College Studentsâ•Ž Personal Financial Literacy - CORE
34
Undergraduate Economic Review Volume 4 | Issue 1 Article 1 2007 College Students’ Personal Financial Literacy: Economic Impact and Public Policy Implications Florentina Furtuna Randolph-Macon Woman’s College This Article is brought to you for free and open access by The Ames Library, the Andrew W. Mellon Center for Curricular and Faculty Development, the Office of the Provost and the Office of the President. It has been accepted for inclusion in Digital Commons @ IWU by the faculty at Illinois Wesleyan University. For more information, please contact [email protected]. ©Copyright is owned by the author of this document. Recommended Citation Furtuna, Florentina (2008) "College Students’ Personal Financial Literacy: Economic Impact and Public Policy Implications," Undergraduate Economic Review: Vol. 4: Iss. 1, Article 1. Available at: http://digitalcommons.iwu.edu/uer/vol4/iss1/1 brought to you by CORE View metadata, citation and similar papers at core.ac.uk provided by Digital Commons @ Illinois Wesleyan University
-
Upload
khangminh22 -
Category
Documents
-
view
0 -
download
0
Transcript of College Studentsâ•Ž Personal Financial Literacy - CORE

Undergraduate Economic Review
Volume 4 | Issue 1 Article 1
2007
College Students’ Personal Financial Literacy:Economic Impact and Public Policy ImplicationsFlorentina FurtunaRandolph-Macon Woman’s College
This Article is brought to you for free and open access by The Ames Library, the Andrew W. Mellon Center for Curricular and FacultyDevelopment, the Office of the Provost and the Office of the President. It has been accepted for inclusion in Digital Commons @ IWU bythe faculty at Illinois Wesleyan University. For more information, please contact [email protected].©Copyright is owned by the author of this document.
Recommended CitationFurtuna, Florentina (2008) "College Students’ Personal Financial Literacy: Economic Impact and Public PolicyImplications," Undergraduate Economic Review: Vol. 4: Iss. 1, Article 1.Available at: http://digitalcommons.iwu.edu/uer/vol4/iss1/1
brought to you by COREView metadata, citation and similar papers at core.ac.uk
provided by Digital Commons @ Illinois Wesleyan University

College Students’ Personal Financial Literacy: Economic Impact andPublic Policy Implications
AbstractThis study analyzes the level of financial literacy among college students in Lynchburg VA area as well as thefactors that impact the students’ competency in the field. Furthermore, it examines how the level of financialknowledge influences students’ opinions and decisions on personal finance matters. Past research indicatesthat non-business majors, women, students under age 30, with lower class ranks, and with little workexperience have lower levels of financial knowledge. A major focus of this study is to test these hypotheses byadministering a survey to college students in Lynchburg VA area and make inferences based on the collecteddata about the economic implications of the students’ financial literacy levels on the local and neighboringregions’ economies.
This article is available in Undergraduate Economic Review: http://digitalcommons.iwu.edu/uer/vol4/iss1/1

Undergraduate Economic Review
A publication of Illinois Wesleyan University
Vol. IV – 2007 - 2008
Title “College Students’ Personal Financial Literacy: Economic
Impact and Public Policy Implications”
Author Florentina Furtuna
Affiliation Randolph-Macon Woman’s College
Abstract This study analyzes the level of financial literacy among college students in Lynchburg VA area as well as the factors that impact the students’ competency in the field. Furthermore, it examines how the level of financial knowledge influences students’ opinions and decisions on personal finance matters. Past research indicates that non-business majors, women, students under age 30, with lower class ranks, and with little work experience have lower levels of financial knowledge. A major focus of this study is to test these hypotheses by administering a survey to college students in Lynchburg VA area and make inferences based on the collected data about the economic implications of the students’ financial literacy levels on the local and neighboring regions’ economies.
1
Furtuna: College Students’ Personal Financial Literacy: Economic Impact an
Published by Digital Commons @ IWU, 2008

2
I. Introduction
As the national financial system becomes increasingly complex, placing even more responsibility on
individuals to manage the details of their finances, there is mounting evidence that the burden is too much for
many individuals. Americans’ poor financial habits have reached alarming proportions. A large percentage of
people of all ages, incomes, and education levels lack the basic financial knowledge and skills to ensure long-
term stability for themselves and their families. Researchers predict that in the future 96% of Americans will
be financially dependent on government services, family or charities to cover the costs of retirement (U.S.
Dept. of Health & Human Services). The current consumer debt stands at almost $2 trillion, which averages to
more than $18,500 per household, not including mortgage debt (Khan). In addition, it is estimated that 43% of
U.S. families spend more than they earn (Khan, MSN Money) and an average household with one or more
credit cards holds $9,200 on those cards, up from $4,300 in 1994, which represents an 114% increase in ten
years (Consumer Credit Counseling Services, 2004). In this context, in a speech before the National Press
Club, David Walker, Comptroller General of the U.S., stated “We must come to grips with the daunting fiscal
realities that threaten our nation’s, children’s and grandchildren’s future” (Walker, 2003).
The lack of financial planning among various social strata indicates a growing trend in the level of
personal bankruptcies and a sudden decrease in the savings rates. Financial problems are one of the primary
reasons for divorce and why the number of elderly living in poverty has never been higher (Mason, 2000).
Various studies (KPMG, 1995; PSRA, 1996, 1997; Vanguard Group/Money Magazine, 1997; Bianco &
Bosco 2000) indicate that the main reason why Americans make poor financial decisions is because they have
not received a sound personal finance education. Many individuals lack a basic understanding of how to
control debt, how to save and how to plan a solid financial future.
Currently, college students represent a considerable part of the U.S. population and their level of
financial literacy will soon impact the overall economy. It is estimated that more than 16 million students
2
Undergraduate Economic Review, Vol. 4 [2008], Iss. 1, Art. 1
http://digitalcommons.iwu.edu/uer/vol4/iss1/1

3
were enrolled in U.S. postsecondary education in 2005. In addition, both high-school graduates and college
enrollments are expected to increase until at least 2014 (Hawkins & Clinedinst 2006). Since college students
are expected to have higher earnings after graduation, they are also expected to be financially literate or at
least more literate as a part of their preparation for a career.
This study will analyze the level of financial literacy among college students in Lynchburg as well as
the factors that impact the students’ competency in the field. In addition, it will examine how the level of
financial knowledge influences students’ opinions and decisions on personal finance matters. The paper will
be organized as follows. Section II reviews related literature to the financial literacy topic. Section III
discusses the research design and methodology including three subsections: the Plan for Data Collection, the
Sampling Plan, and the Plan for Statistical Analysis and Data Processing. Section IV states the results.
Section V presents the limitations of the project and indicates ideas for future research. Section VI represents
an appendix that includes the data collection tool.
II. Literature Review
Most of the previous studies have been conducted by practitioners in the financial services industry.
Many surveys have tested the level of financial literacy of adults. Results suggested that the majority of adults
were not financially literate. For instance, in 1997 the Princeton Survey Research Associates surveyed 1,770
households nationwide on their financial knowledge. The 42% average correct score on the survey indicated
that households did not possess a good understanding of basic financial concepts. Another study conducted by
KPMG in 1995 that surveyed 1,183 employers indicated that employees did not contribute a sufficient amount
of their income to 401(K) plans, thus failing to maximize their benefits by insuring a financially secure
retirement. A more recent study conducted by the Employee Benefit Research Institute in 2006 provided
additional evidence that while a large majority of Americans expect to enjoy a comfortable retirement, many
3
Furtuna: College Students’ Personal Financial Literacy: Economic Impact an
Published by Digital Commons @ IWU, 2008

4
have not taken actions needed to turn their aspirations into reality and face the prospect of having to work far
longer than they expect.
Studies have indicated that even active investors are not necessarily financially literate. A 2001 John
Hancock study of eight hundred 401(K) investors indicated that only 21% of investors considered themselves
relatively knowledgeable about investments typically found in 401(K) plans (John Hancock, 2001). A Money
Magazine/Vanguard Mutual Fund Literacy test administered every two years to fund investors revealed that
less than 20% of the 1,555 investors polled scored 70% or better and the average score was just 49%. In
addition, American Century Investments surveyed 750 investors about their knowledge of bond markets. The
results were disappointing since 73% of investors failed to answer at least half of the 10 questions correctly
(Reuters 2001). In 2002 Ronald P. Volpe, Joseph E. Kotel and Haiyang Chen surveyed 530 online investors
examining their investment literacy. The findings that investors correctly answered only 50% of the questions
indicated a deficiency in the knowledge of investing concepts, despite the large amount of educational
information and research available to online investors.
Prior studies of high school students consistently showed that students were not receiving a good
education in personal finance. A research conducted by The Securities and Exchange Commission in 1999
indicated that 66 % of high school seniors taking a basic economic literacy test failed. The results were even
worse in 2000 and 2001 respectively. The National Endowment for Financial Education stated that 70% of
high school graduates were “illiterate consumers” (Miller, 1998). However, the Jump$tart Coalition for
Personal Financial Literacy nationwide survey conducted in 2004 revealed for the first time since 1997 that
high school students were reversing declining scores and were demonstrating increased aptitude and ability to
manage financial resources such as credit cards, insurance, and savings accounts.
Few studies have examined the financial literacy levels among college students. Volpe, Chen, and
Pavlicko (1996) surveyed 454 students from a state university in the Midwest with the primary purpose of
4
Undergraduate Economic Review, Vol. 4 [2008], Iss. 1, Art. 1
http://digitalcommons.iwu.edu/uer/vol4/iss1/1

5
measuring the students’ financial knowledge of investment. The results indicated a 44% average score, a fact
clearly suggesting that students at that university had a low level of financial investment knowledge. In
addition, the study revealed that male students were more knowledgeable than female students, and business
majors were more knowledgeable than non-business majors.
Another study conducted by Haiyang Chen and Ronald P. Volpe in 1998 surveyed 924 college
students examining their personal financial literacy and the relationship between the literacy and students’
characteristics as well as the impact of literacy on students’ opinions and decisions. Their findings indicated a
low level of financial knowledge since participants in the survey answered about 53% of questions correctly.
Non-business majors, women, students in the lower class ranks, under age 30, and with little work experience
had lower levels of financial knowledge. In addition, the study indicated that less knowledgeable students
tended to hold wrong opinions and made inappropriate decisions. Thus, the authors concluded that the low
level of students’ financial knowledge would limit their ability to make informed decisions in the future.
One of the recent studies that examined students’ financial literacy was conducted by Bianco and
Bosco. They surveyed 574 students at an undergraduate university in New England in December, 1999 and
January, 2000. Their results were consistent with prior studies on adults and students indicating a poor
understanding of personal finance of the participants in the survey. The authors emphasized the need for
financial education among students because of the amount of debt most of them incur while they are in
school. As of 2004, the average indebted senior was $17,600 in debt on graduation day (Boushey, 2005).
Thus, the high levels of debt have implications for how students think about post-college jobs and life-
choices. Highly indebted graduates may have little flexibility in the kinds of jobs that they must take in order
to afford their debts and may choose to postpone marriage, buying a house, or starting a family while they pay
off their loans (Boushey, 2005).
The impact of a growing student enrollment within a region extends beyond the educational
5
Furtuna: College Students’ Personal Financial Literacy: Economic Impact an
Published by Digital Commons @ IWU, 2008

6
institutions to the local community itself. Likewise, a college or university which is successful in attracting a
diverse college student body enhances not only its own reputation but also has an important impact on the
local community in question (Steahr & Schmid, 1972). With the increase in the number of colleges and
universities in the USA, trends of student migration across state boundaries to obtain the various benefits of a
college education have also developed. Thus, students migrate across states in search of an “optimal bundle”
of educational benefits offered by a university education (Mixon, 1992). During the years spent as students
and residents of local communities, students develop specific networks and contacts, and perhaps their tastes
change as well. After graduation, these students may be more likely to reside in the locality or region in which
they have been educated. Evidence suggests that the university is important in attracting human capital to the
local area and in stimulating entrepreneurial talent in the region (Huffman & Quigley, 2002). In this context,
the financial literacy levels of students within the region where they are located will have important regional
public policy implications due to the short term as well as long-run consequences students’ financial
education will have on the local markets.
Prior research on financial literacy levels has provided evidence that a vast majority of individuals
from different social strata, including college students lack the basic financial knowledge and skills to ensure
long-term stability for themselves and their families. Most of the studies indicate the low levels of financial
literacy among college students partly addressing the factors that influence the individuals’ knowledge and the
impacts on their decisions regarding personal financial issues. In my study I intend to analyze the financial
literacy levels among college students and their opinions and decision regarding financial matters. In addition, I
will attempt to make inferences based on the data that I will have collected about the economic implications of
the students’ financial literacy levels on the local and neighboring regions’ economies.
6
Undergraduate Economic Review, Vol. 4 [2008], Iss. 1, Art. 1
http://digitalcommons.iwu.edu/uer/vol4/iss1/1

7
III. Research Design and Methodology
Plan for Data Collection
The primary data collection instrument for my study was a survey. The main function of the
questionnaire was to translate the defined research objective, namely to identify the level of financial literacy of
college students and probe their attitudes, opinions and decisions regarding pertinent financial matters. In
designing the survey I took into consideration the fact that most students had busy schedules and most probably
would not be willing to spend an extended amount of time to finish a lengthy survey. Accordingly, in line with
previous research, specifically, Haiyang Chen and Ronald Volpe’s survey, my questionnaire, although not as
comprehensive, included financial literacy questions on general knowledge, savings and borrowings, insurance,
and investments.
For cost saving considerations I made the survey self-administered and undisguised. I clearly
disclosed the purpose of the study at the beginning of the questionnaire in order to assure respondents’
anonymity and achieve greater truthfulness and objectivity. The survey was conducted in person and the
respondents were explained the objectives and the contents of the research. In addition, clarifications were made
when necessary concerning various questions on the survey.
I divided the survey in three parts. With the questions from the first part of my questionnaire I
attempted to probe opinions and attitudes, namely by identifying students’ attitudes and opinions regarding
money management skills: spending, investing, acquiring insurance. With the second set of questions I tried to
measure students’ level of financial literacy by assigning a percentage score according to the number of the
correct responses that the participants provided. In the last part of the survey I collected demographic and other
relevant data on the respondents which allowed me to test the relationship between the students’ levels of
financial literacy and their academic discipline, gender, class rank, work experience, age, and whether a student
wanted to work after graduation in the proximity of Lynchburg area or not.
7
Furtuna: College Students’ Personal Financial Literacy: Economic Impact an
Published by Digital Commons @ IWU, 2008

8
Sampling Plan
The population that I found relevant for my research project is the Lynchburg VA area college student
population, specifically due to the fact that the region has a fairly large student population that can be easily
identified. In order to draw the units for the sample I used a non-probability sampling method with which the
selection of the members of the population is not based on probability. Therefore, I was not able to calculate the
probability of any one person in the population being selected into the sample. However, the non-probability
method, in particular the convenience sampling method that I used, strived to draw a representative sample
since it included features of a systematic, probability based sampling method. Specifically, due to the easily
identified population in the region I was able to calculate the “skip interval” as a part of the sampling technique.
Thus, I computed it by dividing the college students in the Lynchburg area population size to the chosen sample
size. The chosen sampling methodology tried to ensure sufficient randomness and it attempted to be as
representative as possible of the student college population in Lynchburg area.
The sample frame for my research consisted of students in Lynchburg that are currently enrolled in a
graduate or undergraduate program. It included two representative colleges: Randolph- Macon Woman’s
College and Lynchburg College campus locations. Since all students pursuing a college degree usually live on
campus the incidence rate for my study was relatively high. That is, the sample units drawn from that frame
fitted the qualifications of those people I intended to survey.
I determined the sample size by using a confidence interval approach which applies the concepts of
variability, confidence interval, sampling distribution, and standard error percentage to create a valid sample.
Furthermore, in addition to applying the theoretically most correct method, I took into consideration the budget
and time constraints when deciding on the desired sample size. The college student population in Lynchburg is
approximately 18,000 students where Lynchburg College with a population of 2,428 students represents 14 %
and Randolph-Macon Woman’s College with a population of 730 students represents 4 %. I calculated the
8
Undergraduate Economic Review, Vol. 4 [2008], Iss. 1, Art. 1
http://digitalcommons.iwu.edu/uer/vol4/iss1/1

9
sample size for my survey by considering three factors: the amount of variability believed to be in the
population, the desired level of accuracy, and the desired level of confidence required in my sample estimates of
the population values.
Thus, I used the formula:
2
2 )(
e
pqzn
×=
where, n = the sample size z = standard error associated with the level of confidence p = estimated variability in the population q = (100 - p) e = acceptable error Due to the uncertainty in the variability of the defined population I chose the case of greatest variability with
50-50 percentage approach (“worst case”), I decided to use a 95 percent level of confidence, and I wanted the
results to be accurate 5± percent.
Thus, the computations were the following:
38425
250084.3
5
)5050(96.12
2
=×
=×
=n
Hence, I intended to survey 384 students to obtain 5± percent accurate results at the 95 percent confidence
level. At this point I was able to establish the skip interval to ensure sufficient randomness of the convenience
sampling method that I applied. Thus, I calculated the “skip interval” by dividing the population size to the
desired sample size.
8.46384
000,18===
SampleSize
SizePopulationalSkipInterv
Since the skip interval was approximately 47 students, for time and cost saving considerations, I divided the
interval to a randomly chosen number 9, thus, minimizing it to 5 students. Since my sample consists of two
representative institutions in Lynchburg, I split the sample proportionally in accordance with the subpopulation
9
Furtuna: College Students’ Personal Financial Literacy: Economic Impact an
Published by Digital Commons @ IWU, 2008

10
sizes of these institutions. Thus, I intended to survey 264 students from Lynchburg College and 120 students
from RMWC. Furthermore, since I projected the sample results to the entire Lynchburg area college student
population I used the same skip interval for both institutions.
Plan for Statistical Analysis and Data Processing
In order to analyze the data collected, I started with a descriptive analysis so that I would portray the
“typical” respondent as well as reveal the general pattern of responses. The descriptive measures became a
foundation for subsequent predictive statistical analysis. Hence, I tried to identify different groups of students
according to their financial literacy level through a regression analysis.
Previous research has indicated that the level of financial literacy varies in accordance with students’
major, experience, age, gender, nationality, and race. Studies indicate that non-business majors, women,
students in the lower class ranks, under age 30, and with little work experience have lower levels of knowledge
and tend to hold wrong opinions and make incorrect decisions (Chen & Volpe, 1998). Taking into consideration
the previous research theoretical considerations I created an econometric model by analyzing the financial
literacy of students as a function of age group, field of study, gender, work experience, if a student had taken a
class in personal finance, and finally if the participant would prefer working after graduation in the proximity of
the Lynchburg VA area or not. The coefficients of the selected independent variables represented the effect of
each subgroup compared with an arbitrarily selected reference group. For instance, the academic Major was
coded as “1” if a participant in survey is a Business/Economics major and “0” otherwise. In order to assess, the
financial literacy of students I used Haiyang Chen and Ronald Volpe’s technique by calculating the mean and
the median percentage of correct scores for each question in section II on the designed survey and then grouping
the overall scores into two categories in accordance with the median percentage of correct scores of all
participants of the survey. Therefore, I created a dichotomous financial literacy dependent variable including
two categories with scores equal to or below the median, and scores above the average. Students with scores
10
Undergraduate Economic Review, Vol. 4 [2008], Iss. 1, Art. 1
http://digitalcommons.iwu.edu/uer/vol4/iss1/1

11
higher than the sample median were classified as those with relatively more financial knowledge, while
respondents with scores equal to or below the median were classified as students with relatively less knowledge.
The Econometric Model takes on the following form:
)()()()(
)()()()()(
)()()()()()]1/(ln[
14413312211
11049382716
25143210
radWorkAfterGExperienceExperienceExperience
ExperienceClassRankClassRankClassRankClassRank
AgeAgeGenderceClassFinanFieldStudy
ββββ
βββββ
ββββββρρ
++++
+++++
+++++=−
where,
ρ = the probability of a student with relatively more knowledge about personal finance.
FieldStudy = 1 if a participant is a Business/Economics Major, 0 otherwise.
ClassFinance = 1 if a student has taken a class in Personal Finance, 0 otherwise.
Gender = 1 if a participant is a female, 0 otherwise.
Age1 = 1 if a participant is in the age group of 18-20, 0 otherwise.
Age2 = 1 if a participant is in the age group of 21-25, 0 otherwise.
ClassRank1 = 1 if a participant is a freshman, 0 otherwise.
ClassRank2 = 1 if a participant is a sophomore, 0 otherwise.
ClassRank3 = 1 if a participant is a junior, 0 otherwise.
ClassRank4 = 1 if a participant is a senior, 0 otherwise.
Experience1 = 1 if a participant has no experience, 0 otherwise.
Experience2 = 1 if a participant has more than 0 to less than 2 years of experience, 0 otherwise.
Experience3 = 1 if a participant has 2 to less than 4 years of experience, 0 otherwise.
Experience4 = 1 if a participant has 4 or more years of experience, 0 otherwise.
WorkAfterGrad = 1 if the participant wants to work in the proximity of Lynchburg area, 0 otherwise.
11
Furtuna: College Students’ Personal Financial Literacy: Economic Impact an
Published by Digital Commons @ IWU, 2008

12
IV. Results & Analysis
Three hundred and sixty seven students participated in the survey. Initially, the desired sample size
was of 384 students so that I would be able to project my findings towards the defined population at a
5± percent significance level. The response rate, however, was very high of approximately 96 %. In addition,
due to the convenience sampling technique that I used which is not based on probability where I am not able
to calculate the probability of each respondent in my sample, a difference of 4 % in the initially defined
sample size had a minor impact on the obtained results, thus, it didn’t affect the sampling inferences and
predictions projected towards the entire Lynchburg college student population. For future considerations,
however, in order to obtain more reliable results and make better inferences about the defined population, a
random sampling technique should be considered.
The sample characteristics were the following. In terms of education 36.5 % of the respondents were
freshman, 25.3 % sophomores, 22.1 % juniors, 15 % seniors, and 3 students had already graduated. 42.5 %
were majoring in Human and Other Social Sciences, 22.6 % were Science majors, 18.8 % were majoring in
Fine Arts, and finally only 16.1 % indicated that they were Business Administration/Economics majors.
87.5 % of the students surveyed hadn’t taken a class in Personal Finance before and only 12.5 % indicated
that they had taken such a class before. In terms of demographic background, most of the respondents were
from 18 to 20 years of age, specifically 70.8 %, the rest of the students, 27.8 % were aged between 21 and 25
years, and only 5 students indicated that they belonged to the 26- 40 age group. Female participants
represented about 75 % of the sample due to the sampling frame that was chosen which included a single sex
institution. 35.1 % had more than four years of work experience, 28.3 % had between two and four years of
experience, and approximately the same percentage of students, 27.2 % had less than two years of work
experience. Most of the participants were U.S. citizens, 84 % of the sample, and 38 % indicated that they were
VA residents.
12
Undergraduate Economic Review, Vol. 4 [2008], Iss. 1, Art. 1
http://digitalcommons.iwu.edu/uer/vol4/iss1/1

13
Overall Survey Results
Graph 1: Students’ Total Financial Literacy Scores
100 % Score
87.5 % Score
75 % Score
62.5 % Score
50 % Score
37.5 5 Score
25 % Score
12.5 % Score
0 % Score
Total Financial Literacy Score
120
110
100
90
80
70
60
50
40
30
20
10
0
To
tal N
r of S
tude
nts
0.27%0.54%
1.91%
13.62%
28.34%
25.89%
19.07%
8.72%
1.63%
Students' Total Financial Literacy Scores
Graph 1 indicates that on average participants answered 40 % of the questions correctly. Considering
that the survey included only eight questions that tested basic knowledge in investments, borrowings, savings,
and general personal finance, answering less than half of the questions correctly suggests that Lynchburg
college students’ financial knowledge is relatively low. One possible explanation offered by previous research
is that most of the higher education institutions do not take into account the students’ personal finance
knowledge (Danes & Hira, 1987, Bianco & Bosco, 2000), and even business schools do not require students
to take a Personal Finance Management course (Bialaszewski, Pencek, & Zietlow, 1993).
Another reason for the low level of financial knowledge could be attributed to the fact that most of
the participants in the survey were very young; approximately 75% of students belonged to the 18-20 years
old group, thus, they were still at an initial stage in their financial planning life cycle; this explanation is
consistent with past research findings (Volpe, Chen & Pavlicko). In addition, the largest percent of students,
13
Furtuna: College Students’ Personal Financial Literacy: Economic Impact an
Published by Digital Commons @ IWU, 2008

14
42.5 %, indicated that their primary major was in the field of Human and other Social Sciences and only
16.1 % indicated that they were Business Administration/Economics majors. Usually, Business
Administration/Economics students are much more exposed to issues in accounting, finance and marketing
as a part of their curriculum requirements, thus, they tend to be more knowledgeable in finance matters than
other students. This disproportional distribution among business and non business students could have also
affected their low knowledge about personal finance matters.
Students were asked in Question 2 on the financial literacy test to identify instruments which are
usually not associated with spending. As indicated in Table 1, 82.6% answered this question correctly, which
represents the highest score out of all the questions on the second part of the survey. This occurrence could be
explained by the fact that most of the students at this age spend their income on consumption, thus, they are
aware of the main spending instruments at their disposal.
Table 1. Instruments usually not associated with spending
In addition, as indicated on Graph 2 when asked to rank on the first part of the survey the importance
of spending less than one’s income on a 5 dimension Likert scale ranging from Strongly Unimportant to Very
Important, most of the students, 56 % indicated that this issue is very important. Therefore, this explains the fact
that college students at this stage of their financial experience cycle are active consumers and they are
extensively aware of the importance of their spending patterns, hence their financial knowledge concerning this
aspect of their personal finance education is considerably high.
Students’ Scores on Question 2 Frequency Percent Cumulative
Percent 0% Scored 64 17.4 17.4
12.5 % Scored 303 82.6 100.0
Total 367 100.0
14
Undergraduate Economic Review, Vol. 4 [2008], Iss. 1, Art. 1
http://digitalcommons.iwu.edu/uer/vol4/iss1/1

15
Graph 2: Importance of Spending Less than One’s Income
Very Important
Somewhat Important
Not SureSomewhat Unimportant
Strongly Unimportant
No Response
Importance of spending less than one's income
260
240
220
200
180
160
140
120
100
80
60
40
20
0
To
tal N
r o
f S
tud
en
ts
55.86%
18.8%
8.72%9.81%6.54%0.27%
Importance of Spending Less than One's Income
On Question 4 which analyzes students’ knowledge about borrowings, specifically focusing on
the meaning of APR, respondents have scored the lowest out of all the questions on the entire financial
literacy test. 83 % of the students as indicated in Table 2 have answered this question incorrectly. In this
regard, it would have been interesting to add another question on the survey asking students how many
credit cards they posses, thus, gain more insight about the reasons for such a low knowledge about the
APR. However, since the APR is a confusing term in ways that it is calculated by different lenders, this
could serve as a possible explanation why students are not really familiar with its meaning when
comparing loan costs, even though, most of them posses at least one credit card.
Table 2. Annual Percentage Rate (APR)
Students’ Scores on Question 4 Frequency Percent
Cumulative Percent
0 % Scored 305 83.1 83.1
12.5 % Scored 62 16.9 100.0
Total 367 100.0
15
Furtuna: College Students’ Personal Financial Literacy: Economic Impact an
Published by Digital Commons @ IWU, 2008

16
On the last questions that tested students’ investments knowledge scores were relatively low.
Respondents’ scores are indicated in Tables 3 and 4 respectively. A possible reason for this occurrence is that
at this stage in their lives students are exposed to a limited amount of financial securities and most of their
income is spent on consumption rather than investment. Therefore, they are less knowledgeable about these
topics and do not attribute importance to these issues.
Table 3. Interest Rate Price of a Treasury bond inverse relationship
Students’ Scores on Question 7 Frequency Percent
Cumulative Percent
0 % Scored 276 75.2 75.2
12.5 % Scored 91 24.8 100.0
Total 367 100.0
Table 4. High-Risk & High Return Investment Strategy
Students’ Scores on Question 8 Frequency Percent
Cumulative Percent
0 % Scored 196 53.4 53.4
12.5 % Scored 171 46.6 100.0
Total 367 100.0
Predictive Analysis - Logistic Regression Output
For the predictive analysis I used a logistic regression model. This econometric model is
constructed by an iterative maximum likelihood procedure. The predicted variable, the financial literacy of
students, is a dichotomous variable. Specifically, it is a function of the probability that a respondent will
be more or less financially literate. In order to assess the explanatory power of the listed independent
variables and test the proposed hypotheses I ran the regression for the entire financial literacy score on the
financial literacy test. The regression output is included in the Appendix B. I coded the predicted
probability of a student being more financially knowledgeable (scoring higher than the median score of
37.5%) with 1 and less financially literate (with a score lower than 37.5%) with 0. That
is,
−=
ρ
ρ
1ln)ln(ODDS , where ρ is the predicted probability of a student being more financially
16
Undergraduate Economic Review, Vol. 4 [2008], Iss. 1, Art. 1
http://digitalcommons.iwu.edu/uer/vol4/iss1/1

17
knowledgeable, thus, scoring higher on the test which is coded with 1, and ρ−1 is the predicted
probability of the respondent being less financially knowledgeable, coded with 0. Under the Variables in
the Equation (Table 3. Appendix B), the intercept-only model is ln(odds) = -.213. Since 164 of the
students scored higher than the median score, and 203 had an equal or lower score to the 37.5% median
score, the predicted odds of a student being more financially knowledgeable, scoring higher than the
median score is .807 (164/203) (Table 2. Appendix B).The Omnibus Tests of Model Coefficients (Table
5. Appendix B) indicates a relatively high Chi-Square of 28.740 on 14 degrees of freedom, significant
beyond .011. However, the overall fit of the model given by -2 Log Likelihood statistic of 475.878 (Table
6. Appendix B) is not highly significant (the smaller the statistic the better the model). I used the Hosmer-
Lemeshow to test the null hypothesis about the existence of a linear relationship between the predictor
variables and the log odds, thus, detect any problem of multicollinearity. This test computes the expected
frequencies based on the assumption that there is a linear relationship between the weighted combination
of the predictor variables and the log odds of the dependent variable, and ultimately, it compares them
with the actual observed frequencies. The chi-square statistic, which compares the observed frequencies
with those expected under the linear model, has a nonsignificant value of only 5.027 at a .755 significance
level (Table 7. Appendix B), fact which indicates that the data fit the model well. The Variables in the
Equation (Table 9. Appendix B) output indicates the following regression equation:
)(279.)(366.21)(639.21)(859.21
)(071.22)(63.21)(1.21)(141.21)(947.20
)(420.)(545.)(325.)(869.)(779.335.)]1/(ln[
432
14321
21
radWorkAfterGExperienceExperienceExperience
ExperienceClassRankClassRankClassRankClassRank
AgeAgeGenderceClassFinanFieldStudy
−−−−
−++++
−−+−+−=− ρρ
In order to predict the odds that a student of a given gender, field of study, age, work
experience, preference of working after graduation and whether the person has taken a class in
personal finance will score higher on the financial literacy test I used the odds prediction
equation bxaeODDS
+= , where a is the constant in the equation, b is the coefficient of the
17
Furtuna: College Students’ Personal Financial Literacy: Economic Impact an
Published by Digital Commons @ IWU, 2008

18
explanatory variable and finally x is whether 1 or 0, depending on the groups codes. For the first
explanatory variable, the Field of Study that a student pursues, if the respondent is a Business/
Economics major (FieldStudy = 1), then the 556.1444.)1(779.335.. === ×+−eeODDS . That is, an
Economics/Business major is 1.556 times more likely to score higher on the financial literacy
test. If the respondent is a non Business/Economics major (FieldStudy = 0), then
the 716.0335.)0(779.335.. === −×+−eeODDS . Thus, a non business major is only .716 as likely to
score higher than the median score on the financial literacy test. By converting the odds to
probabilities, for the Business/Economics majors 608.0556.2
556.1
1==
+=
ODDS
ODDSρ and for the
non Business/Economics majors 417.0716.1
716.0
1==
+=
ODDS
ODDSρ , hence, the model predicts that
60% of the students majoring in Business/Economics will score higher on the financial literacy
test versus 41% of students majoring in other fields.
For the Class in Personal Finance variable, if a respondent has taken a class in personal finance
before, then the 301.0204.1)1(869.335.. === −×−−eeODDS . At the same time if a student hasn’t taken such a
class before the 716.0335.)0(869.335.. === −×−−eeODDS . By converting the odds to probabilities for the
students who have taken a class in personal finance ρ = 0.23 and for those who haven’t ρ = 0.41.
Paradoxically, the probability of scoring higher than the median score on the financial literacy test is much
higher for the students who haven’t taken a class in personal finance before (41%) rather than for the
respondents who have taken one (23%).
For the Gender variable, if a respondent is a female, then the 99.001.0.)1(325..335.. === −×+−eeODDS .
If, on the other hand, the subject is a male the 71.0335.)0(325..335.. === −×+−eeODDS . Thus, the probability
of scoring higher on the financial literacy test is 49% for women versus 41% for men. For Age1 variable
the probability of scoring higher on the financial literacy test if the respondent belongs to the 18-20 age
18
Undergraduate Economic Review, Vol. 4 [2008], Iss. 1, Art. 1
http://digitalcommons.iwu.edu/uer/vol4/iss1/1

19
group is of 55% while for Age2 variable, if a student is between 21-25 years old the probability is
relatively lower of 52%. For the Class Rank and Experience variables the coefficients are statistically
insignificant, thus, the probabilities of the student scoring higher on the financial literacy test whether he
or she belongs to one experience group versus another or an upper or lower class rank are also
insignificant. Ultimately, for the Work after Graduation variable, if a student indicated as a primary
preference working in the neighboring labor markets after graduation, the probability of him or her
scoring higher on the financial literacy test is only 35%. In addition, the Exp(B) in the Variables in the
Equation (Table 9. Appendix B) output indicates the odds ratio predicted by the model (natural log to the
b power, where b is the coefficient of the independent variable). For instance, it predicts that the odds of
scoring higher on the financial literacy test are 2.179 higher for Business/Economics majors than for non
Business majors, as well as 1.385 higher for female versus male respondents.
The Classification Table(a) (Table 8. Appendix B) indicates 49% (80.7/164) of the students where
the predicted event of scoring higher than the median financial literacy score was observed. This is known
as the sensitivity of prediction P which represents the percentage of occurrences correctly predicted. The
classification of the students where the predicted event was not observed is 71% (144/203). It is known as
the specificity of prediction P and it calculates the percentage of nonoccurrences correctly predicted. Overall
the predictions were correct 224 out of 367 times, for an overall success rate of 61%.
Table A and Table B present the summarized results of the Logistic Regression. As shown in Table
A, the Field of Study has the highest percentage support. Thus, the fact that a student majors in Business or
Economics predicts a higher score that the median one on the financial literacy test, hence, a higher level of
financial knowledge among these students. In addition, the percentage support for Gender, Age1 and Age2
groups are relatively high, however, the difference between the two Age groups is not significant and it is in
the reverse order than the expected one, specifically, the fact that with age the financial literacy of students
19
Furtuna: College Students’ Personal Financial Literacy: Economic Impact an
Published by Digital Commons @ IWU, 2008

20
increases. Considering the Gender variable, the logistic regression indicates that females are more likely to
score higher than males, however, the difference is not statistically significant. Ultimately, the percentage
support for the students’ market preferences concerning employment opportunities in the future and the
students’ overall rate of financial literacy is one of the lowest compared to the other explanatory variables.
Table A: Effect of Scenario on % of Students Scoring Higher than the Median Score on the
Financial Literacy Test
Scenario Percentage Support
Field Study (Business/Economics)
60
Gender (Female) 49
ClassFinance 23
Age1 55
Age2 52
WorkAfterGrad 35
Table B: Logistic Regression Predicting Score from Field of Study, Gender, Class Finance,
Age1, Age2, Work After Graduation
Predictor B Wald χ2 p Odds Ratio
FieldStudy .779 5.815 .01 1.556
Gender .325 1.422 .233 0.99
ClassFinance -.869 5.638 .01 0.301
Age1 .545 .199 .656 1.23
Age2 .420 .117 .733 1.088
WorkAfterGrad
-.279 1.581 .209 0.54
Table B indicates the logistic regression coefficients for the significant variables in the logistic
regression model. In addition, the Wald Chi-Square χ2 statistic tests the unique contribution of each
predictor, in the context of the other predictors, by holding constant the other predictors, thus,
eliminating an overlap between them. The Wald statistic is significant at a conventional .05 significance
level only for two variables, the field of study that a student pursues and whether the student has taken
20
Undergraduate Economic Review, Vol. 4 [2008], Iss. 1, Art. 1
http://digitalcommons.iwu.edu/uer/vol4/iss1/1

21
or not a class in personal finance. The odds ratio for the field of study indicates that when holding all the
other variables constant, a Business/Economics student is 1.556 times more likely to score above the
median score on the financial literacy test than a student who pursues a major different than Economics
or Business. The Class Finance variable has an unexpected negative sign that is statistically significant,
fact which indicates that a student is more likely to score higher on the financial literacy test, .716 if he
or she hasn’t taken a personal finance class before. The Age groups are highly insignificant at a .05
significance level as well as the gender and work after graduation variables, thus, their explanatory
power is really low.
The predictive analysis for the overall financial literacy scores offers support for the hypothesis
that students ‘financial literacy levels will be influenced by their major. It doesn’t provide support,
however, for the theories that men are more financially literate than women or that age is a good predictor
of the personal financial knowledge level among students. In addition, class rank and experience are
statistically very insignificant variables, thus, the constructed model as well as the chosen sample do not
offer enough insight and support for the two theories implying that with an increase in work experience or
class rank there is an expected higher level of financial literacy.
Limitations & Ideas for Future Research
My research faced several limitations including sampling and non-sampling errors. The sampling
error was partly controlled by the designed sampling plan which included a relatively large sample size.
Another obvious limitation was the sampling method chosen, specifically, a non-probability
convenience sampling method where the probability of each surveyed respondent can’t be calculated,
thus, the correctness of results decreases. In the future in order to project more accurately the sample
findings towards the entire Lynchburg VA area college student population a simple random or
systematic sampling technique should be considered.
21
Furtuna: College Students’ Personal Financial Literacy: Economic Impact an
Published by Digital Commons @ IWU, 2008

22
In addition, another downsize of the research due to cost and time constraints was the fact that it
was targeted towards a small defined population of college students only in Lynchburg area, thus, no
inferences and predictions from the chosen sample could have been projected towards a much larger
student body that included the surrounding areas as well. However, for future research purposes,
considering the cost and time variables the study can be extended by administering the survey to college
students from other cities, counties, or even other states, thus, comparing the results and drawing
inferences for a much larger student college population. Throughout the research I tried to minimize the
non-sampling errors, however, every research holds great potential for non-sampling errors. Thus, some
of the limitations included: intentional and unintentional errors on the parts of both interviewers and
respondents. Some of the unintentional field worker errors included: personal characteristics and fatigue.
The unintentional respondents’ errors, on the other hand, were reflected by the misunderstanding of
certain questions or specific meaning of various financial terms, (for instance financial securities), loss
of attention, boredom, interruptions and distractions. The intentional respondents’ errors included:
misrepresentation of certain information, and non-response or refusal to answer certain questions.
Hence, whenever future research is conducted on a similar subject, it should attempt to minimize the
previously encountered limitations. Ultimately, for future research purposes, a similar analysis of the
Lynchburg college students’ market or the surrounding areas could be expanded by applying a more
extensive survey or designing a questionnaire tailored towards one specific topic, for instance, analyzing
the spending or savings behavior of the young college student consumers and relating it to their personal
financial literacy knowledge. Hence, as I mentioned previously, this research could be improved in
various ways, primarily by defining a larger population, designing a different sample plan, using a
different sampling technique, and finally choosing a different sampling frame.
22
Undergraduate Economic Review, Vol. 4 [2008], Iss. 1, Art. 1
http://digitalcommons.iwu.edu/uer/vol4/iss1/1

23
Conclusions and Recommendations
This study analyzed the level of financial literacy among college students in Lynchburg VA as
well as the factors that impact the students’ competency in the field. It surveyed 367 students from two
representative institutions in Lynchburg, in particular, Lynchburg College and Randolph-Macon Woman’s
College. The research examined how the level of financial knowledge influences students’ opinions and
decisions on personal finance matters. It also analyzed the relationship between the financial literacy and
the respondents’ demographic data, characteristics such as: gender, academic discipline, age, work
experience, nationality, preferences to work after graduation, and whether a student has taken a class in
personal finance previously or not. In addition, the research attempted to make inferences based on the
data that was collected about the economic implications of the students’ financial literacy levels,
specifically the external consequences as well as the spillover effects on the local and neighboring
regions’ economies. Taking into consideration previous research, after graduation students were more
likely to reside in the locality or region in which they have been educated (Huffman & Quigley, 2002).
Thus, the financial education of students will have important public policy implications due to the short
term as well as long-run consequences students’ financial literacy levels will have on the local markets.
The results suggest that college students in Lynchburg area have a very low level of personal
finance knowledge since the median score on a relatively simple financial literacy test was only of
37.5% that is much lower than the average 53% score indicated by previous research (Volpe, Chen &
Pavlicenko 1997) which, on the other hand, used a much more comprehensive survey. In line with the
previous studies’ findings one of the weakest areas where students score the lowest are the questions
related to investment decisions and borrowings. Students, however, seem to be more knowledgeable
about spending and insurance subjects. The regression analysis indicates different levels of financial
knowledge among subgroups. Specifically, lower levels of financial knowledge are found among non
23
Furtuna: College Students’ Personal Financial Literacy: Economic Impact an
Published by Digital Commons @ IWU, 2008

24
Business/Economics majors, students who have actually taken a class in personal finance previously and
male versus female students (although, the difference in the means of financial literacy scores grouped
by gender is not highly statistically significant). In addition, since most of the respondents belong to the
first two age groups, there is no significant difference in the financial literacy scores among these two
age groups. The work experience and the class rank of the respondents have a very low statistical
significance, thus, the level of financial literacy does not differ among the subgroups identified for these
two variables.
Considering the last hypothesis about the labor market implications most students indicated that
they preferred finding employment in Lynchburg or in the neighboring markets, however, these students’
scores were the lowest among the other groups of students. Their lack of financial education could have
for the time being a negative impact only at a personal level, however, in the long run, which is less than
four years, the financial illiteracy will result in costly consequences. If these students will not be able to
manage their own finances in the future this will lead to a lower productivity in their workplaces (CHRGI
1995) as well as much deeper social problems due to an elevated level of anxiety of individuals who are
not able to keep track of their financial transactions. In addition, it will exacerbate the well functioning of
a good market economy due to the already existing highly financially illiterate American public, thus,
elevate even more the immense burden of the financial illiteracy cost on the U.S. economy.
It is highly important to address this challenging issue in the future. Higher education institutions
in Lynchburg VA area should consider including a personal financial planning class for students from
different academic disciplines. Hence, enhance their knowledge about personal finance issues, specifically,
in the areas of borrowings and investments where students seem to be completely financially oblivious. In
addition, the class could be organized in a very interactive way, on a Pass/Fail basis so that it is appealing to
students from various academic backgrounds. General education classes in various areas including: science,
24
Undergraduate Economic Review, Vol. 4 [2008], Iss. 1, Art. 1
http://digitalcommons.iwu.edu/uer/vol4/iss1/1

25
history, math, arts, English are mandatory for obtaining a BA degree. Therefore, since college graduates are
expected to be more educated and they are expected to have higher earnings after graduation, they are also
expected to be financially literate and contribute in an efficient way to the overall economic growth within
the labor markets they will be operating. Thus, as part of the preparation for their careers, a general
education requirement including a class in personal financial planning would serve as a good personal
finance foundation for college and university students, from which they will obviously benefit in the future.
In this context, it is highly important to emphasize the fact that most of the respondents indicated that they
have actually taken a personal finance class before, probably at a high school level, however, their scores on
the financial literacy test were even lower than the scores of the students who haven’t taken such a class
before. The logistic regression coefficient for the ClassFiance variable was statistically significant, fact
which indicates that the quality or the requirements for the class were really low, hence it hasn’t contributed
towards the personal finance enlightenment of these students. At a college or university level the quality of
education is considerably higher, thus, a personal finance class at this level is expected to have an effective
impact on increasing the students’ personal finance knowledge, and contribute towards educating informed
consumers and knowledgeable investors in the future.
Acknowledgements: I am really grateful for all the support, suggestions, and help with covering the cost
for the printing expenses to my academic advisor Dr. Eric Mitchell. In addition, I am highly grateful for all
the support of the RMWC students: Christina Morgan, Alexandra Ishchuk, Natasa Velkovska, Olivia Badoi
Oleksandra Petrova, Natalia Petrova and Esther Valle who helped me collect the necessary data for the
research.
25
Furtuna: College Students’ Personal Financial Literacy: Economic Impact an
Published by Digital Commons @ IWU, 2008

26
Appendix A - Questionnaire
Personal Financial Literacy Survey This study is a part of a senior research project being conducted by a student at Randolph-Macon Woman’s College. The survey intends to examine students’ personal financial literacy and the impact financial literacy has on students’ opinions and decisions. In no way will your response be used to identify you, the respondent. The survey is completely anonymous. We are interested only in your honest responses, opinions and attitudes. Thank you so much for participating in the survey!
I. Please circle the response that you find most applicable to you 1. Do you maintain financial records?
Please circle the most applicable answer:
A. Maintain very detailed records B. Maintain minimal records C. Maintain no records
2. How important it is for you to maintain adequate auto-insurance coverage?
Circle the most applicable answer:
Strongly Somewhat Not Somewhat Very
Unimportant Unimportant Sure Important Important 1 2 3 4 5
3. Is it important for you to spend less than your income?
Circle the most applicable answer:
Strongly Somewhat Not Somewhat Very
Unimportant Unimportant Sure Important Important
1 2 3 4 5 4. What are the factors you consider most important when choosing to invest in financial
securities? Place “1” by your first choice, “2” by your second choice, and so on:
Return on investment 1 2 3 4 5
Price 1 2 3 4 5 Risk 1 2 3 4 5 Professional Financial Advice 1 2 3 4 5
5. “Planning and implementing a regular investment program is a highly important
issue that should be considered by all college students.”
Circle the response that you find most applicable to you:
Strongly Somewhat Neutral Somewhat Strongly Disagree Disagree Agree Agree 1 2 3 4 5
26
Undergraduate Economic Review, Vol. 4 [2008], Iss. 1, Art. 1
http://digitalcommons.iwu.edu/uer/vol4/iss1/1

27
II. Please for questions 6-13 circle the most applicable answer 6. Personal financial planning involves
A. Developing a sound yearly budget of expenses and income. B. Minimizing taxes and insurance expenses. C. Preparing plans for future financial needs and goals. D. Examining your investment portfolios to maximize returns.
7. Which of the following instruments is NOT typically associated with spending
A. Cash B. Credit card C. Debit card D. Certificate of deposit
8. Many savings programs are protected by the Federal government against loss. Which
of the following is NOT A. A bond issued by one of the 50 States B. A U.S. Treasury Bond C. A U.S. Savings Bond D. A certificate of deposit at the bank
9. Which of the following statements is TRUE about the annual percentage rate (APR)? A. APR is the actual rate of interest paid over the life of the loan B. APR is a good measure of comparing loan costs C. APR takes into account all loan fees D. All of the above
10. The main reason to purchase insurance is to
A. Protect you from a loss recently incurred B. Provide you with excellent investment returns C. Protect you from a catastrophic loss D. Protect you from small incidental losses
11. Which of the following statements is FALSE? A. You receive no benefits when your term insurance policy expires B. A term insurance policy is the least expensive form of life insurance C. A decreasing-term policy reduces coverage over time D. A level-term policy guarantees a fixed-premium over the life of the contract
12. If interest rates rise, the price of a Treasury bond will A. Increase B. Decrease C. Remain the same D. Trade at a premium
13. A high-risk and high-return investment strategy would be most suitable for
A. An elderly retired couple living on a fixed income B. A middle-aged couple needing funds for their children’s education in two years C. A young married couple without children D. All of the above because they all need high return
27
Furtuna: College Students’ Personal Financial Literacy: Economic Impact an
Published by Digital Commons @ IWU, 2008
28
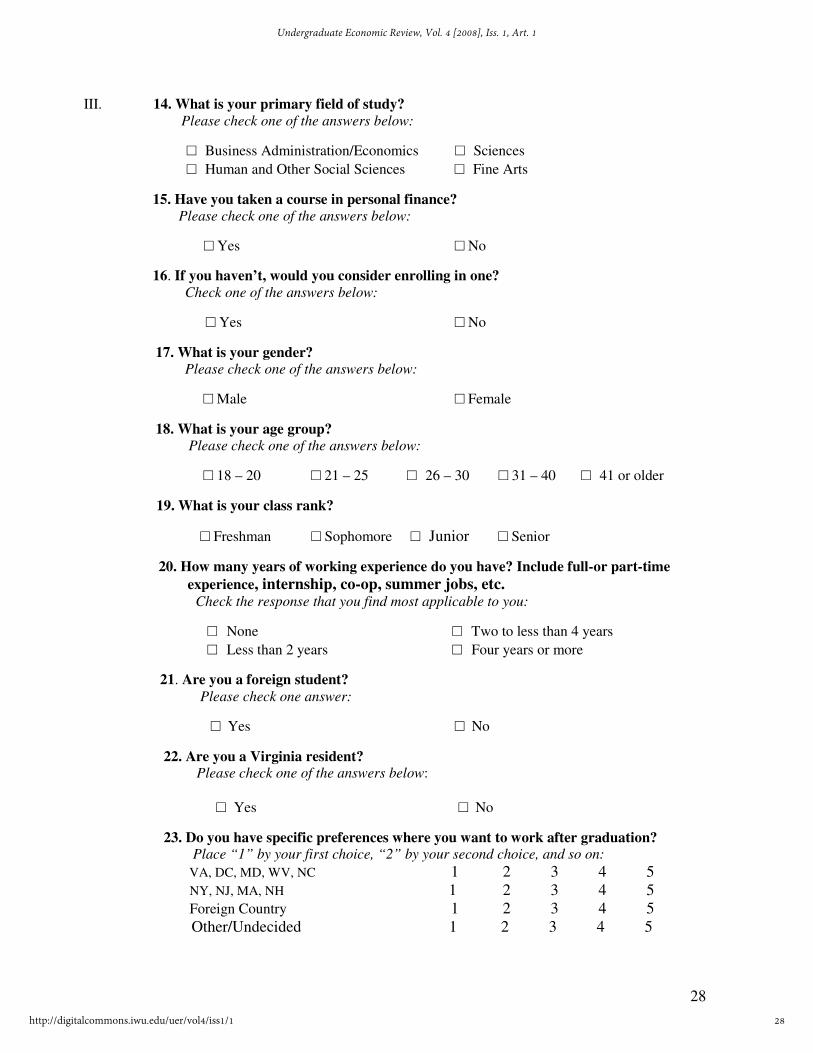
III. 14. What is your primary field of study? Please check one of the answers below:
□ Business Administration/Economics □ Sciences
□ Human and Other Social Sciences □ Fine Arts
15. Have you taken a course in personal finance?
Please check one of the answers below:
□ Yes □ No
16. If you haven’t, would you consider enrolling in one? Check one of the answers below:
□ Yes □ No
17. What is your gender?
Please check one of the answers below:
□ Male □ Female
18. What is your age group?
Please check one of the answers below:
□ 18 – 20 □ 21 – 25 □ 26 – 30 □ 31 – 40 □ 41 or older
19. What is your class rank?
□ Freshman □ Sophomore □ Junior □ Senior
20. How many years of working experience do you have? Include full-or part-time
experience, internship, co-op, summer jobs, etc. Check the response that you find most applicable to you:
□ None □ Two to less than 4 years
□ Less than 2 years □ Four years or more
21. Are you a foreign student? Please check one answer:
□ Yes □ No 22. Are you a Virginia resident? Please check one of the answers below:
□ Yes □ No 23. Do you have specific preferences where you want to work after graduation? Place “1” by your first choice, “2” by your second choice, and so on:
VA, DC, MD, WV, NC 1 2 3 4 5 NY, NJ, MA, NH 1 2 3 4 5 Foreign Country 1 2 3 4 5 Other/Undecided 1 2 3 4 5
28
Undergraduate Economic Review, Vol. 4 [2008], Iss. 1, Art. 1
http://digitalcommons.iwu.edu/uer/vol4/iss1/1

29
Appendix B - Total Financial Literacy Score Logistic Regression
Table 1. Dependent Variable Encoding
Original Value Internal Value
Student scored below 37.5 % 0
Student scored above 37.5 %
1
Table 2. Classification Table(a,b) Observed Predicted
Students' Total Financial Literacy
Student scored below 37.5 %
Student scored above 37.5 %
Percentage Correct
Students' Total Financial Literacy
Student scored below 37.5 % 203 0 100.0
Step 0
Student scored above 37.5 % 164 0 .0
Table 3. Variables in the Equation- (intercept model only)
B S.E. Wald df Sig. Exp(B)
Step 0 Constant -.213 .105 4.129 1 .042 .808
Table 4. Variables not in the Equation
Score df Sig.
FieldStudy1 2.594 1 .107
ClassFinance 5.741 1 .017
Age1 .935 1 .334
Age2 1.613 1 .204
ClassRank1 2.251 1 .134
ClassRank2 .121 1 .728
ClassRank3 .041 1 .839
ClassRank4 3.569 1 .059
Experience1 1.891 1 .169
Experience2 .756 1 .385
Experience3 .332 1 .564
Experience4 4.232 1 .040
WorkAfterGrad1 1.640 1 .200
Step 0 Variables
Gender .381 1 .537
Table 5. Omnibus Tests of Model Coefficients
Chi-square df Sig.
Step 28.740 14 .011
Block 28.740 14 .011
Step 1
Model 28.740 14 .011
29
Furtuna: College Students’ Personal Financial Literacy: Economic Impact an
Published by Digital Commons @ IWU, 2008

30
Table 6. Model Summary
Step -2 Log
likelihood Cox & Snell R Square
Nagelkerke R Square
1 475.878(a) .075 .101
Table 7. Hosmer and Lemeshow Test
Step Chi-square df Sig.
1 5.027 8 .755
Table 8. Classification Table(a)
Observed Predicted
Students' Total Financial Literacy
Student scored below 37.5 %
Student scored above 37.5 %
Percentage Correct
Students' Total Financial Literacy
Student scored below 37.5 % 154 49 75.9
Step 1
Student scored above 37.5 % 93 71 43.3
Table 9. Variables in the Equation
B S.E. Wald df Sig. Exp(B) 95.0% C.I.for EXP(B)
Chi-Square
χχχχ2 Lower Upper
S1 FieldStudy1 .779 .323 5.815 1 .016 2.179 1.157 4.105
ClassFinance -.869 .366 5.638 1 .018 .419 .205 .859
Age1 .545 1.221 .199 1 .656 1.724 .158 18.856
Age2 .420 1.231 .117 1 .733 1.522 .136 16.988
ClassRank1 20.947 19778.095 .000 1 .999 1250820507.334 .000 .
ClassRank2 21.141 19778.095 .000 1 .999 1518715972.978 .000 .
ClassRank3 21.100 19778.095 .000 1 .999 1456792917.519 .000 .
ClassRank4 21.630 19778.095 .000 1 .999 2476033556.847 .000 .
Experience1 -22.071 40194.923 .000 1 1.000 .000 .000 .
Experience2 -21.859 40194.923 .000 1 1.000 .000 .000 .
Experience3 -21.639 40194.923 .000 1 1.000 .000 .000 .
Experience4 -21.366 40194.923 .000 1 1.000 .000 .000 .
WorkAfterGrad1 -.279 .222 1.581 1 .209 .757 .490 1.169
Gender .325 .273 1.422 1 .233 1.385 .811 2.364
Constant -.335 44798.529 .000 1 1.000 .715
a Variable(s) entered on step 1: FieldStudy1, ClassFinance, Age1, Age2, ClassRank1, ClassRank2, ClassRank3, ClassRank4, Experience1, Experience2, Experience3, Experience4, WorkAfterGrad1, Gender.
30
Undergraduate Economic Review, Vol. 4 [2008], Iss. 1, Art. 1
http://digitalcommons.iwu.edu/uer/vol4/iss1/1

31
Works Cited
Bianco, Candy A., Bosco, Susan M.“Financial Illiteracy – What Are Business Schools Teaching?” (2000). Gabelli School of Business Roger Williams University, Bristol, RI.
Boushey, Heather. “Student Debt: Bigger and Bigger.” (2005, September). Center for Economic
and Policy Research, Washington DC. Burns, Alvin C., Bush, Ronald F. Marketing Research. 3 ed. Upper Saddle River, NJ: Prentice-
Hall, Inc. 2000.
David M. Walker, “Truth and Transparency: The Federal Government’s Financial Condition and Fiscal Outlook.” United States GAO, September 17, 2003.
Drucker, Joshua, Goldstein, Harvey. “The Economic Development Impacts of Universities on
Regions. Do Size and Distance Matter?” Economic Development Quarterly. (2006): Vol. 20, No. 1, 22-43.
Hawkins, David A., Clinedinst, Melissa. State of College Admission 2006. (2006). National Association for College Admission Counseling.
Helman, Ruth, Greenwald, Mathew & Associates; Craig Copeland, Jack VanDehei, Employee
Benefit Research Institute. “Will More of Us Be Working Forever? The 2006 Retirement Confidence Survey, Results of the 2006 Retirement Confidence Survey.”April 2006, Washington DC.
Huffman, David, Quigley, John M. “The role of the university in attracting high-tech
entrepreneurship: A Silicon Valley tale.” The Annals of Regional Science. (2002, September): Vol. 36, No.3, 403-419.
John Hancock. 2001. Insight into participant investment knowledge & behavior, seventh. Boston,
MA: John Hancock. Jump$tart Coalition (2004), “Financial Literacy Improves Among Nation’s High School Students:
Jump$tart Questionnaire for Seniors Reveals Moderate Gains.” http://www.jumpstart.org/fileuptemp/FINAL_PR_Jump$tart_2004_Survey.doc
Khan, K. “How Does Your Debt Compare?” MSN Money.
http://moneycentral.msn.com/content/SavingandDebt/P70581.asp
KPMG Peat Marwick LLP (KPMG). (1995). “Retirement benefits in the 1990s: 1995 survey data.”
June. New York, NY. Mixon, G. Franklin. “Factors Affecting College Student Migration across States.” International
Journal of Manpower, (1992):Vol. 13 No.1, 25-32.
31
Furtuna: College Students’ Personal Financial Literacy: Economic Impact an
Published by Digital Commons @ IWU, 2008

32
Miller, Ron, 1998, “Youth Education’s Long-tern Yield,” Credit Union Magazine, (1998, January): 15A-16A.
“NFCC Convenes Spring Meeting & Congressional Advocacy Day in Recognition of Financial
Literacy Month & Credit Education Week,” Consumer Credit Counseling Services. April 16th, 2004.
Princeton Survey Research Associates (PRSA). “Planning for the future: Are Americans prepared
to meet their financial goals?” Nations Bank/Consumer Federation of America. (1997, January/February). Princeton, NJ.
Steahr, E. Thomas, Schmid, Calvin F. “College Student Migration in the United States.” The
Journal of Higher Education. (1972, June): Vol. 43, No.6, 441-463. U.S. Dept. of Health & Human Services as quoted in “Debt Statistics,” New Step Debt
Consolidation. http://www.newstepsolutions.com/debt-statistics.htm Volpe, R. P., Kotel, J. E. & Chen, H. “A survey of investment literacy among online investors,”
Financial Counseling and Planning. (2002): 1-13. Vanguard Group/ Money Magazine. “Financial Literacy of Mutual Fund Investors.”(2002): May,
NY. Volpe. P., Ronald, E. Joseph, Kotel, Chen, Haiyang, “A Survey of Financial Literacy Among
Online Investors,” (2002). Association for Financial Counseling and Planning Education. Volpe, R. P., Chen, H., & Pavlicko J. J. “Personal investment literacy among college students: A
survey.” Financial Practice and Education. (1996, Fall/Winter): 86-94. Volpe, R. P., Chen, Haiyang. “An Analysis of Personal Financial Literacy Among College
Students.” Financial Services Review. (1998): 107-128.
32
Undergraduate Economic Review, Vol. 4 [2008], Iss. 1, Art. 1
http://digitalcommons.iwu.edu/uer/vol4/iss1/1