Respiration characteristics and its responses to ... - Nature

Plant Cell Physiol. 50(2): 203–215 (2009) doi:10.1093/pcp/pcn189, available online at www.pcp.oxfordjournals.org© The Author 2008. Published by Oxford University Press on behalf of Japanese Society of Plant Physiologists.All rights reserved. For permissions, please email: [email protected]
4 Present address: Molecular Plant Physiology Group, Research School of Biological Sciences, Building 46, The Australian National University, Canberra, ACT, 2601 Australia. * Corresponding author: E-mail, [email protected] ; Fax, +61-2-6125-5075.
Some plant species show constant rates of respiration and photosynthesis measured at their respective growth temperatures (temperature homeostasis), whereas others do not. However, it is unclear what species show such temperature homeostasis and what factors affect the temperature homeostasis. To analyze the inherent ability of plants to acclimate respiration and photosynthesis to different growth temperatures, we examined 11 herbace-ous crops with different cold tolerance. Leaf respiration ( R area ) and photosynthetic rate ( P area ) under high light at 360 µ l l –1 CO 2 concentrations were measured in plants grown at 15 and 30°C. Cold-tolerant species showed a greater extent of temperature homeostasis of both R area and P area than cold-sensitive species. The underlying mechanisms which caused differences in the extent of temperature homeostasis were examined. The extent of temperature homeostasis of P area was not determined by differences in leaf mass and nitrogen content per leaf area, but by differences in photosynthetic nitrogen use effi ciency (PNUE). Moreover, differences in PNUE were due to differences in the maximum catalytic rate of Rubisco, Rubisco contents and amounts of nitrogen invested in Rubisco. These fi ndings indicated that the temperature homeostasis of photosynthesis was regulated by various parameters. On the other hand, the extent of temperature homeostasis of R area was unrelated to the maximum activity of the respiratory enzyme (NAD-malic enzyme). The R area / P area ratio was maintained irrespective of the growth temperatures in all the species, suggesting that the extent of temperature homeostasis of R area interacted with
the photosynthetic rate and/or the homeostasis of photosynthesis.
Keywords: Cold tolerance • Phenotypic plasticity • Photosynthesis • Respiration • Temperature acclimation • Temperature homeostasis.
Abbreviations: DTT , Dithiothreitol ; HT , high temperature ; LMA , leaf mass per area ; LT , low temperature ; NAD-ME , NAD-malic enzyme ; N area , nitrogen content per leaf area ; P area , net photosynthetic rate ; P mass , photosynthetic rate per leaf mass ; PNUE , photosynthetic nitrogen use effi ciency ; R area , dark respiration rate ; R mass , respiration rate per leaf mass ; RM-ANOVA , repeated measures analysis of variance ; RuBP , ribulose bisphosphate ; RNUE , respiratory nitrogen use effi ciency.
Introduction
Photosynthetic rates vary with leaf temperature ( Berry and Björkman 1980 , Yamori et al. 2005 , Hikosaka et al. 2006 ). However, when plants are grown at various temperatures, the photosynthetic rate measured at their growth tempera-ture is often maintained ( Slatyer 1977 , Mooney et al. 1978 , Berry and Björkman 1980 , Yamori et al. 2005 ). The case is often the same for respiration. Although respiration rates increase with leaf temperature, the respiration rate at their growth temperature is similar ( Tjoelker et al. 1999a , Loveys et al. 2003 , Atkin et al. 2006 ). These are considered as homeo-static responses to maintain a certain rate of photosynthesis
Cold-Tolerant Crop Species Have Greater Temperature Homeostasis of Leaf Respiration and Photosynthesis Than Cold-Sensitive Species Wataru Yamori 1 , 4 , * , Ko Noguchi 2 , Kouki Hikosaka 3 and Ichiro Terashima 2 1 Department of Biology, Graduate School of Science, Osaka University, 1-1 Machikaneyama-cho, Toyonaka, Osaka, 560-0043 Japan 2 Department of Biological Sciences, Graduate School of Science, The University of Tokyo, 7-3-1, Hongo, Bunkyo-ku, Tokyo, 113-0033 Japan 3 Graduate School of Life Sciences, Tohoku University, 6-3 Aoba, Sendai, 980-8578 Japan
203Plant Cell Physiol. 50(2): 203–215 (2009) doi:10.1093/pcp/pcn189 © The Author 2008.
Regular Paper

and respiration irrespective of the growth conditions ( Atkin and Tjoelker 2003 , Hikosaka et al. 2006 ).
Temperature acclimation for photosynthesis has been related to leaf nitrogen economy, since more than half of the leaf nitrogen is in the photosynthetic apparatus and thus the photosynthetic capacity is strongly related to the leaf nitro-gen content ( Evans 1989 , Poorter and Evans 1998 , Makino et al. 2003 , Hikosaka 2004 ). Leaf nitrogen content on a leaf area basis is greater in leaves grown at lower temperatures (either in the laboratory or in the fi eld; Weih and Karlsson 2001 , Muller et al. 2005 , Yamori et al. 2005 ). This is consid-ered as a compensatory response to low temperature, which decreases enzyme activity ( Badger et al. 1982 , Holaday et al. 1992 , Strand et al. 1999 ). As respiration rates are also related to the leaf nitrogen content ( Makino and Osmond 1991 , Ryan 1995 , Reich et al. 1998a , Reich et al. 1998b , Noguchi and Terashima 2006 ), a similar response has also been observed for the temperature acclimation of respiration ( Duke et al. 1977 , Atkin and Tjoelker 2003 , Kurimoto et al. 2004b ).
For photosynthesis, not only leaf nitrogen content but also nitrogen use within a leaf is suggested to be related to the temperature acclimation. Changes in nitrogen parti-tioning among photosynthetic components can be a factor responsible for changes in the temperature dependence of the photosynthetic rate, and thus may affect the photo-synthetic rate at the growth temperature ( Hikosaka 1997 , Hikosaka et al. 2006 ). Some studies showed that nitrogen partitioning among photosynthetic components changes with the growth temperature ( Makino et al. 1994 , Steffen et al. 1995 , Hikosaka 1997 , Hikosaka 2005 , Yamori et al. 2005 ). It has also been reported that the temperature dependence of Rubisco kinetics changes with growth temperatures ( Huner and Macdowall 1979 , Yamori et al. 2006a ). There-fore, it is probable that differences in both leaf nitrogen con-tent and nitrogen use effi ciency could affect temperature homeostasis.
Temperature dependence of the respiration rate is con-sidered to be determined by the maximum activity of respi-ratory enzymes, availability of substrates and/or demand for respiratory energy ( Azcón-Bieto et al. 1983 , Noguchi and Terashima 1997 , Atkin et al. 2000 , Atkin and Tjoelker 2003 ). It has been reported that temperature acclimation of respiration involves increases in the respiratory capacity by increasing the capacity per mitochondrion ( Klikoff 1966 , Klikoff 1968 ), or increasing the number of mitochondria ( Miroslavov and Kravkina 1991 ), the mitochondrial density and the density of cristae within mitochondria ( Armstrong et al. 2006 ). Thus, temperature acclimation of respiration could be linked to changes in the enzyme capacity ( Atkin and Tjoelker 2003 ).
The extent of temperature acclimation of photosynthesis and respiration differs among species. Some species are able to acclimate, whereas others are not ( Berry and Björkman
1980 , Larigauderie and Körner 1995 , Xiong et al. 2000 , Loveys et al. 2002 , Loveys et al. 2003 , Atkin et al. 2006 ). There are reports that broad-leaved tree species exhibited a lower extent of temperature homeostasis of leaf respiration than needle-leaved tree species ( Tjoelker et al. 1999b ), and that a greater extent of temperature homeostasis was exhibited by herbaceous species in several studies ( Yamasaki et al. 2002 , Talts et al. 2004 , Yamori et al. 2005 , Yamori et al. 2006a , Yamori et al. 2006b , Yamori et al. 2008 ). Recently, Atkin et al. (2006) indicated that the extent of temperature homeo-stasis of leaf respiration and photosynthesis differed greatly between lowland (fast-growing) and alpine (slow-growing) Plantago species. Lowland species showed a greater extent of temperature homeostasis than alpine species. However, it is unclear what physiological characteristics are related to the interspecifi c variation of temperature homeostasis of respi-ration and photosynthesis. Moreover, mechanisms underly-ing the differences in temperature homeostasis depending on the species have still not been clarifi ed. Recent studies have shown that interspecifi c variation of many leaf traits is related to the plant functional type ( Wright et al. 2005 ). However, Loveys et al. (2003) showed that the temperature response for the respiration/photosynthesis ratio was gen-erally similar among typical functional groups (forbs, eight species; grasses, two species; shrubs and trees, four species). Also, Campbell et al. (2007) indicated the striking similarities in the response of acclimation for respiration and photosyn-thesis among several functional groups (forbs, seven species; grasses, four species; shrubs and trees, eight species).
Since temperature tolerance differs depending on the plant species even in the same functional group ( Long and Woodward 1989 ), it is possible that the extent of tempera-ture homeostasis of respiration and photosynthesis would also differ depending on the species. Therefore, comparisons of several species with different cold tolerance would provide us with new insight into the temperature homeostasis and effects of growth temperature on the respiration/photosyn-thesis ratio. In the present study, we selected 11 herbaceous crops which have different cold tolerance (e.g. Larcher 1995 , Huner et al. 1998 , Huang et al. 2005 ). We grew those plants at 15°C (LT) and 30°C (HT), and measured the temperature dependences of leaf dark respiration rate and photosynthetic rate under high light of 1,500 µ mol m –2 s –1 at 360 µ l l –1 CO 2 concentrations. Together with structural parameters such as leaf mass per leaf area (LMA), we determined leaf nitro-gen content and nitrogen use effi ciency for photosynthe-sis (PNUE) and respiration (RNUE). Moreover, we analyzed the maximal activities of Rubisco and NAD-malic enzyme (NAD-ME) as representative enzymes for photosynthesis and respiration, respectively. We addressed the following key questions. (i) Does the extent of temperature homeostasis of respiration and photosynthesis relate to cold toler-ance? (ii) What factors infl uence the extent of temperature
204
W. Yamori et al.
Plant Cell Physiol. 50(2): 203–215 (2009) doi:10.1093/pcp/pcn189 © The Author 2008.

homeostasis of respiration and photosynthesis? In particular, we focused on the mechanisms of temperature homeostasis from a viewpoint of nitrogen economy, and analyzed whether the interspecifi c difference in homeostasis is related to the plasticity in leaf nitrogen content or nitrogen partitioning within the leaf.
Results
Temperature homeostasis of leaf respiration and photosynthesis Dark respiration rate ( R area ) and net photosynthetic rate ( P area ) were measured at the growth temperature in HT and LT leaves, respectively ( Table 1 , Supplementary Table S1). In Cucumis sativus , Nicotiana tabacum and Oryza sativa , R area measured at 15°C in LT leaves was lower than R area measured at 30°C in HT leaves, whereas other plant species exhibited similar rates at their respective growth temperatures. As an index for the extent of the respiratory homeostasis, we determined the ratio of R area measured at 15°C in LT leaves to that measured at 30°C in HT leaves (LT-15°C/HT-30°C) ( Table 1 ). When the ratio is close to 1.0, it indicates that the temperature homeostasis is high. In C. sativus , N. tabacum and O. sativa , the ratio of R area was much lower than 1.0 and showed a value between 0.51 and 0.65. For all other spe-cies, the ratio was between 0.81 and 0.94. The average ratio of R area (LT-15°C/HT-30°C) for the cold-sensitive species (0.67 ± 0.05) was signifi cantly lower than that for the cold-tolerant species (0.88 ± 0.05).
According to Atkin et al. (2004) and Kurimoto et al. (2004a , 2004b ), the extent of respiratory homeostasis was calculated as
where Rn ( m °C) denotes a respiratory rate in n °C-grown plants, which were measured at m °C. The average H of R area
for the cold-sensitive species (0.69 ± 0.18) was signifi cantly lower than that for the cold-tolerant species (0.90 ± 0.06; P = 0.016). When we compared these two methods, there were signifi cant relationships for R area ( R 2 = 0.92). Therefore, it is fair to say that the trends between the two methods were the same.
P area measured at the respective growth temperatures also decreased with decreasing growth temperature in C . sativus , N . tabacum and O . sativa ( Table 1 , Supplemen-tary Table S1). On the other hand, the other species exhib-ited similar rates irrespective of the growth temperatures. This indicates that the species with high homeostasis of R area also showed high homeostasis of P area , and vice versa. The average ratio of P area (LT-15°C/HT-30°C) for the cold-sensitive species (0.67 ± 0.06) was signifi cantly lower than that in the cold-tolerant species (0.92 ± 0.06, Table 1 ).
In order to investigate the relationships between the extent of temperature homeostasis of respiration and pho-tosynthesis, we analyzed the relationships between R area and P area at their respective growth temperatures ( Fig. 1 ). The ratio of R area (LT-15°C/HT-30°C) was strongly related to the ratio of P area ( r = 0.95, P < 0.0001).
Mechanisms of temperature homeostasis of photosynthesis and respiration The extent of temperature homeostasis of R area and P area was different depending on the cold tolerance. Tempera-ture homeostasis is basically considered as a compensation for the changes in specifi c activity by altering amounts of enzymes. Here, we analyzed factors affecting the tempera-ture homeostasis of respiration and photosynthesis with a decomposition analysis ( Table 2 , see also Supplementary Tables S2, S3, S4 for each species). First, the effects of growth temperature, plant type and their interaction were tested with repeated measures analysis of variance (RM-ANOVA). LMA and nitrogen content per leaf area (N area ) were larger in LT leaves than in HT leaves ( Table 2 ), although there were
Table 1 Temperature homeostasis of dark respiration and photosynthesis, and balance between the respiration and photosynthetic rates in cold-sensitive and cold-tolerant species
R area ( µ mol CO 2 m –2 s –1 ) P area ( µ mol CO 2 m –2 s –1 ) R area / P area ratio
LT (15°C) HT (30°C) Ratio (homeostasis)
LT (15°C) HT (30°C) Ratio (homeostasis)
LT (15°C) HT (30°C)
Cold-sensitive species 0.71 ± 0.10 1.08 ± 0.08 0.67 ± 0.05 10.4 ± 2.0 16.2 ± 3.0 0.67 ± 0.06 0.068 ± 0.009 0.068 ± 0.012
Cold-tolerant species 0.99 ± 0.10 1.13 ± 0.08 0.88 ± 0.05 15.0 ± 2.0 16.4 ± 3.0 0.92 ± 0.06 0.067 ± 0.011 0.071 ± 0.014
Student's t -test ** NS * ** NS ** NS NS
Respiratory rate ( R area ) and net photosynthetic rate ( P area ) measured at their growth temperatures in LT and HT leaves are shown for LT (15°C) and HT (30°C). The ratios of rates measured at 15°C in LT leaves to that measured at 30°C in HT leaves are also shown for ‘Ratio (homeostasis)’ as an index of the extent of temperature homeostasis. On the right, the balance between the respiration and photosynthetic rates ( R area / P area ) at their respective growth temperatures in LT and HT leaves are shown. Values represent the mean ± SD for cold-sensitive species and cold-tolerant species, respectively; n = 3–5.
205
Homeostasis of respiration and photosynthesis
Plant Cell Physiol. 50(2): 203–215 (2009) doi:10.1093/pcp/pcn189 © The Author 2008.

variations depending on the plant species (Supplementary Table S2). N area values were greater in cold-tolerant species than in cold-sensitive species at both growth temperatures. No signifi cant differences were observed for LMA between plant types. In relation to R area , the respiration rate per leaf mass ( R mass ), RNUE ( R area /N area ), NAD-ME activity and NAD-ME activity/N area were lower in LT leaves than in HT leaves, whereas R area /NAD-ME activity was greater. How-ever, there was no signifi cant difference in these parameters between cold-tolerant and cold-sensitive species. There were no signifi cant interactive effects of growth temperature and plant type in all the factors for R area .
In relation to P area , the photosynthetic rate per leaf mass ( P mass ), PNUE ( P area /N area ), Rubisco activity and the maxi-mum catalytic turnover rate of Rubisco ( k cat ) were lower in LT leaves than in HT leaves, whereas P area /Rubisco activity and Rubisco contents were greater. There were signifi cant differences in Rubisco activity, k cat , Rubisco contents and P max /Rubisco activity between cold-sensitive and cold-tolerant species, whereas there were no signifi cant differences in P mass , P area /N area and Rubisco contents/N area . We found mar-ginally signifi cant interactive effects ( P < 0.1) of growth tem-perature and plant type in P area /N area ( P = 0.053) and Rubisco contents/N area ( P = 0.060), suggesting that the temperature response in nitrogen use was different between cold-sensitive and cold-tolerant species.
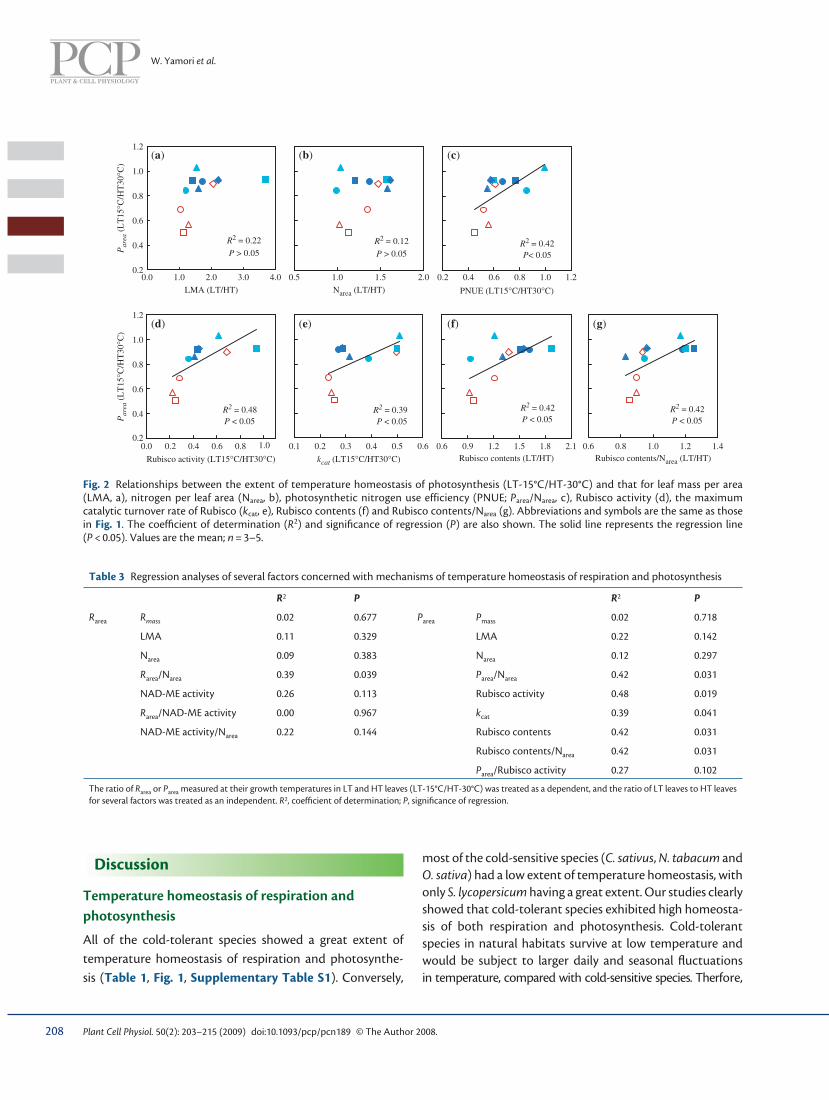
Next, we conducted a regression analysis to test what factors contributed to the temperature homeostasis in species with a great extent of the homeostasis ( Fig. 2 , Table 3 ). We treated the ratio of R area or P area at two growth
temperatures (i.e. the extent of temperature homeostasis) as a dependent and the ratio of the above factors as an indepen-dent. There was signifi cant correlation between the R area ratio and the R area /N area ratio, but there was no signifi cant corre-lation between the R area ratio and the other related factors ( Table 3 ). The ratio of P area was not correlated with that of P mass , LMA, N area and P area /Rubisco activity, but was signifi -cantly correlated with that of P area /N area , Rubisco activity, Rubisco k cat , Rubisco contents and Rubisco contents/N area , respectively ( Fig. 2 , Table 3 ).
Balance between respiration and photosynthetic rates
In order to analyze the balance between respiration and photosynthetic rates, we estimated the ratio of R area to P area ( R area / P area ) at their respective growth temperatures ( Table 1 , Supplementary Table S1). There were no differences in the average R area / P area ratio at their respective growth tempera-tures between cold-sensitive and cold-tolerant species. The R area / P area ratio was maintained irrespective of the growth temperatures in all the species. However, the R area / P area ratio differed greatly depending on the species (e.g. O. sativa , 0.061; Solanum lycopersicum , 0.078). We plotted the relationship of the R area / P area ratio between HT and LT leaves ( Fig. 3a ). The R area / P area ratio in HT leaves was strongly correlated with the ratio in LT leaves, irrespective of the extent of temperature homeostasis of R area and P area ( r = 0.92, P < 0.0001).
Fig. 1 Relationships of temperature homeostasis between respiration and photosynthetic rates. The extent of temperature homeostasis was determined by the ratio of R area or P area measured at 15°C in LT leaves to that measured at 30°C in HT leaves (LT-15°C/HT-30°C). When the ratio is close to 1.0, it indicates that the temperature homeostasis is high. The solid line represents the correlation line. The coeffi cient of correlation ( r ) and signifi cance of correlation ( P ) are also shown. The dashed line indicates y = x . Values are the mean; n = 3–5.
r = 0.95
P < 0.0001
0.2
0.4
0.6
0.8
1.0
1.2
0.2 0.4 0.6 0.8 1.0 1.2
Rarea (LT15°C/HT30°C)
Par
ea (
LT
15°C
/HT
30°C
)
Cold sensitive species
Cucumis sativus ( )
Nicotiana tabacum ( )
Oryza sativa ( )
Solanum lycopersicum ( )
Cold tolerant species
Secale cereale ( )
Solanum tuberosum ( )
Spinacia oleracea ( )
Triticum aestivum (spring) ( )
Triticum aestivum (winter) ( )
×Triticosecale Wittmack ( )
Vicia faba ( )
206
W. Yamori et al.
Plant Cell Physiol. 50(2): 203–215 (2009) doi:10.1093/pcp/pcn189 © The Author 2008.

Next, in order to investigate the interaction between photosynthesis and respiration at an enzyme level, we analyzed temperature effects on activities of Rubisco and NAD-ME as representative enzymes for photosynthesis and respiration, respectively. The average ratios of NAD-ME activity to Rubisco activity (NAD-ME/Rubisco) at the growth temperatures were signifi cantly greater in
cold-sensitive species (LT, 1.75 ± 0.36; HT, 1.34 ± 0.25) than in cold-tolerant species (LT, 0.77 ± 0.09; HT, 0.72 ± 0.07) in both HT and LT leaves (Supplementary Tables S2, S3). Moreover, in both cold-sensitive and cold-tolerant species, the average NAD-ME/Rubisco ratio was greater in LT leaves than in HT leaves. The NAD-ME/Rubisco ratio was strongly correlated between HT and LT leaves ( r = 0.97, P < 0.0001, Fig. 3b ).
Table 2 Effects of growth temperature, plant type and their interaction on several factors concerned with mechanisms of temperature homeostasis of respiration and photosynthesis
Cold-sensitive
Cold-tolerant
P -value Cold-sensitive
Cold-tolerant
P -value
LMA (g m –2 ) LT 29.7 ± 9.2 41.5 ± 17.4 GT: 0.003 P area LT (15°C) 10.4 ± 2.0 15.0 ± 2.0 GT: <0.001
HT 21.8 ± 4.9 22.0 ± 2.7 PT: 0.186 ( µ mol m –2 s –1 ) HT (30°C) 16.2 ± 3.0 16.4 ± 3.0 PT: 0.086
GT×PT: 0.208 GT×PT: 0.006
N area (g m –2 ) LT 1.28 ± 0.11 1.69 ± 0.16 GT: 0.003 P mass LT (15°C) 0.37 ± 0.10 0.40 ± 0.12 GT: <0.001
HT 1.06 ± 0.25 1.30 ± 0.23 PT: 0.008 ( µ mol g –1 s –1 ) HT (30°C) 0.76 ± 0.19 0.75 ± 0.10 PT: 0.884
GT×PT: 0.611 GT×PT: 0.824
R area LT (15°C) 0.71 ± 0.10 0.99 ± 0.10 GT: <0.001 P area /N area LT (15°C) 8.20 ± 1.53 8.91 ± 1.19 GT: <0.001
( µ mol m –2 s –1 ) HT (30°C) 1.08 ± 0.08 1.13 ± 0.08 PT: 0.008 ( µ mol g –1 s –1 ) HT (30°C) 15.6 ± 3.4 12.9 ± 2.4 PT: 0.610
GT×PT: 0.011 GT×PT: 0.053
R mass LT (15°C) 0.025 ± 0.007 0.026 ± 0.007 GT: <0.001 Rubisco activity LT (15°C) 10.1 ± 2.2 26.5 ± 7.7 GT: <0.001
( µ mol g –1 s –1 ) HT (30°C) 0.051 ± 0.012 0.052 ± 0.007 PT: 0.878 ( µ mol m –2 s –1 ) HT (30°C) 32.4 ± 10.5 53.5 ± 13.6 PT: <0.001
GT×PT: 0.968 GT×PT: 0.116
R area /N area LT (15°C) 0.56 ± 0.15 0.59 ± 0.10 GT: <0.001 k cat LT (15°C) 0.45 ± 0.16 0.75 ± 0.13 GT: <0.001
( µ mol g –1 s –1 ) HT (30°C) 1.06 ± 0.25 0.89 ± 0.16 PT: 0.682 [mol CO 2 (mol sites) –1 s –1 ]
HT (30°C) 1.52 ± 0.36 2.15 ± 0.58 PT: 0.006
GT×PT: 0.111 GT×PT: 0.330
NAD-ME LT (15°C) 17.3 ± 2.1 20.0 ± 4.2 GT: <0.001 Rubisco contents LT 2.91 ± 0.53 4.43 ± 0.88 GT: 0.011
activity HT (30°C) 43.8 ± 16.9 38.0 ± 8.5 PT: 0.900 ( µ mol m –2 ) HT 2.69 ± 0.73 3.18 ± 0.77 PT: 0.029
( µ mol m –2 s –1 ) GT×PT: 0.279 GT×PT: 0.114
R area /NAD-ME LT (15°C) 0.041 ± 0.008 0.051 ± 0.010 GT: <0.001 P area /Rubisco activity LT (15°C) 1.04 ± 0.12 0.59 ± 0.11 GT: <0.001
activity HT (30°C) 0.027 ± 0.011 0.031 ± 0.008 PT: 0.220 HT (30°C) 0.52 ± 0.13 0.31 ± 0.04 PT: <0.001
GT×PT: 0.758 GT×PT: 0.634
NAD-ME LT (15°C) 13.6 ± 2.7 11.8 ± 2.1 GT: <0.001 Rubisco contents/N area LT 2.29 ± 0.51 2.63 ± 0.50 GT: 0.582
activity/Narea HT (30°C) 41.1 ± 13.4 29.6 ± 5.8 PT: 0.056 ( µ mol g –1 ) HT 2.57 ± 0.65 2.45 ± 0.30 PT: 0.632
( µ mol g –1 s –1 ) GT×PT: 0.370 GT×PT: 0.060
Gas exchange rate and enzyme activity measured at their growth temperatures in LT and HT leaves are shown for LT (15°C) and HT (30°C). k cat was calculated from Rubisco activity and Rubisco contents. Values represent the mean ± SD for cold-sensitive species and cold-tolerant species, respectively; n = 3–5. An RM-ANOVA was used after data were transformed logarithmically. P -values of RM-ANOVA are shown for difference between growth temperatures (GT) and between plant types (PT), and for interactions (GT×PT).
207
Homeostasis of respiration and photosynthesis
Plant Cell Physiol. 50(2): 203–215 (2009) doi:10.1093/pcp/pcn189 © The Author 2008.
Discussion
Temperature homeostasis of respiration and photosynthesis
All of the cold-tolerant species showed a great extent of temperature homeostasis of respiration and photosynthe-sis ( Table 1 , Fig. 1 , Supplementary Table S1). Conversely,
most of the cold-sensitive species ( C. sativus , N. tabacum and O. sativa ) had a low extent of temperature homeostasis, with only S. lycopersicum having a great extent. Our studies clearly showed that cold-tolerant species exhibited high homeosta-sis of both respiration and photosynthesis. Cold-tolerant species in natural habitats survive at low temperature and would be subject to larger daily and seasonal fl uctuations in temperature, compared with cold-sensitive species. Therfore,
Fig. 2 Relationships between the extent of temperature homeostasis of photosynthesis (LT-15°C/HT-30°C) and that for leaf mass per area (LMA, a), nitrogen per leaf area (N area , b), photosynthetic nitrogen use efficiency (PNUE; P area /N area , c), Rubisco activity (d), the maximum catalytic turnover rate of Rubisco ( k cat , e), Rubisco contents (f) and Rubisco contents/N area (g). Abbreviations and symbols are the same as those in Fig. 1 . The coeffi cient of determination ( R 2 ) and signifi cance of regression ( P ) are also shown. The solid line represents the regression line ( P < 0.05). Values are the mean; n = 3–5.
R2 = 0.42P < 0.05
Rubisco contents/Narea (LT/HT)
R2 = 0.42P < 0.05
Rubisco contents (LT/HT)
R2 = 0.42P< 0.05
PNUE (LT15°C/HT30°C)
R2 = 0.39P < 0.05
kcat (LT15°C/HT30°C)
Narea (LT/HT)
R2 = 0.48P < 0.05
Rubisco activity (LT15°C/HT30°C)
0.2
0.4
0.6
0.8
1.0
1.2
0.0 1.0 2.0 3.0 4.0
0.0 0.2 0.4 0.6 0.8 1.0 0.1 0.2 0.3 0.4 0.5 0.6 0.6 0.9 1.2 1.5 1.8 2.1 0.6 0.8 1.0 1.2 1.4
0.5 1.0 1.5 2.0 0.2 0.4 0.6 0.8 1.0 1.2
LMA (LT/HT)
Par
ea (
LT
15°C
/HT
30°C
)
0.2
0.4
0.6
0.8
1.0
1.2
Par
ea (
LT
15°C
/HT
30°C
)
R2 = 0.22
P > 0.05R2 = 0.12
P > 0.05
(a)
(d) (e) (f) (g)
(b) (c)
Table 3 Regression analyses of several factors concerned with mechanisms of temperature homeostasis of respiration and photosynthesis
R 2 P R 2 P
R area R mass 0.02 0.677 P area P mass 0.02 0.718
LMA 0.11 0.329 LMA 0.22 0.142
N area 0.09 0.383 N area 0.12 0.297
R area /N area 0.39 0.039 P area /N area 0.42 0.031
NAD-ME activity 0.26 0.113 Rubisco activity 0.48 0.019
R area /NAD-ME activity 0.00 0.967 k cat 0.39 0.041
NAD-ME activity/N area 0.22 0.144 Rubisco contents 0.42 0.031
Rubisco contents/N area 0.42 0.031
P area /Rubisco activity 0.27 0.102
The ratio of R area or P area measured at their growth temperatures in LT and HT leaves (LT-15°C/HT-30°C) was treated as a dependent, and the ratio of LT leaves to HT leaves for several factors was treated as an independent. R 2 , coeffi cient of determination; P , signifi cance of regression.
208
W. Yamori et al.
Plant Cell Physiol. 50(2): 203–215 (2009) doi:10.1093/pcp/pcn189 © The Author 2008.

cold-tolerant species would acquire a greater extent of temperature homeostasis for both R area and P area than cold-sensitive species. Plants with high homeostasis would be able to maintain their relative growth rate irrespective of growth temperature ( Gunn and Farrar 1999 , Kurimoto et al. 2004a ).
Many studies have reported a different inherent abil-ity to tolerate cold, even in the same species, e.g. C. sativus ( Yu et al. 2002 ), O. sativa ( Saruyama and Tanida 1995 ) and S. lycopersicum (Brüggemann et al. 1994). Moreover, selec-tive breeding of crops has been improved. Therefore, it is possible that S. lycopersicum examined in this study is rela-tively tolerant to the low temperature compared with other cold-sensitive species.
Mechanisms of temperature homeostasis of photosynthesis It has been argued that the temperature homeostasis of photosynthesis is related to N area and LMA (e.g. Weih and Karlsson 2001 , Muller et al. 2005 , Yamori et al. 2005 , Camp-bell et al. 2007 ). Although N area and LMA increased at low growth temperature in most species ( Table 2 , Supplemen-tary Table S2), this increase was unrelated to the tempera-ture homeostasis ( Fig. 2 ). Rather, temperature homeostasis of photosynthesis was related to P area /N area (PNUE, Fig. 2 ), suggesting that nitrogen use is more important for the tem-perature homeostasis than nitrogen content. Recent model analysis suggests that nitrogen partitioning has great poten-tial for maximizing the photosynthetic rate ( Zhu et al. 2007 ). In the present study, we clearly showed that plants which can alter nitrogen partitioning depending on the growth temperature had a great extent of temperature homeosta-sis for photosynthesis. Among mechanisms which contrib-uted to the increase in PNUE, Rubisco content/N area , which is the partitioning of nitrogen to Rubisco, was important
( Fig. 2 ). Moreover, greater increases in Rubisco contents and k cat by decreasing the growth temperature were important factors ( Fig. 2 ). Thus, the interspecifi c variation in the extent of temperature homeostasis of photosynthesis was related to the differences in both the quality and quantity of Rubisco. This study showed that the temperature homeostasis of photosynthesis would be regulated by various parameters.
Many studies have shown that plants grown at low tem-peratures have more N area and Rubisco per unit leaf area to compensate for decreased activity at low temperatures (e.g. Badger et al. 1982 , Holaday et al. 1992 , Strand et al. 1999 ). However, some species (e.g. N. tabacum , O. sativus and Solanum tuberosum ) in the present study did not increase N area and Rubisco content at low growth temperature (Supplementary Table S2, S4). Therefore, an increase in N area and Rubisco contents in leaves grown at low temperature is not always seen among C 3 species, when plants are grown at moderate temperature (e.g, 15–30°C).
Rubisco k cat was signifi cantly different between cold-sensitive and cold-tolerant species ( Table 2 , Supple-mentary Table S4). In particular, Rubisco k cat at 15°C was statistically greater in cold-tolerant species than in cold-sensitive species, when plants were grown at LT (Student's t -test, P < 0.01). Temperature acclimation would alter the concentrations of inhibitors for Rubisco and secondary metabolites in plant tissues ( Kaplan et al. 2004 , Zobayed et al. 2005 , Parry et al. 2008 ), which might cause the differ-ences in Rubisco k cat between cold-sensitive and cold-toler-ant species ( Parry et al. 1997 ). However, this study strongly suggests that cold-tolerant species have Rubisco which performed effi ciently at low temperature, and that Rubisco has evolved to improve its performance at the plant growth temperature. This is supported by the fi nding that Rubisco from plants in cool habitats had a higher k cat than Rubisco
Fig. 3 Relationships between respiration and photosynthetic rates ( R area / P area ; a) and between NAD-ME and Rubisco activities (NAD-ME/Rubisco; b) measured at the respective growth temperatures in HT and LT leaves. Abbreviations and symbols are the same as those in Fig. 1 . The solid line represents the correlation line. The coeffi cient of correlation ( r ) and signifi cance of correlation ( P ) are also shown. The dashed line indicates y = x . Values are the mean; n = 3–5.
r = 0.92P < 0.0001
0.04
0.06
0.08
0.10(a) (b)
0.04 0.06 0.08 0.10
Rarea/Parea (LT−15°C)
Rar
ea/P
area
(H
T−3
0°C
)
r = 0.97P < 0.0001
0.0
1.0
2.0
3.0
0.0 1.0 2.0 3.0
NAD-ME/Rubisco (LT−15°C)
NA
D-M
E/R
ubis
co (
HT
−30°
C)
209
Homeostasis of respiration and photosynthesis
Plant Cell Physiol. 50(2): 203–215 (2009) doi:10.1093/pcp/pcn189 © The Author 2008.

from plants in warm habitats ( Sage 2002 ). Although Rubisco k cat is known to differ between C 3 and C 4 species ( Seemann et al. 1984 , von Caemmerer and Quick 2000 , Sage 2002 ), the variation of Rubisco k cat in C 3 species has been hardly highlighted ( Sage 2002 ). Since suffi cient CO 2 concentration tended to be present in plants to allow Rubisco to catalyze near the CO 2 saturation at low temperature, Rubisco k cat would be important for increasing the photosynthetic rate and nitrogen use effi ciency ( Yamori et al. 2006a ). In cold-tolerant species, Rubisco contents in LT leaves were greater than those in HT leaves ( Table 2 , Supplementary Table S4). Therefore, in cold-tolerant species, increases in Rubisco k cat and content would both contribute to the increases in photosynthetic rate at low temperature, and thus to photo-synthetic homeostasis. On the other hand, it is known that there is a trade-off relationship between k cat and affi nity for CO 2 ( K c ) ( von Caemmerer and Quick 2000 ). If this is also the case across the species in the present study, low k cat in the cold-sensitive species may be a result of increasing the affi n-ity for CO 2 (decreasing K c ). Since CO 2 concentration in the carboxylation site is much lower than K c at higher tempera-ture, the value of K c may be more important for effi cient use of Rubisco in the cold-sensitive species.
Although the extent of temperature homeostasis of pho-tosynthesis was not related to that of P area /Rubisco activity ( Table 3 ), there were differences in the average P area /Rubisco activity depending on the species and growth temperature ( Table 2 , Supplementary Table S4). The average P area /Rubisco activity tended to be greater in cold-sensitive spe-cies than in cold-tolerant species, and tended to be greater in HT leaves than in LT leaves. P area /Rubisco activity refl ects the differences in intercellular CO 2 concentration, chloro-plast CO 2 concentration, Rubisco activation state and the limiting step of photosynthesis. Since there were no signifi -cant differences in intercellular CO 2 concentration between cold-sensitive and cold-tolerant species (data not shown), other factors must affect the differences in P area /Rubisco activity. In particular, in the present study, we analyzed the maximal activities of Rubisco as a representative enzyme for photosynthesis. However, it could be the case that the pho-tosynthetic rate would be limited by the ribulose bisphos-phate (RuBP) regeneration rate and/or triose phosphate utilization ( Sharkey 1985 , Sage and Kubien 2007 ). Further studies are required to clarify the differences in internal conductance, Rubisco activation state and limiting steps of the photosynthetic rate between cold-sensitive and cold-tolerant species.
Mechanisms of temperature homeostasis of respiration The extent of temperature homeostasis of R area (LT-15°C/HT-30°C) was not related to that of any respiratory parameters
that were measured, except for R area /N area (RNUE, Table 3 ). However, R mass , R area /N area , NAD-ME activity, R area /NAD-ME activity and NAD-ME activity/N area were different depend-ing on the growth temperature ( Table 2 , Supplementary Table S3). Therefore, it is fair to say that the respiratory characteristics changed depending on the growth temper-ature, but that such responses to the growth temperature were not related to the changes in the absolute values of the respiratory rate and/or the respiratory homeostasis.
The respiration rate and the extent of temperature homeostasis of respiration were highly related to the pho-tosynthetic rate and the extent of temperature homeosta-sis of photosynthesis, respectively ( Table 1 , Figs. 1 , 3 ). This refl ects the interdependence of photosynthesis and respira-tion. Maintaining the balance between photosynthesis and respiration would be important for optimal plant growth, because leaf respiration largely depends on photosynthates and supplies ATP for maintenance of the photosynthetic apparatus, whereas photosynthesis also depends on respira-tory ATP supply for sucrose synthesis and energy dissipation by the ATP-uncoupling pathways ( Krömer 1995 , Raghaven-dra and Padmasree 2003 ). The respiration rate was stimulated by the addition of substrates such as glucose and sucrose ( Azcon-Bieto et al. 1983 , Atkin and Day 1990 , Noguchi and Terashima 1997 ), and the leaf respiration rate was positively correlated with variations in leaf soluble sugar concentration ( Tjoelker et al. 1999a , Griffi n et al. 2002 ). Therefore, the tem-perature homeostasis of respiration would interact with the photosynthetic rate and/or the temperature homeostasis of photosynthesis. As a result, relationships between the extent of the temperature homeostasis of R area (LT-15°C/HT-30°C) and RNUE could be indirectly caused by the results from the extent of temperature homeostasis of photosynthesis ( Table 3 ). The R area / P area ratio was maintained irrespective of growth temperatures in all species, but differed among individual plant species ( Table 1 , Supplementary Table S1). This would indicate that the optimal balance of photosyn-thesis and respiration is different depending on the growth temperature.
In this study, we analyzed the NAD-ME activity as a rep-resentative enzyme for respiration, because NAD-ME is only located in mitochondria. When we plotted R area vs. NAD-ME activity at the growth temperatures, there was no statistical correlation (data not shown). It is possible that another respiratory enzyme that is potentially rate limiting (e.g. the pyruvate dehydrogenase complex or one of the tricar-boxylic acid cycle enzymes) might have provided a greater correlation with overall respiratory rates ( Hill and Bryce 1992 ). This study indicates that the respiration rate at the growth temperature would not be limited, at least, by the capacity of NAD-ME activity. Nevertheless, the NAD-ME/Rubisco activity ratio, which indicates the balance of activi-ties between the respiratory and photosynthetic enzymes,
210
W. Yamori et al.
Plant Cell Physiol. 50(2): 203–215 (2009) doi:10.1093/pcp/pcn189 © The Author 2008.

was maintained irrespective of the growth temperature in both cold-sensitive and cold-tolerant species. This suggests that even respiratory enzymes which do not limit respira-tion would respond to changes in growth temperature to the same extent as Rubisco which would be a representative of photosynthesis. This also indicates the tight coupling of mitochondrial and chloroplastic metabolism ( Krömer 1995 , Raghavendra and Padmasree 2003 ).
Balance between respiration and photosynthesis
The extents to which photosynthesis and respiration accli-mate are clearly important determinants of plant responses to environmental change, but they are poorly understood. Our results showed that the extent of respiratory and pho-tosynthetic acclimation differed between the cold-sensitive and cold-tolerant species ( Table 1 , Fig. 1 , Supplementary Table S1). Nevertheless, the balance between leaf respira-tion and photosynthetic rate ( R area / P area ) was constant irre-spective of growth temperatures (i.e. 15 or 30°C), in both the cold-sensitive and cold-tolerant species ( Table 1 , Fig. 3 , Supplementary Table S1). Campbell et al. (2007) showed that the R area / P area ratio did not remain constant when plants were exposed to chilling temperatures (e.g. 7°C). It has been suggested that the R area / P area ratio would change when plants were grown at extremely low and high temperatures ( Loveys et al. 2003 , Atkin et al. 2006 , Campbell et al. 2007 ). Taken together, it is fair to say that the R area / P area ratio is homeo-static at moderate growth temperatures in many plant species, and that a large-scale carbon model is able to make broad generalizations about similar extents of temperature homeostasis for respiration and photosynthesis among the plant species ( Gifford 2003 ).
Conclusion
The cold-tolerant species were generally more capable of maintaining homeostasis of photosynthesis and respiration than the cold-sensitive species, indicating a clear difference in phenotypic plasticity for temperature homeostasis depend-ing on cold tolerance. Temperature acclimation of photosyn-thesis has been considered to be related to changes in N area and LMA. However, the extent of temperature homeostasis of photosynthesis was determined by differences in PNUE. The maximum catalytic turnover rate of Rubisco, Rubisco contents and the amount of nitrogen allocated to Rubisco were important factors that contributed to the variation in PNUE. Thus, the temperature homeostasis of photosynthesis would be regulated by various parameters. On the other hand, the extent of temperature homeostasis of respiration was considered to interact with photosynthetic rate and/or the extent of temperature homeostasis of photosynthesis.
Materials and Methods
Plant materials and growth conditions Studies were conducted on 11 species, C. sativus L. cv. Nan-shin (cucumber), N. tabacum L. cv. Samsun NN (tobacco), O. sativa L. cv. Nipponbare (rice), Secale cereale L. cv. Warko (winter rye), S. lycopersicum L. cv. House-momotarou (tomato), S. tuberosum L. cv. Danshaku (potato), Triticum aestivum L. cv. Haruyutaka (spring wheat), T. aestivum L. cv. Hokushin (winter wheat), × Triticosecale Wittmack cv. Presto (triticale) and Vicia faba L. cv. Nintokuissun (broad bean). In addition, data on Spinacia oleracea L. cv. Torai (spinach) were taken from our previous study ( Yamori et al. 2005 ). C. sativus , N. tabacum , O. sativa and S. lyco-persicum are considered to be cold-sensitive species, while S. cereale , S. oleracea , S. tuberosum , T. aestivum (spring), T. aestivum (winter), Triticosecale and V. faba are considered to be cold-tolerant species (e.g. Larcher 1995 , Huner et al. 1998 , Japan Seed Trade Association 2002 , Huang et al. 2005 ). All plants were grown in vermiculite in 1.3 liter plastic pots. Day and night lengths were 8 and 16 h, respectively. Photo-synthetically active photon fl ux density (PPFD) during the day time was 250 µ mol m –2 s –1 . Plants were grown at either 15/10°C or 30/25°C (day/night). These are referred to as low temperature (LT) and high temperature (HT) conditions, respectively. The leaves grown at LT and HT are called LT and HT leaves, respectively. All plants were able to grow at 15/10°C or 30/25°C without any injury. It is considered that a temperature of 30/25°C would be suitable to grow the cold-sensitive species, whereas a temperature of 15/10°C would be suitable to grow the cold-tolerant species. The plants, except for rice, were watered once a week and fertilized with 200 ml of a nutrient solution containing 2 mM KNO 3 , 2 mM Ca(NO 3 ) 2 , 0.75 mM MgSO 4 , 0.665 mM NaH 2 PO 4 , 25 µ M Fe-EDTA, 5 µ M MnSO 4 , 0.5 µ M ZnSO 4 , 0.5 µ M CuSO 4 , 25 µ M H 3 BO 4 , 0.25 µ M Na 2 MoO 4 , 50 µ M NaCl and 0.1 µ M CoSO 4 once a week. The 1.3 liter plastic pots for rice plants were placed in a container fi lled with the above nutrient solution with the pH adjusted to 5.4 ± 0.3. The nutrient solution level was kept at about 10 cm from the bottom of the container. The nutrient solution was aerated continuously with an air pump, and renewed every week.
Gas exchange measurements Rates of dark respiration ( R area ) and photosynthesis ( P area) of the most recently fully expanded leaves were measured using a portable gas exchange system (LI-6400; Li-Cor Inc., Lincoln, NE, USA) as described previously ( Yamori et al. 2005 ). R area and P area were measured every 5°C from 10 to 35°C, and at 38°C at an ambient CO 2 concentration of 360 µ l l –1 . R area was measured after a suffi ciently long dark period
211
Homeostasis of respiration and photosynthesis
Plant Cell Physiol. 50(2): 203–215 (2009) doi:10.1093/pcp/pcn189 © The Author 2008.

(approximately 10 h). P area was measured at a high light intensity of 1,500 µ mol m –2 s –1 .
Determinations of Rubisco and nitrogen Immediately after gas exchange measurements, leaf discs were frozen and stored at −80°C until biochemical mea-surements. The frozen leaf sample (approximately 1.0 cm 2 ) was ground in liquid nitrogen and homogenized in an extraction buffer containing 100 mM sodium phosphate buffer (pH 7.0), 1.0% (w/v) polyvinylpyrrolidone, 0.1% (v/v) Triton X-100, 1 mM phenylmethylsulfonyl fl uoride and 1.0% β -mercaptoethanol. The content of Rubisco was determined by the method of Yamori et al. (2005) .
Some leaf discs, taken from leaves after the measurements of the gas exchange, were used for determination of leaf dry mass and leaf nitrogen contents. After the leaf discs were dried at 70°C for at least 7 d, leaf nitrogen contents were measured with an NC analyzer (CHNOS Elemental analyzer, Vario EL III, Elementar, Hanau, Germany).
Enzyme assays The frozen leaf sample (approximately 1.0 cm 2 ) was rapidly homogenized using a chilled mortar and pestle with 0.892 ml of the extraction medium. The medium contained 100 mM HEPES-KOH (pH 7.8), 10 mM MgCl 2 , 5 mM dithiothreitol (DTT) and 1 mM EDTA. The homogenate was centrifuged at 16,000 × g for 30 s at 4°C, and the supernatant was used for the Rubisco and NAD-ME assay. The enzyme activities were measured at 15°C in LT leaves and 30°C in HT leaves. The maximal Rubisco activity was assayed by monitoring NADH oxidation at 340 nm, according to the method of Yamori et al. (2006a) . After Rubisco was activated for 20 min at 4°C in an activation medium that contained 375 mM HEPES-KOH (pH 7.8), 50 mM MgCl 2 , 50 mM NaHCO 3 , the total activity was assayed in the assay medium containing 100 mM Bicine-KOH (pH 8.2), 20 mM MgCl 2 , 20 mM NaHCO 3 , 5 mM ATP, 5 mM creatine phosphate, 63 µ M NADH, 0.6 mM RuBP, 10 U ml –1 of creatine kinase, 10 U ml –1 of 3-phosphoglyceric phosphokinase (PGK) and 25 U ml –1 of glyceraldehyde-3-phosphate dehydrogenase (GAPDH). The maximal NAD-ME activity was assayed according to Millar et al. (1998) , in a reaction medium consisting of 50 mM MOPS-KOH (pH 6.5), 2 mM NAD + , 0.025% (v/v) Triton X-100, 2 mM MnCl 2 , 4 mM DTT and 10 mM malate.
Decomposition analyses for photosynthesis and respiration Decomposition analyses were conducted to investigate mechanisms of differences in temperature homeostasis depending on the plant species. P area is divided into the P mass ,
LMA, PNUE ( P area /N area ), N area , Rubisco activity, the Rubisco k cat and Rubisco contents:
and
In this study, Rubisco was analyzed as a representative enzyme for photosynthesis. The P area /Rubisco activity is a parameter that is affected by the CO 2 conductance from air to the carboxylation site, Rubisco activation state and the limiting step of photosynthesis. The Rubisco con-tent/N area refl ects the proportion of nitrogen invested in Rubisco.
In the same manner, R area is divided into the respiration rate per leaf dry mass ( R mass ), LMA, RNUE (R area /N area ), N area and NAD-ME activity:
and
In this study, NAD-ME was analyzed as a representative enzyme for respiration, because it is located only in mitochondria.
Statistical analyses All data were analyzed with STATVIEW (ver. 4.58, SAS Insti-tute Inc., Cary, NC, USA). To evaluate whether homeostasis is different between cold-sensitive and cold-tolerant spe-cies, we used a RM-ANOVA after values were transformed logarithmically. Growth temperature (within-subject factor) and cold tolerance (between-subjects factor) were treated as fi xed factors, and individual species were treated as a random effect. An average value was used for each species, and the variation within a species was ignored.
Supplementary data
Supplementary data are available at PCP online.
Funding
The Japan Society for the Promotion of Science grant for young research fellows (to W.Y.).
(1)
(3)
(4)
(2)
212
W. Yamori et al.
Plant Cell Physiol. 50(2): 203–215 (2009) doi:10.1093/pcp/pcn189 © The Author 2008.

Acknowledgments
We are grateful to Dr. J. Evans (Australian National Univer-sity) for valuable comments on the manuscript. We are also grateful to Dr. T. Yoshihira (Rakuno Gakuen University) for his generous gift of seeds of spring wheat, triticale, winter wheat and winter rye.
References Armstrong , A.F. , Logan , D. , Tobin , A.K. , O’Toole , P. and Atkin , O.K.
( 2006 ) Heterogeneity of plant mitochondrial responses underpinning respiratory acclimation to the cold in Arabidopsis thaliana leaves. Plant Cell Environ. 29 : 940 – 949 .
Atkin , O.K. , Bruhn , D. and Tjoelker , M.G. ( 2004 ) Response of plant respiration to changes in temperature: mechanisms and consequences of variations in the Q 10 and acclimation. In Plant Respiration: From Cell to Ecosystem . Edited by Lambers, H. and Ribas-Carbó, M. Kluwer Academic Publishers , Dordrecht , The Netherlands .
Atkin , O.K. , and Day , D.A. ( 1990 ) A comparison of the respiratory processes and growth rates of selected alpine and lowland plant species. Aust. J. Plant Physiol. 17 : 517 – 526 .
Atkin , O.K. , Edwards , E.J. and Loveys , B.R. ( 2000 ) Response of root respiration to changes in temperature and its relevance to global warming. New Phytol. 147 : 141 – 154 .
Atkin , O.K. , Scheurwater , I. and Pons , T.L. ( 2006 ) High thermal acclimation potential of both photosynthesis and respiration in two lowland Plantago species in contrast to an alpine congeneric. Global Change Biol. 12 : 500 – 515 .
Atkin , O.K. and Tjoelker , M.G. ( 2003 ) Thermal acclimation and the dynamic response of plant respiration to temperature. Trends Plant Sci . 8 : 343 – 351 .
Azcón-Bieto , J. , Lambers , H. and Day , D.A. ( 1983 ) Effect of photosynthe-sis and carbohydrate status on respiratory rates and the involve-ment of the alternative pathway in leaf respiration. Plant Physiol. 72 : 59 – 603 .
Badger , M.R. , Björkman , O. and Armond , P.A. ( 1982 ) An analysis of photosynthetic response and adaptation to temperature in higher plants: temperature acclimation in the desert evergreen Nerium oleander L. Plant Cell Environ. 5 : 85 – 99 .
Berry , J.A. and Björkman , O. ( 1980 ) Photosynthetic response and adaptation to temperature in higher plants. Annu. Rev. Plant Physiol . 31 : 491 – 543 .
Brüggemann , W. and Linger , P. ( 1994 ) Long-term chilling of young tomato plants under low light. IV. Differential responses of chlorophyll fl uorescence quenching coeffi cients in Lycopersicon species of different chilling sensitivity. Plant Cell Physiol. 35 : 585 – 591 .
Campbell , C. , Atkinson , L. , Zaragoza-Castells , J. , Lundmark , M. , Atkin , O.K. and Hurry , V. ( 2007 ) Acclimation of photosynthesis and respiration is asynchronous in response to changes in temperature regardless of plant functional group. New Phytol. 176 : 375 – 389 .
Duke , S.H. , Schrader , L.E. , and Miller , M.G. ( 1977 ) Low temperature effects on soybean ( Glycine max (L.) Merr. cv. Wells) mitochondrial
respiration and several dehydrogenases during imbibition and germination. Plant Physiol. 60 : 716 – 722 .
Evans , J.R. ( 1989 ) Photosynthesis and nitrogen relationships in leaves of C 3 plants. Oecologia 78 : 9 – 19 .
Gifford , R.M. ( 2003 ) Plant respiration in productivity models: conceptualisation, representation and issues for global terrestrial carbon-cycle research. Funct. Plant Biol . 30 : 171 – 186 .
Griffi n , K.L. , Turnbull , M. , and Murthy , R. ( 2002 ) Canopy position affects the temperature response of leaf respiration in Populus deltoides . New Phytol . 154 : 609 – 619 .
Gunn , S. and Farrar , J.F. ( 1999 ) Effects of a 4°C increase in temperature on partitioning of leaf area and dry mass, root respiration and carbohydrates. Funct. Ecol. 13 : 12 – 20 .
Hikosaka , K. ( 1997 ) Modelling optimal temperature acclimation of the photosynthetic apparatus in C 3 plants with respect to nitrogen use. Ann. Bot. 80 : 721 – 730 .
Hikosaka , K. ( 2004 ) Interspecifi c difference in the photosynthesis–nitrogen relationship: patterns, physiological causes, and ecological importance. J. Plant Res. 117 : 481 – 494 .
Hikosaka , K. ( 2005 ) Nitrogen partitioning in the photosynthetic apparatus of Plantago asiatica leaves grown at different temperature and light conditions: similarities and differences between temperature and light acclimation. Plant Cell Physiol. 46 : 1283 – 1290 .
Hikosaka , K. , Ishikawa , K. , Borjigidai , A. , Muller , O. , and Onoda , Y. ( 2006 ) Temperature acclimation of photosynthesis: mechanisms involved in the changes in temperature dependence of photosynthetic rate. J. Exp. Bot. 57 : 291 – 302 .
Hill , S.A. and Bryce , J.H. ( 1992 ) Malate metabolism and light-enhanced dark respiration in barley mesophyll protoplasts. In Molecular, Biochemical and Physiological Aspects of Plant Respiration . Edited by Lambers , H. and van der Plas , L.H.W. pp. 221 – 230 . SPB Academic Publishing , The Hague , The Netherlands .
Holaday , A.S. , Martindale , W. , Alred , R. , Brooks , A.L. , and Leegood , R.C. ( 1992 ) Changes in activities of enzymes of carbon metabolism in leaves during exposure of plants to low temperature. Plant Physiol. 98 : 1105 – 1114 .
Huang , L. , Ye , Z. , Bell , R.W. , and Dell , B. ( 2005 ) Boron nutrition and chilling tolerance of warm climate crop species. Ann. Bot. 96 : 755 – 767 .
Huner , N.P.A. , and Macdowall , F.D.H. ( 1979 ) Changes in the net charge and subunit properties of ribulose bisphosphate carboxylase-oxygenase during cold hardening of Puma rye. Can. J. Biochem. 57 : 1036 – 1041 .
Huner , N.P.A. , Öquist , G. , and Sarhan , F. ( 1998 ) Energy balance and acclimation to light and cold. Trends Plant Sci. 3 : 224 – 230 .
Japan Seed Trade Association ( 2002 ) Seed and seedling (in Japanese) . Japan Seed Trade Association , Tokyo , Japan ,
Kaplan , F. , Kopka , J. , Haskell , D.W. , Zhao , W. , Schiller , K.C. , Gatzke , N. , et al. ( 2004 ) Exploring the temperature-stress metabolome of Arabidopsis. Plant Physiol . 136 : 4159 – 4168 .
Klikoff , L.G. ( 1966 ) Temperature dependence of the oxidative rates of mitochondria in Danthonia intermedia , Penstemon davidsonii and Sitanion hystrix . Nature 212 : 529 – 530 .
Klikoff , L.G. ( 1968 ) Temperature dependence of mitochondrial oxidative rates of several plant species of the Sierra Nevada. Bot. Gaz. 129 : 227 – 230 .
213
Homeostasis of respiration and photosynthesis
Plant Cell Physiol. 50(2): 203–215 (2009) doi:10.1093/pcp/pcn189 © The Author 2008.

Krömer , S. ( 1995 ) Respiration during photosynthesis. Annu. Rev. Plant Physiol . Plant Mol. Biol. 46: 45 – 70 .
Kurimoto , K. , Day , D.A. , Lambers , H. , and Noguchi , K. ( 2004a ) Effect of respiratory homeostasis on plant growth in cultivars of wheat and rice. Plant Cell Environ. 27 : 853 – 862 .
Kurimoto , K. , Millar , A.H. , Lambers , H. , Day , D.A. , and Noguchi , K. ( 2004b ) Maintenance of growth rate at low temperature in rice and wheat cultivars with a high degree of respiratory homeostasis is associated with a high effi ciency of respiratory ATP production. Plant Cell Physiol. 45 : 1015 – 1022 .
Larcher , W. ( 1995 ) Physiological Plant Ecology, 3rd edn. Springer , Berlin . Larigauderie , A. , and Körner , C. ( 1995 ) Acclimation of leaf dark
respiration to temperature in alpine and lowland plant species. Ann. Bot. 76 : 245 – 252 .
Long , S.F. and Woodward , F.I. ( 1989 ) Plants and Temperature. Symposia of the Society for Experimental Biology . Edited by Long , S.F. and Woodward , F.I. , Vol. 42 . The Company of Biologists Limited , Cambridge .
Loveys , B.R. , Atkinson , L.J. , Sherlock , D.J. , Roberts , R.L. , Fitter , A.H. , and Atkin , O.K. ( 2003 ) Thermal acclimation of leaf and root respiration: an investigation comparing inherently fast- and slow-growing plant species. Global Change Biol. 9 : 895 – 910 .
Loveys , B.R. , Scheurwater , I. , Pons , T.L. , Fitter , A.H. , and Atkin , O.K. ( 2002 ) Growth temperature infl uences the underlying components of relative growth rate: an investigation using inherently fast- and slow-growing plant species. Plant Cell Environ. 25 : 975 – 987 .
Makino , A. , Nakano , H. , and Mae , T. ( 1994 ) Effects of growth temperature on the responses of ribulose-1,5-bisphosphate carboxylase, electron transport components, and sucrose synthesis enzymes to leaf nitrogen in rice, and their relationships to photosynthesis. Plant Physiol. 105 : 1231 – 1238 .
Makino , A. , and Osmond , B. ( 1991 ) Effects of nitrogen nutrition on nitrogen partitioning between chloroplasts and mitochondria in pea and wheat. Plant Physiol. 96 : 355 – 362 .
Makino , A. , Sakuma , H. , Sudo , E. , and Mae , T. ( 2003 ) Differences between maize and rice in N-use effi ciency for photosynthesis and protein allocation. Plant Cell Physiol. 44 : 952 – 956 .
Millar , A.H. , Atkin , O.K. , Menz , R.I. , Henry , B. , Farquhar , G. , and Day , D.A. ( 1998 ) Analysis of respiratory chain regulation in roots of soybean seedlings. Plant Physiol. 117 : 1083 – 1093 .
Miroslavov , E.A. , and Kravkina , I.M. ( 1991 ) Comparative analysis of chloroplasts and mitochondria in leaf chlorenchyma from mountain plants grown at different altitudes. Ann. Bot. 68 : 195 – 200 .
Mooney , H.A. , Björkman , O. , and Collatz , G.J. ( 1978 ) Photosynthetic acclimation to temperature in the desert shrub, Larrea divaricata . I. Carbon dioxide exchange characteristics of intact leaves. Plant Physiol. 61 : 406 – 410 .
Muller , O. , Hikosaka , K. , and Hirose , T. ( 2005 ) Seasonal changes in light and temperature affect the balance between light harvesting and light utilisation components of photosynthesis in an evergreen understory. Oecologia 143 : 501 – 508 .
Noguchi , K. , and Terashima , I. ( 1997 ) Different regulation of leaf respiration between Spinacia oleracea , a sun species, and Alocasia odora , a shade species. Physiol. Plant. 101 : 1 – 7 .
Noguchi , K. , and Terashima , I. ( 2006 ) Responses of spinach leaf mitochondria to low N availability. Plant Cell Environ. 29 : 710 – 719 .
Parry , M.A.J. , Andralojc , P.J. , Parmar , S. , Keys , A.J. , Habash , D. , Paul , M.J. , et al. ( 1997 ) Regulation of Rubisco by inhibitors in the light. Plant Cell Environ. 20 : 528 – 534 .
Parry , M.A.J. , Keys , A.J. , Madgwick , P.J. , Carmo-Silva , A.E. , and Andralojc , P.J. ( 2008 ) Rubisco regulation: a role for inhibitors. J. Exp. Bot. 59 : 1569 – 1580 .
Poorter , H. , and Evans , J.R. ( 1998 ) Photosynthetic nitrogen-use effi ciency of species that differ inherently in specifi c area. Oecologia 116 : 26 – 37 .
Raghavendra , A.S. , and Padmasree , K. ( 2003 ) Benefi cial interactions of mitochondrial metabolism with photosynthetic carbon assimilation. Trends Plant Sci. 8 : 546 – 553 .
Reich , P.B. , Walters , M.B. , Ellsworth , D.S. , Vose , J.M. , Volin , J.C. , Gresham , C. , et al. ( 1998a ) Relationships of leaf dark respiration to leaf nitrogen, specifi c leaf area and leaf life-span: a test across biomes and functional groups. Oecologia 114 : 471 – 482 .
Reich , P.B. , Walters , M.B. , Tjoelker , M.G. , Vanderklein , D. , and Buschena , C. ( 1998b ) Photosynthesis and respiration rates depend on leaf and root morphology and nitrogen concentration in nine boreal tree species differing in relative growth rate. Funct. Ecol. 12 : 395 – 405 .
Ryan , M.G. ( 1995 ) Foliar maintenance respiration of subalpine and boreal trees and shrubs in relation to nitrogen content. Plant Cell Environ. 18 : 765 – 772 .
Sage , R.F. ( 2002 ) Variation in the K cat of Rubisco in C 3 and C 4 plants and some implications for photosynthetic performance at high and low temperature. J. Exp. Bot. 53 : 609 – 620 .
Sage , R.F. , and Kubien , D.S. ( 2007 ) The temperature response of C 3 and C 4 photosynthesis. Plant Cell Environ . 30 : 1086 – 1106 .
Saruyama , H. , and Tanida , M. ( 1995 ) Effect of chilling on activated oxygen-scavenging enzymes in low temperature-sensitive and -tolerant cultivars of rice ( Oryza sativa L.). Plant Sci. 109 : 105 – 113 .
Seemann , J.R. , Badger , M.R. , and Berry , J.A. ( 1984 ) Variations in the specifi c activity of ribulose-1,5-bisphosphate carboxylase between species utilizing differing photosynthetic pathways. Plant Physiol . 74 : 791 – 794 .
Sharkey , T.D. ( 1985 ) Photosynthesis in intact leaves of C 3 plants; physics, physiology and rate limitations. Bot. Rev . 51 : 53 – 341 .
Slatyer , R.O. ( 1977 ) Altitudinal variation in the photosynthetic characteristics of snow gum, Eucalyptus paucifl ora Sieb. ex Spreng. IV. Temperature response of four populations grown at different temperatures. Aust. J. Plant Physiol. 4 : 583 – 594 .
Steffen , K.L. , Wheeler , R.M. , Arora , R. , Palta , J.P. , and Tibbitts , T.W. ( 1995 ) Balancing photosynthetic light-harvesting and light-utilization capacities in potato leaf tissue during acclimation to different growth temperatures. Physiol. Plant. 94 : 51 – 56 .
Strand , Å. , Hurry , V.M. , Henkes , S. , Huner , N.P.A. , Gustafsson , P. , Gardeström , P. , et al. ( 1999 ) Acclimation of Arabidopsis leaves developing at low temperatures. Increasing cytoplasmic volume accompanies increased activities of enzymes in the Calvin cycle and in the sucrose-biosynthesis pathway. Plant Physiol. 119 : 1387 – 1397 .
Talts , P. , Parnik , T. , Gardeström , P. , and Keerberg , O. ( 2004 ) Respiratory acclimation in Arabidopsis thaliana leaves at low temperature. J. Plant Physiol. 161 : 573 – 579 .
214
W. Yamori et al.
Plant Cell Physiol. 50(2): 203–215 (2009) doi:10.1093/pcp/pcn189 © The Author 2008.
Tjoelker , M.G. , Oleksyn , J. , and Reich , P.B. ( 1999b ) Acclimation of respiration to temperature and CO 2 in seedlings of boreal tree species in relation to plant size and relative growth rate. Global Change Biol. 5 : 679 – 691 .
Tjoelker , M.G. , Reich , P.B. , and Oleksyn , J. ( 1999a ) Changes in leaf nitrogen and carbohydrates underlie temperature and CO 2 acclimation of dark respiration in fi ve boreal tree species. Plant Cell Environ. 22 : 767 – 778 .
von Caemmerer , S. and Quick , W.P. ( 2000 ) Rubisco: physiology in vivo. In Photosynthesis: Physiology and Metabolism . Edited by Leegood , R.C. , Sharkey , T.D. and von Caemmerer , S. pp. 85 – 113 . Kluwer Academic , Dordrecht , The Netherlands .
Weih , M. , and Karlsson , P.S. ( 2001 ) Growth response of mountain birch to air and soil temperature: is increasing leaf-nitrogen content an acclimation to lower air temperature? New Phytol. 150 : 147 – 155 .
Wright , I.J. , Reich , P.B. , Cornelissen , J.H.C. , Falster , D.S. , Garnier , E. , Hikosaka , K. , et al. ( 2005 ) Assessing the generality of global leaf trait relationships. New Phytol. 166 : 485 – 496 .
Xiong , F.S. , Mueller , E.C. , and Day , T.A. ( 2000 ) Photosynthetic and respiratory acclimation and growth response of Antarctic vascular plants to contrasting temperature regimes. Amer. J. Bot. 87 : 700 – 710 .
Yamasaki , T. , Yamakawa , T. , Yamane , Y. , Koike , H. , Satoh , K. , and Katoh , S. ( 2002 ) Temperature acclimation of photosynthesis and related changes in photosystem II electron transport in winter wheat. Plant Physiol. 128 : 1087 – 1097 .
Yamori , W. , Noguchi , K. , Hanba , T.Y. , and Terashima , I. ( 2006b ) Effects of internal conductance on the temperature dependence of the
photosynthetic rate in spinach leaves from contrasting growth temperatures. Plant Cell Physiol . 47 : 1069 – 1080 .
Yamori , W. , Noguchi , K. , Kashino , Y. , and Terashima , I. ( 2008 ) The role of the electron transport in determining the temperature dependence of photosynthetic rate in spinach leaves grown at contrasting temperatures. Plant Cell Physiol. 49 : 583 – 591 .
Yamori , W. , Noguchi , K. , and Terashima , I. ( 2005 ) Temperature acclimation of photosynthesis in spinach leaves: analyses of photosynthetic components and temperature dependencies of photosynthetic partial reactions. Plant Cell Environ. 28 : 536 – 547 .
Yamori , W. , Suzuki , K. , Noguchi , K. , Nakai , M. , and Terashima , I. ( 2006a ) Effects of Rubisco kinetics and Rubisco activation state on the temperature dependence of the photosynthetic rate in spinach leaves from contrasting growth temperatures. Plant Cell Environ. 29 : 1659 – 1670 .
Yu , J.Q. , Zhou , Y.H. , Huang , L.F. , and Allen , D. ( 2002 ) Chill-induced inhibition of photosynthesis: genotypic variation within Cucumis sativus . Plant Cell Physiol. 43 : 1182 – 1188 .
Zhu , X.G. , de Sturler , E. , and Long , S.P. ( 2007 ) Optimizing the distribution of resources between enzymes of carbon metabolism can dramatically increase photosynthetic rate: a numerical simulation using an evolutionary algorithm. Plant. Physiol . 145 : 513 – 526 .
Zobayed , S.M.A. , Afreen , F. , and Kozai , T. ( 2005 ) Temperature stress can alter the photosynthetic effi ciency and secondary metabolite concentrations in St. John's wort. Plant Physiol. Biochem. 43 : 977 – 984 .
(Received October 13, 2008; Accepted November 27, 2008)
215
Homeostasis of respiration and photosynthesis
Plant Cell Physiol. 50(2): 203–215 (2009) doi:10.1093/pcp/pcn189 © The Author 2008.
Copyright © 2022 FDOKUMEN