Stripped Clothing and Identity in Colonial Captivity Narratives
Upload
khangminh22Category
view
2download
0
the Clothing Sector
113600 i '4 '"L. iect
An Industrial Strategy for
Miriam Altman
ARCHIV

IDR
AN INDUSTRIAL STRATEGY FOR THE
CLOTHING SECTOR
Miriam Altman
Industrial Strategy Project Development Policy Research Unit
School of Economics University of Cape Town
1994
UCT PRESS

UCT Press (Pty) Ltd
University of Cape Town Private Bag Rondebosch
7700 South Africa
All rights are reserved. No part of this publication may be reproduced, stored in a retrieval system, or transmiued in any form or by any means, electronic, mechanical, photocopying, recording or otherwise, without prior permission of the publisher.
Cover illustration: Taken from Gavin Young's sculpture, "Hoerrikwagga", standing near Jameson Hall on the University of Cape Town campus.
Typesetting: Kira Low Cover design: Karren Visser
Printed and bound by Creda Press
Copyright: Industrial Strategy Pmject First published: 1994
ISBN: O—7992—1576—7

EDITORIAL COMMENT
This report is one of a series produced by the Industrial Strategy Project.
The ISP has its origins in the Economic Trends Research Group, a collective of economists and other social scientists convened by the Congress of South African Trade Unions in 1986. COSATU, under attack for its support for sanctions, initially asked these researchers to examine the impact of enforced isolation on the South African economy. It soon became clear that sanctions were a small aspect of the problems besetting the South African
economy, and the work of the Economic Trends Research Group expanded into a full-blown analysis of South Africa's economic crisis.
The poor performance of South Africa's manufacturing sector loomed large in the litany of problems bedeviling the South African economy. The 1980s had been, in economic terms, something of a lost decade. The manufacturing sector was particularly conspicuous by its inability to create jobs, and to produce commodities that satisfied the divergent requirements of the domestic and international markets. A range of factors contributed to this malaise -
apartheid's impact on the skills profile of the workforce, repressive and outmoded industrial relations systems and work organisation, a highly concentrated industrial structure and a
concomitantly weak and repressed SME and micro-enterprise sector, and a highly inward oriented trade regime, were the most obvious sources of the crisis in manufacturing.
However, the solutions were less obvious than the problems, and in 1990, again at COSATU's initiation, the ISP was conceived. From the outset, the political environment ensured that the ISP would not be an ordinary research project. The unbanning of the ANC and the certainty of the immediate accession to power of COSATU's political ally, coupled with the union federation's increasingly direct role in policy formulation, ensured that the ISP focus closely on policy, contributing to the development of the industrial policy that would address the poor performance of South African manufacturing.
To this end, the ISP engaged a range of researchers with the purpose of undertaking detailed examinations of the key sub-sectors of South African manufacturing. The fruits of the ISP are to be found in the reports, such as this one, most of which are to be published by the UCT Press. The authors of the reports were assigned, generally for a period of 14 months, to the study of a particular sector. The researchers were required to study the local sector and the factors promoting and restraining its development. They were required to assess its prospects in the light of the likely global trajectory of the industry. Detailed examination of local firms were complemented by international visits that enabled the researchers to consult with international experts and visit factories to enable them to situate South African firms in a comparative perspective.

In addition to the sectoral studies, the ISP also engaged researchers to examine key cross-cutting issues. Those selected for study were human resource development and industrial relations, technology development, market and ownership structures, trade perfonnance and policies, and regional industrial strategies.
Industrial policy is not a plan easily contained between the covers of a single document. It is a process, a process of engagement between the key industrial stakeholders. South Africa's peculiar transition has given concrete expression to this credo, with the tripartite National Economic Forum and the various sectoral task groups the key institutions and processes within which an evolving industrial policy is being developed. COSATU has played the leading role in this process. The ISP has, in turn, made a significant contribution to COSATU's capacities. It has done this by constant dialogue between the ISP and the COSATU leadership, and by a traineeship programme which saw a number of union leaders seconded to the ISP for its duration.
In addition the research process has engaged a range of key actors. Individual researchers have engaged with union and business leaders and experts within government. The ISP was punctuated by a series of intensive workshop attended by the researchers, COSATU and ANC leaders, and other local and international experts. The work-in-progress was thoroughly discussed and critiqued at these workshops and it is appropriate to see each report as owing a great deal to the ISP collective.
A number of researchers are continuing their work from within the industry task forces, the unions, and the structures of the new government. The ISP itself is moving into a second phase, taking up questions still unanswered, re-examining conclusions of the first phase and continuing the unending process of developing industrial policy. It is in this spirit that these reports should be read: they are not final plans, but simply attempts to start a vital process, one that will of necessity be taken forward by all of the major industry participants.
The Industrial Strategy Project was funded by generous grants from the Humanistisch Instituut Voor Ontwikkelingssamenwerking (HIVOS) of The Netherlands, the International Development Research Centre (IDRC), Ottawa, Canada, and the Olof Palme International Centre of Sweden. We benefitted not only from the financial resources of these institutions, but also from the wide-ranging experience of their staff members and their deep and abiding commitment to a democratic and prosperous South Africa.
Avril Joffe David Kaplan David Lewis Raphael Kaplinsky
ISP Co-Directors Development Policy Research Unit University of Cape Town

FOREWORD
In the late eighties COSATU commissioned a group of economists to prepare a report analysing the impact of sanctions on the South African economy. We commissioned this work in response to criticism in the media and elsewhere that held us — through our support for sanctions —
responsible for the sorry state of the South African economy, including the miserable conditions of our members and others whose interests and aspirations we represented.
The research revealed that the crisis of the South African economy was rooted in the policies of the apartheid era and our commission to the economists was transformed into a full-scale critique of the economics of apartheid. A key consequence of the failures of apartheid's social and economic policies was its unproductive manufacturing sector. It was unable to produce basic goods of a suitable quality and at an affordable price; it was unable to produce goods that successfully penetrated international markets; it relied on low paid, poorly trained workers, and harsh, authoritarian shop floor supervision; above all, it proved incapable of generating desperately needed employment. While manufacturing's contribution to the global economy escalated, South Africa relied increasingly on its natural resource base and the cheap labour that mined and farmed it.
Appreciation of these problems inspired COSATU to request its research collective to undertake research in support of our attempt to formulate a new industrial policy. This
request flowered into the Industrial Strategy Project whose output is represented in these reports.
The research process has been characterised by considerable dialogue between COSATU, its affiliates and the researchers. We have learnt much from this interaction; we are confident that we have taught the researchers much. However this work is the output of an independent research collective. As is to be expected in an anns length relationship of this kind, we do not agree with every line of each report, we do not accept every recommendation. But with regard to its major findings, we do agree that there is a real potential for building an efficient manufacturing base, rooted in well paid, productive workers. Above all we believe, and this is endorsed by the ISP, that an independent trade union movement actively and aggressively pursuing its interests is not merely compatible with rapid and sustainable industrial development — it is a precondition.
,p4 John Gomomo President, Congress of South African Trade Unions
Table of Contents
Executive summary . Preface xix
Chapter A: Introduction
Chapter B: Employment and Competitiveness: the International Context 6
B.!. Industrial Structure and Trends 7 B.1.1. Employment 7 B.1.2. Industrial Fragmentation 9 B.1.3. Retail Structure 12
B.2. The Intensification of Competitive Pressures B.2.1. International Trade B.2.2. Market Segmentation B.2.3. Cost of Production in an International Context
B.3. In Pursuit of Static or Dynamic Strategies9 B.3. 1. Static Organisational Strategies: The Old Style
Numerical and Financial Labour Flexibility. Automation in Isolation Static Strategies in South Africa Dominant Historical Trends Expected Directions
B.3.2. Dynamic Organisational Strategies: The New The Supply of Inputs Pre-Production Assembly Marketing and Distribution
B.4. The Competitive Position of the S.A. Clothing Industry B.4.1. Areas of Competitive Advantage and Disadvantage
Market Access Cost Factors Non-Price Factors
B.4.2. Niches that Reflect S.A.'s Competitive Position....
Style
18 18
22 23
28 31 33 34 35 36 42 48 51 54 57 68
73 73 73 74 80 82

Chapter C: Market Orientation . 88
C.!. Historiëal Policy and Trade Orientation 90 C.1.1. Protecting the Local Clothing Industry 90 C.l.2. The New Interest in Export Promotion 94 C.1.3. Problems with Current Export Promotion Policies 97
C.2. Potential Market Focus 115 C.2. 1. Inward Orientation: Focusing on the Local Market 115 C.2.2. Outward Orientation: Focusing on Export Markets 118 C.2.3. Taking a Balanced Approach 120
C.3. Adoption of a Balanced Approach to Trade 125 C.3.1. The Institutions 125
The S.A. State 125 International Arrangements 126
General Agreement on Tariffs and Trade (GATT) . . 126 The Multi-Fibre Arrangement (MFA) 128 The Lome Convention 131
C.3.2. Reconsideration of Trade Policy 131 Protection Policy 133 Export Promotion Policy 137
Chapter D: Social Orientation: Achieving Sustainable Formal Employment ... 142
D.1. Promotion: Redefining the Route to Competitiveness 142 D.1.1. Productivity 142
Regional Support Services 143 Training and Grading 144
D.1.2. Pipeline Organisation 151 D. 1.3. Marketing Strategies 151 D.1.4. Clothing-Textile Development Office 152
D.2. Regulation: Organising the Operational Environment 155 D.2.1. Foreign Processing 156 D.2.2. Informalisation 157 D.2.3. Casuallsation 159 D.2.4. Notification and Severance Procedures 160 D.2.5. Wage Determination 161 D.2.6. Member Education 168
Chapter E: Conclusion 176
Appendices . 179
1. Measures of Relative Production Costs . 179 2. Calculation of GElS Assistance 182 3. International Training in Clothing 184 4. Price Levels, Demand & Employment 189 5. The Effect of Static & Dynamic Strategies: A Graphic Representation .. .. 193 6. Aspects of Liberalisation 197
Reference Tables 199 Table Gi: S.A. Clothing Employment 200 Table G2: Comparative International Clothing Statistics 201 Table G3: Exchange Rates 202 Table G4: S.A. Trade Balance: Clothing (1980—91) . 203 Table G5: Growth in S.A. Clothing Exports and Imports 204 Table G6: International Clothing Export Prices 205 Table G7: Comparative Clothing Production Costs:
Productivity and Hourly Compensation 206 Table G8: Comparative Clothing Labour Costs:
Basic and Social Charges 208 Table G9: Minimum Wages of a Qualified Clothing Machinist
(current rands/week) 209 Table GlO: Minimum Wages of a Qualified Clothing Machinist
(current rands/hour) 210 Table Gil: Minimum Wages of a Qualified Clothing Machinist
(constant rands/hour) 211 Table Gl2: Minimum Subsistence Income Level 212 Table G 13: Minimum Effective Income Level 212
Bibliography 213

Table Bi: Table B2: Table B3: Table B4: Table B5: Table B6: Table B7: Table B8: Table B9: Table BlO: Table Bli: Table B12: Table B13: Table B14: Table B15: Table B16: Table B17: Table B18: Table B19: Table B20: Table B21: Table B22: Table B23: Table B24: Table B25: Table Cl: Table C2: Table C3: Table C4: Table CS: Table C6: Table C7: Table C8: Table C9: Table ClOa: Table ClOb: Table Cli: Table C12: Table C13: Table C14: Table C15: Table Dl:
List of Tables
11 12 12 14
15 19 20 20 28 30 41 41 42 61 63 65 66 67 68 70 71 76 79 80 81 94 98 99
106 107 110 110 111 111 112 112 112 119 120 124 131 150
Clothing Firm Concentration (Employment and Output) An International Comparison of Clothing Concentration Distribution of Employment and Output Distribution of Clothing Retail Sales Percent of Output Sold to Chain Stores Major Export Flows of Clothing Major World Clothing Importers & Exporters Significance of S.A. in World Apparel Trade Product Adaptation and Source of Ownership Strategic Forms Location of Clothing Industry Employment (1991) Configuration of Decentralised Firms Cost of Qualified Machinist by Region Cross-Training in the S.A. Clothing Industry Bonuses Paid by Cape Clothing Factories Material Stocks and Production Systems by Region Short Cycle Manufacturing Implementation Sequence Improvements with Short Cycle Modular Manufacturing Savings from Short Cycle Manufacturing Mark-ups on Clothing: Factory to Consumer
Replenishment Period of Retail Apparel Goods Competitive Position of the S.A. Clothing Industry Frequency of Fabric Damages: S.A. Clothing Source of Defects: S.A. Clothing Source of Fabric Defects: S.A. Clothing Periodisation of Protection
Import Penetration & Export Intensity: S.A. Clothing (% by value) Import Penetration and Export Intensity by VOLUME Net Employment Effect of SAP Permits Major Durban Exporters: Export-Induced Changes Major Cape Town Exporters: Export Induced Changes The Allocation of SAP Permits Rate of Protection in S.A. Clothing Effective Rate of Protection in S.A. Clothing Scheduled and Actual Clothing Tariffs 1991 Scheduled and Actual Clothing Tariffs 1993 Comparison of Tariff Schedules Estimated Income Elasticity for Clothing (S.A.) World Price, Income and Employment Elasticities for Clothing . . .
Export Intensity & Import Penetration: International Comparisons Share of Clothing Trade in Subject to MFA & Other Restraints . . . Relative Wages in the W. Cape Industrial Council Agreement

Table D2: Wages and Subsistence Levels 165
Table D3: International Comparisons of Manufacturing Wage Rates by Scale . . 168
Table Fl: Clothing Machinist Training in Germany, the UK and S.A 188
Table F2: CITB Training Offered 190 Table F3: Effect of Price Changes on Employment 192
List of Figures
1. Employment in the S.A. Clothing Industry 8
2. Labour Productivity in the S.A. Clothing Industry 9 3. Comparative Production Costs 24 4. Comparative Production Costs (1982) 25 5. Dominant Historical Business Strategies in S.A. Clothing .. 37 6. Historical Shifts in Labour-Use 38
7. Dominant Business Strategies: Current & Desired Directions 44 8. An Overview of the Clothing Pipeline 50 9. The Cutting Room 56 10. Clothing Assembly 59 11. Clothing Market Niches 83 12. Volume of Clothing Imports and Exports 99 13. Structure of Clothing Import Volumes .. 100
14. Clothing Production & Sales 100 15. Retail and Wholesale Sales 101
16. Career Paths in a Clothing Factory 147 17. Tariffs, Prices and Demand 191
18. Static & Dynamic Approaches to Productivity Improvement 192

Executive Summary
This document considers the potential for developing the South African clothing industry within an international context. The central question concerns the potential for expanding or securing sustainable, formal job opportunities. The analysis and policy conclusions are formulated to take into account the effect of industry development policy on both the quantity and quality of jobs.
A highly traditional outlook on productivity improvement is depressing industry competitiveness. In reinforcement, firms consistently pursue strategies that emphasize work and wage intensification. Historically, South African firms have sought to reduce their cost structure through labour cost flexibility, potentially offering only static, one-off gains. This has entailed geographical decentralisation and the displacement of workers by age and race. Unlike overseas, South African firms have not informalised nor processed substantially in foreign plants since the domestic environment offered sufficient flexibility. However, as
many of the historical options are closed off, firms will increasingly pursue the kinds of strategies found overseas. These strategies could result in falling formal employment and
deteriorating working conditions. The challenge at this turning point is to find the appropriate mix of policies that will both promote industrial expansion and regulate potentially negative outcomes.
Section B.!. considers three aspects of industrial structure including that related to
employment, firms and distribution. The central findings are the following:
Employment
Employment in Industrial Council Areas consistently rose until 1976 to 103,000: thereafier, it fluctuated dramatically, peaking at 131,000 workers in 1982. Since 1989, the industry has been on its longest downswing ever. Figure 6 shows that the Industrial Councils account for approximately 70% of industry employment.
The fall in S.A. clothing employment cannot be attributed to labour productivity, since it has remained stagnant since at least 1976. Instead, job loss is due to the massive growth in import volume penetration: Export expansion has not
compensated for the displacement in local markets.

Firms and Plants
The notion that clothing is a highly fragmented industry primarily holds at the production level. An analysis of the clothing industry requires a consideration of the locus of power, located in ownership, and not in the small, fragmented production units. In particular, it is these large firms overseas that may be important customers for the S.A. industry in its efforts to export.
The S.A. industry is more concentrated in terms of production and ownership than any other clothing industry considered. In terms of ownership, this may be useful for the expansion of export and technological adoption. However, there are few scale economies in clothing: In fact, it is possible that the large size structure imposes unnecessary inefficiencies as a result of high overheads. Firms may gain from disintegrating and operating as completely separate cost centres.
Retail
The highly concentrated retail sector could have beneficial effects on the industry, if their approach were more developmental.However, at present, the retail sector is mainly squeezing the clothing producers, resulting in a poor distribution of profits through the pipeline.
The degree of dependence on the large retailers is worrying. In particular, firms that have a high dependence lose market control, and in the event of retailer bankruptcy, suffer from an inevitable domino effect. This dependence varies by region: Many Cape firms have adopted a specific policy to focus on multiple retailers. The firms interviewed in Natal have a broader customer base, including multiples and independent distributors.
Section B.2. considers the intensification of international competition, taking into account changing patterns of trade, market segmentation and international cost pressures. The central findings include:
International Trade
The international division of labour and trade flows in clothing have altered dramatically in the post-war period, and particularly since the 1960s. The international trade in clothing expanded dramatically: Simultaneously, developing countries increased their share of world exports from 10% in 1955 to 44% in 1988.
11

The reasons for this shift in production and export sourcing is not completely clear. The growth in Developing Country (DC) clothing exports is caused by two factors: Clothing production is often the first industry to be developed in a non- industrialised country. On the other hand, Industrialised Country (IC) firms seek low cost locations to assemble garments, maintaining the high skill intensive aspects of production centrally. The Multi-fibre Arrangement then encourages IC firms to continually relocate production to DCs that have unfilled quotas.
Market Segmentation
Clothing expenditure as a proportion of private consumption has been failing since the mid-1970s. Hence, apparel firms have sought to increase their penetration of smaller markets by diversifying and differentiating their product. The expansion of niche marketing has resulted in a requirement for greater production flexibility and more emphasis on creative marketing.
Cost of Production
Even in the age of niche marketing, price continues to be an important consideration for overseas buyers.
Relative to other countries, S.A. is a high cost producer. The productive efficiency is so low that, in terms of price, there is little benefit for a European buyer to source in S.A.
The high cost of production is not related to the cost of labour. The dramatic rise in wages was off a small base: Wages are still below subsistence and are low relative to other middle-income countries. In addition, the social charges are lower than found in any country analyzed.
This is not such a dire picture, since the productivity problem could be easily rectified if the industry adopted fundamental productivity improvements. These
improvements would focus on factory organisation, pipeline efficiency and human resource development, as described in section B.3.2.
Section B.3. is central to this document as it redefines the meaning and strategies to improve productivity. Business strategies to enhance profitability are outlined, demarcated by their potential contribution to long-run dynamic competitive advantage. This section essentially distinguishes "static" and "dynamic" strategies. Aspects of both approaches are presented: The superiority of dynamic approaches is clear in terms of speed of results and contribution to long run competitiveness.
111

Static Organisational Forms
Static strategies refer to one-off accommodations that do not improve a firm's ability to respond to further competitive pressures. Mainly as a result of ownership structures, clothing companies tend to be conservative in their business strategy and
pursue static responses to competitive pressures.
In a labour intensive industry the most familiar manifestation of these strategies includes the emphasis on labour cost flexibility. Such strategies may include casualisation, decentralising production to low cost regions or informal finns or work intensification through productivity deals. Mechanising or automating without implementing organisational change can be another form of static adaptations. These strategies are static since they offer a very short term respite: For example, firms that depend on low-wage labour pools must constantly relocate production, with all its attendant costs.
South African clothing firms have typically adopted static strategies that emphasize labour cost flexibility. The choice of strategy has depended on the prevailing regulatory environment governing labour and international trade. The primary strategies have included domestic decentralisation and the displacement of workers
by age and race. The strategies often found overseas, such as casualisation, informalisation and foreign processing, have not yet predominated since firms have had sufficient opportunity to garner labour cost flexibility in these other ways. As the former possibilities for wage and work intensification are exhausted and
competition intensifies, firms will seek alternative avenues. In the absence of regulatory change it is probable that firms will begin to pursue those static labour- cost reduction strategies found overseas.
Dynamic Organisational Forms
Dynamic strategies occur when firms implement practices that permanently increase the capacity to respond to change. These changes emphasize organisational change and functional labour flexibility.
Changes to factory organisation, as consistent with short-cycle manufacturing, quick response relationships and human resource development, encouraging broadly defined forms of multi-skilling, are integral to this approach.
Organisational change is considered for all parts of the clothing pipeline including the supply of textiles, pre-production, assembly and distribution. New organisational forms are presented that are consistent with shorter production cycles, modular
iv
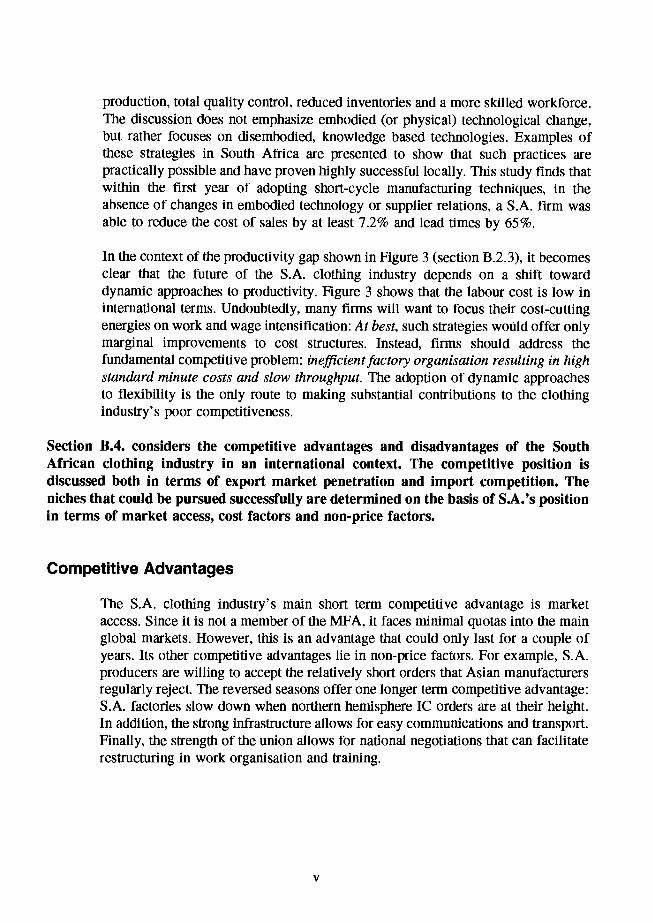
production, total quality control, reduced inventories and a more skilled workforce. The discussion does not emphasize embodied (or physical) technological change, but rather focuses on disembodied, knowledge based technologies. Examples of these strategies in South Africa are presented to show that such practices are practically possible and have proven highly successful locally. This study finds that within the first year of adopting short-cycle manufacturing techniques, in the absence of changes in embodied technology or supplier relations, a S.A. firm was able to reduce the cost of sales by at least 7.2% and lead times by 65%.
In the context of the productivity gap shown in Figure 3 (section B.2.3), it becomes clear that the future of the S.A. clothing industry depends on a shift toward dynamic approaches to productivity. Figure 3 shows that the labour cost is low in international terms. Undoubtedly, many finns will want to focus their cost-cutting energies on work and wage intensification: At best, such strategies woUld offer only marginal improvements to cost structures. Instead, firms should address the fundamental competitive problem: inefficient factory organisation resulting in high standard minute costs and slow throughput. The adoption of dynamic approaches to flexibility is the only route to making substantial contributions to the clothing industry's poor competitiveness.
Section B.4. considers the competitive advantages and disadvantages of the South African clothing industry in an international context. The competitive position is discussed both in terms of export market penetration and import competition. The niches that could be pursued successfully are determined on the basis of S.A.'s position in terms of market access, cost factors and non-price factors.
Competitive Advantages
The S.A. clothing industry's main short term competitive advantage is market access. Since it is not a member of the MFA, it faces minimal quotas into the main global markets. However, this is an advantage that could only last for a couple of years. Its other competitive advantages lie in non-price factors. For example, S.A. producers are willing to accept the relatively short orders that Asian manufacturers regularly reject. The reversed seasons offer one longer term competitive advantage: S.A. factories slow down when northern hemisphere IC orders are at their height. In addition, the strong infrastructure allows for easy communications and transport. Finally, the strength of the union allows for national negotiations that can facilitate restructuring in work organisation and training.
v

Competitive Disadvantages
S.A. clothing faces a number of disadvantages including an exchange rate that is supported by gold and mineral based exports, distance from the main export markets and a 14% tariff into EC markets. In addition, the weakness of local apparel fabric producers is a significant disadvantage, since overseas buyers often prefer to source fabric locally when purchasing from afar.
Low productivity is the S.A. clothing industry's major competitive disadvantage. This can be a short term problem since raising efficiency in the clothing industry is relatively cheap and quick: The most important changes are organisational and substantial improvements can be gained within 6—12 months. The main obstacle to achieving these gains is psychological: Firms tend to focus their cost-cutting efforts on wage and work intensification. Instead, a shift in thinldng about productivity must occur where efforts to increase productive efficiency, reduce throughput times and lower cost structures emphasize the production system. The most substantial gains have been found in firms adopting short-cycle manufacturing techniques; The introduction of quick response relationships would further enhance efficiency.
Market Niches
This report refers to 6 broad market niches, including low price or higher priced fashion, seasonal and basic goods. The inherent difference between fashion/seasonal/basic goods is the replenishment time allowed. Where a fashion item may be replaced within a month, a basic item may have a shelf life of over a year.
S.A. would not successfully compete in low priced goods since, unless there is a major currency devaluation, its cost structure must reflect that of a middle income country.
In export markets, its main competitors are other middle income countries such as Turkey, Southern Europe, or parts of SE Asia. Overseas buyers will mainly seek to buy from S.A. to diversify their sources and to order smaller runs. Since the distances are large, S.A. would be stronger in middle-priced seasonal or basic items, with longer replenishment times. To compete in the medium term, it will be necessary to dramatically raise productivity since the lower income countries such as China will soon achieve capabilities in the production of mid-income seasonal and basic garments.
In local markets, S.A. mainly imports from Taiwan, China and Hong Kong and, to a lesser degree, from Europe. Even if productivity improved dramatically, S.A.
vi

producers could not compete with the low priced Asian imports. Its competitive advantage would lie in the development of quick response relationships in the production of medium-high market basic, seasonal and fashion items.
Section C.!. considers the historical and current trade orientation applying to the clothing and textile industries. Both import protection and export promotion policies are presented. The critique of their interaction finds that the ad hoc manner in which trade policy is formulated has had detrimental effects on local employment:
Import Protection
Until very recently, the S.A. clothing industry provided more than 80% (of the units) and 90% (of the value) of local demand. Since 1989, volume import penetration has risen to over 40% of the local market.
Worn clothing accounts for an important part of the rise in import penetration: However, the extent to which new and worn clothing are substitutes is not clear.
Historically, S.A. clothing has been highly protected from imports by tariffs and
quotas. The system of tariff protection has become extremely complicated, with a different tariff for small product variances. Tariff dispersion is excessive, particularly in light of weak customs control mechanisms.
Although the scheduled tariff on clothing remains high, very little is actually paid as a result of the duty free permits offered by the SAP export promotion scheme. Hence, clothing producers will be squeezed by the recent rise in fabric duties from 20% to 50% ad valorem. In the next 2 years clothing producers may face negative effective rates of protection. Although a short period, this industry, which typically operates on small margins, is extremely fragile: This is demonstrated in the loss of 15—20% of its employment in only 2 years.
Export Promotion
Export promotion has caught the imagination of South African policy makers and firms since the late 1980s. The misnamed Structural Adjustment Programme (SAP) was introduced in 1989 to encourage exports. The SAP offers negotiable duty-free import permits to exporters until at least 1994/5.
There were two main problems with the SAP. First, it assumed that export activity would necessarily encourage productivity improvements: The SAP does not offer
any form of support to the organisational changes required in the industry and
vu

pipeline. This study finds that exporting firms have not introduced major changes to operating practices: Firms seem to mirror their local behaviour, both in terms of production and marketing behaviour when entering export activity.
Second, the SAP encouraged import penetration since it allowed for duty-free imports to be sold on the local market. Normally, rebate programmes are introduced to allow exporters access to inputs at "world prices". In contrast, the SAP encouraged firms to export in order to bypass high tariff detenninations. In conjunction with high variations in tariff determinations, SAP permits have mainly been used on the most trade sensitive products, to which the higher duties apply. In 1991, only 20% duty was paid on total clothing imports.
The net effect on the industry has been disastrous. Volume import penetration has risen from 19% in 1988 to 44% in 1991. The export intensity (in volume terms) has risen from only 7% in 1989 to 9% in 1991. When calculated in isolation, this study finds that the SAP caused the loss of approximately 14,000 jobs between 1990—2. It is estimated that a further 13,000 jobs may be lost in 1993/4, directly as a result of SAP (Table C4).
In addition, the SAP and duty drawback scheme (470.03), which are used about equally, conflict with the GElS incentive. Essentially, the GElS formula is partly dependent on the use of local inputs. If clothing exporters make use of duty- drawbacks to obtain inputs at world prices, their GElS subsidy can fall from 19.5% to 9% of export value.
Finally, aside from assistance with productivity improvements, exporters need support for marketing costs. Clothing exporters unanimously report that marketing accounts for about 10-15% of the cost of export sales in the first few years at least. The Export Marketing Assistance (EMA) programme offers a mere pittance of what is really required: The EMA provides 50% of one economy airfare, a stipend of R400 per day and a small amount for the transport of samples. However, the development of overseas markets requires many trips and expensive communications and hotel stays.
In light of the need to determine an overall market strategy, section C.2. considers inward, outward and balanced trade orientations. The main conclusion points to the superiority of a balanced approach to trade, which emphasizes the optimal expansion of global (export and local) markets:
vii'

Inward Orientation
An inward orientation requires high protection to ensure local markets for domestic
producers. This was the prevailing orientation in S.A. until the late 1980s.
It is a very narrow approach for two complementary reasons. First, the local market is small and mainly growing in low-income segments. These are the products that the local industry cannot offer competitively. From a macro-economic standpoint, it is necessary to offer an important wage-good at low prices. Moreover, the extent of protection required would exceed that allowed by international trading arrangements. Second, the high degree of market segmentation means that S.A. could concentrate on items it can produce competitively. The S.A. industry could supply both local and global markets in particular niches. These products would then be complementary to, not in competition with, imports.
Export Orientation
The adoption of an export oriented trade strategy often assumes that an open trading enviromnent maximises welfare and best promotes productivity and
efficiency. This study does NOT find that exporting has encouraged the adoption of new productive or marketing strategies. In fact, exporters seems to graft local
strategies onto exporting behaviour.
The main changes implemented by new S.A. exporters include a re-location of production to lower wage countries that have better market (Lome) access. In countries with greater labour regulation, local formal employment often falls as exports competition encourages finns to assemble in foreign factories. It is mainly the less-developed countries where exports lead to significant rises in employment.
A Balanced Approach
S.A. is unlikely to be wildly successful in export markets, particularly in the absence of some new fashion trend or significant productivity improvements. It would therefore be unwise to ignore the need to recapture local markets, and the balance required between supplying domestic and foreign demand.
A holistic development programme is required that directly promotes productivity improvements through operational change. Firms should focus on product niches in which they can successfully compete, providing these items for both the S.A. and export markets. The development of quick response relationships and short-cycle
ix

manufacturing techniques would be more effective at recapturing the local market than would high tariffs.
Section C.3. considers policy to support a balanced approach to trade. A balanced combination of protective and export promoting policies are presented in the context of the relevant S.A. and international institutions.
The S.A. State
This study finds that S.A. state institutions involved in trade policy are indecisive and, to the detriment of the industry, do NOT formulate trade and development policy in a coordinated manner. In addition, the BTI and Dli are under-resourced, depending on interest groups for policy analysis. The constant alterations and shifts in trade policy make it impossible for business to plan ahead.
International Trade Arrangements
This study considers two main international arrangements: the General Agreement on Tariffs and Trade (GAiT) and the Multi-Fibre Arrangement (MFA).
South Africa will be expected comply with GATF regulations as sanctions are abandoned. One important change implemented in the Uruguay Round was the elimination of a separate subsidies code: This means that all GAIT signatories must now comply with rules on subsidies. This will limit the S.A. state's ability to target specific industries for development. In addition, subsidies that are contingent on export performance are prohibited. Should S.A. be reclassified as a "developing country", it would have an 8 year transition period to full compliance. If the intention is to offer a new export promotion subsidy to the clothing industry, it must be implemented immediately since the transition period applies only to programmes already in existence. It would not be possible to introduce a subsidy falling outside of GAIT regulations after the Round is signed.
The Multi-Fibre Arrangement (MFA) regulates the international trade in clothing and textiles. Over a 10 year period, it will be progressively integrated into GAIT. This means that the possibility to use quantitative import restrictions (eg. quotas) and to discriminate against specific trading partners will fall away.
S.A. may want to reconsider joining the MFA. The most important reason to join rests on the potential admission of China into GAIT. As a result of Chinese trading practices, it will be necessary to impose discriminatory barriers against its exports.
x

If China joins GAY!', S.A. will only be able to implement discriminatory trade practices if a member of the MFA.
However, if there is a committed intention of expanding exports in the immediate future, it may be more sensible to wait until international markets feel the impact of S.A. exports. it is unusual that S.A. is NOT a member of the MFA. This is one of S.A. 's main short-term competitive advantages since very few quotas are imposed against its exports. At present, S.A. provides 0.11% of global markets. It may become noticeable once it provides 1—3% of international exports. The determination of quotas set on the basis of current capacity would be set too low to allow for a substantial export expansion.
Trade Policy
The most important consideration in developing trade policy for S.A. clothing is employment generation. In addition, it is necessary to consider the effect on consumer prices since clothing accounts for a large proportion of household expenditure.
Any policy should be formulated in an integrated manner. It is crucial that policy be implemented in a consistent manner, and that incentives and schedules remain unchanged. Finally, incentives should always be tied to the proverbial stick. For example, the continued provision of export subsidies should be tied to demonstrated productivity improvements, employment expansion, training or capital investment.
Protective policies should be simplified: Tariffs should be determined by 4-digit SJTC codes instead of the current 8-digit codes. Although this simplification would encourage screams from many industrialists, it would facilitate product identification and eliminate the product switching that so commonly occurs at customs. The tariff could reflect the most trade sensitive item in the code, setting the protection at a rate which eliminates dumping and provides some margin to the industry. In conjunction with development programmes, this margin could be reduced to reflect productivity improvements, in line with textile tariffs.
Since S.A. is not a member of the MFA but is a GAY!' signatory, it cannot use the ultimate form of protection: the quota. The second best option is to use specific tariffs, which set a duty per kg imported. This tariff reflects differences in weight (eg. children's versus adult clothing) and reduces when an item is more expensive. It is therefore the most useful tariff in a bid to reduce the dumping and extremely cheap imports that are undermining the industry.
xi

In terms of export promotion, S.A. exporters will need a subsidy to bridge the productivity gap that currently exists. However, this subsidy should be tied to productivity improvements, as outlined in section B.3.2. Public resources are wasted if export subsidies are given to an industry that cannot achieve competitiveness. The required improvements could be quickly implemented since the problems are primarily organisational, not structural.
The specific recommendations include the full provision of GElS at 19.5%, even when making use of duty drawbacks on imported inputs. In addition, capital equipment should be imported duty-free and without a surcharge. Finally, the EMA should be extended to offer more substantial marketing subsidisation for at least the first 2—3 years of export market penetration. The combination of these policies should subsidize the exporter by approximately 35% of export sales, while importing inputs at world prices.
To date, industry policy has primarily focused on narrow trade issues. Section D.2. suggests development policy for the S.A. clothing industry. The broad goal concerns the adoption of productivity improvements that will contribute to dynamic competitive advantage. The main policies include the establishment of a central Development Office, the development of Regional Support Services and a reconsideration of human resource policy:
Clothing Textile Development Office
A Development Office would coordinate an industry plan jointly for business and labour. It would ensure the development of regional support services, monitor developments in the pipeline, supervise the use (or abuse) of incentives offered to the industry and promote joint submissions to the state where necessary. Finally, a Development Office could be responsible for linking exporters to potential overseas buyers.
Regional Support Services
Regional support services are required to assist firms to implement new organisational practices. To this end, a critical mass of industrial engineers should be trained to service the main regions. This service would be particularly useful to smaller firms that may not be able to afford a full staff complement. These services might be subsidised initially, with some user fee charged.
xii

Training and Grading
The training and grading system needs to be altered for two reasons: First, it will not be possible to introduce newer organisational practices, reduce downtime and improve throughput times unless workers become more multi-skilled. In particular, modular manufacturing systems absolutely require that workers have a broad range of skills. Even where organisational changes are modest, training workers in quality control and line balancing can reduce reject rates and speed throughput. Second, the current grading system discourages worker interest in training since little financial remuneration is offered to those who gain a broader skill base.
The common perception that clothing workers are unable to become more educated and move up the "ranks" seems to be based on poor entry educational levels. However, low school leaving educational attainment is probably more the result of the few choices facing women. Factories that do encourage training achieve the desired results. The training and grading structures should reflect clearly-defined career paths for production workers. Increments should be offered to workers that gain higher skill levels. The current grading system contains a maximum of 24 grades, differing by region, with pay relativities that do not necessarily reflect skill. This structure should be simplified to about 5 broad bands and homogenised across the regions. Each band could contain very different jobs, but reflecting similar skill levels.
There will be resistance to any changes in grading structures or training expectations. A number of ways of addressing this resistance may be considered. First, it will be necessary to offer detailed information on cost savings achieved through training. In addition, this study suggests the development of a co-operative programme where workers on training schemes develop projects that can be implemented on the factory floor to improve productivity. Section D.2.5. also recommends wage agreements that extend over a longer period of time so that
employers will not obstruct the introduction of a new grading system for fear of unexpected wage rises. Finally, tax breaks or export subsidies might be provided to firms that train.
While wages have risen, they are still very low. In fact, the determination for a qualified clothing machinist is below the minimum household subsistence income level. Unless there is some plan to increase wages to exceed subsistence levels, it will be very difficult to introduce substantial training programmes.
The dominant business strategies alter as firms respond to greater international competition and a package of incentives. In addition, changes in the labour environment, particularly with the amalgamation which culminated in the establishment of SACTWU and the organisation of workers in the bantustans, will influence the way
xiii

firms try to respond to competitive pressures. Section D.2. considers the regulatory environment to ensure that social goals are achieved within the context of an industry plan. Historical behaviour has shown that firms will try to take advantage of the gaps in labour regulation to achieve static labour-cost flexibility. Organised labour must realise that some flexibility is required: However, it should be possible to regulate the forms of flexibility so that they allow for formal sustainable job opportunities. The issues considered include regulations over foreign processing, informalisation, casualisation, severance procedures and wage determination. Finally, the role of member education is discussed.
Foreign Processing
There is relatively little foreign processing at present. However, assembly in lower wage, Lome signatory countries is likely to rise as firms increasingly enter export markets. Aside from informalisation, foreign processing is one of the most difficult forms of labour-cost flexibility to regulate. It is well worth considering the implementation of regulatory measures before many firms become dependent on this activity. For example, there might be regulations on the percentage of value that can be added outside of the country. In addition, it is quite important to limit
foreign processing to manufacturers. Clearly, any state assistance to firms should
require adherence to these kinds of regulations.
Informalisation
Informalisation occurs where assembly is (usually) subcontracted to unregistered firms that are not required to comply with labour regulations. While not a major problem yet in S.A., informalisation can devastate worker organisation and
regulation within a very short period of time. Regulating informal firms is a formidable task.
Three suggestions are made with regard to informalisation: First, SACTWU might consider allowing for a separate wage determination for small finns. S.A. clothing is one of the only known industries where wages are homogeneous by plant scale. With wages at below subsistence levels, it would be difficult to justify two determinations. However, in order to avoid the ravages of informalisation, a lower determination for smaller firms may encourage subcontracting to small formal firms, and not informal ones. Second, intermediary services between contractors and subcontractors could be developed to encourage small firms to come out of the woodwork. Third, member education may be an important source of information
concerning the extent to which informal firms are expanding. Members should become more aware of the problems associated with colleagues leaving to start up
xiv

on their own, possibly supplying the former employer. Services in communities and to retrenched workers may also keep former workers within the gamut of union organisation.
Casual isation
Casualisation is relatively rare in the S.A. clothing industry. However, other forms of flexibility thai previously offered substantial savings in the wage bill are falling away. The minimal regulations on casualisation are now likely to encourage firms to increasingly hire workers on fixed term contracts. This can have a very divisive effect on union membership.
There are a number of ways of addressing casualisation: First and most difficult, the introduction of short cycle manufacturing tends to smooth out the production cycle, thereby lessening the need to reduce the workforce during slow periods. Second, more stringent notification and severance procedures might limit current retrenchments: Typically as firms move to casualisation, they fire permanent staff and then hire back on fixed-term contracts. Although casualisation is not desirable, it may be a better form of flexibility than informalisation or foreign processing since it can be observed and regulated. Strangely, it may be in SACTWU's interest to establish the rules around casualisation by, for example, introducing maximum
proportions of a firm's workforce that can be hired on fixed-term contracts.
Notification and Severance Procedures
The notification procedures essentially require only one week's notice. Severance
pay is determined by negotiation. In an industry offering low wages and small
provident fund pay-outs, workers are left with little for their working life. Clearly more stringent procedures are required. In particular, the union should be given a minimum of one-month's notice of severance. Minimum assistance should be provided for re-training. In addition, there should be provisions allowing independent consultants entry to a factory to determine ways to avert closure.
Wage Determination
The common ideology concerning wage determination asserts that workers should be paid according to their productivity. However, it is quite clear that firms do not know the marginal productivity of their workers. Wages are more determined by industry margins and the bargaining power of worker organisation. Attention should not be focused on the allocation of a fixed surplus between wages and profits.
xv

Figure 3 shows that wages are not S.A. clothing's competitive disadvantage; Instead, the problem is low productive efficiency. Section B.3.2. shows that short- cycle manufacturing techniques can result in a real increase in the surplus by over 7% within the first year of implementation. Even if equally divided between wages and profits, these savings would offer workers a REAL wage increase of at least 3.5% at the outset. Many firms are folding and some are requesting wage freezes or reductions. These concessions will not address their fundamental problem, associated with poor productivity. It is worth entering such deals only when the wage is used as a strategic tool to force the firm to adopt new organisational practices. Otherwise, wage deals can only result in a downward pressure on industry wages.
Three major suggestions are made: First, a lower wage determination might be introduced for smaller firms. Second, two-tiered bargaining may be introduced in a limited manner as a strategic tool to encourage firms to introduce organisational change. One detennination might be set for most of the industry. As an experiment, a slightly lower basic wage might be allowed for firms that jointly with SACTWU enter a process of introducing SCM and quick response relationships. The proceeds from the productivity improvements would then be shared in set proportions. These experiments would require shop steward training to monitor the implementation and improvements. Finally, any major change to grading structures will probably meet with resistance in the industry. The major concern will be related to potential wage increases. This concern would be addressed by the introduction of longer term wage agreements that tie wages to some cost of living index. This will allow for the introduction of more rational grading structures that benefit skill and human capital development.
Member Education
Member education will be crucial to the implementation of any plan that seeks to promote sustainable formal jobs. In particular this study suggests that members be trained to monitor the industry and feed information back through union structures. In addition, members should learn about signs of potential closure in order to warn organisers. If SACTWU becomes involved in joint schemes to promote the adoption of fundamental productivity improvements, workers should be trained in measuring these improvements so that they fairly gain from the process. Workers should also become more aware of the effect of industrial change on unionisation, particularly in relation to informalisation. Finally, since wages are below the minimum subsistence income levels, life skills education, such as nutrition and home budgeting, will assist workers to cope. From a union standpoint, this education could contribute to member loyalty as workers see that the union is interested in their daily needs.
xvi

An Industry Plan
Based on the findings of this study, an integrated plan could be developed, including the following components:
r"''''"" r' • Marketing Offices • Services
4. Rationalisation of Import Protection Structure
5. Labour Market Regulation
Regulate use of labour to achieve social goals of industrial policy: • Creative wage determination • Regulation of wage and work intensification • labour adjustment • Member education
xvii

Preface
This document is admittedly exiremely long and fairly dense. It is not meant to be a popular document. Ideally, this document should be read in its entirety. Where this is not possible, it can be used as a reference document, offering information on topics as required. A very detailed table of contents is provided for this purpose. However, there is a danger in reading sections in isolation. Consuming detached arguments may miss the broader point being made: concepts should be understood within the context of the full argument being put forward.
This document is submitted to SACTWU and COSATU. It does not reflect the views of either organisation. The opinions stated reflect the views of the author only.
Acknowledgements I would like to thank the following for their assistance, advice and cooperation: The staff at SACTWU, the NCF, the Textile Federation, the Industrial Councils, the National
Development Corporations, the BIT, the DTI, the International Labour Organisation (ILO), the NPI, Filtea and the Turkish Employers' Association. In addition, I thank the employers and managers interviewed, many of whom requested anonymity.
Thanks also for the support and suggestions of Chris Lloyd, Alastair Machin, Diane Elson, Rob Lagrange, Lionel October, Mark Bennett, Sam Gindin, Derek van der Riet, Joop de Voest, Sue McCreedie, Brian Levy, Gerry Helleiner, Gijsbert van Liemt, Raphie Kaplinsky and Wendy Matthews (for the mouse!)
Finally, I gratefully acknowledge the financial assistance contributed by (in addition to the ISP): the Richard Ward Endowment Fund, the URC Ad Hoc Grant and the DVC (Wits Research) Discretionary Fund.
Acronyms BIT Board of Tariffs and Trade CMT Cut-Make-Trim (syn. subcontractor) CIF Customs, Insurance. Freight DC Developing Country DTI Dept of Trade and Industry
xix

FOB Free-on-Board Forex Foreign exchange GAIT General Agreement on Tariffs & Trade IC Industrialised Country MFA Multi-Fibre Arrangement NCF National Clothing Federation NPI National Productivity Institute OPT Outward Processing Traffic (syn. foreign processing) S.A. South Africa SACTWU South African Clothing & Textile Workers' Union TexFed Textile Federation
xx

Chapter A: Introduction
Why promote the clothing industry?
From the standpoint of established interest groups, namely the clothing workers and
producers it is not a question of "why", but rather of "how". The appropriate question is less obvious for the rest of organised labour and policy-makers.
If the South African state does choose to target indusiries for assistance, it will need to consider sectors that earn foreign exchange, provide strategic inputs, generate employment and/or fill consumer demand. In the S.A. context, employment generation and consumer needs would be the main considerations in developing the clothing industry. Clothing is not a major foreign exchange earner for a country rich in strategic minerals and metals. The extent to which S.A. clothing could efficiently supply consumer needs is unclear: consumer
requirements could be imported from Asia and Europe. The costs of any subsidisation would need to be weighed against foreign exchange expenditures.
The most important priorities are employment generating and job saving in the context of extremely high unemployment rates. The clothing industry offers a number of advantages to a government seeking to expand employment quickly. It is one of the few remaining labour intensive industries. In S.A., clothing factories employ about 9% of manufacturing workers, with about 140—160,000 located in central and decentralised factories. While the
clothing pipeline tends to have low employment multipliers, a significant portion of the
90,000 workers in textiles depend on S.A. clothing output. The creation of clothing jobs is
extremely cheap, costing less than R10,000 per employment opportunity. In the absence of other alternatives, supporting the clothing industry is one way to cheaply and quickly generate jobs.
In addition, improving competitiveness to promote expansion is very inexpensive. This study finds that the most important productivity improvements are implemented organisationally, and do not necessarily require substantial capital investment Therefore clothing is a
relatively cheap, non-forex consuming industry. Particularly if foreign investment were
encouraged, easy entry means that the industry can expand very quickly.
As a low productivity sector, it is not the sort of industry a S.A. government would support in the long run. However, over the next period of years, it could be an important source of
manufacturing employment.

2 INDUSTRIAL STRATEGY PROJECT
How would an industrial development programme be framed to achieve the desired goals? What are these goals? What are the constraints?
Typically, industrial development strategies focus on achieving international competitiveness through improved efficiency, innovation or design. From the standpoint of industrialists, the main goal is to maximise profits and/or global market share. Yet, organised labour may need to re-orient these objectives to fulfil social goals. In particular, the main reason for promoting a labour intensive industry is to generate fonnal, sustainable jobs. Raising competitiveness is a necessary, but not sufficient condition. Section B.3.l. shows how even successful clothing industries, such as Italy, can achieve competitiveness and design success in conjunction with work and wage intensification strategies. Hence, a framework outlined by organised labour would differ from that laid out by the business sector. Although some overlap would exist, the goals are fundamentally different.
If employment generation is the overriding goa4 where does competitiveness fit?
Essentially, an industry development framework that seeks to maximise formal, sustainable jobs must take into account certain constraints. The obvious constraints for clothing industry development include the availability of financial resources, the lack of credibility of state institutions and conservative management attitudes to new forms of work organisation. Yet, achieving international competitiveness is the most significant constraint to expanding employment. For labour, competitiveness is a constraint, not a goal in itself. Jobs will not be created or sustained unless it is achieved, since neither import nor export competition will be successfully met. Competitiveness is a constraint that must be accounted for, but is not a goal since it can commonly coincide with strategies that are inimical to labour. The goals include job creation and the achievement of satisfactory work conditions, reasonable wages and skills development. These are socially-determined goals. Enhancing profitability and productivity may be necessary to achieve these social goals, but surely they in themselves are not what labour seeks.
An industry development framework needs to embody ways of achieving the social goals, in the context of existing constraints. For the clothing industry, this entails balancing industry promotion policies with labour regulation and member education. In addition, it requires a "carrot-stick" approach to policy development: Any incentives offered to business should be tied to desired behaviour, such as employment generation or the provision of training. Likewise, if concessions are to be made in terms of wage determination, these trade-offs should be undertaken strategically. For example, any factory-based wage deal should be tied to stringently determined productivity improvements that can help firms become more sustainable and eventually offer the desired wages and work conditions.
A psychological shift is required to address the productivity gap. Business and the state
typically say wage compensation cannot improve in the absence of productivity improvements. However, in deconstructing the productivity problem, this study finds that

CLOTHING SECTOR 3
wages are not the significant cost disadvantage. Despite the relatively low wages, clothing production cost structures are high and throughput times are slow.
This negative picture can be rectified: It would be extremely difficult to achieve sufficient productivity improvements if it were the cost of inputs that posed the competitive problem. Contrary to common belief, S.A. labour costs are low by international standards. In any case, labour is not really the most important variable: it is the materials and factory organisation that offer the main production variables. This is particularly the case where workers are earning wages falling below subsistence levels. With commitment, the required productivity improvements associated with changes in factory organisation could be easily achieved in a short space of time. The industry could focus on market niches that reflect the structural constraints posed by South Africa's position as a middle income country. As described in section B.4., S.A. would best provide higher priced, classically styled products.
Firms will typically seek to bridge the productivity gap through work and wage intensification: These strategies focus on labour cost flexibility. It would not be in the industry's best interest to follow such avenues. Focusing on reducing labour cost may offer a short term advantage, but will not address the requirements of achieving long-run dynamic competitive advantage. Speeding up work will also not effectively address competitiveness, since throughput depends more on the flow of materials and work-in-progress (WIP) in the pipeline and factory. As discussed in section B.3. 1., a continuing emphasis on labour cost reduction to increase competitiveness will result in significant losses in formal factory jobs, as firms informalise, process in low-wage countries and then shut down. Unless the underlying productivity problem is addressed, the S.A. clothing industry is unlikely to survive remotely near its present size.
Instead, dynamic organisational practices should be implemented, introducing short-cycle manufacturing techniques and quick response relationships with human resource development. This is the only way of substantially improving lead times and cost structures to achieve dynamic competitive advantage and generate sustainable job opportunities, as shown in section B.3.2.
Some firms have already gained from adopting such techniques. To encourage a broader diffusion of these disembodied organisational technologies, it will be necessary to tie desired practices to strategic incentives at the disposal of either the state or organised labour.
The clothing industry is exceptionally fluid with seemingly endless organisational possibilities and few objective determinants of organisational choice. Yet, firms make organisational decisions on the basis of pressures experienced, accessible opportunities and constraints posed. These pressures, constraints and opportunities are substantially dependent on the prevailing regulatory environment. A fragmented, labour intensive industry is not a strategic industry nor is it characterised by concentrated power or decision-making ability. Industry policy that seeks to encourage development cannot be merely indicative and

4 INDUSTRIAL STRATEGY PROJECT
educative of the way forward. Successful industrial policy must change the relative price and incentive structure to ensure desirable forms of behaviour.
Any union-backed strategy for the clothing industry requires a combination of promotion and regulation. Effective industry policy brings with it new firm strategies for market expansion and cost containment. Industrial promotion policies are not neutral from a labour standpoint. A clear awareness of the forms of labour flexibility and the way firms seek this flexibility are needed. This explicit awareness may enable organised labour to influence the regulatory environment in such a way that undesirable organisational options become costly, while desired organisational forms are encouraged. In some cases, it may be necessary to sacrifice certain regulations which result in excessive rigidity and pressure on firms: Excessive
regulation may encourage firms to take highly undesirable and unmanageable routes to competitiveness, including informalisation and foreign processing.
Trade policy should focus on promoting the fundamental development rationale. The mix of import and export policy should be part of a programme that directly focuses on raising employment through improvements in productivity and human capital development. As described in Section C.l.3., South African clothing trade policy has mainly rewarded exports by encouraging import penetration! It is not the export activity that should be rewarded, but rather desired behaviour in terms of productivity growth, investment or sustainable
employment generation. There is little net benefit to redirecting output to overseas markets, unless done in conjunction with these improvements. If these changes occurred, the importation of cheap clothing would pose less of a threat since it would represent complementary, not competitive supply. The S.A. clothing industry would put itself in a
stronger position to generate sustainable employment opportunities.
Regulating the operational environment is as important as promoting industrial expansion. Historical behaviour in the clothing industry has demonstrated that firms do react to regulatory change: Firms have chosen different forms of labour flexibility, in light of labour market controls on relative wages and regional incentives. Now that certain options for flexible labour use are being cut, firms will surely seek new forms, including informalisation, casualisation, foreign processing, automation and shifting into importation.
There are a number of ways of addressing these business choices: the first entails facing these forms of labour cost flexibility head on by imposing severe regulations. The problem with this approach is that the industry is highly footloose and could simply encourage closure and movement outside of S.A. Geographical movement of production is feasible in the context of a labour intensive industry. While a firm would want to maintain a headquarters and design office near markets, the precise location of production is less
important. In addition, excessive rigidity tends to result in intensified efforts to circumvent the rules. In consequence, clothing unions globally have lost any significant influence over their environment.

CLOTHING SECTOR 5
It is necessary to consider ways that the union can influence the operational environment so that acceptable and sufficient forms of flexibility are available to firms. The emphasis would be on altering the forms of flexibility, not their elimination. Certain avenues are cut off, while other avenues are opened up. Some forms of flexibility may be sub-optimal if they result in a loss of hard-won gains. However, the real choice may entail demarcating between the acceptable and unacceptable areas of compromise: In order to ensure long-term survival of labour organisation, it may be necessary to offer the acceptable areas up in exchange for concessions from the employers. Section D.2. addresses issues associated with foreign processing, informalisation, casualisation, wage determination and severance procedures.
This study is based on both primary and secondary research. A large sample of finns was visited in 1991 in the Transvaal, Natal and the Western Cape. This was not a random sample: It mainly included outerwear firms employing more than 300 people. However, some smaller firms, CMTs, foundationwear, childrenswear and design houses were also included. These were intensive interviews, with an average duration of 4.5 hours. Meetings were held with company MDs and those responsible for production, sales and personnel. During each visit, a walk through the factory floor was undertaken to view work organisation and machinery. Overall, the sample included 11 Transvaal-based firms, 27 Cape Town-based firms and 23 finns in Natal. More than 61 factories were visited, as some firms operate through a number of subsidiaries and plants. In addition, eight multiple retailers were interviewed. Finally, visits were made to firms, employers organisations and unions in Turkey and Italy. The research also gained from visits to the GAiT and EC offices in Geneva and Brussels.

Chapter B: Employment and Competitiveness
The International Context
The South African clothing industry is only beginning to enter global markets: This is quite unusual since clothing is a highly traded good in international markets. This entry to the international fray will force firms to either alter their competitive strategies or close down. In recent times, many firms have done the latter as import competition surged.
S.A. clothing producers are highly inefficient: the high cost structures are usually blamed on the price of labour or textiles. Yet, S.A. labour costs are relatively low. It is poor factory organisation that results in high production costs and slow throughput. This problem will not be resolved through traditional means of wage or work intensification. Focusing on reducing labour cost may offer a short term advantage, but will not address the requirements of achieving long-run dynamic competitive advantage. Speeding up work will also not effectively address competitiveness, since throughput depends more on the flow of materials and work-in-progress (WIP) through the pipeline and factory. A continuing emphasis on labour cost flexibility as a means to increasing competitiveness will result in significant losses in formal factory jobs, as firms informalise, process in low-wage countries and then shut down. Unless the underlying productivity problem is addressed, the S.A. clothing industry is unlikely to survive remotely near its present size.
Sections B.1. and B .2. consider the position of S.A. clothing internationally, given its organisational and cost structures. Section B.3. outlines the different strategies typically undertaken by the clothing industry, both in S.A. and abroad. It demarcates between strategies that offer static versus dynamic gains, pointing to the benefits and means of achieving dynamic competitive advantage. Section B.4. points to niches in which S.A. could be successful, if the industry improves productive efficiency in the ways outlined in B.3.

B.1. Industrial Structure and Trends
The S.A. industrial structure must be understood within the international trends. This section begins by considering the international division of labour where employment has shifted from industrialised (ICs) to developing countries (DCs). Industrial structure is then discussed. The assumption that the clothing industry fragmented is questioned: although factories tend to be small and dispersed, the locus of decision-making is far more concentrated than commonly accepted. The structure of distribution is then considered.
The South African industry is considered within this international context, with the following findings: The recent employment losses have mainly been caused by import penetration, not productivity improvements. In fact, productivity barely altered between 1976—1992. Low productivity may be partly due to high clothing industry concentration, in terms of both factory and firm size, imposing unnecessary overhead structures. Moreover, a powerful retail sector limits the distribution of profits through the pipeline, possibly hindering new investment.
B.1..1. Employment
Since the 1970s, global clothing employment has shifted from ICs to DCs. Between 1973—80, 500,000 clothing jobs were lost in the OECD countries (De Ia Torre 1984:22). The fail in employment has continued into the 1990s. Part of this decline represents a movement by ICs up the product ladder, into higher productivity sectors. Excluding some of the southern European countries, clothing employment as a proportion of manufacturing has declined dramatically in the OECD (De la Tone 1984:54). While much of the skill intensive functions remain in ICs, production has shifted toward DCs. As developing countries themselves move up the product and skills ladder to become "NICs", clothing production relocates to increasingly low cost locations.
A number of studies have shown that productivity improvements have been the main cause of declining OECD clothing employment (Cline 1987, de Ia Tone 1984). Cline's study disaggregates the effect of imports, domestic demand and productivity on domestic employment: These factors contributed to the 15% fall in employment between 1970—80 in the following way:
Domestic demand +21.7% Net Imports —10.0%
Productivity —27.0%
Total —15.3%
Although local industrialists and unions tend to blame rising imports for employment losses, Cline finds that the positive effect of demand and negative effect of imports would have

8 INDUSTRIAL STRATEGY PROJECT
resulted in an 11.7% net rise in employment. Cline finds that the productivity improvements contribute the most to job loss. De la Torre (1984:30) shows that labour productivity in the OECD countries increased by between 28—102% over this decade. Even if imports had not risen, employment would still have fallen by at least 5%.
Productivity improvement is clearly necessary to maintain competitiveness. However, the significance of "labour productivity" is unclear: The term evokes notions of technological or organisational change. Section B.3.1. questions this assumption: In the clothing industry, productivity improvements may be closely associated with informalisation and foreign processing. In this case, the productivity improvement is merely statistical since the labour component is simply not enumerated.
Figure 1 and Table Gi show trends in South African Industrial Council clothing employment between 1933—93. Employment rose consistently until the mid-1970s to 103,000. Industrial Council employment then fluctuated, peaking at 131,000 in 1982. The Industrial Councils account for about 70% of industry employment: Figure 6 shows that the proportion of clothing workers in decentralised factories has risen to over 30%.
A number of factors affected employment fluctuations from then on: First, by the 1970s, South Africa had exhausted its import substitution potential. In the absence of export activity, growth fully depended on a rise in local population or incomes. Since 1989, rising volume import penetration has resulted in declining employment levels.
Figure 1 Employment in the S.A. clothing industry —
Industrial Council areas
: i:i:ii:i:i::i:: /_ 33394551 5460657076T778798081 828384858687888990918293
Year

CLOTHING SECTOR 9
Figure 2 Labour productivity in the S.A. clothing industry
1976 1978 1980 1982 1984 1986 1988 1Q90 1992
Year
-.- OutputlLabour Ratio -- - Empbyment -- Production
Consider Figures 2 and 14 in light of Cline's findings. The dramatic fall in S.A. clothing employment has not been the result of rising productivity: Figure 2 shows that labour
productivity in the S.A. clothing industry has been stagnant or falling. Figures 14 and 15 show that domestic demand has increased by about 10%. Finally, Figure 12 shows that rising import penetration, in the absence of sufficient export expansion, is the most significant contributor clothing job loss.
B.1 .2. Industrial Fragmentation
Clothing is often perceived as an industry with many small firms. In fact, a number of large firms dominate the industry in a way that is not obvious to the casual observer. The
appearance of a small size structure results from the prevalence of small factories and a fragmented production organisation which may occur across cities, regions or countries. In
addition, many large clothing finns do not produce themselves, although their market power allows them substantial influence. Hoffman and Rush (1987) estimate that by the turn of the
century, 75—100 companies will account for 75% of global sales.
The Italian clothing industry perfectly exemplifies the false impression of clothing fragmentation. Table B2 shows that in 1981, there was an average of 12 workers per plant in Italy. This degree of fragmentation in production continues today. However, there is a high degree of industrial concentration: In 1986, 61 clothing companies accounted for almost half industry mrnover (Pent 1988). Of 500 firms producing ladies' wear, the top 39 contribute 1/3 of turnover. In menswear, 5 firms out of a total 550 account for 1/4 of turnover (Lewis 1988).
8 140
120
100
6C

10 INDUSTRIAL STRATEGY PROJECT
The S.A. clothing industry has a large size structure by international standards. The statistics have shown a marked increase in industry concentration in terms of ownership and
production since the 1950s and between 1957—68 in particular. Table B 1 shows that between 1972—9, the proportion of companies accounting for 80% of clothing sales fell from about 1/3 to 1/7. This underestimates the degree of concentration, since it does not account for multiple ownership.
Table B2 compares the South African Clothing industry to the countries with the highest (the U.K.) and one of the lowest (Belgium) employment concentrations in Europe. Concentration in the South African case is much higher than in any country in Europe. Even this finding may be understated since Table B2 compares European finns to South African plants. In 1982, the U.K. had an average of 35 employees per plant and 38 per firm (Zeitlin and Totterdill l989).1 By contrast, in 1979, the S.A. Clothing industry had an average of 87
employees per plant and 88 per firm (Census of Manufacturing 1979).
Table B3 presents proportionate changes in employment and output between 1961 and 1985.
It is clear that only large size plants maintained or increased their share of total employment and output. Particularly between 1961—70, the smaller size classes experienced a
proportionate decline. This concentration in production is even more evident in the bantustans.
Since the minimum efficient scale in clothing is quite low, there are few advantages to
operating a factory with more than 100—150 workers. It is possible that some of the cost
disadvantages described in section B.2.3. are the result of excessive overheads.
'The U.K. Clothing industry underwent some restructuring in the 1980s. The industry had been extremely concentrated before this time. In the 1970s, it experienced some decline, resulting in the closure of many medium sized enterprises and lay-offs in the larger firms. In the 1980s there was some decentralisation and market refocusing (Zeitlin and Totterdill).
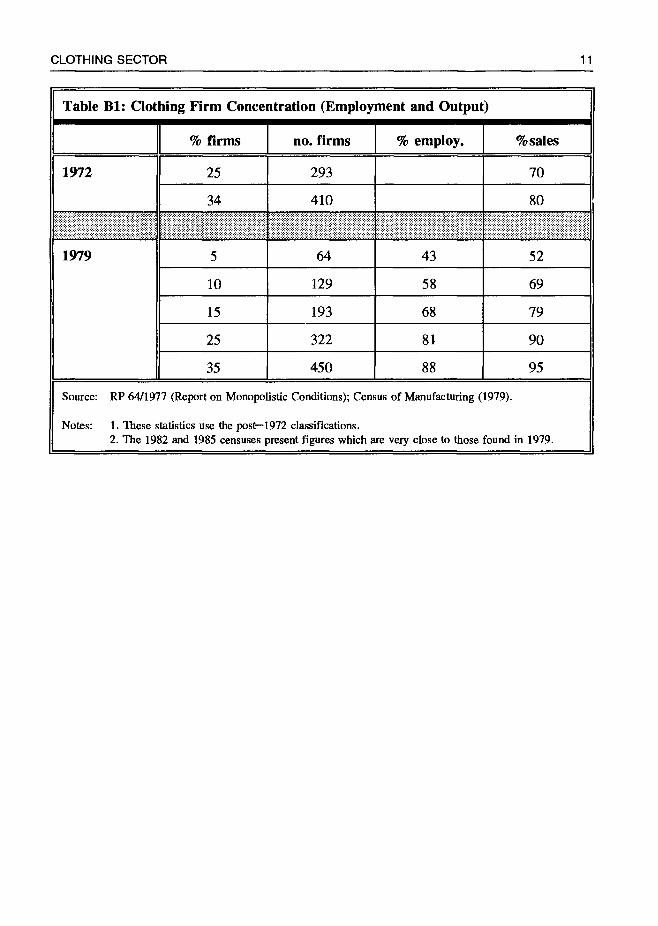
CLOTHING SECTOR 11
Table B!: Clothing Firm Concentration (Employment and Output)
% firms no. firms % employ. %sales
293
34 410 80
10 129 58 69
15 193 68 79
25 322 81 90
35 450 88 95
Source: RP 64/1977 (Report on Monopolistic Conditions); Census of Manufacturing (1979).
Notes: 1. These statistics use the post—1972 classifications. 2. The 1982 and 1985 censuses present figures which are very close to those found in 1979.
1972 25 70
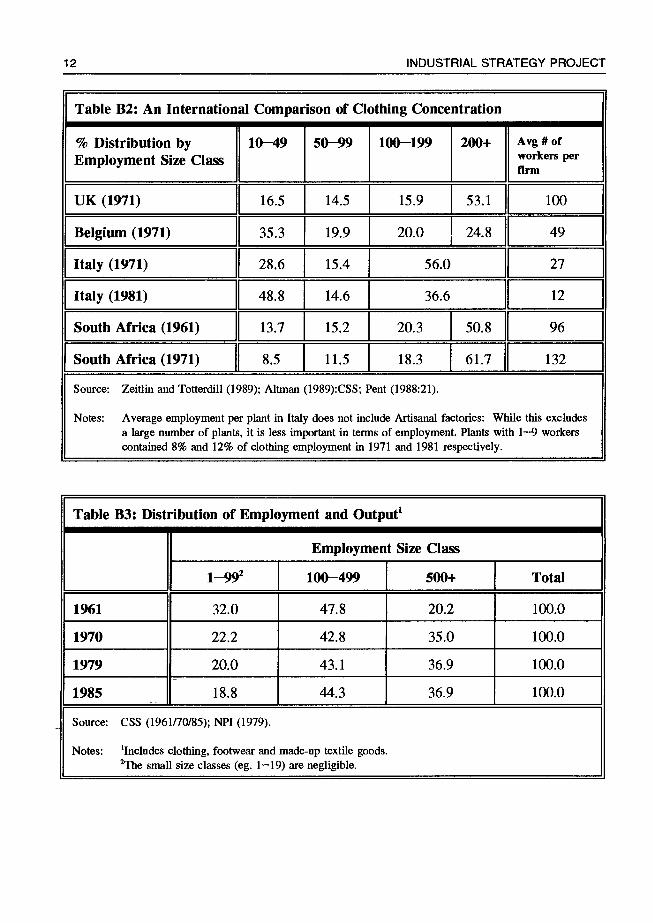
12 INDUSTRIAL STRATEGY PROJECT
Table B2: An International Comparison of Clothing Concentration
% Distribution by Employment Size Class
10-49 50—99 100-199 200+ Avg # of workers ier firm
UK (1971) 16.5 14.5 15.9 J
53.1 100 }
Belgium (1971) 35.3 19.9 20.0 24.8 49
Italy (1971) 28.6 15.4 56.0 27
Italy (1981) 48.8 14.6 36.6 12
South Africa (1961) 13.7 15.2 20.3 50.8 96
South Africa (1971) 8.5 11.5 18.3 61.7 132
Source: Zeitlin and Totterdill (1989); Altman (1989):CSS; Pent (1988:21).
Notes: Average employment per plant in Italy does not include Artisanal factories: While this excludes a large number of plants, it is less important in terms of employment. Plants with 1—9 workers contained 8% and 12% of clothing employment in 1971 and 1981 respectively.
Table B3: Distribution of Employment and Output1
Employment Size Class
1—99 100—499 500+ Total
1961 32.0 47.8 20.2 100.0
1970 22.2 42.8 35.0 100.0
1979 20.0 43.1 36.9 100.0
1985 18.8 44.3 36.9 100.0
Source: CSS-(1961170185); NPI (1979).
Notes: 'Includes clothing, footwear and made-up textile goods. 2The small size classes (eg. 1—19) are negligible.

CLOTHING SECTOR 13
B.1 .3. Retail Structure
The structure of retailing has a significant impact on industrial organisation and bargaining power through the pipeline. In some countries, such as the UK, large multiple retailers dominate sourcing, design and product branding. Some countries, such as Germany, have a relatively fragmented distributive sector: In this case, manufacturers control design and brand names and therefore wield greater market power. Moreover, menswear is more often sold through small independent retailers than is ladies' wear.
Trends in the Concentration of S.A. Retail SaJes
In S.A., the multiple retailers wield substantial control in the clothing industry. The statistics show that the major chains increasingly dominate clothing retail distribution. Table B4 shows that in 1991, the top 5 chains accounted for 58% of clothing retail sales. If the 9 next largest department stores are added, these 14 firms account for 67% of clothing sales. This compares to 54% and 63% respectively in 1990. If a large mailorder company (Mashold) is added, the clothing sales governed by the multiple retailers is pushed above the 70% mark.
The extent to which clothing producers sell to independent or multiple retail stores varies by region. Table B5 shows that the Cape clothing firms are much more reliant on the large chains for business. In the past few years, many Cape firms have consciously decided to drop their independent customers as a result of high transaction costs. Of the Cape firms interviewed 64% sell more than 80% of their output to the chains. In Natal, there is a stronger relationship with independent retailers. In this case, only 29% of firms interviewed sell more than 80% of their output to chains. In fact, 13% do not even deal with the chains at all. The variation by region is probably related to cultural differences: The Natal firms interviewed were more focused on alternative marketing possibilities. Cape firms are more concerned with improvements on the production floor and seem to put less emphasis on marketing.

14 INDUSTRIAL STRATEGY PROJECT
Table B4: Distribution of Clothing Retail Sales
1990 1991 1992
Edgars 16% 22% 22%
Wooltru 12% 13% 13%
Pepkor 13% 9% 11%
Foschini 7% 9% 8%
OK 6% 5% 4%
Dept Stores 9% 9% 11%
Other 37% 33% 31%
Total 100% 100% 100%
Total Sales (Rmn) 9435 10860 12650
Real Total Sales (Index: 1990 = 100)
100 103 109
Real CTF Wholesale Sales (Index: 1990 = 100)
100 115 114
Source: NCF Diaiy (1991/2/3:265/7): Total retail sales is based on CSS data. Wholesale data is provided by the CSS and is not available on a disaggregated basis.
Notes: 1. "Other" primarily refers to independent retailers. It also includes maiorder houses and factory shops. 2. "CTF" refers to Clothing, Textiles and Footwear.

CLOTHING SECTOR 15
Table B5: Percent of Output Sold to Chain Stores
None <10 10—49 50—79 80+ Total
#tirms Natal
%firms
3 0 6 8 7 24
13 0 25 33 29 100
#firms Cape
%firms
I 1 2 5 16 25
4 4 8 20 64 100
Source: Interviews (Cape and Natal, 1991).
Manufacturers' output not destined for chains is sold to independent stores, wholesalers, factory shops, as subcontracting jobs for other producers and for export. Exports form a very small, albeit increasing, proportion of total sales. At least 5 firms that exported between 10—30% of output were found in both Durban and Cape Town. The products varied widely, from up-market men's suits to low priced children's wear.
The concentration of power at the end of the pipeline gives multiple retailers substantial negotiating power in determining prices to the manufacturer, delivery specifications and payment periods. Where producers deal with independents, the profit margin for the manufacturer is higher, since the producer can determine prices within certain limits. In this case, profits are more evenly spread through the pipeline. Despite higher producer mark-ups associated with independent retailers, cost disadvantages can include additional paperwork, uncertain payment, higher levels of stock and a greater number of fashion ranges.
The reliance on a few customers is dangerous. On the one hand, the chain may choose to dump the particular producer, while the firm has not maintained the flexibility to cope with this situation. On the other hand, the current experience in Canada and the USA shows that bankruptcy of large retailers results in a domino effect into manufacturing since there is some lag time between delivery and payment (Yalnizyan 1991). The more successful
producers overseas are those that have a relatively diversified customer base.
The extent to which the statistics accurately reflect retail concentration may be questioned. In particular, the deregulation of hawking and the recession have encouraged alternative forms of distribution. Although statistical evidence is not available, a tour through the central metropolitan areas clearly exhibit growth in informal trading and wholesaling. These distributors sell ex-factory clothing, imported used clothing and, to a lesser extent, goods produced by informal businesses. There are a growing number of businesses in the Durban area that specifically target hawker-wholesaler outlets. The growth in imported worn clothing is one indication that alternative means of distribution are expanding. For example, in

16 INDUSTRIAL STRATEGY PROJECT
volume terms these imports increased by 64.5% between 1989—90. With a mark-up, it is probable that sales of worn clothing are comparable to a small chain such as Milady's (R 1 25rrm turnover) although the volumes of used clothing would be higher.
Section B.!. considered three aspects of industrial structure including that related to employment, firm concentration and distribution. The central findings were the following:
Employment
kmpk)yment cc'nsistently rose until the I 970s: thereafter. it Iluctuated dramatically. Since 1989. the industry has been on its longest downswing ever.
'I he fall in l( clothing etnph iy inent cannot be primarily :ittrihii ted to import perletrzition. ('h:tnges in hits wr use are most significantly related to labour productivity growth.
By contra.st. the fall in S.A. clothing employment cannot be attributed to labour productivity which has
stagnated since at least 1976. Job loss is due to the massive tT0Wth in import volume penetration: I xport expansion has not compensated for the displacement in local markets.
Structure of Ownership and Production
The notion that clothing is a highly fragmented industry primarity holds at (he production level. In terms
of ownership. even the Itaiian industry is concentrated. For example. S firms account for 25 of Italian menswear turnover. I lence. an analysis f the cIt tli ing industi retjli lies a cc insidcrat ion of the locus of power, located in ownership, and not in the small. fragmented production units. In fact, it is these large firms that may he important customers for the S.A. industry in its efforts to export.
The S.A. industry is more concentrated in Lenns of production and ownership than any other clothing industry considered. In terms of ownership. this may be useful 6r the espansion of export and technological
adoption. However, there are few scale economics in clothing: In fact, it is possible that the large si/c structure impoSes unnecessary inefficiencies as a rcsLilt of high overheads. Firms may gain from disintegrating and operating as completely separate cost centres.

CLOTHING SECTOR 17
Structure of Distribution
The highly concentrated retail sector could have beneficial effects on the indttstiy if their approach were
more developmeiifah HoWever, at present, the retail, sector is maInly squeezing the clothing producers3 resulting m a poor distribution of profits through the pipeline
The degree of dependence on the large retailer.is worrying. In particular, firms that have...a high
dependence lose market control and in the event of retailer bankruptcy suffer from an mevitable domino
effect. This dependence varies by.region: Maiy Cape finns have adopted a ecific policy to focus on
multiple retailers The finns interviewed in Natal have a broader customer base including multiples and
independent distributors

B.2. The Intensification of Competitive Pressures
The competitive pressures in the global clothing industry have been intensifying with international recession, the entry of DCs into the competitive fray and growing market segmentation. Within the current context, S.A. could not successfully compete since its productivity is extremely low. While labour costs are competitive, the cost per standard minute and, more significantly, throughput times dramatically reduce any incentive to source clothing in S.A.
B.2.1. International Trade
The growing integration of international markets since WWII has intensified global competition in the clothing industry. In particular, the balance of trade between industrialised countries (ICs) and developing countries (DCs) in textile and apparel products has altered dramatically.2 "Both" sets of countries have been adapting to these changes. While the DCs have been struggling to develop through the technological and product ladder, the ICs have had to adjust to enhanced competition in the low skill, low value-added sub-sectors in particular.
In the 1960s and 1970s, the international trade in clothing and textiles grew faster than that for manufactures in general. Between 1963—79, global exports of clothing and textiles expanded approximately 120% faster than production (Altman 1993:194—6, De la Torre 1984:33). The direction of export flows have clearly shifted: Table B6 demonstrates that the significance of developing countries has risen substantially. From a small contribution to total exports in 1955, developing countries increased their share in world exports to 44% in 1988. This growth contrasts with a sharp drop in the share of IC exports from 66% to 40% over the same period. The industrialised countries have primarily lost market share in the developing countries, although their position in IC markets has also been eroding since the 1970s. Since very little intra-DC trade occurs in clothing, it appears that DC clothing output is sold in respective domestic markets and in IC markets.
Table B7 shows that this growth in DC clothing exports relies on four main exporters: Hong Kong, China, South Korea and Taiwan account for at least 90% of DC clothing exports (Silberston 1989:17).
These trends have had an impact on global shares of production and employment. Between 1963—80, the global share of industrialised country clothing employment and production fell by 10% and 18% respectively. While developing countries barely increased their share of total production, they raised their share of employment by 8.3% (De la Torre 1984:45).
2This paper refers to ICs as essentially encompassing OECD countries including Japan. DCs includes industrialising countries, including the East Asian NICs and excluding the former 'eastern bloc' countries.

CLOTHING SECTOR 19
Table B6: Major Export Flows of Clothing
1955 1963 1970 1979 1988*
Total Trade (Current USA $bn)
II 0.8 2.2 6.2 34.9 89.5
Proportion of World Exports (%)
ICtoIC 46 53 55 44 37
ICtoDC 20 12 6 5 3
DCtoIC 5 10 18 31 40
DCtoDC 5 4 3 4
ETA to ETA 18 16 10 7 4
World 100 100 100 100 100
Source: De la Torre 1984:35; (*) NCF Diary 1992:182.
Notes: 1. Includes SIIC 84. 2. Regions are defined as: IC (Industrialised Country) includes all OECD member countries
(except Australia & NZ); "ETA" refers to the Eastern trading area, including all former centrally planned economies (except Yugoslavia); DC (Developing Country) refers to ail other countries
(except South Africa). World totals include the previous exempted countries.

20 INDUSTRIAL STRATEGY PROJECT
Table B7: Major World Clothing Importers & Exporters (1990)"
Importers iob Imports Exporters''
27.9 EC
%Glob:l
EC 13.9
USA 27.8 Hong Kong" 9.8 (16.2)
Japan 8.3 China 7.7
Hong Kong a 7.1
(0.7) S.Koreac 6.8
Switzerland 3.6 Taiwan 6.7e
Sweden 2.6 Thailandc 3.4
Australia 2.5 Turkey 3.0
Canada 2.4 USA 2.5
Indonesia 1.8
Source: "Demand, Production and Trade in Textiles and Clothing", GATT, Nov 1991, p.7, 10.
Notes: 0lncludes imports for re-export. If re-exports subtracted from total imports, retained imports totalled $0.67bn. bDomesUc exports. Re-exports totalled $5.66bn. Percentage in brackets includes re-exports. C1989
1Excluding intra-EC trade, 1990 world trade in clothing amounted to USA $ 88.9bn. In 1988, this
figure was $70.7bn 01987 (Levy(1991)).
Table B8: Significance of S.A. in World Apparel Trade (1992/3)
S.A. Imports S.A. Exports (% of Global Imports) (% of Global Exports)
0.09 I 0.11
Note: These figures are calculated on the assumption that world imports and exports grew by 10%, the average yeariy nominal growth between 1980—90.

CLOTHING SECTOR 21
It is often implicitly assumed that the massive insertion of DCs into export markets occurred autonomously. Is growing import competition really from DCs per se? Or is this competition actually between IC finns pursuing labour cost reductions?3 In fact, much of DC entry resulted from the investment decisions of IC clothing finns. The introduction of "orderly marketing agreements" (the Multi-Fibre Arrangement) based on quotas has unintentionally encouraged geographical volatility and undermined its protectionist framework since firms must relocate once quotas are filled.4 The centre of decision-making should be the focal point in the analysis. Within the emerging competitive environment, both ICs and DCs have adopted strategies to either sustain or develop their respective clothing industries. DC & IC responses must be considered together since firm decisions are dependent on the operational environment in its totality, encompassing known competition and the combination of opportunities available in both DCs and ICs.
Opportunities for DC clothing industry expansion were afforded by access to cheap loans, preferential access to large consumer markets and an enhanced interest by IC companies to produce in low cost regions. DC responses to the new opportunities available with enhanced world trade have included:
• Establishing an apparel-textile industry behind protectionist walls. • Encouraging foreign subcontracting • Establishing Free Trade Zones (VIZ) • Offering financial or fiscal incentives to attract foreign direct investment • Controlling labour to ensure a low wage bill and a "holiday" from unions
On the other hand, the ICs have had to create their opportunities in response to intense market pressure. There are a number of strategies that have been adopted by IC firms/industries to meet this new competition, including:
• Erecting high tariff and quota barriers • Adapting marketing to focus on niches and alternative forms of distribution • Modifying production processes and structures of organisation and management • Work (or wage) intensification
On a national level, it is interesting that the ICs, in attempting to save firms and employment, have put much emphasis on orderly marketing agreements and on protecting their domestic industries, particularly through systems of quotas. However, de la Tone
For example, Japanese firms began investing directly in Taiwanese and Thai textile and apparel plants from the early 1960s. Japan continued to expand its foreign direct investment into South Korea, Indonesia, Malaysia and the Philippines (De la Torre 1984:105).
4Although the initial intention of the MFA was to reduce trade barriers, effective protection in member
countries has actually increased albeit in the form of non-tariff barriers. See section C.3.1.
22 INDUSTRIAL STRATEGY PROJECT
(1984:71—3) and Cline (1987:96) show that net imports were not the major cause of falling employment in the OECD countries since exports were rising at least as rapidly as imports. Instead productivity improvements have been the main cause of employment loss.5
Clothing firms are forever seeking pools of cheap labour. Protectionism and orderly marketing agreements (MFA) have forced exporting companies to continuously relocate to locations that are not excessively targeted by quotas.6 This results in increased cost pressure for the protective countries as the prices of imported goods do not necessarily reflect the exporter's domestic factor costs (particularly when dumped).
B.2.2. Market Segmentation
Between 1963 to 1980 the weighted average of clothing expenditure as a proportion of total private consumption for 8 OECD countries fell by more than 2%. This fall was in the context of relatively stagnant consumer demand (de la Tone 1984:25). Although a zero- sum exercise, IC firms found that the maintenance or expansion of market penetration could only be achieved with enhanced product market segmentation. The growth of niche marketing has taken a life of its own and now forces firms to compete on the basis of frequent style changes. By creating demand for constant change and variety, clothing is transforming from a mature industry into one that is more vital. Enhanced telecommunications and information technology has resulted in a broader awareness of technological and organisational opportunities for all forms of flexibility (Rubery et al. 1987). Responses in production organisation to niche marketing varies with different regional and national regulatory environments.
These responses to the changing competitive environment have in themselves altered the operational climate. For example, the emergence of fine niche marketing has resulted in a situation where constant style change is a requirement for survival in relatively high value- added markets. This puts extreme pressure on the production process, where it is necessary to reduce lead times and production runs. On the basis of traditional production processes, it becomes extremely difficult for factories to meet this challenge. Generally, firms combine traditional and newer methods in responding to a changing operational environment that
requires constant style change. Examples of this strategy mix may include:
5see section B.1.1.
6See section C.3.1.
7The 8 countries include: Belgium, France, W.Germany. Italy, Netherlands, UK, USAA and Japan. Over this
period, private consumer expenditure grew by 1—2% per annum in Europe and by 4—8% in Japan and the USAA. These are the main markets for clothing.

CLOTHING SECTOR 23
• the internal reorganisation of the factory floor and inventory/ordering practices • the use of specialty subcontractors to handle the smaller orders • the development of well-defined markets to reduce style changes and lengthen their
production runs • the extension of style usage by changing fabrics
Much of the literature on industrial restructuring assumes that growing diversity of consumer demand necessarily results in an ongoing decline in the length of production runs. The significance of this assumption is twofold. First, it takes for granted that consumer incomes are rising and that consumer choice is primarily consumer driven. This does not account for the effect of distributor buying practices. Multiple retailers exert substantial influence on styles and fashion change. The length of production runs can be highly dependent on the buying practices and growth or decline of specific retailers. Moreover, the view of demographic change is very superficial. For example, in S.A. there seems to be an expansion of demand at the lower end of the market, where there are fewer style changes.
The findings from interviews with S.A. clothing producers do show a dramatic fall in the length of production runs from at least the 1970s to the early 1980s. In the 1980s, there has been a mixed experience: Changes in production runs are more closely associated with the marketing strategies of both producers and retailers.
The length of production run is highly dependent on the manufacturer's customer base. If the manufacturer is particularly reliant on certain distributors, then the length of production runs will depend on buying practices and relative growth of the distributor. The economic conditions also affect the length of production runs. For example, many manufacturers attribute smaller orders/style to the recession whereby retailers prefer to spread their risk over a larger number of styles. In some cases the total number of units may decline, as distributors may maintain purchases in value terms only.
If production runs continue to decline, it is possible that finns will subcontract the shorter orders. Most companies interviewed prefer not to take orders of less than 500 per style. Since the early 1980s, this minimum has declined from about 1000 per style. The significance of the length of a production run lies in the cost per unit: Depending on the firm's efficiency, a style change can require anywhere between one day to one week before
optimal productivity is achieved. Most manufacturers would prefer longer runs that do not require this drop in efficiency. If firms are forced below runs of 500, organisational change will be required. Section C.3.2. describes short-cycle manufacturing techniques that would enable the flexibility required.
B.2.3. Cost of Production in an International Context
Competitive pricing is crucial, even within the context of market segmentation. For example, a survey of EC, USA and Canadian retailers found that the dominant reason for sourcing

24 INDUSTRIAL STRATEGY PROJECT
overseas was price related. This study found that price is even important to sourcing decisions of designer and brand labelled goods (Harris & Heppell(1991)).
An analysis of cost structures requires a consideration of levels and changes in local prices, taking into account inflation and exchange rates. The relative cost of clothing production is affected by labour costs, material inputs, the cost of capital, organisational efficiency, subsidies, tariffs on imported goods and tariffs on exports into other markets.
Relative international costs are rapidly becoming an important issue for S.A. clothing, both in terms of export expansion and local market share. Export intensity has risen quite dramatically, although it still accounts for a small proportion of S.A. production. Import penetration in volume terms has risen by over 20% since 1989.
While wages have been rising over the past period of years, labour costs are still low relative to S.A.'s competitors, as presented in Table G7 and Figure 3. Table Gil shows that since 1975, real wages have doubled. However, Table D2 shows that since the rise was off a low initial base, workers are still earning less than subsistence incomes. S.A. has the lowest rate of social charges amongst a list of 24 DC and IC clothing industries analyzed by Kurt Salmon. In absolute terms, wage costs have not risen dramatically and should not constitute a competitive disadvantage unless firms try to compete against the very cheap countries such as China.
Figure 3 Comparative clothing production costs — 1990
bc
12C
lbXb 86-ISO bc
ILLtiiI
note: Hourly compensation includes wages and social costs.
8
I t'J
W.G.,vneiy Itiáy USA H Kcn9 'PogiTaw,' Twk.y fta
Cost per Std.Min. Hou,ty Compensation
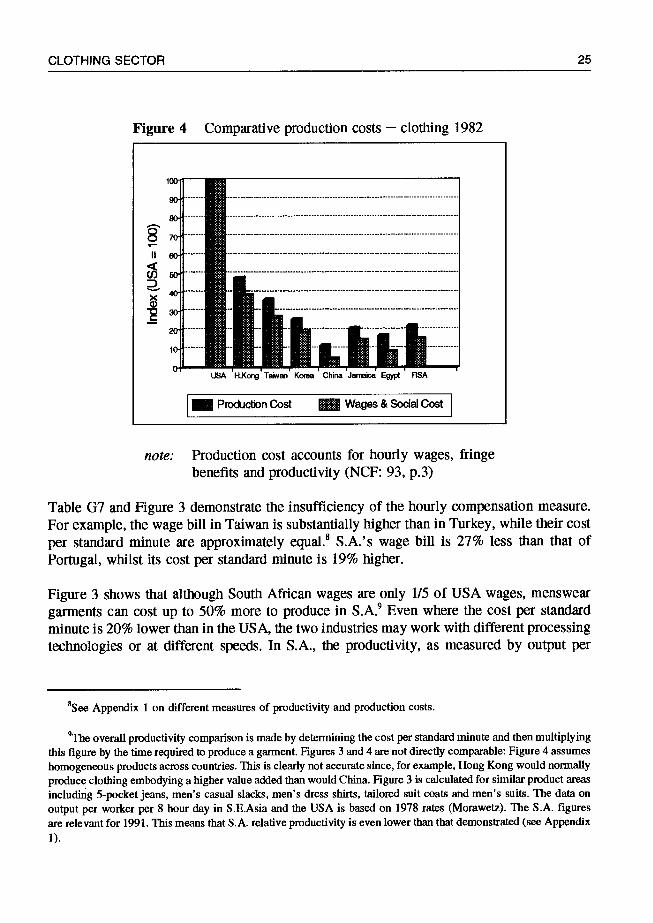
CLOTHING SECTOR 25
Figure 4 Comparative production costs — clothing 1982
iIIhti,n USA H.Kong Tatam Korea China Jannica Egypt ASA
note: Production cost accounts for hourly wages, fringe benefits and productivity (NCF: 93, p.3)
Table G7 and Figure 3 demonstrate the insufficiency of the hourly compensation measure. For example, the wage bill in Taiwan is substantially higher than in Turkey, while their cost
per standard minute are approximately equal.8 S.A.'s wage bill is 27% less than that of Portugal, whilst its cost per standard minute is 19% higher.
Figure 3 shows that although South African wages are only 1/5 of USA wages, menswear
garments can cost up to 50% more to produce in S.A.9 Even where the cost per standard minute is 20% lower than in the USA, the two industries may work with different processing technologies or at different speeds. In S.A., the productivity, as measured by output per
8See Appendix 1 on different measures of productivity and production costs.
9The overall productivity comparison is made by determining the cost per standard minute and then multiplying this figure by the time required to produce a garment. Figures 3 and 4 are not directly comparable: Figure 4 assumes
homogeneous products across countries. This is clearly not accurate since, for example, Hong Kong would normally produce clothing embodying a higher value added than would China. Figure 3 is calculated for similar product areas
including 5-pocket jeans, men's casual slacks, men's dress shirts, tailored suit coats and men's suits. The data on
output per worker per 8 hour thy in S.E.Asia and the USA is based on 1978 rates (Morawetz). The 5.A. figures are relevant for 1991. This means that S.A. relative productivity is even lower than that demonstrated (see Appendix I).
S
I
Prockxtion Cost Wages & Sodal Cost

26 INDUSTRIAL STRATEGY PROJECT
operator per day, can be 11—70% lower than the USA, depending on the particular product.1° Some producers will clearly try to meet this problem by reducing labour costs; This emphasis does not address the problem and offers only a short term solution at best.
Comparing international and regional productivity on the basis of labour costs is an enoneous basis upon which to make business decisions. In fact, many businesses have fallen
prey to the belief that depressed wages will necessarily result in lower overall costs. This has
certainly been the case for many firms in S.A. that decentralised within the country. There are essentially two, related reasons why a focus on labour cost is insufficient. First, labour
compensation accounts for only one aspect of total costs (15—25%) in clothing manufacture. It is important to consider other important factors that may add extras to the total bill: textiles and overheads. Second, while the wage bill may be low, productivity may also be quite low, sometimes erasing any expected benefits. For example, in rural areas where workers are not yet imbued with a factory mentality, there may be a high turnover and absenteeism rate. This can add substantially to costs.
Aside from wage costs, there are many other factors that influence the decision to locate production, including: incentives on inputs, the extent and militancy of unionisation; involvement in special export agreements & market access; and other location incentives.
Section B.2. examined the intensification of international competition, considering patterns of trade, market segmentation and international costs. The central findings included:
Intensified International Trade
The international division of labour and trade flows in clothing have altered particLilarly since the I %Os.
The international trade in clothing expanded dramatically: Simultaneously. developing countries increased
their share of world exports from lO' in l9.5 to .14% in I98.
The gno,th in 1X clothing exports is catised 1w two lactors: Clothing production is often the first industry to be developed in a non—industrialised country. C )n the other hand. IC firms seek low cost locations to
assemble garments. maintaining the high skill intensive aspects of production centrally. ftc Multi fibre
A rrangemnen I then cncc nirages l( IIrms to ci in Lirtual Iv reli icate pri 'ductu 'n Ii DC 's that have u nfl lied quotas.
'°Data on standard minute ratings were gained from a range of S.A. factories, not all of which produce men's wear. The output per worker per day was obtained in interviews with S.A. menswear producers and cover the
specific products considered.

CLOTHING SECTOR 27
Market Segmentation
Clothing ezpenditureas a proportion of private consumption has been falling since the mid-l7Os Apparel firms have sought to increase their penetration of smaller markets by differentiating their product The expansion of niche marketing has created a requirement for greater production flexibility and creative
marketing
Cost of Production
Even in the age of niche marketing price continues to be an important consideration for overseas buyers
S A is a relatively high cost producer The productive efficiency is so low that in terms of price there is little benefIt for a European buyer to source in S A.
The high cost of production is not related to the cost of labour The dramatic nse in wages was off a small base Wages are still below subsistence and are low relative to other middle income countries In addition the social charges are lower than found m aily countiy analyzed
This is not a completely dire picture The productivity problem could be easily rectified if the industry adopted fundamental productivity unprovements These improvements woukl focus on factory orgamsation pipeline efficiency and human resource development as described in section B 3 2

B.3. In Pursuit of Static or Dynamic Strategies?
In an industry as fluid and intensely competitive as clothing, firms must be able to respond to rapid changes in opportunities, pressures and constraints in the markets for their inputs and products. The interviews done for this study have found that most clothing companies are profit satisficing: Firms merely seek to earn some base profit required to stay in business. Firms in this industry are not maximisers in terms of either profit or market domination. This characteristic is manifest in the consistently low profit rates: For example, the surplus (after tax) on sales is only 3%. This compares unfavourably with the average manufacturing ratio of 10%, where only four industries experienced lower profit margins. Moreover, the return on investment was only 5.5% in 1985, as compared with 8.3% for all of manufacturing (NCF Diary 1993:176: NPI Productivity Focus 1988).
These tend to be second-generation businesses, managed by the sons of immigrant tailors or importers. The current owner-managers tend to operate by rule of thumb and are not imbued in new management and production techniques. Firms adapt to a changing environment by choosing organisational options that require the least effort and highest short-term gain.
Table B9 gives an indication of management behaviour by ownership type. Over 1/3 of firms in the sample were established by the current owner's father: Almost none of these inherited firms have substantially altered their product since inception. On the other hand, the firms that were purchased or were established by the current owner displayed stronger tendencies to adapt product lines to market shifts.
Table B9: Product Adaptation and Source of Ownership
Source of Ownership:
Product Same as When Firm Established? (% of sample)
Same Changed No. of Firms
Inherited from parent 93% 7% 15
Buy-out 25% 75% 12
Established by current owner 35% 65% 17
Total 52% 48% 44
Source: Interviews 1991.
Notes: Product change may entail a complete shift in pmduct (eg. shifting fmm children's to ladies' outerwear), adding additional areas to the product mix or rationalising ranges.

CLOTHING SECTOR 29
Ultimately, clothing firms must be as flexible as possible to a changing environment. Business strategy to maintain or enhance profitability that offer only superficial adaptations may allow a firm to survive in the short run, but do not offer the flexibility needed for long run competitiveness. Only fundamental productivity improvements offer the required flexibility to rapidly changing factor and product market conditions.
Atkinson (1987) introduces some useful guidelines in the analysis of firm behaviour and
flexibility. He points to static and dynamic strategies:
dynamic aspects of flexibility. . mean changes to institutional, cultural and other social or economic
regulations and practices which permanently increase the capacity to respond to change;.. . the static aspects mean one-off accommodations to particular pressures, which leave one no better placed to respond to
further pressures (Atkinson(l987:88).
Static strategies are most typically found in clothing when firms focus their efforts on
achieving labour cost reductions. Firms responding to new market pressures by enhancing labour cost flexibility have tended to adopt other production or marketing related changes that increase their functional rigidity. There has traditionally been a perception of labour as the prime variable in the profit enhancing exercise. The labour input has historically been an important cost component and the easiest factor to vary. There is now greater awareness of alternative and more effective avenues to productivity enhancement. Firms adopting these new alternatives emphasize operational flexibility or dynamic strategies to enhance their
long-run competitive advantage.
Three main labour-use strategies may be identified, emphasizing numerical, financial or functional flexibility (Rubery et al. 1987):
Numerical flexibility refers to the adjustment of employment according to cyclical or structural changes in demand. In the global clothing industry this may be achieved through casualisation, subcontracting, the deregulation of employment contracts or the avoidance of redundancy payments.
Financial flexibility refers to the pursuit for control over the process of Wage and benefits determination. This may be acquired through the use of piece rates, productivity bonuses,
subcontracting to sweatshops and excessive use of trainees, illegal immigrants or juvenile labour. It is common for clothing firms to successively replace labour pools with weaker
bargaining power.
A firm that automates without organisational change focuses on numerical and/or financial labour flexibility. Speeding up an operation through automation can reduce the labour
component and often entails operational de-skilling allowing workers at lower grades, such as trainees, to adequately perform the task.

30 INDUSTRIAL STRATEGY PROJECT
An emphasis on numerical or financial flexibility in labour use is a static, short term approach: In the context of a medium or high cost country, this emphasis counters the improvements in quality, lead times and shopfloor efficiency required for a shift into higher value-added products.
Functional flexibility can refer to multi-skilling and/or multi-tasking. In manufacturing, functional flexibility is often considered incompatible with numerical and financial flexibility. To acquire functional flexibility, a firm must be committed to training and reducing labour turnover. However, "sufficient" functional flexibility may be gained for clothing if a core group of workers is trained.
Functional flexibility is an integral component to the achievement of operational flexibility. However, in isolation, it is typed with the "static" strategies. Many clothing firms develop some functional flexibility amongst their workIorce to address absenteeism. Their goals and achievements are limited.
Table BlO: Strategic Forms
Strategy in: Dynamic Static
Labour-use Functional Numerical
Financial
Organisation Technological change with organisational change
Automation
Organisational change Geographic or organisational decentralisation
Distribution Quick Response: forging partnerships
Focus on scale economies in transport, communications
While implementing static aspects of flexibility can assist firms in the short term, such one- time adaptations do not offer the kind of inherent dynamic flexibility required to survive in an industry that is inherently unstable and constantly changing.
Production experience regularly observes a "40, 40, 20" rule. Roughly 40 per cent of any manufacturing base of competition derives from long-tenn changes in manufacturing structure (decisions, for example, concerning the number, size, location and capacity of facilities) and basic approaches in materials and workforce management. Another 40 per cent comes from major changes in equipment and process technology. The final 20 per cent-no more- rests on conventional approaches to productivity improvement (Skinner 1986:56).
Essentially, Skinner notes that traditional means of improving productivity, through automation for example, are the least effective at gaining a competitive edge. On the other
CLOTHING SECTOR 31
hand, firms that are the first to adopt new technologies can gain a static advantage of 40% on competitors. This lead is not dynamic and can be sustained oniy for a short period until other firms follow. More significantly, changes in the management of people and materials affords the most effective and dynamic edge.
The enhancement of operational flexibility can offer significant gains in the ability to respond to rapid changes in product and factor markets. Operational flexibility refers to a situation where firms adopt appropriate "lean manufacturing" techniques that attend to dynamic improvements throughout the factory and within the pipeline.
The following sections compare static and dynamic aspects of business strategy in more detail: Section B. 3.1. discusses the typical pursuit of static strategies internationally. The particular historical way that S.A. clothing firms have sought labour cost flexibility is presented. Section B.3.2. considers alternative organisational forms that render dynamic competitive advantage. In the evolving operational environment, the adoption of these organisational forms will become necessary to the survival of the S.A. clothing industry.
B..31. Static Organisational Strategies: The Old Style
The global clothing industry's efforts to maintain or enhance profitability have commonly focused on static strategies. A focus on labour cost has resulted in an emphasis on numerical and financial labour flexibility. The most common strategies for pursuing labour cost reductions include geographical decentralisation to lower wage, less regulated locations and organisational decentralisation to lower wage firms. These strategies have resulted in a significant demise in formal clothing employment opportunities in OECD countries.
It is commonly suggested that middle and higher income countries focus on higher value- added pioducts: To successfully compete in export markets, countries with high input costs need to move up the product and skill ladder. Unable to compete on price alone, it becomes necessary to compete on the basis of quality or style as well. This advice assumes that countries successfully selling higher value-added products have produced those goods domestically by a higher skilled workforce. However, the experience in industries having raised the value-added shows that strategies to maintain competitiveness and profitability have had a negative impact on employment opportunities and conditions of work. It is necessary to distinguish between a production- and a market-related definition of value- added. The market-related definition refers to the surplus earned per unit. The concentration on higher value added markets (higher income consumers) diverts attention from price to
quality and fashion. Alternatively, a production-related definition focuses on the amount of value added which is actually produced in the factory. This is a significant distinction since
many developed countries are expanding their clothing exports without employing workers
locally.

32 INDUSTRIAL STRATEGY PROJECT
Even where workers are in registered factories, unions tend to be weak. This may be attributed to two factors: On the one hand, it is extremely difficult to organise in predominantly small clothing factories. The fragmentation of the clothing industry is exemplified by the predominance of small firms, where, at an extreme, 43% of all Italian workers (1979) were found in plants with less than 20 employees (Burns and Dewhurst 1986). On the other hand, the workers tend to be female with low skill levels who are often averse to "causing trouble" for fear of job loss or reprisal (Mitter 1986.)"
There is some indirect evidence to show the significant degree to which producers are decentralising production. Downward trends in OECD employment appear unrelated to trends in either production or exports. Labour productivity in the OECD clothing industries rose substantially between 1963—86. Clothing is one of the few industries that did not much benefit from the rapid technological change occurring in most of manufacturing.12 It is unlikely that the negative relationship between employment and output growth is related to technological change or the introduction of flexible factory organisation (in the "post-fordist" sense) since the diffusion of these changes has been weak in the clothing industry (Whitaker et al. 1989, Statistics 1989). In any case, technological change has a different impact on clothing, primarily affecting pre-production where a small proportion of total workers are employed. Although it has been shown that the fall in OECD clothing employment is primarily the result of labour productivity improvements (de Ia Torre 1984:72, Clime 1987), it may be that these improvements are of a purely statistical nature, reflecting lower rates of formal registration of workers. The statistics do not record the displacement of formal factory workers by informal workers and workers in foreign CMT plants.
Hence, the companies are successfully expanding markets in higher value-added products (by market definition) but are not necessarily expanding value added in their local factories (by production definition). A high value added strategy does not preclude the pursuit of static strategies. This raises important employment-related policy questions regarding the regulatory environment that are addressed in section D.2.
Italian clothing union officials say that many employers circumvent labour regulations. For example, some employers require new workers to sign blank sheets or forms attesting that they received full minimum wages, when less was actually paid.
'2For example, the combined ratio of employment growth to output growth for S.A. clothing and textiles fell from 0.71 (1961—70) to 0.41 (1970—79) (Altman 1989). McCarthy (1988:12) shows that this ratio for clothing alone (1970—82) was 0.76. This means that major labour productivity improvements were made in the textile industry, while productivity in clothing remained stagnant.(An elasticity of 0.76 means that for every 100% increase in output, employment rises by 76%).

CLOTHING SECTOR 33
Numerical and Financial Labour Flexibility
The clothing industry is very "footloose" with a low capital intensity and a potentially low skill requirement. Broad stages of production, and functions within these stages, can be separated into discrete parts. Therefore, location and organisational decisions are based on market location, communication links, relative incentives, degrees of labour militancy, relative factor costs and management capability or willingness to effectively supervise over geographical distances.
Firms axe increasingly adopting a hierarchy of plants, with centralised high-skill activities and less skill-intensive assembly in decentralised areas both domestically and overseas. This type of formation has been spreading since at least the l970s in the more successful American, European and Japanese firms. Particularly where long distances are involved, a firm will subcontract the low value-added garments, requiring less skill and longer runs. However, some up-market goods such as designer jeans can be largely produced in DCs, returned to the centre for embroidery and labelling. The trend in international processing is now towards sub-regions, where Europe processes in North Africa & Southern Europe, North America processes in Mexico and Japan processes in the Asian NICs.
It is also possible for ICs to make use of their immigrant population as a pooi of informal labour. For example, there has been evidence of an expanding informal sector in the UK, the USA, Canada and Australia. In Australia, informal outworking has expanded from about 10,000 workers in 1980 to over 60,000 by 1987.13 Swasti Mitter (1986) has examined the rise in the use of Cypriot, Asian and Bengali homeworkers by London High Street retailers in the UK. Mitter notes that:
in the inner city areas of London, a substantial number of jobs are being transferred from the factories and
sweatshops to homeworkers. . . (For example) in a community where more than 20,000 Cypriot women are
employed in the clothing industry, the ratio of homeworkers to factory workers. . . has shifted from 40% of the total workers in 1979 to 60% today (in 1984).
Sweatshops in the West Midlands are providing at least 100,000 units per week to London retailers (Mitter 1986). Mitter estimates that approximately 13,100 clothing workers shifted between factory to sweatshop or homework between 1979 and l983.' In a survey done in 1982, it was found that Asian homeworkers in Leicester were earning an average of 90p per hour, and as low as 23p/hour (Ri .15), for an average 48 hour week (varying between 15—90
hours/week) (Mitter 1986). Miller postulates that improvements in labour productivity in the
131n 1987, registered clothing factory employment was 75,200 (Scott 1987: 46, Peck 1990:35, Peck 1992).
14Total formal employment in the UK clothing industry in 1983 was 77,900. Hence, the shift to informal work
represented 14% in only 4 years. The figure of 13,100 is the addition to (and not the total number working in) the
sweat-shop/homeworking sector.

34 INDUSTRIAL STRATEGY PROJECT
UK have been derived, not from changing technology and organisational systems, but rather from the intensification of work.
In the USA, firms shift production to the southern right-to-work states, where unionisation levels are 1/4 to 1/2 lower than in the north. In addition, firms have easy access to vulnerable "illegal aliens" in the informal economy (ILO 1987:96).
Italian finns such as Benneton make liberal use of low wage labour globally. It is the perfect example of the way static and dynamic strategies may be mixed: High technology communication is used in conjunction with a spread of small low wage subcontractors throughout the world (Belussi 1991, Pent 1988).
Automation in Isolation
Much attention has been devoted to mechanisation and automation in the clothing industry. The extent of this emphasis is strange in light of the finding that 80% of operator time is devoted to handling (ILO 1987:43, Disher 1987:58). Handling essentially refers to time spent on organising parts, rewinding bobbins, changing threads and completing work records. Automation can offer one-off improvements to throughput times where the machinery reduces the handling time, not simply the speed of the specific operation. Ultimately, it is improved floor management that reduces throughput times.
The diffusion of new technologies in the clothing industry tends to be slow (Whitaker, StatsCan). The greatest change has occurred in information and pre-production technologies. For example, a 1988 survey of UK clothing firms found that 40% had adopted CAD systems, with 25% intending to invest in this equipment by 1990. However, only 6% used design technology; This equipment was mainly used for grading and marking (Whitaker 1988). The factory visits for this study in South Africa and Europe between 1990—1992 did not find a single firm using design technology. Further down the production process, the other technologies that have generated interest include automated laying and cutting. However, these have not diffused very quickly; the same UK survey found only 12% of firms with automatic knife cutting, and only 20% considering related investment by 1990. The pre-production equipment seems to be more popular for the clothing subsectors involved in producing high volume and low-medium style changes. In particular, the most investment in any form of technology was undertaken by men's and boys tailored outerwear producers.
The introduction of CAD, particularly in conjunction with computerised cutting can offer substantial static gains. On its own, CAD may contribute to the reduction in overall material costs by 4—6% and a 50—70% reduction in grading/marking labour costs. In combination with a cutter, savings recorded include a 50% reduction in total lead times and a 4—10%
saving on sewing time as a result of improved cutting accuracy (Hoffman and Rush 1988). Of course, while CAD systems become more affordable, computerised cutting is still beyond the investment potential of most clothing manufacturers.

CLOTHING SECTOR 35
Firms are even slower to invest in advanced assembly equipment. The most common microprocessor-controlled machinery includes 1 &2 needle general sewing machines (operator programmable), pocket setters (pre-programmed convertible) and button holers or pocket welters (pre-programmed dedicated). Again, most investment is undertaken by firms defined by high volumes and few style changes. The benefits to automated sewing include reduced
inegularities, the faster execution of operations and improved quality. In addition, handling time may be reduced where the job is deskilled: In some cases, the operator simply feeds the fabric and then aligns subsequent parts while the machine performs the function (Disher 1987). Productivity improvements associated with the introduction of automated assembly equipment range from 100% to 800% (Disher 1987). While these improvements may seem dramatic, they apply to few operations, amounting to small contributions to overall cost structure. To gain full advantage of operation acceleration, it is necessary to implement organisational change so that the result is not simply uneven piles of work-in-progress around the production floor. In addition, the introduction of pre-programmed equipment tends to introduce considerable mental stress for the machinist when forced into pre- determined operation cycles (Gebbert 1992).
Overhead conveyer systems that transport parts between stations have not diffused widely: Their main benefit includes a reduction in final pressing. The other benefits normally attributed to overhead transport systems are simply those offered by the introduction of unit production systems. In fact, many S.A. manufacturers that have invested in these systems are now scrapping them.
The most common form of information and communication technology programmes are those that assist with payrolls, managing orders, production planning and workplace design (Gebbert 1992, Whitaker 1988). EDI (Electronic Data Interchange) and Direct Data Interchange between producers and retailers is still uncommon. Retailers are accumulating electronic point of sale information: However, it is still feasible to provide information quickly to manufacturers without expensive equipment. As with other technologies, communication technology can only contribute to substantial improvements where lead times are reduced with organisational change and the full use of CAD systems.
Static Strategies in South Africa
Historically, S.A. clothing firms have sought to maintain profitability by pursuing static strategies that focus on reducing labour costs. The S.A. clothing industry has been conservative in its approach to profitability: Firms seek to survive and do not set their sights on growth or expansion of market share. Hence, the survival strategies have primarily focused on static gains offered by age, racial and geographical displacement.
The essential strategies of S.A. clothing firms have been similar to overseas: to maintain or enhance profitability by emphasizing labour cost flexibility. Yet, the opportunities and constraints faced by S.A. firms have influenced the specific routes taken. The typical

36 INDUSTRIAL STRATEGY PROJECT
international strategies of informalising and subcontracting to foreign plants have not yet been pursued by S.A. firms since other, easier options were available. In addition, the extent of labour regulation in industrial council areas has meant that some options for pursuing wage flexibility have been less attractive. Since alternative options were available, finns avoided the difficulty of circumventing or lobbying against particular IC rules. Hence, one reason clothing labour productivity has not risen relative to the OECD is that workers tend to be formally registered and recognised: there is a lower incidence of "invisible" workers.
The regulatory environment is now in flux, altering the decision-making terrain. This means that firms will find new ways of using or circumventing the regulatory environment to realise cost savings.
Dominant Historical Trends
The dominant historical trends in the pursuit of labour cost reduction are demonstrated in Figure 5. Although a number of options were available, the choice mainly depended on the opportunities and constraints afforded by institutional and regulatory structures. In addition, the strength of the industrial councils and the availability of sufficient possibilities for wage intensification ensured that firms mostly conformed to industrial rules and regulations.
The options available to firms included geographical decentralisation, age and racial displacement, automation and foreign processing. While some regulations hinder casualisation, it is possible to hire workers on fixed term contracts.15 Although these possibilities existed, firms mainly found labour cost flexibility by age, racial and geographical displacement. Informalisation is barred within the Industrial Council system: Firms wishing to subcontract to firms that are not registered with the IC must submit a justification to the Industrial Council. Essentially, firms are not allowed to subcontract to non-IC firms. Of course, it would also be possible to pursue alternatives that enhance operational flexibility such as skills development and organisational change: However, these were not overwhelmingly undertaken.
'5The regulation governing the hiring of casual labour requires firms employing workers for more than 5 days to offer one week's notice of dismissal. In addition, firms must pay the same wage to workers on fixed and permanent contracts.

CLOTHING SECTOR 37
Figure 5 Dominant business strategies in S.A. clothing — historical forms
Automation
• I%t t ,%I
S S S S 5 5 S S
S S • S .t St _$ — — /
'— __—/
• — a —- \ Creative
—-' Marketing
Skills DeieIopment
Casualisation
Infosmalisation
Operational Change
Age&Racial I
Dtacsmej
KEY:
— Pursued
: — \ Possible, but
V notpursued Not possible

38 INDUSTRIAL STRATEGY PROJECT
Figure 6 Historical shifts in labour use
90
80 ----
70 60 ;..,
1936 1946 1955 1960 1970 1985 1990
Year
—— Youth — Transvaai ---- Black Female
—e— 'Uncontrolled' —N-- African
Decentrailsation policy and regional labour regulation has strongly influenced the form in which clothing companies have sought to enhance or maintain flexibility. Clothing producers in other countries have sought to maintain numerical flexibility through local and international subcontracting. For example, it is usually cheaper to subcontract to smaller firms as a result of lower overheads, lower wages and by shifting risk to the subcontractor (Altman 1989, Pent 1988, Ricoveri 1991). In S.A., it has not been necessary to subcontract. Firms have been able to maintain flexibility internally to the firm by organising plants in a hierarchy by region.
Figure 6 shows the shifting dominance of various forms of labour cost strategies. Initially, the clothing workiorce was predominantly comprised of Afrikaner women, emerging from the rural agricultural sector. In the early part of the century, about one-third of the clothing workforce were teenagers, earning wages substantially below adult rates (Barker 1962). In the post-war period, the use of teenage labour declined. This was mainly the result of an aging White workforce that was not being replenished by White youth. In the 1940s, "Coloured" women and teenagers were becoming more predominant. At the same time, firms began to decentrailse from the previously dominant Transvaal to other locations. Initially firms moved to Natal and the Cape. Increasingly, the movement was toward "uncontrolled areas".16 This movement was partly the result of growing militancy of the Transvaal
'61n the mid-1900s, areas outside of the Industrial Councils were called Uncontrolled', now refering to bantustan and wage determination areas.
CLOTHING SECTOR 39
union.17 In addition, the regulations governing the "uncontrolled areas" became clearer, and wage differentials were ensured. Racial displacement occurred with geographical movement. For example, the movement to the Natal region from the 1950s resulted in a rising proportion of "Asians" in the clothing workforce. Likewise, the movement to "uncontrolled" areas in the 1970s resulted in a rising proportion of "African" labour.
The racial distribution of employment has remained relatively stable since the mid-1970s, closely reflecting the geographical distribution of the clothing industry and the historically controlled demographics of these regions. The racial current racial distribution corresponds to geographical location: approximately 1/3 of the industry is in the West and Eastern Cape, 1/4 in Natal and the remainder in the Transvaal and other areas. These proportions are broadly similar to the racial employment distribution, with about 35% "Coloured", 25% "Asian" and 40% "African".
Table B 11 presents the current locational configuration of the clothing industry. It shows that 35,378 and 15,000 jobs are located in the bantustans and wage determination areas respectively. This accounts for 30% of total clothing employment.
Firms were encouraged to move to decentralised locations where low wages were relatively assured by controls over the labour market. A hierarchy of plants was developed amongst the different regions, depending to a large extent on the skill requirement of the product and stage of production. In a range of different locational structures, producers were essentially able to contain their own CMT operation, with all the associated benefits. There are essentially 4 configurations in firms that decentralised:
(I) Assembly decentralised to a number of plants with variations in skill levels. Design, marking, grading and distribution would be centrally located. Work is allocated to factories by skill content. For example, jackets would be produced centrally, while blouses or trousers would be sent to a
factory in a pen-urban area. Items with a low skill content, such as skirts, would be sent to the more remote factories.
(II) Assembly is decentralised to one plant or a number of plants in areas offering workers of similar skill. Again, design, marking, grading and distribution would be handled centrally.
(III) All functions are decentralised. A head office is maintained in the metropolitan centre for
merchandising, customer service, etc.
(IV) All functions, including the head office are decentralised.
'7For example, the Transvaal-based GWUSAA (Garment Workers' Union of S.A.) won a 40 hour week in the 1940s. The Transvaal is still the only region in S.A. that works 40 hours.

40 INDUSTRIAL STRATEGY PROJECT
Historical labour regulation
Between the mid-1950s to present, regional atidinciál wage disparities were ensured for business.. Legislation regulating the labour market bad the etTect of formally dividing the process of wage determination and segmenting the labour market This refers to the complementary effect of Influx Coptttii, the Group Areas Act and revIsions to the Industrial Conciliation Act (1956) and the Wage Act (1957) The 1956 IC Act formalised the divisive effect of racial parallelism which had been emerging since the 1940s in the trade union movement (Lewis Scheepers)
The rules on uniracial umons were complementary to the labour legislation onented to race groups In particular, 'Africans were covered by the Black Labour Relations Regulation Act (1953) and the Black Labour Act .fl964) These regulations: were. implemented to control, not protect,Black labour (Riekert Commission) tAfncan' wages were determined by the Wage Act, tendered ineffectual by its 1957 revision Between 1958—1968 minimum wages were raised only once in each region (Race Relations 1972 S A Statistics 1970) The new Wage Act accentuated differentials by race and region in the context of controls on population movement by the Pass Laws and the Group Areas Act The
• .:chaiigesteiuited in extreniely wide differentiala in wages determined under collective bargaining and those left to the Wage Board By 1968 the highest wage determmation was at most equal to the lowest IC agreement (Hepple) These differences became particularly wide as the Minister of Labour proceeded to overrule Industrial Councils by lowering zninnnums set in 'border areas (Hepple) The • wages in Rustenburg (near Pretoria) textile factories were generally 4565% less than. those in the Transvaal IC (Race Relations 1971) Wages in textile and clothing plants in Dimbaza (Ciskei) were 50—75% lower than m East London, only 7Okms away East London itself had wages that were 25% lower than the national average (Hirsch) Minimum wages in Hanunarsdale clothing factories were at least O* lower than in t)utban only 45 kms away (Hepple) Interviews done in 1q91 found wages in Johannesburg to be 36 to 9 times greater than in Babalegi (Bophuthatswana)
:In the post-Wiebahn period, urban clothing wages tôiè, exacerbating urban-non urban differentials; Aside from the intensification of direct decentralisation incentives, this may have been one cause for a growing presence of clothing firms in pen urban and non urban areas
SAC1WU currently organises about 70—80% of S A clothing workers High muon coverage may be explained bya number o factors: The large size structure makes it easier to find and organise factories; In addition, SACTWU inherited a closed shop in the IC areas, initially awarded to stave off the more 'radical GWUSAA The current regulations continue to entrench regional labour segmentation with 5 industrial councils and differential labour regulation for Wage Determination Areas (471) and each of the 'independent (TBvC) and non independent bantustans

CLOTHING SECTOR 41
Table Bit: Location of Clothing Industry Employment (1991)
Region II # Employed f % of Employment
Industrial Councils 118,900 70.2%
Wage Determination Areas' 15,000 8.9%
Non-Independent Bantustans 19,027 11.2%
TBVC 16,351 9.7%
Total Employment2 169,278 100.0%
Original Location Number of Firms with each Configuration
I H III IV I
Total
JHB 3 3 1 2 4 13
Cape Town 5 1 — — 20 26
Source: CSS, IC Provident Funds, NDC company lists.
Notes: 1. Employment in Wage Determination areas is estimated from discussions with firms located in those regions. 2. These figures are changing rapidly as many workers are being retrenched. In addition, one veiy large Taiwanese employer, with at least 2—3000 employees in the decentralised areas recently disappeared. 3. Employment figures for 1992/3 include: 95,000 in Industrial Councils areas; approx. 15,431 in non-
independent bantustans; and 13,639 in the TBVC.
Table B12: Configuration of Decentralised Firms
Source: Interviews Nov 1990 and Jan/Feb 1991.
Note: This only covers firms based in Cape Town and Johannesburg. In Natal, many companies locate their factories an hour's drive away in Isithebe (KwaZulu) where wages, although rising, are still half of those in Durban.

42 INDUSTRIAL STRATEGY PROJECT
Table B13: Cost of Qualified Machinist by Region (Current RandsfHour)
Rands/hour Index
(Natal = 100)
Natal 6.31 100
W. Cape 6.38 101
Transvaal 6.31 100
E. Cape 5.64 89
Natal Country (471) 2.24 35
NewCastle 3.00 48
Isithebe 3.13 50
Source: Natal Clothing Manufacturers Association (NCMA).
Notes: 1. These values are good from Oct. 1992. They include the basic wage plus all social costs. 2. Natal "Country" refers to wage determination areas. 3. Machinist wage in Isithebe: R92.50 in 1991; R122.50 in 1992/3: for 45 hr week.
Table B 12 shows that of 39 firms interviewed, 15 (38.4%) have decentralised factories. The most favoured organisation has gradations of skill by location. Historically, this type of decentralisation has displaced the need for subcontractors since it was possible for decentralised factories to be perfectly flexible in terms of staff levels and payment.
Table B 13 shows that large wage disparities continue to exist regionally. The hierarchy of wages is now from Industrial Council to bantustan to wage determination area. The bantustan wages have been rising dramatically: for example Isithebe (KwaZulu) weekly wages rose from R92.50 to R122.50 in one year. Since few wage determination areas still exist, the ability of firms to hire/fire at will and pay extremely low wages is diminishing. The degree to which national wages merge will partly depend on the extent to which firms can hide from areas currently enumerated by industry groups, outside of industrial councils, bantustans and known wage determination areas.
Expected Directions Without Policy Intervention
In the absence of direct policy intervention, it may be expected that conservatism in clothing companies will continue. While firms will adapt to changes in the regulatory and incentive structures, a laissez-faire approach will support a continued pursuit of static productivity

CLOTHING SECTOR 43
improvements. Static strategies will lead to the demise of the S.A. clothing industry. Figure 3 shows the degree to which the S.A. clothing production is uncompetitive. The status quo will not allow S.A. clothing to survive in a context of S.A.'s re-integration into world markets.
Some of the former strategies for achieving labour cost flexibility have been exhausted. In particular, there is little scope for age, racial and gender displacement. Until recently, these forms of displacement were the easiest routes, and in many cases supported by state policy. In the evolving environment of the 1990s, firms will look to other strategies, previously overlooked. The expected shifts in firm strategies are presented in Figure 7.
Automation
In the context of rising nominal wages, firms are likely to automate in order to reduce the labour and skills component. For example, the interviews with manufacturers did not clarify the extent to which an investment in micro-electronic grading, marking and/or cutting was for the purpose of enhanced flexibility or workforce reduction and deskilling. Automation in the assembly lines allows a reduced reliance on operator skill and enables trainees to sufficiently carry out previously skilled functions such as pocket setting.
Casualisation
Casualisation is relatively rare in the S.A. clothing industry. Fixed-term contracts are primarily used to fill the space of workers on maternity leave. While casualisation is relatively common overseas, there are fewer advantages to hiring casual labour in S.A. clothing. Most significantly, firms are required to offer the same rate of pay to workers on
permanent and fixed-term contracts. In addition, firms must offer one weeks notice in case of separation to workers employed for more than 5 days.
S.A. clothing firms have avoided the use of casual labour to enhance labour cost flexibility, since there were better options available. Decentralisation to bantustans had allowed firms to hire and fire at will. The regions not covered by any form of labour regulation are now dwindling. Hence, the use of fixed-term contracts is the current option for firms that want to reduce their workforce in slow seasons or in cyclical downturns.
While it may seem reasonable for a clothing firm to want this flexibility, a rise in casualisation could be detrimental to hard won gains in wages and working conditions. The likely outcome of this strategy is a dual workforce: a small, strong core of skilled workers and a large, less-skilled unstable pool of workers. This would result in either a downward pressure on all wages or higher differentials between permanent and fixed-term contract workers. It is also likely that such a system would be abused in economic downturns, where workers who are in fact permanent, agree to the continuous renewal of fixed-term contracts.

44 INDUSTRIAL STRATEGY PROJECT
Figure 7 Dominant business strategies in S.A. clothing
Current Directions Fcxeigri I Processing F
_ *S 1<2
.a Creatve
II Importing
Desired Directions
Ekmeshc
Cqiisafian
Wom
Devepment
Operatlonai
Change
Age & Ria1 Displacernsnt
Foreign
Domes Dece _
Aum 1) L7 —nt
Operational
change Casualisation
Infonnalisalion
KE
—' Creave
Age I:�tin
Ma,keth
rNotPobe.

CLOTHING SECTOR 45
Workers on fixed-term contracts clearly become more vulnerable to management attitude; It is likely that workers in the periphery will become more docile to management demands in the hope of gaining an extension or new contract. Therefore, this group of workers will become more difficult to organise, and a situation may arise where workers refuse (or are unable) to cooperate with union action.
This situation is also problematic for the firm. The promotion of casualisation creates a workforce that is not committed to a company. In order to promote long run competitive advantage, it is necessary to develop a committed, highly skilled workforce. Casualisation runs contrary to this requirement.
Informalisation
Informalisation, or contracting to un-registered factories or home-workers, is an extremely common practice globally. The expected advantages of informalisation include lower wage and social costs, lower overheads and more flexibility in the core workforce in slow periods.
The small extent of informalisation in S.A. clothing may explained from both the demand and supply side: On the supply side, it was illegal for "non-Europeans" to own an industrial concern until the early 1980s. Whites moving out of the clothing industry were not replaced by small black concerns. Internationally, the skills required for this artisanal class are commonly handed down through families or communities. This kind of training through demonstration has been relatively rare in S.A., with the possible exception of "Asian" locations in Natal and small pockets of "Coloured" locations in the W. Cape. The lack of artisanal development has resulted in a very small pool of subcontractors. With some
exceptions, they would not be imbued in the required knowledge pertaining to business
management, production, quality and reliability.
On the demand side, firms are essentially barred by the industrial council system from subcontracting to unregistered factories. The main regions covered by industrial councils tend to be sufficiently policed so that escaping notice is difficult. Moreover, the other options to enhance labour cost flexibility were sufficient to deflect any desire to circumvent these industrial council rules. Finally, the retail sector has been dominated by the multiples that
typically place large orders: Dealing with many tiny subcontractors would incur excessive transaction costs.
Change in the form of procurement is the most influential factor encouraging the expansion of informal producers. In particular, the S.A. clothing industry is moving to an increasingly dualistic form of production. There is a growing demand for pure cut-make-trim (CMI) firms, with design and fabric supplied. This reduces the skill content and the bargaining power of the production unit. In addition, it paves the way for informalisation as the high skill intensive aspects are removed. In addition, the contractor that is not answerable to the

46 INDUSTRIAL STRATEGY PROJECT
indusirial council may increasingly subcontract to informal factories. The most important manifestation of this contractor is the multiple retailer and design house.
The multiple retailers are increasing their influence over design and procurement. In
particular, the push for cost reduction encourages retailers to require more simply "engineered" garments. All of the top 4 multiples, accounting for 56% of retail sales, directly contract out to CMTs. In fact, the director of one multiple admitted that most of his suppliers are "essentially glorified CMTs". Another multiple has a special subsidiary whose function is to design and supervise the CMT of over half of its clothing purchases. A third multiple very closely supervises the production, quality and fabric purchases of its suppliers. A large mail-order company, accounting for 4.6% of clothing sales, opened a design section in 1990/1. The function of its suppliers is being increasingly simplified to that of a pure CMT.
The surfacing of design houses may also result in an increased demand for informal CMT work. Design houses employ a small number of designers and support staff and produce the bulk of their turnover out-of-house. Although the research has not yet systematically quantified the incidence of design houses, to date 6 have been uncovered. Their individual turnover was estimated at around R10—SOmn in 1991. This is the equivalent of a medium-
large sized manufacturer with between 200—800 employees. Some manufacturers believe that this is a growing trend since the elimination of in-house production reduces most of the risk inherent in the clothing industry.
A fail in the size of orders and the increasing expectation of style variation is another condition that is changing the way goods are procured. Production runs have fallen
dramatically. A number of firms noted that they try to subcontract the orders that are uneconomical to produce in-house. In some cases, small orders need high quality production, since the cost per unit is greater. Hence, firms would require the services of well-established, high skill CMTs. It would seem that the "sweat-shop" variety of subcontractor would not be able to properly fill such orders. However, there is evidence that the London High Street stores make extensive use of small immigrant sweat-shops (Mitter 1986).
Domestic Decentralisation
There is some evidence of declining employment in bantustan areas. It is unclear whether this reflects movement out or firm closure. On the other hand, factories are being found within S.A. in areas not covered by the Industrial Council system. The extent of these "hidden" factories is unclear. However, it is probable that the dispersion between metropolitan and decentralised factories has not yet changed dramatically since 1991. The main difficulty with the factories being found in "uncontrolled areas" is that the wages are often even lower than in the bantustans. For example, the 1992/3 minimum hourly compensation (md. social costs) for a qualified machinist in Isithebe (KwaZulu) and the Natal Wage Determination Areas were respectively 50% and 35% of the Natal Industrial Council wages. These factories are more difficult to track down. While the National

CLOTHING SECTOR 47
Development Corporations keep lists of factories for their respective bantustan, no authority is yet required to undertake this function in wage detennination areas.
There is circumstantial evidence of factories locating in increasingly bucolic areas. In particular, factories have recently been found on the Natal North and South Coast, the Orange Free State and in places as remote as the centre of agricultural fields. As labour regulation and wages become more integrated, firms will continue to seek locations that are not easily discovered. For example, there continue to be areas in Natal that are not covered by the Industrial Council. Typically, wage determination areas tend to cover specific towns or small regions. It is relatively easy to remain unnoticed for some period of time in such areas. In addition, firms may increasingly consider producing in the OFS. The OFS Industrial Council does not offer a blanket cover: different determinations exist for the four magisterial districts with discrepancies as wide as 15% in the wages of qualified machinists. This is a fairly small region and has not received much attention in terms of the effective application of regulations.
Contrary to many assumptions about new micro-electronic equipment, it is not clear that new technologies will encourage a centralisation of production (Hoffman 1985, Kaplan 1984). The bulk of new technologies are being adopted at the pre-production phases. With the use of simple information technologies, it is possible to send markers to be cut and assembled in a decentralised factory. In fact, it is information technologies that may enhance the ability to effectively decentralise, since the factory becomes less dependent on communication infrastructure. In addition, it is often the more traditional equipment that remains in the centralised factories producing higher style garments, since much of the more automated
equipment in assembly is inflexible.
Foreign Processing
There are two main factors encouraging firms to produce in plants outside of S.A. First, it is becoming increasingly difficult to find labour cost flexibility by decentralising within S.A. Previously, state policy encouraged decentralisation with subsidies and differential labour legislation ensuring relatively low wages and weak regulation. The alteration of decentralisation benefits, the entry of SACTWU to previously unorganised regions, the introduction of a national industrial council by 1995 and the expected re-incorporation of the independent bantustans will result in an unprecedented integration of regional labour markets. Firms will therefore be encouraged to leave S.A. for lower wage, less regulated environments. Second, if the S.A. clothing industry continues to promote exports, there will

48 INDUSTRIAL STRATEGY PROJECT
be an incentive to move production to an ACP country that can benefit from Lome status.'8 This allows preferential market access to European markets.
Importing Final Goods
From 1989, S.A. clothing producers have had an export promotion policy whose main result was higher import penetration.'9 This programme has demonstrated to producers that profits are more easily found in a business that imports final goods. In addition, relationships with
exporters overseas have now been developed. There has been some experience in OECD countries of manufacturers shifting into the import-wholesale business. It is worrisome that an export promotion scheme may have encouraged this trend.
B.3.2. Dynamic Organisational Strategies: The New Style
It is possible to prevent the devastation to S.A. formal clothing employment that would be wrought by the expected pursuit of static strategies in the evolving operational environment.
Figure 7 presents other directions to be encouraged that would develop a strong and sustainable industry. S.A. clothing firms should be encouraged to focus on operational or
dynamic flexibility. This would entail an integrated approach including skills development and organisational change. Organisational change would include the introduction of short-
cycle manufacturing and the development of quick response relationships. In addition, the
industry should be encouraged to become more creative in marketing and distribution.
This section considers productivity improvements that enhance dynamic competitiveness by examining the relations between the stages of production and within the industry pipeline. Four stages are presented in Figure 8 including:
1. The supply of textiles 2. The pre-production aspects 3. The production-related aspects 4. Marketing and distribution
Organisational change is emphasized since the more substantial improvements in clothing industry productivity are not necessarily acquired with the introduction of new embodied
technologies. While new equipment may aid advancement, it is possible to make important
'8African-Caribbean-Pacific (ACP) countries are those less developed economies that are Lome signatories. The associated preferential market access and financial assistance is normally extended to poorer countries including the surrounding African states (BLS, Zimbabwe, Malawi, etc).
'9See section C. 1.2 and C.1 .3. on the Structural Adjustment Programme (SAP).

CLOTHING SECTOR 49
inroads into the cost structure without introducing major changes to the capital stock. Approximately 90% of potential productivity gains in clothing are made through organisational change. Another 10% could result from capital investment (ILO 1987:41).
This document considers accessible and relevant organisational forms and equipment. A comprehensive overview of newest and latest technologies is more usefully described in articles specifically addressing themselves to this issue.2° New embodied technologies are explained within the gamut of organisational change or disembodied technology. New embodied technologies have substantially less impact on productivity when introduced in isolation of associated organisational change. Most importantly, it is possible to make significant gains without huge financial outlays.
Competitiveness can be dramatically enhanced with changes in work organisation embodying short-cycle modular manufacturing techniques in conjunction with Quick Response (QR) through the pipeline. Short-cycle manufacturing (SCM) refers to "pull scheduling" focusing on shorter production cycles, Total Quality Control (TQC), Total Preventative Maintenance (TPM), customer service and improved information exchange.
Such references often draw a sneer from South African clothing employers: The defeatist attitude of many S.A. clothing firms is unfortunate: this lack of vision is probably the single major deterrent to substantial productivity improvements. Essentially, many firms are sceptical of achieving shorter lead times and reduced stocks as a result of poor delivery and quality standards found in the provision of local textiles. It is strange that so many firms consider related achievements impossible when associated productivity improvements were successfully gained in the East Asian NICs: previously known for cheap ash-trays, wigs and irretrievably corrupt business environments, now synonymous with highly productive, skill intensive industries.
Short cycle manufacturing and quick response practices are introduced with ultimate productive capabilities in the mind. A firm will move toward the achievement of this potential step by step. It is toward this goal that the company strives, with an attitude consistent with continuous improvement. The notion of "best practice" is adapted to the requirements of firms involved in different markets. For example, the inventory requirements are higher for firms that supply independent retailers or produce standardised workwear or commodity-type clothing for stock business. The principles of moving toward minimum possible stockholcling remains, although the goalposts may differ.
In conjunction with "pull scheduling", modular organisational principles are introduced. This refers to a re-organisation that "identif(ies) families of products. . . products having basic similarities in design of manufacturing process. The aim is to identify these similarities and
20 For example see: Textile Outlook International, Trade Journals such as Bobbin, Ron Malcolm's column in the NCF's Clothing Industry News, Hoffman and Rush (1988).

50 INDUSTRIAL STRATEGY PROJECT
Figure 8 A general overview of the pipeline

CLOTHING SECTOR 51
then to group them into families which can be massed in a group — perhaps a manufacturing
cell . . ." (Avery and Leask 1987:141).
The proven gains in South African factories having adopted SCM techniques is shown in the box below. For example, improved process flow can reduce throughput times from 4 weeks to 10 days (Avery and Leask 1987:129).
The specific objectives of short-cycle manufacturing include reduced set up times, smaller
lot-sizes, production smoothing for a more uniform output rate and fewer stoppages and the development of a multi-functional workforce.
The most important proven results from a commitment to implementing short-cycle modular
manufacturing systems include a reduction in lead times, reject rates, material waste, raw stock levels, interest rate payments and work-in-progress and an improvement in quality, cash flow, worker motivation and a more productive use of the full range of potential workforce skills.
The Supply of Inputs
Improving the quality, reliability and cost of textiles is crucial to clothing industry efficiency and competitiveness. Fabric contributes over 50% to clothing production costs. The local textile industry provides about 60% of fabric consumed by S.A. clothing factories and accounts for 25—38% of the cost of sales.2' Productivity improvements can be made
21Between 1983—91, the clothing industry imported 30—50% of its fabric requirements. Since tariffs have been
low from 1989, it is unlikely that a tariff reduction would noticeably alter these proportions.
Process Flow
TMdi1Ona 3 Osys
Altemalive 1 Osy
Tot Throupt
lime lODays 4w.sIrs
(2SDaya) osys 1 .4 weeks * Days

52 INDUSTRIAL STRATEGY PROJECT
without fundamentally altering supplier relationships since, even within the current status quo, firms could substantially reduce inventories. However, tightening supplier relationships could improve productivity and lead times far more dramatically.
Stock Control
Traditionally, firms order materials for existing and expected orders. Clothing firms generally hold some buffer stocks to compensate for late deliveries, particularly on consistent products. Some companies also speculate on fabric, intending to use the material in a design for an undetermined future sale.
S.A. clothing firms report that a shortage of material is the second largest contributor to under-utilisation of capacity (NCF Diary 1993 p298.)22 In South Africa, it is not uncommon to find clothing companies holding 2—3 months stock. The value of closing stocks of raw material was the equivalent to 12% or 3 months of sales (NCF Diary 1993:257, NP! 1992: 16).23 Internationally, the costs associated with holding such stocks are not that high, although it may have a negative impact on cash flow (Tyler:74). For South African firms, the cost of holding excessive inventories is substantial, given high interest rates. In terms of the cost of borrowed capital, maintaining large inventories is only sensible if a company is paying out of earnings and buying at prices that compensate for expected inflation. Clearly, very few firms are in this position, with low margins and little bargaining power with textile
producers. Two surveys of approximately 25 S.A. companies found that interest payments accounted for 3.9% to 4.5% of turnover between 1989/90 and 199 1/92. Short term loans (up to 60 days) account for 83% of loans outstanding (NCF Diary 1993:255: CSS Survey of the Accounts of Companies; NP! 1992:2, 18).
Ultimately, the maximum stock holding required would match the 4 week production cycle of most clothing factories. Yet, the average raw material inventory is 3 months worth of stock. Taking into account the delivery problems experienced, it should be possible to reduce raw stocks to 1.5 months worth of production allowing for some buffer in order to ensure continuous production. In fact, the survey done in 1991 showed that firms typically held the equivalent of about 1 month worth of fabric in "dead stock", and underestimated the total amount of raw inventories.
22 Insufficient demand is the most common contributor to under-capacity utilisation. The underutiisation recorded between 1988—91, ranging between 10.3 to 14.4%, was mainly attributed to weak demand (5—8%), a shortage of raw materials (2—3%), a shortage of skilled labour (1—1.4%) (NCF Diaxy 1993: 298: CSS Labour Statistics 1991).
23 The value of total closing stocks was 23% of the value of sales. The ratios quoted for clothing are similar in the textile industry, with raw material stocks accounting for 13% of sales, raw material inputs accounting for 60% of sales and the value of total closing stocks equal to 25% of sales.

CLOTHING SECTOR 53
If the average of 3 months raw stock were halved to 1.5 months, a firm could reduce the cost of sales associated with interest payments by 2%. If Short-Cycle Manufacturing techniques and Quick Response relationships were introduced, the cost of sales would be reduced even more dramatically. Clearly there are other benefits related to the availability of extra cash for productive purposes.
Quick Response Relationships24
Quick Response (QR) refers to a tightening of supplier relationships through the production pipeline in order to improve responsiveness to market demand. As much as possible, goods are pulled through the system by consumer demand. Lead times are shortened as orders are smaller but more frequent. Waste associated with forecasting errors is minimised since the lot sizes in inventory are reduced. Production may be smoothed since orders take place over a longer stretch of time.
A QR relationship is developed from textile producer through to retailer where a commitment is made to exchange immediate infonnation on market demand through the pipeline and to fill agreed factory capacity. The partners in QR would normally have already adopted short-cycle manufacturing techniques.
QR can be implemented for any type of good, whether basic, seasonal or fashion.25 It is merely the time frame that is altered to suit product type. If major changes are required in product specification, the minimum lead time is raised. In addition, the goals of QR vary by market niche. For example, the goal of QR in the provision of basics is to minimize the time required to pull replacement through the pipeline, given the velocity of retail stock turnover. In seasonal clothing, with a shorter shelf life and some style change, QR will help the pipeline to provide the "winners" to the market. Initial orders present the range of goods: Within a short period, consumers provide information on the likely seasonal "winners". QR for fashion items, which have a very short shelf life but embody the greatest amount of product change, seeks to postpone the final product decision-making in order to reduce risk.
One South African QR experiment was developed in 1988/9 on seasonal items, with a shelf life of 30 weeks. To implement this experiment, a sales forecast was developed to determine the likely units sold over the 30 weeks. A relationship was developed through the pipeline where the retailer books clothing and textile factory capacity. While the capacity is guaranteed, the retailer does not commit to specific product characteristics: For example, colour specifications could alter according to information provided by consumers. Minimum lead times are partly determined by the minimum production cycle in clothing and the
24Unless otherwise specified, the information on Quick Response is derived from van der Riet(1990).
25See section B.2.2 and B.4.2. for an explanation of basic, seasonal and fashion goods.

54 INDUSTRIAL STRATEGY PROJECT
minimum dye or finishing lots of the textile producer. In this case, the minimum dye lot required 4 weeks, while the minimum make-up time was 2 weeks.26 Clearly, QR lead times could be improved with technological upgrading to handle smaller runs. It was agreed that deliveries would be macic every 2 weeks, although a small buffer stock of a total of 4 weeks would be maintained in light of potential system inefficiency. An initial order for the first 4 weeks was put through the pipeline. Previously, the retailer may have made larger orders that did not sufficiently reflect consumer demand. In this case, the retailer garners information within the first 2 weeks concerning preferred colours'and sizes. On this basis, the next 4 weeks of orders are placed through the pipeline.
To implement QR, electronic data interchange is not absolutely necessary in the context of short distances and easy access to fax machines or the telephone. However, most of the major retailers have already introduced point-of-sale electronic data collection: An investment in a personal computer and modem is no longer prohibitive and could be easily introduced into the production end.
This S.A. example of QR on seasonal items greatiy contributed to cost savings and the reduction in lead times. A substantial 11.5% was saved on the final cost of the product. These savings resulted from a reduction in interest rate payments associated with high inventories, fewer markdowns and a bypassing of stockroom costs. In addition, sales on the QR items rose by 57% over the first season of the experiment, as compared to similar products. Higher sales occur because the product corresponds more closely to consumer demand.
Pre-Production
Typically, pre-production accounts for about 5 days of the production cycle. The phases associated with pre-production are important to the smooth running of the assembly process. Pieces must be properly graded, marked and cut to avoid rejects and stoppages on the assembly lines. Design and production planning must suit the machinery and organisation on the floor.
The assembly stage of clothing production is not highly mechanised or technologically advanced, although it is the realm in which some of the more advanced organisational advances have been introduced. Alternatively, pre-production has experienced a much higher degree of technological adoption, but tends to be ignored when considering new organisational practices. Most of the literature related to pre-production focuses on the dramatic savings earned with the adoption of new micro-electronic technologies. While
26Both the textile and clothing manufacturer were capable of replenishing the initial order within 2 weeks. Changes in size specifications required 3—4 weeks, Finally, a change in colour or pattern required a lead time of 8 weeks for both clothing and textile producers.

CLOTHING SECTOR 55
acknowledging their positive effect, it is the organisational change into which these new technologies should be inserted that offer the substantial long term dynamic advantages.
Cutting27
Although not commonly considered, it is possible to introduce cellular manufacturing principles to the cutting floor. The re-organisation along these principles can result in reduced lead times and improved quality control. In one S.A. example, the lead time for cutting as a result of organisational change, in the absence of technological change, was reduced from 3 days to 1 day. Improving efficiency in cutting is extremely important for a clothing factory: it is the site of the highest cost blue-collar labour and the potential source of significant material wastage and mis-matching of pieces destined for the assembly floor.
The typical cutting room is operated as a job-shop, producing WIP batches for the assembly floor.28 Traditionally, a long cutting table (35M) defines the lead time from the cutting room. The depth of fabric lay will vary according to the production run and the degree to which fabric patterns vary within an order. For example, an order which requires the same style in different colours of plain fabric can be cut simultaneously. However, a lay will not generally mix patterned and plain fabric, particularly if patterns (such as stripes) must match up at the seams.
After laying-up the fabric, the fabric may be cut with the use of manual scissors or some semi-automatic cutter.29 The adoption of micro-electronic cutting machines has diffused slowly both in S.A. and internationally (Whitaker, Statistics 1988). To date, their use tends to be limited to very long runs in large companies. They require constant use and therefore encourage the introduction of multi-shift work practices. Their advantages include: potential integration with micro-electronic design/grading/marking, improved efficiency and accuracy, reduced faults and potentially thicker fabric lays.
After cutting, the pieces are transported to be stamped and sorted. Essentially, each piece must bear some code that identifies the style, size and production run. If required, some panels, such as collars and cuffs, are transported to a fusing machine: a vilene-type material is fused in order to stiffen the piece.
27 The discussion on cutting floor reorganisation refers extensively to Avety and Leask (1987:141-6).
28"A job shop type process is characterised by production in batches at intermittent intervals. In this case, equipment and labour are organised into work centres by similar types of skill or equipment. A product or job will flow only to those work centres that are required and will skip the rest. The result is a jumbled flow pattern." (Avery&Leask: 130: Schroeder 1986:136).
29Manual cutting is relatively rare in S.A.: However, it was seen quite often in Turkish plants visited.

56 INDUSTRIAL STRATEGY PROJECT
Figure 9 The cutting room
Traditional Cutting Room Layout
I I Laying-up Machine
35 Cutting Table
metres
LI _________ 11 Bandsaw
i
Fusing I
Isottin I Quality
1 Pressi I Icotai
Alternative: Dedicated Fabric Culling Cell
I Laying-up Machine
35 Cutting Table
J3M linear
F ___________ I] Bandsaw _ISng 1 Soling
I I Qu I
Fusing1 Press Source: A'veiy & LeaIc(1 987) p.142, 144.

CLOTHING SECTOR 57
This cutting room organisation results in long lead times since large batches are moved through the required processes. It is possible to reduce lead times, enhance quality and engender a continuous flow of production with the introduction of cutting cells.
Figure 9 compares the traditional cutting room and an alternative cutting cell. Here, the cuffing cells are dedicated by fabric type. This varies from the traditional organisation which puts all orders through the same set of machines, by-passing functions not required. The appropriate machinery, settings and workflow are more standardised, with a greater integration of the required processes. In this example, the length of cutting table is effectively reduced by 1/10, as the bandsaw is moved up the table.3° While the depth of fabric lay is the same, the flow of work through the cuffing room is accelerated.3' The shorter runs are then stamped, sorted and inspected on the table. The transport between different tables and potential confusion is thereby eliminated. The fusing remains off the table since separate heavy machinery is required.
The staff and skill distribution within the cutting floor is altered accordingly. This cell requires one cutter and 5 multi-functional operators. The multi-functional workers must be able to move quickly between operations to clear potential bottlenecks and assist in work- balancing. All members of the cell are responsible for quality control. The smaller batches allow for earlier detections of faults, thereby reducing potential fabric waste.
Assembly
The overall organisation of the assembly floor varies little from factory to factory. Generally, the panels cut and sorted in pre-production move into a WIP storeroom. Depending on the production plan, panels associated with a particular run will be put through a straight assembly line. In S.A., style changes are normally implemented overnight to allow for the movement of any new machinery required or alteration of machine settings. The organisation and balancing of the line is determined by the work-study department, possibly in conjunction with the line supervisor. Before the new style comes on line, the supervisor will instruct machinists on any new operations.
These lines may contain between 5 to 120 workers depending on style, complexity and the chosen division of labour. A typical line contains approximately 8—15 workers. Most factories operate on a progressive bundle system: this means the panels are tied into bunches of 10—60 pieces each. The operator picks up each subsequent bundle, unties the panels,
30Bandsaws are not necessarily common in the clothing industry. In S.A., the most common cutter was a semi- manual vertical blade. A bandsaw is described since this was the type of cutting machine used in the particular case study.
31The depth of fabric lay is determined by the heterogeneity of fabrics required by the order and technical
capacity of the cutting machine.

58 INDUSTRIAL STRATEGY PROJECT
completes the required operation on each piece, re-ties these pieces into a bundle, and pushes the bundle forward to the next operator. In some cases, an examining table is placed within longer lines.
The bundles are most commonly transferred between operators along a WIP transfer table that sits alongside each production line. In some cases, an overhead rail transfers the panels between operations.32 Overhead rail systems tend to be unpopular with both management and workers. For workers, the system can be claustrophobic and hot since the rails encircle them and cut them off from the rest of the factory. For management, the desired productivity gains have been elusive: many investing in rail transfer systems have abandoned the equipment. In S.A., two micro-electronic rail systems have been adopted, only one of which has been used successfully.
Once off the line, the assembled garment will be inspected, pressed and cleaned of loose threads. If the sewing machines in the line contain underbed trimmers, the cleaning function is substantially reduced. The garments will then go into a final goods storeroom where they undergo a final inspection. The garments will either be packed and dispatched, or remain on rails until purchased.
It is common to have a small core of multi-skilled and multi-tasked workers. Some proportion of machinists will be able to perform more than one function on the same machine, or will be able to operate more than one machine. Even in more progressive S.A. factories visited, the stated purpose of developing these skills is to address absenteeism. The breadth of machinist and supervisor skills is extremely limited. Table B 14 shows that the majority of workers in most firms in the Cape and Natal can operate only one machine. For example, only 31% of Natal firms interviewed said that more than 60% of machinists could operate more than one machine. The ability to operate more than one machine is not particularly impressive. Generally, clothing machinists are unable to assemble a full gannent, are slow at style changes and are not trained in quality control, basic line balancing or rudimentary mechanics (see Appendix 3).
Typically, about 2/3 of the processing time is devoted to assembly and post production. If WIP were eliminated and a production cycle of 14 days achieved, about 10 days would be spent in assembly, cleaning, pressing and inspection.
32An overhead rail may be mechanically or electronically operated. It generally consists of an overhead rail to which chains are attached. The panels making up a garment are clipped to each chain. The operator may un-clip the panel for the relevant operation. Alternatively, the machinist operates on the panel while still clipped to the chain. Mechanical rail systems tend to follow a straight line configuration. An electronic system may embody a switchtrack configuration, where panels may not move in a straight line. Instead, the chains may move between lines or areas or the production floor as appropriate.

CLOTHING SECTOR 59
Figure 10 Clothing assembly
The TradiionaI Production line
I WlPStore 1
Alternative: Modular Dedicated Cells
Machinists
Pressing
Final Inspection & Packing
I- 0
0 C -C C,
U — LEI (U iEII , El _EJ Cleaning
Final Inspection Packing ]
i WiPSiore
jor I I

60 INDUSTRIAL STRATEGY PROJECT
Table B14: Cross-Training in the S.A. Clothing Industry (% of operators that can operate more than 1 machine)
% of operators <10% 10-19 20-39 40-59 60+ # of firms
% of Cape firms
Natal
14 10 19 14 43 21
11 11 26 21 31 19
Source: Interviews Jan/July 1991.
There a number of problems associated with the traditional work organisation described above.33 First, the work in process is pushed through the factory from behind. As a result, WIP becomes unevenly distributed through the line and bottlenecks arise. Some operators become overburdened with bundles awaiting processing, while other operators sit unoccupied waiting for work to be passed to them. Second, as large bundles are processed before any form of inspection is carried out, excess wastage occurs. Since operators are not generally trained or responsible for quality control, large quantities of W1P can pass through a line before any processing or fabric faults are found. This can result in excessive re-work and in- factory rejects. In addition, where fabric faults were not noticed in the initial pre-production inspection, not only is there material waste: costs associated with adding value to the material are also incurred.
Third, the limited training offered to machinists and supervisors raises the indirect labour costs and the amount of downtime associated with machinery breakdown and style or fabric changeovers. For example, machinists and supervisors are not trained in preventative machinery maintenance or basic mechanics. Since workers are not involved in quality control, more staff is required for inspection. In addition, quality problems are detected later and so large quantities of an order may require unpicking and re-work. The integration of quality control in the line substantially reduces the quality inspection required later.
Approximately 2/3 of processing time is devoted to assembly and post production functions. The Process Flow illustrated on page 42, 51, 54 shows a breakdown of a typical 4 week production cycle. In fact, only 13 days of the full 28 are spent in productive activity: the remaining time is spent in WIP stores, awaiting processing. Within the assembly stage, about 80% of an operator's time is spent in handling. Hence, the most substantial productivity improvements could be gained by improving organisational techniques that would reduce
33The traditional work organisation' is common in S.A. and abroad. However, there are still many factories, particularly in Natal, that are now introducing progressive bundle systems as a anew' form of work organisation.

CLOTHING SECTOR 61
WIP and operator handling time. The common cost-reduction strategies involving automation and work intensification do not effectively address these issues.
Figure 10 displays a traditional assembly line and an alternative organisation of work. The alternative presented is consistent with short-cycle manufacturing (SCM) with modular cells, dedicated to fabric type or broad style groupings. Two cells are shown: the machinists that would normally have formed one linear production line now form two production cells. Fewer styles and fabrics flow through each cell, thereby reducing downtime associated with set-up times and changeovers. Most importantly, a unit-production system is introduced where ultimately one unit is produced at a time. The machinist does not untie a bundle. Instead, each panel is picked up and operated on separately. Should WIP build up in the next station, the previous machinist will operate on a limited number of units (eg 1—10) until stopping and assisting with the bottleneck.34 In this way, a system of pulling work evenly through the line is introduced, where speed is regulated by the machinists in front. This compares to the previous system where work is pushed from behind on the basis of the prior machinists' speed.
The WIP transfer tables are eliminated, since panels are handed from station to station directly. Rail systems which are generally thought to be appropriate to unit production systems are not adopted: Instead, the tables are shifted so that the stations are closer together or are contiguous. Eliminating the WIP transfer tables ensures that only a minimum of WIP can physically flow through the line at any one time.
Two modular configurations are presented in Figure 10: In the first, machines are positioned in a horseshoe shape. The machinists move between operations. While this is the form advocated by some consultants, it is not optimal. The machinists are required to stand. This would result in fatigue and longer term health related problems such as varicose veins. It is particularly inappropriate in a female dominated industry, where problems would be encountered during pregnancy.
The second cell-type is an innovation introduced into some Cape Town factories.35 In this case the operators sit at interwoven tables. It is possible to attach a side-car should certain operators be expected to perform functions on different machines. In addition, the machinists now face each other. Many firms expressly prefer machinists to face away from each other to avoid "wasted" time in conversation. Yet, this system has shown that a large proportion
"Not all factories are comfortable with unit production systems. Yet, it is advantageous to reduce the bundle size, whether as an ultimate objective or in a progressive shift to unit production. In the first year of the South African case study, the bundle was reduced from 40 to 10 panels each, with a maximum of 4 bundles allowed between work stations.
35This innovation was introduced by Derek van der Riet of Faull, v.d Riet and Associates in a number of Cape Town clothing factories. An example can be found in one of the Bonwit factories.

62 INDUSTRIAL STRATEGY PROJECT
of discussion relates to quality problems, particularly when panels are passed one station back for re-work.
To enable these small cells to function, the operators and supervisor in the line are responsible for a wider range of functions than in the traditional mode. These functions include multi-skill in operations and machinery, preventative machine maintenance, line balancing, quality control and cleaning in the line.
The introduction of SCM techniques often entails a change in work incentives. Since machinists are now responsible for quality and throughput on a collective basis, a group bonus may be offered. In S.A., firms rarely pay bonuses that are sufficient to encourage higher productivity. It is generally accepted that a bonus becomes effective when it accounts for 25% of the basic wage. However, the maximum bonus offered in the Cape just covered 10% of the wage. Some employers believe that financial bonuses are not effective because of the workers' family structure, where the operator's pay-packet is often immediately passed onto the person of authority in the household. They question whether a productivity bonus is the appropriate means of encouraging cooperative group behaviour. It would be possible to tie effective group behaviour to other rewards, such as professional advancement, movement up a grading ladder or extra time off.
In order to avoid work intensification, any bonus should be negotiated within the context of organisational change. In fact, the bonus may simply be offered to encourage cooperative group behaviour or improved quality control.
Table B15: Bonuses Paid by Cape Clothing Factories
Rands/Week None R1-9 R1O-19 R20+ Year- end
Total No.
% of factories 35% 19% 12% [_23% 12% 26
Source: Interviews, Jan/Feb 1991.
There is considerable scepticism through the S.A. industry concerning the viability of short- cycle manufacturing techniques. However, substantial savings and productivity improvements have been experienced where these techniques have been adopted in an integrated manner.
The net result of a SCM system is fewer in-factory rejects, reduced lead times through the assembly floor and reduced down-time. Rework and factory rejects are reduced since quality problems are identified before a large batch of WIP has passed through the line. In the S.A.

CLOTHING SECTOR 63
example, rework quantities were reduced by 78%, indicating a fall from 6% of output to only 1.3%. This is equivalent to an estimated saving of 1.6% on the cost of sales.36
Table B 18 underestimates the savings from reduced rejects and returns. Particularly in a recession, retailers tend to return a high proportion of goods for dubious reasons. Manufacturers have described this problem both in S.A. and in other countries including Italy and Turkey. The introduction of SCM in conjunction with improved communication and information systems with retailers would reduce the excessive returns. Factories could then re-orient some production to more appropriate products and/or to alternative distributive channels.
In addition, the adoption of this system allowed for an 83% reduction in rejects. If the average rate of rejects and returns to manufacturers accounts for 1.3% of the cost of sales, an 83% drop in rejects would reduce the cost of sales by 1.1%.
Each line requires 2 fewer workers, thereby reducing labour costs by 20%. This reduces the cost of sales by a further 2—3%. Workers may be redeployed to more productive activities: Where sales are stagnant, the workforce may be reduced through attrition. However, SCM is normally introduced to enhance competitiveness and therefore results in a growth in sales (AAMA, van der Riet). For SACTWU, this is not a zero-sum situation since South African firms are now competing for both global and local market share.
Table B19 shows the cost savings within the first year of introducing SCM into a South African factory. These savings are made in the absence of changes in technology or supplier relationships. Overall, the initial savings add to 7.2%, raising the firm's surplus from 2.8% to 10%.
The S.A. example experienced a 55% reduction in assembly lead times. The Process Flow on page 42, 51, 54 illustrates the possible reduction in the production cycle to 10 days as a factory becomes more adept at SCM and QR. While it is unclear that this reduction reduces the cost of sales, improved lead times definitely offer a manufacturer a strong competitive advantage.
Table B16 presents the extent to which the S.A. clothing industry is adopting new manufacturing techniques. It shows that the introduction of unit production systems and attention to stock holdings varies considerably by region. For example, 55% of Cape flrms interviewed had introduced unit production systems in a substantial way. In Natal only 2 firms had adopted unit production systems: In fact, the firms undergoing productive re-
36This includes direct. and indirect labour costs and overhead costs incurred (in this case, calculated as contributing 33.7% to the cost of sales). If reworks were eliminated, 2% would be saved on the cost of sales.
A 20% reduction in the cost of direct labour (12.7% of the cost of sales) is equal to 2.5% of the cost of sales.

64 INDUSTRIAL STRATEGY PROJECT
organisation were excited about introducing progressive bundle systems. In general, Natal based firms tended to put less attention to scientific management, and relied more on rule-of- thumb. Table B16 also shows that Natal based firms tend to keep higher raw stocks: 64% of finns interviewed kept more than 3 months raw inventory. This compares to 60% of Cape firms holding less than 2 months worth of raw material stocks.
Table B16: Material Stocks and Production Systems by Region
Months of raw stock 1 2 3 4+ % of firms
# of firms
W. Cape Unit (% of firms)
Bundle
20% 15% 20% -- 55% 11
5% 20% 15% 5% 45% 9
Natal Unit (% of firms
Bundle
11% 11% 2
10% 26% 32% 21% 89% 17
Source: Interviews, Jan and July 1991.
Notes: Includes "dead stock". Does not include CMT finns that do not buy raw materials.. A finn is listed as unit production if at least half the assembly lines operate in this way.
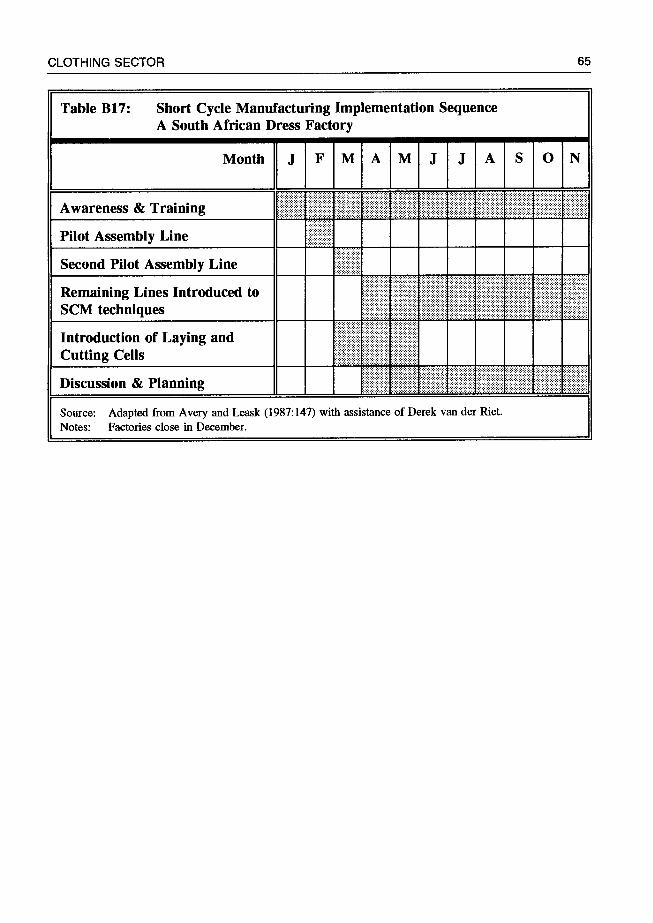
CLOTHING SECTOR 65
Table B17: Short Cycle Manufacturing Implementation Sequence A South African Dress Factory — — — — — — — —
Month J FMAMJ J A SION
Awareness & Training
Pilot Assembly Line
Second Pilot Assembly Line — — I
Remaining Lines Introduced to SCM techniques
Introduction of Laying and Cutting Cells
Discussion & Planning
Source: Adapted from Avery and Leask (1987:147) with assistance of Derek van der Riet. Notes: Factories close in December.
1-

66 INDUSTRIAL STRATEGY PROJECT
Table B18: Improvements with Short Cycle Modular Manufacturing: A South African Example
Improvement (knitwear &
dress)
Improvement in dress division
Rework quantities 72% 78%
Rejects 83%
Lead times 61% 65%
WIP inventory 34% 15%
Raw material inventory 23% 27%
Stock shrinkages 60% 66%
Set-up times 0-5% 0-5%
Space savings 24% 20%
Labour savings approx 20%
Source: Avery & Leask (1987).

CLOTHING SECTOR 67
Table B19: Savings from Short Cycle Manufacturing (% of Cost of Sales)5
Cost of Sales with Progressive Bundle System 100.0%
Materials 50.0%
Labour (direct) 12.7%
Overheads 13.7%
GROSS PROFIT 23.6%
Admin 7.5%
SellinglDistr. 8.3%
OPERATING PROFIT 7.8%
interest 4.0%
Tax 1.0%
SURPLUS L2.8% EXAMPLE of ADDITIONS to SURPLUS if SCM ADOPTED
Raw inventory reduced by 50% to 1.5 months2 2.0%
Rejects & returns reduced by 83% from 1.3% of sales 1.1%
Reduced rework from 6% to 1.3% of output3 1.6%
Labour saving by 2O% 2.5%
SURPLUS USING SCM TECHNIQUES 10.0%
Source: Cost of Sales: Interviews and NP! (1992); Additions to Surplus: Own Calculations.
Notes: 1. Direct and indirect labour account for 27.2% of the cost of sales. 2. Assumes borrowing to purchase stock. 3. Assumes avg. 1.5 mm per re-worked item. 4. Labour saved mainly includes cleaners and inspectors and re-work machinists. In the examples observed, workers were moved to other parts of the factory. Labour was either reduced by attrition or raised as a result of increased sales. 5. This table offers a selection of the most significant savings that could be made within the first year of implementation only.

68 INDUSTRIAL STRATEGY PROJECT
Marketing and Distribution
Studies of the clothing industry often emphasize its fragmentation. A better understanding is gained by focusing on centres of influence. In the clothing industry, the group dominating marketing and distribution wields substantial influence on trends within the industry, including accumulation at each stage of the commodity chain, frequency of style change, the extent of technological adoption and types of inter-firm cooperation or competition.
In S.A., the multiple retailers dominate the clothing induslry.38 As demonstrated in Table B4, the multiple retailers and department stores account for approximately 2/3 of all clothing retail sales.39
Many clothing manufacturers tie into major retailers to ensure market outlets and reduce the uncertainty and transaction costs associated with the independent retailers. Table B5 shows that in the W. Cape, 84% of firms sell the majority of their output to multiple retailers. In fact, over the past few years, some companies in the Cape have had a specific policy of moving away from independent retailers.
Very few Cape manufacturers seem to be aware of their competition. Most companies interviewed could not name their competitors. Producers primarily discussed retailers with which they were developing relationships, albeit in vague terms. They rarely described how they were going to enhance local or global market share.
Marketing behaviour varies by region. In Natal, 38% of firms concentrate sales on
independent retailers: There seems to be a community between producers and distributors, with some loyalty and supportive behaviour between groups. In fact, a number of firms seem to be integrated into retail: Aside from the factory, the firm will own a series of low-priced shops.
Despite the apparent safety of the multiple retailers, there are a number of problems associated with this reliance. This dominance results in a concentration of profits in the pipeline at the retail end (NCF 1993:248: FM Top 300). The squeeze on manufacturer profits
38Four types of retailers are identified: multiple retailers, department stores and independent stores. The multiple retailers are large, nationwide or international chains. Department stores are smaller chains that have fewer stores.
Independent retailers are small outfits that usually have one or two outlets. In S.A., these retailers tend to buy directly from manufacturers. The fourth retailer is the hawker, with no fixed outlet. The hawkers tend to buy goods either from factoiy outlets or hawker-wholesalers.
39The statistics on total retail sales are taken from the CSS, while data on the sales of specific retailers is from
corporate financial reports. Since the CSS sample has not been changed since 1974, it is likely that the residual other' category is underestimated. In particular, the CSS sample would not take into account the significant rise in hawking as a form of retail, nor the observed growth in wholesaling that services hawkers.
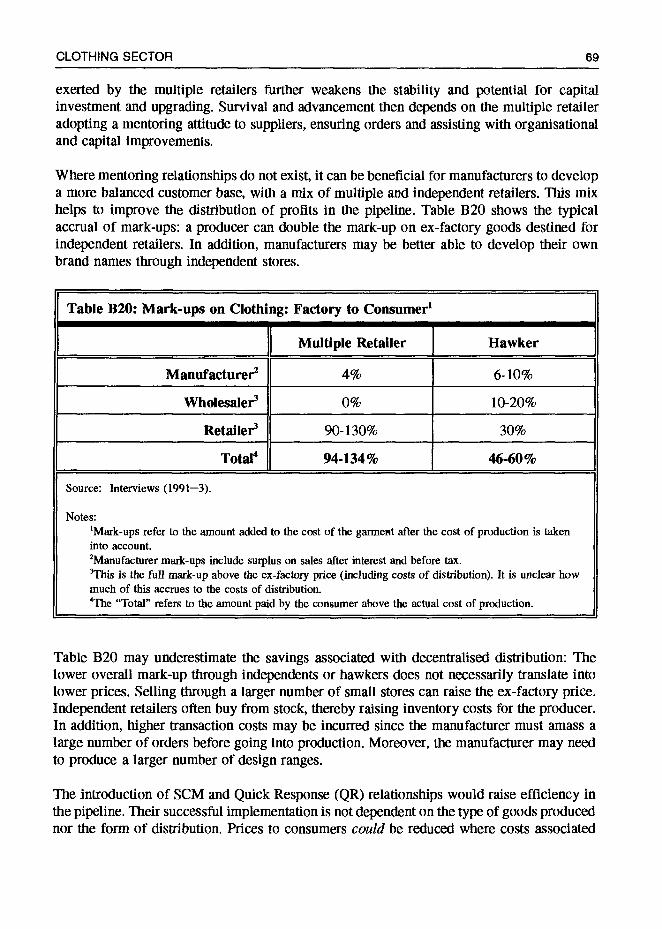
CLOTHING SECTOR 69
exerted by the multiple retailers further weakens the stability and potential for capital investment and upgrading. Survival and advancement then depends on the multiple retailer adopting a mentoring attitude to suppliers, ensuring orders and assisting with organisational and capital improvements.
Where mentoring relationships do not exist, it can be beneficial for manufacturers to develop a more balanced customer base, with a mix of multiple and independent retailers. This mix helps to improve the distribution of profits in the pipeline. Table B20 shows the typical accrual of mark-ups: a producer can double tile mark-up on ex-factory goods destined for independent retailers. In addition, manufacturers may be better able to develop their own brand names through independent stores.
Table B20: Mark-ups on Clothing: Factory to Consumer'
Multiple Retailer Hawker
Manufacturer2 4% 6-10%
Wholesaler2 0% 10-20%
Retailer2 90-130% 30%
Total4 94-134% 46-60%
Source: Interviews (1991—3).
Notes: tMark-ups refer to the amount added to the cost of the garmeNt after the cost of production is taken into account. 2Manufacturer mark-ups include surplus on sales after interest and before tax. 3This is the full mark-up above the ex-factory price (including costs of distribution), it is unclear how much of this accrues to the costs of distribution. 4The "Total" refers to the amount paid by the consumer above the actual cost of production.
Table B20 may underestimate the savings associated with decentralised distribution: The lower overall mark-up through independents or hawkers does not necessarily translate into lower prices. Selling through a larger number of small stores can raise the ex-factory price. Independent retailers often buy from stock, thereby raising inventory costs for the producer. In addition, higher transaction costs may be incurred since the manufacturer must amass a large number of orders before going into production. Moreover, the manufacturer may need to produce a larger number of design ranges.
The introduction of SCM and Quick Response (QR) relationships would raise efficiency in the pipeline. Their successful implementation is not dependent on the type of goods produced nor the form of distribution. Prices to consumers could be reduced where costs associated

70 INDUSTRIAL STRATEGY PROJECT
with distributive waste are cut. Essentially, Short Cycle Manufacturing enables the reduction in production cycle time. This means that the manufacturer is able to efficiently provide smaller orders at shorter notice. Ideally, orders could be organised around the replenishment needs of the distributor. The stock of different types of goods can be replenished over varying periods of time: Basic items have a shelf life of 8—12 months or more. Seasonal items are sold over a period of 16—22 weeks. This means that once a season's styles are on the shelf, it is possible to sell this particular set of goods for 4 to 5.5 months. Finally, fashion goods have a potential replenishment period of 4—10 weeks.
The ideal situation is one where a small order is provided of the designated styles: Within a short period, the more popular styles and colours from that set becomes clearer. Further orders should emerge from the information provided by consumers. The tighter time frame of production to selling results in reduced "stock-outs" and returns to manufacturers. Even if the net effect in a recession is smaller overall orders from multiple retailers, this knowledge allows producers to find alternative products and distributive channels. Maintaining an apparent safety net by procuring large early orders results in returns by retailers (often on dubious grounds) that force a manufacturer to sell at substantially reduced prices. If alternatives were found at an earlier date, the manufacturer's surplus would be less compromised by the whim of major retailers.
Table B21: Replenishment Period of Retail Apparel Goods
Basics 8—12 months
Seasonal 16—22 weeks
Fashion 4—10 weeks
Source: AAMA (1987).
Notes: The replenishment period refers to the shelf life of particular types of style groupings.
The reduction in forecasting errors enabled by SCM techniques raises the attractiveness of local sourcing. Even if local prices were higher, they could be offset by a reduction in markdowns at a season's end.
The introduction of SCM and Quick Response requires improved information flow and communication. The cost of technology associated with improved communication has been greatly reduced, and can be implemented relatively easily. Many of the major retailers have already introduced computerised point-of-sale data collection procedures. Yet, even smaller retailers can introduce these techniques by use of a personal computer (PC). Information can be simply passed back to the manufacturer by use of a PC and modem in the factory. At its most rudimentary, quick information feedback can even be achieved by fax!

CLOTHING SECTOR 71
The QR relationship becomes more complicated when moving back into the provision of textiles. Although 6 experiments were established from 1990 in QR through the pipeline, one of the major bottlenecks was caused by the lack of commitment: For example, despite bookings of textile production space having been made, other orders were taken for lack of confidence in the QR order. Without the commitment of textile manufacturers, SCM and QR can still be partially achieved: Yet, some of the burden will be placed up in the production chain, where clothing producers will need to maintain large stock levels in order to ensure quick deliveries. While considerable scepticism exists, there are examples of successful Quick Response experiments in South Africa.
Section B.3. demarcated static and dynamic business strategies by their potential contribution to long-run dynamic competitive advantage. Dynamic approaches are superior in their contribution to speed of results and long run competitiveness.
Static Organisational Forms

72 INDUSTRIAL STRATEGY PROJECT
Dynamic Organisational Forms
The adoption oldynaniic flexibility occurs when firms implement practices that permanently increase the capacity to respond to change. These changes emphasize operational change and functional labour flexibility. Dynamic organisation changes to factory organisatlon may Include the Introduction or short-cycle nianufacturing, quick response relationships and Iiumaii resource development with an encouragement of broadly defined forms of umlti—skilling.
Operational change Is considered for all parts of the clothing pipeline Including the supply of textiles, pre-production, assemhy and distribution. While the dIscussion is not comprehensive, specific examples of new organisational forms are offered to show how shorter production cycles, modular production, total quality control, reduced inventories and skills development can be implemented and benefit firms. The adoption of new physical technologies is not emphasized: tnstead, it Is the disembodied technologies that receive attention.
Examples of these strategies in South Africa are presented to show that such practices are practically possible and have proven highly successful locally. ThIs study finds that within the fIrst year of adopting short-cycle manufacturing techniques, In the absence of changes In hard technology or supplier relations, a S.A. firuuu was able to reduce the cost of sales and lead times by 7.2% and 65%
respectively.
Given the gap in productive efficiency shown in FIgure 3. it becomes clear that the future of the S.A.
clothing Industry depends on the adoption of dynamic approaches to productivity. Although the labour cost is low in international terms. many firms will want to focus their cost-cutting energies on work and wage intenslficatlom At best, such strategies would offer only marginal Improvements to cost structures. Instead, firms should address the fundamental competttlve problem: inefficient factorj organisation resulting in high standard minute rusts and slow throughput. The adoption of dynamic approaches to flexibility is the only route to making substantial contributions to the clothing Industry's weak competItIveness.

B.4. The Competitive Position of the S.A. Clothing Industry
While the introduction of fundamental productivity improvements would greatly enhance S.A. competitiveness, there are limitations on potential market penetration. In particular, S.A. could never compete in low-priced, low-income markets. Exchange rate policy and local inflation alone would effectively bar South Africa from competing on this basis. This study finds that S.A. could compete internationally on seasonal products destined for medium priced markets. In the immediate term, S.A.'s competitiveness mainly rests on its market access: Since it is not a member of the Multi-fibre Arrangement (MFA), it is one of the few countries to which quotas do not apply. However, this advantage will soon fall away: Dramatic improvements to productive efficiency and marketing capabilities will be needed to compete thereafter. Locally, S.A. producers could compete against imports on the basis of quick response in seasonal and fashion items.
Section B.4.l. considers factors contributing to the competitive advantage or disadvantage of the S.A. clothing industry in the short and medium term including market access, cost- based factors and non-price related factors. Section B.4.2. then discusses niches in which S.A. could successfully compete, in both local and export markets.
B.4.1. Areas of Competitive Advantage and Disadvantage
Factors contributing to competitiveness may be of a short term or long term nature. Factors that affect long-term competitive advantage tend to be either structural or exogenous. Short term competitive (dis)advantage relates to areas that affect the industry in the immediate term (eg. 1—2 years) and can be influenced by micro-based policy.
Table B22 outlines three broad categories affecting competitive advantage for the S.A. clothing industry, including: market access, cost factors and non-price factors. In each area, S.A. has certain characteristics that offer short and long term advantages and disadvantages. Relative competitiveness depends on change in S.A. 's competitors, the balance of positive and negative characteristics and the time frame considered.
Market Access
S.A. has been a small supplier to world markets and, in a context of non-membership of the MFA, its clothing industry does not face the usual system of quotas. Although quotas could be constructed, their virtual absence constitutes one of S.A. 's main competitive advantages at present. Firms will want to diversify sourcing to S.A. as quotas are filled from other countries. This advantage will be short-lived: if it is to be fully utilised, S.A. must make every effort to immediately raise the volume of exports in order to maximise the initial level

74 INDUSTRIAL STRATEGY PROJECT
of quotas imposed.4° Within about 10 years, the MFA will become fully integrated into GAIT: this means that quotas and discriminatory protectionist measures will fall away. Foreign buyers will have much less interest in S.A. as the need to diversify sourcing is reduced.
On the negative side, local producers have experienced some difficulty expanding exports as a result of vestiges of sanctions. The impact of sanctions are felt on both sides of the trade relationship: Where country-of-origin labelling is required, the South African label still encounters some discrimination. For South African finns, the isolation from international markets has left weak exporting relationships and skills. These could be rectified with training and support services.
Cost Factors
Product Prices
Table G6 compares S.A. FOB export prices to those from Hong Kong, Turkey, Thailand and Italy.41 As would be expected, the Thai prices are lower than those S.A. can offer, while Italian export prices are higher. Prices tend to be comparable to those offered by other middle income countries, such as Turkey and Hong Kong. In fact, Table G7 shows that in 1990, S.A. hourly compensation and standard minute ratings were similar to those found in Southern and Eastern Europe and some Asian countries. Yet, a recent survey by the NCF has shown that local unit prices are well above the export prices. A comparison of unit prices would require more detailed information on the extent to which the clothing industry is subsidised in other countries.
The lack of continuity in trade policy is a short term competitive disadvantage. For example, the scheme of tariff protection and export promotion change so often that it is difficult for firms to offer forward prices with some certainty.
Finally, S.A. is not a Lome signatory and therefore pays duty into EC markets. This creates a 14% price disadvantage.
40See section C.3.1. It is not possible to set quotas lower than the previous year's imports: essentially, quotas are based on demonstrated capacity.
41 These figures are averages, calculated from UN export statistics. They offer a broad indicator of export prices
only. A substantial price variation would be expected, given the high degree of product differentiation in even the same 8digit tariff code. Furthermore, the prices may or may not reflect differences in quality, styling or brand strength.

CLOTH!NG SECTOR 75
Table B22: Competitive Position of the S.A. Clothing Industry
Long Term Short Term
Advantage J
Disadvantage Advantage Disadvantage
Market Access
End of MFA Lack of quotas Vestiges of sanctions
Cost Factors
Local raw materials High cost of raw materials
Exchange rate policy
Availability of local consultants
14% tariff into EC
Low productivity
Inconsistent trade policy
Non-Price Factors
Infrastructure
Reversed seasons
Strong union
Distance from export markets
Political uncertainty
Discipline of local retailers
Timeliness Quality
Will produce short runs
Lead times
Weak training
Weak design
Uncertainty of stoppages
Weak apparel textiles
Exchange Rale Policy
Clothing exports are highly sensitive to the balance of local inflation and exchange rate policy. In S.A., the real trade-weighted exchange rate has barely changed from the mid- 1980s. Essentially, the relatively high rates of inflation in S.A. have eclipsed any potential gains from the falling rand.
S.A. exchange rates will likely constitute a competitive disadvantage since S.A. is primarily an exporter of strategic minerals. This export base maintains the rand value at a higher rate

76 INDUSTRIAL STRATEGY PROJECT
than otherwise and militates against the long term competitiveness of S.A. clothing. With the balance of exchange rates and inflation detennined exogenously, it is not possible to make a policy choice to effectively devalue the price of labour.
Low Productivity
Low productive efficiency is found throughout the pipeline, both in manufacturing and in supplier relationships. Since local consultants are available, it would be possible to raise productivity if firms were committed to making full developmental use of this expertise.
Low productivity is a problem in both the clothing and textile industries. Section B.2.3. discusses poor productive efficiency in the clothing sector and section B.3.2. shows ways to address this problem. Figure 3 most clearly shows how inefficient production organisation has a negative impact on the competitiveness of S.A. 's clothing industry.
The costs of S.A. clothing production is also adversely affected by inefficiency in the textile sector. Section B.3.2. and Table B19 show that significant productivity gains can be made in the absence of changes in supplier relationships. However, improvements in supplier relationships and greater local efficiency in textile production could clearly offer an important boost to the competitiveness of local clothing. First, shortening lead times contributes to productivity by improving potential responsiveness to market demand, enabling shorter production runs and reducing losses associated with market forecasting errors. The long textile lead times allows clothing producers to justify high inventories: while these inventories may be higher than actually required, the untimely provision of fabric clearly contributes to higher interest and rental costs for clothing finns. Issues associated with textile lead times are discussed in the following section on non-price factors.
Second, reductions in rejects and fabric errors would contribute to higher efficiency in clothing production. The competitiveness of the S.A. clothing industry is adversely affected by the poor quality and relatively high prices of local fabrics. This situation is exacerbated by poor communication and inefficiency in the pipeline, resulting in long lead times and weak market responsiveness by fabric producers.
If the industry were dependent on international CMT orders, where overseas contractors supplied duty-free fabric, inefficiency in the textile-clothing pipeline would not be a significant problem. However, the industry is well established but operates in a relatively high cost environment. The November 1992 increase in fabric protection from 20% to 50% ad valorem, will further exacerbate cost structures if textile producers import parity price: The competitiveness of S.A. clothing will be more dependent on the responsiveness and efficiency of local textile producers.
Fabric damages or errors can result in major problems for the clothing producer. If a roll is the wrong width, the producer may need to make new markers. If rolls are returned for

CLOTHING SECTOR 77
reasons of faults or dyes, clothing lead times are raised and production planning must be re- organised. In rolls that are not rejected, fabric faults contribute to clothing rejects. Some faults can be determined at the fabric examination stage, particularly if the faults are properly "strung".42 Some faults are not detected and result in clothing factory rejects. At worst, an entire roll may be defective, but only recognised once the entire production run has been completed: the problem is often manifest either in defective seams or problems at the pressing stage. Where short cycle manufacturing techniques and in-line quality checking are introduced, this problem should be virtually eliminated.
Table B23 compares the frequency of fabric damages in local and imported fabric. More than 7 faults were found on 1/3 of all local rolls sampled. By comparison, more than 7 faults were found on only 1/5 of imported rolls sampled. On average, South African fabric has about 8 faults per lOOM, while imported fabric has about 6 faults every lOOM. This means that S.A. fabric has 20% more faults than imported fabric. A more commonsense description of these statistics would show the following: If one metre of fabric is required per garment produced, then these fabric flaws would result in one clothing reject per 13 garments produced if local fabric is used. Alternatively, imported fabric would result in a reject rate of one garment in every 16 items produced.
Although the overall quality of imported material is higher, there are some quality advantages to buying locally. For example, the occurrence of unobserved fabric faults is higher in imports. Table B23 shows that the chances of finding unstrung (unmarked) damages is almost 3.5 times higher in imported goods. This means that while the overall fabric reject rate may be lower on imports, the likelihood of final rejects is actually higher.
Table B24 presents the source of clothing defects over a 2 year period. This data is offered by retailers, where the rejects represent returns by final consumers. These figures show that the proportion of rejects caused by faulty fabric have risen from 35% in 1989 to 45% in 1992. Table B25 offers a breakdown of the source of fabric quality problems. The most significant problems for both wovens and knitted products include colour changes, holes in the fabric and general fabric flaws. Colour changes seem to be a growing problem in woven products and a diminishing issue for knitwear. By contrast, holes in fabric seems to be a growing issue for knits and a diminishing one for wovens. The figures presented in these tables may be skewed since they do not reflect returns to manufacturer (RTMs) by the retailer. RTMs range significantly by retailer practice and economic conditions. For example, retailers tend to reject more goods in a recession on the basis of slight transgressions in
42A string is placed beside the fault so that it can be immediately identified. In this case, the clothing producer loses only on the fabric waste: If the fabric fault is put through production, the manufacturer also loses on the costs associated with the process of adding value.

78 INDUSTRIAL STRATEGY PROJECT
Table B23: Frequency of Fabric Damages: S.A. Clothing
Local Fabric Imported Fabric
No. of Fabric Rolls 742 177
Total Length (M) 55209 13,187
Avg Roll Length (Wroll) 74 75
Strung Damages* 3,214 190
Unstrung Damages* 986 637
Total Damages 4,200 827
Avg # Damages per Roll 5.6 4.7
Avg # Damages per lOOM 7.6 6.3
Avg # Strung Damages per lOOM 5.8 1.4
Avg # Unstrung Damages per lOOM
1.8 4.8
% of Rolls with 0-9 faults per lOOM
68.7 77.9
% of Rolls with more than 9 faults per lOOM
31.3 22.1
Source: NCF Diary (1993:295).
Notes: The fabric manufacturer is meant to put a string by damages in the fabric so that the purchaser can readily find them. Damages that are not marked by a string present a greater problem to the clothing producer since their existence necessitates greater quality checking at the outset and may result in unexpected rejects in the production process.

CLOTHING SECTOR 79
Table B24: Source of Defects: S.A. Clothing (%)
1989 June 90 —
Nov 90 Dec 90 —
May 91 July 91 —
Dec 91 Jan 92 —
June 92
Fabric 35.2 38.2 34.6 47.3 45.1
Other 64.8 61.8 65.4 52.7 54.9
Total 100.0 100.0 100.0 100.0 100.0
Source: NCF Diaries (1991:145, 1992:260 and 1993:292).
Note: This data is calculated on the basis of returns to retailers. The NCF estimates that these returns
represent 0.004% of total goods produced and sold by manufacturers in Sm. These statistics underestimate and may skew the actual picture since retailers also return goods to manufacturers. One consultant estimates that retailer returns may account for up to 6% of ex-factoty sales.
delivery times.43 The NP! (1992) sample found that 2.3% of output is rejected in-factory; A further 1.5% are returned by retailers. This would result in a total reject rate of 3.8%. The survey undertaken by this report found that the NPI figures on in-factory rejects were fairly accurate; Alternatively, the experience of RTMs was much higher than found by the NP!, in some cases rising to 6%.
One manufacturer has suggested that griege be imported duty-free. In the long run, this may make sense since finishing is the major coniributor to "value-added". However, at present, one of the major impediments to the competitive supply of S.A. textiles is inefficiency and unresponsiveness of dyeing and finishing. It is not clear whether duty-free griege would
improve supply of domestic textiles or simply encourage unfair competition from Asia.
43The NP! (1992) found that in-factory rejects do not vary much by scale or region. However, RTMs vary noticeably by region (RTMs in Natal firms are more than 1% less that in the Cape or Transvaal) and by scale (returns for small firms are almost 3% higher than for large firms). The degree to which R'FMs are determined by efficiency or bargaining power with retailers is unclear.

80 INDUSTRIAL STRATEGY PROJECT
Table B25: Source of Fabric Defects: S.A. Clothing
1989 June 90- Nov 90
Dec 90-
May 91 July 91- Dec 91
Jan 92- June92
WOVENS
colour change 12.50 17.80 26.30 8.25 21.06
holes in fabric 12.50 11.52 10.40 9.09 7.32
fabric flaws 15.90 13.35 16.47 13.32 12.42
shrinkage 3.97 5.76 6.94 9.51 5.76
print flaws 2.84 1.83 2.02 1.06 2.00
misc 1.42 0.79 1.16 0.85 1.55
s/total 49.23 51.05 63.29 42.07 50.11
KNITS
colour change 11.64 15.18 8.38 9.73 11.31
holes in fabric 25.85 17.02 18.21 21.14 22.17
fabric flaws 5.11 4.71 4.05 15.22 8.87
shrinkage 3.69 7.85 2.89 7.19 2.22
print flaws 3.41 3.40 2.31 1.27 2.88
misc 1.14 0.79 0.87 3.38 2.44
s/total 50.84 48.95 36.71 57.93 49.89
Non-Price Factors
S.A. has a number of non-price advantages in the short run. In particular, it is a relatively sophisticated industry, having been subject to the rigours of local retailer specifications. In addition, local producers are willing to provide shorter runs than their Asian counterparts.
S.A. is disadvantaged since its lead times are slow, partly exacerbated by poor skills training and weak production organisation. S.A. does not have a reputation for design, although it does have some capacity to copy foreign designs. Design capacity could be addressed by improving local courses or encouraging foreign designers to locate in South Africa.
CLOTHING SECTOR 81
To successfully compete locally and internationally, S.A. clothing producers must be highly innovative in terms of responsiveness, quick turn-around times and style. Ideally, the clothing industry should produce locally designed and high value-added products. Some of the input requirements for these products could be met with imported fabric. Imports allow for extra product diversity. However, competitiveness on the basis of style, quality and timeliness
requires a strong domestic apparel textile industry and effective communication in the pipeline. While less important in clothing subsectors producing long runs in low-income markets, a dependency on imported fabric would severely limit the clothing industry's capacity to sufficiently raise the number of style changes per year.
Information garnered from seven major S.A. clothing producers, covering the range of product areas, noted that local lead times on fabric orders are longer than those for imports. On average, the expected lead time from order to receipt of local goods is 2—3 months. The minimum lead time mentioned was 6 weeks. The very large producers, who tend to place sizable, relatively constant orders with textile manufacturers can at times receive their goods more quickly. Lead times for imports were slightly shorter: Firms expect to wait between 1-3 months for overseas orders. This compares unfavourably with the experience in other middle income countries, producing similar products. For example, Turkish firms interviewed in 1992 pointed to local lead times as short as one week.
The textile companies complain that clothing manufacturers are partly to blame for late deliveries: The most frequent comment refers to late orders and specifications that are not sufficiently clear.
While partly responsible for the weak communication, clothing manufacturers complain of long lead times and late deliveries; poor quality, particularly in dyeing and printing; incorrect roll widths; and poor responsiveness to market demand.
In a 1991 survey of Cape Town clothing producers and retailers, 6 quick response experiments were found. The types of products were not those ideally requiring this activity: Examples include the production of t-sbirts or underwear. Most of these experiments were not working well. It seems that there is a lack of trust in the pipeline. In some cases, textile factories book space for a clothing manufacturer but then offer this space to another bidder for fear that the clothing firm will not honour the agreement.
Political uncertainty affects both short and long term competitiveness, depending on the time frame of transition. In the immediate term, there is some uncertainty concerning labour action. In the longer term, if the violence continues some buyers may be discouraged from
44A representative of the EC and the Dutch employers association noted that Dutch buyers prefer to provide their own textiles when processing nearby. However, it is common practice to use local textiles when processing in the Far East (M.Scheffer, 05/93).
82 INDUSTRIAL STRATEGY PROJECT
sourcing in S.A. On the positive side, a strong, centralised union for clothing and textiles, enables the coordination of industrial development policy on a Iri-partite basis.
The distance from the main export markets raises the inherent costs and lead times. Yet, transport costs are low and many of the world's main suppliers, such as Hong Kong or China, are also distant from their main export markets. This problem essentially circumscribes potential areas of competition: for example, S.A. would not be a supplier of quick response goods, but might instead compete in seasonal items. On the positive side, the reversed seasons is a competitive advantage since the slack production periods in S.A. are the busy order times for the EC and North America.
A strong infrastructure is an important non-price competitive advantage. Highly developed transport, banking and telecommunications networks facilitate easy business operations.
B.4.2. Niches that Reflect S..A.'s Competitive Position
Figure 11 presents six broad product areas for the clothing industry, in a matrix accounting for high and low priced, basic, seasonal and fashion garments. The provision of fashion items renders lead times a more important competitive factor. Shifting toward higher value added markets requires more attention to quality. Success in any of these broad product areas is partly determined by distance from markets and cost structures.
The S.A. clothing industry must worry about maximising global market share: As discussed in section C.2., this does not entail a surrender of local markets to import penetration. Essentially, this study finds that S.A. could compete in export and domestic markets in middle priced seasonal goods. Domestically S.A. producers should compete with imports on the basis of Quick Response in fashion items as well.
There are clear product markets in which S.A. could not be competitive in either the short or long term. The high cost structure, relative to other less developed countries such as China or Thailand, excludes S.A. from any success in markets competing solely on price. In fact, S.A. could only follow a low cost strategy if the exchange rate were devalued to a small fraction of its current position. This is unlikely given the export structure which is highly mineral and gold-based. The long lead times resulting from inefficiency and distance from markets render success in quick response and fashion garments remote. S.A. must compete on the basis of non-price factors such as quality, professionalism, infrastructure and market access.
S.A. would be most competitive in products that are high price/quality and classic in styling. Examples of high price/quality/classic product include middle-income men's suits, classic- styled or tailored women's clothing, high quality jeans and high quality women's underwear

CLOTHING SECTOR 83
Figure 11 Clothing market niches
Low price
Fashion
Med-I-hgh price
Fashion
Low Price
Seasonal Med-High Price
Seasonal
Low Price
Basic Med-High Price
Basic
products. These goods could be provided in two ways: as CMT and as final goods. Since the present capacity for international marketing is very weak, exports could be expanded more rapidly through international CMT.
S.A. has a clear short-term competitive advantage as an international subcontractor. It is not a member of the MFA, and to date, has been a very small supplier to world markets: S.A. is therefore one of the few remaining developing countries to which no quotas apply. This fact will act as an important attractant for manufacturers and retailers overseas that are looking for alternative sources. It should be noted that firms do not choose subcontractors solely on the basis of price. While S.A. has a clear price advantage over its main markets in the EC, its cost of production is currently higher than in other middle income countries with which it would compete. S.A.'s main competitive advantage relies on the desire of buyers to diversify their production sources and avert import quotas.45 While any long term strategy cannot depend on this fact, in the immediate future S.A. could use this situation to re-enter global markets and develop international marketing skills and contacts.
The difficulty S.A. factories currently face with quick style changes in the production line would, to some degree be alleviated by the expansion of export markets in the high cost classic and CMT lines. Export orders tend to be much larger than local ones. Production runs
USA, Canadian and EC buyers all ranked quality, delivery and reliability as the most important factors in sourcing decisions for designer and brand label goods. Competitive pricing ranked fourth after fashion and styling. Other important factors included the existence of a developed manufacturing base, the availability of fabric and the ability to produce to size standards (Harris and Heppeil 1991:93).
A C,) a) E F- -D a) -J
Quality
84 INDUSTRIAL STRATEGY PROJECT
for outerwear destined for the local market, excluding those for low priced, commodity products, tend to vary between l000—5000 units. On the other hand, export orders tend to be a minimum of 10,000 units, and can often run to 30,000+ units. In this vein, S.A. offers an advantage for overseas contractors: Large orders are possible within the large factories that dominate the industry. Moreover, since there is relatively little subcontracting in the S.A. clothing industry, foreign buyers can be sure that output will be of a consistent quality. This can be a common problem in other DC clothing and textile producers, where subcontracting is the dominant form of production and quality varies by factory.
In the longer term, it would be necessary for the S.A. clothing industry to become an exporter of high price/quality, fashion garments. Alternatively, S.A. would need to develop strong brand names in classic product markets. S.A.'s competitive advantage in the long-run classic lines will be short lived: It will not be long before S.A. 's most significant current competitive advantage in not facing quotas will be eroded. Second, this product is not sufficiently differentiated to offer any producer a long term advantage. It is likely that new NICs will, over time, improve quality levels and proceed from low cost commodity to higher cost classic products. If S.A.'s current exchange rate policy continues, all things being equal, the local clothing industry's cost per standard minute will be too high to compete on relatively undifferentiated products.
S.A. may have a long-term competitive advantage in products that are more capital intensive. In essence, its cost structure is lower than that found in most other capital rich countries. An example that clearly stands out is the knitwear industry. This refers to the production of both jerseys and sportswear produced from single-knit jersey. The local knitwear industry has shown to be more competitive than most other subsectors. For example, in the Cape, employment has been stable (at about 7,000 employees) over the period of 1990—2. In the same period, Cape clothing employment fell by 12% (or about 5,000 jobs) to a total of 41,317. The relative stability of knitwear employment coincided with the introduction of the SAP: the duty free imports associated with the SAP were originally focused on knitwear imports. In 1991, the duty paid on knits was only 8% of the tariff revenue expected. Clearly, the knitting industry was either capable of competing with world prices or has a clearly defined niche which imports did not dramatically threaten.
A number of factors may explain relative stability in knitwear. These are related to its capital intensity, ownership structure and/or specific product area. The capital intensity of knitting may raise the cost of closure, thereby enhancing the relative incentive to restructure. On the other hand, upgrading becomes more expensive. In terms of ownership structure, most of the major knitting companies are owned by larger corporations that monitor performance. Almost all knitwear factories visited had undergone important restructuring exercises. This openness and requirement of organisational change may not have been possible for an independent firm. Finally, most knitwear factories focus on medium-higher value added markets, with a focus on both styling and yarn characteristics. It is common for knitting companies to acquire overseas labels. The relative success in knitwear may suggest that the more labour intensive aspects of the clothing-textile pipeline do not have a long-term future. In the

CLOTHING SECTOR 85
immediate term, the clothing industry might be a quick and cheap employment generator. In the long-term, it may be the knitwear and textile industries that provide stability.
In conclusion, the S.A. clothing industry already demonstrates some capability in providing the local market with med-high priced fashion goods, within a protected environment. In an unprotected market, the industry would need to improve its lead times, productivity, and design capability. Moreover, input prices, delivery and flexibility would need to be addressed. This could be achieved by introducing SCM techniques and QR relationships. In addition, the textile industry would need to raise its efficiency and responsiveness to market demand.
Section B.4. considered the competitive advantages and disadvantages of the South African clothing industry in an international context. The competitive position was discussed both in terms of export market penetration and Import competition. The niches that could be pursued successfully were determined on the basis of S.A.'s position in terms of market access, cost factors and non-price factors.
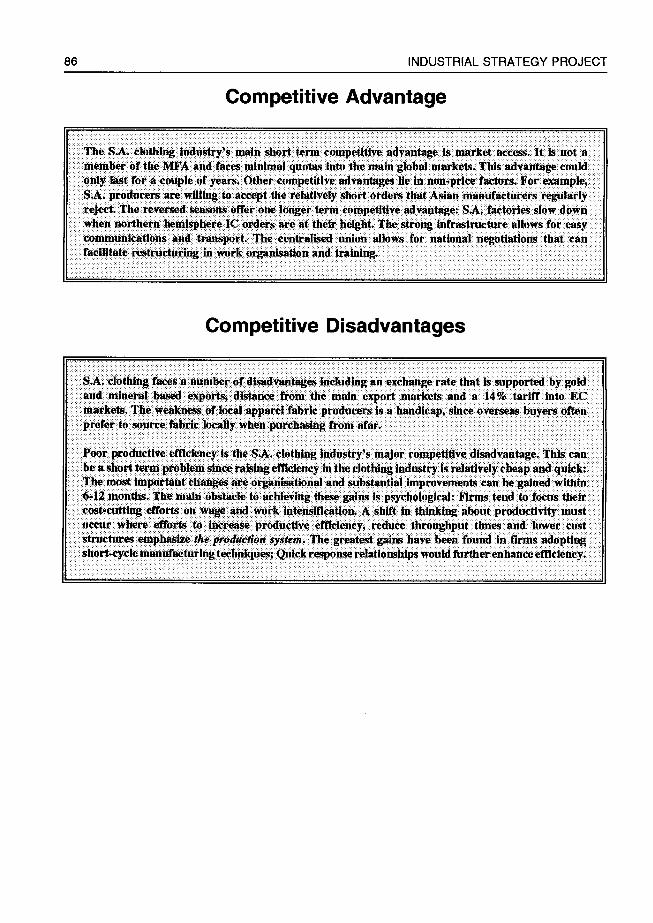
86 INDUSTRIAL STRATEGY PROJECT
Competitive Advantage
The S A clothing Industry's main short term competitive advantage is market access It Is not a member of the MFA and faces minimal quotas into the main global markets This advantage could only last for a couple of years Other competitive advantages He in non.prke factors For example, S A producers are willing to accept the relatively short orders that Asian manufacturers regularly reject The reversed seasons offer one longer term competitive advantage S A factories slow down when northern hemisphere IC orders are at their height The strong infrastructure allows for easy communications and transport The centralised union allows for national negotiations that can facilitate restructurmg in work organisatlon and training
Competitive Disadvantages
S A clothing faces a number of disadvantages including an exchange rate that Is supported by gold and mineral based exports, distance from the main export markets and a 14% tariff into EC markets The weakness of local apparel fabric producers is a handicap, since overseas buyers often prefer to source fabric locally when purchasing from afar
Poor productive emciency Is the S A clothing industry's major competitive disadvantage This can be a short term problem since raising effiezency in the elotbtng industry is relatively cheap and quick The most Important changes are organisational and substantial improvements can be gained within 6.12 months The main obstacle to achieving these gains is psychological Firms tend to focus their cost cutting efforts on wage and work intensification A shift in thinkIng about productivity must occur where efforts to increase productive efficiency, reduce throughput times and lower cost structures emphasize the production syStem The greatest gains have been found in firms adopting short-cycle manufacturing techniques, Quick response relationships would further enhance efficiency

CLOTHING SECTOR 87
Market Niches
This report refers to 6 broad market niches, Including low price or higher priced fashion, seasonal and basic goods. The fashion! seasunaWhasic goods are demarcated by their replenishment time. Where a fashion Item may he replaced wlthlii a month, a basic Item may have a shelf life of over a year. S.A. would not successfully compete in low priced goods. Iluless there were a major currency devaluation, its cost structure reflects that of a middle Income couiitry.
in export markets. Its main competitors are other middle Inconie countries such as Turkey, Southern Europe, or parts of SE Asia. Overseas buyers will mainly seek to buy from S.A. to diversify their sources and to order smaller runs. Since the distances are large, SA. would he stronger in middle- priced seasonal or basic items, with longer replenishment times. To compete In the medium term, it will be necessary to dramatically raise efficiency: the lower income countries such as China will soon achieve capabilities In the production of mid-Income seasonal and basic garments.
In local markets, S.A. mainly imports from Taiwan, China and Hong Kong and, to a lesser degree, from Europe. Even if productivity Improved dramatically. S.A. producers could not compete with the low priced Aslami Imports. Its competitive advantage would lie in the development of quick response relationships in the production of medium-high market basic, seasonal and fashion items.

Chapter C: Market Orientation
There is no inherent benefit to tightly protecting the local market nor myopically promoting exports. S.A. clothing firms would aim at maximizing global market share. Labour organisation would seek to maximize the availability of sustainable, formal jobs. The preferred strategy, whether inward, outward or balanced, must reflect the economic realities of competitive strengths and market stmctures. Although some argue that export promotion is more beneficial in its encouragement of productivity growth, the causal mechanism is unclear. Moreover, liberalisation is often suggested to improve the availability of cheap good for consumers; yet, savings from cheap imports do not necessarily filter through to the consumer unless the distributive sector is highly competitive (see Appendix 4). Others argue that the local market and jobs must be protected from imports: this ignores the potential for developing export markets.
South Africa would most effectively find some balance in local and export markets. Excessive protection would limit the cheap imports required, whilst discouraging export activity. In addition, high protection will be increasingly difficult to sustain as S.A. becomes more integrated into GAIT. Excessive liberalisation would cause job loss as goods are dumped into the local market. Trade policy, as a component of broader industrial policy, would most usefully focus on developing those areas of the clothing industry in which S.A. could become competitive. As discussed in section B.4., S.A. would not be able to compete with extremely cheap countries.46 S.A. might be competitive in middle priced seasonal clothing for local and export markets.
The experience of trade policy in S.A. has been mixed. The import substitution policies from the 1920s were successful: By the 1970s, the domestic clothing industry met almost all of local demand. A new interest in export policy emerged in the 1980s: Unfortunately, export promotion and import protection have been determined in an ad hoc and unintegrated maimer. This has severly damaged the S.A. clothing industry. The combination of policies has unintentionally encouraged a rapid increase in import penetration, without adequately expanding export markets. Ultimately, a more balanced development policy will be required: adequately protecting the local market, encouraging exports and, most importantly, providing developmental incentives to promote productivity and employment opportunities.
Section C. 1. describes the historical trade orientation of the S.A. clothing industry. Initially inward focused, there is an increasing interest in promoting exports. The problems with the
46This does not mean protection should be dropped on imports from low cost countries. The process of effectively protecting the local market from dumping is extremely difficult. In many cases, importers under-invoice, where goods destined for medium-high priced markets are falsely imported as worn or cheap clothing to evade tariffs. Alternatively, some low cost-countries (most notably China) unfairly compete on the basis of prison or child labour and price controls.

CLOTHING SECTOR 89
mix of import protection and export promotion policies are analyzed. Section C.2. briefly considers alternative trade orientations, concluding that a balanced approach, promoting trade without needlessly surrendering the local market, is most appropriate. Finally, section C.3. considers the range of policies to support a balanced trade orientation. Recommendations are made for import protection and export promotion policy, taking into account constraints
posed by domestic institutions and international arrangements.

Ci. Historical Policy and Trade Orientation
Trade policy for the S.A. clothing industry has primarily been inward focused. Even once import substitution was successfully completed by the 1970s, policy continued to emphasize protection. By the late 1980s, some shift toward export promotion occurred: The expansion of exports over the four years of promotion has been minimal relative to the growth in import penetration.
C_I .1. Protecting the Local Clothing Industry
The clothing industry in S.A. has traditionally been the focus of state attention: initially, to promote industrial development, to generate employment for Afrikaner women (1 920s) and to support industrial decentralisation policy (1960s-f). Clothing was initially supplied by coastal importer-wholesalers. The state promoted its development with the implementation of import substitution policies, as was the norm in many countries at that time.47
Table Cl outlines the evolution of levels and forms of protection in the S.A. clothing industry. In the post-war period, nominal clothing tariffs have ranged from 30% to over 100%. Until the late 1980s, the clothing duties were either lower or on a par with those applying to textile fabrics. Fabric duties, initially instituted from the 1950s, were constantly revised upwards and ranged between 25—42%. Between 1952—92, rates of textile protection were revised 14 times (Steenkamp). The system of protection is extremely complicated and has made liberal use of formula and specific tariffs.
It is difficult to pinpoint effective barriers given the non-transparency of protection, particularly from the 1950s. In focusing on the level of ad valorem tariffs, the clothing industry would seem to have rightly complained about the relative balance of tariffs in the pipeline. In many periods, textile ad valorem rates were actually higher than those for clothing. However, focusing on these tariffs masks the true balance in rates of protection. From at least 1989, the formula duties were the more significant form of protection in the clothing industry. On the other hand, inflation quickly eroded the reference prices applying to fabrics so that a flat 20% ad valorem generally applied. It is quite possible that this discrepancy was also true in previous periods. For example, the Steenkamp Report notes that 30% of fabric codes were covered by formula duties in 1983. In addition, relatively ad hoc quantitative restrictions have offered another important form of protection since the 1950s.48
47lmport substitution policies generally entail the protection from imports until the new domestic industiy is
capable of competing. Associated development policies also commonly offer a range of developmental subsidies and other forms of support.
48Quantitative restrictions were always the ultimate form of protection, particularly from 1949 to 1989 (Cassim:34, Bell:8). In 1989 appmximately half of the textile tariff codes were exempt from the list of items to which quantitative restrictions applied (Bell:8). However, ad hoc informal restrictions continue to be an ultimate

CLOTHING SECTOR 91
Types of Import Tariffs
A tariff or duty is a lax on imports. normaHy imposed to protect iroiri import competition. Three types of tariffs arc ide.ntilixl: ad valorem. specilic and formula. An ad valorem is the simplest: it is lixed at a percentage of the import value. A specilic duly is a rand amount paid on every kg ir unit imported. A fummia duty is the most complicated: it is calculated on the basis of a 'reference price per kg or unit imported. with the reference price adlusted downward by a set proportion of the import price. For example. assume a garment is imported at R5() per unit, and each garment weighs 0.5 kgs (or 2 units per kg):
lithe ad valoreni duty is 50%. then the tariff per unit is R25. lkmice. each garment will be imported at a total price of R75.
If the specific duty is k50/kg. then the tariff per unit is R5012 = R25. Again, each unit will be imported at a total price, of R75.
Jf the formula duty is Rl2OIkg-0.7 (import price/kg). then the tariff is R120-O.7 (Rl()) = RSOIkg or R25
per unit.
The substantial dispersion of tariffs adds further confusion to tariff determination. The tariff schedule outlines different duties according to the 8-digit SITC code. Such disaggregation results in a determination for about 2000 clothing and textile tariff codes. There is a high tariff dispersion, with large variances even within 6-digit categories. The "laser beam approach" (Bell 1993) to tariff determination means that often importers falsely declare goods under alternative, albeit closely related, codes. This disaggregation is unrealistic, since Customs officials are generally unable to distinguish between fine demarcations in product category.
The protective measures outlined above were very effective in limiting import penetration. Nicol (1984:38) shows that import penetration fell from 83% in 1918 to 49% in 1939. By 1975, only 10% of the local market was supplied by imports. Table C2 shows that, in value terms, imports began to rise from 1986.
protective measure.
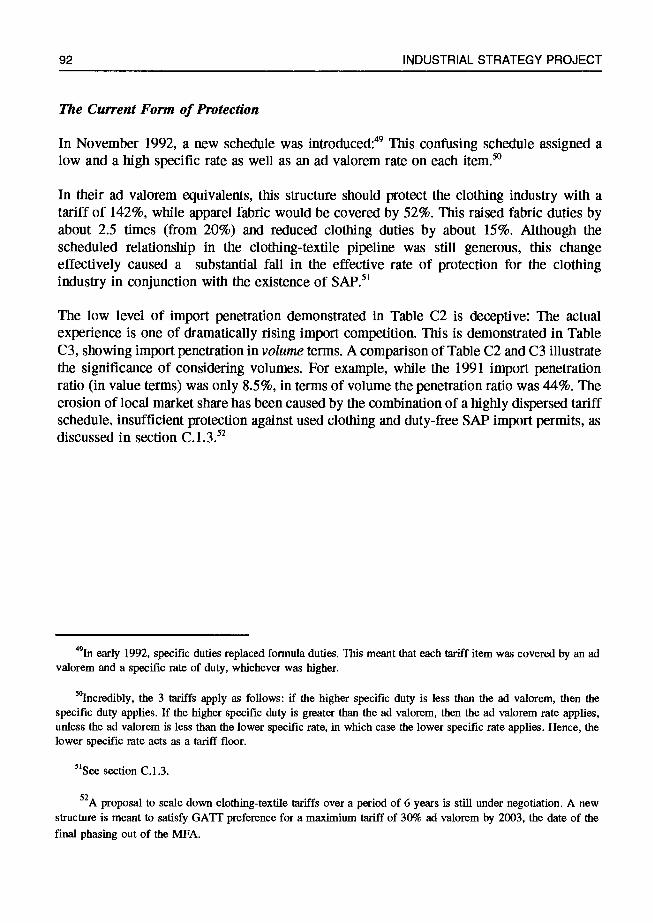
92 INDUSTRIAL STRATEGY PROJECT
The Current Form of Protection
In November 1992, a new schedule was introduced:49 This confusing schedule assigned a low and a high specific rate as well as an ad valorem rate on each item.5°
In their ad valorem equivalents, this structure should protect the clothing industry with a tariff of 142%, while apparel fabric would be covered by 52%. This raised fabric duties by about 2.5 times (from 20%) and reduced clothing duties by about 15%. Although the scheduled relationship in the clothing-textile pipeline was still generous, this change effectively caused a substantial fail in the effective rate of protection for the clothing industry in conjunction with the existence of SAP.51
The low level of import penetration demonstrated in Table C2 is deceptive: The actual experience is one of dramatically rising import competition. This is demonstrated in Table C3, showing import penetration in volume terms. A comparison of Table C2 and C3 illustrate the significance of considering volumes. For example, while the 1991 import penetration ratio (in value terms) was only 8.5%, in terms of volume the penetration ratio was 44%. The erosion of local market share has been caused by the combination of a highly dispersed tariff schedule, insufficient protection against used clothing and duty-free SAP import permits, as discussed in section C.1.3.52
491n early 1992, specific duties replaced formula duties. This meant that each tariff item was covered by an ad valorem and a specific rate of duty, whichever was higher.
50lncredibly, the 3 tariffs apply as follows: if the higher specific duty is less than the ad valorem, then the
specific duty applies. If the higher specific duty is greater than the ad valorem, then the ad valorem rate applies, unless the ad valorem is less than the lower specific rate, in which case the lower specific rate applies. Hence, the lower specific rate acts as a tariff floor.
51See section C.l.3.
52A proposal to scale down clothing-textile tariffs over a period of 6 years is still under negotiation. A new structure is meant to satisfy GATI' preference for a maximium tariff of 30% ad valorem by 2003, the date of the final phasing out of the MFA.
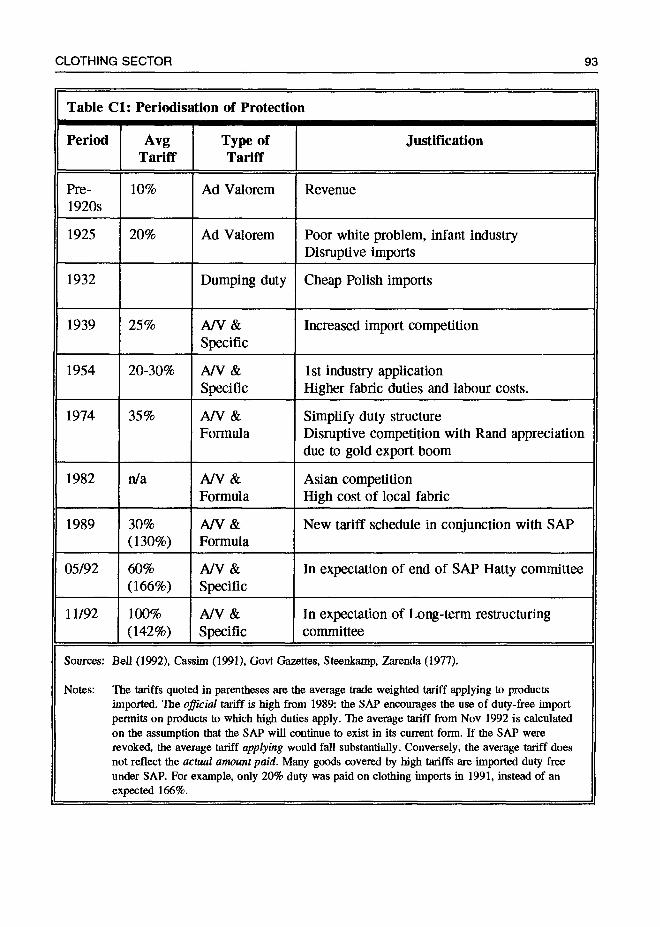
CLOTHING SECTOR 93
Table Cl: Periodisation of Protection
Period Avg Tariff
Type of Tariff
Justification
Pre- 1920s
10% Ad Valorem Revenue
1925 20% Ad Valorem Poor white problem, infant industry Disruptive imports
1932 Dumping duty Cheap Polish imports
1939 25% NV & Specific
Increased import competition
1954 20-30% A/V &
Specific 1st industry application Higher fabric duties and labour costs.
1974 35% A/V & Formula
Simplify duty structure Disruptive competition with Rand appreciation due to gold export boom
1982 n/a A/V & Formula
Asian competition High cost of local fabric
1989 30% (130%)
NV & Formula
New tariff schedule in conjunction with SAP
05/92 60% (166%)
A/V & Specific
In expectation of end of SAP Hatty committee
11/92 100%
(142%) A/V & Specific
In expectation of Long-term restructuring committee
Sources: Bell (1992), Cassim (1991), Govt Gazettes, Steenkamp, Zarenda (1977).
Notes: The tariffs quoted in parentheses are the average trade weighted tariff applying to products imported. The official tariff is high from 1989: the SAP encourages the use of duty-free import permits on products to which high duties apply. The average tariff from Nov 1992 is calculated on the assumption that the SAP will continue to exist in its current form. If the SAP were revoked, the average tariff applying would fall substantially. Conversely, the average tariff does not reflect the actual amount paid. Many goods covered by high tariffs are imported duty free under SAP. For example, only 20% duty was paid on clothing imports in 1991, instead of an expected 166%.

94 INDUSTRIAL STRATEGY PROJECT
C.L2. The New Interest in Export Promotion
A shift in policy focus was initially marked by the Reynders (1972), Van Huysteen (1979), Kleu (1983) and Steenkamp (1983) Commissions. A slow progression from the initial enquiry into export expansion was made in the development of export promotion policies, finally culminating in the introduction of the Structural Adjustment Programme (SAP) and the General Export Incentive Scheme (GElS) in 1989 and 1990 respectively.
The Reynders Commission was the first to officially suggest the promotion of manufactured exports. This was a response to a balance of payments difficulty and a noticeable fall in manufactured exports (Cassim:125). The Commission focused only on export expansion, assuming that "no real conflict" between export expansion and import substitution policies existed (Reynders:630). Export incentives implemented in 1972 were superficial: cash grants were offered to exporters to cover costs of freight and marketing. The van Huyssteen Report followed, suggesting that a fuller range of assistance be offered, including tax concessions, a 50% duty rebate on inputs used for export and a fixed rate of assistance (10%) based on the value added in exports.53
The two subsequent reports increasingly considered the balance required to promote industrial growth with trade policy. The Kleu Commission argued that trade policy continued to discriminate against exports since manufacturing exporters could not buy inputs at world prices. The Steenkamp report, which focused specifically on clothing and textiles, suggested a more holistic approach, broaching the issue of competitiveness. The Commission's view was still unbalanced in its assumption that reduced protection would necessarily encourage greater competitiveness and a growth in exports. Bell queries the assumption of a "challenge- response mechanism" pointing to the improbability of a liberalisation accomplishing what a recession and falling domestic demand failed to achieve (Bell 1992:30).
Prior to the introduction of the SAP and GElS, fluctuations in the real exchange rate were possibly the most important influence on clothing exports levels. First, the intensification of sanctions in conjunction with a significant real appreciation of the Rand in 1980 resulted in a 25% fall in the real value of exports in 1981 (Bell 1992:6). Exports only expanded after 1983 when the rand devalued in response to a liberalisation of forex controls, a fall in the gold price and political instability (Bell:8). In particular, the massive devaluation that ensued in 1984 and 1985 resulted in a more than doubling of real clothing exports from their 1983 level. Exports fell to 60% of the 1985 level between 1987—89 in response to intensified American sanctions and a real appreciation of the rand (Bell 1992:6).
53The value added in exports is calculated as the FOB price less the cost of protected inputs.
541n 1984, the USA took approximately 10% of S.A. clothing and textile exports (Weberloff 1987, p152).
CLOTHING SECTOR 95
In 1989, the Structural Adjustment Programme (SAP) for the clothing and textile industries was introduced. This was the first programme to recognise the competitive disadvantage that the trade regime poses for export expansion. A compensating programme was implemented to reduce discrimination against exports. For the clothing industry, this meant that firms exporting at least 2.5% of their output would be allocated negotiable duty free pennits to import clothing or fabric up to the value of 70% of the previous years' exports or; fabric up to the value of 10% of inputs purchased domestically in the previous year.
The SAP benefits are partly linked to export growth since rebates are dependent on the amount exported. Moreover, when exports cross the threshold of 15% and 20% of a firm's turnover, the amount that can be imported duty free expands to 12.5% and 15% of the previous years' domestic input purchases.
Strangely, goods imported on a SAP duty-free permit can be used for either the domestic or export markets. Two types of permits are distributed: One can be used for the import of fabric only (rebate schedule 311), while the other can be used to purchase either fabric or clothing (schedule 460.11). In 1991, clothing producers allocated only 28% of these permits to fabric imports. By 1992, it became necessary to specify quotas by which the permits could be used, as seen in Table C7. Particular limitations were placed on the import of knitted fabrics and clothing (BTT Report No. 2646, 1991), Textile Federation, "Issue of SAP Permits", mimeo June 1992).
The initial SAP expired in April 1993, with import permits issued valid through to April 1994. A slightly modified SAP was introduced for 1993/4: This places a ceiling on the potential tariff savings to limit the concentrated use of pennits in highly protected, trade sensitive products.55
While a duty-drawback scheme does exist (470.03), it is far less attractive than the SAP. This rebate is directly tied to imports used in the production process of exports. Exports covered by 470.03 can be counted as part of the 2.5% threshold requirement to receive SAP permits, but do not qualify for the duty free permits themselves. It is not advantageous for companies exporting more than 2.5% of output to use the 470.03 rebate since it would allow for duty free imports of fabric to the equivalent of approximately 50% of exports. This compares to SAP which offers more than 70% of the export value. Despite the SAP advantage, 41% of duty free fabric imports entered under rebate 470.03 in 1991. A number of explanations for the use of the duty drawback scheme could be posited. It is possible that many clothing exporters do not export more than 2.5% of their turnover. These exporters would not be eligible for SAP benefits. Alternatively, the SAP may result in a greater cash
55The new system allows an exporter to save 30% of duties on 70% of the value of exports. For example, if Rlmn is exported, then up to the value of 70% of export sales (RO.7mn) is eligible for tradeable duty free permits. However, the total duty savings possible are equal to 30% of the R0.7mn= R.2lmn. This is in addition to the duty free imports allowed on the basis of the use of local textiles as inputs.
96 INDUSTRIAL STRATEGY PROJECT
flow problem relative to the duty drawback, for smaller firms in particular. The SAP offers a tax savings in the following year, while the 470.03 is rebated immediately. Hence, although the SAP may be more lucrative, the cash flow problem and a possible need to borrow at high interest rates to tide a company over until the following year may render the SAP less attractive to companies that do nevertheless qualify for both programmes.
The General Export Incentive Scheme (GElS) was introduced in 1990 for all industries. It is meant to help offset the competitive disadvantage experienced by S.A. finns as a result of inflation, exchange rate fluctuations and the price of local inputs. The amount of cash assistance offered by GElS is varied by an inflation and exchange rate adjustment factor. In 1991, clothing exporters could benefit from assistance worth 19% of the value of a firm's exports. From October 1992, this rate increased to 19.5% (see Appendix 2).
The combined effect of GElS and the SAP has been to encourage firms to raise profitability by expanding exports. SAP encourages exports in two ways. First, it reduces the potential discrimination against exports where inputs are subject to tariffs. Second, since SAP import permits are transferable, qualifying exporters can earn a profit on local permit sales. Some firms are willing to export at a loss with the intention of raising profits in the trade of duty- free import permits. GElS, on the other hand, is meant to address a competitive disadvantage experienced by S.A. exporters. In particular, GElS provides a cash subsidy that is intended to enable firms to sell at world prices.
Economic orthodoxy prescribes a trade policy that neutralises the relative incentive to produce for export versus domestic markets. This goal requires an equalisation of the relative
price a producer can get in local and world markets. This view, as expressed in the World Bank literature, suggests a liberalisation and a "laissez-faire" trading environment. However, it is unclear that a trade policy that seeks neutrality via a laissez-faire approach can be successful in a context where the local product is not price competitive or where structural change is desired. In fact, it may be necessary to distort prices in order to encourage desired forms of business behaviour.
If the goal of S.A. trade policy had been to "level the playing field" in terms of relative prices in local and export markets, it is unclear that the combination of GElS and SAP achieved this end. On the one hand, these policies do not sufficiently equalise the price received in domestic and in export markets. In particular, Table C9 shows that the effective rate of protection (ERP) in 1991 was approximately 37%56 The actual ERP was significantly lower than the scheduled ERP of 220% as a result of the application of duty- free SAP permits. GElS and SAP are complementary in their impact on the relative price earned in local and world markets: GElS effectively raises the world price by 19% for local producers, while the SAP reduces the average trade-weighted domestic price by 183%. Yet,
56 This figure takes into account the actual tariff collected on apparel fabric and clothing. Note that the SAP has the effect of reducing the tariff paid on both fabric and clothing.

CLOTHING SECTOR 97
the net effect is a relative price advantage of 18% in the local market.57 On the other hand, in a stagnant local market and reduced capacity utilisation, there is an incentive to take export orders that typically lengthen production runs and fill plant capacity. Belli (1993) found that South African exporting finns mainly required a price that covered variable costs,
particularly when local demand was insufficient to fill capacity.
Table C2: Import Penetration & Export Intensity: S.A. Clothing (% by value)
1982 1986 1990 1991'
Import Penetration 8.0 5.0 6.3 8.5
Export Intensity 2.1 5.2 4.6 8.0
Source: Calculated from NCF Diary:162.
Note: 1991 figures are estimated from "Clothing Industry News" (NCF Newsletter) March/May and
June/Aug 1992.
Tables C2, G4 and G5 provide information on export growth in the 1980s. While exports have expanded since the introduction of the SAP and GElS, Table C2 shows that by 1991
exports accounted for only 8% of local production. This is very low by international standards presented in Table C14. It is not clear that these programmes were the most
important factor in encouraging the small growth that did occur. In particular, the major growth occurred in 1991, after the 1989 and 1990 implementation of the SAP and GElS. It is possible that there was some lag period between implementation and effect.
The lack of coordination in the determination of import protection and export promotion policy constitutes a major problem. As discussed in section C. 1.3., the ad hoc manner in which incentives and barriers are implemented has had significant unintended consequences. In particular, policies introduced since 1989, while intended to protect the local market and
encourage exports, has had the effect of almost completely opening up the local market to
imports, thereby radically reducing employment.
C.1.3. Problems with Current Export Promotion Policies
The combination of trade policies in existence since 1989 has resulted in the loss of more than 20,000 clothing jobs in the Industrial Council areas alone. This reduction in
If the actual ERP was 37% and GELS raises the world price by 19%, then the difference between local and world prices is equal to 37% - 19% = 18%.
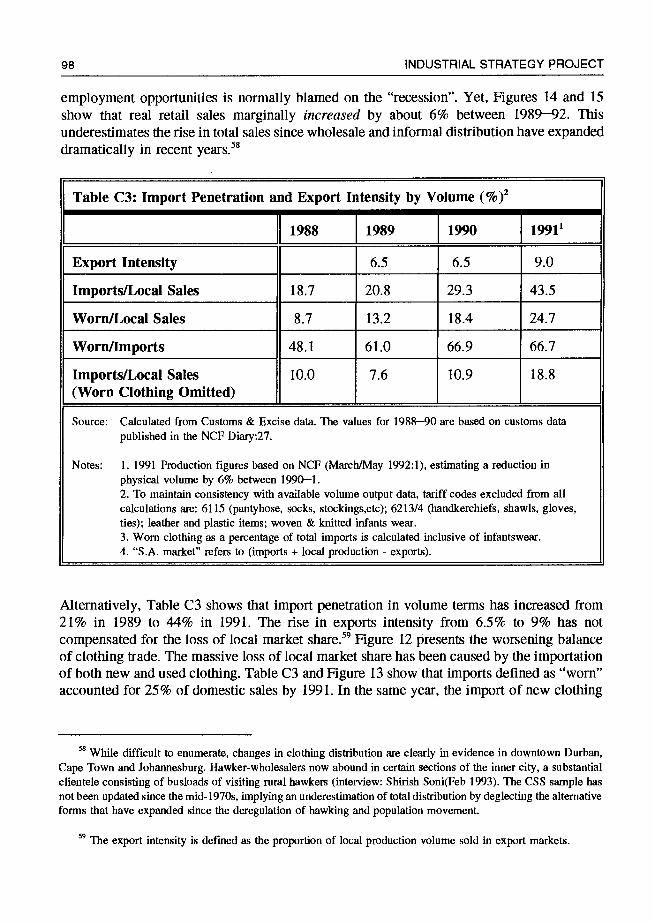
98 INDUSTRIAL STRATEGY PROJECT
employment opportunities is normally blamed on the "recession". Yet, Figures 14 and 15
show that real retail sales marginally increased by about 6% between 1989—92. This underestimates the rise in total sales since wholesale and informal distribution have expanded dramatically in recent years.58
Table C3: Import Penetration and Export Intensity by Volume (%)2
1988 1989 1990 19911
Export Intensity 6.5 6.5 9.0
Imports/Local Sales 18.7 20.8 29.3 43.5
Worn/Local Sales 8.7 13.2 18.4 24.7
Worn/Imports 48.1 61.0 66.9 66.7
Imports/Local Sales (Worn Clothing Omitted)
10.0 7.6 10.9 18.8
Source: Calculated from Customs & Excise data. The values for 1988—90 are based on customs data
published in the NCF Diary:27.
Notes: 1. 1991 Production figures based on NCF (March/May 1992:1), estimating a reduction in physical volume by 6% between 1990—1. 2. To maintain consistency with available volume output data, tariff codes excluded from all calculations are: 6115 (pantyhose, socks, stockings,etc); 6213/4 (handkerchiefs, shawls, gloves, ties); leather and plastic items; woven & knitted infants wear. 3. Worn clothing as a percentage of total imports is calculated inclusive of infantswear, 4. "S.A. market" refers to (imports + local production - exports).
Alternatively, Table C3 shows that import penetration in volume terms has increased from 21% in 1989 to 44% in 1991. The rise in exports intensity from 6.5% to 9% has not compensated for the loss of local market share.59 Figure 12 presents the worsening balance of clothing trade. The massive loss of local market share has been caused by the importation of both new and used clothing. Table C3 and Figure 13 show that imports defined as "worn" accounted for 25% of domestic sales by 1991. In the same year, the import of new clothing
While difficult to enumerate, changes in clothing distribution are clearly in evidence in downtown Durban, Cape Town and Johannesburg. Hawker-wholesalers now abound in certain sections of the inner city, a substantial clientele consisting of busloads of visiting rural hawkers (interview: Shirish Soni(Feb 1993). The CSS sample has not been updated since the mid- 1970s, implying an underestimation of total distribution by deglecting the alternative forms that have expanded since the deregulation of hawking and population movement.
The export intensity is defined as the proportion of local production volume sold in export markets.
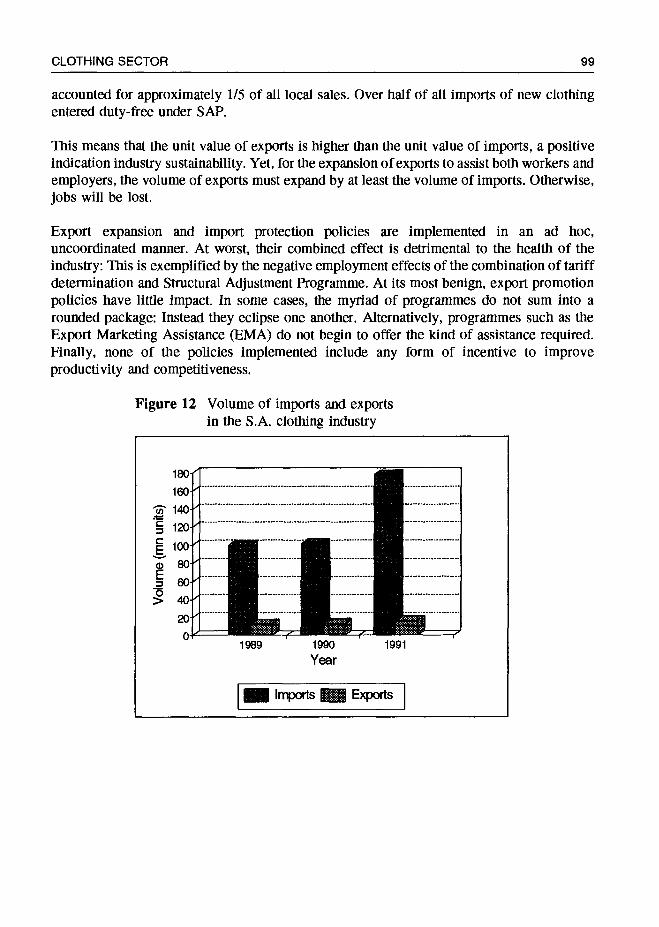
CLOTHING SECTOR 99
accounted for approximately 1/5 of all local sales. Over half of all imports of new clothing entered duty-free under SAP.
This means that the unit value of exports is higher than the unit value of imports, a positive indication industry sustainability. Yet, for the expansion of exports to assist both workers and employers, the volume of exports must expand by at least the volume of imports. Otherwise, jobs will be lost.
Export expansion and import protection policies are implemented in an ad hoc, uncoordinated manner. At worst, their combined effect is detrimental to the health of the industry: This is exemplified by the negative employment effects of the combination of tariff determination and Structural Adjustment Programme. At its most benign, export promotion policies have little impact. In some cases, the myriad of programmes do not sum into a rounded package: Instead they eclipse one another. Alternatively, programmes such as the Export Marketing Assistance (EMA) do not begin to offer the kind of assistance required. Finally, none of the policies implemented include any form of incentive to improve productivity and competitiveness.
Figure 12 Volume of imports and exports in the S.A. clothing industry
Imports Exports
I 180 160
140 120
100 cDBO E 60 0 >40
20 0
I
I Ei•i•i•
1989 1990
Year
—(

100
Figure 13 Slructure of import volumes in the S.A. clothing industry
INDUSTRIAL STRATEGY PROJECT
I I
Figure 14 Production and sales in the S.A. clothing industry
notes: Production is in volume terms. Retail sales are in real 1990 Rands.
100 90 80
20 10
1988 1989 1990 1991
Year
[] Worn SAP — Other
8
Cl,
I Year
—'— Prockictlo Retail Sales

CLOTHING SECTOR 101
Figure 15 Retail and wholesale sales in the S.A. clothing industry
Structural Adjustment Programme (SAP)
It is often assumed that the SAP created employment by encouraging exports. In fact, Table C4 isolates the net employment effect of the SAP programme. It becomes clear that SAP directly caused the loss of over 13,000 jobs from I 990—2. This estimate accounts for both the loss of local market share and the expansion of export market share. The displacement caused by worn clothing would have caused a large part of the remaining job loss. Even worse, a conservative estimate would show that the SAP programme will result in the loss of a further 14,000 jobs in 1993/4.60
Productivity Development
Interviews conducted in 1991 and 1992 with Cape Town and Durban firms found that any changes implemented as a result of export development were highly reversible and insubstantial (see Tables C5 and C6). The weak relationship between entry to export markets and attitudes toward productive efficiency may be explained in a number of ways. First,
60This estimate assumes that exports in 1993/4 remain at 1992/3 levels. This is unlikely in the current context, with uncertain trade policies and a recent reduction in the SAP benefit.
8
I
.0
Year
WCbUng)4Who(CTF-RMaiI (CT Depj

102 INDUSTRIAL STRATEGY PROJECT
there may be some lag between the time of initial export market entry and changes to productive or marketing efficiency. Most firms have only begun in the past 1—2 years to develop export markets in any substantial way.
Second, firms use incentives in a rent-seeking manner since there is little confidence in the state's ability to maintain consistent industrial policy. Many firms expand exports with a short time horizon, simply to profit from incentives and subsidies currently in existence. Moreover, the package of incentives does not encourage nor necessitate improvements in productive efficiency. The SAP initially put forward by the BTT was a more holistic package of incentives; yet, tariff subsidisation was the sole focus of the programme finally implemented. No visible incentives for skills development or investment were offered. S.A. producers experience certain competitive disadvantages: The SAP bridges part of the cost differential. The SAP lacks a carrot-stick approach that would require productivity improvements, thereby allowing for a successful "weaning" of firms from absolute dependence on subsidies.

CLO
TH
ING
SE
CT
OR
10
3
TA
BL
E C
4:
NE
T E
MPL
OY
ME
NT
EFF
EC
T o
f SA
P PE
RM
ITS
A
Val
ue o
f SA
P Pe
rmit
(Rm
n)
B
Uni
t Pr
ice
of
SAP
Impo
rts
(r/u
nit)
C
Vol
ume
of S
AP
Impo
rts
mn
units
(A
/B)
D
Val
ue o
f E
xpor
ts
(Rm
n)
E
Uni
t V
alue
of
Exp
orts
(r
/uni
t)
F V
olum
e of
E
xpor
ts
mu
units
(D
/E)
G
Vol
ume
Los
s wI
SA
P Im
port
s m
n un
its
(eg.
C2-
C1)
H
Vol
ume
Gai
n w
I H
ighe
r E
xpor
ts
mn
units
(e
g.F2
-F1)
I N
et
Vol
ume
Los
s m
n un
its
(HG
)
j Jo
b lo
ss
indu
ced
by
SAP
Impo
rts
(111
550)
1990
28
.0
4.50
6.
2 19
4.7
15.2
1 12
.8
1991
98
.2
4.50
21
.8
321.
9 18
.97
17.0
1992
* 16
0.0
4.50
35
.6
460.
0 22
.50
20.4
29
.3
7.6
-21.
7 -1
4000
1993
*
Scen
ario
1
241.
5 4.
50
53.7
24
0.0
25.0
0 9.
6 18
.1
-10.
8 -2
8.9
-186
24
Scen
ario
2
241.
5 4.
50
53.7
48
0.0
25;0
0 19
.2
18.1
-1
.2
-19.
3 -1
2430
Scen
ario
3
241.
5 4.
50
53.7
72
0.0
25.0
0 28
.8
18.1
8.
4 -9
.7
-623
7
Scen
ario
4
241.
5 4.
50
53.7
96
0.0
25.0
0 38
.4
18.1
18
.0
-0.1
-4
3
Not
es:
1.
Figu
res
for 1
992
and
1993
refe
r to
the
peri
od o
f M
areh
92-M
aith
93
and M
aith
93-
Mai
th94
resp
ectiv
ely
2.
Figu
res
for 1
990
and
1991
refe
r to
Jan-
Dec
per
iods
3.
The
val
ue o
f 199
2 exp
orts
is
base
d on
upd
ated
estim
ates
off
ered
by
the
NC
F.
4.
Uni
t val
ue o
f 19
93 e
xpor
ts i
s an
est
imat
e
5.
Val
ue o
f 199
3 SA
P im
port
pem
uts c
alcu
late
d as
the
est
imat
ed v
alue
of e
xpor
ts x
70%
x 7
5%.
The
bul
k of
SA
P pe
rmits
are
ear
ned
as 7
0% o
f the
pre
viou
s ye
ar's
exp
ort
valu
e.
In a
ll pr
eced
ing
year
s, o
nly
75%
of
tota
l ex
port
s qu
alif
y fo
r SA
P pe
rmits
.
Hei
e, i
n 19
93,
the
valu
e of
SA
P pe
rmits
= R
460
x 75
% x
70%
= R
241.
5mn
6.
Uni
t val
ue o
f SA
P im
port
s ba
sed
on th
e 19
91 a
vera
ge
7.
it is
ass
umed
tha
t out
put/e
mpl
oyee
/ann
um =
155
0 un
its

104 INDUSTRIAL STRATEGY PROJECT
The Effect of Exporting on Marketing Behaviour?
In general, firms establishing relatively substantial export markets, invest 15—20% of export value in marketing. The main activities include regular trips overseas, the determination of overseas agents, and the establishment of offices and warehouses overseas.
Only in rare cases are exporters developing brand names overseas. More commonly, local manufacturers tag onto foreign brand names, whether retailer or producer based.
Movements into other markets tend to mirror marketing behaviour domestically. The most successful exporters are those directly involved in the distribution process. Companies that follow this strategy (eg. opening their own stores overseas) tend to have retail experience in South Africa. It is only the few firms with a strong local brand presence that have aggressive strategies toward brand development overseas. Firms that are tied into chain stores locally seek similar relationships overseas. On the other hand, exporting firms have not become more sophisticated in attending to the expansion or maintenance of local market share.
The Effect of Exporting on Production?
Export activity has not encouraged firms to alter the organisation of production in any fundamental way. The main change to the organisation of production includes the expansion of manufacturing to factories in surrounding African countries. Lesotho, Swaziland and Botswana are the most popular locations. Firms locate in these countries for two main reasons:
Market access is the most important factor since the BLS countries are members of the Lome Convention and are not subject to 14% duties into the EC. In addition, exports from the BLS are not affected by any residual discrimination against South African products.
Lower wages, weaker labour regulation and the availability of better educated workers is a secondary reason for movement to the ilLS countries.
Two firms vaguely referred to quality improvements brought on by the requirements of export markets. The corporate report of one firm points to the adoption of SABS to standardise quality to European expectations. The second firm suggests that entry to export markets forces quality improvements, but is not clear on the specific changes implemented.

CLOTHING SECTOR 105
Table C5: Major Durban Exporters: Export-Induced Changes
II Firm 1 Firm 2 Firm 3 Firm 4
I irirm
Marketing
Marketing Infra.
Estab. own stores
Regular trips overseas Offices: USA & EC
UK officel
agent Export division UK office Cyprus agent
Markets UK USA EC USSR, UK EC
Exports/ Production
began at 65% (1991)
15-20% 30% but being reduced
increasing to 30%
9% (reduced)
Local Market
Hawker Chains Chain, indep Chains Chain
Export Product
Low Income Chains low-end mailorder chain and
design houses: suits, shorts, swimwear,etc
Medium-priced mall-order
Design local Local foreign local
Brand local Local foreign mixed
Production
Local runs 1000 500
Export runs
5-10,000 500- 2000 5000
Other Reduce Swazi CMT, Estab Swazi Factory
Lesotho & Botswana factories
Small factory investment
unit prod'n line for long
runs
Source: Interviews June 1991 and Dec 1992.

106 INDUSTRiAL STRATEGY PROJECT
Table C6: Major Cape Town Exporters: Export Induced Changes
Firm 1 Firm 2 Firm 3 Firm 4
Marketing
Marketing Infrastructure
Export Dept Overseas agents
Export dept Overseas agents
Mail order: Post- office agreement
Own stores
Agents
Markets EC EC Africa,UK UK
Exportsl Production
10% 30-40% 10%
Local Market Mid-income Mid-income L & M Low income
low-mid income
Export Market
same Ladies outerwear Suits Swimwear
same same
Design local both local local
Brand foreign foreign local local
Production
Local runs 500-1000 650+ 500-3000 6000+ (up to 25- 60,000 if dedicated)
Export runs 2-3000 3000+ surplus from local market
same
Other none intro SABS standards for EC
exports
Source: Interviews Jan/Feb 1991, Nov 1992, Jan 1993.
Despite the lack of any objective improvements in work organisation, export activity should have an immediate effect on productive efficiency. It is common for production runs destined for export markets to be 10 times larger than that for the local market. Many firms find that the size of export orders allow breathing space from changes in organisation that would be required if local runs were to be reduced any further. In particular, most firms cite production thresholds of 500—1500 as minimum, break-even lots. In many cases, the size of local orders has dropped to these levels. Therefore, firms producing for higher value-added markets must either restructure production to accommodate shorter runs or develop new

CLOTHING SECTOR 107
marketing strategies. Export development offers a marketing strategy that allows the desired maintenance of current production organisation.
Encouragement of Import Competition
Table C3 and Figure 13 show that a large increase in the volume of imports coincides with the Structural Adjustment Programme: The effect of SAP imports would be expected with a growth in export activity. By 1991, imports provided 40% of the local market in volume terms. SAP permits accounted for 31% of the value of imports, supplying at least 12% of the domestic market. In fact, the extent of import penetration was exacerbated by abuses of SAP, where more permits were allocated than allowed.
Abuses of SAP Permits
Flie discrepancy in SAP permit usage can bc shown in two ways. First, the 1991 customs data shows that R195.4mn was imported under SAP, despite only Rl63.mn worth of permits having been issued: This is a difference of R34.Smn, These figures refer to all SAP imports including yarn, fabric and clothing. In 1991, about 50% of permits were used for ckthmg imports.
A similar result is found when calculating the value of SAP permits that should have been extended to
clothing exporters on the hais of the Rl0I,lmn exported in 1990. Msurne that:
170tf of clothing exports qualify for SAP: ('lothing exports qualifying for SAP pernhits would amount to R19l.7 x 0.7 = R134.2mn
*Average import penetration tr apparel fabrics is 40 *Pabric constitUtes an average of 50% of garment output price.
i. 'the 70% subsidy on export value = R134..2 inn 0.7 = R 93.9mn
ii.Thc subsidy on local inputs puxhascd in 1990 =R 40.3nin x 0.1 = R4.Oinii wherc local inputs = R134.2 x 0.5 x 0.6 R40,3nin;.
The total value of SAP import permits would he = R9.9mn + R4.Omri = R97.Oinn
Clothing exporters used only 28% of SAP permits on R27.4mn worth of fabric imports. Clothing exporters could have imported duty free under SAP clothing valued at R97.9mui - 27.4mn. k70.5ITln. to fact, clothing imported duty-free in 1991 with SAP permits totalled R98.2mn: This is a discrepancy of R27.7mn.
Although an export promotion scheme, the SAP has been more effective at encouraging import penetration in two, complementary ways:

108 INDUSTRIAL STRATEGY PROJECT
First, in conjunction with high tariff dispersion, the duty free permits are most profitably used to import goods covered by high tariffs. This is particularly encouraged by the negotiable status of the permits so that permit holders do not necessarily import according to their needs: Instead, the permits can be sold to the highest bidder. This means that the SAP encourages the importation of the most trade sensitive, low cost goods, subject to the highest rates of protection.
In 1991, an average of only 3% duty was paid on the 30 items to which the highest rates of duty applied. These are highly sensitive products such as underwear. Only 11% was paid on the 60 clothing tariff items (out of about 400 codes) officially covered by a formula duty providing more than 100% in their ad valorem equivalent. While these 60 codes represent 15% of the total schedule, they accounted for over 35% of the total value of imports. Given the same structure of tariffs and the SAP programme, it is clear that those very products that require substantial protection will be those that are most threatened.
SAP duty free permits continue to apply to clothing imports. Although SAP quotas were introduced in 1992, these allocations will not change the overall import structure. Their purpose was to limit the concentrated use of permits for certain products, knitwear in particular. Table C7 shows that the allocations between tariff codes are very close to the distribution of imports in 1991. Hence, the pennits could be used in precisely the same way as before.
Second, the most recent tariff schedule raised fabric duties and lowered clothing duties. Since the SAP has the effect of virtually eliminating clothing tariff payments, the new schedule will dramatically reduce the effective protection for clothing and further squeeze local profit margins. As tariff policy raises the cost of inputs, export promotion policy substantially reduces protection, thereby diminishing the ability to compete against imports.
As shown in Table Cli, the new tariff schedule drastically alters the effective cost structure in the pipeline. In 1991, the effect of SAP was such that only 12% of the scheduled tariff was paid on clothing, while 85% of the scheduled tariff was collected on fabrics. Table C8 presents the discrepancy between scheduled and paid rates of tariff. Table Cl Oa shows that the high disparity in tariffs in the pipeline encourages permit holders to target clothing imports.
Since the SAP permits continue to circulate and the high tariff dispersion persists, it is probable that approximately the same proportion of tax will be paid in 1992. Tables ClOa and ClOb show the expected results of this situation: Table ClOa presents the average, trade- weighted tariff scheduled and the tariff actually paid at customs in 1991. Table C lOb presents the average tariff that has been scheduled for 1993 and the tariff that was collected. The new schedule, in conjunction with SAP, discriminates against clothing manufacturers. Fabric manufacturers will receive substantially more protection than clothing producers. This will effectively raise input costs by more than 10%, while lowering prices that can be acquired for the final good.

CLOTHING SECTOR 109
Table C7: The AlJocation of SAP Permits
Product Description Tariff code SAP Allocation (1992)
% of Total Imports (1991)
man-made jerseys 6110.30 7.5% 8.6%
other jerseys other 6110 12.5% 3.0%
knit t-shirts and underwear
6105-09 10.5% 11.8%
other knits 6101-14 & 6111-14
22.0% 17.7%
woven products 6201-12 47.5% 54.9%
Table C8: Rate of Protection in S.A. Clothing (1991) Scheduled and Actual Tariff Levels
Scheduled Tariff Tariff Paid
Knits 212% 17%
Wovens 127% 21%
Worn Clothing 202% 20%
TOTAL 167% 19%
Source: Calculated from Customs & Excise information.
Notes: 1. This data includes tariff codes 6101-6114, 6201-6212 and 6309 (worn overcoats & other clothing only). 2. The tariffs presented are trade-weighted ad valorem equivalents. 3. The inclusion of worn clothing does not substantially change the total since, in value terms, worn
clothing is not so significant.

110 INDUSTRIAL STRATEGY PROJECT
Table C9: Effective Rate of Protection in S.A. Clothing (1991)
with surcharge without surcharge
Scheduled 220% 202%
Actual 37% 20%
Source: Customs & Excise.
Notes: The Actual rate does include worn clothing. All figures include tariff codes 6101-14, 6201-12
and 6309 (as above). The ERP calculation accounts for a surcharge of 15% for clothing and 5% for fabric. The calculation assumes that fabric is the only input.
Table ClOa: Scheduled and Actual Clothing Tariffs 1991
Avg Tariff Scheduled
Avg Tariff Paid
Clothing
166%
20%
Fabrics
20%
17%
Table ClOb: Scheduled and Actual Clothing Tariffs 1993
Clothing [ Fabrics
Avg Tariff Scheduled 142% 52%
Avg Tariff Paid 8% 14%

CLOTHING SECTOR 111
Table Cli: Comparison of Tariff Schedules (% FOB, ad valorem equivalents)
1989-May92 Nov 92
Textiles Apparel Fabric
20 52
Clothing
Knits 212 177
Wovens 127 114
Average 166 142
Clothing Tariff Codes Effectively Subject to Specific
Duty
161 171
Notes: i. Figures are presented in percentage ad valorem equivalents. ii. All calculations are based on 1991 trade weighted averages. iii. By 1992, the reference prices for apparel fabric were largely redundant and the ad valorem mainly applied.
GElS and Duty Drawbacks (470.03)
Duty-rebate schemes that are tied to exports are the most highly regarded export incentives. While such a programme does exist for the clothing and textile industries (470.03), it conflicts with the GElS incentive.
The GElS formula is highly dependent on the proportion of local input. In order to take full advantage of GElS, the local content of exports must be greater than 75%. This would give clothing exporters a tax free incentive of 19.5% of their export value. However, if an exporter chooses to make use of the duty rebate scheme (470.03), the GElS assistance could potentially drop to 8.8% of the export value (see Appendix 2).
While the local content variable in the GElS formula is beneficial in principle, a dependency on local textile inputs would dramatically reduce the potential competitiveness of S.A. clothing exports. The local textile industry is not responsive to market needs, is high cost and supplies with long lead times. Moreover, the new tariff schedule (11/92) results in an average fabric protection of 50%: this rate of duty will result in a 25% price disadvantage against

112 INDUSTRIAL STRATEGY PROJECT
imports. To successfully compete in global markets, clothing exporters require access to reasonably priced, varied inputs.
It is reasonable for the clothing industry to expect the full advantage of GElS plus the rebate programme. Clearly, international competition becomes extremely difficult in the face of a 25% price disadvantage. Where the 470.03 rebate scheme is used, exporters lose approximately 10% of their GElS assistance. Yet, this subsidy is required since, unlike many other developing countries, South African exports to the EC are subject to a 14% duty. Hence, if an exporter does not use 470.03 the cost disadvantage is 25%-19.5%÷14%= 19.5%. If an exporter does use 470.03, the cost disadvantage is 0%-8.8%+14% = 5.2%. The existence of SAP currently meets this disadvantage: However, the effect of the programme expires by April 1994. Moreover, the SAP has had a deleterious effect on the total demand for S.A. clothing, since export volumes have not compensated for the loss in domestic markets to duty-free imports.
While the combination of export incentives may neutralise relative prices, the dramatic export expansion desired has not occurred.61 Incentives targeted at behaviour are required, encouraging productivity improvements (see section D. 1.) and export market development.
Export Marketing Assistance (EMA)
Until 1991, the state offered a tax rebate (1 ibis) to exporters: Exporters gained a value of two times the marketing costs incurred. Some exporters were unhappy with 11 bis, since the tax rebate could take up to 2 years to be realised.
The benefits offered by the Export Marketing Assistance Programme (EMA) are substantially less than those previously gained by 1 ibis. For the development of each new market, the EMA offers only 50% of one economy airfare, a stipend of R400/day for 15 days and R600 for transport of samples.
This assistance barely touches the financial requirements of establishing export markets. Exporting firms consistently report that the development of export markets absorbs 10—15% of the cost of sales over a number of years. The larger exporters simply absorb the cost. The lack of export marketing assistance discriminates against smaller companies.
61The growth in clothing exports has been off a minuscule base.

CLOTHING SECTOR 113
Section C.!. considered the historical and current trade orientation applying to the clothing and textile industries. Both import protection and export promotion policies are presented. The critique of their interaction finds that the ad hoc manner in which trade policy is formulated has had detrimental effects on local employment:
Import Protection
Until very recently. the SA. clothing Industry provided more thaii 80% (of the units) and 90% (of the value) of local demand. Since 1989. volume Import penetration has risen to over 40% of the local market. Worn clothing is a major contributor to the rise in import penetration, although the extent to which new and worn clothing are substitutes Is not clear.
Historically, S.A. clothing has been highly protected from Imports by tariffs and quotas. The system of tariff protection has become extremely complicated, with a different tariff for small product variances. This tariff dispersion is excessive, particularly in comjiinction with weak customs control mechanisms.
Although the scheduled tariff on clothing remains high. very little is actually paid as a result of the duty free permits offered by the SAP export promotion scheme. Clothing producers will he squeezed by the recent rise in fabric duties from 20% to 50% ad valoreni. In the next 2 years clothing producers may face negative effective rates of protectloii. Although a short period, the clothing Industry is fragile, typIcally operating on small margins: This Is demonstrated Iii the loss of 15-20% of lt. employment in only 2 years.

114 INDUSTRIAL STRATEGY PROJECT
Export Protection
There were two.rnain..problems with the SAP Firs it assumed that export activity would necessarily encourage productivity improvellients: The SAP does not offer any form of support to the organlsatlonal changes required in the industry This study finds that exporting firms have not introduced major changes to operating practires Firms seem to mirror their local behaviour, both in terms of production and marketing behaviour when entering export activity
Second, the SAP encouraged Import penetration Its duty free hnports could be sold on the focal market Normally, rebate programmes are satroduced to allow exporters access to inputs at 'world prices' In contrasts the SAP encouraged firms to export in order to bypass high tariff determinations In the context of substantial tariff dispersion, SAP permits were primarily used on the most trade sensitive products, to which the higher duties apply In 1991, onLy 20% duty was paid on total clothing imports
The net effect on the industry has been disastrous Volume import penetration has risen from 19% in 1988 to 44% iñI1991. The, export intOiisity (in volume terms) has risen froinoni 7% hi 1989 to 9%. hi 1991 When calculated In Isolation, this study finds that the SAP caused the loss of about 14,000 jobs between 1990-2 A further 13,000 jobs may be lost in 1993/4 as a result of S A
The SAP and duty drawback scheme (470 03), which are used about equally, conflict with the GElS incentive Essentially, the GElS formula is partly dependent on the use of local Inputs ft clothing exporters make use of duty-drawbacks to obtain mputs at world prices, their GElS subsidy can fall from 19S% to 9% of export value
Aside from assistance with productivity Improvements, exporters need support for marketing costs Clothing exporters unanimously report that marketing accounts for about 10—15% of the cost of export sales m the first few years at least. The Export Marketing Assistance (EMA) progranune offers a mere pittance of what IS really requireth The EMA provides 50% of one eronomy airfare, a Stipend ot R400 per day and a small amount for the transport of samples Yet, the development of overseas tuarkets requires many trips and expensive communications and hotel stays
Export promotion has caught the imagination of S A pohcy makers and firms since the fate 1980s The misnamed Structural Adjustment Programme (SAP) was Introduced in 1989 to encourage exports The SAP offers negotiable duty-free import.permits tO exporters until 1994/5.

C.2. Potential Market Focus
The debate on trade orientation tends to become polarised around "free trade" versus an inward focus. Section C.2. considers inward, export and balanced orientations. A myopic focus on either inward or outward orientations is critiqued in section C.2. 1. and C.2.2. The local market is unlikely to offer sufficient ouflets unless there is dramatic growth in incomes. The export market should not receive too much attention since the low current productivity will limit the degree to which overseas markets may be penetrated. In addition, entry to export markets alters business strategy, and can encourage subcontracting to lower wage and Lome Convention countries. A balanced approach, described in section 3.2.3., would encourage productivity growth in an industry development framework: Niche products areas would be developed to compete against imports and in export markets.
C.2.1. Inward Orientation: Focusing on the Local Market
The South African clothing industry has always been inwardly oriented. Export intensity has always been extremely low.62 Its development mainly depended on the displacement of imports in the local market. Even in the context of the supposed "export drive" underway, the clothing industry has expanded exports from a marginal 2% in 1982 to less than 10% of production by 1992.
Import penetration fell from 83% in 1918 to 49% in 1939 and finally to a low of about 5% in 1986 (Nicol, NCF Diary). Yet, the historical import protection has inadvertently fallen away since 1989 and imports have risen dramatically, brought in either as "worn" or duty- free under the SAP rebate schedule. Table C3 shows that between 1988—1991, import penetration in volume terms rose from 19% to 44%.
Some might argue that it is necessary to clamp-down on imports and continue to focus on the local market. The justification for this argument would emphasize rising protectionism in export markets and expected growth in the local market. In particular, local demand would emerge from population growth, an improvement in the distribution of income and urbanisation. The deregulation of hawking and easier population movement should enhance market penetration in rural areas.
However, an inward focus is unrealistic in the evolving domestic and international context for the following reasons:
First, the lack of export competition and a high degree of protection can contribute to higher input and consumer prices. In particular, protective tariffs can encourage import parity pricing. It is important to keep the price of clothing down since apparel is an important
62Export intensity refers to exports as a proportion of local production.

116 INDUSTRIAL STRATEGY PROJECT
wage-good (accounting for a significant part of basic consumer expenditure). Cheaper prices in low-income market segments are necessary to meet the needs of poorer parts of the population. On a broader level, keeping clothing prices down helps contain inflation.63
Second, the market for clothing has become highly segmented. The S.A. industry is not particularly well-equipped to fully meet all needs. In particular, the local industry is not price competitive and is not sufficiently able to fill the needs of the lower-income market. In order to strengthen the industry, it would be more sensible to focus on areas that could offer a competitive advantage: In local markets, much would depend on the development of local brands, short-cycle manufacturing techniques and quick response relationships. In export markets, S.A. will be competitive if it focuses on complementary products that compete on the basis of quality or style, assuming the industry is able to improve productive efficiency. Instead of producing all products for the local market, the long-run health of the clothing industry may depend on its ability to expand global market share of product areas reflecting factor prices.
Third, the domestic market is unlikely to support sufficient growth for the S.A. clothing industry. Tables C12 and C13 show different estimates of income elasticities of demand for clothing. The estimates for South Africa seen in Table C12 are questionable since the variation between racial groups seems quite narrow. A relatively high income elasticity of demand for poorer households would be expected, while Table C 12 presents an income elasticity of about unity for the whole population. Table Cl 3 offers global estimates that, although highly aggregated, seem more realistic: this table shows income elasticities varying between 1.27 for menswear to 1.97 for underwear. This means a 1% increase in income leads to a 2% rise in the demand for underwear.
Even if income elasticities are high, it would be dangerous to depend on the local market for growth. This dependence would necessarily require substantial economic growth and/or income redistribution. The average yearly growth of 3.8% in retail sales shown in Figures 14 and 15 since 1985 probably depends more on population than income growth: The average yearly growth in GDP was only 1.4% in the 1980s. The inward focus clearly
631t cannot be assumed that cheap imports necessarily results in lower prices for the consumer. Much depends on competition within the distribution sector. Some of the clothing that enters at extremely low prices actually competes in middle-price markets. This occurs where goods are dumped or where false declarations are made. For example, it is common to hear of falsely categorised 'worn' clothing imports. When distribution is concentrated, the reduced product price may simply translate into higher retailer surplus. This situation merely undermines the local industry, without necessarily offering substantial benefits to consumers, as discussed in Appendix 4. It is possible that the expansion of alternative forms of distribution, such as hawking, may encourage the transfer of these cost savings to consumers.
"S.A. manufacturers are highly dependent on foreign brands that are produced under license. As barriers fall, foreign companies may be more inclined to produce elsewhere and import into S.A.

CLOTHING SECTOR 117
constrained growth: The fall in GDP growth coincided with the levelling of clothing employment in the 1970s presented in Figure 1 65
Table C12: Estimated Income Elasticity for Clothing (S.A.)
Income Elasticity of Demand
Employment Elasticity of Income
"White" 0.96 0.73
"Asian" 1.10 0.84
"Coloured" 1.04 0.79
"Black" 1.08 0.82
Source: NCF Diary (1993:175:DBSA).
Notes: Income elasticity describes the change in demand that occurs with every percentage change in income. Employment elasticity describes the change in employment for every percentage change in income. It assumes that the elasticity of employment to changes in output is 0.76 (McCarthy 1988, Altman 1989).
The products with the highest income elasticities are also those that are the most trade sensitive: In particular, underwear has been one of the more important products imported from low income producers. The high income elasticity presented in Table C13 for childrenswear is borne out in the S.A. situation: The black market accounts for the majority of chlldrenswear sales, which is the main source of growth in retail sales. Unfortunately, childrens and infantswear is also highly trade sensitive and, except in higher priced segments, is not a product in which S.A. could be competitive locally or abroad. The most growth would be expected in lower income households, primarily wanting to buy cheap goods. Yet, S.A. clothing is stronger in higher income goods. The lack of access to home ownership has often meant that conspicuous consumption was manifest in cars and clothing. As home ownership expands, consumers will spend more income on home-related purchases and lay relatively less emphasis on clothing to demonstrate "wealth".
'5Average annual GDP growth was 5.7% in the 1960s, 3.8% in the 1970s and 1.4% in the 1980s. Although the slowing growth was experienced globally, it was then necessary to take advantage of niche marketing to expand global market share. This should have been particularly possible for a small supplier like South Africa.
"In 1980, the white market' accounted for 46% of retail sales. By comparison, the black' market accounted for 65—70% of childrenswear retail sales (NCF Diary 1993:273). The products offering the most retail sales growth were ladies/girls and infants clothing, accounting for 58% of retail sales in 1980 (NCF 1993:262).

118 INDUSTRIAL STRATEGY PROJECT
Table C13: World Price, Income and Employment Elasticities for Clothing
Product Price
Elasticity Income Elasticity
Employment Elasticity
Menswear -0.58 1.27 0.97
Womens' wear -0.33 1.52 1.16
BIG wear -0.44 1.57 1.19
MIB Underwear -0.11 1.92 1.46
W/G Underwear -0.26 1.97 1.50
"Other" -0.79 1.59 1.21
Floor Covering -0.61 2.30 n/a
HH Textiles -0.73 1.58 n/a
Source: ILO (1987:5: Kravis, et al. (1982).
Notes: 1. Price Elasticity refers to the change in demand for every percentage change in price. 2. BIG is boys'/girls'; M/B is mens'Iboys'; WIG is women's/girls'; HH is household.
Finally, growing integration of South Africa in international markets will prohibit the kind of protectionism previously offered. It will become less possible for lobby groups to obtain special rates of protection when international trading arrangements must be negotiated for the country as a whole. In fact, current negotiations with GATI' require set reductions in tariffs over a specified period.67 Although S.A. is a small market and contributes little to global markets, its protectionist policies are already noticed in some quarters: for example, the Br!' received complaining letters from the UK industry in the context of the November 1992 tariff determination. It is unrealistic to believe that full protection can still be offered. A more sensible approach would entail a focus on developing current and potential strengths, expanding global market share and devoting less attention to tinkering with tariff policy.
C.2.2. Outward Orientation: Focusing on Export Markets
There has been some shift in the focus of S.A. trade policy toward export promotion. This shift is partly in response to a substantial body of literature, particularly as produced by the
'71n the negotiating process, a large number of products are bound': the reduction in the tariffs applying to these products must be reduced by an agreed rate, typically by 33.3%.

CLOTHING SECTOR 119
World Bank, that in hindsight attributes the success of the East Asian "Tigers" to an export focus and open trade policy. It is suggested that economic success will be forthcoming with the adoption of a "neutral trade regime" in which the exports are promoted with the development of a conducive "environment" in which "the prices are right" (or reflect factor endowments). It is the involvement in export markets that offers information exchange, technology transfer and more intense competition encouraging productivity growth and improved competitiveness.68
The promotion of a neutral trade regime generally refers to an environment that neither favours nor discriminates against exports. The operational environment should be one where there is equal incentive to produce for the domestic or export market. This is often seen as an open trading environment with transparent forms of protection and tariffs that do not excessively raise local prices. The idea is to eliminate distortions that artificially raise the local price relative to the "world" price, thereby discouraging export activity.
However, there is convincing evidence to show that economic success in the NICs has been promoted by "getting the prices wrong" and by offering substantial govermnent assistance and guidance (Amsden, Wade, White). In a situation where structural change is sought, the distortion of relative prices may be needed to encourage business behaviour that contributes to economic growth. This is a particularly important point for the South African clothing industry that demonstrates low productivity and little innovative behaviour.
The causality of export led productivity improvements is unclear. Learning must occur in this activity, simply by virtue of international communication. However, in the clothing industry, communication already occurs through international trade fairs and trade journals. In less developed countries, it is foreign direct investment that tends to encourage learning.69
This study has found that behaviour in domestic markets tends to be mirrored in export markets. Firms tend to graft marketing tactics from their domestic operations. Companies that have tied themselves into multiple retailers in S.A., tend to forge relationships with multiples in countries such as the UK with a high degree of concentration in the retail sector. Producers that are active in developing their own brands, do so in export markets. Finally, companies that depend on their own retail outlets in S.A. also establishing outlets overseas.
681t is often admitted that expansionary macro-economic policy instruments assist in the contribution of exports to GDP growth. However, these instruments are merely meant to set the scene for export growth (eg. Papageorgiou et aL, World Bank 1992).
69The best example is found in German companies investing or subcontracting to less developed countries. These firms tend to become closely involved in aspects of production, sending industrial engineers to improve shop- floor organisation. Clearly, this type of behaviour is not found in all firms: In fact, some foreign firms import weak
practices and unfair labour practices to S.A.

2O INDUSTRIAL STRATEGY PROJECT
The purported gains from an export focus may be elusive. For example, the policies associated with an export push have effectively resulted in greater import penetration and an overall loss in global market share. Exports can contribute to industrial expansion only if they at least compensate for any loss in local market share. The lack of balance in S.A. policy formulation, the insufficient attention to sustaining the local market and export promotion policies that encourage import penetration have had disastrous consequences for the clothing industry since 1989.
It is possible to expand exports without liberalisation. Even where tariffs continue to protect local industry, duty rebates directly tied to exports eliminate most of the cost problems. It may be argued that high tariffs discourage exports since the local price is greater than that procured on world markets. However, relative prices are only one factor in deciding to export: The decision may rely more on expanding global market share, spreading risk and reducing dependence on the local market, maximising capacity utiuisation and expanding production runs.
In the near future, the S.A. clothing industry is unlikely to be spectacularly successful in export markets. Its main asset is the existence of infrastructure and the lack of quotas faced in the EC and USA. However, its productivity is quite low and it is a higher cost producer than many other comparable middle income countries. In addition, its marketing behaviour and design tend to be unimaginative. It would be unsafe to abandon a consideration of local market share and import competition. One retort would suggest that it is exports that should receive focus, since productivity improvements and competitiveness follow. However, there is substantial evidence to show that it is domestic developmental policies, services and incentives that the encourage structural change required to enhance competitiveness.
C..2.3. Taking a Balanced Approach
A balanced approach to trade policy that is required to enhance the South African clothing industry's global market share, accounting for local and international demand. Where the most important goal is maximising sustainable formal employment, it is necessary to
encourage development along lines that reflect S.A.' s long run competitive advantage. This entails productivity improvements emerging from the introduction of short-cycle manufacturing techniques, improved relations through the pipeline and a greater emphasis on skilling of the workforce. In addition, market focus should be directed at products that reflect factor costs: products that embody a higher value-added in the "market" sense. Unless firms respond to import competition in this way, it is unlikely that it will be possible to sustain a clothing industry in S.A. Finding a trade balance is important since barring all
imports is unrealistic and unrealisable at this time. Hence, the S.A. clothing industry must improve what it is potentially good at doing: producing high quality, medium style products on a timely basis for the local market and on a reliable basis for export markets. Table C14 shows that a number of countries with strong clothing industries have not barred imports, but have rather become strong, both locally and internationally, in certain market segments.

CLOTHING SECTOR 121
For example, the German industry has become renowned for its high quality tailored clothing. While German import penetration grew by 44% in the 1980s, its export intensity increased by l2O%.° Hong Kong has a virtual trade balance, where it imports and exports about half of its consumption and production.71 Of course, Table C14 also demonstrates that it is not necessary to be give up the local market to be a successful exporter: This is demonstrated by the case of Italy, Portugal and Turkey.
The successful clothing industries have shown that export promotion, allowing for some balance of trade, could be developmental for the S.A. clothing industry: First, low-cost imports help to contain the price of wage goods for lower income brackets. Second, export markets expand the demand for goods in which S.A. could be competitive: This particularly refers to higher value-added products which reflect S.A.' S cost structure.
Export promotion would not necessarily improve S.A.'s foreign exchange position. It is also unclear that exporting would encourage improved productive efficiency. It is more likely that productive efficiency must improve in order to successfully compete. The local market is highly competitive and the slow introduction of advanced production techniques is more related to conservatism and weak profit margins than to a lack of international integration.72
In order to support a balanced approach to trade policy, it is necessary to .consider the following questions:
What is the appropriate protective structure, reflecting international agreements, pipeline relationships and the fragmented nature of the product? This should displace the often stated focus on how to liberalise, reduce tariffs and promote "free trade".
What are the appropriate export promotion policies that directly benefit the export activity?
70me German industry has gained from specialising in expensive, high quality products. Moreover, some major companies such as Hugo Boss, Escada and Mondi have introduced improved pipeline communication, developed strong brand names and increasingly moved into exports (Finnerty 1989). The German industiy's shift into higher value added products has primarily depended on dynamic strategies, including the development of a highly skilled workforce, new technologies and emphasis on higher value-added products. While the German industry is dependent on foreign processing in lower wage countries, companies are known to have a developmental approach: This was confirmed during the visit to Turkey where German industrial engineers and production consultants were seen in subcontracting plants.
"This does not include re-exports.
'2Visits to factories in Turkey, a highly successful exporter, reflected the weak relationship between productive efficiency and the exporting activity. With few exceptions, the plants visited displayed outdated equipment and inefficient factory organisation. A quick look through the stock of a large clothing broker showed inadequate garment cleaning and demonstrated an absence of fairly basic machinery embodying underbed trimmers.

122 INDUSTRIAL STRATEGY PROJECT
What are the set of local development policies that can promote a movement to more competitive behaviour and an improvement in productive efficiency?
Table C14: Export Intensity & Import Penetration: International Comparisons (%)
Export_Intensity Import Penetration
1978 1986 1990 1982 1986 J
19881
Germany 14 27 31 36 42 52
Belgium 59 60 64 na2 71 74
USA 2 3 7 22 47 50
Italy 30 37 36 7 11 13
UK 25 18 34 30 32 41
Sweden 4 73 69 83 95 85
Portugal na 63 61 na 7 15
Taiwan na 82 49 na 1 7
Turkey na na 51 na na 1
Hong Kong na na 52 na na 45
Source: NCF Diary 1992:161/2 (International Apparel Federation).
Notes: 11988 figures were calculated in local currencies. Otherwise all calculations were in USA$. Note that all currencies appreciated with respect to the USA$ by approximately 30% with the following exceptions: Portuguese currency devalued by 28%, the UK £ appreciated by 19% and the German mark appreciated by 58% between 1982-88. 2"na" indicates that data was not available.
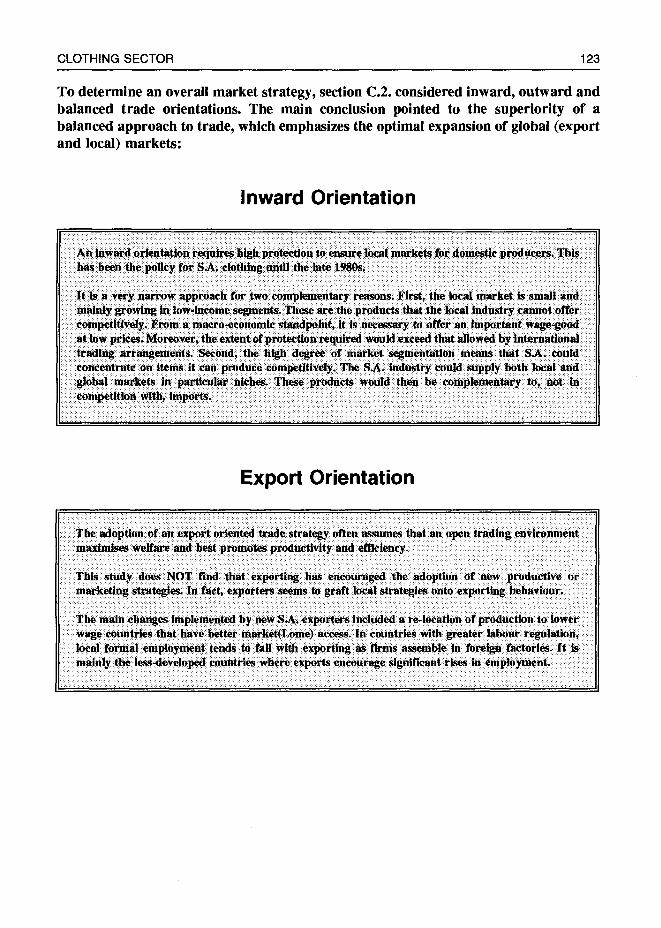
:a. .i.
•
:.
iti H
i •.
Hj.
... •:
: •
1 •
• H ft
•.Ij
R
. 0 h:
. .
TU
D
•
•c
flI.i
•1
• .
s...
= .
••• 0
••••
••
• ...
=
rn
0 -I 0 -l CD
0
r r
—.
1 =
eD
e eD
Cl)
-.
Cl)
—
—.
—D
0)
0. 0 -I C
D 0
C) I- 0 -1 I z 0 (I
) m
C
) H 0 I\)
C)

124 INDUSTRIAL STRATEGY PROJECT
A Balanced Approach
t.A. Is unlikely to be wildly SUccessful In export inarket.s. partkiuhirly lii the absence of some new fashion trend or significant productivity Improvements. It would therefore he unwise to ignore the need to recapture local markets, and the balance required between supplying domestic and foreign demand.
A holLstic development programme Is required that directly promotes productivity improvements through operational change. FIrmS should focus on product niches In which they can successfully compete, providing these Items for both the S.A. and export markets. The development of quick response relationships and short—cycle manufacturing techniques would he immore effective at
recapturing the local market than would high tarifl:s.
C.3. Adoption of a Balanced Approach to Trade
The adoption of a balanced approach to trade and development requires an integrated consideration of import protection and export promotion policies. However, it is necessary to first consider the institutional framework and constraints in which policy is formulated.
C.3.1. The Institutions
International and domestic institutions and arrangements can encourage or hinder the determination and implementation of developmental and trade policy. This section considers the institutional opportunities and constraints posed by the S.A. state and international agreements such as the General Agreement on Tariffs and Trade (GATT), the Multi-fibre Arrangement (MFA) and the Lome Convention.
The S.A. State
Although clearly stated, the demarcations between the Board of Tariffs and Trade (BIT) and the Dept of Trade and Industry (DTI) are ambiguous in practice. Formal representations are made to the BIT, and yet the Dli is responsible for decision-making. The Dli's stated reliance on the recommendations of the BIT is not reflected in policy outcomes. More importantly, the BIT is under-resourced and must devote most of its energy to day-to-day requests for information. The DII is currently in the process of computerising. Information supplied by the Dli is normally handwritten. One must wonder how it would be possible to undertake even the most minimal policy analysis in these conditions. Although some of the data analysis required may be fairly simple, the sheer bulk in the context of 2000 tariff determinations renders traditional forms of "number crunching" ineffectual. Hence, the BIT and Dli are forced to rely on information and analysis provided by interest groups. This raises the susceptibility to the demands of sectional interests and may partly explain the frequency with which trade policy alters.
As in most countries, trade policy must conform to the requirements of the Ministry of Finance. Unfortunately, the objectives of the Finance Ministry and the DII are unclear. While the Ministry of Finance is rightly seeking to reduce the deficit and limit public spending, it seems that the costs incurred to earn future revenue are being avoided. For example, the minimal costs associated with improving customs controls and policing customs fraud are neglected: Yet, tariff revenue could be enhanced and unfair trade resulting in local job loss reduced by such measures.
The degree to which the state is committed to export promotion, employment generation and human resource development is undemonstrated. Clear and consistent messages through sustained policy determination have not been exhibited. The constant shift in policy, even

126 INDUSTRIAL STRATEGY PROJECT
more than the actual decisions themselves, are what most destroys confidence and successful industrial expansion.
A number of issues require more clarity:
• Why is there more than one state body attending to trade policy?
• What financial commitments is the state willing to make to promote exports? Is the state intending to offer general or targeted assistance to industries? If the intention is to target industries, what forms of assistance can be expected? In determining an industrial development framework, to what extent can public resources be depended upon?
• Why is it not possible to sustain policy determinations over a period of years? The constant alteration of trade policy encourages the short-termism demonstrated by most clothing businesses.73
International Arrangements
General Agreement on Tariffs and Trade (GATT)74
South Africa was one of the founding members of GAIT in 1947. Possibly for reasons of prestige, S.A. defined itself as a "developed" country. While this status was relatively inconsequential at that time, it is becoming increasingly important that S.A. be correctly reclassified as "developing".75
South Africa is becoming more integrated into international trading arrangements with the lifting of sanctions. Other countries are watching the development of trade policy: only recently a GAIT mission reviewed S.A. trade policy and the USA chastised S.A. for its
73Many exporting firms visited in Turkey demonstrated a long-range view not found in the many visits through the S.A. industry. For example, Turkish firms could describe their step-by-step plan for export and design development over a period of more than 5 years. In S.A., most firms do not plan much past 6—12 months.
74GArr was established in 1947 with 27 member countries with the stated purpose of promoting free trade. It provides a set of rules governing international trade that are applied on a multi-lateral basis. GATF membership currently extends to 109 countries, accounting for over 90% of world trade (Trade Monitor No.1, UCT, Feb 1993).
"A fuller discussion can be found in Altman(1992c). While S.A. could easily attain 'developing country status, it is unlikely to be extended before a transitional government is in place, at the very least.

CLOTHING SECTOR 127
subsidies and protective policies. If S.A. were classified as developing, it would be less subject to safeguard action.76 For example, a developing country can be subject to safeguard action only if it exports at least 3% of the world market (Section M, Part III): Table B8 shows that S.A. cunently exports only 0.11% of global supply.
The Uruguay Round of GATF tightens provisions related to subsidies. In particular, the "Subsidies Code" was previously signed voluntarily. Signatories to the Subsidies Code were committed to a narrow range of policy instruments by which they could encourage industrial expansion. The Uruguay Round incorporates the Subsidies Code into the main agreement so that all GAIT signatories must comply with its provisions (Section I, Articles 1—9).
There are three categories of subsidies: Prohibited, Actionable and Non-Actionable. Prohibited subsidies include those contingent on export performance and/or on the use of domestic over imported inputs. An example of a prohibited subsidy would include the SAP for textiles and clothing.
GATF severely circumscribes the use of subsidies. This limitation could pose a problem for efforts to promote the expansion of S.A.'s industrial base. For example, subsidies cannot be specific to a firm or industry (Section I, Article 2). Hence, industrial targeting would be difficult to pursue. The developed country signatories are given a 3 year transition period in which subsidies offered must come into conformity with the GATT Protocol (Section I, Part IX, Article 28). S.A. would clearly need a longer transition period and some leeway in the application of subsidies.
Developing countries are allowed differential treatment on subsidies offered to domestic industries. For example, subsidies normally prohibited by GATT, if they are already in force upon the signing of the GAIT Protocol, would be permitted for a period of 8 years. Such subsidies could not be increased and an agreement would be reached concerning their phasing out (Section I, Article 27). These subsidies would be prohibited only if the country provided at least 3.25% of world trade in the particular product in 2 consecutive years.
The integration of the Subsidies Code into the general GAIT agreement has important policy implications for the S.A. clothing industry. In particular, the SAP must be replaced immediately by a more appropriate assistance programme, before the South Africa's offer to GAIT is finally negotiated. While GAIT provisions allow for a negotiated phasing out of "unfair subsidies", it is not possible to introduce new subsidies that fall foul of GAIT rules.
76A GAiT member can call for a safeguard action if it can show that its domestic industry is being endangered
by imports.

128 INDUSTRIAL STRATEGY PROJECT
The MulE-Fibre Arrangement (MFA)
The MFA is an international trading arrangement, developed specifically for the trade in clothing and textiles. It operates outside the GAIT provisions and embodies particular rules that would otherwise contravene GAIT. In particular, the MFA permits quantitative restrictions (eg. quotas). In addition, the arrangements are bilateral and therefore allow discriminatory trade restrictions.77 This means that it is possible to set quotas, not only on a specific product, but on imports from a specific country.
The MFA was introduced in 1974 in order to promote "orderly trade" between developing and industrialised countries.78 For ICs, the arrangement was intended to reduce market disruption from low-cost DC exports. For DCs, it was meant to replace the unilateral imposition of trade barriers by ICs with restrictions that were officially negotiated.
The departure from the usual GAIT provisions was initially intended to be temporary. However, the economic downturn from the mid-1970s encouraged its periodic renewal in 1978, 1982, 1986. The Uruguay Round provisions now outline its integration into GAIT. This integration is to occur over a 10 year phasing period: Products are to be shifted into GAIT in 3 stages. Quotas on products remaining in the MFA over the transitional period are required to rise by between 16% to 27% per annum, until complete liberalisation is achieved (Article 2).
South Africa is one of the few clothing and textile producing countries that is not a member of the MFA. Membership had been considered and rejected by the Steenkamp Report (1983). The Report suggested that the system of tariff protection was sufficient, that joining the MFA would jeopardize export potential and finally that allocating quotas would result in undue import competition.
Should S.A. reconsider joining the MFA?
The current situation necessitates a decision since the MFA now has a finite life. If it is decided that a system of quotas is required over the next period of years to contain import penetration, joining the MFA would be the only "legal" means of implementing this form of protection.
77GAfl' permits fmancial restrictions (eg. tariffs) and non-discriminatory trade restrictions.
78The forerunner of the MFA was the LTA (Long-term Arrangement Regarding Trade in Cotton Textiles), promulgated in 1962. The MFA replaced the LTA as new man-made and synthetic fibres became more prominent.
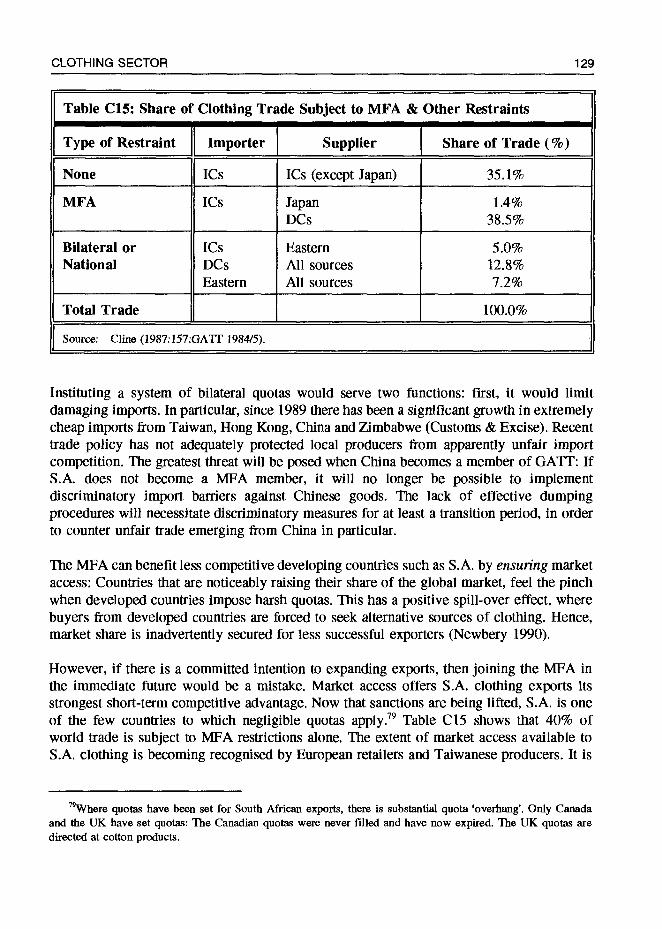
CLOTHING SECTOR 129
Table C15: Share of Clothing Trade Subject to MFA & Other Restraints
Type of Restraint Importer Supplier Share of Trade (%)
None ICs ICs (except Japan) 35.1%
MFA ICs Japan DCs
1.4% 38.5%
Bilateral or National
ICs DCs Eastern
Eastern All sources All sources
5.0% 12.8% 7.2%
Total Trade 100.0%
Source: Clime (1987: 157:GATF 1984/5).
Instituting a system of bilateral quotas would serve two functions: first, it would limit damaging imports. In particular, since 1989 there has been a significant growth in extremely cheap imports from Taiwan, Hong Kong, China and Zimbabwe (Customs & Excise). Recent trade policy has not adequately protected local producers from apparently unfair import competition. The greatest threat will be posed when China becomes a member of GATT: If S.A. does not become a MFA member, it will no longer be possible to implement discriminatory import barriers against Chinese goods. The lack of effective dumping procedures will necessitate discriminatory measures for at least a transition period, in order to counter unfair trade emerging from China in particular.
The MFA can benefit less competitive developing countries such as S.A. by ensuring market access: Countries that are noticeably raising their share of the global market, feel the pinch when developed countries impose harsh quotas. This has a positive spill-over effect, where buyers from developed countries are forced to seek alternative sources of clothing. Hence, market share is inadvertently secured for less successful exporters (Newbery 1990).
However, if there is a committed intention to expanding exports, then joining the MFA in the immediate future would be a mistake. Market access offers S.A. clothing exports its strongest short-term competitive advantage. Now that sanctions are being lifted, S.A. is one of the few countries to which negligible quotas apply.19 Table C 15 shows that 40% of world trade is subject to MFA restrictions alone. The extent of market access available to S.A. clothing is becoming recognised by European retailers and Taiwanese producers. It is
79Where quotas have been set for South African exports, there is substantial quota overhang'. Only Canada and the UK have set quotas: The Canadian quotas were never filled and have now expired. The UK quotas are directed at cotton products.

130 INDUSTRIAL STRATEGY PROJECT
a drawcard since market access encourages overseas buyers to diversify sourcing towards S.A.
The quotas negotiated under the MFA are based on "demonstrated capacity".80 S.A. is currently such a small exporter that quotas negotiated now could limit the market access required for an export drive. On the other hand, if S.A. can expand its exports quickly, quotas negotiated in the future will be based on this new level of "demonstrated capacity". If S.A. does expand exports dramatically, quotas will inevitably be imposed. Even then, South Africa may receive special treatment should transitional safeguards be implemented:81 Article 6 limits the use of safeguards for "small suppliers" in global markets. In practice, the stronger nations tend to dominate this process and impose quotas at the slightest indication of threat (Salib 199 1).82
Hence, it would seem that S.A. has two choices: if there is a weak commitment to exports, it should join the MFA now to take advantage of the system of quotas. If the commitment to export expansion is strong, S.A. should enter the MFA after substantially raising its global market share. Export promotion policy should take into account measures that would assist a speedy rise in exports. For example, exports could be immediately raised by encouraging foreign direct investment and international subcontracting. While the long-range goal may differ, the immediate need would be to quickly increase "demonstrated capacity".
The eventual integration of the MFA into GATT has some important implications for S.A. clothing. The lack of quotas facing S.A. is one the most important contributors to its short- term competitiveness for two reasons: First, as S.A. enters export markets more substantially, developed countries will quickly set quotas. Second, the quantitative restrictions allowed by the MFA to some degree shift the emphasis of sourcing decisions from price to market access. Once these quotas are lifted, sourcing choices on the basis of market access will not be important since GAIT does not discriminate between countries. The emphasis will return to price-based considerations (Newbery 1990:43). Hence, the integration of the MFA into
80Article 6 of the MFA provisions allow that quotas cannot be set lower than the actual level of exports (or imports) over the previous 12—14 months. The Uruguay Round arrangement will then require increases in these quotas over the phasing of the MFA into GAIT.
81Countries that are not MFA members cannot set discriminatory quotas but are still subject to safeguard measures. Transitional safeguards are applied when a country can show that imports derived from a particular source are endangering their domestic producers. They are meant to be applied for one year, although may be used for up to 3 years. The quotas may be negotiated bilaterally or between the threatened country and the MFA's Textiles Monitoring Body. An MFA member could declare a dispute to be arbitrated through the Textile Monitoring Body.
Salib points to quotas imposed on shirts from Bangladesh. Bangladesh did not much benefit from preferential provisions being a small supplier and amongst the least developed nations. In temis of S.A., the USA representative to the MFA quite clearly stated that quotas negotiated in 1985 for S.A., set at a fairly low level, would be abided by today.
CLOTHING SECTOR 131
GATF will pose particular problems for high cost developing countries that produce for, but are less competitive in, middle income markets.
The Lome Convention and the European Communily (EC)
The Lome Convention was initially signed in 1975 between the European Community and least developed African-Caribbean-Pacific (ACP) countries. There are two main benefits accruing to ACP countries by Lome status: First, ACP exports are granted tariff and quota free access to EC markets. In addition, financial aid is also made available to Lome signatories. In Southern Africa, the EC works through SADCC, whose member states are all Lome signatories.
Within both EC and GATF offices, S.A. is strongly perceived to be a developed country. Within S.A., there seems to be an expectation that S.A. will be accepted into Lome. The mere suggestion of this possibility is greeted with the chuckles of EC officials. Even if S.A. achieves developing country status, it is unlikely that it would be invited into the Lome Convention. The signatories are mainly very poor, less developed countries. Countries of comparable development to S.A. are not members: for example, Lome does not apply to South American countries. Asian signatories are mainly poor Pacific Islands such as Vanuatu or Fiji. In addition, S.A. is seen as the economic powerhouse of Southern Africa. The resistance to S.A. by ACP countries has already been demonstrated in the recent withdrawal of an invitation for De Kierk to attend a meeting of ACP countries (Business Day, April 1993, pgl).
It is more likely that S.A. will negotiate a bilateral agreement with the EC outside of Lome. This will mean that imports from S.A. will be subject to a 14% tariff. In terms of quotas, countries often rescind on such agreements when import competition becomes noticeable. One problem associated with a lack of Lome status concerns location decisions: A South African clothing industry that continues to expand exports will be encouraged to locate production in countries that have Lome status.
C.3.2. Reconsideration of Trade Policy
Trade policy should be formulated within a broader vision of desired directions in industrial development. The primary rationale for devoting resources to the clothing industry must first be considered. The possible reasons for developing the clothing industry may include:
employment generation development of a manufacturing sector satisfaction of consumer demand foreign exchange savings or earnings

132 INDUSTRIAL STRATEGY PROJECT
In S.A., foreign exchange considerations are currently the lowest priority in the determination of trade policy for the local clothing industry. The clothing industry contributes less than 3% to manufacturing output, is not a major foreign exchange loser and has little potential for contributing substantially to overall foreign exchange earnings in the S.A. context (CSS 1985).
The other two factors, employment generation and satisfying consumer demand are the most significant considerations. On the consumption side, it is important that industrial policy allow for reasonable domestic prices, particularly for lower income groups. This may be achieved through more open trade or with enhanced productive efficiency. The employment question is important and complicated: Clothing accounts for approximately 9% of manufacturing employment. Will more employment be generated by protecting the local industry from foreign competition or by taking advantage of larger foreign markets?
Unfortunately, the debates in S.A. tend to rely myopically on either a protectionist or free trade focus. Instead, it is a balanced approach that is required. On the one hand, the local industry should continue to receive some protection, in line with that offered to almost all clothing and textile industries globally. On the other hand, exports should be promoted in a more comprehensive manner. Tariff policy, particularly where it has a liberalising effect, should not be determined in isolation, but in the context of supportive micro and macro policies.
Trade policy should focus on promoting the fundamental development rationale. The mix of import and export policy should be part of a programme that directly focuses on raising employment through improvements in productivity and competitiveness. As described in section C.1., South African clothing trade policy has mainly rewarded exports by encouraging import penetration! It is not the export activity that should be rewarded, but rather desired behaviour in terms of productivity growth, investment for sustainable employment generation. There is little net benefit to redirecting output to overseas markets, unless done in conjunction with these improvements. If these changes occurred, the importation of cheap clothing would pose less of a threat since it would represent complementary, not competitive supply. The S.A. clothing industry would put itself in a stronger position to generate sustainable employment opportunities.
Hence, all policy should be formulated in an integrated manner with a "carrot-stick" approach in mind. While the goals mentioned above may seem consistent with union requirements, there can be underlying contradictions. For example, a policy which seeks to expand exports and raise competitiveness by deregulating the labour market and encouraging informal business would result in a downward pressure on wages and work standards. In addition, the intensification of competitive pressures attending an export promotion strategy could encourage firms to subcontract to lower wage countries. While this may strengthen clothing industry profitability, it could have a substantially negative impact on employment in local registered factories. With the choice of trade policy must come a careful consideration of an appropriate incentive structure to ensure desired productive

CLOTHING SECTOR 133
improvements. In addition, regulatory siructures must be adapted to ensure that changes in business strategy associated with a redirection of market focus do not have a negative impact on formal, domestic employment. These issues are discussed in section D.
The following section considers the policies consistent with a balanced approach to trade. First, changes are required to current protectionist policies: In particular, this section suggests a simplification of the tariff schedule, with one specific tariff applying according to each 4- digit SITC code. The tariff determined would reflect the most trade sensitive product in the code: the tariff would ensure that a price floor was established to avoid dumping. A tariff reduction by 1/3 is essentially determined by GATT, as most clothing items are bound. Export promotion policy would offer a range of incentives to improve competitiveness and marketing capacity. An expectation of meeting performance specifications such as
employment generation, productivity improvement, human resource development or new investment would be established.
Protection Policy
Both the state and the clothing industry seems to strive for the peifect tariff schedule, one that would please all interest groups. The result is a tariff structure that is highly complicated, with 3 tariffs applying to 2000 codes at an 8-digit SITC level. The high degree of tariff dispersion, even within 8-digit codes, results in substantial evasion. Problems arise from underinvoicing, false declarations, weak training of customs officials and insufficient computerisation at customs points. In addition, section C.3. described how the high tariff dispersion in conjunction with SAP import permits, reduced clothing tariffs and higher fabric tariffs will squeeze clothing margins excessively by reducing effective protection.
Perfection in a fragmented industry is simply not possible: In fact, the tariff structure needs to be altered so that it can be implemented and understood by mere mortals, whether
computerised or not. The tariff schedule should abide by the following principles:83
• Simplification, with reduced tariff dispersion and greater transparency • Sensitivity to product heterogeneity in these industries • Supportive of trade policy sustainability and legitinwcy
83A tax structure that is more even and set at reasonable levels is likely to be more effective: Firms will invest less effort in tax avoidance if the rates are not too high. A high tariff dispersion encourages switching' at customs. In conjunction with SAP, the great differential between the high and low rates encourages finns to use SAP permits on items with a high tariff and switch the product defmition on non-SAP items to low tariff codes.

134 INDUSTRIAL STRATEGY PROJECT
Sfrnplifi cation
The extent of tariff code disaggregation is quite unnecessary and adds undue complication to the determination of policy. The tariff structure should be homogenised, with duties determined by 4-digit tariff code, covered by specific tariffs. The rate covering each 4-digit tariff code could be determined on the basis of the most trade sensitive clothing items. This does not mean that the rate should be high, but rather that it reflect the particular needs of the broad product definitions in a fragmented industry. In addition, only one tariff should be set per code: If specific duties are chosen, then the rate should not be implemented in conjunction with an ad valorem duty.
The simplification of the tariff code would enable an easier product identification at customs, thereby eliminating product switching. While some products are genuinely threatened, there is a high degree of tariff redundancy. Such a schedule would offer more sensitivity to items experiencing greater competitive pressure, while simplifying the items that experience less import competition. The complicated present schedule is beyond the scope of human capability to effectively administer and appropriately alter. Simplifying the tariff schedule would in itself contribute to more effective policy determination.M In addition, a simplification would substantially reduce rent-seeking behaviour by interest groups in the industry.
Specific Tariffs
The type of tariff chosen for clothing imports must address the following issues: First, the product is highly fragmented in terms of weight, product definition and value, even within an 8-digit SITC code. Second, there seems to be a substantial degree of dumping, where goods are imported at unbelievably low prices. Hence, protection should be provided against unfair competition. Since S.A. is not a member of the MFA, it is not allowed to impose discriminatory quantitative restrictions on imports. The form of protection should discriminate against unfair trade, not higher value-added products.
For example, distributors of both "high" and "low" end goods are importing goods with extremely low unit prices. One of the most extreme examples is tariff item 61031200 (men' s/boys' synthetic knit suits). Customs data shows an average FOB unit price of Ri .52, while one importer interviewed buys these items for Rl.68 each.
84The customs borders that are not computerised have great difficulty calculating rates payable. This especially refers to the BLNS countries and TBVC borders. Where there are multiple determinations, the rates will simply fall to the ad valorem duties since they are the simplest to calculate. The ad valorem rates do not offer sufficient protection on the very low cost imports.
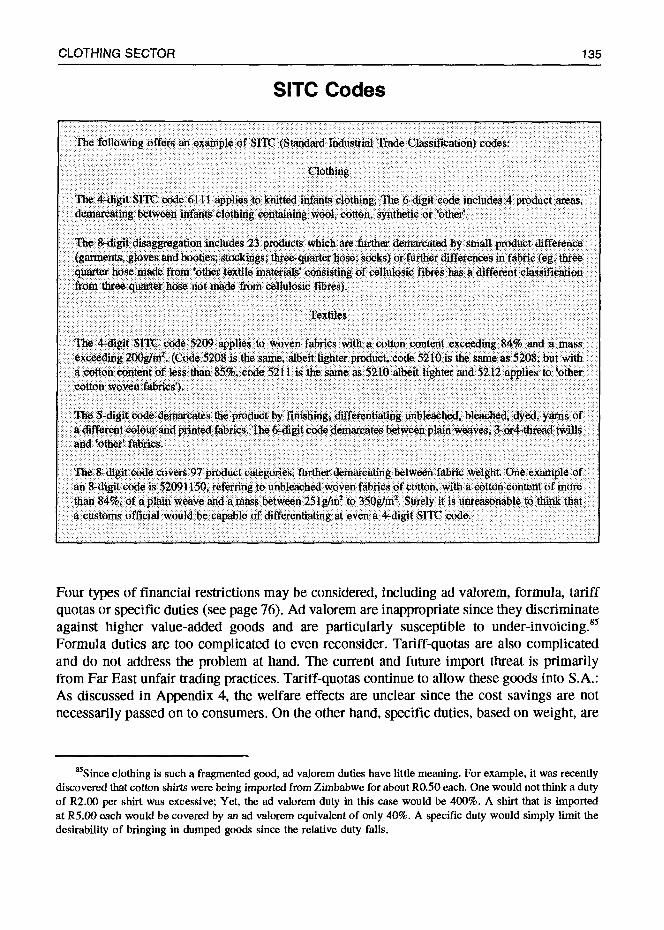
CLOTHING SECTOR 135
SITC Codes
The following offers an example of SITC (Standard Industrial Trade Classi&ation) codes
Clothing
The 4-digit Slit code 6111 applies to knitted infants clothing The 6 digit code includes 4 product areas dernarcaung between infants clothing containing wool cotton synthetic or bother
The S-digit disaggregation includes 23 products which are further demarcated by small product difference (garments, gloves and booties, stockings, three-quarter hose socks) or further differences in fabric (eg three quarter hose made from otber textile materials consisting of ceilulosic fibres has a different classification from three-qnarter hose not made froin cellulosic fibres)
Textiles
The 4-digit Silt code 5209 apphes to woven fabi1cs with a cotton content exceeding 84% atid a mass exceeding 200g/mi (Code 5208 is the same albeit hghter product, code 5210 is the same as 5208 but with a cotton content of less than 85%+ code 5211 is the same as 5210 albeit lighter and 5212 applies to other cotton woven fabrics')
The 5 digit code demarcates the product by finishing differentiating unbleached bleached dyed yarns of a different colour and printed fabrics The 6 digit code demarcates between plain weaves 3 or4..thread twills and 'othet':fabrics. . ...:
.• ::. .
The 8 digit code covers 97 product categories further demarcating between fabric weight One example of an 8 digit code is 52091150, rfernng to unbleached woven fabrics of cotton with a cotton content of more ban 84%of aplain. weave and amass between 25lg/nf.to 350gIm2 Surely it is unreasonable that. a customs official would be capable of differentiating at even a 4—digit SITC code
Four types of financial restrictions may be considered, including ad valorem, formula, tariff quotas or specific duties (see page 76). Ad valorem are inappropriate since they discriminate against higher value-added goods and are particularly susceptible to under-invoicing.85 Formula duties ar too complicated to even reconsider. Tariff-quotas are also complicated and do not address the problem at hand. The current and future import threat is primarily from Far East unfair trading practices. Tariff-quotas continue to allow these goods into S.A.: As discussed in Appendix 4, the welfare effects are unclear since the cost savings are not
necessarily passed on to consumers. On the other hand, specific duties, based on weight, are
85Since clothing is such a fragmented good, ad valorem duties have little meaning. For example, it was recently discovered that cotton shirts were being imported from Zimbabwe for about R0.50 each. One would not think a duty of R2.00 per shirt was excessive; Yet, the ad valorem duty in this case would be 400%. A shirt that is imported at R5.OO each would be covered by an ad valorem equivalent of only 40%. A specific duty would simply limit the
desirability of bringing in dumped goods since the relative duty falls.

136 INDUSTRIAL STRATEGY PROJECT
essentially reduced as the product price is increases. Moreover, a calculation of the specific price per kg will also allow for sensitivity to the lighter unit weights associated with children's clothing, albeit simultaneously ensuring an appropriate base price.
Tariffs in the Pipeline
The determination of this price floor on clothing imports would need to take into account tariffs on apparel textiles. The tariff schedule determined in November 1992 unwittingly neglected the pipeline: In conjunction with SAP, the rise in fabric tariffs by 2.5 times and reduction in clothing protection will result in negative effective protection for the clothing industry. Table ClOb shows that the new schedule will result in actual payments of 44% on fabric and only 17% on clothing. This was not the intention of the schedule, but will most certainly be the effect over the next year until SAP expires. While the exact relationship between fabric and clothing tariffs is unclear, there should be some margin between them, with clothing tariffs set at a higher rate.
A flat tariff rate could be imposed on the majority of apparel fabrics for two reasons. First, apparel fabrics have been subject to a relatively low, flat tariff structure for a period of years already: This would not constitute a liberalisation. Second, distinguishing fabrics is extremely difficult at customs: A more uniform tariff structure that emphasizes the trade sensitive items would be more effectively implemented, with less chance for evasion and product switching.
Worn Clothing
Goods imported as "worn" are the biggest threat to the clothing industry. More than half of the volume of imports are categorised as "worn". These imports are intended for the very poor, distributed through church groups. In practice, many non-charity related groups import under this category, often with false declarations. In addition, even in the context of low tariffs, only 20% ad valorem was paid, as compared to a scheduled 202% (see Table C8). The current determination raises protection, as it charges a high rate per kg and makes it more difficult to obtain import pennits. In any case, the extremely low unit price of worn clothing and the fact that it arrives in bundles means that a tariff on anything other than weight is meaningless. The most valuable protection would ensure an effective policing, whereby a limited number import permits were given to registered charity groups only.
Dumping
Anti-dumping regulations should be tightened and defined in accordance with Section F of the GAIT code. The margin of dumping can be measured in terms of "the cost of production in the country of origin, plus a reasonable amount for administrative, selling and any other costs and for profits." The exporter's costs should be calculated in terms of adult

CLOTHING SECTOR 137
wage rates to eliminate competition on the basis of child labour, as found in th EC's Social Charter.
Where the process of determination of anti-dumping applications exceeds 60 days, they should be referred to an independent expert in the field of international clothing and textile costing or consultancy. A time limit should be set within which applications are finally settled.
A cost-benefit analysis should be undertaken to weigh the relative cost of more comprehensive crate examination versus potential tariff revenue loss. Such a study would determine the relative merits of more stringent customs controls, possibly monitored by the industry.
Export Promotion Policy
An alternative export promotion scheme must be put into place for two reasons. First, the momentum that has been built should be encouraged and sustained. As described in section C.2., export activity can be beneficial for the expansion of niche marketing, particularly in the context of a small domestic market. Second, the loss of local market share caused by the SAP pennits currently in circulation must be compensated by an expansion of exports. The assistance should be at least as substantial as that offered by SAP: Table C4 shows that SAP import-induced job loss will be minimal only if exports double. If exports are stagnant, approximately 13,000 jobs may be lost.
Export promotion incentives need to address two points: first, incentives need to cover the cost disadvantage, and should therefore be tied to productivity improvements. Second, assistance with the substantial costs inherent to developing export markets is required in an industry with low margins and weak cash flow.
Most exporters concur that the combined benefit of GElS and SAP is approximately 40% of export value. In developing a package of export incentives, it must be ensured that:
The local market is not prejudiced and export incentives directly address the export activity
The incentives are linked to desired behaviour to ensure that resources are not lost in subsidising an ever uncompetitive industry. Ongoing incentives may be tied to investment, training, organisational change, productivity improvements or employment generation.

138 INDUSTRIAL STRATEGY PROJECT
Addressing the Cost Disadvantage
Clothing exporters should be offered the full range of incentives, even if imported fabrics are used. This would entail the full GElS incentive at 19%, with a duty drawback scheme (470.03) offering unconditionally 100% imported inputs for export. These rebates should only be available for inputs imported for locally processed goods destined for export.
The existing programme (470.03) conflicts with the GElS benefit. Since the GElS formula partly depends on local content, the GElS benefit can drop to 9.5% if all fabric is imported. This forces finns to use local fabric in exports, previously resulting in a 10% cost disadvantage. With the new duties, the cost disadvantage can rise to 25%. There may be two means of addressing this inconsistency:
The GElS formula could be dependent on indusiry-wide import penetration levels. This would maintain the 19% assistance, without making excessive concessions to a single industry.
The 470.03 rebate might be extended to cover the percent of GElS benefit lost through the use of 470.03. The extra benefit would range from between 0% to 9.5% of a firm's export value.
Exporters taking advantage of duty-rebates sometimes enlarge their report of fabric content in exported goods. To address this problem, it is possible to either require rebate storerooms or to specify a range of expected fabric content within clothing product categories.
Machinery and equipment should be imported duty-free and without a surcharge. Dated machinery is a major roadblock to improved efficiency in the textile industry. Much could be done to lower lead times and raise market responsiveness if new machinery were purchased, allowing for the production of smaller batches.
Cheap credit should be offered to threatened firms in highly sensitive product lines. Since customs data will become available on a monthly basis, it will be possible to estimate import penetration in specific products.86 Firms demonstrating that retrenchment or closure is directly related to import competition on SAP might receive special assistance, to enable them to subsidise their prices.
86At the end of 1992, there was some indication that trade data would become more readily available. However, the indications of improved information flow seem remote. For example, the audited trade figures for 1992 were still not available four months into 1993.
CLOTHING SECTOR 139
Meeting the Costs of Exporting
Foreign currency holding accounts would be beneficial. Unlike many other countries, it is illegal to hold foreign currency in South Africa. Exporting firms should be allowed to hold the foreign exchange that they earn in order to import inputs or machinery. In addition, forward cover on export contracts is required.
The Export Marketing Assistance programme should be extended. Firms seem to spend about 10—15% of export sales on marketing activity. The large investment in marketing is required over a period of at least 3 years. Export marketing requires numerous overseas trips, expensive communications, the determination and payment of overseas agents and the establishment of offices and warehouses. Finally, there is a learning curve where a firm increases its sophistication in terms of sizing, labelling, and quality expectations.
Section C.3. considered policy to support a balanced approach to trade. A balanced combination of protective and export promoting policies were presented in the context of the relevant S.A. and international institutions.
The SA. State
This study finds that S.A. state institutions Involved In trade policy are Indecisive and, In the detriment of the Industry, do NOT formulate trade and development policy In a coordinated manner. In addition, the 1111 and 1)11 are under-resourced, depending on Interest groups fur policy analysis. The constant alterations and shifts In trade policy make it impossible for business to plan ahead.

140 INDUSTRIAL STRATEGY PROJECT
International Trade Arrangements
This study considers two main International arrangements: the (eneral Agreement on Tariffs and Trade (GATT) and the Multi-Fibre Arrangement (MFA).
South Africa will be expected comply with GATT regulations as sanctions are abandoned. l'his means S.A. will have to comply with the subsidies code. Hence, the .S.A. state's ability to target specific industries for development will he limited. Moreover, subsidies that are contingent on export performance are prohibited. Should S.A. he reclassified as a 'developing country', it would have an S year transition period to full compliance. If the Intention Is to offer a new export promotion subsidy to the clothing industry, it must be implemented inimediately since the transition period applies only to progrnmnnles already in existence. It would not he possible to introrluce a subsidy falling outside of ;ATT regulations after the Round is signed.
The Multi-Fibre Arrangement (MFA) regulates the international trade in clothing and textiles. Over a 10 year period, it will he progressively integrated iiito GATT. This means that the possibility to use
quantitative import restrictions (eg. quotas) and to discriminate against specific trading partners will fall away.
S.A. may want to reconsider joining the MEA. 'lIme most important reason to Join rests on the potential admission of China into GATT. As a result of Chinese trading practices, it will be necessary to Impose discriminatory harriers against its exports. lt'&'hinaJoins GAtI. S.A. will only he able to
linplenient discriminatory trade practices if a member of the MFA.
However, if there is a committed Intention of expanding exports in the immediate future, it may he more sensible to wait uimatil International markets feel time Impact of S.A. exports. It Is unusual that S.A. is NOT a member of the MFA. ThLs is one of S.A.'s maui short-term competitive advantages since very few quotas are imposed against its exports. At present. S.A. provides 0.11 + of global markets. It may become noticeable once it provides l—3r of International exports. The determination of quotas set omi the basis of current capacity would he set too low to allow for a substantial export expansion.

CLOTI-HNG SECTOR 141
Trade Policy
The most important consideration in developing trade policy for S A clothing is employment generation In addition, it is necessary to consider the effect on consumer prices since clothing accounts for a large proportion of household expenditure
Any policy should be formulated In an integrated manner It Is crucial that policy be Implemented In a consistent manner, and that Incentives and schedules remain Unchanged Finally, incentives should always be tied to the proverbial stink The continued provision of export subsidies should be tied to demonstrated productivity Improvements, employment expansion, training or capital investment.
Protective policies should be simplified Tariffs should be determined by 4 dIgit SITC codes instead of the current 8-digit codes For example, this would offer one tariff for all types of coat (SITC 6101), instead of one tariff each for overcoats or jackets or 'other made of wool or cotton or man-made fibres or 'other fibres' Although this simplification would encourage screams froni many Industrialists, it would facilitate product identification and eliminate the product switching that so conunonly occurs at customs The tarilT could reflect the most trade sensitive item In the code, setting the protection at a rate which eliminates dumping and provides some margin in the Industry In conjunction with development programmes and In conjunction with pipeline tariffs, this margin could be reduced to reflect productivity Improvements
Since S A is not a member of the MFA but is a GATT signatory, it cannot Use the ultimate form of protection the quota The second best option is to use specific tariffs, which set a duty per kg Imported This tariff reflects differences In weight (eg children's versus adult clothing) and reduces when an Itetnis more expensive. it is therefore the most useful tariff hi a bid to reduce the dumping and extremely cheap Imports that are undermining the industry
In terms of export promotion, SA exporters will need a subsidy to bridge the productivity gap that currently exists However, this subsidy should be tied to productivity improvements, as outlined in section B.3 2 PublIc resources are wasted If export subsidies are given to an industry that cannot achieve competitiveness The required Improvements could he quickly Implemented since the problems are primarily organisatlonal, not structural
The specific recommendations include the full provision of GElS at 195%, even when making Use of duty drawbacks on Imported Inputs. In addition, capital equipment should be imported duty-free and without a surcharge Finally, the EMA should be extended to offer more substantial marketing subsidisatlon for at least the first 2—3 years of export market penetration The combination of these policies should subsidize the exporter by approximately 35% of export sales, while Importing inputs at world prices

Chapter D: Social Orientation: Achieving Sustainable Formal Employment
D.1. Promotion: Redefining the Route to Competitiveness
Weak firm organisation is the clothing industry's main competitive weakness. As shown in Figure 3, wages are low by international standards and do not contribute to relatively high product costs. However, it will be difficult to convince the industry of this fact, since the wage bill is traditionally the focus of efforts to enhance profitability. It will be necessary to
develop services for the clothing industry to facilitate the diffusion of new work practices and improved marketing strategies. This section considers a range of issues including regional support services, improved training and grading structures, improved marketing services and an industry based development office.
D.1 .1 - Productivity
It is clear that the S.A. clothing industry must improve its productivity in order to compete both domestically and abroad. Despite relatively low wages, productive efficiency is weak by international standards. Many firms will try to address the productivity gap by focusing on labour cost reduction strategies. Yet, it will not be in their long run interest to further suppress wages since the current industrial council wage determinations barely cover minimum subsistence income levels.87 In order to work effectively, employees must be able to at least sustain themselves and their families.
While the labour cost component has traditionally been perceived as the most variable input, in S.A. it might almost be seen as a fixed cost. The degree of labour regulation and the alieady low wage levels mean that it is not in the interests of management to pursue labour cost flexibility. Moreover, there is a greater awareness of other, more effective variables in the production process. It is possible to make large sustainable gains in cost structure by emphasizing changes in the organisation of the factory floor and material usage. Table B 19
87Table Dl (page 139) shows that the 1992 wages of a qualified clothing machinist cover the minimum subsistence income levels in the West and East Cape regions only. The 1992 industrial council wages are 19%—38% below the minimum effective income level. This is the level at which a household becomes a viable economic unit. While the relationship between machinist wages and minimum subsistence levels has improved since 1989, there is clearly still room for improvement in light of the need to sustain the workiorce.

CLOTHING SECTOR 143
shows a S.A. example where, in the absence of technological and supplier change, the surplus on the cost of sales was raised by at least 7.2% within a year.
Firms need to be encouraged to adopt new organisational practices in order to enhance the industry's long run competitive advantage. In a conservative industry such as clothing, it may be necessary to introduce a "carrot-stick" approach to organisational behaviour. A general principle must be established where concessions and incentives are offered only on the basis of the adoption of new organisational practices and improvements in productive efficiency. For example, export incentives might be tied to a combination of indicators including export sales, employment and productivity. In addition, productivity bargaining would usefully be tied to the introduction of negotiated work practices.
In order to enable restructuring on the basis of advanced factory organisation, it will be necessary to offer consulting services on a wide and inexpensive basis. In addition, attention must be devoted to supportive human resource development.
Regional Support Services
Many clothing companies are managed as family firms, without sufficient training in new management and organisational techniques. This is exemplified by the lack of attention to creative and professional management of the production floor. For example, 25% of firms surveyed by the NP! do not have a work-study department (NP! 1992). A work-study department does not infer the employment of an industrial engineer: Very few industrial engineers are employed by clothing factories.88 A workstudy technician is usually only capable of maintaining the organisational status quo. It is immediately obvious when an industrial engineer governs the factory floor: One finds organisational experiments and more creative floor management. The NP! survey found that only 33% undertake organisation and methods (O&M) studies and 54% undertake systematic equipment evaluation entailing some form of preventative maintenance scheduling. This study found that only 47% of firms ever check the ratings of the few industrial engineers employed. Annualized savings are required from the industrial engineering department in less than half the firms surveyed (NP! 1992). The NP! study found that insufficient production management was a problem, albeit to differing degrees, in factories of all scales.
Even with the best of intentions, the diffusion of new forms of work organisation will not be possible in this environment, with this weak skills base. There is little question that the S.A. clothing industry must produce higher value-added, higher quality products and substantially improve productive efficiency to ensure long-run competitive advantage. This shift will require the provision of production advisory services.
88The production manager of a large factory had previously been an accountant for the firm. When asked about any re-training undergone, he looked perplexed and replied: "But what is there to know? It's simple".

144 INDUSTRIAL STRATEGY PROJECT
The development of such services would require a number of changes. A critical mass of industrial engineers should be trained for the clothing industry. Some of these engineers would be hired by large factories. Yet, smaller finns may have difficultly affording this type of in-house support. Hence, it would be beneficial to develop regional support services. Such service centres could offer advice on new work organisation and assist in its implementation. These centres would serve two purposes: First, firms that could not afford in-house industrial engineering departments could hire these services on a part-time basis. Second, if SACTWU becomes involved in bargaining to promote improved work organisation, these regional service centres could provide impartial intervention.89
Training and Grading
Skills development is crucial at all stages of production. This particularly applies to clothing since most productivity gains are made through organisational change. The educational and skills potential of clothing workers is underestimated. In almost every firm visited, almost no job mobility was possible and very little training was offered. Only one factory had a floor manager who initially started as a cleaner: this upward mobility was possible in a case where the worker was particularly motivated and the factory supportive of the required training.
The perception of a weak skills potential seems to arise from the poor educational background of most clothing workers: On average, factory workers enter with a Standard 6 to 8 school education. Particularly in a female dominated industry, workers may not have continued their education for many reasons other than ability. Education is often cut off by childbearing, a low family priority on female education or the lack of household income earners. The fact that workers are willing to work for a wage that is often below the minimum subsistence level reflects the dire poverty from which they emerge and the lack of life choices. Poor school education does not reflect intelligence or the ability to learn: it is a stronger indication of the lack of effective access to education.
Factory workers are not encouraged to undertake skills training since the grading structure offers little reward. This problem is most evident for assembly machinists, who account for the majority of clothing workers. While three machinist grades exist, the majority of operators fall into only one grade. In addition, a clearly defined channel for skilling and job mobility does not exist. Essentially, the grading structure, in the context of single tier bargaining, does not encourage workers to advance along a skills hierarchy. Hence, very few workers realise their potential. This is a particular problem since the clothing industry is not
The next section considers ways to use wage bargaining to drive changes in work organisation. In addition, if SACTWU becomes involved in Early Warning Systems' that identify potential closures, the immediate availability of independent production consultants will facilitate any negotiation to implement improvements in the factory.

CLOTHING SECTOR 145
attracting sufficient numbers of qualified technical personnel. As a low productivity sector, wages for technicians tend to be relatively poor: technical staff, such as industrial engineers, would move into higher paying industries. Most firms are unaware that it is possible to train technical staff from machinists with low basic school education. Discussions with a number of consultants and the CITB have confirmed that it would be possible to go through middle level management and technical training with a standard 6 education. Clearly, worker and employer motivation is required, in addition to supplementary assistance in numeracy and literacy skills: However, it cannot be denied that the most effective middle level management and technical staff would be those that have an intimate understanding of the various functions within the plant.
Very few firms encourage training or mobility and are unaware of the potential contribution a skilled workforce can make to productive efficiency. It is often assumed that training is lost through high rates of labour turnover. Many companies believe they subsidise the industry if they invest in training. However, industry labour turnover rates are not exceptionally high: One small sample found labour turnover rates of 15% (NPI 1992). Many firms find that their core workers stay for many years: labour turnover tends to be highest amongst younger and newer workers. In fact, factories that have invested heavily in training often find that their labour turnover rates fall. While the causality is unclear, an investment in training may reflect better attitudes toward the workforce in general. Improved training in the clothing industry could enhance productivity in many ways, including:
• Enhancing the relative attractiveness of local labour
• Reducing downtime where machinists are capable of attending to small mechanical problems, machine resetting and machine maintenance.
• Reducing lead times and quality problems where workers are involved in problem solving and improvements associated with quality checking and line balancing.
• Reducing downtime with greater awareness and communication between the shoptloor and design departments.
• Improving efficiency in the deployment of employees in the factory as the ratio between indirect to direct workers falls. Flexible skills allow workers to move between functions, reduce work-in-progress and perform indirect functions such as inspection and cleaning. In this way, the "human resource base" is more fully utilised, by virtue of working "smarter", not harder.
146 INDUSTRIAL STRATEGY PROJECT
• Improving productivity and reducing the cost of sales associated with short-cycle manufacturing techniques and unit production systems.9° The effective implementation of these organisational practices requires a skilled workforce.
• Providing skilled middle-level management and technical staff
Training policy needs to be reconsidered in its entirety. The changes currently implemented within the CITB are not sufficiently coherent as they address parts in isolation. Alternatively, the notion of career paths enables a reconsideration of training policy in a more comprehensive manner. Essentially, "a career path refers to a classification structure under which a worker can either:91
Progress up through clearly defined skill levels (vertical progression).
or
Progress within a skill level by virtue of experience gained (horizontal progression)".
A training policy would be designed to offer clear steps up a skills ladder, where a thread cleaner with sufficient ability and motivation could potentially become a technician, engineer or human resource manager.92 Clearly, some workers will choose not to advance, while others will take up training with small increments in mind. A
complementary grading structure would reflect the relationship between skill and career paths.
The current grading structure is complicated with pay relativities that do not necessarily reflect skill or difficulty of work. In addition, the grading structure and pay relativities vary by region and are therefore not consistent with the move to ceniralised bargaining. There are a maximum of 24 grades, generally offering trainee and qualified rates.93
90For example, see Table B15. Alternatively, there is little point in pursuing a strategy of skilling for the
clothing industry unless organisational practices are modified.
9tThese definitions are from TCF, section LI,pl
The Young Management Development Programme clearly demonstrates that it is possible to train shop floor workers for managerial positions. For example, there are 5 shop floor workers on the YMDP. Former CITB employee, Nic Jooste, claims that while matric is the preferred base education, it is possible to admit those with standard 8 education since the basic skills required include broadness of thinking and basic literacy and numeracy.
93The number and definition of grades varies by regions. The East Cape defines only 18 grades.

CLOTHING SECTOR 147
Figure 16 Career paths in a clothing factory
Managenal fLRldiOtlS Factory manager *
planning Personnel manager * floorjfactory supeMskx Industrial erineer
/ \ I * technical reorgarilsation
I \ advanced Waling sJiIIs; al to assist in hailing Full medwiic pirnmme devalopment
f 5 \ u *m siaus aothng \ * range of mechanical s1s FloOr supervisor
* baso line balancing arid work Shidf SkillS Su ervisor * medium-level training skills 4 * fjfl skills Assistant trainer
* capable of producing ftill garment Assistant mechanic
* able to take group rasponsiblilty Minst (level 4&5) * capable c sewing 1mm a pattern
3 * basic arváig & problem soMng sidlis Assistant bne-
capable ç Idlng basic training Trainee mechanic SMSO IS level 2
* ability to pedomi more xmplex tasks
2 * perform diflerent funcilons Machinist(level 2&3)
* operate iricre than ons mathina Basic
* responsible for quality ai own wodc
Thread dewier Labourer
ExamIes Grades Examples of Fundions of job litles

148 INDUSTRIAL STRATEGY PROJECT
Table Dl: Relative Wages in the W. Cape Industrial Council Agreement (July 1992-93)
Weekly wage (Current R)
Years to qualify
Starting wage
Wage Relative to Grade B
Ratio of starting to qualified wage
Machine mechanic 428.00 3 238.00 193 56
Clothing technician
428.00 3 238.00 193 56
Head Cutter 428.00 193
Pattern Maker 428.00 3 238.00 193 56
Grader 344.50 3 221.00 156 64
CutterlLaymaker 332.00 2.5 198.50 150 60
Clerk 290.50 2.5 212.00 131 73
Supervisor, Instructor, Quality control
270.50 122
Grade A 263.00 2.5 183.50 119 70
Clicker 246.50 2 182.50 111 74
Cutter: interlining/trims 239.00 2.5 177.00 108 74
Tracer 231.00 1.5 180.50 104 78
Grade B 221.50 1.5 180.00 100 81
Travellers' driver 220.00 99
Factory Clerk 216.00 2.5 171.00 98 79
Despatch packer 211.00 95
Layer 203.00 1.5 171.50 92 84
Underpresser 200.00 1.5 171.50 90 86
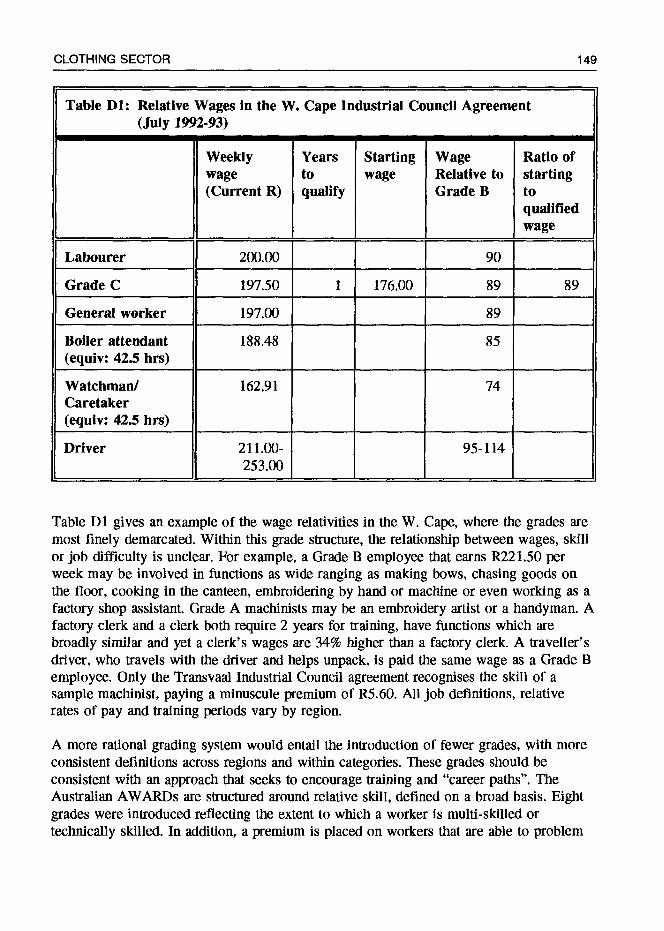
CLOTHING SECTOR 149
Table Dl: Relative Wages in the W. Cape Industrial Council Agreement (July 1992-93)
Weekly wage (Current R)
Years to qualify
Starting wage
Wage Relative to Grade B
Ratio of starting to qualified wage
Labourer 200.00 90
Grade C 197.50 1 176.00 89 89
General worker 197.00 89
Boiler attendant (equiv: 425 hrs)
188.48 85
Watchman/ Caretaker (equiv: 42.5 hrs)
162.91 74
Driver 211.00- 253.00
95-114
Table Dl gives an example of the wage relativities in the W. Cape, where the grades are most finely demarcated. Within this grade structure, the relationship between wages, skill or job difficulty is unclear. For example, a Grade B employee that earns R22 1.50 per week may be involved in functions as wide ranging as making bows, chasing goods on the floor, cooking in the canteen, embroidering by hand or machine or even working as a factory shop assistant. Grade A machinists may be an embroidery artist or a handyman. A factory clerk and a clerk both require 2 years for training, have functions which are broadly similar and yet a clerk's wages are 34% higher than a factory clerk. A traveller's driver, who travels with the driver and helps unpack, is paid the same wage as a Grade B employee. Only the Transvaal Industrial Council agreement recognises the skill of a sample machinist, paying a minuscule premium of R5.60. All job definitions, relative rates of pay and training periods vary by region.
A more rational grading system would entail the introduction of fewer grades, with more consistent definitions across regions and within categories. These grades should be consistent with an approach that seeks to encourage training and "career paths". The Australian AWARDs are structured around relative skill, defined on a broad basis. Eight grades were introduced reflecting the extent to which a worker is multi-skilled or technically skilled. In addition, a premium is placed on workers that are able to problem

150 INDUSTRIAL STRATEGY PROJECT
solve or apply "independent judgement". A worker may advance through the entire grading system, from a trainee machinist to a managerial position. Small incremental steps are made within each grade, as a worker gains further skills within a defined limit. Once a specified set of skills are gained, the worker can then move into the subsequent grade.
Figure 16 offers an example of career paths for workers entering the industry as machinists or machine technicians. The chart on the left shows the kind of skills that might define particular grades: workers that have similar skill levels but different jobs may then belong to the same grade. In the right-hand column are listed examples of the kinds of jobs that might fit within the grade definitions.
Many machinists will remain within the gamut of the first 3 grades: Ideally, grade 3 would be a requirement for most machinists since the introduction of new organisational practices depends on these skills. Workers that choose to advance further could push on to higher grades, with very few finally crossing over into salaried staff managerial positions.
Figure 16 is not definitive, but is rather suggestive of the kinds of horizontal and vertical paths workers might follow through their working lives. In order to ascertain which jobs belong to which grade, it is necessary to perform a skills audit of current jobs done and skills possessed by workers. Skills must be generalised by training time, problem solving and technical ability to compare over current grade categories. Once the relative skill levels are determined, it becomes possible to outline potential career paths for workers, along which there are clearly defined relationships between skill, the acquisition of training and upward mobility.
The relationship between skills training and organisational change cannot be underestimated. Skills training is irrelevant unless firms make use of the new capabilities. New organisational practices cannot be effectively implemented unless workers are skilled and involved in change. One way of driving this change on both the side of workers and firms is to introduce a "Co-operative Programme": Workers undertaking training programmes would be required to develop factory based projects to improve productivity.94 These projects would tie training to work organisation at all levels: the suggestions may be broad or narrow. However, the activity would encourage problem solving for workers and would show employers how workers can actively contribute to organisational change and productive efficiency.
In order to encourage training, it will be necessary to overcome management obstruction. This problem may be approached in a number of ways: The state might offer incentives
The CITB's Young Management Development Programme (YMDP) operates along these lines: However, it is only directed at middle-management positions. This educational concept could be effectively applied at all levels.

CLOTHING SECTOR 151
such as tax breaks or export subsidies that are partially reliant on training provided. Alternatively, the degree to which skills training can improve productivity may be demonstrated in clear cost accounting terms. Finally, the costs of training might be partially absorbed for small firms through the provision of group training schemes.
Di .2. Pipeline Organisation
Discussion concerning improved communication in the clothing-textile pipeline has been heard for a number of years, with few results. It will not be possible for the S.A. clothing industry to substantially raise its competitiveness unless the local apparel textile industry becomes more responsive and improves its quality and lead times. In addition, quick response relationships with retailers will be crucial to the ability to compete with imports. The most important block to implementing quick response relationships is the lack of trust. Ways of addressing this poor relationship between members of the pipeline are unclear. The only suggestion proposed by this study includes tying the forging of desired developmental pipeline relationships to financial or fiscal incentives. A second problem concerns poor work organisalion that limits the ability of both clothing and textile firms to quickly respond to market demand. This second problem can be bridged with the introduction of SCM techniques and capital investment in textile finishing.
D.1 .3. Marketing Strategies
A strong marketing drive will be required to enter export markets. A central marketing resource agency could be developed to coordinate marketing internationally and to link potential buyers to S.A. suppliers. This service would be similar to Turkey's ITKJB. The industry could establish central marketing offices in important markets, as does the Italian industry.
The most important means by which USA, Canadian and EC buyers acquire product sources differ (Harris and Heppell 1991). By far, buying offices are the main source of information for USA retailers. Canadian buyers tend to source information from sales representatives or agents. Alternatively, EC buyers find product sources from trade shows and trade publications. Differences in information sourcing may be partly reliant on the relative concentration of distribution, where mass retailers are less significant in the EC than in the USA or Canada (Newbery 1990). It will be important to take this kind of information into account to maximise the use of marketing resources.
Finally, the develop of key partnerships will be beneficial, whether with particular retailers or economies. For example, the success of Turkey relies on its relationship with West Germany, while China depends on Hong Kong.

152 INDUSTRIAL STRATEGY PROJECT
D.1.4. Clothing-Textile Development Office
A Clothing-Textile Development Office could be established to coordinate an industry plan that serves to develop the clothing-textile pipeline. This service would operate independently of interest groups: it would service the joint interests of management and organised labour. In some cases, it might even be used to mediate between the various
(non-wage related) interests of the textiles and clothing industries and SACTWU. The potential functions might include:
• the development of an industry data base, monitoring changes in issues such as the dissemination of technology, new work practices and location patterns. In addition, a database could be developed that enabled some analysis of the interrelationship between retrenchment and firm/factory scale, use of technology, investment patterns, location, market and ownership type.
• the development of regional support services and responsibility for appropriately staffing these services: In particular, the training of industrial engineers would be crucial.
• the monitoring of the use of incentives and assistance to firms.
• the preparation of joint management-labour representations to the state. This function could include mediation between groupings to ensure a united voice is presented to government.
• the promotion of textile modernisation. For example, an important impediment to clothing flexibility is related to the long runs associated with old finishing equipment.
• the linking of exporters to potential overseas buyers. An excellent example of this service is ITKIB, a research and consulting parastatal that services the Turkish clothing and textile industries.

CLOTHING SECTOR 153
To date, industry policy has primarily focused on narrow trade issues. Section D.2. suggests development policy for the S.A. clothing industry. The broad goal concerns the adoption of productivity improvements that will contribute to dynamic competitive advantage. The main policies include the establishment of a central Development Office, the development of Regional Support Services and a reconsideration of human resource policy:
Clothing-textile Development Office
A Development Office would coordinate an Industry plan jointly for business and labour. It would ensure the development of regional support services, monitor developments In the pipeline, supervise the use for abuse) of incentives offered to the industry and promote joint submissions to the state where necessary. Finally, a Development Office could be responsible for linking exporters to potential overseas buyers.
Regional Support Services

154 INDUSTRIAL STRATEGY PROJECT
Training and Grading
The training and grading system needs to he altered for two reasons First, It wifi not be possible to Introduce newer organisational practices, reduce downtime and Improve throughput times unless workers become more multi skilled In particular, modular manuh*cturlng systems absolutely require that workers have a broad range of skills Even where orgamsational changes are modest, traimng workers In quality control and line balancing can reduce reject rates and speed throughput Second, the current grading system discourages worker interest in training since little financial remuneration is offered to those who gam a broader skill base
The common perception that clothing workers are unable to become more educated and move up the 'ranks' seems to be based on poor entry educational levels However, low school leaving educational attainment Is probably more the result of the few choices facing women Factories that do encourage traIning achIeve the desired results
The training and grading structures should reflect dearly defined career paths for production workers Increments should be offered to workers that gain higher skill levels The current gradIng system contains a maximum of 24 grades, differing by region, with pay relatlvlttes that do not necessarily reflect skill This structure should be simplified to about 5 broad bands and homogenised across the regions Each band could contain very different jobs, but reflecting similar skill levels
There will be resistance to changes in grading structures or training expectatIons Some suggestions were put forward to overcome resistance For example, it will be necessary to offer detaIled information on cost savings achieved through training In addition, this study suggests the development of a co-operative programme where workers on trainIng schemes develop projects that can be implemented on the factory floor to improve productivity Section 1)25 also recommends wage agreements that extend over a longer period of time so that employers wlil not obstruct the Introduction of a new grading system for fear of unexpected wage rises Finally, tax breaks or export subsidies might be provided to firms that train
While wages have risen, they are still very low In fact, the determination for a qualified clothing machinist Is below the minimum household subsistence income level Unless there Is some plan to Increase wages to exceed subsistence levels, It wili be very difficult to implement substantial training programmes.
D.2. Regulation: Organising the Operational Environment
Clothing firms can be organised in a multitude of ways. The choices taken partly depend on the extent and form of competition and the regulatory environment. Maxithising local formal sustainable employment can only be achieved if the industry expands and becomes more competitive. But industrial expansion does not guarantee job creation. In fact, without regulatory guidance, the promotion of the clothing industry can result in labour fragmentation, where parts of the workforce are employed on an informal or casual basis. This can lead to dualism in wage and working conditions and/or a downward pressure on all wages and working conditions. Foreign processing is a common experience in even the most successful industries. In this way, industrial output expands but local jobs decline. Like informalisation and casualisation, foreign processing can also exert a downward pressure on wages and working conditions.
Therefore, regulating the operational environment is as important as promoting industrial expansion. Historical behaviour in the clothing industry has demonstrated that firms do react to regulatory change: Firms have chosen different forms of labour flexibility, depending on the effect of labour market controls on relative wages and regional incentives. Now that certain options for achieving flexible labour costs are being cut, firms will surely seek new forms. These options are outlined in section B.3.l, including informalisation, casualisation, foreign processing, automation and shifting into importation.
There are a number of ways of addressing these business choices: the first entails facing these forms of labour cost flexibility head-on by imposing severe regulations. Yet, the industry is highly footloose and this reaction could simply encourage closure and movement outside of S.A. Geographical movement of production is not so difficult for a labour intensive industry. While a firm would want to maintain a headquarters and design office near markets, the precise location of production is less important. In addition, excessive rigidity tends to result in intensified efforts to circumvent the rules. It is quite common for clothing unions globally to experience a significant loss of influence over their environment.
It is necessary to consider ways that the union can influence the operational environment so that acceptable and sufficient forms of flexibility are available to firms. The emphasis would be on altering the forms of flexibility, not their elimination. Certain avenues are cut off, while other avenues are opened up. The forms of flexibility allowed may not be optimal since it could entail the loss of hard-won gains. However, the real choice may entail demarcating between the acceptable and unacceptable areas of compromise: In order to ensure long-term survival of labour organisation, it may be necessary to offer the acceptable areas up in exchange for concessions or desired behaviour. The following section considers ways of addressing foreign processing, informalisation, casualisation, wage determination and closures and retrenchments.

156 INDUSTRIAL STRATEGY PROJECT
D..2.1 - Foreign Processing
Foreign processing usually refers to goods that are exported temporarily for processing, and re-imported for local sale as South African.95 In this discussion, foreign processing also refers to goods that are produced for export by a S.A. based company, where the fabric is exported for assembly in another country and the final product is labelled under the country of assembly. Normally, foreign processing occurs in order to capture the benefits of lower wages or weaker labour regulation. S.A. firms have also been involved in foreign processing to circumvent sanctions. If South African clothing exports are promoted, it is also probable that foreign processing will expand in order to take advantage of preferential market access to the EC available to Lome Convention signatories.
The extent to which foreign processing can result in local job loss is quite dramatic. For example, 35% of German clothing output value is processed in foreign plants ("Traffic" 1991). This really means that more than 70% of value added in German clothing occurs outside of Germany.96
Foreign processing by S.A. firms has not yet reached OECD proportions. However, in the context of relatively high labour regulation and non-Lome status, an encouragement of exports will soon result in the expansion of OPT. It becomes very difficult to curb this activity once it takes hold. It is therefore sensible to address this issue now, since there is already evidence that outward movement is increasing.
The current EC regulations (EC regulation 636/82) are administered nationally. Generally, 30% of output value may be processed in foreign plants, outside of the EC. In Belgium, the 30% is imposed on the value-added and is only allowed where a firm's employment has fallen by less than 5% over the previous year. In Italy, a union signature is required on foreign processing agreements to ensure fair labour practices. Finally, a number of EC countries allow only manufacturers to produce in foreign plants: the limitation to manufacturers is meant to curtail abuse of regulations by design houses and brokers in clothing.
Foreign processing is assisted in the USA by sections 9802.00.60 and 9802.00.80 of the tariff schedule. These sections allow duty free imports of all American- made components
95The need to regulate foreign processing (outward processing traffic' or OPT) has been addressed most directly in the European Community (EC). "The (EC regulatory) provisions...apply to textile products and clothing resulting from processing operations in a third country whenever there are arrangements on imports or surveillance with regard to imports...from the said third country..." (Council Regulation (EEC) No.636/82 (March 1982) (Official Journal of the European Communities No. L76).
96This assumes that 50% of product value are material inputs and 50% value added.

CLOTHING SECTOR 157
used in goods assemhied abroad: Duty is offly payable on the value-added, which given low wages, is usually not very high (Mody & Wheeler (1987:127O)).
The regulations that are being discussed for the EC on foreign processing would be useful to consider in the S.A. situation:
Employment should be maintained in companies that process in foreign plants. In other words, the foreign jobs should be new and not displace local ones.
Foreign processing should be banned for "commercial enterprises and brokers": The company processing in foreign plants should also be a manufacturer.
Foreign assembly should occur only in factories observing the ILO conventions. To this end, a union signature should be required on agreements wit/i foreign plants.
The unions should be involved in monitoring the regulations on foreign processing.
Any publicly-sourced financial assistance should require that a fixed percentage of a firm's value added be local.
D.2.2. Informalisation
Informalisation devastate labour organisation. This is the process by which formal factory jobs are increasingly displaced by jobs in unregistered plants and homeworking. Informal producers are used in order to circumvent labour regulations and lower labour costs. Since the wages in small and large firms, contractors and subcontractors, tend to be the same, there is an extra incentive in South Africa to start looking to informal production as other options for labour cost flexibility close.98 In addition, the proliferation of design houses will encourage the expansion of informal production, with associated shorter production runs and the lack of accountability to the industrial council system.
Informalisation is extremely difficult to regulate once it begins to take substantial hold on the industry. Such plants tend to be relatively "invisible" and difficult to organise when workers are fragmented and more vulnerable.
91These regulations result in a situation in which the best option for trading with the USAA is in partnership, using section 9802. In this way, a DC can avoid most of the tariff payments on clothing exported to the USAA.
IntemationaIly, wages normally vary by finn or factory scale. Overseas, the wages in small plants tend to be about 20% lower than in large plants.
158 INDUSTRIAL STRATEGY PROJECT
One way of addressing informalisation is to implement regulatory controls. At present, the Industrial Councils do not allow firms to subcontract to non-industrial council members. In addition, SACTWU has been negotiating for the requirement of Industrial Council membership by very small firms. Although it is necessary to have these regulations in place, informalisation is very difficult to police. Moreover, the regulations do not cover design houses that do not fall within the gamut of the Industrial Council system.
Although there is little precedent internationally, discouraging informalisation may be a more effective means of addressing this problem. First, the relative gains from using informal plants would be reduced if a dual wage determination were set for very small factories. For example, in Italy, there is a specific determination for firms with less than 15 employees. Although many firms take advantage of the dual wage determination, it may be preferable to encourage firms to remain within the Industrial Council system, rather than become completely unregulated.99
Second, intermediary services between contractors and subcontractors could be developed. Examples of such services could include brokering between contractors and subcontractors, or offering a "rating" guide on subcontractors (eg. by quality, timeliness or relative prices). In addition, small subcontractors might gain from central services. For example, it might be beneficial to offer services that are not normally within reach of small firms such as cheap credit and the exchange of inexpensive or used equipment. With the development of such services, it might become more advantageous to remain within the regulatory environment.
Third, member education could be an important source of information and means of countering the expansion of informal production. For example, it is common for informal operators to have gained skills in factory work (Koch 1991). Internationally, informal services emerge when employers encourage their firms to become "independent operators". In such cases, the firms may even offer to sell equipment cheaply. Member education is important in countering false promises associated with this independence. Many operators that take up these propositions find that they unexpectedly worsen their situation by increasing the work intensity for less remuneration and benefits. However, once in their communities, there is less communication between workers and this message does not necessarily get transmitted. Member education can be useful in breaking down some myths associated with self-employment. In addition, it may be helpful for workers to be made aware of the effect that informalisation has on wages: that apparently isolated instances of informal business can have a downward pressure on
990ne problem experienced with two wage determinations concerns the artificial break-up of firms. In a tour of the Italian clothing industry, plants that quite clearly contained one firm were described as a number of companies. Essentially, companies would register their cutting room and each line as one firm. To do so, they were simply required to erect some partition or wall between the various activities.

CLOTHING SECTOR 159
wages and working conditions for factory workers. In addition, member education may be used to ensure the implementation of Industrial Council regulations. For example, members could be trained to keep their eyes open to the source of subcontracted work and their implications.
Finally, community organising may be a useful way to limit the extent to which workers
disappear from the regulated environment. Unemployment-related services could be offered to retrenched workers to keep them within the regulated system. For example, workers may need help with unemployment insurance applications, health services, creche services while seeking alternative employment or even job recruitment services.
D.2.3. Casualisation
The clothing industry is typically organised on the basis of seasons: A range is produced and bought at the beginning of each season. This means that the factories tend to have very busy and slow periods. This variation encourages firms to seek "fixed term contracts" so that staff levels can be varied over the year.
The demand for fixed term contracts will rise in S.A. for two principle reasons: first, the decline for local orders is encouraging firms to find ways of enhancing labour-cost
flexibility. Second, the possibility of hiring cheap and casual labour in previously deregulated decentralised locations is being reduced as these regions come under increasing union influence. Firms will increasingly take advantage of the weak
regulations on casualisation in the industrial council areas.
The expansion of fixed-term contracts can have a divisive effect on the workforce,
creating a small core of higher paid, "permanent" workers and a larger pool of fixed-term contract workers. This larger group would be in a weaker position and would be more docile to the demands of management. In addition, the expansion of casual labour negates the move required toward improved productive efficiency and attendant training needs.
There are two ways of addressing the potential problem of casualisation:
• the promotion of short-cycle manufacturing and the development of quick response relationships help to smooth the production cycle. Factories produce smaller batches over a longer period of time. The introduction of these techniques reduces the previously cyclical nature of the industry.
• Introduce more stringent notification and severance procedures to safeguard current jobs. In a recession, workers previously hired on "permanent" contracts
may be retrenched and subsequently hired on fixed-term contracts.

160 INDUSTRIAL STRATEGY PROJECT
It may be difficult to completely bar fixed-term contracts. Hence, the use of casual labour
may be limited by introducing regulations determining the percentage of a firm's workforce that can be hired on fixed-term contracts. Where employers want to hire on this basis, they would be required to apply to the Industrial Council.
Overall, it may be necessary to consider regulations over informalisation and casualisation in unison. While neither form of labour-cost flexibility is desirable, informalisation constitutes a bigger problem than casualisation since it operates completely outside of the formal regulatory structures. Allowing for some flexibility on the use of casual labour may help to limit the degree to which firms seek to use informal subcontractors.
D.2.4. Notification and Severance Procedures
The regulation on notification and severance procedures are weak: Behaviour depends on union strength and the potential industrial action that unfalr practices may cause. The current regulations require one day's notice for less than 4 weeks service: Thereafter, one week's notice is required. While notification of retrenchment to the union is required, the time required is so short that the notification offers little benefit (NCF 1993:371). In most regions, severance pay is to be negotiated between the union and firm on a case-by-case basis. The Transvaal is the only region requiring a minimum severance pay, equal to 3
days pay per year of service (Interview, Rob Lagrange 1993). In light of the extremely low wages paid in the industry, even this minimum does not add to much. The industrial councils operate provident funds: the contributions account for a minuscule proportion of earnings and only recently were the contributions raised slightly.
There are a number of strategic reasons for introducing improved regulations concerning severance procedures and payments. First, the long term health of the S.A. clothing industry depends on the ability and willingness of firms to introduce new manufacturing techniques. It is the "willingness" that is unclear: Diffusion of new forms of work organisation and technologies is exceptionally slow in the global clothing industry. It is hoped that the right set of policies can be implemented in S.A. to encourage the desired changes. However, clothing management tends to be more conservative than in many other industries. It is not possible to completely depend on the required industrial change. Mostly, it is hoped that a critical mass of firms either alter work organisation or enter the market with new ideas. The likely outcome is further retrenchment with hopefully a core of sustainable jobs. Improved notification of retrenchment or closure is required in order to respond, even if by assisting in finding new jobs for members. The severance package may include in-kind assistance such as skills training. An adequate severance package should be available to workers whose low incomes would not have allowed lifetime savings.

CLOTHING SECTOR 161
Second, improved notification procedures would enable the development of a data bank: This information base could point to common characteristics (such as size, product or technology) in firms that are retrenching or closing. It would then be possible to target regional services to problem areas. In addition, the information could be used in shop steward and member education to identify early signs of an impending closure. Where members realize that a firm may be heading for trouble, early negotiations could be undertaken to introduce consulting services to recommend changes to sustain the firm. If SACTWU decides to become involved in developing "early warning systems", a notification period of at least one month would be required.
D.2.5. Wage Determination
Orthodox economic theory contributes to the dominant way that firms and policy makers think about the relationship between productivity and wage determination. Essentially, it is assumed that firms should pay workers according to their marginal productivity. However, in reality it is difficult to determine the marginal productivity of labour in a meaningful way. In fact, wages are determined on the basis of a number of factors including the availability of workers, labour regulation, unionisation as well as productivity.
Of course, it is possible to measure average labour productivity. However, the assumptions normally associated with the labour-output measure are questionable: What information does an improvement in output per worker really transmit? In clothing, it may simply reflect a reduction in the use of domestic labour or enumerated factory workers.10° It is necessary to determine the full range of significant contributors to productivity improvement. The disaggregation of ratios is quite important: One may want to know to what extent improved labour productivity occurred as a result of reduced rejects, reworks or material wastage on the cutting floor. A more useful measure might include a ratio associated with material use.
The topic of wage determination is particularly sensitive in the context of industrial restructuring. Issues explicitly raised by employers and SACTWU have been related to wage flexibility and productivity bargaining. Discussions with employers almost invariably include some reference to the number of jobs that would be created if labour markets were deregulated and wages more flexible. The most common suggestions put forward by business include the determination of different wage levels by product type and by business size.
'°°As discussed in section B.3. 1., labour productivity in S A. may have been stagnant relative to the industrialised countries because the regulatory environment has encouraged labour cost flexibility amongst domestic, enumerated workers. Firms have not yet adopted the dominant strategies overseas, where assembly is undertaken in foreign or informal plants.
162 INDUSTRIAL STRATEGY PROJECT
Conceding differential wage determinations for the same job grades is problematic in terms of implementation and justification. In particular, successful restructuring in the clothing industry will only occur if the emphasis shifts away from wage flexibility to focus on productive efficiency.
This does not mean that some forms of wage flexibility should not be considered: Instead, the strategic issue concerns the manner in which SAC'FWU can use an important bargaining tool to encourage desirable industrial change. Essentially, any concessions by labour should be tied to elements of improvement in productive efficiency. Elements of wage flexibility introduced should entail a net gain for labour, whether in the short or medium term. For example, if a firm is investing in changes that will improve its sustainability, limits on wage increases should be tied to associated gains in profitability or productivity. The fundamental point is that high wages are not the source of woe in the S.A. clothing industry.
S.A. wages are comparable to those in other middle income countries: When adding social costs to compare total labour compensation, one finds that S.A. labour is actually relatively cheap (Table G8).10' Figure 3 shows that the competitive problem is not labour cost, but rather productive efficiency. While labour costs are approximately in line with other middle-income countries, the cost per standard minute is high. When total productivity is considered, the cost of production is not that much different from the industrialised countries.'02 In fact, it can be more expensive to produce in S.A. than in the USA! Firms may seek to address this imbalance by reducing wages or intensifying work through traditional forms of productivity bargaining: Since the reduction in wages does not address the fundamental problem of productive efficiency, this concession in the absence of other changes in the production process will not contribute to job stability. Hence any allowance for wage flexibility must be determined within an understanding that wages are not the problem: However, wage concessions may be used as a strategic tool to encourage changes in business behaviour that would ensure competitiveness. Wage flexibility concessions on their own will not benefit organised labour, and will merely support a traditional and inappropriate attitude toward productivity.
Wages must to some extent reflect the local cost of living. From a purely economistic point of view, it is necessary to support human capital development and the reproduction of labour. The minimum effective household income in March 1992 for "African" and
'°'South Africa could not compete with extremely cheap countries such as China. The S.A. clothing industry's competitors in terms of product and cost structure include other middle-income countries such as Turkey, Eastern Europe and certain SE Asian economies.
inTotal productivity is compared by measuring relative cost per standard minute multiplied by relative unit output per minute.

CLOTHING SECTOR 163
"Coloured" families ranged between Ri 170 and R1425.'°' The average monthly gross pay of a qualified machinist at about R946 in July 1993 does not cover the nilnimum household subsistence level, and is well below the minimum effective household income level. Although the family profile of clothing workers is unknown, one survey found that "Coloured" and "African" families have an average of 1.3 earners per household (Nel i986). This means that the wages of only 30% of workers are supplemented by a secondary income. One must stretch the imagination to ascertain the manner of survival in unregu1ated areas where wages are one-fifth to one-half of industrial council minimums. Although the desperation of unemployment may drive some to work for wages below the minimum subsistence level, it is not in the interest of business to push wages below this level. Employers need to ensure that the labour force from which they draw workers is sufficiently sustained. In light of the current relationship between wages and the cost of living, one might argue that wages are not rising fast enough. A survey of family structures covering the average number of income earners per household and the average family size of clothing workers would show the extent to which minimum wages should be determined with the minimum effective household income levels in mind.
Table 02: Wages and Subsistence Levels (Qualified Clothing Machinists)
j__Natal' Cape2 Transvaal3 E. Cape4
Ratio of wages to Minimum Subsistence Income Level(%)
1989 100 101 77 91
1992 93 109 96 90
Ratio of wages to Minimum Effective Income Level(%)
1989 67 67 51 60
1992 62 73 64 60
Source: Adapted from NCF Diary 1993 pg 326: Bureau of Market Research (UNISA) & Institute of Planning Research (UPE).
Notes: 1. Refers to "coloured family of 5" in 1992 and an "Indian family of 5" in 1989. 2. Refers to a "coloured family of 5". 3. Refers to a "black family of 6". 4. Refers to a "coloured family of 5". 5. The minimum effective income level is equal to 150% of the subsistence level. The effective level is the absolute minimum income that can sustain a viable family unit.
103 The minimum subsistence level for a 'coloured' household (family of 5) and a 'black' household (family of 6) in March 1992 varied between R780 to R950 per month. This level is not sufficient to sustain the family as 'a viable unit': it includes only the most basic of necessities for survival. "The income is not effective in enabling the household to maintain the standards of short term health and decency To sustain a family, at least 150% of the household minimum subsistence level is required (NCF Diary 1993 :326: Institute for Planning Research, UPE).

164 INDUSTRIAL STRATEGY PROJECT
A standard argument would suggest that an industry unable to cover these minimum costs should not be sustained in S.A. Yet, clothing is a highly fragmented industry embodying many products and methods of production: It is therefore possible to find successful clothing industries in both high and low wage countries. To successfully compete from a high wage base, improvements to the organisation of production are required. The S.A. clothing industry is outliving the period in which it can depend on low wages to support competitiveness. This change results from rising labour regulation, inflation and exchange rate policy. Realistically, wages are not a variable when set so close to minimum subsistence levels. Increasingly, firms will have to depend on improvements in productive efficiency that contribute to long-run competitive advantage. The disembodied technology associated with these improvements has advanced considerably: Tables B 18 and B 19 show the kind of sustainable cost savings that can made within a year of implementing organisational change.
Tiered Wage Determinations and Wage Flexibility
Wage flexibility and tiered bargaining are not in the direct interest of labour: SACTWU has created an enviable position with a movement to centralised bargaining and single tier bargaining. This situation greatly simplifies the process of wage determination in a highly fragmented industry. In addition, it contributes to worker mobilisation.
However, there may be some circumstances in which multi-tiered bargaining and wage flexibility are considered. In particular, these may be used as strategic tools to ensure the continued use of local factory labour and the introduction of desired forms of work organisation. As discussed, many previous forms of labour cost flexibility are being closed: firms will be seeking new forms. If there is a significant shift into informal plants or foreign processing, SACTWU will substantially lose bargaining power in the industry. In order to exert some influence over the process of labour "flexibilisation", SACTWU might consider allowing forms of flexibility that are "lesser evils". Two examples are considered here: dual wage determinations according to scale and wage flexibility according to behaviour.
First, two determinations might be considered: In this case, one determination would cover large firms, the other would cover small firms. This system is used in the Italian clothing industry. One trick Italian business use to circumvent the higher determination includes breaking each factory into firms: For example, a number of factories visited were described as multi-firm, where the cutting room and each production line was considered as a factory. In S.A., one might expect that a lower determination for small firms may encourage increased outwork. Despite problems associated with two determinations, a lower regulated wage for small firms may discourage the use of informal factories by reducing the relative cost advantage. It must be recognised that it is

CLOTHING SECTOR 165
exiremely unusual that S.A. clothing companies pay the same wage, regardless of size.104 Table D3 shows that wages in small plants tend to be about 20% lower than those in large plants. The fact of wage differentiation by scale does not mean that it is necessary for SACTWU to introduce this unfortunate situation for workers in small plants. However, as noted, there may be strategic industry-wide considerations.
Second, two determinations, in conjunction with two tier bargaining might be introduced in order to encourage changes in the organisation of production. In this case, wages would be determined for the clothing industry. Firms that agree to implement desired changes in the organisation of production might benefit from wage flexibility for at least the period in which substantial changes are undertaken. Hence, the basic wage would be lower, with bonuses tied to negotiated indicators of productivity improvement. This could be offered to both healthy and ailing firms to encourage the competitiveness of the industry and job stability. Clearly, it would be dangerous to offer this canot in the absence of the stick that drives industrial change and development.
Some question has been raised around the possibility of paying efficiency wages in decentralised areas. This is a questionable practice since accepting substantial wage differentials encourages firms to decentralise. It is the role of the state to offset lower productivity by subsidising wages if rural employment becomes a soclo-economic priority. The only justification for paying according to regional productivity is as a strategic tool to encourage improvements in productive efficiency. For example, differential wages could be negotiated over a specified period (with the intention of eventual equalisation) in conjunction with a business plan to raise productivity.
'°4Clothing companies rarely pay bonuses and so the gazetted wage closely reflects that paid.

166 INDUSTRIAL STRATEGY PROJECT
Table D3: International Comparisons of Manufacturing Wage Rates by Scale
Firm/Plant Scale
10—99 100—499 500+
Belgium 1978 78 85 100
Denmark 1978 93 97 100
France 1978 83 86 100
Germany 1978 90 92 100
Italy 1978 85 93 100
Fapan 1982 77 83 bOb
USA 1983 57C 74 100
S.A. mfg 19Mm 80C 83 100
clothing 1964e1 103 106 100
clothing 1976 109 97 100
Source: Storey & Johnson:200 (OECD 1985), Altman 1989:52 (CSS) Notes:
100-999 workers b 1000+ workers
1-99 workers Refers to all manufacturing, less clothing and textiles Refers to clothing and textiles only. Figures for 1964 include non-cash payments.
Data are by plant for Denmark, Germany and Italy. For Belgium, France, Japan and the USA, data is for firm size.
Productivity Bargaining
The traditional form of productivity bargaining focuses on the relationship between pay and output per worker. Where weekly wages are the significant form of remuneration, a bonus will be determined on the basis of increases in the number of units flowing through the production line or factory. This form of productivity incentive generally entails work intensification since the firm depends on work acceleration for productivity improvements.

CLOTHING SECTOR 167
However, productivity bargaining need not necessarily entail work intensification. In fact, this forum may be used as a strategic tool to encourage firms to introduce improvements that contribute to long-run competitive advantage. In this case a bonus would be tied to improvements in quality, output, reduced wastage and the introduction of new manufacturing techniques.
Where productivity bargaining is undertaken on this basis, certain practical problems arise. In particular, monitoring productivity or profitability improvements would require shop steward training in a fragmented industry like clothing.'05 It would be virtually impossible to administer a programme tied to productivity improvements from the centre, unless a range of full-time staff were hired for this purpose. The easiest programme to implement would be related to on-line improvements: this focus is accessible to workers and encourages worker involvement in changing work organisation throughout the factory. It cannot be understated that such productivity deals mainly result in work intensification when introduced in isolation: Improvements in work organisation are crucial to their success in encouraging job sustainability and growth in earnings.
Wage Negotiations and Training
Some interest has been expressed by SACTWU to alter grading structures. Clearly, changes in the current grading structure would affect relative wages between job categories and within grades. The effect of this exercise on the wage bill is unclear.
There will be significant resistance to a regrading exercise in the clothing industry. Even firms that have introduced advanced manufacturing techniques are somewhat sceptical. The most common antagonism will arise from firms believing that the regrading will result in a higher wage bill. In fact, the emphasis of the regrading should be on a more rational grading structure that encourages "human capital development".
It will be important to reduce the perceived threat of regrading to employers. Stabilising wages and injecting greater certainty into wage determination could reduce the degree to which employers try to obstruct efforts to introduce a new grading structure. The stabilisation could entail the following:
105There has been some debate over the relative merits of productivity versus profitability deals. Tying bonuses to profitability requires extensive assistance of professional accountants: It must be possible to fully understand a firms accounts and be able to uncover ways that profits may be hidden. Alternatively, a productivity deal requires production floor knowledge: the sort of knowledge already available on the shop floor, requiring minimal training to implement a programme.

168 INDUSTRIAL STRATEGY PROJECT
• the determination of long term wage agreements
• the negotiation of wage agreements that determine relative wages within an agreed total wage bill.
• the indexation of the wage bill to an agreed measure of inflation and/or changes in the minimum effective household income levels.
It will be important to organise current wage demands within a longer term framework in order to ease business concerns about the potential implications of regrading on the wage bill. At present, wage agreements tend to cover periods of approximately 12—18 months. A longer period, perhaps 5 years, could be negotiated by tying the wage bill to some measure of inflation: If a reduced wage dispersion is required, the lower grades would receive a percentage increase above inflation. The weighted average would result in an overall wage bill that was reasonably in line with a cost of living index and inflation.'06 Focusing on the wage bill ensures that cost structures will remain relatively certain over a reasonable length of time. Changes in relative wages would be determined within the agreed wage-bill.
With the introduction of greater certainty around wage determination, membership might then be mobilised around non-wage issues such as foreign processing, plant reorganisation, retrenchment and severance packages or improved pension and health schemes.
D.2.6. Member Education
Member education is the most important contributor to union strength. In a low productivity sector, the strength of wage determination crucially depends on union bargaining power. This bargaining power relies on the dominance of a single union and membership solidarity. Loyalty to union organisation will become more important as employers try to encourage current or retrenched workers to become informal entrepreneurs.
An emphasis on member education can play a number of functions including:
'°6When tying wage demands to inflation, care should be taken in choosing the inflation index. For example, the Consumer Price Index (CPI) gives inordinate weight to housing costs: as interest rates come down, the inflation rate seems to also be substantially reduced. Yet, for the income and racial groups affected by clothing wage negotiations, the most relevant indices may be either food and clothing prices and/or the minimum household effective income levels.

CLOTHING SECTOR 169
• improved two-way information flow between head and regional offices and membership.
• enabling member foresight of industrial trends
• driving any joint productivity-enhancing projects by training shop stewards in alternative productivity indicators.
• raising solidarity anwngst members in the face of potential labour cost reduction strategies
• enhancing survival skills of workers who are mainly earning below-subsistence incomes.
Monitoring the Industry
Workers, shop stewards and organisers should be the best source of information on industrial trends. Workers clearly have the best and most detailed knowledge of changes on the workfloor, current work practices and the diffusion of new technologies. However, this information remains hidden: With some training, this massive knowledge base could be developed and tapped. The first step would entail training on the significance of organisational and technical changes members observe on a daily basis. Shop stewards might be encouraged to keep a monthly roster of factory based changes, including technological or organisational change, the introduction of consultants, changes in subcontracting relationships, increases in importation, or even retrenchment and closure.
Early Warning Systems
Early Warning Closure systems are a method of identifying early signs of closure, in a context of insufficient prior notification.107 The benefit of identifying potential closures is twofold: An earlier warning can raise the union's ability to negotiate improved severance and re-training packages. More importantly, a wider time frame may allow SACTWU to negotiate for productivity improvements that would allow for the continued existence of the company. In this context, productivity improvements do not refer to schemes that depend on reducing the wage or intensifying work: Deals done on this basis mainly result in a fall in industry wages as these deals become an expectation of ailing firms. Firms that negotiate for such productivity deals are not addressing their structural problems and are not increasing their sustainability. The intention is to motivate the
107Early Warning Systems have been used by ACTWU in the USAA in a cross-section of the industries it
organises (UIC, Klingel and Martin).

170 INDUSTRIAL STRATEGY PROJECT
introduction of changes that contribute to long-run competitive advantage such as short cycle manufacturing techniques.108
To implement Early Warning Systems, members need training in the signs of potential closure or scaling down of operations. Examples of these indicators include: work slowdown, deteriorating plant maintenance, increasing subcontracting to decentralised areas or informal operations, increasing importation of final goods or a dramatic reduction in orders. In the case of multi-plant firms, factories may shut as part of a larger corporate plan. In smaller finns, factories may shut because of poor marketing or operational behaviour. The principles of negotiation around a closure clearly varies depending on the reasons for closure.
In addition to identifying early signs of closure, it is also useful to train organisers and shop stewards to report on the state of the plant after a workforce reduction or closure. In particular, there may be evidence that a large multi-plant enterprise is in trouble if the factory closes after introducing consultants and new equipment: This would indicate that the firm unsuccessfully attempted to save the plant.
Progressive Productivity Improvements
If SACTWU becomes involved in joint schemes to improve the sustainability if firms, it will be necessary to train shop stewards to drive the process. As described in section B.3.2., progressive productivity improvements that do not simply entail wage reduction or work intensification, would be based on the re-organisation of aspects of production such as cutting, assembly and material usage. It will be necessary for workers to be trained in new forms of production organisation in order to be involved in the process and to monitor the associated productivity improvements. Monitoring becomes particularly important where supplemental wage increases depend on these productivity improvements.
The Effect of Industrial Change on Unionisation
Members may not be aware of the relationship between the changes they see around them and the ultimate effect on their wages and worker organisation. For example, members may see some of their retrenched colleagues opening up informal subcontracting
'°8Examples of productivity improvements that do not depend on work or wage intensification are found in section 9.3.2.
It may be worth solidifying the current guidelines, stipulating that finns must try to "avoid retrenchments by transferring employees to other departments, by training or retraining, by limiting and/or eliminating overtime, working short-time..." (NCF l993:371:NCMA).

CLOTHING SECTOR 171
operations. There may not be an awareness that the employed worker will eventually be in competition with the informalised worker, both in terms of work offered and in relation to wage determination. Workers also need a clearer idea of the effects that casualisation can have on member solidarity and wages.
Life Skills Education
It is unlikely that wages will rise above subsistence levels in the near future. Unfortunately, there is a gap in the provision of satisfactory home economics education. In particular, families on an extremely low income would gain from improved understanding of nutrition and home budgeting. In addition, family planning services are currently offered by some factories, usually with the objective of limiting the incidence of pregnancy in the factory. A predominantly female membership needs ongoing information on birth control options and the financial costs of childrearing. Assertiveness training is required for both union related activities and for home-related problems. Other non- educational services such as child-care and rape crisis are also needed.
Offering these educational and non-educational services fulfils complementary objectives. First, it assists members who currently survive on very low incomes. Second, in the context of a large union and stop-order forms of payment, the potential for alienation of the grass-roots from leadership is high. The services described above offer a clear indication to members that the union is concerned with their day-to-day problems. Third, as members are retrenched, it is important to keep them within the gamut of union structures so that there is less inclination to disappear into the informal sector.

172 INDUSTRIAL STRATEGY PROJECT
Section D.2. considered the regulatory environment to ensure that social goals are achieved within the context of an industry plan. Historical behaviour has shown that firms will try to take advantage of the gaps in labour regulation to achieve static labour-cost flexibility. Organised labour must realise that some flexibility is required: However, it should be possible to regulate the forms of flexibility to maximise formal sustainable job opportunities. Different measures are considered with respect to foreign processing, informalisation, casualisation, severance procedures and wage determination. Finally, the role of member education was examined.
Foreign Processing
there is relatively link fOreign proessiiig at present. However, assembly In lower wage, l1ome
signatory countries is likely to rise as firms increasingly enter export •narket.. Aside from lnformaiisatksn. foreign processing Is one of the most dlmcult forms of labour-cost flexibility to
control. It is well worth considering the Implementation of regulatory controls before many firms become dependent on this activity. For example, there might be regulations controlling the percentage of value that can he added omitide of the country. In addition, it is quite Important to lImit foreign processing to mnanufmwturer. Clearly, any state assistance to firms should require adherence to these kinds of regulations.
Informalisation
Lnfornmlisatlon occurs where asemnbiy is (usually) subcontracted to unregistered firnis that are not requIred to comply with labour regulations. While not a major problem yet in Sit.. informalisatlon can devastate worker organisation and regulation within a very short period of time. It is also very difficult to lmpleiiient regulatory controls that are intended to control the behaviour of Informal firms.
Three suggestions are made with regard to Informalisatlon: First. SAUT%VU might consider allowing for a separate wage determination for small firms. S.A. clothing Is one of the only known industries where wages are homogeneous by plant scale. With wages at below subsIstence levels, it would he difficult to justify two determinations. However, in order to avoid the ravages of inforumailsation. a lower determination for smaller firms mmmv encourage subcontracting to small formal firms, and not informal ones. Second, intermediary services between contractors and subcontractors could he
developed to encourage small firm.s to come out of the woodwork. Third, imiember education may be an Important source or information concerning the extent to which Informal firmums are expanding. Members should become more aware of the problems associated with co-workers leaving 11 start up (In their own. possibly supplying the former employer. Services in communities and to retrenched workers may also keep former workers within the gnnmt of union organisation.

CLOTHING SECTOR 173
Casualisation
Casualisatlon is relatively rare in the S A clothing industry However other forms of flexibility that previously substmttial savings hi the wage bill ar falllng away. The minimal regulations on casualisatlon are now likely to encourage firms to hwreasmgly hire workers on fixed term contracts This can have a very divisive effect on union membership
There are a number of ways of addressing casuallsation First and most difficult, the Introduction of shortcyclemanufaniurheg .teflds to smooth out the .prodtirtion cycle,. thereby. In fling the need to reduce the worktorce during slow periods. Second, more stringent notification and severance procedures might limit current retrenchments Typically as firms move to casualisatlon, they fire permanent staff and then hire back on fixed term contracts Although casualisatlon is not desirable, It may be a better form of flexibility than infórmallsation or foreign processing since It can be observed and controlled Strangely, it may be in SACTWU'S interest to establish the rules around casnailsatmu by, for example, introducing maximum proportions of a firm's workforce that can be hired on flxed-terni contracts
Notification and Severance Procedures
The notification procedures essentially require only one week's notice. Severance pay Is determined by negotiation In an industry offering low wages and small provident fund pay-outs, workers are left with little for their working life Clearly more stringent procedures are required In particular, the union should be given a minimum atone-month's notice of severance Minimum assistance should be provided for re training In addition, there should be provisions allowing Independent consultants entry to a factory to determine ways to avert closure

174 INDUSTRIAL STRATEGY PROJECT
Wage Determination
The common Ideology concerning wage determination asserts that workers should be paid according to their productivity. However, it is quite clear that firms do not know the marginal productivity of their workers. Wages are more deter,niiied by industry margins and the bargaining power of worker organisation. The emphasis should not he the allocation id a fixed surplus between wages and profits. Figure 3 shows that wages are not the S.A. clothing's competitive disadvantage; Instead, the problem is low productive efficiency. Section 13.3.2. shows that short-cycle manufacturing techniques can result In a real increase In the surplus by over 7% within the first year of Implementation. Even if equally divided between wages and profits, these savings would offer workers a REAL wage increase of at least 35% at the outset.
Many firms are folding aiid some are requesting wage freezes or reductions. These concessions will not address their fundamentai problem, associated with poor productivity. It is worth entering such deals only when the wage Is used as a strategic tool to force the firm to adopt new organisatlonal practices. Otherwise, wage deals can only result In a downward pressure on Industry wages.
Overall, three major suggestions are made: First, a lower wage determination might be introduced for snialier firms. Second. two-tiered bargaining may he Introduced in a limited manner as a strategic tool to encourage firms to Introduce organisatlonal change. One determination might he set for most of the Industry. As an experiment, a slightly lower basic wage might be allowed for firms that, jointly with SACTWU, enter a process of introducing SCM and quick response relationships. The proceeds from the productivity Iniproveinents would then he shared In set proportions. l'hase experiments would require shop steward training to monitor the implementation and improvements. Finally. any major change to grading structures will probably meet with resistance in the Industry. The major concern will he related to potential wage increases. This concern would be addressed by time Introduction of longer term wage agreements that tie wages to some cost of living index. This will allow for the Introduction of more rational grading structures that benefit skill and human capital development.

CLOTHING SECTOR 175
Member Education
Member education will be crucial to the implementation of any plan that seeks to ptontote sustainable formal jobs In particular, this study suggests that members be trained to monitor the Industry and feed Information back through union structures. Members should learn about signs of potential closure in order to warn organisers It SACTWU becomes Involved In joint schemes to promote the adoption of fundamental ptoducti*lty Improvements, workers should be trained in measuring these improvements so that they fairly gam from the process Workers should also become more aware of the effect of Industrial change on unlonisatlon, particularly In relation to intormalisatlon Finally, since wages are below subsistence levels, life skills education, such as nutrition and home budgeting, will assist workers to cope Ftom a union standpoint, this education could contribute to member loyalty as workers see that the union Is interested In their daily needs.
Chapter E: Conclusion
If the S.A. state is to target industries for support, some development criteria must be ascertained. These factors may include the potential for foreign exchange earnings, productivity development, employment generation or the efficient meeting of local consumer needs. Clothing is an industry that does not much contribute to manufacturing productivity levels. In the S.A. context, it would not be a significant foreign exchange earner with the availability of strategic metals and minerals. However, clothing production is one of the few industries that could provide jobs quickly and cheaply. The cost of job creation is less than RlO,000. Expansion could occur quickly, particularly if direct foreign investment were encouraged in the immediate term. In addition, development of the clothing industry is not expensive since the most important productivity improvements occur through organisational change. Hence, the industry would not be a net foreign exchange loser.
It is not enough to promote competitiveness in an industry that is earmarked as an employment generator. Clothing industry organisation is extremely fluid: There are a wide range of choices available to finns concerning the division of labour, geographically and
internally. The common advice to move into higher value-added products and improve productivity has merit: However, achieving these ends does not guarantee the creation of local, formal, sustainable jobs. In fact, it is quite possible to marry these improvements with the introduction of work and wage intensification strategies. Many successful clothing industries hardly even produce in formal factories: Assembly is subcontracted to lower-wage plants in their informal sector or abroad.
Since employment generation is the clothing industry's main contribution to the economy, it is important for development policy to focus its attention on the best way to maximize this end. There is little point diverting resources to this industry if business strategies for achieving competitive "success" entail foreign processing. Certain constraints must be addressed to achieve the goal of maximising local, formal employment. These constraints include financing of development programmes, a lack of credibility in state organisations to consistently adhere to policy formulations and management conservatism to new organisational practices. Achieving competitiveness is the most significant constraint. In fact, the industry will not survive unless it becomes more competitive in local and international markets.
The S.A. clothing industry demonstrates very low productivity levels. This problem has been deconstructed in cost accounting terms to locate the fundamental issues that must be addressed. The bad news is that the industry has high cost structures relative to its throughput times. Recent visitors from the European Community similarly observed that despite very low wages, producing in S.A. yields little cost saving as a result of low productivity.

CLOTHING SECTOR 177
The good news is that the productivity problem could be easily and quickly rectified. In particular, the problem is not structural in that the labour costs are quite competitive with other middle income countries. The productivity gap must be addressed, both to recapture local markets and expand export markets. These gains can be made at little cost, with the introduction of new organisational practices and human resource development. This study shows the dramatic gains associated with short-cycle manufacturing techniques, the development of quick response relationships and the introduction of training and grading structures that support new organisational practices.
While these practices have been implemented by some finns already, there tends to be a resistance to fundamental change in this industry. Development policy must address the regulatory environment and incentive structures. First, any incentives must be tied to desired behaviour in terms of productivity improvement or human resource development. For example, policies that directly reward export activity will not necessarily contribute to achieving broader social goals; However, export incentives might be a carrot offered to firms, in conjunction with the stick requiring the introduction of desired organisational practices.
It will be necessary to reconsider the regulatory environment to ensure that jobs created are local, formal, and offer reasonable wages and work conditions. This study has made suggestions for organising the regulatory environment so that firms seeking flexibility in labour use channel their energies in desired directions. As many of the historical options such as racial displacement and decentralisation are exhausted, it will be particularly important to ensure that firms do not redirect their energies toward foreign processing or informalisation. SACTWU may want to consider the forms of labour flexibility it is willing to offer in order to maintain some influence over the regulatory environment.
Finally, a number of issues that are beyond the scope of this study, must be considered. A dilemma exists with respect to the implementation of an ambitious training scheme when wages are below minimum subsistence levels. There is some merit to the case that wages cannot rise until productivity is improved. However, it will be difficult to fundamentally address the productivity problem in the absence of a strong training drive. One must wonder what can be demanded in terms of mental or physical application from workers earning wages that are below subsistence. Some care will be required in determining ways of clearly tying wage rises to enhanced skill levels and/or productivity improvements associated with
organisational change.
A study of a low productivity industry like clothing adds weight to the need for some kind of social wage, as currently being discussed at a macro-economic level. Substantial research has shown that, even with equal skill levels, work experience and job description, workers will earn less in low productivity sectors. Table G2 shows that clothing workers globally earn between 25% to 50% less than their respective manufacturing averages. In S.A., this means that a qualified machinist earns less than the minimum household subsistence income. In S.A., it is unlikely that this gap will be filled by some adaptation of a Swedish Solidarity

178 INDUSTRIAL STRATEGY PROJECT
Wage. In the absence of a social wage, workers in low productivity sectors are consistently poor in terms of retirement packages, health benefits and educational possibilities. Furthermore, women's wages tend to be far lower than male wages. The reasons for this are too numerous to list here. However, since many women are the sole income earners in their household, important issues arise surrounding the perpetuation of poverty, poor levels of health care and low educational attainment within certain sections of the population. It will be important to consider the development of a social wage to begin to bridge the important gap in earnings between male and female headed households and between workers in low and high productivity sectors.

Chapter F: Appendices

1. Measures of Relative Production Costs
There are a number of ways to compare productivity and costs internationally. The calculations may include comparisons of the wage bill or hourly compensation, unit labour cost, cost per standard minute (see box) and speed of production throughput. The best measure of relative productivity is standard minute content or GSD (general sewing data). Very few firms use this measure since it is somewhat complicated. Generally, clothing companies know only the number of units they produce per worker per day in various product ranges. This is the information gathered for work-study.
Calculating Cost per Standard Minute
'l'he Cost per standard minute LaJL'S into iICCOLJflL the following data:
wages and social costs management and service personnel thscn Lecism
holidays and annual leave
length of the working week fixed costs efficiency
The assumptions in the international calculations include (Kurt Salmon Associatest 1991):
I-U) direct pmduction operatives 'Medium level technology Production is solely for parent company
The data does NOT include the following considerations:
• Quality • lashion Level • The cost of material inputs • Cost differentials within the country • Subsidies • Reduced or rebated ta'es • Export incentives
Figure 3 presents the closest possible international productivity comparison. The calculations account for both cost per standard minute and speed offactory throughput. Throughput rates

CLOTHING SECTOR 181
are included since the cost per standard minute measure assumes equal processing methodologies in different countries. Even if the cost per standard minute is equal, it may take longer to produce the same garment in one country. Different throughput times may depend on technology or automation, factory organisation and/or skill levels.

2. Calculation of GElS Assistance
GElS is essentially a cash grant: The amount offered depends on a formula that primarily depends on the value exported and the extent of local content. Small adjustments are made for changes in the exchange rate. The percentage of cash assistance is based on the following formula:
Z = U(M + E)P where:
Z = tax free value of export assistance U = FOB value of exports M = a given % of assistance relative to the export value (clothing=25%) B = exchange rate and inflation adjustment factor as of Oct/92 = -5.5% P = local content of exports = ((U - Imports)/ U} x 100
if local content> 75%, then P=1 if 35% <local content <75%, the P=actual if local content < 35%, then P = 0
Assume an average fabric content of 50% of the cost of clothing sales, then:
If 40% of fabric is imported...
lithe industry average of 40% oF textile inputs are imported. then imports will account thr 20% of the Cost of salestie. 40% x 50%). Hence, Ofl average the local content of clothing is approximately 80%. Therefore. P= 1.
GElS assistance to clothing as a % ol export value = U(.25 - .055)1 = 19.5 % of export value

CLOTHING SECTOR 183
11100% of fabric Is imported...
If exporters use the 47003 rebate programme for 100% of fabric, then 1' = 1 -
(04)(0 5)(1 07) x 100 0465
14ence GELS (19 5%)(Q 465) 91% of export value
Therefore, GElS assistance can vary between a minimum of 9% to a maximum of 19.5%, depending on the Efactor. Exporters receive the maximum rate until they import more than 45% of their material inputs.

3. International Training in Clothing109
Developing high skill levels is extremely important to improving industrial productivity. Skills training requires attention from the level of the machinist to the manager. For example, with training the machinist could become multi-skilled, whereby it would be possible to operate a number of machines, clean the garments, and be involved in quality control. The
supervisor could become more responsible for cost controls, work study and line balancing and quality control. The industry also requires technicians that can effectively "engineer" patterns to reduce waste, simplify operations and plan the sequence of production. Training in the "West" German clothing industry is generally taken as the model for other countries. The United Kingdom also has training structures, although they are not sufficiently used. South Africa has very weak, unintegrated training programmes.
Training in West Germany
Vocational training is extremely important in Germany. Most youths are either streamed into
university education or vocational apprenticeship programmes.
In the clothing industry, 3-year apprenticeship programmes are offered. This is in-factory training, where the apprentice is paid 1/3 of the adult rate. (Normally, apprentices are between the ages of 15—18 years old). The standards are set nationally, with exams after each year. In the apprenticeship, the trainee gains a general educational and technical knowledge. The apprentice learns to operate a number of machines, has some capability in quality control and can put together a full garment. This range of skills means that a change of jobs requires less retraining later.
Each year, 5000 machinists finish the 2nd year of apprenticeship, while 1600 graduate from the 3rd year. Most machinists in German factories have completed at least 2 years of this apprenticeship. The majority of supervisors have completed the 3rd year, as well as a work- study course. After this, some supervisors would then go on to the next qualification, which is work planning and production management.
109 The information on the international experience is mainly derived from Steedman and Wagner (1989). The CITB statistics are derived from NCF reports.

CLOTHING SECTOR 185
Training in the United Kingdom
In the U.K., a clothing machinist would qualify for the British City & Guild Clothing Craft Exam. It is a 3-year programme, usually undertaken by youths, where trainees are also paid a fraction of the full wage.
It is quite unusual to find a machinist in Britain that has completed any of this qualification. In addition, a very small number of supervisors have any of this training. In fact, each year only 400 operators pass the 2nd year, while a mere 120 complete the 3rd year. Instead, most large firms prefer to train machinists on a separate line for 6 weeks. Smaller firms train by moving trainees between machines.
The industry has also introduced a "Clothing Skills Award", whereby a trainee is tested by the supervisor for competence in a specific range of basic sewing operations. This
programme lasts for 2 years. The German apprentices learn in 6 months the same amount as the Clothing Skills trainees in 2 years.
Comparing the U.K. and Germany
The productivity improvements possible with greater training are obvious when comparing the U.K. and German clothing industries. Although German clothing has more styling, output per worker is equal. The German industry is twice as productive and offers much higher wages. To reach full speed after a style change in Germany requires 2 days, compared to the UK where full efficiency is reached after more than 1 week. In Germany, very little work is unpicked. In the UK, the large amounts of garment unpicking means that they need 2/3 more quality controllers and twice the number of supervisors as in Germany.
German supervisors have greater responsibility than in the U.K., while the U.K. supervisors have similar operations as given in South Africa: ensuring continuous work-flow, correcting sewing faults and teaching new operations. Yet, in Germany, a higher level of training makes it possible to be involved in cost controls, production organisation and work-study.
Training in South Africa
There is very little formal training available in the South African clothing industry. Certificates are mainly offered at the technician and management level. Courses offered to machinists by the CITB are short (6 weeks for basic and 4 weeks for specialised training).

186 INDUSTRIAL STRATEGY PROJECT
Table Fl: Clothing Machinist Training in Germany, the UK and S.A.
Employment Numbers trained/yr
Length of Course
Germany 220,000 6,600 2-3 yrs
U.K. 230,000 520 2-3 yrs
S.A. 113,000 289 1-10 weeks
Source: Steedman and Wagner (1989), NCF Annual Report.
Notes: The figures for South Africa cover the 1991 calendar year. Employment figures cover Industrial Council areas only. The numbers trained in 1991 dropped from 1208 in 1990, although most were on short courses and were categorized as "work seekers" or "informal sector".
In 1993, only 136 machinists finished the basic training, while 16 completed the specialised course. While in previous years the CITB courses were mainly geared to workseekers and the informal sector, there seems to have been a shift toward industry machinists in 1993, accounting for 2/3 of the 311 machinist-trainees. Yet, this still means that very few employed machinists get training. In general, companies train their own machinists. At present, a small number of firms have accredited in-factory training schools.
The CITB has a 3 year course for mechanics. In 1993, only 59 full-time trainees were in the 1st and 2nd year, while 22 completed the 3rd year. In addition, the CITh has offered a substantial service in short courses, with 220 trainees in its 18 hour modules.
There has been a significant shift in the type of training undertaken at the CITB: 1. The number of short courses has increased (average 4 hours to 9 days) while the number
of longer courses decreased (average 4—6 weeks). Shorter courses that can be undertaken without excessive disruption to work may be more appropriate to clothing industry needs. However, since it is reduced the number of trainees from 1992, the CITB may be offering fewer training hours to the industry.
2. There has been a shift toward management training, from 43% of all trainees in 1989 to 77% in 1991. At the same time, machinist training has fallen from 44% of all trainees in 1989 to only 8% in 1991. This drop does not represent a movement to multi-skilling since the allocation to work study has fallen and the training of quality examiners is negligible (10 trainees on a 1 week course in 1991).
3. The bulk of the training is devoted to 6M Simulation. 6M Simulation trainees as a
proportion of total management trainees has increased from 36% in 1989 to 53% in 1991. In 1993, the one-day "Business Sense" course accounted for 1/3 of the technical

CLOTHING SECTOR 187
school trainees. The 10 hour "Free Enterprise System" course accounted for 80% of the operator school trainees.
4. Machinist training overwhelmingly focuses on workseekers and the informal sector. Between 1989—91, workseekers accounted for 69—78% of machinist trainees.
The CITB is in the process of developing clothing management courses with the technikons. In particular, they have established the Young Managers Development Programme in the Cape. This is a 45 day course for new management entrants, spread over a period of 3 years, primarily conducted on-the-job. Since it is a new course, no graduates have yet emerged from the YMDP. The CITB and Technikons are also looking into upgrading diploma courses at the technikons.
The CITB has stated that they are developing an 8 week integrated basic machinist course that would train in different machines, quality, machine maintenance and business principles. While this is a step in the right direction, it is unclear how they will effectively teach this in 8 weeks. It may be more desirable to implement this type of programme as a part-time course that could be undertaken over a longer period of time. Of course, this assumes that employers are interested in releasing workers for short periods. Workers may have an incentive to enrol themselves if advanced levels of education resulted in greater status and higher grades of pay.
Some firms have their own in-house training schools. The CITB can accredit these schools. It is unclear whether machinists can emerge with a formal clothing machinist qualifications. There were about 11 of these schools in early 1991, primarily found in the Cape. By the end of 1992, there were more than 20 in Cape Town, 4 in Johannesburg and about 15 in Durban (Interview: Nic Jooste(CITB)). Otherwise training is ad hoc, although new entrants are generally trained for short initial periods.
Clearly, training needs to be improved in the clothing industry. There is a concern amongst some firms that training workers more than is absolutely necessary is a wasted expenditure since the investment is lost when the worker chooses to find alternative employment. Clearly this is short sighted. This perception necessitates skills development on an industry basis, to reduce the concern for "free riders". To enhance industry promoted skills development, the training levy could be raised. At present, the levy is R1.13 to R1.21 per week per worker, or about 0.005% of the value of a basic wage. To encourage industry-wide training, an increase in the levy might be linked to levels of firms-based training. For example, a higher levy might be imposed on firms that do not provide a specified amount of training.
Aside from developing the CITB programme, a number of conditions must be overcome to cultivate skill levels in S.A. First, the government provides training allowances only for manufacturers in locations that are designated as "industrial development areas". Second, the attitude of managers to the training potential of workers must change. The vast majority of companies would not think of promoting past supervisor. Finally, the current job grading

188 INDUSTRtAL STRATEGY PROJECT
discourages skills improvement. The machinist that can perform one function is paid much the same as the machinist that is multi-skilled.
Table F2: CITB Training Offered
1989 1990 1991 1992 1993
TOTAL CITB TRAINEES 3507 3398 3484 4892 3879
TOTAL MANAGEMENT TRAINEES 1521 1747 2685 2426 1029
TOTAL MACHINIST TRAINEES 1534 1208 289 363 311
Significant Courses Offered
6M (10 hours) 541 315 1426 1300 1386
Management Seminars (4 hours) 102 401 362 695 645
Supervisor (9 day) 181 298 285 207 126
Supervisor modules 10 437
Industrial Relations (4 hours) 172 284 52 67
Work Study (20 hrs & 4 weeks) 133 90 80 66 67
Mechanics (1—3 years) 123 147 163 44 111
Mechanics Modules (4 hours) 184 171 193 383 220
Production Management (4 hours) 95 135 152 383 56
Industry Machinists (4—8 wks) 206 244 84 92 152
Machinists: Technikon (1 week) 131 132 0 73 95
Machinists: Workseekers & Informal (3-4 wks)
1197 832 205 198 104
Source: NCF Annual Report (1991, 1992, 1993) and Diaries (1991,1992).
Notes: Figures for 1992 cover the period of Jan-October. In 1993, the machinist course for workseekers was expanded to 8 weeks and the mechanics modules were expanded to 18 hours each.
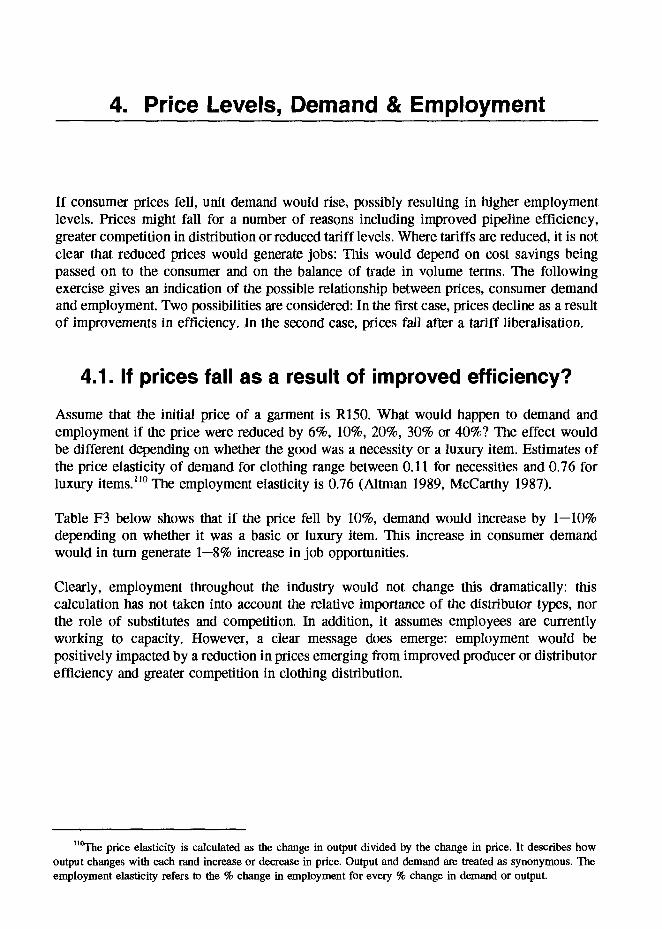
4. Price Levels, Demand & Employment
If consumer prices fell, unit demand would rise, possibly resulting in higher employment levels. Prices might fall for a number of reasons including improved pipeline efficiency, greater competition in distribution or reduced tariff levels. Where tariffs are reduced, it is not clear that reduced prices would generate jobs: This would depend on cost savings being passed on to the consumer and on the balance of trade in volume terms. The following exercise gives an indication of the possible relationship between prices, consumer demand and employment. Two possibilities are considered: In the first case, prices decline as a result of improvements in efficiency. In the second case, prices fall after a tariff liberalisation.
4.1. If prices tall as a result of improved efficiency? Assume that the initial price of a garment is R150. What would happen to demand and employment if the price were reduced by 6%, 10%, 20%, 30% or 40%? The effect would be different depending on whether the good was a necessity or a luxury item. Estimates of the price elasticity of demand for clothing range between 0.11 for necessities and 0.76 for luxury
, The employment elasticity is 0.76 (Altman 1989, McCarthy 1987).
Table F3 below shows that if the price fell by 10%, demand would increase by 1—10%
depending on whether it was a basic or luxury item. This increase in consumer demand would in turn generate 1—8% increase in job opportunities.
Clearly, employment throughout the industry would not change this dramatically: this calculation has not taken into account the relative importance of the distributor types, nor the role of substitutes and competition. In addition, it assumes employees are currently working to capacity. However, a clear message does emerge: employment would be positively impacted by a reduction in prices emerging from improved producer or distributor efficiency and greater competition in clothing distribution.
"°The price elasticity is calculated as the change in output divided by the change in price. It describes how output changes with each rand increase or decrease in price. Output and demand are treated as synonymous. The employment elasticity refers to the % change in employment for every % change in demand or output.

190 INDUSTRIAL STRATEGY PROJECT
Table F3: Effect of Price Changes on Employment3
% Change in Price 6% 10% 20% 30% 40%
New Price R141 R135 R120 R105 R90
What would happen to consumer demand?'
Necessity 1% 1% 2% 3% 4%
Luxury 6% 10% 20% 30% 40%
What would happen to Necessity employment?2
Luxury
1% 1% 2% 2% 3%
5% 8% 15% 23% 30%
Notes: 1. This table assumes that the price elasticity of demand ranges between 0.11 (eg. underwear) and 1.0 (Kravis 1982, Cline 1987). 2. The elasticity of employment to changes in demand is 0.76 (Altman 1989, McCarthy 1987). 3. These estimates offer a crude indication of the effect of price on employment. For example, these figures assume that all prices rise or fall. The figures given above may be more relevant to specific product areas.
4.2. If prices fall as a result of liberalisation?
The welfare effects of a price reduction resulting from tariff reductions are unclear. Prices to the consumer may fall if the retail sector is competitive. If retail prices do fall, then there are clear benefits to allowing the entry of cheap wage goods. However, a consideration of the net welfare effect must also take into account potential employment losses. Two problems may arise when focusing on consumer interests in tariff determination: First, an across-the-board tariff reduction may allow unfair wage competition, particularly with China: this would exert a downward pressure on local wages in competition with child and prison labour. Second, if price reductions are not passed on fully to the consumer, then the net welfare effect would be negative as employment losses would translate into enhanced retailer surpluses.

CLOTHING SECTOR 191
Figures 17a and 17b Tariffs, prices and demand
Figure 17 offers an indication of the relationship between tariffs, prices and the potential employment effects. The initial positions in Figures 17A and 17B show demand for imports and local output when there is tariff protection. Line Dd in Figure 17A shows the initial relationship between local prices and the demand for local goods: It is downward sloping since a fall in price per unit increases the amount of S.A. goods that consumers want to buy. The supply curve is upward sloping since a rise in price encourages finns to produce more for the market. Point h shows that consumers will buy local goods in quantity Qd' at a price
Pd. Figure 17B shows that, when a tariff (Ps) is added to "world prices" (P), then S.A. buyers will only import a quantity of The market prices, d and are not necessarily the same. For example, could be lower than d and still not completely penetrate local markets since South African and imported goods are not perfect substitutes.
If the tariff were dropped, "world" prices (P) would be paid for imports. The demand for imported goods would then increase to M.. At the same time, the demand for S.A. goods would drop to Q. Figure 17A shows that the demand curve would shift to the left, reflecting the diminished desire to buy locally. Consumer would only be willing to pay Pd! and since productivity has not increased, fewer finns would supply at this reduced price. Theoretically, the shaded area in Figure 17A represents the "consumer surplus" which is essentially the savings to consumers. However, orthodox economics neglects two points: First, this surplus may actually accrue to retailers if the price saving is not passed on. The consumer's surplus is completely dependent on the existence of a highly competitive distribution sector. Newbury (1990) shows that reductions in clothing import prices have had
QdlQd Q 17A Dnisd
b
C
D
Mw÷t Mw
17 Inor.d M
O bc utdmn,d M-aflytnçcdsd nnduiraid f tnçcfl Dd- dpmuid for doni..Iy pioducid cfolting
Pd- domodcpdo.
Pw-rpo Pw+Pwoild 1c' 1II

192 INDUSTRIAL STRATEGY PROJECT
little effect on consumer prices.111 Second, this fall in local demand reflects a concomitant drop in employment. This clearly entails a welfare loss. Alternatively, the shaded area in Figure 17B simply represents this welfare transfer to foreign suppliers. The price that firms overseas are paid is the same, although they are now supplying more to the S.A. market.
Figures 17c and 17d Tariffs, prices and demand
Figures 17C and 17D show how the demand for local goods could expand if substantial improvements were made to domestic productivity. In Figure 17C, the supply curve shifts to the right to S', representing a fail in domestic output prices. That is, local producers are able to offer the same goods at lower prices.112 This drop in price, increases the attractiveness of buying locally. Hence, the demand curve subsequently shifts to the right (D'dl), with the new demand for domestic output increasing to Q'dl. At the same time, Figure 17D shows that the demand for imported clothing fails: the demand curve for imports shifts to the left (D'm) and the quantity imported fails to M'.
"This study analysed this relationship for the 13K and West Germany (Newbery 199O:2931).
"2The same effect would result from a currency devaluation.
Pd
'd1 d1
ii Q'di
17C: Docnes1k Q
D
M'wMw M
17D Imported

5. The Effect of Static & Dynamic Strategies: A Graphic Representation
Figure 18 presents the effect of static and dynamic approaches to productivity improvement. The arrows in these four graphs represent the relationship between cost and output. The arrows slope upwards since working capital or variable costs always rise with output: it is necessary to purchase more inputs to produce exira units of clothing.
Assume that arrow 1 in Figure 1 8a represents the initial position of a clothing manufacturer: this firm produces in a metropolitan area using fairly traditional manufacturing techniques. Oa shows the start-up costs of this firm, before it produces anything. These are the costs associated with management and fixed assets such as building and machinery.
Arrow 2 shows the expected result of static approaches to productivity enhancement, focusing on labour cost flexibility. This may entail decentralisation, casualisation, informalisation or work intensification. In this case, the expected result is a parallel downward shift in the curve: from arrow 1 to arrow 2. The difference between oa and ob represents the expected fall in costs associated with a lower wage bill. In the case of S.A. decentralisation, subsidies would also be expected to reduce overall start-up costs. The lines are parallel since productivity has not been improved: the relations between stages of production are unchanged. Instead, the expected cost reduction mainly contributes to enhancing profitability.
Arrow 3 in Figure 1 8b represents a dynamic approach to productivity improvement. In this case, productivity is improved by focusing on operational change, where the relations in the stages of production are altered. For example, the firm may introduce short cycle manufacturing techniques as described in the following section. The start-up costs associated with arrow 1 and arrow 3 may be similar. However, arrow 3 represents a higher rate of productivity: costs rise less rapidly as output expands. In fact, one can expect that over a short period of time, the productivity improvement associated with operational change (arrow 3) offers lower costs per unit of output than the expected savings associated with labour flexibility (arrow 2). Essentially, operational change offers long-run competitive advantage, while wage intensification can only offer a short-run competitive advantage. Although these diagrams describe a point in time, the output axis may be seen as analogous to time: that is, within a short space of time (eg. 0-qi), the costs associated with arrow 3 are lower than for arrow 2. In fact, there are South African examples to show that operational change can offer substantial productivity gains within 6—9 months.

194 INDUSTRIAL STRATEGY PROJECT
Figures 18a and 18b Static and dynamic approaches to productivity improvement
The more common experience of wage intensification is represented in Figures 1 8c and 1 8d.
Contrary to expectations, decentralisation often results in productivity reductions that offset gains in labour costs. Arrow 2' in Figure 18c shows how decentralisation may allow for lower start-up costs. However, the steeper curve, representing higher costs per unit of output, quickly result in a worsened productivity and profitability for the firm. Lower productivity may result from lower skills, higher transactions and transport costs as well as higher reject rates. In this case, operational change quickly outstrips any possible gains that are associated with wage intensification. In fact, it is not uncommon for decentralising firms to unexpectedly raise costs above the initial position (arrow 1).
Finally, many firms experience the situation shown in Figure 1 8d: As in Figure 1 8c, arrow 2" has a lower rate of productivity than either arrow 1 or 3. However, Figure 1 8d also represents higher start-up costs. These initial costs may be associated with higher management costs, since more supervision and re-location pay may be necessary. In addition there may be conîmuriication problems and inefficient infrastructure. Hence, arrow 2" shows that a strategy focusing on labour flexibility can unexpectedly worsen a finn's profit and productivity position. In all cases, arrow 3 offers the best long-run dynamic competitive advantage since it allows for a sustainable reduction in unit costs. Cost reductions associated with wage intensification tend to be of a short term nature: firms following this strategy often find that over a short period of time, workers organise or market wages rise. This induces firms to move again, requiring that the firm incur costs associated with start-up or the forging of new supplier relations again. This constant movement becomes less necessary when operational change has been introduced, with ongoing productivity improvements implemented on-site, within relationships of a stronger standing.
3
a
b
0 Output
Figure 18a
qi Output
Figure 18b

CLOTHING SECTOR 195
Figures 18c and 18d Static and dynamic approaches to productivity improvement
One study shows that the expected relocation time is at least 2 years and may require more than 5 years (van der ffiet 1989). The time required to achieve efficiency comparable to the more centrally-located plant depends on product characteristics such as skill intensity, average size of production run, quality standards required, outwork requirements (eg. pleating, embroidery, washing, etc) and turnaround times. This study compares the production costs of a Cape Town factory to a decentralised factory in 9 regions. If a decentralised factory operates at 60% of CT efficiency, a factory could save 13% on total costs. However, a decentralised factory operating at 46% of CT efficiency will actually incur higher costs: on average the cost of production will be 7% higher than in Cape Town.113
It is not unusual for a decentralised factory to operate at half the parent factory's rate of efficiency. The expected cost reduction associated with decentralisation therefore depends on rebates and very high wage differentials: In S.A., both are falling away. The subsidies
"3This study was based on 1989 costs. By 1992, labour costs in both decentralised and industrial council areas rose substantially. On the other hand, interest rates fell. The figures quoted above do not include rebates.
The costs or saving depend more on efficiency than on wage rates, This is clearly shown in Tables Gl9 and G20. For example, a Taiwanese finn would be foolish to relocate pmduction to Poland or Turkey, despite a potential halving of wages. The move would not reduce total production costs because labour productivity is substantially lower in these countries, resulting in a situation where the Taiwanese firm would not save on total production costs. Instead, this move would mainly incur substantial costs associated with the development of new relationships, uncertainty, higher transaction costs and possibly start-up costs.
2' 2"
I
b
0
C
a
0
Figure 18c
Othput
Figure 18d
196 INDUSTRIAL STRATEGY PROJECT
offered to decentralising factories have been substantially reduced and tightened. Moreover, the re-incorporation of the bantustans into South Africa is imminent. SACTWU has successfully incorporated many of the wage determination areas into industrial council areas. Finally, negotiations are under way to organised a national industrial council. Hence, the regulatory environment governing wages and work conditions is becoming increasingly integrated.
Historical avenues for achieving labour cost flexibility in South Africa are being closed. Firms are increasingly looking at alternative options including foreign processing, casualisation and decentralisation to new, relatively hidden locations. To approach the goal of maximising local formal employment opportunities, development policy should focus on ways of discouraging a continued emphasis on labour cost; the regulatory environment and structure of incentives should be designed to shift the emphasis to dynamic operational change.
6. Aspects of Liberalisation
Liberalisation normally occurs in stages and in conjunction with complementary macro- economic adjustment policies. The most common components of liberalisation include the movement to greater transparency in the structure of protection, a reduction of quantitative restrictions and an exchange rate devaluation. The tariff schedule is then reformulated to compensate for the drop in quantitative restrictions. A drop in tariffs across the board is NOT always a component of the liberalisation process. A comprehensive World Bank- financed study of liberalisation programmes found tariff reductions in only 6 of 19 cases studied (Michaely et a! 1991: 56, 286). Often, the liberalisation process is implemented in an uneven manner, accounting for the particular policy goals for each sector within an overall macro-plan (Wade 1990:128, Balassa 1982:57).h14
The introduction of supportive micro and macro economic adjustment policies are required. Examples of policies at the macro-level include the devaluation of the exchange rate and the adjustment of monetary and fiscal policy. Policies at the micro-level often include the introduction of a duty-drawback scheme to reduce discrimination against exports. Policy formulation at the micro-level can be problemmatic since the determination of exchange rate, monetary and fiscal policies are exogenous. In particular, the expectation that exports will expand as barriers are reduced may not be fulfilled in the absence of an amenable exchange rate policy.
Even the strongest advocates of trade liberalisation recognise that an adjustment or transitional period is required. It is recognised that if there is high unemployment, liberalisation may not be an acceptable exercise. Michaely et al. admit that liberalisation
nonnaily results in short term unemployment. In the "long term" the net employment effect may be positive if there are other growth industries which can absorb displaced labour (Michaely et al. (1991) vol 7 p71). Drastic reductions in protection should only be introduced in conjunction with complementary adjustment policies.
While the SAP effectively reduced protection for clothing to about 17% ad valorem, the elimination of this programme will result in a reversion to high tariffs. Section C(2) of the Uruguay Round GATT Protocol requires a phased reduction in tariffs on an annual basis, over a five year period. Since most clothing codes are bound in terms of GATF, reductions in rates of protection will be required. There are a number of methods for reducing tariffs,
"4For example, the Taiwanese protective structure barely changed between 1956—76, with tariffs ranging between 0—165%. The liberalisation process primarily entailed the reduction in items under import control, a currency devaluation and expprt subsidisation. Controls on imports of clothing and textiles were substantial until 1980: only European and American imports were permitted, eliminating the more competitive sources. Trade neutrality at the was not achieved. Balassa (1982) has shown that the difference between the effective subsidy to
export or produce for the domestic market varied depending on the trade orientation of the particular subsector.

198 INDUSTRIAL STRATEGY PROJECT
as explained in Altman (1993:188) and Michaely, et al. (vol 7: 289). Whichever method is chosen, it is important to account for product heterogeneity, variations in trade sensitivity and the nature of the competitive environment internationally and domestically. In particular, a process of liberalisation through reduced protection must ensure that effective safeguards against unfair trade and dumping are in place.

Chapter G: Reference Tables
Table Gi: S.A. Clothing Employment 200 Table G2: Comparative International Clothing Statistics 201 Table G3: Exchange Rates 202 Table G4: Clothing Trade Balance (1980-9 1) 203 Table G5: Export and Import Growth 204 Table G6: International Clothing Export Prices 205 Table G7: Comparative Clothing Production Costs: Productivity and
Hourly Compensation 206 Table G8: Comparative Clothing Labour Costs: Basic and Social Charges 208 Table G9: Minimum Wages of a Qualified Clothing Machinist (current rands/week) 209 Table GlO: Minimum Wages of a Qualified Clothing Machinist (current rands/hour) 210 Table Gil: Minimum Wages of a Qualified Clothing Machinist (constant rands) . . . 211 Table G12: Minimum Subsistence Income Level 212 Table G13: Minimum Effective Income Level 212
200 INDUSTRIAL STRATEGY PROJECT
Table Gi: S.A. Clothing Employment
Year Employment
j[ ('000 workers) Index (1985=100)
1933 14.3 12
1939 18.9 16
1945 30.3 26
1951 45.3 39
1954 49.1 42
1960 56.7 49
1965 76.5 66
1970 100.7 87
1976 103.1 89
1978 94.4 81
1980 108.8 94
1982 130.9 113
1984 126.0 109
1986 102.9 89
1988 113.2 98
1990 114.7 99
1991 111.8 96
1992 100.8 87
1993 93.2 80
Source:
Figures for 1933—70 are from the Industrial Censuses: 1933-54 from Barker: 284; 1960—70 from NPI (1971:40). Figures for 1976—93 from Industrial Council Provident Funds (excl. OFS & E. Cape). 1993 covers Jan/Feb only.

CLOTHING SECTOR 201
Table G2: Comparative International Clothing Statistics
GNP/pc (1986) (Current USA$)
Employment ('OOOs) (1991)
Change in Employment (1982-91)
Avg.Wage per hour (USA$) (1991)
Apparel wages! Manuf wages (1983)
France 13.1 166 -30% 11.80 78
W.Germany 14.7 161 -23% 16.90 65
Italy 10.5 142 -30% 8.50 75
UK 9.7 189 -10% 6.60 59
Belgium 8.2 28 -18% 7.50 75
Portugal 2.9 41 -39% 3.60 66
AustralIa 9.4 66 - 6% 1 6.50
USA 17.5 1024 -12% 6.75 54
Taiwan 3.6 65 2 3.00
Turkey <2.0 38 111% 2.60 48
Indonesia 190 0.20 50
Malaysia 80 220% 57
South Africa
2.1 123 - 8% 1.90 45
Source: NCF (1993:182), ILO (1987:21).
Notes: 1. Change between 1986-90. 2. Change between 1986-91. 3. 1982 (CSS). This ratio includes wages and salaries for production and non-production employees. If "Whites" are excluded, apparel wages are 60% of the average manufacturing rate.

202 INDUSTRIAL STRATEGY PROJECT
Table G3: Exchange Rates (Ri = )
1982 1986 1990 1991 1992
USA Dollar 0.92 0.44 0.39 0.35 0.35
UK Pound 0.53 0.30 0.22 0.20 0.20
D.Mark 2.24 0.95 0.62 0.60 0.50
Source: &A. Reserve Bank Quarterly Bulletins.
Notes: These are middle rates in foreign currency units per Rand.

CLOTHING SECTOR 203
Table G4: S.A. Trade Balance: Clothing (1980-91) - -- I
YEAR CONSTANT 1985 J RANDS
CURRENT RANDS
J_______ PPI REAL TRADE BALANC E (R'OOO) EXPORTS
(R'OOO)
IMPORTS (R'OOO)
EXPORTS (R'OOO)
IMPORTS (R'OOO)
1980 61,878 119,403 36,508 70,448 59 -57,525
1981 45,926 221,266 29,852 143,823 65 -175,340
1982 44,232 182,768 32,732 135,248 74 -138,536
1983 45,819 131,728 37,113 106,700 81 -85,909
1984 85,492 172,411 75,233 151,722 88 -86,919
1985 112,263 115,953 112,263 115,953 100 -3,690
1986 95,913 88,483 112,218 103,525 117 7,430
1987 68,666 115,788 91,326 153,998 133 -47,122
1988 67,603 150,367 102,757 228,558 152 -82,764
1989 76,024 132,407 133,803 233,036 176 -56,383
1990 93,977 115,340 191,713 235,293 204 -21,363
1991 145,001 155,312 321,902 344,793 222 -10,311
1992est 181,666 163,097 437,816 393,064 241 18,569
Source: TexFed Statistics (1989:2&3, 199 1:10&11). Figures for 1991 are Customs and Excise. Figures for 1992 are estimates based on unaudited Customs & Excise data for Jan-July 1992 (ie. Jan-July figures x 1.55 (pmportionate increase as in 1991(36%)). NCF (1 1/92)estimate exports to rise to R600mn but later (02/93) estimate at R450-500 to April93).

204 INDUSTRIAL STRATEGY PROJECT
Table G5 Growth in S.A. Clothing Exports and Imports
(Index: 1985 100)
Real Apparel Imports (1985= 100)
Real Apparel Exports (1985= 100)
1980 103 55
1981 191 41
1982 158 39
1983 114 41
1984 149 76
1985 100 100
1986 76 85
1987 100 61
1988 130 60
1989 114 68
1990 99 84
1991 134 129
1992 141 160
Notes: Based on constant (1985) rands,
Figures for 1992 are estimates. X = exports; M = imports

CLOTHING SECTOR 205
Table 66: International Clothing Export Prices (Current USA dollars)
SOUTH AFRICA OTHER COUNTRIES
Hong Kong
Turkey Thai- land
Italy
1989 1990 1991 1990 1988 1988 1990
KMTS
WIG shirts 7.06 10.05 6.80 8.63
esp cotton 8.00 15.49 9.25
Jerseys 10.82 19.79 12.27 9.48 4.94 10.51
non-wool: 13.72 21.28 12.08 8.38 4.90
Tracksuits 4.23 11.74 12.79 12.25
WOVENS
M/B suits 64.59 61.88 39.35 80.35 20.52 2.71 118.68
M/B trousers 4.81 6.85 9.14 8.05 10.96 3.42 19.17
WIG ensembles
12.02 8.66 9.41 32.02 16.77 3.95 87.05
WIG dresses 10.31 11.17 14.34 19.30 4.33 3.65 31.28
M/B shirts 2.45 2.71 4.85 3.85 15.50
WIG shirts 5.92 4.65 5.36 9.80 5.11 3.44 15.73
TOTAL 3.47 5.74 6.59
Source: S.A. data from NCF Diary (1992:45), International Data from U.N. records.
Notes: 1. All values in current USA dollars. Exchange rates used for S.A. data are USA$l = R2.74
(1989); R2.65 (1990); P2.88 (1991). 2. MIB refers to "Men's & Boys"; WIG refers to "Women's & Girls". 3. WIG ensembles for H.K. and Turkey include suits. This has only a marginal effect on unit price. 4. M/B "trousers" includes trousers, overalls, shorts,etc

206 INDUSTRIAL STRATEGY PROJECT
Table G7: Comparative Clothing Production Costs: Productivity and Hourly Compensation'
Cost/Standard Minute Hourly Compensation
USA$/std.min (1990)
INDEX USA=100
Current USA$ (1990)
INDEX USA=100
Italy .350 166 6.00 92
WGermany .357 169 8.11 125
UK .220 104 5.29 81
Spain .214 101 4.08 63
USA .211 100 6.50 100
Greece .179 85 2.35 36
HongKong .150 71 2.53 39
Portugal .138 65 2.16 33
Taiwan .143 68 2.00 31
Poland2 .136 64 1.01 16
Turkey .126 60 0.90 14
India .110 52 0.23 4
USSR2 .091 43 1.91 29
South Africa4 1.16 18
clothing .187 89
knitwear .179 85

CLOTHING SECTOR 207
Sources/Notes on Table G7:
1. Kurt Salmon (1991) Factory Cost Comparison. 2. ECHO (1991): 213 (Table 12.6), 192 (Table 11.26), 212 (Table 12.4). Hourly compensation in the USSR is for 1989. The wage is calculated on the basis of the "official exchange rate". (The "market" rate for the rouble would result in an hourly wage of $0.1 1). The Polish wage rate is for 1988 and is estimated as 75% of the average industrial wage rate. 3. Cline 1987:103. This is estimated from the 1985 rate ($5.59), adjusted upward by the USA inflation rate. 4. South African std.minute ratings are based on interviews done in Cape Town in Jan 1991. The exchange rate used is R1=USA$0.39. Values given by manufacturers were deflated by 7% to get a mid-rate. While the S.A. ratings are not directly comparable with the international figures, the figures do offer a marker for S.A.'s factory productivity. Note that standard minute ratings do not account for textile prices. 5. Hourly compensation in S.A. reflects an approximation of the average Industrial Council minimum
wage (Aug/89-90)at the 1990 exchange rate of R1=$0.39. They do not reflect wages in decentralised areas which generally range between R20-R80/week (or R0.50-R2.00/hour for a 4Ohr week: This accounts for approx. 30% of S.A. clothing employment. Wages rose to $1.26 in Aug 1990/1.

208 INDUSTRIAL STRATEGY PROJECT
Table G8: Comparative Clothing Labour Costs: Basic and Social Charges'
Hourly Compensation Hourly Compensation with Social Charges
Current USA$ (1990)
INDEX USA=100
Social Costs (Prop. of wage)
Total Labour Costs
INDEX USA=100
Italy 6.00 92 .90 11.40 135
WGermany 8.11 125 .70 13.79 163
UK 5.29 81 .35 7.14 85
Spain 4.08 63 .45 5.92 70
USA 6.502 100 .30 8.45 100
Greece 2.35 36 .55 3.64 43
HongKong 2.53 39 .25 3.16 37
Portugal 2.16 33 .30 2.81 33
Taiwan 2.00 31 .35 2.70 32
Turkey 0.90 14 .50 1.35 16
India 0.23 4 .50 0.35 4
South Africa4
1.16 18 .09 1.27 15
Sources: 1. Kurt Salmon (1991) Factory Cost Comparison. 2. NCF Diary (1992:213). 3. NCF Diary (1991:204).
Notes: See note #5 in Table G7. Social contributions are very low and declining relative to wages (see NCF Diary (l992)p285). The reduction relative to wages can be partly attributed to inadequate inclexation built into their determination.
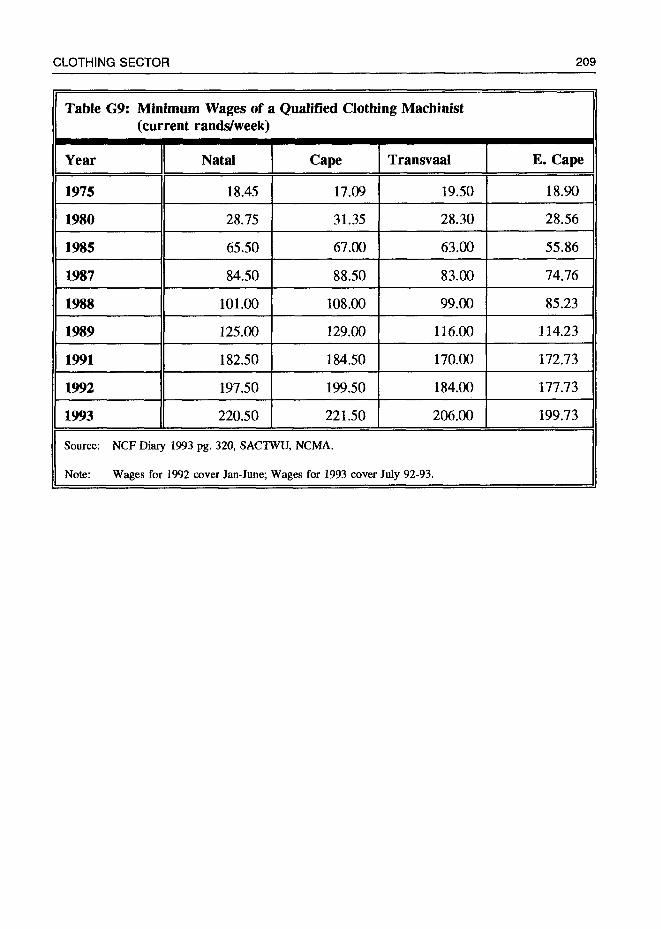
CLOTHING SECTOR 209
Table G9: Minimum Wages of a Qualified Clothing Machinist (current rands/week)
Year Natal Cape J_Transvaal E. Cape
1975 18.45 17.09 19.50 18.90
1980 28.75 31.35 28.30 28.56
1985 65.50 67.00 63.00 55.86
1987 84.50 88.50 83.00 74.76
1988 101.00 108.00 99.00 85.23
1989 125.00 129.00 116.00 114.23
1991 182.50 184.50 170.00 172.73
1992 197.50 199.50 184.00 177.73
1993 220.50 221.50 206.00 199.73
Source: NCF Diary 1993 pg. 320, SACTWU, NCMA.
Note: Wages for 1992 cover Jan-June; Wages for 1993 cover July 92-93.

210 INDUSTRIAL STRATEGY PROJECT
Table GlO: Minimum Wages of a Qualified Clothing Machinist (current rands/h our)
Year Natal Cape Transvaal E. Cape
1975 0.43 0.40 0.49 0.45
1980 0.68 0.74 0.71 0.68
1985 1.54 1.58 1.58 1.33
1987 1.99 2.08 2.08 1.78
1988 2.38 2.54 2.48 2.03
1989 2.94 3.04 2.90 2.72
1991 4.29 4.34 4.25 3.51
1992 4.65 4.69 4.60 4.23
1993 5.19 5.21 5.15 4.76
Notes: 1. Pay is negotiated on the basis of the work week. However, the hours worked per week varies by region: the work week is 42.5 hours in the Cape and Natal, 42 hours in the E. Cape and 40 hours in the Transvaal. SACTWU's former Regional Secretary for the Transvaal suggests that often the extra 2.5 hours is worked on overtime pay. This raises the minimum hourly rate for Transvaal workers to R4.73 in 1992 and R5.30 in 1993. 2. Minimum rates very closely reflect actual wages paid.
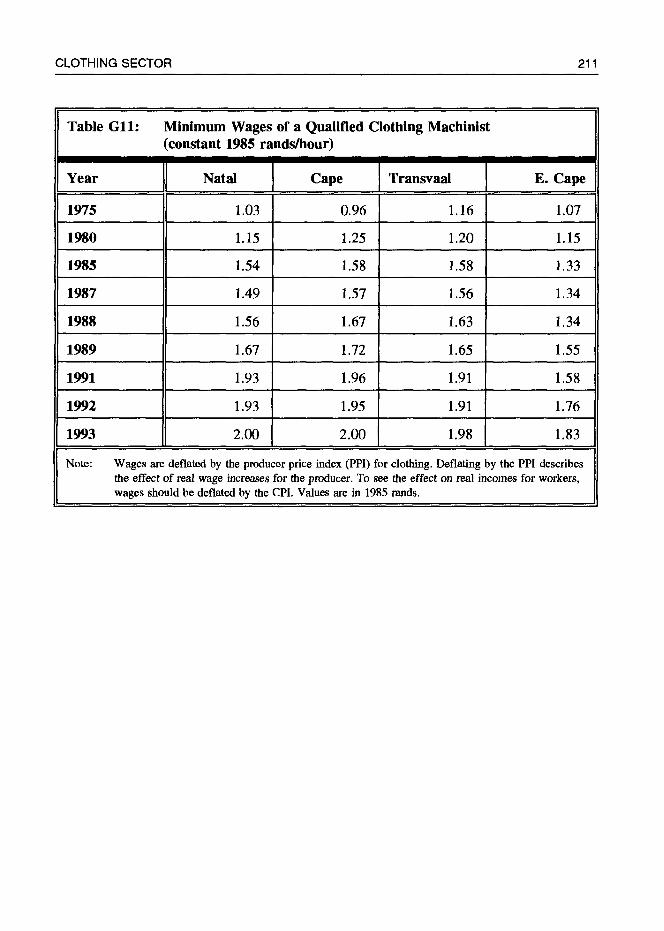
CLOTHING SECTOR 211
Table Gil: Minimum Wages of a Qualified Clothing Machinist (constant 1985 rands/hour)
Year Natal Cape Transvaal E. Cape
1975 1.03 0.96 1.16 1.07
1980 1.15 1.25 1.20 1.15
1985 1.54 1.58 1.58 1.33
1987 1.49 1.57 1.56 1.34
1988 1.56 1.67 1.63 1.34
1989 1.67 1.72 1.65 1.55
1991 1.93 1.96 1.91 1.58
1992 1.93 1.95 1.91 1.76
1993 2.00 2.00 1.98 1.83
Note: Wages are deflated by the producer price index (PPI) for clothing. Deflating by the PPI describes the effect of real wage increases for the producer. To see the effect on real incomes for workers, wages should be deflated by the CPI. Values are in 1985 rands.

212 INDUSTRIAL STRATEGY PROJECT
Table G12: Minimum Subsistence Income Level (current rands/month)
Year Natal Cape Transvaal E. Cape
1989 536.19 551.18 647.73 542.00
1992 909.18 787.82 825.55 852.30
Table G13: Minimum Effective Income Level (current randslmonth)
Year Natal Cape Transvaal E. Cape
1989 ]
1992 jj
804.29
1363.77 826.77] 971.60
1181.73 J
1238.33
813.00
1278.45
Source: NCF Diary 1993 p.326: Bureau of Market Research (UNISA) and Institute of Planning Research (UPE).
Notes: 1. Transvaal value covers black family of 6. 2. Natal, Cape and E. Cape refer to "coloured" family of 5. 3. Natal (1992) refers to indian family of 5. 4. The minimum effective income level is 50% above the minimum subsistence level. The minimum subsistence level is not sufficient to sustain a viable family unit.

Chapter H: Bibliography
HI. Books, Articles and Monographs
AAMA. 1987. "Getting Started in Quick Response", prepared by the Technical Advisory Committee, American Apparel Manufacturer's Association. Arlington, Virginia
Altman, M. 1993. "Tinker, Tailor, Tailor's Son: Developing the Clothing Industry", Report submitted to the Industry Strategy Project, Economic Trends, DPRU, Economics Dept, University of Cape Town.
1993a. "Unpaid or Undervalued Labour? Some Labour Market Considerations", Paper presented to the ANC Workshop on Unpaid Labour & Economic Policy, April 15-16, University of the Witwatersrand.
1992a. "Comments on the Revised Duty Structure, Nov 1992", policy document, submitted to the BIT, October.
1992b. "Submission to the BTT Regarding the Proposed Nov 1992 Tariff Schedule", policy document, submitted to the BIT, September.
1992c. "Position Paper on the General Agreement on Tariffs and Trade", policy document, submitted to COSATU and the Dept of Economic Planning, ANC, September.
1991. "Subcontracting in the S.A. Clothing Industry: Implications for the Division of Labour and Conditions of Work", paper presented to the ASSA conference in July. Cape Town.
1989. "Limits to the Growth of Small Firms in South Africa: Concentration in the Clothing and Textile Industries", unpublished M.Phil thesis, Dept of Politics and Economics, University of Cambridge.
Atkinson, J. 1987. "Flexibility or Fragmentation? The United Kingdom Labour Market in the Eighties", Labour and Society 12(1).
Avery, PG., Leask, GM. 1987. "Implementation Strategies for Just in Time Manufacturing Techniques: Case Studies of Three Western Cape Companies", MBA thesis, GSB, University of Cape Town.

214 INDUSTRIAL STRATEGY PROJECT
Balassa, B(ed). 1982. Development Strategies in Semi-Industrialised Economies, IBRD- World Bank. Baltimore: Johns Hopkins University Press.
Barker, HAF. 1962. The Economics of the Wholesale Clothing Industry of South Africa, 1907—1957. Johannesburg: Pallas Publications.
Bell, T. 1984. "The State, the Market and the Interregional Distribution of Industry in S.A.", Carnegie Conference Paper No. 243, SALDRU, University of Cape Town.
Bell, Trevor. 1992. "Should South Africa Further Liberalize its Foreign Trade?", Economic Trends Working Paper No.16, DPRU, University of Cape Town.
Belli, P., Finger, M., Ballivan, A. 1993. "South Mrica: Review of Trade Policy Issues", mimeo, Informal Discussion Papers on Aspects of the Economy of South Africa, Paper no.4. World Bank.
Belussi, F. 1992. "Benetton Italy: Beyond Fordism and Flexible Specialisation. The Evolution of the Network Firm Model" in Mitter, S. (ed.), Computer-aided Manufacturing and Women's Employment: The Clothing Industry in Four EC Countries. London: Springer-Verlag.
Boyer, R. 1987. "Labour Flexibilities: Many Forms, Uncertain Effects", Labour and Society, 12(1).
Burns, P., Dewhurst, J. 1986. (eds) Small Business in Europe. Macmillan Education Ltd.
Cassim, R. 1991. "Recent Developments in the South African Clothing Industry With a Focus on Exports", unpublished M.Phil thesis, Dept of Economic History, University of Cape Town.
Chew, BW. 1988. "No-Nonsense Guide to Measuring Productivity", Harvard Business Review, JanfFeb, p110-118.
Chiesi, M. 1992. "On Using Women as Resources: Italian Unions' Strategies Towards Information Technology and New Organisation of Work" in Mitter, Swasti(ed). 1992.
Cline, WR. 1987. The Future of World Trade in Textiles and Apparel. Washington: Institute for International Economics.
De la Tone, Jose. 1984. Clothing Industry Adjustment in Developed Countries. London: Trade Policy Research Centre.

CLOTHING SECTOR 215
Disher, M. 1987. "Clothing Assembly: Automation versus Flexibility", Textile Outlook International, May.
ECHO. 1991. "Textiles and Clothing in Eastern Europe: Market at the Crossroads", Economist Intelligence Unit, Special Report No. 2149. London.
EIU. 1990. "Clothing Manufacture: New Methods of Working", Textile Outlook International, May.
Finnerty, A. 1989. "Profiles of Hugo Boss, Escada and Mondi", Textile Outlook International, September.
Frazier, R. 1986. "How Industry Can Deliver the Quick Response", Apparel International, vol 9(2) February.
Gebbert, C. 1992. "Taylorism or Human Cenired Technology? Evaluating Alternative Paths of Technology in Germany", in Mitter, Swasti(ed). 1992.
Gibbs, D. 1988. "Reslructuring in the Manchester Clothing Industry: Technical Change and Interrelationships between Manufacturers and Retailers", Environment and Planning A, vol.20 pg 1219-33.
Gibbs, D. 1987. "Technology and the Clothing Industry", Area, vol. 19(4) pgs.313-20.
GLC. 1985. "Clothing", London Industrial Strategy. London: Heffers Printers.
Greenaway, David. 1983. International Trade Policy: From Tariffs to the New Protectionism. London: Macmillan Press Ltd.
Gunston, R., Harding, P. 1986. "Quick Response: USA and UK Experiences", Textile Outlook International, March p43.
Hamilton, CII and Kim, C. 1990. "Republic of Korea: Rapid Growth in Spite of Protectionism Abroad" in Hamilton, CB.(ed.).
Hamilton, CB. ed. 1990. Textiles Trade and the Developing Countries: Eliminating the Multi-Fibre Arrangement in the 1990s. Washington: World Bank.
Harris, R., Heppell, J. 1991. "Apparel Sourcing: A Survey of Retail Buyers' Attitudes in Canada, the USA and Western Europe", Textile Outlook international, November.
Hatty, P. 1992. "Proposals of the Clothing and Textiles Industry", mimeo, January.
216 INDUSTRIAL STRATEGY PROJECT
Hepple, Alex. 1969. South Africa: Workers Under Apartheid. IDAF.
Hirsch, A. 1987. "The Industrialisation of Dimbaza: Population Relocation and Industrial Decentralisation in a Bantustan", in Tomlinson and Addleson(eds).
Hoffman, K. 1989. "Technological and Organisational Change in the Global Textile- Clothing Industry: Implications for Industrial Policy in Developing Countries", in UNIDO, New Technologies and Global Industrialisation: Prospects for Developing Countries.
Hoffman, K. and Rush, H. 1988. Microelectronics and Clothing: The Impact of Technological Change on a Global Industry. New York: Praeger.
Hoffman, K. 1985. "Clothing Chips and Competitive Advantage: The Impact of Microelectronics on Trade and Production in the Garment Industry", World Development, vol 13(3) p371-92.
Howell, DR., Wolff, EN. 1991. "Skills, Bargaining Power and Rising Interindustry Wage Inequality Since 1970", Review of Radical Political Economics, Vol.23(l&2) p.30-7.
Human, L., Greenacre, MJ. 1987. "Labour Market Discrimination in the Manufacturing Sector: The Impact on Race, Gender, Education and Age on Income", South African Journal of Economics, 55(2).
ILO. 1987. "The Impact on Employment and Income of Structural Change in the Clothing Industry", Third Tripartite Technical Meeting for the Clothing Industry, Report III. Geneva.
ITCB. 1987. Textile Trade from 1982 to 1990 and Prospects for the Nineties, Geneva, December.
Kaplan, D. 1985. "New Technology in the Garment Industry", S.A. Labour Bulletin vol 10(7).
Klingel, S., Martin, A. (eds). 1988. Fighting Chance: New Strategies to Save Jobs and Reduce Costs. Cornell University Press.
Koch, R. 1991. "Small Clothing Manufacturers in Mitchell's Plain", SALDRU Working Paper #80, University of Cape Town.
Kravis, lB., Heston, A., Summers, R. 1982. World Product and Income: International Comparisons of Real Gross Product. Baltimore: John Hopkins University Press.
CLOTHING SECTOR 217
Kurt Salmon Associates - 1993. "An Approach to a Balanced Sourcing Strategy", paper presented to the Conference on Global Resiructuring and Local Strategies: The Case of the Clothing Industry, University of Bradford, (September).
Kurt Salmon Associates. 1991. "Factory Cost Comparison Study", Report. Manchester.
Kurt Salmon Associates. 1987. "Quick Response Implementation", Report. Manchester.
Leask, G. June 1990. "Beware If You Are Running Your Job Shop Like a Job Shop!", Proceedings of the 12th SAPICS International Conference. Durban.
Levy, Brian. 1991. "How can South African Manufacturing Efficiently Create Employment? An Analysis of the Impact of Trade and Industrial Policy", Informal Discussion Papers on Aspects of the Economy of South Africa, Paper No.1. World Bank.
Lewis, J. 1984. Industrialisation and Trade Union Organisation in South Africa, 1924—55, African Studies Series. Cambridge University Press.
McCarthy, C. 1988. "Structural Development of South African Manufacturing Industry: A Policy Perspective", South African Journal of Economics, 56(1).
Meulders, D., Willdn, L. 1987. "Labour Market Flexibility: Critical Introduction to the Analysis of a Concept", Labour and Society 12(1).
Meth, C. 1991. "Income Redistribution, Productivity and Trade Union Action in South Africa", Economic Trends Working Paper No. 12, DPRU, University of Cape Town.
Mitter, Swasti(ed). 1992. Computer-aided Manufacturing and Women's Employment: The Clothing Industry in Four EC Countries. London: Springer-Verlag.
Mitter, Swasti. 1986. "Industrial Restructuring and Manufacturing Homework: Immigrant Women in the UK Clothing Industry", Capital and Class No.27.
Mody, A., Wheeler, D. 1987. "Towards a Vanishing Middle: Competition in the World Garment Industry", World Development vol.15(10/il).
National Clothing Federation of S.A. (NCF). 1992. Executive Handbook/Diary, Bedfordview. Johannesburg.
National Clothing Federation of S.A. (NCF): Bi-monthly newsletters and Bulletins.
National Productivity Institute. 1992. "R.S.A. Clothing Manufacturing Data Bank Industry Report. (1991/92). ", Mimeo. Pretoria.

218 INDUSTRIAL STRATEGY PROJECT
National Productivity Institute. 1990. "R.S.A. Clothing Manufacturing Data Bank Industry Report. (1989/90)", Mimeo. Pretoria.
National Productivity Institute. 1971. Productivity of the Women's and Girls' Clothing Industry in South Africa, Report No. NPIJ2I1 971. Pretoria.
NEDO. 1991. Team Working: A Guide to Modular Manufacturing in the Garment Industries. London.
Nel, PA. 1986. "An Assessment of the Development and Welfare of Employees in the Republic of South Africa", Bureau of Market Research, Report No. 133, UNISA. Pretoria.
Newbery, M. September 1990. "Liberalising the MFA: Implications for the European Textile and Clothing Industry", Textile Outlook International.
Ngoasheng, M. 1990. "Technological and Organisational Innovations and the South African Garments Industry", unpublished M.Phil. Brighton: University of Sussex.
Nicol, M. 1984. "The Clothing Workers of Cape Town 1900—1939", Phd Thesis, Economic History, University of Cape Town.
Papageorgiou, D., Michaely, M. and Choksi, AM.(eds). 1991. Liberalising Foreign Trade (vol 7), Basil I3lackwell. Cambridge, Massachusetts.
Peck, JA. May 1990. "Circuits of Capital and Industrial Restructuring: Adjustment in the Australian Clothing Industry", Australian Geographer 2 1(1).
Peck, JA. 1992. "Invisible Threads': Homeworking, Labour Market Relations and Industrial Restructuring in the Australian Clothing Trade", Society and Space, 10, p. 671-689.
Pent, GF. 1988. "Product Differentiation and Process Innovation in the Italian Clothing Industry", World Employment Programme Research, Working Paper No. 19, ILO.
Porter, M. 1990. The Competitive Advantage of Nations. London: Macmillan Press Ltd.
Race Relations Reviews
Ricoveri, G., Cilona, 0., Focker, F. 1991. "Labour and Social Conditions in Italian Industrial Districts", Labour and Society, 16(1).

CLOTHING SECTOR 219
Rogerson, CM., Kobben, SM. 1982. "The Locational Impact of the Environmental Planning Act on the Clothing and Textiles Industry in South Africa", S.A.
Geographer, 10(1).
Rubery, J., Tarling, R., Wilkinson, F. 1987. "Flexibility, Marketing and the Organisation of Production", Labour and Society, 12(1).
Rush, H and Soete, L. 1984. "Clothing", in Standing,G.(ed),Technological Trends and Employment: Basic Consumer Goods, SPRU. Gower Publishing Co.
Salib, M. March 1991. "World Textiles and the Multifibre Arrangement", mimeo, Textile Institute Conference.
Scott, B. 1987. "Outwork and Restructuring in the Australian Clothing Industry: A Geographical Perspective", Unpublished BA Hons. thesis, School of Earth Sciences. Australia: MacQuarie University.
Silberston, ZA. 1989. The Future of the Multi-Fibre Arrangement: Implications for the UK Economy. London: HMSO.
Skinner, W. July/August 1986. "The Productive Paradox", Harvard Business Review.
Standing, G. 1989. "Global Feminization through Flexible Labor", World Development, vol 17(7), p1077-95.
Steedman, H and Wagner, K. February 1989. "Productivity, Machinery and Skills: Clothing Manufacture in Britain and Germany", National Institute Economic Review. London: NIESR.
TCF Unions Award Restructuring Kit, mimeo. Australia.
Tomlinson, R. and Addleson, A. (eds). 1987. Regional Restructuring Under Apartheid: Urban and Regional Policies in Contemporary S.A. Johannesburg: Ravan Press.
Totterclill, Peter. 1992. "The Role of Local Intervention: Choices and Agencies for Change", in Mitter, Swasti(ed). 1992.
"Traffic in Outward Processing". 1991. Joint submission by Filta (CISL), Filtea (CGIL), Uilta (UIL) to EC. Rome.
Trela,, I. and Whalley, J. 1990. "Unraveling the Threads of the MFA", in Hamilton (ed).

220 INDUSTRIAL STRATEGY PROJECT
Tussie, Diana. 1987. The Less Developed Countries and the World Trading System: A
Challenge to GAIT. London: Frances Pinter.
Tyler, D. September 1989. "Managing for Production Flexibility in the Clothing Industry", Textile Outlook International. p63.
UIC Centre for Urban Economic Development, Community Economic Development Strategies: A Manual for Local Action. Chicago: The University of Illinois.
Van der Riet, D. July 1990. "Quick Response in Action in South Africa", Proceedings of the 12th International SAPICS Conference. Durban.
Van der Riet, D. 1989. "A Study of the Deceniralisation Benefits and Relocation Potential for the Clothing Manufacturers in South Africa", mimeo. Cape Town: Derek van der Riet & Associates.
Wachtel, HM., Betsey, C. 1980. "Employment at Low Wages", in JE.King(ed) Readings in Labour Economics. Oxford University Press.
Wade, R. 1990. Governing the Market: Economic Theory and the Role of Government in East Asian Industrialisation. New Jersey: Princeton University Press.
Weberloff, A. 1987. Textiles in Africa.
Weiss, John. October 1992. "Trade Policy Reform and Performance in Manufacturing: Mexico 1975-88", Journal of Development Studies, vol 29(1), pl-23.
Whitaker, M. et al. 1989. "Technical Change in the British Clothing Industry: Survey Report 1988", Centre for Business Research, Brighton Polytech, unpublished.
Yalnizyan, A. 1991. "National and International Links: The Case of Garment Workers", mimeo, article for ILGWU, Ontario region. Canada.
Zarenda, H. 1977. ,"The Policy of State Intervention in the Establishment and
Development of Manufacturing Industry in South Africa", Unpublished MA thesis, Economics Dept, University of the Witwatersrand.
Zeitlin, J. 1992. "Reconfiguration of the Market and the Use of Computerised Technology", in Mitter, Swasti(ed). 1992.
Zeitlin, J., Totterdill, P. 1989. "Markets, Technology and Local Intervention: A Case
Study of Clothing" in Hirst and Zeitlin(eds) Reversing Industrial Decline: Industrial Structure and Policy in Britain and Her Competitors. Oxford University Press.

CLOTHING SECTOR 221
H.2. Official Publications:
Censuses of Manufacturing: Statistics according to Groups and Subgroups (various years)
Clothing and Knitwear Industrial Council Provident Fund lists of employers (Transvaal, Natal)
Courier (The). 1990. "Lome IV Convention" (ACP-EC, Brussels, No 120)
Customs & Excise data (various years)
Dept of Trade and Industry. July 1992. "Explanatory Document Concerning the Revision of the Interim Measures for the Textile and Clothing Industries Introduced 1 May 1992". Pretoria.
EC . September 1990. Southern Africa and the European Community, Commission of the European Communities. Brussels.
GATI'. 1991. "Report of the Textiles Surveillance Body to the Textiles Committee (Addendum); Status of Restrictions Maintained by Participating Countries", mimeo. Geneva.
GATT. 1991a. "Draft Final Act Embodying the Results of the Uruguay Round of Multilateral Trade Negotiations". Geneva.
GATI'. 1991b. "Demand, Production and Trade in Textiles and Clothing: Statistical Report by the Secretariat", Textiles Committee, COM.TEX/W/239, mimeo. Geneva.
GATI'. November 1992. "Demand, Production and Trade in Textiles and Clothing: Statistical Report by the Secretariat", Textiles Committee. Geneva.
GATT. 1993. International Trade 91-92: Statistics. Geneva.
National Development Corporations (unpublished company listings)
RP 64/1977: Report on the Commission of Inquiry into the Regulation of Monopolistic Conditions Act. 1955.
Statistics Canada. September 1989. Survey of Manufacturing Technologies-1989: Statistical Tables, Science, Technology and Capital Stock Division.

222 INDUSTRIAL STRATEGY PROJECT
Steenkamp Inquiry into the Protection of the Clothing and Textile Industries. 1983.
World Bank. 1992. "Trade Policy Reforms Under Adjustment Programmes", Operations Evaluation Dept, IBRD. Washington.
World Bank. 1989. Garments: Global Subsector Study, Industry Series Paper No.19, Industry and Energy Department Working Paper, World Bank.

CLOTHING SECTOR 223
Other Industrial Strategy Project Publications
An Industrial Strategy for the Pulp and Paper Sector
An Industrial Strategy for the Motor Vehicle Assembly and Component Sector
An Industrial Strategy for the Textile Sector
An Industrial Strategy for the Building Material Supplies Sector
An Industrial Strategy for the Household Electrical Durables Sector
An Industrial Strategy for the Commodity Plastics Sector
An Industrial Strategy for the Mineral Beneficiation and Mineral Based Fabrication
Sectors
An Industrial Strategy for the Electrical Distribution Equipment and the Professional
Electronics Sectors
An Industrial Strategy for the Food Processing and Beverages Sector
An Industrial Strategy for the Footwear Sector
An Industrial Strategy for the Engineering Sector
An Industrial Strategy for the Microenterprise Sector
A Trade Policy for Industrial Growth
A Policy for Regional Industrial Development

There is widespread agreement that if post-apartheid South Africa is to succeed economically, there will have to be a sustained improvement in industrial performance. Thus far, there have been no major policy oriented studies of South Africa's principal industrial sectors. This series of reports, published under the umbrella of the "Contemporary Policy Issues" series, seeks to fill this gap.
This book examines the potential for developing the South African clothing industry. A number of policy issues are considered, including those related to international trade, labour regulation, firm re-organisation, productivity enhancement, training and grading and industry support services. The analysis and policy conclusions are formulated to link industry development policy to expanding sustainable, formal job opportunities.
This important and comprehensive study will be of interest to policy makers, business decision-makers, academics and students of industrial relations and industrial policy.
Miriam Altman is a lecturer at the University of the Witwatersrand, Johannesburg.
ISBN 0—7992—1576—7
UC T 9 78O799215762 _______
Copyright © 2022 FDOKUMEN