Climate, season, and social status modulate the functional response of an efficient stalking...
11
Journal of Animal Ecology 2009, 78, 741–751 doi: 10.1111/j.1365-2656.2009.01547.x © 2009 The Authors. Journal compilation © 2009 British Ecological Society Blackwell Publishing Ltd Climate, season, and social status modulate the functional response of an efficient stalking predator: the Eurasian lynx Erlend B. Nilsen 1 *†, John D. C. Linnell 2 , John Odden 3 and Reidar Andersen 2 ‡ 1 Faculty of Forestry and Wildlife Management, Hedmark University College, Evenstad, NO-2480 Koppang, Norway; 2 Norwegian Institute for Nature Research, NO-7485 Trondheim, Norway; 3 Norwegian Institute for Nature Research, NO-0349 Oslo, Norway Summary 1. Predation plays a major role in shaping the structure and dynamics of ecological communities, and the functional response of a predator is of crucial importance to the dynamics of any predator– prey system by linking the trophic levels. For large mammals, there is a dearth of field studies documenting functional responses, and observations at low prey density are particularly scarce. Furthermore, there is a lack of understanding about how variables such as season, social status and climate modulate the functional response curves. 2. We analysed kill rate data collected over a 10-year period based on radio-marked lynx (Lynx lynx) mainly preying on roe deer (Capreolus capreolus) along a steep prey density gradient in south- eastern Norway. 3. The asymptotic kill rate was reached at a very low prey density for both solitary individuals and family groups (i.e. females with their dependent kittens), indicative of an efficient predator. This highlights the importance of understanding the interplay between predator and prey at low prey densities. 4. A purely prey-dependent functional response was a poor descriptor of the data, as the curve was strongly modulated by season and differences between lynx of different social status. In addition, there was a clear effect of abiotic climatic factors (indexed by the North Atlantic Oscillation) on observed kill rates in the more snow-rich portion of our study area. 5. Our analysis suggests that simple functional response curves might be poor descriptors of pred- ator consumption rates in complex natural system, and that auxiliary factors are likely to induce complexity into any predator–prey systems that would not be captured by simple deterministic approaches. Key-words: Capreolus capreolus, consumption rates, kill rate, Lynx lynx, NAO, predator–prey Journal of Animal Ecology(2007) >doi: 10.1111/j.1365-2656.2007.0@@@@.x Introduction Describing the functional response of a consumer is one of the cornerstones in community ecology research and largely determines the effect of a predator population on the prey population (Abrams & Ginzburg 2000). Although functional responses have a long history in the ecological literature (Holling 1959), a central discussion during the last couple of decades has concerned how the consumption rate is best modelled (see e.g. discussion in Abrams & Ginzburg 2000). Importantly, different forms give rise to widely differing predictions about the scaling of biomass across food webs (Ginzburg & Ackakaya 1992; Vucetich, Peterson & Schaefer 2002) as well as the persistence of predator–prey systems with an efficient predator (Arditi & Berrymann 1991). However, the outcome from purely deterministic approaches might have limited predictive value if per capita prey consumption is strongly modulated by auxiliary biotic and stochastic abiotic factors (e.g. Post et al. 1999). While the relative importance of deterministic and stochastic factors has been a central tenet in population ecology for at least five decades (see Coulson, Rohani & Pascual 2004 for a recent summary), the theoretical *Correspondence author. e-mail: [email protected] †Present address: Norwegian Institute for Nature Research, NO-7485 Trondheim, Norway. ‡ Present address: Section of Natural History, Museum of Natural History and Archaeology, Norwegian University of Technology and Science, NO-7491 Trondheim, Norway.
-
Upload
independent -
Category
Documents
-
view
0 -
download
0
Transcript of Climate, season, and social status modulate the functional response of an efficient stalking...

Journal of Animal Ecology
2009,
78
, 741–751 doi: 10.1111/j.1365-2656.2009.01547.x
© 2009 The Authors. Journal compilation © 2009 British Ecological Society
Blackwell Publishing Ltd
Climate, season, and social status modulate the
functional response of an efficient stalking predator:
the Eurasian lynx
Erlend B. Nilsen
1
*†, John D. C. Linnell
2
, John Odden
3
and Reidar Andersen
2
‡
1
Faculty of Forestry and Wildlife Management, Hedmark University College, Evenstad, NO-2480 Koppang, Norway;
2
Norwegian Institute for Nature Research, NO-7485 Trondheim, Norway;
3
Norwegian Institute for Nature Research,
NO-0349 Oslo, Norway
Summary
1.
Predation plays a major role in shaping the structure and dynamics of ecological communities,and the functional response of a predator is of crucial importance to the dynamics of any predator–prey system by linking the trophic levels. For large mammals, there is a dearth of field studiesdocumenting functional responses, and observations at low prey density are particularly scarce.Furthermore, there is a lack of understanding about how variables such as season, social status andclimate modulate the functional response curves.
2.
We analysed kill rate data collected over a 10-year period based on radio-marked lynx (
Lynxlynx
) mainly preying on roe deer (
Capreolus capreolus
) along a steep prey density gradient in south-eastern Norway.
3.
The asymptotic kill rate was reached at a very low prey density for both solitary individuals andfamily groups (i.e. females with their dependent kittens), indicative of an efficient predator. Thishighlights the importance of understanding the interplay between predator and prey at low preydensities.
4.
A purely prey-dependent functional response was a poor descriptor of the data, as the curve wasstrongly modulated by season and differences between lynx of different social status. In addition,there was a clear effect of abiotic climatic factors (indexed by the North Atlantic Oscillation) onobserved kill rates in the more snow-rich portion of our study area.
5.
Our analysis suggests that simple functional response curves might be poor descriptors of pred-ator consumption rates in complex natural system, and that auxiliary factors are likely to inducecomplexity into any predator–prey systems that would not be captured by simple deterministicapproaches.
Key-words
:
Capreolus capreolus
, consumption rates, kill rate,
Lynx lynx
, NAO, predator–prey
Journal of Animal Ecology
(2007) >doi: 10.1111/j.1365-2656.2007.0@@@@.x
Introduction
Describing the functional response of a consumer is one ofthe cornerstones in community ecology research and largelydetermines the effect of a predator population on the preypopulation (Abrams & Ginzburg 2000). Although functionalresponses have a long history in the ecological literature(Holling 1959), a central discussion during the last couple of
decades has concerned how the consumption rate is bestmodelled (see e.g. discussion in Abrams & Ginzburg 2000).Importantly, different forms give rise to widely differingpredictions about the scaling of biomass across food webs(Ginzburg & Ackakaya 1992; Vucetich, Peterson & Schaefer2002) as well as the persistence of predator–prey systems withan efficient predator (Arditi & Berrymann 1991). However,the outcome from purely deterministic approaches mighthave limited predictive value if per capita prey consumption isstrongly modulated by auxiliary biotic and stochastic abioticfactors (e.g. Post
et al.
1999). While the relative importance ofdeterministic and stochastic factors has been a central tenet inpopulation ecology for at least five decades (see Coulson,Rohani & Pascual 2004 for a recent summary), the theoretical
*Correspondence author. e-mail: [email protected]†Present address: Norwegian Institute for Nature Research, NO-7485 Trondheim, Norway.‡ Present address: Section of Natural History, Museum of NaturalHistory and Archaeology, Norwegian University of Technology andScience, NO-7491 Trondheim, Norway.

742
E. B. Nilsen
et al.
© 2009 The Authors. Journal compilation © 2009 British Ecological Society,
Journal of Animal Ecology
,
78
, 741–751
debate in predator–prey ecology seems so far to be dominatedby deterministic models (but see van der Meer & Smallegange2009). There is therefore still a clear need for empirical studiesinvestigating the relationships in complex, natural systems(Abrams & Ginzburg 2000).
A number of factors in addition to prey density are likely toinduce spatial and temporal variation in consumption rateswithin and between predator populations, including predatorage class, spatial distribution of prey (Errington 1946), predatorand prey grouping behaviour (Fryxell
et al.
2007), predatordensity (Vucetich
et al.
2002), surplus killing (Odden
et al.
2002), and the presence of other predator and prey species(Miller
et al.
2006). In addition, consumption rates often varyduring the year, due to differences in prey susceptibility (Sand
et al.
2008), energetic requirements of the predators and theage of the prey (Sand
et al.
2008). The modulating effect ofexternal abiotic factors (such as weather) has receivedconsiderable attention recently, and has been shown to affectconsumption rates (Stenseth
et al.
2004) and thereby thedynamics of predator–prey systems (Post
et al.
1999; Stenseth
et al.
1999; Hebblewhite 2005). In fact, a few recent studieshave suggested that such abiotic factors might be just asimportant as top-down effects in shaping prey dynamics evenin simple predator–prey systems (Vucetich & Peterson 2004).In effect, predation events ought to some extent to be seen asa stochastic process (Festa-Bianchet
et al.
2006), and differentage/sex classes within the predator population might behavevery differently under similar conditions.
The mammalian functional response literature is domin-ated by studies from wolf
Canis lupus
L. ungulate systems(see e.g. Hayes & Harestad 2000; Vucetich
et al.
2002; Jost
et al.
2005), whereas there is a dearth of published functionalresponses for large solitary predators with other huntingtechniques (but see O’Donoghue
et al.
1998; Stenseth
et al.
2004). To expand the existing knowledge about the factorsthat affect the rate at which prey is killed from such systems isin particular important because theoretical studies indicatethat systems dominated by stalking predators will be affectedby environmental factors such as climate variations in differentways than systems dominated by coursing predators (Wilmers,Post & Hastings 2007). We studied the functional response ofthe Eurasian lynx
Lynx lynx
L. preying on roe deer
Capreoluscapreolus
L. in a northern boreal forest ecosystem. In areas ofsympatry, predatory interactions between the Eurasian lynxand roe deer are common (Jedrzejewski
et al.
1993). While thegenus
Lynx
is generally specialized on lagomorphs (Werdelin1981), the Eurasian lynx usually show preference for roe deer(Jedrzejewski
et al.
1993; Odden, Linnell & Andersen 2006).Our study system thus represents a classical predator–preysystem, but has some characteristics that make it particularlysuitable for studying predator consumption rates. First, in thenorthern boreal forests, roe deer densities are generally lowcompared to more temperate regions (Holand
et al.
1998)allowing us to also examine consumption rates below predatorsatiation thresholds. Second, there is a clear spatial andseasonal difference in climate and snow cover, potentiallyinducing variation in hunting success (Stenseth
et al
. 2004)
and prey spacing behaviour (Mysterud, Bjørnsen & Østbye1997). Third, although different age and sex categories mightoften have different probabilities of being captured by apredator (Okarma 1984), earlier studies have shown that lynxin our study area show no selection with respect to size, ageor body condition of roe deer (Andersen
et al.
2007) underboreal conditions. Finally, lynx densities are maintainedbelow saturation levels by recreational harvest (Herfindal
et al
. 2005a) – thus, although ratio-dependent predation hasbeen documented in a few recent studies for e.g. wolf-moosesystems (Vucetich
et al.
2002; Jost
et al.
2005), variation inpredator density is unlikely to influence consumption rates inour study area.
Based on kill rate data from radiocollared lynx collectedover a 10-year period in south-eastern Norway, we ask somefundamental questions relevant to understanding therelationship between consumers and their prey. We areparticularly interested in the shape of the relationshipbetween lynx kill rates and roe deer density at low prey den-sities. The interpretation of this is of crucial importance for ourunderstanding of the shape of functional response curves, andtherefore our understanding of the predator–prey dynamics.Then, we investigated to what extent additional factorsmodulate the functional response curves of the lynx in acomplex, natural system. More precisely, we examined howsocial status of the lynx, season, and climatic variability influ-enced the observed kill rates.
Materials and methods
STUDY
AREA
The 32 000 km
2
study area encompasses an environmental gradient(roughly north-east–south-west) in the counties of Hedmark, Akershusand Østfold in south-eastern Norway (Figs S1 and S2). The ‘northern’portion of the study area is characterized by several river valleys ataround 200–300 m above sea level, separated by hills reaching to700–800 m above sea level. The forest is mainly composed of Nor-wegian spruce
Picea abies
L. and Scots pine
Pinus sylvestris
L. andmost of it has been logged and regenerated throughout the last100 years. The roe deer density in this portion of the study area isgenerally lower than in the southern one (0·01–0·65 individualsharvested annually km
−
2
of forested area). The ‘southern’ portion ofthe study area includes patches of deciduous forest, representedmainly by birch
Betula
spp. and the landscape is more human-modified, with the forest fragmented by cultivated land. The altitudeis not higher than 300 m above sea level, and roe deer occur at higherdensities (0·10–2·50 individuals harvested annually/km
2
of forestedarea). Throughout the study area, roe deer co-exist with moose
Alcesalces
L., mountain hares
Lepus timidus
L. and forest birds such asblack grouse
Tetrao tetrix
L. and capercaillie
Tetrao urugallus
L. Afew red deer
Cervus elaphus
L. were available as prey in small pockets,wild mountain reindeer
Rangifer tarandus
L. were seasonally availableat higher altitudes in the northern part of the study area, and in partsof the study area free-ranging domestic sheep
Ovis aries
L. wereavailable during the summer season (Odden
et al.
2006). The densityof lynx, including dependent offspring, inside the study area hasbeen estimated to be
ca
. 0·3 per 100 km
2
in the northern part of thestudy area and
ca
0·4 per 100 km
2
in the southern part (Odden
et al
.
Lynx functional response
743
© 2009 The Authors. Journal compilation © 2009 British Ecological Society,
Journal of Animal Ecology
,
78
, 741–751
2006). The lynx management goals for different regions are set bythe Norwegian parliament in terms of the desired number ofconfirmed annual reproductions, above which the population islimited by an annual recreational harvest. Lynx populations aremonitored annually in a coordinated programme using standardizedmethods (Andrén
et al
. 2002; Linnell
et al
. 2007).
ANIMAL
CAPTURE
We captured 79 lynx in the study area between 1995 and 2007, ofwhich we obtained kill rate data (see below) from 34 individuals (17males: 17 females). Adult lynx and juveniles (> 5 months) werecaptured in walkthrough box traps, spring-loaded foot-snares andtreed using trained dogs. We also immobilized lynx from cars andhelicopters. In addition, neonatal kittens were captured by hand atnatal lairs. We recaptured lynx every second year when possible. Thewalkthrough box traps were made of wood or metal, baited withlynx urine, and placed along known lynx trails. We checked radio-alarms on the box traps twice per day to minimize the time lynxspent in the box. The spring-loaded foot-snares were placed atlynx-killed roe deer. These snares were continually monitored usingradio-alarms, and our reaction time upon capture was < 15 min.When recapturing lynx with trained dogs, the dogs were released asclose to the radio-located lynx as possible, and the lynx was chaseduntil it escaped, climbed a tree, or sought refuge under rocks. Oncea lynx was in a tree, they were darted and caught in a net if they fell.Occasionally, we also immobilized lynx by darting from car, helicopteror by stalking on foot. All adult animals were immobilized using amixture of ketamine (100 mg) and medetomidine (4 mg), reversed withatipamezole (5 mg); juveniles received a half dose. We administereddrugs intramuscularly by hand, blow-pipe or gas-powered dartingrifle. All procedures were approved by the Norwegian ExperimentalAnimal Ethics Committee, and permits for wild animal capture wereobtained from the Norwegian Directorate for Nature Management.We equipped 57 lynx with VHF radiocollars (Telonics MOD-335transmitter with mortality sensor, Telonics Inc., Mesa, AZ, USA),17 kittens received free-floating intraperitoneal implant transmitters(Telonics IMP/150/L and IMP/400/L implantable transmitter withmortality sensor, Telonics Inc., Mesa, AZ, USA), and 5 lynx receivedglobal positioning system (GPS) collars (four store-on-board Posrec300 and one GPS/GSM Tellus 3H2A, TVP Positioning AB, Lindes-berg, Sweden) (Arnemo
et al
. 1999, Arnemo
et al
. 2006). Collarsweighed 150 g or less than 1% of an adult female’s body weight.
Estimation of kill rates
Data on lynx kill rates on roe deer (defined as number of roedeer killed 100 days
–1
lynx
–1
) were sampled during summer(1 May–30 November) and winter (1 December–30 April)following three different sampling protocols:
1.
Periods of at least 10 days where lynx were located every 15min during either the night, or the entire 24-h period.
2.
Periods of at least 10 days with 1 radiolocation a day.
3.
Periods of at least 10 days with at least 1 radiolocation aday, and also allowing gaps in a radiotracking sequence basedon the following rule:
Female with kittens – winter: no gap allowed.Female with kittens – summer: no gap allowedSingle lynx – winter: 2-day gap allowed.Single lynx – summer: 1-day gap allowed.
The rule for accepting ‘gaps’ in the data set were made fromestimates of handling time of lynx with respect to sex, age andseason (Øvrum 2000), and we used the lower 95% confidenceinterval of estimated mean handling time of ungulate prey.Although this rule is likely to underestimate the number ofsmall prey items and to some extent domestic sheep, we areconfident that it gives a good representation of the number ofroe deer prey, which was the focus of this study. Underprotocol 1, we searched all locations where the lynx stoppedfor at least 1 h during its travels at night in order to locatepotential kills. Using these methods, we located carcassesfrom many domestic sheep, kills of small prey (capercaille,black grouse, mountain hares), and large kills that were mainlyroe deer (Odden
et al
. 2006). It soon became apparent thatlarge kills of wild ungulates were handled in a stereotypedmanner – with the lynx returning to the kill each night soonafter dusk to consume a meal, and then withdrawing to adaybed at some distance from the kill (Pedersen
et al.
1999;Øvrum 2000). This usually continued for several days untilthe kill was more or less totally consumed and the lynx movedon. This resulted in an easily recognizable clustering of loca-tions around a kill, separated by more widely distributedintermediate points. Therefore, when collecting data that wasonly intended to quantify predation on large wild ungulateslike roe deer, we supplemented protocol 1 data with sequencesthat were based on a single daily location. In many cases whenthis single location was at dusk, or when snow conditionspermitted backtracking, it was possible to locate the kill.However, we were not able to search for, or find, all possiblekills. Therefore, we included ‘virtual kills’ where lynx behaviourconformed to the stereotyped behaviour observed when killswere confirmed, even in situations where the kill was notlocated (following Jobin, Molinari & Breitenmoser 2000).This conforms to the methods being developed for interpretingpredation behaviour from predator movement data whereGPS-telemetry technology is being utilized (Anderson &Lindzey 2003; Sand
et al.
2005; Zimmermann
et al
. 2007).Based on the lower 95 % boundary of estimated mean handlingtime and upper 95% boundary of mean distance between akill and a daybed, we made the following rules for virtual kills.
1.
Single animals – all year – three out of four consecutivedaybeds within a radius of 2·6 km
2.
Female with kittens – winter: two consecutive daybedswithin a radius of 2·6 km
3.
Female with kittens – neonatal lair period: three huntingtrips to the same point
4.
Female with kittens – summer after neonatal lair period:three out of four consecutive daybeds within a radius of2·6 km.
Table 1 gives a summary of the number of lynx-killed roedeer included in the analysis, as well as the proportion of thekills that were ‘virtual kills’.
Initial analysis suggested that the estimated kill rates weresensitive to the length of the tracking period, but that theestimates stabilized when periods longer than 7 days wereused. Here, we use data from intensive radiolocation periodsranging from 10 to 125 days to estimate kill rate.
744
E. B. Nilsen
et al.
© 2009 The Authors. Journal compilation © 2009 British Ecological Society,
Journal of Animal Ecology
,
78
, 741–751
ROE
DEER
DENSITY
INDEX
As an index of local roe deer density, we used hunting bagstatistics at the municipality level, available from StatisticsNorway (www.ssb.no). Although hunting bag data might beexpected to give only a coarse representation of roe deerdensities, a previous comparison between hunting bag dataand several independent indexes of roe deer abundance reporteda very good concordance between them (Grøtan
et al
. 2005).First, within our study area (Akershus, Østfold and Hedmark)the hunting statistics are strongly correlated with road traffickills (Table 1 in Grøtan
et al.
2005). Second, in parts of thestudy area where supplemental feeding of roe deer wasconducted, there was a strong correlation between annualvariation in sightings on feeding stations and number of roedeer shot in the area (Grøtan
et al.
2005). Third, althoughthe roe deer harvest is regulated through a quota system,only a low fraction of the quotas were actually harvested(Grøtan
et al
. 2005). Consequently, we expect the temporalvariation in our roe deer density index to largely reflecttemporal variations in roe deer density fairly well. Finally,based on radiocollared roe deer in the study area (based on
n
= 229 radio-marked roe deer; C. Melis, J. D. C. Linnell, J.Odden, & R. Andersen, unpublished data), we found only aweak relationship between harvest rate and the hunting bagdata, indicating that variation in harvest rates across regionsdid not contribute substantially to the variation in our roe deerdensity index. For the ease of interpretation, we rescaled ourroe deer density index (i.e. number of roe deer shot/km
2
forestedarea) based on the assumption that the harvesting rate wasconstant (~14%) across years and regions. Note however thatsince the spatial extension of our roe deer study area is muchless than the lynx study area, we would not able to calculateroe deer densities based on capture-mark-recapture analysiscovering the study area.
In the analysis, the roe deer density index was calculated asthe average across the municipalities in which the individuallynx travelled during the intensive tracking periods. Althoughthis density index is crude, we believe that it is functionalacross such a massive variation in roe deer density (2–3 ordersof magnitude).
CL IMATE
DATA
We used the winter index for the North Atlantic Oscillation(NAO) as an index of climate (Hurrell 1995). This index,
which measures the sea pressure difference between the Azoresand Iceland, has become a popular large-scale index for climatevariability in ecological research (see e.g. Post
et al.
1999;Stenseth & Mysterud 2005). Although local conditions arewhat individual lynx experience when hunting roe deer, it hasrecently been shown that global-scale climate indices such asNAO are reasonable composites of several local climate var-iables (see Stenseth & Mysterud 2005 and references therein).Here, we used this index as a substitute for local weatherconditions as it allow us to avoid arbitrary choice of timeframe, spatial resolution and climatic variables to measure(Stenseth & Mysterud 2005).
In general, a high NAO index is correlated with mild wintertemperature and much precipitation in the Scandinavianregion (Stenseth & Mysterud 2005), and a low index with lowtemperatures and little precipitation. However, whether thisprecipitation comes as snow or rain varies with altitude andlatitude. Based on meteorological data (downloaded from theNorwegian Meteorological Institute; http://www.met.no), weinvestigated the relationship between winter-NAO and snowcover (mean cover from January–March) for meteorologicalstations (
n
= 20) located across the study area (Figs S1 andS2). Preferably, we used a meteorological station locatedcentral in the municipality, but not all municipalities haveweather stations and not all of them covered the entire studyperiod (1995–2005). We therefore selected weather stationsspread around the study area, and searched for general patternsin the relationship between NAO and snow cover. In thenorthern part of the study area, snow cover (in January–March)was generally deep and NAO was positively correlated withsnow cover [mean
r
= 0·39 (range: 0·21–0·71), Figs S1 andS2], which might facilitate lynx hunting success (lynx have asmaller sinking depth than roe deer). In the southern part ofthe study area, however, snow cover is much less deep and notcorrelated with NAO [Figs S1 and S2; mean
r
=
–0·08 (range–0·28–0·11)]. In our statistical analysis, we used an indicatorvariable (I: see below) to investigate whether the correlationbetween NAO and kill rates differed between these regions.
STATISTICAL
ANALYSIS
OF
THE
FUNCTIONAL
RESPONSE
Regardless of the class of functional response, predatorsatiation seems to be a common feature emerging from studiesof mammalian (Jost
et al.
2005) and other (Skalski & Gilliam2001) predator–prey systems. To assess this assumption, weinitially modelled the relationship between lynx kill rate androe deer density using a generalized additive mixed effectsmodel (Woods 2006), using the gamm procedure in the library
mgcv
in the
r
2·6·2 software (R Development Core Team2008). This nonparametric approach allows for full flexibilityin the relationship between the response and explanatoryvariable and is thus well suited to investigate this assumption.In the models, season (summer vs. winter), social status (solitaryindividuals vs. females with dependent kittens) and theirinteraction were fitted as parametric fixed effects, and therelationship between roe deer density and kill rates were
Table 1. The number of lynx killed roe deer included in thefunctional response analysis, separated by social status and season.The number in parentheses represents the proportion of the totalnumber of kills that are based on the ‘virtual kill’ method (seeMethods)
Summer Winter Total
Family groups 38 (50%) 61 (38%) 99 (42%)
Solitary 80 (46%) 75 (52%) 155 (49%) Total 118 (47%) 136 (46%) 254 (46%)
Lynx functional response
745
© 2009 The Authors. Journal compilation © 2009 British Ecological Society,
Journal of Animal Ecology
,
78
, 741–751
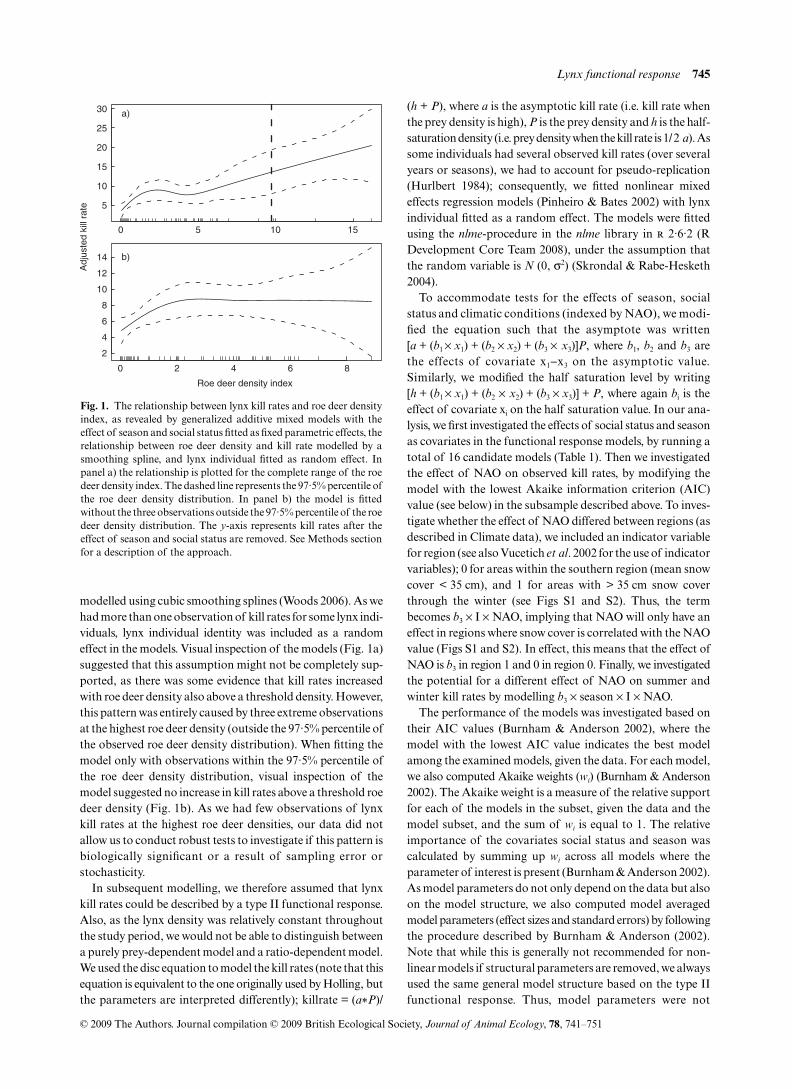
modelled using cubic smoothing splines (Woods 2006). As wehad more than one observation of kill rates for some lynx indi-viduals, lynx individual identity was included as a randomeffect in the models. Visual inspection of the models (Fig. 1a)suggested that this assumption might not be completely sup-ported, as there was some evidence that kill rates increasedwith roe deer density also above a threshold density. However,this pattern was entirely caused by three extreme observationsat the highest roe deer density (outside the 97·5% percentile ofthe observed roe deer density distribution). When fitting themodel only with observations within the 97·5% percentile ofthe roe deer density distribution, visual inspection of themodel suggested no increase in kill rates above a threshold roedeer density (Fig. 1b). As we had few observations of lynxkill rates at the highest roe deer densities, our data did notallow us to conduct robust tests to investigate if this pattern isbiologically significant or a result of sampling error orstochasticity.
In subsequent modelling, we therefore assumed that lynxkill rates could be described by a type II functional response.Also, as the lynx density was relatively constant throughoutthe study period, we would not be able to distinguish betweena purely prey-dependent model and a ratio-dependent model.We used the disc equation to model the kill rates (note that thisequation is equivalent to the one originally used by Holling, butthe parameters are interpreted differently); killrate = (a*P)/
(h + P), where a is the asymptotic kill rate (i.e. kill rate whenthe prey density is high), P is the prey density and h is the half-saturation density (i.e. prey density when the kill rate is 1/2 a). Assome individuals had several observed kill rates (over severalyears or seasons), we had to account for pseudo-replication(Hurlbert 1984); consequently, we fitted nonlinear mixedeffects regression models (Pinheiro & Bates 2002) with lynxindividual fitted as a random effect. The models were fittedusing the nlme-procedure in the nlme library in r 2·6·2 (RDevelopment Core Team 2008), under the assumption thatthe random variable is N (0, σ2) (Skrondal & Rabe-Hesketh2004).
To accommodate tests for the effects of season, socialstatus and climatic conditions (indexed by NAO), we modi-fied the equation such that the asymptote was written[a + (b1 × x1) + (b2 × x2) + (b3 × x3)]P, where b1, b2 and b3 arethe effects of covariate x1−x3 on the asymptotic value.Similarly, we modified the half saturation level by writing[h + (b1 × x1) + (b2 × x2) + (b3 × x3)] + P, where again bi is theeffect of covariate xi on the half saturation value. In our ana-lysis, we first investigated the effects of social status and seasonas covariates in the functional response models, by running atotal of 16 candidate models (Table 1). Then we investigatedthe effect of NAO on observed kill rates, by modifying themodel with the lowest Akaike information criterion (AIC)value (see below) in the subsample described above. To inves-tigate whether the effect of NAO differed between regions (asdescribed in Climate data), we included an indicator variablefor region (see also Vucetich et al. 2002 for the use of indicatorvariables); 0 for areas within the southern region (mean snowcover < 35 cm), and 1 for areas with > 35 cm snow coverthrough the winter (see Figs S1 and S2). Thus, the termbecomes b3 × I × NAO, implying that NAO will only have aneffect in regions where snow cover is correlated with the NAOvalue (Figs S1 and S2). In effect, this means that the effect ofNAO is b3 in region 1 and 0 in region 0. Finally, we investigatedthe potential for a different effect of NAO on summer andwinter kill rates by modelling b3 × season × I × NAO.
The performance of the models was investigated based ontheir AIC values (Burnham & Anderson 2002), where themodel with the lowest AIC value indicates the best modelamong the examined models, given the data. For each model,we also computed Akaike weights (wi) (Burnham & Anderson2002). The Akaike weight is a measure of the relative supportfor each of the models in the subset, given the data and themodel subset, and the sum of wi is equal to 1. The relativeimportance of the covariates social status and season wascalculated by summing up wi across all models where theparameter of interest is present (Burnham & Anderson 2002).As model parameters do not only depend on the data but alsoon the model structure, we also computed model averagedmodel parameters (effect sizes and standard errors) by followingthe procedure described by Burnham & Anderson (2002).Note that while this is generally not recommended for non-linear models if structural parameters are removed, we alwaysused the same general model structure based on the type IIfunctional response. Thus, model parameters were not
Fig. 1. The relationship between lynx kill rates and roe deer densityindex, as revealed by generalized additive mixed models with theeffect of season and social status fitted as fixed parametric effects, therelationship between roe deer density and kill rate modelled by asmoothing spline, and lynx individual fitted as random effect. Inpanel a) the relationship is plotted for the complete range of the roedeer density index. The dashed line represents the 97·5% percentile ofthe roe deer density distribution. In panel b) the model is fittedwithout the three observations outside the 97·5% percentile of the roedeer density distribution. The y-axis represents kill rates after theeffect of season and social status are removed. See Methods sectionfor a description of the approach.
746 E. B. Nilsen et al.
© 2009 The Authors. Journal compilation © 2009 British Ecological Society, Journal of Animal Ecology, 78, 741–751
dependent on one model, but took into account modelselection uncertainty. Assumptions of the models were inves-tigated as described by Pinheiro & Bates (2002).
To investigate the amount of variation that could be attrib-uted to the fixed and random parts of the models, we followeda two-step process. First, we evaluated the proportion of thetotal residual variation that could be attributed to individualidentity, also known as the intraclass correlation ρ (Skrondal& Rabe-Hesketh 2004). Then we examined the correlationbetween the fitted and observed values, without the effect ofthe random factors. We here report the squared correlationcoefficient (r2), and note that this gives very similar results tosingle-level models.
Results
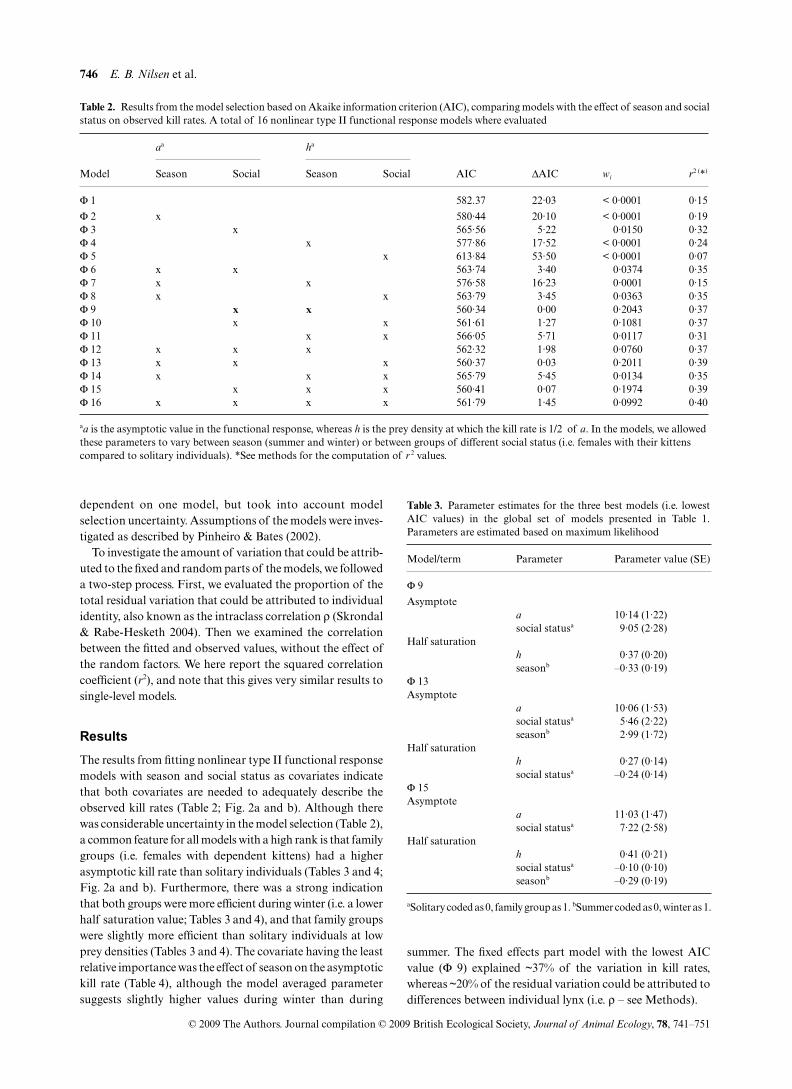
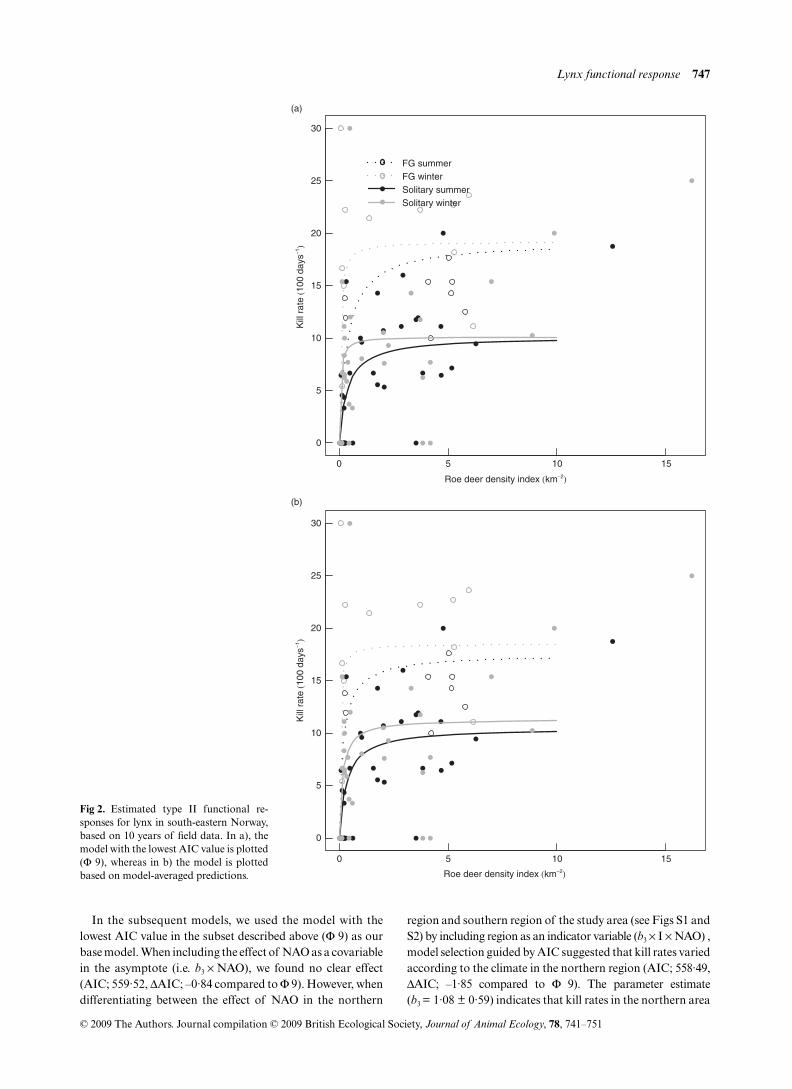
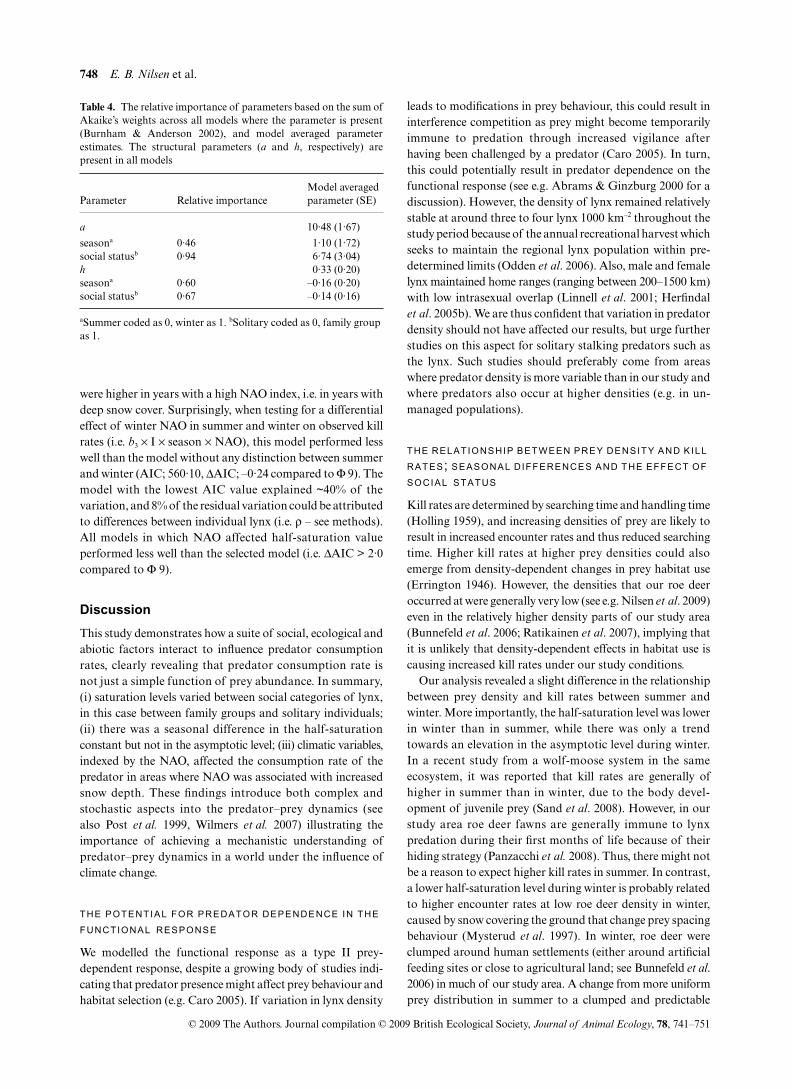
The results from fitting nonlinear type II functional responsemodels with season and social status as covariates indicatethat both covariates are needed to adequately describe theobserved kill rates (Table 2; Fig. 2a and b). Although therewas considerable uncertainty in the model selection (Table 2),a common feature for all models with a high rank is that familygroups (i.e. females with dependent kittens) had a higherasymptotic kill rate than solitary individuals (Tables 3 and 4;Fig. 2a and b). Furthermore, there was a strong indicationthat both groups were more efficient during winter (i.e. a lowerhalf saturation value; Tables 3 and 4), and that family groupswere slightly more efficient than solitary individuals at lowprey densities (Tables 3 and 4). The covariate having the leastrelative importance was the effect of season on the asymptotickill rate (Table 4), although the model averaged parametersuggests slightly higher values during winter than during
summer. The fixed effects part model with the lowest AICvalue (Φ 9) explained ~37% of the variation in kill rates,whereas ~20% of the residual variation could be attributed todifferences between individual lynx (i.e. ρ – see Methods).
Table 2. Results from the model selection based on Akaike information criterion (AIC), comparing models with the effect of season and socialstatus on observed kill rates. A total of 16 nonlinear type II functional response models where evaluated
Model
aa ha
AIC ΔAIC wi r2 (*)Season Social Season Social
Φ 1 582.37 22·03 < 0·0001 0·15
Φ 2 x 580·44 20·10 < 0·0001 0·19Φ 3 x 565·56 5·22 0·0150 0·32Φ 4 x 577·86 17·52 < 0·0001 0·24Φ 5 x 613·84 53·50 < 0·0001 0·07Φ 6 x x 563·74 3·40 0·0374 0·35Φ 7 x x 576·58 16·23 0·0001 0·15Φ 8 x x 563·79 3·45 0·0363 0·35Φ 9 x x 560·34 0·00 0·2043 0·37Φ 10 x x 561·61 1·27 0·1081 0·37Φ 11 x x 566·05 5·71 0·0117 0·31Φ 12 x x x 562·32 1·98 0·0760 0·37Φ 13 x x x 560·37 0·03 0·2011 0·39Φ 14 x x x 565·79 5·45 0·0134 0·35Φ 15 x x x 560·41 0·07 0·1974 0·39Φ 16 x x x x 561·79 1·45 0·0992 0·40
aa is the asymptotic value in the functional response, whereas h is the prey density at which the kill rate is 1/2 of a. In the models, we allowed these parameters to vary between season (summer and winter) or between groups of different social status (i.e. females with their kittens compared to solitary individuals). *See methods for the computation of r 2 values.
Table 3. Parameter estimates for the three best models (i.e. lowestAIC values) in the global set of models presented in Table 1.Parameters are estimated based on maximum likelihood
Model/term Parameter Parameter value (SE)
Φ 9
Asymptotea 10·14 (1·22)social statusa 9·05 (2·28)
Half saturationh 0·37 (0·20)seasonb –0·33 (0·19)
Φ 13Asymptote
a 10·06 (1·53)social statusa 5·46 (2·22)seasonb 2·99 (1·72)
Half saturationh 0·27 (0·14)social statusa –0·24 (0·14)
Φ 15Asymptote
a 11·03 (1·47)social statusa 7·22 (2·58)
Half saturationh 0·41 (0·21)social statusa –0·10 (0·10)seasonb –0·29 (0·19)
aSolitary coded as 0, family group as 1. bSummer coded as 0, winter as 1.
Lynx functional response 747
© 2009 The Authors. Journal compilation © 2009 British Ecological Society, Journal of Animal Ecology, 78, 741–751
In the subsequent models, we used the model with thelowest AIC value in the subset described above (Φ 9) as ourbase model. When including the effect of NAO as a covariablein the asymptote (i.e. b3 × NAO), we found no clear effect(AIC; 559·52, ΔAIC; –0·84 compared to Φ 9). However, whendifferentiating between the effect of NAO in the northern
region and southern region of the study area (see Figs S1 andS2) by including region as an indicator variable (b3 × I × NAO) ,model selection guided by AIC suggested that kill rates variedaccording to the climate in the northern region (AIC; 558·49,ΔAIC; –1·85 compared to Φ 9). The parameter estimate(b3 = 1·08 ± 0·59) indicates that kill rates in the northern area
Fig 2. Estimated type II functional re-sponses for lynx in south-eastern Norway,based on 10 years of field data. In a), themodel with the lowest AIC value is plotted(Φ 9), whereas in b) the model is plottedbased on model-averaged predictions.
748 E. B. Nilsen et al.
© 2009 The Authors. Journal compilation © 2009 British Ecological Society, Journal of Animal Ecology, 78, 741–751
were higher in years with a high NAO index, i.e. in years withdeep snow cover. Surprisingly, when testing for a differentialeffect of winter NAO in summer and winter on observed killrates (i.e. b3 × I × season × NAO), this model performed lesswell than the model without any distinction between summerand winter (AIC; 560·10, ΔAIC; –0·24 compared to Φ 9). Themodel with the lowest AIC value explained ~40% of thevariation, and 8% of the residual variation could be attributedto differences between individual lynx (i.e. ρ – see methods).All models in which NAO affected half-saturation valueperformed less well than the selected model (i.e. ΔAIC > 2·0compared to Φ 9).
Discussion
This study demonstrates how a suite of social, ecological andabiotic factors interact to influence predator consumptionrates, clearly revealing that predator consumption rate isnot just a simple function of prey abundance. In summary,(i) saturation levels varied between social categories of lynx,in this case between family groups and solitary individuals;(ii) there was a seasonal difference in the half-saturationconstant but not in the asymptotic level; (iii) climatic variables,indexed by the NAO, affected the consumption rate of thepredator in areas where NAO was associated with increasedsnow depth. These findings introduce both complex andstochastic aspects into the predator–prey dynamics (seealso Post et al. 1999, Wilmers et al. 2007) illustrating theimportance of achieving a mechanistic understanding ofpredator–prey dynamics in a world under the influence ofclimate change.
THE POTENTIAL FOR PREDATOR DEPENDENCE IN THE FUNCTIONAL RESPONSE
We modelled the functional response as a type II prey-dependent response, despite a growing body of studies indi-cating that predator presence might affect prey behaviour andhabitat selection (e.g. Caro 2005). If variation in lynx density
leads to modifications in prey behaviour, this could result ininterference competition as prey might become temporarilyimmune to predation through increased vigilance afterhaving been challenged by a predator (Caro 2005). In turn,this could potentially result in predator dependence on thefunctional response (see e.g. Abrams & Ginzburg 2000 for adiscussion). However, the density of lynx remained relativelystable at around three to four lynx 1000 km–2 throughout thestudy period because of the annual recreational harvest whichseeks to maintain the regional lynx population within pre-determined limits (Odden et al. 2006). Also, male and femalelynx maintained home ranges (ranging between 200–1500 km)with low intrasexual overlap (Linnell et al. 2001; Herfindalet al. 2005b). We are thus confident that variation in predatordensity should not have affected our results, but urge furtherstudies on this aspect for solitary stalking predators such asthe lynx. Such studies should preferably come from areaswhere predator density is more variable than in our study andwhere predators also occur at higher densities (e.g. in un-managed populations).
THE RELATIONSHIP BETWEEN PREY DENSITY AND KILL RATES; SEASONAL DIFFERENCES AND THE EFFECT OF SOCIAL STATUS
Kill rates are determined by searching time and handling time(Holling 1959), and increasing densities of prey are likely toresult in increased encounter rates and thus reduced searchingtime. Higher kill rates at higher prey densities could alsoemerge from density-dependent changes in prey habitat use(Errington 1946). However, the densities that our roe deeroccurred at were generally very low (see e.g. Nilsen et al. 2009)even in the relatively higher density parts of our study area(Bunnefeld et al. 2006; Ratikainen et al. 2007), implying thatit is unlikely that density-dependent effects in habitat use iscausing increased kill rates under our study conditions.
Our analysis revealed a slight difference in the relationshipbetween prey density and kill rates between summer andwinter. More importantly, the half-saturation level was lowerin winter than in summer, while there was only a trendtowards an elevation in the asymptotic level during winter.In a recent study from a wolf-moose system in the sameecosystem, it was reported that kill rates are generally ofhigher in summer than in winter, due to the body devel-opment of juvenile prey (Sand et al. 2008). However, in ourstudy area roe deer fawns are generally immune to lynxpredation during their first months of life because of theirhiding strategy (Panzacchi et al. 2008). Thus, there might notbe a reason to expect higher kill rates in summer. In contrast,a lower half-saturation level during winter is probably relatedto higher encounter rates at low roe deer density in winter,caused by snow covering the ground that change prey spacingbehaviour (Mysterud et al. 1997). In winter, roe deer wereclumped around human settlements (either around artificialfeeding sites or close to agricultural land; see Bunnefeld et al.2006) in much of our study area. A change from more uniformprey distribution in summer to a clumped and predictable
Table 4. The relative importance of parameters based on the sum ofAkaike’s weights across all models where the parameter is present(Burnham & Anderson 2002), and model averaged parameterestimates. The structural parameters (a and h, respectively) arepresent in all models
Parameter Relative importanceModel averaged parameter (SE)
a 10·48 (1·67)
seasona 0·46 1·10 (1·72)social statusb 0·94 6·74 (3·04)h 0·33 (0·20)seasona 0·60 –0·16 (0·20)social statusb 0·67 –0·14 (0·16)
aSummer coded as 0, winter as 1. bSolitary coded as 0, family group as 1.
Lynx functional response 749
© 2009 The Authors. Journal compilation © 2009 British Ecological Society, Journal of Animal Ecology, 78, 741–751
prey distribution in winter may facilitate a reduction in searchtime, since lynx maintain their territories, and the associatedknowledge of prey distribution, for years (Breitenmoser-Würsten et al. 2007). Another potential explanation is thatdomestic sheep were available as an alternative lynx preyduring summer in the parts of our study area with low roedeer densities (Odden et al. 2006). As domestic sheep mightcontribute substantially to the lynx diet, this might havesuppressed lynx consumption of roe deer in summer in someareas. However, separate analyses have indicated that lynxselect habitats associated with higher roe deer density ratherthan areas with free-grazing sheep (Moa et al. 2006; Oddenet al. 2008), supporting the notion that lynx prefer roe deerprey when available.
Overriding the seasonal differences in kill rates was thedifference between lynx of different social status; the con-sumption rate of females with their dependent kittens wasmuch higher than those of solitary individuals. Such dif-ferences between different categories of individuals have beenreported previously for puma preying on mule deer (Laundré2008) and lynx preying on roe deer (Jobin et al. 2000), and ismost likely related to different energetic demands (Laundré2008).
CLIMATE VARIABIL ITY AND IMPLICATIONS FOR PREDATOR–PREY DYNAMICS
The mechanistic relationship between climate and kill rates ismost likely linked to differing hunting success. A small reductionin speed of an escaping roe deer due to snow cover may affectthe hunting success in winter. Surprisingly, however, ourmodelling also suggested that winter NAO had a carry-overeffect through to the summer. At this stage, we feel that it ispremature to suggest that this is a general pattern. However,previous studies have shown how roe deer are sensitive towinter climate, and that body weight in autumn might berelated to conditions experienced during the previous winter(Herfindal 2006; Mysterud & Østbye 2006).
Relationships between climatic conditions such as snowcover and the dynamics of wolf-ungulate systems have beendescribed several times (Post et al. 1999; Hebblewhite 2005),and in a recent analysis from Isle Royale climatic variationwas reported to explain more of the variation in moosepopulation growth rates than did wolf density (Vucetich& Peterson 2004). However, lynx and wolves have differentsocial structures and hunting strategies, and for stalking pred-ators (such as the lynx), similar studies are generally lacking(but see Stenseth et al. 2004). Simulation studies suggest thatambush or stalking predators should stabilize the dynamicsof predator–prey systems, by inducing elevated mortality forprime-aged prey, and thus prolonging the predator pit andreducing the chance of prey irruption (Wilmers et al. 2007).We have previously shown that lynx frequently include adultroe deer in their diet in a proportion representing the standingage distribution (Andersen et al. 2007), thus one could expectlynx predation to stabilize the system (Wilmers et al. 2007).However, if climatic conditions affect the functional response
of the lynx, as we report here, one would expect climaticvariation to destabilize these systems as well. This is alsosupported by demographic perturbation analysis of radiocol-lared roe deer in the study area; interannual fluctuation in roedeer growth rate is strongly affected by lynx predation andmore so in the northern part of the study area (Nilsen et al.2009). Our results further suggest that lynx impact on roe deerprey might increase in areas where climate change resultsin more snow (see also Post et al. 1999; Hebblewhite 2005),although the nonlinear relationships that are frequentlyobserved in biological systems (e.g. Mysterud et al. 2001)require a cautious interpretation.
The fact that lynx were able to exhibit high kill rates at avery low roe deer density is indicative for a potentially strongtop-down limitation of the prey population. This is in par-ticular true in the northern parts of the study area, where roedeer densities are at the lowest, predation rates highest (C.Melis, J. Odden, R. Andersen, & J. D. C. Linnell, unpublisheddata), and lynx consumption rates are most closely linked toclimatic factors. Indeed, a steep type II functional responsecoupled with a stable predator population (e.g. due to man-agement) will result in a negative relationship between preydensity and predation rates (see also Nilsen et al. 2005). Ifallowed to respond numerically however, an effective predatorsuch as the lynx should result in a predator zero isocline inter-secting the prey isoclines to the left of the hump (see Denget al. 2007 and references therein). Theoretically, a verticalpredator isocline should then result in increasing cyclesending up with prey and predator extinction (see also classicalstudies by Gauss 1934), whereas a sloped predator isocline(arising from predator dependence in kill rates or moregenerally in predator growth rate; Abrams & Ginzburg 2000;Deng et al. 2007) should lead to equilibrium points that areboth low and stable (i.e. biological control; Deng et al. 2007).However, regardless of theoretical considerations based ondeterministic models, the stochasticity induced by variationin the spatial distribution of lynx family groups and varyingclimatic conditions combined with the low half-saturationdensity, is likely to lead to high variability on a local scale.
Our analyses have highlighted that prey consumption ratesby predators are more complex than being purely a functionof prey density (see also Abrams & Ginzburg 2000; Milleret al. 2006). Indeed, we have shown that a purely prey-dependentfunctional response model might give a poor description ofthe data, and that additional factors are needed to obtain areliable understanding of predator consumption rate. Suchdetailed knowledge is important if we are to make predictionsabout the nature of predator–prey relationships.
Acknowledgement
The study was supported by the Research Council of Norway, the NorwegianDirectorate for Nature Management (DN), the Norwegian Institute for NatureResearch (NINA), Hedmark University College, and the Nature ProtectionDivisions of the County Governor’s Office for Oslo & Akershus, Østfold,Hedmark, Oppland, Buskerud and Telemark counties. We also want to thankthe many people who have helped us in the field during the years of this study.Jos M. Milner, Harry P. Andreassen, Jean-Michel Gaillard and FridolinZimmermann provided valuable comments on the manuscript.
750 E. B. Nilsen et al.
© 2009 The Authors. Journal compilation © 2009 British Ecological Society, Journal of Animal Ecology, 78, 741–751
References
Abrams, P.A. & Ginzburg, L.R. (2000) The nature of predation: prey dependent,ratio dependent or neither? Trends in Ecology & Evolution, 15, 337–341.
Andersen, R., Karlsen, J., Austmo, L.B., Odden, J., Linnell, J. & Gaillard, J.M.(2007) Selectivity of Eurasian lynx Lynx lynx and recreational hunters forage, sex and body condition in roe deer Capreolus capreolus. Wildlife Biology,13, 467–474.
Anderson, C.R. & Lindzey, F.G. (2003) Estimating cougar predation ratesfrom GPS location clusters. Journal of Wildlife Management, 67, 307–316.
Andrén, H., Linnell, J.D.C., Liberg, O., Ahlqvist, P., Andersen, R., Danell, A.,Franzén, R., Kvam, T., Odden, J., & Segerstrom, P. (2002) Estimating totallynx (Lynx lynx) population size from censuses of family groups. WildlifeBiology, 8, 299–306.
Arditi, R. & Berryman, A.A. (1991) The biological-control paradox. Trends inEcology & Evolution, 6, 32–32.
Arnemo, J.M., Linnell, J.D.C., Wedul, S.J., Ranheim, B., Odden, J. & Andersen,R. (1999) Use of intraperitoneal radio-transmitters in lynx Lynx lynxkittens: anaesthesia, surgery and behaviour. Wildlife Biology, 5, 245–250.
Arnemo, J. M., Ahlqvist, P., Andersen, R., Berntsen, F., Ericsson, G., Odden, J.,Brunberg, S., Segerstrom, P. & Swenson, J.E. (2006) Risk of capture-relatedmortality in large free-ranging mammals: experiences from Scandinavia.Wildlife Biology, 12, 109–113.
Breitenmoser-Würsten, C., Zimmermann, F., Stahl, P., Vandel, J.M., Molinari-Jobin, A., Molinari, P., Capt, S. & Breitenmoser, U. (2007) Spatial and socialstability of a Eurasian lynx Lynx lynx population: an assessment of 10 yearsof observation in the Jura Mountains. Wildlife Biology, 13, 365–380.
Bunnefeld, N., Linnell, J.D.C., Odden, J., van Duijn, M.A.J. & Andersen, R.(2006) Risk taking by Eurasian lynx (Lynx lynx) in a human-dominatedlandscape: effects of sex and reproductive status. Journal of Zoology, 270,31–39.
Burnham, K.P. & Anderson, D.R. (2002) Model Selection and MultimodelInference: A Practical Information-Theoretic Approach, Springer-Verlag,New York.
Caro, T.M. (2005) Antipredator Defenses in Birds and Mammals The Universityof Chicago Press, Chicago, Illinois.
Coulson, T., Rohani, P. & Pascual, M. (2004) Skeletons, noise and populationgrowth: the end of an old debate? Trends in Ecology & Evolution, 19, 359–364.
DelGiudice, G.D., Fieberg, J., Riggs, M.R., Powell, M.C. & Pan, W. (2006) Along-term age-specific survival analysis of female white-tailed deer. Journalof Wildlife Management, 70, 1556–1568.
Deng, B., Jessie, S., Ledder, G., Rand, A. & Srodulski, S. (2007) Biologicalcontrol does not imply paradox. Mathematical Biosciences, 208, 26–32.
Errington, P.L. (1946) Predation and vertebrate populations. Quarterly Reviewof Biology, 21, 144–177.
Festa-Bianchet, M., Coulson, T., Gaillard, J.M., Hogg, J.T. & Pelletier, F.(2006) Stochastic predation events and population persistence in bighornsheep. Proceedings of the Royal Society B: Biological Sciences, 273, 1537–1543.
Fryxell, J. M., Mosser, A., Sinclair, A.R.E. & Packer, C. (2007) Group formationstabilizes predator-prey dynamics. Nature, 449, 1041–U4.
Gause, G.F. (1934) The Struggle for Existence, Dover Publications.Ginzburg, L.R. & Ackakaya, H.R. (1992) Consequences of ratio-dependent
predation for steady-state properties of ecosystems. Ecology, 73, 1536–1543.Grøtan, V., Saether, B.E., Engen, S., Solberg, E.J., Linnell, J.D.C., Andersen, R.,
Broseth, H. & Lund, E. (2005) Climate causes large-scale spatial synchronyin population fluctuations of a temperate herbivore. Ecology, 86, 1472–1482.
Hayes, R.D. & Harestad, A.A. (2000) Wolf functional response and regulationof moose in the Yukon. Canadian Journal of Zoology, 78, 60–66.
Hebblewhite, M. (2005) Predation by wolves interacts with the North PacificOscillation (NPO) on a western North American elk population. Journal ofAnimal Ecology, 74, 226–233.
Herfindal, I. (2006) Life history consequences of environmental variationalong ecological gradients in northern ungulates. PhD thesis, Department ofBiology. Norwegian University of Science and Technology, Trondheim,Norway.
Herfindal, I., Linnell, J.D.C., Moa, P.F., Odden, J., Austmo, L.B., & Andersen,R. (2005a) Does recreational hunting of lynx reduce depredation losses ofdomestic sheep. Journal of Wildlife Management, 69, 1034–1042.
Herfindal, I., Linnell, J.D.C., Odden, J., Nilsen, E.B. & Andersen, R. (2005b)Prey density, environmental productivity and home-range size in theEurasian lynx (Lynx lynx). Journal of Zoology, 265, 63–71.
Holand, Ø., Mysterud, A., Wannag, A. & Linnell, J.D.C. (1998) Roe deer innorthern environments: Physiology and behaviour. European Roe Deer: The
Biology of Success (eds R. Andersen, P. Duncan & J.D.C. Linnell), pp. 117–139. Scandinavian University Press, Oslo, Norway.
Holling, C.S. (1959) The components of predation as revealed by a study ofsmall mammal predation of the european pine sawfly. The CanadianEntomologist, 91, 293–320.
Hurlbert, S.H. (1984) Pseudoreplication and the design of ecological fieldexperiments. Ecological Monographs, 54: 187–211.
Hurrell, J.W. (1995) Decadal trends in the North Atlantic Oscillation – regionaltemperatures and precipitation. Science, 269, 676–679.
Jedrzejewski, W., Schmidt, K., Milkowski, L., Jedrzejewska, B. & Okarma, H.(1993) Foraging by lynx and its role in ungulate mortality: the local (BialowiezaForest) and the Palaearctic viewpoint. Acta Theriologica, 38, 385–403.
Jobin, A., Molinari, P. & Breitenmoser, U. (2000) Prey spectrum, prey prefer-ence and consumption rates of Eurasian lynx in the Swiss Jura Mountains.Acta Theriologica, 45, 243–252.
Jost, C., Devulder, G., Vucetich, J.A., Peterson, R.O. & Arditi, R. (2005) Thewolves of Isle Royale display scale-invariant satiation and ratio-dependentpredation on moose. Journal of Animal Ecology, 74, 809–816.
Laundré, J.W. (2008) Summer predation rates on ungulate prey by a largekeystone predator: how many ungulates does a large predator kill? Journal ofZoology, London, 275, 41–348.
Linnell, J.D.C., Andersen, R., Kvam, T., Andren, H., Liberg, O., Odden, J. &Moa, P.F. (2001) Home range size and choice of management strategy forlynx in Scandinavia. Environmental Management, 27, 869–879.
Linnell, J.D.C., Odden, J., Andrén, H., Liberg, O., Andersen, R., Moa, P.F.,Kvam, T., Segerström, P., Schmidt, K., Jedrzejewski, W. & Okarma, H. (2007)Distance rules for minimum counts of Eurasian lynx Lynx lynx familygroups under different ecological conditions. Wildlife Biology, 13, 447–455.
Miller, D.A., Grand, J.B., Fondell, T.F. & Anthony, M. (2006) Predator func-tional response and prey survival: direct and indirect interactions affecting amarked prey population. Journal of Animal Ecology, 75, 101–110.
Moa, P.F., Herfindal, I., Linnell, J.D.C., Overskaug, K., Kvam, T., & Andersen,R. (2006) Does the spatiotemporal distribution of livestock influence foragepatch selection in Eurasian lynx? Wildlife Biology, 12, 63–70.
Mysterud, A. & Østbye, E. (2006) Effect of climate and density on individualand population growth of roe deer Capreolus capreolus at northern latitudes:the Lier valley, Norway. Wildlife Biology, 12, 321–329.
Mysterud, A., Bjørnsen, B.H. & Østbye, E. (1997) Effects of snow depth onfood and habitat selection by roe deer Capreolus capreolus along an altitudinalgradient in south-central Norway. Wildlife Biology, 1, 27–33.
Mysterud, A., Stenseth, N.C., Yoccoz, N.G., Langvatn, R. & Steinheim, G.(2001) Nonlinear effects of large-scale climatic variability on wild anddomestic herbivores. Nature, 410, 1096–1099.
Nilsen, E.B., Pettersen, T., Gundersen, H., Milner, J.M., Mysterud, A., Solberg,E.J., Andreassen, H.P. & Stenseth, N.C. (2005) Moose harvesting strategiesin the presence of wolves. Journal of Applied Ecology, 42, 389–399.
Nilsen, E.B., Gaillard, J-M., Andersen, R., Odden, J., Delorme, D., van Laere,G. & Linnell, J.D.C. (2009) A slow life in hell or a fast life in heaven: demo-graphic analyses of contrasting roe deer populations. Journal of AnimalEcology, printed online (DOI: 10.1111/j.1365-2656.2009.01523.x)
O’Donoghue, M., Boutin, S., Krebs, C.J., Zuleta, G., Murray, D.L. & Hofer,E.J. (1998) Functional responses of coyotes and lynx to the snowshoe harecycle. Ecology, 79, 1193–1208.
Odden, J., Linnell, J.D.C., Moa, P.F., Herfindal, I., Kvam, T. & Andersen, R.(2002) Lynx depredation on domestic sheep in Norway. Journal of WildlifeManagement, 66, 98.
Odden, J., Linnell, J.D.C. & Andersen, R. (2006) Diet of Eurasian lynx, Lynxlynx, in the boreal forest of southeastern Norway: the relative importance oflivestock and hares at low roe deer density. European Journal of WildlifeResearch, 52, 237–244.
Odden, J., Herfindal, I., Linnell, J.D.C. & Andersen, R. (2008) Vulnerability ofdomestic sheep to lynx depredation in relation to roe deer density. Journal ofWildlife Management, 72, 276–282.
Okarma, H. (1984) The physical condition of red deer falling prey to the wolfand lynx and harvested in the Carpathian Mountains. Acta Theriologica, 29,283–290.
Øvrum, L. (2000) At the scene of the crime; lynx handling of prey in Hedmark.MSc Thesis, Norwegian University for Science and Technology, Trondheim,Norway.
Panzacchi, M., Linnell, J.D.C., Odden, J., Odden, M. & Andersen, R. (2008)When a generalist becomes a specialist: patterns of red fox predation on roedeer fawns under contrasting conditions. Canadian Journal of Zoology, 86,116–126.
Pedersen, V., Linnell, J.D.C., Andersen, R., Andrén, H., Segerström, P. &Lindén, M. (1999) Winter lynx predation on semi-domestic reindeer innorthern Sweden. Wildlife Biology, 5, 203–212.

Lynx functional response 751
© 2009 The Authors. Journal compilation © 2009 British Ecological Society, Journal of Animal Ecology, 78, 741–751
Pinheiro, J. & Bates, D. (2002) Mixed-Effects Modelling in S and S-Plus.Statistics and Computing Series, Springer Verlag, New York.
Post, E., Peterson, R.O., Stenseth, N.C. & McLaren, B.E. (1999) Ecosystemconsequences of wolf behavioural response to climate. Nature, 401, 905–907.
R Development Core Team (2008) R: A Language and Environment for Statis-tical Computing. R Foundation for Statistical Computing, Vienna, Austria.
Ratikainen, I.I., Panzacchi, M., Mysterud, A., Odden, J., Linnell, J. &Andersen, R. (2007) Use of winter habitat by roe deer at a northern latitudewhere Eurasian lynx are present. Journal of Zoology, 273, 192–199.
Sand, H., Zimmermann, B., Wabakken, P., Andren, H. & Pedersen, H.C.(2005) Using GPS technology and GIS cluster analyses to estimate kill ratesin wolf-ungulate ecosystems. Wildlife Society Bulletin, 33, 914–925.
Sand, H., Wabakken P., Zimmermann, B., Johansson, Ø., Pedersen, H.C. &Liberg, O. (2008) Summer kill rates and predation pattern in a wolf–moosesystem: can we rely on winter estimates? Oecologia, printed online (DOI:10.1007/s00442–008–0969–2).
Skalski, G.T. & Gilliam, J.F. (2001) Functional responses with predator inter-ference: viable alternatives to the Holling Type II model. Ecology, 82, 3083–3092.
Skrondal, A. & Rabe-Hesketh, S. (2004) Generalized Latent Variable Modeling:Multilevel, Longitudinal and Structural Equation Models, Chapman & Hall/CRC, Washington, DC.
Stenseth, N.C. & Mysterud, A. (2005) Weather packages: finding the right scaleand composition of climate in ecology. Journal of Animal Ecology, 74, 1195–1198.
Stenseth, N.C., Chan, K-S., Howell, T., Boonstra, R., Boutin, S., Krebs, C.J.,Post, E., O’Donoghue, M., Yoccoz, N.G., Forckhammer, M.C. & Hurrell,J.W. (1999) Common dynamic structure of Canadian lynx within threeclimatic regions. Science, 285, 1071–1073.
Stenseth, N.C., Shabbar, A., Chan, K-S., Boutin, S., Rueness, E.K., Ehrich, D.,Hurrell, J.W., Lingjærde, O.C. & Jakobsen, K.S. (2004) Snow conditions maycreate an invisible barrier for lynx. Proceedings of the National Academy ofSciences, USA, 101, 10632–10634.
van der Meer, J. & Smallegange, I.M. (2009) A stochastic version of theBeddington-DeAngelis functional response: modelling interference for afinite number of predators. Journal of Animal Ecology, 78, 134–142.
Vucetich, J.A. & Peterson, R.O. (2004) The influence of top-down, bottom-upand abiotic factors on the moose (Alces alces) population of Isle Royale.Proceedings of the Royal Society B: Biological Sciences, 271, 183–189.
Vucetich, J.A., Peterson, R.O. & Schaefer, C.L. (2002) The effect of prey andpredator densities on wolf predation. Ecology, 83, 3003–3013.
Werdelin, L. (1981) The evolution of lynxes. Annales Zoologici Fennici, 18, 37–71.
Wilmers, C.C., Post, E. & Hastings, A. (2007) The anatomy of predator–preydynamics in a changing climate. Journal of Animal Ecology, 76, 1037–1044.
Woods, S. (2006) Generalized Additive Models: An Introduction with R. Chapman& Hall, Boca Raton, Florida.
Zimmermann, B., Wabakken, P., Sand, H., Pedersen, H.C. & Liberg, O. (2007)Wolf movement patterns: a key to estimation of kill rate? Journal of WildlifeManagement, 71, 1177–1182.
Received 28 May 2008; accepted 3 March 2009 Handling Editor: Andre Gilburn
Supporting Information
Additional supporting information may be found in theonline version of this article:
Fig. S1. Map showing the study area in south-eastern Norway,and the demarcation of the regions (see Methods). In thenorthern region (dark grey shading indicates municipalitieswith kill rate data), snow cover is generally deep during winterand interannual variation is positively correlated with theNAO index. In the southern region (light grey shading indi-cates municipalities with kill rate data), snow cover is moreshallow and not related with the NAO index (see Methodssection of main document and Fig. S2).
Fig. S2. Correlation (r) between annual variation in meansnow cover (January–March) measured at climate stationsacross the study area and winter NAO value, plotted againstmean snow cover at the same stations. In general, there is apositive correlation between NAO value and snow cover inthe snow-rich northern areas (black circles), whereas there isno, or only a weak, correlation in snow poor areas in south(open circles). In the analysis of the effect of NAO onobserved kill rates, we differentiated between these regions(see Methods section in the main document and Fig. S1).
Please note: Wiley-Blackwell are not responsible for thecontent or functionality of any supporting informationsupplied by the authors. Any queries (other than missingmaterial) should be directed to the corresponding author forthe article.