ClarkeThesis2022.pdf - FLEX
176
Reproductive behaviours, drivers of activity, and effects of wildlife tourism on yellowtail kingfish (Seriola lalandi) in southern Australia Reproduced with permission from Andrew Fox (Rodney Fox Shark Expeditions) By Thomas Michael Clarke (BSc. Mar Biol, Hons) Thesis Submitted to Flinders University for the degree of Doctorate of Philosophy College of Science and Engineering September 2021
-
Upload
khangminh22 -
Category
Documents
-
view
0 -
download
0
Transcript of ClarkeThesis2022.pdf - FLEX

Reproductive behaviours, drivers of activity, and effects of wildlife tourism on yellowtail
kingfish (Seriola lalandi) in southern Australia
Reproduced with permission from Andrew Fox (Rodney Fox Shark Expeditions)
By
Thomas Michael Clarke (BSc. Mar Biol, Hons)
Thesis Submitted to Flinders University for the degree of Doctorate of Philosophy
College of Science and Engineering September 2021

i
CONTENTS
THESIS SUMMARY .................................................................................................................................... III
DECLARATION ............................................................................................................................................. V
AUTHOR CONTRIBUTIONS, PERMITS AND FUNDING ................................................................... VI
OTHER PAPERS OR CONTRIBUTIONS ............................................................................................. VIII
ACKNOWLEDGEMENTS .......................................................................................................................... IX
LIST OF FIGURES ....................................................................................................................................... XI
LIST OF TABLES ...................................................................................................................................... XIII
...................................................................................................................................................14
General Introduction .....................................................................................................................................14
1.1 Movement and behavioural ecology: Connections between animals and the environment ...............15
1.2 Large pelagic fishes in the Anthropocene ..........................................................................................16
1.3 Tracking movements and behaviours of mobile fauna .......................................................................18
1.4 Wildlife tourism: An industry on the rise ...........................................................................................20
1.5 Study species and region ....................................................................................................................22
1.6 Research objectives ............................................................................................................................26
...................................................................................................................................................29
Using tri-axial accelerometer loggers to identify spawning behaviours of large pelagic fish ......................29
2.1 Abstract ..............................................................................................................................................30
2.2 Introduction ........................................................................................................................................30
2.3 Methods ..............................................................................................................................................33
2.4 Results ................................................................................................................................................42
2.5 Discussion ..........................................................................................................................................49
2.6 Conclusions ........................................................................................................................................52
...................................................................................................................................................53
Investigating the effects of shark tourism on the daily residency and movements of a non-focal pelagic fish ................................................................................................................................................................53
3.1 Abstract ..............................................................................................................................................54
3.2 Introduction ........................................................................................................................................54
3.3 Materials & Methods ..........................................................................................................................56
3.4 Results ................................................................................................................................................61
3.5 Discussion ..........................................................................................................................................69
3.6 Conclusions ........................................................................................................................................72
...................................................................................................................................................73
Influence of shark tourism on the activity and physiological status of a non-focal pelagic fish ..................73
4.1 Abstract ..............................................................................................................................................74
4.2 Introduction ........................................................................................................................................74
4.3 Methods ..............................................................................................................................................77
4.4 Results ................................................................................................................................................81

ii
4.5 Discussion ..........................................................................................................................................88
4.6 Conclusions ........................................................................................................................................91
...................................................................................................................................................92
Environmental drivers of yellowtail kingfish activity across south-eastern Australia inferred through a national network of acoustic tracking arrays ................................................................................................92
5.1 Abstract ..............................................................................................................................................93
5.2 Introduction ........................................................................................................................................93
5.3 Methods ..............................................................................................................................................96
5.4 Results ..............................................................................................................................................102
5.5 Discussion ........................................................................................................................................114
5.6 Conclusions ......................................................................................................................................118
.................................................................................................................................................120
General discussion ......................................................................................................................................120
6.1 Thesis overview ................................................................................................................................121
6.2. A new method to identify spawning behaviour of large pelagic fish ..............................................121
6.3. Implications for wildlife tourism to consider mobile non-target pelagic species ............................124
6.4 Physiological responses of pelagic ectotherms in a variable and changing environment ................127
6.5 Management implications ................................................................................................................130
6.5 Conclusions ......................................................................................................................................132
BIBLIOGRAPHY .........................................................................................................................................134
APPENDIX ...................................................................................................................................................156

iii
THESIS SUMMARY
Understanding the behaviours and physiology of free-ranging animals, and the ecological processes
driving them is a fundamental goal of studies in ecology. However, insights into these behaviours and
responses to human impacts are poorly understood for large-bodied pelagic fish, despite these species being
ecologically and economically important. Yellowtail kingfish (Seriola lalandi, family Carangidae) can be
used as a model species to develop techniques to identify ecologically-important behaviours and the effects
of anthropogenic pressures on the movements and physiology of large pelagic fishes. This thesis aimed to
examine kingfish spawning behaviours, impacts of wildlife tourism, and drivers of activity in southern
Australia.
Accelerometers and a machine learning model were used to describe behavioural classes of captive kingfish
based on 624 hours of accelerometer data paired with visual observations. The model was subsequently used
to predict behaviours from eight free-ranging kingfish to identify naturally-occurring reproductive
behaviours (Chapter 2). Paired with environmental information and geographic location, my results show
that accelerometers and machine learning provide an opportunity to identify spawning aggregations, and
advise the implementation of spatial management efforts of large pelagic fish, when required.
The effects of feeding during white shark cage-diving tourism on kingfish residency and space use (Chapter
3), along with activity and physiological status (Chapter 4) were assessed through acoustic tags fitted with
accelerometer sensors over two years. Kingfish were residential to the cage-diving site, with individuals
detected up to 79% of days. Daily time spent at the site increased by ~27% when operators were present, and
individuals were 62% closer to food-based compared to acoustic-attractants. Kingfish activity and burst
events also increased during operations, by 18% and 60% respectively. However, I found that physiological
condition of kingfish at the tourism site (measured using bioelectrical impedance analysis) was similar to
individuals from eastern Australia that were not exposed to wildlife tourism (n = 113). Therefore,
behavioural changes from tourism-interactions did not reflect a decrease in physiological status, suggesting
that consumption of food-based attractant may be compensating for raised energetic expenditure.
A national network of acoustic-tracking receivers was used to identify environmental drivers of activity from
65 kingfish throughout south-eastern Australia (Chapter 5). Generalised Linear Mixed Models revealed that
activity increased with temperature and was inversely correlated with moon illumination, with variable
responses to tide height and time of day. Additionally, I demonstrated that continental-scale acoustic
networks can be used to not only identify large-scale movements of individuals, but also evaluate activity
over long-term and large-scale datasets.
Overall, kingfish provided a model species to showcase the power of multiple electronic tags to reveal
important behaviours and environmental drivers of large pelagic fish energetics. My results make an original
contribution by identifying the reproductive behaviours and describing the movements of kingfish in

iv
southern Australia, and by developing widely-applicable techniques suitable across large pelagic fishes
globally. In a time of shifting and unstable marine climates, and human-induced pressures, identifying
drivers of movements and activity of large pelagic fish is essential to detect shifts and to employ effective
and adaptable management strategies.

v
DECLARATION
I certify that this thesis does not incorporate without acknowledgment any material previously submitted for
a degree or diploma in any university; and that to the best of my knowledge and belief it does not contain any
material previously published or written by another person except where due reference is made in the text.
Signed....................................................
Date: 17/09/2021

vi
AUTHOR CONTRIBUTIONS, PERMITS AND FUNDING
The following outlines the author contributions and acknowledgements for each chapter:
Chapter 2
T Clarke, S Whitmarsh and C Huveneers were involved in the conception and design of the
research. T Clarke was responsible for data collection, analysis, and interpretation of the research data. S
Whitmarsh and C Huveneers contributed to data collection and earlier drafting of the manuscript. J
Hounslow, A Gleiss and N Payne aided with analysis and significantly contributed to revisioning drafts of
the manuscript.
This chapter has been published as follows:
Clarke TM, Whitmarsh SK, Hounslow JL, Gleiss AC, Payne NL, Huveneers C (2021) Using tri-axial
accelerometer loggers to identify spawning behaviours of large pelagic fish. Movement Ecology 9:1-14
I thank staff from Cleanseas Aquaculture Hatchery, Arno Bay, who assisted with captive kingfish trials.
Volunteers from the Southern Shark Ecology Group at Flinders University assisted in capture and tagging of
free-ranging kingfish at the Neptune Islands. The white shark tourism operators: Rodney Fox Shark
Expeditions, Calypso Star Charters, and Adventure Bay Charters staff and crew provided ongoing support
and in-kind contributions, facilitating field work at the Neptune Islands. Commercial scale fishers assisted
with the capture and tagging of kingfish in Coffin Bay.
Chapter 3
T Clarke, S Whitmarsh, and C Huveneers were involved with the conception and design of the
research, and acquisition of field data. T Clarke was responsible for analysis and interpretation of research
data. R Dwyer, V Udyawer and H Pederson substantially aided to the analysis and interpretation of the data.
All authors were involved in drafting and revising drafts of the chapter.
This chapter has been published as follows:
Clarke TM, Whitmarsh SK, Dwyer RG, Udyawer V, Pederson H, Huveneers C (2022) Effects of shark
tourism on the daily residency and movements of a non-focal pelagic teleost. Marine Ecology Progress
Series, doi: https://doi.org/10.3354/meps13998
I would like to acknowledge the white shark cage-diving operators: Rodney Fox Shark Expeditions, Calypso
Star Charters, and Adventure Bay Charters, including all staff and crew who facilitated and assisted field
work. I also thank J. Dennis, J Davey, and other volunteers from Flinders University who assisted with
sampling kingfish and servicing acoustic receiver arrays.

vii
Chapter 4
T Clarke, S Whitmarsh, and C Huveneers were involved with the conception and research design. T
Clarke, S Whitmarsh, L Meyer, J Dennis, and C Huveneers were involved in acquisition of South Australian
field data. C Champion provided body condition measurements from New South Wales kingfish. N Payne
and H Pederson provided substantial assistance with analytical design. All authors were involved in drafting
and revising earlier versions of the chapter.
I would again like to thank all crew and staff from white shark cage-diving operators: Rodney Fox Shark
Expeditions, Calypso Star Charters, and Adventure Bay Charters who assisted with sample collection. I also
thank J Davey for assisting with field work at the Neptune Islands.
Chapter 5
T Clarke, S Whitmarsh, N Payne, and C Huveneers were involved with the conception and study
design. T Clarke, J Davey and C Huveneers were involved with kingfish sample collections from South
Australia. T Clarke, C Huveneers, J Rizzari, and D Ierodiaconou were responsible for sample collections in
Victoria. F Jaine assisted with extraction of environmental parameter data. S Brodie, M Taylor, and P
Butcher provided kingfish activity measurements from New South Wales. All authors contributed to drafting
revised versions of the work, and contributed to interpretation of findings.
I thank B Butson and his commercial scale-fishing crew for assistance with field work in Coffin Bay, and the
ongoing assistance from white shark tourism operators at the Neptune Islands. Thank you to A Biggs, J
Dennis and M Lloyd who aided with collection of acoustic receiver arrays.
Permitting and funding
Fish handling and sampling procedures were conducted in accordance with Flinders University
Animal Ethics Committee approval E467-18. Activities occurring within South Australian Marine Parks
were performed in accordance with approval from the Department for Environment and Water Marine Parks
Research Activity permit MR00132-1-V. Seine netting in Coffin Bay was done in accordance with protocols
detailed in Ministerial Exemption permit ME9903059.
Funding was provided by Holsworth Wildlife Research Endowment (2019 and 2020) and Biology Society of
South Australia Research Grant (2018). Thomas Clarke was supported by the Australian Government
Research Training Program Scholarship.

viii
OTHER PAPERS OR CONTRIBUTIONS
I was also able to contribute to all of the following papers during my thesis period:
Clarke, T. M., Whitmarsh, S. K., Fairweather, P. G., & Huveneers, C. (2019). Overlap in fish assemblages
observed using pelagic and benthic baited remote underwater video stations. Marine and Freshwater
Research, 70:870-880.
Meyer, L., Apps, K., Bryars, S., Clarke, T. M., Hayden, B., Pelton, G., Simes, B., Vaughan, L.M.,
Whitmarsh, S.K. and Huveneers, C., (2021). A multidisciplinary framework to assess the sustainability and
acceptability of wildlife tourism operations. Conservation Letters, e12788.
Huveneers, C., Jaine, F.R., Barnett, A., Butcher, P.A., Clarke, T.M., Currey-Randall, L.M., Dwyer, R.G.,
Ferreira, L.C., Gleiss, A.C., Hoenner, X. and Ierodiaconou, D., (2021). The power of national acoustic
tracking networks to assess the impacts of human activity on marine organisms during the COVID-19
pandemic. Biological Conservation, 256:108995.
Bates, A. E., Primack, R. B., Duarte, C. M., & PAN-Environment Working Group. (2021). Global
COVID-19 lockdown highlights humans as both threats and custodians of the environment. Biological
Conservation, in press.

ix
ACKNOWLEDGEMENTS
Firstly, thank you to my supervisor Charlie Huveneers, for your continual guidance, support, and
genuine interest in all aspects of this project and life away from research. Your drive and passion are
contagious, and I can’t thank you enough for pushing me to achieve the best out of myself as a scientist.
Thank you for always taking the time to help, either through revising drafts (at absurd hours of the day or
night), assisting with field work, or arranging meetings to direct the best route moving forward. I promise
that one day I will finally use en and em dashes appropriately and won’t need you to correct them. You’ve
provided me with so many skills and lessons that go well beyond just scientific education, and I’m
unreservedly grateful to have had you as a supervisor.
To Sasha Whitmarsh, thank you for your non-stop support throughout the last several years. From forcing
you to come fishing in Tom Thumb without cover in the wind and rain, to revising endless drafts, and
pushing me to schedule regular meetings to ensure progress, you’ve been such a big part in my scientific and
personal development, and I can’t thank you enough.
To Nick Payne, it’s been a pleasure getting to know you and talking all things tagging. I truly appreciate the
huge effort you made to come over to Australia in the early stages of this PhD, which kickstarted my project
and taught me invaluable knowledge about biologging. I’m glad we got to work together in person before the
borders closed, and I’m sure we will team up again in the future. To Peter Fairweather, thank you for your
priceless knowledge and always encouraging me to think outside of the box. The skills that you left me with
are something that I will continue to appreciate. The college, lab, and research as a whole are poorer off
without you here.
Throughout this PhD, I was lucky enough to collaborate and meet with many great researchers which have
each left me with valuable knowledge and scientific skills. To Jenna Hounslow and Adrian Gleiss, thank you
for the skills that you provided me in the realm of accelerometers and machine learning. You are both so
approachable and easy-going, and managed to turn complex practices into something that I genuinely
enjoyed. Chapter 2 would have been a great deal more difficult without your partnership. Ross Dwyer, Vinay
Udyawer, Fabrice Jaine, and Hugh Pederson; thank you for continually lending an ear and always being
available to chat acoustic tracking, modelling, and big fish. Thank you to Curtis Champion, Alistair Hobday,
and CSIRO Coasts and Ocean Research team for facilitating body condition measurements by loaning the
BIA tool. You all streamlined the process of learning complex modelling techniques, and I’m grateful for the
working relationships that we have forged.
To the Southern Shark Ecology Group, thank you for your friendship and support over the past 3.5 years.
Lauren, Maddie, Chloe, Christine, Dennis, and to all others who have been involved throughout the project,
thank you for making the lab such an enjoyable place to come each day. Mods, thanks for your help and
good times in Coffin Bay. Josh Dennis and Josh Davey (Fish Boys), I can’t thank you enough for your

x
mateship. You’ve always gone above and beyond to help me out in any way possible, and made the long
days (and nights) in the field, unlanded fish, broken pluggers, and back-to-back field trips so much more
enjoyable. I couldn’t think of better mates to work alongside, and I can’t wait for more (mis)adventures in
the future.
To my family and friends who have provided endless support and encouragement, thank you for everything.
To my parents, your continual support of all my endeavours has been endless. It would have been easy to
disregard my aspirations as a kid to somehow turn my love of fish and diving into a career, but you’ve
always encouraged me to pursue my passions and grab opportunities with both hands and I thank you
unconditionally. Kimberley, thank you for your unwavering support and encouragement during my PhD.
You’ve always been there to listen to my frustrations and rants, and never turned down the opportunity to
help me in any way possible (even if it means getting into freezing water). I’m grateful that we could go
through this PhD voyage together.
Thank you to everyone along the way for any discussion, field assistance, coding chats, or fishy
conversations, I thoroughly appreciate it all.

xi
LIST OF FIGURES
Figure 1.1. Location of the a) Neptune Islands Group within South Australia, b) Sanctuary Zone boundaries (green), and locations of cage-diving anchorages (blue) at the North (c) and South (d) Neptune Islands Groups between August 2018 – August 2020. .................................................................................................25
Figure 1.2. Examples from the Neptune Islands Group showing a) shark cage-diving operations, b) diverse fish assemblages (provided by Rodney Fox Shark Expeditions), and c), d) kingfish interacting with food-based attractant (provided by Calypso Star Charters). .....................................................................................26
Figure 1.3. Overall objective and aims of thesis with each chapter’s contribution to those aims ....................28
Figure 2.1. Number of 1-second increments spent performing observed behaviours for captive kingfish tagged with accelerometers, (n = 6, recording time = 115 hours C1, 2, 3; 93 hours C4, 5, 6). Swim behaviours are not included as the same amount of time swimming (1,500 seconds) was used for each individual. .........................................................................................................................................................43
Figure 2.2. Characteristics of observed behavioural classes from captive kingfish tagged with accelerometer loggers. Mean values shown as red diamonds. Black horizontal bars represent median values. Black boxes encompass the interquartile range, and vertical black lines represent the maximum and minimum values. ...45
Figure 2.3. Example of one free-ranging kingfish reproductive event predicted from the random forest model (a), and total duration in seconds of b) reproductive behaviours and c) spawning events predicted from free-ranging yellowtail kingfish individuals at the Neptune Islands (blue) and Coffin Bay (green) as predicted from a supervised machine learning model. Time of day is indicated by dawn (orange), dusk (orange), day (yellow) and night (grey). .................................................................................................................................48
Figure 3.1. Map of the Neptune Islands Group showing a) operator anchoring locations (acoustic attractant in blue, food-based attractant in red); and b) kingfish positions during daylight hours (60-minute center of activities). Horizontal dashed line represents ‘north-’ and ‘south-eastern’ sides of the island. VR2AR acoustic receivers are presented as black triangles. See Figure 1.1 for location of the Neptune Islands in South Australia. ................................................................................................................................................58
Figure 3.2. Weekly summaries of operator and kingfish residency and space use at the Neptune Islands Group Marine Park; a) number of operating days; b) water temperature (temp) ± se; c) number of fish detected; d) residency ± se; and e) space use (BBKUD-50 ± se). ....................................................................63
Figure 3.3. Interaction between the predicted a) time spent and b) distance to the closest cage-diving operator with temperature at the Neptune Islands across temperatures from Generalised Linear Mixed Models. Operating types using food-based attractant are shown in red, acoustic attractant in blue, and no operator days in black. ....................................................................................................................................................66
Figure 3.4. Estimated hourly COAs of kingfish (red) in relation to the location of cage-diving operators (blue). Positions on days when no operators were present (a), on days when operators were using acoustic (b, c) or food-based (d, e) attractant (b, d) shows days when operators where anchored on the northern side of North Neptune Island; (c, e) shows days when operators were anchored on the southern side. Percentage of positions occurring on the respective half of the island during operator treatments are provided. ..................68
Figure 4.1. Predicted activity (m/s2; marginal means) from Generalise Linear Mixed Model of kingfish at the Neptune Islands with different tourism operator types (food-based = red, acoustic attractant = blue, no operator days = black). .....................................................................................................................................82
Figure 4.2. Predicted activity (marginal means ± SE) from Generalised Linear Mixed Model of kingfish at the Neptune Islands showing the interaction between same (solid) and different (dashed) sides of the island with food-based (red) and non-food-based (black) operations across sampling temperature. Panels represent different times of day. .......................................................................................................................................83
Figure 4.3. Predicted burst ratio (events exceeding 4m/s2/total daily detections) from Generalised Linear Mixed Model of kingfish on days with food-based operators (red) and no food-based attractant present (black). ..............................................................................................................................................................84
Figure 4.4. a) Residency of acoustically-tagged kingfish at the Neptune Islands, with individuals sampled using Bioelectrical Impedance Analysis in dark blue, unmeasured individuals in light blue. Crosses represent

xii
date that body condition measurements were taken. b) Body condition (electrical phase angle) of kingfish sampled at the Neptune Islands during food-based provisioning operations. Blue circles represent acoustically-tagged individuals, black circles are untagged kingfish. The horizontal dashed line (y = 28) represents value above which kingfish are considered in good body condition based on phase angle measurements from 113 kingfish sampled throughout eastern Australia (provided from Champion et al. 2020b). ..............................................................................................................................................................87
Figure 5.1. Map showing location of acoustic receiver arrays (red circles) in a) Australia, state subsets showing acoustic installations for b) New South Wales and c) South Australia (Coffin Bay inset), and detailed installation arrays in d) Sydney Harbour and e) Coffin Bay. ..............................................................98
Figure 5.2. a) Estimated means of kingfish activity at different installations in south-eastern Australia. Mean values shown as red diamonds. Black horizontal bars represent median values. Black boxes encompass the interquartile range, and vertical black lines represent the maximum and minimum values. b) marginal means (predicted values ± SE) of kingfish activity in response to environmental variables from Generalised Additive Mixed Model. ..................................................................................................................................105
Figure 5.3. Residency of kingfish in Coffin Bay between November 2019 – January 2021, colours correspond to interconnected areas of the system. Darker colours represent areas closer to the mouth (entrance of the system), lighter colours represent areas further into the estuary. .........................................106
Figure 5.4. Generalised Linear Mixed Model predicted effects (marginal means) of a) residency time in each area, and b) core (pink: 50%) and extent (purple: 95%) space use ± standard error space use in response to temperature of kingfish in Coffin Bay. ...........................................................................................................109
Figure 5.5. Monthly core (pink: 50%) and extent (purple: 95%) of space use in Coffin Bay. Grey areas represent land. Acoustic receivers shown as black circles. Number represents number of fish detected in the array that month ..............................................................................................................................................111
Figure 5.6. Activity of kingfish predicted from Generalised Additive Mixed Model in different areas of Coffin Bay through interactions with environmental parameters. Darker colours represent areas closer to the mouth of the estuary, lighter shades are areas further into the system. ..........................................................113
Figure 6.1. Graphical representation of overall thesis, summarising chapter results, thesis outcomes, and thesis conclusion. ............................................................................................................................................133

xiii
LIST OF TABLES
Table 2.1. Description of yellowtail kingfish (Seriola lalandi) used for captive (C) and free-ranging (FR) accelerometer trials. Free-ranging kingfish were not checked for sex (shown as ‘-‘). Location refers to tagging location. ...............................................................................................................................................35
Table 2.2. Definitions and formulae for each predictor variable measured through the accelerometer data ...37
Table 2.3. Definitions of behaviours coded from video footage that were attributed to acceleration data. Behaviours that were initiated by researchers are marked with *. ...................................................................39
Table 2.4. Performance metrics of behavioural classes from captive kingfish calculated from random forest algorithm on the test data (30% overall). Grey boxes represent number of correctly allocated behaviour increments from test data set. ...........................................................................................................................47
Table 3.1. Summary of models estimating effects of cage-diving operations (weekly operator days; opdays) on kingfish a) residency and b) space use (BBKUD-50). df, degrees of freedom; AICc , Akaike's information criterion corrected for small sample size; ΔAICc , difference in AICc between the current and the top-ranked model; wAICc, model probability; Rm, marginal (fixed effects) R2; Rc, conditional (fixed and random effects) R2. .....................................................................................................................................................................64
Table 3.2. Summary of models estimating effects of operator type (type) on daily time spent and proximity of kingfish to the closest operator vessel. df, degrees of freedom; AICc , Akaike's information criterion corrected for small sample size; ΔAICc , difference in AICc between the current and the top-ranked model; wAICc , model probability; Rm, marginal (fixed effects) R2; Rc, conditional (fixed and random effects) R2. .67
Table 4.1. Summary of models to estimate effects of cage-diving operations on kingfish activity. df, degrees of freedom; AICc , Akaike's information criterion corrected for small sample size; degrees of freedom (df); log-likelihood (logLik); ΔAICc , difference in AICc between the current and the top-ranked model (ΔAICc); wAICc , model probability; Rm, marginal (fixed effects) R2; R, conditional (fixed and random effects) R2. Only the top 5 ranked models are presented for table clarity. ..........................................................................85
Table 5.1. Summary of Generalised Additive Mixed Model covariates used to test environmental drivers of kingfish activity in south-eastern Australia. ...................................................................................................101
Table 5.2. Summary of top five models estimating effects of environmental parameters on kingfish activity in south-eastern Australia. df, degrees of freedom; AICc, Akaike information criterion corrected for small sample size; ΔAICc , difference in AICc between the current and the top-ranked model; wAICc , model probability; Rm, marginal (fixed effects) R2; Rc, conditional (fixed and random effects) R2. ........................104
Table 5.3. Summary of Generalised Linear Mixed Model estimating effects of month on residency time (time within each area) in Coffin Bay. df, degrees of freedom; AICc, Akaike information criterion corrected for small sample size; ΔAICc, difference in AICc between the current and the top-ranked model; wAICc , model probability; Rm, marginal (fixed effects) R2; Rc, conditional (fixed and random effects) R2. ........................107
Table 5.4. Summary of Generalised Linear Mixed Model estimating effects of month on kingfish core (BBKUD – 50) and extent (BBKUD – 95) space use at Coffin Bay. df, degrees of freedom; AICc , Akaike's information criterion corrected for small sample size; ΔAICc , difference in AICc between the current and the top-ranked model; wAICc , model probability; Rm, marginal (fixed effects) R2; Rc, conditional (fixed and random effects) R2. ..................................................................................................................................108
Table 5.5. Summary of the top five models estimating effects of environmental drivers on kingfish activity in Coffin Bay. df, degrees of freedom; AICc , Akaike's information criterion corrected for small sample size; ΔAICc , difference in AICc between the current and the top-ranked model; wAICc , model probability; Rm, marginal (fixed effects) R2; Rc, conditional (fixed and random effects) R2. ..................................................112
Table 6.1. Yellowtail kingfish (Seriola lalandi) recreational and commercial management methods in different state jurisdictions of Australia. ........................................................................................................131

General Introduction

15
1.1 Movement and behavioural ecology: Connections between animals and the environment
Animal movements occur across multiple scales and can influence the density of individuals
and populations, regulate community and ecosystem structure, and influence evolutionary processes
and patterns of biodiversity (Dickinson et al. 2000, Nathan 2008). Species’ movements can be directly
influenced by a variety of environmental factors, which are often related to reproductive behaviours or
resource needs (Harrington & Taylor 1990, Skov et al. 2013), e.g., acquisition of food (Shivik et al.
1996, McIntyre & Wiens 1999, Marable et al. 2012), predation avoidance (Hoey & McCormick 2004,
Hammerschlag et al. 2017), and mating opportunities (Chapman et al. 2012, Espinoza et al. 2016,
Robertson et al. 2018). Consequently, the movements of animals are a fundamental aspect of
ecological and evolutionary processes, with the study of the size and use of core areas (i.e. home
range size, habitat association; McNab 1963, Börger et al. 2006) and extent of movements (residency
versus distant migrations; Simpfendorfer et al. 2002, Pedersen et al. 2011) revealing important
information of how animals interact with their surrounding environment (Nathan 2008, Hussey et al.
2015). An understanding of animal movements and of factors influencing them, can therefore
contribute crucial knowledge of a species ecology, as these behaviours account for large portions of
energetic budgets, and underpin critical components of behavioural characteristics and processes, e.g.,
feeding and reproduction.
Estimating the rates at which free-ranging animals expend energy is also essential to basic and applied
ecology, and to understand how individuals physiological responses are influenced by natural (Briggs
& Post 1997, Payne et al. 2013, Watanabe et al. 2019) and human-induced effects (Christiansen et al.
2013, Barnett et al. 2016, Huveneers et al. 2018). The energetic cost associated with behaviours
innately influences individual fitness, measured via survival, growth, and reproductive success
(Brown et al. 2004, Cooke et al. 2004a), and so provides critical information to understand ecological
processes (Cooke et al. 2004a). The study of animal behaviours and activity in relation to ecological
and environmental constraints (i.e., behavioural ecology; Danchin et al. 2008, Davies et al. 2012), is
often investigated in parallel to movement ecology when attempting to characterise a species’
movement strategies and physiological responses in the context of its surrounding environment. Given
that the movements and behaviours of animals are so intrinsically linked to fitness of individuals and
populations, there is a need to identify and study ecologically-important behaviours and energetic
strategies to infer responses to biotic and abiotic factors in nature.
Impacts from human activities on natural ecosystems have become so pervasive that the current epoch
of immense human influence has come to be known as the Anthropocene (Crutzen 2006, Lewis &
Maslin 2015). Anthropogenic stressors have been identified across almost every ecosystem, with
putative impacts on the functional diversity of organisms (e.g., terrestrial vertebrates and
invertebrates; Dirzo et al. 2014, coral reefs; Woodhead et al. 2019, marine megafauna; Pimiento et al.

16
2020), dramatic changes in biogeography (Worm & Tittensor 2011, Darling & Carlton 2018, Tucker
et al. 2018), and a need to revise conservation targets in the face of climate change (Hannah et al.
2002, Rilov et al. 2020). Yet, while there is strong evidence of anthropogenic stress, identifying and
quantifying causative human impacts with the intention of developing appropriate intervention
strategies is extremely difficult given the almost overwhelming pace at which change is occurring
(Halpern et al. 2008, Hobday & Lough 2011, Schimel et al. 2013, but see:, Nabe‐Nielsen et al. 2018).
One of the greatest challenges affecting animal movements, is the increasing level of human impacts
on ecosystems, which drives ecological change and has the potential to lead to widespread disruptions
of animal movement and behavioural ecology (Halpern et al. 2008, Doherty et al. 2021). For example,
changes as a result of anthropogenic impacts can create physical barriers that reduce the organisms
movements and contract movement ranges (Worm & Tittensor 2011, Tucker et al. 2018), reduce prey
abundance leading to increased foraging efforts (Graham et al. 2005), or disturb natural conditions
that leads to changed behaviour, therefore reducing foraging performance and fitness (DeRuiter et al.
2013, Francis & Barber 2013). Identifying the factors that contribute to an animal’s movement and
behaviour is important for predicting change and prioritising effective management or conservation
strategies for ecological communities under threat (e.g., Hobday et al. 2011, Doherty & Driscoll 2018,
Katzner & Arlettaz 2019). For instance, movement data from animal tracking studies have been used
to predict overlap of terrestrial mammal migration routes with proposed oil and gas developments
(Sawyer et al. 2009), manage interactions between modelled avian movements with human
recreational activities and wind turbine locations (Braunisch et al. 2011, Perona et al. 2019), and
modelled habitat preference of marine (Hobday et al. 2011) and freshwater fishes (Lamouroux et al.
1999) to inform spatial fisheries management decisions. The capacity to quantify and describe the
movements of animals in the Anthropocene is therefore essential to strategies effective conservation
and management and detecting changes in species ecology attributed to human impacts.
1.2 Large pelagic fishes in the Anthropocene
Pelagic ecosystems are highly dynamic environments, characterised by complex relationships
between physical, chemical, and biological phenomena. Movements and behaviours of individuals
within these ecosystems are therefore largely regulated by the interactions between environmental
conditions, and physiological needs of species (Humston et al. 2000, Bakun 2006, Robinson et al.
2015). Large-bodied pelagic fishes are influential predators in pelagic ecosystems that have high
ecological, economic, and social value (Hobday et al. 2009, Macfadyen et al. 2016, van Denderen et
al. 2018). They are dominant predators which occupy upper positions in food webs, regulating lower
trophic levels through direct and indirect interactions (Bornatowski et al. 2018, Roesti et al. 2020), in
addition to playing an important role as prey for larger marine animals (e.g., Grainger et al. 2020).
These interactions can influence the functioning within ecosystems (Kitchell et al. 2006, Baum &
Worm 2009), and so the prevalence of large pelagic fish in these environments is crucial to the

17
functioning and energy flow within pelagic food webs. In addition to their role as ecologically-
important mesopredators, large pelagic fishes contribute substantial economic benefits through
commercial and recreational fishing, and social significance to local coastal communities (Henry &
Lyle 2003, Macfadyen et al. 2016). Large pelagic fishes are more profitable for fisheries than their
smaller-bodied counterparts (Sethi et al. 2010), with financial contributions from global tuna fisheries
alone contributing $42 billion annually (Macfadyen et al. 2016). However, despite their importance
for the structuring of pelagic ecosystems and significant socio-economic value, stocks of many large
pelagic species are declining, and have been the focal point of many concerns about sustainability and
performance of management strategies (Ceo et al. 2012, Pons et al. 2018). Although, development of
robust and adaptable management strategies has displayed the potential to promote recovery of
overfished stocks of pelagic fishes (e.g., tuna and billfishes; Pons et al. 2017, Pons et al. 2018). This
further emphasises the importance for knowledge about the movement and behavioural ecology of
these species during the Anthropocene to prioritise effective conservation measures (Galland et al.
2018).
Movements of large pelagic fish are diverse and widespread across open ocean and coastal
environments, with the capacity to occur over large spatial scales (hundreds to thousands of
kilometres; Gillanders et al. 2001, Galuardi et al. 2010, Hobday et al. 2016). The high mobility of
these species throughout pelagic habitats and association with coastline environments often results in
high levels of spatial overlap with human interactions, resulting in increasing pressures from
anthropogenic effects (Halpern et al. 2008, Petrik et al. 2020). Impacts from these interactions can be
either direct, through exploitation via fishing pressures leading to species being categorised as
overfished or unsustainable (Pauly & Watson 2003, Ceo et al. 2012), or indirect impacts leading to
alterations in range and space use via decreased mobility and dispersal, or changes to habitat
preferences (Worm & Tittensor 2011, Champion et al. 2018, Pecl et al. 2019). While research has
aimed to address pressures on economically-important species (e.g., tuna, billfishes, sharks) due to
ongoing and increasing fishing pressures (Crossin et al. 2017, Pons et al. 2018), and climate change
(Robinson et al. 2015, Petrik et al. 2020), there has been comparatively less focus into human-induced
drivers of movement on less frequently targeted pelagic species (e.g., carangids, mackerel) due to
changing environmental conditions.
With reproductive behaviour being one of the key animal behaviours driving population dynamics,
spawning events also influence the fitness and survival of large pelagic fishes (Rowe & Hutchings
2003, Bakun & Parrish 1991). Fertilisation success, transport of fertilised eggs and larvae, food
availability, and suitable conditions for growth of offspring ultimately regulate the recruitment
success of spawning events and the abundance of populations (Cury & Roy 1989). For example,
reproductive behaviours of small pelagic species is reliant on spawning events in optimal conditions

18
triggered by boundary currents and upwelling intensity (Roy et al. 1992, Brochier et al. 2013), or
timing with tidal cycles (Foster 1987), whereas spawning events in unfavourable conditions
potentially lead to poor larval growth and survival (Lasker 1981, Bergenius et al. 2002). This is
particularly problematic in marine ecosystems that are under increasing pressures from shifting
climatic conditions and associated alterations to environmental conditions. Yet, the patchy
distribution, diversity of reproductive strategies, and extensive movements of large pelagic fishes,
paired with logistical difficulties associated with working in the marine environment have made the
study of naturally occurring spawning behaviours of many large pelagic species challenging (Costa
2015, Richardson et al. 2016). As a result, there is a need for effective, and efficient methods to
predict geographic location and timing of spawning aggregations of large pelagic fish in the wild.
1.3 Tracking movements and behaviours of mobile fauna
Functional understandings about the movements and behaviours of free-ranging (i.e., wild)
pelagic fishes and the factors driving them largely relies on the capacity to accurately track
individuals as they move through the natural environment. Early studies of pelagic fish movements
used mark-recapture approaches; where species are caught, tagged, and released so that they can be
identified when recaptured later (e.g., Pepperell 1985, Schaefer & Fable Jr 1994, Gillanders et al.
2001). The effectiveness of this method has continued to grow through collaborative efforts between
recreational anglers, commercial fishing sectors, and researchers, by means of engagement in
cooperative tagging programs which increase spatial scale and sampling efforts (e.g., Pepperell 1985,
Saul & Holdsworth 1992, Begg et al. 1997, Gunn & Block 2001, Block 2005, Hutson et al. 2007).
While these studies provide coarse estimates of movement patterns and distribution, they are limited
to only providing knowledge of tagging location and recapture site, failing to account for movements
and behaviours between captures. Since the early 1990s, electronic tagging has emerged as a more
effective technique to remotely monitor the detailed movements, behaviours, and physiology of
marine animals as they move freely through the environment, and provide crucial information for
management and policy makers (Cooke et al. 2004a, Crossin et al. 2017, Taylor et al. 2017).
Acoustic telemetry has advanced as a tool to remotely monitor the fine-scale habitat use and extent of
species’ movements (Hussey et al. 2015, Heupel et al. 2018). This method involves placing electronic
transmitters (tags) on animals, that autonomously transmit data to logging or relay-receiver stations to
identify the presence of an animal as it moves from one location to another (Arnold & Dewar 2001,
Hussey et al. 2015). Early applications of acoustic tracking in the marine realm required researchers to
follow the sounds emitted from tags using a directional hydrophone, with positions recorded regularly
(e.g., every minute, hour) to represent the movement tracks of individuals (e.g., Holland et al. 1985,
Block et al. 1992a, Morrissey & Gruber 1993). These studies led to more effective and efficient
tracking of mobile marine fauna, revealing the potential to remotely monitor movements of animals as

19
they move freely through the environment, however, were limited in temporal and spatial resolution
as it was required that researchers actively tracked individuals near-continuously. In more recent
years, technological advancements in battery engineering, and software and hardware development
have enabled acoustic tracking to expand in applicability, through fixed, strategically-positioned
acoustic receiver stations that passively monitor the movements of tagged animals without requiring
researchers to actively track individuals (Brousseau et al. 2004, Egli & Babcock 2004). The
incorporation of remotely-positioned receivers and collaborative tracking systems (e.g., Brodie et al.
2018, Hoenner et al. 2018, Lédée et al. 2021) has broadened the geographical and temporal extent of
studies of marine animal movements, permitting characterisation of horizontal and vertical
movements over broad spatial (meters to thousands of kilometres) and temporal scales (hours to
several years) (Orbesen et al. 2008, Brodie et al. 2018). Additionally, long-term tracks of individuals
movements can be combined with extensive environmental variables (e.g., temperature, depth, light
levels) and reveal movements in response to changing conditions (Donaldson et al. 2014). Insights
into movements collected via acoustic telemetry have resultingly contributed to design and
management of marine protected areas around core ranges of movements, seasonal closures of
fisheries, and assessing the impacts of fisheries management strategies (Crossin et al. 2017, Taylor et
al. 2017). Movement information collected through acoustic telemetry therefore allows studies to
accurately track the movement and distribution of animals in response to surrounding conditions and
variables, and provides researchers with the ability to assess the implications on human interactions
and environmental parameters on the movements of highly mobile large pelagic fishes.
In addition to tracking movement ecology of marine animals, electronic tags can be used to identify
infrequent behaviours and interactions that occur at scales too small (spatially or temporally) to be
detected through tracking methods such as acoustic telemetry. Tri-axial accelerometer loggers
(accelerometers) can infer behaviours of unrestrained animals by measuring characteristics of
acceleration and body position (e.g., Watanabe et al. 2008a, Moreau et al. 2009, Broell et al. 2012).
The applicability of accelerometers to describe behaviours based on acceleration provides a novel
opportunity to characterise naturally-occurring behaviours of large pelagic fishes, such as spawning
events, which have previously been difficult to study and often require destructive sampling methods
(e.g., euthanising and gonad removal; Yasuda et al. 2013) or direct observations (Sakaji et al. 2018).
Additionally, advanced statistical software and programming capabilities has enabled researchers to
model these complex datasets and use described behavioural profiles to remotely predict naturally-
occurring behavioural classes in the wild (Carroll et al. 2014, Ladds et al. 2017). In addition to
deducing the occurrence of ecologically-important behaviours, acceleration features collected through
accelerometers provide a useful method to estimate energetic status of free-ranging animals, through
the association of accelerations with oxygen consumption, and resulting metabolic rate (Wilson et al.
2006, Gleiss et al. 2011a, Murchie et al. 2011). Acceleration measured through these tools allows

20
researchers to estimate field-based measures of metabolic rate and energy expenditure (Wilson et al.
2006, Murchie et al. 2011), and identify effects of environmental conditions (Whitney et al. 2007,
Gleiss et al. 2011b, Payne et al. 2016), or anthropogenic stressors on energy budgets and resulting
health and fitness of these individuals (Fitzpatrick et al. 2011, Barnett et al. 2016, Huveneers et al.
2018). Overall, different scales of electronic tagging can be combined to complement one another and
identify and describe drivers of movements (telemetry), behaviours, and activity budgets
(accelerometers). Together, these tools provide a unique opportunity to be used in unison and address
the complex movement and behaviour ecology of large pelagic fishes, identify the timing and
occurrence of important behavioural events, and help to identify consequences from human impacts
on natural movements.
1.4 Wildlife tourism: An industry on the rise
The wildlife tourism industry is one form of human-animal interactions that is growing
globally, steadily increasing in the number and diversity of operations and targeted species (Orams
2002, Trave et al. 2017). As a result, interacting with wildlife is one of the main drivers influencing
travel decisions, particularly within Australia, where 43% of international visitors seek experiences
through wildlife tourism (Ballantyne et al. 2009). Globally, estimates of participants are between 79
and 440 million (Moorhouse et al. 2015, Trave et al. 2017), with the industry expected to further
double in the next 50 years (French et al. 2011, Trave et al. 2017, note: prior to COVID-19 crisis
halting international travel). These operations contribute substantial economic benefits, accounting for
9% of global gross domestic product (Moorhouse et al. 2015), in addition to also supporting local
businesses and infrastructure (Scheyvens 1999, Huveneers et al. 2017a). Wildlife tourism also
supports conservation through preservation of natural resources by supporting the creation and
maintenance of protected areas, financially contributing to governing organisations, and providing
education opportunities (Higginbottom & Tribe 2004, Apps et al. 2018). Additionally, wildlife
tourism can provide psychological benefits to participants (Muloin 1998, Curtin & Kragh 2014)
through providing a unique opportunity to connect tourists with wildlife in a situation that otherwise
would not be possible (Curtin & Kragh 2014).
The sustainability and success of wildlife tourism ventures are dependent on reliable and consistent
encounters with animals. However, ensuring predictable and dependable interactions with wild
animals for tourists can be challenging, and is exacerbated by many focal species being highly mobile,
elusive, and vastly dispersed (Knight 2009, Gallagher & Huveneers 2018). Wildlife tourism operators
therefore often use various forms of attractant to maximise the likelihood of reliable and up-close
encounters for tourists (i.e., provisioning; Meyer et al. 2021b). Some of the attractants used do not
involve direct feeding; e.g., minced fish or fish oil (also called berley or chum; Bruce & Bradford
2013, Clarke et al. 2013), bait inside a crate or box that cannot be accessed by the focal animals

21
(Dicken & Hosking 2009, Fitzpatrick et al. 2011), visual stimuli to attract natural prey sources and
subsequently focal animals (Osada 2010, Needham et al. 2017), or auditory stimuli to mimic the
vibrations of injured prey items (Rizzari et al. 2014). However, other types of wildlife tourism directly
feed the focal animals to draw them closer to tourists (direct feeding, e.g., Samuels et al. 2000,
Brookhouse et al. 2013, Pini-Fitzsimmons et al. 2018). Many studies have shown that provisioning
from wildlife tourism can lead to short- and long-term impacts (Orams 2002, Higginbottom et al.
2003, Meyer et al. 2021a) by generating unnatural conditions, inherently altering the environmental
and ecological cues that control natural feeding and movement patterns of animals. Direct feeding in
particular has been shown to have various effects including on abundance and species composition
(Clarke et al. 2013, Brunnschweiler et al. 2014, Whitmarsh 2019), site occupancy (Brookhouse et al.
2013, Bruce & Bradford 2013, Huveneers et al. 2013), swimming behaviours and movements
(Laroche et al. 2007, Fitzpatrick et al. 2011, Pini-Fitzsimmons et al. 2018), and physiological
responses (Barnett et al. 2016, Huveneers et al. 2018) of focal animals targeted by tourism, and is
therefore an important concern for development of sustainable tourism management frameworks
(Francis & Barber 2013, Meyer et al. 2021a).
Despite feeding being intended for focal species, indirect or unintentional feeding of non-focal (i.e.,
non-targeted) individuals can also occur (e.g., Laroche et al. 2007, Brena et al. 2015, Rizzari et al.
2017). In the terrestrial realm for example, non-focal species which are indirectly provisioned can
consume up to 98% of food intended for game wildlife (Donalty et al. 2003, Inslerman 2006). While
some of these operations have designed food-based attractant that is inaccessible to focal species (e.g.,
in a box; Dicken & Hosking 2009, Fitzpatrick et al. 2011) or withdrawn before feeding (Huveneers et
al. 2017b, Meyer et al. 2020), non-focal species are often still able to access food sources meaning
that feeding of these species might even be more ubiquitous than for focal species. As a result, effects
of indirect feeding from wildlife tourism on non-focal species can mirror, and even exacerbate those
effects on targeted individuals. For example, shark tourism using baits and berley has been shown
alter dietary profiles (Meyer et al. 2021b), increase parasite infestation (Vignon et al. 2010), and
change behaviour of movements (Milazzo et al. 2006, Rizzari et al. 2017) of non-target fish and ray
species, as well as and changing community assemblages at tourism sites (Whitmarsh 2019). However
despite the potential for negative implications from wildlife tourism on non-focal individuals, only
7% of studies assessing the effects of wildlife provisioning examined non-focal or ecosystem-wide
effects (Trave et al. 2017). These interactions of wildlife provisioning with non-focal species are often
not accounted for by tourism management frameworks and policies (Higginbottom et al. 2003,
Gallagher & Huveneers 2018, Meyer et al. 2020) and could have implications on populations by
disrupting important natural movements and ecosystem processes.

22
1.5 Study species and region
Yellowtail kingfish (Seriola lalandi, kingfish, Valenciennes 1833) is a large-bodied (up to 2.5
m, ~70 kg) pelagic carangid, distributed throughout temperate and sub-tropical waters of the southern
hemisphere and northern Pacific (Gomon et al. 2008, Ben-Aderet 2018). Kingfish typically occur in
large schools, especially around deep rocky reefs and seamounts (Hobday & Campbell 2009),
offshore islands (Brookhouse et al. 2013), and adjacent sandy areas of coastal waters in depths of up
to 300 m, but on some occasions entering shallower estuaries (Gomon et al. 2008, Brodie 2016). Due
to their large size and fighting ability, kingfish have established a strong reputation among
recreational anglers, in addition to contributing towards expanding finfish aquaculture industry with
4,000 t annual production with a market value of $60 million/year (Donohue et al. 2021). This
industry is estimated to further increase to reach 5,000 tonnes of production by 2022 (Poortenaar et al.
2001, Symonds et al. 2014). Kingfish are seasonal, pelagic-broadcast spawners that are triggered by
increasing water temperature expected to coincide with natural conditions between spring/summer
months (Gillanders et al. 1999, Poortenaar et al. 2001, Moran et al. 2007). However, despite intensive
research into optimal spawning conditions for kingfish in a captive environment for production
purposes (Gillanders et al. 1999, Poortenaar et al. 2001, Moran et al. 2007), natural spawning
behaviours and aggregations of kingfish in the free-ranging environment have not been identified, yet
provide crucial information about the frequency, timing, and location for these events.
In Australia, kingfish are distributed across the southern coastline from Queensland to Western
Australia and eastern Tasmania. Genetic analyses have revealed on large south-eastern population
found from Queensland (QLD), New South Wales (NSW), Victoria (VIC), South Australia (SA),
Tasmania (Tas) and New Zealand (Patterson & Swearer 2008, Miller et al. 2011, Green et al. 2020),
which is genetically distinct from kingfish in Western Australia. As such, Australian kingfish stocks
are categorised into two jurisdictions: Eastern (Commonwealth, NSW, QLD, SA, Tas and VIC) and
Western Australian stocks (FRDC 2020). Despite catches of kingfish recorded across several states,
the ‘Eastern Australian’ biological stock is assessed using data primarily from the NSW fishery, with
most recent commercial catch estimates of 76 t in 2018–19 (FRDC 2020), compared to 2.89 t from the
Western Australian jurisdiction. Recreational catch estimates are expected to exceed commercial
catch, with Eastern Australian catch estimated at 129 t in 2017–18, and 7 t in Western Australia
(Murphy et al. 2020). The persistence of kingfish along Australia’s south-eastern coast is driven by
oceanographic condition regulated by temperature, with increased prevalance along the east coast
during summer and Autumn months in response to shelf incursions from the East Australian Current
(EAC; Brodie et al. 2015, Champion et al. 2018). Though, climate-driven shifts increasing the
poleward extent of the EAC (Hobday & Lough 2011, O’Kane et al. 2011) are predicted to lead to a
decline in temporal persistence of kingfish in northernmost areas of their eastern distribution, leading
to southward shifts in the distribution along eastern Australia (Champion et al. 2018).

23
In spite of being a favoured target among seafood consumers , mark-recapture is popular among
anglers targeting kingfish, accounting for 10% of all tagged fish in the cooperative New South Wales
(NSW) Department of Fisheries Game Fish Tagging Programme since 1973, in addition to being the
most abundantly recaptured species (34% of all recaptures, 8% recapture rate; Gillanders et al. 2001,
Hutson et al. 2007). Movement data from these tags support previous descriptions of one distinct
south-eastern population, with substantial long-range and bi-directional movements between SA and
NSW ranging up to 1,500 km (Gillanders et al. 2001, Hughes & Stewart 2020), as well as between
eastern Australia and New Zealand (Saul & Holdsworth 1992, Gillanders et al. 1999). These large-
scale movements mostly occur in large individuals (> 1000 mm TL), however high levels of site-
fidelity is also observed for both large and smaller individuals with a majority of recaptured fish
occurring within 50 km of the original tagging location (Gillanders et al. 2001, Hutson et al. 2007,
Hobday & Campbell 2009), in addition to individuals frequently recaptured at the same location as
the original tagging even after 442 days at liberty (Gillanders et al. 2001). While tagging efforts from
these cooperative tagging programs have revealed large-scale movements of kingfish, a majority of
the information about kingfish movements is based on tag-and-recapture data with limited
information about movements and activity between capture events, leaving detailed understanding of
spawning aggregations and energetic strategies poorly understood (Baxter 1960, Pepperell 1985, Saul
& Holdsworth 1992).
The Neptune Islands Group (Ron and Valarie Taylor Marine Park) in South Australia is a group of
temperate offshore granite islands situated 60–70 km south-east of Port Lincoln (Figure 1.1a). The
Neptune Islands are comprised of the North and South Island groups, situated ~12 km apart (Figure
1.1b), and accommodate breeding and feeding opportunities for many local and migratory sea birds
(e.g., Osprey Pandion haliaetus, Cape Barren goose Cereopsis novaehollandiae), Australian sea lions
(Neophoca cinerea) and long-nosed fur seals (Arctocephalus forsteri), as well as hosting diverse
communities of fishes (Whitmarsh 2019, Figure 1.2b). The importance of the islands for such a
diverse range of transient and residential taxa resulted in its inclusion in the South Australian Marine
Parks program implemented in 2014, including a no-take sanctuary zone (North Neptune Islands),
Habitat Protection Zone (South Neptune Islands), and Restricted Access Zones (North and South
Neptune Islands; Figure 1.1b).
The Neptune Islands Group is additionally home to Australia’s only white shark (Carcharodon
carcharias) cage-diving tourism operation (Figure 1.2), where three operators run charters to the
island groups with the objective of ensuring a close encounter for tourists with sharks. While
operators are permitted to visit both North and South Neptune Islands, tourism mostly occurs at the
North Neptune Islands (85% of operating days; C Huveneers unpublished data), where operators
typically anchor in the bay on the south-eastern side of the islands, and on the northern side of the
24
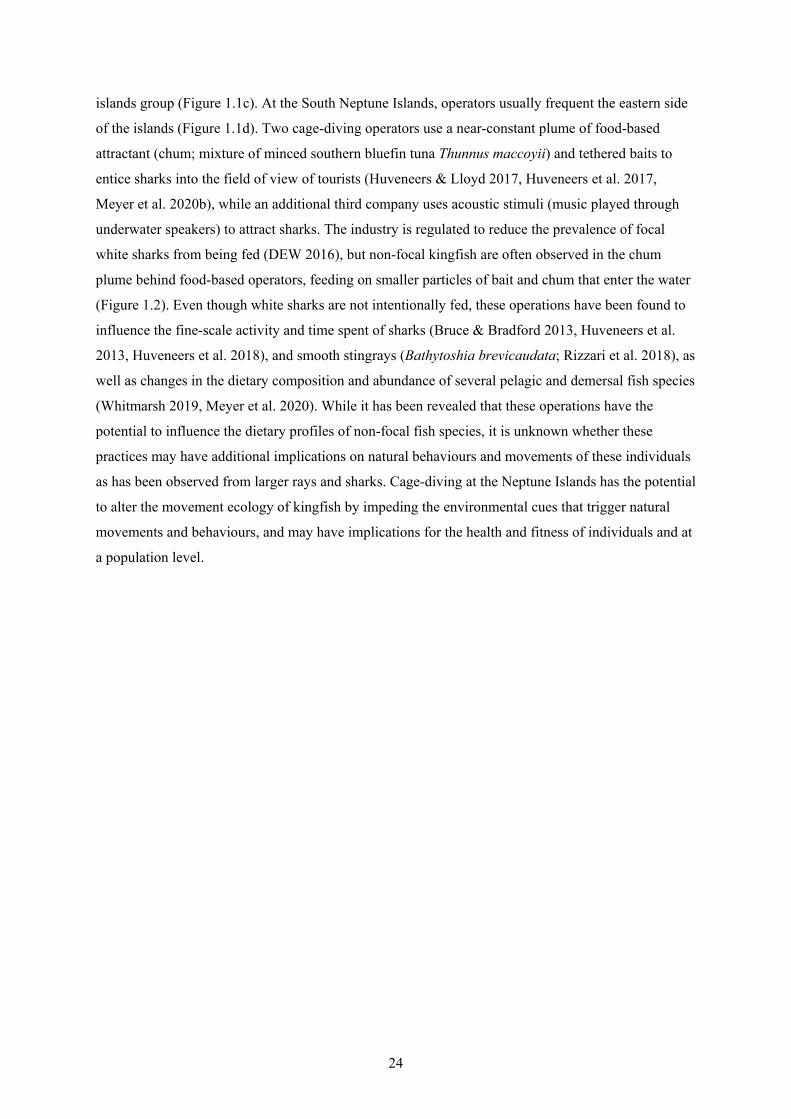
islands group (Figure 1.1c). At the South Neptune Islands, operators usually frequent the eastern side
of the islands (Figure 1.1d). Two cage-diving operators use a near-constant plume of food-based
attractant (chum; mixture of minced southern bluefin tuna Thunnus maccoyii) and tethered baits to
entice sharks into the field of view of tourists (Huveneers & Lloyd 2017, Huveneers et al. 2017,
Meyer et al. 2020b), while an additional third company uses acoustic stimuli (music played through
underwater speakers) to attract sharks. The industry is regulated to reduce the prevalence of focal
white sharks from being fed (DEW 2016), but non-focal kingfish are often observed in the chum
plume behind food-based operators, feeding on smaller particles of bait and chum that enter the water
(Figure 1.2). Even though white sharks are not intentionally fed, these operations have been found to
influence the fine-scale activity and time spent of sharks (Bruce & Bradford 2013, Huveneers et al.
2013, Huveneers et al. 2018), and smooth stingrays (Bathytoshia brevicaudata; Rizzari et al. 2018), as
well as changes in the dietary composition and abundance of several pelagic and demersal fish species
(Whitmarsh 2019, Meyer et al. 2020). While it has been revealed that these operations have the
potential to influence the dietary profiles of non-focal fish species, it is unknown whether these
practices may have additional implications on natural behaviours and movements of these individuals
as has been observed from larger rays and sharks. Cage-diving at the Neptune Islands has the potential
to alter the movement ecology of kingfish by impeding the environmental cues that trigger natural
movements and behaviours, and may have implications for the health and fitness of individuals and at
a population level.

25
Figure 1.1. Location of the a) Neptune Islands Group within South Australia, b) Sanctuary Zone
boundaries (green), and locations of cage-diving anchorages (blue) at the North (c) and South (d)
Neptune Islands Groups between August 2018 – August 2020. Source:
https://www.marineparks.sa.gov.au
a)
c) d)
b)
Arno Bay
Mount Drummond
North Neptune Islands
South Neptune Islands

26
Figure 1.2. Examples from the Neptune Islands Group showing a) shark cage-diving operations, b)
diverse fish assemblages (provided by Rodney Fox Shark Expeditions), and c), d) kingfish interacting
with food-based attractant (provided by Calypso Star Charters).
1.6 Research objectives
The main objective of this study was to increase the understanding of the reproductive behaviour,
and activity patterns of yellowtail kingfish in southern Australia, and investigate the potential impacts
of wildlife tourism on kingfish. This objective stems into three overarching aims to:
1) Characterise and identify courtship and spawning behaviour of kingfish
2) Assess the effects of white shark cage-diving tourism on kingfish
3) Identify drivers of kingfish activity across south-eastern Australia
To address these aims, I have compiled four thesis chapters (excluding this introductory [1] and
general discussion [6] chapters, each with specific aims and goals which link to the overall objective
of this study (Figure 1.3).
a) b)
c) d)

27
Thesis structure
Chapter 1 provided an introduction about movement and behaviour ecology, the study species, and
wildlife tourism, in particular the white shark cage-diving industry in South Australia. Interactions of
kingfish with cage-diving tourism are introduced, highlighting the potential for negative implications
on kingfish movements and physiology. This chapter represents a brief introduction to the key topics
included in the thesis as more details are provided within each data chapter.
Chapter 2 used accelerometer loggers and machine learning to identify spawning behaviours of
kingfish. This included 1) characterising and describing behaviours of kingfish in a captive
environment, and 2) subsequently applied behavioural profiles on unseen data from free-ranging
kingfish to detect naturally-occurring reproductive behaviours. This chapter fits within aim 1 (Figure
1.3) and has been published in Movement Ecology.
Chapter 3 examined the influence of white shark tourism on the movements of kingfish at the
Neptune Islands. Kingfish residency and space use was assessed over a two-year period, and the
weekly number of operating days and type of operator attractant (food-based, acoustic, no operator)
was tested to measure the effects of tourism on kingfish movements. Findings from this chapter align
with aim 2 and is under review in Marine Ecology Progress Series.
Chapter 4 assessed the influence of white shark tourism on the physiological responses of kingfish.
Activity of kingfish was compared during times that food-based, acoustic, or no operators were
present to reveal effects of chumming operations on activity. Body condition (measured through
Bioelectrical Impedance Analysis) of kingfish at the Neptune Islands was assessed to further divulge
if feeding on a provisioned food source was reflected by poorly physiologically conditioned
individuals. These findings relate to aim 2.
Chapter 5 accumulated data of kingfish activity from their distribution across south-eastern Australia
through a national network of acoustic tracking receivers to reveal environmental drivers of kingfish
activity, and included a case-study of activity patterns over a small spatial scale (~120 km2) within a
semi-enclosed embayment system in Coffin Bay. This chapter built on the understanding of kingfish
energetic strategies between interconnected sites from one largely distributed population, and aligns
with aim 3.
Chapter 6 synthesised results from chapters 2 – 5 and discussed major findings and inferences for the
wider understanding of kingfish ecology in southern Australia. This highlights the power of multiple
electric tagging methods to reveal reproductive behaviours and energetic budgets of large pelagic fish,
and emphasises the potential effects from shark tourism on non-focal mobile species.

28
Figure 1.3. Overall objective and aims of thesis with each chapter’s contribution to those aims

29
Using tri-axial accelerometer loggers to identify spawning behaviours of large
pelagic fish
Published as: Clarke TM, Whitmarsh SK, Hounslow JL, Gleiss AC, Payne NL,
Huveneers C (2021) Using tri-axial accelerometer loggers to identify spawning
behaviours of large pelagic fish. Movement Ecology 9:1-14

30
2.1 Abstract
Tri-axial accelerometers have been used to remotely describe and identify in situ behaviours
of a range of animals without requiring direct observations. Datasets collected from these
accelerometers (i.e., acceleration, body position) are often extensively large, requiring development of
semi-automated analyses to classify behaviours. Marine fishes exhibit many ‘burst’ behaviours (e.g.,
feeding, escape, etc.) with high amplitude accelerations that are difficult to interpret and differentiate.
This has constrained the development of accurate automated techniques to identify different burst
behaviours occurring naturally, where direct observations are not possible. Here, I developed a trained
random forest machine learning algorithm based on 624 hours of accelerometer data from six captive
yellowtail kingfish (Seriola lalandi) during spawning periods. Five distinct behaviour classes (swim,
feed, chafe, escape, and courtship) were described, which were used to train the model based on 58
predictive variables. Overall accuracy of the model was 94%. Classification precision of each
behavioural class was variable; predictive accuracy (F1 scores) ranged from 0.48 (chafe) – 0.99
(swim). The model was subsequently applied to accelerometer data from eight free-ranging kingfish,
and all behaviour classes described from captive fish were predicted by the model to occur, including
nineteen events of courtship behaviours, ranging from 3 seconds to 108 minutes in duration. Our
findings provide a novel approach of applying a supervised machine learning model on free-ranging
large pelagic fish, which has previously been predominantly constrained to direct observations of
behaviours, and not predicted from free-ranging individuals. Additionally, our findings identify
timing and location of typically ambiguous spawning and courtship behaviours of a large pelagic fish
as they naturally occur.
2.2 Introduction
In the past decade, the field of biologging has increasingly enabled remote monitoring of
many aspects of the lives of some of the most enigmatic animals (Block 2005, Rutz & Hays 2009,
Hussey et al. 2015). Devices such as tri-axial acceleration data loggers (hereafter accelerometers)
allow for remote in situ assessments of animal movements and are often used in the marine realm
(Shepard et al. 2008a; Suzuki et al. 2009). Accelerometers measure acceleration across three axes
(e.g., dorso-ventral [heave], anterior-posterior [surge], and lateral [sway] axes; Shepard 2008a) to
generate a time-series characterising movement and activity. Accelerometers, therefore, provide an
opportunity to describe acceleration profiles related to movement and energetic expenditure in an
environment that is otherwise difficult to directly observe (Foerster et al. 1999, Tsuda et al. 2006,
Moreau et al. 2009). Additionally, accelerometers also provide an opportunity to quantify kinematic
profiles of animals, enabling the inference of unique behavioural classes based on distinctive
characteristics. For example, accelerometer data may be used in combination with spatio-temporal
data (e.g., depth, geographic location, season) to identify ecologically-important behaviours, such as

31
spawning (Tsuda et al. 2006, Sakaji et al. 2018, Schlenker et al. 2021), or feeding (Tanoue et al. 2012;
Brownscombe et al 2014; Gleiss et al. 2013; Kadar et al. 2020). Remotely inferring occurrences of
such behaviours from accelerometer data also allows for further insight into movement strategies
(Gleiss et al. 2011a, Wang et al. 2015, Watanabe et al. 2019), and energy budgets (Ladds et al. 2017,
Lear et al. 2020) of animals in free-ranging environments. Studies have used visual observations of
animals in nature to relate acceleration profiles to particular behaviours such as different modes of
travelling and feeding/drinking in Adélie penguins Pygoscelis adeliae, domestic cat Felis catus
(Watanabe et al. 2005), and polar bears Ursus maritimus (Pagano et al. 2017). However, validation
from time-synchronised accelerations with direct observations, referred to as ground-truthing, is
required to accurately infer behaviours from accelerometer data and create labelled datasets. Other
research efforts have employed animal-borne video to ground-truth behaviours of free-ranging
animals, time-synchronised to accelerometer data (Watanabe & Takahashi 2013, Watanabe et al.
2019), but validating behaviour in situ using animal-borne cameras is limited due to cameras either
being too large for small organisms, short battery life incapable of recording for long periods, or
insufficient lighting to accurately infer some behaviours that occur during less illuminated hours of
the day.
To characterise fine-scale behaviours of taxa beyond binary classification (e.g., active vs inactive),
studies using accelerometers are required to use high temporal resolution sampling rates (Noda et al.
2013, Noda et al. 2014). Consequentially, datasets collected from accelerometers are exceptionally
large, consisting of millions of rows of data, ands a result, manually analysing accelerometer datasets
is time-consuming and often one of the limiting tasks of behavioural studies using these devices
(Müller & Schrader 2003, Shepard et al. 2008a). To overcome these limitations, more recent studies
have used machine learning (ML) algorithms to train models based on patterns in the collected data
allowing predictions from unseen data (Valletta et al. 2017, Brewster et al. 2018, Hounslow 2018,
Hounslow et al. 2019). Machine learning approaches address these complex, large datasets that would
otherwise be intractable using classical statistical techniques (Leos‐Barajas et al. 2017, Valletta et al.
2017). In particular, supervised machine learners, such as random forest models, are trained on a
labelled data-sets to recognise unlabelled or ‘unseen data’ (Valletta et al. 2017). Random forest (RF)
algorithms are an ensemble classifier designed to mitigate the issues associated with overfitting in
decision trees through using multiple unpruned classification or regression trees (Breiman 2001).
These RF models are particularly popular with behavioural classification data (e.g., Nathan et al.
2012, Wang et al. 2015, Pagano et al. 2017, Hounslow et al. 2019) because of they often produce
higher classification accuracy than other models (e.g., k-nearest neighbour, support vector machine,
naïve Bayes, adaptive boosting; Breiman 2001, Tatler et al. 2018, Mansbridge et al. 2018). Random
Forest models can handle thousands of mixed categorical and continuous predictions with robustness
to outliers (Valetta et al. 2017) and have relative ease of execution. In the case of behavioural

32
classification of acceleration data, training an RF model to predict from unseen data means first
ground-truthing to ‘train’ the model, by confirming the behaviour of the animal carrying an
accelerometer to match acceleration data with the corresponding behaviour class of the individual
(Watanabe et al. 2005, Shepard et al. 2008b). Thus, a well-trained algorithm can predict the behaviour
of a wild (‘unseen’) individual across ecologically-important times or areas.
Understanding courtship and spawning behaviours of large pelagic fish is vital to predict population
responses to environmental and fishing pressures, and develop suitable and adaptable management
strategies (Rowe & Hutchings 2003, Sakaji et al. 2018). However, observations of spawning
behaviours of most free-ranging fish in pelagic environments is often difficult due to their patchy
distribution, large-scale movements, occurrence in low light conditions, and the logistical difficulties
associated with working in the marine environment. In marine fishes, accelerometers have been used
to characterise a number of behavioural classes such as foraging (Brownscombe et al. 2014), feeding
(Tanoue et al. 2012, Kawabata et al. 2014), and escape behaviours (Noda et al. 2013) based on
acceleration profiles. Accelerometers have also been used to characterise complex reproductive
behaviours, such as chum salmon (Oncorhynchus keta; Tsuda et al. 2006), flounder (Paralichthys
olivaceus; Yasuda et al. 2013), and greater amberjack (Seriola dumerili, Sakaji et al. 2018), as well as
showing potential to describe mating strategies of nurse sharks (Ginglymostoma cirratum; Whitney et
al. 2010), by confirming reproductive status via either destructive gonad sampling or direct visual
observations. Random forest models developed through data collected via accelerometers therefore
offer an opportunity to build on this past research to address the typically challenging task of
detecting natural spawning events by training a predictive model based on acceleration characteristics
during visually-confirmed events, and subsequently identify naturally-occurring reproductive events
on unseen data from free-ranging individuals.
Yellowtail kingfish (Seriola lalandi; hereafter referred to as kingfish) is a large migratory pelagic
carangid, found globally in temperate and sub-tropical coastal waters (Gomon et al. 2008). In addition
to being commercially and recreationally targeted, kingfish are highly palatable and as a result, part of
an expanding aquaculture sector in Japan and southern Australia (PIRSA 2014). Access to kingfish in
a captive aquaculture environment has permitted the description of optimal conditions and kinematics
during reproductive behaviours (Gillanders et al. 1999, Moran et al. 2007). Spawning most often
occurs between dawn and dusk (A Miller; pers. comms, Moran et al. 2007), and typically involves
long periods of high-speed pursuit of a female by one male, interspersed with stalling, nipping, and
touching of bodies followed by the male nipping the female gonoduct, presumably to initiate
spawning (Moran et al. 2007). Kingfish movement and body position during these events should,
therefore, be suitably different to other behaviours, providing a unique opportunity to use
33
accelerometers to characterise acceleration profiles of spawning behaviours (Sakaji et al. 2018) and
develop a RF model to identify these behaviours from free-ranging kingfish.
This study aimed to describe and quantify behaviours of captive kingfish by developing a supervised
ML algorithm (RF model) based on ground-truthed accelerometer data, and subsequently apply this to
data collected from free-ranging kingfish to identify naturally-occurring spawning behaviour.
2.3 Methods
Captive kingfish trials
Captive trials were undertaken at the Cleanseas Aquaculture Hatchery Facility, in Arno Bay, South
Australia (33°56.222‘S, 136°34.4918‘E; Figure 1.1). Here, sexually mature broodstock kingfish are
housed in large tanks for the purpose of ongoing production runs and egg stocking. Broodstock
kingfish in production tanks are originally sourced from wild kingfish caught locally in South
Australia. Between August 2018 and February 2019, two tracking sessions where undertaken where
six captive brood stock kingfish (three each tracking session - 1 female and 2 males; Table 2.1) were
tagged with tri-axial accelerometer data loggers (Technosmart Europe srl, Axy-Depth, Rome, Italy)
scheduled to record at 50 Hz and ± 4G. Loggers were programmed to record in three-axes of
acceleration; surge (x), heave (y), sway (z) corresponding to dorsal-ventral, anterior posterior, and
lateral orthogonal body axes.
Fish were removed from holding tanks and placed inside a ‘knock-out tub’ containing AQUI-S (10
ppm) for tagging. The logger was affixed to a padded base plate, which was attached to the fish by
passing 45 kg breaking-strain monofilament leader through the dorsal musculature using sharpened
embroidery needles, which had the monofilament passed through the eyelet and held secure firmly
with a small crimp and heat shrink tubing. The monofilament was then cut to remove the needle and
passed through a padded button (one per strand of monofilament) to act as an anchor. To identify
tagged individuals, accelerometers were designed with different coloured buttons, different patterns
(for night-time), as well as different numbered base plates that could be identified through video
footage. Once the logger was secured, the fish was returned to the housing tank. A recovery period of
3 hours following tagging was allowed prior to trials to allow fish to resume regular behaviours.
Following trials, tagged individuals were recaptured, and loggers were manually removed.
Over 5-day periods, four video cameras (GoPro Hero 7 and Concord CCTV infrared cameras) were
placed inside the tank to enable constant recording over the trial period. Cameras were secured in
waterproof acrylic housings, while running from a charging power bank battery pack to allow cameras
to record for ~8-hour periods. Time on the video recording was synchronised to the same time as the
accelerometers, so that acceleration data could be directly related to the video footage for a given

34
point in time. Trials were carried out in regular production brood stock tanks to ensure natural
spawning events would occur, so there were 27 (tracking session 1) and 60 (tracking session 2)
additional untagged fish within each tank over the trial periods. Fish were fed to satiation twice per
day by spreading 1,400–2,000 g of pellet into the tank over 3 – 5 minutes. Escape behaviour was also
induced during the second tracking session and consisted of a 5-minute period where an extendable
pole was held inside the tank with the pole moving behind tagged fish and used to instigate an escape
behaviour until individuals were out of reach. Times of initiated feeding and induced escape
behaviour were noted for synchronisation with acceleration data. During winter months (April–
October; Trip 1) spawning in the tanks is initiated through manipulation of tank water temperatures,
but during warmer months (November – March; Trip 2) tanks are kept at ambient seawater
temperatures and spawning occurs naturally. As not all fish engage in spawning events within the
tank, confirmation of courtship from tagged individuals was required and obtained through direct
observation or video footage.
Free-ranging kingfish trials
Between October 2015 and November 2019, eight free-ranging kingfish (98 – 151 cm TL) were
caught and tagged with accelerometers (Little Leonardo, ORI400-D3GT, Tokyo, Japan or
Technosmart Europe srl, Axy-Depth, Rome, Italy) for 2–3 days (Table 2.1). An additional ninth
kingfish was tagged with an accelerometer that prematurely released after 2 hours and so was
excluded from the analysis. Only fish > 80 cm total length (TL) were tagged, as this is expected to be
the minimum size that both male and female kingfish are mature and to coincide with spawning
behaviours (Gillanders et al. 1999). Additionally, an effort was made to ensure that free-ranging fish
were of similar size to the tagged captive fish to minimise any potential influence of fish size on
acceleration profiles (Webb 1976, Webb 1978). Free-ranging fish (98 – 151 cm, mean = 122.9 cm
TL) in this study were, however, slightly larger than captive fish (90 – 105 cm, mean 96.5 cm TL).
Kingfish were tagged during the Austral spring and summer months to coincided with expected
natural spawning events, that are expected to be triggered by increasing water temperature and occur
between spring/summer months i.e., November through April (Gillanders et al. 1999, Poortenaar et al.
2001, Moran et al. 2007).

35
Table 2.1. Description of yellowtail kingfish (Seriola lalandi) used for captive (C) and free-ranging
(FR) accelerometer trials. Free-ranging kingfish were not checked for sex (shown as ‘-‘). Location
refers to tagging location.
Accelerometers were attached to free-ranging kingfish using the same protocol as detailed above
(section 2.1) but were modified to self-detaching recoverable packages, containing an accelerometer
(Axy-Depth, Technosmart Europe srl, Rome, Italy), radio transmitter (MM100, Advanced Telemetry
Systems Inc, Isanti, USA), and Smart Position and Temperature (SPOT) transmitting tag (258,
Wildlife Computers, Redmond, USA), and were deployed with corrodible links to allow for recovery
after 2–3 days. Logger packages (138–150 g, 15 x 4 x 5.5 cm) were designed to be as small and
streamlined as possible and of similar size to logger plates used in captive trials.
Fish ID Location Date tagged Sex Total length
(cm)
Logger recording time
(hours) C1 Arno Bay 21/08/2018 M 91 115
C2 Arno Bay 21/08/2018 F 105 115
C3 Arno Bay 21/08/2018 M 95 115
C4 Arno Bay 8/2/2019 M 90 93
C5 Arno Bay 8/2/2019 F 97 93
C6 Arno Bay 8/2/2019 M 101 93
FR1 Neptune Islands 28/10/2015 - 99 45.5
FR2 Neptune Islands 28/10/2015 - 98 37
FR3 Neptune Islands 30/10/2015 - 114 16.7
FR4 Neptune Islands 13/2/2019 - 120 10.7
FR5 Neptune Islands 15/2/2019 - 119 16.6
FR6 Coffin Bay 10/11/2019 - 151 51.2
FR7 Coffin Bay 10/11/2019 - 142 33.7
FR8 Coffin Bay 10/11/2019 - 140 30.3

36
Data analysis
Accelerometer data were downloaded and visually observed through IGOR Pro (WaveMetrics Inc.,
Lake Oswego, OR, USA, version 8.0.3) with add-on software Ethographer (Sakamoto et al. 2009).
Data from periods where fish could not be directly observed or identified from the video footage due
to low light conditions, or out of view of cameras were removed from further analysis.
Static acceleration (as a result of Earth’s gravitational field) and dynamic acceleration (representing
body movement) were calculated for all three acceleration axes (X, Y, and Z) to filter the dominant
signal caused by tail beating and body attitude, and to isolate behaviours with high amplitude
acceleration (Table 2.2, Wilson et al. 2006, Shepard et al. 2008b). Continuous wavelet
transformations were then applied to the lateral acceleration data (sway axis [Z] as a measure of tail
beating undulations; Rioul & Vetterli 1991, Sakamoto et al. 2009) to derive acceleration wavelets
representing amplitude (maximum displacement from equilibrium position) and cycle (stroke
frequency) of tail beat sequences. The vector of the three axes of dynamic body acceleration
(VeDBA) was calculated as a metric of activity level, whereby behaviours associated with increased
levels of activity and metabolic rate correspond to higher values of VeDBA (e.g., Qasem et al. 2012,
Broell et al. 2016; Ladds et al. 208; Lear et al. 2020). Pitch and roll values were calculated based on
orientation of the logger (Table 2.2). Absolute values for roll were used to represent the roll without
influence of directionality (i.e. -90 o and +90 o resulting in running mean average roll of 0 o, or
minimum value equalling 90o). A set of descriptive predictor variables was produced characterising
kingfish behaviour for subsequent ML classification (n = 64, Table 2.2), by calculating the mean,
standard deviation, skewness, kurtosis, minimum, and maximum for each of these values from 1
second increments (Shepard et al. 2008a) matched to known behaviour labels. Summarising
acceleration data into 1-second increments was chosen as longer increments would not encompass
short burst behaviours such as chafe (which only lasts 1–2 seconds; Hounslow 2018, Robert et al.
2009, Campbell et al. 2013), in addition to it not being possible to make sub-second manual
observations of behaviour.

37
Table 2.2. Definitions and formulae for each predictor variable measured through the accelerometer
data
Variable Formula Definition
Static acceleration Filtered 0.06, 0.6 1 second means for static acceleration
representing body posture in each axis
Dynamic acceleration Raw (g) – Static (g) 1 second means for dynamic
acceleration representing body
movement in each axis
Vector of Dynamic
Body Acceleration
√Dynamic (X axis)2 + Dynamic (Y
axis)2 + Dynamic (Z axis)2
Square root of the sum of squares of
absolute dynamic body acceleration in
each axis
Cycle Cycle for the dominant frequency
obtained through the continuous
wavelet transformation generated
spectrogram. Represents the inverse of
tail-beat frequencies.
Amplitude Amplitude for the dominant frequency
obtained through the continuous
wavelet transformation generated
spectrogram.
Pitch atan(X axis/(sqrt(Z axis*Z axis)+(Y
axis)*(Y axis))) *180/pi
Body inclination of the fish (Watanabe
et al. 2008b) during ascending (+) or
descending (-)
Roll atan2(Z axis, Y axis)*180/Pi Spinning movements of an individual
around the main axis of the fish
(Sfakiotakis et al. 1999). Absolute
values for roll were used to alleviate
influence of roll direction.

38
Standard deviation Standard deviation of static and
dynamic acceleration, VeDBA, pitch
and roll in each axis.
Skewness A measure of the symmetry of the
variable
Kurtosis A measure of the tail shape of the
variable
Minimum Minimum value of static and dynamic
acceleration, VeDBA, pitch and roll in
each 1 second increment
Maximum Maximum value of static and dynamic
acceleration, VeDBA, pitch and roll in
each 1 second increment
Time-series acceleration data were inspected to identify potential burst-behaviours. Behaviours that
exceeded ± 1 g acceleration in the sway axis (indicative of behaviours with high acceleration
amplitude associated with tail beat), had substantial changes in roll, or periods of rapid changes in
acceleration were inspected in the video footage. This conservative threshold was expected to be
sufficient to detect successful spawning events based on previous descriptions of spawning in Seriola
dumerili exceeding ± 2 g (Sakaji et al. 2018). Feed and escape behaviours were identified based on
events during times that fish were fed, or escape trials were undertaken. Behaviours were then coded
(using the Ethographer mask feature) as one of five behavioural classes observed from the video:
feeding, swim, escape, courtship, or chafe (Table 2.3).

39
Table 2.3. Definitions of behaviours coded from video footage that were attributed to acceleration
data. Behaviours that were initiated by researchers are marked with *.
Coded behaviour Definition
Feed* Between 1,400–2,000 g of pellet feed was dispersed into the tank from
the surface and fish were observed accelerating towards and consuming
pellets. Typically lasted 3–5 minutes, until pellets were exhausted.
Escape* Five trials per individual of 5-minutes in length where a researcher used
a long pole to initiate burst swimming behaviour by following tagged
fish with the pole until fish was out of reach. Only events where fish
were visually observed to react to the presence of the pole were
included as escape.
Courtship Included both typical chase preceding spawning and actual spawning
events, due to low sample size of visually confirmed spawning events (n
= 8). A typical chase was identified from the tagged individual(s)
chasing another kingfish by closely following behind or next to another
fish with increase in swim speed, often rubbing nose on the underside of
the body or nipping at pelvic or caudal fins (Moran et al. 2007).
Spawning was identified by a group of individuals (including tagged
fish) closely rubbing bodies, followed by large burst swimming by
involved individuals lasting <10 seconds, and with gametes observed in
the water column.
Chafe Individual rolls to face one side of the body to the surface either in mid-
water or to the bottom of the tank. Roll motion where dorsal side
contacts surface or substrate in an effort to remove unwanted parasites
or foreign bodies (Myrberg Jr & Gruber 1974, Hounslow 2018)
Swim Typical swim behaviours with no burst or roll events, steady lateral
undulatory locomotion (Maia et al. 2012, Hounslow 2018). 1,500
seconds of swimming behaviour was allocated during periods where
fish could be directly observed regularly swimming around the tank
with no bursts in acceleration amplitude observed. These periods were
allocated as five random, 5-minute periods with good visibility, and not
within 30 minutes of feed- or escape trials.

40
Development of a machine learning classification algorithm
Random forest classification was performed using the randomForest function from ‘randomForest’
package in R (version 1.1.453). Values from each predictor variable was pooled for all captive
individuals into a single dataset, before being randomly split into two datasets; 70% for training the
model and 30% as a test dataset to assess the performance of the model. This partitioning of data is
commonly used in machine learning applications to ensure a suitably sized test dataset, enabling high
accuracy of error estimates from acceleration data studies (Nathan et al. 2012, Sur et al. 2017). A
range of number of trees (ntree values) were tested starting at 500 and increasing in increments of 500
up to 2,000 trees. Additionally, the number of variables randomly sampled at each split (mtry) were
tested (in increments of 5, from 5 to 20) to assess influence on error rate of the model. It was deemed
that a ntree value of 1,000 with mtry default value (square root of the number of predictor variables)
was sufficient based on the low range of Out-Of-Bag (OOB) error variation (5.54%), that showed
minimal change when the number of trees increased beyond 1,000. An attempt was made to account
for the unbalanced size of behaviour class data (due to more frequently occurring behaviours) through
stratified sampling with equal probabilities (function: strata, package: ‘sampling’ version 2.8).
However, while this stratified sampling improved precision accuracy of behaviour classes with
smaller sample sized (e.g., chafe), precision of courtship class was decreased and so this function was
not included in the final model. The 64 predictor variables were checked for relative importance to the
overall class predictive performance of the classification model with the function ‘varImpPlot’ within
the ‘randomForest’ package in R, measures the mean decrease in overall accuracy if a predictor
variable is removed from the model (Figure S1) (Wang et al. 2015, Sur et al. 2017, Valletta et al.
2017).
Evaluation of model performance
Performance metrics were calculated from the RF confusion matrix as indicators of the performance
of the model for classifying kingfish behaviours (Chen et al. 2004, Brewster et al. 2018). A confusion
matrix was created using the confusionMatrix function from the ‘caret’ package in R (version 6.0.88).
This matrix provides a table of actual observations from each behaviour class (rows) versus the
behaviour class predictions of the model (columns). Performance metrics were calculated from the
true positive (TP), false positive (FP) and false negative (FN) observations determined by the
confusion matrix (Brewster et al. 2018). True positives are observations which have successfully been
assigned to the correct class by the model (Brewster et al. 2018). False Positives are observations
which have been incorrectly assigned to a behaviour class. False Negatives (FN) are values that
belong to a particular class but have been incorrectly assigned to another behaviour. To evaluate
performance of the model for predicting distinct kingfish behaviour, evaluation metrics (Pr), recall
(Re), and the F-measure (F1) were used:

41
Recall: Proportion of predicted behaviours from each class that were correctly classified.
R = TP/TP + FN
Precision: Proportion of predicted behaviours from each class that were that behaviour.
P = TP/(TP + FP)
F1 Score: The harmonic mean of recall and precision. Value of 0–1, where values near 0 have low
classification performance, while values closer to 1 have best classification performance
F1 = 2PR/(P + R)
Predicting free-ranging kingfish behaviours
The RF algorithm developed using ground-truthed data from captive kingfish was subsequently
applied to unseen data from eight free-ranging kingfish using the predict.randomForest function in R.
The first 60 minutes of data once each fish was released was removed from the dataset, to avoid
incorrect allocations of capture-induced behaviours (Roberts et al. 2011). As kingfish are
physiologically robust fish (Moran et al. 2008) and anaesthetic was not used during the tagging
procedure of free-ranging individuals, I assumed 60 minutes to be sufficient time for resuming regular
behaviours. Each one-second running mean increment of time-series data (recorded at 50 Hz) was
allocated a predicted behavioural class, based on values and the same predictor variables calculated
from captive fish to train the RF. To minimise misallocations of free-ranging behaviour class
predictions, 1 second increments that were predicted differently to the behaviour in adjacent
increments was instead allocated as the same behaviour as that which preceded it. For example, if
behaviours were classified in order as: swim, swim, feed, swim, swim; feed would be reclassified as
swim. Given the improbability of behaviours occurring in a duration <1 second, it is more likely that a
predicted behaviour is the same as that which precedes that second, rather than transitioning to a new
behavioural class for only one second. Courtship predicted from the model were categorised as either
spawning events or reproductive behaviours. Spawning events were labelled as each portion of free-
ranging data that courtship was predicted to occur(Figure S2). Reproductive behaviours included time
periods where several spawning events were predicted over a 30 – 90-minute period, based on
descriptions from (Moran et al. 2007; Figure S2). Time-series data were then allocated into selected
time-bins using the getSunlightTimes function (package ‘suncalc’ version 0.5.0), apportioned as dawn,
day, dusk, and night based on data of 1-hour periods either side of sunrise (dawn) and sunset (dusk).
Values of swimming depth (m) was also recorded once every five seconds for free-swimming fish,
and values for each 1 second running-mean were allocated based on the previously filled value.

42
2.4 Results
Captive Kingfish behaviour classes
A total of 624 hours of acceleration data was obtained from six kingfish during captive trials over two
tracking sessions at times of controlled spawning. Fertilised eggs were collected from trial tanks from
4 out of 5 (Tracking session 1) and 3 out of 4 nights (Tracking session 2), confirming that successful
spawning occurred on seven nights while kingfish carried accelerometers. Over 11,600 seconds of
accelerometer data were ground-truthed and categorised as one of five behavioural classes: feed
(1,332 seconds), escape (398 seconds), courtship (766 seconds), chafe (113 seconds), and swim
(Figure 2.1). Total events (1-second increments) allocated to behavioural classes per individual varied
between 1,674 (C2) to 2,490 (C4) seconds (Figure 2.1).
Twenty-five minutes (1,500 seconds) of regular swim behaviour was manually coded for each captive
fish (9,000 seconds total). Feed events were observed for all captive individuals, apart from C3. Feed
classes varied between 30 – 614 seconds per individual, and a total of 1,332 seconds across all fish
(Figure 2.1). Courtship behaviours were observed from five fish, varying between 128 – 172 seconds
in total per individual (Figure 2.1) and a cumulative total of 776 seconds. Escape behaviours were
variable between individuals, with only 2 seconds of this class observed for C1 and C3, with up to
182 seconds for C6 (Figure 2.1). No escape behaviours were observed for C2. A total of 398 seconds
of escape behaviours were collected across all fish. Chafe was the least represented behavioural class,
with 113 seconds of this behaviour observed varying between 5 (C2) and 45 (C6) seconds in
continuous length (Figure 2.1).

43
Figure 2.1. Number of 1-second increments spent performing observed behaviours for captive
kingfish tagged with accelerometers, (n = 6, recording time = 115 hours C1, 2, 3; 93 hours C4, 5, 6).
Swim behaviours are not included as the same amount of time swimming (1,500 seconds) was used
for each individual.
Acceleration characteristics of behaviour classes
Chafe behaviours were typified by a short burst (1 – 3 seconds) where fish dove to the bottom of the
tank represented by a descend in depth and pitch (mean Pitch = -6° ± 2.21), with large values of roll
as fish would turn onto their sides (Figure 2.2, Figure S3). Chafe included medium-strength bursts of
acceleration, characterised by increased VeDBA (0.31 G ± 0.01) and tail beat (amp = 0.14 ± 0.02,
cycle = 0.54 ± 0.01 s). Courtship behaviours were typically extended periods (up to 1 – 2 minutes) of
increased cycle and amplitude, interspersed with short bursts of roll and pitch (Figure 2.2, Figure S3).
Courtship events displayed the highest intensity acceleration of all behaviours (mean VeDBA = 0.48
± 0.002 g), though tail beats were slightly slower and less strong than during feeding (amp = 0.19 ±
0.01, cycle = 0.43 ± 0.004 s). Escape behaviours had acceleration signatures that were lower in
intensity compared to other burst behaviours (e.g., feed, courtship) but higher than typical swimming
(mean VeDBA = 0.15 ± 0.002G). Fish remained mostly upright (pitch = 2 ± 0.50 °), with intermittent
small roll values (34.4 ± 0.73 °; Figure 2.2, Figure S3). Feed behaviours were identifiable by several
large peaks in amplitude and VeDBA values with several large events over 3 – 5 minutes periods
(Figure 2.2, Figure S3). These large peaks corresponded to observed moments that fish would

44
increase acceleration to feed on a pellet in the tank. Feed had the second highest intensity of
acceleration (mean VeDBA = 0.43 ± 0.003 G), with the fastest tail beat cycles (0.42 ± 0.003 s) and
highest amplitude (0.21 ± 0.006). Pitch was slightly positive (mean = 5 ± 0.38 °) due to fish ascending
towards the surface to consume pellets. Swim behaviours were characterised by steady, low values of
acceleration, pitch, roll, and cycle, and consistent low peaks of cycle demonstrative of the regular
occurring tail beat of the individual (Figure 2.2, Figure S3). During swim, VeDBA was lowest out of
all classes (mean VeDBA = 0.04 ± 0.44 G), which was due to slow, long-duration tail beats (amp =
0.02 ± 0.006, cycle = 0.9 ± 0.003 s). During swimming, body position of fish remained upright,
resulting in roll values close to zero (mean roll = 0.34 ± 0.7).

45
Figure 2.2. Characteristics of observed behavioural classes from captive kingfish tagged with
accelerometer loggers. Mean values shown as red diamonds. Black horizontal bars represent median
values. Black boxes encompass the interquartile range, and vertical black lines represent the
maximum and minimum values.

46
Model classification performance of behavioural classes
Overall model accuracy of the RF model was 94%. The RF model predicted behaviour classes with
variable performance (F1 ranging from 0.46 – 0.99). Classification performance (F1) was highest for
swim and feed classes (> 84% accuracy, Table 2.4), followed by courtship, with lower allocation
scores for escape and chafe classes (Table 2.4). Swim class had the highest correct allocation of all
behavioural classes, with all performance metrics exceeding 0.99 (Table 2.4). Swim was correctly
predicted for all 1 second increments, except for 9 seconds which were incorrectly allocated as
escape. Feed was the next highest performing behavioural class. Somewhat low precision for the feed
class (0.75) caused by feeding behaviours being predicted by courtship, chafe, and escape, was
complemented by high recall (0.93), resulting in an F1 score of 0.84. Courtship had a high level of
correctly allocated predictions (precision = 0.93), on only 11 occasions was incorrectly allocated as
feed, chafe, or escape. Courtship had a lower score for recall (0.57) as a result of misallocations of
actual courtship events being predicted incorrectly, predominantly as feed. This resulted in an F1 score
for the courtship class of 0.70. Escape was largely correctly allocated (precision = 0.69), though 17%
and 12% of escape behaviours were incorrectly allocated as swim and feed classes, respectively. The
model incorrectly predicted courtship (9%) and feed (12%) occurrences as escape resulting in a recall
score of 0.70, and an overall F1 of 0.69. Chafe was the poorest performing behavioural class, with
only 31% of chafe behaviours correctly allocated as this class. Most of these behaviours (48%) were
incorrectly predicted as the feeding class. Although chafe had a high result for precision (0.90)
representative of the model only incorrectly predicting chafe to occur once, as feeding. These values
resulted in a F1 score of 0.46.

47
Table 2.4. Performance metrics of behavioural classes from captive kingfish calculated from random
forest algorithm on the test data (30% overall). Grey boxes represent number of correctly allocated
behaviour increments from test data set.
Reference
behaviour
Predicted behaviour Performance metrics
Chafe Courtship Escape Feed Swim Precision Recall F1
Chafe 9 2 3 14 1 0.90 0.31 0.46
Courtship 0 142 12 96 1 0.93 0.57 0.70
Escape 0 1 83 14 21 0.69 0.70 0.69
Feed 1 8 14 379 2 0.75 0.93 0.84
Swim 0 0 9 0 2671 0.99 0.99 0.99
Free-ranging Kingfish behaviours
The model trained using the entire ground-truthed dataset was used to predict naturally-occurring
behaviours from eight free-ranging kingfish (Figure 2.3). All five behavioural classes observed and
coded in the captive trials were predicted to be performed by free-ranging individuals. Five of the
eight free-ranging fish spent most of the recording period swimming (67–97%; Figure S4), however
the remaining three fish (FR4, FR5 and FR7) mostly displayed escape behaviour, accounting for 81,
58, and 45% of behaviour class allocations, respectively. Courtship was predicted to occur from five
free-ranging fish, three from the Neptune Islands and two from Coffin Bay in temperatures between
16.5 – 19.5°C. A total of 48 spawning events were predicted and classified into 19 expected
reproductive behaviours. Reproductive behaviours were typically made up of between 1 to 6
spawning events, with one reproductive behaviour containing 18 spawning events, lasting 108.6
minutes (Figure 2.3b). Of the 19 behaviours, 12 included only single spawning events. Of these single
occurrence events, duration ranged from 3 to 14 seconds (Figure 2.3c). Reproductive behaviours
occurred between 12 – 103 m of depth at the Neptune Islands (n = 16 events, mean = 35.8 ± 3.84 m)
and 1 – 6 m in depth at Coffin Bay (n = 5 events, mean = 2.98 ± 0.42 m). During courtship, fish
exhibited minimal changes in depth, generally propelling slightly towards the surface 0.74 ± 0.18 m in
Coffin Bay, 1.81 ± 0.38 m at the Neptune Islands (Figure 2.3a). Courtship predominantly occurred at
dawn and day, with 17 and 18 events (accounting for 35 and 38% of all spawning events
respectively). Comparatively, 7 (15%) and 6 (13%) of the events occurred at night and dusk (Figure
2.3c).

48
Figure 2.3. Example of one free-ranging kingfish reproductive event predicted from the random
forest model (a), and total duration in seconds of b) reproductive behaviours and c) spawning events
predicted from free-ranging yellowtail kingfish individuals at the Neptune Islands (blue) and Coffin
Bay (green) as predicted from a supervised machine learning model. Time of day is indicated by dawn
(orange), dusk (orange), day (yellow) and night (grey).
a)
c) b)
Dep
th (m
) R
oll (
°)
Am
plitu
de
VeD
BA (g
)
Time
2.0
-20
-40
0
200
100
1.0
0
4.0
2.0
0
8:58:50 PM 8:59:00 PM 8:59:10 PM 8:59:20 PM 8:59:30 PM
a)
49
2.5 Discussion
This study used accelerometers and machine learning to describe reproductive behaviours of
yellowtail kingfish in a captive environment, differentiate these from other behaviours, i.e.,
swimming, feeding, escape behaviours, and identified these behaviours in free-ranging kingfish.
These results showed that free-ranging kingfish displayed all behaviour classes , with swimming and
escape behaviours being most common. Evidence of courtship was observed from five free-ranging
kingfish, supporting anecdotal descriptions of occurrence of reproductive behaviour and spawning
events at both the Neptune Islands and Coffin Bay, and further encouraging the combined use of
accelerometers and machine learning as a tool to identify naturally-occurring behaviours of large
pelagic fish.
Accelerometers provide an opportunity to record in situ movements of free-ranging organisms to infer
behaviours based on changes in acceleration, body position, and tail beat signatures (Kawabe et al.
2003, Whitney et al. 2010). Previous applications of this method to verify ecologically-important
behaviours of large pelagic fishes have been limited to identifying and describing spawning events of
marine fishes based on visualisation of tail beat acceleration signatures (Yasuda et al. 2013, Sakaji et
al. 2018). However, accelerometers have not yet been used to distinguish spawning from other
naturally-occurring burst behaviours. This chapter successfully identified and described five
behavioural classes of yellowtail kingfish, including courtship, based on variables characterising
acceleration profiles, body position, and tail beat signatures. While visual observation of data obtained
from accelerometer loggers was sufficient to identify bursting behaviours (e.g., courtship, feed,
escape), the random forest algorithm was necessary to differentiate among these high-acceleration
events.
Swimming behaviour in pelagic fish is represented by regular, low intensity cyclic patterns in sway
acceleration which is more regular and consistent compared to infrequent, high intensity burst
behaviours (Gleiss et al. 2009, Broell et al. 2016). These predictable waveform signals are typical in
pelagic fish and sharks (Gleiss et al. 2009, Hounslow 2018), contributing to forward propulsion and is
commonly the most highly allocated behaviour in machine learning studies differentiating behaviours
of swimming marine organisms given that these behaviours are the most frequently performed
behavioural class (Hounslow 2018). These expectations were met by our model, with consistent high
levels of successful allocations for swimming behaviour. However, differentiating behavioural classes
with more complex kinematics, and high and variable frequency and amplitude such as burst
behaviours, has been a challenge for most accelerometer-based studies of behavioural predictions
(Brownscombe et al. 2014, Sakaji et al. 2018).

50
While courtship and spawning were visually confirmed from five of the six tagged captive kingfish,
low light levels when courtship and spawning mostly occurred, i.e., at night, dusk, and dawn
(Poortenaar et al. 2001, Moran et al. 2007), limited the number of spawning events which could be
visually confirmed via video footage. Induced spawning through hormone injections could have been
used to increase the number of spawning events observed (e.g., Sakaji et al. 2018), but the
acceleration signature from such events may not be representative of kinematics exhibited during
naturally-occurring spawning (i.e., less courting or chasing), limiting its use to infer spawning events
in free-ranging fish. Likewise, the use of additional artificial lighting to improve visibility in low light
conditions (e.g., at night, dawn) could affect fish behaviour and prevent spawning from occurring
(Bromage et al. 1984, Hansen et al. 2001, Kissil et al. 2001). Instead, increased observation effort
during dawn and dusk when spawning is expected to occur would likely increase the number of
reproductive behaviours observed and improve predictive capacity of naturally-occurring courtship in
the future.
The most frequently predicted behaviour of free-ranging kingfish at both the Neptune Islands Group
and Coffin Bay was swimming, providing some support for the predictive power of this approach,
given it would be expected that swimming should be occurring a majority of time by free-ranging
individuals. However, escape was the most frequently occuring behaviour in three free-ranging fish,
but it is unlikely that these fish spent more time escaping predators than swimming across 1 – 2 days.
Acceleration signatures are also influenced by body size and locomotion of pelagic schooling fish
(Noda et al. 2016), which may result in misclassification of behavioural classes between differently
sized individuals. In addition to body size, free-ranging kingfish may exhibit larger tail strokes than
captive fish constrained in tanks, resulting in fast regular swimming in free-ranging fish being
allocated to escape behaviours. While I attempted to minimise these effects by attaching loggers to
fish of similar size in both captive and free-ranging environments, free-ranging fish were slightly
larger than captive individuals (91 – 105 vs. 99 – 151 cm). Escape behaviours invoked by pursuing
individuals with a pole in the captive environment may also not be sufficiently comparable to natural
escape responses in a free-ranging environment. For example, movements exhibited while escaping
predators would likely differ from manoeuvres performed in tanks. Therefore, this may lead to the
escape behaviours from the captive fish poorly translating in the model, contributing to high
allocations of escape in some free-ranging individuals. Although this approach is effective for
identifying some behaviours (e.g., courtship, feeding), the constraints of validating naturally-
occurring behaviours in tanks can affect the accuracy of detecting others (i.e., escape) that are not well
translated from captive to natural environments.
Access to captive kingfish from the aquaculture industry has previously enabled research describing
spawning and reproduction in captivity (Poortenaar et al. 2001, Moran et al. 2007). Our study reveals,

51
for the first time, information about the timing and locations of kingfish spawning in the wild. A total
of 19 reproductive behaviours were identified in five of the eight free-ranging fish, although thirteen
behaviours lasted less than 1 minute and might be misallocated behaviours. The six remaining
behaviours lasted 14 – 109 minutes which is of similar duration to reproductive behaviours described
by Moran et al. 2007. All but two of these behaviours occurred at dawn or dusk, resembling theories
of spawning occurring predominantly during low light levels, e.g., dawn (Poortenaar et al. 2001,
Moran et al. 2007) and supporting the validity of my results here. As tagging periods were targeted in
Austral spring and summer conditions, temperature during free-ranging reproductive events (16.5 –
19.5°C) additionally met descriptions of hatching success in captive environments (15 – 26°C; Moran
et al. 2007). Courtship was identified from fish tagged at both study sites, the Neptune Islands and
Coffin Bay. While it is possible that the kingfish left the vicinity of the Neptune Islands or Coffin Bay
after tagging, the location of the loggers upon recovery and high residency of kingfish at both these
locations (Chapters 3, 5) suggest that the spawning observed occurred in areas within Coffin Bay and
around the Neptune Islands. While these findings of courtship are encouraging, courtship events
which do not match the described spawning profiles of kingfish (i.e., short duration, occurring in the
middle of the day or night) may have been misclassified from other burst event behaviours with
similar acceleration profiles. This reiterates that behaviours predicted by the RF model should be
carefully reviewed and ground-truthed where possible regardless of the high accuracy and
performance of the model (Valletta et al. 2017). It is also possible that the identified courtship events
did not result in the successful release of gametes, which affects the suitability of using
accelerometers to infer spawning events (Graham & Castellanos 2005). However, even if the tagged
fish does not release gametes, the indication that courtship or spawning attempts are taking place is a
reliable indication of timing and areas used for reproductive events (Graham & Castellanos 2005) and
that accelerometers can help identify when spawning is occurring. Integrating additional sensors (e.g.,
depth sensor) or tags (e.g., acoustic or satellite tags) means studies may also use accelerometers to
infer patterns in migrations, as well as spatial and habitat use to determine spawning location and
depth for spatial and temporal management efforts to protect spawning aggregations (Flavelle et al.
2002, Pecl et al. 2006, Rowell et al. 2015).
A limitation of behavioural studies such as this present chapter using accelerometers is the individual
variation in behaviours, movements, and swimming performance between captive and wild
individuals. Captive environments are space-limited and often have manipulated conditions which
may skew its performance for use on datasets from free-ranging individuals. In addition, ML
algorithms such as the RF model developed in this study do not account for the temporal auto-
correlation expected in timeseries (Brewster et al. 2018, Leos-Barajas et al. 2017). While there are
very few ways to combat these issues (e.g., Hidden Markov models; Leos-Barajas et al. 2017), future
studies may attempt to ground-truth data in the wild environment through means of animal-born video

52
cameras. However, these technologies come with a trade-off of limited battery-life, low visibility
under poor lighting, and additional weight to accelerometer packages potentially influencing
behavioural profiles.
2.6 Conclusions
Combined use of accelerometers and supervised machine learning algorithms has become
prevalent as a method of characterising behaviour classes from both terrestrial and marine taxa. This
study is the first to use a trained classification model to identify behaviours of free-ranging pelagic
fish.. Through direct observations of courtship and spawning behaviours, these findings provide the
first study to predict naturally-occurring courtship of a large pelagic fish, yellowtail kingfish, via the
use of accelerometers and ML. These findings contribute to more detailed approaches of identifying
naturally-occurring behaviours, which in the past have been only inferred through increase in general
activity patterns, or destructive sampling approaches. This method may contribute to a detailed
understanding of timing and location of important reproductive aggregations of large pelagic fish, and
in turn the effective spatial and temporal management strategies required to protect spawning
populations.

53
Investigating the effects of shark tourism on the daily residency and
movements of a non-focal pelagic fish
Reproduced with permission from Andrew Fox (Rodney Fox Shark Expeditions)
Published as: Clarke TM, Whitmarsh SK, Dwyer RG, Udyawer V, Pederson H, Huveneers C (2022) Effects of shark tourism on the daily residency and movements of a non-focal pelagic teleost. Marine Ecology Progress Series, doi: https://doi.org/10.3354/meps13998

54
3.1 Abstract
Marine wildlife tourism is increasing in popularity, with operations targeting a wide range of
taxa globally. While previous studies have mostly focused on assessing the effects of provisional
feeding from tourism on focal species of such operations, non-focal species that unintentionally feed
upon provisioned food sources have largely been overlooked. This study improves our understanding
of the effects from provisioning shark cage-diving tourism on the movements and behaviours of a
non-focal pelagic fish. I used acoustic tracking to determine the effects of shark cage-diving tourism
on the residency and space use of yellowtail kingfish (Seriola lalandi) at the Neptune Islands, South
Australia. I revealed that while cage-diving did not affect the weekly residency and space use of
kingfish, daily time spent at the islands and location of kingfish was influenced by the presence of
operators. Acoustic attractant did not influence kingfish behaviours, but operators using food-based
attractant increased the average daily time spent at the Neptune Islands by ~27% (from 230.6 ± 6.8 to
293.8 ± 5.5 minutes). Similarly, kingfish were observed closer to operators using food-based
attractant (217 ± 4.82 m from vessel) compared to acoustic operators (412 ± 29.5 m from vessel).
Findings from this chapter identify changes in the daily behaviour of kingfish at the Neptune Islands
as a result of food-based provisioning from shark cage-diving, which demonstrates that non-focal
large pelagic species can be affected by shark diving tourism. These results highlight that food-based
attractant used from tourism may also lead to longer-term effects on the physiological condition and
energetic budgets of these individuals.
3.2 Introduction
Wildlife tourism is gaining popularity globally, and is one of the fastest growing sectors of
the tourism industry (Wearing & Neil 2009, Barnes et al. 2019). These practices often provide
substantial socio-economic benefits by offering an alternative to the consumptive use of wildlife (e.g.,
hunting, fishing) that results in assorted conservation and economic benefits to local communities
(Huveneers et al. 2017a, Apps et al. 2018). The focal-species of most wildlife tourism ventures are
often large, charismatic animals which can occur infrequently and sporadically. As a result, tourism
operations often use a food-based attractant (i.e., provisioning, Meyer et al. 2021b) to aggregate these
targeted individuals and increase the chance of a consistent and up-close encounter for tourists
(Knight 2009; Meyer et al 2021a). However, food-based provisioning from these operations can
modify the movements and behaviour of focal species (Chateau & Wantiez 2008, Bruce & Bradford
2013), and affect their health and condition by changing their diet (Brena et al. 2015, Trave et al.
2017, Patroni et al. 2018, Meyer et al. 2020). While provisioning practices are aimed at attracting
targeted animals, other non-focal species are frequently observed feeding on the food provided (often
termed indirect feeding, Meyer et al. 2020). Consequences for these non-focal individuals have been
found to replicate effects on focal species, with altered movements (Rizzari et al. 2017), increased risk

55
of predation (Milazzo et al. 2006), nutrient loading (Turner & Ruhl 2007), parasite infestations
(Vignon et al. 2010), and shifts in diet reflected through fatty acid and stable isotope profiles (Meyer
et al. 2020). However, despite the potential impacts on non-focal species, literature surrounding
implications from provisioning tourism has been largely skewed towards focal species (93% of
studies, Trave et al. 2017), with no studies investigating these impacts for non-focal large-pelagic
fishes (Trave et al. 2017). The need for further research to assess impacts of provisioning from
wildlife tourism on non-focal species has also been highlighted in recent reviews (Gallagher and
Huveneers, 2018; Gallagher et al., 2015) and management frameworks (Higginbottom et al. 2003,
Meyer et al. 2021a)..
White shark (Carcharodon carcharias) cage-diving is a popular form of wildlife tourism, which
occurs in five countries worldwide, i.e., Australia, South Africa, the United States of America,
Mexico (Guadalupe Island), and New Zealand. In Australia, the Neptune Islands Group Marine Park
(South Australia), is the only location where white shark cage-diving is permitted (Figure 1.1). At this
site, two companies use a near-constant plume of food-based attractant (chum; mixture of minced
fish, usually southern bluefin tuna Thunnus maccoyii) and tethered baits to attract sharks into the field
of view of tourists (Huveneers et al. 2017b, Meyer et al. 2020). A third company uses acoustic
attractant (music played through underwater speakers) to attract sharks. The industry is regulated to
ensure that operators are not permitted to deliberately feed sharks (DEW 2016), however, baits may
be consumed if the handler is not fast enough to react and withdraw the tether (Huveneers et al. 2013).
Although white sharks are not intentionally fed, a number of small, non-focal species (e.g., yellowtail
kingfish Seriola lalandi, trevally Pseudocaranx spp.) are often observed feeding on smaller particles
of chum and bait that disperse into the water column.
Yellowtail kingfish (Seriola lalandi, kingfish hereafter) are a large-bodied coastal pelagic fish
distributed globally in temperate and sub-tropical environments (Gomon et al. 2008). Kingfish are a
highly-valued focal for recreational and commercial fishers (Stewart et al. 2004, Hughes & Stewart
2020), and contribute to an expanding aquaculture industry (Tanner & Fernandes 2010, Symonds et
al. 2014). Mark-recapture tagging programs have identified that kingfish are capable of migrating
large distances (up to 1000’s of kilometres; Brodie 2016, Gillanders et al. 2001, Saul & Holdsworth
1992), but have also revealed high levels of site-fidelity with individuals often recaptured within 5 km
of their original tagging location (Hutson et al. 2007, Hobday & Campbell 2009). Movements of
kingfish along Australia’s south-eastern coastline are predominantly driven by suitability of
oceanographic conditions, with increased movements to offshore island groups during warmer
months, and high residency and site-fidelity in shallow estuaries during cold months (Brodie 2016).
At the Neptune Islands, kingfish are often observed behind cage-diving tourism vessels year-round,
feeding on smaller particles of bait and chum which enter the water column to attract white sharks.

56
This indirect feeding from cage-diving operations has the potential to change the frequency of
important behaviours, e.g., spawning (see Chapter 2), in addition to changing movements and space
use associated with natural foraging and crepuscular patterns (Myers et al. 2016, Rizzari et al. 2017),
or halting migrations associated with habitat selectivity (Brodie et al. 2016, Champion et al. 2020) by
leading kingfish to remain at the Neptune Islands for longer than they would naturally. As a result, the
chumming occurring during white shark cage-diving may lead to kingfish spending more time at the
tourism site even when the habitat becomes less optimal from a physiological or fitness perspective,
e.g., less suitable oceanographic conditions (Champion et al. 2020).
In this study, I used implanted tags and an array of acoustic receivers to examine how kingfish
residency and space use is affected by the white shark cage-diving industry. Cage-diving in the
Neptune Islands typically operates on most days (i.e., 261 days of the year, 6 days per week), with the
number of operators present varying between zero and three operators per day (two food-based, one
acoustic attractant). Furthermore, the temporary halt in cage-diving operations in mid-2020 due to
COVID-19-related travel restrictions provided a unique opportunity to investigate the behaviour of
kingfish when operators were absent over longer periods (Huveneers et al 2021). Specifically, I
hypothesised that 1) weekly residency of tagged kingfish increases and space use contracts to within
proximity of cage-diving operations as the number of days operators were present increased; 2) daily
time spent by kingfish at the Neptune Islands increases when food-based operators were present; and
3) kingfish occur closer to food-based operators than acoustic-based operators when present.
3.3 Materials & Methods
Study site
The Neptune Islands Group (Ron and Valarie Taylor Marine Park; Figure 1.1) is a group of offshore
granite islands 60 – 70 km towards the southeast from Port Lincoln, South Australia. The islands
group consists of the North Neptune islands (35°13.944’S; 135°03.834’E) and South Neptune islands
(35°19.518’S; 135°06.762’E), located 12 km south from the North Neptune Islands. While shark
tourism operators run trips to both groups, approximately 85% of the trips occur at the North Neptune
Islands (C. Huveneers, unpublished data) due to its closer proximity to Port Lincoln where vessels
depart. Operations run year-round, with tourism vessels permitted to run trips ten days every fortnight,
with four ‘operator-free days’ to reduce tourism pressure and minimise any potential effects on focal
white sharks (DEW 2016).

57
Capture of Kingfish
Between August 2018 and May 2020, 18 kingfish (> 80 cm total length) were captured with hook and
line at the Neptune Islands and tagged with V16A 98 x 16 mm (17.3 g; 1090 days battery life) or
V13A 48 x 13 mm (6.5 g; 368 days battery life) acoustic activity tags (Innovasea, Nova Scotia,
Canada, innovasea.com). Fish were inverted upside down in a padded cradle, maintaining water flow
over the gills using a hose inserted in the mouth, inducing a tonic immobility reflex where the fish do
not respond to external stimuli (Wells et al. 2005). A small incision was made, and the acoustic tag
was inserted in the peritoneal cavity, before being stitched with absorbable sutures (Monosyn 2-0/3-0,
B. Braun, Hessen, Germany). Acoustically tagged individuals were also tagged with an external
identification tag to avoid double-tagging, if recaptured.
Receiver Deployments
An array of 16 V2AR acoustic receivers (Innovasea, Nova Scotia, Canada, innovasea.com) were
deployed in November 2018, with 15 receivers positioned at the North Neptune Islands (Figure 3.1)
and 1 positioned at the South Neptune Islands. Due to the infrequency of operators to visit the South
Neptune Islands, only data from receivers at the North Neptune Islands group were included
(hereafter North Neptune Islands is referred to as Neptune Islands). Prior to deployment of the
acoustic receiver array, range testing was undertaken to assess detection range. Receivers were
positioned ~350 m from each other to ensure simultaneous tag detection by 2 – 3 receivers and enable
to estimate high-precision fish positions throughout the study period. Receivers were deployed in 10 –
40 m water depth on low-profile moorings ~2 m high with 70 – 100 kg of anchor chain as weight and
sub-surface floats. Receivers were strategically positioned where cage-diving boats anchor which is
also the side of the island most protected from dominant winds and swell (Figure 3.1). The array was
deployed for nearly two years with downloads occurring annually. Acoustic receivers also recorded
water temperature hourly, enabling calculation of daily and weekly mean temperature (Figure 3.2).

58
Figure 3.1. Map of the Neptune Islands Group showing a) operator anchoring locations (acoustic
attractant in blue, food-based attractant in red); and b) kingfish positions within the array during
daylight hours (60-minute center of activities). Horizontal dashed line represents ‘north-’ and ‘south-
eastern’ sides of the island. VR2AR acoustic receivers are presented as black triangles. See Figure 1.1
for location of the Neptune Islands in South Australia.
a)
b)

59
Data analysis
Daily operator position was collected through a customised daily e-logbook (FulcrumTM from
November 2018 to February 2019 and White Shark Cage-Diving app from March 2019 to August
2020; Nazimi 2018). For each day of operation, cage-diving operators recorded time at the Neptune
Islands using food or acoustic attractant and anchor location (coordinates). Weekly sums of the
number of ‘operating days’ were calculated based on the iso-week calendar (beginning on Monday of
each week) using the isoweek() function from the ‘lubridate’ (version 1.7.9) package in R (R Core
Team 2020). Daily ‘operator types’ were determined based on the configuration of operators present
on a given day: one food-based, two food-based, acoustic only, one food-based + acoustic, all
operators, or no operators. To identify spatial effects of operators across the island, the group was
categorised as the north-eastern and south-eastern sides (latitude ≥ 35°13.680’S) based on the two
distinct groupings of operating locations (Figure 3.1).
Analyses of kingfish residency and space use were performed in the R statistical environment (version
1.2.5033). The ‘VTrack’ package (version 1.21) with Animal Tracking Toolbox extension (Udyawer
et al. 2018) was used to calculate position in the array, residency, and space use. Residency (days
detected divided by days at liberty) was calculated using the detectionSummary function, with overall
residency (i.e., for the full period of tag operation) and weekly subsets calculated. Residency
calculations from the first and last week of the recording period were removed, due to shortened
weeks during receiver deployment and collection. Approximate kingfish positions within the acoustic
array were estimated through 60-minute centres of activity (COAs) using the COA function in
VTrack, to enable sufficient signal receptions from transmitters for accurate location estimates
(Simpfendorfer et al. 2002).This method assumes that detection probability is a linear function of
distance, and calculates the position based on the mean of receiver detections weighted by the number
of detections at each receiver within the array. Although COAs provide a mean-weighted estimate of
an individual’s position, and are conventionally used to infer spatial and temporal patterns of
movement within acoustic arrays, an attempt to calculate refined positioned through a Vemco
Positioning System (VPS) was made based on the 3-receiver time-difference-of-arrival algorithm
(Espinoza et al. 2011). However, there was low success of conversion from detections to position
estimates reduced detection range during high noise periods and fish positioned around the fringe of
the array. As a result, COAs were used in this study to infer kingfish positions while maintaining
abundant position estimates to infer change due to tourism operations. Estimates of space use (weekly
and overall) were calculated using 50% contour of Brownian-Bridge Kernel Utilisation Distributions
(BBKUD-50) based on COAs, using the HRSummary function. The Brownian-Bridge approach was
used rather than other metrics of space use (i.e., fixed KUD) as it accounts for autocorrelation
between sequential location estimates by incorporating movement paths, and more accurately

60
represents space use in highly mobile animals such as kingfish (Horne et al. 2007, Udyawer et al.
2018). Choice of smoothing parameter associated with relocation error (σ2) for the Brownian-bridge
movement model was undertaken using an ad hoc approach (Kie 2013), with the smoothing parameter
associated with animal speed (σ1) estimated using a maximum likelihood estimator (see Horne et al.
2007).
To identify the acute responses of kingfish to the provisioning from cage-diving operations, daily
metrics of residency (time spent) and space use (distance to closest vessel) were calculated. Daily
time spent by tagged kingfish within the array was calculated as the difference in time (minutes)
between the first and last detection for each individual detected on that day. Distance between
kingfish and the closest operator vessel were estimated using the distHarversine function (package:
‘geosphere’ version 1.5.10) which measures the shortest distance between two points, using
coordinates of kingfish COAs and operator anchor locations. Sunrise and sunset times were estimated
using the getSunlightTimes function (package: ‘suncalc’ version 0.5.0), and only detections occurring
between the end of sunrise and the beginning of sunset were used for analyses as the operators only
ran trips and were present on the Island during daylight hours.
Generalised linear mixed models (GLMMs) were used to test the effects of cage-diving operations on
kingfish residency and space use at weekly and daily scales using the lmer or lme function in the
‘lme4’ R package (Bates et al. 2014). Individual fish (Transmitter) was included as a random effect
(rand) to account for potential lack of independence in behaviour within fish. Potential effects of
temporal autocorrelation on the residency and space use of kingfish were accounted for by using an
AR1 correlation structure in the weekly models (form = ~WeekNumber|Transmitter; corr). As AR1
correlation structure is not possible through the lmer function with repeated samples for the same time
increment, daily models included week number as a random factor with slopes and intercepts
randomised by the weekly number of operating days. Number of operating days (0 – 7; weekly
GLMM) and operator type (no operators, acoustic only, one/two food-based, food-based + acoustic,
all operators; daily GLMM) were included as fixed factors, along with temperature recorded by the
acoustic receivers to test for the potential effects of operators and temperature on kingfish movements.
The most appropriate statistical family, transformation, and validity of the model was determined by
examining the distribution of the response variable and visual inspection of residuals. A square-root
transformation was deemed appropriate for daily time spent and distance from operator values, while
a log10 transformation was required for the weekly models to maintain normality of residuals. All
model combinations of fixed-effect terms were run using the dredge function (package: ‘MuMIn’;
version 1.43.17; Barton 2020) and ranked using Akaike’s information criterion corrected (AICC) for
small sample size (Burnham & Anderson 2002). The r.squaredGLMM function was then used to

61
estimate marginal (fixed-factor) and conditional (all factors) R2 values for each model. Full models
used for GLMM’s were:
Weekly model:
detection index/BBKUD-50 = Operator days*Temperature + Operator Days|Transmitterrand +
WeekNumber|Transmittercorr
Daily model:
time spent/distance to operator = Operator Type*Temperature + Operator Type|Transmitterrand +
Operator Type|WeekNumbercorr
3.4 Results
Operator Days
Between November 2018 and August 2020, white shark cage-diving operators were present at the
Neptune Islands on 435 / 637 days (68%) of the study period. Operators were most often present on 6
/ 7 days of the week (n = 32 weeks; 35% of all weeks; Figure 3.2), but there were some weeks where
operators visited the islands on all days (n = 5 weeks, i.e., 5% of all weeks). The period with the least
tourism activity was a 6-week period between March and August 2020 when COVID-19 controls and
travel restrictions were in place and no cage-diving operators visited the Neptune Islands (Figure 3.2).
Kingfish detections
Between November 2018 and August 2020, the number of detections per kingfish ranged from 35 to
58,771 (mean = 14,320 ± 3,959 detections). Kingfish were detected at all fifteen receivers deployed at
the North Neptune Islands. A total of 13,398 kingfish positions were calculated in the acoustic array
based on 60-minute COAs (Figure 3.1b), with positions mostly occurring on both north-eastern (44%
of locations) and south-eastern sides (56% of locations) of the North Neptune Islands.
Residency and space use summary
Mean kingfish residency at the Neptune Islands over the near two-year period was 0.52 ± 0.04 (range:
0.29 – 0.79; Figure S5, Table S1) which is representative of individual fish being present within the
array on 52% of all days. Monthly residency of all kingfish was highest during January (0.59 ± 0.06)
and December (0.59 ± 0.06) and lowest during July (0.39 ± 0.06) and August (0.35 ± 0.06), but
persistence of kingfish at the islands remained consistent throughout the year (0.35 – 0.59). Brownian-

62
Bridge Kernel Utilisation Distribution estimates were estimated from 16 kingfish based on 6 to 2,233
COA positions (mean = 788 ± 145.6 positions). One kingfish (Transmitter ID 4310) was only detected
35 times (Figure S5) from 11 receivers, thus, a reliable space use metric could not be estimated for
this individual. Space use (50% BBKUDs) of tagged kingfish ranged from 0.15 to 1.97 km2 (mean =
0.59 ± 0.05 km2; Figure S6). Space use was smallest during July (0.41 ± 0.06 km2) and August (0.40
± 0.05 km2), and the largest during the months of March (0.54 ± 0.02 km2) and April (0.53 ± 0.07
km2) but remained consistent with kingfish using all areas inside the array across all months (range:
0.40 – 0.53 km2; Figure 3.2).
Weekly residency and space use
Weekly residency of tagged kingfish at the Neptune Islands ranged from 0.14 (1 day detected) to 1
(present on all 7 days; 0.56 ± 0.03). Water temperature or the number of operator days did not
influence the weekly residency of kingfish, as the top-ranked model was the null model that only
included the random effect, Transmitter ID (wAICc = 0.76; Table 3.1; S3.5; Table S2). Only 12% of
the variation was explained by this model, with some variation in residency between years. Weekly
space use of kingfish ranged from 0.11 to 1.05 km2 (mean = 0.32 ± 0.01 km2). The top-ranked model
was again the null model (wAICc = 0.60; Table 3.1), indicating that the number of operating days nor
the temperature was influencing weekly space use of kingfish, with the individual Transmitter ID
explaining more of the deviance than the weekly residency model (Rc = 0.46 vs. 0.12).

63
Figure 3.2. Weekly summaries of operator and kingfish residency and space use at the Neptune
Islands Group Marine Park; a) number of operating days; b) water temperature (temp) ± se; c) number
of fish detected; d) residency ± se; and e) space use (BBKUD-50 ± se).

64
Table 3.1. Summary of models estimating effects of cage-diving operations (weekly operator days;
opdays) on kingfish a) residency and b) space use (BBKUD-50). df, degrees of freedom; AICc ,
Akaike's information criterion corrected for small sample size; ΔAICc , difference in AICc between
the current and the top-ranked model; wAICc, model probability; Rm, marginal (fixed effects) R2; Rc,
conditional (fixed and random effects) R2.
Daily time spent at the North Neptune Island
The daily time that tagged kingfish spent at the North Neptune Islands acoustic array ranged from 1
second (i.e., one detection) to 922 min (mean = 68 ± 13.3 min) and was influenced by temperature
and operator type (wAICc = 0.84; Table 3.2; Figure 3.3a). While the total variance explained was
24%, most of this was from the random factor (fish ID, 22%), with only 2% explained by the fixed
factors. Daily time spent within the acoustic array at the North Neptune Islands was shortest on those
days when no operator was present (230 ± 6.8 mins) and on days when only an acoustic attractant was
used (222 ± 19.4 mins; Figure 3.3). Comparatively, kingfish spent more time within the acoustic array
on days when food-based attractant was present, regardless of whether it was one (276 ± 8.4 mins) or
two operators present (276 ± 12.7 mins; Figure 3.3a; Table S2). Daily time spent in the receiver array
was highest on days when all three operators were present at the islands (329 ± 11.7 mins; Figure
3.3a). Temperature had a small, but positive influence on daily time spent of kingfish (Figure 3.3a),
with kingfish spending more time within the array on warmer days.
Model df logLik AICc ΔAICc wAICc Rm Rc
a) Weekly residency (days detected/days at liberty)
Residency ~ 1 (intercept only) 4 -14.9 37.8 0 0.76 0 0.116
Residency ~ Temperature 5 -15.7 41.4 3.64 0.12 0.014 0.122
Residency ~ Opdays 5 -15.8 41.6 3.85 0.11 0.017 0.105
Residency ~ Temperature + Opdays 6 -17.1 46.4 8.65 0.01 0.029 0.117
Residency ~ Temperature * Opdays 7 -20.8 55.7 17.91 0.00 0.031 0.121
b) Weekly space use (Brownian-bridge Kernel Utilisation Distribution, 50%)
Space use ~ 1 (intercept only) 4 490.4 -972.7 0 0.97 0 0.465
Space use ~ Temperature 5 487.7 -965.3 7.43 0.02 0.006 0.483
Space use ~ Opdays 5 486.1 -962.1 10.66 0.01 0.000 0.479
Space use ~ Temperature + Opdays 6 483.4 -954.7 18.06 0.00 0.006 0.497
Space use ~ Temperature:Opdays 7 478.6 -942.9 29.84 0.00 0.006 0.495

65
Distance between fish and cage-diving operations
During times that cage-diving vessels frequented the Neptune Islands, kingfish were on average 202.6
± 6.2 m from the closest operator. The distance that tagged kingfish occurred in proximity to operator
vessels was influenced by operator type (top-ranked model wAICc = 0.37; Table 3.2). While the
second and third best model had similar wAICc (0.34 and 0.28 respectively) and included either
temperature (third best model) or the interaction between operator type and temperature (second best
model), the variance explained did not substantially increase when including these factors (from 44%
for the top-ranked model to 46% and 45% for the second and third best model respectively). Most of
that variance was attributed to the random effect (individual fish ID, Rc = 40%). Distance between
kingfish and cage-diving operator vessels was greatest on days when only acoustic attractant operator
was present (mean = 412 ± 29.6 m; Figure 3.3b). Kingfish came closer to cage-diving operations
when a food-based attractant was used (Figure 3.3b), but there was no effect from an increased
number of these chumming operators (180 ± 9.22 m [when acoustic and food-based present] - 234.4 ±
8.5 m; Figure 3.3b). The influence of the food-based operators on kingfish position in the Neptune
Islands array was supported by increase in likelihood of fish to be detected on the same side of the
island as chumming operators (Figure 3.4a). When no operators frequented the islands, kingfish
showed a slight preference to the southern side of the island, occurring here 54% of the time (Figure
3.4a). Kingfish position was similar when only acoustic-attracting operators were present on the
northern or southern sides of the island (Figure 3.4b, c). In comparison, this likelihood of kingfish to
occur on the southern side of the island increased to 75% when food-based operators were present on
this side (Figure 3.4e). The same effect was observed when operators where anchored on the northern
side, with 71% of detections occurring on this side of the island during these times (Figure 3.4d).

66
Figure 3.3. Interaction between the predicted a) time spent and b) distance to the closest cage-diving
operator with temperature at the Neptune Islands across temperatures from Generalised Linear Mixed
Models. Operating types using food-based attractant are shown in red, acoustic attractant in blue, and
no operator days in black.
a)
b)

67
Table 3.2. Summary of models estimating effects of operator type (type) on daily time spent and
proximity of kingfish to the closest operator vessel. df, degrees of freedom; AICc , Akaike's
information criterion corrected for small sample size; ΔAICc , difference in AICc between the current
and the top-ranked model; wAICc , model probability; Rm, marginal (fixed effects) R2; Rc, conditional
(fixed and random effects) R2.
Model df logLik AICc ΔAICc wAICc Rm Rc
a) Daily time spent (time between first and last detection)
Time ~ Type + Temperature 50 -9575.2 19252.4 0 0.78 0.02 0.26
Time ~ Type 49 -9578.1 19256 3.69 0.12 0.01 0.26
Time ~ Temperature 45 -9583.1 19257.8 5.42 0.05 0.01 0.27
Time ~ Type + Temperature + Type*Temperature 55 -9573.1 19258.4 6.07 0.04 0.02 0.26
Time ~ 1 (intercept only) 44 -9586 19261.4 9.0 0.01 0.00 0.27
b) Distance to nearest operator (m)
Distance ~ Type + Temperature 37 -4019 8115.2 0 0.43 0.04 0.46
Distance ~ Temperature + Type + Temperature*Type 41 -4015 8115.7 0.49 0.34 0.04 0.46
Distance ~ Type 36 -4021 8116.6 1.35 0.22 0.03 0.44
Distance ~ 1 (intercept only) 32 -4029 8124.2 8.92 0.01 0.00 0.44
Distance ~ Temperature 33 -4029 8124.9 9.66 0.00 0.01 0.45

68
Figure 3.4. Estimated hourly COAs of kingfish (red) in relation to the location of cage-diving
operators (blue). Positions on days when no operators were present (a), on days when operators were
47%
53% a)
North
Neptune Is.
49%
51% b)
North
Neptune Is.
33%
67% c)
North
Neptune Is.
71%
29% d)
North
Neptune Is.
25%
75% e)
North
Neptune Is.
Latit
ude
Latit
ude
Latit
ude
Longitude Longitude

69
using acoustic (b, c) or food-based (d, e) attractant (b, d) shows days when operators where anchored
on the northern side of North Neptune Island; (c, e) shows days when operators were anchored on the
southern side. Percentage of positions occurring on the respective half of the island during operator
treatments are provided.
3.5 Discussion
This study improves the understanding of kingfish residency and space use at a temperate
offshore island group and reveals the impacts of shark cage-diving tourism on a non-focal large
pelagic fish. Findings show that kingfish can be year-long residents of the North Neptune Islands,
with tagged individuals exhibiting a high residency index within the array throughout the year and
some individuals spending up to 79% of days at the islands. While cage-diving tourism did not affect
the weekly residency and space use of kingfish, the time that kingfish spent within the North Neptune
Islands acoustic array each day increased when food-based attractant are used. This shift in daily
residency therefore delays the time of day when kingfish naturally left, which could be linked to
diurnal behaviours linked to foraging and minimising predation risk. The use of acoustic attractant did
not have the same effect. In addition, kingfish daily space use was also affected by the presence of
bait and chum, with kingfish occurring closer to cage-diving vessels using food-based attractant than
acoustic attractant and shifting its position to match anchoring locations of chumming operators.
Kingfish are highly mobile and migratory pelagic fish, with movements and residency largely driven
by changing oceanographic conditions (Gillanders et al. 2001, Brodie 2016, Champion et al. 2018).
Such seasonal migrations are common in many coastal-pelagic fishes, with movements tracing
optimal conditions to access resources and increase recruitment opportunities (Golovanov 2006, Walli
et al. 2009, Briscoe et al. 2017). Previous descriptions of kingfish movements have demonstrated
northerly latitudinal changes in winter, with increased residency around offshore islands in summer
when water temperature is warmest, often with an complete exodus at these islands during winter
(e.g., Lady Julia Percy Island [J Rizzari pers. obs.], Coffin Bay [see Chapter 5], Brodie 2016). In
contrast, most kingfish tagged at the Neptune Islands remained inside the array throughout most of the
year, with fish residing at the islands during all months. This opposing trend in the residency of
kingfish at the Neptune Islands compared to observations at other offshore islands may be indicative
of an effect of cage-diving tourism, where a reliable supply of an provisioned food source is altering
the cues that kingfish naturally use to select optimal habitat (Meyer et al. 2020, Semeniuk 2021). As a
result, kingfish may choose to remain at the Neptune Islands for extended periods, rather than moving
away from the islands in response to seasonal fluctuations in food availability and preferable habitat
conditions (Champion 2019, Champion et al. 2020b). However, despite the tendency of kingfish to be
detected at the Neptune Islands year-round, all kingfish occasionally left the area for extended periods
throughout the year (from several weeks up to 5 months; Figure S5). Additionally, three individuals

70
were detected at the South Neptune Islands (~12 km from North Neptune), and two individuals were
detected over 1,800 km away in Narooma, Batemans Bay and Manly in New South Wales between
August, and December 2020. One of these individuals was also detected off Victor Harbor, South
Australia, ~230 km from the Neptune Islands further contributing information about the spatial
movements of kingfish across south-eastern Australia. While the year-round residency of kingfish at
the Neptune Islands is high compared to previous studies (e.g. Brodie 2016, Udyawer et al. 2018),
large-scale movements to other offshore island groups and interstate show that even if the cage-diving
industry may be contributing to high residency, it does not stop kingfish from occasionally
undertaking large-scale movements which may be attributed to prey availability (Nøttestad et al.
1999), or spawning migrations (Axenrot & Hansson 2004, Barbaro et al. 2009) and pursuing optimal
environmental conditions (Champion et al. 2018).
Despite no effect from the number of operating days on the weekly residency of kingfish, the amount
of time that kingfish spent at the North Neptune Island array each day increased by 17% (63 ± 5
minutes) when food-based operators occurred, compared to days that no operators or only acoustic-
attractant were present. The lack of effect when acoustic attractant was used by operators suggests
that kingfish were attracted to bait and chum input, rather than simply the presence of the operator
vessels. Diurnal undulations in persistence and movements across habitats in coastal-pelagic fish such
as kingfish are common, with many species adapting habitat use strategies that favour optimal
foraging conditions (i.e., light availability) and prey availability (Horwood & Cushing 1978; Buckley
et al. 1994). Prolonged time spent by kingfish at the Neptune Islands because of provisioning from
cage-diving operations therefore has the potential to disrupt natural foraging behaviours, leading to
more reliance on the food-source supplied from cage-diving operations and less time foraging for
natural prey items. However, kingfish maintained high residency even during COVID-19 lockdown
restrictions in April – May 2020, when no operators frequented the Neptune Islands. Although, it is
difficult to infer whether this high residency is attributed to provisioning or natural residency due to
the lack of historical data prior to the onset of tourism operations. The prolonged daily duration of
kingfish at the Neptune Islands may contribute to the documented shift in dietary profiles where
kingfish diets more closely resemble T. maccoyii used as bait rather than natural prey items observed
at control sites (Meyer et al. 2020), and has the potential to reduce kingfish physiological condition
and fitness (Bessa et al. 2017, Semeniuk et al. 2021). In addition to influencing nutritional profiles,
extended exposure to cage-diving vessels has the potential to lead to alterations in energetic budgets
of kingfish due to increasing fast swimming behaviours through chasing baits and feeding on chum
around the surface. Previous examples from provisioning wildlife tourism has revealed shifts in the
activity budgets of whitetip reef sharks (Fitzpatrick et al. 2011, Barnett et al. 2016), white sharks
(Huveneers et al. 2013, Huveneers et al. 2018), and whale sharks (Barry 2020) due to an increase in
strong accelerations and vertical movement behaviours associated with pursing bait resources at

71
tourism sites. These changes in activity are reflective of shifts in metabolic rate (Wilson et al. 2006,
Payne et al. 2011), and have the potential to lead to long-term effects on the biological processes and
survival on individuals that is not reflected from behavioural and dietary shifts (Brown et al. 2004).
Movements and space use of upper trophic level pelagic fish such as kingfish are often associated
with foraging and feeding on small mobile preys like fish, squid, and crustaceans (Gomon et al.
2008). However, provisioned feeding from wildlife tourism can influence the space use of mobile
marine species, with individuals aggregating where the feed is provided (Clua et al. 2010, Corcoran et
al. 2013, Thomson et al. 2017). I therefore anticipated that the chum and bait used during food-based
cage-diving operations would contract the space use of kingfish around operator vessels rather than
moving around the islands seeking prey. Previous studies at the Neptune Islands have shown similar
effects on the focal species of operations, i.e., white sharks (Huveneers et al 2013) and benthic non-
focal species, i.e., smooth stingray Bathytoshia brevicaudata (Rizzari et al. 2017). Although such
reduction in the weekly space used of kingfish in response to the number of operating days was not
observed, the daily location of kingfish was affected, with kingfish more likely to occur on the side of
the island that chumming operators occurred. Additionally, provisioning from food-based operators
resulted in kingfish occurring on average ~200 m closer to operators using food-based attractants than
the operator using acoustic attractant. Attracting kingfish within close proximity to tourism operations
can negatively affect kingfish, e.g., injuries through interaction with vessels or passengers, predation
from white sharks (Grainger et al. 2020), increased stress hormone levels (Semeniuk et al. 2008,
Bessa et al. 2017), changes in hierarchical structure (Pini-Fitzsimmons et al. 2021, Brookhouse et al.
2013), and heightened risk from parasite infestation through increased transmission rates (Semeniuk
& Rothley 2008, Clua et al. 2010, Brookhouse et al. 2013). Additionally, implications may be
extended to broad ecosystem-wide effects by shifting the environmental services that kingfish play in
the ecosystem. As large-bodied pelagic fish, kingfish are meso-predators that occupy high positions in
pelagic food webs in addition to playing a role in regulating concentrations of small-bodied prey items
as well as being an important prey-source for larger predators (Navarro et al. 2017, Grainger et al.
2020). Therefore, altering movements of kingfish at the Neptune Islands away from natural foraging
areas has potential flow-on effects by disrupting both prey and predator interactions that would
otherwise occur throughout unmodified daily movement patterns.
Wildlife tourism at the Neptune Islands can also positively affect kingfish. The significance of the
islands for focal white sharks along with the biological importance of diverse habitat and fauna that
inhabit the area have led to the implementation of a marine protected area around the islands (Neptune
Islands Group (Ron and Valarie Taylor) Marine Park; Department of Environment and Water
https://www.environment.sa.gov.au/marineparks/). This includes a no-take sanctuary zone around the
North Neptune Islands, where commercial and recreational fishing practices are prohibited (Figure

72
1.1). As a commonly targeted species for recreational and commercial fisheries across south-eastern
Australia (Lowry et al. 2016), an increase in the time spent and occurrence close to operator vessels
within the no-take zone may therefore have positive effects for the kingfish population residing at the
Neptune Islands. However, effectiveness of these no-take zones for aggregated populations are
dependent on compliance efforts to ensure illegal fishing does not occur (Read et al. 2011, Campbell
et al. 2012, Arias & Sutton 2013). Wildlife tourism can also assist in maximising the efficacy of
marine protected areas, by increasing conservation awareness and having a presence reducing illegal
fishing activities for both focal and non-focal species (McKeon & Drew 2019, Meyer et al. 2021a).
3.6 Conclusions
Findings from this chapter reveal that the behavioural effects of wildlife tourism extend
beyond the targeted species (i.e., white sharks) and have the potential to influence the residency and
space use of an upper-trophic level pelagic fish. Despite the weekly movements of kingfish not being
affected by cage-diving vessels, food-based operators increased time spent at the Neptune Islands
during the day and moved kingfish core space use. Potential flow-on effects from these behavioural
changes may lead to reduced individual and population fitness, highlighting the importance for marine
wildlife tourism management to expand beyond focal species and account for non-focal species.

73
Influence of shark tourism on the activity and physiological status of a
non-focal pelagic fish
Reproduced with permission from Andrew Fox (Rodney Fox Shark Expeditions)

74
4.1 Abstract
Wildlife tourism can have adverse effects on the behaviours and movements of animals,
leading to physiological consequences and impacts to the health and fitness of individuals and
populations. I used activity data collected through acoustic telemetry to show that the food-based
provisioning used in shark tourism increases activity in yellowtail kingfish (Seriola lalandi, kingfish,
n = 18), a large-bodied pelagic fish often associated with shark tourism vessels. Kingfish activity was
18% higher on days when operators using bait and berley were present compared to days with no
operators, or when only acoustic (i.e., non-food-based, 17% higher). Increased activity in response to
berleying was restricted to periods when kingfish were on the same side of the island group as tourism
vessels, but decreased after provisioning stopped and operators left the area. The incidence of burst
swimming events was also affected, with the ratio of burst behaviours increasing by 60% during
operations when food-based tourism operators were present. Kingfish activity and burst events also
increased in warmer temperatures. Despite this increase in fish activity and the frequency of burst
swimming events, likely associated with pursuing and feeding on baits and berley particles, the
physiological condition of kingfish (measured using bioelectrical impedance analysis) at the tourism
site remained consistent with kingfish from a control site that was not exposed to tourism (n = 113).
This suggests that kingfish were able to compensate their increased energy expenditure by feeding on
bait and berley used by operators or through natural foraging. These findings highlight that the effects
of provisioning from wildlife tourism can extend beyond changes in behaviours and movements and
can additionally influence the energetic condition of non-focal animals through increased activity.
However, supplemental food-sources provided through wildlife tourism, or changes in natural
foraging, may be sufficient to compensate for the increased energy expenditure and lessen the effects
of tourism on individual fitness and health.
4.2 Introduction
Knowledge of the activity of free-ranging organisms is essential to understand species’
behavioural ecology and examine how energy expenditure is influenced by abiotic factors (Brown et
al. 2004, Payne et al. 2011). The energetic cost associated with different activities can influence
growth, reproductive success, and ultimately survival (Brown et al. 2004), and subsequently provides
vital information for management and the understanding of ecological processes (Brown et al. 2004,
Cooke et al. 2004b). Suitability of the surrounding environment contributes to regulating the energetic
balance of animals, through prey availability and the subsequent energetic costs of finding and
consuming prey items. Changes to environmental conditions via natural (Pörtner et al. 2008, Payne et
al. 2011, Payne et al. 2013) or anthropogenic drivers (Pörtner & Peck 2010, Kreiss et al. 2015, Barnett

75
et al. 2016) can, therefore, impact predation efficacy, affecting energy budgets and innately have
implications for health and fitness. Identifying drivers of activity from free-ranging animals therefore
contributes to determining energetic expenditure and assessments of how environmental changes or
anthropogenic pressures influence animal behaviour at a functional level (Payne et al. 2010). Despite
the importance of understanding the energy costs associated with different activities, many methods
used to determine metabolic rate only provide a limited temporal resolution (e.g. doubly-labelled
water; Butler et al. 2004), or require loggers that need to be retrieved (e.g. heart-rate monitoring
methods; Butler et al. 2004). More recently, proxies of activity calculated from tri-axial
accelerometers (e.g. Overall Dynamic Body Acceleration; ODBA) has gained traction as a useful
method to estimate energetic status of free-ranging animals due to the positive relationship between
movement and oxygen consumption, inherently linked to metabolic processes (Yoda et al. 2001,
Wilson et al. 2006, Payne et al. 2011). Such activity proxies can help study relative changes in energy
expenditure in a range of taxa, including those in the marine environment which are often logistically
difficult to study, and identify factors contributing to shifts in the energetic strategies of these
individuals (Watanabe & Goldbogen 2021).
In addition to acute physiological responses of animals measured through activity metrics, physical
body condition is also broadly used to assess the nutritional and physiological status of fishes (Bolger
& Connolly 1989, Stevenson & Woods 2006, Brosset et al. 2015) and has been used as an indicator of
growth (Critchell & Hoogenboom 2018), reproductive condition (Trippel 2003), and mortality (Hoey
& McCormick 2004, Brosset et al. 2015). Metrics used to measure the body condition of fish,
including length-weight relationships (Fulton’s K; Nash et al. 2006), height (Richter et al. 2000),
hepatosomatic and gonadosomatic indices (Chellappa et al. 1995, Tierney et al. 1996, Lenhardt et al.
2009), and energy density (Hartman & Brandt 1995, Johnson et al. 2017) are typically insensitive,
lethal, or costly and time-consuming, or are restricted to laboratory procedures that measure specific
physiological parameters. More recently, sub-lethal methods of measuring body condition of fishes in
situ have been established. One such method is through electrical phase angle, which measures the
ratio of resistance and reactance of tissue to applied electrical current, measured through bioelectrical
impedance analysis (Cox & Heintz 2009). Phase angle allows for in-field measurements of body
condition from live individuals by combining a prompt field-based measurement, with the intricacy of
laboratory analysis by measuring both extra- and intracellular water distribution within the tissues of
an live individual (Cox & Heintz 2009). Phase angle has been applied to detect differences in
condition of fish at different stages (e.g. fed vs. fasted, and post mortem; Cox & Heinz 2009,
Champion et al. 2020a), changes attributed to preferable environmental conditions (e.g. wild vs.
hatchery, and winter vs. spring; Cox & Heintz 2009), and optimal oceanographic conditions
(Champion et al. 2020b). Body condition may therefore be used to reveal long-term changes in

76
physiological status due to ongoing effects from changes in activity budgets and energy expenditure
(Willis & Hobday 2008), and changed diets due to provisioned food sources.
Wildlife tourism is a form of human-animal interaction that can lead to lead to behavioural (Laroche
et al. 2007, Clua et al. 2010, Heinrich et al. 2021) and physiological (Barnett et al. 2016, Huveneers et
al. 2018) effects on focal- and non-focal species at tourism sites. The use of food-based attractant is
often required during tourism operations to aggregate focal species which are often sparsely
distributed, in low densities, and undertake large-scale movements, making it challenging to ensure
reliable and consistent interactions (Knight 2009, Gallagher & Huveneers 2018). When provisioned
food is provided in small quantities and at unpredictable times and places, feeding from wildlife
tourism can be an efficient technique for tourism operators to increase the likelihood of up-close
encounters for tourists (Knight 2009, Meyer et al. 2021b). However, frequent use of food-based
provisioning at tourism sites can have a multitude of detrimental effects on species occupying these
areas. For example, direct feeding of nocturnal species can invert diel behaviours, such as southern
stingrays Hypanus americanus at Stingray City Sandbar in the Cayman Islands (Corcoran et al. 2013).
Similarly, habituation towards supplemental food sources can restrict core area space use of some
marine species due to increased time spent within the vicinity of operators, rather than undertaking
natural behaviours such as searching for food (Huveneers et al. 2013, Rizzari et al. 2017). However,
assessment of species movement and residency patterns may not be sufficient to comprehensively
assess the impacts of provisioning tourism operations on the health and fitness of animals (Semeniuk
et al. 2009, Burgin & Hardiman 2015, Barnett et al. 2016). Food-based provisioning has also been
shown to alter the energetic responses and physiological condition of individuals at tourism sites
(Semeniuk et al. 2009). Frequent (i.e., near-daily) supply of supplemental food can increase activity
and frequency of burst events associated with pursing baits and fragmented particles in the water
column (Barnett et al. 2016, Huveneers et al. 2018), reflecting changes in metabolic efficacy that
ultimately influence critical biological and ecological processes (Brown et al. 2004). Food-based
attractant used by tourism operators is also often different to naturally-occurring prey items,
particularly for non-focal species which are indirectly fed, and is often consumed in much higher
quantities than regular prey due to ease of access. Persistent feeding on these unnatural food types can
lead to high parasite loads (Semeniuk et al. 2009, Brookhouse et al. 2013), raised stress hormones
(Semeniuk et al. 2009), and excessive fat deposits (Brookhouse et al. 2013). While few studies have
delved into the energetic and physiological responses of sharks (Barnett et al. 2016, Huveneers et al.
2018) and rays (Semeniuk et al. 2009), the effect of food-based wildlife tourism operations on the
energetic responses and physiology of highly-mobile large pelagic fish have rarely been quantified
(but see Brookhouse et al. 2013).

77
White shark cage-diving at the Neptune Islands, South Australia, provides an opportunity to assess
energetic and physiological responses to provisioning feeding practices on non-focal mobile pelagic
fish. Here, two companies use a near-constant plume of food-based attractant (berley; mixture of
minced southern bluefin tuna Thunnus maccoyii) and tethered baits to entice sharks into the field of
view of tourists (Huveneers & Lloyd 2017, Huveneers et al. 2017b, Meyer et al. 2020). A third
company uses acoustic stimuli (music played through underwater speakers) to attract sharks. While
sharks are not fed bait intentionally, small particles from bait and berley plumes in the water column
are eaten by smaller, non-focal species (e.g., smooth stingrays Dasyatis brevicaudata; Rizzari et al.
2017, trevally Pseudocaranx spp., horseshoe leatherjacket Meuschenia hippocrepis; Meyer et al.
2020). This indirect feeding has altered the diets of some of these fish, with a shift in fatty acid
profiles to more closely resemble the T. maccoyii baits rather than naturally-occurring prey sources
(Meyer et al. 2020), as well as contributing to changes in local assemblage abundance (e.g.
Pseudocaranx spp., M. hippocrepis, Whitmarsh 2019), and altered daily movements of some mobile
species (e.g., D. brevicaudata; Rizzari et al. 2017, kingfish; see Chapter 3). However, it remains
undetermined whether these changes contribute to physiological effects on the energetic balance and
physiological condition of non-focal species, as changes in space use and diet do not necessarily lead
to a change in the health or fitness of individuals (Gill et al. 2001, Beale & Monaghan 2004).
The yellowtail kingfish (Seriola lalandi, hereafter referred to as kingfish) is a large-bodied coastal-
pelagic fish, frequently occurring at the Neptune Islands Group. Kingfish are typically considered to
be mobile piscivores, capable of large-scale movements (i.e., up to 1000s of kilometres; Saul &
Holdsworth 1992, Gillanders et al. 2001), but individuals at the Neptune Islands are highly residential
throughout the year (Chapter 3) and are often observed feeding on the food-based attractant (Meyer et
al. 2020). It is possible that the occurrence of kingfish around cage-diving vessels pursuing baits and
feeding on bait and berley could translate to an increase in activity (Fitzpatrick et al. 2011, Barnett et
al. 2016), and that reliance on an unnatural prey source might limit natural foraging or lack nutritional
quality, resulting in poorly conditioned individuals (Meyer et al. 2020). Kingfish therefore provide a
model species to assess the potential effects of shark tourism on the activity and physiological status
of a non-focal, large pelagic fish. This study aimed to identify if cage-diving tourism influences the
activity and physiological status of kingfish at the Neptune Islands. Specifically, I hypothesised that a)
activity of kingfish increased when food-based cage-diving operators were present at the Neptune
Islands, and increased further when kingfish were in close proximity to the vessels, and b) body
condition of kingfish at the Neptune Islands was reduced due to increased activity and diet
modification from feeding on an unnatural prey item.
4.3 Methods
Site description

78
This study was undertaken at the North Neptune Islands group (hereafter referred to as Neptune
Islands), located ~30 km from mainland South Australia (Figure 1.1; 35°13.944’S; 135°03.834’E). An
array of 15 VR2-AR acoustic receivers (Innovasea, Nova Scotia, Canada, innovasea.com) was
deployed in November 2018 for a 2-year period. Receivers were positioned ~350 m from each other
in areas where cage-diving vessels anchor to ensure simultaneous tag detection by 2 – 3 receivers and
enable to estimate high-precision fish positions throughout the study period. This is also the side of
the island most protected from dominant winds and swell (Figure 1.1). Acoustic receivers also
recorded water temperature hourly, which was used to calculate daily mean water temperature.
Capture of kingfish
Between August 2018 and May 2020, 18 mature kingfish (> 80 cm total length; Gillanders et al. 1999,
Poortenaar et al. 2001) were caught via hook and line at the Neptune Islands, and tagged with V16A
98 x 16 mm (17.3 g; 1090 days battery life) or V13A 48 x 13 mm (6.5 g; 368 days battery life)
acoustic activity tags (Innovasea, Nova Scotia, Canada, innovasea.com). Acoustic tags were equipped
with acceleration sensors, which records measurements of acceleration (hereafter referred to as
activity). These tags are less sensitive than accelerometers used in Chapter 1, enabling long-term
monitoring of relative activity rather than fine-scale characteristics of behaviours (i.e., 12.5 Hz for one
second every 30 – 90 seconds vs. 50 Hz continually). Acceleration (± 4.9 m/s2 range) was sampled for
each transmission cycle and converted to a value by the onboard microprocessor using the root mean
square value of all three axes (activity = √[X2 + Y2 + Z2]). The static contribution to the overall
acceleration (g) was filtered out prior to root mean square calculation. Root mean square acceleration
resolution was 0.0191 m/s2 (Payne et al., 2011).
Body condition measurements: bioelectrical impedance analysis
Kingfish body condition was quantified using Bioelectrical Impedance Analysis (BIA) following the
protocols detailed by Cox & Heintz et al. (2009) and Champion et al. (2020a). Bioelectrical
Impedance Analysis measures two paths of electrical current, resistance (R) and reactance (Xc).
Resistance is a reflection of extracellular material (i.e., fat) which is nonconductive and is indicated
by higher measurements of R (Cox & Heintz 2009, Cox et al. 2011) in poorly conditioned individuals.
Reactance is measured as the total volume of healthy cells, indicated by the ability of a substance to
hold a charge (Gabriel et al. 1996, Hartman et al. 2015). Measurements of R and Xc were used to
derive values of electrical phase angle, which is an index of the metabolic condition of fishes (Willis
& Hobday 2008) and has been previously used to assess the body condition of kingfish through the
eastern Australian distribution of this species (Champion et al. 2020a):
phase angle (°) = �arctan �𝑋𝑋𝑐𝑐𝑅𝑅�� ×
180°𝜋𝜋

79
Phase angle provides a measurement of the angle between the R and Xc vector components of
impedance, ranging from 0 to 90°, where higher values represent good body condition as a result of
high readings of Xc which are indicative of a high proportion of intact cell membranes (Foster &
Lukaski 1996).
Phase angle measurements were taken from kingfish at the Neptune Islands between August 2018 and
July 2021 using BIA. Individuals were captured using the hook and line methods described above.
Three replicate BIA measurements were taken along the dorsal musculature of kingfish on a
nonconductive surface using the Seafood Analytics Certified Quality Reader (Certified Quality Foods,
Inc., United States of America, certifiedqualityseafoods.com), and mean of replicate measurements
was calculated for each kingfish. As body length does not influence phase angle measurements taken
for kingfish (Champion et al. 2020a), a direct comparison across individuals of different size classes
was not necessary. Although variation in reproductive status has the potential to influence phase angle
measurements due to increased lipid and moisture content during spawning periods (Jonsson et al.
1997, Domínguez-Petit et al. 2010), previous research has found no effect from reproductive status on
Dolly Varden (Salvelinus malma) sampled along the dorsal musculature, despite gonads being on
average 30 times larger in spawning vs. non-spawning individuals (Stolarski et al. 2014). Rather, by
sampling across dorsal tissue that doesn’t intersect with gonadal tissue, comparisons across different
class size is further justified (Stolarski et al. 2014). Data were compared with phase angle values
sampled for wild kingfish throughout the species’ eastern Australian distribution, where values >28°
(i.e., the median of 113 fish sampled) reflects individuals within the population that are in relatively
good physiological condition (Champion et al. 2020a).
Kingfish activity in response to cage-diving operations
Coordinates of anchored locations and time of cage-diving operations were collected through a
customised daily e-logbook (named FulcrumTM from November 2018 – February 2019 and White
Shark Cage-Diving app from March 2019 – August 2020; Nazimi et al. 2018). Boat position was
allocated to either north-eastern (latitude ≥ 35°13.68’S) or south-eastern (latitude ≤ 35°13.68’S) side
based on daily coordinates, and activity measurements were then assigned as ‘same side’ if the
detection occurred on the same side of the island as cage-diving operators were anchored, or ‘different
sides’ if the detection occurred on the opposite side. To reduce the effect from crepuscular patterns
influencing the activity of kingfish, only detections during the day were used by filtering for daytime
only using the getSunlightTimes function (package ‘suncalc’ version 0.5.0). Activity measurements
were also classified based on whether the detection occurred before, during, or after cage-diving
operations based on time of operation recorded on the White Shark Cage-Diving app. For days when
operators did not visit the islands, the average arrival (09:04:00) and departure (16:21:00) times were
used to assign a before, during, or after cage-diving operation category. Activity measurements

80
exceeding 4 m/s2 were identified as ‘burst events’, as this was the threshold expected to correspond
with burst feeding events in kingfish of similar size (see Chapter 2, Clarke et al. 2021). Daily ‘burst
ratios’ were calculated for each individual based on the number of burst events divided by the number
of detections for that day.
Statistical models
A series of generalised linear mixed models (GLMMs) were used to test the effects of cage-diving
operations on the behaviour of kingfish at the Neptune Islands. All models were constructed using the
lmer function in the ‘lme4’ package (version 1.1.23, Bates et al. 2015) in the R statistical environment
(version 4.0.2). The first model tested the effect of six different daily operator types (one food-based,
two food-based, acoustic only, acoustic + food-based, all operators, no operators) on kingfish activity,
while controlling for temperature and unobserved heterogeneity by adding temperature and
Transmitter ID to the model as fixed and random effects (slope + intercept), respectively. Absolute
temperature values collected from receivers were used instead of temperature anomalies, as sea
temperature has previously been linked to kingfish spawning behaviours (Moran 2007, Miller et al.
2011), persistence across oceanographic habitats (Champion et al. 2018), and physiological condition
(Champion et al. 2020). Study week (i.e., week since the start of the project, when first fish was
tagged) was included as a random effect to account for temporal autocorrelation. The most
appropriate statistical family, transformation, and validity of the model was determined by examining
the distribution of the response variable and visual inspection of residuals. Activity values were log-
transformed for models measuring effects from operator type, side of the island, and time of the day.
A second model tested for the effect of food-based vs. no provisioning on tagged kingfish activity.
Here, no-operator days and days that only acoustic attractant were present were classes as ‘no
provisioning’ and any operator type containing food-based attractant as ‘provisioning’. This model
included a before/after effect (i.e., whether activity measurements were taken before, during, or after
operators were present), a second control/impact effect (i.e., if detection occurred on the same ‘side’
of the island as cage-diving operations), and an interaction between these three terms representing the
Before After Control Impact (BACI) effect. Temperature (receiver temperature, °C) and Transmitter
ID were included as a random effect with randomised slope and intercept to account for potential lack
of independence in behaviour within fish. Activity values were again log-transformed prior to the
analysis.
A third model was used to test the effect of berleying operations on the burst ratio of kingfish during
hours of operation. This model included only measurements during cage-diving operations, and a
control/impact effect (i.e., if food-based or. no-food provisioning was used). Only detections during
food-based operations on the same side of the island as cage-diving operations were included as

81
provisioning days to assess burst ratio. Temperature and Transmitter ID were also included as a
random effect with randomised slope and intercept. A square-root transformation were deemed
necessary for burst ratio model due to the occurrence of 0 values when no burst events exceeding 4
m/s2 was recorded on a particular day.
All combinations of factors were run, with the most parsimonious model selected using Akaike’s
information criterion corrected for small sample size (Burnham & Anderson 2002) via the dredge
function from package ‘MuMIn’ (version 1.43.17). Deviance explained from all model factors
(conditional R2; Rc) and from only fixed-factors (marginal R2; Rm) were then estimated by subtracting
the deviance explained from the null-model from each alternative model. The ggpredict function
(package ‘ggeffects’ version 1.0.1) was used to estimate marginal means (predicted values) for fixed
effects included in top ranked models. Full models were:
Type: activity = Operator type + Temperature + Transmitterrand
Interaction: activity ~ Provisioning*Side*Time of day + Temperature + StudyWeek|Transmitterrand
Burst ratio: burst ratio ~ Provisioning + Temperature + Transmitterrand
4.4 Results
Activity measurements were obtained from 243,440 detections at the Neptune Islands. Over
95% of detections (232,928 detections) occurred during daylight hours, with 3% at night and < 1% for
dawn and dusk. Between August 2018 and November 2020, cage-diving operators were present on
62% of days (397 out of a possible 639 days). Activity of kingfish at the Neptune Islands was
influenced by operator type (2% deviance explained) and temperature (3%), with both factors
included in the top-ranked model and together explained 5% of the model deviance (Table 4.1a).
Activity was lowest on days when no operators were present (0.96 ± 0.04 m/s2) and on days with only
acoustic attractant (0.97 ± 0.04 m/s2; Figure 4.1a). Food-based operations led to an increase in
kingfish activity, with activity higher on days when one (1.06 ± 0.04 m/s2), or two (1.09 ± 0.04 m/s2)
food-based operators were present (Figure 4.1a; Table S3). Activity of kingfish increased with water
temperatures with this effect slightly larger than operator type (Figure 4.1b, Table S3). Activity also
varied between individual kingfish, which explained 7% of the model deviance.

82
Figure 4.1. Predicted activity (m/s2; marginal means) from Generalise Linear Mixed Model of
kingfish at the Neptune Islands with different tourism operator types (food-based = red, acoustic
attractant = blue, no operator days = black).
Provisioning, time of day, side of the island
The effect of food-based attractant on kingfish activity was influenced by all three fixed-effects
(provisioning, side of the island, and time of day) and each of their two-way interactions (Table 4.1b)
as well as a positive relationship with temperature for all interactions (Figure 4.2). The top-ranked
model also included the interaction between all three factors (Table 4.1). Interactions explained 4% of
the model variation, but there was also high variability between individuals, with random factors
explaining 33% of the total variation (Table 4.1). When kingfish were detected on the same side of the
Two food-based No boat day One food-based Two food-based
Acoustic One food-based + Acoustic All operators

83
island as food-based operators, activity was 18% higher during operations than when non-food-based
operators were present (0.92 ± 0.05 – 1.1 ± 0.05 m/s2). There was, however, no effect on kingfish
activity when kingfish were on opposing side to the operators (1.01 ± 0.04 – 1.05 ± 0.05 m/s2; Figure
4.2). The effect of operators on kingfish activity was also supported by the difference in activity being
greatest during tourism operations, with little differences observed prior to the operators arriving
(Figure 4.2, Table S4). After operators left the Neptune Islands, activity on days that food-based
operations occurred returned to levels that resembled days that no food-based attractant was present
on the same side of the island, but was higher than after operations when operators were on both the
same and opposing sides of the island (Figure 4.2, Table S4).
Figure 4.2. Predicted activity (marginal means ± SE) from Generalised Linear Mixed Model of
kingfish at the Neptune Islands showing the interaction between same (solid) and different (dashed)
sides of the island with food-based (red) and non-food-based (black) operations across sampling
temperature. Panels represent different times of day.

84
Burst events
Across the sampling period, 3,366 burst events exceeding 4 m/s2 were detected, ranging between 1 to
26 events per day by individual kingfish. Burst ratio (number of burst/number of detections) for each
day ranged from 0 to 0.5 (mean = 0.02 ± 0.0008). Food-based operations (3% of variance) and
temperature (2% of variance) affected burst ratio, however, there was also a large amount of variation
in burst events amongst individuals with 14.1% of the variance of the model explained by individual
Transmitter ID (Table 4.1c). Burst behaviours increased by ~60% with the presence of food-based
operators (from 0.0048 ± 0.01 m/s2 to 0.003 ± 0.12 m/s2; Table 4.1, Figure 4.3).
Figure 4.3. Predicted burst ratio (events exceeding 4m/s2/total daily detections) from Generalised
Linear Mixed Model of kingfish on days with food-based operators (red) and no food-based attractant
present (black).

85
Table 4.1. Summary of models to estimate effects of cage-diving operations on kingfish activity. df, degrees of freedom; AICc , Akaike's information
criterion corrected for small sample size; degrees of freedom (df); log-likelihood (logLik); ΔAICc , difference in AICc between the current and the top-ranked
model (ΔAICc); wAICc , model probability; Rm, marginal (fixed effects) R2; R, conditional (fixed and random effects) R2. Only the top 5 ranked models are
presented for table clarity.
Model df logLik AICc ΔAICc wAICc Rm Rc
a) Operator type
Activity ~ Operator Type + Temperature 9 -161400 322818.1 0 1 0.04 0.12
Activity ~ Temperature 4 -162679 325366.3 2548.21 0 0.03 0.11
Activity ~ Operator Type 8 -164688 329392.8 6574.71 0 0.02 0.08
Activity ~ 1 (intercept only) 3 -166510 333025.1 10207.02 0 0.00 0.07
Model df logLik AICc ΔAICc wAICc Rm Rc
b) Interaction
Activity ~ Provisioning + Time + Side + Temperature + Provisioning*Time + Provisioning* Side +
Time*Side + Provisioning*Time*Side 17 -159505 319043.9 0 0.75 0.037 0.366
Activity ~ Provisioning + Time + Side + Temperature + Provisioning*Time + Provisioning* Side +
Time*Side 15 -159508 319046.1 2.22 0.25 0.037 0.359
Activity ~ Provisioning + Time + Side + Temperature + Provisioning* Side + Time*Side 13 -159515 319056 12.11 0.002 0.037 0.359
Activity ~ Provisioning + Time + Side + Temperature + Provisioning*Time + Time*Side 14 -159577 319180.9 137.07 0 0.037 0.353
Activity ~ Provisioning + Time + Side + Temperature + Provisioning* Side 12 -159585 319193.2 149.37 0 0.037 0.355

86
Model df logLik AICc ΔAICc wAICc Rm Rc
a) Burst ratio
Burst ratio ~ Provisioning + Temperature 5 1677.5 -3344.9 0 0.884 0.019 0.180
Burst ratio ~ Temperature 4 1674.1 -3340.1 4.84 0.078 0.012 0.168
Burst ratio ~ Provisioning 4 1673.3 -3338.6 6.31 0.038 0.010 0.158
Burst ratio ~ 1 (intercept only) 3 1667.2 -3328.4 16.57 0 0.000 0.141

87
Kingfish body condition
Body condition was calculated from 39 kingfish caught at the Neptune Islands. Kingfish were 52 –
165.5 cm total length and sampled from water temperatures between 16.01 – 19.8°C. All acoustically-
tagged kingfish showed high levels of residency (0.42 – 0.69 residency index [days detected/days at
liberty], mean = 0.55 ± 0.04; Figure 4.4a). Phase angle ranged from 26.17 – 35.83° (mean = 30.20 ±
0.38°, Figure 4.4b) and was not influenced by water temperature at the time of sampling or body
length, with the top-ranked model not including any fixed effects (wAICc = 0.53). Of the 39 fish
sampled, 77% (including three acoustically-tagged individuals) had phase angle values similar to
kingfish considered in good body condition (i.e., > 28° as per Champion et al. 2020a).
Figure 4.4. a) Residency of acoustically-tagged kingfish at the Neptune Islands, with individuals
sampled using Bioelectrical Impedance Analysis in dark blue, unmeasured individuals in light blue.
Crosses represent date that body condition measurements were taken. b) Body condition (electrical
a)
b

88
phase angle) of kingfish sampled at the Neptune Islands during food-based provisioning operations.
Blue circles represent acoustically-tagged individuals, black circles are untagged kingfish. The
horizontal dashed line (y = 28) represents value above which kingfish are considered in good body
condition based on phase angle measurements from 113 kingfish sampled throughout eastern
Australia (provided from Champion et al. 2020b).
4.5 Discussion
This study revealed that the use of bait and berley during white shark cage-diving increased
kingfish activity and frequency of burst events, which could potentially affect the energy budget,
health, and fitness of these individuals. Activity increased on days when food-based operators were
present at the islands, but not when sound was the only attractant used. The increased activity was
only identified when fish were on the same side of the island as operators using food-based attractant,
suggesting that the effects from these operators were restricted to within ~500 m to vessels. Activity
of kingfish also fluctuated throughout the day, being at their highest during berleying activities when
operators were on the same side of the island. In comparison, activity remained consistent and lower
throughout the day when operators using food products were not present, or when they were on
opposite sides of the island to the kingfish at the time of the detection. However, the observed activity
increase did not lead to low body condition of these individuals, suggesting that the changes incurred
by the cage-diving tourism does not result in reduced physical condition or fitness.
Kingfish activity was 18% higher during operations on days when food-based operators were at the
Neptune Islands compared to days when these operators were not present. In comparison, no change
was observed when the acoustic operator was present, suggesting that the increased activity is
associated with the use of bait and berley rather than the mere presence of the cage-diving vessels.
Changes in activity are reflective of raised energetic expenditure, and is linked to shifts in metabolic
rate (Wilson et al. 2006, Gleiss et al. 2011b, Lear et al. 2017). Raised activity cost during cage-diving
operations might raise kingfish energy expenditure above that incurred during naturally-occurring
behaviours, which can lead to ongoing effects on growth, reproductive health, and ultimately fitness
and survival (Videler & Weihs 1982). Mobile pelagic fish such as kingfish are capable of high-speed
burst behaviours to capture fast-swimming prey and avoid predation (Block et al. 1992b), but the high
frequency of bursts of activity during cage-diving activities (60% increase) might further affect
kingfish energetic budgets, as well as increases risk of physical injury though collisions with vessels,
cages, or interspecific species (Brookhouse et al. 2013). These high-acceleration behaviours likely
occur when freshly tethered baits are thrown in the water, resulting in individuals dashing towards the
food-source. Such burst events in pelagic fish require anaerobic effort and can result in decreased
blood pH and oxygen uptake for several hours (Jones 1978, Randall et al. 1987). As a result, increased
frequency of burst swimming behaviours has the potential to disrupt essential biological functions that

89
require oxygen (e.g., respiration, feeding, locomotion, predatory avoidance, reproduction; Kramer
1987). Additionally, kingfish are highly residential to the Neptune Islands (residency of some
individuals reaching 80%, Chapter 3), with food-based tourism practices further increasing the
number of hours spent at the tourism site. These compounding effects could lead to kingfish
exhausting anaerobic energy stores which are required to capture prey items, reproduce, or avoid
predators (Payne et al. 2011), and in the long-term limit growth and reproductive success of
individuals and populations (Brown et al. 2004, Tomlinson et al. 2014).
The increase in kingfish activity when food-based operators were present was limited to occasions
when kingfish were detected on the same side of the Neptune Islands as operators. The geological
formation of the Neptune Islands essentially segregates the north- and south-eastern sides of the
island, with a small gap in-between (~250 m in width; Figure 1.1). The bait plume and berley particles
might therefore be restricted to the side of the Neptune Islands where it is used and disbursed, not
being transported to the other side and influencing kingfish there. While might be appealing to restrict
cage-diving operations to one side of the Neptune Islands to minimise the impact of shark tourism on
kingfish, mobile pelagic species like kingfish (Chapter 3), trevally (J Dennis, unpublished data), and
white sharks (C Huveneers, pers obs.) can move between the north- and south-eastern sides of the
Neptune Islands within a few minutes and have been observed to interact with vessels on both sides of
the Neptune Islands on the same day. Therefore, restricting operators to one side of the Neptune
Islands is unlikely to be an effective approach to reduce the impact of the cage-diving industry on
kingfish activity. Management efforts, if required, should instead focus on temporal restrictions (i.e.,
daily operating hours, number of days of operation) or limiting bait and berley quantities, both of
which are already in effect (DEW 2016).
Some wildlife tourism ventures strive to combat negative effects from operations by enforcing strict
operating time limitations to reduce the degree of interaction of wildlife with companies (Trave et al.
2017). However, behavioural shifts from supplemental feeding practices can additionally extend
beyond operating hours, inverting naturally occurring diel activity patterns (Corcoran et al. 2013).
Findings from this study suggest that kingfish activity remained slightly elevated after operators have
left the islands, however this was apparent for both food-based and non-food-based days but only
when operators were on the same side of the island as operators. This poses additional difficulties
when attempting to quantify the effect of wildlife tourism on the health of animals, given that
physiological effects can extend beyond times that fish are interacting with tourism operators. Diurnal
rhythms in activity and associated energy budgets are common amongst pelagic piscivores and are
often associated with feeding behaviours and prey availability (Arostegui et al. 2020). Like most
large-bodied pelagic fish, kingfish are visual diurnal predators which actively search to find prey
during the day (Pankhurst 1989, Silvano 2001). Observed changes in kingfish activity during

90
berleying operations could therefore disrupt natural activity patterns attributed to foraging, increasing
the reliance of these individuals on the provisioned food sources from operators.
Although food-based operations increased the activity and burst events of kingfish which has the
potential to negatively affect the health and fitness of individuals, this study showed that these
changes did not translate to a decrease in physiological condition. Based on body condition of
kingfish in eastern and southeast Australia, individuals at the Neptune Islands were of relatively good
physiological status (Cox & Heintz 2009, Champion et al. 2020a) and of similar condition to kingfish
from a highly suitable habitat (Champion et al. 2020b). Body condition is inherently linked to the
composition of healthy cells and permeability of cell membranes, and has previously been used to
detect unfavourable environmental conditions (Champion et al. 2020b), risk of predation (Hoey &
McCormick 2004), and effects from anthropogenic stressors (Cavraro et al. 2019). The lack of
reduced body condition despite increased activity might be due to the provisioned food source
provided by the food-based operators (bait and berley) which is fed upon by kingfish (Meyer et al.
2020) and is of high nutritional value. The southern bluefin tuna used as bait and berley by cage-
diving operators are acquired locally from aquaculture operations in Port Lincoln, less than 50 km
from the Neptune Islands. Tuna are fed locally sourced baitfish i.e., sardines Sardinops spp., that are
high in natural proteins and oils, and as a result contain high levels of nutritional fatty acids, including
omega-3 fatty acids (Glencross et al. 2002, Gregory et al. 2010, Pethybridge et al. 2015). While not a
naturally-occurring prey item for kingfish, this dietary shift to southern bluefin tuna may, therefore, be
comparable, if not more nutritious than the common prey items of kingfish (e.g., small pelagic fish,
squid, crustaceans; Gomon et al. 2008, Meyer et al. 2020). This subsidised food source may be
compensating for increasing the energy cost during and following cage-diving operations (Barnett et
al. 2016), resulting in a lack of effect on body condition. The consumption of food-based attractant
could in fact be necessary to compensate for the increased energy expenditure during interactions with
cage-diving vessels. A similar instance of food-based wildlife tourism influencing activity budgets has
been described, whereby the activity and associated metabolic rate of whitetip reef sharks
(Triaenodon obesus) increased by 6.37% on feeding days, with sharks required to increase food
consumption (e.g., baits) to compensate and maintain constant body mass (Barnett et al. 2016).
However, reliance on tuna as a food source may also decrease kingfish dietary diversity, which can
influence gut microbiome communities and disease control (Bolnick et al. 2014) and resultingly affect
health and reproductive output (Kowalczyk et al. 2014). There may also be other health impacts for
kingfish that is not measured through BIA. For example, kingfish fed with bread and aquaculture
pellets at a fish-feeding site at Lord Howe Island (NSW, Australia) demonstrated dependency on
supplemental food, raised aggression, frequent skin lesions and stomach ulcers, and heightened
parasite loading (Brookhouse et al. 2013). Kingfish that fed on bread and pellets at Lord Howe Island
had excessive fat deposits, which would be expected to be represented by poorly conditioned fish

91
indicated through bioelectrical impedance values. Kingfish at the Neptune Islands, however, were
found to have comparable body condition to individuals from a control site. The relatively good
condition of kingfish at the Neptune Islands compared to those fed on Lord Howe Island further
suggests that T. maccoyii is a nutritionally high-quality supplemental diet (in comparison to bread,
aquaculture pellets) which may be compensating for the increased energy expenditure during cage-
diving operations. The sensitivity of this method to detect subtle changes in physical condition from
varying food intake and environmental conditions, suggests that phase angle should be suitable to
detect physiological change due to unfavourable dietary sources. However future research into
physiological shifts in response to provisioning wildlife tourism would benefit from more sensitive
measurements of physiological changes (e.g., increased stress hormones; Iwama et al., 1998, Peter
2011, changes in blood glucose, lactate build up; Barton et al. 2002) to be paired with energetics
inferred through activity metrics, but these methods are more intrusive and time-consuming for field-
based studies.
4.6 Conclusions
Findings from this study identified impacts from white shark cage-diving tourism on the
physiological responses of kingfish, highlighting potential implications for the daily energy budgets
and resulting consequences for the health and fitness of these individuals. These results reveal that
impacts on activity from food-based wildlife tourism can extend beyond focal-species, and
additionally have effects on non-focal individuals, which is particularly pervasive for highly mobile
and active individuals such as mobile pelagic fish. Future research would benefit from quantifying the
calorific value and quantity of bait and berley consumed by kingfish, in combination with to
respirometry data (Brodie et al. 2016) to help provide a clearer estimation of metabolic processes
reflected through energetic status of effected individuals (Brunnschweiler et al. 2018), but these
practices are often expensive and logistically difficult to execute on mobile pelagic fish. Such
information of these implications is important for the development of adequate management wildlife
tourism frameworks which often largely focus only on impacts to focal-species (Higginbottom et al.
2003, Meyer et al. 2020, Meyer et al. 2021a), with little consideration for highly mobile non-focal
animals such as pelagic fish.

92
Environmental drivers of yellowtail kingfish activity across south-eastern Australia inferred through a national network of acoustic tracking arrays
Image removed due to copyright restriction. Original can be viewed
at:
https://www.34south.com.au/gallery-6-4

93
5.1 Abstract
Environmental conditions (natural or influenced by humans) can affect the behaviours and
movements of organisms in marine ecosystems. Identifying species response to variations in
environmental conditions and the relationships between the environment and species ecology can
contribute to proactive and adaptable management, but can also be logistically challenging. Activity
(measured via acceleration) provides an insight into energetic expenditure of animals which is linked
to movement, behaviour, and physiological processes. This study used a network of acoustic tracking
receivers (n = 93) across south-eastern Australia to identify the effects of environmental conditions on
the activity of yellowtail kingfish (Seriola lalandi, n = 63). Activity, calculated through accelerometer
sensors via acoustic tracking, was tested against geographical (latitude, bathymetry, distance to land),
environmental (sea surface temperature, tide height, moon fraction, hour of the day), and biological
(individual length) factors to identify drivers of kingfish activity. Sea surface temperature, hour of the
day, and bathymetry strongly influenced the activity of kingfish, while activity slightly decreased
during high tide height and moon fraction. Differences in activity and movement (residency and space
use) within a small temperate estuary (120 km2) were further investigated in a case study of a seasonal
kingfish aggregation in Coffin Bay, South Australia. Kingfish remained in Coffin Bay during warm
months (September – April), with a complete exodus from the estuary in winter. While residing in
Coffin Bay, activity varied between interconnected areas, with temperature, hour of the day, tide
height, and moon fraction also influencing kingfish activity. These results reveal that energetic
responses of kingfish are sensitive to long-term (i.e., seasonal sea surface temperature) and diurnal;
(time of day, photoperiod) changes in the environment, which can regulate behaviours and
physiological processes. Findings from this study have implications for the energetic budgets of large
pelagic fish in sub-tropical and temperate regions, which are facing rapidly changing climates. This is
also the first study to highlight the potential for national-scale acoustic tracking to go beyond
quantifying residency and movements, and describe physiological responses to changing
environments for highly mobile and broadly-distributed species.
5.2 Introduction
Environmental processes in marine environments are complex and highly variable, and can
have substantial impacts on the behaviours and movements of animals (Pörtner & Peck 2010,
Udyawer et al. 2013, Heupel & Simpfendorfer 2014). Such changes can occur across different
temporal scales, from acute behavioural responses over daily cycles (e.g., daily cycles of tidal
currents, moon periods; Naylor 1999, Brownscombe et al. 2014) to chronic changes in movements
due to more gradual environmental shifts (e.g., phenological temperature changes, photoperiod;
Schlaff et al. 2014, Udyawer et al. 2015). These behavioural shifts can lead to positive outcomes such
as increased access to nutrients or productive thermal shifts to increase recruitment (e.g.,

94
Morrongiello et al. 2014), or in some cases can have negative outcomes such as reduced resource
availability, unfavourable thermal conditions, and increased energetic demands (Magnuson et al.
1990, Sorte et al. 2013). While the spatial movements and temporal persistence of some species
linked to environmental conditions have been identified (Ackerman et al. 2000, Block et al. 2001,
Udyawer et al. 2015), there has been a paucity of information in the effects of environmental drivers
on the energetic status of free-ranging animals. Identifying how environmental variability can
influence the activity of animals can therefore contribute towards understanding the effects of natural
and anthropogenic-driven changes on the physiology of marine species (Udyawer et al. 2015).
While some marine fishes are endothermic (e.g., tunas, lamnid sharks), most marine teleosts are
ectotherms that cannot thermoregulate internally (Wright & Cooper 1981, Johnston & Dunn 1987).
To compensate, behaviours and movements of ectothermic fish are inherently linked to temperature
changes in their surrounding environment, as individuals seek favourable areas to facilitate essential
physiological processes (i.e., metabolism, oxygen uptake, immune response; Wright & Cooper 1981,
Pörtner et al. 2001, Whitney et al. 2007). As a result, most mobile temperate pelagic species are
typically more active or mobile during warm periods or within warm areas, due to increased energetic
expenditure generated through active behaviours (e.g., swimming, foraging, spawning; Brodie et al.
2016, Payne & Smith 2017, Matley et al. 2020). Additionally, warm temperatures provide conditions
that facilitate breeding opportunities and the survival and growth of early life-stage marine animals
(Schofield et al. 2009, Payne et al. 2011, Matley et al. 2020). However, warming temperatures can
exceed thermal tolerances, reaching levels at which physiological processes and energetic gains can
decline (Johansen et al. 2015, Payne et al. 2016, Payne & Smith 2017). As temperate ecosystems
continue to face fast-warming conditions (Müller et al. 2009, Hobday & Lough 2011), energetic
budgets of ectothermic species are at risk of exposure to unfavourable conditions that can lead to
implications on frequency and functioning of important behaviours and associated physiological
processes. Identifying the activity responses of ectothermic pelagic fish across varying temperature
conditions, therefore, offers valuable insights to inform climate and environmental variability models
(Malishev et al. 2018). While temperature is arguably the most notable driver of activity, various
other environmental parameters have the potential to influence behaviours and movements of
ectothermic fish species. Shifts in salinity (Collins et al. 2008, Bernal et al. 2012), tidal patterns
(Medved & Marshall 1983, Ackerman et al. 2000, Embling et al. 2013), bathymetry (Maravelias
1999, Hobday & Campbell 2009, Embling et al. 2013), current velocity and direction (Gaspar et al.
2006, Sleeman et al. 2010, Brodie et al. 2015), among a number of other abiotic factors (Schlaff et al.
2014) have the potential to influence movements and behaviours of marine ectotherms and
subsequently has implications for energetic budgets. Revealing spatial patterns of activity associated
with environmental factors can untangle interactions between highly mobile taxa and their

95
surrounding environment, beyond traditional tracking methods (e.g., acoustic telemetry, mark-
recapture) which only quantify geographical movements of animals.
Yellowtail kingfish (Seriola lalandi; hereafter referred to as kingfish), is a large-bodied carangid
distributed circumglobally across coastal pelagic environments in temperate and sub-tropical oceans
(Gillanders et al. 2001, Gomon et al. 2008). As a palatable table fish, kingfish support large
recreational and commercial fisheries in Australia (Henry & Lyle 2003, Lowry et al. 2016), but are
additionally recognised as a popular catch and release target amongst game fishers which has resulted
in a large input of movement information from government supported tagging programs (e.g., New
South Wales Game Fish tagging program). The south-east Australian distribution of kingfish (from
southern Queensland [QLD], through New South Wales [NSW], Victoria [VIC], and Tasmania [Tas],
to the western boundary of South Australia [SA]) is comprised of one, single population which is
genetically distinct from Western Australia (WA; Miller et al. 2011). Kingfish abundance in east
Australia’s coastal areas increases in summer and autumn in response to warming conditions
generated through shelf incursions from the East Australian Current (Brodie et al. 2015). Sea level
anomalies, eddy kinetic energy, and oceanographic conditions around topographic features are also
significant environmental predictors for the distribution of kingfish in southern Australia (Hobday &
Campbell 2009, Brodie et al. 2015). This distribution and occurrence of kingfish along Australia’s
eastern coast has shifted poleward over the past 20 years in response to climate-driven shifts,
changing the environmental conditions and habitats that individuals may naturally be exposed to
(Champion et al. 2018). Kingfish in Australia can also undertake large-scale movements (up to 1000s
of kilometres) between Australian state boundaries (Gillanders et al. 2001), and internationally with
some individuals travelling between Australia and New Zealand (Saul & Holdsworth 1992).
Throughout shifts in the distribution and large-scale movements across temperate (i.e., SA – southern
NSW) and sub-tropics (i.e., northern NSW), kingfish in the south-eastern population are exposed to a
range of environmental conditions which have the potential to influence energetic expenditure.
Despite studies of movement compiled through recreational tagging programs (Gillanders et al. 2001,
Hutson et al. 2007, Brodie et al. 2015) and studies investigating the site-specific habitat use of
kingfish (Hobday & Campbell 2009, Roberts et al. 2011, Brodie 2016), environmental drivers of
activity and energetic performance across south-eastern Australia have not been investigated.
This study assessed the activity (inferred through acceleration) of kingfish in south-eastern Australia
(western SA to northern NSW) to determine chronic and acute environmental drivers of activity.
Specifically, I collated acoustic tracking data from a national-scale animal tracking database and
collaborative tagging projects to assess changes in kingfish activity in response to environmental,
geographical, and biological factors. This study also included a case study within a small semi-

96
enclosed estuary system (Coffin Bay, South Australia) to determine fine-scale activity changes within
different interconnected areas across a small geographic scale (~ 120 km2).
5.3 Methods
Study sites
South-eastern Australia
Acoustic tracking receiver arrays were deployed across > 2,500 km of coastline in south-eastern
Australia (Figure 5.1a), encompassing temperate to sub-tropical habitats in NSW, VIC, and SA
through a collaboration across three locally-focused projects (Figure 5.1b, Table S5). Raw detections
and activity metadata was sourced through the Integrated Marine Observing System (IMOS)
Australian Animal Acoustic Telemetry Database (animaltracking.aodn.org.au; Hoenner et al. 2018).
Acoustic arrays included a combination of VR4, VR2W, and VR2AR acoustic receivers (Innovasea,
Nova Scotia, Canada, innovasea.com) with kingfish detections collected from 96 receivers (Figure
5.1; NSW = 51, SA = 45). Receivers in VIC detected too few individuals for sufficient analyses of
activity (n kingfish = 1, detections = 10) and, thus, were not included. Receiver installations within
each state included the North and South Neptune Island Groups and Coffin Bay (SA), and Narooma,
Sydney (coastal), Sydney Harbour, and Coffs Harbour (NSW) (Figure 5.1). Due to potential influence
from cage-diving operations on kingfish activity at the Neptune Islands (see Chapter 4), detections on
days that shark cage-diving operators visited the islands were not included.
Coffin Bay
Coffin Bay is a shallow (< 9 m) inverse estuary system comprised of interconnected bays located on
the southern tip of the Eyre Peninsula, South Australia (34°37’18.84”S, 137°27’ 59.76”E; Kämpf &
Ellis 2015; Figure 5.1b). Mean bathymetry in the system is ~2.6 m and total length is ~25 km (Kämpf
& Ellis 2015). The mouth of the bay is a narrow opening created from a long (~5 km) spit of sand
which limits exchange of estuarine water with ambient shelf water. This main body of the bay
narrows to smaller interconnected sections (hereafter referred to as areas; Fig 5.1b), with two smaller
islands named the Brothers. Long beach is an extended stretch of sand on the southern side of Coffin
Bay, with a deep channel (8 – 9 m) that connects the outer areas to the inner bays of the system
(Figure 5.1b). Dutton and Kellidie Bays are inner areas to the north and east of Long Beach,
respectively. Each of the interconnected areas of the estuary have variable depths, flushing time,
oceanographic conditions, and biota (Kämpf & Ellis 2015), in addition to unique assemblages of
fauna (Whitmarsh et al. 2020). An array of 28 VR2W acoustic receivers (Innovasea, Nova Scotia,
Canada, innovasea.com) were deployed throughout Coffin Bay in November 2019 prior to tagging of
kingfish. Receivers were deployed throughout the estuary with a maximum distance of ~700 m apart,

97
to form acoustic gates at the entrance to each area, enabling the detection of individuals moving
between each area (Huveneers et al. 2016). Receivers were fixed into the benthos on galvanised star-
pickets and serviced annually.
Capture and tagging of kingfish
Between March 2009 and March 2020, 59 kingfish were captured via hook-and-line and tagged with
V9/V13/V16 AP64 acoustic activity tags (64/126 – 369/1090 days battery life, respectively;
Innovasea, Nova Scotia, Canada, innovasea.com) in Sydney Harbour (n = 34), Coffs Harbour (n = 7),
and the Neptune Islands (n = 18). Acoustic tags were equipped with acceleration sensors, which take
measurements of acceleration (hereafter referred to as activity). Acceleration (± 4.9 m/s2 range) was
sampled for each transmission cycle and converted to a value by the onboard microprocessor using
the root mean square value of all three axes (activity = √[X2 + Y2 + Z2]). The static contribution to the
overall acceleration (g) was filtered out prior to root mean square calculation. Root mean square
acceleration resolution was 0.00139 – 0.01922 m/s2 (Payne et al. 2011). An additional four
individuals were tagged in western Victoria (38°24'41.1"S, 142°00'32.7"E; Lady Julia Percy Island
[Deen Maar]), but only one individual was detected (10 detections) 21 km from tagging location
(Fitzroy River entrance; 38°16'03.3"S 141°50'48.9"E) and so was not included in activity analyses.
Total length of individuals ranged from 465 – 1,510 mm (mean = 865 ± 38 mm), though fish tagged
in NSW were generally smaller (465 – 890; mean = 637 ± 15.8 mm TL) compared to individuals
tagged in South Australia (800 – 1510; mean = 1,195 ± 39.9 mm TL). In November 2019, six
additional kingfish were caught via seine net in Coffin Bay. All kingfish were tagged within the
Kellidie Bay area, from two shots of the seine net. All fish were internally tagged with transmitters
following standard surgical techniques (Taylor et al. 2013).

98
Figure 5.1. Map showing location of acoustic receiver arrays (red circles) in a) Australia, state subsets showing acoustic installations for b) New South Wales
and c) South Australia (Coffin Bay inset), and detailed installation arrays in d) Sydney Harbour and e) Coffin Bay.
a)
e) d)
Sydney (Harbour/coastal)
Narooma
Coffs Harbour
Coffin Bay
Mount Drummond
Neptune Islands (North/South)
b) c)
NSW
SA

99
Extraction of environmental parameters
Analyses of kingfish activity was performed in the R statistical environment (version 1.2.5033).
Measurements of interpolated daily sea surface temperature (GHRSST data, 15 km resolution),
bathymetry (m; Geoscience Australia, 250 m resolution), distance to nearest landmass (km),
combined current velocity (m/s2) and bearing (°) were extrapolated using the env_extract function
from the package ‘IMOSTrack’ (in development; Table 5.1). For locations that were missing derived
environmental information, nearest pixel averages were calculated to assign approximate values (see
Table 5.1 for geographical extent of interpolation). Hourly predictions of tide height derived from
global models based on nearest tide gauge observations and supplied from the Bureau of
Meteorology. Moon fraction (as a fraction of 0.0 [new moon] – 1 [full moon]) was calculated from the
getMoonIllumination function from the package ‘suncalc’ (version 0.5.0). Fortnightly mean
temperature and salinity data for Coffin Bay was obtained from the Primary Industry and Regions of
South Australia Shellfish Quality Assurance Program (SASQAP) across three locations due to poor
spatial resolution from satellite data.
Residency times and space use in Coffin Bay
Residency time in each area (time in days spent by kingfish in each area receiver array) was
calculated using the residency function in the ‘actel’ package (version 1.2.1; Flávio & Baktoft 2021)
based on time between first and final detections from receivers within the area array. Monthly
utilisation distributions (UDs) were estimated for each kingfish using the dynBBMM function from the
‘Refined Shortest Path’ (RSP) package (version 1.0.1.9003; Niella et al. 2020). This function uses the
Brownian-bridge approach to account for variable temporal windows between detections across all
individuals (Horne et al. 2007). Contours were calculated for 50% (BBKUD-50; core) and 95%
(BBKUD-95; extent) space use estimates, representing where animals spent 50 and 95% of the
tracking time respectively.
Statistical analyses
To assess environmental drivers of kingfish activity across south-eastern Australia, activity
measurements were examined in response to environmental parameters. The relationship between
environmental variables (Table 5.1) and activity were tested using a Generalised Additive Mixed
Model (GAMM), through the gam function (package ‘mgcv’, version 1.8.33). Fish length was
included as an additional biotic factor but was highly correlated with sea surface temperature (r = -
0.80) due to discrepancies in fish size between sampling locations and removed from the model.
Factors were tested for correlation using UncertCoef (categorical factors, package: ‘DescTools’
version 0.99.42) and cor.test (numeric factors, package: ‘stats’ version 3.6.2). A hierarchical cyclic

100
cubic spline was fit to account for ordinal cyclical features of hour of the day (i.e., 1 – 23). Four
individuals from NSW were detected fewer than 10 times and were removed from subsequent
analyses. The full south-eastern Australia activity model was:
activity ~ Latitude + SST + Bathy + Tide + Moon + Dist2land +
Hour + Transmitterrand + Yearrand
A second GAMM was used to test the effect of environmental factors (temperature, tide, moon
fraction, hour) on the activity of kingfish in different areas of the Coffin Bay estuary system.
Interactions between each area of Coffin Bay with environmental factors were tested to identify
differences in kingfish responses in each area. Bathymetry was highly correlated with area (r = 0.96;
i.e., all receivers within each area were of similar bathymetry) and was not included in mixed-effect
models. The full Coffin Bay activity model was:
activity ~ Temperature*Area + Tide*Area + Moon*Area + Hour*Area +
Transmitterrand + Weeknumberrand
Generalised Linear Mixed Models (GLMM, function lmer; package ‘lme4’ version 1.1.23) were used
to predict the monthly residency and space use of kingfish in Coffin Bay. Month and temperature
were highly correlated, so categorical month was removed from GLMMs. Models for residency time
in each area of the system were tested in response to temperature. Core (50% BB-KUD) and extent
(95%) range of movements were also modelled in response to temperature, but as BB-KUD’s were
not calculated for individual areas, interaction with area was not included. Months and areas with no
detections were allocated as 0. Fish ID was additionally included in all models as a random intercept
to account for individual variation in behaviours between kingfish, and study month (month of the
study in ascending order from 1 – 15) was included for each fish to account for temporal
autocorrelation across the study period. The full Coffin Bay movement models were:
Residency: residency time ~ Area*Temperature + (Studymonth|Transmitter)rand
Space use: BBKUD-50/95 ~ Temperature + (Studymonth|Transmitter)rand
The most appropriate statistical family, response variable transformation, and validity of each model
was determined by examining the distribution of the response variable and visual inspection of
residuals. All model combinations of fixed-effect terms were run using the dredge function (package:
‘MuMIn’; version 1.43.17, Barton 2020) and ranked using Akaike’s information criterion corrected
for small sample size (AICc; Burnham & Anderson 2002). The r.squaredGLMM function was then
used to estimate marginal (fixed-factor; Rm) and conditional (all factors; Rc) R2 values for each model.

101
Predicted values were extracted for each factor included in the top performing model using the
ggpredict function from package ‘ggeffects’ (version 1.0.1).
Table 5.1. Summary of Generalised Additive Mixed Model covariates used to test environmental
drivers of kingfish activity in south-eastern Australia.
Covariate Description Source Units Range
latitude Location south of the equator; measured in
decimal degrees
IMOS ATF
(IMOSTrack R
package)
Decimal
degrees; S
30.20 – 35.33
SST Sea surface temperature; one day composite
remotely interpolated across 15 km radius;
composite of multi-swath multi-sensor (L3S);
derived from the Group for High Resolution Sea
Surface Temperature (GHRSST)
IMOS ATF
(IMOSTrack R
package)
°C 13.2 – 25.75
bathy Australian Bathymetry and Topography Grid; 250
m resolution
Geosciences
Australia
(IMOSTrack R
package)
m 1.5 – 38
dist2land Distance from nearest shoreline; derived from
high-resolution Open Street Map shoreline
product
IMOS ATF
(IMOSTrack R
package)
km 1 – 31.0
hour Hour of the day (local time) extracted from
activity detection
IMOS ATF
(IMOSTrack R
package)
h 0 – 23
tide Hourly predictions of tide height derived from
global model based on nearest tide gauge
observations
Bureau of
Meteorology
m -0.69 – 2.2
moon Illuminated fraction of the moon; varies from 0.0
(new moon) to 1.0 (full moon)
getMoonIllumination
function (suncalc R
package)
0 – 1
length Total length mm 465 – 1510

102
5.4 Results
Summary of south-eastern Australia results
A total of 211,713 activity measurements were collected from 59 individuals via six receiver
installations and across 5.124 degrees of latitude (30.202 – 35.326°S) in south-eastern Australia
(Table S5). Average sea surface temperature was 18.9 ± 0.01°C (Table S6), ranging from 16.1 ±
0.01°C (Coffin Bay) to 23.4 ± 0.02°C (Coffs Harbour). These installations were also at the extremities
of bathymetry (mean = 13.1 ± 0.02 m), with bathymetry in Coffin Bay being the shallowest (mean =
5.5 ± 0.01m) compared to deepest at Coffs Harbour (20.8 ± 0.08 m). Distance to the mainland ranged
from 1 km (Sydney Harbour and Sydney Costal) to 31 km (South Neptune Islands), with an average
distance of 10.1 ± 0.03 km. Full cycles of tide (mean = 0.321 – 0.001 m), moon fraction (0.385 –
0.001), and hour of the day were observed (Table 5.1). Even on days that shark cage-diving operators
did not frequent the area, kingfish activity was highest at the North Neptune Islands installation (mean
activity = 1.09 ± 0.003 m/s2; Figure 5.2a), followed by coastal Sydney (1.06 ± 0.01 m/s2) and Coffs
Harbour (0.95 ± 0.007 m/s2). Kingfish activity decreased in Sydney Harbour (0.77 ± 0.002 m/s2) and
Coffin Bay (0.7 ± 0.003 m/s2) and was lowest at the South Neptune Islands (0.53 ± 0.02 m/s2).
Environmental drivers of kingfish activity in south-eastern Australia
Except for distance to land, all environmental parameters in the GAMM had significant effects on
activity of kingfish (Table S7) and were included in the top-ranked model (wAICc = 0.523, Table 5.2),
however, the second best model included distance to land and had a similar wAICc (0.477), but did
not improve the variance explained by the model (i.e., 23 vs. 22%). Latitude and temperature had the
largest influence on activity (Figure 5.2b, Table S7). Activity increased southwards (Figure 5.2a),
despite activity being lowest at the most poleward installation South Neptune Islands (0.53 ± 0.02
m/s2; Figure 5.2b) and third highest at the northernmost installation Coffs Harbour (5.1b 0.95 ± 0.01
m/s2). This trend was likely attributed to activity being highest at the North Neptune Islands (1.09 ±
0.003 m/s2) and coastal areas of Sydney (1.06 ± 0.01 m/s2; Figure 5.2b). Temperature had a large,
positive relationship with activity irrespective of latitude (Figure 5.2), with individuals being less
active at low temperatures (~0.55 ± 0.2 m/s2 at 15°C vs. 1.1 ± 0.01 m/s2 at 24.5°C). Kingfish had
strong diurnal activity patterns, being largely inactive at night (0.5 – 0.6 m/s2 from 1900 – 0600 vs.
0.7 – 0.8 m/s2 at ~12:00; Figure 5.2b). Kingfish activity was negatively correlated with bathymetry
(Figure 5.2b). Tide height and moon fraction had a slight inverse relationship with activity (Figure
5.1). Random model effects also influenced kingfish activity, with Fish ID explaining 17% of the
model variation, while study year explained less of the variance (3%, Figure S7).

103
Large-scale movements
In addition to exposure to local environmental conditions, three individuals (13%) tagged in South
Australia undertook large-scale movements away from their tagged location. One individual (ID
14251), tagged at the North Neptune Islands group in April 2019, remained at the Neptune Islands
until July 2020 and was then detected ~250 km away at Victor Harbor (Granite Island, -
35°33’24.48"S, 138°38'11.4"E) in September 2020. This individual was then detected 11 days later
over 1,400 km away in Narooma, New South Wales (36°15'46.4"S 150°09'52.1"E), then three days
later ~ north of Manly (Sydney, NSW; ~300 km north of Narooma). This individual was again
detected near Manly two months later and at the entrance of Sydney Harbour in December 2020. In
total, this individual moved ~1,800 km, and across four Australian state boundaries. A second
individual (ID 7809) tagged at the North Neptune Islands was detected in Batemans Bay, NSW
(35°47'42.1"S 150°14'13.3"E) 56 days after being detected last at the Neptune Islands, and was then
detected in Manly six days later (two months prior to ID 14251). One kingfish (ID 14253) tagged in
November 2019 inside Coffin Bay was detected outside of the estuary system at Mount Drummond
(34°10'21.4"S 135°14'16.1"E; Figure 5.1) in September 2020, over ~60 km from tagging location in
Coffin Bay. This individual was detected here one day before being detected back inside the Coffin
Bay array, where it continued to reside for the following 4 months. During all large-scale movements,
brief occurrences of individuals at receivers (i.e., < 5 detections) were accompanied by high activity
values (1.2 – 2.04 m/s2), suggesting that these individuals are more active while travelling compared
to when residing in installation areas.

104
Table 5.2. Summary of top five models estimating effects of environmental parameters on kingfish activity in south-eastern Australia. df, degrees of freedom;
AICc, Akaike information criterion corrected for small sample size; ΔAICc , difference in AICc between the current and the top-ranked model; wAICc , model
probability; Rm, marginal (fixed effects) R2; Rc, conditional (fixed and random effects) R2.
Model df logLik AICc ΔAICc wAICc Rm Rc
Activity (m/s2) ~ Bathy + Latitude + Moon + Hour + SST + Tide 89 -8323.3 16825.3 0 0.523 0.064 0.23
Activity (m/s2) ~ Bathy + Dist2land + Katitude + Moon + Hour + SST + Tide 89 -8322.9 16825.5 0.18 0.477 0.059 0.22
Activity (m/s2) ~ Bathy + Latitude + Hour + SST + Tide 88 -8343.8 16864.3 38.93 0 0.059 0.22
Activity (m/s2) ~ Bathy + Dist2land + Latitude + Hour + SST + Tide 88 -8343.5 16864.6 39.29 0 0.059 0.22
Activity (m/s2) ~ Bathy + Dist2land + Moon + Hour + SST + Tide 89 -8351.4 16881.2 55.9 0 0.058 0.22

105
Figure 5.2. a) Estimated means of kingfish activity at different installations in south-eastern
Australia. Mean values shown as red diamonds. Black horizontal bars represent median values. Black
boxes encompass the interquartile range, and vertical black lines represent the maximum and
minimum values. b) marginal means (predicted values ± SE) of kingfish activity in response to
environmental variables from Generalised Additive Mixed Model.
a)
b)

106
Coffin Bay case study: Drivers of movement and activity in a seasonal aggregation within a semi-
enclosed embayment
Kingfish (n = 6) were detected 33,371 times in the Coffin Bay array between November 2019 and
January 2021 (mean = 5,562 ± 33.5 per fish). The most frequented area of Coffin Bay was Mount
Dutton Bay, comprising 71% of all detections (Figure 5.3, Figure 5.4). There was a complete exodus
of kingfish from the estuary during winter, with no fish detected between the 30th of April and 8th of
August 2020 (Figure 5.3). Three tagged kingfish returned to Coffin Bay in September, all returning
within a three-day window (8 – 12th September; Figure 5.3).
Figure 5.3. Residency of kingfish in Coffin Bay between November 2019 – January 2021, colours
correspond to interconnected areas of the system. Darker colours represent areas closer to the mouth
(entrance of the system), lighter colours represent areas further into the estuary.
Residency and space use in Coffin Bay
The top-ranked model for residency time in Coffin Bay only included area and was not affected by
temperature, or the interaction between temperature and area (Figure 5.4a; Table 5.3). Kingfish spent
the most time in Dutton Bay (1.58 ± 0.27 days per month), which was substantially higher than in any
other areas (0.06 – 0.12 days; Figure 5.4a). Average core (BBKUD – 50) space use by individual
kingfish in Coffin Bay was 5.84 ± 1.45 km2, and extent (BBKUD – 95) of space use was 30.68 ± 6.83
km2. Core and extent of kingfish space use was influenced by temperature, with the most space

107
occupied during warm periods (Table 5.4, Figure 5.4). In contrast to residency behaviours, individual
Transmitter ID contributed to the variation of the space use model (19% core, 13% extent vs. 4% for
time spent), indicating that space use was variable between individuals. Predicted core space use was
highest in warm temperatures > 18°C (October – February, 4.4 – 7.83 km2, Figure 5.3, Figure 5.4),
but decreased when temperature was < 15°C (March and April), coinciding with the exodus of fish
from Coffin Bay between May – August when space use shifted towards the entrance of Coffin Bay
(< 12.5°C, 0.01 – 0.0.02 km2, Figure 5.3, Figure 5.5). When fish returned to Coffin Bay in August,
core space use gradually increased and individuals occupied areas deeper into the estuary system,
until it peaked in November – February (Figure 5.5). This trend was mirrored from the extent of space
use, with kingfish occupying the most space during summer months when temperature was above
18°C (November – February, 26.45 – 45.07 km2, Figure 5.5), decreasing when kingfish left the bay
between May and June.
Table 5.3. Summary of Generalised Linear Mixed Model estimating effects of month on residency
time (time within each area) in Coffin Bay. df, degrees of freedom; AICc, Akaike information
criterion corrected for small sample size; ΔAICc, difference in AICc between the current and the top-
ranked model; wAICc , model probability; Rm, marginal (fixed effects) R2; Rc, conditional (fixed and
random effects) R2.
Model df logLik AICc ΔAICc wAICc Rm Rc
Time spent ~ Area 9 -380.5 779.8 0 0.97 0.14 0.19
Time spent ~ Area + Temperature 10 -382.8 786.8 6.94 0.03 0.14 0.19
Time spent ~ 1 (Intercept only) 5 -396.1 802.3 22.51 0 0 0.04
Time spent ~ Area + Temperature + Area*Temperature 14 -388.6 807.3 27.46 0 0.14 0.19
Time spent ~ Temperature 6 -398.3 809.1 29.28 0 >0.01 0.04

108
Table 5.4. Summary of Generalised Linear Mixed Model estimating effects of month on kingfish core
(BBKUD – 50) and extent (BBKUD – 95) space use at Coffin Bay. df, degrees of freedom; AICc ,
Akaike's information criterion corrected for small sample size; ΔAICc , difference in AICc between
the current and the top-ranked model; wAICc , model probability; Rm, marginal (fixed effects) R2;
Rc, conditional (fixed and random effects) R2.
Model df logLik AICc ΔAICc wAICc Rm Rc
a) BBKUD – 50
Temperature 6 -81.625 177.5 0 0.986 0.24 0.46
Intercept 5 -87.233 186.0 8.54 0.014 0 0.19
b) BBKUD – 95
Temperature 6 -116.89 248.0 0 0.995 0.26 0.43
Intercept 5 -123.53 258.6 10.62 0.005 0 0.13

109
Figure 5.4. Generalised Linear Mixed Model predicted effects (marginal means) of a) residency time
in each area, and b) core (pink: 50%) and extent (purple: 95%) space use ± standard error space use in
response to temperature of kingfish in Coffin Bay.
a)
b)

110
November 19
December 20
October 20 September 20 August 20
May 20 June 20 July 20
February 20 March 20 April 20
January 20 December 19
November 20
x 6 x 2 x 2
x 2 x 2 x 2
x 0 x 0 x 0
x 0 x 3 x 3
x 3 x 3
Longitude (DD)
34.5°S
34.°S
34.7°S
135.3°E 135.4°E 135.5°E 135.3°E 135.4°E 135.5°E
135.3°E 135.4°E 135.5°E
34.5°S
34.°S
34.7°S
34.5°S
34.°S
34.7°S 34.5°S
34.°S
34.7°S 34.5°S
34.°S
34.7°S
Latit
ude
(DD
)

111
Figure 5.5. Monthly core (pink: 50%) and extent (purple: 95%) of space use in Coffin Bay. Grey
areas represent land. Acoustic receivers shown as black circles. Number represents number of fish
detected in the array that month
Activity drivers in Coffin Bay
Interactions between area and temperature, hour of the day, tide height, and moon fraction were all
included in the top-ranked model and influenced the activity of kingfish in Coffin Bay (wAICc = 0.99,
19% of variance explained, Table 5.5, Table S8). The effects of environmental drivers on kingfish
activity were also variable between individuals and across the temporal period, with 6% of model
deviance linked to the random effects (i.e., 5% Transmitter ID, 1% study week number).
In all areas of Coffin Bay, activity of kingfish was lowest at night and increased during the day,
except for the Mouth which remained consistent across all hours of the day (Figure 5.6a). In the
morning, activity was highest in the Brothers area (0.96 ± 0.04 m/s2) but was highest in the Long
Beach area in the afternoon (1.02 ± 0.02 m/s2). Despite spending the most time in Dutton Bay (Figure
5.4), activity was consistently lowest in this area all hours of the day (0.44 – 0.68 m/s2, Figure 5.6a).
Temperature in Coffin Bay ranged from 10.1 – 21.9°C, but kingfish were only detected in the system
above 13.2°C. Kingfish activity increased with warming temperatures in all areas, but the intensity of
the response was variable (Figure 5.6). At low temperatures (<15°C), kingfish were most active in
Brothers (0.77 ± 0.02 m/s2) and Long Beach (0.77 ± 0.02 m/s2; Figure 5.6b). However, activity in
Kellidie Bay rose rapidly with temperature and became higher than all other areas in warm conditions
(Kellidie = 1.44 ± 0.12 m/s2). Activity in Dutton Bay also increased with temperature but was the area
of lowest activity across all temperatures (from 0.38 – 0.87 m/s2, Figure 5.6b). The influence of tidal
height on activity varied between areas of Coffin Bay (Figure 5.6c). Kingfish were most active at low
tide heights and decreased as tide heights increased in all areas, except for Dutton Bay where activity
slightly rose with tide height (0.46 – 0.48 m/s2, Figure 5.6c). At both low and high tide heights,
activity was highest in the outer bays (i.e., Brothers [0.92 ± 0.03 m/s2], Long Beach [0.89 ± 0.02
m/s2]; Figure 5.6c). Activity in Kellidie and the Mouth dropped noticeably with tide heights, to the
point of activity at the Mouth being similar to activity in Dutton Bay at tide heights higher than 1.2 m
(~0.54 m/s2, Figure 5.6c). Kingfish activity was negatively correlated with moon fraction in Kellidie,
Dutton, and the Mouth, but increased at the Brothers and Long Beach areas (Figure 5.6d).

112
Table 5.5. Summary of the top five models estimating effects of environmental drivers on kingfish activity in Coffin Bay. df, degrees of freedom; AICc ,
Akaike's information criterion corrected for small sample size; ΔAICc , difference in AICc between the current and the top-ranked model; wAICc , model
probability; Rm, marginal (fixed effects) R2; Rc, conditional (fixed and random effects) R2.
Model df logLik AICc ΔAICc wAICc Rm Rc
Area + Moon + Temperature + Tide + Hour*Area + Area*Temperature + Area*Tide + Area*Moon 88 -25376.2 50929.6 0 0.99 0.193 0.249
Area + Moon + Temperature + Tide + Hour*Area + Area*Temperature + Area*Tide 85 -25394.7 50960.8 31.25 <0.01 0.0192 0.248
Area + Moon + Temperature + Hour*Area + Area*Temperature + Area*Moon 83 -25398.5 50964.2 34.63 <0.01 0.0192 0.248
Area + Moon + Temperature + Tide + Hour*Area + Area*Temperature + Area*Moon 84 -25398.1 50965.3 35.74 <0.01 0.0192 0.248
Area + Temperature + Tide + Hour*Area + Area*Temperature + Area*Tide 84 -25402.1 50972.9 43.30 <0.01 0.0192 0.248

113
Figure 5.6. Activity of kingfish predicted from Generalised Additive Mixed Model in different areas
of Coffin Bay through interactions with environmental parameters. Darker colours represent areas
closer to the mouth of the estuary, lighter shades are areas further into the system.

114
5.5 Discussion
The capacity to infer the behaviours and energetic budgets of highly mobile pelagic fish, and
their responses to environmental conditions has historically been logistically challenging. While past
applications of standard telemetry methods have been used to quantity environmental drivers of
horizontal and geographic movements of mobile marine species, linking these drivers to activity and
energetic expenditure of mobile species has been limited. This study identified several environmental
drivers of kingfish activity in south-eastern Australia, while demonstrating the capability of a national
network of acoustic-tracking receivers to identify important drivers of energetic budgets for a highly
mobile pelagic fish across a large geographic footprint. Acoustic transmitters, equipped with
accelerometer sensors, revealed that sea surface temperature had a large positive influence on kingfish
activity across south-eastern Australia, with activity also increasing in areas of shallower bathymetry
and during daylight hours. Activity of kingfish decreased during higher tides and with increasing
moon fraction. In addition, the Coffin Bay case study highlighted that activity and movements are
influenced by environmental conditions within a small spatial scale less than ~120 km2 and can vary
between interconnected areas of a shallow estuary system. I also identified large-scale movements of
kingfish in southern Australia through acoustic tracking, which has previously been reliant on tag-
and-recapture or habitat modelling through fisheries catch data (e.g., Hutson et al. 2007, Brodie et al.
2015, Champion et al. 2018). Describing the relationship between activity and environmental
conditions across south-eastern Australia provides a novel understanding of the ecology of kingfish,
which is increasingly important in the Anthropocene (Steffen et al. 2015, Aswani et al. 2018) in an
area where changes to the oceanographic conditions of water bodies has already been identified (i.e.,
poleward extension of the East Australian Current; O’Kane et al. 2011, Oliver & Holbrook 2014).
This study found that kingfish activity was strongly correlated with sea surface temperature, whereby
fish spent more energy when under warm conditions. This relationship mirrors previous descriptions
of thermal-dependent energy expenditure for ectothermic teleosts (Wright et al. 2014, Payne et al.
2016) and cephalopods (Payne et al. 2011), where raised temperatures facilitate active behaviours
such as increased intensity and frequency of foraging and feeding, reproductive behaviours, or
predator avoidance strategies. Previous activity comparisons from eastern Australia found that
kingfish were more active in warm coastal vs. estuarine environments (Brodie 2016), but my findings
build on a sub-tropical acoustic telemetry dataset and extend to the temperate distribution of kingfish
in south-eastern Australia. Thermal conditions have significant implications for the movements and
behaviours of marine ectotherms (Udyawer et al. 2015, Payne et al. 2016). Optimal thermal
conditions for kingfish physiology along Australia’s eastern coastline is expected to be ~22°C, which
corresponds to optimal growth in captivity (Fielder & Heasman 2011, McKenzie et al. 2014) and
preferable physiological status (Champion et al. 2020b). In this current study, kingfish were sampled
across a broad temperature range (13.2 – 25.75°C), revealing a linear relationship with activity

115
extending beyond the 22°C limit for optimal growth and condition (Fossette et al. 2012, Payne &
Smith 2017). Furthermore, coastal and pelagic environments adjacent to areas of south-eastern
Australia in this study are warming 3 – 4 times more rapidly than the global average, due to the
poleward extension of the southward flowing East Australian Current (EAC) (Cai et al. 2005,
Ridgway 2007). Transportation of warm, tropical water from the EAC to cooler temperate climates
has led to this region being within the top 10% of fastest warming areas of the global ocean, with
projections expected to continue to increase (Hobday & Lough 2011, O’Kane et al. 2011, Hobday &
Pecl 2014). As a result, habitat suitability of northernmost areas of kingfish distribution are predicted
to contract, leading to a poleward shift in the distribution and persistence of kingfish in south-eastern
Australia (Champion et al. 2018). With the thermal habitats of kingfish in south-eastern Australia
facing climate-driven shifts, it is possible that kingfish could be unable to efficiently manage energy
expenditure, and deplete anaerobic energy stores which are required to capture prey, reproduce, or
avoid predators (Payne et al. 2011).
Given that northern areas (i.e., tropics) of Australia are warmer than southern regions, it was expected
that activity would decrease with southward latitudes due to poleward areas being cooler. However,
despite a strong positive relationship with temperature, kingfish activity was predicted by the GAMM
to increase in poleward latitudes. This is likely explained by the highest activity being at the North
Neptune Islands and Sydney coastal areas, which are both further south of Coffs Harbour where
kingfish had low activity. Activity was highest at the North Neptune Islands, even though only
activity measurements when cage-diving operators were not present were used. This indicates that
kingfish activity at the Neptune Islands remains elevated even on days that tourism operators do not
frequent the islands, making activity at this location more comparable to regions or periods of warm
water temperature. Kingfish from Sydney coastal waters had higher activity than kingfish from
Sydney Harbour and Coffs Harbour, despite these two locations having comparable, if not warmer,
water temperatures. Higher activity in coastal areas may be due to fish using Sydney coastal waters as
migratory corridors compared to estuaries like Sydney Harbour or offshore island groups (i.e., Coffs
Harbour – South Solitary Islands, South Neptune Islands) where kingfish might be more resident and
use the area as a low-activity refuge away from strong currents like the EAC (Brodie 2016). Findings
from the Coffin Bay estuary further show that activity can vary over a small spatial scale (i.e.,
between different areas of the system). These findings highlight that the energetic responses of
kingfish can be acute in response to local environmental drivers (i.e., habitat in different areas of the
system, prey availability; Whitmarsh 2019) even within similar geographic conditions.
Bathymetry plays an important role in facilitating the vertical and horizontal distributions and activity
of coastal-pelagic species (Maravelias 1999, Collins et al. 2012). Shallow coastal environments often
provide warm, highly productive habitats that promote high levels of activity in mobile fish (Watson
et al. 2014, Tanner et al. 2019). Although the distance to the nearest landmass did not influence

116
activity, kingfish were most active in shallow areas, which is likely associated with individuals using
these areas for active behaviours possibly linked to foraging or reproduction, often facilitated by high
levels of primary production and resource availability. Shipley et al. (2018) described a similar trend
from Caribbean reef sharks (Carcharhinus perezi), where activity increased when closer to the reef-
shelf, expected to coincide with important foraging areas for this species. Although an effort was
made to include measurements of primary productivity (daily chlorophyll-a concentration) in mixed
models, insufficient measurements from satellite-derived platforms was obtained for areas close to
landmasses or in estuarine systems (i.e., Sydney Harbour, Coffin Bay), exposing a limitation of using
satellite-derived environmental information across marine landscapes and highlighting the need for in-
situ observations. In addition to shallow coastal environments, large pelagic fish are often also
associated with bathymetric features on continental shelves, seamounts, and mid-ocean ridges which
are used as aggregation areas (Maravelias 1999, Hobday & Campbell 2009). For example, in Western
Australia 80% of recaptured tagged kingfish were associated with these features (Hobday & Campbell
2009). While these associations suggest high site-fidelity, it would be expected that activity
surrounding these deeper, offshore bathymetric structures would resemble lower activity estimates as
observed at the South Neptune Islands and Coffs Harbour (Solitary Islands) as fish are less active
while residing. Future research should examine the roles of such offshore bathymetric formations in
the energetic budgets and physiological processes of kingfish in southern Australia. Findings from
this chapter highlighted that in addition to being important areas for movements and aggregations,
bathymetry played an important role in the energetics of kingfish in south-eastern Australia.
One of the most notable drivers of kingfish activity was hour of the day, with strong diurnal patterns
indicating a 30% increase in activity during the day (0700 – 1800; 0.75 ± 0.1 m/s2). Diel patterns of
movement are a common trait that have been observed in many large pelagic fish (e.g., bigeye tuna
Thunnus obeseus; Musyl et al. 2003, sailfish Istiophorus platypterus; Chiang et al. 2013, sunfish Mola
mola; Chang et al. 2020, dolphinfish Coryphaena hippurus; Lin et al. 2020), coinciding with
availability of prey items and associated foraging opportunities during daylight hours. As active
mobile feeders that feed during the day on cephalopods, smaller mesopelagic fish, and crustaceans
(Gomon et al. 2008, Meyer et al. 2020), increased activity of kingfish during the day likely
corresponds with energetically-costly movements and behaviours associated with foraging and
feeding. In Coffin Bay, diurnal activity trends varied between areas of the estuary system. Despite
spending the greatest time in Dutton Bay, activity was lowest here of all areas, with a small increase
in activity during the day. This low activity, paired with elevated residency suggests that kingfish are
using this area to reside and rest, with energetically-costly behaviours taking place in other areas of
Coffin Bay. Unlike other areas of the system, activity was consistent throughout all times of the day at
the mouth, with no diurnal peaks or troughs. These areas near the entrance of the estuary are more

117
likely used as transportation areas in and out of the system, rather than residing areas by fish while
inside of Coffin Bay where diurnal trends are more prevalent.
Tide height and moon phase also influenced kingfish activity, although to a lesser extent than other
abiotic factors (e.g., temperature, bathymetry, hour). Kingfish were exposed to a range of tidal heights
(-0.69 – 2.20 m), with highest activity identified at lower tides. Lower tide height concentrates prey
resources (Mackinson et al. 1999, Hoare et al. 2004, Robinson et al. 2004), so higher activity during
shallower tides may be linked to foraging and feeding behaviours of kingfish maximising access to
prey items. The effect of tide height was stronger in Coffin Bay when compared to south-eastern
Australia overall, with activity in all areas of the system decreasing considerably with higher tides,
except for Dutton Bay where activity remained low regardless of tides. In inner-areas of the Coffin
Bay, kingfish are often observed traveling along shallow banks and sandbars, where they can be
visually observed with caudal fins out of the water. Mobility in shallow bathymetries creating
additional drag requires more powerful movements and would likely explain why activity was higher
in shallow areas at low tide (i.e., Kellidie Bay, < 2 m bathymetry) compared to deep areas (e.g.,
Dutton Bay, 4 – 6 m bathymetry). Relationships with lunar cycles are often observed in the
movements, feeding, and reproductive behaviours of marine and freshwater fishes (Di Natale &
Mangano 1995, Naylor 1999, Milardi et al. 2018). Kingfish in south-eastern Australia were most
active when moon fraction was lowest i.e., new moon, with a small decrease coinciding with moon
fullness. Moon fraction and tide changes are inherently linked, where newer moons are associated
with large tide cycles, so it is likely that the relationship between tide heights and the effects on
kingfish activity are most prevalent at new and full moons where tidal influence is greatest. This
relationship was replicated in Coffin Bay, except for Long Beach and Brothers areas where activity
increased with moon fraction. Previous descriptions in the pelagic domain have associated periods of
full moons to increased schooling behaviours (Thomas & Schülein 1988) and occupying greater
depths in the water column (Gaudreau & Boisclair 2000) which are reflective of decreased movement
and associated activity levels. Increased fraction from the moon raises light levels in the water
column, which for nocturnal animals would be expected to translate to higher activity levels during
periods of increased fraction due to increased foraging and mobility (Milardi et al. 2018, Merciai et al.
2020). However, I found kingfish were not more active during periods of increased moon fraction,
suggesting that they are not using nights of increased moon light to increase foraging and movements
and might instead be visual feeders that predate and forage during daylight hours (Gomon et al. 2008).
In other circumstances, raised activity during darker periods (i.e., less moon fraction) have been
suggestively linked to reducing predation risk during reproductive behaviours or eggs being laid
(Hammerschlag et al. 2017). For example, reef associated damselfish (Pacific sergeant major
Abudefduf troschelii) have been described to synchronise hatching of eggs near the new moon,
expected to coincide with timing of tidal cycles to transport eggs away from higher risk of predation

118
(Foster 1987). Raised activity of kingfish near the new moon may be indicative of kingfish using
these times for reproductive behaviours, especially in inner areas of Coffin Bay (i.e., Kellidie Bay,
Dutton Bay) where the largest effect of moon fraction was observed, and spawning aggregations have
been described (DEW 2018). The relationship between tide and moon characteristics and the activity
of fishes such as kingfish is of particular interest to fishers, who produce lunar calendars charts, and
applications which strive to optimise fishing strategies (Sharma & Dhenuvakonda 2019, Di Natale &
Mangano 1995). This additional insight into the effects of moon and tide for species such as kingfish
could be linked to catchability, and fishers could direct the timing and location of fishing activities to
reduce or increase catches of large pelagic species’ such as kingfish (Hammerschlag et al. 2017).
Detections from the national acoustic tracking network revealed long-range movements of individual
kingfish up to ~1,800 km, with three individuals tagged in South Australia displaying large-scale
movements > 50 km away from tagging location. Throughout these broad movements, individuals
were exposed to a range of temperatures (15.6 – 20.6°C) and other environmental factors that can
influence activity. These movements occurred within relatively short temporal scales (i.e., 56 – 80
days), so the physiological performance of these individuals is dependent on the ability of kingfish to
cope with variable conditions. These migrations of kingfish across the south-eastern coast of Australia
are supported by mark-and-recapture data (Gillanders et al. 2001) and genetic population structure
that has identified one large south-eastern Australian population that is genetically distinct from
Western Australia (Patterson & Swearer 2008, Miller et al. 2011). This study shows that a national
network of acoustic tracking receivers can not only monitor large-scale movements of mobile species,
but also provides an opportunity to assess how animals are partitioning energetic budgets across large
spatial scales. In addition to identifying environmental drivers of activity, this nation-wide network of
acoustic receivers may also be used by future studies to provide an insight into how human impacts
may effect species energetic expenditure on a broad spatial scale (Huveneers et al. 2021a) and
contribute to area management strategies for mobile large pelagic fish.
5.6 Conclusions
Environmental processes play vital roles in the functioning and structure of pelagic
ecosystems, and so it is critical to recognise animals’ energetic responses to variable conditions to
infer the relationships between species and their surrounding environment. This study found that
kingfish were most active during the day, in warm and shallow areas, and expended slightly less
energy with rising tide height and increased moon fraction. Effects from increasing temperature were
not reproduced by a decrease in activity poleward, with kingfish predicted to be most active in
southern regions, most likely attributed to raised activity due to lag effects from feeding during shark
tourism at the North Neptune Islands, and lower activity in Sydney Harbour and offshore islands
around Coffs Harbour where individuals are residing. These findings advance our understanding of

119
kingfish activity in south-eastern Australia, providing valuable information about the energetic
responses of an ectothermic pelagic fish under changing environmental conditions. Additionally, this
study highlights the potential for national-scale acoustic receiver arrays to accumulate long-term and
broadly-distributed information not only about animal movements, but also combine detections with
environmental conditions to identify spatially-important areas and timing of raised energetic
expenditure. In the current climate of increased pressures from human impacts, this is a valuable
approach to predict population responses to changing environmental conditions, particularly for
highly mobile and vastly-distributed large pelagic fishes such as kingfish.

120
General discussion
Image removed due to copyright restriction. Original can be viewed
at:
https://www.gettyimages.com.au/detail/photo/yellow-tail-kingfish-
swimming-at-the-surface-among-royalty-free-image/824832752

121
6.1 Thesis overview
Yellowtail kingfish (Seriola lalandi) is an important predator in pelagic ecosystems (Gomon
et al. 2008), in addition to contributing to significant economic and social gains through commercial
and recreational fisheries (Henry & Lyle 2003, Lowry et al. 2016). However, there is a paucity of
research into reproductive behaviours and factors driving activity of kingfish across southern
Australia. In this thesis, I used kingfish as a model species of large pelagic fish to develop methods to
identify ecologically-important behaviours, and reveal effects from human pressures on fine-scale
movements and activity. My findings demonstrate that biologging can be used to identify timing and
locations of spawning events, and has potential to be conditioned to identify spawning behaviours of
other species of large pelagic fish, and reveal natural and anthropogenic drivers of residency, space
use, and energetic expenditure. Throughout this thesis, I addressed the understudied reproductive
behaviours, effects of wildlife tourism, and environmental drivers of kingfish activity in south-eastern
Australia. Specifically, I applied a machine learning algorithm to characterise courtship and spawning
behaviours of kingfish, and subsequently applied the model on unseen data to predict naturally-
occurring spawning events (Chapter 2); revealed impacts of white shark tourism on the residency and
space use (Chapter 3); and physiological responses (Chapter 4) of kingfish; and identified
environmental drivers of kingfish activity across a south-eastern Australia dataset (Chapter 5).
Outcomes from this thesis contribute essential knowledge about the ecology of kingfish in southern
Australia, but also demonstrated novel methods and approaches that are applicable to other species of
large-bodied and mobile pelagic fish (e.g., scombrids, carangids, billfish).
6.2. A new method to identify spawning behaviour of large pelagic fish
Reproductive success of large pelagic fish is vital for preserving viable populations in the
wild, but identifying spawning events in a pelagic environment in the past has been logistically
challenging (Balon 1984, Ware 1984). My thesis developed a non-destructive and efficient method to
describe kinematics and acceleration during spawning behaviours and remotely predict the occurrence
of these events in the wild (Chapter 1). Prior to these findings, identifying these events was limited to
destructive approaches (e.g., gonad staging or gonadosomatic indixes; DeMartini et al. 2000,
Karakulak et al. 2004, Richardson et al. 2018) or required high-effort sampling in spawning areas
(e.g., ichthyoplankton tows for fertilised eggs; Davis et al. 1990, Paine et al. 2008, Richardson et al.
2016). My results build on previous use of accelerometers, which have been used to characterise
reproductive behaviours based on acceleration and body posture during visually-confirmed events
(Tsuda et al. 2006, Yasuda et al. 2013, Sakaji et al. 2018). I used a machine learning algorithm to
characterise behaviour classes, and additionally demonstrated the potential for these methods to be
applied on free-ranging individuals to remotely identify naturally-occurring spawning aggregations,
among other ecologically-relevant behaviours (i.e., feeding, escape, chafing). Accelerometers in this
study successfully confirmed 776 seconds of courtship from captive kingfish, in addition to 772

122
seconds of courtship and spawning behaviour from free-ranging individuals, and thus should be
considered for application on other large-bodied marine taxa. Reproductive behaviours from wild
individuals predominantly occurred at dawn (35% of events) and during the early hours of the
morning (38% of events), and between temperatures of 16.5 – 19.5°C, which aligns with previous
examples of kingfish spawning from anecdotal and aquaculture-based descriptions (Gillanders et al.
1999, Poortenaar et al. 2001) and thus further reinforces the reliability of this technique for predicting
reproductive events. During the progression of this thesis, a recent study from Schlenker et al. (2021)
used a similar method to remotely predict spawning behaviours of another large pelagic fish, Mahi-
Mahi (Coryphaena hippurus) from acceleration data collected via pop-up satellite archival tags
(PSATs). Spawning behaviours were characterised using and ensemble of classification algorithms,
including Random Forest models that were used in Chapter 2 of this study, finding that spawning
predominantly occurred at night-time. This further highlights the complications for ground-truthing
reproductive behaviours of large pelagic fish that can occur during times of low-light levels. While
accelerometer loggers from Chapter 2 were able to record swimming depth, and infer location within
acoustic arrays via implanted acoustic transmitters, PSATs used be Schlenker et al. (2021) were able
to divulge fine-scale responses to additional parameters recorded through tags such as temperature,
light levels, and geographical data to make remote predictions about more detailed environmental
conditions during predicted spawning. This timely study further highlights the demand for dependable
techniques that can identify fine-scale reproductive behaviours of highly mobile pelagic fish, and
demonstrates the capacity for acceleration metrics to be paired with surrounding geographical and
environmental data to uncover important timing and areas of pelagic fish spawning in nature.
Outcomes from this thesis provide valuable information about the spawning behaviours of kingfish in
southern Australia, specifically within the Neptune Islands and Coffin Bay areas. Identifying
spawning behaviours is not only beneficial from a behavioural ecology perspective, but provides
information to strategize fisheries management towards protecting vulnerable stocks during such
aggregations (Domeier 2012). While genetic research has focused on revealing population structure of
kingfish in Australia and New Zealand (Patterson & Swearer 2008, Miller et al. 2011), this thesis
provided the first behavioural evidence of kingfish spawning in southern Australia. Both the Neptune
Islands (Ron and Valarie Taylor Marine Park) and Coffin Bay (Thorny Passage Marine Park) regions
where kingfish spawning was predicted through RF models in this study, were incorporated in the
South Australian Marine Parks zoning plan implemented in 2014 (National Parks and Wildlife
Service 2020). In particular, the Thorny Passage Marine Park includes allocated sanctuary zones (i.e.,
no-take areas) to assist in protecting suspected spawning aggregations of kingfish (DEW 2018), in
addition to hosting an important nursery area for other coastal teleost species (e.g., whiting Sillago
spp., pink snapper Chrysophrys auratus, flathead Platycephalus spp.). However, prior to findings
from this thesis, descriptions of kingfish spawning in these areas were only anecdotal, based on visual

123
descriptions of fish aggregating, flashing their sides, and pursuing burst swimming behaviours
(Landscape South Australia 2016, Environment SA News 2018). Chapter 2 provided empirical
evidence that kingfish are likely spawning in Coffin Bay, which was supported by high levels of
activity in areas of the system where sanctuary zones were implemented (i.e., Kellidie Bay, Chapter 5,
DEW 2018), particularly around new moons when large tidal cycles may be being utilised for egg and
larvae dispersal. These results further support the ongoing protection of areas within Coffin Bay to
allow successful spawning behaviours to occur during the seasonal aggregation. Although sample size
was small with observations of spawning from five individuals only, the record of spawning
behaviour from all three tagged fish in Coffin Bay suggest that such behaviour might be frequent
during the spring – summer aggregation. The implementation of spatial management strategies to
protect spawning individuals, particularly for transient and mobile species, is a major challenge facing
fisheries conservation (Domeier 2012, Grüss et al. 2014). Although when implemented effectively,
spatial protection of these aggregations can increase spawning-stock biomass and minimise disruption
of spawning behaviours to maximise recruitment success of commonly angled and targeted species
(Domeier 2012). Paired with information of timing and geographic location of movements around
these aggregations (Chapter 5), these findings show that accelerometers paired with machine learning
are a forthcoming option to identify the enigmatic reproductive behaviours of highly mobile species
such as kingfish, and can contribute to advising and supporting efficacy of spatial management efforts
to protect spawning aggregations and ensure viable populations continue.
While there are clear benefits to the application of accelerometers to predict naturally-
occurring spawning behaviours, there were some limitations to the implementation of this method.
Since kingfish in this study were targeted to be reproductively active, individuals were of relatively
large body size (> 91 cm TL). However, the additional drag and obstruction from the logger packages
(Jepsen et al. 2005) could disrupt the occurrence of desired behaviours of smaller-bodied
individuals/species, and should be considered in future studies that use large biologging devices to
characterise and identify naturally-occurring behaviours like spawning. This is particularly relevant in
the marine environment where logger packages require additional equipment for recovery (i.e., non-
compressible foam, satellite/radio transmitters, corrodible links), and largely limits the application of
logger packages to large-bodied animals (e.g., > ~1 m in length: billfishes, tuna, sharks). Constraints
of battery-life and storage systems in marine accelerometers restrict the temporal and geographic
extent of deployments, with most products limited to deployments of a few days or week(s) (Broell et
al. 2012), meaning that the timing of deployments with spawning events can be difficult to achieve.
Alternatively, loggers can be programmed to reduce sampling frequencies to prolong battery life and
storage, but this might affect the ability to record and identify complex behaviours like spawning and
courtship if measurements are recorded too infrequently (Tsuda et al. 2006, Yasuda et al. 2013, Sakaji
et al. 2018). Alternatively, threshold-based recording devices can prolong duration of deployments by

124
only recording when movement exceed a particular threshold (Nishiumi et al. 2018), but this requires
some knowledge of expected thresholds for desired behaviours. Effects of accelerometer sampling
frequency on the behavioural classification performance of machine learning algorithms has been
studied in juvenile lemon sharks (i.e., burst, chafe, headshake, rest, swimming behaviours; Hounslow
et al. 2019), with 5 Hz deemed appropriate for classifying broad behaviour classes of sharks of similar
size to kingfish. However, given the erratic movements during burst behaviours of large pelagic fish
(i.e., spawning, feeding), it is probable that a higher resolution sampling rate, such as 50 Hz used in
Chapter 2, is required for distinguishing between burst events. With current methodologies, logger
packages (and PSATs such as those used by Schlenker et al. 2021) deployed in the wild also need to
be physically recovered to obtain acceleration data. If deployed for too long, tagged individuals may
swim large distances away from capture location, leading to increased effort and difficulty to relocate
and collect the package. As a result, some background into the spatial and temporal occurrence of
desired behaviours should be known prior to deploying accelerometers in order to maximise detection
probability over short temporal scales. The difficulty ground-truthing kinematic measurements with
visual behaviours is another limitation facing accelerometer studies (Rast et al. 2020). Movements of
captive animals in tanks can be limited (e.g., due to shallow depth and small tank) and so recorded
activities may therefore differ from natural behaviour, or behaviours that occur in nature may not be
observed in captivity (Herborn et al. 2010, Rast et al. 2020). Additionally, some large pelagic fish are
challenging to keep in captivity to ground-truth behavioural classes. Studies may pair accelerometers
with animal-borne cameras to visually confirm naturally-occurring events to further substantiate
predictions of spawning aggregations for some of these taxa (e.g., Marshall 1998, Marshall et al.
2007, Watanabe et al. 2008b), but this generates even greater limitations due to the typically short for
battery life and high storage requirements for video images. The size of the tagging packages with
video loggers included would also be greater than the accelerometer packages used in this thesis,
making it only applicable to very large fishes, sharks, and marine mammals without causing
detrimental effects from additional drag or obstruction.
6.3. Implications for wildlife tourism to consider mobile non-target pelagic species
The feasibility and success of wildlife tourism operations around the globe ultimately depend
on predictable and reliable encounters with wildlife. The implementation of food-based provisoning is
therefore often required to attract target-species and increase the consistency of encounters (Newsome
& Rodger 2008, Knight 2009). While some industries have regulations in place to prohibit direct
feeding of targeted animals (Laroche et al. 2007, Newsome & Rodger 2008, Meyer et al. 2021b), this
thesis identified that behavioural (Chapter 3) and physiological effects (Chapter 4) of using food-
based attractants can extend to non-target species, which are exceptionally underrepresented in the
scientific literature (Trave et al. 2017, Meyer et al. 2020). Kingfish occurred closer to food-based
operators and spent longer at the islands each day compared to days with acoustic-attractant only or

125
when no operators were present (Chapter 3). On days that food-based operators frequented the
islands, kingfish were more active during tourism operations and as a result spent more energy due to
indirect feeding practices (Chapter 4). Additionally, even on days when no operators were at the
Neptune Islands, kingfish activity was higher than any other installation in southern Australia
(Chapter 5). While near year-round residency is common in sub-tropical to warm temperate areas of
Australia (i.e., New South Wales; Brodie 2016, Brookhouse et al. 2016), the thermal climate at the
Neptune Islands Group is largely outside the thermal boundaries described for optimal kingfish larval
growth and survival (>21 – 26.5°C; Abbink et al. 2012) and reproductive output (>20°C; Gillanders et
al. 1999). However, kingfish were persistent throughout the year at the Neptune Islands, despite only
6% of days at the Neptune Islands being above 20°C. Although kingfish in the wild may be more
adaptable and resilient to cold climates than captive stocks, current insights into aggregations of
kingfish in temperate Australian climates of similar oceanographic condition to the Neptune Islands
have revealed strong seasonal trends in residency, with individuals completely leaving these areas
during the cold winter months (e.g., Coffin Bay [Chapter 5], Port Augusta [T Clarke pers. obs.], Lady
Julia Percy Island Deen Maar [J Rizzari pers. obs.]). This thesis found that year-round residency at
the Neptune Islands may be reflective of an ‘ecological trap’ (Schlaepfer et al. 2002), where indirect
feeding from cage-diving operations is suppressing environmental cues that would otherwise drive
movements away from the islands during winter months when thermal conditions restrict
physiological processes (i.e., metabolism, growth, reproduction). Since the inception of commercial
cage-diving tourism in South Australia in the early 2000s, the number of operating days has continued
to rise (from ~124 days/year 2000 – 2006 to ~265 days 2008 – now; Bruce & Bradford 2013). While
these findings highlight the potential for wildlife tourism to impact large pelagic fish behaviour and
movements over fine- (i.e., daily) and potentially extended (i.e., year-round residency) temporal-
scales, weekly residency and space use were not influenced by the number of operating days (Chapter
3) and some individuals still undertook long-range movements away from the islands (Chapter 5).
Without an understanding into the detailed residency and movements of similarly-sized kingfish prior
to the inception of cage-diving tourism, or at comparable temperate offshore island groups, it is
difficult to interpret if high residency at the Neptune Islands throughout the year was attributed to
long-term effects from cage-diving tourism, or rather represent typical movements of large individuals
in southern Australia.
As mobile animals that often rely upon vertical and horizontal migrations for foraging, reproduction,
and following of preferable oceanographic conditions (e.g., Galuardi et al. 2010, Jansen & Gislason
2011, Richardson et al. 2016), large pelagic fishes are particularly vulnerable to behavioural shifts due
to supplemental feeding from wildlife tourism. Studies into the concept of ecological traps
(Schlaepfer et al. 2002) in marine wildlife tourism has gained traction (Semeniuk & Rothley 2008,
Pini-Fitzsimmons et al. 2018). However, implications for large pelagic fish are largely understudied

126
compared to large, focal species (e.g., sharks and rays), but remains an important consideration.
Modifications to pelagic habitats such as through drifting fish aggregating devices (FADs) are
suggested to create ecological traps by modifying the environment that these fish reside, and have
major effects on behaviour and movements of pelagic fish (e.g., mahi-mahi Coryphaena hippurus ,
rainbow runner Elagatis bipinnulata, wahoo Acanthocybium solandri, tunas Thunnus spp., etc.) by
altering natural movements to feeding or spawning areas (Marsac et al. 2000, Dagorn et al. 2010).
Whilst kingfish at the Neptune Islands were in good physiological condition (Chapter 4), and some
individuals were observed undertaking large-scale movements away from the islands (Chapter 5),
health and fitness of individuals might instead be affected by disrupting ecologically-important
behaviours and migrations due to increased dependence on the food-based attractant as a food source
(Marsac et al. 2000, Dagorn et al. 2010). Although the potentially negative effects of wildlife tourism
may be geographically-limited, these effects can accumulate with other anthropogenic pressures that
effect movements and behaviours of pelagic fishes, e.g., habitat alterations (Marsac et al. 2000,
Andersson 2011), direct (overfishing) and indirect (i.e. prey availability) pressures from fisheries
(Block et al. 1998, Heino & Godø 2002, Golet et al. 2007), and changing climate conditions
(Robinson et al. 2015, Champion et al. 2018, Petrik et al. 2020). Findings from Chapters 3 and 4
highlight those large pelagic fishes should be considered when developing and implementing
management strategies for food-based tourism operations, and emphasise an additional aspect to
consider when accounting for anthropogenic effects on movements and behaviours. Baseline studies
of residency and movements, paired with energetic budgets and physiological status of both focal and
non-focal species prior to implementation of food-based tourism operations could be used to provide
more detailed insights into implications of provisioning on movement and behavioural ecology of
mobile species.
In spite of near year-round residency and behavioural changes exhibited by kingfish in response to
cage-diving operators using food-based attractant (Chapters 3 and 4), kingfish at the Neptune Islands
were in relatively good condition (Chapter 4), comparable to areas of suitable habitat from the
Australian east coast (Champion et al. 2020a). Additionally, three individuals were predicted to
undertake reproductive behaviours soon after being tagged at the Neptune Islands (Chapter 2).
Findings of this thesis suggest that feeding on bait and chum from food-based provisioning operators
may be required to compensate for increased energy expenditure during cage-diving operations
reflected by the increased activity demonstrated in Chapter 4 (Barnett et al. 2016, Brunnschweiler et
al. 2018, Huveneers et al. 2018). While bioelectrical impedance measurements did not detect a
negative effect on body condition, a more sensitive assessment of oxygen consumption and metabolic
processes could be estimated by estimating energy expenditure and compare the activity budget of
yellowtail kingfish when operators are present vs. absent. Brodie et al. (2016) developed a
bioenergetics model for free-ranging kingfish under natural conditions based on estimates of oxygen

127
consumption rates in response to swim speed under varying conditions. This offers an opportunity for
future research to quantify the metabolic cost of if the increased activity at the Neptune Islands, and
highlight if activity partitioning towards interaction with vessels is overcompensating for energetic
requirements (i.e., growth, metabolism, reproduction, waste). Additionally, information of the
calorific value and quantities of bait and chum (i.e., Thunnus maccoyii gills, guts) consumed by
kingfish could be used to substantiate if food-attractant being consumed is sufficient to compensate
for shifts in energetic budgets linked to the increased activity.
Although findings from this thesis indicated that cage-diving tourism can disrupt natural behaviours
and energetics, well-managed tourism and cooperation with policymakers can have potential benefits
for effected targeted and non-focal species (Ballantyne et al. 2009, Apps et al. 2018, Meyer et al.
2021a). Like the Neptune Islands, marine wildlife tourism often occurs in marine protected areas
globally (e.g., New Zealand [Okakari Point]; Cole 1994, Mediterranean [Ustica Island]; Milazzo et al.
2005, Australia; Lord Howe Island Marine Park, Great Barrier Reef Marine Park, GBRMP 2005,
Brookhouse et al. 2013, Brazil [Abrolhos Bank]; Paula et al. 2018, Hawaii [Molokini Shoal]; Philips
et al. 2019) and offers a non-lethal alternative form of wildlife use. Increased residency and space use
within these areas therefore enhances the level of protection for highly targeted species like kingfish,
and additionally contributes to supplementary compliance in these areas (Read et al. 2011, Campbell
et al. 2012, Arias & Sutton 2013).
6.4 Physiological responses of pelagic ectotherms in a variable and changing environment
Behavioural and energetic responses of species are sensitive to changes in the environment
(Wilson et al. 2006, Del Raye & Weng 2015, Huveneers et al. 2018), yet there remains a scarcity of
quantitative evaluations using data collected in the field. My thesis showed that acoustic tags can be
used to identify changes in the activity status of a large pelagic fish due to anthropogenic (Chapter 4)
and natural (Chapter 5) changes in the environment. These findings highlight the sensitivity of
kingfish activity to abiotic factors (e.g., temperature, hour of the day, moon, and tide input), which
consequently reflects the rate at which individuals expend energy and in turn, the long-term energetic
strategies that influence the fitness and survival of individuals and populations (Brown et al. 2004,
Fossette et al. 2012). Previous applications of acoustic telemetry have been used to enhance fishery
management by inferring movements and residency of species in reproductive grounds (Pecl et al.
2006, Espinoza et al. 2015) and occurrence overlap with fishing pressures (Melnychuk et al. 2017),
but these methods offer little information about the effects of surrounding environments on the
energetic expenditure of animals during the course of their movements. Findings from this thesis
show that acoustic tracking can build on these studies by inferring energetic expenditure under
different conditions, advancing our understanding of how environmental conditions influence the
physiology of large pelagic fish in temperate and sub-tropic environments.

128
Prior to this study, understanding of kingfish ecology in southern Australia predominantly relied upon
mark-recapture (Gillanders et al. 2001, Hutson et al. 2007, Hobday & Campbell 2009), or habitat-
modelling approaches based on catch data from fisheries and recreational tagging programs (Brodie et
al. 2015, Champion et al. 2018, Champion et al. 2020b). Whilst some studies have advanced these
insights to identify activity between recaptures by quantifying survival of angled individuals (Roberts
et al. 2011), responses contaminant exposure (Taylor et al. 2018), habitat suitability (Champion et al.
2020b), efficacy of acoustic arrays to detect fine-scale movements (Udyawer et al. 2018), and
energetic budgets in coastal vs. estuary environments (Chapter 3 from Brodie 2016), these studies
were all situated on the eastern coast of Australia only, and studied fish that were substantially smaller
(450 – 890 mm TL) compared to South Australian fish from this thesis (800 – 1,510 mm). These
larger individuals are prone to more extensive movements and are thus exposed to more variable
environmental conditions (Gillanders et al. 1999, Hutson et al. 2007). My findings build on the
understanding of large, reproductively mature kingfish ecology in southern Australia and reveal
environmental parameters that influence the activity of kingfish from warm, sub-tropical areas
(~25°C, Coffs Harbour) to cool temperate regions (~13°C Neptune Islands, Coffin Bay). Kingfish
energetic expenditure (inferred through activity) was sensitive to changes in environmental conditions
across the south-east Australian distribution, which mediate metabolic processes and have
consequential implications for physiological processes (Wilson et al. 2006, Gleiss et al. 2009,
Watanabe et al. 2019).
Sea surface temperature was the greatest environmental driver of kingfish activity, emphasising the
temperature-dependence of ectothermic species linked with the facilitation of important behaviours
and metabolic processes (Payne et al. 2016). In Australia, temperate and sub-tropical oceans are
warming (Bohaty & Zachos 2003, Duran et al. 2020), leading to tropicalisation of marine
communities through poleward shifts in the distributions and movements of sub-tropical and
temperate species (Johnson et al. 2011, Cheung et al. 2012, Pecl et al. 2019). Kingfish are an example
of such range extensions, with distributions extending poleward from south-eastern Australia
facilitated by changes to sea surface temperature and eddy kinetic energy (Champion et al. 2018).
Habitat suitability due to temperature has previously been linked to the physiological condition of
kingfish measured through BIA, with condition of individuals peaking at ~21 – 22°C (Champion et al.
2018) which corresponds with optimal growth and physiological responses in captive environments
(Abbink et al. 2012). As marine climates continue to warm, kingfish habitats in south-eastern
Australia may increase beyond productive temperatures, and expose individuals to conditions beyond
optimal thermal tolerances (Payne et al. 2016, Payne & Smith 2017), or lead to fish expending more
energy in areas that are otherwise required for less energetically-costly behaviours. Alternatively, cold
climates such as the Neptune Islands may warm and become preferable habitats that support growth
and reproduction. Activity of kingfish was also strongly influenced by bathymetry, with individuals

129
most active in shallower environments. Although kingfish often occupy deeper waters and
topographic structures near continental-shelfs (Hobday & Campbell 2009), shallower coastal habitats
where individuals were most active provide an environment that is used by coastal-pelagic fish for
transport, controlling larval dispersion, and foraging strategies (Bakun & Parrish 1982, Watanabe et
al. 2019), behaviours which may be reflected through heightened energetic expense in these areas.
While the extensive and dynamic movements of mobile pelagic fish pose difficulties for spatial
management strategies (White et al. 2017, Richardson et al. 2018), my findings show that energetic
responses of animals to surrounding conditions can subsequently highlight spatial areas that are
ecologically important for large pelagic fish and could be targeted by management tactics where
required. These findings offer an opportunity for dynamic ocean management strategies which are
applicable to rapid changes in space and time in response to near real-time data (Lewison et al. 2015,
Maxwell et al. 2015).
Large pelagic fishes are often highly mobile, capable of extensive movements across continental-
scales and influenced by biological and environmental cues that are associated with resource needs
(Block et al. 2011, Espinoza et al. 2016, Huveneers et al. 2021b). Findings from this thesis
highlighted that although kingfish spent up to 80% of time at the Neptune Islands Group (Chapter 3)
and daily behaviours were influenced by cage-diving operations (Chapters 3 and 4), some individuals
were still detected undertaking large-scale movements up to ~1,800 km across the south-eastern coast
of Australia. The vast distributions and tendency of large-bodied species to cover extensive distances
can lead to difficulties when studying effects of environmental conditions on the fine-scale behaviours
of animals, and subsequently complicate management and conservation efforts (Heupel et al. 2015).
In more recent years, acoustic tracking arrays have increased in number and extent of locations
through facilitated collaborative systems that are capable of tracking mobile marine animals across
large geographic scales (i.e., continental-wide). Extensive tracking networks combining receiver
arrays have been employed in North America (Pacific Ocean Shelf Tracking – POST; Welch et al.
2002, Ocean Tracking Network (OTN) in Canada; Jackson 2011, Integrated Tracking of Aquatic
Animals in the Gulf of Mexico - iTag; Currier et al. 2015, Kirkpatrick et al. 2016, Whoriskey &
Hindell 2016, Florida Atlantic Coast Telemetry - FACT; Griffin et al. 2018), South Africa (Acoustic
Tracking Array Platform – ATAP; Cowley et al. 2017), and Europe (Permanent Belgian Acoustic
Receiver Network; Reubens et al. 2019, European Tracking Network; van der Knaap et al. 2021). The
Integrated Marine Observing System (IMOS) Animal Tracking Facility is a collaborative acoustic
tracking network in Australia, which was used in this study (Chapter 5). The network integrates a
series of continental-wide receiver arrays owned by IMOS, in cooperation with independent
installations owned by individual research groups, with all detections uploaded and publicly
accessible via the Australian Ocean Data Network (AODN) and IMOS Animal Tracking Database
(https://animaltracking.aodn.org.au/; Hoenner et al. 2018). The database hosts > 920 active acoustic

130
receivers, and over 102.8 million detections from ~9,600 individuals of 150 species across Australia,
and has proven to be valuable to study large-scale movements and residency of a range of species
(Heupel et al. 2015, Brodie et al. 2018) and distinguish human impacts on behaviours (e.g., COVID-
19 pandemic; Huveneers et al. 2021a). My thesis expands on previous application of traditional
telemetry techniques, which has mainly been used to quantify environmental drivers of horizontal and
vertical movements, and highlights that such networks provide an opportunity to identify details of
activity, and energy expenditure of species across a continental-scale, via acoustic tags equipped with
accelerometer sensors. While conventional accelerometer loggers can be used to examine fine-
resolution characteristics of behaviour classes over narrow time-series, my findings show that
traditional telemetry methods equipped with lower-resolution sampling acceleration sensors deliver an
opportunity to identify energetic partitioning of species over extended temporal and spatial scales.
This was the first study to employ a new process (via the recently developed R package
‘IMOSTrack’) to extract environmental parameters for each animal activity measurement from the
Australian Ocean Data Network Portal based on timing and geographic location of detections
collected via the IMOS Animal Tracking Database. I highlight the effectiveness of this approach to
streamline the accessibility of stored environmental data corresponding to individual detections,
without requiring additional parameter sensors that can increase tag size and reduce record frequency
of other sensors (i.e., activity).
6.5 Management implications
While kingfish stocks are considered to be sustainable in both Western and Eastern Australian
jurisdictions (Hughes & Stewart 2020), rising threats from anthropogenic pressures imply that
proactive measures to maintain and preserve natural populations should be considered. Despite
extensive movements (Chapter 5; Gillanders et al. 2001, Hutson et al. 2007) and genetic connection
(Miller et al. 2011, Symonds et al. 2014) in south-eastern Australia, management regulations of
kingfish vary between state jurisdictions (Table 6.1). Recreational size limits (45 – 65 cm) and boat
possession limits (2 [QLD] – 10 [Tas]; Table 6.1) are variable between states within eastern Australia,
in addition to highly variable recreational catch estimates (3 – 199 t, Table 6.1). Commercial kingfish
catch in Australia is not managed by catch limits or fishing effort (https://www.afma.gov.au/fisheries-
services/catch-limits), but rather state-to-state restrictions of permitted gear types and accessibility.
These commercial restrictions also vary, from just limited entry (i.e., limited licences, SA) to size
limits, spatial closures, vessel restrictions and licensing limits (VIC, NSW, QLD). Kingfish in south-
eastern Australia could be exposed to varying degrees of management and pressure from fisheries,
including in areas significant for apportioning of energetic budgets. Future dynamic management
considerations for large pelagic fishes such as kingfish should consider the extent of movements and
their activity in response to environments throughout their distribution rather than varying levels of
protection which could undermine one another (Cabral et al. 2010).

131
Table 6.1. Yellowtail kingfish (Seriola lalandi) recreational and commercial management methods in
different state jurisdictions of Australia.
Genetic stock State Recreational limits (min
size, possession limit,
catch estimate)
Commercial
management methods,
catch estimate
Eastern Australia 1,2Queensland 60 cm, 2, 9t (2013/14) Limited entry, size limits,
spatial closures, vessel
restrictions, 4.97t
3New South Wales 65 cm, 5, 129t (2017/18) Limited entry, size limits,
spatial closures, vessel
restrictions, 75.62t
4South Australia 60 cm, 3, 199t (2013/14) Limited entry, 1.82t
5Victoria 60 cm, 5 Gear restrictions, licenses,
limited entry, spatial
closures
6Tasmania 45 cm, 10, 3t (2017/18) Size limits, trip limits
Western Australia 7Western Australia 60 cm, 3, 7 t (2017/18) Limited entry, size limits,
spatial closures, vessel
restrictions, 2.89t
Table references: 1 https://www.frdc.com.au/, 2 https://www.qld.gov.au/, 3
https://www.dpi.nsw.gov.au/, 4 https://www.pir.sa.gov.au/, 5 https://vfa.vic.gov.au/, 6
https://www.tas.gov.au/, 7 http://rules.fish.wa.gov.au/

132
6.5 Conclusions
This thesis used kingfish as a model pelagic species to reveal the power of multiple animal
biologging and tracking tools (i.e., accelerometers, acoustic telemetry) to understand important
behaviours and environmental divers of large pelagic fish activity and movement (Figure 6.1). These
findings provide a new insight into reproductive behaviours and movements of kingfish in southern
Australia, but also showcased techniques that can be adapted to other areas or species and contribute
to understanding activity budgets of large pelagic fish and the effects of wildlife tourism. Ultimately,
employing adaptable approaches to detect behavioural change will be vital to ensuring biological
shifts are identified and addressed in rapidly changing pelagic environments.

133
Figure 6.1. Graphical representation of overall thesis, summarising chapter results, thesis outcomes, and thesis conclusion.

134
BIBLIOGRAPHY
Abbink W, Blanco Garcia A, Roques JAC, Partridge GJ, Kloet K, Schneider O (2012) The effect of temperature and pH on the growth and physiological response of juvenile yellowtail kingfish Seriola lalandi in recirculating aquaculture systems. Aquaculture 330-333:130-135
Ackerman JT, Kondratieff MC, Matern SA, Cech JJ (2000) Tidal influence on spatial dynamics of leopard sharks, Triakis semifasciata, in Tomales Bay, California. Environmental Biology of Fishes 58:33-43
Andersson MH (2011) Offshore wind farms — ecological effects of noise and habitat alteration on fish. Stockholm University PhD thesis dissertation
Apps K, Dimmock K, Huveneers C (2018) Turning wildlife experiences into conservation action: Can white shark cage-dive tourism influence conservation behaviour? Marine Policy 88:108-115
Arias A, Sutton SG (2013) Understanding recreational fishers’ compliance with no-take zones in the Great Barrier Reef Marine Park. Ecology and Society 18:1-9
Arnold, G. and Dewar, H. (2001) Electronic tags in marine fisheries research: a 30-year perspective. In: Electronic Tagging and Tracking in Marine Fisheries Reviews: Methods and Technologies in Fish Biology and Fisheries. J.R. Sibert & J.L.Nielsen (eds), Dordrecht: Kluwer Academic Press, pp. 7–64
Arostegui M, Gaube P, Berumen ML, DiGiulian A, Jones B, Røstad A, Braun C (2020) Vertical movements of a pelagic thresher shark (Alopias pelagicus): insights into the species’ physiological limitations and trophic ecology in the Red Sea. Endangered Species Research 43:387-394
Aswani S, Basurto X, Ferse S, Glaser M, Campbell L, Cinner JE, Dalton T, Jenkins LD, Miller ML, Pollnac R (2018) Marine resource management and conservation in the Anthropocene. Environmental Conservation 45:192-202
Axenrot T, Hansson S (2004) Seasonal dynamics in pelagic fish abundance in a Baltic Sea coastal area. Estuarine, Coastal and Shelf Science 60:541-547
Bakun A, Parrish RH (1982) Turbulence, transport, and pelagic fish in the California and Peru current systems. California Cooperative Oceanic Fisheries Investigations 23:99-112
Bakun A, Parrish RH (1991) Comparative studies of coastal pelagic fish reproductive habitats: the anchovy (Engraulis anchoita) of the southwestern Atlantic. ICES Journal of Marine Science 48:343-361
Bakun A (2006) Fronts and eddies as key structures in the habitat of marine fish larvae: opportunity, adaptive response and competitive advantage. Scientia Marina 70:105-122.
Ballantyne R, Packer J, Hughes K (2009) Tourists' support for conservation messages and sustainable management practices in wildlife tourism experiences. Tourism management 30:658-664
Balon EK (1984) Patterns in the evolution of reproductive styles in fishes. Fish Reproduction: Strategies and Tactics, Academic Press, London, pp. 35-53
Barbaro A, Einarsson B, Birnir B, Sigurðsson S, Valdimarsson H, Pálsson ÓK, Sveinbjörnsson S, Sigurðsson Þ (2009) Modelling and simulations of the migration of pelagic fish. ICES Journal of Marine Science: Journal du Conseil 66: 826-838
Barnes, J, Burgess, J, Pearce D (1992) Wildlife tourism. T.M. Swanson, E.B. Barbier (Eds.), Economics for the wilds: Wildlife, wildlands, diversity and development, Earthscan Publications, London
Barnett A, Payne NL, Semmens JM, Fitzpatrick R (2016) Ecotourism increases the field metabolic rate of whitetip reef sharks. Biological Conservation 199:132-136
Barry, C (2020) Big kick energy: tourism feeding site increases whale shark (Rhincodon typus) activity. Flinders University, College of Science and Engineering, Honours thesis dissertation.
Barton, B.A., Morgan, J.D. and Vijayan, M.M. (2002) Physiological and condition-related indicators of environmental stress in fish. In: Adams, S.M. (Eds.), Biological Indicators of Ecosystem Stress. American Fisheries Society, Bethesda, MD, pp. 111–148.
Barton, K. (2020). MuMIn: multi-model inference. R package version 1.43.17. Available at: http://CRAN.R-project.org/package=MuMIn.

135
Bates, D, Mächler, M, Bolker, B, Walker S (2014) Fitting linear mixed-effects models using lme4. Journal of Statistical Software 67:201–210
Baum JK, Worm B (2009) Cascading top‐down effects of changing oceanic predator abundances. Journal of animal ecology 78:699-714
Baxter, JL (1960) A study of the yellowtail Seriola dorsalis (Gill). State of California Department of Fish and Game. Fish Bulletin no. 110, pp. 110-96.
Beale CM, Monaghan P (2004) Behavioural responses to human disturbance: a matter of choice? Animal Behaviour 68:1065-1069
Begg GA, Cameron DS, Sawynok W (1997) Movements and stock structure of school mackerel (Scomberomorus queenslandicus) and spotted mackerel (S. munroi) in Australian east-coast waters. Marine and Freshwater Research 48:295-301
Ben-Aderet, NJ (2017). The biology of yellowtail (Seriola lalandi) in the Southern California Bight: spatial insights from recreational catch records, tagging and life-history characteristics. PhD thesis dissertation, University of California, San Diego.
Bergenius MA, Meekan MG, Robertson RD, McCormick MI (2002) Larval growth predicts the recruitment success of a coral reef fish. Oecologia 131:521-525
Bernal D, Carlson JK, Goldman KJ, Lowe CG (2012) Energetics, metabolism, and endothermy in sharks and rays. In: Carrier JC, Musick JA, Heithaus MR (Eds.) Biology of sharks and their relatives, 2nd edn. CRC Press, Boca Raton, pp. 211–237
Bessa, E., Silva, F, Sabino, J. (2017). Impacts of fish tourism. In Blumstein, D. T., Geffroy, B., Samia, D. S. M., Bessa, E. (Eds.), Ecotourism’s promise and peril. Cham, Switzerland: Springer International Publishing AG, pp. 59–72
Block B, Booth D, Carey F (1992a) Depth and temperature of the blue marlin, Makaira nigricans, observed by acoustic telemetry. Marine Biology 114:175-183
Block BA, Booth D, Carey FG (1992b) Direct measurement of swimming speeds and depth of blue marlin. Journal of Experimental Biology 166:267-284
Block BA, Dewar H, Farwell C, Prince ED (1998) A new satellite technology for tracking the movements of Atlantic bluefin tuna. Proceedings of the National Academy of Sciences 95:9384-9389
Block BA, Dewar H, Blackwell SB, Williams TD, Prince ED, Farwell CJ, Boustany A, Teo SLH, Seitz A, Walli A, Fudge D (2001) Migratory Movements, Depth Preferences, and Thermal Biology of Atlantic Bluefin Tuna. Science 293:1310
Block BA (2005) Physiological ecology in the 21st century: advancements in biologging science. Integrative and Comparative Biology 45:305-320
Block BA, Jonsen ID, Jorgensen SJ, Winship AJ, Shaffer SA, Bograd SJ, Hazen EL, Foley DG, Breed G, Harrison A-L (2011) Tracking apex marine predator movements in a dynamic ocean. Nature 475:86-90
Bohaty SM, Zachos JC (2003) Significant Southern Ocean warming event in the late middle Eocene. Geology 31:1017-1020
Bolger T, Connolly PL (1989) The selection of suitable indices for the measurement and analysis of fish condition. Journal of Fish Biology 34:171-182
Bolnick DI, Snowberg LK, Hirsch PE, Lauber CL, Knight R, Caporaso JG, Svanbäck R (2014) Individuals' diet diversity influences gut microbial diversity in two freshwater fish (threespine stickleback and Eurasian perch). Ecology letters 17:979-987
Börger L, Franconi N, Ferretti F, Meschi F, Michele GD, Gantz A, Coulson T (2006) An integrated approach to identify spatiotemporal and individual-level determinants of animal home range size. The American Naturalist 168:471-485
Bornatowski H, Angelini R, Coll M, Barreto RR, Amorim AF (2018) Ecological role and historical trends of large pelagic predators in a subtropical marine ecosystem of the South Atlantic. Reviews in Fish Biology and Fisheries 28:241-259
Braunisch V, Patthey P, Arlettaz R (2011) Spatially explicit modeling of conflict zones between wildlife and snow sports: prioritizing areas for winter refuges. Ecological Applications 21:955-967
Breiman L (2001) Random forests. Machine learning 45:5-32.

136
Brena PF, Mourier J, Planes S, Clua E (2015) Shark and ray provisioning: functional insights into behavioral, ecological and physiological responses across multiple scales. Marine Ecology Progress Series 538:273-283
Brewster L, Dale J, Guttridge T, Gruber S, Hansell A, Elliott M, Cowx I, Whitney N, Gleiss A (2018) Development and application of a machine learning algorithm for classification of elasmobranch behaviour from accelerometry data. Marine biology 165:1-19
Briggs CT, Post JR (1997) In situ activity metabolism of rainbow trout (Oncorhynchus mykiss): estimates obtained from telemetry of axial muscle electromyograms. Canadian Journal of Fisheries and Aquatic Sciences 54:859-866
Briscoe DK, Hobday AJ, Carlisle A, Scales K, Eveson JP, Arrizabalaga H, Druon JN, Fromentin J-M (2017) Ecological bridges and barriers in pelagic ecosystems. Deep Sea Research Part II: Topical Studies in Oceanography 140:182-192
Brochier T, Echevin V, Tam J, Chaigneau A, Goubanova K, Bertrand A (2013) Climate change scenarios experiments predict a future reduction in small pelagic fish recruitment in the Humboldt Current system. Global change biology 19:1841-1853
Brodie S, Hobday AJ, Smith JA, Everett JD, Taylor MD, Gray CA, Suthers IM (2015) Modelling the oceanic habitats of two pelagic species using recreational fisheries data. Fisheries oceanography 24:463-477
Brodie S (2016) The ecology and distribution of two pelagic fish: yellowtail kingfish Seriola lalandi and dolphinfish Coryphaena hippurus. PhD thesis dissertation, University of New South Wales.
Brodie S, Taylor MD, Smith JA, Suthers IM, Gray CA, Payne NL (2016) Improving consumption rate estimates by incorporating wild activity into a bioenergetics model. Ecology and Evolution 6:2262-2274
Brodie S, Lédée EJ, Heupel MR, Babcock RC, Campbell HA, Gledhill DC, Hoenner X, Huveneers C, Jaine FR, Simpfendorfer CA (2018) Continental-scale animal tracking reveals functional movement classes across marine taxa. Scientific reports 8:1-9
Broell F, Noda T, Wright S, Domenici P, Steffensen JF, Auclair J-P, Taggart CT (2012) Accelerometer tags: detecting and identifying activities in fish and the effect of sampling frequency. Journal of Experimental Biology 216:1255-1264
Broell F, Burnell C, Taggart CT (2016) Measuring abnormal movements in free-swimming fish with accelerometers: implications for quantifying tag and parasite load. Journal of Experimental Biology 219:695-705
Bromhead D, Scholey V, Nicol S, Margulies D, Wexler J, Stein M, Hoyle S, Lennert-Cody C, Williamson J, Havenhand J (2015) The potential impact of ocean acidification upon eggs and larvae of yellowfin tuna (Thunnus albacares). Deep Sea Research Part II: Topical Studies in Oceanography 113:268-279
Brookhouse N, Bucher DJ, Rose K, Kerr I, Gudge S (2013) Impacts, risks and management of fish feeding at Neds Beach, Lord Howe Island Marine Park, Australia: a case study of how a seemingly innocuous activity can become a serious problem. Journal of Ecotourism 12:165-181
Brosset P, Ménard F, Fromentin J-M, Bonhommeau S, Ulses C, Bourdeix J-H, Bigot J-L, Van Beveren E, Roos D, Saraux C (2015) Influence of environmental variability and age on the body condition of small pelagic fish in the Gulf of Lions. Marine Ecology Progress Series 529:219-231
Brousseau LJ, Sclafani M, Smith DR, Carter DB (2004) Acoustic-tracking and radio-tracking of horseshoe crabs to assess spawning behavior and subtidal habitat use in Delaware Bay. North American Journal of Fisheries Management 24:1376-1384
Brown JH, Gillooly JF, Allen AP, Savage VM, West GB (2004) Toward a metabolic theory of ecology. Ecology 85:1771-1789
Brownscombe JW, Gutowsky LF, Danylchuk AJ, Cooke SJ (2014) Foraging behaviour and activity of a marine benthivorous fish estimated using tri-axial accelerometer biologgers. Marine Ecology Progress Series 505:241-251

137
Bruce BD, Bradford RW (2013) The effects of shark cage-diving operations on the behaviour and movements of white sharks, Carcharodon carcharias, at the Neptune Islands, South Australia. Marine Biology 160:889-907
Brunnschweiler JM, Abrantes KG, Barnett A (2014) Long-term changes in species composition and relative abundances of sharks at a provisioning site. PLoS One 9:e86682
Brunnschweiler J, Payne N, Barnett A (2018) Hand feeding can periodically fuel a major portion of bull shark energy requirements at a provisioning site in Fiji. Animal conservation 21:31-35
Buckley TW, Miller BS (1994) Feeding habits of yellowfin tuna associated with fish aggregation devices in American Samoa. Bulletin of Marine Science 55:445-459
Burgin S, Hardiman N (2015) Effects of non-consumptive wildlife-oriented tourism on marine species and prospects for their sustainable management. Journal of environmental management 151:210-220
Burnham KP, Anderson DR (2002) Model selection and multimodel inference: A practical information-theoretic approach. New York: Springer-Verlag. 2nd ed.
Butler PJ, Green JA, Boyd I, Speakman J (2004) Measuring metabolic rate in the field: the pros and cons of the doubly labelled water and heart rate methods. Functional ecology 18:168-183
Cabral RB, Geronimo RC, Lim MT, Aliño PM (2010) Effect of variable fishing strategy on fisheries under changing effort and pressure: an agent-based model application. Ecological Modelling 221:362-369
Cai W, Shi G, Cowan T, Bi D, Ribbe J (2005) The response of the Southern Annular Mode, the East Australian Current, and the southern mid‐latitude ocean circulation to global warming. Geophysical Research Letters 32:L23706
Calenge C (2006) The package “adehabitat” for the R software: a tool for the analysis of space and habitat use by animals. Ecological modelling 197:516-519
Campbell HA, Gao L, Bidder OR, HunterJ., Franklin CE (2013). Creating a behavioural classification module for acceleration data: using a captive surrogate for difficult to observe species. Journal of Experimental Biology, 216:4501-4506.
Campbell SJ, Hoey AS, Maynard J, Kartawijaya T, Cinner J, Graham NA, Baird AH (2012) Weak compliance undermines the success of no-take zones in a large government-controlled marine protected area. PloS one 7:e50074
Carroll G, Slip D, Jonsen I, Harcourt R (2014) Supervised accelerometry analysis can identify prey capture by penguins at sea. The Journal of Experimental Biology 217:4295-4302
Cavraro F, Bettoso N, Zucchetta M, D’Aietti A, Faresi L, Franzoi P (2019) Body condition in fish as a tool to detect the effects of anthropogenic pressures in transitional waters. Aquatic Ecology 53:21-35
Ceo M, Fagnani S, Swan J, Tamada K, Watanabe H (2012) Performance reviews by regional fishery bodies: Introduction, Summaries, Synthesis and Best Practices Volume 1: CCAMLR, CCSBT, ICCAT, IOTC, NAFO, NASCO, NEAFC. FAO Fisheries and Aquaculture Circular, No. 1072, Rome, Italy
Champion C, Hobday AJ, Zhang X, Pecl GT, Tracey SR (2018) Changing windows of opportunity: past and future climate-driven shifts in temporal persistence of kingfish (Seriola lalandi) oceanographic habitat within south-eastern Australian bioregions. Marine and Freshwater Research 70:33-42
Champion C (2019) Influence of oceanographic environment on the distribution and condition of yellowtail kingfish (Seriola lalandi) within a climate change hotspot. University of Tasmania, PhD thesis dissertation
Champion C, Hobday AJ, Pecl GT, Tracey SR (2020) Oceanographic habitat suitability is positively correlated with the body condition of a coastal‐pelagic fish. Fisheries Oceanography 29:100-110
Chang C-T, Lin S-J, Chiang W-C, Musyl MK, Lam C-H, Hsu H-H, Chang Y-C, Ho Y-S, Tseng C-T (2020) Horizontal and vertical movement patterns of sunfish off eastern Taiwan. Deep Sea Research Part II: Topical Studies in Oceanography 175:104683
Chapman JW, Bell JR, Burgin LE, Reynolds DR, Pettersson LB, Hill JK, Bonsall MB, Thomas JA (2012) Seasonal migration to high latitudes results in major reproductive benefits in an insect. Proceedings of the National Academy of Sciences 109:14924-14929

138
Chateau O, Wantiez L (2008) Human impacts on residency behaviour of spangled emperor, Lethrinus nebulosus, in a marine protected area, as determined by acoustic telemetry. Journal of the Marine Biological Association of the United Kingdom 88:825-829
Chellappa S, Huntingford F, Strang R, Thomson R (1995) Condition factor and hepatosomatic index as estimates of energy status in male three‐spined stickleback. Journal of Fish Biology 47:775-787
Chen C, Liaw A, Breiman L (2004) Using random forest to learn imbalanced data. University of California, Berkeley. Technical Report 666, pp. 110-124
Cheung WW, Meeuwig JJ, Feng M, Harvey E, Lam VW, Langlois T, Slawinski D, Sun C, Pauly D (2012) Climate-change induced tropicalisation of marine communities in Western Australia. Marine and Freshwater Research 63:415-427
Chiang W-C, Kawabe R, Musyl MK, Sun C-L, Hung H-M, Lin H-C, Watanabe S, Furukawa S, Chen W-Y, Chen Y-K (2013) Diel oscillations in sailfish vertical movement behavior in the East China Sea. Journal of Marine Science and Technology 21:267-273
Christiansen F, Rasmussen MH, Lusseau D (2013) Inferring activity budgets in wild animals to estimate the consequences of disturbances. Behavioral Ecology 24:1415-1425
Clarke C, Lea J, Ormond RF (2013) Changing relative abundance and behaviour of silky and grey reef sharks baited over 12 years on a Red Sea reef. Marine and Freshwater Research 64:909-919
Clarke TM, Whitmarsh SK, Hounslow JL, Gleiss AC, Payne NL, Huveneers C (2021) Using tri-axial accelerometer loggers to identify spawning behaviours of large pelagic fish. Movement Ecology 9:1-14
Clua E, Buray N, Legendre P, Mourier J, Planes S (2010) Behavioural response of sicklefin lemon sharks Negaprion acutidens to underwater feeding for ecotourism purposes. Marine Ecology Progress Series 414:257-266
Cole R (1994) Abundance, size structure, and diver-oriented behaviour of three large benthic carnivorous fishes in a marine reserve in northeastern New Zealand. Biological conservation 70:93-99
Collins AB, Heupel MR, Simpfendorfer CA (2008) Spatial distribution and long-term movement patterns of cownose rays Rhinoptera bonasus within an estuarine river. Estuaries and Coasts 31:1174-1183
Collins MA, Stowasser G, Fielding S, Shreeve R, Xavier JC, Venables HJ, Enderlein P, Cherel Y, Van de Putte A (2012) Latitudinal and bathymetric patterns in the distribution and abundance of mesopelagic fish in the Scotia Sea. Deep Sea Research Part II: Topical Studies in Oceanography 59:189-198
Cooke SJ, Hinch SG, Wikelski M, Andrews RD, Kuchel LJ, Wolcott TG, Butler PJ (2004a) Biotelemetry: a mechanistic approach to ecology. Trends in Ecology and Evolution 19:334-343
Cooke SJ, Thorstad EB, Hinch SG (2004b) Activity and energetics of free‐swimming fish: insights from electromyogram telemetry. Fish and Fisheries 5:21-52
Corcoran MJ, Wetherbee BM, Shivji MS, Potenski MD, Chapman DD, Harvey GM (2013) Supplemental feeding for ecotourism reverses diel activity and alters movement patterns and spatial distribution of the southern stingray, Dasyatis americana. PLoS One 8:e59235
Costa E (2015) Reproductive strategies of marine fishes from the southwest Atlantic Ocean: An application of histological and image processing techniques. Universidade De Sao Paulo, Sao Paula, Brazil. PhD thesis dissertation
Cowley P, Bennett R, Childs A, Murray T (2017) Reflection on the first five years of South Africa’s Acoustic Tracking Array Platform (ATAP): status, challenges and opportunities. African Journal of Marine Science 39:363-372
Cox KW, Heintz R (2009) Electrical phase angle as a new method to measure fish condition. Fishery Bulletin 107:477-487
Cox M, Heintz R, Hartman K (2011) Measurements of resistance and reactance in fish with the use of bioelectrical impedance analysis: sources of error. Fishery Bulletin 109:35 - 47
Critchell K, Hoogenboom MO (2018) Effects of microplastic exposure on the body condition and behaviour of planktivorous reef fish (Acanthochromis polyacanthus). PloS one 13:e0193308

139
Crossin GT, Heupel MR, Holbrook CM, Hussey NE, Lowerre‐Barbieri SK, Nguyen VM, Raby GD, Cooke SJ (2017) Acoustic telemetry and fisheries management. Ecological Applications 27:1031-1049
Crutzen PJ (2006) The “anthropocene”. Earth system science in the anthropocene. Springer, pp. 13-18
Currier R, Kirkpatrick B, Simoniello C, Lowerre-Barbieri S, Bickford J (2015) iTAG: developing a cloud based, collaborative animal tracking network in the Gulf of Mexico. In: OCEANS 2015 - MTS/IEEE, Washington, Washington DC, pp. 1–3.
Curtin S, Kragh G (2014) Wildlife tourism: Reconnecting people with nature. Human dimensions of wildlife 19:545-554
Cury P, Roy C (1989) Optimal environmental window and pelagic fish recruitment success in upwelling areas. Canadian Journal of Fisheries and Aquatic Sciences 46:670-680
Dagorn L, Holland KN, Filmalter J (2010) Are drifting FADs essential for testing the ecological trap hypothesis? Fisheries Research 106:60-63
Danchin E, Giraldeau L, Ce´zilly F (2008) Behavioural ecology. Oxford University Press, Oxford Darling JA, Carlton JT (2018) A framework for understanding marine cosmopolitanism in the
Anthropocene. Frontiers in Marine Science 5:293 Davies, NB, Krebs, JR, West, SA (2012) An Introduction to Behavioural Ecology. 4th Edition. Wiley-
Blackwell, Chichester, pp. 520 Davis T, Jenkins G, Young J (1990) Patterns of horizontal distribution of the larvae of southern
bluefin (Thunnus maccoyii) and other tuna in the Indian Ocean. Journal of plankton research 12:1295-1314
Del Raye G, Weng KC (2015) An aerobic scope-based habitat suitability index for predicting the effects of multi-dimensional climate change stressors on marine teleosts. Deep Sea Research Part II: Topical Studies in Oceanography 113:280-290
DeMartini EE, Uchiyama JH, Williams HA (2000) Sexual maturity, sex ratio, and size composition of swordfish, Xiphias gladius, caught by the Hawaii-based pelagic longline fishery. Fishery Bulletin 98:489-489
DeRuiter SL, Southall BL, Calambokidis J, Zimmer WM, Sadykova D, Falcone EA, Friedlaender AS, Joseph JE, Moretti D, Schorr GS (2013) First direct measurements of behavioural responses by Cuvier's beaked whales to mid-frequency active sonar. Biology letters 9:20130223
Department for Environment and Water (2016) South Australian White Shark Tour Licensing Policy, pp.1-12
Department for Environment and Water (2018) Kingfish due back in Coffin Bay, environment.sa.gov.au, accessed September 2020.
Di Natale A, Mangano A (1995) Moon phases influence on CPUE: A first analysis of swordfish driftnet catch data from the Italian fleet between 1990 and 1991. Collect Vol Sci Pap ICCAT 44:264-267
Dicken M, Hosking S (2009) Socio-economic aspects of the tiger shark diving industry within the Aliwal Shoal Marine Protected Area, South Africa. African Journal of Marine Science 31:227-232
Dickinson MH, Farley CT, Full RJ, Koehl M, Kram R, Lehman S (2000) How animals move: an integrative view. Science 288:100-106
Dirzo R, Young HS, Galetti M, Ceballos G, Isaac NJ, Collen B (2014) Defaunation in the Anthropocene. Science 345:401-406
Doherty TS, Driscoll DA (2018) Coupling movement and landscape ecology for animal conservation in production landscapes. Proceedings of the Royal Society B: Biological Sciences 285:20172272
Doherty TS, Hays GC, Driscoll DA (2021) Human disturbance causes widespread disruption of animal movement. Nature Ecology & Evolution 5:513-519
Domeier ML (2012) Revisiting spawning aggregations: definitions and challenges. In Reef Fish Spawning Aggregations: Biology, Research and Management, Fish & Fisheries Series (Y. Sadovy de Mitchson, P. L. Colin, Eds.), Springer, Dordrecht. 35:1-20.

140
Domínguez-Petit R, Saborido-Rey F, Medina I (2010) Changes of proximate composition, energy storage and condition of European hake (Merluccius merluccius, L. 1758) through the spawning season. Fisheries Research 104:73-82
Donaldson MR, Hinch SG, Suski CD, Fisk AT, Heupel MR, Cooke SJ (2014) Making connections in aquatic ecosystems with acoustic telemetry monitoring. Frontiers in Ecology and the Environment 12:565-573
Donalty S, Henke SE, Kerr CL (2003) Use of winter food plots by nongame wildlife species. Wildlife Society Bulletin 31:774-778
Donohue CG, Partridge GJ, Sequeira, AMM (2021). Bioenergetic growth model for the yellowtail kingfish (Seriola lalandi). Aquaculture 531:735884.
Duran E, England M, Spence P (2020) Surface ocean warming around Australia driven by interannual variability and long‐term trends in Southern Hemisphere westerlies. Geophysical Research Letters 47:e2019GL086605
Egli D, Babcock R (2004) Ultrasonic tracking reveals multiple behavioural modes of snapper (Pagrus auratus) in a temperate no-take marine reserve. ICES Journal of Marine Science 61:1137-1143
Embling C, Sharples J, Armstrong E, Palmer M, Scott B (2013) Fish behaviour in response to tidal variability and internal waves over a shelf sea bank. Progress in Oceanography 117:106-117
Environment of South Australia (2018) Kingfish due back in Coffin Bay, Government of South Australia, accessed 1/02/2022, https://www.environment.sa.gov.au/news-hub/news/articles/2018/09/kingfish-coffin-bay
Espinoza M, Farrugia TJ, Webber DM, Smith F, Lowe CG (2011). Testing a new acoustic telemetry technique to quantify long-term, fine-scale movements of aquatic animals. Fisheries Research, 108:364-371
Espinoza M, Lédée EJ, Simpfendorfer CA, Tobin AJ, Heupel MR (2015) Contrasting movements and connectivity of reef‐associated sharks using acoustic telemetry: Implications for management. Ecological Applications 25:2101-2118
Espinoza M, Heupel MR, Tobin AJ, Simpfendorfer CA (2016) Evidence of partial migration in a large coastal predator: opportunistic foraging and reproduction as key drivers? PloS one 11:e0147608
Fielder, D, Heasman, M (2011). Hatchery Manual for the Production of Australian Bass, Mulloway and Yellowtail Kingfish. Industries, N.D.o.P. (Eds.). Taylors Beach, NSW: Port Stephens Fisheries Institute.
Fitzpatrick R, Abrantes KG, Seymour J, Barnett A (2011) Variation in depth of whitetip reef sharks: does provisioning ecotourism change their behaviour? Coral Reefs 30:569-577
Flavelle LS, Ridgway MS, Middel TA, McKinley RS: Integration of acoustic telemetry and GIS to identify potential spawning areas for lake trout (Salvelinus namaycus). Hydrobiologia 2002, 483:137–146.
Flávio H, Baktoft H (2021) actel: Standardised analysis of acoustic telemetry data from animals moving through receiver arrays. Methods in Ecology and Evolution 12:196-203
Foerster F, Smeja M, Fahrenberg J (1999) Detection of posture and motion by accelerometry: a validation study in ambulatory monitoring. Computers in Human Behavior 15:571-583
Fossette S, Schofield G, Lilley MK, Gleiss AC, Hays GC (2012) Acceleration data reveal the energy management strategy of a marine ectotherm during reproduction. Functional Ecology 26:324-333
Foster KR, Lukaski HC (1996) Whole-body impedance--what does it measure? The American journal of clinical nutrition 64:388-396
Foster S (1987) Diel and lunar patterns of reproduction in the Caribbean and Pacific sergeant major damselfishes Abudefduf saxatilis and A. troschelii. Marine Biology 95:333-343
Francis CD, Barber JR (2013) A framework for understanding noise impacts on wildlife: an urgent conservation priority. Frontiers in Ecology and the Environment 11:305-313
French SS, González-Suárez M, Young JK, Durham S, Gerber LR (2011) Human disturbance influences reproductive success and growth rate in California sea lions (Zalophus californianus). PloS one 6:e17686

141
Gabriel C, Gabriel S, Corthout yE (1996) The dielectric properties of biological tissues: I. Literature survey. Physics in medicine & biology 41:2231
Gallagher AJ, Hammerschlag N (2011) Global shark currency: the distribution, frequency, and economic value of shark ecotourism. Current Issues in Tourism 14:797-812
Gallagher AJ, Vianna GM, Papastamatiou YP, Macdonald C, Guttridge TL, Hammerschlag N (2015) Biological effects, conservation potential, and research priorities of shark diving tourism. Biological Conservation 184:365-379
Gallagher AJ, Huveneers CP (2018) Emerging challenges to shark-diving tourism. Marine Policy 96:9-12
Galland GR, Nickson AE, Hopkins R, Miller SK (2018) On the importance of clarity in scientific advice for fisheries management. Marine Policy 87:250-254
Galuardi B, Royer F, Golet W, Logan J, Neilson J, Lutcavage M (2010) Complex migration routes of Atlantic bluefin tuna (Thunnus thynnus) question current population structure paradigm. Canadian Journal of Fisheries and Aquatic Sciences 67:966-976
Gaspar P, Georges J-Y, Fossette S, Lenoble A, Ferraroli S, Le Maho Y (2006) Marine animal behaviour: neglecting ocean currents can lead us up the wrong track. Proceedings of the Royal Society B: Biological Sciences 273:2697-2702
Gaudreau N, Boisclair D (2000) Influence of moon phase on acoustic estimates of the abundance of fish performing daily horizontal migration in a small oligotrophic lake. Canadian Journal of Fisheries and Aquatic Sciences 57:581-590
Great Barrier Reef Marine Park Authority 2005, Great Barrier Reef Marine Park Heritage Strategy, Great Barrier Reef Marine Park Authority, Townsville.
Gill JA, Norris K, Sutherland WJ (2001) Why behavioural responses may not reflect the population consequences of human disturbance. Biological Conservation 97:265-268
Gillanders BM, Ferrell DJ, Andrew NL (1999) Size at maturity and seasonal changes in gonad activity of yellowtail kingfish (Seriola lalandi; Carangidae) in New South Wales, Australia. New Zealand Journal of Marine and Freshwater Research 33:457-468
Gillanders BM, Ferrell DJ, Andrew NL (2001) Estimates of movement and life-history parameters of yellowtail kingfish (Seriola lalandi): how useful are data from a cooperative tagging programme? Marine and Freshwater Research 52:179-192
Gleiss, A., Gruber, S., Wilson, R., 2009. Multi-Channel Data-Logging: Towards Determination of Behaviour and Metabolic Rate in Free-Swimming Sharks. In: Nielsen, J., Arrizabalaga, H., Fragoso, N., Hobday, A., Lutcavage, M., Sibert, J. (Eds.), Tagging and Tracking of Marine Animals with Electronic Devices. Springer, New York, pp. 211–228.
Gleiss AC, Norman B, Wilson RP (2011a) Moved by that sinking feeling: variable diving geometry underlies movement strategies in whale sharks. Functional Ecology 25:595-607
Gleiss AC, Wilson RP, Shepard EL (2011b) Making overall dynamic body acceleration work: on the theory of acceleration as a proxy for energy expenditure. Methods in Ecology and Evolution 2:23-33
Gleiss AC, Wright S, Liebsch N, Wilson RP, Norman B (2013) Contrasting diel patterns in vertical movement and locomotor activity of whale sharks at Ningaloo Reef. Marine Biology 160:2981-2992
Glencross B, Carter C, Gunn J, van Barneveld R, Rough K, Clarke S (2002) Southern bluefin tuna, Thunnus maccoyii. CABI Publishing, New York, USA
Golet WJ, Cooper AB, Campbell R, Lutcavage M (2007) Decline in condition of northern bluefin tuna (Thunnus thynnus) in the Gulf of Maine. Fishery Bulletin 105:390-395
Golovanov V (2006) The ecological and evolutionary aspects of thermoregulation behavior on fish. Journal of Ichthyology 46:S180-S187
Gomon DMF, Bray DJ, Kuiter RH (2008) Fishes of Australia’s southern coast. Reed New Holland, New South Wales, Australia
Graham K, Beckerman AP, Thirgood S (2005) Human–predator–prey conflicts: ecological correlates, prey losses and patterns of management. Biological conservation 122:159-171
Graham RT, Castellanos DW (2005) Courtship and spawning behaviors of carangid species in Belize. Fishery Bulletin 103:426-432

142
Grainger R, Peddemors VM, Raubenheimer D, Machovsky-Capuska GE (2020) Diet composition and nutritional niche breadth variability in juvenile white sharks (Carcharodon carcharias). Frontiers in Marine Science 7:422
Green C, Hamer P, Ingram B, Silva C, Strugnell J, B W (2020) Increasing knowledge of Victoria’s growing recreational yellowtail kingfish fishery. Recreational Fishing Grants Program Research Report, Project No 14/15/Large/34
Gregory MK, See VH, Gibson RA, Schuller KA (2010) Cloning and functional characterisation of a fatty acyl elongase from southern bluefin tuna (Thunnus maccoyii). Comparative Biochemistry and Physiology Part B: Biochemistry and Molecular Biology 155:178-185
Griffin LP, Brownscombe JW, Adams AJ, Boucek RE, Finn JT, Heithaus MR, Rehage JS, Cooke SJ, Danylchuk AJ (2018) Keeping up with the Silver King: using cooperative acoustic telemetry networks to quantify the movements of Atlantic tarpon (Megalops atlanticus) in the coastal waters of the southeastern United States. Fisheries Research 205:65-76
Grüss A, Robinson J, Heppell SS, Heppell SA, Semmens BX (2014) Conservation and fisheries effects of spawning aggregation marine protected areas: what we know, where we should go, and what we need to get there. ICES Journal of Marine Science 71:1515-1534
Gunn J & Block BA (2001) Advances in acoustic, archival, and satellite tagging of tunas. Fish physiology 19:167-224
Halpern BS, Walbridge S, Selkoe KA, Kappel CV, Micheli F, D'Agrosa C, Bruno JF, Casey KS, Ebert C, Fox HE (2008) A global map of human impact on marine ecosystems. Science 319:948-952
Hammerschlag N, Skubel R, Calich H, Nelson E, Shiffman D, Wester J, Macdonald C, Cain S, Jennings L, Enchelmaier A (2017) Nocturnal and crepuscular behavior in elasmobranchs: a review of movement, habitat use, foraging, and reproduction in the dark. Bulletin of Marine Science 93:355-374
Hannah L, Midgley GF, Millar D (2002) Climate change‐integrated conservation strategies. Global Ecology and Biogeography 11:485-495
Hansen T, Karlsen Ø, Taranger GL, Hemre G-I, Holm JC, Kjesbu OS (2001) Growth, gonadal development and spawning time of Atlantic cod (Gadus morhua) reared under different photoperiods. Aquaculture 203:51-67
Harrington R, Taylor L (1990) Migration for survival: fine-scale population redistribution in an aphid, Myzus persicae. The Journal of Animal Ecology 59:1177-1193
Hartman KJ, Brandt SB (1995) Estimating energy density of fish. Transactions of the American Fisheries Society 124:347-355
Hartman KJ, Margraf FJ, Hafs AW, Cox MK (2015) Bioelectrical impedance analysis: a new tool for assessing fish condition. Fisheries 40:590-600
Heino M, Godø OR (2002) Fisheries-induced selection pressures in the context of sustainable fisheries. Bulletin of marine science 70:639-656
Heinrich D, Dhellemmes F, Guttridge TL, Smukall M, Brown C, Rummer J, Gruber S, Huveneers C (2021) Short-term impacts of daily feeding on the residency, distribution and energy expenditure of sharks. Animal Behaviour 172:55-71
Henry GW, Lyle JM (2003) National recreational and indigenous fishing survey. Herborn KA, Macleod R, Miles WT, Schofield AN, Alexander L, Arnold KE (2010) Personality in
captivity reflects personality in the wild. Animal Behaviour 79:835-843 Heupel M, Simpfendorfer C (2014) Importance of environmental and biological drivers in the
presence and space use of a reef‑associated shark. Marine Ecology Progress Series 496:47-57 Heupel MR, Simpfendorfer CA, Espinoza M, Smoothey AF, Tobin A, Peddemors V (2015)
Conservation challenges of sharks with continental scale migrations. Frontiers in Marine Science 2:1-7
Heupel MR, Kessel ST, Matley JK, Simpfendorfer CA (2018) Acoustic telemetry. CRC Press Higginbottom K, Green R, Northrope C (2003) A framework for managing the negative impacts of
wildlife tourism on wildlife. Human dimensions of wildlife 8:1-24 Higginbottom K, Tribe A (2004) Contributions of wildlife tourism to conservation. Wildlife tourism:
Impacts, management and planning, Common Ground Publishing, CRC for Sustainable Tourism, Gold Coast, 99-123

143
Hoare DJ, Couzin ID, Godin J-G, Krause J (2004) Context-dependent group size choice in fish. Animal Behaviour 67:155-164
Hobday AJ, Campbell G (2009) Topographic preferences and habitat partitioning by pelagic fishes off southern Western Australia. Fisheries Research 95:332-340
Hobday, AJ, Griffiths S, Ward, T (2009), Pelagic fishes and sharks, in Poloczanska, E, Hobday, AJ, Richardson, A. (Eds.) Marine Climate Change Impacts and Adaptation Report Card for Australia 2009, NCCARF Publication.
Hobday AJ, Hartog JR, Spillman CM, Alves O (2011) Seasonal forecasting of tuna habitat for dynamic spatial management. Canadian Journal of Fisheries and Aquatic Sciences 68:898-911
Hobday AJ, Lough JM (2011) Projected climate change in Australian marine and freshwater environments. Marine and Freshwater Research 62:1000-1014
Hobday AJ, Pecl GT (2014) Identification of global marine hotspots: sentinels for change and vanguards for adaptation action. Reviews in Fish Biology and Fisheries 24:415-425
Hobday AJ, Evans K, Eveson JP, Farley JH, Hartog JR, Basson, M, Patterson TA (2016) Distribution and migration—southern bluefin tuna (Thunnus maccoyii). In: Kitagawa T, Kimura S (eds) Biology and ecology of bluefin tuna. CRC Press, Boca Raton, 189–210
Hoenner X, Huveneers C, Steckenreuter A, Simpfendorfer C, Tattersall K, Jaine F, Atkins N, Babcock R, Brodie S, Burgess J (2018) Australia’s continental-scale acoustic tracking database and its automated quality control process. Scientific data 5:1-10
Hoey AS, McCormick MI (2004) Selective predation for low body condition at the larval-juvenile transition of a coral reef fish. Oecologia 139:23-29
Holland KN, Brill R, Ferguson S, Chang R, Yost R (1985) A small vessel technique for tracking pelagic fish. Marine Fisheries Review 4:26-32
Horne JS, Garton EO, Krone SM, Lewis JS (2007) Analyzing animal movements using Brownian bridges. Ecology 88:2354-2363
Horwood, JW, Cushing, DH (1978). Spatial Distributions and Ecology of Pelagic Fish. In Steele, JH. editor, Spatial Pattern in Plankton Communities, New York and London: Plenum Press, pp. 55-383.
Hounslow JL (2018) Establishing best practice for the classification of shark behaviour from bio-logging data. Murdoch University, Honours thesis dissertation
Hounslow J, Brewster L, Lear K, Guttridge TL, Daly R, Whitney N, Gleiss A (2019) Assessing the effects of sampling frequency on behavioural classification of accelerometer data, Journal of experimental marine biology and ecology, 512:22-30
Hughes J, Stewart J (2020) Status of Australian Fish Stocks 2020 – NSW Stock status summary – Yellowtail Kingfish (Seriola lalandi).
Humston R, Ault JS, Lutcavage M, Olson DB (2000) Schooling and migration of large pelagic fishes relative to environmental cues. Fisheries Oceanography 9:136-146
Hussey NE, Kessel ST, Aarestrup K, Cooke SJ, Cowley PD, Fisk AT, Harcourt RG, Holland KN, Iverson SJ, Kocik JF (2015) Aquatic animal telemetry: a panoramic window into the underwater world. Science 348:1255642
Hutson K, Smith B, Godfrey R, Whittington I, Chambers C, Ernst I, Gillanders B (2007) A tagging study on yellowtail kingfish (Seriola lalandi) and Samson fish (S. hippos) in south Australian waters. Transactions of the Royal Society of South Australia 131:128-134
Huveneers C, Rogers PJ, Beckmann C, Semmens JM, Bruce BD, Seuront L (2013) The effects of cage-diving activities on the fine-scale swimming behaviour and space use of white sharks. Marine Biology 160:2863-2875
Huveneers C, Simpfendorfer CA, Kim S, Semmens JM, Hobday AJ, Pederson H, Stieglitz T, Vallee R, Webber D, Heupel MR (2016) The influence of environmental parameters on the performance and detection range of acoustic receivers. Methods in Ecology and Evolution 7:825-835
Huveneers C, Meekan MG, Apps K, Ferreira LC, Pannell D, Vianna GM (2017a) The economic value of shark-diving tourism in Australia. Reviews in Fish Biology and Fisheries 27:665-680

144
Huveneers C, Lloyd M (2017b) Residency of white sharks, Carcharodon carcharias, at the Neptune Islands Group Marine Park (2016–17). Report to the Department of the Environment, Water and Natural Resources Adelaide, South Australia, Flinders University
Huveneers C, Watanabe YY, Payne NL, Semmens JM (2018) Interacting with wildlife tourism increases activity of white sharks. Conservation Physiology 6:1-34
Huveneers C, Jaine FR, Barnett A, Butcher PA, Clarke TM, Currey-Randall LM, Dwyer RG, Ferreira LC, Gleiss AC, Hoenner X (2021a) The power of national acoustic tracking networks to assess the impacts of human activity on marine organisms during the COVID-19 pandemic. Biological Conservation 256:108995
Huveneers C, Niella Y, Drew M, Rogers PJ, Waltrick D, Dowling C, Mountford S, Keay I, Braccini M (2021b) Continental-scale network reveals cross-jurisdictional movements of sympatric sharks with implications for assessment and management. Frontiers in Marine Science 8:955
Inslerman, RA (2006). Baiting and supplemental feeding of game wildlife species. The Wildlife Society. Accessed from http://wildlife.org/documents/technicalreview
Iwama GK, Thomas PT, Forsyth RB, Vijayan MM (1998) Heat shock protein expression in fish. Reviews in Fish Biology and Fisheries 8:35-56
Jackson GD (2011) The development of the Pacific Ocean shelf tracking project within the decade long census of marine life. PloS one 6:e18999
Jansen T, Gislason H (2011) Temperature affects the timing of spawning and migration of North Sea mackerel. Continental Shelf Research 31:64-72
Jepsen N, Schreck C, Clements S, Thorstad EB (2005b) A brief discussion on the 2% tag/bodyweight rule of thumb. In: Spedicato MT, Lembo G, Marmulla G (eds) Aquatic telemetry: advances and applications. Proceedings of the Fifth Conference on Fish Telemetry held in Europe, Ustica, Italy, 9–13 June 2003. FAO/COISPA, Rome, pp. 255–260
Johansen J, Pratchett M, Messmer V, Coker DJ, Tobin A, Hoey A (2015) Large predatory coral trout species unlikely to meet increasing energetic demands in a warming ocean. Scientific reports 5:1-8
Johnson CR, Banks SC, Barrett NS, Cazassus F, Dunstan PK, Edgar GJ, Frusher SD, Gardner C, Haddon M, Helidoniotis F (2011) Climate change cascades: Shifts in oceanography, species' ranges and subtidal marine community dynamics in eastern Tasmania. Journal of Experimental Marine Biology and Ecology 400:17-32
Johnson BM, Pate WM, Hansen AG (2017) Energy density and dry matter content in fish: new observations and an evaluation of some empirical models. Transactions of the American Fisheries Society 146:1262-1278
Johnston I, Dunn J (1987) Temperature acclimation and metabolism in ectotherms with particular reference to teleost fish. Symposia of the Society for Experimental Biology 41: 67-93
Jones DR (1978) The respiratory and circulatory systems during exercise in fish. Fish physiology 7:425-501
Jonsson, N, Jonsson, B, Hansen, LP (1997). Changes in proximate composition and estimates of energetic costs during upstream migration and spawning in Atlantic salmon Salmo salar. Journal of Animal Ecology 66:425-436.
Kadar JP, Ladds, MA, Day J, Lyall B, Brown, C (2020). Assessment of machine learning models to identify Port Jackson shark behaviours using tri-axial accelerometers. Sensors, 20:7096
Kämpf J, Ellis H (2015) Hydrodynamics and flushing of Coffin Bay, South Australia: A small tidal inverse estuary of interconnected bays. Journal of Coastal Research 31:447-456
Karakulak S, Oray I, Corriero A, Deflorio M, Santamaria N, Desantis S, De Metrio G (2004) Evidence of a spawning area for the bluefin tuna (Thunnus thynnus L.) in the eastern Mediterranean. Journal of Applied Ichthyology 20:318-320
Katzner, T, Arlettaz, R (2019). Evaluating contributions of recent tracking-based animal movement ecology to conservation management. Frontiers in Ecology and Evolution 7:1-10.
Kawabata Y, Noda T, Nakashima Y, Nanami A, Sato T, Takebe T, Mitamura H, Arai N, Yamaguchi T, Soyano K (2014) A combination of gyroscope and accelerometer for identifying alternative feeding behaviours in fish. The Journal of Experimental Biology 217:3204-3208

145
Kawabe R, Nashimoto K, Hiraishi T, Naito Y, Sato K (2003) A new device for monitoring the activity of freely swimming flatfish, Japanese flounder Paralichthys olivaceus. Fisheries Science 69:3-10
Kie JG (2013) A rule-based ad hoc method for selecting a bandwidth in kernel home-range analyses. Animal Biotelemetry 1:1-12
Kirkpatrick BA, Currier RD, Simoniello C (2016) iTAG: Integrating a Cloud Based, Collaborative Animal Tracking Network into the GCOOS data portal in the Gulf of Mexico. American Geophysical Union 2016:OD34A-2492
Kissil GW, Lupatsch I, Elizur A, Zohar Y (2001) Long photoperiod delayed spawning and increased somatic growth in gilthead seabream (Sparus aurata). Aquaculture 200:363-379
Kitchell JF, Martell SJ, Walters CJ, Jensen OP, Kaplan IC, Watters J, Essington TE, Boggs CH (2006) Billfishes in an ecosystem context. Bulletin of Marine Science 79:669-682
Knight J (2009) Making wildlife viewable: habituation and attraction. Society & Animals 17:167-184 Kowalczyk ND, Chiaradia A, Preston TJ, Reina RD (2014) Linking dietary shifts and reproductive
failure in seabirds: a stable isotope approach. Functional ecology 28:755-765 Kramer DL (1987) Dissolved oxygen and fish behavior. Environmental biology of fishes 18:81-92 Kreiss CM, Michael K, Lucassen M, Jutfelt F, Motyka R, Dupont S, Pörtner H-O (2015) Ocean
warming and acidification modulate energy budget and gill ion regulatory mechanisms in Atlantic cod (Gadus morhua). Journal of Comparative Physiology 185:767-781
Ladds MA, Thompson AP, Kadar J-P, J Slip D, P Hocking D, G Harcourt R (2017) Super machine learning: improving accuracy and reducing variance of behaviour classification from accelerometry. Animal Biotelemetry 5:1-9
Lamouroux N, Capra H, Pouilly M, Souchon Y (1999) Fish habitat preferences in large streams of southern France. Freshwater Biology 42:673-687
Landscape South Australia (2016) Be aware of Coffin Bay Sanctuary Zones this Kingfish season, accessed 1/2/2022, https://www.landscape.sa.gov.au/ep/news/161014-sanctuary-zones-kingfish
Laroche RK, Kock AA, Dill LM, Oosthuizen WH (2007) Effects of provisioning ecotourism activity on the behaviour of white sharks Carcharodon carcharias. Marine Ecology Progress Series 338:199-209
Lasker R (1981) The role of a stable ocean in larval fish survival and subsequent recruitment. Marine fish larvae: morphology, ecology and relation to fisheries 1:80-89
Lear KO, Whitney NM, Brewster LR, Morris JJ, Hueter RE, Gleiss AC (2017) Correlations of metabolic rate and body acceleration in three species of coastal sharks under contrasting temperature regimes. Journal of Experimental Biology 220:397-407
Lear KO, Morgan DL, Whitty JM, Whitney NM, Byrnes EE, Beatty SJ, Gleiss AC (2020) Divergent field metabolic rates highlight the challenges of increasing temperatures and energy limitation in aquatic ectotherms. Oecologia 193:311-323
Lédée EJ, Heupel MR, Taylor MD, Harcourt RG, Jaine FR, Huveneers C, Udyawer V, Campbell HA, Babcock RC, Hoenner X (2021) Continental‐scale acoustic telemetry and network analysis reveal new insights into stock structure. Fish and Fisheries 22: 987-1005
Lenhardt M, Jaric I, Cakic P, Cvijanovic G, Gacic Z, Kolarevic J (2009) Seasonal changes in condition, hepatosomatic index and parasitism in sterlet (Acipenser ruthenus L.). Turkish Journal of Veterinary and Animal Sciences 33:209-214
Leos‐Barajas V, Photopoulou T, Langrock R, Patterson TA, Watanabe YY, Murgatroyd M, Papastamatiou YP (2017) Analysis of animal accelerometer data using hidden Markov models. Methods in Ecology and Evolution 8:161-173
Lewis SL, Maslin MA (2015) Defining the anthropocene. Nature 519:171-180 Lewison R, Hobday AJ, Maxwell S, Hazen E, Hartog JR, Dunn DC, Briscoe D, Fossette S, O'Keefe
CE, Barnes M, Abecassis M (2015). Dynamic ocean management: identifying the critical ingredients of dynamic approaches to ocean resource management. BioScience 65:486-498.
Lin S-J, Chiang W-C, Musyl MK, Wang S-P, Su N-J, Chang Q-X, Ho Y-S, Nakamura I, Tseng C-T, Kawabe R (2020) Movements and Habitat Use of Dolphinfish (Coryphaena hippurus) in the East China Sea. Sustainability 12:5793

146
Lowry M, Molony B, Keag M, Penney A (2016) Yellowtail kingfish Seriola lalandi. Fisheries Research and Development Corporation) Available at http://fish gov au/reports/finfish/Pages/yellowtail_kingfish [Verified 29 July 2021]
Macfadyen, G, Huntington, T, Defaux, V, Rogers, A, Galland, G, Nickson, A (2016). Netting Billions: A Global Valuation of Tuna. Challenging New Frontiers in the Global Seafood Sector: Proceedings of the Eighteenth Biennial Conference of the International Institute of Fisheries Economics and Trade, July 11-15, 2016. Compiled by Stefani J. Evers and Ann L. Shriver. International Institute of Fisheries Economics and Trade (IIFET), Corvallis.
Mackinson S, Nøttestad L, Guénette S, Pitcher T, Misund O, Fernö A (1999) Cross-scale observations on distribution and behavioural dynamics of ocean feeding Norwegian spring-spawning herring (Clupea harengus L.). ICES Journal of Marine Science 56:613-626
Magnuson JJ, Meisner JD, Hill DK (1990) Potential changes in the thermal habitat of Great Lakes fish after global climate warming. Transactions of the American Fisheries Society 119:254-264
Maia AM, Wilga CA, Lauder GV (2012) Biomechanics of locomotion in sharks, rays, and chimaeras. Biology of sharks and their relatives 1:125-151
Malishev M, Bull CM, Kearney MR (2018) An individual‐based model of ectotherm movement integrating metabolic and microclimatic constraints. Methods in Ecology and Evolution 9:472-489
Mansbridge N, Mitsch J, Bollard N, Ellis K, Miguel-Pacheco GG, Dottorini T, Kaler J (2018) Feature selection and comparison of machine learning algorithms in classification of grazing and rumination behaviour in sheep. Sensors, 18:3532.
Marable MK, Belant JL, Godwin D, Wang G (2012) Effects of resource dispersion and site familiarity on movements of translocated wild turkeys on fragmented landscapes. Behavioural processes 91:119-124
Maravelias CD (1999) Habitat selection and clustering of a pelagic fish: effects of topography and bathymetry on species dynamics. Canadian Journal of Fisheries and Aquatic Sciences 56:437-450
Marsac F, Fonteneau A, Menard F (2000) Drifting FADs used in tuna fisheries: an ecological trap? In: Le Gall J.-Y., Cayré P. and Taquet M. (eds.), Pêche thonière et dispositifs de concentration de poissons, Ed. Ifremer, Actes Colloq. 28:537–552.
Marshall GJ (1998) Crittercam: an animal-borne imaging and data logging system. Marine Technology Society Marine Technology Society Journal 32:11
Marshall GJ, Bakhtiari M, Shepard M, Tweedy III J, Rasch D, Abernathy K, Joliff B, Carrier JC, Heithaus MR (2007) An advanced solid-state animal-borne video and environmental data-logging device (“Crittercam”) for marine research. Marine Technology Society Journal 41:31-38
Matley J, Jossart J, Johansen L, Jobsis P (2020) Environmental drivers of diving behavior and space-use of juvenile endangered Caribbean hawksbill sea turtles identified using acoustic telemetry. Marine Ecology Progress Series 652:157-171
Maxwell SM, Hazen EL, Lewison RL, Dunn DC, Bailey H, Bograd SJ, Briscoe DK, Fossette S, Hobday AJ, Bennett M, Benson S (2015). Dynamic ocean management: Defining and conceptualizing real-time management of the ocean. Marine Policy 58:42-50.
McIntyre NE, Wiens JA (1999) Interactions between landscape structure and animal behavior: the roles of heterogeneously distributed resources and food deprivation on movement patterns. Landscape Ecology 14:437-447
McKenzie J, Smith M, Watson T, Francis M, Maolagáin C, Poortenaar C, Holdsworth J (2014) Age, growth, maturity and natural mortality of New Zealand kingfish (Seriola lalandi lalandi). New Zealand Fisheries Assessment Report:03
McKeon MG, Drew JA (2019) Community dynamics in Fijian coral reef fish communities vary with conservation and shark-based tourism. Pacific Conservation Biology 25:363-369
McNab BK (1963) Bioenergetics and the determination of home range size. The American Naturalist 97:133-140
Medved RJ, Marshall JA (1983) Short-term movements of young sandbar sharks, Carcharhinus plumbeus (Pisces, Carcharhinidae). Bulletin of Marine Science 33:87-93

147
Melnychuk MC, Dunton KJ, Jordaan A, McKown KA, Frisk MG (2017) Informing conservation strategies for the endangered Atlantic sturgeon using acoustic telemetry and multi‐state mark–recapture models. Journal of Applied Ecology 54:914-925
Merciai R, Casadevall M, Villegas‐Hernández H, Lloret J (2020) Twilight activity patterns and angling vulnerability of yellowmouth barracuda (Sphyraena viridensis Cuvier, 1829), a range‐expanding thermophilic fish. Journal of fish biology 97:383-395
Meyer L, Whitmarsh SK, Nichols PD, Revill AT, Huveneers C (2020) The effects of wildlife tourism provisioning on non-target species. Biological Conservation 241:108317
Meyer L, Apps K, Bryars S, Clarke T, Hayden B, Pelton G, Simes B, Vaughan LM, Whitmarsh SK, Huveneers C (2021a) A multidisciplinary framework to assess the sustainability and acceptability of wildlife tourism operations. Conservation Letters e12788 doi: https://doi.org/10.1111/conl.12788
Meyer L, Barry C, Araujo G, Barnett A, Brunnschweiler JM, Chin A, Gallagher A, Healy T, Kock A, Newsome D, Ponzo A, Huveneers C (2021b) Redefining provisioning in marine wildlife tourism. Journal of Ecotourism, doi:10.1080/14724049.2021.1931253
Milardi M, Lanzoni M, Gavioli A, Fano EA, Castaldelli G (2018) Tides and moon drive fish movements in a brackish lagoon. Estuarine, Coastal and Shelf Science 215:207-214
Milazzo M, Badalamenti F, Fernández TV, Chemello R (2005) Effects of fish feeding by snorkellers on the density and size distribution of fishes in a Mediterranean marine protected area. Marine Biology 146:1213-1222
Milazzo M, Anastasi I, Willis TJ (2006) Recreational fish feeding affects coastal fish behavior and increases frequency of predation on damselfish Chromis chromis nests. Marine Ecology Progress Series 310:165-172
Miller PA, Fitch AJ, Gardner M, Hutson KS, Mair G (2011) Genetic population structure of Yellowtail Kingfish (Seriola lalandi) in temperate Australasian waters inferred from microsatellite markers and mitochondrial DNA. Aquaculture 319:328-336
Moorhouse TP, Dahlsjö CA, Baker SE, D'Cruze NC, Macdonald DW (2015) The customer isn't always right—conservation and animal welfare implications of the increasing demand for wildlife tourism. PloS one 10:e0138939
Moran D, Smith CK, Gara B, Poortenaar CW (2007) Reproductive behaviour and early development in yellowtail kingfish (Seriola lalandi Valenciennes 1833). Aquaculture 262:95-104
Moran D, Wells RM, Pether SJ (2008) Low stress response exhibited by juvenile yellowtail kingfish (Seriola lalandi Valenciennes) exposed to hypercapnic conditions associated with transportation. Aquaculture Research 39:1399-1407
Moreau M, Siebert S, Buerkert A, Schlecht E (2009) Use of a tri-axial accelerometer for automated recording and classification of goats’ grazing behaviour. Applied Animal Behaviour Science 119:158-170
Morrissey JF, Gruber SH (1993) Home range of juvenile lemon sharks, Negaprion brevirostris. Copeia 1993:425-434
Morrongiello JR, Walsh CT, Gray CA, Stocks JR, Crook DA (2014) Environmental change drives long‐term recruitment and growth variation in an estuarine fish. Global Change Biology 20:1844-1860
Müller R, Schrader L (2003) A new method to measure behavioural activity levels in dairy cows. Applied Animal Behaviour Science 83:247-258
Müller R, Laepple T, Bartsch I, Wiencke C (2009) Impact of oceanic warming on the distribution of seaweeds in polar and cold-temperate waters. Botanica Marina 52:617–38
Muloin S (1998) Wildlife tourism: The psychological benefits of whale watching. Pacific Tourism Review 2:199-213
Murchie KJ, Cooke SJ, Danylchuk AJ, Suski CD (2011) Estimates of field activity and metabolic rates of bonefish (Albula vulpes) in coastal marine habitats using acoustic tri-axial accelerometer transmitters and intermittent-flow respirometry. Journal of Experimental Marine Biology and Ecology 396:147-155
Murphy J, Ochwada-Doyle F, West L, Stark K, JM H (2020) The Recreational Fisheries Monitoring Program. Survey of recreational fishing in 2017–18. In: Industries NDoP (ed) Murphy, JJ, Ochwada-Doyle, FA, West, LD, Stark, KE and Hughes JM, 2020, The Recreational Fisheries

148
Monitoring Program Survey of recreational fishing in 2017–18, Fisheries final report series 158, Wollongong
Musyl MK, Brill RW, Boggs CH, Curran DS, Kazama TK, Seki MP (2003) Vertical movements of bigeye tuna (Thunnus obesus) associated with islands, buoys, and seamounts near the main Hawaiian Islands from archival tagging data. Fisheries Oceanography 12:152-169
Myers EMV, Harvey ES, Saunders BJ, Travers MJ (2016) Fine-scale patterns in the day, night and crepuscular composition of a temperate reef fish assemblage. Marine Ecology 37:668-678
Myrberg Jr AA, Gruber SH (1974) The behavior of the bonnethead shark, Sphyrna tiburo. Copeia 1974:358-374
Nabe‐Nielsen J, van Beest FM, Grimm V, Sibly RM, Teilmann J, Thompson PM (2018) Predicting the impacts of anthropogenic disturbances on marine populations. Conservation Letters 11:e12563
Nash RD, Valencia AH, Geffen AJ (2006) The origin of Fulton’s condition factor—setting the record straight. Fisheries 31:236-238
Nathan R (2008) An emerging movement ecology paradigm. Proceedings of the National Academy of Sciences 105:19050-19051
Nathan R, Spiegel O, Fortmann-Roe S, Harel R, Wikelski M, Getz WM (2012) Using tri-axial acceleration data to identify behavioral modes of free-ranging animals: general concepts and tools illustrated for griffon vultures. The Journal of Experimental Biology 215:986-996
National Parks and Wildlife Service SA (2020) South Australia Marine Parks. Accessed 12/08/2021. Navarro J, Sáez-Liante R, Albo-Puigserver M, Coll M, Palomera I (2017) Feeding strategies and
ecological roles of three predatory pelagic fish in the western Mediterranean Sea. Deep Sea Research Part II: Topical Studies in Oceanography 140:9-17
Naylor E (1999) Marine animal behaviour in relation to lunar phase. Earth Moon Planets 85–86:291– 302.
Needham MD, Szuster BW, Mora C, Lesar L, Anders E (2017) Manta ray tourism: interpersonal and social values conflicts, sanctions, and management. Journal of Sustainable Tourism 25:1367-1384
Newsome, D. & Rodger, K. (2008). To feed or not to feed: a contentious issue in wildlife tourism. Australian Zoologist 34, 255– 270.
Niella Y, Flávio H, Smoothey AF, Aarestrup K, Taylor MD, Peddemors VM, Harcourt R (2020) Refined Shortest Paths (RSP): Incorporation of topography in space use estimation from node‐based telemetry data. Methods in Ecology and Evolution 11:1733-1742
Nishiumi, N, Matsuo, A, Kawabe, R, Payne, N, Huveneers, C, Watanabe, YY, Kawabata, Y (2018). A miniaturized threshold-triggered acceleration data-logger for recording burst movements of aquatic animals. Journal of Experimental Biology 221:jeb172346
Noda, T Kawabata, Y, Arai, N, Mitamura, H, Watanabe, S (2013) Monitoring escape and feeding behaviours of cruiser fish by inertial and magnetic sensors. PLoS ONE, 8:e79392
Noda T, Kawabata Y, Arai N, Mitamura H, Watanabe S (2014) Animal-mounted gyroscope/accelerometer/magnetometer: In situ measurement of the movement performance of fast-start behaviour in fish. Journal of experimental marine biology and ecology 451:55-68
Noda T, Fujioka K, Fukuda H, Mitamura H, Ichikawa K, Arai N (2016). The influence of body size on the intermittent locomotion of a pelagic schooling fish. Proceedings of the Royal Society B: Biological Sciences, 283:20153019.
Nøttestad L, Giske J, Holst JC, Huse G (1999) A length-based hypothesis for feeding migrations in pelagic fish. Canadian Journal of Fisheries and Aquatic Sciences 56:26-34
O’Kane TJ, Oke PR, Sandery PA (2011) Predicting the east australian current. Ocean Modelling 38:251-266
Oliver E, Holbrook N (2014) Extending our understanding of South Pacific gyre “spin‐up”: Modeling the East Australian Current in a future climate. Journal of Geophysical Research: Oceans 119:2788-2805
Orams MB (2002) Feeding wildlife as a tourism attraction: a review of issues and impacts. Tourism management 23:281-293

149
Orbesen ES, Hoolihan JP, Serafy JE, Snodgrass D, Peel E, Prince E (2008) Transboundary movement of Atlantic istiophorid billfishes among international and US domestic management areas inferred from mark-recapture studies. Marine Fisheries Review 70:14-23
Osada K (2010) Relationship of zooplankton emergence, manta ray abundance and SCUBA diver usage Kona Hawaii. University of Hawai'i at Hilo, PhD thesis dissertation
Pagano AM, Rode KD, Cutting A, Owen MA, Jensen S, Ware JV, Robbins CT, Durner GM, Atwood TC, Obbard ME, Middel KR, Thiemann GW, Williams TM (2017) Using tri-axial accelerometers to identify wild polar bear behaviors. Endangered Species Research 32:19-33
Paine MA, McDowell JR, Graves JE (2008) Specific identification using COI sequence analysis of scombrid larvae collected off the Kona coast of Hawaii Island. Ichthyological Research 55:7-16
Pankhurst NW (1989) The relationship of ocular morphology to feeding modes and activity periods in shallow marine teleosts from New Zealand. Environmental Biology of Fishes 26:201-211
Patroni J, Simpson G, Newsome D (2018) Feeding wild fish for tourism—A systematic quantitative literature review of impacts and management. International Journal of Tourism Research 20:286-298
Patterson HM, Swearer SE (2008) Origin of yellowtail kingfish, Seriola lalandi, from Lord Howe Island, Australia, inferred from otolith chemistry. New Zealand Journal of Marine and Freshwater Research 42:409-416
De Paula, YC, Schiavetti, A, Sampaio CLS, Calderom E (2018) The effects of fish feeding by visitors on reef fish in a Marine Protected Area open to tourism. Biota Neotropica 18: ISSN 1676-0611
Pauly D, Watson R (2003) Counting the last fish. Scientific American 289:42-47 Payne NL, Gillanders BM, Seymour RS, Webber DM, Snelling EP, Semmens JM (2011)
Accelerometry estimates field metabolic rate in giant Australian cuttlefish Sepia apama during breeding. Journal of Animal Ecology 80:422-430
Payne NL, van der Meulen DE, Gannon R, Semmens JM, Suthers IM, Gray CA, Taylor MD (2013) Rain reverses diel activity rhythms in an estuarine teleost. Proceedings of the Royal Society B: Biological Sciences 280:20122363
Payne NL, Smith JA, van der Meulen DE, Taylor MD, Watanabe YY, Takahashi A, Marzullo TA, Gray CA, Cadiou G, Suthers IM (2016) Temperature dependence of fish performance in the wild: links with species biogeography and physiological thermal tolerance. Functional Ecology 30:903-912
Payne NL, Smith JA (2017) An alternative explanation for global trends in thermal tolerance. Ecology letters 20:70-77
Pecl GT, Tracey SR, Semmens JM, Jackson GD (2006) Use of acoustic telemetry for spatial management of southern calamary Sepioteuthis australis, a highly mobile inshore squid species. Marine Ecology Progress Series 328:1-15
Pecl GT, Stuart-Smith J, Walsh P, Bray DJ, Kusetic M, Burgess M, Frusher SD, Gledhill DC, George O, Jackson G (2019) Redmap Australia: challenges and successes with a large-scale citizen science-based approach to ecological monitoring and community engagement on climate change. Frontiers in Marine Science 6:349
Pedersen MW, Patterson TA, Thygesen UH, Madsen H (2011) Estimating animal behavior and residency from movement data. Oikos 120:1281-1290
Pepperell JG (1985) Cooperative game fish tagging in the IndoPacific region. In: Stroud RH (ed) World angling resources and challenges. Proceedings of the 1st World Angling Conference, Cap d'Agde, France, 12-18 September 1984. International Game Fish Association, Fort Lauderdale, Florida, pp. 241-252
Perona AM, Urios V, López-López P (2019) Holidays? Not for all. Eagles have larger home ranges on holidays as a consequence of human disturbance. Biological conservation 231:59-66
Peter MS (2011) The role of thyroid hormones in stress response of fish. General and Comparative Endocrinology 172:198-210
Pethybridge HR, Parrish CC, Morrongiello J, Young JW, Farley JH, Gunasekera RM, Nichols PD (2015) Spatial patterns and temperature predictions of tuna fatty acids: tracing essential nutrients and changes in primary producers. PloS one 10:e0131598

150
Petrik CM, Stock CA, Andersen KH, van Denderen PD, Watson JR (2020) Large pelagic fish are most sensitive to climate change despite pelagification of ocean food webs. Frontiers in Marine Science 7:1023
Philips LP, Szuster BW, Needham MD (2019) Tourist value orientations and conflicts at a marine protected area in Hawaii. International Journal of Tourism Research 21:868-881
Pimiento C, Leprieur F, Silvestro D, Lefcheck J, Albouy C, Rasher D, Davis M, Svenning J-C, Griffin J (2020) Functional diversity of marine megafauna in the Anthropocene. Science Advances 6:eaay7650
Pini-Fitzsimmons J, Knott NA, Brown C (2018) Effects of food provisioning on site use in the short-tail stingray Bathytoshia brevicaudata. Marine Ecology Progress Series 600:99-110
Pini-Fitzsimmons, J, Knott NA, Brown C (2021). Heterarchy Reveals Social Organization of a Smooth Stingray (Bathytoshia brevicaudata) Population in a Provisioned Food Context. Frontiers in Marine Science 8:466.
Pons M, Branch TA, Melnychuk MC, Jensen OP, Brodziak J, Fromentin JM, Harley SJ, Haynie AC, Kell LT, Maunder MN (2017) Effects of biological, economic and management factors on tuna and billfish stock status. Fish and Fisheries 18:1-21
Pons M, Melnychuk MC, Hilborn R (2018) Management effectiveness of large pelagic fisheries in the high seas. Fish and Fisheries 19:260-270
Poortenaar CW, Hooker SH, Sharp N (2001) Assessment of yellowtail kingfish (Seriola lalandi lalandi) reproductive physiology, as a basis for aquaculture development. Aquaculture 201:271-286
Pörtner H-O, Berdal B, Blust R, Brix O, Colosimo A, De Wachter B, Giuliani A, Johansen T, Fischer T, Knust R (2001) Climate induced temperature effects on growth performance, fecundity and recruitment in marine fish: developing a hypothesis for cause and effect relationships in Atlantic cod (Gadus morhua) and common eelpout (Zoarces viviparus). Continental Shelf Research 21:1975-1997
Pörtner H-O, Bock C, Knust R, Lannig G, Lucassen M, Mark FC, Sartoris FJ (2008) Cod and climate in a latitudinal cline: physiological analyses of climate effects in marine fishes. Climate research 37:253-270
Pörtner HO, Peck M (2010) Climate change effects on fishes and fisheries: towards a cause‐and‐effect understanding. Journal of fish biology 77:1745-1779
Primary Industry and Regions South Australia (2014) South Australian Aquaculture: a summary of its diversity, production and innovation. Government of South Australia, Industry booklet
Qasem L, Cardew A, Wilson A, Griffiths I, Halsey LG, Shepard EL, Wilson R (2012). Tri-axial dynamic acceleration as a proxy for animal energy expenditure; should we be summing values or calculating the vector? PloS one, 7:e31187.
R Development Core Team. R: A language and environment for statistical computing (version 4.0.2). Vienna: R Foundation for Statistical Computing; 2016
Randall D, Mense D, Boutilier R (1987) The effects of burst swimming on aerobic swimming in chinook salmon (Oncorhynchus tshawytscha). Marine & Freshwater Behaviour & Physiology 13:77-88
Rast W, Kimmig SE, Giese L, Berger A (2020) Machine learning goes wild: Using data from captive individuals to infer wildlife behaviours. PloS one 15:e0227317
Read AD, West RJ, Haste M, Jordan A (2011) Optimizing voluntary compliance in marine protected areas: A comparison of recreational fisher and enforcement officer perspectives using multi-criteria analysis. Journal of Environmental Management 92:2558-2567
Reubens J, Verhelst P, van der Knaap I, Wydooghe B, Milotic T, Deneudt K, Hernandez F, Pauwels I (2019) The need for aquatic tracking networks: the Permanent Belgian Acoustic Receiver Network. Animal Biotelemetry 7:1-6
Richardson AJ, Downes KJ, Nolan ET, Brickle P, Brown J, Weber N, Weber SB (2018) Residency and reproductive status of yellowfin tuna in a proposed large‐scale pelagic marine protected area. Aquatic Conservation: Marine and Freshwater Ecosystems 28:1308-1316
Richardson DE, Marancik KE, Guyon JR, Lutcavage ME, Galuardi B, Lam CH, Walsh HJ, Wildes S, Yates DA, Hare JA (2016) Discovery of a spawning ground reveals diverse migration

151
strategies in Atlantic bluefin tuna (Thunnus thynnus). Proceedings of the National Academy of Sciences 113:3299-3304
Richter H, Luckstadt C, Focken U, Becker K (2000) An improved procedure to assess fish condition on the basis of length-weight relationships. Archive of Fishery and Marine Research 48:255-264
Ridgway KR (2007) Long‐term trend and decadal variability of the southward penetration of the East Australian Current. Geophysical Research Letters 34:1-5
Rilov G, Fraschetti S, Gissi E, Pipitone C, Badalamenti F, Tamburello L, Menini E, Goriup P, Mazaris AD, Garrabou J (2020) A fast‐moving target: achieving marine conservation goals under shifting climate and policies. Ecological Applications 30:e02009
Rioul O, Vetterli M, Wavelets and signal procesing. IEEE Signal Processing Magazine, Oct. 1991. Rizzari J, Semmens J, Fox A, Huveneers C (2017) Observations of marine wildlife tourism effects on
a non‐focal species. Journal of fish biology 91:981-988 Rizzari JR, Frisch AJ, Connolly SR (2014) How robust are estimates of coral reef shark depletion?
Biological Conservation 176:39-47 Robert B, White B, Renter D, Larson R (2009). Evaluation of three-dimensional accelerometers to
monitor and classify behavior patterns in cattle. Computers and Electronics in Agriculture 67:80-84
Roberts LW, Butcher PA, Broadhurst MK, Cullis BR (2011) Using a multi-experimental approach to assess the fate of angled-and-released yellowtail kingfish (Seriola lalandi). ICES Journal of Marine Science 68:67-75
Robertson EP, Fletcher RJ, Cattau CE, Udell BJ, Reichert BE, Austin JD, Valle D (2018) Isolating the roles of movement and reproduction on effective connectivity alters conservation priorities for an endangered bird. Proceedings of the National Academy of Sciences 115:8591-8596
Robinson CJ, Anislado V, Ramos P (2004) Shoaling fish and red crab behaviour related to tidal variations in Bahía Magdalena, México. Deep Sea Research Part II: Topical Studies in Oceanography 51:767-783
Robinson L, Hobday A, Possingham H, Richardson AJ (2015) Trailing edges projected to move faster than leading edges for large pelagic fish habitats under climate change. Deep Sea Research Part II: Topical Studies in Oceanography 113:225-234
Roesti M, Anstett DN, Freeman BG, Lee-Yaw JA, Schluter D, Chavarie L, Rolland J, Holzman R (2020) Pelagic fish predation is stronger at temperate latitudes than near the equator. Nature communications 11:1-7
Rowe S, Hutchings JA (2003) Mating systems and the conservation of commercially exploited marine fish. Trends in Ecology & Evolution 18:567-572
Rowell TJ, Nemeth RS, Schärer MT, Appeldoorn RS (2015) Fish sound production and acoustic telemetry reveal behaviors and spatial patterns associated with spawning aggregations of two Caribbean groupers. Marine Ecology Progress Series 518:239-254
Roy C, Cury P, Kifani S (1992) Pelagic fish recruitment success and reproductive strategy in upwelling areas: environmental compromises. South African Journal of Marine Science 12:135-146
Rutz C, Hays GC (2009) New frontiers in biologging science. Biology Letters 5:289-292 Sakaji H, Hamada K, Naito Y (2018) Identifying spawning events of greater amberjack using
accelerometers. Marine Biology Research 14:637-641 Sakamoto KQ, Sato K, Ishizuka M, Watanuki Y, Takahashi A, Daunt F, Wanless S (2009) Can
ethograms be automatically generated using body acceleration data from free-ranging birds? PloS one 4:e5379
Samuels A, Bejder L, Heinrich S (2000) A review of the literature pertaining to swimming with wild dolphins. Marine Mammal Commission Bethesda, MD, USA
Saul PJ, Holdsworth J (1992) Cooperative gamefish tagging in New Zealand waters, 1975-90. MAF Fisheries
Sawyer H, Kauffman MJ, Nielson RM, Horne JS (2009) Identifying and prioritizing ungulate migration routes for landscape‐level conservation. Ecological Applications 19:2016-2025
Schaefer HC, Fable Jr WA (1994) King mackerel, Scomberomorus cavalla, mark-recapture studies off Florida's east coast. Marine Fisheries Review 56:13-23
152
Scheyvens R (1999) Ecotourism and the empowerment of local communities. Tourism management 20:245-249
Schimel DS, Asner GP, Moorcroft P (2013) Observing changing ecological diversity in the Anthropocene. Frontiers in Ecology and the Environment 11:129-137
Schlaepfer MA, Runge MC, Sherman PW (2002) Ecological and evolutionary traps. Trends in ecology & evolution 17:474-480
Schlaff AM, Heupel MR, Simpfendorfer CA (2014) Influence of environmental factors on shark and ray movement, behaviour and habitat use: a review. Reviews in Fish Biology and Fisheries 24:1089-1103
Schlenker LS, Faillettaz R, Stieglitz JD, Lam CH, Hoenig RH, Cox GK, Heuer RM, Pasparakis C, Benetti DD, Paris CB (2021) Remote Predictions of Mahi-Mahi (Coryphaena hippurus) Spawning in the Open Ocean Using Summarized Accelerometry Data. Frontiers in Marine Science 8:131
Schofield G, Bishop CM, Katselidis KA, Dimopoulos P, Pantis JD, Hays GC (2009) Microhabitat selection by sea turtles in a dynamic thermal marine environment. Journal of Animal Ecology 78:14-21
Semeniuk CA, Rothley KD (2008) Costs of group-living for a normally solitary forager: effects of provisioning tourism on southern stingrays Dasyatis americana. Marine Ecology Progress Series 357:271-282
Semeniuk CA, Bourgeon S, Smith SL, Rothley KD (2009) Hematological differences between stingrays at tourist and non-visited sites suggest physiological costs of wildlife tourism. Biological Conservation 142:1818-1829
Semeniuk, CA (2021) The role of conservation physiology in mitigating social-ecological traps in wildlife-provisioning tourism: a case study of feeding stingrays in the Cayman Islands. In Conservation Physiology, Oxford University Press, pp. 125-140
Sethi SA, Branch TA, Watson R (2010) Global fishery development patterns are driven by profit but not trophic level. Proceedings of the National Academy of Sciences 107:12163-12167
Sfakiotakis M, Lane DM, Davies JBC (1999) Review of fish swimming modes for aquatic locomotion. IEEE Journal of oceanic engineering 24:237-252
Sharma A, Dhenuvakonda K (2019) Virtual fisheries through mobile apps: The way forward. Aquaculture 20:16.12
Shepard EL, Wilson RP, Quintana F, Laich AG, Liebsch N, Albareda DA, Halsey LG, Gleiss A, Morgan DT, Myers AE (2008a) Identification of animal movement patterns using tri-axial accelerometry. Endangered species research 10:47-60
Shepard EL, Wilson RP, Halsey LG, Quintana F, Laich AG, Gleiss AC, Liebsch N, Myers AE, Norman B (2008b) Derivation of body motion via appropriate smoothing of acceleration data. Aquatic Biology 4:235-241
Shipley ON, Brownscombe JW, Danylchuk AJ, Cooke SJ, O’Shea OR, Brooks EJ (2018) Fine-scale movement and activity patterns of Caribbean reef sharks (Carcharhinus perezi) in the Bahamas. Environmental biology of fishes 101:1097-1104
Shivik JA, Jaeger MM, Barrett RH (1996) Coyote movements in relation to the spatial distribution of sheep. The Journal of Wildlife Management 60:422-430
Silvano RA (2001) Feeding habits and interspecific feeding associations of Caranx latus (Carangidae) in a subtropical reef. Environmental Biology of Fishes 60:465-470
Simpfendorfer CA, Heupel MR, Hueter RE (2002) Estimation of short-term centers of activity from an array of omnidirectional hydrophones and its use in studying animal movements. Canadian Journal of Fisheries and Aquatic Sciences 59:23-32
Skov C, Chapman BB, Baktoft H, Brodersen J, Brönmark C, Hansson L-A, Hulthén K, Nilsson PA (2013) Migration confers survival benefits against avian predators for partially migratory freshwater fish. Biology letters 9:20121178
Sleeman JC, Meekan MG, Wilson SG, Polovina JJ, Stevens JD, Boggs GS, Bradshaw CJ (2010) To go or not to go with the flow: Environmental influences on whale shark movement patterns. Journal of Experimental Marine Biology and Ecology 390:84-98

153
Sorte CJ, Ibáñez I, Blumenthal DM, Molinari NA, Miller LP, Grosholz ED, Diez JM, D'Antonio CM, Olden JD, Jones SJ (2013) Poised to prosper? A cross‐system comparison of climate change effects on native and non‐native species performance. Ecology letters 16:261-270
Steffen W, Broadgate W, Deutsch L, Gaffney O, Ludwig C (2015) The trajectory of the Anthropocene: the great acceleration. The Anthropocene Review 2:81-98
Stevenson RD, Woods WA, Jr (2006) Condition indices for conservation: new uses for evolving tools. Integrative and Comparative Biology 46:1169-1190
Stewart J, Ferrell DJ, van der Walt B (2004) Sizes and ages in commercial landings with estimates of growth, mortality and yield per recruit of yellowtail kingfish (Seriola lalandi) from New South Wales, Australia. Marine and Freshwater Research 55:489-497
Stolarski J, Margraf F, Carlson J, Sutton T (2014) Lipid and moisture content modeling of amphidromous dolly varden using bioelectrical impedance analysis. North American Journal of Fisheries Management 34:471-481
Sur M, Suffredini T, Wessells SM, Bloom PH, Lanzone M, Blackshire S, Sridhar S, Katzner T (2017) Improved supervised classification of accelerometry data to distinguish behaviors of soaring birds. PloS one 4:e0174785
Suzuki I, Naito Y, Folkow LP, Miyazaki N, Blix AS (2009) Validation of a device for accurate timing of feeding events in marine animals. Polar Biology, 32:667-671.
Symonds J, Walker S, Pether S, Gublin Y, McQueen D, King A, Irvine G, Setiawan A, Forsythe J, Bruce M (2014) Developing yellowtail kingfish (Seriola lalandi) and hāpuku (Polyprion oxygeneios) for New Zealand aquaculture. New Zealand Journal of Marine and Freshwater Research 48:371-384
Tanner JE, Fernandes M (2010) Environmental effects of yellowtail kingfish aquaculture in South Australia. Aquaculture Environment Interactions 1:155-165
Tanner SE, Vieira AR, Vasconcelos RP, Dores S, Azevedo M, Cabral HN, Morrongiello JR (2019) Regional climate, primary productivity and fish biomass drive growth variation and population resilience in a small pelagic fish. Ecological Indicators 103:530-541
Tanoue H, Komatsu T, Tsujino T, Suzuki I, Watanabe M, Goto H, Miyazaki N (2012) Feeding events of Japanese lates Lates japonicus detected by a high-speed video camera and three-axis micro-acceleration data-logger. Fisheries Science 78:533-538
Tatler J, Cassey P, Prowse TA (2018) High accuracy at low frequency: detailed behavioural classification from accelerometer data. Journal of Experimental Biology, 221: https://doi.org/10.1242/jeb.184085.
Taylor MD, McPhan L, van der Meulen DE, Gray CA, Payne NL (2013) Interactive drivers of activity in a free-ranging estuarine predator. PLoS One 8:e80962
Taylor MD, Babcock RC, Simpfendorfer CA, Crook DA (2017) Where technology meets ecology: acoustic telemetry in contemporary Australian aquatic research and management. Marine and Freshwater Research 68:1397-1402
Taylor MD, van der Meulen DE, Brodie S, Cadiou G, Knott NA (2018) Applying acoustic telemetry to understand contaminant exposure and bioaccumulation patterns in mobile fishes. Science of The Total Environment 625:344-354
Thomas R, Schülein F (1988) The shoaling behaviour of pelagic fish and the distribution of seals and gannets off Namibia as deduced from routine fishing reports, 1982–1985. South African Journal of Marine Science 7:179-191
Thomson JA, Araujo G, Labaja J, McCoy E, Murray R, Ponzo A (2017) Feeding the world's largest fish: highly variable whale shark residency patterns at a provisioning site in the Philippines. Royal Society open science 4:170394
Tierney J, Huntingford F, Crompton D (1996) Body condition and reproductive status in sticklebacks exposed to a single wave of Schistocephalus solidus infection. Journal of fish Biology 49:483-493
Tomlinson S, Arnall SG, Munn A, Bradshaw SD, Maloney SK, Dixon KW, Didham RK (2014) Applications and implications of ecological energetics. Trends in ecology & evolution 29:280-290

154
Trave C, Brunnschweiler J, Sheaves M, Diedrich A, Barnett A (2017) Are we killing them with kindness? Evaluation of sustainable marine wildlife tourism. Biological conservation 209:211-222
Trippel EA (2003) Estimation of male reproductive success of marine fishes. Journal of Northwest Atlantic Fishery Science 33:81-113
Tsuda Y, Kawabe R, Tanaka H, Mitsunaga Y, Hiraishi T, Yamamoto K, Nashimoto K (2006) Monitoring the spawning behaviour of chum salmon with an acceleration data logger. Ecology of Freshwater Fish 15:264-274
Tucker MA, Böhning-Gaese K, Fagan WF, Fryxell JM, Van Moorter B, Alberts SC, Ali AH, Allen AM, Attias N, Avgar T (2018) Moving in the Anthropocene: Global reductions in terrestrial mammalian movements. Science 359:466-469
Turner AM, Ruhl N (2007) Phosphorus loadings associated with a park tourist attraction: limnological consequences of feeding the fish. Environmental management 39:526-533
Udyawer V, Chin A, Knip DM, Simpfendorfer CA, Heupel MR (2013) Variable response of coastal sharks to severe tropical storms: environmental cues and changes in space use. Marine Ecology Progress Series 480:171-183
Udyawer V, Read M, Hamann M, Simpfendorfer CA, Heupel MR (2015) Effects of environmental variables on the movement and space use of coastal sea snakes over multiple temporal scales. Journal of Experimental Marine Biology and Ecology 473:26-34
Udyawer V, Dwyer RG, Hoenner X, Babcock RC, Brodie S, Campbell HA, Harcourt RG, Huveneers C, Jaine FR, Simpfendorfer CA (2018) A standardised framework for analysing animal detections from automated tracking arrays. Animal Biotelemetry 6:1-14
Valletta JJ, Torney C, Kings M, Thornton A, Madden J (2017) Applications of machine learning in animal behaviour studies. Animal Behaviour 124:203-220
van Denderen PD, Lindegren M, MacKenzie BR, Watson RA, Andersen KH (2018) Global patterns in marine predatory fish. Nature ecology & evolution 2:65-70
van der Knaap I, Slabbekoorn H, Winter HV, Moens T, Reubens J (2021) Evaluating receiver contributions to acoustic positional telemetry: a case study on Atlantic cod around wind turbines in the North Sea. Animal Biotelemetry 9:1-12
Videler JJ, Weihs D (1982) Energetic advantages of burst-and-coast swimming of fish at high speeds. Journal of Experimental Biology 97:169-178
Vignon M, Sasal P, Johnson RL, Galzin R (2010) Impact of shark-feeding tourism on surrounding fish populations off Moorea Island (French Polynesia). Marine and Freshwater Research 61:163-169
Walli A, Teo SL, Boustany A, Farwell CJ, Williams T, Dewar H, Prince E, Block BA (2009) Seasonal movements, aggregations and diving behavior of Atlantic bluefin tuna (Thunnus thynnus) revealed with archival tags. PloS one 4:e6151
Wang Y, Nickel B, Rutishauser M, Bryce CM, Williams TM, Elkaim G, Wilmers CC (2015) Movement, resting, and attack behaviors of wild pumas are revealed by tri-axial accelerometer measurements. Movement ecology 3:1-12
Ware, DM (1984) Fitness of different reproductive strategies in teleost fishes. In: Fish Reproduction: Strategies and Tactics (eds G.W. Potts and R.J. Wootton). Academic Press, London, 349-366
Watanabe S, Izawa M, Kato A, Ropert-Coudert Y, Naito Y (2005) A new technique for monitoring the detailed behaviour of terrestrial animals: a case study with the domestic cat. Applied Animal Behaviour Science 94:117-131
Watanabe N, Sakanoue S, Kawamura K, Kozakai T (2008a) Development of an automatic classification system for eating, ruminating and resting behavior of cattle using an accelerometer. Grassland Science 54:231-237
Watanabe Yy, Wei Q, Yang D, Chen X, Du H, Yang J, Sato K, Naito Y, Miyazaki N (2008b) Swimming behavior in relation to buoyancy in an open swimbladder fish, the Chinese sturgeon. Journal of Zoology 275:381-390
Watanabe YY, Takahashi A (2013) Linking animal-borne video to accelerometers reveals prey capture variability. Proceedings of the National Academy of Sciences 110:2199-2204

155
Watanabe YY, Payne NL, Semmens JM, Fox A, Huveneers C (2019) Swimming strategies and energetics of endothermic white sharks during foraging. The Journal of Experimental Biology 222:jeb185603
Watanabe YY, Goldbogen JA (2021) Too big to study? The biologging approach to understanding the behavioural energetics of ocean giants. Journal of Experimental Biology 224: jeb202747.
Watson R, Zeller D, Pauly D (2014) Primary productivity demands of global fishing fleets. Fish and Fisheries 15:231-241
Wearing S, Neil J (2009) Ecotourism: Impacts, potentials and possibilities. Oxford: Butterworth Heinemann
Webb PW (1976) The effect of size on the fast-start performance of rainbow trout Salmo gairdneri, and a consideration of piscivorous predator-prey interactions. Journal of Experimental Biology 65:157-177
Webb PW (1978) Fast-start performance and body form in seven species of teleost fish. Journal of Experimental Biology 74:211-226
Welch DW, Boehlert GW, Ward BR (2002) POST–the Pacific Ocean salmon tracking project. Oceanologica Acta 25:243-253
White TD, Carlisle AB, Kroodsma DA, Block BA, Casagrandi R, De Leo GA, Gatto M, Micheli F, McCauley DJ (2017) Assessing the effectiveness of a large marine protected area for reef shark conservation. Biological Conservation 207:64-71
Whitmarsh S (2019) Investigating the Anthropocene Influence on Temperate Fish Assemblages Through Baited Remote Underwater Video Stations (BRUVS). Flinders University, College of Science and Engineering
Whitmarsh SK, Huveneers C, Fairweather PG (2020) Investigating the cumulative effects of multiple stressors on fish assemblages in a semi-enclosed bay. Marine Biology 167:1-13
Whitney NM, Papastamatiou YP, Holland KN, Lowe CG (2007) Use of an acceleration data logger to measure diel activity patterns in captive whitetip reef sharks, Triaenodon obesus. Aquatic Living Resources 20:299-305
Whitney NM, Pratt HL, Jr., Pratt TC, Carrier JC (2010) Identifying shark mating behaviour using three-dimensional acceleration loggers. Endangered Species Research 10:71-82
Whoriskey F, Hindell M (2016) Developments in tagging technology and their contributions to the protection of marine species at risk. Ocean Development & International Law 47:221-232
Willis J, Hobday AJ (2008) Application of bioelectrical impedance analysis as a method for estimating composition and metabolic condition of southern bluefin tuna (Thunnus maccoyii) during conventional tagging. Fisheries Research 93:64-71
Wilson RP, White CR, Quintana F, Halsey LG, Liebsch N, Martin GR, Butler PJ (2006) Moving towards acceleration for estimates of activity‐specific metabolic rate in free‐living animals: the case of the cormorant. Journal of Animal Ecology 75:1081-1090
Woodhead AJ, Hicks CC, Norström AV, Williams GJ, Graham NA (2019) Coral reef ecosystem services in the Anthropocene. Functional Ecology 33:1023-1034
Worm B, Tittensor DP (2011) Range contraction in large pelagic predators. Proceedings of the National Academy of Sciences 108:11942-11947
Wright RK, Cooper EL (1981) Temperature effects on ectotherm immune responses. Developmental & Comparative Immunology 5:117-122
Wright S, Metcalfe JD, Hetherington S, Wilson R (2014) Estimating activity-specific energy expenditure in a teleost fish, using accelerometer loggers. Marine Ecology Progress Series 496:19-32
Yasuda T, Katsumata H, Kawabe R, Nakatsuka N, Kurita Y (2013) Identifying spawning events in the Japanese flounder Paralichthys olivaceus from depth time-series data. Journal of Sea Research 75:33-40
Yoda K, Naito Y, Sato K, Takahashi A, Nishikawa J, Ropert-Coudert Y, Kurita M, Le Maho Y (2001) A new technique for monitoring the behaviour of free-ranging Adelie penguins. Journal of Experimental Biology 204:685-690

156
APPENDIX
Table S1. Mean weekly residency index (RI) and activity space (BBKUD-50) of yellowtail kingfish
with varying number of operating days.
Operating
Days/Week
N (RI) Mean Residency (RI) N (BBKUD-
50)
Mean Activity Space
(BBKUD-50)
0 68 0.554 ± 0.03 43 0.309 ± 0.02
1 9 0.476 ± 0.09 3 0.308 ± 0.01
2 16 0.527 ± 0.06 12 0.298 ± 0.04
3 86 0.488 ± 0.03 52 0.335 ± 0.03
4 103 0.559 ± 0.03 69 0.306 ± 0.01
5 167 0.599 ± 0.02 126 0.316 ± 0.01
6 222 0.652 ± 0.02 190 0.339 ± 0.01
7 38 0.650 ± 0.05 32 0.340 ± 0.02

157
Table S2. Estimated operator type coefficients (β) and their standard errors (SE), t-values of factors
included in the top-ranked model (indicated for each variable) for models testing weekly a) residency,
b) activity space, and daily c) time spent and d) distance to nearest operator. Significant values are
shown in bold.
Level β SE DF t-value p-value
a) Weekly residency
Detection index ~ 1 (intercept only)
(Intercept) 0.538 0.024 659 22.51 0
b) Weekly activity space
BBKUD ~ 1 (intercept only)
(Intercept) 0.319 0.013 497 25.37 0
c) Daily time spent
Time ~ Operator Type * Temperature
(Intercept, No operator) 3.52 3.43 1.03
Temp 0.53 0.19 2.76
Acoustic 2.09 1.19 1.75
One Food-based 0.36 0.97 0.37
One Food-based+Acoustic 1.76 0.96 1.84
Two Food-based 2.14 1.07 2.01
All Operators 1.13 1.19 0.96
d) Daily distance to operators
Distance ~ Operator Type * Temperature
(Intercept, Acoustic) 9.36058 5.67636 1.64905
Temperature 0.58513 0.31962 1.83073
All Operators -5.1859 2.0385 -2.544
One Food-based -3.6767 2.07696 -1.7703
One Food-based+Acoustic -4.9138 2.06822 -2.3759
Two Food-based -6.2586 1.99824 -3.1321

158
Table S3. Estimated deterrent level coefficients (β) and their standard errors (SE), and t-values in the
top-ranked model for the effect of operator type on activity of kingfish at the Neptune Islands.
Level β SE t-value
Intercept; No operators -1.28169 0.038596 -33.208
Temperature 0.074709 0.00091 82.138
Acoustic 0.012189 0.006227 1.958
One Food-based 0.101046 0.002681 37.694
One Food-based+Acoustic 0.056696 0.003555 15.947
Two Food-based 0.124784 0.003459 36.074
All Operators 0.13487 0.003254 41.454
Table S4. Estimated deterrent level coefficients (β) and their standard errors (SE), and t-values in the
top-ranked model for the effect of interactions between provisioning, side of the island, and
Before/After Control/Impact on activity of kingfish at the Neptune Islands.
Level β SE t-value
Intercept -1.26213 0.047922 -26.337
Before 0.06256 0.006825 9.166
During 0.040497 0.006235 6.496
No food -0.00034 0.009329 -0.037
Same 0.091919 0.007128 12.895
temp 0.07195 0.00096 74.966
Before:No food -0.03708 0.010886 -3.406
During:No food -0.04402 0.009946 -4.426
Before:Same -0.09837 0.008652 -11.37
During:Same 0.037928 0.007869 4.82
No food:Same 0.0082 0.041067 0.2
Before:No food:Same -0.09052 0.043155 -2.098
During:No food:Same -0.14284 0.042815 -3.336

159
Table S5. Summary of receiver stations within acoustic arrays for kingfish detections collected
through the Integrated Marine Observing System Animal Tracking Database.
Project name Sampling year(s)
Installation Station Name Latitude Longitude Detections
Paul Butcher Kingfish
2009 Sydney (coastal)
Magic Point -33.956 151.265 18
Manly -33.826 151.298 4
Sydney Harbour
Dobroyd Head -33.814 151.275 304
Spit Bridge -33.803 151.246 50
Bantry Bay -33.785 151.230 395
Quakers Hat -33.812 151.235 7,206
Shark Bay -33.847 151.264 15,059
Shark Island -33.858 151.259 55
Clarke Island -33.863 151.242 4
SIMS -33.839 151.259 238
Taylors Bay -33.850 151.250 840
Western Wedding Cake
-33.840 151.264 14,225
Sow and Pigs -33.836 151.270 262
Clifton Gardens -33.842 151.255 123
Mann Point -33.843 151.186 1,290
Sugarloaf -33.794 151.225 250
Castle Cove -33.785 151.220 253
Clontarf -33.808 151.249 45
Castlecrag -33.802 151.231 2,639
Green Channel Buoy No. 6
-33.828 151.272 11,876
NSW DPI Coastal and Estuarine Fish Tracking (CEFT)
2013 Coffs Harbour SIMP 5 - Sth Sol Manta Arch
-30.203 153.381 2,105

160
SIMP 6 - Sth Sol Boulder
Wall
-30.202 153.301 4,428
SIMP 7 - Sth Sol Buccanans
Wall
-30.207 153.503 1,096
SIMP 7 - Sth Sol Buchanans
Wall
-30.207 153.265 1,091
Sydney (coastal)
Between Bondi And South Head (Sth)
-33.873 151.287 33
BL 2 -33.900 151.295 2
BL 4 -33.908 151.309 455
CTBAR NewHeadland
-33.798 151.296 1
CTBAR NewNorth
-33.799 151.295 1
CTBAR NewWest
-33.799 151.294 1
Dunbar South -33.851 151.291 583
FAD Botanywide
-33.995 151.446 10
Long Reef -33.738 151.329 3,090
North Head -33.826 151.300 117
Offshore Artificial Reef
Sydney
-33.847 151.300 332
SG 4 -33.826 151.298 106
Sydney Mooring 140m
-34.000 151.450 2
Sydney Harbour
Balmoral Bay -33.823 151.256 7
Bantry Bay -33.785 151.230 15,814
Black Channel Buoy - Entrance
-33.831 151.274 25

161
Castle Cove -33.785 151.220 10,710
Castlecrag -33.802 151.231 3,860
Chowder Bay -33.839 151.257 1,280
Cobbler's Beach -33.823 151.264 1,040
Quaker's Hat -33.812 151.235 1,719
Red Channel Buoy - Entrance
-33.831 151.277 167
Spit Bridge -33.803 151.246 95
Sugarloaf Bay -33.794 151.225 1,024
Western Wedding Cake
-33.840 151.264 1
Kingfish in South Australia
2018-2021
South Neptune South Neptune -35.326 136.116 351
North Neptune Islands
ST01 -35.210 136.028 2,357
ST02 -35.211 136.032 6,949
ST03 -35.208 136.026 5,918
ST04 -35.205 136.017 4,193
ST05 -35.206 136.022 2,018
ST06 -35.213 136.046 1,140
ST07 -35.214 136.044 2,348
ST08 -35.211 136.033 4,586
ST09 -35.213 136.028 3,561
ST10 -35.211 136.025 7,136
ST11 -35.206 136.014 3,579
ST12 -35.209 136.022 10,015
ST13 -35.212 136.031 6,483
ST14 -35.209 136.023 3,039
ST15 -35.211 136.026 11,122

162
2019-2021
Coffin Bay Array
CB01 -34.594 135.457 1187
CB02 -34.605 135.472 187
CB03 -34.617 135.475 166
CB04 -34.607 135.497 61
CB05 -34.603 135.484 27
CB06 -34.609 135.504 27
CB07 -34.614 135.503 19
CB08 -34.612 135.452 848
CB09 -34.552 135.427 18497
CB10 -34.595 135.415 1672
CB11 -34.566 135.438 538
CB12 -34.597 135.427 413
CB13 -34.549 135.435 701
CB14 -34.541 135.418 1945
CB15 -34.633 135.406 105
CB16 -34.618 135.397 478
CB17 -34.612 135.400 441
CB18 -34.605 135.402 593
CB19 -34.600 135.362 210
CB20 -34.590 135.382 1196
CB21 -34.590 135.374 190
CB22 -34.589 135.367 54
CB23 -34.572 135.365 244
CB24 -34.565 135.347 147
CB25 -34.546 135.315 3093
CB26 -34.542 135.361 217
CB27 -34.521 135.371 67

163
CB28 -34.522 135.362 48
Total 93 212,497
Table S6. Average environmental parameters from south-eastern Australian receiver arrays used for
Generalised Additive Mixed Model.
Factor Installation Average n SE
SST Coffin Bay 16.1 33371 0.013
Coffs Harbour 23.4 8720 0.016
North Neptune 17.0 73660 0.006
South Neptune 17.9 351 0.026
Sydney (coastal) 20.5 4755 0.030
Sydney Harbour 20.9 90853 0.005
Total 18.9 211710 0.006
Bathy Coffin Bay -5.5 33371 0.009
Coffs Harbour -20.8 8720 0.082
North Neptune -15.0 73660 0.014
South Neptune -14.0 351 0
Sydney (coastal) -15.4 4755 0.158
Sydney Harbour -13.5 90853 0.042
Total -13.1 211710 0.021
dist2land Coffin Bay 1.1 33371 0.002
Coffs Harbour 9.0 8720 0
North Neptune 26.0 73660 0
South Neptune 31.0 351 0
Sydney (coastal) 1.0 4755 0
Sydney Harbour 1.0 90853 0
Total 10.1 211710 0.026
tide Coffin Bay 0.555 33371 0.001
Coffs Harbour 1.101 8720 0.004
North Neptune 0.020 73660 0.001
South Neptune -0.003 351 0.012
Sydney (coastal) 1.016 4755 0.007

164
Sydney Harbour 0.369 90853 0.002
Total 0.321 211710 0.001
moon Coffin Bay 0.447 33371 0.002
Coffs Harbour 0.410 8720 0.003
North Neptune 0.480 73660 0.001
South Neptune 0.839 351 0.009
Sydney (coastal) 0.521 4755 0.005
Sydney Harbour 0.275 90853 0.001
Total 0.385 211710 0.001
Table S7. Estimated factor coefficients (β) and their standard errors (SE), t-values, and approximate
significance (p-values) of factors included in the top-ranked model for activity drivers south-eastern
Australia. Smooth and random terms showing df (estimated degrees of freedom), F (Fisher-Snedecor
distribution, continuous probability distribution) and p-values (approximate significance, significant
values are shown in bold).
Terms Factor β SE t value p-value
Fixed Intercept (depth) -2.72 0.491 -5.519 >0.01
latitude 0.09 0.014 6.524 >0.01
SST 0.03 0.0004 61.051 >0.01
bathy -0.001 0.0001 -12.102 >0.01
tide -0.013 0.002 -7.934 >0.01
moon -0.01 0.002 -6.195 >0.01
df F p-value
Smooth hour 20.27 21069.7 >0.01
Random transmitter 57.19 598.8 >0.01
year 4.25 19763.3 0.04

165
Table S8. Estimated factor coefficients (β) and their standard errors (SE), t-values of factors included
in the top-ranked model for activity drivers in different areas of Coffin Bay (indicated for each
variable). Significant interactions are shown in bold.
Terms Factor β SE t value p-value
Fixed Intercept (Brothers) -1.16 0.22 -5.2 >0.01
Dutton -1.11 0.13 -8.5 < 2e-16
Kellidie -1.08 0.32 -3.4 >0.01
Long Beach 0.33 0.16 2.0 0.044
Mouth -0.12 0.21 -0.6 0.558
Moon 0.14 0.04 3.8 >0.01
Temperature 0.05 0.01 7.7 >0.01
Tide -0.10 0.07 -1.4 0.155
Dutton*Moon -0.20 0.04 -4.9 >0.01
Kellidie*Moon -0.25 0.08 -3.0 >0.01
Long Beach*Moon -0.05 0.05 -1.1 0.283
Mouth*Moon -0.20 0.05 -4.1 >0.01
AreaDutton*Temperature 0.05 0.01 7.9 >0.01
Kellidie*Temperature 0.08 0.02 4.2 >0.01
Long Beach*Temperature -0.01 0.01 -1.6 0.110
Mouth*Temperature 0.02 0.01 1.7 0.084
Dutton*Tide.height 0.14 0.07 1.9 0.059
Kellidie*Tide.height -0.09 0.11 -0.8 0.407
Long Beach*Tide.height -0.04 0.09 -0.5 0.642
Mouth*Tide.height -0.17 0.09 -1.8 0.068
Smooth Hour*Brothers 6.56 22 10.7 >0.01
Hour*Dutton 14.39 22 62.5 >0.01
Hour*Kellidie 9.68 22 4.1 >0.01
Hour*Long Beach 10.06 22 14.0 >0.01
Hour*Mouth 15.65 22 4.9 >0.01
Random Transmitter 4.98 5 638.8 >0.01
Week number 1.00 1 1327.1 >0.01

166
Figure S1. Variable importance plots for predictor variables. Mean decrease in accuracy shows how
model performance decreases if a predictor variable is removed from the model, and mean decrease in
Gini Index shows the importance of a predictor variable based on Gini Impurity Index for the
calculation of splits in trees.

167
Figure S2. Example of spawning events (n = 16, red markers) and reproductive behaviours (n = 1, purple arrow) as predicted from RF model applied on free-
ranging Kingfish.
VeD
BA
(g)
Dep
th (m
)
spawning event
reproductive behaviour
Courtship

168
a)
b)
c)

169
Figure S3. Acceleration signatures for a) swim, b) escape, c) chafe, d) feed, and e) courtship behavioural
classes from captive Yellowtail Kingfish recorded via accelerometer loggers.
d)
e)

170
Figure S4. Number of 1 second increments predicted from free-ranging Yellowtail Kingfish at each hour of
the day. Time of day is indicated by dawn (orange, 0600 – 0900), dusk (orange, 1700 – 2000), day (yellow)
and night (grey).
Behaviour class
Chafe
Courtship Escape Feed Swim

171
Figure S5. Abacus plot showing residency of 18 acoustically tagged kingfish at north (black) and south
(blue) Neptune Islands between August 2018-20.

172
4311 4312
4313 4314
7809 7810
% BBKUD
contour

173
7811 14245
14246 14247
14248 14249

174
Figure S6. Overall activity space (BBKUD 50- and 95% contours) of yellowtail kingfish at the Neptune
Islands. Estimates of 60-minute centre of activities are shown in blue. Location of VR2W acoustic receivers
are shown in red.
14259 14252
14251 14250

175
Figure S7. Estimated marginal means (predicted values ± SE) of kingfish activity for random effects; a)
Transmitter ID and b) Year in Generalised Additive Mixed Model for activity in south-eastern Australia.
a)
b)