Circles of Health: Towards an advanced social network about disabilities of neurological origin
24
Circles of Health: Towards an advanced social network about disabilities of neurological origin Laia Subirats a,b,⇑ , Luigi Ceccaroni a , Raquel Lopez-Blazquez b,c,d , Felip Miralles a , Alejandro García-Rudolph b,c,d , Jose M. Tormos b,c,d a Barcelona Digital Technology Centre, Roc Boronat, 117, 5th Floor, MediaTIC Building, 22@ District, 08018 Barcelona, Spain b Universitat Autònoma de Barcelona, Campus UAB, 08193 Bellaterra, Spain c Institut Guttmann, Institut Universitari de Neurorehabilitació adscrit a la UAB, Camí de Can Ruti sn, 08916 Badalona, Spain d Fundació Institut d’Investigació en Ciències de la Salut Germans Trias i Pujol, Camí de Can Ruti sn, 08916 Badalona, Spain article info Article history: Received 18 October 2012 Accepted 4 September 2013 Available online 16 September 2013 Keywords: Knowledge-based systems Biomedical ontologies ICF Medical health records Decision-support systems abstract Objectives: This research is concerned with the study of a new social-network platform, which (1) provides people with disabilities of neurological origin, their relatives, health professionals, therapists, carers and institutions with an interoperable platform that supports standard indicators, (2) promotes knowledge democratization and user empowerment, and (3) allows making decisions with a more informed opinion. Methods: A new social network, Circles of Health, has been designed, developed and tested by end-users. To allow monitoring the evolution of people’s health status and comparing it with other users and with their cohort, anonymized data of 2675 people from comprehensive and multidimensional medical evalu- ations, carried out yearly from 2006 to 2010, have been standardized to the International Classification of Functioning, Disability and Health, integrated into the corresponding medical health records and then used to automatically generate and graphically represent multidimensional indicators. These indicators have been integrated into Circles of Health’s social environment, which has been then evaluated via expert and user-experience analyses. Results: Patients used Circles of Health to exchange bio-psycho-social information (medical and other- wise) about their everyday lives. Health professionals remarked that the use of color-coding in graphical representations is useful to quickly diagnose deficiencies, difficulties or barriers in rehabilitation. Most people with disabilities complained about the excessive amount of information and the difficulty in inter- preting graphical representations. Conclusions: Health professionals found Circles of Health useful to generate a more integrative under- standing of health based on a comprehensive profile of individuals instead of being focused on patient’s diseases and injuries. People with disabilities found enriching personal knowledge with the experiences of other users helpful. The number of descriptors used at the same time in the graphical interface should be reduced in future versions of the social-network platform. Ó 2013 Elsevier Inc. All rights reserved. 1. Introduction A disease or injury may have multiple disabling effects of vari- ous levels of severity, and cause varying degrees of health prob- lems. The global burden of disease (GBD) links average loss of health to disease and injury’s causes through disability-adjusted life years (DALYs) [1] and disability weight factors. The DALY extends the concept of potential years of life lost due to premature death to include equivalent years of healthy life lost by virtue of being in states of poor health or disability. The weight factor reflects the severity of the disease on a scale from 0 (perfect health) to 1 (death). The term disability has a number of different meanings and, in particular, is not seen by some as a synonym or proxy for loss of health. However, the World Health Organization (WHO) uses the term disability to refer to loss of health, where health is concep- tualized in terms of functioning capacity in a set of health domains such as mobility, cognition, hearing and vision, and we adopt this use for the term. According to the WHO, of the world’s population of 6.5 billion in 2004, 19 million (3%) were severely disabled and another 80 million (12%) had moderate longterm disability, which is a barrier for personal development as well as social integration. People with disabilities of neurological origin are mainly people 1532-0464/$ - see front matter Ó 2013 Elsevier Inc. All rights reserved. http://dx.doi.org/10.1016/j.jbi.2013.09.001 ⇑ Corresponding author at: Barcelona Digital Technology Centre, Roc Boronat, 117, 5th Floor, MediaTIC Building, 22@ District, 08018 Barcelona, Spain. Fax: +34 93 553 45 41. E-mail addresses: [email protected] (L. Subirats), [email protected] (L. Ceccaroni), [email protected] (R. Lopez-Blazquez), [email protected] (F. Miralles), [email protected] (A. García-Rudolph), jmtormos@guttmann. com (J.M. Tormos). Journal of Biomedical Informatics 46 (2013) 1006–1029 Contents lists available at ScienceDirect Journal of Biomedical Informatics journal homepage: www.elsevier.com/locate/yjbin
-
Upload
independent -
Category
Documents
-
view
4 -
download
0
Transcript of Circles of Health: Towards an advanced social network about disabilities of neurological origin

Journal of Biomedical Informatics 46 (2013) 1006–1029
Contents lists available at ScienceDirect
Journal of Biomedical Informatics
journal homepage: www.elsevier .com/locate /y jb in
Circles of Health: Towards an advanced social network about disabilitiesof neurological origin
1532-0464/$ - see front matter � 2013 Elsevier Inc. All rights reserved.http://dx.doi.org/10.1016/j.jbi.2013.09.001
⇑ Corresponding author at: Barcelona Digital Technology Centre, Roc Boronat,117, 5th Floor, MediaTIC Building, 22@ District, 08018 Barcelona, Spain. Fax: +34 93553 45 41.
E-mail addresses: [email protected] (L. Subirats), [email protected](L. Ceccaroni), [email protected] (R. Lopez-Blazquez), [email protected](F. Miralles), [email protected] (A. García-Rudolph), [email protected] (J.M. Tormos).
Laia Subirats a,b,⇑, Luigi Ceccaroni a, Raquel Lopez-Blazquez b,c,d, Felip Miralles a,Alejandro García-Rudolph b,c,d, Jose M. Tormos b,c,d
a Barcelona Digital Technology Centre, Roc Boronat, 117, 5th Floor, MediaTIC Building, 22@ District, 08018 Barcelona, Spainb Universitat Autònoma de Barcelona, Campus UAB, 08193 Bellaterra, Spainc Institut Guttmann, Institut Universitari de Neurorehabilitació adscrit a la UAB, Camí de Can Ruti sn, 08916 Badalona, Spaind Fundació Institut d’Investigació en Ciències de la Salut Germans Trias i Pujol, Camí de Can Ruti sn, 08916 Badalona, Spain
a r t i c l e i n f o a b s t r a c t
Article history:Received 18 October 2012Accepted 4 September 2013Available online 16 September 2013
Keywords:Knowledge-based systemsBiomedical ontologiesICFMedical health recordsDecision-support systems
Objectives: This research is concerned with the study of a new social-network platform, which (1) providespeople with disabilities of neurological origin, their relatives, health professionals, therapists, carers andinstitutions with an interoperable platform that supports standard indicators, (2) promotes knowledgedemocratization and user empowerment, and (3) allows making decisions with a more informed opinion.Methods: A new social network, Circles of Health, has been designed, developed and tested by end-users.To allow monitoring the evolution of people’s health status and comparing it with other users and withtheir cohort, anonymized data of 2675 people from comprehensive and multidimensional medical evalu-ations, carried out yearly from 2006 to 2010, have been standardized to the International Classification ofFunctioning, Disability and Health, integrated into the corresponding medical health records and thenused to automatically generate and graphically represent multidimensional indicators. These indicatorshave been integrated into Circles of Health’s social environment, which has been then evaluated via expertand user-experience analyses.Results: Patients used Circles of Health to exchange bio-psycho-social information (medical and other-wise) about their everyday lives. Health professionals remarked that the use of color-coding in graphicalrepresentations is useful to quickly diagnose deficiencies, difficulties or barriers in rehabilitation. Mostpeople with disabilities complained about the excessive amount of information and the difficulty in inter-preting graphical representations.Conclusions: Health professionals found Circles of Health useful to generate a more integrative under-standing of health based on a comprehensive profile of individuals instead of being focused on patient’sdiseases and injuries. People with disabilities found enriching personal knowledge with the experiencesof other users helpful. The number of descriptors used at the same time in the graphical interface shouldbe reduced in future versions of the social-network platform.
� 2013 Elsevier Inc. All rights reserved.
1. Introduction
A disease or injury may have multiple disabling effects of vari-ous levels of severity, and cause varying degrees of health prob-lems. The global burden of disease (GBD) links average loss ofhealth to disease and injury’s causes through disability-adjusted lifeyears (DALYs) [1] and disability weight factors. The DALY extends
the concept of potential years of life lost due to premature deathto include equivalent years of healthy life lost by virtue of beingin states of poor health or disability. The weight factor reflectsthe severity of the disease on a scale from 0 (perfect health) to 1(death). The term disability has a number of different meaningsand, in particular, is not seen by some as a synonym or proxy forloss of health. However, the World Health Organization (WHO) usesthe term disability to refer to loss of health, where health is concep-tualized in terms of functioning capacity in a set of health domainssuch as mobility, cognition, hearing and vision, and we adopt thisuse for the term. According to the WHO, of the world’s populationof 6.5 billion in 2004, 19 million (3%) were severely disabled andanother 80 million (12%) had moderate longterm disability, whichis a barrier for personal development as well as social integration.People with disabilities of neurological origin are mainly people
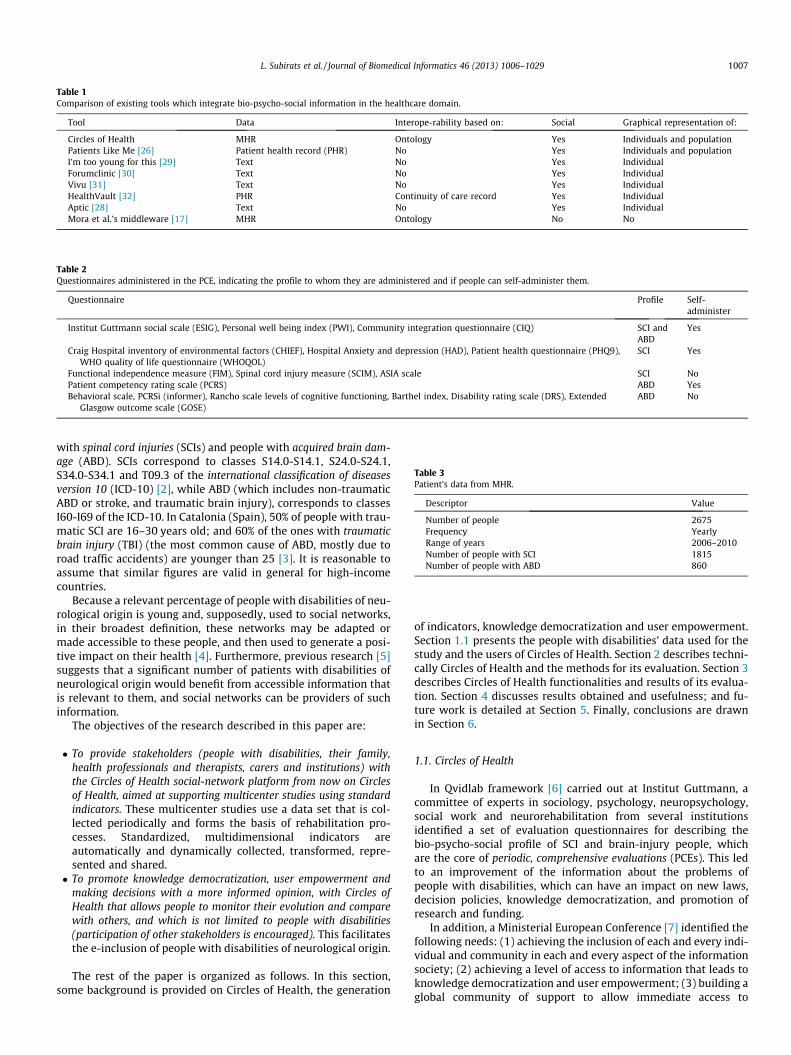
Table 1Comparison of existing tools which integrate bio-psycho-social information in the healthcare domain.
Tool Data Interope-rability based on: Social Graphical representation of:
Circles of Health MHR Ontology Yes Individuals and populationPatients Like Me [26] Patient health record (PHR) No Yes Individuals and populationI’m too young for this [29] Text No Yes IndividualForumclinic [30] Text No Yes IndividualVivu [31] Text No Yes IndividualHealthVault [32] PHR Continuity of care record Yes IndividualAptic [28] Text No Yes IndividualMora et al.’s middleware [17] MHR Ontology No No
Table 2Questionnaires administered in the PCE, indicating the profile to whom they are administered and if people can self-administer them.
Questionnaire Profile Self-administer
Institut Guttmann social scale (ESIG), Personal well being index (PWI), Community integration questionnaire (CIQ) SCI andABD
Yes
Craig Hospital inventory of environmental factors (CHIEF), Hospital Anxiety and depression (HAD), Patient health questionnaire (PHQ9),WHO quality of life questionnaire (WHOQOL)
SCI Yes
Functional independence measure (FIM), Spinal cord injury measure (SCIM), ASIA scale SCI NoPatient competency rating scale (PCRS) ABD YesBehavioral scale, PCRSi (informer), Rancho scale levels of cognitive functioning, Barthel index, Disability rating scale (DRS), Extended
Glasgow outcome scale (GOSE)ABD No
Table 3Patient’s data from MHR.
Descriptor Value
Number of people 2675Frequency YearlyRange of years 2006–2010Number of people with SCI 1815Number of people with ABD 860
L. Subirats et al. / Journal of Biomedical Informatics 46 (2013) 1006–1029 1007
with spinal cord injuries (SCIs) and people with acquired brain dam-age (ABD). SCIs correspond to classes S14.0-S14.1, S24.0-S24.1,S34.0-S34.1 and T09.3 of the international classification of diseasesversion 10 (ICD-10) [2], while ABD (which includes non-traumaticABD or stroke, and traumatic brain injury), corresponds to classesI60-I69 of the ICD-10. In Catalonia (Spain), 50% of people with trau-matic SCI are 16–30 years old; and 60% of the ones with traumaticbrain injury (TBI) (the most common cause of ABD, mostly due toroad traffic accidents) are younger than 25 [3]. It is reasonable toassume that similar figures are valid in general for high-incomecountries.
Because a relevant percentage of people with disabilities of neu-rological origin is young and, supposedly, used to social networks,in their broadest definition, these networks may be adapted ormade accessible to these people, and then used to generate a posi-tive impact on their health [4]. Furthermore, previous research [5]suggests that a significant number of patients with disabilities ofneurological origin would benefit from accessible information thatis relevant to them, and social networks can be providers of suchinformation.
The objectives of the research described in this paper are:
� To provide stakeholders (people with disabilities, their family,health professionals and therapists, carers and institutions) withthe Circles of Health social-network platform from now on Circlesof Health, aimed at supporting multicenter studies using standardindicators. These multicenter studies use a data set that is col-lected periodically and forms the basis of rehabilitation pro-cesses. Standardized, multidimensional indicators areautomatically and dynamically collected, transformed, repre-sented and shared.� To promote knowledge democratization, user empowerment and
making decisions with a more informed opinion, with Circles ofHealth that allows people to monitor their evolution and comparewith others, and which is not limited to people with disabilities(participation of other stakeholders is encouraged). This facilitatesthe e-inclusion of people with disabilities of neurological origin.
The rest of the paper is organized as follows. In this section,some background is provided on Circles of Health, the generation
of indicators, knowledge democratization and user empowerment.Section 1.1 presents the people with disabilities’ data used for thestudy and the users of Circles of Health. Section 2 describes techni-cally Circles of Health and the methods for its evaluation. Section 3describes Circles of Health functionalities and results of its evalua-tion. Section 4 discusses results obtained and usefulness; and fu-ture work is detailed at Section 5. Finally, conclusions are drawnin Section 6.
1.1. Circles of Health
In Qvidlab framework [6] carried out at Institut Guttmann, acommittee of experts in sociology, psychology, neuropsychology,social work and neurorehabilitation from several institutionsidentified a set of evaluation questionnaires for describing thebio-psycho-social profile of SCI and brain-injury people, whichare the core of periodic, comprehensive evaluations (PCEs). This ledto an improvement of the information about the problems ofpeople with disabilities, which can have an impact on new laws,decision policies, knowledge democratization, and promotion ofresearch and funding.
In addition, a Ministerial European Conference [7] identified thefollowing needs: (1) achieving the inclusion of each and every indi-vidual and community in each and every aspect of the informationsociety; (2) achieving a level of access to information that leads toknowledge democratization and user empowerment; (3) building aglobal community of support to allow immediate access to
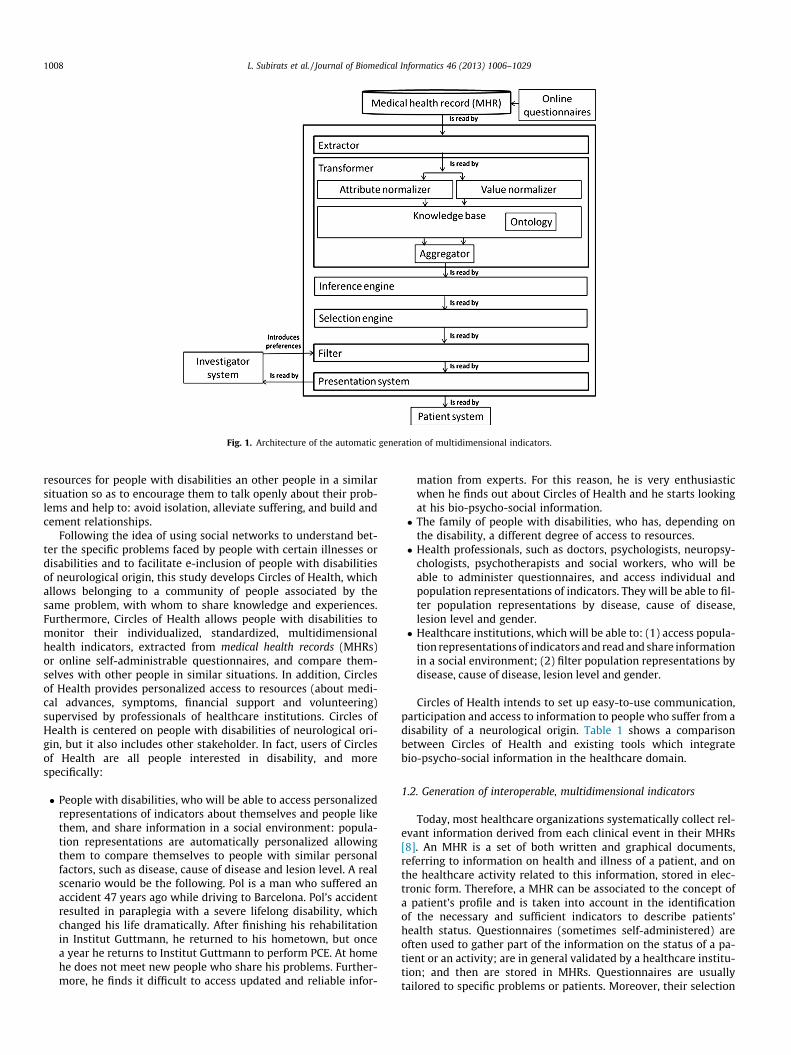
Fig. 1. Architecture of the automatic generation of multidimensional indicators.
1008 L. Subirats et al. / Journal of Biomedical Informatics 46 (2013) 1006–1029
resources for people with disabilities an other people in a similarsituation so as to encourage them to talk openly about their prob-lems and help to: avoid isolation, alleviate suffering, and build andcement relationships.
Following the idea of using social networks to understand bet-ter the specific problems faced by people with certain illnesses ordisabilities and to facilitate e-inclusion of people with disabilitiesof neurological origin, this study develops Circles of Health, whichallows belonging to a community of people associated by thesame problem, with whom to share knowledge and experiences.Furthermore, Circles of Health allows people with disabilities tomonitor their individualized, standardized, multidimensionalhealth indicators, extracted from medical health records (MHRs)or online self-administrable questionnaires, and compare them-selves with other people in similar situations. In addition, Circlesof Health provides personalized access to resources (about medi-cal advances, symptoms, financial support and volunteering)supervised by professionals of healthcare institutions. Circles ofHealth is centered on people with disabilities of neurological ori-gin, but it also includes other stakeholder. In fact, users of Circlesof Health are all people interested in disability, and morespecifically:
� People with disabilities, who will be able to access personalizedrepresentations of indicators about themselves and people likethem, and share information in a social environment: popula-tion representations are automatically personalized allowingthem to compare themselves to people with similar personalfactors, such as disease, cause of disease and lesion level. A realscenario would be the following. Pol is a man who suffered anaccident 47 years ago while driving to Barcelona. Pol’s accidentresulted in paraplegia with a severe lifelong disability, whichchanged his life dramatically. After finishing his rehabilitationin Institut Guttmann, he returned to his hometown, but oncea year he returns to Institut Guttmann to perform PCE. At homehe does not meet new people who share his problems. Further-more, he finds it difficult to access updated and reliable infor-
mation from experts. For this reason, he is very enthusiasticwhen he finds out about Circles of Health and he starts lookingat his bio-psycho-social information.� The family of people with disabilities, who has, depending on
the disability, a different degree of access to resources.� Health professionals, such as doctors, psychologists, neuropsy-
chologists, psychotherapists and social workers, who will beable to administer questionnaires, and access individual andpopulation representations of indicators. They will be able to fil-ter population representations by disease, cause of disease,lesion level and gender.� Healthcare institutions, which will be able to: (1) access popula-
tion representations of indicators and read and share informationin a social environment; (2) filter population representations bydisease, cause of disease, lesion level and gender.
Circles of Health intends to set up easy-to-use communication,participation and access to information to people who suffer from adisability of a neurological origin. Table 1 shows a comparisonbetween Circles of Health and existing tools which integratebio-psycho-social information in the healthcare domain.
1.2. Generation of interoperable, multidimensional indicators
Today, most healthcare organizations systematically collect rel-evant information derived from each clinical event in their MHRs[8]. An MHR is a set of both written and graphical documents,referring to information on health and illness of a patient, and onthe healthcare activity related to this information, stored in elec-tronic form. Therefore, a MHR can be associated to the concept ofa patient’s profile and is taken into account in the identificationof the necessary and sufficient indicators to describe patients’health status. Questionnaires (sometimes self-administered) areoften used to gather part of the information on the status of a pa-tient or an activity; are in general validated by a healthcare institu-tion; and then are stored in MHRs. Questionnaires are usuallytailored to specific problems or patients. Moreover, their selection
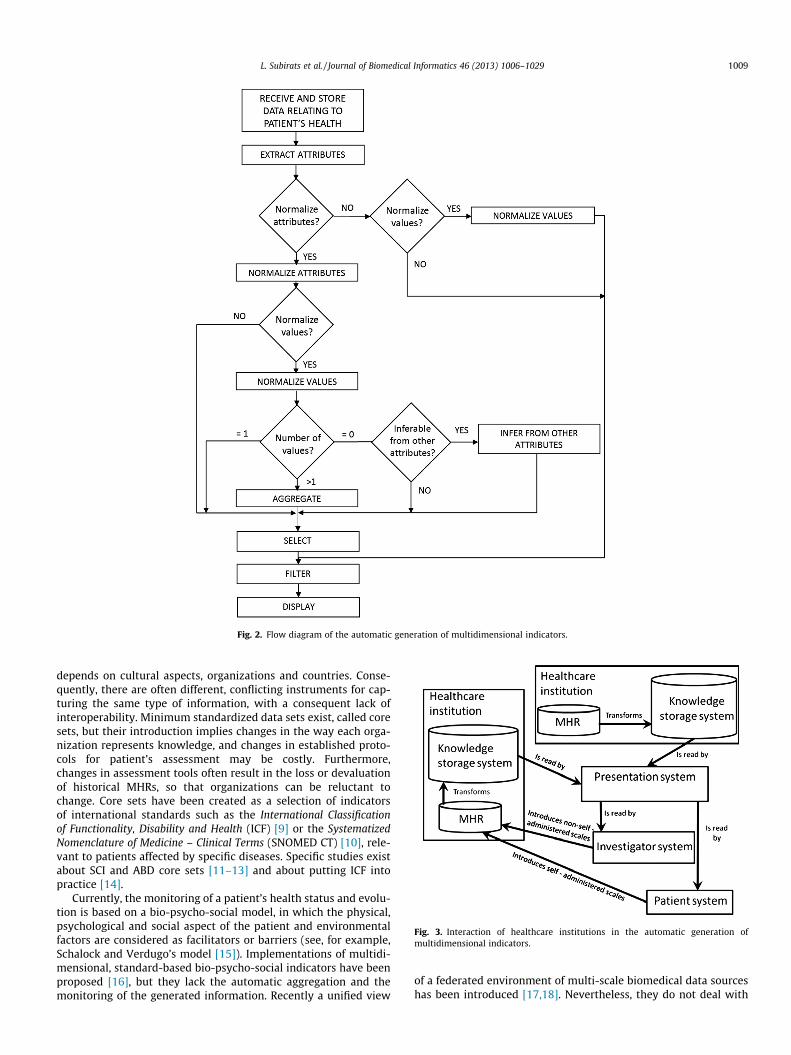
Fig. 2. Flow diagram of the automatic generation of multidimensional indicators.
Fig. 3. Interaction of healthcare institutions in the automatic generation ofmultidimensional indicators.
L. Subirats et al. / Journal of Biomedical Informatics 46 (2013) 1006–1029 1009
depends on cultural aspects, organizations and countries. Conse-quently, there are often different, conflicting instruments for cap-turing the same type of information, with a consequent lack ofinteroperability. Minimum standardized data sets exist, called coresets, but their introduction implies changes in the way each orga-nization represents knowledge, and changes in established proto-cols for patient’s assessment may be costly. Furthermore,changes in assessment tools often result in the loss or devaluationof historical MHRs, so that organizations can be reluctant tochange. Core sets have been created as a selection of indicatorsof international standards such as the International Classificationof Functionality, Disability and Health (ICF) [9] or the SystematizedNomenclature of Medicine – Clinical Terms (SNOMED CT) [10], rele-vant to patients affected by specific diseases. Specific studies existabout SCI and ABD core sets [11–13] and about putting ICF intopractice [14].
Currently, the monitoring of a patient’s health status and evolu-tion is based on a bio-psycho-social model, in which the physical,psychological and social aspect of the patient and environmentalfactors are considered as facilitators or barriers (see, for example,Schalock and Verdugo’s model [15]). Implementations of multidi-mensional, standard-based bio-psycho-social indicators have beenproposed [16], but they lack the automatic aggregation and themonitoring of the generated information. Recently a unified view
of a federated environment of multi-scale biomedical data sourceshas been introduced [17,18]. Nevertheless, they do not deal with

Fig. 4. Ontological representation of people who has SCI.
1010 L. Subirats et al. / Journal of Biomedical Informatics 46 (2013) 1006–1029
the particularities of the ICF standard (which require a normaliza-tion of both attributes and values), the integration with MHRs, northe integration of several standards, such as ICF and SNOMED CT.Although relationships of the concepts of ICF have been explored[19], an implementation of automatic generation of interoperableand multidimensional data has not been provided.
1.3. Social environment for knowledge democratization and userempowerment
The adoption of information and communication technologies(ICTs) is one of the aspects which will link the e-inclusion of theperson with his empowerment. New technologies (and especiallythe Internet) can facilitate the creation of a communication envi-ronment that enables knowledge democratization, empowerment[20] and participation. Currently, there is a lack of visual and per-sonalized comparison involving individuals and populations,showing personal factors and their evolution in an indicator-drivenrepresentation, although there are already some initiatives for rep-resenting semantic similarity in biomedical ontologies [21] and forextracting knowledge from data sets over time [22]. This poten-tially involves the comparison of the functioning of a patient (rep-resented by ICF) with anonymous people with similar factors suchas disease, cause of disease, lesion level or gender, among others.
A general need exists for specific tools and services which offersocial networking [23], participation, guidance to high qualityinformation, collaboration and openness in medicine [24]. Thereare some initiatives which share biomedical information in a socialenvironment such as the popular social network PatientsLikeMe
[25,26]; others which analyze biomedical information disclosedin YouTube [27]; and some others which aim to improve patients’quality of life (QoL) [28]. However, none of them integrates stan-dardized and multidimensional data nor allows automatic person-alization of visualization of biomedical information depending onthe patient’s profile.
2. Methods
This section describes technically Circles of Health and themethods for its evaluation.
2.1. Technical description of Circles of Health
Circles of Health is developed in Liferay Portal CE [40], which isavailable under the Lesser GNU Public License (LGPL) v2.1 at abso-lutely no cost. Liferay is a content management system (CMS) writ-ten in Java with certain portlets preinstalled which cover most ofthe functionalities (described in Section 3.1) required in Circles ofHealth. New portlets for the automatic generation of interoperable,multidimensional and holistic indicators of MHRs, developed usingMatlab, are available upon request. Nowadays, Circles of Health isnot publicly available because the business model to ensure sus-tainability of Circles of Health is still under study and a patenthas been published [41]. The rest of the section describes the auto-matic generation of interoperable, multidimensional and holisticindicators of MHRs; knowledge representation; and accessibilityof Circles of Health.
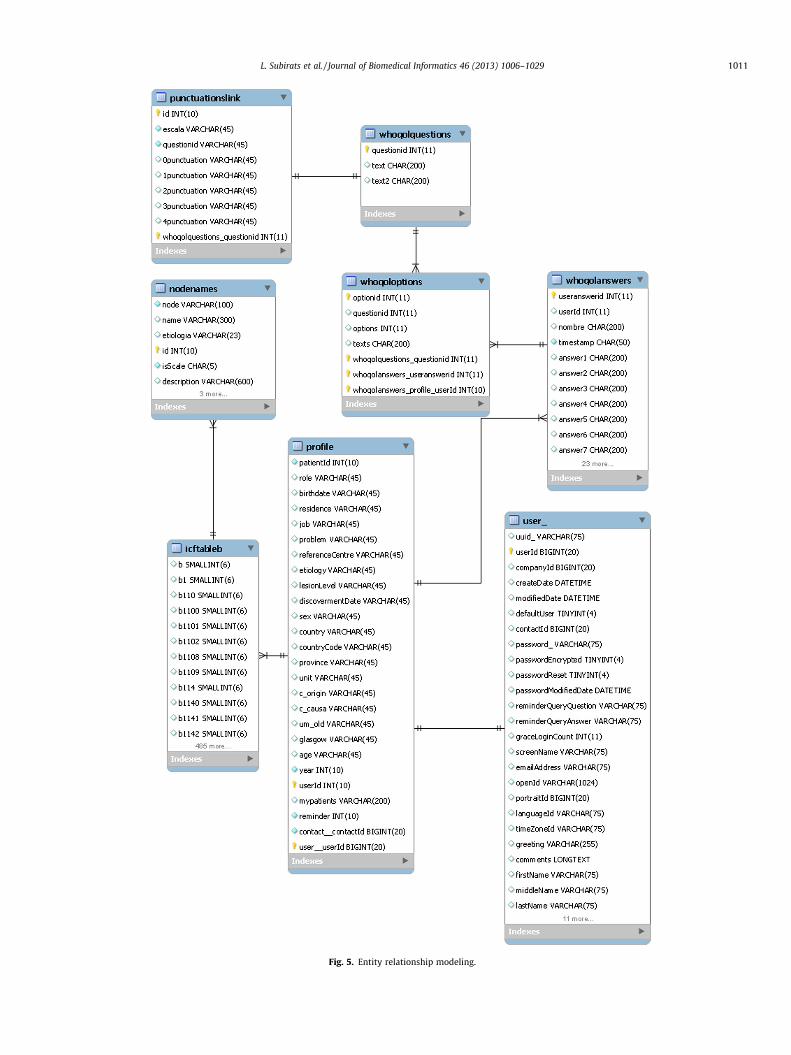
Fig. 5. Entity relationship modeling.
L. Subirats et al. / Journal of Biomedical Informatics 46 (2013) 1006–1029 1011
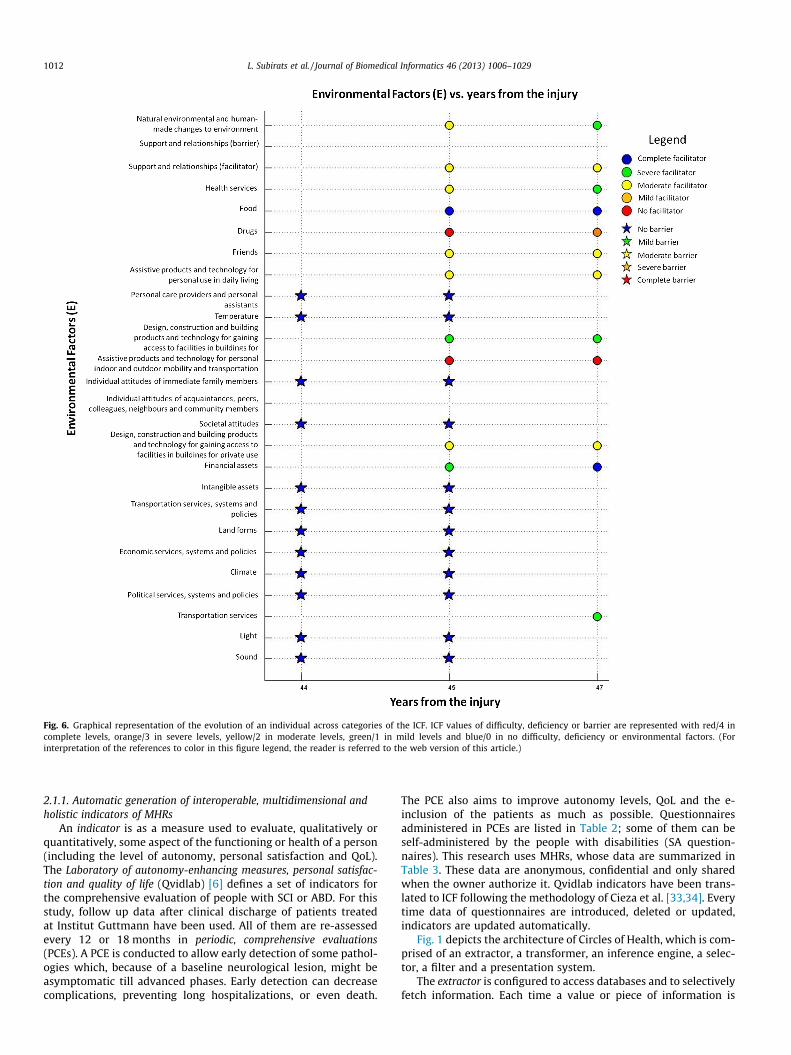
Fig. 6. Graphical representation of the evolution of an individual across categories of the ICF. ICF values of difficulty, deficiency or barrier are represented with red/4 incomplete levels, orange/3 in severe levels, yellow/2 in moderate levels, green/1 in mild levels and blue/0 in no difficulty, deficiency or environmental factors. (Forinterpretation of the references to color in this figure legend, the reader is referred to the web version of this article.)
1012 L. Subirats et al. / Journal of Biomedical Informatics 46 (2013) 1006–1029
2.1.1. Automatic generation of interoperable, multidimensional andholistic indicators of MHRs
An indicator is as a measure used to evaluate, qualitatively orquantitatively, some aspect of the functioning or health of a person(including the level of autonomy, personal satisfaction and QoL).The Laboratory of autonomy-enhancing measures, personal satisfac-tion and quality of life (Qvidlab) [6] defines a set of indicators forthe comprehensive evaluation of people with SCI or ABD. For thisstudy, follow up data after clinical discharge of patients treatedat Institut Guttmann have been used. All of them are re-assessedevery 12 or 18 months in periodic, comprehensive evaluations(PCEs). A PCE is conducted to allow early detection of some pathol-ogies which, because of a baseline neurological lesion, might beasymptomatic till advanced phases. Early detection can decreasecomplications, preventing long hospitalizations, or even death.
The PCE also aims to improve autonomy levels, QoL and the e-inclusion of the patients as much as possible. Questionnairesadministered in PCEs are listed in Table 2; some of them can beself-administered by the people with disabilities (SA question-naires). This research uses MHRs, whose data are summarized inTable 3. These data are anonymous, confidential and only sharedwhen the owner authorize it. Qvidlab indicators have been trans-lated to ICF following the methodology of Cieza et al. [33,34]. Everytime data of questionnaires are introduced, deleted or updated,indicators are updated automatically.
Fig. 1 depicts the architecture of Circles of Health, which is com-prised of an extractor, a transformer, an inference engine, a selec-tor, a filter and a presentation system.
The extractor is configured to access databases and to selectivelyfetch information. Each time a value or piece of information is
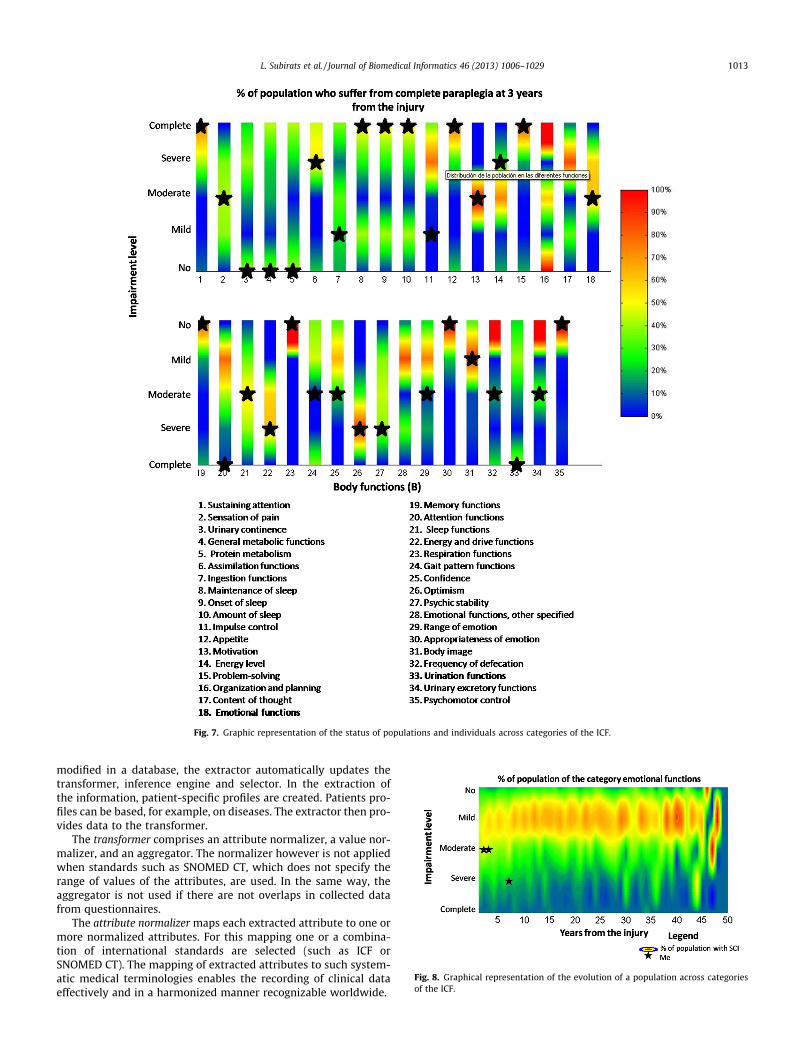
Fig. 7. Graphic representation of the status of populations and individuals across categories of the ICF.
Fig. 8. Graphical representation of the evolution of a population across categoriesof the ICF.
L. Subirats et al. / Journal of Biomedical Informatics 46 (2013) 1006–1029 1013
modified in a database, the extractor automatically updates thetransformer, inference engine and selector. In the extraction ofthe information, patient-specific profiles are created. Patients pro-files can be based, for example, on diseases. The extractor then pro-vides data to the transformer.
The transformer comprises an attribute normalizer, a value nor-malizer, and an aggregator. The normalizer however is not appliedwhen standards such as SNOMED CT, which does not specify therange of values of the attributes, are used. In the same way, theaggregator is not used if there are not overlaps in collected datafrom questionnaires.
The attribute normalizer maps each extracted attribute to one ormore normalized attributes. For this mapping one or a combina-tion of international standards are selected (such as ICF orSNOMED CT). The mapping of extracted attributes to such system-atic medical terminologies enables the recording of clinical dataeffectively and in a harmonized manner recognizable worldwide.
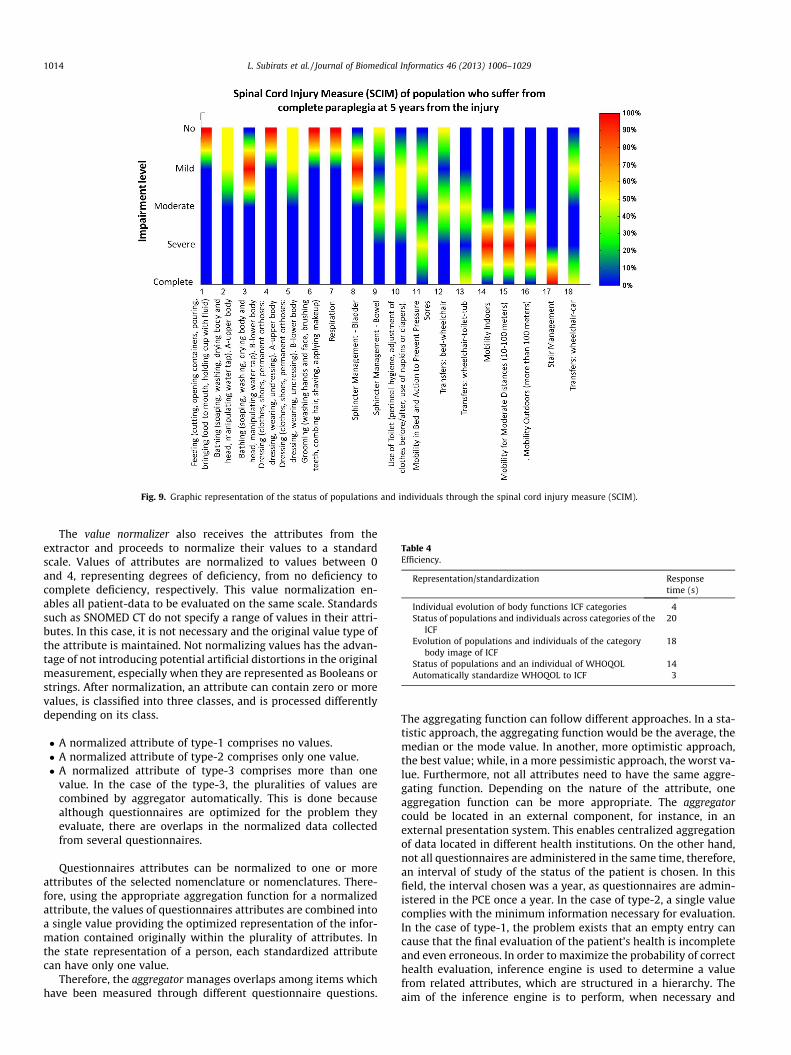
Fig. 9. Graphic representation of the status of populations and individuals through the spinal cord injury measure (SCIM).
Table 4Efficiency.
Representation/standardization Responsetime (s)
Individual evolution of body functions ICF categories 4Status of populations and individuals across categories of the
ICF20
Evolution of populations and individuals of the categorybody image of ICF
18
Status of populations and an individual of WHOQOL 14Automatically standardize WHOQOL to ICF 3
1014 L. Subirats et al. / Journal of Biomedical Informatics 46 (2013) 1006–1029
The value normalizer also receives the attributes from theextractor and proceeds to normalize their values to a standardscale. Values of attributes are normalized to values between 0and 4, representing degrees of deficiency, from no deficiency tocomplete deficiency, respectively. This value normalization en-ables all patient-data to be evaluated on the same scale. Standardssuch as SNOMED CT do not specify a range of values in their attri-butes. In this case, it is not necessary and the original value type ofthe attribute is maintained. Not normalizing values has the advan-tage of not introducing potential artificial distortions in the originalmeasurement, especially when they are represented as Booleans orstrings. After normalization, an attribute can contain zero or morevalues, is classified into three classes, and is processed differentlydepending on its class.
� A normalized attribute of type-1 comprises no values.� A normalized attribute of type-2 comprises only one value.� A normalized attribute of type-3 comprises more than one
value. In the case of the type-3, the pluralities of values arecombined by aggregator automatically. This is done becausealthough questionnaires are optimized for the problem theyevaluate, there are overlaps in the normalized data collectedfrom several questionnaires.
Questionnaires attributes can be normalized to one or moreattributes of the selected nomenclature or nomenclatures. There-fore, using the appropriate aggregation function for a normalizedattribute, the values of questionnaires attributes are combined intoa single value providing the optimized representation of the infor-mation contained originally within the plurality of attributes. Inthe state representation of a person, each standardized attributecan have only one value.
Therefore, the aggregator manages overlaps among items whichhave been measured through different questionnaire questions.
The aggregating function can follow different approaches. In a sta-tistic approach, the aggregating function would be the average, themedian or the mode value. In another, more optimistic approach,the best value; while, in a more pessimistic approach, the worst va-lue. Furthermore, not all attributes need to have the same aggre-gating function. Depending on the nature of the attribute, oneaggregation function can be more appropriate. The aggregatorcould be located in an external component, for instance, in anexternal presentation system. This enables centralized aggregationof data located in different health institutions. On the other hand,not all questionnaires are administered in the same time, therefore,an interval of study of the status of the patient is chosen. In thisfield, the interval chosen was a year, as questionnaires are admin-istered in the PCE once a year. In the case of type-2, a single valuecomplies with the minimum information necessary for evaluation.In the case of type-1, the problem exists that an empty entry cancause that the final evaluation of the patient’s health is incompleteand even erroneous. In order to maximize the probability of correcthealth evaluation, inference engine is used to determine a valuefrom related attributes, which are structured in a hierarchy. Theaim of the inference engine is to perform, when necessary and
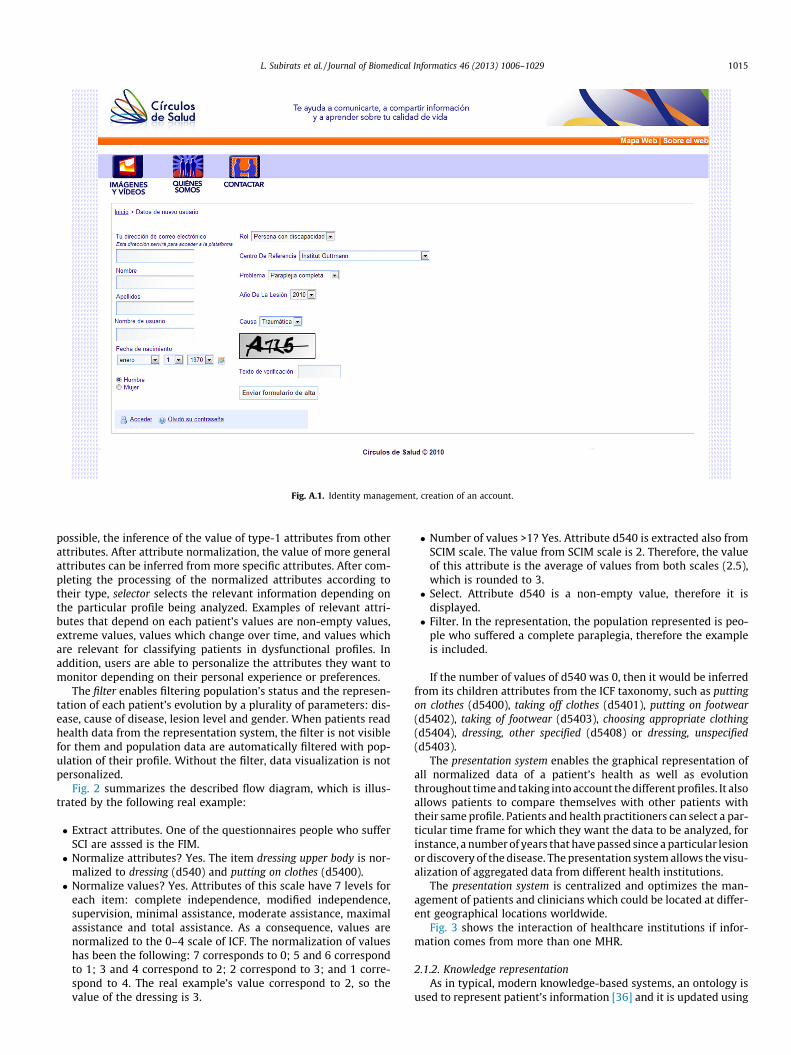
Fig. A.1. Identity management, creation of an account.
L. Subirats et al. / Journal of Biomedical Informatics 46 (2013) 1006–1029 1015
possible, the inference of the value of type-1 attributes from otherattributes. After attribute normalization, the value of more generalattributes can be inferred from more specific attributes. After com-pleting the processing of the normalized attributes according totheir type, selector selects the relevant information depending onthe particular profile being analyzed. Examples of relevant attri-butes that depend on each patient’s values are non-empty values,extreme values, values which change over time, and values whichare relevant for classifying patients in dysfunctional profiles. Inaddition, users are able to personalize the attributes they want tomonitor depending on their personal experience or preferences.
The filter enables filtering population’s status and the represen-tation of each patient’s evolution by a plurality of parameters: dis-ease, cause of disease, lesion level and gender. When patients readhealth data from the representation system, the filter is not visiblefor them and population data are automatically filtered with pop-ulation of their profile. Without the filter, data visualization is notpersonalized.
Fig. 2 summarizes the described flow diagram, which is illus-trated by the following real example:
� Extract attributes. One of the questionnaires people who sufferSCI are asssed is the FIM.� Normalize attributes? Yes. The item dressing upper body is nor-
malized to dressing (d540) and putting on clothes (d5400).� Normalize values? Yes. Attributes of this scale have 7 levels for
each item: complete independence, modified independence,supervision, minimal assistance, moderate assistance, maximalassistance and total assistance. As a consequence, values arenormalized to the 0–4 scale of ICF. The normalization of valueshas been the following: 7 corresponds to 0; 5 and 6 correspondto 1; 3 and 4 correspond to 2; 2 correspond to 3; and 1 corre-spond to 4. The real example’s value correspond to 2, so thevalue of the dressing is 3.
� Number of values >1? Yes. Attribute d540 is extracted also fromSCIM scale. The value from SCIM scale is 2. Therefore, the valueof this attribute is the average of values from both scales (2.5),which is rounded to 3.� Select. Attribute d540 is a non-empty value, therefore it is
displayed.� Filter. In the representation, the population represented is peo-
ple who suffered a complete paraplegia, therefore the exampleis included.
If the number of values of d540 was 0, then it would be inferredfrom its children attributes from the ICF taxonomy, such as puttingon clothes (d5400), taking off clothes (d5401), putting on footwear(d5402), taking of footwear (d5403), choosing appropriate clothing(d5404), dressing, other specified (d5408) or dressing, unspecified(d5403).
The presentation system enables the graphical representation ofall normalized data of a patient’s health as well as evolutionthroughout time and taking into account the different profiles. It alsoallows patients to compare themselves with other patients withtheir same profile. Patients and health practitioners can select a par-ticular time frame for which they want the data to be analyzed, forinstance, a number of years that have passed since a particular lesionor discovery of the disease. The presentation system allows the visu-alization of aggregated data from different health institutions.
The presentation system is centralized and optimizes the man-agement of patients and clinicians which could be located at differ-ent geographical locations worldwide.
Fig. 3 shows the interaction of healthcare institutions if infor-mation comes from more than one MHR.
2.1.2. Knowledge representationAs in typical, modern knowledge-based systems, an ontology is
used to represent patient’s information [36] and it is updated using
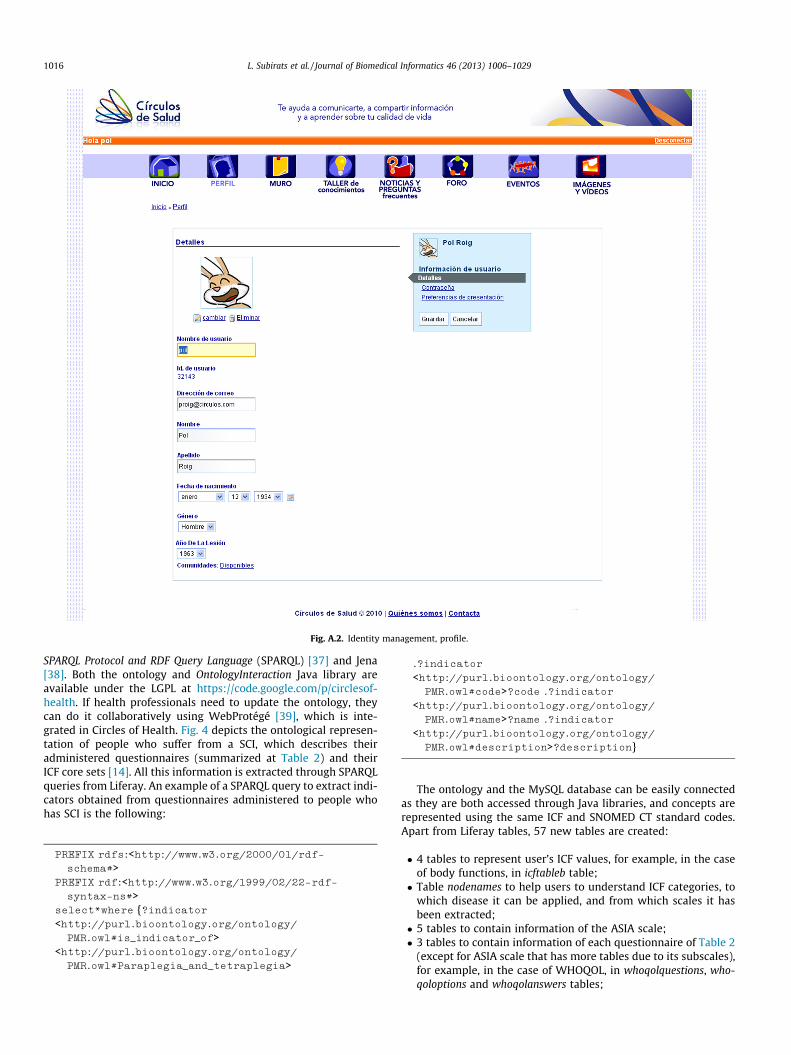
Fig. A.2. Identity management, profile.
1016 L. Subirats et al. / Journal of Biomedical Informatics 46 (2013) 1006–1029
SPARQL Protocol and RDF Query Language (SPARQL) [37] and Jena[38]. Both the ontology and OntologyInteraction Java library areavailable under the LGPL at https://code.google.com/p/circlesof-health. If health professionals need to update the ontology, theycan do it collaboratively using WebProtégé [39], which is inte-grated in Circles of Health. Fig. 4 depicts the ontological represen-tation of people who suffer from a SCI, which describes theiradministered questionnaires (summarized at Table 2) and theirICF core sets [14]. All this information is extracted through SPARQLqueries from Liferay. An example of a SPARQL query to extract indi-cators obtained from questionnaires administered to people whohas SCI is the following:
PREFIX rdfs:<http://www.w3.org/2000/01/rdf-schema#>
PREFIX rdf:<http://www.w3.org/1999/02/22-rdf-syntax-ns#>
select*where {?indicator<http://purl.bioontology.org/ontology/PMR.owl#is_indicator_of>
<http://purl.bioontology.org/ontology/PMR.owl#Paraplegia_and_tetraplegia>
.?indicator
<http://purl.bioontology.org/ontology/PMR.owl#code>?code .?indicator
<http://purl.bioontology.org/ontology/PMR.owl#name>?name .?indicator
<http://purl.bioontology.org/ontology/PMR.owl#description>?description}
The ontology and the MySQL database can be easily connectedas they are both accessed through Java libraries, and concepts arerepresented using the same ICF and SNOMED CT standard codes.Apart from Liferay tables, 57 new tables are created:
� 4 tables to represent user’s ICF values, for example, in the caseof body functions, in icftableb table;� Table nodenames to help users to understand ICF categories, to
which disease it can be applied, and from which scales it hasbeen extracted;� 5 tables to contain information of the ASIA scale;� 3 tables to contain information of each questionnaire of Table 2
(except for ASIA scale that has more tables due to its subscales),for example, in the case of WHOQOL, in whoqolquestions, who-qoloptions and whoqolanswers tables;
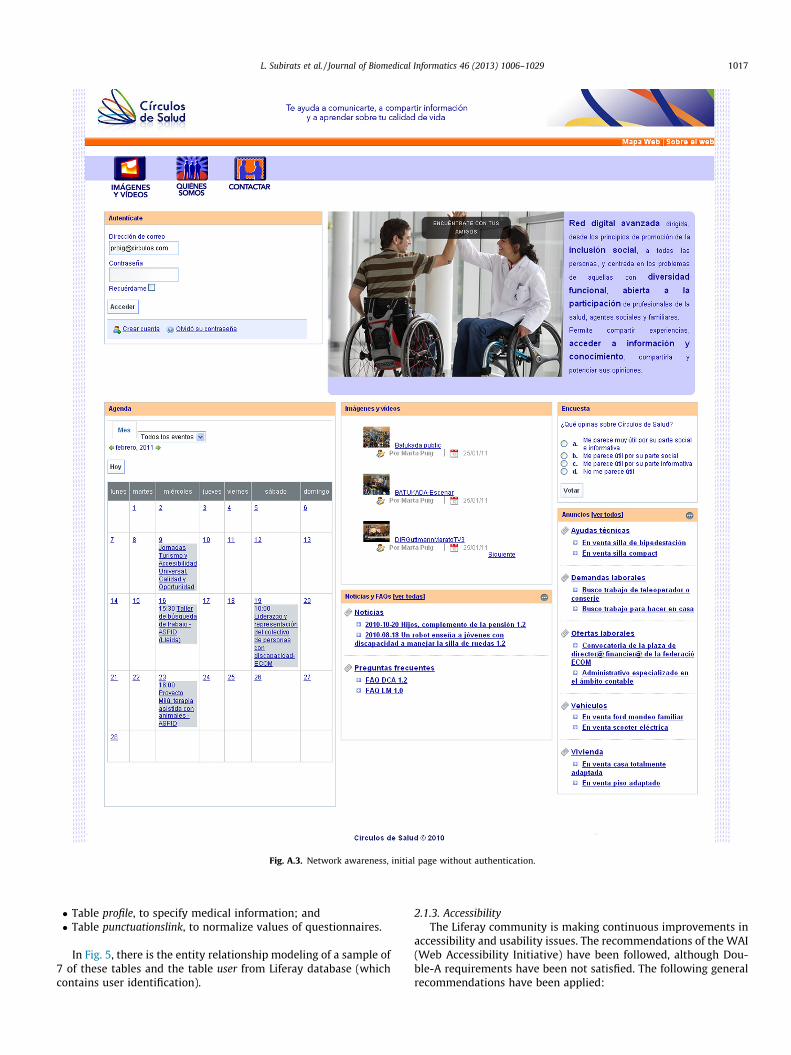
Fig. A.3. Network awareness, initial page without authentication.
L. Subirats et al. / Journal of Biomedical Informatics 46 (2013) 1006–1029 1017
� Table profile, to specify medical information; and� Table punctuationslink, to normalize values of questionnaires.
In Fig. 5, there is the entity relationship modeling of a sample of7 of these tables and the table user from Liferay database (whichcontains user identification).
2.1.3. AccessibilityThe Liferay community is making continuous improvements in
accessibility and usability issues. The recommendations of the WAI(Web Accessibility Initiative) have been followed, although Dou-ble-A requirements have been not satisfied. The following generalrecommendations have been applied:
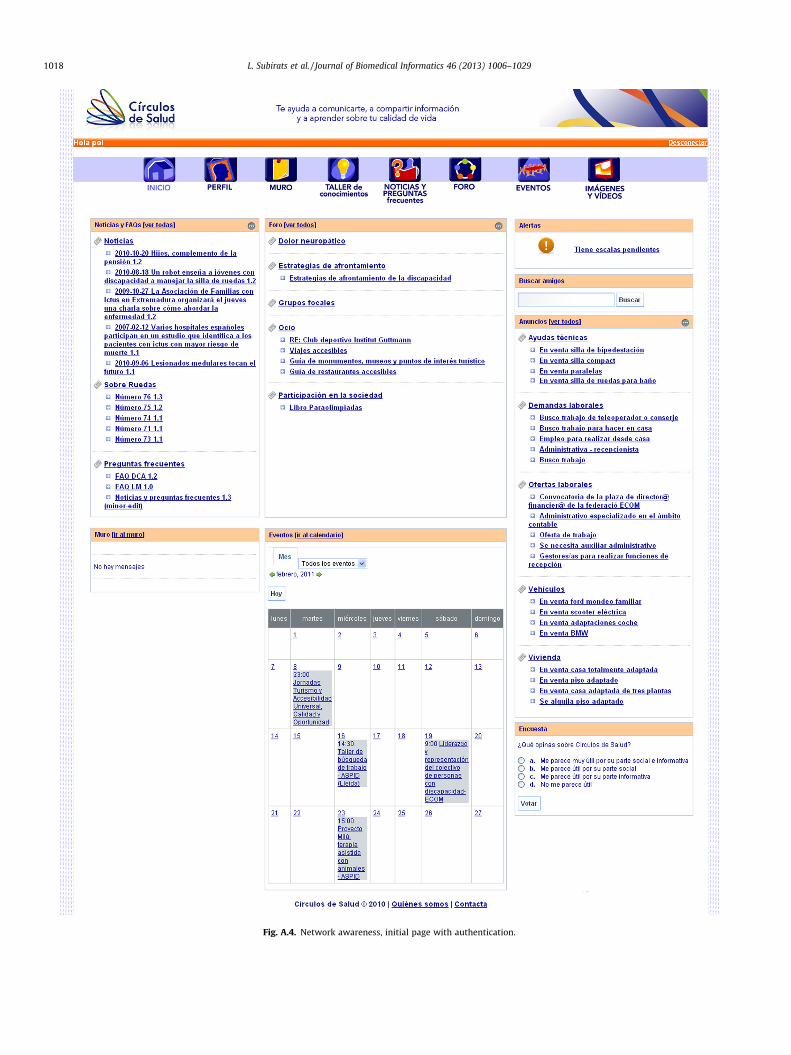
Fig. A.4. Network awareness, initial page with authentication.
1018 L. Subirats et al. / Journal of Biomedical Informatics 46 (2013) 1006–1029
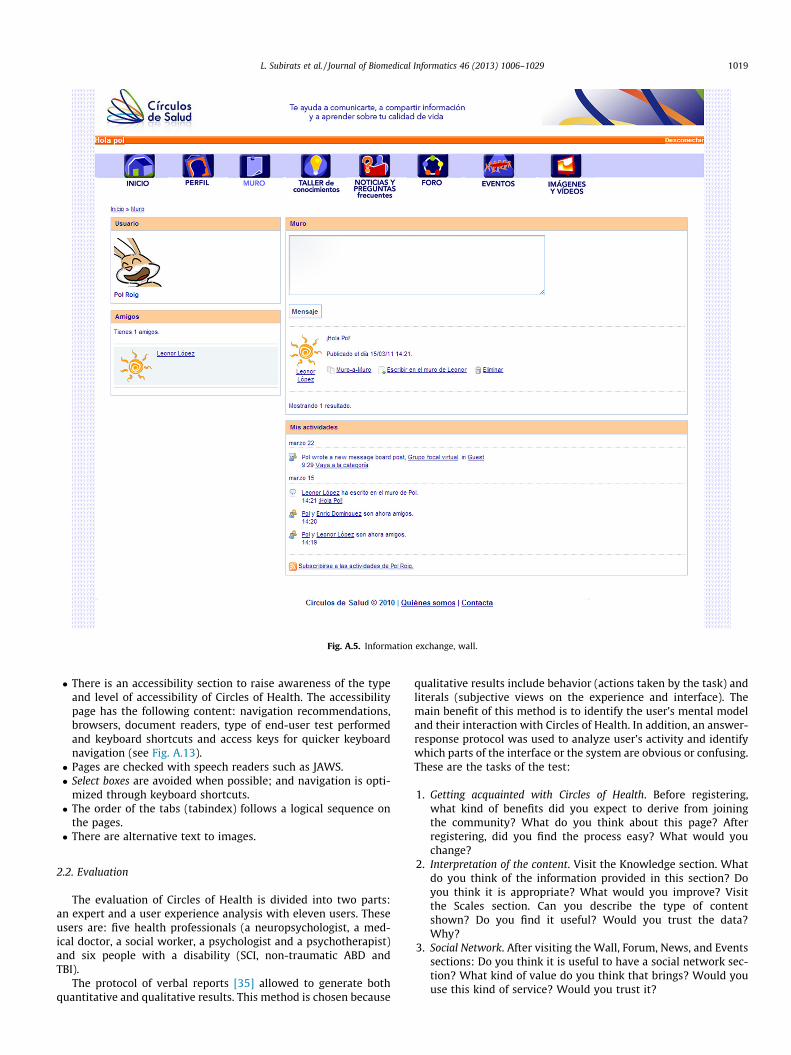
Fig. A.5. Information exchange, wall.
L. Subirats et al. / Journal of Biomedical Informatics 46 (2013) 1006–1029 1019
� There is an accessibility section to raise awareness of the typeand level of accessibility of Circles of Health. The accessibilitypage has the following content: navigation recommendations,browsers, document readers, type of end-user test performedand keyboard shortcuts and access keys for quicker keyboardnavigation (see Fig. A.13).� Pages are checked with speech readers such as JAWS.� Select boxes are avoided when possible; and navigation is opti-
mized through keyboard shortcuts.� The order of the tabs (tabindex) follows a logical sequence on
the pages.� There are alternative text to images.
2.2. Evaluation
The evaluation of Circles of Health is divided into two parts:an expert and a user experience analysis with eleven users. Theseusers are: five health professionals (a neuropsychologist, a med-ical doctor, a social worker, a psychologist and a psychotherapist)and six people with a disability (SCI, non-traumatic ABD andTBI).
The protocol of verbal reports [35] allowed to generate bothquantitative and qualitative results. This method is chosen because
qualitative results include behavior (actions taken by the task) andliterals (subjective views on the experience and interface). Themain benefit of this method is to identify the user’s mental modeland their interaction with Circles of Health. In addition, an answer-response protocol was used to analyze user’s activity and identifywhich parts of the interface or the system are obvious or confusing.These are the tasks of the test:
1. Getting acquainted with Circles of Health. Before registering,what kind of benefits did you expect to derive from joiningthe community? What do you think about this page? Afterregistering, did you find the process easy? What would youchange?
2. Interpretation of the content. Visit the Knowledge section. Whatdo you think of the information provided in this section? Doyou think it is appropriate? What would you improve? Visitthe Scales section. Can you describe the type of contentshown? Do you find it useful? Would you trust the data?Why?
3. Social Network. After visiting the Wall, Forum, News, and Eventssections: Do you think it is useful to have a social network sec-tion? What kind of value do you think that brings? Would youuse this kind of service? Would you trust it?
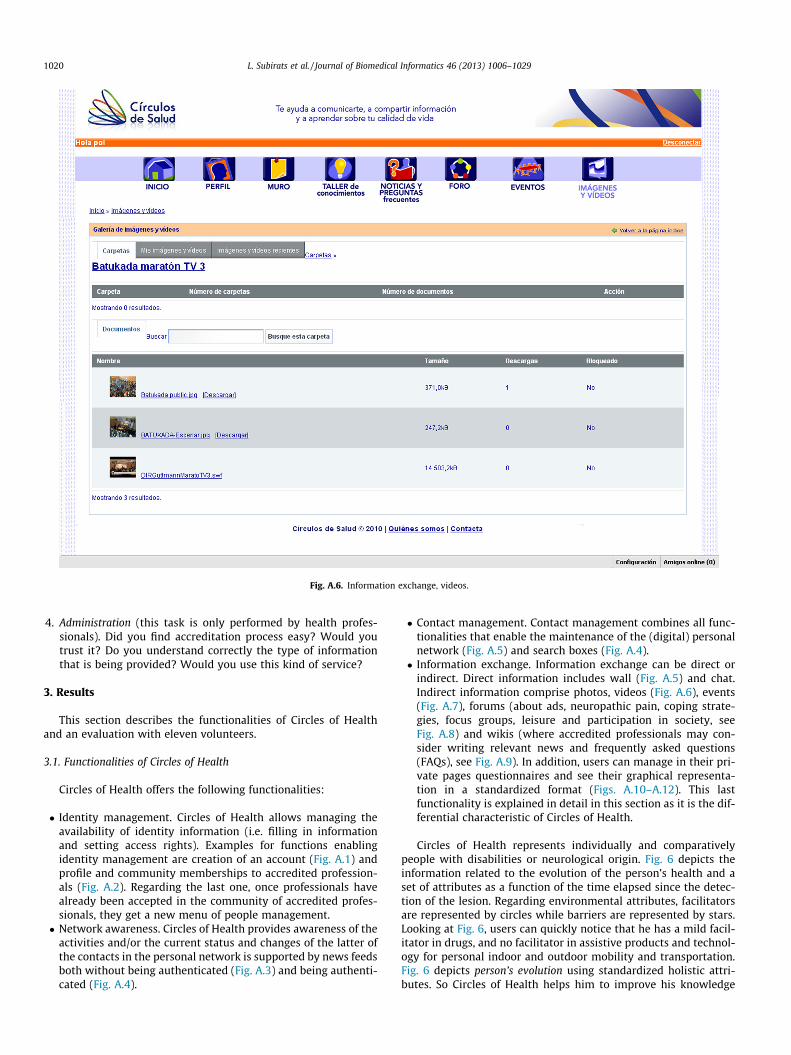
Fig. A.6. Information exchange, videos.
1020 L. Subirats et al. / Journal of Biomedical Informatics 46 (2013) 1006–1029
4. Administration (this task is only performed by health profes-sionals). Did you find accreditation process easy? Would youtrust it? Do you understand correctly the type of informationthat is being provided? Would you use this kind of service?
3. Results
This section describes the functionalities of Circles of Healthand an evaluation with eleven volunteers.
3.1. Functionalities of Circles of Health
Circles of Health offers the following functionalities:
� Identity management. Circles of Health allows managing theavailability of identity information (i.e. filling in informationand setting access rights). Examples for functions enablingidentity management are creation of an account (Fig. A.1) andprofile and community memberships to accredited profession-als (Fig. A.2). Regarding the last one, once professionals havealready been accepted in the community of accredited profes-sionals, they get a new menu of people management.� Network awareness. Circles of Health provides awareness of the
activities and/or the current status and changes of the latter ofthe contacts in the personal network is supported by news feedsboth without being authenticated (Fig. A.3) and being authenti-cated (Fig. A.4).
� Contact management. Contact management combines all func-tionalities that enable the maintenance of the (digital) personalnetwork (Fig. A.5) and search boxes (Fig. A.4).� Information exchange. Information exchange can be direct or
indirect. Direct information includes wall (Fig. A.5) and chat.Indirect information comprise photos, videos (Fig. A.6), events(Fig. A.7), forums (about ads, neuropathic pain, coping strate-gies, focus groups, leisure and participation in society, seeFig. A.8) and wikis (where accredited professionals may con-sider writing relevant news and frequently asked questions(FAQs), see Fig. A.9). In addition, users can manage in their pri-vate pages questionnaires and see their graphical representa-tion in a standardized format (Figs. A.10–A.12). This lastfunctionality is explained in detail in this section as it is the dif-ferential characteristic of Circles of Health.
Circles of Health represents individually and comparativelypeople with disabilities or neurological origin. Fig. 6 depicts theinformation related to the evolution of the person’s health and aset of attributes as a function of the time elapsed since the detec-tion of the lesion. Regarding environmental attributes, facilitatorsare represented by circles while barriers are represented by stars.Looking at Fig. 6, users can quickly notice that he has a mild facil-itator in drugs, and no facilitator in assistive products and technol-ogy for personal indoor and outdoor mobility and transportation.Fig. 6 depicts person’s evolution using standardized holistic attri-butes. So Circles of Health helps him to improve his knowledge
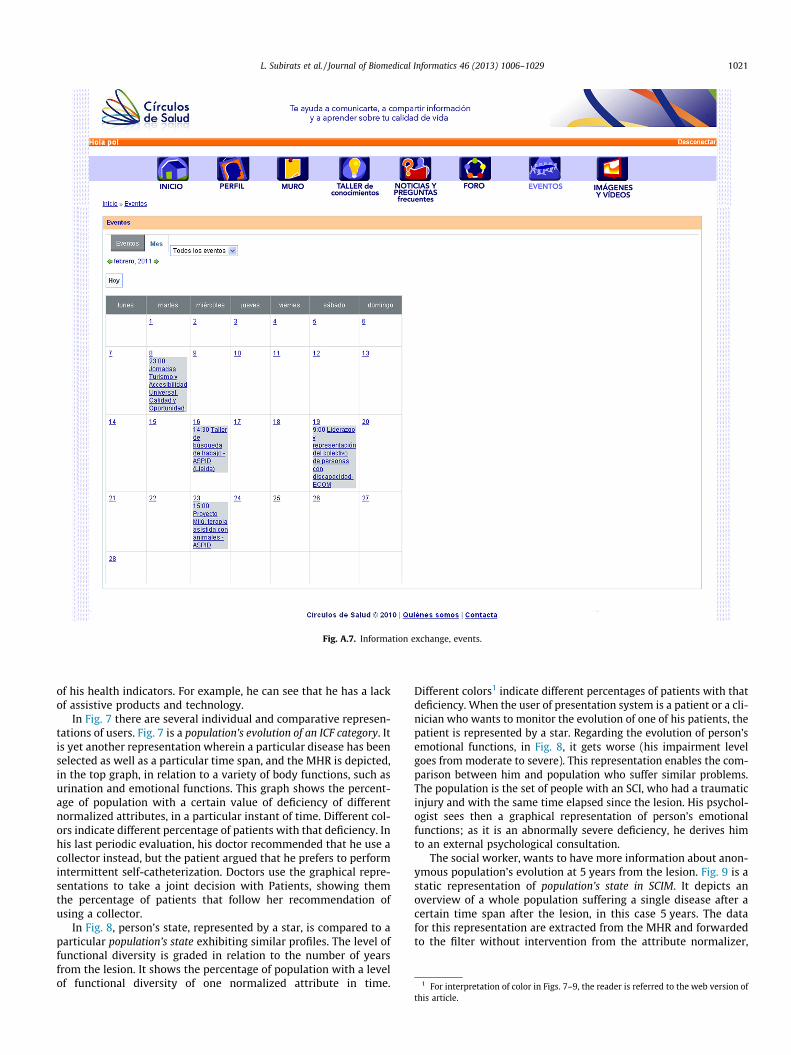
Fig. A.7. Information exchange, events.
1 For interpretation of color in Figs. 7–9, the reader is referred to the web version o
L. Subirats et al. / Journal of Biomedical Informatics 46 (2013) 1006–1029 1021
of his health indicators. For example, he can see that he has a lackof assistive products and technology.
In Fig. 7 there are several individual and comparative represen-tations of users. Fig. 7 is a population’s evolution of an ICF category. Itis yet another representation wherein a particular disease has beenselected as well as a particular time span, and the MHR is depicted,in the top graph, in relation to a variety of body functions, such asurination and emotional functions. This graph shows the percent-age of population with a certain value of deficiency of differentnormalized attributes, in a particular instant of time. Different col-ors indicate different percentage of patients with that deficiency. Inhis last periodic evaluation, his doctor recommended that he use acollector instead, but the patient argued that he prefers to performintermittent self-catheterization. Doctors use the graphical repre-sentations to take a joint decision with Patients, showing themthe percentage of patients that follow her recommendation ofusing a collector.
In Fig. 8, person’s state, represented by a star, is compared to aparticular population’s state exhibiting similar profiles. The level offunctional diversity is graded in relation to the number of yearsfrom the lesion. It shows the percentage of population with a levelof functional diversity of one normalized attribute in time.
Different colors1 indicate different percentages of patients with thatdeficiency. When the user of presentation system is a patient or a cli-nician who wants to monitor the evolution of one of his patients, thepatient is represented by a star. Regarding the evolution of person’semotional functions, in Fig. 8, it gets worse (his impairment levelgoes from moderate to severe). This representation enables the com-parison between him and population who suffer similar problems.The population is the set of people with an SCI, who had a traumaticinjury and with the same time elapsed since the lesion. His psychol-ogist sees then a graphical representation of person’s emotionalfunctions; as it is an abnormally severe deficiency, he derives himto an external psychological consultation.
The social worker, wants to have more information about anon-ymous population’s evolution at 5 years from the lesion. Fig. 9 is astatic representation of population’s state in SCIM. It depicts anoverview of a whole population suffering a single disease after acertain time span after the lesion, in this case 5 years. The datafor this representation are extracted from the MHR and forwardedto the filter without intervention from the attribute normalizer,
this article.
f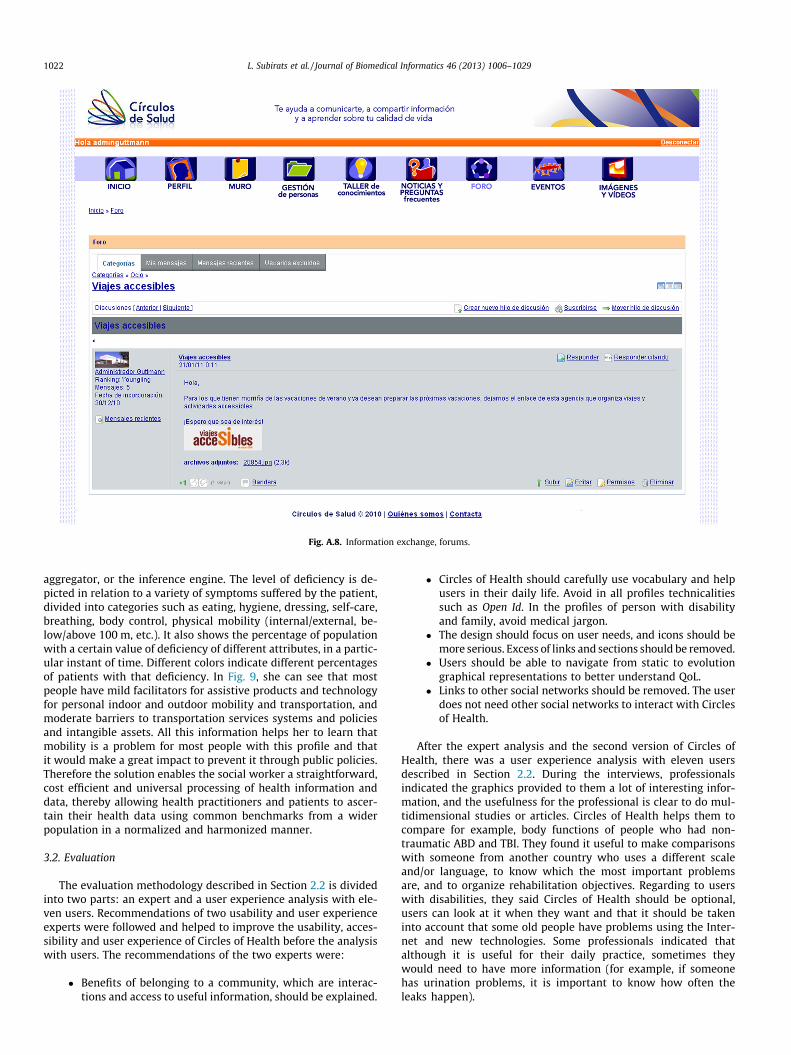
Fig. A.8. Information exchange, forums.
1022 L. Subirats et al. / Journal of Biomedical Informatics 46 (2013) 1006–1029
aggregator, or the inference engine. The level of deficiency is de-picted in relation to a variety of symptoms suffered by the patient,divided into categories such as eating, hygiene, dressing, self-care,breathing, body control, physical mobility (internal/external, be-low/above 100 m, etc.). It also shows the percentage of populationwith a certain value of deficiency of different attributes, in a partic-ular instant of time. Different colors indicate different percentagesof patients with that deficiency. In Fig. 9, she can see that mostpeople have mild facilitators for assistive products and technologyfor personal indoor and outdoor mobility and transportation, andmoderate barriers to transportation services systems and policiesand intangible assets. All this information helps her to learn thatmobility is a problem for most people with this profile and thatit would make a great impact to prevent it through public policies.Therefore the solution enables the social worker a straightforward,cost efficient and universal processing of health information anddata, thereby allowing health practitioners and patients to ascer-tain their health data using common benchmarks from a widerpopulation in a normalized and harmonized manner.
3.2. Evaluation
The evaluation methodology described in Section 2.2 is dividedinto two parts: an expert and a user experience analysis with ele-ven users. Recommendations of two usability and user experienceexperts were followed and helped to improve the usability, acces-sibility and user experience of Circles of Health before the analysiswith users. The recommendations of the two experts were:
� Benefits of belonging to a community, which are interac-tions and access to useful information, should be explained.
� Circles of Health should carefully use vocabulary and helpusers in their daily life. Avoid in all profiles technicalitiessuch as Open Id. In the profiles of person with disabilityand family, avoid medical jargon.
� The design should focus on user needs, and icons should bemore serious. Excess of links and sections should be removed.
� Users should be able to navigate from static to evolutiongraphical representations to better understand QoL.
� Links to other social networks should be removed. The userdoes not need other social networks to interact with Circlesof Health.
After the expert analysis and the second version of Circles ofHealth, there was a user experience analysis with eleven usersdescribed in Section 2.2. During the interviews, professionalsindicated the graphics provided to them a lot of interesting infor-mation, and the usefulness for the professional is clear to do mul-tidimensional studies or articles. Circles of Health helps them tocompare for example, body functions of people who had non-traumatic ABD and TBI. They found it useful to make comparisonswith someone from another country who uses a different scaleand/or language, to know which the most important problemsare, and to organize rehabilitation objectives. Regarding to userswith disabilities, they said Circles of Health should be optional,users can look at it when they want and that it should be takeninto account that some old people have problems using the Inter-net and new technologies. Some professionals indicated thatalthough it is useful for their daily practice, sometimes theywould need to have more information (for example, if someonehas urination problems, it is important to know how often theleaks happen).
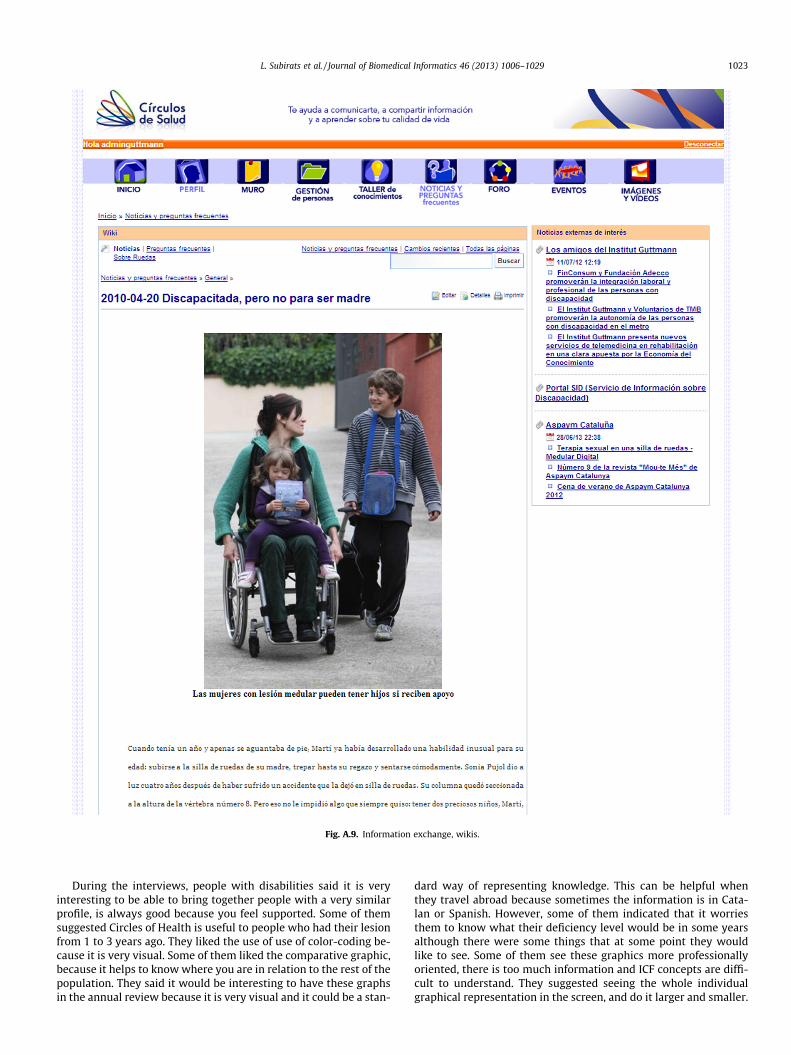
Fig. A.9. Information exchange, wikis.
L. Subirats et al. / Journal of Biomedical Informatics 46 (2013) 1006–1029 1023
During the interviews, people with disabilities said it is veryinteresting to be able to bring together people with a very similarprofile, is always good because you feel supported. Some of themsuggested Circles of Health is useful to people who had their lesionfrom 1 to 3 years ago. They liked the use of use of color-coding be-cause it is very visual. Some of them liked the comparative graphic,because it helps to know where you are in relation to the rest of thepopulation. They said it would be interesting to have these graphsin the annual review because it is very visual and it could be a stan-
dard way of representing knowledge. This can be helpful whenthey travel abroad because sometimes the information is in Cata-lan or Spanish. However, some of them indicated that it worriesthem to know what their deficiency level would be in some yearsalthough there were some things that at some point they wouldlike to see. Some of them see these graphics more professionallyoriented, there is too much information and ICF concepts are diffi-cult to understand. They suggested seeing the whole individualgraphical representation in the screen, and do it larger and smaller.
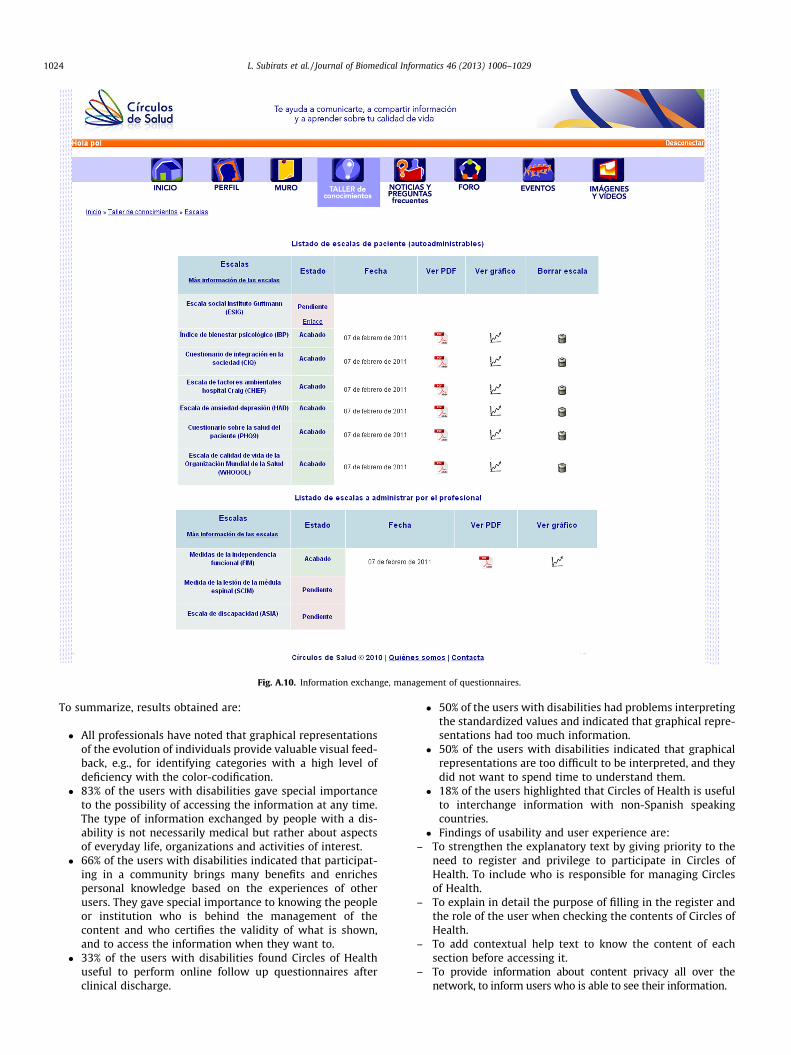
Fig. A.10. Information exchange, management of questionnaires.
1024 L. Subirats et al. / Journal of Biomedical Informatics 46 (2013) 1006–1029
To summarize, results obtained are:
� All professionals have noted that graphical representationsof the evolution of individuals provide valuable visual feed-back, e.g., for identifying categories with a high level ofdeficiency with the color-codification.
� 83% of the users with disabilities gave special importanceto the possibility of accessing the information at any time.The type of information exchanged by people with a dis-ability is not necessarily medical but rather about aspectsof everyday life, organizations and activities of interest.
� 66% of the users with disabilities indicated that participat-ing in a community brings many benefits and enrichespersonal knowledge based on the experiences of otherusers. They gave special importance to knowing the peopleor institution who is behind the management of thecontent and who certifies the validity of what is shown,and to access the information when they want to.
� 33% of the users with disabilities found Circles of Healthuseful to perform online follow up questionnaires afterclinical discharge.
� 50% of the users with disabilities had problems interpretingthe standardized values and indicated that graphical repre-sentations had too much information.
� 50% of the users with disabilities indicated that graphicalrepresentations are too difficult to be interpreted, and theydid not want to spend time to understand them.
� 18% of the users highlighted that Circles of Health is usefulto interchange information with non-Spanish speakingcountries.
� Findings of usability and user experience are:– To strengthen the explanatory text by giving priority to the
need to register and privilege to participate in Circles ofHealth. To include who is responsible for managing Circlesof Health.
– To explain in detail the purpose of filling in the register andthe role of the user when checking the contents of Circles ofHealth.
– To add contextual help text to know the content of eachsection before accessing it.
– To provide information about content privacy all over thenetwork, to inform users who is able to see their information.
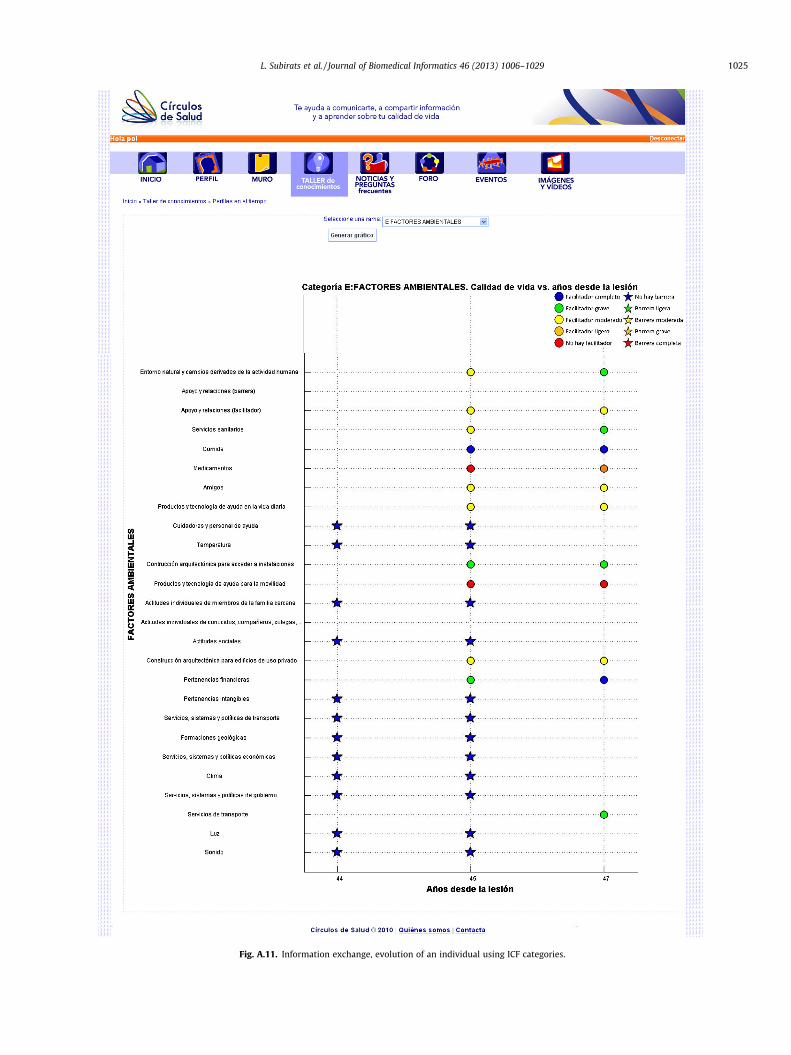
Fig. A.11. Information exchange, evolution of an individual using ICF categories.
L. Subirats et al. / Journal of Biomedical Informatics 46 (2013) 1006–1029 1025

Fig. A.12. Information exchange, evolution of a population using ICF categories.
1026 L. Subirats et al. / Journal of Biomedical Informatics 46 (2013) 1006–1029
– To review the format of Circles of Health with emphasis onadding the title in all sections and to add different colorsin the text.
Regarding efficiency, users were satisfied with time response ofCircles of Health when generating graphical representations, andintroducing and standardizing questionnaires. We show the re-sponse times of the integration of Matlab and Liferay in a X3430(2.39 GHz, 3.99 RAM) processor (see Table 4) was acceptable byusers.
4. Discussion
All professionals noted that graphical representations of theevolution of individuals provide valuable visual feedback. Theyalso highlighted Circles of Health integrates understanding ofhealth forming a comprehensive profile of an individual and popu-lation. Therefore, results indicate Circles of Health is useful to sup-port multicenter studies thanks to the use of standardizedknowledge.83% of users with disabilities gave special importance
to the possibility of accessing the information at any time, 66%indicated that participating in a community brings many benefitsand enriches personal knowledge based on the experiences ofother users, and 33% of people with disabilities indicated Circlesof Health is useful to perform online follow up questionnaires. Asa consequence, Circles of Health has potential to promote knowl-edge democratization, user empowerment and making decisionswith a more informed opinion.
However, 50% of users with disabilities remarked ICF categoriesobtained from PCEs provide too much information to people withdisabilities. In addition, 50% of them found some categories ofthe ICF standard difficult to understand. Therefore, it is recom-mended to limit the number of ICF categories for each user’s inter-face to no more than nine. The number nine was set due to humanlimits in the ability of processing information [46].
5. Future work
In the future, the usage of Circles of Health will be promoted atthe Institut Guttmann – Neurorehabilitation Hospital among patients
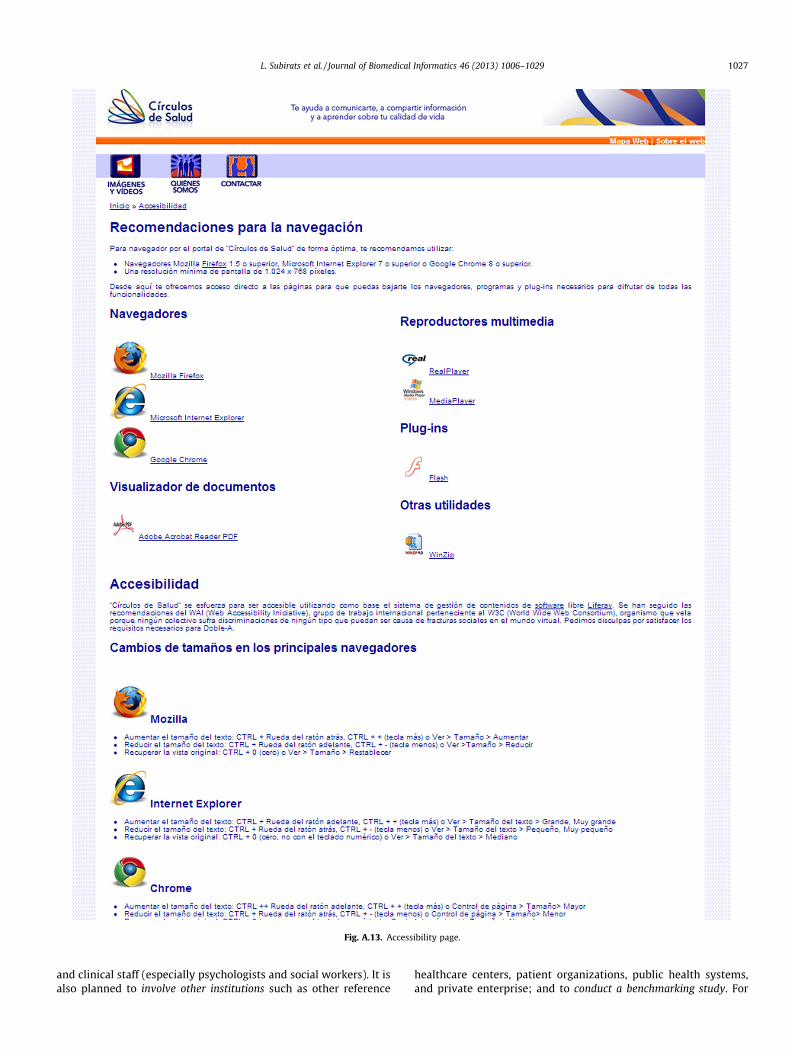
Fig. A.13. Accessibility page.
L. Subirats et al. / Journal of Biomedical Informatics 46 (2013) 1006–1029 1027
and clinical staff (especially psychologists and social workers). It isalso planned to involve other institutions such as other reference
healthcare centers, patient organizations, public health systems,and private enterprise; and to conduct a benchmarking study. For
1028 L. Subirats et al. / Journal of Biomedical Informatics 46 (2013) 1006–1029
that, information models, such as EN 13606 [44] or HL7 virtualmedical record (vMR) [45], may be incorporated in order to facili-tate information exchange among MHRs.
For future work, in order to improve usability and user experi-ence of Circles of Health, the number of ICF categories for eachuser’s interface should be reduced. In addition, as clinical decisionsupport systems (CDSSs) have gained momentum with the emer-gence of biomedical ontologies [42], the inclusion of prognosis ofsome categories into Circles of Health may help health profession-als to make decisions about changes in activities and environmen-tal factors. There is some work done in knowledge representationof prognosis [43] we plan to incorporate into Circles of Health.
As 18% of users highlighted, internationalization is also anopportunity for Circles of Health. Although at first glance it isoriented to Spanish speaking countries, it can be extended interna-tionally to other countries. This would be useful for governments,as it would allow get a general picture of disability and of the com-parison among different regions. In addition, it would allow thecreation of best practices and recommendations at the Europeanlevel, with direct impact on regional policies of inclusion, supportand assistance to dependence. Furthermore, this work can alsobe generalized to other types of disabilities or chronic conditions,the generalization to all people, and the work of internationaliza-tion described in previous sections. In addition, there are newopportunities for Circles of Health, as can be generalized to othertypes of disability. People with visual or hearing disabilities maybe users of Circles of Health if questionnaires of these groups areintroduced and translated to ICF. It would be interesting to gener-alize Circles of Health to the physical and cognitive domains,adapting the questionnaires and the information to the profile ofthe person.
6. Conclusions
We have presented a social-network platform called Circles ofHealth, focused on people with disability, open to the participationof people with disabilities, family members, health professionals,education and social services. Circles of Health uses a new method-ology which automatically collects, transforms, shares and graphi-cally represents standardized and multidimensional indicators.Circles of Health includes main aspects of a person’s life (develop-ment, participation, and environment) using the ICF instead of so-lely focusing on his or her diagnosis. Results indicate Circles ofHealth has great potential for users. Professionals found Circles ofHealth useful to generate new knowledge. People with disabilitiesfound helpful to enrich personal knowledge with the experiencesof other users and to perform online follow up questionnaires afterclinical discharge. As a consequence, Circles of Health has potentialto promote knowledge democratization, user empowerment andmaking decisions with a more informed opinion. For future work,it would be interesting to establish no more than nine ICF catego-ries for each user’s interface and to involve other institutions.
Acknowledgments
The authors thank all volunteers from Institut Guttmann thathave participated in this study for their cooperation. We also thankMs. Silvia Orte for her help in the development of Circles of Health.The research described in this paper arises from a Spanish researchproject called Circles of Health TSI-040200-2009-73 funded byCDTI under Avanza Ciudadanía Digital. This work is also partiallysupported by a Spanish research project called Rehabilita (Disrup-tive technologies for the rehabilitation of the future) CEN-2009-1043, which is funded by CDTI, under the CENIT program, in theframework of the Spanish government’s INGENIO 2010 initiative.
It is also partly supported by the Catalonia Competitiveness Agency(ACC1Ó).
Appendix A. Screenshots
See Figs. A.1–A.13.
References
[1] Sassi F. Calculating QALYs comparing QALY and DALY calculations. HealthPolicy Plan 2006;21(5):402–8.
[2] World Health Organization, International Classification of Diseases (ICD-10);2008. <http://apps.who.int/classifications/icd>.
[3] Traffic Service of the Interior Department of the Goverment of Catalonia.Accident and disability, some Figs. 2002. <http://guttmannazure.blob.core.windows.net/guttmann-publish/invar/b5ebb29b-5f8f-4066-8ad4-151ef84f0689>.
[4] Lupiáñez F, Mayer M, Torrens J. Opportunities and challenges of web 2.0 inhealthcare systems: an empirical exploration. Inform Health Soc Care2009;34:117–26.
[5] Edwards L, Krassioukov A, Fehlings M. Importance of access to researchinformation among individuals with spinal cord injury: results of anevidenced-based questionnaire. Spinal Cord 2002;40:529–35.
[6] Institut Guttmann, Qvidlab. Laboratorio de medidas potenciadoras de laautonomía, satisfacción personal y calidad de vida de las personas con lesiónmedular y daño cerebral: tres años de investigación en calidad de vida ydiscapacidad: memoria 2006/2008, Tech rep; 2009.
[7] E. Union, Ministerial declaration; 2006. <http://ec.europa.eu/information_society/events/ict_riga_2006/doc/declaration_riga.pdf>.
[8] Rector A, Nowlan W, Kay S. Foundations of an electronic medical record.Methods Inf Med 1991;30:179–86.
[9] World Health Organization, International Classification of Functioning,Disability and Health (ICF); 2011. <http://apps.who.int/classifications/icf>.
[10] College of American Pathologists and National Health Service, SystematizedNomenclature of Medicine Clinical Terms (SNOMED CT); 2011. <http://purl.bioontology.org/ontology/SNOMEDCT>.
[11] Laxe S, Tschiesner U, Zasler N, López-Blazquez R, Tormos JM, Bernabeu M.What domains of the international classification of functioning, disability andhealth are covered by the most commonly used measurement instruments intraumatic brain injury research? Clin Neurol Neurosurg 2012;114(6):645–50.
[12] Bernabeu M, Laxe S, López R, Stucki G, Ward A, Barnes M, et al. Developing coresets for persons with traumatic brain injury based on the internationalclassification of functioning, disability, and health. Neurorehabil Neural Repair2009;23:464–7.
[13] Coenen M. Developing a method to validate the who icf core sets from apatient perspective: rheumatoid arthritis as a case point. Dissertation.Humanbiologie an der Medizinischen Fakultät, Ludwig-Maximilians-Universität, Munchen.
[14] Bickenbach JE, Cieza A, Rauch A, Stucki G. ICF core sets. Manual for clinicalpractice. Hogrefe Publishing; 2012. <http://www.icf-casestudies.org>.
[15] Schalock R, Braddock D, Verdugo M. Handbook on quality of life for humanservices practitioners. American Association on Mental Retardation 2002.
[16] Mpofu E, Oakland T. Rehabilitation and health assessment: applying ICFguidelines. Springer Publishing Company; 2010.
[17] Mora O, Engelbrecht G, Bisbal J. A service-oriented distributed semanticmediator: integrating multiscale biomedical information. IEEE Trans InfTechnol Biomed 2012;16(6):1296–303.
[18] Langegger WWA, Blochl M. A semantic web middleware for virtual dataintegration on the web. Semantic Web: Res Appl 2008:493–507.
[19] Della Mea V, Simoncello A. An ontology-based exploration of the concepts andrelationships in the activities and participation component of the internationalclassification of functioning, disability and health. J Biomed Semantics2012;3(1).
[20] Charpentier M, Soulières M, Paroles de résidents. Rapport final de recherchesoumis au Ministère de la Santé et des Services sociaux du Québec etSecrétariat des aînés, Montréal, École de travail social, Université du Quévec aMontréal; 2006.
[21] Pesquita C, Faria D, Falcao A, Lord P, Couto F. Semantic similarity in biomedicalontologies. J PLoS Comput Biol 2009;5.
[22] Gibert K, García-Rudolph A, Curcoll L, Soler D, Pla L, Tormos JM. Knowledgediscovery about quality of life changes of spinal cord injury patients:clustering based on rules by states. In: Medical informatics Europe; 2009. p.579–83.
[23] Van De Belt TH, Engelen LJ, Berben SA, Schoonhoven L. Definition of health 2.0and medicine 2.0: a systematic review. J Med Internet Res 2010;12:e18.
[24] Eysenbach G. Medicine 2.0: social networking, collaboration, participation,apomediation, and openness. J Med Internet Res 2008;10:e22.
[25] Wicks P, Massagli M, Frost J, Brownstein C, Okun S, Vaughan T, et al. Sharinghealth data for better outcomes on patientslikeme. J Med Internet Res2010;12:e19.
[26] Frost J, Okun S, Vaughan T, Heywood J, Wicks P. Patient-reported outcomes asa source of evidence in off-label prescribing: analysis of data frompatientslikeme. J Med Internet Res 2011;13:e6.
L. Subirats et al. / Journal of Biomedical Informatics 46 (2013) 1006–1029 1029
[27] Fernandez-Luque L, Elahi N, Grajales III F. An analysis of personal medicalinformation disclosed in youtube videos created by patients with multiplesclerosis. Stud Health Technol Inform 2009;150:292–6.
[28] Armayones M, Hernandez-Encuentra E, Gomez-Zuniga B, Guillamon N,Ontiveros G, Bosque A, et al. Aptic: a social network to improve the qualityof life of members of patients associations. Orphanet J Rare Dis 2010;5(27).
[29] Im too young for this foundation. Stupid cancer; 2012. <http://stupidcancer.com/>.
[30] Grau I, Gene-Badia J, Bernardo M, Semir M, Grajales III F. New patientinteraction formulas in spanish and catalan: a case for forumclinic. In: Medicalinformatics Europe; 2009.
[31] Vivu, your health network; 2012. <http://vivu.es>.[32] Microsoft. Healthvault: a platform for connected health information and
innovation; 2012. <http://msdn.microsoft.com/en-gb/healthvault/jj128027>.[33] Cieza A, Brockow T, Ewert T, Amman E, Kollerits B, Chatterji S, et al. Linking
health-status measurements to the international classification of functioning,disability and health. J Rehabil Med 2002;34:205–10.
[34] Cieza A, Geyh S, Chatterji S, Kostanjsek N, Üstün B, Stucki G. ICF linking rules:an update based on lessons learned. J Rehabil Med 2005;37:205–10.
[35] Ericsson K, Simon H. Verbal reports as data. Psychol Rev 1980;87(3):215–51.[36] Ceccaroni L, Subirats L. Interoperable knowledge representation in clinical
decision support systems for rehabilitation. Int J Appl Comput Math2012;11(2):303–16.
[37] PrudHommeaux E, Seaborne A. SPARQL query language for RDF. Tech rep.World Wide Web Consortium; 2008.
[38] McBride B. Jena: a semantic web toolkit. IEEE Internet Comput 2002;6:55–9.
[39] Tudorache T, Nyulas CI, Noy NF, Musen MA. WebProtg: a collaborativeontology editor and knowledge acquisition tool for the web. Semantic WebJournal. IOS Press; 2011.
[40] Liferay. Open source CMS; 2012. <http://www.liferay.com>.[41] Miralles F, Ceccaroni L, Subirats L, Tormos J, Gil-Origuen A, Lopez-Blazquez R,
et al. System and method for extracting and monitoring multidimensionalattributes regarding personal health status and evolution. Patent applicationPCT/EP2011/074267, WO/2013/097905.
[42] Rodríguez-González A, LabraGayo J, Colomo-Palacios R, Mayer M, Gómez-Berbís J, García-Crespo A. Sedelo: using semantics and description logics tosupport aided clinical diagnosis. J Med Syst 2012;36:2471–81.
[43] Subirats L, Ceccaroni L, Miralles F. Knowledge representation for prognosis ofhealth status in rehabilitation. Future Internet 2012;4(3):762–75.
[44] Martínez-Costa C, Menárguez-Tortosa M, Fernández-Breis JT, Maldonado JA. Amodel-driven approach for representing clinical archetypes for semantic webenvironments. J Biomed Inform 42(1):150–64.
[45] HL7VMR Project Team. Virtual medical record (vMR) for clinical decisionsupport domain analysis model; 2011. <http://wiki.hl7.org/index.php?title=Virtual_Medical_Record_(vMR)>.
[46] Miller GA. The magical number seven, plus or minus two: Some limits on ourcapacity for processing information. Psychol Rev 1956;63(2):8197.