Chloroplast DNA variation of oaks in western Central Europe and genetic consequences of human...
20
Chloroplast DNA variation of oaks in western Central Europe and genetic consequences of human influences A.O. Ko ¨nig a,* , B. Ziegenhagen a , B.C. van Dam b , U.M. Csaikl c , E. Coart d , B. Degen a,e , K. Burg c , S.M.G. de Vries b , R.J. Petit a,f a Bundesforschungsanstalt fu ¨r Forst- und Holzwirtschaft (BFH), Institut fu ¨r Forstgenetik und Forstpflanzenzu ¨chtung, Sieker Landstrasse 2, D-22927 Grosshansdorf, Germany b ALTERRA, Green World Research, Wageningen, The Netherlands c O ¨ sterreichisches Forschungszentrum Seibersdorf (ARCS), Seibersdorf, Austria d Department of Plant Genetics and Breeding, CLO-Gent, Merelbeke, Belgium e Station de Recherches Forestie `res Guyane, INRA, Kourou, French Guyana, France f Laboratoire de Ge ´ne ´tique et d’Ame ´lioration des Arbres Forestiers, INRA, Pierroton, France Abstract Oak chloroplast DNA (cpDNA) variation was studied in a grid-based inventory in western Central Europe, including Belgium, The Netherlands, Luxembourg, Germany, the Czech Republic, and the northern parts of Upper and Lower Austria. A total of 2155 trees representing 426 populations of Quercus robur L. and Q. petraea (Matt.) Liebl. were screened for polymorphism in up to four PCR-amplified cpDNA fragments. Eleven haplotypes belonging to four lineages were detected; these lineages were formerly restricted to glacial refugia in the Iberian Peninsula, the Apennine Peninsula and the Balkan Peninsula. The haplotypes originating from the Apennines are particularly well represented in the study region, but there is also a significant contribution from the other refugia, which explain the high overall level of cpDNA diversity. The strong human impact in western Central Europe during the past centuries, which has resulted in the clearance of most forests, was followed by reforestation, sometimes involving seed transfers. Despite this strong human impact, broad geographic patterns of lineages and haplotypes could still be detected. To evaluate further the consequences of the former human activities on the present day oak cpDNA genetic structure, four regions where increasingly strong human impact was anticipated (ranging from hilly regions in southern Germany to roadsides plantations in The Netherlands) were selected. There, a comparison of the levels of intrapopulation cpDNA diversity and spatial structuring was made. Over the whole area, within stand diversity was significantly higher in Q. robur than in Q. petraea (h S ¼ 0:24 vs. 0.16). Since total diversity is identical for both species, this results in a significantly lower level of fixation for Q. robur than for Q. petraea (G ST ¼ 0:68 vs. 0.79). The analyses also reveal a decrease of fixation with increasing human impact on oak populations. The Dutch roadside plantations (Q. robur) exhibit a very low level of fixation ðG ST ¼ 0:28Þ as compared to Q. petraea in southern Germany ðG ST ¼ 0:91Þ . The significance of the spatial genetic structure was tested using geostatistical methods. For the complete data set, a strong spatial genetic structure is confirmed, with higher than average genetic similarities between populations distant from up to 270 km, whereas there is no spatial structure in the roadside plantations in The Netherlands or in the northern German lowlands. These results should help to differentiate introduced from autochthonous populations, and provide a framework for the identification of the geographic origin of seed lots. # 2002 Elsevier Science B.V. All rights reserved. Keywords: Q. robur; Q. petraea; PCR–RFLPs; Haplotypes; Spatial genetic patterns; Genetic differentiation; Deforestation; Seed transfer Forest Ecology and Management 156 (2002) 147–166 * Corresponding author. Tel.: þ49-4102-696147; fax: þ49-4102-696200. E-mail address: [email protected] (A.O. Ko ¨nig). 0378-1127/02/$ – see front matter # 2002 Elsevier Science B.V. All rights reserved. PII:S0378-1127(01)00640-5
-
Upload
independent -
Category
Documents
-
view
4 -
download
0
Transcript of Chloroplast DNA variation of oaks in western Central Europe and genetic consequences of human...

Chloroplast DNA variation of oaks in western Central Europeand genetic consequences of human influences
A.O. Koniga,*, B. Ziegenhagena, B.C. van Damb, U.M. Csaiklc, E. Coartd,B. Degena,e, K. Burgc, S.M.G. de Vriesb, R.J. Petita,f
aBundesforschungsanstalt fur Forst- und Holzwirtschaft (BFH), Institut fur Forstgenetik und Forstpflanzenzuchtung, Sieker Landstrasse 2,
D-22927 Grosshansdorf, GermanybALTERRA, Green World Research, Wageningen, The Netherlands
cOsterreichisches Forschungszentrum Seibersdorf (ARCS), Seibersdorf, AustriadDepartment of Plant Genetics and Breeding, CLO-Gent, Merelbeke, Belgium
eStation de Recherches Forestieres Guyane, INRA, Kourou, French Guyana, FrancefLaboratoire de Genetique et d’Amelioration des Arbres Forestiers, INRA, Pierroton, France
Abstract
Oak chloroplast DNA (cpDNA) variation was studied in a grid-based inventory in western Central Europe, including
Belgium, The Netherlands, Luxembourg, Germany, the Czech Republic, and the northern parts of Upper and Lower Austria. A
total of 2155 trees representing 426 populations of Quercus robur L. and Q. petraea (Matt.) Liebl. were screened for
polymorphism in up to four PCR-amplified cpDNA fragments. Eleven haplotypes belonging to four lineages were detected;
these lineages were formerly restricted to glacial refugia in the Iberian Peninsula, the Apennine Peninsula and the Balkan
Peninsula. The haplotypes originating from the Apennines are particularly well represented in the study region, but there is
also a significant contribution from the other refugia, which explain the high overall level of cpDNA diversity. The strong
human impact in western Central Europe during the past centuries, which has resulted in the clearance of most forests, was
followed by reforestation, sometimes involving seed transfers. Despite this strong human impact, broad geographic patterns of
lineages and haplotypes could still be detected. To evaluate further the consequences of the former human activities on the
present day oak cpDNA genetic structure, four regions where increasingly strong human impact was anticipated (ranging from
hilly regions in southern Germany to roadsides plantations in The Netherlands) were selected. There, a comparison of the
levels of intrapopulation cpDNA diversity and spatial structuring was made. Over the whole area, within stand diversity was
significantly higher in Q. robur than in Q. petraea (hS ¼ 0:24 vs. 0.16). Since total diversity is identical for both species, this
results in a significantly lower level of fixation for Q. robur than for Q. petraea (GST ¼ 0:68 vs. 0.79). The analyses also reveal
a decrease of fixation with increasing human impact on oak populations. The Dutch roadside plantations (Q. robur) exhibit a
very low level of fixation ðGST ¼ 0:28Þ as compared to Q. petraea in southern Germany ðGST ¼ 0:91Þ. The significance of the
spatial genetic structure was tested using geostatistical methods. For the complete data set, a strong spatial genetic structure is
confirmed, with higher than average genetic similarities between populations distant from up to 270 km, whereas there is no
spatial structure in the roadside plantations in The Netherlands or in the northern German lowlands. These results should help
to differentiate introduced from autochthonous populations, and provide a framework for the identification of the geographic
origin of seed lots. # 2002 Elsevier Science B.V. All rights reserved.
Keywords: Q. robur; Q. petraea; PCR–RFLPs; Haplotypes; Spatial genetic patterns; Genetic differentiation; Deforestation; Seed transfer
Forest Ecology and Management 156 (2002) 147–166
* Corresponding author. Tel.: þ49-4102-696147; fax: þ49-4102-696200.
E-mail address: [email protected] (A.O. Konig).
0378-1127/02/$ – see front matter # 2002 Elsevier Science B.V. All rights reserved.
PII: S 0 3 7 8 - 1 1 2 7 ( 0 1 ) 0 0 6 4 0 - 5
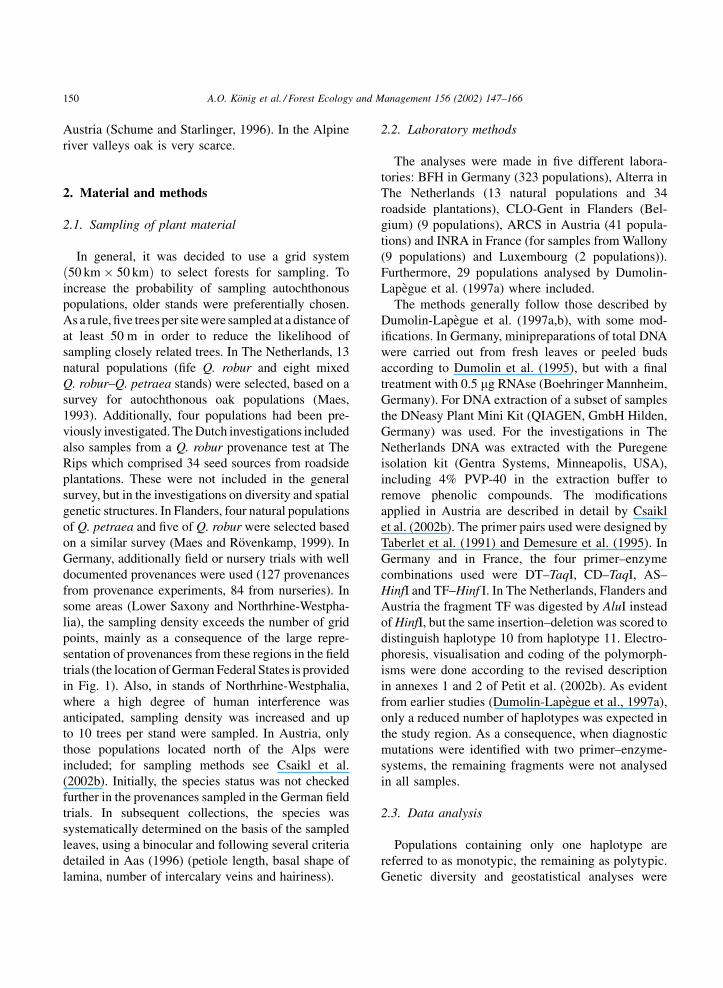
1. Introduction
The distribution of tree species in Europe during the
last ice-age has been classically studied by mapping
pollen frequencies obtained from sediment cores
taken in peat bogs or lakes (e.g., Firbas, 1949; Huntley
and Birks, 1983). Due to low temperatures and aridity
during the ice-age, many trees could only survive in
limited areas in the Mediterranean region, so-called
refugia, where a favourable climate existed. Oaks, in
particular, were confined to three main refugia in
the Iberian Peninsula, the Apennine Peninsula and
the Balkan Peninsula, from where re-colonisation
took place (Huntley and Birks, 1983; Brewer et al.,
2001).
Several investigations have also demonstrated the
value of molecular genetic markers for the identifica-
tion of post-glacial colonisation routes of oaks in
Europe. In many countries in Europe, marked regional
geographic patterns based on chloroplast DNA
(cpDNA) polymorphisms, with a single haplotype
or a mixture of related haplotypes predominating over
large areas, have been described (e.g., Ferris et al.,
1993; Petit et al., 1993, 2002a; Dumolin-Lapegue
et al., 1997a, 1998; Cottrell et al., 2002; Olalde et al.,
2002). On the other hand, in Central Europe, multiple
colonisation from different refugia may have resulted
in a mixture of haplotypes belonging to different
lineages due to the geographic situation not far away
from the Iberian Peninsula, the Apennines and the
Balkans. In addition, a particularly strong human
impact on oak forests may have further blurred the
original genetic structure in this region.
The objective of this study is, therefore, to analyse
cpDNA variation in Q. robur L. and Q. petraea (Matt.)
Liebl. in western Central Europe including Belgium,
Luxembourg, The Netherlands, Germany, the Czech
Republic and parts of Austria, in order to try to
reconstruct the post-glacial history of oaks, to identify
the original re-migration routes and to evaluate the
influence of human activities on the cpDNA structure
within and among populations. This study greatly
extends previous preliminary investigations in the
region (Dumolin-Lapegue et al., 1997a; Konig et al.,
1998).
Today’s cultural landscape is the result of human
impact upon natural ecosystems. The area of native
oak stands has been reduced considerably in the region
studied, either as a consequence of deforestation, or
through the transformation of former broadleaved
forests into conifer forests. In addition, artificial seed
transfers may have directly influenced the genetic
structure of oak forests. For conservation purposes,
and in order to achieve a sustainable management of
forest genetic resources, it is necessary to distinguish
between autochthonous and allochthonous popula-
tions. Until recently, the origin of planted forests could
only be traced back on the basis of historic
documentation but the advent of cpDNA techniques
may help to distinguish allochthonous from auto-
chthonous populations. To check this, spatial cpDNA
variation in several smaller regions characterised by
increasing degrees of human impact has been studied.
In order to identify these regions, a review of the
history of human activities in forests since the post-
glacial in Central Europe is provided. It relies largely
on the work of Firbas (1949), Krahl-Urban (1959) and
Hasel (1985), as well as the more recent study of
Kuster (1998). It is followed by a description of the
importance of oaks in the countries investigated, as
well as by some preliminary indications on their
degree of autochthony, thus providing a basis for the
cpDNA investigations.
1.1. Overview of forest history in the study region
Optimal growing conditions for oaks prevailed
between 7500 and 4500 before present (BP), given the
higher temperatures present at that time. Mixed oak
forests were the prevailing vegetation type in the
lowlands between Lake Constance and the Harz
Mountains as well as in the northern and eastern
moraine landscape. Subsequently, the climate became
more humid and colder, and oaks became confined to
the slopes of the drier hills. Many mixed oak forests
were replaced by beech, fir or spruce at higher
elevations. This process was more pronounced in
western Germany than in eastern Germany, where the
sites are frequently drier and poorer. This natural
evolution is considered to have come to an end
between about 2500 and 1500 BP (Hasel, 1985).
Prior to the Neolithic (7000–4000 BP), it is unlikely
that man had a significant impact on the oak woods.
Then during this period, some forests growing on
stoneless loess soils in the lowlands were converted
into cultivated land. The natural openings in the light
148 A.O. Konig et al. / Forest Ecology and Management 156 (2002) 147–166

oak forests were enlarged by cutting small trees and
by removing emerging seedlings. The remaining oaks,
however, provided an abundant supply of acorns for
consumption by humans and domestic animals. Man
would have started to make a significant impact during
the Bronze and Iron Ages when oak was required for
mining as pit timber, as a source of charcoal for use in
smelteries, or for the production of salt.
Additional oak forests were cut during Roman times
when woods located along the Rhine and the Mosel
rivers were cleared to release land for vineyards and
orchards. The clearing continued during the Middle
Ages to provide agricultural land and areas to settle.
At that time it was begun to float wood on the rivers
Rhine, Weser, Elbe and Oder from the forests in the
south of Central Europe to the wood-demanding cities
in the north. Oak was used for building houses,
windmills, ships and harbours. Demand for oak was
particularly high in the 17th and 18th centuries when
intensive deforestation occurred, boosted by the
development of the glass factories and the salines.
By the end of the 18th century, large areas west of the
river Weser had been converted to heathland, and only
a few isolated regions remained wooded. Similarly, in
The Netherlands, woodland covered only 1% of the
country 150 years ago (de Vries, 1998a).
These large clearances resulted in a scarcity of wood.
The wooded areas were too small to act as a source
of regeneration for the large unwooded expanses, and
artificial restoration techniques of forests had to be
developed. Seeding and planting had been used since
the 14th and 15th centuries (Hasel, 1985). Oaks were
used for planting because of their importance as seed
and timber trees. Planting of oak in coppice forests is
probably the oldest method of artificial forest regen-
eration. The oldest record of this practice is from the
region of Dortmund in 1343 and there are several
records in subsequent centuries as well. In the 16th
century, the forest regulations contained advice on how
to carry out broadleaf seeding. In Prussia, a regulation
from 1680 demands that each man has to plant six oaks
before he gets married. Later, users of oak wood were
obliged to participate in reforestation work, even
though these constraints were probably not very
effective in the restoration of the devastated forests.
Sowing of coniferous species such as pine, spruce and
fir proved much more successfully and considerably
changed the aspect of the landscape and the original
composition of forests. In former broadleaf forest
areas, such as the upper Rhine plane, pine replaced oak
as the main timber species.
1.2. Present importance and status of oaks
in the countries investigated
In Belgium, the total forest cover is approximately
600,000 ha, mainly concentrated in the southern
region. There are 83,500 ha (18%) of oak forests in
Wallony (both Q. robur and Q. petraea) and only
17,200 ha (8%) in Flanders (Jacques and de Cuyper,
1998). In Flanders, native populations are rare, but
some (putative) autochthonous Q. petraea populations
are recorded in the eastern region. In The Netherlands,
oaks are dominant in 60,000 ha, i.e. 16% of the total
forest area (¼11%). Most of these forests are pure
planted Q. robur stands. In addition, about 25% of line
and roadside plantations are established with oak (de
Vries, 1998b). In general, natural populations of oaks
are very rare in The Netherlands (Maes, 1993) and
even those that are described as native may be
intermixed with introduced material. In Luxembourg,
the total forest area is about 90,000 ha (33% of the
territory), including 28% of oaks (Wagner et al.,
1998).
In Germany, the proportion of oak amounts to 8.5%
of the total forest area of 10.7 million hectares (BML,
1994). The main oak species are Q. robur and Q.
petraea (Rohrig, 1980), but Q. pubescens also occurs
on warm and dry sites in southwestern Germany. The
western part of Germany is especially rich in oaks, the
foothills of the Alps and all other regions of higher
elevations in Germany have few oaks (Krahl-Urban,
1959). The presence of native and introduced oak
populations in Germany is likely to be heterogeneous.
In the Czech Republic, forest covers 2.63 million ha,
corresponding to 33% of the national territory (Hynek,
1998). As in other Central European countries, oak is
now underrepresented, covering only 6%, compared
with an estimate of about 18% some centuries ago.
Austria is the most densely forested country (46%) of
the studied region (BMLF, 1995), but oak represents
only 2.3% of standing timber volume (Schadauer,
1994). The majority of oaks are situated in south-
eastern and northeastern Austria and in the region
north of the Alps, especially in the Danube valley
where oaks represent up to 25% of the forest in east
A.O. Konig et al. / Forest Ecology and Management 156 (2002) 147–166 149
Austria (Schume and Starlinger, 1996). In the Alpine
river valleys oak is very scarce.
2. Material and methods
2.1. Sampling of plant material
In general, it was decided to use a grid system
ð50 km � 50 kmÞ to select forests for sampling. To
increase the probability of sampling autochthonous
populations, older stands were preferentially chosen.
As a rule, five trees per site were sampled at a distance of
at least 50 m in order to reduce the likelihood of
sampling closely related trees. In The Netherlands, 13
natural populations (fife Q. robur and eight mixed
Q. robur–Q. petraea stands) were selected, based on a
survey for autochthonous oak populations (Maes,
1993). Additionally, four populations had been pre-
viously investigated. The Dutch investigations included
also samples from a Q. robur provenance test at The
Rips which comprised 34 seed sources from roadside
plantations. These were not included in the general
survey, but in the investigations on diversity and spatial
genetic structures. In Flanders, four natural populations
of Q. petraea and five of Q. robur were selected based
on a similar survey (Maes and Rovenkamp, 1999). In
Germany, additionally field or nursery trials with well
documented provenances were used (127 provenances
from provenance experiments, 84 from nurseries). In
some areas (Lower Saxony and Northrhine-Westpha-
lia), the sampling density exceeds the number of grid
points, mainly as a consequence of the large repre-
sentation of provenances from these regions in the field
trials (the location of German Federal States is provided
in Fig. 1). Also, in stands of Northrhine-Westphalia,
where a high degree of human interference was
anticipated, sampling density was increased and up
to 10 trees per stand were sampled. In Austria, only
those populations located north of the Alps were
included; for sampling methods see Csaikl et al.
(2002b). Initially, the species status was not checked
further in the provenances sampled in the German field
trials. In subsequent collections, the species was
systematically determined on the basis of the sampled
leaves, using a binocular and following several criteria
detailed in Aas (1996) (petiole length, basal shape of
lamina, number of intercalary veins and hairiness).
2.2. Laboratory methods
The analyses were made in five different labora-
tories: BFH in Germany (323 populations), Alterra in
The Netherlands (13 natural populations and 34
roadside plantations), CLO-Gent in Flanders (Bel-
gium) (9 populations), ARCS in Austria (41 popula-
tions) and INRA in France (for samples from Wallony
(9 populations) and Luxembourg (2 populations)).
Furthermore, 29 populations analysed by Dumolin-
Lapegue et al. (1997a) where included.
The methods generally follow those described by
Dumolin-Lapegue et al. (1997a,b), with some mod-
ifications. In Germany, minipreparations of total DNA
were carried out from fresh leaves or peeled buds
according to Dumolin et al. (1995), but with a final
treatment with 0.5 mg RNAse (Boehringer Mannheim,
Germany). For DNA extraction of a subset of samples
the DNeasy Plant Mini Kit (QIAGEN, GmbH Hilden,
Germany) was used. For the investigations in The
Netherlands DNA was extracted with the Puregene
isolation kit (Gentra Systems, Minneapolis, USA),
including 4% PVP-40 in the extraction buffer to
remove phenolic compounds. The modifications
applied in Austria are described in detail by Csaikl
et al. (2002b). The primer pairs used were designed by
Taberlet et al. (1991) and Demesure et al. (1995). In
Germany and in France, the four primer–enzyme
combinations used were DT–TaqI, CD–TaqI, AS–
HinfI and TF–Hinf I. In The Netherlands, Flanders and
Austria the fragment TF was digested by AluI instead
of HinfI, but the same insertion–deletion was scored to
distinguish haplotype 10 from haplotype 11. Electro-
phoresis, visualisation and coding of the polymorph-
isms were done according to the revised description
in annexes 1 and 2 of Petit et al. (2002b). As evident
from earlier studies (Dumolin-Lapegue et al., 1997a),
only a reduced number of haplotypes was expected in
the study region. As a consequence, when diagnostic
mutations were identified with two primer–enzyme-
systems, the remaining fragments were not analysed
in all samples.
2.3. Data analysis
Populations containing only one haplotype are
referred to as monotypic, the remaining as polytypic.
Genetic diversity and geostatistical analyses were
150 A.O. Konig et al. / Forest Ecology and Management 156 (2002) 147–166

performed and applied to the whole data set as well as
to four subsets as described below. Only those popula-
tions represented by at least three trees were included
in the analysis. The within-population genetic diver-
sity hS, the total diversity hT, and the coefficient of
genetic differentiation GST were calculated according
to the method of Pons and Petit (1995). GST was
estimated separately for Q. robur and Q. petraea both
for the whole data set as well as for the different
subsets. The difference between sets was tested
against zero by the t-test, first within species and
then among species of the same region. To test the
existence of a spatial genetic structure, distograms
were constructed. The procedure follows that des-
cribed by Degen and Scholz (1998): mean pairwise
genetic distances are plotted for different distance
classes. The genetic distance (d) used is that proposed
by Gregorius (1974), with the haplotype frequen-
cies substituted directly into the formula. The per-
mutation test is made according to Noreen (1989).
Fig. 1. The study region western Central Europe. The shaded areas indicate the hilly or mountainous regions at intervals of 250, 500 and 1000 m,
respectively. Each symbol (square for Q. robur and circle for Q. petraea) marks the location of an analysed population. The three rectangles
comprise selected sub-areas with different degrees of human impact (see text). The inset on the left side gives the abbreviations of German Federal
States mentioned in the text—BW: Baden-Wurttemberg, BY: Bavaria, BB: Brandenburg, HE: Hesse; MV: Mecklenburg-Vorpommern, NI: Lower
Saxony, NW: Northrhine-Westphalia, RP: Rhineland-Palatinate, SN: Saxony, ST: Saxony-Anhalt, SH: Schleswig-Holstein, TH: Thuringia.
Fig. 3. Haplotype distribution in and among roadside plantations
of Q. robur in The Netherlands. Assignment of haplotypes to
colours see Fig. 4.
A.O. Konig et al. / Forest Ecology and Management 156 (2002) 147–166 151
(For the software see: http://kourou.cirad.fr/genetique/
index.html: Spatial Genetic Software by B. Degen.)
To guarantee a sufficient number of populations in
each distance class, and to enable a comparison
between the four selected areas, the distogram analy-
sis is restricted to Q. robur and distance classes of
30 km were selected. Confidence intervals of the
genetic distances in each distance class were obtai-
ned by using 500 permutations. All maps were pro-
duced using the GIS-software Mapinfo Professional
Version 3.5.
The first region selected to evaluate human impacts
on the cpDNA genetic structure of Q. robur are The
Netherlands. Only roadside plantations were included.
Trees for line and roadside plantations have been
subjected to mass selection for good performance and
stem form for a long time, and mixtures of material
originating from several nurseries is a common
practice (de Vries and van Dam, 1998).
Furthermore, within Germany, three more or less
even-sized areas of 60,000–70,000 km2 were chosen
for comparative genetic analyses (see the position of
these regions in Fig. 1). The first region, the northern
lowlands of Germany (52.3–54.58N in latitude and
7.0–11.08E in longitude) is characterised by long-term
human impact. First, in this region, prehistoric
activities have been documented since more than
10,000 years in the lower courses and the mouths of
the rivers Weser and Elbe (Rust, 1972). In the past
centuries, the large cities of Bremen and Hamburg had
high demands for wood. Additionally, in Luneburg, a
salt processing plant existed which required a huge
amount of wood. As a consequence, in the 18th
century, the majority of the forests of this region was
devastated, and many of the oak populations that grow
there today are likely to have been established
artificially.
The second area (49.0–52.08N, 6.0–9.08E) is crossed
by the Rhine from the southeast to the northwest, and
is also characterised by long-term human impact. The
Rhine valley was settled early during prehistoric times;
subsequently, the Romans cleared forests there, not
only to extract wood, but also to establish vineyards
or to plant chestnuts. In the lower course of the Rhine,
oak plantations were established in order to produce
firewood, bark for tannin extraction, and bowed stems,
which were needed for the construction of the bulgy
cogs in The Netherlands (Kuster, 1998). In the hilly
region of Northrhine-Westphalia coppice systems have
been applied, mainly with Q. petraea, since up to 2500
years ago (Hesmer, 1958).
The third region (47.5–50.08N, 9.0–12.58E) inclu-
des a large part of Bavaria and the eastern part of
Baden-Wurttemberg. Oak populations in this region
are scarce and often limited to wet sites (Q. robur);
therefore a low degree of human interference is to be
expected.
3. Results
3.1. Geographic distribution of species
In total, 2155 oak trees were sampled from 426
populations. These were collected either in prove-
nance tests, in nursery beds, or directly in the forests
(called ‘‘units’’ in Table 1). In this sample set 1214
trees (56%) turned out to be Q. robur and 879 (41%)
turned out to be Q. petraea. The remaining 62 trees
had morphology of an intermediate nature or the
species was not determined. Fig. 1 gives an overview
on the geographic distribution of the samples and the
species. Q. petraea was found more frequently in the
hilly region, with the exception of the region situated
between the Alps and the Danube, where the
occurrence of oak is rare in general. In the northern
lowlands of Germany, and north of the Alps in South
Germany and Austria, Q. robur is the dominant
species.
3.2. cpDNA polymorphisms
In total, 11 haplotypes were detected (Table 1)
corresponding to four lineages (A, B, C, E). The
composition of these lineages is indicated in Figs. 1
and 2 of Petit et al. (2002b). However, only three
lineages (A, B, C) and eight haplotypes are well
represented. Lineage C (of inferred Apennines origin)
is the most common (43% of the samples), followed
by lineage A (of Apennines and/or Balkans origin)
(30%) and by lineage B (from the Iberian refugia)
(26%). The three most frequent haplotypes are
haplotype 1 (40%), haplotype 7 (23%) and haplotype
10 (14%), which belong to the C, A and B lineages,
respectively. All other haplotypes exhibit a frequency
below 10%. Haplotypes 6 and 15 were only found in
152 A.O. Konig et al. / Forest Ecology and Management 156 (2002) 147–166

one population each, whereas haplotype 17 (of lineage
E) is restricted to a part of Austria. Other polymorph-
isms had been detected in Austria (Csaikl and Konig,
2001), but are not discussed here as they could be
distinguished only with more resolutive separation
methods and would have gone unrecognised with the
experimental conditions used in France, Belgium, The
Netherlands or Germany.
3.3. Geographic variation of cpDNA polymorphisms
Maps of the geographic structure are provided in
Fig. 2a–d, separately for Q. robur (a) and Q. petraea (b)
and for monotypic (c) and polytypic (d) stands. The
frequency of the different haplotypes is similar for the
two species and varies among regions. In the southeast
haplotype 7 is dominant, in the west haplotype 1 is most
common, and haplotypes 10–12 are the most frequent
ones in the northwest (Fig. 2a and b). Polytypic
populations are much rarer in Q. petraea than in Q.
robur. In Lower Saxony, Q. robur had a particularly
high frequency of polytypic populations, whereas in the
southeast of Germany many populations are fixed for
the one haplotype. Fig. 3 illustrates the very special case
of roadside plantations in The Netherlands, where most
populations comprise several haplotypes.
The distribution of individual haplotypes is shown
in Fig. 4. Haplotypes originating from the Iberian
refugia (lineage B: haplotypes 10–12) are more
common in the western part of the study region.
Haplotype 10 (13.6%) was detected in Belgium, The
Netherlands and from the lowlands of North Germany
to the Baltic Sea, where many of the populations are
fixed for this haplotype. Haplotype 10 also extends
Table 1
Overall statistics
Country Haplotype (Lineage)
1
(C)
2
(C)
4
(A)
5
(A)
6
(A)
7
(A)
10
(B)
11
(B)
12
(B)
15
(E)
17
(E)
No. of
trees
No. of
units
Number of trees per haplotype, total number of trees and units investigated
Belgium 57 0 0 0 –a 4 36 0 22 – 0 119 22
The Netherlands 22 0 0 0 – 12 14 4 34 – – 86 17
Luxembourg 0 0 0 0 – 0 0 10 0 – 0 10 2
Germany 758 8 90 48 – 392 244 87 118 – – 1745 337
Czech Republic 11 4 0 0 32 0 0 0 1 – 48 9
Austria 18 41 0 11 2 45 0 0 0 – 30 147 40
Sum 866 53 90 59 2 485 294 101 174 1 30 2155 426
Percentage 40.2 2.5 4.2 2.7 0.1 22.5 13.6 4.7 8.1 0.0 1.4
Percentage/lineage 42.7 (C) 29.5 (A) 26.4 (B) 1.4 (C)
Separation by species
Q. robur
Belgium, Luxembourg and
The Netherlands 36 0 0 0 – 12 37 14 40 – – 139 20
Germany 437 8 33 27 – 212 167 38 56 – – 978 181
Czech Republic 6 0 0 0 – 19 0 0 0 1 0 26 4
Austria 14 15 0 0 0 29 0 0 0 0 13 71 17
Sum 493 23 33 27 0 272 204 52 96 1 13 1214 222
Q. petraea
Belgium, Luxembourg and
The Netherlands 43 0 0 0 – 4 13 0 16 – – 76 8
Germany 300 0 57 21 – 177 73 49 56 – – 733 132
Czech Republic 5 4 0 0 – 13 0 0 0 – 0 22 4
Austria 2 25 0 5 0 5 0 0 0 0 11 48 4
Sum 350 29 57 26 0 199 86 49 72 0 11 879 148
a Haplotype was not scored in the investigating laboratory.
A.O. Konig et al. / Forest Ecology and Management 156 (2002) 147–166 153

Fig. 2. Distribution of haplotypes in western Central Europe separated by species and by distribution within populations. Each colour
represents a different haplotype. Assignment of haplotypes to colours see Fig. 4. (a) Distribution for Q. robur and (b) for Q. petraea. (c)
Populations of Q. robur and Q. petraea fixed for one haplotype (monotypic populations). (d) Populations with more than one haplotype
(polytypic populations).
154 A.O. Konig et al. / Forest Ecology and Management 156 (2002) 147–166

Fig. 2. (Continued ).
A.O. Konig et al. / Forest Ecology and Management 156 (2002) 147–166 155

Fig. 4. Distribution of individual haplotypes in the study region (statistics see Table 1). Information is taken from both monotypic (bigger
circles) and polytypic populations (smaller circles).
156 A.O. Konig et al. / Forest Ecology and Management 156 (2002) 147–166
from Alsace into the hilly region of Baden-Wurttem-
berg. Haplotype 11 (4.7%) has a more scattered dis-
tribution throughout the northwestern part of the
region. Only six monotypic populations were detected
for this haplotype, four of which occur in Luxembourg
and in Northrhine-Westphalia. Haplotype 12 (8.1%)
has a distribution very similar to that of haplotype 10.
There are clusters of this haplotype in The Nether-
lands, in Northrhine-Westphalia and in the Luneburger
Heide (northeastern Lower Saxony). The cluster in the
Mosel-Hunsruck region extends to the east side of the
Rhine. Only one tree with this type was found in the
south.
Populations of lineage C are more or less equally
distributed over the western and central part of the
region investigated. This lineage is nearly exclusively
represented by haplotype 1 (40.2%). Regional clusters
of monotypic populations can be observed in Fig. 2c.
Haplotype 2 (2.5%) was found rarely in western
Germany and was limited to a monotypic stand in
Northrhine-Westphalia and a single tree close to
Hanover. In Austria, this haplotype is relatively
frequent forming a cluster in the part of the Danube
valley called Wachau (between the cities of Melk and
Krems) and also west of that cluster in Upper Austria.
Haplotype 2 occurs also in one population in the
Czech Republic.
Haplotype 7 (lineage A) is most common in the
eastern part of Germany, especially in the Federal States
Saxony and Bavaria. It is also found in the Czech
Republic and Austria. Two other haplotypes belonging
to lineage A: haplotypes 4 and 5, are scattered at low
frequencies throughout the study region (4.2 and 2.7%,
respectively). Haplotype 4 was detected in Germany in
populations of east Brandenburg (close to the border
with Poland), in the forest district Gohrde and its
surroundings (in the northeast of Lower Saxony, along
the Elbe river) and in the Sauerland (Northrhine-
Westphalia). This haplotype was not detected in
Belgium, The Netherlands, Czech Republic and
Austria. Haplotype 5 has a similar distribution in
Germany, but it was also detected in one population
in eastern Austria. Finally, haplotypes 6, 15 and 17
were found only in the eastern part of the study
region. Two trees of type 6 were detected in the north of
Austria, where there is also a cluster of haplotype 17,
and one tree sampled in the Czech Republic was
haplotype 15.
3.4. cpDNA diversity and differentiation
Estimates of genetic diversity and differentiation are
given in Table 2 for each species and subset (study
region). Diversity within stands (hS) is significantly
lower in Q. petraea than in Q. robur for the whole
data set (0.16 vs. 0.24, t ¼ 2:72; P < 0:01). The
difference between the two species is also significant
in the case of the north German lowlands ðt ¼ 2:19;P < 0:05Þ. An exception from this general trend occurs
in the Rhine region where both species have similar
values for hS. The Dutch roadside plantations (Q. robur)
have the highest within-population genetic diversity
ðhS ¼ 0:53Þ, more than twice the overall value for the
complete data set. The lowest intrapopulation diversity
values were estimated for populations in Bavaria,
particularly for stands of Q. petraea. The GST estimates
show overall values of 0.68 for Q. robur and 0.79 for
Q. petraea (the difference is highly significant:
t ¼ 2:97; P < 0:01). In each of the three regions in
which both species were compared, Q. petraea had the
higher GST values; the difference is significant in the
case of Bavaria ðt ¼ 2:01; P < 0:05Þ, where Q. petraea
has the highest GST value (0.91), compared to the
extremely low GST value (0.28) for the Q. robur
roadside plantations in The Netherlands. This latter
value represents the lowest GST reported in the literature
for oaks (Petit et al., 2002b and references therein). It
differs significantly from all other values reported in
this study, and in particular with the second lowest GST
value (0.52), that of Q. robur in the northern lowlands
ðt ¼ 2:76; P < 0:01Þ. For both oak species, the ranking
of the three regions studied is the same: GST is smallest
in the northern lowlands, intermediate in the Rhine
region, and largest in Bavaria.
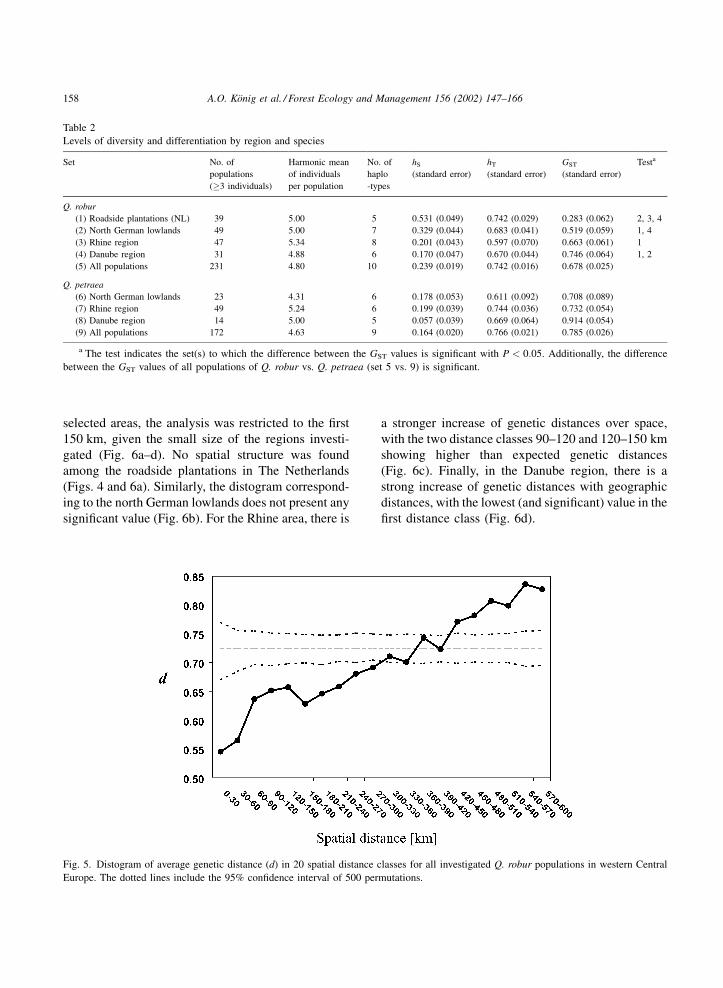
3.5. Tests of spatial genetic structures
To support previous results based on the fixation
index GST, the existence of a spatial genetic structure
was tested in Q. robur in the same regions used in the
previous analyses (Figs. 5 and 6). On the basis of the
complete data set, a continuous increase of cpDNA
genetic distance with geographic distance is observed
in Q. robur (Fig. 5). Genetic distances are significantly
lower than expected by chance in the first distance
classes (up to 300 km) and significantly higher in the
classes ranging from 420 to 600 km. In the four
A.O. Konig et al. / Forest Ecology and Management 156 (2002) 147–166 157
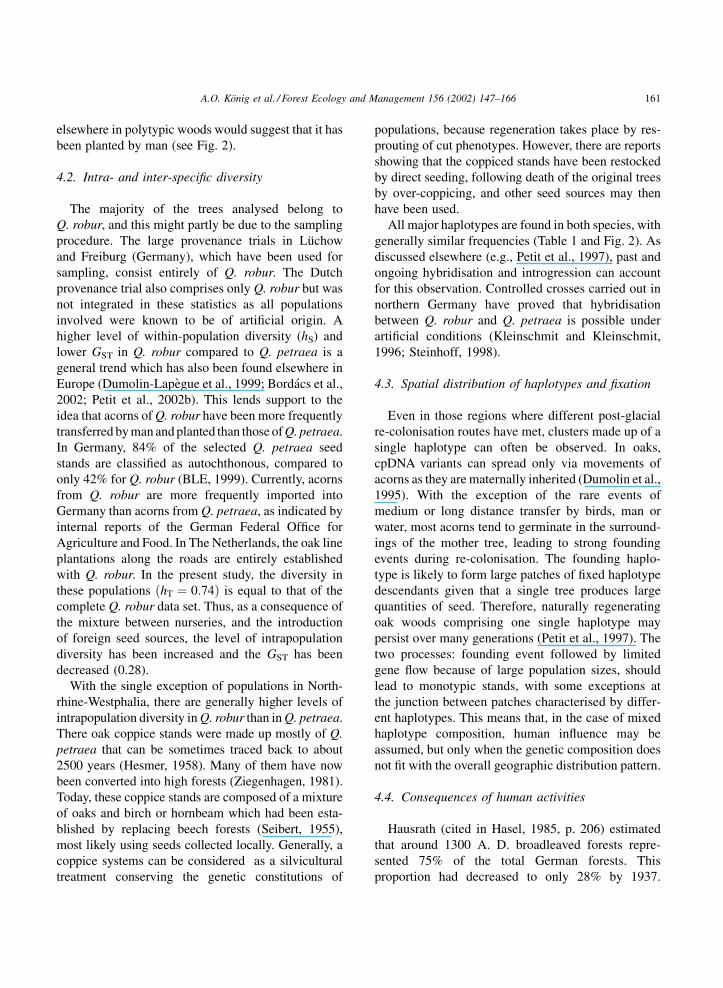
selected areas, the analysis was restricted to the first
150 km, given the small size of the regions investi-
gated (Fig. 6a–d). No spatial structure was found
among the roadside plantations in The Netherlands
(Figs. 4 and 6a). Similarly, the distogram correspond-
ing to the north German lowlands does not present any
significant value (Fig. 6b). For the Rhine area, there is
a stronger increase of genetic distances over space,
with the two distance classes 90–120 and 120–150 km
showing higher than expected genetic distances
(Fig. 6c). Finally, in the Danube region, there is a
strong increase of genetic distances with geographic
distances, with the lowest (and significant) value in the
first distance class (Fig. 6d).
Table 2
Levels of diversity and differentiation by region and species
Set No. of
populations
(�3 individuals)
Harmonic mean
of individuals
per population
No. of
haplo
-types
hS
(standard error)
hT
(standard error)
GST
(standard error)
Testa
Q. robur
(1) Roadside plantations (NL) 39 5.00 5 0.531 (0.049) 0.742 (0.029) 0.283 (0.062) 2, 3, 4
(2) North German lowlands 49 5.00 7 0.329 (0.044) 0.683 (0.041) 0.519 (0.059) 1, 4
(3) Rhine region 47 5.34 8 0.201 (0.043) 0.597 (0.070) 0.663 (0.061) 1
(4) Danube region 31 4.88 6 0.170 (0.047) 0.670 (0.044) 0.746 (0.064) 1, 2
(5) All populations 231 4.80 10 0.239 (0.019) 0.742 (0.016) 0.678 (0.025)
Q. petraea
(6) North German lowlands 23 4.31 6 0.178 (0.053) 0.611 (0.092) 0.708 (0.089)
(7) Rhine region 49 5.24 6 0.199 (0.039) 0.744 (0.036) 0.732 (0.054)
(8) Danube region 14 5.00 5 0.057 (0.039) 0.669 (0.064) 0.914 (0.054)
(9) All populations 172 4.63 9 0.164 (0.020) 0.766 (0.021) 0.785 (0.026)
a The test indicates the set(s) to which the difference between the GST values is significant with P < 0:05. Additionally, the difference
between the GST values of all populations of Q. robur vs. Q. petraea (set 5 vs. 9) is significant.
Fig. 5. Distogram of average genetic distance (d) in 20 spatial distance classes for all investigated Q. robur populations in western Central
Europe. The dotted lines include the 95% confidence interval of 500 permutations.
158 A.O. Konig et al. / Forest Ecology and Management 156 (2002) 147–166

Fig. 6. Distograms of average genetic distance (d) in six spatial distance classes for Q. robur populations in four selected sub-areas. The 95% confidence interval of 500
permutations is presented.
A.O
.K
on
iget
al./F
orest
Eco
log
ya
nd
Ma
na
gem
ent
15
6(2
00
2)
14
7–
16
61
59

4. Discussion
4.1. Distribution of haplotypes and re-colonisation
routes
Routes of re-colonisation can be inferred from the
present geographic distribution of haplotypes. For
example, haplotypes 10–12 of lineage B (Fig. 4), which
originate from the Iberian refugia, appear to have
moved north–northeast through France, into Luxem-
bourg, Belgium and The Netherlands, and finally
entered Germany in the northwest from France (in the
Mosel region), Belgium and The Netherlands. The
subsequent movements were northeastwards, up to
the Baltic Sea. The native status of oak populations
characterised by these haplotypes is supported by the
presence of numerous stands fixed for haplotypes
of lineage B in northeast Germany (Mecklenburg-
Vorpommern,especiallyhaplotype10).Thefewpopula-
tions from southwest Germany (Baden-Wurttemberg
and West Bavaria) characterised by haplotypes 10 and
12 could indicate a separate colonisation route through
the Porte de Bourgogne, between the Vosges mountains
and the Swiss Jura, rather than from the north. This
hypothesis is supported by the fact that haplotypes of
lineage B are absent in the adjacent Palatinate hilly
region. Since the populations characterised by this
lineage did not penetrate further east than to the border
region of Baden-Wurttemberg and Bavaria, they may
have arrived there later, although the distance from the
Iberian refugia to the Porte de Bourgogne is much
shorter than to northern Germany. Another possibility
is that they may have encountered populations coming
from the east relatively early in their migration, which
could have hindered a further extension.
Haplotype 1 is most likely of Italian origin (Dumolin-
Lapegue et al., 1997a; Petit et al., 2002a). It is the most
common haplotype detected in Germany (40%). The
location where oaks carrying this haplotype may have
passed the Alps, is detailed elsewhere (Matyas, 1999;
Csaikl et al., 2002b). The founder populations migra-
ted to Germany in the southwestern corner of the
territory from where they moved largely northwards.
The distribution of this haplotype broadens as it moves
northwards from Belgium and The Netherlands to
northwest Poland (Csaikl et al., 2002a). In Saxony and
Bavaria, haplotype 1 occurs with a low frequency.
There is a gap between the populations characterised
by this haplotype found in the Czech Republic and in
Austria, and those found in southwestern Germany.
The migration of haplotype 1 into those countries can
be explained either by long distance migration from
West Germany, or by the existence of a more easterly
migration route through northeast Italy and Austria.
On the other hand it can also not be excluded that
several trees are allochthonous, as for example that
one found in the park of Schonbrunn castle (eastern-
most point in Fig. 4, 1). Lineage C is also represented
in the study region by haplotype 2. Although the
general distribution of this haplotype is centred further
east of western Central Europe, it occurs in the
extreme southeastern corner of the region considered
here.
Lineage A, which likely originates from the Balkans,
is represented by haplotypes 4, 5 and 7 in the study
region. Haplotype 4 is more frequent in Hungary and in
Slovakia (Bordacs et al., 2002), but further investiga-
tion in the Czech Republic may allow to determine
more precisely the distribution area of this haplotype.
This would indicate whether acorns have floated
during inundations or been shipped by man down-
stream along the rivers Elbe and Oder. Two clusters of
haplotype 4 occur in northern Germany, on the lower
courses of these rivers, but the possible source popu-
lations have not yet been identified. Shipments may
have been made to feed cattle, or for reforestation
purposes in the 19th century after the large forest
fellings.
Similarly, for haplotype 5, disjunct stands have been
identified in Bavaria and Northrhine-Westphalia. This
haplotype is the most frequent in the area to the east
of the study region, in Romania, Hungary, Slovenia
and eastern Austria (Bordacs et al., 2002). It may have
migrated into Germany through south Poland and
possibly through the Czech Republic since a cluster of
haplotype 5 exists in the border region between
Germany, Poland and the Czech Republic.
Finally, haplotype 7 has a broad distribution in the
region investigated. In The Netherlands and in Belgium
it is very rare (and probably introduced), and scarce in
northwest Germany (near the Atlantic) as well as in
Mecklenburg-Vorpommern (near the Baltic Sea), in
south Hesse and in Frankonia. This would suggest a
migration route northwards along the border with the
Czech Republic. Although it may be autochthonous
further north in pure haplotype 7-stands, its presence
160 A.O. Konig et al. / Forest Ecology and Management 156 (2002) 147–166
elsewhere in polytypic woods would suggest that it has
been planted by man (see Fig. 2).
4.2. Intra- and inter-specific diversity
The majority of the trees analysed belong to
Q. robur, and this might partly be due to the sampling
procedure. The large provenance trials in Luchow
and Freiburg (Germany), which have been used for
sampling, consist entirely of Q. robur. The Dutch
provenance trial also comprises only Q. robur but was
not integrated in these statistics as all populations
involved were known to be of artificial origin. A
higher level of within-population diversity (hS) and
lower GST in Q. robur compared to Q. petraea is a
general trend which has also been found elsewhere in
Europe (Dumolin-Lapegue et al., 1999; Bordacs et al.,
2002; Petit et al., 2002b). This lends support to the
idea that acorns of Q. robur have been more frequently
transferred by man and planted than those of Q. petraea.
In Germany, 84% of the selected Q. petraea seed
stands are classified as autochthonous, compared to
only 42% for Q. robur (BLE, 1999). Currently, acorns
from Q. robur are more frequently imported into
Germany than acorns from Q. petraea, as indicated by
internal reports of the German Federal Office for
Agriculture and Food. In The Netherlands, the oak line
plantations along the roads are entirely established
with Q. robur. In the present study, the diversity in
these populations ðhT ¼ 0:74Þ is equal to that of the
complete Q. robur data set. Thus, as a consequence of
the mixture between nurseries, and the introduction
of foreign seed sources, the level of intrapopulation
diversity has been increased and the GST has been
decreased (0.28).
With the single exception of populations in North-
rhine-Westphalia, there are generally higher levels of
intrapopulation diversity in Q. robur than in Q. petraea.
There oak coppice stands were made up mostly of Q.
petraea that can be sometimes traced back to about
2500 years (Hesmer, 1958). Many of them have now
been converted into high forests (Ziegenhagen, 1981).
Today, these coppice stands are composed of a mixture
of oaks and birch or hornbeam which had been esta-
blished by replacing beech forests (Seibert, 1955),
most likely using seeds collected locally. Generally, a
coppice systems can be considered as a silvicultural
treatment conserving the genetic constitutions of
populations, because regeneration takes place by res-
prouting of cut phenotypes. However, there are reports
showing that the coppiced stands have been restocked
by direct seeding, following death of the original trees
by over-coppicing, and other seed sources may then
have been used.
All major haplotypes are found in both species, with
generally similar frequencies (Table 1 and Fig. 2). As
discussed elsewhere (e.g., Petit et al., 1997), past and
ongoing hybridisation and introgression can account
for this observation. Controlled crosses carried out in
northern Germany have proved that hybridisation
between Q. robur and Q. petraea is possible under
artificial conditions (Kleinschmit and Kleinschmit,
1996; Steinhoff, 1998).
4.3. Spatial distribution of haplotypes and fixation
Even in those regions where different post-glacial
re-colonisation routes have met, clusters made up of a
single haplotype can often be observed. In oaks,
cpDNA variants can spread only via movements of
acorns as they are maternally inherited (Dumolin et al.,
1995). With the exception of the rare events of
medium or long distance transfer by birds, man or
water, most acorns tend to germinate in the surround-
ings of the mother tree, leading to strong founding
events during re-colonisation. The founding haplo-
type is likely to form large patches of fixed haplotype
descendants given that a single tree produces large
quantities of seed. Therefore, naturally regenerating
oak woods comprising one single haplotype may
persist over many generations (Petit et al., 1997). The
two processes: founding event followed by limited
gene flow because of large population sizes, should
lead to monotypic stands, with some exceptions at
the junction between patches characterised by differ-
ent haplotypes. This means that, in the case of mixed
haplotype composition, human influence may be
assumed, but only when the genetic composition does
not fit with the overall geographic distribution pattern.
4.4. Consequences of human activities
Hausrath (cited in Hasel, 1985, p. 206) estimated
that around 1300 A. D. broadleaved forests repre-
sented 75% of the total German forests. This
proportion had decreased to only 28% by 1937.
A.O. Konig et al. / Forest Ecology and Management 156 (2002) 147–166 161

This suggests that over a period of 600 years human
activities have greatly modified the composition of the
forests. Also the percentage of forests, where oak was
the main species has decreased in some regions; for
example in the forest district of the Bramwald from
82% in 1587 to only 16% in 1948 (Krahl-Urban,
1959). Exceptions occurred in regions with coppice
systems.
However, it is not clear to what extent these human
activities also affected intra-specific genetic variation.
It is evident that the large conifer sowings have not
only changed the structure of forest ecosystems, but
also largely determined the genetic structure of conifer
populations. Conifer seed could be collected far away,
the seeds could be easily stored and transported over
large distances, and with a few kilograms several tens
of thousands of trees could be raised. This is quite
different with oak. One kilogram of seeds consists on
average of 350 acorns of Q. petraea or of 250 acorns of
Q. robur (Krahl-Urban, 1959). For the establishment
of an oak forest, a huge amount of acorns is therefore
necessary, given the high density of acorns or plants
used in artificial regeneration. For instance, in Lower
Frankonia (BY), as much as 600–750 kg of acorns are
sown per hectare (Grimm, 1995). If used for refore-
station, acorns have to be protected against desiccation
and deterioration. It is difficult to envisage that storage
and transportation occurred on any appreciable scale
in the Middle Ages and in the following centuries. An
exception might be through transport by ships, along
major rivers. Elsewhere, if acorns were needed for
planting or sowing, they would have been of local
origin. Even the vast areas of deforestation present in
the 17th, 18th and first half of the 19th century were
probably regenerated using seed from local remnant
oaks near farmers’ buildings.
The situation might have changed in the middle of
the 19th century with the development of the railroad
system. Big forest seed transfer occurred during the
19th and the beginning of the 20th century. There were
considerable imports from Austria and Hungary as well
as from Belgium and France. In the case of acorns,
Ludemann (1961) compiled the available statistics
between 1888 and 1940. Before World War I, the annual
imports amounted to about 500–1500 t per year, with
a maximum of 3000 t in 1911. Between the two World
Wars, imports were greatly reduced. These seed trans-
fers, both within and between countries, must have
affected the cpDNA genetic structure, resulting, in
many cases, in an increased cpDNA-diversity within-
stands or within-forest-districts due to the mixing of
seed sources.
4.5. Increasing genetic structure with decreasing
human influence
Because of its greater propensity to be manipulated
by man, Q. robur was chosen to test the assumption
that an increased degree of human influence should
result not only in increased levels of diversity within
populations, but also in decreased levels of spatial
genetic structure. This implies the assumption that
for reforestations not only local but also non-indi-
genous material has been used. First, the distogram
based on the overall set of Q. robur populations
confirms the observation that the haplotypes are not
randomly distributed throughout the study region.
This means that even in a regionally intensively
managed species, the original geographic structure
that was created at the onset of post-glacial re-
colonisation may still be identified. Within the
subsets (Fig. 6a–d) a differential human influence
was assumed. Both for the Dutch roadside plantations
as well as for the north German lowland the genetic
distances do not deviate from the random expecta-
tions: all values remain within the confidence limits
and these are rather narrow. But the conditions for
both sets are quite different. In The Netherlands the
populations included in this kind of investigation
are entirely planted, using material from outside the
country. In total five haplotypes were identified.
But according to the general remigration patterns
only haplotypes of lineage B (10–12) would be expec-
ted to have migrated naturally into The Netherlands.
Haplotype 1 is considered to be autochthonous only
in the southeastern corner of The Netherlands, and
haplotype 7 seems to have been introduced. In North
Germany, on the contrary, seven haplotypes from
different lineages were found, and this area can be
considered as a hybrid zone in the sense of Hewitt
(1999). So Fig. 6b cannot be interpreted as being
exclusively the result of human activity. Both
mingling of lineages and mixing of seed from both
local and non-local origins might have contributed
to the random distribution pattern of haplotypes.
Q. petraea has experienced less human interference
162 A.O. Konig et al. / Forest Ecology and Management 156 (2002) 147–166

and therefore the current geographic distribution of
cpDNA variation in this species is probably more
representative of the original pattern. For the region
of the Rhine valley and surrounding hills, some
(limited) level of genetic structure remains, despite
the presence of some polytypic forests of likely
introduced origin. The Q. robur populations growing
at intermediate elevation in Bavaria present a distinct
spatial genetic structure in the lowest distance class.
This is probably due to the big cluster of monotypic
stands of haplotype 7 in and south of the Danube
valley.
4.6. Indications for autochthony/allochthony
The overall spatial genetic structure that was
established at the outset of post-glacial re-colonisation
can be used to evaluate the autochthony of oak
populations. The introduction of non-autochthonous
material will be particularly evident where there is a
large geographic distance between the stand and the
region where the corresponding haplotype occurs at
high frequency. This is true for the monotypic stand in
Northrhine-Westphalia characterised by haplotype 2.
This haplotype is more frequently distributed in Croatia,
Hungary and East Austria from where it extends as far
as the Austrian–German border region. This isolated
stand is separated by 500 km from the nearest popu-
lations sharing the same haplotype.
More frequently, however, intermediate situations
will occur. In the case of haplotype 5, there is one fixed
haplotype stand of Q. robur in West Germany close to
the border with The Netherlands (between the Meuse
and the Rhine rivers). The distance between this stand
and the closest monotypic stands in Thuringia and
Bavaria is almost of about 270 and 300 km, respec-
tively. Although it may be possible that this stand was
established by a long-distance seed dispersal event
during post-glacial re-colonisation, it seems more
likely that the acorns were introduced to establish a
coppice plantation in the river plain; this could be
checked by analysing further samples in the vicinity of
the isolated haplotype 5 western population.
The arguments concerning autochthony can be
reinforced by examining the taxonomic status of the
populations investigated. The clusters of haplotype
4 in the lower course of the rivers Elbe and Oder
have already been interpreted as possibly introduced
populations. These trees were largely Q. petraea.
Since Q. robur is more suited to the ecological con-
ditions prevailing in these river plains, the hypothesis
that the Q. petraea trees are allochthonous is sup-
ported. The presence of haplotype 4 in Northrhine-
Westphalia and in Bavaria, in the form of two disjunct
patches, could also indicate human transfer, especially
in the westernmost location.
Another indicator for non-autochthony is the
heterogeneity of a stand. Many polytypic woods exist
in the densely sampled regions of Northrhine-
Westphalia and Lower Saxony. The existence of
polytypic stands which comprise haplotypes of all
three main lineages or contain haplotypes which do
not occur in the surrounding stands provides strong
evidence that the basic material is (at least partly)
introduced. The Dutch roadside plantations demon-
strate this clearly. On the other hand, stands planted
with introduced material may also be monotypic, as
shown above in the case of some stands fixed for
haplotypes 2, 4 or 5.
5. Conclusions
The results of this study have provided important
information about the location of the post-glacial
migration routes of oak in western Central Europe.
Although humans have considerably altered the
landscape in this part of Europe, it seems that the
mapped patterns largely reflect the original post-
glacial distribution of haplotypes. Because of the
position of the region at the meeting-point of the three
lineages from the Balkans, Apennines and Iberia, a
comparatively high level of cpDNA diversity exists
naturally. Nevertheless, in several regional clusters a
uniform genetic composition exists, which points to
the persistence of material of local origin. In regions
where human influence has been particularly strong,
an increased cpDNA diversity within populations
and a decreased spatial genetic structure could be
observed, but this might also be due to the mingling of
lineages.
The use of molecular markers can assist in the
identification of autochthonous material and indicate
the amount of past seed transfer within a region. Stands
not fitting into the general remigration pattern can be
classified as having been established with introduced
A.O. Konig et al. / Forest Ecology and Management 156 (2002) 147–166 163
material. The method can be used for the genetic
characterisation of seed stands and, to some degree, for
identity control of forest reproductive material moving
in trade.
Acknowledgements
The study has been carried out with financial
support from the commission of the European Com-
munities, Agriculture and Fisheries (FAIR) specific
RTD programme, CT-FAIR 1 PL95-0297, ‘‘Synthetic
maps of gene diversity and provenance performance
for utilisation and conservation of oak genetic
resources in Europe’’. It does not necessarily reflect
its views and in no way anticipates the Commission’s
future policy in this area.
The authors are particularly thankful to Katrin
Groppe, Inge Schulze and Nils Ziegler (Germany),
to Marie-Helene Pemonge and Celine Latouche-
Halle (France), to Karin Hohl (Austria) and to Jan
Bovenschen and Marloes Welles (in The Netherlands)
for excellent work in the laboratory. We gratefully
acknowledge Helen Tabbener for reviewing an earlier
draft of this manuscript and helping with the English,
and Joan Cottrell and Antoine Kremer for useful
comments.
The following colleagues kindly participated or
helped organising the collections in natural populations
or in provenance tests: D. Jacques (in Wallony), J.-F.
Hausman (in Luxembourg), C. Das, C. van Doorn, G.
Kranenborg, and K. van der Schaaf (in The Nether-
lands), W. Arenhovel, H. Bleymuller, E. Burchard, A.
Franke, A. Hewicker, J. Heyder, J. Kleinschmit, W.
Maurer, J. Pein, H.-M. Rau, M. Rogge, G. Schachler,
Mr. Schilling, H.-P. Schmidt, V. Schneck, S. Steinhoff,
B.R. Stephan, U. Tabel, H. Wolf, and I. Zaspel (in
Germany), and E. Palatova (in the Czech Republic).
R.J. Pet thanks the Institut fur Forstgenetik und
Forstpflanzenzuchtung of the BFH, for its hospitality
during the preparation of the manuscript.
References
Aas, G., 1996. Morphologische und okologische Variation
mitteleuropaischer Quercus-Arten: Ein Beitrag zum Verstand-
nis der Biodiversitat. Habilitationsschrift, Eidgenossische
Techn. Hochschule, Zurich, 275 pp.
BLE, 1999. List of approved basic material for forest reproductive
material in the Federal Republic of Germany (Status: 01.
October 1997). Bundesanstalt fur Landwirtschaft und Ernah-
rung (Federal Office for Agriculture and Food), Frankfurt, 480
pp.
BML, 1994. Nationaler Waldbericht der Bundesrepublik Deutsch-
land. Bundesministerium fur Ernahrung, Landwirtschaft und
Forsten, Ref. 611, Bonn, 94 pp. þAnhang.
BMLF, 1995. Osterreichischer Waldbericht. Bundesministerium fur
Land- und Forstwirtschaft, Wien.
Bordacs, S., Popescu, F., Slade, D., Csaikl, U.M., Lesur, I.,
Borovics, A., Kezdy, P., Konig, A.O., Gomory, D., Brewer, S.,
Burg, K., Petit, R.J., 2002. Chloroplast DNA variation of white
oaks in northern Balkans and in the Carpathian Basin. For.
Ecol. Mgmt., 156.
Brewer, S., Cheddadi, R., de Beaulieu, J.-L., Reille, M., and Data
contributors, 2001. The spread of deciduous Quercus through-
out Europe since the last glacial period. For. Ecol. Mgmt., this
issue.
Cottrell, J.E., Munro, R.C., Tabbener, H.E., Gillies, A.C.M.,
Forrest, G.I., Deans, J.D., Lowe, A.J., 2002. Distribution of
chloroplast variation in British oaks (Quercus robur and Q.
petraea). For. Ecol. Mgmt. 156, 181–195.
Csaikl, U.M., Konig, A.O., 2001. Genetic types in white oak
populations north of the Alps and in the Danube valley. In:
Muller-Starck, G. and Schubert, R. (eds.). Genetic Response of
Forest Systems to Changing Environmental Conditions.
Proceedings of the IUFRO Conference (Division 2 and 7) at
Freising, September 12–17, 1999, Volume 70, Kluwer Aca-
demic Publishers, Dordrecht, pp. 129–138.
Csaikl, U.M., Burg, K., Fineschi, S., Konig, A.O., Matyas, G.,
Petit, R.J., 2002a. Chloroplast DNA variation of white oaks in
the Alpine region. For. Ecol. Mgmt. 156, 131–145.
Csaikl, U.M., Glaz, I., Baliuckas, V., Petit, R.J., Jensen, J.S., 2002b.
Chloroplast DNA variation of white oaks in the Baltic countries
and Poland. For. Ecol. Mgmt. 156, 211–222.
de Vries, S.M.G., 1998a. Das niederlandische Programm zur
Erhaltung forstgenetischer Ressourcen. In: Geburek, Th.,
Heinze, B. (Hrsg.), Erhaltung Genetischer Ressourcen im
Wald, Normen, Programme, Maßnahmen. Ecomed-Verlagsge-
sellschaft, Landsberg, pp. 110–119.
de Vries, S.M.G., 1998b. Activities concerning Social Broadleaves
genetic resources in the Netherlands. In: Turok, J., Kremer, A.,
de Vries, S. (Comp.), First EUFORGEN Meeting on Social
Broadleaves, Bordeaux, France, October 23–35, 1997. Interna-
tional Plant Genetic Resources Institute, Rome, pp. 97–101.
de Vries, S.M.G., van Dam, B.C., 1998. Selection programme of
oak in the Netherlands. In: Steiner, K.C. (Ed.), Diversity and
Adaptation in Oak Species. Proceedings of the Second Meeting
of WP 2.08.05 on Genetics of Quercus of the IUFRO,
University Park (State College), PA, October 12–17, 1997.
The Pennsylvania State University, University Park, PA,
pp. 201–208.
Degen, B., Scholz, F., 1998. Spatial genetic differentiation among
populations of European beech (Fagus sylvatica L.) in Western
Germany as identified by geostatistical analysis. For. Genet. 5,
191–199.
164 A.O. Konig et al. / Forest Ecology and Management 156 (2002) 147–166

Demesure, B., Sodzi, N., Petit, R.J., 1995. A set of universal
primers for amplification of polymorphic non-coding regions of
mitochondrial and chloroplast DNA in plants. Mol. Ecol. 4,
129–131.
Dumolin, S., Demesure, B., Petit, R.J., 1995. Inheritance of
chloroplast and mitochondrial genomes in pedunculate oak
investigated with an efficient PCR method. Theoret. Appl.
Genet. 91, 1253–1256.
Dumolin-Lapegue, S., Demesure, B., Fineschi, S., Le Corre, V.,
Petit, R.J., 1997a. Phylogeographic structure of white oaks
throughout the European continent. Genetics 146, 1475–1487.
Dumolin-Lapegue, S., Pemonge, M.-H., Petit, R.J., 1997b. An
enlarged set of consensus primers for the study of organelle
DNA in plants. Mol. Ecol. 6, 393–397.
Dumolin-Lapegue, S., Pemonge, M.H., Petit, R.J., 1998. Associa-
tion between chloroplast and mitochondrial lineages in oaks.
Mol. Biol. Evol. 15, 1321–1331.
Dumolin-Lapegue, S., Kremer, A., Petit, R.J., 1999. Are chlor-
oplast and mitochondrial DNA variation species-independent in
oaks? Evolution 53, 1406–1413.
Ferris, C., Oliver, R.P., Davy, A.J., Hewitt, G.M., 1993. Native oak
chloroplasts reveal an ancient divide across Europe. Mol. Ecol.
2, 337–344.
Firbas, F., 1949. Spat- und nacheiszeitliche Waldgeschichte
Mitteleuropas nordlich der Alpen. Verlag von Gustav Fischer,
Jena.
Gregorius, H.R., 1974. Genetischer Abstand zwischen Populatio-
nen. I. Zur Konzeption der genetischen Abstandsmessung.
Silvae Genet. 23, 22–27.
Grimm, R., 1995. Nachzucht und Kulturpflege von Werteichenbes-
tanden in den Buntsandsteingebieten Unterfrankens—also im
wesentlichen im Spessart, Bayer. Odenwald und Vorrhon.
Mitteilungen aus der Forstlichen Versuchsanstalt Rheinland-
Pfalz 34, 136–140.
Hasel, K., 1985. Forstgeschichte. Pareys Studientexte, Vol. 48. P.
Parey, Hamburg.
Hesmer, H., 1958. Wald- und Forstgeschichte in Nordrhein-
Westfalen, Hannover.
Hewitt, G.M., 1999. Post-glacial re-colonization of European biota.
Biol. J. Linnean Soc. 68, 87–112.
Huntley, B., Birks, H.J.B., 1983. An Atlas of Past and Present
Pollen Maps for Europe, 0–13,000 Years Ago. Cambridge
University Press, Cambridge.
Hynek, V., 1998. Social broadleaves in the Czech Republic. In:
Turok, J., Kremer, A., de Vries, S. (Comp.), First EUFORGEN
Meeting on Social Broadleaves, Bordeaux, France, October 23–
35, 1997. International Plant Genetic Resources Institute,
Rome, pp. 34–40.
Jacques, D., de Cuyper, B., 1998. Genetic conservation strategy for
social broadleaves in Belgium. In: Turok, J., Kremer, A., de
Vries, S. (Comp.), First EUFORGEN Meeting on Social
Broadleaves, Bordeaux, France, October 23–35, 1997. Interna-
tional Plant Genetic Resources Institute, Rome, pp. 88–96.
Kleinschmit, J.R.G., Kleinschmit, J., 1996. Artificial hybridization
between Quercus robur L. and Quercus petraea (Matt.) Liebl.
In: Inter- and Intra-specific Variation in European Oaks:
Evolutionary Implications and Practical Consequences.
Proceedings of the Workshop, Brussels (BE), June 15–16,
1994. Agro-Industrial Research Division DGXII-E.2, EUR
16717 EN, European Commission, pp. 319–336.
Konig, A.O., Groppe, K., Ziegenhagen, B., 1998. First results of
chloroplast-DNA investigations in German populations of
Quercus robur and Q. petraea. In: K.C. Steiner (Ed.), Diversity
and Adaptation in Oak Species. Proceedings of the Second
Meeting of WP 2.08.05 on Genetics of Quercus of the IUFRO,
University Park (State College), PA, October 12–17, 1997. The
Pennsylvania State University, University Park, PA, pp. 102–
108.
Krahl-Urban, J., 1959. Die Eichen. Forstliche Monographie der
Traubeneiche und der Stieleiche. P. Parey, Hamburg.
Kuster, H., 1998. Geschichte des Waldes. C.H. Beck, Munchen.
Ludemann, G.H., 1961. Die Forstpflanzenanzucht in Kampen und
Forstbaumschulen Norddeutschlands. Dissertation. Georg-Au-
gust-Univ. Gottingen, Hann.-Munden, 166 pp.
Maes, C.N.M., 1993. Genetische kwaliteit van inheemse bomen en
struiken. Deelproject: Randvoorwaarden en knelpunten by
behoud en toepassing van inheems genenmateriaal. Rapport
No. 020. IKC-NBLF en IBN-DLO, Wageningen.
Maes, N., Rovenkamp, C., 1999. Onderzoek naar autochtone
genenbronnen in de Ecologische impulsgebieden, regionale
landschappen Vlaamse Ardennen en Westvlaamse Heuvels en
houtvesterijen Hechtel en Bree. Vertrouwelijke rapporten
AMINAL, afdeling Bos en Groen., Bruxelles.
Matyas, G., 1999. Rekonstruktion der nacheiszeitlichen Einwan-
derung der Eichen in der Schweiz anhand ihrer Chloroplasten-
DNA. Thesis. ETH Zurich, Switzerland.
Noreen, E.W., 1989. Computer Intensive Methods for Testing
Hypotheses. Wiley, New York.
Olalde, M., Herran, A., Espinel, S., Goicoechea, P.G., 2002. White
oaks phylogeography in the Iberian Peninsula. For. Ecol.
Mgmt. 156, 89–102.
Petit, R.J., Kremer, A., Wagner, D.B., 1993. Geographic structure
of chloroplast DNA polymorphisms in European oaks. Theoret.
Appl. Genet. 87, 122–128.
Petit, R.J., Pineau, E., Demesure, B., Bacilieri, R., Ducousso, A.,
Kremer, A., 1997. Chloroplast DNA footprints of postglacial
recolonization by oaks. Proc. Natl. Acad. Sci. USA 94, 9996–
10001.
Petit, R.J., Brewer, S., Bordacs, S., Burg, K., Cheddadi, R., Coart,
E., Cottrell, J., Csaikl, U.M., van Dam, B.C., Deans, J.D.,
Fineschi, S., Finkeldey, R., Glaz, I., Goicoechea, P.G., Jensen,
J.S., Konig, A.O., Lowe, A.J., Madsen, S.F., Matyas, G.,
Munro, R.C., Popescu, F., Slade, D., Tabbener, H., de Vries,
S.M.G., Ziegenhagen, B., de Beaulieu, J.-L., Kremer, A.,
2002a. Identification of refugia and postglacial colonization
routes of European white oaks based on chloroplast DNA and
fossil pollen evidence. For. Ecol. Mgmt., 156, 49–74.
Petit, R.J., Csaikl, U.M., Bordacs, S., Burg, K., Coart, E., Cottrell,
J., van Dam, B.C., Deans, J.D., Dumolin-Lapegue, S., Fineschi,
S., Finkeldey, R., Gillies, A., Glaz, I., Goicoechea, P.G., Jensen,
J.S., Konig, A.O., Lowe, A.J., Madsen, S.F., Matyas, G.,
Munro, R.C., Pemonge, M.-H., Popescu, F., Slade, D.,
Tabbener, H., Taurchini, D., de Vries, S.M.G., Ziegenhagen,
B., Kremer, A., 2002b. Chloroplast DNA variation in European
A.O. Konig et al. / Forest Ecology and Management 156 (2002) 147–166 165
white oaks: phylogeography and patterns of diversity based
on data from over 2600 populations. For. Ecol. Mgmt., this
156, 5–26.
Pons, O., Petit, R.J., 1995. Estimation, variance and optimal
sampling of gene diversity. I. Haploid locus. Theoret. Appl.
Genet. 90, 462–470.
Rohrig, E., 1980. Waldbau auf okologischer Grundlage. 5. Aufl.,
Erster Band. P. Parey, Hamburg.
Rust, A., 1972. Vor 20.000 Jahren—Rentierjager der Eiszeit. K.
Wachholtz Verlag, Neumunster.
Schadauer, K., 1994. Baumartenatlas fur Osterreich. FBVA-
Berichte Nr. 76. Forstliche Bundesversuchsanstalt, Wien.
Schume, H., Starlinger, F., 1996. Boden- und vegetationskundliche
Gliederung von eichenreichen Waldern im ostlichen Osterreich.
In: Neumann, M. (Hrsg.), Osterreichisches Waldschaden-
Beobachtungssystem, FBVA-Berichte Nr. 93. Schriftenreihe
der Forstlichen Bundesversuchsanstalt, Wien, pp. 11–63.
Seibert, P., 1955. Die Niederwaldwirtschaft des Sudwestfalischen
Berglandes. Allg. Forst- u. Jagdztg. 126, 1–11.
Steinhoff, S., 1998. Results of Quercus hybridization work from
1989 to 1996 at Escherode (Quercus petraea (Matt.) Liebl. and
Quercus robur L.). In: Steiner, K.C. (Ed.), Diversity and
Adaptation in Oak Species. Proceedings of the Second Meeting
of WP 2.08.05 on Genetics of Quercus of the IUFRO, University
Park (State College), PA, October 12–17, 1997. The Pennsylva-
nia State University, University Park, PA, pp. 156–164.
Taberlet, P., Gielly, L., Pautou, G., Bouvet, J., 1991. Universal
primers for amplification of three non-coding regions of
chloroplast DNA. Plant Mol. Biol. 17, 1105–1109.
Wagner, M., Wolter, F., Hausmann, J.F., 1998. Oak and beech
genetic resources in Luxembourg. In: Turok, J., Kremer, A., de
Vries, S. (Comp.), First EUFORGEN Meeting on Social
Broadleaves, Bordeaux, France, October 23–35, 1997. Interna-
tional Plant Genetic Resources Institute, Rome, pp. 86–87.
Ziegenhagen, B., 1981. Die Erhaltung und Umformung des
Niederwaldes im Siegerland und Olper Land aus geschichtli-
cher, waldbaulicher und rechtlicher Sicht. Diplomarbeit,
Landw. Fakultat der Universitat Bonn, 108 pp.
166 A.O. Konig et al. / Forest Ecology and Management 156 (2002) 147–166