The relationship between self-esteem, self-efficacy and sense ...

For Peer Review
Childhood Obesity, Self-Esteem and Health-Related Quality Of Life among Urban Primary Schools Children in Kuching,
Sarawak, Malaysia
Journal: Asia-Pacific Journal of Public Health
Manuscript ID: APJPH-11-May-237
Manuscript Type: Original Manuscript
Keywords:
Public Health Nutrition < FAMILY MEDICINE, Child Health < FAMILY MEDICINE, Epidemiology < PUBLIC HEALTH, Nutrition/Dietetics < PUBLIC HEALTH, Psychological/Behavioural Medicine < PUBLIC
HEALTH
Abstract:
This study aimed to determine the association between obesity, self-esteem and health-related quality of life (HRQOL) among urban primary school children in Kuching, Malaysia. A cross-sectional study involving 311 children aged 12 years was done using the LAWSEQ questionnaire and Paediatric Quality of Life Inventory (PedsQL). The prevalence of overweight was 18.2% and obesity was 15.2%. Both parent and child self-reported PedsQL scores were higher for normal weight children compared to thin and obese, but lower than overweight children. Only parent-proxy PedsQL scores in both psychosocial health and emotional component were
significant different between overweight and obese children (p=0.019, p=0.02). Self esteem score was found to be significantly correlated with parent and child PedsQL scores. Both parent and child PedsQL score among overweight group was found to be higher than normal weight group. This findings help to increase public awareness on the impact of obesity on all aspects of functioning.
http://mc.manuscriptcentral.com/apjph
Asia-Pacific Journal of Public Health

For Peer Review
1
Original Research
Childhood Obesity, Self-Esteem and Health-Related Quality Of Life among Urban Primary
Schools Children in Kuching, Sarawak, Malaysia
Abstract
This study aimed to determine the association between obesity, self-esteem and health-related
quality of life (HRQOL) among urban primary school children in Kuching, Sarawak, Malaysia.A
cross-sectional study involving 311 children aged 12 years was done in Kuching from March to
December 2010. Self-esteem and HRQOL were measured using the LAWSEQ questionnaire and
Paediatric Quality of Life Inventory (PedsQL) respectively.The prevalence of overweight and
obesity were 18.2% and 15.2% respectively. Parent-proxy and child self-reported PedsQL
scores were higher for normal weight children compared to thin and obese children, but lower
than overweight children. At the subscale level, only parent-proxy PedsQL scores in both
psychosocial health and emotional component were significant different between overweight
and obese children (p=0.019, p=0.02). Self esteem score was found to be significantly
correlated with parent and child PedsQL scores. Although obesity was associated with lower
HRQOL among children, both parent and child PedsQL score among overweight group was
found to be higher than normal weight group. Awareness of this relationship can help policy
makers and programme developers in prevention of childhood obesity, particularly to increase
public awareness on the impact of obesity on all aspects of functioning.
Keywords: Overweight/Obesity, Self-Esteem, Health-Related Quality Of Life , Schools Children
Page 1 of 22
http://mc.manuscriptcentral.com/apjph
Asia-Pacific Journal of Public Health
123456789101112131415161718192021222324252627282930313233343536373839404142434445464748495051525354555657585960
For Peer Review
2
Introduction
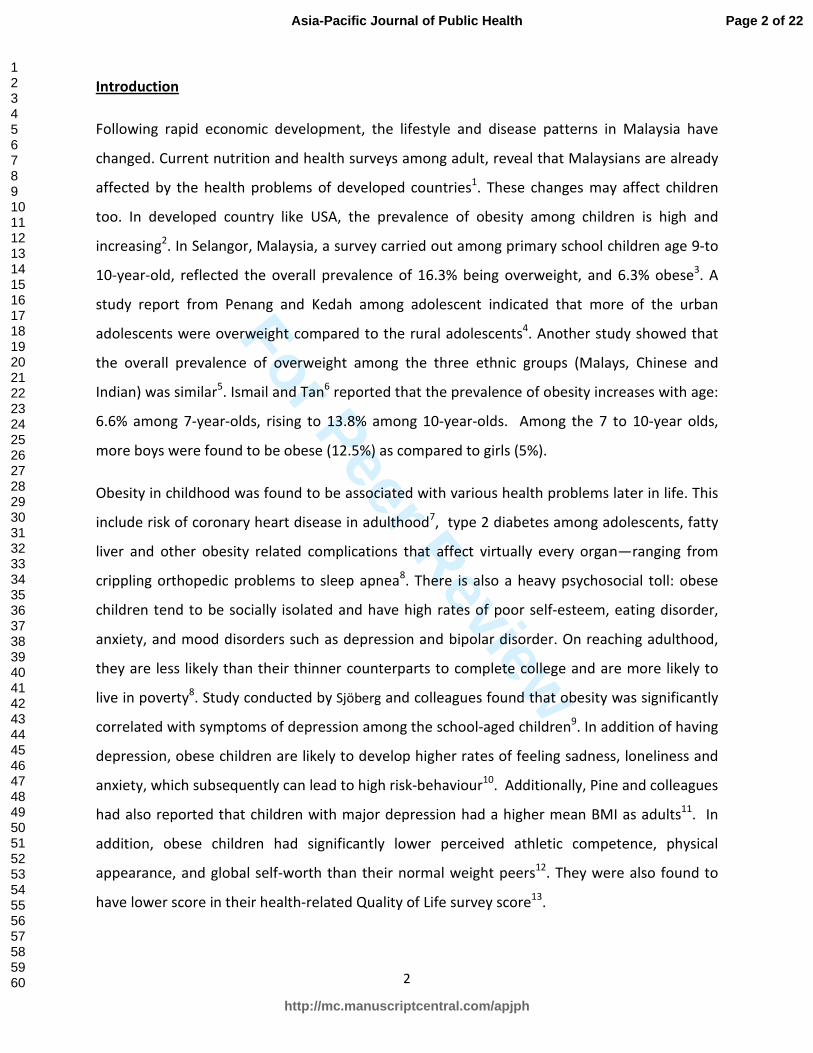
Following rapid economic development, the lifestyle and disease patterns in Malaysia have
changed. Current nutrition and health surveys among adult, reveal that Malaysians are already
affected by the health problems of developed countries1. These changes may affect children
too. In developed country like USA, the prevalence of obesity among children is high and
increasing2. In Selangor, Malaysia, a survey carried out among primary school children age 9-to
10-year-old, reflected the overall prevalence of 16.3% being overweight, and 6.3% obese3. A
study report from Penang and Kedah among adolescent indicated that more of the urban
adolescents were overweight compared to the rural adolescents4. Another study showed that
the overall prevalence of overweight among the three ethnic groups (Malays, Chinese and
Indian) was similar5. Ismail and Tan
6 reported that the prevalence of obesity increases with age:
6.6% among 7-year-olds, rising to 13.8% among 10-year-olds. Among the 7 to 10-year olds,
more boys were found to be obese (12.5%) as compared to girls (5%).
Obesity in childhood was found to be associated with various health problems later in life. This
include risk of coronary heart disease in adulthood7, type 2 diabetes among adolescents, fatty
liver and other obesity related complications that affect virtually every organ—ranging from
crippling orthopedic problems to sleep apnea8. There is also a heavy psychosocial toll: obese
children tend to be socially isolated and have high rates of poor self-esteem, eating disorder,
anxiety, and mood disorders such as depression and bipolar disorder. On reaching adulthood,
they are less likely than their thinner counterparts to complete college and are more likely to
live in poverty8. Study conducted by Sjöberg and colleagues found that obesity was significantly
correlated with symptoms of depression among the school-aged children9. In addition of having
depression, obese children are likely to develop higher rates of feeling sadness, loneliness and
anxiety, which subsequently can lead to high risk-behaviour10
. Additionally, Pine and colleagues
had also reported that children with major depression had a higher mean BMI as adults11
. In
addition, obese children had significantly lower perceived athletic competence, physical
appearance, and global self-worth than their normal weight peers12
. They were also found to
have lower score in their health-related Quality of Life survey score13
.
Page 2 of 22
http://mc.manuscriptcentral.com/apjph
Asia-Pacific Journal of Public Health
123456789101112131415161718192021222324252627282930313233343536373839404142434445464748495051525354555657585960

For Peer Review
3
The cause and effect of obesity was previously investigated in many countries. Factors such as
genetic and environment were found to be the causes of obesity in children. However, in
Malaysia, studies on obesity in childhood are mainly focusing on the prevalence rate. There are
very limited studies investigating the effect of obesity to young children. In Sarawak, East
Malaysia, there is no substantial study available on the influence of obesity on the quality of
life, and self-esteem among primary school children. Furthermore, the ethnic and cultural
background of the community in Sarawak is very different from West Malaysia. Therefore, we
aimed to fill the existing gaps in the effects of overweight and obesity of the school-going
children in Sarawak. It is hoped that these findings would contribute to the development of
future policies in the prevention of obesity in our children. We aimed to determine the effect of
obesity among primary school children and the relationship between obesity, quality of life, and
self-esteem.
Method
Participants
For the purpose of generating prevalence of overweight and obese, all the 12 years-old school
children from seven randomly selected schools were recruited. Children were excluded if they
had any genetic syndromes associated with obesity. Parents were given an information sheet
about the study and a consent form to allow their children to participate. The minimum sample
size was determined using the formula for single proportion (EpiInfo 3.3.2, CDC, USA). Based
on the overweight prevalence of a local study (6.1%) and sampling frame of 45950, the
minimum sample size to achieve with a confidence rate of 95% or more, was estimated to be
approximately 254, with an allowance of 5% of non-response and the precision of the
prevalence of overweight chosen as 2.5%.
Study design
This study utilized cross-sectional design, with quantitative method as the approach.
Page 3 of 22
http://mc.manuscriptcentral.com/apjph
Asia-Pacific Journal of Public Health
123456789101112131415161718192021222324252627282930313233343536373839404142434445464748495051525354555657585960

For Peer Review
4
Procedures
All the school children age 12 year-old in the selected school had their weight and height
measured, for the calculation of body mass index (BMI). Information on household
demographic and socioeconomic was obtained from parents through self-administered a
questionnaires. Both the students and their parents completed the questionnaire on quality of
life. The self-esteem questionnaire was completed by the participants only. These
questionnaires were distributed in three different languages; English, Malay and Mandarin.
Body Mass Index (BMI)
The measurement of height and weight were done with the respondents in school uniform and
socks. Height was measured using a Seca portable body meter. The respondents stood straight
with their back facing the body meter and the measuring beam was pulled down to rest on
their heads. The height was recorded to the nearest ten of a centimetre. Body weight was
measured using a Seca digital weighing scale with an accuracy of 0.1 kilogram. Body Mass Index
(BMI) was calculated based on body weight in kilograms divided by the square of height in
meter. For children and teens, BMI is age-and sex-specific and is often referred to as BMI-for-
age. The calculated BMI was plotted onto BMI-for-age percentiles chart for different gender
and further classified based on WHO reference 200714
.
Health-related quality of life
To measure health-related quality of life, Malaysian-English, Malay and Mandarin translated
versions of Pediatric Quality of Life InventoryTM
4.0 (PedsQLTM
) generic core scales and manual
15, 16, 17, 18 were used. It is a validated 23-items questionnaire for children aged 2 to 18 years.
For this study, the 8-12 version self-report scale with a five-point response scale (0=never a
problem, 1=almost never, 2=sometimes, 3=often and 4=almost always) was used. The measure
consists of four generic core scales, including physical (8 items), emotional (5 items), social (5
items), and school functioning (5 items), as well as two broad domain scores (physical and
psychosocial functioning) and a total general health score. The questionnaire has both children
and parent-proxy version. Scales are standardized to 0-100 scores, with higher scores
indicating better quality of life.
Page 4 of 22
http://mc.manuscriptcentral.com/apjph
Asia-Pacific Journal of Public Health
123456789101112131415161718192021222324252627282930313233343536373839404142434445464748495051525354555657585960

For Peer Review
5
Self-esteem
The LAWSEQ is a 12 items validated instrument used to measure children’s self-esteem. Back to
back translation of the original English version of the questionnaire to Malay and Mandarin was
done and validated during pilot study. Each item consists of answers with ‘yes’ coded as 1, ‘no’
and ‘don’t know’ coded as 0 and item responses summed to give a total score from 0 (high self-
esteem) to 12 (low self-esteem).
Analysis of data
All data collected were analysed using SPSS version 17.0 (SPSS Inc., Chicago). Data was cleaned
for outlier and checked for normality using boxplots and Kolmogorov-Smirnov and Shapiro-
Wilks statistics. Significant association between variables was determined using inferential
statistics based on a p value of less than 0.5 (2-sided).
Results
Socio-demographic data and BMI of students
A total of 677 students from the seven randomly selected schools were weighed and their
height measured with most of them were girls (48.6%, n = 329). About half (50.8%, n=344) of
the students were Chinese, followed by 25.3% (171) Sarawak bumiputra, 23.3% (N=158)
Malays, and only 0.4% (N=3) Indian. About one third (33.4%, n=226) had BMI-for-age at
overweight or obese category. Majority of them (59.5%, n=403) had normal BMI-for-age and
7.1% (48) were underweight (Table 1).
Although all the students were weighed and their height measured only a total of 311 students
and their parents were recruited in this study based on the sample-size estimation. Consents
were obtained from all the parents. The proportion of girls (54.7%, n=170) were found to be
slightly higher than boys (45.3%, n=141). There were more Sarawak Bumiputra participated in
the questionnaires. There were 32.8% (102) of the students in this group had BMI at
overweight or obese category. Majority 59.5% (185) of them had normal BMI-for-age and 7.7%
(24) were underweight. The proportion of students who were overweight or obese was similar
Page 5 of 22
http://mc.manuscriptcentral.com/apjph
Asia-Pacific Journal of Public Health
123456789101112131415161718192021222324252627282930313233343536373839404142434445464748495051525354555657585960

For Peer Review
6
in the students who participated in the questionnaires comparing to those not participated
(Table 1).
Further analysis showed significant higher proportion of boys who were overweight or obese
comparing to girls (Table 2). Although there were no significant difference in the proportion of
students who were overweight or obese among the races, the mean BMI of Sarawak Bumiputra
(20.17 kg/m2, SD=5.46) was higher than Chinese (19.26 kg/m2, SD=4.40).
PedsQL inventory and LAWSEQ scores reported by child-self and parent-proxy
The means, standard deviations, and minimum and maximum scores of the PedsQL inventory
and LAWSEQ are presented in Table 3. Results showed the mean score were higher in children
than parents for all subscales under PedsQL. The score for LAWSEQ was 2.86, fall slightly
towards higher self-esteem level.
Relationship between HRQOL, Self-Esteem and BMI
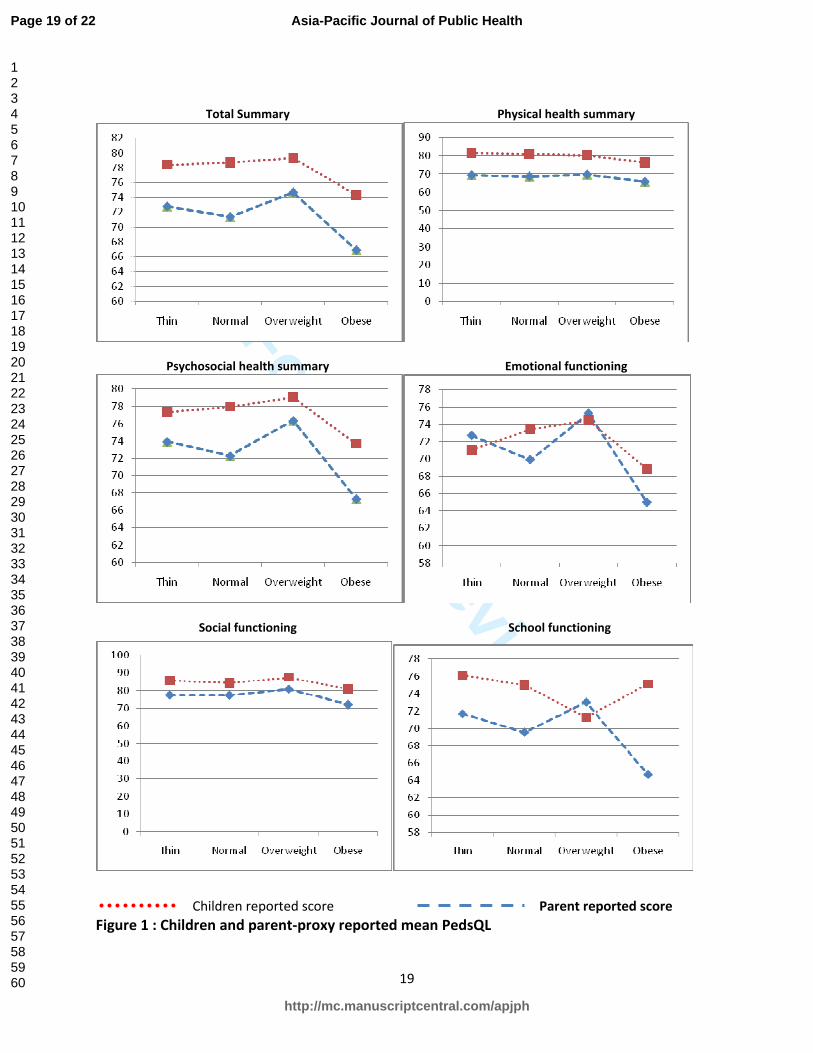
Table 4 illustrates the results of the mean (SD) scores for PedsQL and LAWSEQ by BMI
classification. The results showed that parents reported lower than the children in total score,
physical health score, and psychological health score. However, under the psychological health
subscales, only social functioning score showed similar pattern. Parents with obese children
reported significant lower scores for psychosocial health and emotional scores compared to
children who were overweight. However, for the other subscales, the scores were not
significantly different. There was no significant difference on children’s report for all subscales
of HRQOL and LAWSEQ One interesting finding was all the scores, except for school functioning
score for children, were rated higher for overweight students and their parents. Students who
were thin rated the highest in the LAWSEQ scores.
Mean score for both parent-proxy and child self-reported total PedsQL scores across 4 weight
categories were stratified by sex and race (Table 5). For both parent-proxy and child self-
reported total PedsQL scores, both sex and race indicated a decreased of scores from
overweight to obese categories. Between sex, boys reported to have lower PedsQL scores than
Page 6 of 22
http://mc.manuscriptcentral.com/apjph
Asia-Pacific Journal of Public Health
123456789101112131415161718192021222324252627282930313233343536373839404142434445464748495051525354555657585960
For Peer Review
7
girls for both parent and child proxy. Malay respondents reported to have the lowest PedsQL
scores and Chinese respondents had the highest. Although not significant, parents of
overweight boys and girls reported better PedsQL scores than normal weight children. Post-hoc
test Despite of the above, only PedsQL parent proxy total scores were reported to be significant
difference between overweight and obese categories (p=0.032).
For LAWSEQ score, similarly to PedsQL scores, overweight children reported to be higher self-
esteem as compared to normal weight children, except for Chinese respondents. However,
these differences were not statistically significant. Although boys reported to have lower
PedsQL scores, their level of self-esteem were reported to be higher than girls. Among the
races, Chinese has the highest self-esteem (2.67, SD=1.62), followed by Malay (2.87, SD=1.85)
and Sarawak Bumiputra (3.10, SD=1.85).
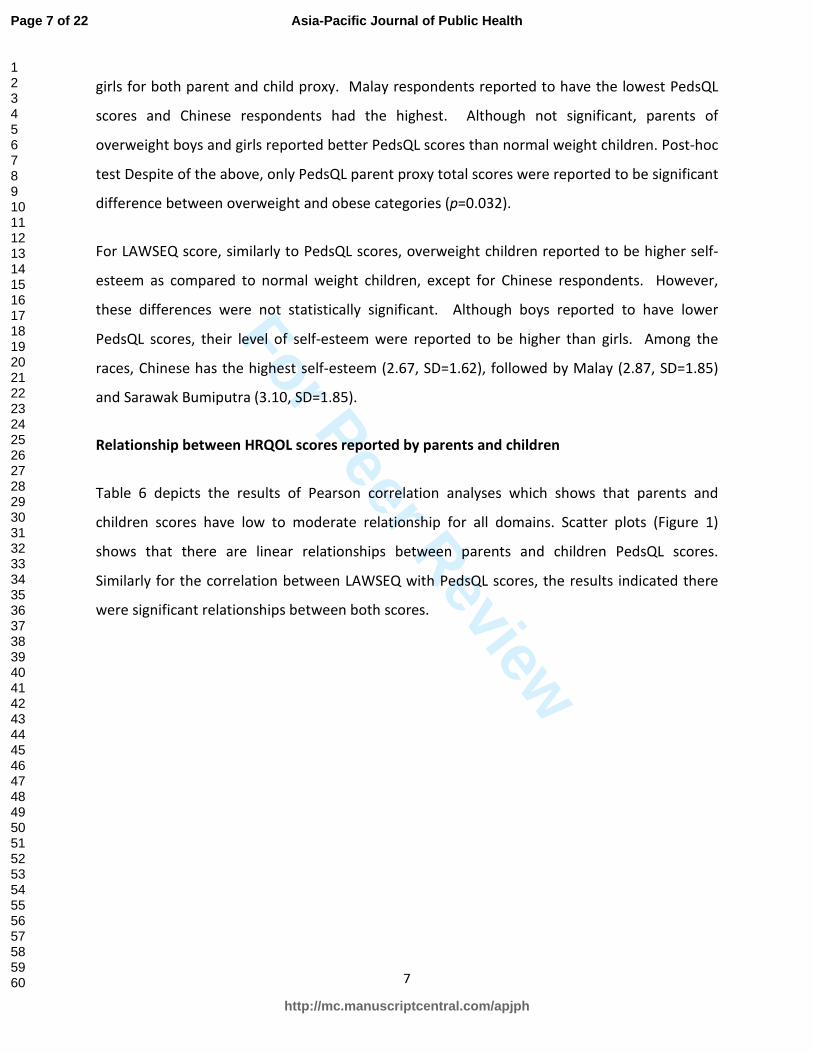
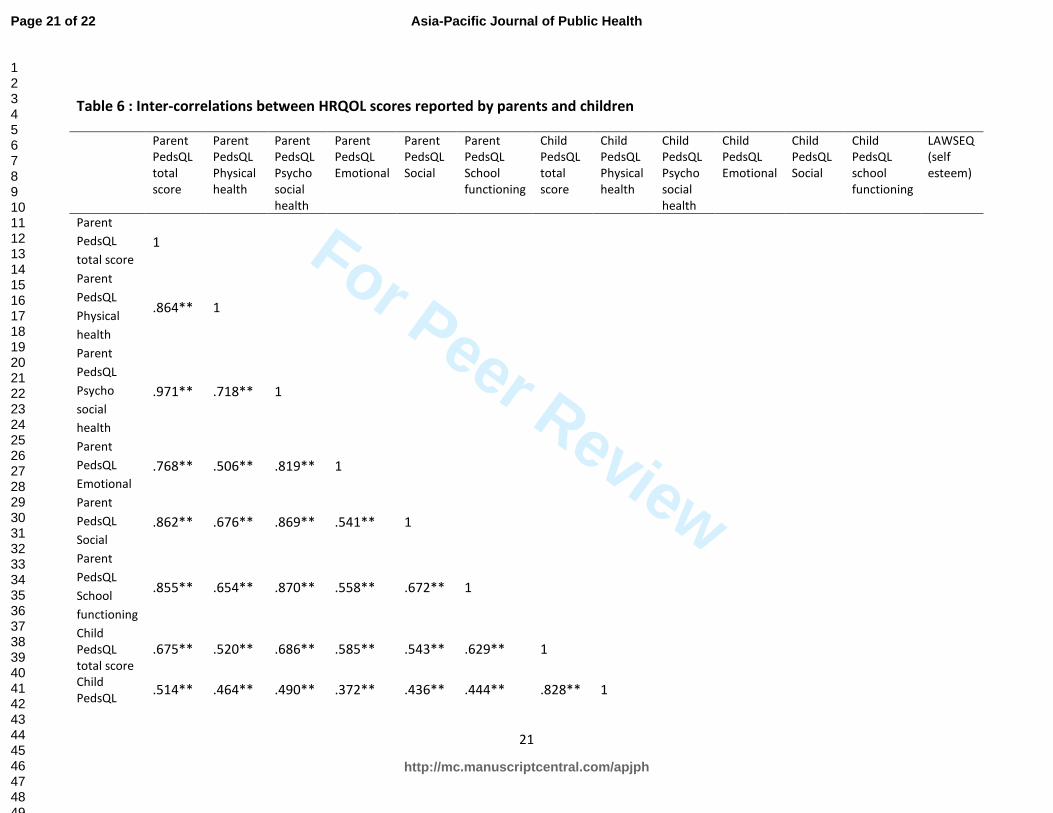
Relationship between HRQOL scores reported by parents and children
Table 6 depicts the results of Pearson correlation analyses which shows that parents and
children scores have low to moderate relationship for all domains. Scatter plots (Figure 1)
shows that there are linear relationships between parents and children PedsQL scores.
Similarly for the correlation between LAWSEQ with PedsQL scores, the results indicated there
were significant relationships between both scores.
Page 7 of 22
http://mc.manuscriptcentral.com/apjph
Asia-Pacific Journal of Public Health
123456789101112131415161718192021222324252627282930313233343536373839404142434445464748495051525354555657585960

For Peer Review
8
Discussions
The prevalence of overweight and obesity among 12 year old children in our study were 18.2%
and 15.2% respectively which was higher than other studies in West Malaysia3,6
. The
prevalence of overweight and obesity in our study had exceeded the National Plan of Action for
Nutrition of Malaysia II (NPANM II) targets of not more than 10% prevalence of overweight and
obesity for children 6 to 12 years old by 201519
. Thus, a proper intervention and treatment
programme for childhood obesity in Kuching is needed to achieve the targets of reducing the
prevalence of obesity of which in turn would reduce the risk of other chronic disease in the
adulthood.
In our study, we found that parents perceived lower HRQOL than children in almost all
domains. Mixed results were found from previous studies20,21,22
. Some studies indicated
parents evaluated the QOL of their children more positively compared to evaluation did by their
children20,21
. This study indicated otherwise. Other studies18
had showed that parents were
more concerned about their children’s body weight and perceived their children’s body mass
index to have an effect on children’s quality of life, particularly on school functioning.
Therefore parents tend to rate their children’s QOL with lower scores, particularly if they
themselves are obese. This is possible as parent own experiences and distress can affect the
way they judge the quality of life for their children. Some children in this study had high self-
reported PedsQL scores. This could be due to they might not have experience the effects of BMI
on their QOL, particularly if they had adapted to their current health status or might never have
experienced a healthier life. They might have assessed their HRQOL by comparing their
expectations with their experiences. Expectations of QOL are learnt experiences and therefore
are highly specific, vary between individuals and are subject to differences in social,
psychological, socioeconomic, demographic, and other cultural factors which may lead to
structural variations in evaluations of the impact on QOL23
. The other possibilities could be the
children under report their health problems and limitations. They might try to give favorable
answers rather their actual feelings.
Page 8 of 22
http://mc.manuscriptcentral.com/apjph
Asia-Pacific Journal of Public Health
123456789101112131415161718192021222324252627282930313233343536373839404142434445464748495051525354555657585960

For Peer Review
9
Our results showed that parents reported significant lower scores for psychosocial and
emotional health for their children who were obese. However, the scores for other domains
were not significantly different, and there was also no significant difference on children’s scores
for all domains. This findings were inconsistent with previous studies conducted in the United
States US13,20
which demonstrates that obese children and adolescents reported significant
impairment not only in total score but also in all domains of QoL. Under subscale scores, except
for school functioning score for children proxy, all PedsQL scores indicated there were higher
scores for overweight children compared to normal weight children. Similar patterns were
found for LAWSEQ scores where overweight children had better self-esteem level as compared
to normal weight children. The reasons for the findings could be due to both respondents
(children and parents) might not perceive overweight as a problem. Children might even
perceive being ‘big size’ had added advantages in physical and mental status, especially among
the Chinese, who has the highest prevalence of overweight children.
More Chinese children tend to be overweight is probably culturally-related. Chinese family
tends to consume much more carbohydrate and food is eaten more often than other ethnic
groups24
. Overeating is accepted in many Chinese families and children are brought up to show
filial love by eating more in front of the parents and overweight and obesity are regarded as
signs for wealth and success25,26
.
Sarawak Bumiputra had the highest prevalence of obesity among the races, reported to have
the lowest PedsQL scores for parent-proxy and LAWSEQ. Variation in cultural concepts, health
perception, parental expectations, and reporting bias can be some of the factors affecting racial
differences in reporting quality of life27
. Sarawak Bumiputra consisted of mostly Iban and
Bidayuh, It was unexpected to find highest prevalence of obesity among them. This is because
they are considered socio-economically more challenged as they are about 36.4% of Iban and
28% of other Bumpitura who are still living below the official poverty line28
. However, other
studies29,30
found that urban poor children tended to have better nutritional status due to their
parents’ better feeding practice and use health services more often among some other
favorable conditions.
Page 9 of 22
http://mc.manuscriptcentral.com/apjph
Asia-Pacific Journal of Public Health
123456789101112131415161718192021222324252627282930313233343536373839404142434445464748495051525354555657585960

For Peer Review
10
Compared to another study done in Singapore with similar population characteristics, this study
reported a lower PedsQL scores for both parent and child proxy. One possible explanation was
the prevalence of overweight and obese for this study was higher than Singapore’s study.
Children with higher BMI-for-age tend to be affected more by perception and prejudice from
the society and peers. Previous studies31,32
did not assess PedsQL among the thin/underweight
categories. This study indicated thin children, compared to those of normal weight, were
having lower PedsQL, but the difference was not statistically significant. Future studies should
examine this phenomena among underweight children as it may affect their physical and
mental well-being.
Our study had shown that the correlation between parent and child scores was low to
moderate for all domains which was consistent with another study by Cremeens et al.33
The
differences in the levelof parent-child agreement previously reported may be an artifact of the
statistical method used. In addition, the confounding factors such as child age, gender, and
parent’s own QOL and relationship to the child could also affect the level of agreement33
.
Conclusion
The prevalence of overweight and obesity was high among 12 year old children in Kuching,
Sarawak. HRQOL might not be able to reflect the actual feeling of obese children as other
factors might affect their perception of obesity and there was also weak correlation between
parents HRQOL score with their children score. Public awareness of childhood obesity and its
related health problems is important to change the perception of children and parents. Action
for the development and implementation of programmes and national policies for the
prevention of childhood obesity should include increasing public awareness and target to
change the perception on childhood obesity among children and parents.
Page 10 of 22
http://mc.manuscriptcentral.com/apjph
Asia-Pacific Journal of Public Health
123456789101112131415161718192021222324252627282930313233343536373839404142434445464748495051525354555657585960
For Peer Review
11
Acknowledgement
The authors acknowledged the support given under the university fund. The authors would also
like to thank the Director of Bahagian Perancangan dan Penyelidikan Dasar Pendidikan,
Kementerian Pelajaran Malaysia, for the permission to conduct the study at the schools. We
would extend our sincere gratitude to the headmasters, headmistresses and teachers of all the
schools involved, for their contribution during the field work. The Quality of Life study described
in this paper was carried out using the PedsQL, developed by Dr. James W. Varni.
Page 11 of 22
http://mc.manuscriptcentral.com/apjph
Asia-Pacific Journal of Public Health
123456789101112131415161718192021222324252627282930313233343536373839404142434445464748495051525354555657585960

For Peer Review
12
References
1. Ismail MN, Chee SS, Nawawi H, Yusoff K, Lim TO, James WP. Obesity in Malaysia. Obesity
Review 2002 Aug;3(3):203-8.
2. Birch LL, Fisher JO. Development of eating behaviors among children and adolescents.
Pediatrics 1998 Mar;101(3 Pt2):539-49.
3. Anuar Zaini MZ, Lim CT, Low WY, Harun F. Factors affecting nutritional status of
Malaysian primary school children. Asia-Pacific Journal of Public Health 2005 17(2): 71-
80.doi : 10.1171/101053950501700203. Available at
http://aph.sagepub.com/content/17/2/71. [Accessed 10 December 2010].
4. Zalilah MS, Mirnalini K, Khor GL, Merlin A, Bahaman AS, Norimah K. Estimates and
distribution of body mass index in sample of Malaysian adolescents. Medical Journal of
Malaysia 2006 Mar;61(1):48-58.
5. Moy FM, Gan CY, Zaleha MK. Body mass status of school children and adolescents in
Kuala Lumpur, Malaysia. Asia Pacific Journal of Clinical Nutrition 2004;13(4):324-9.
6. Ismail MN, Tan CL. Prevalence of obesity in Malaysia. Country Report at the Regional
Advisory Meeting on Obesity. August 1988. Manila, Philipines.
7. Jennifer LB, Lina WO, Thorkild IAS. Childhood Body-Mass Index and the Risk of Coronary
Heart Disease in Adulthood. New England Journal of Medicine 2007 Dec; 357(23):2329-
37.
8. David SL. Childhood Obesity—The shape of Things to Come. New England Journal of
Medicine 2007 Dec;357(23) :2325-27.
9. Sjöberg RL, Nilsson KW, Leppert J. Obesity, Shame, and Depression in School-Aged
Children: A Population-Based Study. Pediatrics 2005 Sep (116):389-392.
10. Strauss R. Childhood obesity and self-esteem. Pediatrics 2000 Jan (105) e15.
11. Pine DS, Goldstein RB, Wolk S, Weissman MM. The association between childhood
depression and and adulthood body mass index. Pediatrics 2001; 107 (5): 1049-1056.
12. Franklin J, Denyer G, Steinbeck KS, Caterson ID, Hill AJ. Obesity and risk of low self-
esteem: a statewide survey of Australian children. Pediatrics 2006 Dec;118(6):2481-
2487.
Page 12 of 22
http://mc.manuscriptcentral.com/apjph
Asia-Pacific Journal of Public Health
123456789101112131415161718192021222324252627282930313233343536373839404142434445464748495051525354555657585960
For Peer Review
13
13. William J, Wake M, Hesketh K, Maher E, Waters E. Health-related quality of life of
overweight and obese children. The Journal of American Medical Association 2005 Jan
5;293(1):70-6.
14. World Health Organization. BMI-for-age (5-19 years). Available at http://www.
cdc.gov/nccdphp/dnpa/bmi/childrens_BMI/about_childrens_BMI.htm. [Accessed on 3
Dec 2008]. 2007.
15. Varni JW, Seid M, Rode CA. The PedsQL: Measurement Model for the Pediatric Quality
of Life Inventory. Medical Care 1999;37(2):126-139.
16. Varni JW, Seid M, Kurtin PS. The PedsQL 4.0: Reliability and validity of the Pediatric
Quality of Life Inventory Version 4.0 Generic Core Scales in healthy and patient
populations. Medical Care 2001; 39(8): 800-812.
17. Varni JW, Seid M, Kurtin PS. The PedsQL 4.0 Generic Core Scales: Sensitivity,
responsiveness, and impact on clinical decision-making. Journal of Behavioral Medicine
2002; 25:175-193.
18. Varni, J.W., Burwinkle TM, Seid M, Skarr D. The PedsQL 4.0 as a pediatric population
health measure: Feasibility, reliability, and validity. Ambulatory Pediatrics 2003;3:329-
341.
19. Ministry of Health (MOH). Standard Operating Procedures. School Health Service, Family
Health Development Division. Kuala Lumpur, Ministry of Health Malaysia.
20. Schwimmer JB, Burwinkle TM, Varni JW. Health Related Quality of Life of Severely Obese
Children and Adolescents. Journal of American Medical Association [Online].
2003;289(14):1813-1819. Available at: http://jama.ama-assn.org [Accessed 10
December 2010]
21. Jozefiak T, Larsson B, Wichstrøm L, Mattejat F, and Ravens-Sieberer U. Quality of Life as
reported by school children and their parents: a cross-sectional survey. Health and
Quality of Life Outcomes 2008 [Online]. 6:34 doi:10.1186/1477-7525-6-34. Available at
http://www.hqlo.com. [Accessed 10 December 2010].
22. Ostbye T, Malhotra R, Wong HB, Tan SB, Saw SM. The effect of body mass on health-
related quality of life among Singaporean adolescents : results from the SCORM study.
Quality of Life Research 2010;19:167-176.
Page 13 of 22
http://mc.manuscriptcentral.com/apjph
Asia-Pacific Journal of Public Health
123456789101112131415161718192021222324252627282930313233343536373839404142434445464748495051525354555657585960
For Peer Review
14
23. Carr AJ, Gibson B, Robinson PG. Measuring quality of life. Is quality of life determined by
expectations or experience? British Medical Journal 2004;322:1240–1243.
24. Kasmini K, Idris MN, Fatimah A, Hanafiah S, Iran H, Asmah Bee MN. Prevalence of
overweight and obese school children aged between 7 to 16 years amongst the major 3
ethnic groups in Kuala Lumpur, Malaysia. Asia Pacific Journal of Clinical Nutrition
1997;6(3):172-174.
25. Lee S, Chin HFK, Chen C. Anorexia Nervosa in Hong Kong; why not more in Chinese.
British Journal of Psychology 1989; 154: 683-688.
26. Zhang Y, Wang S. Prevalent change in overweight and obesity in children and
adolescents from 1995 to 2005 in Shandong, China. Asia Pacific Journal of Public Health.
Published online before print May 10, 2010,doi: 10.1177/1010539509360571. Available
at: http://aph.sagepub.com/content/early/2010/02/26/1010539509360571 [Accessed 3
May 2011].
27. Ng TP, Lim LC, Jin A, Shinfuku N. Ethic differences in quality of life in adolescents among
Chinese, Malay and Indians in Singapore. Quality of Life research 2005;14(7):1755-1768.
28. Berma M, Shahadan F, Abdul Gapor. Alleviating Bumiputera Poverty in Sarawak:
Reflections and Proposal [online]. Available at: eprints.usm.my/.../Alleviating_
Bumiputera_Poverty_In_Sarawak_Reflections_And_Proposal.pdf . [Accessed 10 April
2011]
29. Smith LC, Ruel MT, Ndiaye A. Why is child malnutrition lower in urban than rural areas?
Evidence from 36 developing countries [online]. Available at : www.ifpri.org › Discussion
Papers ›. [Accessed 10 April 2011]
30. Garrett J, Ruel MT. Are determinants of rural and urban food security and nutritional
status different? Some insights from Mozambique. World Development 1999; 27(11):
1955-1975.
31. William J, Wake M, Hesketh K, Mather E, Waters E. Health-related quality of life of
overweight and obese children. Journal of American Medical Association
2005;293(1):70-76.
32. Zeller MH, Modi AC. Predictors of Health-related quality of life in obese youth. Obesity
2005;14(1):122-130.
Page 14 of 22
http://mc.manuscriptcentral.com/apjph
Asia-Pacific Journal of Public Health
123456789101112131415161718192021222324252627282930313233343536373839404142434445464748495051525354555657585960

For Peer Review
15
33. Cremeens J, Eiser C, Blades M. Factor influencing agreement between childself-report
and parent-proxy reports on Pediatric Quality of Life InventoryTM
4.0 (PedsQLTM
) generic
core scales. Health and Quality of Life Outcomes 2006 [Online]. 4.58 doi: 10.1186/1477-
7525-4-58. Available at: http://www.hqlo.com/content/4/1/58 [Accessed 10 December
2010].
Page 15 of 22
http://mc.manuscriptcentral.com/apjph
Asia-Pacific Journal of Public Health
123456789101112131415161718192021222324252627282930313233343536373839404142434445464748495051525354555657585960

For Peer Review
16
Table 1: Socio-demographic data and BMI of students (N=677)
Participants Non Participants Total students
Gender
Boys
Girls
141 (45.3%)
170 (54.7%)
207 (56.6%)
159 (43.4%)
348 (51.4%)
329 (48.6%)
Race
Malay
Chinese
Sarawak Bumiputra
Indian & Others
68 (21.9%)
141 (45.3%)
101 (32.5%)
1 (0.3%)
90(24.6%)
203(55.5%)
70 (19.1%)
3 (0.8%)
158 (23.3%)
344 (50.8%)
171 (25.3%)
4 (0.5%)
BMI
Thin
Normal
Overweight
Obesity
24 (7.8%)
185 (59.5%)
55 (17.7%)
47 (15.1%)
24 (6.6%)
218 (59.6%)
68 (18.6%)
56 (15.3%)
48 (7.1%)
403 (59.5%)
123 (18.2%)
103 (15.2%)
Page 16 of 22
http://mc.manuscriptcentral.com/apjph
Asia-Pacific Journal of Public Health
123456789101112131415161718192021222324252627282930313233343536373839404142434445464748495051525354555657585960

For Peer Review
17
Table 2 : Association of BMI category with Sex and Race
BMI category
Thin Normal Overweight Obese p value
Sex 0.012
Boy (n=348) 16(4.6%) 194 (55.7%) 73 (21%) 65 (18.7%)
Girl (n=329) 32 (9.7%) 209 (63.5%) 50 (15.2%) 38 (11.5%)
Race 0.801
Malay (n=158) 10(6.3%) 99 (62.7%) 26 (16.4%) 23 (14.6%)
Chinese (n=344) 25 (7.3%) 208 (60.5%) 68 (19.8%) 43 (12.5%)
Sarawak Bumiputra
(n=171)
13 (7.6%) 94 (55.0%) 28 (16.4%) 36 (21%)
Indian & others (n=4) 0 (0%) 2 (50%) 1 (25%) 1 (25%)
Table 3: The PedsQL and LAWSEQ score (N=311)
Scale No. of item Min - Max Mean SD
PedsQL
Parent proxy-report
Total score 23 30.31-100 71.39 16.73
Physical health score 8 12.5-100 68.39 22.94
Psychosocial health score 15 30-100 72.38 16.17
Emotional 5 10-100 70.34 18.83
Social 5 15-100 77.23 19.45
School functioning 5 25-100 69.58 18.60
Chidren proxy-report
Total score 23 40.94-100 78.14 13.99
Physical health score 8 25-100 80.16 15.76
Psychosocial health score 15 36.67-100 77.46 14.60
Emotional 5 20-100 72.75 18.39
Social 5 15-100 84.5 16.17
School functioning 5 30-100 75.13 16.48
LAWSEQ 12 0-9 2.86 1.85
Page 17 of 22
http://mc.manuscriptcentral.com/apjph
Asia-Pacific Journal of Public Health
123456789101112131415161718192021222324252627282930313233343536373839404142434445464748495051525354555657585960

For Peer Review
18
Table 4 : PedsQL and LAWSEQ scores by BMI classification
Mean (SD)
Whole
sample
Thin Normal Overweight Obese p value
PedsQL
Parent proxy
report
Total score 71.39
(16.73)
72.78
(16.43)
71.37
(16.37)
74.67
(17.26)
66.90
(17.18)
.128
Physical health
score
68.39
(22.94)
69.27
(21.27)
68.60
(23.11)
69.60
(25.08)
65.69
(20.85)
.838
Psychosocial
health score
72.38
(16.17)
73.96
(15.7)
72.29
(15.52)
76.36
(17.09)
67.31
(16.91)
.041a
Emotional 70.34
(18.83)
72.71
(16.08)
69.92
(18.57)
75.27
(19.42)
65.00
(19.42)
.045a
Social 77.23
(19.45)
77.50
(20.69)
77.41
(19.27)
80.82
(17.47)
72.23
(21.26)
.172
School
functional
69.58
(18.60)
71.67
(16.33)
69.54
(17.75)
73.00
(19.64)
64.68
(21.04)
.143
Child proxy
report
Total score 78.14
(13.99)
78.40
(12.10)
78.71
(14.19)
79.34
(13.26)
74.34
(14.70)
.244
Physical health
score
80.16
(15.76)
81.51
(15.06)
80.93
(15.07)
80.28
(16.73)
76.33
(17.48)
.336
Psychosocial
health score
77.46
(14.60)
77.36
(12.14)
77.96
(14.79)
79.03
(14.03)
73.69
(15.46)
.263
Emotional 72.75
(18.39)
71.04
(16.74)
73.46
(18.35)
74.45
(18.33)
68.83
(19.40)
.379
Social 84.5
(16.17)
85.63
(13.78)
84.32
(15.41)
87.64
(15.51)
80.96
(20.23)
.216
School
functional
75.42
(16.34)
76.11
(16.02)
75.00
(15.84)
71.28
(18.87)
75.13
(16.48)
.359
LAWSEQ 2.86
(1.85)
3.54 (2.17) 2.83 (1.74) 2.60 (2.03) 2.89
(1.85)
.223
a Post Hoc test indicated significant different between overweight and obese group
Page 18 of 22
http://mc.manuscriptcentral.com/apjph
Asia-Pacific Journal of Public Health
123456789101112131415161718192021222324252627282930313233343536373839404142434445464748495051525354555657585960
For Peer Review
19
Total Summary Physical health summary
Psychosocial health summary Emotional functioning
Social functioning School functioning
Figure 1 : Children and parent-proxy reported mean PedsQL
Children reported score Parent reported score
Page 19 of 22
http://mc.manuscriptcentral.com/apjph
Asia-Pacific Journal of Public Health
123456789101112131415161718192021222324252627282930313233343536373839404142434445464748495051525354555657585960

For Peer Review
20
Table 5 PedsQL and LAWSEQ scores by BMI category, stratified by potential confounding variables
Mean (SD) p value Total No. Of
respondents Total Thin Normal Overweight Obese
PedsQL Parent-proxy Total Score
Sex
Boy 141 70.49
(16.13)
75.95
(16.86)
70.41
(16.37)
73.70
(14.72)
66.04
(16.14)
.231
Girl 170 72.13
(17.22)
70.89
(16.45)
72.04
(16.41)
75.61
(19.63)
68.29
(19.14)
.551
Race .032a
Malay 68 65.25
(16.89)
76.33
(17.46)
63.80
(14.67)
72.29
(19.18)
53.96
(18.11)
Chinese 141 77.62
(13.41)
79.73
(8.78)
77.09
(13.58)
80.38
(14.31)
74.47
(13.28)
.478
Sarawak
Bumiputra
101 66.89
(17.97)
61.45
(18.53)
68.37
(18.59)
65.93
(17.70)
65.76
(17.07)
.748
PedsQL Child-proxy Total Score
Sex
Boy 141 76.53
(14.52)
75.73
(12.49)
78.05
(14.65)
76.13
(14.34)
73.17
(15.02)
.493
Girl 170 79.47
(13.43)
80.00
(12.00)
79.16
(13.92)
82.44
(11.56)
76.24
(14.38)
.480
Race
Malay 68 72.33
(15.51)
76.22
(13.81)
73.15
(14.94)
71.76
(16.60)
65.94
(18.99)
.034
Chinese 141 81.89
(12.24)
85.17
(10.35)
81.79
(12.51)
83.48
(11.92)
77.79
(12.29)
.380
Sarawak
Bumiputra
101 76.75
(13.81)
71.56
(9.18)
78.02
(15.03)
77.69
(10.07)
74.74
(14.18)
.551
LAWSEQ Score
Sex
Boy 141 2.73
(1.87)
4.00
(2.65)
2.64
(1.61)
2.30 (2.25) 2.97
(1.74)
.099
Girl 170 2.96
(1.84)
3.27
(1.87)
2.96
(1.82)
2.89 (1.79) 2.78
(2.13)
.891
Race
Malay 68 2.87
(1.87)
2.83
(1.72)
2.98
(1.69)
2.83 (2.66) 2.38
(1.77)
.878
Chinese 141 2.67
(1.85)
3.30
(2.67)
2.63
(1.71)
2.68 (1.98) 2.53
(1.88)
.733
Sarawak
Bumiputra
101 3.10
(1.85)
4.38
(1.69)
3.04
(1.83)
2.27 (1.62) 3.36
(1.89)
.058
aPost-hoc test significant difference between overweight and obese categories
Page 20 of 22
http://mc.manuscriptcentral.com/apjph
Asia-Pacific Journal of Public Health
123456789101112131415161718192021222324252627282930313233343536373839404142434445464748495051525354555657585960
For Peer Review
21
Table 6 : Inter-correlations between HRQOL scores reported by parents and children
Parent
PedsQL
total
score
Parent
PedsQL
Physical
health
Parent
PedsQL
Psycho
social
health
Parent
PedsQL
Emotional
Parent
PedsQL
Social
Parent
PedsQL
School
functioning
Child
PedsQL
total
score
Child
PedsQL
Physical
health
Child
PedsQL
Psycho
social
health
Child
PedsQL
Emotional
Child
PedsQL
Social
Child
PedsQL
school
functioning
LAWSEQ
(self
esteem)
Parent
PedsQL
total score
1
Parent
PedsQL
Physical
health
.864** 1
Parent
PedsQL
Psycho
social
health
.971** .718** 1
Parent
PedsQL
Emotional
.768** .506** .819** 1
Parent
PedsQL
Social
.862** .676** .869** .541** 1
Parent
PedsQL
School
functioning
.855** .654** .870** .558** .672** 1
Child
PedsQL
total score
.675** .520** .686** .585** .543** .629** 1
Child
PedsQL .514** .464** .490** .372** .436** .444** .828** 1
Page 21 of 22
http://mc.manuscriptcentral.com/apjph
Asia-Pacific Journal of Public Health
123456789101112131415161718192021222324252627282930313233343536373839404142434445464748495051525354555657585960

For Peer Review
22
Physical
health
Child
PedsQL
Psycho
social
health
.678** .497** .700** .613** .537** .643** .979** .698** 1
Child
PedsQL
Emotional
.595** .415** .625** .642** .435** .525** .856** .589** .882** 1
Child
PedsQL
Social
.507** .362** .529** .412** .476** .464** .826** .622** .831** .590** 1
Child
PedsQL
school
functioning
.640** .503** .645** .509** .476** .669** .838** .589** .859** .649** .569** 1
LAWSEQ
(self
esteem)
-.161** -.069** -.189** -.175** -.131** -.179** -.283** -.155** -.306** -.203** -.346** -.247** 1
** Significant at p≤0.01
Page 22 of 22
http://mc.manuscriptcentral.com/apjph
Asia-Pacific Journal of Public Health
123456789101112131415161718192021222324252627282930313233343536373839404142434445464748495051525354555657585960
Copyright © 2022 FDOKUMEN