chetnical - UFDC Image Array 2
52
z 0 u ::::, C w IL, 0 z 0 in > Q C) z iii: w w z C) z w ...I u ! ::c u chetnical VOLUME XVIII • NUMBER 1 • WINTER 1984
-
Upload
khangminh22 -
Category
Documents
-
view
6 -
download
0
Transcript of chetnical - UFDC Image Array 2

z 0 ~ u ::::, C w
IL,
0 z 0 in > Q C) z iii: w w z C) z w ...I ~ u ! ::c u
chetnical
VOLUME XVIII • NUMBER 1 • WINTER 1984

3M COMPANY
... /fu~r; CHEMICAL ENGINEERING EDUCATION

EDITORIAL AND BUSINESS ADDRESS
Department of Chemical Engineering University of Florida Gainesville, Florida 32611
Editor: Ray Fahien (904) 392-0857
Consulting Editor: Mack Tyner
Managing Editor: Carole C. Yocum (904) 392-0861
Publications Board and Regional Advertising Representatives:
Chairman: Lee C. Eagleton Pennsylvania State University
Past Chairman: Klaus D. Timmerhaus University of Colorado
SOUTH: Homer F. Johnson University of Tennessee J ack R . Hopper Lamar University
James Fair University of Texas Gary Poehlein Georgia Tech
CENTRAL: R obert F . Anderson UOP Process Division Lowell B. Koppel Purdue University
WEST: William B. Krantz University of Colorado C. Judson King University of California Berkeley Frederick H. S hair California Institute of Technology
NORTHEAST: Angelo J. Perna New Jersey Institute of Technology Stuart W. Churchill University of Pennsylvania Raymond Baddour M.I.T. A. TV. W esterberg Carnegie-Mellon University
NORTHWEST: Charles Sleicher University of Washington
CANADA: Leslie W. Shemilt McMaster University
LIBRARY REPRESENTATIVE Thomas W. Weber State University of New York
WINTER 1984
Chemical VOLUME XVIII
Engineering NUMBER l
DEPARTMENTS
Education WINTER 1984
2 Department of Chemical Engineering Northwestern University
John C. Slattery
6 The Educator Richard C. Alkire of Illinois,
Illinois Colleagues
Laboratory 10 A Grand Sale: $12 for a Dozen Experiments
in CRE, Zhang Guo-Tai, Hau Shau-Drang
20 New Adsorption Methods, Phillip C. Wankat
Classroom 14 Two Computer Programs for Equipment
Cost Estimation and Economic Evaluation of Chemical Processes, Carlos J. Kuri, Armando B. Corripio
26 The Process Design Courses at Pennsylvania: Impact of Process Simulators, Warren D. Seider
34 Modular Instruction Under Restricted Conditions, Tjipto Utomo, Kees Ruijter
30 Curriculum Introducing the Regulatory Process into
the Chemical Engineering Curriculum: A Painless Method, Franklin G. King, Ramesh C. Chaw la
38 Class and Home Problems Setting the Pressure at Which to Conduct a
Distillation, Allen J. Barduhn
9 Positions Available 9, 37 Book Reviews 18, 48 Books Received 19 In Memoriam J. H. Erbar 19 Stirred Pots
CHEMICAL ENGINEERING EDUCATION is published quarterly by Chemical Engineering Division, American Society for Engineering Education. The publication is edited at the Chemical Engineering Department, University of Florida. Second-class postage is paid at Gainesville, Florida, and at DeLeon Springs, Florida. Correspondence regarding editorial matter, circulation and changes of address should be addressed to the Editor at Gainesville, Florida 32611. Advertising rates and information are available from the advertising representatives. Plates and other advertising material may be sent d irectly to the printer: E. 0. Painter Printing Co., P . 0. Box 877, DeL eon Sp r ings, F lorida 32028. Subscript ion ra te U .S. , Canada, and Mexico is $2 0 p e r year, $15 p er year m a iled to m embers of AIChE and of the ChE Div is ion of ASEE. Bulk subscription rates to ChE faculty on request. Write for prices on individual back copies. Copyright © 1984 Chemica] Eng ineering Div is ion of American Society for Engineering Education. The statement.s and opinions expressed in this periodical are those of the writers and not necessarily those of the ChE Division of the ASEE which body assumes no responsibility for them. Defective copies replaced if notified within 120 days.
The International Organization for Standardization has assigned the code US ISSN 0009-2479 for the identification of this periodical.
1

The Technologica l Institute, home of the Department of Chemical Engineering.
[., ;j pll department
NORTHWESTERN UNIVERSITY . .. THE NORTHWESTERN 'PHILOSO'PHY
JOHN C. SLATTERY Northwestern University Evanstan, IL 60201
J F YOU READ NO further than this first para-graph, I would like you to leave with the im
pression that we take pride in our teaching, that we strive to be on the forefront in our research, and that we are committed to meaningful contact with our students. Those priorities provide the guiding philosophy for the department.
This philosophy has been tested by time. This year marks the 40th anniversary of the first class graduating in chemical engineering from the Technological Institute. We awarded our first master's degree in 1945 and our first PhD in 1948.
Our department now includes 18 faculty, 250 undergraduate and 100 graduate students, six visiting scholars, and three postdoctoral fellows. Since modern chemical engineering research is increasingly interdisciplinary in nature, a number of the faculty hold joint appointments with other
© Copyright ChE Division, ASEE. 1984
2
As we have become co~vinced of the synergism, we have
chosen to emphasize several broad areas of research rather than 18 individual activities.
depar~ment~: biomedical engineering, chemistry, materials science and engineering, mechanical and nuclear engineering, and neurobiology / physiology.
~o scale for the comparison of chemical engineermg graduate programs exists. It is clear that, while t~~ _departments all offer excellent faculty and fac1hhes, there are differences in educational philosophy and in the research interests of their faculties. Our department strives to maintain a balanced commitment to teaching and research. The training of graduate and undergraduate students is taken seriously by all of us.
The prerequisites for admission to graduate wor~ include a bachelor's degree in chemical engineeri~g from a university or college of recognized standmg. Graduates of a curriculum in science or in other fields of engineering whose programs
CHEMICAL ENGINEERING EDUCATION

have included sufficient courses in chemistry, mathematics, and physics will also be accepted for graduate work in chemical engineering. However, they may be required to take selected undergraduate courses without credit, in addition to the normal graduate program.
An individual plan of study is arranged for each student after consultation between the student, his or her adviser, and the graduate committee of the department. Every effort is made to design a program covering the fundamentals of modern chemical engineering science and technology while allowing for individual specialization in particular fields of interest.
For the MS degree, we require a minimum of nine (quarter) courses. Research and the preparation of an acceptable thesis may be an alternative to three extra courses.
For the PhD, a minimum of 18 (quarter) courses are required beyond the BS degree or nine (quarter) courses beyond the MS. Students are guided towards this program based on their classroom performances. The formal qualifying exam is oral and focused on the research topic proposed for the thesis. We have no language requirements.
As we have become convinced of the synergism, we have chosen to emphasize several bro2d areas of research rather than 18 individual activities. In the descriptions that follow, observe that we have encouraged for the same reason interactions between faculty which cross department boundaries. The single paragraphs devoted to individual faculty are meant to give an impression of their activities rather than to summarize their multifaceted research programs.
RESEARCH
Chemical Reaction Engineering. The largest single area is chemical reaction engineering: kinetics, catalysis, chemical reactor design, and combustion. There are five faculty active in this area: John B. Butt, Joshua S. Dranoff, Harold H. Kung (who has a joint appointment with chemistry), Chung K. Law (who has a joint appointment with mechanical and nuclear engineering), and Wolfgang M. H. Sachtler (who has a joint appointment with chemistry). This group features extraordinary interactions with faculty in materials science and engineering, chemistry, and physics through the Catalysis Research Center, which will soon have its own building adjacent to the Technological Institute.
John Butt's work in catalysis has been largely
WINTER 1984
in the area of supported metal catalysts. His group's current research is devoted to the study of hydrogenolysis and hydrogenation reactions on supported Pt group metals and to synthesis reactions on supported iron alloys. Particular emphasis is given to the relationship between the morphology of the supported metal crystallites and their activity and selectivity properties. More generally, John Butt is concerned with the interrelation between catalyst deactivation and chemical process dynamics.
The work of Josh Dranoff and his students in photochemical reaction engineering has previously involved gas and liquid phase photochlorination reactions as well as solution photopolymerization.
A practice race in view of the campus.
Current emphasis is focused on the study of novel photoreactor designs in which the photoinitiation and subsequent thermal reaction steps common to many photoreactions of interest are carried out in spatially segregated zones.
Harold Kung is pursuing the reasons for high selectivities in. oxide catalysis. Using modern surface science and catalyst characterization techniques, his group has prepared and characterized both model single crystal oxide catalysts that have high concentrations of a particular type of surface defect, such as anion or cation vacancies, as well as microcrystalline oxide catalysts smaller than 10 nm that possess unusually high selectivities.
A viable approach to enhance combustion efficiency and reduce pollutant formation is through lean combustion. Since lean mixtures are hard to ignite and easy to extinguish, the use of heterogeneous catalysts can significantly extend the lower flammability limits of these mixtures. Ed
3

Law's group is working to identify the dominant catalytic mechanisms and to determine the associated overall kinetic constants for hydrocarbon / air mixtures flowing over different catalysts.
Wolfgang Sachtler and Harold Kung are studying stereospecific catalysts with the objective of understanding the relationship between the geometry of the active site and catalytic selectivity. On the basis of Wolfgang Sachtler's previous work, it has been proposed that many such reactions involve a dual site mechanism. Their research is aimed towards checking this model and evaluating the prospects of dual site hydrogenation catalysts in general.
Interfacial and Multiphase Transport Phenomena. We have three faculty working in the general area of interfacial and multiphase trans-
to a series of fundamental problems concerned with dynamic interfacial behavior and multiphase flows arising in the context of oil production. For example, we have been investigating the influence of the interfacial viscosities upon displacement and the stability of displacement of residual oil from old oil fields.
Polymer Science. Our three faculty whose primary interests are in the area of polymers have joint appointments with materials science and engineering: Stephen H. Carr, Buckley Crist Jr., and John M. Torkelson.
Plastic films that possess either permanent electrical polarizations or electrical conductivity are currently being used as the active elements in such devices as microphones, infrared detectors or batteries. Steve Carr and some of his students
.. . we take pride in our teaching, ... we strive to be on the forefront in our research, and ... we are committed to m~aningful contact with our students. Those priorities provide the guiding philosophy for the department.
port phenomena: S. George Bankoff (who has a joint appointment with mechanical and nuclear engineering), Gregory Ryskin, and me. All three of us find complementary interests in the activities of Stephen H. Davis (who has joint appointments in engineering science and applied mathematics and in mechanical and nuclear engineering). We are involved in such diverse activities as dynamic interfacial phenomena, coalescence, twophase flows with heat transfer, flows in porous media, flows of suspensions, and structural models for the stress-deformation behavior of polymer solutions.
George Bankoff has been directing a broad program of experimental and theoretical studies on two-phase flow and heat transfer. His particular motivation has been problems associated with nuclear reactor accidents. Rather than studying these complicated problems directly, he and his students have chosen to examine more fundamental problems that can shed light on particular aspects of the overall process.
Gregory Ryskin's current research interests focus on the numerical solution of fluid mechanics problems. He is considering both flows with free boundaries as well as the motions of polymer solutions, the stress-deformation behavior of which is determined by the local microstructure.
My students and I have directed our attention
4
are seeking to understand the origins of the persistent polarization that can be established in some polymer solids. They are studying other polymers that are electronic conductors and act as organic metals.
Using model crystallizable hydrogenated polybutadiene (HPB), Buck Crist's group is making significant advances in understanding the important effects of molecular weight, molecular weight distribution, short chain branching and long chain branching on the structure and properties of semicrystalline polymers. These studies utilize light scattering, x-ray scattering and diffraction, small-angle neutron scattering, calorimetry and density measurements on HPB having extremely well-defined molecular microstructures.
The utility of photophysics in studying macromolecular diffusion-controlled reactions has been demonstrated by studies of intermolecular reactions between labelled polystyrene chains as well as by studies of intramolecular cyclization dynamics of a single polystyrene chain. By a combination of carefully selected fluorescence and phosphorescence studies, John Torkelson is investigating the Rouse dynamics of polymer chains.
Process Engineering. The area of computeraided process planning, design, analysis, and
CHEMICAL ENGINEERING EDUCATION

control is the interest of Richard S .H. Mah and William F. Stevens.
The research of Dick Mah and his students is directed towards the development of comprehensive theories and techniques for operating processes. One focus of their research is their work on process data reconciliation and rectification, which has already led to new techniques of gross error detection and identification, a rigorous theory of observability and redundancy, and efficient variable and measurement classification algorithms. Another thrust is in the design and scheduling of batch chemical processes.
Process optimization and process control are beginning to depend significantly upon the utilization of equipment and procedures for "real-:-time" computing. Bill Stevens' current research activities emphasize the development of programs and procedures for the implementation of various "real-time" applications utilizing minicomputers and microcomputers.
Separation Processes. There is currently a developing interest in the department in separation processes.
Josh Dranoff has had a long-term interest in separations based on sorption in zeolites and similar adsorbents. Currently his students are investigating the kinetics of sorption of binary gas mixtures by zeolite adsorbents using a differential bed-chromatographic type apparatus.
Dick Mah's group has proposed and is investigating a new class of distillation schemes designed to enhance overall thermal efficiency. This is accomplished through heat exchange between the rectifying and stripping sections of a distillation apparatus in what is known as secondary reflux and vaporization (SRV) distillation.
George Thodos and his students are studying the removal of S02 from flue gases using regenerable sorbents such as Nahcolite (NaHC03), which may offer the possibility of closed loop systems for clean-up of power station stack gases. Separately, he is testing supercritical extraction as a separation tool.
Individual Activities. Naturally, not all of the research in the department is done in the context of group activities.
Thomas K. Goldstick (who has joint appointments with biomedical engineering and neurobiology /physiology) is well known for his longterm interests in biomedical engineering. His
WINTER 1984
current research centers around the dynamics of oxygen transport in the retina of the eye.
Studies of vapor-liquid equilibria and critical state phenomena continue to occupy the interests of George Thodos and some of his students, while
Chairman John Slattery in an informal discussion with students.
with another group he extends his investigation of solar energy collection and storage.
FUTURE DIRECTIONS
Chemical engineering is an evolving discipline, the one continuous thread being that we are all concerned with applications of chemistry, broadly interpreted. The emphasis given to particular areas of research shifts as the needs of society change, the current faculty matures in its outlook, and we add new faculty.
Looking to the future , we are anxious to expand our activities in the area of computer-aided process planning, design, analysis, and control, when we are presented with the right opportunity. Both the students and faculty agree that this will be a field of increasing importance to the profession.
We would also like to move into biochemical technology. This is not only an area of considerable promise, but also it is one in which, by our judgment, the primary impact of chemical engineers is still developing.
But as we continue to look in new directions, basic priorities will remain unchanged: our pride in our teaching, our eagerness to be on the forefront in our research, and our commitment to meaningful contact with our students. D
5
(! n :I educator
of Illinois
Prepared by his ILLINOIS COLLEAGUES University of Illinois Urbana, IL 61801
To HIS PROFESSIONAL collea_gues, D~ck Alkire is known as an electrochemical engmeer, to his
students as an outstanding teacher and to others through many different perspectives, especially music.
Though he now lives in the heartland of Illinois, Dick grew up in Easton, Pennsylvania, where he graduated from Lafayette College in 1963. For two years of his time at Lafayette, he was tutored on the subject of electrochemical corrosion by Zbigniew Jastrzebski. Traveling to the other coast, Dick attended the University of California at Berkeley to continue the study of electrochemical engineering. Working under the direction of Charles Tobias and Edward Grens, he carried out graduate research on transport processes in porous electrodes. Just to keep things in balance, he enrolled in a piano performance class where he met his future bride, Betty. They left Berkeley in 1968 to spend a post-doctoral year in Gottingen, at the Max Planck Institut ftir physikalische Chemie, where he studied thermodynamics of solid-state galvanic cells under the late Carl Wagner. A year later, Dick brought his young family back to the United States and took up a post as assistant professor at the University of Illinois. Promotion to associate professor came in 1975, and to full professor in 1977.
... it is Dick's philosophy that "you can't teach research creativity by telling everyone what to do." He gives students a great deal of independence in the pursuit of their thesis research ...
© Copyri1Jht ChE Division, ASEE. 1984
6
During these early years, Dick was deeply influenced by his mentors Jastrzebski, Tobias, Grens and Wagner. Under Tobias he had experienced the excitement of a research group that moved steadily into uncharted waters, and with Carl Wagner had had long discussions on how to break open new problems. As a consequence, he embarked on a program of electrochemical engineering research, at Illinois, which continues to this day. At the time, however, the electrochemical field was not common to chemical engineers and it was John Quinn and Roger Schmitz who gave him strong encouragement to maintain his direction.
With these perspectives, Dick worked resolutely to broaden his capabilities and interests. He has emphasized application of potential distribution principles to complex electrochemical problems which involve coupled mass transport, ohmic resistance, and interfacial processes. Concentrating at first on electrodeposition, his work for over a decade in that area earned him, in 1983, the Research Award of The Electrodeposition Division of The Electrochemical Society. Also in the early seventies, he returned to corrosion problems where transport phenomena in the solution phase played a critical but unexplored role. Based on his Ph.D. dissertation on crevice corrosion, Dick's student,
CHEMICAL ENGINEERING EDUCATION

David Siitari, was awarded the Young Author's Prize for the best paper in the 1982 Journal of the Electrochemical Society. During a sabbatical leave at Cal Tech in 1976, Dick formulated a new program in electro-organic synthesis, and introduced rigorous chemical engineering concepts to electro-organic reactor design and scale-up. These programs subsequently led to interactions with Robert Sani, at the University of Colorado, in finite element calculations of electrode shape evolution; with Mark Stadtherr, at Illinois, on electrolytic process simulation and optimization; and with Theodore Beck, of the Electrochemical Technology Corp. in Seattle, on corrosion. In 1983, Dick again used his sabbatical leave, this time at the University of Washington in Seattle, to develop a research program in plasma reactor design, where potential field and convective diffusion phenomena play a critical role.
Working with Steve Perusich, Dick investigates transport processes during corrosion. Here, they use focused ultrasound to trigger breakdown of protective surface films, and then study film repair in the presence of fluid flow.
A consequence of these broad and continuing interests is that Dick's research program is by now very large. Last Fall his group included twenty graduate students and a half dozen undergraduate laboratory assistants. Of necessity, a group of such size demands a meticulous management of time and resources. Dick is quick to point out that a major factor in this regard is the excellent reputation with which Illinois attracts truly outstanding graduate students. In addition, it is Dick's philosophy that, "you can't teach research creativity by telling everyone what to do." He
WINTER 1984
Dick supervises four seminars a week for his graduate students. Shown here (I. to r.} are Steve Lott, Mark Greenlaw, Dick, Bob Schroeder, Demetre Economou, and Kurt Hebert.
gives students a great deal of independence in the pursuit of their thesis research, but demands high standards of commitment, knowledge of the literature, and developing intuitive prowess for linking mathematics to the physical world. One of Dick's former research students observes that "he instills by personal example a deep commitment for achieving a high level of innovation and technical excellence." Another former student notes, "The advice Dick gave me in graduate school in all areas, technical and non-technical, has helped me immensely in my professional career."
To a significant extent, Dick's early years in music have shaped his character and attitudes. Dick and his brother Ed grew up in a family music business where performing came at a young age at the encouragement of Dad, the pro, and Mom, the supporter. Dad, Ed and Dick started playing professionally when Dick was twelve; by the time he was sixteen, they had performed throughout the East and had cut numerous records. Meanwhile, back at tl:e family studio, Dick taught piano, guitar, bass, and vibes, helped run the wholesale and retail businesses, and did much of the art work for Dad's teaching publications. He turned down a four-year organ scholarship to attend Lafayette College to study chemical engineering, but nevertheless performed on over three hundred occasions in the college touring choir, in a barbershop quartet, in a jazz group, and as a solo pianist at weddings and receptions.
The time and energies invested in public performance, in music teaching, and in businessrelated affairs paid invaluable dividends for Dick's management of his massive research effort today. By the way, his brother is also a chemical engineer with Air Products & Chemicals. Ed is
7

... no matter how hectic the day ... Dick will always give a student his total attention. His efforts were rewarded in 1982 with the Teaching Excellence Award of the School of Chemical Sciences at Illinois.
Manager of Technical Affairs for the Industrial Gas Division and has responsibility for safety and operating procedures, process engineering, quality assurance, engineering standards, and environmental compliance.
Dick takes it as a given fact that competence in research both requires and demands excellence in the teaching classroom. With a repertoire of a dozen lecture courses, he takes special pleasure in teaching the subjects and in dealing with students on a personal basis. Thinking back on his own training, he recalls that "I have been extremely fortunate to have had teachers who took a personal interest in me and who inspired me to standards which were beyond my awareness at the time. Sometimes those feelings of inspiration came from only brief moments in their presence when I felt that their entire energies were directed toward giving me an appreciation of the subject matter." As a result, no matter how hectic the day, in the classroom or in his office, Dick will always give a student his total attention. His efforts were rewarded in 1982 with the Teaching Excellence Award of the School of Chemical Sciences at Illinois.
Active in professional pursuits, Dick is the youngest Vice President in the history of the 82-year old Electrochemical Society, and will succeed to the presidency in 1985. He is also a divisional editor of the Society's journal. In the AIChE, he founded a group in 1974 for programming symposia in electrochemical engineering, and has also served as chairman of the Heat Transfer and Energy Conversion Division of the Institute. To quote one of Dick's colleagues, he applies "the same enthusiasm, integrity, and competence to Society affairs as he has to his own students and research."
These experiences, along with extensive consulting activity, serve as critical elements in the continual upgrading of teaching and research. With this activity, he has averaged an off-campus seminar every two weeks during the past four years. As one of his colleagues notes, "A hallmark of his work is his ability to translate results of complex calculations into a form easily understandable to practical users in the field." Like the
8
family music business, Dick's life represents a total commitment to advancing the electrochemical engineering field so that others will be encouraged to follow.
One activity has brought him a special sense of satisfaction. Emeritus Professor Sherlock Swann, Jr. had been at Illinois since 1927 and had, for 45 of those years, meticulously compiled an exhaustively detailed bibliography of the electroorganic synthesis literature, beginning with the first known paper in 1801. Their friendship had begun, understandably, with a mutual love of music which found Dick spending evenings at Sherlock's home listening to old 78-rpm recordings of the masters. Through this musical bond of
Dick's students often spring surprise parties to bid an affectionate adieu to a graduating member of the gang.
shared trust, Sherlock slowly revealed his incredible bibliography. Dick eventually raised over $90,000 to support a meticulous effort at indexing and publishing the collection through The Electrochemical Society. The result was deeply satisfying to Professor Swann, who passed away in 1983 after having seen an important part of his life's work brought to fruition.
Music continues to be the center of Dick's outside interests. It seemed ironic at the time that, within a few months of deciding on a college career in chemical engineering, his parents' music business took an upswing and they presented him with a Baldwin grand piano. During the years since, his main hobby has been keeping up a sound technique and broadening his knowledge of the literature. A few years ago, Dick built a twomanual harpsichord to gain access to four more centuries of keyboard literature. His daughters, now 14 and 16, play violin and cello and, in addition, are studying string quartets under Gabriel
CHEMICAL ENGINEERING EDUCATION
Magyar, master cellist for 16 years with the Hungarian String Quartet. Meanwhile Betty, the Berkeley music major, continues the family tradition by operating her own music studio.
In summary, Dick has made a significant contribution by identifying electrochemical phenomena where chemical engineering concepts find welcome application. He has helped unify diverse electrochemical subfields so that intercommunication between them has been promoted. Through his research students and his professional activities, he has contributed significantly to the broadening horizon of chemical engineering. •
[j n §I book reviews
MASS TRANSFER IN ENGINEERING PRACTICE
By Aksel L. Lydersen John Wiley & Sons, 1983, xiii + 321 pgs . $39 .95
Reviewed by F. L. Rawling, Jr. E.I. Du Pont de Nemours & Co., Inc.
This book is a companion volume to the author's previous book "Fluid Flow and Heat Transfer" (John Wiley & Sons, 1979). The aim of the present volume is to present a short refresher course in those areas of unit operations specifically dealing with mass transfer. The book consists of eight chapters: an introductory chapter on the principles of diffusion and seven chapters covering distillation, gas absorption and desorption, liquid-liquid extraction and leaching, humidification, drying of solids, adsorption and ion exchange, and crystallization. The introductory chapter on the principles of diffusion provides a summary of the major equations together with a short discussion of the various types of diffusion, i.e. diffusion with bulk of mass in motion, eddy diffusion, molecular diffusion in liquids, etc. A short discussion of the two film theory and the penetration theory is also presented. No attempt is made at providing a fundamental treatment of the subject of diffusion; rather, reference is made to the literature. Several problems, typical of those encountered in industry are worked out in detail. There are four problems to be worked by the reader. The chapter ends with a good bibliography, although half the references are pre-1970.
Approximately two-thirds of the book is con-
WINTER 1984
- POSITIONS AVAILABLE -Use CEE's reasonable rates to advertise. Minimum rate
¼ page $60: each additional column inch $25.
OKLAHOMA ST A TE UNIVERSITY
Chemical Engineering: Assistant, Associate, or Full Professor Position. This is a tenure-track position and will be approximately half-time teaching and half-time research. We will help the successful candidate establish research by providing initiation funds, co-investigation opportunities with senior faculty and proposal preparation-processing assistance from our Office of Engineering Research. Candidates must possess an earned Ph.D. from an accredited Department or School of Chemical Engineering or have a Ph.D. in related areas and have strongly related qualifications. We welcome applications from candidates with competencies and interest in any field of chemical engineering, but especially seek those with strengths in design and computer applications. This position is available as early as July 1984. Applications will be received through March 16, 1984. Please send your resume and list of three references to Professor Billy L. Crynes, Head, School of Chemical Engineering, 423 Engineering North, Oklahoma State University, Stillwater, OK 74078. Calls for additional information invited. OSU is an equal opportunity /affirmative action employer.
cerned with staged operations, reflecting the industrial importance of this type of process. In general, each chapter follows the same outline: a short discussion of the theory involved together with the relevant equations, a discussion of the unit operation presenting the assumptions involved and the major design equations, a very general discussion on the various types of equipment employed, a series of worked examples, a set of problems to be worked by the reader, and a bibliography.
The worked examples in each chapter make this book worthwhile. They are well chosen to illustrate industrial problems and are worked out in detail, giving the assumptions and reasoning involved in arriving at a solution. In a few instances, a programmable calculator (HewlettPackard) is used in the solution of a problem. The calculator program is given.
I believe the book fulfills its goal, i.e. a refresher course in mass transfer. The many references adequately direct the user to the fundamental literature. Practicing engineers faced with a problem in an area of mass transfer that they have not been involved with for some time will find this a good, succinct review. Students will find the worked examples illuminating. Instructors should find this book to be a useful adjunct to their course. •
9

l!J Na laboratory
A GRAND SALE: $12 For A Dozen Experiments In CRE
ZHANG GUO-TAI* AND HAU SHAU-DRANG** Oregon State University Corvallis, OR 97331
WE HAVE NOTICED THAT undergraduate chemi-cal engineering laboratories in the United
States commonly make use of experiments in unit operations, instrumentation and control; but that experiments in chemical reaction engineering (CRE) are very rare. This is understandable because such experiments usually require an advanced level of understanding, are rather complex in set up, and more involved to operate.
We would like to introduce a whole class of experiments which require very simple and inexpensive equipment and which illustrate one of the basic problems of chemical reaction engineering: the development of a kinetic rate equation from laboratory data. In essence, the student takes laboratory data, guesses a kinetic equation, tests its fit to the data and, if this is satisfactory, determines the corresponding rate constants.
Basically, we use a hydraulic analog. We will illustrate this with the simplest case; the fitting of a first order decomposition, A• R.
Connect an ordinary glass capillary to a burette as shown in Fig. 1. Fill the burette with water, at time zero let the water flow out, and record the change in volume as time progresses.
We would like to introduce a whole class of experiments which require very simple and inexpensive equipment and which illustrate one of the basic problems of chemical reaction engineering.
• on leave from Shanghai Institute of Chemical Technology, China.
''*On leave from Sichuan University, Chengdu, China.
10
50cm3
0
at start V = 50 cm3
horizontal capillary should
(
be level with the zero volume reading on the burette
.. . Q
Volume Time (cm3) (sec)
50 0
- -- -
- -
FIGURE 1. Experimental set up to represent the first order decomposition of reactant A, or A • R.
The student is told to view the experiment of Fig. 1 as a batch reactor in which reactant A disappears to form product R. The volume reading on the burette in cm3 is to be considered as a concentration of reactant in mole / m3• Thus the experiment of Fig. 1 is to be treated as shown in Fig. 2.
By following the reactant concentration (actually the volume of water in the burette) versus time the student is to determine the order of reaction and the value of the rate constant. If the experiment is set up properly, one will find that the data fits first order kinetics.
The student sooner or later guesses first order kinetics, integrates the rate equation to give ln ( Co/ C) = kt, plots the logarithm of concentration versus time, and from this evaluates the rate constant. Thus he learns how to test kinetic models. Of course, the length and diameter of capillary will determine the value of the rate constant.
The experiment is so simple and quick to do one can incorporate a lesson in statistical analysis with it. Ask the student to repeat the experiment
© Copyright ChE 'Division, A SE E_ 1984
CHEMICAL ENGINEERING EDUCATION

a number of times, find the rate constant, and also the 95 % confidence interval for the rate constant.
This is the simplest of a whole class of experiments that can be done with burettes and capillaries. Fig. 3 shows some of the many other reaction schemes that may be used.
There may be more than one way to test a rate form and fit the rate constants. It challenges the student's initiative and ingenuity to see how he approaches his particular problem. For example: for reactions in series, A-R-s he can try to follow the concentrations directly, he may follow concentration ratios and fit them to charts as shown in Levenspiel [1 ], or he may try to use the conditions when the intermediate hits its maximum value. He soon finds that some approaches are much more discriminating than others.
SUGGESTIONS FOR SETTING UP THE EXPERIMENTS
WE HAVE TESTED ALL THE experimental vari-ations of Fig. 3 in the laboratory ourselves,
and we have found that observation of the following simple precautions will result in excellent agreement of experiment with theory.
• Be sure that the capillary outlet is level with the zero line of the burette. Check this by filling the burette
Zhang Guo-tai was born in Shanghai, China, in 1943. He graduated
from the Shanghai Institute of Chemical Technology in 1965 and is an
instructor there. His teaching and research activities center on the
theory of chemical kinetics and on reactor design . He was at Oregon State Unive rsity on a two year visiting faculty appointment, spon
sored by the Chinese government. (L)
Hau Shau-Orang is an instructor in the chemistry department at
Sichuan University, China, where he is responsible for the teaching
of basic chemical engineering subjects to all chemistry students, a
normal feature of Chinese universities . His duties included being
superintendent of the chemical factory, and later, the pharmaceutical
factory, owned and run by the chemistry department. Mr. Hau
held a courtesy faculty appointment at Oregon State University where
he studied chemical reaction engineering, on a Chinese government
grant. (R)
WINTER 1984
botch reactor for the / reaction A-R
~ initial concentration w CA," 50mol/m3
Reactant concentration
(mol/m3)
50
---
Time (sec)
0
-
--
FIGURE 2. Reactor analog to the hydraulic experiment of Fig. 1.
and letting water run out until equilibrium is achieved. • Do not have any restriction between burette and
ca pillary comparable with that of the capillary itself. • Verify that laminar flow exists in the capillary. For an
ordinary capillary and burette this condition is well satisfied.
• Before starting an experiment pour water through the burettes so as to wet them. Also see that water does not flow back along the bottom of the capillary. Use a rubber band or a Chinese teapot spout dripper at the capillary outlet.
• If the capillary is not long enough then the run time will be awkwardly short; if too long, a lot of time is wasted: The following suggestions are convenient time scales and capillary lengths.
Let T 1 be the time required for the water in the first burette to drop to half its initial height and let the corresponding length of capillary be L,.
For the first experiment of Fig. 3 we find that T, = 30~40 sec is about right. For other experiments the appropriate time scales and capillary lengths are shown in Table 1.
• By preparing a number of capillaries and by using
TABLE 1 Recommended experimental conditions
Reaction Scheme Shown in Fig. 3 T 1 (sec) Capillary length
Case 1 Case 2 Case 3 Case 4 Case 5 Case 6
Case 7
Case Sa,b Case 9 Case 10 Case lla,b Case 12
30~40 20-30 30~40 20~30 30~40 20-30
30~40 20~30 30~40 30-40 30-40
Ll L2 = 2-6 Ll L3 = 2~4 Ll L2 = 4 L,, La = 2-4 L, La = 2~4 LPL., = 2 L, L 2 = 4-5 L 1 ,
L3 = 2----4 Ll L2 = 4 L,, L3 = 2'--'4 L,, L 4 = s-10 L, Ll L3 = 4 L, L3 = 4 L1
L3 = 3........,4 L, L 2 = 2~4 LI' L_, = 6-8 L,
11

12
LJ· h t nR LLR U]R ~ UJs
@
l LIJ· U--w. L
s A~R~S!1T
FIGURE 3. Some reaction schemes. NOTES: In Sa, 9, 10, 11, use different diameter burettes to obtain different rate constants for the forward and reverse
reactions. Be sure to take the volumetric burette reading, not height.
Sb. One can use just one burette if one locates the capillary at a height above the zero reading on the burette.
11 b. One can use 2 burettes if one locates the second capillary somewhat above the zero reading on the burettes.
CHEMICAL ENGINEERING EDUCATION

various combinations of burettes the laboratory instructor can insure that no two laboratory groups will have the same experiment to perform, even in the giant classes which are now being processed.
Finally, a nice feature of this set of experiments is that the student most likely will be led to perform an integration of the performance equation for the batch reactor before he can test his guess with experiment.
CONCLUSION
WE HAVE SHOWN HOW A FEW burettes and capillaries, properly connected, can be the
basis for a large number of simple experiments to teach the principles of data fitting in chemical reaction engineering. These experiments may be simple but they are not trivial. •
REFERENCES
1. 0. Levenspiel, Chemical Reaction Engineering , 2nd Ed., Figure 15, page 191, Wiley, 1972.
APPENDIX
1. Many of the kinetic models of Fig. 3 (cases 1 to 6) are special cases of the Denbigh reaction scheme ( case 7) . The integrated form for this kinetic model, after appropriate manipulation is found to be
CA CA,o
CR
CA,o
CT CA,o
where
K, = k 1 + k2
K2 = k3 + k 1
The conditions when the intermediate is at its
WINTER 1984;
Substantial ChemistryTexts from Prentice-Hall
CHEMICAL PROCESS CONTROL: An Introduction to Theory and Practice
George Stephanopoulos, The National Technical University of Athens 1984 704 pp. (est.) Cloth $34.95
CHEMICAL AND PROCESS THERMODYNAMICS B.G. Kyte, Kansas State University 1984 512 pp. (est.) Cloth $32.95
MASS TRANSFER: Fundamentals and Applications Anthony L. Hines and Robert N. Maddox, both of Oklahoma State University 1984 500 pp. (est.) Cloth $30.95
BASIC PRINCIPLES AND CALCULATIONS IN CHEMICAL ENGINEERING, Fourth Edition
David M. Himmelblau, The University of Texas at Austin 1982 656 pp. Cloth $33.95
PROCESS FLUID MECHANICS Morton M. Denn, University of Delaware 1980 383 pp. Cloth $33.95
DIFFRACTION FOR MATERIALS SCIENTISTS Jerold M. Schultz, University of Delaware 1982 287 pp. Cloth $35.95
NUMERICAL SOLUTION OF NONLINEAR BOUNDARY VALUE . PROBLEMS WITH APPLICATIONS
Milan Kubicek, Prague Institute of Chemical Technology; Vladimir Hlavacek, SUNY at Buffalo 1983 336 pp. Cloth $34.95
For further information, or to order or reserve examination copies, please write: Ben E. Colt, College Operations, Prentice-Hall, Inc., Englewood Cliffs, NJ 07632. · For ''SUPER-QUl~K" Service, dial TOLL FREE (800) 526-0485* between 8:15 a.m.-4:45 p.m., EST, Mon.-Fri. • not applicabfe in New Jersey, a • liil p t• H 11 . Alaska, Hawaii or Puerto Rico. ell t::J LIi ren IC8• a
maximum value are then
C R,max _ k1 [ K, J K2/ (Kz-K1) ~ - K1 K2
and
t (f C ) _ ln (K2/K1) or R,max - K2 _ K1
These expressions may be useful for the instructor as a check of the students work.
2. All the kinetic equations in Fig. 3 involve systems of first order reactions and are conveniently solved, either by integration or by computer simulation for those who know how to talk to these machines. In a later paper we will consider non-linear systems and reaction orders different from unity. D
ACKNOWLEDGMENTS
We would like to thank our advisor, Professor Levenspiel for suggesting that we develop this series of experiments, and we would like to recognize Professor Jodra of the University of Madrid for indirectly bringing this type of experiment to our attention.
13
[iJ n a classroom
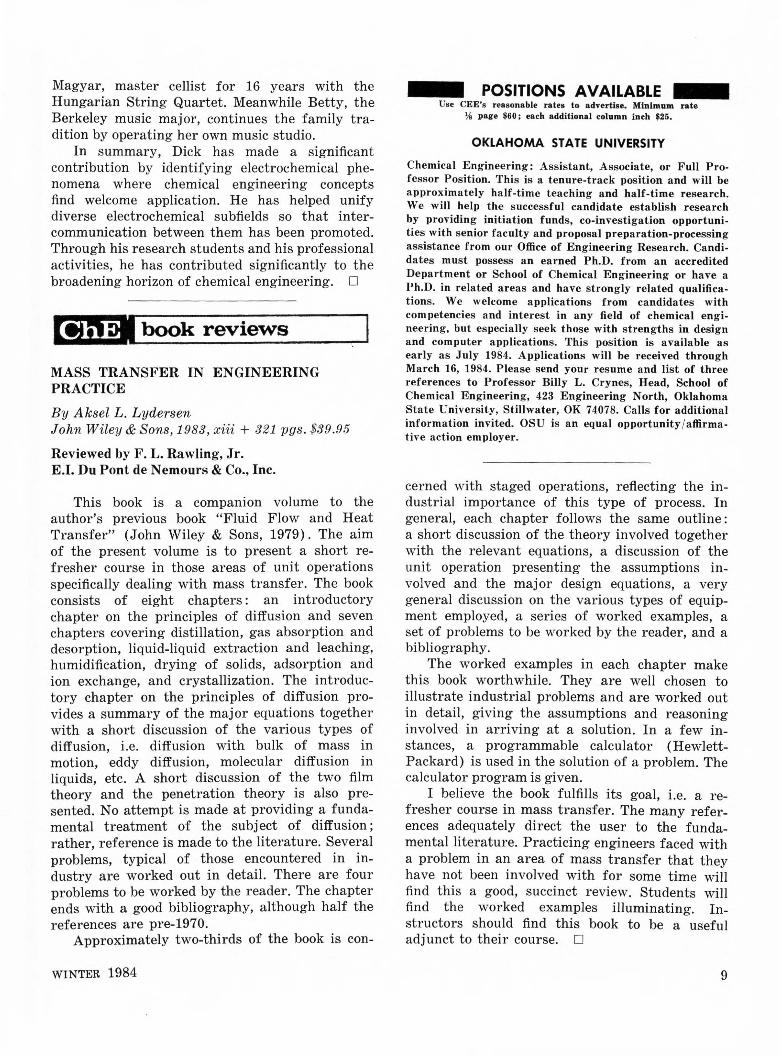
TWO COMPUTER PROGRAMS FOR EQUIPMENT COST ESTIMATION AND
ECONOMIC EVALUATION OF CHEMICAL PROCESSES
CARLOS J. KURI AND ARMANDO B. CORRIPIO Lo-µ,isiana State University Baton Rouge, LA 70803
J N RECENT YEARS SEVERAL cost estimation and economic evaluation computer programs have
been developed, including those associated with ASPEN [2, 3, 4), Monsanto's FLOWTRAN [10), Purdue's PCOST [11], and others. However, the fact that these programs are not readily available to most colleges and universities motivated this .work: the development of a cost estimation and economic evaluation computer program with the latest information in the field, easy to use and by all means suited to fulfill the requirements of a senior process design course.
The algorithms used for the cost estimation computer program were obtained from the ASPEN Project, eleventh, thirteenth .and fourteenth quarterly progress reports [2, 3, 4]. These algorithms are based on cost data for 1979.
EQUIPMENT COSTING PROGRAM
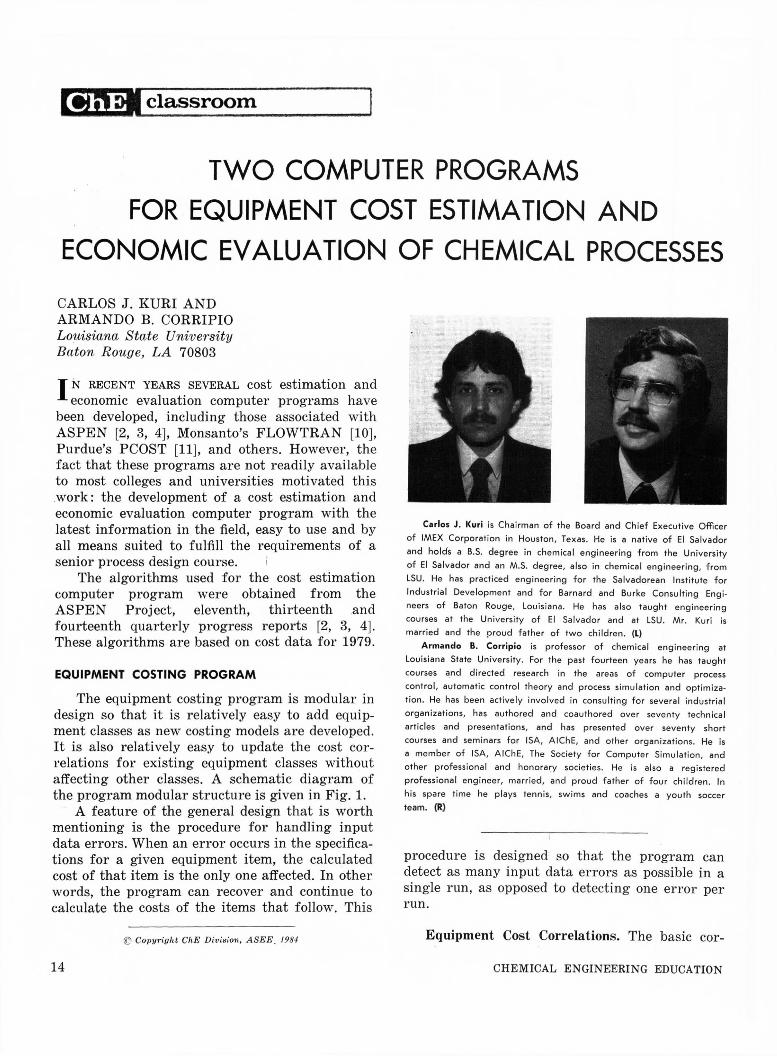
The equipment costing program is modular in design so that it is relatively easy to add equipment classes as new costing models are developed. It is also relatively easy to update the cost correlations for existing equipment classes without affecting other classes. A schematic diagram of the program modular structure is given in Fig. 1.
A feature of the general design that is worth mentioning is the procedure for handling input data errors. When an error occurs in the specifications for a given equipment item, the calculated cost of that item is the only one affected. In other words, the program can recover and continue to calculate the costs of the items that follow. This
~ Copyright ChE Division. ASEE_ 1984
14
Carlos J. Kuri is Chairman of the Board and Chief Executive Officer
of IMEX Corporation in Houston, Texas. He is a native of El Salvador
and holds a B.S. degree in chemical engineering from the University
of El Salvador and an M.S. degree, also in chemical engineering, from
LSU. He has practiced engineering for the Salvadorean Institute for
Industrial Development and for Barnard and Burke Consulting Engi•
neers of Baton Rouge, Louisiana. He has also taught engineering
courses at the University of El Salvador and at LSU . Mr. Kuri is married and the proud father of two children . (L)
Armando B. Corripio is professor of chemical engineering at
Louisiana State University. For the past fourteen years he has taught
courses and directed research in the areas of computer process
control, automatic control theory and process simulation and optimiza
tion . He has been actively involved in consu lting for several industrial
organizations, has authored and coauthored over seventy technical
articles and presentations , and has presented over seventy short
courses and seminars for ISA, AIChE, and other organizations. He is
a member of ISA, AIChE, The Society for Computer Simulation, and
other professional and honorary societies. He is also a registered professional engineer, married, and proud father of four children. In
his spare time he plays tennis, swims and coaches a youth soccer
team. (R)
procedure is designed' so that the program can detect as many input data errors as possible in a single run, as opposed to detecting one error per run.
Equipment Cost Correlations. The basic cor-
CHEMICAL ENGINEERING EDUCATION
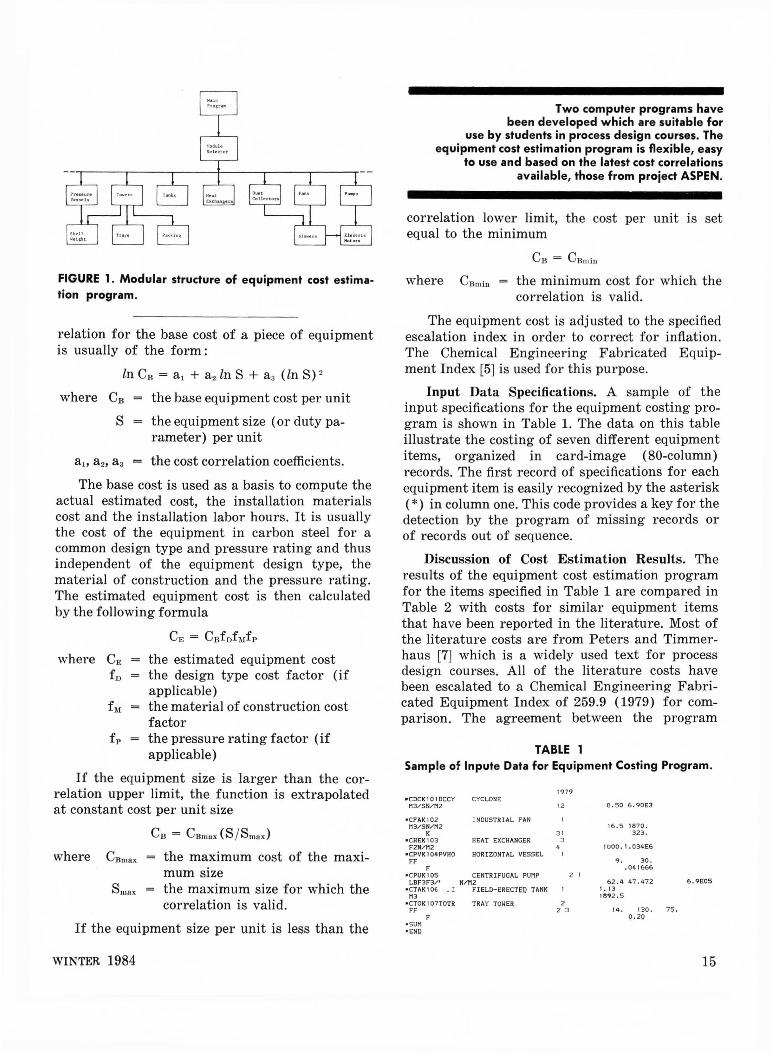
FIGURE 1. Modular structure of equipment cost estimation program.
relation for the base cost of a piece of equipment is usually of the form:
ln CB = a1 + a2 ln S + a 3 ( Zn S) 2
where CB the base equipment cost per unit
S the equipment size ( or duty parameter) per unit
ai, a2, as = the cost correlation coefficients.
The base cost is used as a basis to compute the actual estimated cost, the installation materials cost and the installation labor hours . It is usually the cost of the equipment in carbon steel for a common design type and pressure rating and thus independent of the equipment design type, the material of construction and the pressure rating. The estimated equipment cost is then calculated by the following formula
CE = CBfDfMf P
the estimated equipment cost the design type cost factor (if applicable) the material of construction cost factor the pressure rating factor (if applicable)
If the equipment size is larger than the correlation upper limit, the function is extrapolated at constant cost per unit size
where CBmax
CB = CBmux (S /Smux )
the maximum cost of the maximum size the maximum size for which the correlation is valid.
If the equipment size per unit is less than the
WINTER 1984
Two computer programs have been developed which are suitable for
use by students in process design courses. The equipment cost estimation program is flexible, easy
to use and based on the latest cost correlations available, those from project ASPEN.
correlation lower limit, the cost per unit is set equal to the minimum
CB = CBmiu
where CBmio = the minimum cost for which the correlation is valid.
The equipment cost is adjusted to the specified escalation index in order to correct for inflation. The Chemical Engineering Fabricated E quipment Index [5] is used for this purpose.
Input Data Specifications. A sample of the input specifications for the equipment costing program is shown in Table 1. The data on this table illustrate the costing of seven different equipment items, organized in card-image (80-column) records. The first record of specifications for each equipment item is easily recognized by the asterisk ( *) in column one. This code provides a key for the detection by the program of missing records or of r ecords out of sequence.
Discussion of Cost Estimation Results. The results of the equipment cost estimation program for the items specified in Table 1 are compared in Table 2 with costs for similar equipment items that have been reported in the literature. Most of the literature costs are from Peters and Timmerhaus [7] which is a widely used text for process design courses. All of the literature costs have been escalated to a Chemical Engineering Fabricated Equipment Index of 259.9 (1979) for comparison. The agreement between the program
TABLE 1 Sample of lnpute Data for Equipment Costing Program.
• COC K 101 DCCV CYCLONE M3/SN/M2
1979
12
•CFAK 102 M3/SN/M2
K • CHEK 103
F2N/M2 • CPVK I 04PVHO
FF F
INDUSTRIAL FAN
3 1 HEAT EXCH ANGER 3
4 HORIZONTAL VESSEL 1
• CPUK 105 CENTRIFUGAL PUMP LBF3F3/t N/M2
• CTAK 1 OE. • I FI ELD-ERECTE[l TANK I M3
• CTOK 107TOTR TRAY TOWER 2 TT 23
• SUM • ENO
2 1
a.so 6.90E3
16.5 1870. 323.
1000. 1 . 034E6
9. 30. .041666
62.4 47.472 1. 13 169 2.5
14. 130. 75, Q.ZQ
6.9E05
15

costs and the literature costs is quite good in most cases and within the accuracy of preliminary study estimates. The largest discrepancies are in the cyclone and tray tower costs. For each of these cases the graphs in Peters and Timmerhaus had to be extrapolated, which may account for the discrepancy.
ECONOMIC EVALUATION PROGRAM
An acceptable plant design must present a process that is capable of operating under conditions that will yield a profit. The purpose of the economic evaluation computer program is to calculate two profitability indices: the net present value and the internal rate of return. These two indices are based on discounted cash flow techniques, taking into consideration the time value of money.
Net Present Value (NPV)
n NCFk NPV ·= k; (l+i)1'(1+RINF)k
where NCFk the net cash flow for the kth year
i = the effective annual rate of return
RINF the annual inflation rate
n = the number of years of duration of the project.
Internal Rate of Return (IRR). This is the rate of return that equates the present value of the expected future cash flows or receipts to the initial capital outlay. Normally a trial and error procedure or root finding technique is required to find the discount rate that forces the NPV to zero.
To be more realistic in the calculation of these two indices of profitability, the effect of inflation is included. Failure to at least try to predict inflation rates and take them into account can greatly distort project economics, especially at the double-digit rates that have become common throughout the world.
The procedure used in the program in computing the indices of profitability is described in the text by Bussey [l].
Economic Evaluation Program Results . Results of the economic evaluation program for a sample case are presented in Table 3. The problem is to estimate the profitability of a solids processing plant. Total purchased equipment cost is estimated at $3,200,000, with an economic life of 10 years. An interest rate of 10 %, inflation rate of 8% and
TABLE 2 Comparison of Equipment Cost Estimation Results
Equipment Item
1. Cyclone
2. Fan
8.5 m3 /s (18,000 cfm); 6,900 N/m 2 (28 in water); Excluding blower and motor
16.50 m"/s (35,000 cfm); 1,870 N/m 2 (7.5 in water); 323°K (121 F); Carbon steel; Explosion-proof motor; Belt drive coupling
3. Heat Exchanger 1,000 ft2; 1.034•106 N / m2 (150 psi); Stainless 316; U-Tube
4. Horizontal Vessel 1.034•106 N/m2 (150 psi); 9 ft diameter; 30 ft long
5. Centrifugal Pump 6.9•105 N/m 2 (100 psi); 62.4 lb/ft3; 23.74 ft3/min (178 GPM);
6. Storage Tank
7. Tray Tower
16
Totally enclosed fan-cooled electric motor
1,893 m3 (500,000 gal); Carbon steel
14 ft diameter; TTL = 130 ft long; Stainless 304; 75 Valve trays
Program Cost, 1979
$ 3,380
$ 8,360
$ 29,100
$ 28,600
$ 1,830
$ 79,600
$859,000
Literature Cost, 1979 Reference
$ 5,300 Peters and Timmerhaus [7], (p. 599). Extrapolation required.
$ 8,500 Richardson [9].
$ 33,000 Peters and Timmerhaus [7], (p. 670).
$ 25,500 Pikulik and Diaz, [8]-
$ 1,800 A VS (American Volunteer Sta ndard) Peters and Timmerhaus [7], (p. 557).
$ 71,000 Cone roof tank Peters and Timmerhaus [7], (p. 573).
$657,000 Peters and Timmerhaus [7], (p. 768). Extrapolation required.
CHEMICAL ENGINEERING EDUCATION

TABLE 3 Sample of Output Results for Economic Evaluation
Program. Profitability.
c.,rn OF NET OPERATING GROSS INTEREST DEPRECIATION NET INCOME SECTION 1231 NET PRESENT VALUE YEAR SALES COST INCOME EXPENSE EXPENSE AFTER TAX CASH FLOW CASH FLOW INCREMENT
0 0 . 0. 0 . 0 . o. ::,. -4404706. -4404706. -4404706 .
13933488. 11581918 . 2351570 . 1027764 . 2431999. -576260 . -644883 . 1210855. 934302.
2 17424176. 13894143. 3530033. 963276 . 1958071. 316517 . -709371. 1565215. 931891 .
3 21669312 . 16668485 . 5000827 . 892339. 1576499. 1316634. -780308. 2112824 . 970621.
4 26790096. 19977360. 6812736. 814308. 1269284. 2459155. -858339. 2870099 . 1017369.
5 33256672. 24096912. 9159760 . 728474. 1021936-. 3852862. -944173. 3930624 . 1075074.
6
7
8
9
10
35917184. 26024640 . 9892544. 634056 .
38790544. 28106608. 10683936. 530197.
41893760 . 30355104. 11538656. 415952.
45245248. 32783504. 12461744. 290283 .
488648 16 . 35406160. 13458656. 152047 .
NET PRESENT VALUE AT 20.0 PERCENT RATE OF RETURN
DISCOUNTED CASH FLOW RATE OF RETURN <PERCENT )
INFLATI ON RATE <PERCENT )
TAX RATE <PERCENT )
tax rate of 48 % are specified. Base net annual sales are estimated at $22,634,000 with a fixed annual operating cost of $3,200,000 and a variable annual operating cost of $13,200,000 at 100 % production. The variable annual operating cost is assumed to be proportional to the production rate. Percentages of production for the ten years of operation are as follows: 57, 66, 76, 87, 100, 100, 100, 100, 100, 100. Additional input data are the percentage of total investment financed by debt, 70 %, the life of the loan, 10 years, and the depreciable life, 10 years. Depreciation is computed by the double-declining balance method with a salvage value of $320,000. The program input data are entered in free format.
The columns of the cash flow table (Table 3) summarize the major components of the cash flow for each year of operation. The numbers represent annual amounts in inflated dollars.
Case Studies. A series of results obtained with the economic evaluation program are summarized in Tables 4 and 5. The effect of inflation on the internal rate of return (IRR) and on the net present value (NPV) is illustrated in Table 4 for various financing and tax situations. Cases 1 through 4 represent "after-tax return" with a tax rate of 48 % , while cases 5 through 8 represent "before-tax return," that is, tax rate equal to
WINTER 1984
822790 . 4386562.
769855. 4879619.
769855. 5383481.
769855. 5928835.
769855 . 6519112.
388%14.
38 . 19
8.00
48.00
- 1038591. 4170761. 880213.
-1142449. 4507024 . 733936 .
-1256694. 4896641. 615265 .
-1382363. 5316326. 515431.
1001752. 8290718 . 620221.
zero. The rest of the input data are the same as for the sample problem described above.
Comparison of cases 1 and 2 and of cases 5 and 6 show the effect of inflation on a heavily debtfinanced project. The increase in both the IRR and NPV is due to the fact that the net income from the project inflates while the loan payments remain constant. In other words, most of the inflation losses are passed on to the financing organization. Comparison of cases 3 and 4 show that the effect of inflation on the IRR and NPV reverses when the project is 100 % equity financed. This is due to taxes which increase with inflation
1. 2.
3. 4.
5. 6.
7. 8.
TABLE 4 Effect of Inflation on the Rate of Return
and the Net Present Value
Inflation % Tax IRR Rate, % Debt Rate, % %
0 70 48 35.76 8 70 48 38.19
0 0 48 17.17 8 0 48 15.56
0 70 0 46.46 8 70 0 51.17
0 0 0 26.56 8 0 0 26.32
NPV @ 20% k$
3,250 3,890
-1,580 -2,400
7,620 9,180
4,350 4,130
17

as depreciation remains constant. Notice the negative NPV for both of these cases. This is because the actual IRR is less than the 20 % rate of return used to calculate the NPV. The obvious advantage of debt financing in this problem is due to the low interest rate on the loan (10 % ). Finally, comparison of cases 7 and 8 shows that inflation has no effect on the before-tax return when there is no loan. This is because all of the remaining cash flow items are assumed to inflate at the same rate. Depreciation has no effect on the before-tax returns.
The effect of the depreciation method on the IRR and on the NPV is shown in Table 5. Both double-declining balance and sum-of-the-yearn' digits produce similar results and are superior to the straight line method. This is because the depreciation allowance is accelerated in the early years of the project reducing taxes and shifting after-tax income to the early years where it counts
TABLE 5 Effect of Method of Depreciation on the Rate of Return
and the Net Present Value
Depreciation Method
Straight-line Double-declining balance Sum-of-the-years' digits
Percent debt: 70% Tax Rate: 48% Inflation Rate: 8%
NPV @ IRR, % 20% k$
34.22 3,300 38.19 3,890 38.30 3,943
more. The double-declining balance method used by the program switches automatically to straightline in the later years of the project as allowed by the rules of the Internal Revenue Service.
CONCLUSIONS
Two computer programs have been developed which are suitable for use by students in process design courses. The equipment cost estimation program is flexible, easy to use and based on the latest cost correlations available, those from project ASPEN. The economic evaluation program frees the student from the tedious trial-and-error calculations which are involved in the determination of the internal rate of return. The program is realistic as it accounts for depreciation, income taxes and inflation. •
ACKNOWLEDGMENT
The authors wish to express their appreciation
18
to the staff of project ASPEN, MIT Energy Laboratory, for the cost correlations used in the equipment cost estimation program, and to Banco Central de Reserva de El Salvador for the support of Mr. Kuri.
REFERENCES
1. Bussey, L. E ., The Economic Analysis of Industrial Projects, Prentice-Hall, Inc., Englewood Cliffs, NJ, 1978.
2. Evans, L. B., et al., "Computer-Aided Industrial Process Design," The ASPEN Project, Eleventh Quarterly Progress Report, Massachusetts Institute of Technology, Cambridge, MA, March 15, 1979.
3. Evans, L. B., et al., "Computer-Aided Industrial Process Design," The ASPEN Project, Thirteenth Quarterly Progress Report, Massachusetts Institute of Technology, Cambridge, MA, September 15, 1979.
4. Evans, L. B., et al., "Computer-Aided Industrial Process Design," The ASPEN Project, Fourteenth Quarterly Progress Report, Massachusetts Institute of Technology, Cambridge, MA, December 15, 1979.
5. Kohn, Philip M., "CE Cost Indexes Maintain 13-year Ascent," Chemical Engineering, Vol. 85, No. 10, May 8, 1978, pp. 189-192.
6. Kuri, C. J., "Process Equipment Cost Estimat ion and Economic Evaluation," M.S. Thesis, Departmr nt of Chemical Engineering, Louisiana State University, Baton Rouge, Louisiana, 1980.
7. Peters, M. S., and K. D. Timmerhaus, Plant Design and Economics for Chemical Engineers, 3rd. ed., McGraw-Hill, New York, 1980.
8. Pikulik, A., and H. E. Diaz, "Cost Estimating for Major Process Equipment," Chemical Engineering , Vol. 84, No. 22, Oct. 10, 1977, pp. 106-122.
9. Richardson Engineering Services, Process Plant Construction E stimating Standards, Vol. 4, Solana Beach, CA, 1979-80.
10. Seader, J. D., W. D. Seider, and A. C. Pauls, FLOWTRAN Simulation-An Introduction, 2nd Ed., CACHE Corporation, Cambridge, MA, 1977.
11. Soni, Y., M. K. Sood, and G. V. Reklaitis, PCOST Costing Program, Purdue University, W. Lafayette, Indiana, May 1979.
[i) ;j #I books received "Flame-Retardant Polymeric Materials," edited by Menachem Lewin, S. M. Atlas, and Eli M. Pearce; Plenum Publishing Corp., New York, 10013; 238 pages, $35.00 (1982)
"Advances in Cryogenic Engineering," R. W. Fast, Editor; Plenum Publishing Corp., New York 10013; 1224 pages, $95.00 (1982)
"Surface Chemistry of Froth Flotation," Jan Leja; Plenum Publishing Corp., New York 10013; 758 pages, $69.50 (1982)
"Flat and Corrugated Diaphragm Design Handbook," Mario Di Giovanni; Marcel Dekker, Inc., New York 10016; 424 pages, $55.00 (1982)
CHEMICAL ENGINEERING EDUCATION

J. H. ERBAR John Harold Erbar, 51, professor of chemical
engineering at Oklahoma State University, died September 17, 1983.
Born in El Reno, OK, Erbar earned all of his academic degrees in chemical engineering at Oklahoma State University. Following service in the U.S. Army, he joined Standard Oil Company and worked in several research positions. He joined the OSU faculty as an assistant professor of chemical engineering in 1962 and was named full professor in 1969. He was named Teacher of the Year in 1970-71 and again in 1982-83.
Dr. Erbar was recognized internationally as an expert in computer applications in chemical engineering and taught courses in chemical engineering design, thermodynamics, fluid flow, stagewise
[i) ;j plll1 stirred pots
The Limerick Metric Applied to
Thermodynamics The subject of Thermodynamics, 'Tis true, is not for pedantics. For, tho work must be done And sweat be not shunned, Insight requires more than mechanics.
O'r the four Laws stands Confusion, As their numbering is all but illusion; For the first is not first, Tho the first is well vers'd, And the last is not fourth-how amusin' !
The relations of Maxwell are infamous For prompting ill-natured remarks most
boisterous. Their exactness is trying, Their permutations vying With other companions more amorous.
WINTER 1984
operations and others. He was a member of Omega Chi Epsilon, AIChE, ACS, ASEE, and various Oklahoma and national societies for professional engineers. He was a registered professional engineer in Oklahoma.
He is survived by his widow, Ruth, and a daughter and a son.
The compressibility of liquids and gases Is oft devious to lads and lasses. Relating P, V, and T Seems difficult to see Without perturbing the masses.
Some students have little capacity For understanding fugacity. Their tendency to flee Is paradoxical, to me, And how will they develop tenacity?
The structure of phase diagrams abound With complexities horribly profound. Solid fluid, triple critical, And others more mythical, Its very dimensions can naught but astound.
T'was once a Chem Engineer grasping For the concept of entropy dashing To proverbial heights ; But try as he might, There seemed little hope of his passing!
J.M. Haile Clemson University Clemson, SC 29631
19

,, D pll lab~~atory :
NEW ADSORPTION METHODS*
PHILLIP C. WANKAT Purdue University West Lafayette, IN 47907
ADSORPTION AND ION EXCHANGE systems are used for a variety of separations and purifications
in industry. Many different operational techniques have been proposed for these separation schemes. In this review we will first develop a simple method (suitable for undergraduate and rrraduate students) for following the movement of a solute in an adsorption or ion exchange system. Then this solute movement will be used to study a variety of operational methods. Much of this paper appeared previously [23].
SOLUTE MOVEMENT
Consider first a bed of porous particles. The particles have an interparticle (between different particles) porosity of a and an intraparticle (within a given particle) porosity of e. The total porosity of the bed for small molecules is a + (1-a)e. This is illustrated in Fig. 1. In addition, large solutes will not be able to penetrate all of the intraparticle void space. The fraction of volume of the particle which any species can penetrate is Ka, For a non-adsorbed species, Ka can be determined from
K _ Ve - Vo
d - vi (1)
where v. is the elution volume, V0 is the external void volume between the particles, and Vi is the
*Presented at ChE Division ASEE Summer School, August, 1982.
.....---- - ---.....
FIGURE 1. Porosities in packed bed.
internal void volume. When the molecules arc small and can penetrate the entire interparticle volume, V. = V1 + V0 and Ka = 1.0. When the molecules are large and can penetrate none of the interparticle volume, V. = V0 and Kct = 0.
As solutes migrate through the bed they can be in the mobile fluid in the external void volume in the stagnant fluid inside a particle, or sorbed to the particle. The only solutes which are moving towards the column exit are those in the mobile fluid. Consider the movement of an incremental mass of solute added to a segment of the bed shown in Fig. 1. Within this segment this incremental amount of solute must distribute to form a change in fluid concentration, ~c, and a change in the amount of solute adsorbed, ~q. The amount of this increment of solute in the mobile fluid compared to the total amount of solute increment in this segment is
Amt. in mobile fluid Total amt. in segment
Amt. in mobile fluid (2)
which is
20
Amt. in mobile fluid Total amt. in segment
Amt. in: (Mobile fluid + stationary fluid + sorbed)
© Copyright ChE D ivision, A SEE, 1984
CHEMICAL ENGINEERING EDUCATION

The solid density, p., is included in Eq. (3) to make the units balance. Ac is the cross sectional area, and z is the axial distance.
If fluid has a constant interstitial velocity, v, then the average velocity of the solute in the bed (the solute wave velocity) is just v times (relative amount of time the incremental amount of solute is in the mobile phase). Assuming a random process of adsorption, desorption and diffusion in and out of the stagnant fluid, the solute wave velocity becomes
--Lamount solute in mobile phase J u =v solu te total amount solute in column
(4) or, after rearrangement
V
therm. This assumption allows us to ignore mass transfer effects. The second assumption is that dispersion and diffusion are negligible; thus, all of the solute will travel at the same average solute velocity. These assumptions greatly oversimplify the physical situation, but they do allow us to make simple predictions. As long as we don't believe these predictions must be exactly correct, the simple model which results can be extremely helpful in understanding separation techniques.
For undergraduate students we limit the theory to simple linear equilibrium of the form
q = A(T)c (6)
where q is the adsorbed solute concentration,
U solute (T) 1 + [(1-a) / a] eK,1 + [(1- a) / a] (1-e)p. (.Aq / Ac) K d (5)
Eq. (5) represents a crude, first order description of movement of solute in the column. With a few additional assumptions this equation can be used to predict the separation in the system.
The most important assumption, and the assumption least likely to be valid, is that the solid and fluid are locally in equilibrium. Then Aq will be related to Ac by the equilibrium adsorption iso-
U so l ute (T)
Phil Wankat received his BSChE from Purdue and his PhD from
Princeton. He is currently a professor of chemical engineering at
Purdue. He is interested in teaching and counseling, has won several
teaching awards at Purdue, and is a part-time graduate student in
Education. Phil's research interests are in the area of separation process with particular emphasis on cyclic separations, two-dimensional
separations, preparative chromatography, and high gradient magnetic;
separation.
WIN'rER 1984
A (T) is the equilibrium constant which is a function of temperature, and c is the solute concentration in the fluid.
For common adsorbents the amount of material adsorbed decreases as temperature is increased. Thus A (T) is a monotonically decreasing function of temperature. With linear equilibrium Aq/ Ac= A (T), and Eq. (5) becomes
V
1 + [(1-a) / a]eK11 + [1-a) / a]Krt(l-e)p.A(T) (7
)
For Eq. (7) the solute wave velocity is the same as the average solute velocity. Eq. (7) allows us to explore the behavior of solute in the column for a variety of operating methods.
Several facts about the movement of solute can be deduced from Eq. (5) or Eq. (7). The highest possible solute velocity is v, the interstitial fluid velocity. This will occur when the molecules are very large and K" = 0.0. For small molecules K~ = 1.0, and with porous packings these molecules always move slower than the interstitial velocity even when they are not adsorbed. If adsorption is very strong the solute will move very slowly. When the adsorption equilibrium is linear, Eq. (7) shows that the solute velocity does not depend on the solute concentration. This is important and greatly simplifies the analysis for linear equilibria. If the equilibrium is nonlinear, Aq/Ac will depend on the fluid concentration and Eq. (5) shows that the solute velocity will depend on concentration.
21
Nonlinear equilibrium will be considered later. A convenient graphical representation of the
solute movement is obtained on a plot of axial distance, z, versus time. Since the average solute molecule moves at a velocity of U so lu t e (T)' this movement is shown as a line with a slope U solu l e •
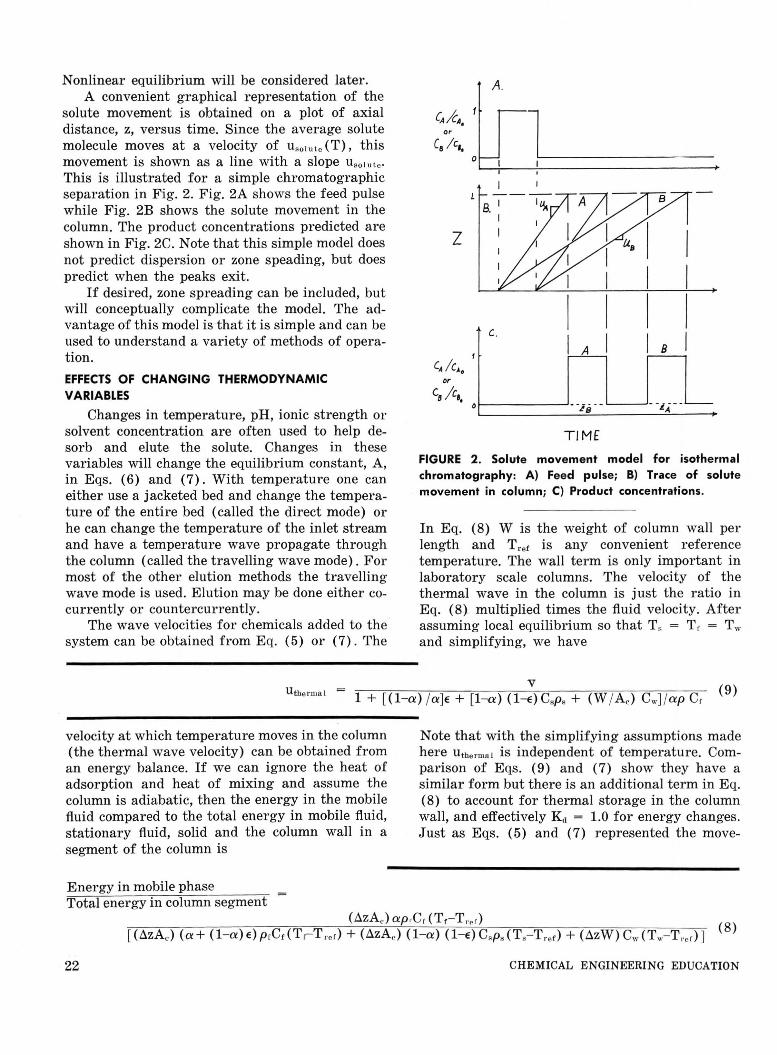
This is illustrated for a simple chromatographic separation in Fig. 2. Fig. 2A shows the feed pulse while Fig. 2B shows the solute movement in the column. The product concentrations predicted are shown in Fig. 2C. Note that this simple model does not predict dispersion or zone speading, but does predict when the peaks exit.
If desired, zone spreading can be included, but will conceptually complicate the model. The advantage of this model is that it is simple and can be used to understand a variety of methods of operation.
EFFECTS OF CHANGING THERMODYNAMIC VARIABLES
Changes in temperature, pH, ionic strength or solvent concentration are often used to help desorb and elute the solute. Changes in these variables will change the equilibrium constant, A, in Eqs. (6) and (7). With temperature one can either use a jacketed bed and change the temperature of the entire bed ( called the direct mode) or he can change the temperature of the inlet stream and have a temperature wave propagate through the column (called the travelling wave mode). For most of the other elution methods the travelling wave mode is used. Elution may be done either cocurrently or countercurrently.
The wave velocities for chemicals added to the system can be obtained from Eq. (5) or (7). The
A.
~lcA, 1
l or
C5 / c,, 0 I
8. I I
z I
C.
I I I I A B
0 .. h, -- - ·L;,-· .____
TIM£
FIGURE 2. Solute movement model for isothermal chromatography: A) Feed pulse; B) Trace of solute movement in column; C) Product concentrations.
In Eq. (8) W is the weight of column wall per length and T ref is any convenient reference temperature. The wall term is only important in laboratory scale columns. The velocity of the thermal wave in the column is just the ratio in Eq. (8) multiplied times the fluid velocity. After assuming local equilibrium so that T. = T r = Tw and simplifying, we have
V Uthe rmal 1 + [(1- a) / a]e + [1-a) (1-e)C.p. + (W / Ac) Cw]/apCr
(9)
velocity at which temperature moves in the column (the thermal wave velocity) can be obtained from an energy balance. If we can ignore the heat of adsorption and heat of mixing and assume the column is adiabatic, then the energy in the mobile fluid compared to the total energy in mobile fluid, stationary fluid, solid and the column wall in a segment of the column is
Energy in mobile phase Total energy in column segment
22
Note that with the simplifying assumptions made here Uthe rma1 is independent of temperature. Comparison of Eqs. (9) and (7) show they have a similar form but there is an additional term in Eq. (8) to account for thermal storage in the column wall, and effectively Ka = 1.0 for energy changes. Just as Eqs. (5) and (7) represented the move-
CHEMICAL ENGINEERING EDUCATION

ment of the average solute molecule, E q. (9) represents the average rate of movement of the thermal wave. A more exact analysis is needed to include dispersion and heat transfer rate effects.
On a graph of axial distance z versus time t the thermal wave will be a straight line with a slope Utbermal• Figure 3 illustrates elution using temperature for counter-current desorption. In this case a single solute is adsorbed. The feed flow is continued until just before solute breakthrough occurs. Then counter-current flow of a hot fluid is used to remove solute. Upon reversing the flow the fluid first exits at the feed temperature and the feed concentration. When the thermal wave breaks through, the temperature and concentration both jump. Since the adsorption equilibrium
constant is lower at high temperature the solute velocity can be significantly greater at the higher temperature. In actual practice the outlet temperature and concentration waves will be S-shaped curves because of the dispersion forces.
To complete the analysis of the traveling wave mode we need to consider the change in solute concentration when the adsorbent temperature is changed. The effect of temperature changes on solute concentration can be determined by a mass balance on a differential section of column Az over which the temperature changes during a time interval At. This balance for one solute is
avAt(c2-c1) - [a+ Kc1dl-a)] (C2-C1) Az - (1--a) (l-e)Kc1p. (q2-q,) Az = 0
(10)
where 1 refers to conditions before the temperature shift and 2 to after the shift. In Eq. (10) the first term is the in-out term, the second term is accumulation of solute in the fluid, and the third term is accumulation of solute on the solid. To ensure that all material in the differential section undergoes a temperature change the control volume is selected so that At = Az / utbet·mnl • The mass balance then becomes
( a+E(l-a) Kc1 - av ) (C2-C1) U t11e rmul
+ Kc1(l-a) (l-e)p. (q2-q1) = 0 (11)
If we assume that solid and fluid are locally in equilibrium and that the equilibrium isotherm is linear, then Eq. (11) reduces to
WINTER 1984
... we will first develop a simple method (suitable for undergraduate and graduate students) for following the movement of a solute in an adsorption or ion exchange system. Then this solute movement will be used to study a variety of operational methods.
C C,
0
z
0
C or
T
0
A.
I
• Reverse F/oi,,
1---- -- -----I 8.
r :iol .. ~
'"r
C. 1---I 7j.r.,•
T I I
Cc•NC Tof oF C,,/u,.,K
BottoM ol
~l"-HN
C, Jr r.
C
tR t, ~ TIME
FIGURE 3. Solute movement model for adsorption followed by counter-current elution with a hot fluid: A) Inlet concentration and temperatures; B) Trace of solute and temperature movement in bed; C) Product concentrations and temperatures.
In the typical liquid system Utbermal > Usolute (TH) > Usolute(Tc), and C(TH) > C(Tc), Thus the solute is concentrated during elution. This concentration is calculated from Eq. (12), and was plotted on Fig. 3C. Note in Figs. 3A and 3C that the overall mass balance will be satisfied. If the equilibrium constant A does not change very much u.0 1 (TH) ~ U80 1 (Tc) and there will be little change in concentration during elution. Since A is not usually strongly dependent on temperature, large temperature changes are required. An alternative is to use
- I ) (12) Uthermal
23

The equations developed here can be rigorously derived from the governing partial differential equations by 111aking a group of assumptions called the local equilibrium assumptions and then using .. . th:i method of characteristics.
a different eluant which has a major effect on A. Eqs. (11) and (12) are still valid but with U E!ua nt replacing U thermnl•
In the direct mode the entire column is heated or cooled simultaneously. In this case U therma l is essentially infinite and Eq. (12) simplifies to
U solute (TH) U so l ute (Tc)
(13)
For the usual adsorbent A (T) decreases ( solute desorbs) as temperature increases. Thus U so iu tc
increases and, as expected, Eq. (13) predicts that the solute concentration increases as temperature increases.
This completes the basic analysis procedure for the solute movement model for linear isotherms. As presented, this is not a rigorous mathematical model but was based on simple physical ideas. The equations developed here can be rigorously derived from the governing partial differential equations by making a group of assumptions called the local equilibrium assumptions and then using a mathematical method called the method of characteristics [l, 22]. Although some of the assumptions required for the rigorous development have been mentioned in passing, it will be helpful to list them explicitly here.
1. Homogeneous packing (no channeling). 2. Radial gradients are negligible. 3. Neglect thermal and pressure diffusion. 4. No chemical reactions except for sorption. 5. Neglect kinetic and potential energy terms. 6. No radiant heat transfer. 7. No electrical or magnetic fields. 8. No changes of phase except sorption. 9. Parameters are constant except for A.
10. Constant fluid velocity. lla. Column is adiabatic, or llb. Column is at controlled constant temperature. 12. Heat of adsorption is negligible. 13. Solutes do not interact. 14. Thermal and mass dispersion and diffusion are
negligible. 15. Heat and mass transfer rates are very high so that
fluid and solid are locally in equilibrium. 16. Equilibrium is linear.
This is a formidable list of assumptions. If any
of these assumptions are invalid the predictions can be way off. The most critical assumptions are the last three. Assumptions 14 and 15 cause the outlet concentrations and temperatures to show sharp jumps instead of the experimentally observed S-shaped curves. Alternate mathematical models which are more realistic but much more complex are reviewed by Sherwood et al [19]. Assumption 16 can also cause physically impossible predictions, but fortunately this assumption of linear equilibrium is easily relaxed (see the next section).
As we have seen this model greatly oversimplifies the actual fluid flow and heat and mass transfer processes occurring in the column. Because of this the predicted separation is always better than that obtained in practice. What is this model good for? The model is simple and can thus be used to analyze rather complex precesses. The model does predict when the peak maximum will exit and thus is a good guide for setting operating variables. Since this model predicts the best possible separation, the model can be used to determine if, at its best, a separation scheme is of interest. Since the predictions made are qualitatively correct, as long as the model predictions are interpreted in a qualitative or at best semiquantitative sense the model is very useful.
NONLINEAR SYSTEMS
If the equilibrium isotherm is nonlinear the basic structure developed here is still applicable, but we must use Eqs. (5) and (11) instead of (7) and (12) . The solute velocity now depends on both temperature and concentration. Once a specific isotherm is determined it can be substituted into Eq. (5). For example, if the Freundlich isotherm
q=A(T)c'' k < l
is used, then
and
lim Aq Ac• O Ac -
oq I= kA(T)ck-1 ac T
(14)
(15)
V
ll so l ute = 1 + [(1- a) /a] EKct + [(hx) /a ] Kct (l-e)p.kA(T)ck-i (l6)
24 CHEMICAL ENGINEERING EDUCATION

A.
c~
[IN
c,
B.
L
z
C.
TfMt
FIGURE 4. Diffuse waves: A) Inlet concentration; B) Sol\lte movement; C) Outlet concentration.
A diffuse wave occurs when a concentrated solution is displaced by a dilute system. This is illustrated in Fig. 4 where the outlet wave concentrations are calculated. If we try the reverse ( dilute solution displaced by a concentrated solution) then the limit does not exist since Lie has a finite value. A shock wave occurs. Another way of looking at this is Eq. (16) predicts a lower slope for dilute systems. When a concentrated solution displaces a dilute solution (Fig. 5A), the theory predicts that the solute lines overlap and two different concentrations occur simultaneously (Fig. 5B). This is physically impossible. To avoid this problem a mass balance is done on a finite section of the column of length Liz. This balance is the same as Eq. (10) except 1 refers to before the shock and 2 after the shock. Now we select the time interval Lit = Liz /ushock so that the shock has passed through the entire section. Solving for the shock wave velocity, we obtain
This is shown in Fig. 5C and the outlet concentration is calculated in Fig. 5D.
Nonlinear isotherms can result in interesting interactions when various shock and diffuse waves intersect. The mathematical principles involved in switching from differential to finite elements is also a good pedalogical tool for teaching graduate students. For graduate students I rigorously derive all these results using the local equilibrium model and the method of characteristics [19, 22].
COUNTER-CURRENT OPERATION I. Continuous Flow
In most chemical engineering unit operations continuous counter-current flow is used since it is usually the most efficient way to operate. Countercurrent movement of solids and fluid is difficult
Continued on page 44.
B.
z
C.
z
TIME
FIGURE 5. Shock wave: A) Inlet concentration; B) Solute waves following Eq. 18; C) Shock wave; D) Outlet concentration.
V (17) Ushock = 1 + [ (1- a) / a]eKd + [(1-a) /a] (1- E) Kdps [(q2-q1) / (C2- C1)]
WINTER 1984 25

[eJ n #I classroom
THE PROCESS DESIGN COURSES AT PENNSYLVANIA:* Impact Of Process Simulators
WARREN D. SEIDER University of Pennsylvania Philadelphia, PA 19104
FOR THE PAST 35 years, a two-semester process design sequence has been taught at the Uni
versity of Pennsylvania. This sequence is unique in several aspects, most notably its diversity of design projects, involving seven faculty advisors and seven consultants from local industry. The fall lecture course, "Introduction to Process Design," covers the methodology of process design and prepares our students for the spring project course, "Plant Design Project," which is intended to provide a meaningful design experience. This article is focused on the impact of process simulators in recent years.
In 1967, we began to introduce computing technology and modern design strategies, principally in the sophomore course on "Material and Energy Balances," and have gradually integrated process simulators into the design sequence. Our objective was to strengthen the highly successful sequence developed by Melvin C. Molstad, A. Norman Hixson, other faculty, and our many industrial consultants. From 1967-1973, our efforts to develop educational materials (principally software) far outweighed the benefits to the students. However, in 1974, the availability of Monsanto's FLOWTRAN Simulator finally made this step successful. Additional industrial simulators have since become available and the benefits to our students now far outweigh our past efforts.
*Based on a lecture at the ASEE Summer School for ChE faculty, Santa Barbara, CA, August, 1982.
Initially, the steps to satisfy a societal need are summarized e.g., the conversion of coal to liquid and gaseous fuels.
26
Warren D. Seider is Associate Professor of chemical engineering at the University of Pennsylvania. He received his B.S. Degree from
the Polytechnic Institute of Brooklyn and Ph.D. Degree from the
University of Michigan. Warren's research concentrates on mathe
matical modelling for process design and analysis. He and his
students have developed new methods for calculation of phase and
chemical equilibria, analysis of azeotropic distillation towers, analysis
of complex reaction systems, and integration of stiff systems. Warren
teaches courses with emphasis on process analysis and design . He has
co-authored Introduction to Chemical Engineering and Computer Calculations (with A. L. Myers) and FLOWTRAN Simulation-An Intro•
duction (with J. D. Seader and A. C. Pauls). He helped to organize CACHE and served as the first chairman from 1971-73. In 1979 he was
elected Chairman of the CAST Division of AIChE and in 1983 he was
elected a Director of AIChE.
Design courses are normally taught last in the chemical engineering curriculum and, hence, the details of the lecture course depend somewhat on the prerequisite courses-and class size. Hopefully, this discussion of our particular format will provide useful ideas.
FALL LECTURE COURSE: INTRODUCTION TO PROCESS DESIGN
The outline of topics and associated lecture hours are listed in Table 1. Two books are required: Plant Design and Economics for Chemical Engineers [7], and FLOWTRAN Simulation-An
1£) Copyright ChE ,Division, ASEE_ 1984
CHEMICAL ENGINEERING EDUCATION

TABLE 1 Outline of topics. Fall lecture course.
Lecture Hours
Introduction 1 Process Synthesis 1 Ana lysis of F lowsheets- FLOWTRAN 12
Simulation Design of Heat Exchangers 8 Cost Estimation 3 Time-Value of Money, Taxes, Depreciation 3 Profitability Analysis 2 Optimization 3 Heat Integration 4 Synt hesis of Separation Processes · 2 Selection of Design Projects (for 1
Spring Project Course) Exams 2
42
Introduction [9]. In addition, materials are taken from seven other sources which are placed on reserve in our library [l, 2, 3, 4, 5, 6, 11].
The course expands upon the steps in the development of a new chemical process as shown in Fig. 1 (based upon a similar figure in Rudd and Watson [8]). Initially, the steps to satisfy a societal need are summarized; e.g., the conversion of coal to liquid and gaseous fuels. Of course, the steps are not always carried out in the sequence shown. For example, a sensitivity analysis is often performed prior to an economic analysis. In the integrated plants of today, aspects of transient and safety analysis must also be considered in the synthesis of the process flowsheet .
Next, the steps in the synthesis of a vinyl chloride process are illustrated with the intent of exposing the steps that enter into the invention of alternative flowsheets. Fig. 2 shows the evolution of one flowsheet, beginning with selection of the reaction path (not shown), followed by the distribution of chemicals (matching sources and sinks and introducing recycle) , selection of the separation steps, the temperature and phase change operations (not shown), and, finally, the integration into chemical process equipment. This is based upon Chapter 3, "Process Synthesis," in Introduction to Chemical Engineering and Computer Calculations [6]. It is noteworthy that steam is used to vaporize dichloroethane and cooling water to cool the reaction products in a quench operation. We emphasize the desirability of heat integration, when feasible, but because carbon would deposit in the evaporator tubes, a rapid low-temperature quench, with water as the cool-
WINTER 1984
Principal emphasis is given to the subroutines to model the process
units such as vapor-liquid separators, multi-staged towers, heat exchangers, compressors,
and reactors.
ing medium, is necessary. Having introduced the concepts of flowsheet
synthesis, attention is turned to the analysis of alternative flowsheets. In practice, of course, the two go hand-in-hand. FLOWTRAN is used principally because our book [9] is written in a t utorial fashion, as compared with the usual User Manuals. FLOWTRAN has been available for students on United Computing Systems, but its usage has been limited by the relatively high cost of commercial computers. Recently, however, like ChemShare (DESIGN /2000) and Simulation Sciences (PROCESS), Monsanto has made FLOWTRAN available for installation on university computers-
Societa l Need
Del ine Genera l
Process Objective
Co ll ect
Sensilivi l y An al ysis
Pr oduc t Demond
{
Econo mic Fo recas ts
Row Mat eri al Supplies
FIGURE 1. Steps in the development of a new chemical
process.
27

greatly improving the effectiveness of process simulators in the design course.
Principal emphasis is given to the subroutines to model the process units such as vapor-liquid separators, multi-staged towers, heat exchangers, compressors, and reactors. There are several subroutines to solve the equations that model each process unit. The models vary in specifications and rigor and it is important that the design student understand the underlying assumptions, but not the solution algorithm. We review the assumptions and make recommendations concerning usage of the subroutines listed in Fig. 3. For example, the PUMP routine disregards the capacity-head curve and uses the viscosity of pure water. When designing a distillation tower, use of DSTWU is recommended to calculate the minimum number of trays, the minimum reflux ratio, and the theoretical number of trays (given the reflux ratio), followed by DISTL which uses the Edmister assumptions to simulate the tower and, in some cases, FRAKB or AFRAC to solve the MESH equations with fewer assumptions.
The synthesis of the simulation flowsheet is also emphasized with consideration of novel ways of using the subroutines to analyze a process flowsheet. For example, consider the quench process (Fig. 4a) in which hot gases are contacted with a cold liquid stream. Given the recycle fraction, and assuming that the vapor and liquid products are at equilibrium with no entrainment, most designers would develop the simulation flowsheet shown in Fig. 4b. However, iterative recycle calculations are unnecessary because the vapor and liquid products (S3, S5) are independent of the recirculation rate. In a more efficient simulation flowsheet, the IFLSH subroutine determines the flow rate and compositions of S3 and S5 (see Fig. 4c). Then, MULPY subroutines compute the flow rates for S4 and S6. Most students use the "brute-force" approach in Fig. 4b, requiring about 5-10 iterations with Wegstein's method, before we demonstrate that the iterative recycle calculations can be avoided.
These lessons are reinforced with a problem to simulate the reactor section of the toluene hydrodealkylation process [9, p. 228]. Feed toluene is mixed with recycle toluene and a recycle gas stream. The reaction products at 1268°F are quenched and the recycle fraction is adjusted to reduce the product temperature to 1150°F. As above, the iterative recycle calculations can be avoided, although most students use the brute-
28
a) The process synthesis problem
HU I I IIMNllod
IIJ ,ood lDft
l!u to' a,~ , ~• f ., '
Hool l l!Hr h , ,h1rl ft t •N~ti.,, ,
~.2 1 I06
11w / M
; ,, I
Desired Product
b) Flow sheet showing distribution of chemicals for thermal cracking of dichloroethane from chlorination of ethylene (reaction past 3)
'"•'·
c) Flow sheet showing separation scheme for vinyl chloride process
d) Flow sheet showing task integration for the vinyl chloride process
FIGURE 2. Synthesis of a vinyl chloride process (Myers and Seider [6]).
CHEMICAL ENGINEERING EDUCA'rlON

force approach. The FLOWTRAN subroutine EXCHl imple
ments the method of thermodynamic effectiveness (computes terminal temperatures, given the area and overall heat transfer coefficient), and the EXCH3 subroutine implements the log-mean temperature difference method ( computes the area, given terminal temperatures and overall heat transfer coefficient). Since these methods are not covered in our course on heat and mass transfer, the methods are derived and problems are worked using Chapter 11 of Principles of Heat Trans! er [5] as text material. Then, the students design a heat exchanger (e.g., 1-4 parallelcounterflow) with correlations for the heat transfer coefficients and pressure drops on the shell and tube sides and the methods presented by Kern [4] and Peters and Timmerhaus [7]. This exposes the student to more detailed analysis procedures than are available in most process simulators. Such detail is recommended only when the approximate models introduce large errors and the cost of a heat exchanger contributes significantly to the economics of the process.
This leads to methods of cost estimation. FLOWTRAN has subroutines for cost estimation, but the assumptions of the cost models are not
FIGURE 3 FLOWTRAN subroutines (blocks)
Flash IFLSH AFLSH BFLSH
Stage wise SEPR separation DSTWU
DISTL FRAKB
AFRAC
Heat exchange HEATR EXCHl
EXCH3
Reactor REACT
XTNT
Compression PUMP GCOMP
Misc. ADD SPLIT MULPY
WINTER 1984
Isothermal flash Adiabatic flash General purpose flash
Split fraction specification Winn-Underwood-Gilliland
distillation Edmister distillation Tray-to-tray distillation (KB
method) Tray-to-tray distillation and
absorption (matrix method)
Heat requirement Shell and tube-method of
thermodynamic effectiveness Shell and tube-log-mean temp.
diff. method
Fractional conversion specifica-tion
Extent of reaction s pecification
Centrifugal pump Compressor (or turbine)
Mixer Stream splitter Stream multiplier
stated or referenced. Since no basis is available for justifying their results, well-established and clearly stated methods are preferred. The factored cost methods of Guthrie [3] have been used to date, but the factors in his article need updating. We are evaluating the PCOST program developed at Purdue University [10] and the data
Quenched Gos
Coo l ing Water
Hot Gas - ~ - ~
(c l Acyc lic S imu l at io n F lowsheet
FIGURE 4. QUENCH process.
(a l Proc ess Fl owsheet
!bl Iterative Simulat ion
Flowsheet
books of Woods [12]. Both give cost curves and factors based upon more recent cost data.
For production or operating costs, the recommendations of Peters and Timmerhaus in Chap. 5 are used with concentration on the direct production costs, such as for raw materials, operating labor, and utilities. The Chemical Marketing Reporter provides the costs of chemicals bi-weekly ( often for several locations within the United States).
Next, the concepts of profitability analysis are introduced, following the sequence of Peters and Timmerhaus in Chaps. 6-9. The concepts of simple and compound interest are applied to give the present and future values of an investment and to define an annuity. Then, capitalized costs are covered to provide a basis for evaluating the cost of equipment having different service lives. For Continued on page 41.
29

Kil;, a curriculum
INTRODUCING THE REGULA TORY PROCESS INTO THE CHEMICAL ENGINEERING CURRICULUM
A Painless Method
FRANKLIN G. KING AND RAMESH C. CHAWLA Howard University Washington, D.C. 20059
ENGINEERING FACULTY CAN NO longer doubt that government regulations have had a major
impact on engineering practice. Public policy decisions have resulted from social concerns and have mandated engineering solutions in many areas, such as environmental pollution, proper disposal of hazardous wastes, consumer product safety, and the control of exposure to carcinogenic and toxic materials. Because technological invention has such a great impact on our society, the scope of an engineer's responsibilities must include a sensitivity for social concerns and the participation in public policy issues involving technology. Engineers are directly affected because our designs are often covered by government regulations. Engineers must also provide the data and technical judgment needed to formulate public policy and to write realistic and technically feasible regulations to implement the policies. If all these things are true, then an argument can be made that engineering students should be exposed to the interaction of engineering and public policy as part of their professional education.
There are at least three different ways that an introduction to government regulations and the
Engineers are directly affected because our designs are often covered by government regulations. Engineers must also provide the data and technical judgment needed to formulate public policy . ..
© Copyright ChE ,Pivittion, ASEE. 1984
30
Franklin G. King received his B.S. degree from Penn State, his
masters in e ducation from Howard University, his masters in chemical
engineering from Kansas State and his D.Sc. from Stevens Institute of
Technology. He has been teaching for the last 18 years at Howard
University and at Lafayette College. His current interests include the
development of personalized instruction methods, biochemical eng i
neering and pharmacokinetic modelling of anticancer drugs. (L)
Ramesh C. Chawla is an Associate Professor of chemical engineer
ing at Howard University. He did his undergraduate work at the
Indian Institute of Technology, Kanpur and obtained his M.S. and
Ph.D. degrees from Wayne State University. Dr. Chawla is a member
of many professional societies including AIChE, APCA, WPCF, Sigma
Xi and SAE. He has received several teaching awards including Out
standing Instructor Award from the Howard University AIChE Student
Chapter and Teeter Award from SAE. His research interests include
kinetics, air and water pollution, and mass transfer. (R)
regulatory process can be integrated into the chemical engineering curriculum. The first approach would be to recommend an elective course on the topic. Many universities have introduced "Society and Technology" elective courses which usually focus on the impact of technology as a social phenomenon, rather than on the technical aspects of public policy issues. These courses are often not recommended by engineering faculty because they do not meet the requirements as a
CHEMICAL ENGINEERING EDUCATION

technical or a social science elective. Generally these courses are not taught by engineering faculty. Thus, engineering students are deprived of a role model and get the feeling that engineers are not concerned with the regulatory process and public policy issues. Also, since the courses are elective courses, many students may not select them voluntarily.
A second approach is the use of interdisciplinary project-oriented courses. The course would be team-taught by both engineering and social science faculty and the students could be both technical and non-technical. As an example, a course could be devoted to a project of cleaning up a river where the team would have to consider both the technical and the social aspects of different solutions. These courses require a considerable amount of faculty time to organize and develop. They also require cooperation of different departments operating on different budgets.
A third technique is to use engineering case studies to introduce public policy considerations directly into the engineering curriculum. The use of case studies can overcome the local problem of developing and sustaining projects with public policy issues. If case materials were available and if only part of a course involved issues concerning public policy, then many faculty might be willing to get involved. On the other hand, few engineering faculty would feel comfortable with or be willing to teach an entire course dealing with public policy. However, if faculty would give students even a small peek at public policy issues they should be able to foster an awareness of the relevance of the social science/humanities component in education. We, as engineering faculty, might even grow a bit as we come to understand the impact of policy issues on the practice of engineering education.
We would like to describe a project which was aimed at developing a number of case studies with public policy considerations and how we have introduced public policy into our undergraduate curriculum at Howard University. We would also invite you to get involved so that case studies can be developed that can be used in chemical engineering curricula.
THE EPEPP PROJECT
The Educating Prospective Engineers for Public Policy (EPEPP) project is administered by ASEE with the University of Washington as the academic sponsor and Professor Barry Hyman [2]
WINTER 1984
The goal of the project is to provide future engineers with the tools necessary to
contribute professionally to the resolution of technically intensive public policy issues.
as the project director. The project has the financial support from the National Science Foundation, Sun Oil Company, General Motors, and nine engineering societies. AIChE has become a sponsor for the 1984 program.
The goal of the project is to provide future engineers with the tools necessary to contribute professionally to the resolution of technically intensive public policy issues. The project is in response to the needs of society to have a greater technical input into the making of . public policy in engineering and technology areas and to the needs of engineers to have a broadened awareness and understanding of the meaning of public policy. The project is geared to produce case studies on topics concerning public policy issues which have technical components. The objective of the project will be accomplished by the direct experience of a small number of students and faculty and by the integration of the case studies into the typical engineering curriculum.
The project has three major integrated components: 1) Washington Internship for Students of Engineering (WISE) ; 2) the development of case studies on engineering and public policy on topics based on the WISE program; and 3) a series of regional ASEE faculty workshops to promote the utilization of case studies.
The WISE Program provides an opportunity for about 15 third-year engineering students to spend 10 weeks during the summer studying the relationship between engineering and public policy. An objective of the WISE program is for the students to gain an understanding of the operation of the federal government so that they can appreciate the non-technical aspects of technology related public policy problems. The students receive a stipend of $1750 to cover expenses. They also receive 3 credits from University of Washington. Their goal for the summer is to complete a written report on their project to provide the basis of a case study. The students are selected competitively by the sponsoring engineering societies. Fortunately, five chemical engineers have been selected even though AIChE was not a sponsor.
31
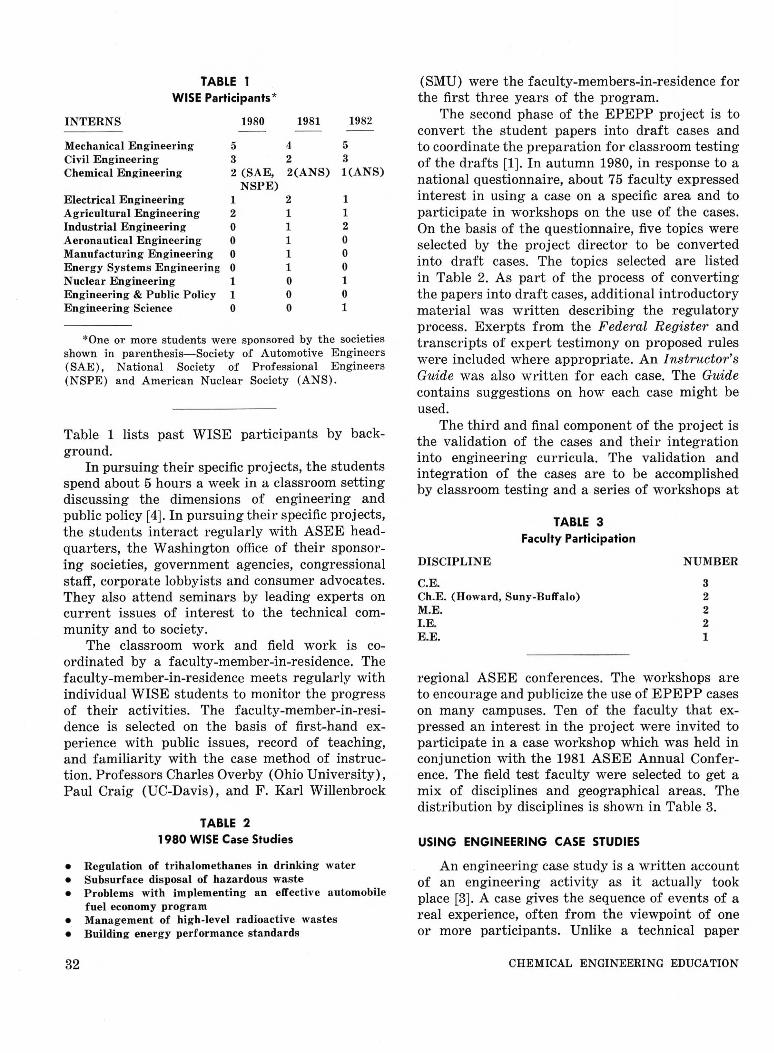
TABLE 1 WISE Participants*
INTERNS 1980
Mechanical Engineering 5 Civil Engineering 3 Chemical Engineering 2 (SAE,
NSPE) Electrical Engineering 1 Agricultural Engineering 2 Industrial Engineering 0 Aeronautical Engineering 0 Manufacturing Engineering 0 Energy Systems Engineering 0 Nuclear Engineering 1 Engineering & Public Policy 1 Engineering Science 0
1981 1982
4 5 2 3 2(ANS) l(ANS)
2 1 1 1 1 2 1 0 1 0 1 0 0 1 0 0 0 1
*One or more students were sponsored by the societies shown in parenthesis-Society of Automotive Engineers (SAE), National Society of Professional Engineers (NSPE) and American Nuclear Society (ANS).
Table 1 lists past WISE participants by background.
In pursuing their specific projects, the students spend about 5 hours a week in a classroom setting discussing the dimensions of engineering and public policy [ 4]. In pursuing their specific projects, the students interact regularly with ASEE headquarters, the Washington office of their sponsoring societies, government agencies, congressional staff, corporate lobbyists and consumer advocates. They also attend seminars by leading experts on current issues of interest to the technical community and to society.
The classroom work and field work is coordinated by a faculty-member-in-residence. The faculty-member-in-residence meets regularly with individual WISE students to monitor the progress of their activities. The faculty-member-in-residence is selected on the basis of first-hand experience with public issues, record of teaching, and familiarity with the case method of instruction. Professors Charles Overby (Ohio University), Paul Craig (UC-Davis), and F. Karl Willenbrock
TABLE 2 1980 WISE Case Studies
• Regulation of trihalomethanes in drinking water • Subsurface disposal of hazardous waste • Problems with implementing an effective automobile
fuel economy program • Management of high-level radioactive wastes • Building energy performance standards
32
(SMU) were the faculty-members-in-residence for the first three years of the program.
The second phase of the EPEPP project is to convert the student papers into draft cases and to coordinate the preparation for classroom testing of the drafts [l]. In autumn 1980, in response to a national questionnaire, about 75 faculty expressed interest in using a case on a specific area and to participate in workshops on the use of the cases. On the basis of the questionnaire, five topics were selected by the project director to be converted into draft cases. The topics selected are listed in Table 2. As part of the process of converting the papers into draft cases, additional introductory material was written describing the regulatory process. Exerpts from the Federal Register and transcripts of expert testimony on proposed rules were included where appropriate. An Instructor's Guide was also written for each case. The Guide contains suggestions on how each case might be used.
The third and final component of the project is the validation of the cases and their integration into engineering curricula. The validation and integration of the cases are to be accomplished by classroom testing and a series of workshops at
TABLE 3 Faculty Participation
DISCIPLINE
C.E. Ch.E. (Howard, Sony-Buffalo) M.E. I.E. E.E.
NUMBER
3 2 2 2 1
regional ASEE conferences. The workshops are to encourage and publicize the use of EPEPP cases on many campuses. Ten of the faculty that expressed an interest in the project were invited to participate in a case workshop which was held in conjunction with the 1981 ASEE Annual Conference. The field test faculty were selected to get a mix of disciplines and geographical areas. The distribution by disciplines is shown in Table 3.
USING ENGINEERING CASE STUDIES
An engineering case study is a written account of an engineering activity as it actually took place (3]. A case gives the sequence of events of a real experience, often from the viewpoint of one or more participants. Unlike a technical paper
CHEMICAL ENGINEERING EDUCATION

which focuses on the validity of a solution, a case considers how the results were obtained. A case often shows how the participants interacted to accomplish the engineering task. A case is often written in segments to allow class study or discussion at critical decision points. Cases, like design projects, have no single correct answer and depend on many subdivisions of engineering. They often raise questions of human behavior and ethics as well as technical questions, and thus permit many possible solutions.
Engineering cases can be used in many different ways. A list of some of the more common methods is given in Table 4. Using cases as read-
TABLE 4 Classroom Uses of Case Material
• Reading assignments • Background to specific problems • Practice in formulating problems • Subjects for class discussion • Medium for relating engineering history and illustrat
ing the engineering method • Motivation for laboratory work • Background and source for research or design projects
ing material is the simplest method, but it is probably the least effective. One of the other methods should probably be selected since students will be more involved in the learning process.
EXPERIENCE AT HOWARD UNIVERSITY
We used the draft case study "Regulation of Trihalomethanes (THM's) in Drinking Water" as part of our first chemical engineering course "Introduction to Engineering Design." All of our students were concurrently taking their second semester of chemistry and calculus. The THM case was selected from the available cases because it had a strong chemistry component and the topic had the most interest to chemical engineers.
The students were all given a copy of the case study as a reading assignment and were given a short technical presentation on the formation
- of THM's in water. Every attempt was made to insure unbiased dissemination of information. The students were next organized, voluntarily, into one of six groups consisting of the EPA, Congress, industry, consumer groups, research centers and universities, and judges. Each group was asked to prepare themselves for a role-playing discussion of the topic. Each group then met individual-
WINTER 1984
Unlike a technical paper which focuses on the validity of a solution, a case considers
how the results were obtained ... Cases, like design projects, have no single correct answer and
depend on many subdivisions of engineering.
ly to formulate their strategy. They were encouraged to explore the topic in as great technical detail as possible. The students were expected to present and defend the positions of their group, rather than express their personal views.
The discussion period consisted of a two-hour session which began by having each group's spokesperson summarize the group's role in the regulation process. Two faculty members and a senior student joined the judges group to moderate and guide the discussion and to bring out various aspects of the problem. The judges also acted to evaluate individual student and group performance. A lively debate followed, with each group questioning the others. The judges were successful in keeping the discussion going and getting most of the students involved in the discussion. The student judges were unanimous in siding with the consumer group, their evaluation being more on an emotional basis than a factual one. The faculty judges felt that the discussions should have been more technical, but everyone agreed that they had a better understanding of the regulatory process and why engineers must be involved.
We plan to continue using the case studies in our freshman class and intend to introduce them in the senior level design course. We expect to get a better technical response from the seniors, but both groups will gain a sensitivity for the social responsibility of engineers. •
REFERENCES
1. Federow, H. L., and B. Hyman. "Developing Case Histories from the WISE Program," Proceedings of the 1981 ASEE Annual Conference, pp. 1011-1015.
2. Hyman, Barry (EPEPP Project Director). Program in Social Management of Technology, FS-15. University of Washington, Seattle, Washington 98195.
3. Kardos, G., and C. 0 . Smith. "On Writing Engineering Cases." Proceedings of the 1979 ASEE Engineering Case Studies Conference.
4. Overby, C. M. "Engineering and Public Policy: Reflections by the 1980 (WISE) Faculty-Member-inResidence." Proceedings of the 1981 ASEE Annual Conference, pp. 1004-1009.
33

[e) ;j plll classroom
MODULAR INSTRUCTION UNDER RESTRICTED CONDITIONS
TJIPTO UTOMO Bandung Institute of Technology Bandung, Indonesia
KEES RUIJTER Twente University of Technology Enschede, The Netherlands
DUE TO THE ECONOMIC recession and cuts in edu-cational budgets, discussions on the efficiency
of the education system (especially with regard to faculty time) have only recently been started in the Western world. For developing countries, however, this is not only a well known problem but only one of many problems. Besides having a
Tjipto Utomo graduated from high school in 1941 but had to
suspend his academic activities during the second World War and
the following struggle for independence. He began university studies
in 1950 and graduated from the chemical engineering department of
the Institute of Technology Bandung in 1957. He obtained his MChE
degree in 1959 from the University of Louisville and is presently a professor at the Institute of Technology Bandung. (L)
Kees T. A. Ruijter is a graduate in chemistry from the University
of Amsterdam. During the years of 1979-19B3 he worked in the Dutch-Indonesian program on upgrading chemical engineering edu
cation in Indonesia. Before that he was with the Twente University of Technology (Holland) working on the development of chemical
engineering education and he has now returned there. His ma in
areas of interest are lab course improvement, efficiency of the learn
ing-teaching process, and curriculum evaluation and development. (R)
34
small faculty, underpaid and overoccupied with additional activities, universities often face such conditions as inhomogeneous classes (in capability as well as in motivation), low staff-student ratios, rapidly increasing enrollments, and the need for more graduates.
In a cooperative project between the Bandung Institute of Technology (ITB) and technical universities in The Netherlands, the educational system was improved gradually within these restrictive conditions [1]. One of the main features, a modified modular instructional system, is the subject of this article.
THE TRANSPORT PHENOMENA COURSE
The transport phenomena ( T .P.) course is a fourth semester course. However, because the first year is a common basic science program for all ITB students, it is their first real confrontation with engineering concepts. For this reason and because less than 30 % of the students passed yearly, the T.P. course was chosen as our pilot course.
In the first phase of reconstruction the course and its context were thoroughly evaluated. Some measures were investigated in an experimental set-up and implemented step-wise. The main findings were
1. Only a few students perform at an acceptable level. Many students know the principles and laws but cannot apply them in any situation.
We decided to restrict the number of topics to be discussed and to require the students to perform at a higher level of competence.
2. The individual differences in student performance are enormous (despite the common first year program).
To minimize this problem we developed a modular instruction scheme enabling the students to study at their own pace.
3. The students (80%) are not able to read English texts.
Also, because the lecture as a source of informa-
© Copyright ChE Division, ASEE . 1984
CHEMICAL ENGINEERING EDUCATION
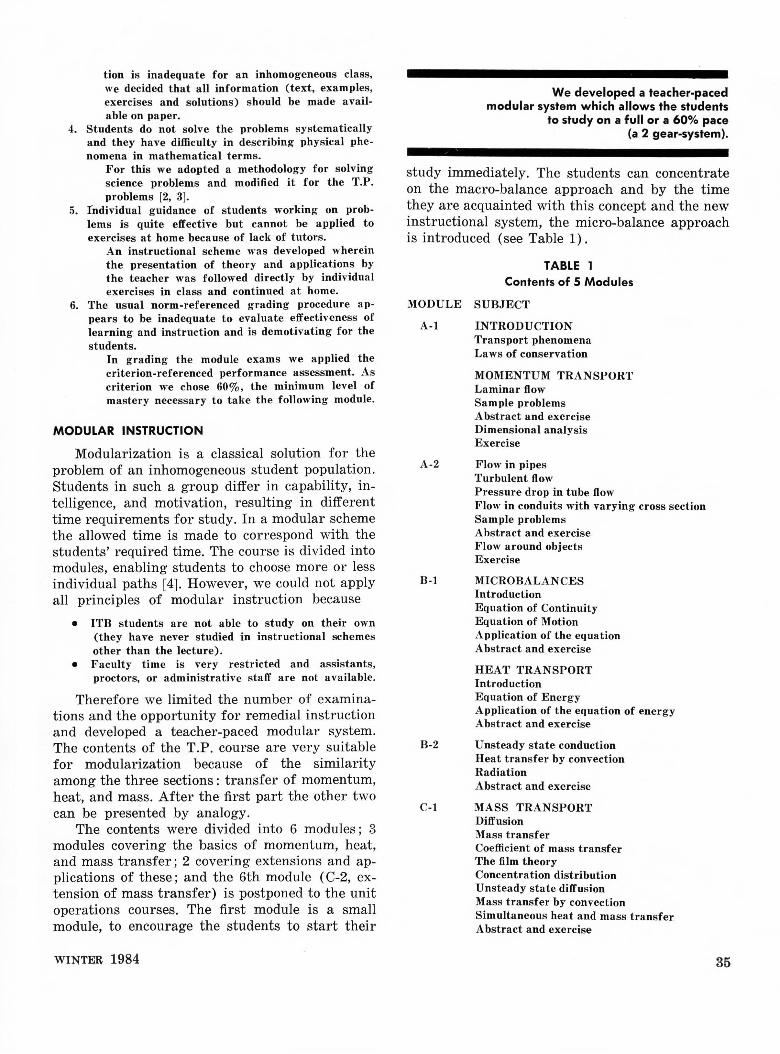
tion is inadequate for an inhomogeneous class, we decided that all information (text, examples, exercises and solutions) should be made available on paper.
4. Students do not solve the problems systematically and they have difficulty in describing physical phenomena in mathematical terms.
For this we adopted a methodology for solving science problems and modified it for the T.P. problems [2, 3].
5. fodividual guidance of students working on problems is quite effective but cannot be applied to exercises at home because of lack of tutors.
An instructional scheme was developed wherein the presentation of theory and applications by the teacher was followed directly by individual exercises in class and continued at home.
6. The usual norm-referenced grading procedure appears to be inadequate to evaluate effectiveness of learning and instruction and is demotivating for the students.
In grading the module exams we applied the criterion-referenced performance assessment. As criterion we chose 60%, the minimum level of mastery necessary to take the following module.
MODULAR INSTRUCTION
Modularization is a classical solution for the problem of an inhomogeneous student population. Students in such a group differ in capability, intelligence, and motivation, resulting in different time requirements for study. In a modular scheme the allowed time is made to correspond with the students' required time. The course is divided into modules, enabling students to choose more or less individual paths [4]. However, we could not apply all principles of modular instruction because
• 1TB students are not able to study on their own (they have never studied in instructional schemes other than the lecture).
• Faculty time is very restricted and assistants, proctors, or administrative staff are not available.
Therefore we limited the number of examinations and the opportunity for remedial instruction and developed a teacher-paced modular system. The contents of the T .P. course are very suitable for modularization because of the similarity among the three sections: transfer of momentum, heat, and mass. After the first part the other two can be presented by analogy.
The contents were divided into 6 modules ; 3 modules covering the basics of momentum, heat, and mass transfer; 2 covering extensions and applications of these; and the 6th module ( C-2, extension of mass transfer) is postponed to the unit operations courses. The first module is a small module, to encourage the students to start their
WINTER 1984
We developed a teacher-paced modular system which allows the students
to study on a full or a 60% pace (a 2 gear-system).
study immediately. The students can concentrate on the macro-balance approach and by the time they are acquainted with this concept and the new instructional system, the micro-balance approach is introduced (see Table 1).
TABLE 1 Contents of 5 Modules
MODULE SUBJECT
A-1 INTRODUCTION Transport phenomena Laws of conservation
MOMENTUM TRANSPORT Laminar flow Sample problems Abstract and exercise Dimensional analysis Exercise
A-2 Flow in pipes Turbulent flow Pressure drop in tube flow Flow in conduits with varying cross section Sample problems Abstract and exercise Flow around objects Exercise
B-1 MICROBALANCES
B-2
C-1
Introduction Equation of Continuity Equation of Motion Application of the equation Abstract and exercise
HEAT TRANSPORT Introduction Equation of Energy Application of the equation of energy Abstract and exercise
Unsteady state conduction Heat transfer by convection Radiation Abstract and exercise
MASS TRANSPORT Diffusion Mass transfer Coefficient of mass transfer The film theory Concentration distribution Unsteady state diffusion Mass transfer by convection Simultaneous heat and mass transfer Abstract and exercise
35

The examination procedure forces the students to concentrate on the basic modules. Only students who pass the first module (A-1) are allowed to proceed to the second module (A-2). The others must repeat the A-1 exam, which is scheduled at the same time as the regular module A-2 exam. This procedure requires the least possible time from the lecturer. For the same reason, no remedial instruction for repeating students is organized. The printed text and work-out exercises should enable them to prepare for the repetition. As a consequence, as many students as possible who are starting to study heat transfer have passed module A-1 and have a proper comprehension of the essentials of momentum transfer. The procedure for the second section is quite similar.
A calculation showed that the examination for modular instruction should consume no more instructor time than examination by the former method, if 60 % of the group passes on the first attempt.
Since 1981 all homework problems have been directly related to classroom exercise. Feedback on the exercises was provided in class and in the lecture notes (answers), while many worked-out problems were shown in show-windows. All problems were worked out in four phases: analysis, plan, elaboration, evaluation. Only a precise result in one phase allows the problem solver to proceed to the next phase. The results at each phase enable the instructor to provide adequate feedback and allows the students to look for adequate information about their solving process. This problem solving scheme was also followed for examinations.
RESULTS
The module test results of 1981 are shown in Table 2. The student performances were acceptable except for modules B-2 and C. Here a final module effect, "we have got the ticket," seems likely.
After the tests only 66 % had to repeat two modules or less. Most of them were able to pass the respective parts of the final exam and thus the whole course. This and the overall effect of the reconstruction is shown in Table 3.
By means of questionnaires, interviews, and analysis of examination results, other information was collected on
• TIME SPENT Students did not feel the modular
36
TABLE 2 1981 Module Test Results
STUDENTS WITH SCORE ABOVE 60% % Students
First Second Final passed MODULE attempt attempt exam (N=135)
A-1 95 (70%) 34 1 96 A-2 67 (70%)• •• 35 67 B-1 97 (72%) 26 1 92 B-2 55 (57%) •• 1 41 C 27 (20%) •• 77 77
•Percentage of number of participants in the examination. Here 67 passed out of 95 students allowed to participate.
'1'*For these modules the final exam is the second attempt.
system forced them to spend more time on transport phenomena.
• PROBLEM SOLVING The plan phase was very difficult for the students. The lecturer considers the systematical method on problem solving not only as a means for learning but also as a sound tool for instruction and explanation to the students.
• ATTENDANCE AT LECTURES/ INSTRUCTIONS The number of students attending the lectures during the semester was higher than before. The decrease in attendance during modules B-2 and C was partly caused by the interference of laboratory activities. This explains the lower scores on these modules.
• ACCEPTANCE Students and lecturer were very positive about the reconstructed course and the modular system.
CONCLUSIONS
The examination results of the reconstructed courses and the general acceptance show that the modular T.P. course is a substantially improved course. The better performance of the students is not a result of an increase in their efforts or the
TABLE 3 Distribution of Final Grades for the TP Course
During and After 1980
GRADE 1980 1981 1982
A 0% 3.3% 21.0% B 2.5% 30.1% 29.5% C 18.5% 46.3% 27.6%
(A+B+C) (21.0%) (79.7%) (78.1%) D 25.2% 12.2% 5.7% E 30.3% 0% 4.8% F 23.5% 8.1% 11.4%
A / B/ C- Passed: D- Passed conditionally: E / F- Failed.
CHEMICAL ENGINEERING EDUCATION

activities of the teacher, but by a more efficient use of the students' and lecturer's time; i.e. the internal efficiency of the instructional process has been improved.
The main feature of the new course is the modular system. We developed a teacher-paced modular system which allows the students to study on a full or a 60 % pace (a 2 gear-system). Remedial teaching was not applied. This system resulted in a constant study load in transport phenomena during the semester and few students lost the junction in an early phase as they had in the past. We may conclude that it is worthwhile to apply a modular scheme, even under very restricted conditions of faculty time. •
ACKNOWLEDGMENT
This educational upgrading program was sponsored by The Netherlands Ministery of Development Cooperation.
LITERATURE
1. Ruijter, K. and Tjipto Utomo, "The Improvement of Higher Education in Indonesia : A Project Approach." Higher Education, 12 ( 1983).
2. Mettes, C. T. C. W., et al., "Teaching and Learning Problem Solving in Science," Part I; Journal of Chemical Education, 57/ 12 (1980).
3. Idem, Part II: Journal of Chemical Education, 58/ 1 (1981).
4. Russel, J. D., "Modular Instruction," Burgess Co., 1974.
[9;j §I book reviews
THE HISTORY OF CHEMICAL ENGINEERING AT CARNEGIE-MELLON UNIVERSITY
By Robert R. Rothfus Carnegie-Mellon University, Pittsburgh, PA 15213, 302 pages
Reviewed by Robert B. Beckmann University of Maryland
The author, Robert R. Rothfus has been associated with the chemical engineering program at Carnegie-Mellon, as a graduate student and faculty member, for over forty years, a period that covers over half the Chemical Engineering programs total existence and almost the entire period of its existence as a separate department. The book was obviously a labor of love to Professor Rothfus
WINTER 1984
as evidenced by its attention to statistical detail and anecdotes as well as historical development.
The first part of the book outlines the historical development of the school beginning with Andrew Carnegie's original offer to establish an institution for technical education on 15 November 1900 and traces the development from the "Carnegie Technical Schools" to the transition (1912) to Carnegie Institute of Technology and the final transition (1967) to Carnegie Mellon University. Following the detailed development to University status the book turns to the historical growth and development of the original School of Applied Science . . . one of the four original Schools founded by the Carnegie gift . . . to the current College of Engineering. The first diplomas in Chemical Engineering Practice were awarded in 1908 along with the initial "Diplomas" in the Civil, Electrical, Mechanical and Metallurgical Practice fields. Included are statistical and organizational details relating to the various departments, research laboratories, interdisciplinary programs, the academic calendar, tuition and enrollments.
The development and growth of the Chemical Engineering Department is chronicled in Chapter 4, beginning with the original Chemical Practice program in 1905 and the transition to Chemical Engineering in 1910. The chapter divides the history of the Department into quantum periods depending upon who was the chief administrative officer of the department during that period. The problems, issues and accomplishments of each period are well chronicled. The development is carried through 1980.
Part Two of the book, which comprises over 40 percent of the total pages is devoted to an exhaustive presentation of departmental statistics from its inception through 1980. The various chapters include such topics as enrollment and degrees granted, the faculty over the years, the changing undergraduate curriculum and graduate instruction, research activities and financial support and anecdotal sections devoted to departmental "personalities" and a recalling of the unusual, comical and tragicomical events over the years. The Appendices, about a third of the book, are devoted to a complete delineation of faculty, staff and students (graduate and undergraduate) by name and years of service, or graduation, who have been a part of the Carnegie Story in chemical engineering. Continued on page 48.
37

class and home. problems
The object of this column is to enhance our readers' collection of interesting and novel problems in Chemical Engineering. Problems of the type than can be used to motivate the student by presenting a particular principle in class or in a new light or that can be assigned as a novel home problem are requested as well as those that are more traditional in nature that elucidate diffi cult concepts. Please submit them to Professor H. Scot Fogler, ChE epartment, University of Michigan, Ann Arbor, MI 48109.
SETTING THE PRESSURE AT WHICH TO CONDUCT A DISTILLATION
ALLEN J. BARDUHN Syracuse University Syracuse, NY 13210
This memorandum was issued to the students in chemical engineering stage operations, most of whom are sophomores and first semester juniors but none of whom have yet had any heat transfer courses. Thus the elementary explanation of heat exchangers may be unnecessary for more experienced students.
The subject of the memorandum is usually not covered at all in stage operation texts, or at most only lightly covered. In most of the problems on this subject for distillation the pressure is given but there is no statement as to how it is determined.
When the pressure is given, most students (and a few professors) will have no idea whether it is reasonable or even possible.
T HE MINIMUM PRESSURE at which to conduct a distillation is set by the condenser. The
temperature of condensation of the top product must be high enough to condense it with the cooling water available. We remove heat in the condenser with cooling water which rises in temperature as it removes heat, since its sensible heat rises
The maximum pressure for the separation is set by the reboiler. The boiling temperature of the bottom product must be low enough to be boiled by condensing the steam available.
© Copyright ChE Division, ASEE. 1984
38
with temperature. Also the condensing temperatures of the overhead product increase with increasing pressure.
The maximum pressure for the separation is set by the reboiler. The boiling temperature of the bottom product must be low enough to be boiled by condensing the steam available. We must be able to add heat to the reboiler, by having the heat source at a higher temperature than the bubble point of the bottom product.
HEAT EXCHANGERS
Both the condenser and the reboiler are generic heat exchangers and all heat exchangers require that there be a temperature difference between the source of heat and the sink, i.e. the source must be hotter than the sink. The local temperature difference (Lit) between the two streams exchanging heat is often not a constant but it must be everywhere greater than zero. If the Lit is zero anywhere in the exchanger, the area required to transfer the heat becomes uneconomically large. It is useful to plot the temperature history in any heat exchanger to see what the Lit (driving force) is and how it varies throughout the device. For example, the overhead vapors (from a distillation column when heat is removed) will first begin to condense at their dew point. Further cooling will condense more until it is completely condensed at the bubble point.
THE CONDENSER
If the dew point of the overhead product at the column pressure is 140°F and the bubble point is 120°F-and if the inlet cooling water is
CHEMICAL ENGINEERING EDUCATION

70°F and a 30°F rise may be taken-the temperature pattern in the condenser when the overhead is condensed completely but not subcooled is represented in Fig. 1.
The At driving heat transfer is thus between 40° and 50°F. This is quite adequate, but At's as low as 10 or 20°F are not uncommon.
Now if the pressure of operation were lowered then the dew and bubble point temperatures would be less than those shown and they might approach the cooling water temperature, thus decreasing the At which drives heat transfer and increasing the area required according to the design equation
A= ft2 Area req'd. Q
where Q
u
the rate at which heat is to be transferred (Btu /hr.) the overall heat transfer coefficient Btu/ [ (hr) (ft2
) (°F) J the mean driving force temperature difference in °F.
All during my undergraduate days (1936-1940) at the University
of Washington in Seattle, the country was in the depths of the great
depression and jobs were scarce. After obtaining my M.S. I was
lucky to get one job offer with an oil refinery in California which I promptly accepted and started to work 24 November, 1941 just two
weeks before Pearl Harbor. The refinery work was very good chemical engineering experience
for me. I worked there for over 7 years and remember wondering
when I first arrived, why all de-butanizers operated at 50 to 60 psig
and all depropanizers operated at 180 psig. When I later figured it
out it was simple but I seldom come across any professors who
have thought about it enough to have a well organized answer to my question of "How is the Pressure Set for a Distillation Column?" I
have yet to see a thorough or even a sketchy treatment of this subject in any text on distillation. So I thought it would be appropriate to
write this article for a class in Stage Operations and perhaps to publish it in CEE. The elementary discussion of heat exchangers was
necessary because the students had not yet taken a course in heat
transfer. (Informal biographical sketch submitted by author.)
WINTER 1984
The condenser thus sets the minimum pressure at
which the column must operate. To find this minimum pressure, first find the bubble
point pressure of the D product ...
FIGURE 1.
120°F
~=Water IN LU = 50°F
The mean Lit is usually some.where between the two terminal temperature differences ( unless one of them is 0) and you will learn in Transport II how to calculate these mean At's.
The condenser thus sets the minimum pressure at which the column must operate. To find this minimum pressure, first find the bubble point pressure of the D product at a temperature of say 10° or 20°F higher than the inlet cooling water temperature. For a binary distillation this can be taken from the P-x-y diagram for that temperature, . and for multicomponent mixtures one must use the relations for vapor-liquid equilibrium in multicomponent mixtures.
THE REBOILER
As the column pressure is increased, the At in the condenser will just get bigger and this is satisfactory; but the pressure also affects the operation of the reboiler in the opposite fashion. The material being boiled in the reboiler has the composition of the bottom product and the boiling temperature is the bubble point of W, the bottom product. It is fixed once its composition and the pressure are known. The heat source is usually condensing steam and the steam condensing temperature must thus be at least 10 or 20°F above the bubble point of the bottoms product. Since the latter temperature goes up with increasing pressure, this sets a maximum pressure at which the distillation may be conducted. The temperature pattern in the reboiler is simpler than that in the condenser since neither the steam nor the bottom product changes temperature as heat is transferred. If, for example, the bubble point of W is 300°F at the column pressure, and we have steam available at 300 psig, the condensing temperature for this steam (steam tables) is
39

about 422°F. This temperature pattern is illustrated in Fig. 2.
4220F __ c_on_d_e_n_si_n-=-g_s_teo_m __ 4220F ·
300°F t.t = 122°F
boiling btms. product 300°F
flt : 122°F
FIGURE 2.
The bubble point of the bottom product ( which increases as P goes up) and the available steam pressure (and its condensing temperature) thus set a maximum pressure for the distillation. To find this pressure, estimate the bubble point pressure of the W product at a temperature of say 20°F (more or less) below the condensing steam temperature.
We now have both a maximum and minimum pressure at which the distillation can be carried out. Some pressure between these two would be used in the final design and its optimum value will be determined by an economic balance. The items to consider in such an economic balance are:
1. The effect of P on the temperatures of condensation of the overhead and on the boiling temperature of the bottom product which affect the mean ;lt in the con• denser and reboiler and thus their areas. Each of these exchangers may be made smaller at the eipense of the other one by adjusting the pressure up or down between the limits imposed. The higher the pressure, the smaller the condenser and the larger the reboiler, and vice versa. Pressure affects these two exchangers .in opposite directions because we are removing heat from one and adding heat to the other.
2. The effect of the column design pressure on its wall thickness and thus cost.
3. The effect of pressure on the vapor-liquid equilibrium. This effect is likely small for nearly ideal liquid solutions since for these liquid mixtures the relative volatility is independent of pressure. For hydrocarbon systems for example, by changing the absolute pressure by a factor of 2, the relative volatility changes only about 5%. For non-ideal systems however pressure may have a more important effect especially when there are azeotropes since the composition of the azeotrope may change with pressure. It may even be possible to eliminate an azeotrope by suitably adjusting the pressure.
A COMMON PROBLEM
It is entirely possible ( especially when there is wide variation in the boiling points of the bottom and top product) that the minimum pres-
40
sure set by the condenser is higher than the maximum pressure set by the reboil er. In this case there are three possible solutions. One is to use refrigeration to condense the top product, but this may be expensive. A second solution is to use a fired reboiler for the bottoms, i.e. send the liquid from the bottom tray to a furnace which may heat to temperatures much higher than condensing steam. The liquid is thus partially vaporized and sent to a flash drum to separate the vapor formed from the remaining liquid. The vapor off this drum is returned to the column below the bottom plate, and the liquid becomes the W product.
A third possible solution to the problem is to accept as a vapor that part of the overhead product which can not be condensed with the cooling medium, i.e. design a partial condenser. The part that is condensed is partly returned as reflux and the rest is liquid D product. The D products thus consist of two streams; one a vapor and one a liquid. This is usually the case for the first crude oil fractionation. The flow sheet is illustrated in Fig. 3.
Vapor product
(wet gosl
Liquid .._ ____ water
.._ ________ Liquid top product
FIGURE 3.
The vapor product contains methane, and ethane which can't be condensed easily. The vapor product is called "wet gas" not because it contains water (which it does), but because it contains some condensible hydrocarbons. It is sent to compressors and thence to an absorption column where the ethane and heavier are removed as ethane and L.P.G. (Liquified Petroleum Gasses) which consist mostly of Ca's and C/ s. The methane containing very little ethane and heavier is called dry gas and is about the same as natural gas. The ethane is usually cracked at high temperature to yield ethylene which is the source of many of our petrochemicals.
CHEMICAL ENGINEERING EDUCATION

The liquid water product comes from open steam used to assist in the first crude oil fractionation instead of having a reboiler.
GENERAL FRACTIONATION NOTES
(a) The optimum reflux ratio is said by Treybal to fall in the range of 1.2 to 1.5 times the minimum reflux ratio. This rule was formulated when heat was cheap, say $0.50 to $1.00 per million Btu. With currently expensive heat, say $5.00 to $8.00 per million Btu the optimum reflux ratio comes much nearer to the minimum and may lie in the range (1.05 to 1.2) (Rm1n).
(b) In desert areas when water is scarce and expensive, air cooling is often used to condense the overhead vapors but in this case the overall heat transfer coefficients are much lower than with water cooling and the optimum approach temperature differences for condensing may be much larger than the 10° to 20°F quoted above. Also the design air inlet temperatures may have to be 90° to 110°F or even 120°F in order to get a design which will work most of the time. D
DESIGN COURSE Continued from page 29.
projects with gross profit, tax and depreciation schedules are described. Finally, cash flow diagrams are introduced for comparing investments on the basis of simple rate of return, present worth of cash flows, or discounted cash flows.
Given profitability measures, questions of optimality arise. The optimization problem is defined in general terms to begin coverage of this comprehensive subject. The objective is to introduce optimization methods, suggesting the need for further study. Single variable, unconstrained methods known as sequential search methods ( e.g., the Golden-Section method) are covered using the excellent descriptions in Chap. 10 of Digital Computers and Numerical Methods [2] with two example problems from Chap. 10 of Peters and Timmerhaus ( optimal insulation thickness and optimal batch time). Then, multivariable, unconstrained methods are covered including lattice search, repeated uni-directional search, and optimal steepest descent [2].
Next, the students optimize the design of a distillation tower with a condenser, reboiler, and reflux pump. Throughout the course they have
WINTER 1984
solved problems involving these components, so for this problem they are given the FORTRAN function DISTIL which computes the rate of return on investment as a function of the product purity, the reflux ratio, and the fractional recovery of the most volatile species in the distillate. The use of DISTIL to (1) carry out material balances, (2) count trays, (3) calculate the tower diameter, heat exchanger areas, and pump horsepower, and (4) calculate costs, cash flows and discounted cash flow rate of return is reviewed. Then, the students write a program to calculate the maximum rate of return on investment. Incidentally, DISTIL was written by Prof. D. Brutvan [1 J and has been modified slightly for use in our course. Prof. Brutvan prepared an excellent problem-statement, typical of a large company, with design specifications, sources of physical property data, cost data, and explanations of the algorithm. This has also been modified for use in our course.
After the introduction to process synthesis, the course concentrates on analysis with the configuration of the process flowsheet given. The design variables are adjusted to locate an optimal design for a given configuration. However, in process synthesis, the emphasis is placed upon finding the best configuration. This approach is well-suited to teach methods of increasing the thermodynamic efficiency by heat integration. The monograph, Availability (Exergy) Analysis [13] and the paper "Heat Recovery Networks" [11] provide excellent introductions to the analysis of thermodynamic efficiency and the pinch method for minimizing utilities. Synthesis of separation processes is also covered, but briefly in just two hours. The key considerations are introduced, time being unavailable to solve a meaningful problem.
The course concludes with a final exam and the course grade is based upon two mid-semester exams and the homework. Approximately 15 problem sets are assigned, with two problems using FLOWTRAN and one problem in which the rate of return for a distillation tower ( using the DISTIL function) is maximized.
SPRING COURSE: PLANT DESIGN PROJECT
Penn's strength in process design can be attributed in part to the large concentration of chemical industry along the Delaware River and to our close interactions with several industrial
41

colleagues. In this section, organization of the project course to benefit from this interaction is examined, before considering the impact of process simulators.
During the last two weeks of the fall lecture course, the students select design projects suggested by our industrial colleagues and the chemical engineering faculty. The projects must be timely, of practical interest to the CPI, and be workable in 15 weeks. Kinetic and thermophysical property data should be available. Abstracts of possible design projects are prepared and the students select a project or propose one of special interest to themselves. No effort is made to restrict projects to those well-suited for simulation.
In the spring, 1982, we had sixteen projects, one for each group of three students, and in 1983 we had nineteen projects. Each group is advised by one of seven members of our faculty, usually supplemented by a visiting faculty member and a research student in the area of computer-aided design.
During the spring, as the designs proceed, each group meets for one hour weekly ( on Tuesday afternoon) with its faculty advisor and one of its four industrial "consultants." For the past three years we have had seven outstanding consultants. Dr. Arnold Kivnick of Pennwalt Corp. has completed his twenty-fifth year as a consultant to our students. Arnold has shared his years of experience in helping our student,s and young faculty develop their design skills. Other members of our consultant team contribute similarly, making it possible to expose our students to a broad range of design projects.
The course concludes with a one-day technical
,FIGURE 5 Abstract of a typical design project
High purity isobutene (suggested by Len Fabiano, ARCO)
lsobutene will be recovered from a mixed C4 stream containing n-butane, i-butane, butene-I, butene-2, i-butene, and butadiene. A four-step sequence will be considered: (1) reaction with CH3 OH to MTBE (methyl-tertiary-butylether), (2) recovery of M;TBE from the reaction products, (3) cracking of MTBE to methanol, isobutene, and byproducts, and (4) recovery of isobutene, by-products and methanol.
This design will concentrate on (3) and (4). Kinetic data in the literature will be supplemented by ARCO.
Fattore, Massi Mauri, Oriani, Paret, "Crack MTBE for Isobutylene," Hydrocarbon Processing, 101, Aug., 1981.
42
TABLE 2 Possible Design Projects (1982-83)
1. Cyclohexane oxidation to cyclohexanol
2. Polymerizer solvent recovery 3. High purity isobutene 4. Catalyst recovery plant 5. Triolefin process 6. Ethylene dimerization 7. Ethanol to gasoline 8. Methane from coal with K 2CO0
catalyst 9. Liquid CO 2 for extraction of
Suggested by
W. D. Seider D. F. Kelley, DuPont L. A. Fabiano, ARCO L. A. Fabiano, ARCO L. A. Fabiano, ARCO L.A. Fabiano, ARCO W. B. Retallick, Cons.
W. D. Seider
pyrethrin from chrysanthemums W. D. Seider 10. Syngas to methanol S. W. Churchill 11. Separation of benzene, toluene,
xylene 12. Heat pump for ethane
ethylene split 13. Optimization of solar heated
home 1~. Maleic anhydride from butane 15. Fluidized-bed, coal combustion,
electric power plant J 6. Supercritical fluid extraction 17. Dimethylamine 18. Paramethylstyrene with zeolite
catalyst 19. Hydrogen production by
radiation of CO 0 and water-gas shift -
W. D. Seider
W. D. Seider
N. Lior W. D. Seider
N. Arai A. L. Myers P. J. O'Flynn
W. D. Seider
S. W. Churchill
meeting of oral presentations accompanied by written design reports. From the oral and written reports, the faculty selects the outstanding design project for the Melvin C. Molstad Award. Each member of the winning group receives a $100 prize thanks to the generous endowment of Dr. Ken Chan, Class of 1962. Notably, the last five reports have also won the Zeisberg Award in competition with other schools in our area.
A typical abstract of a design project is shown in Fig. 5 and the titles for 1982-83 are in Table 2. The problems are timely and their diversity shows the broad interests of our faculty and industrial consultants.
IMPACT OF SIMULATORS
Since 1974 we have had access to the FLOWTRAN program on United Computing Systems (UCS), but its usage has been limited by the high cost of UCS, a commercial computing system. Initially modest funds were budgeted for FLOWTRAN, but with increasing class sizes and tight budgets it became necessary to charge the
CHEMICAL ENGINEERING EDUCATION

students for use of FLOWTRAN. Consequently, FLOWTRAN was used by just a few groups -as a last resort. The maximum charge per group was approximately $100.
In 1982, ChemShare Corp. provided DESIGN/ 2000 as a load module for installation on our UNIVAC / 1100 at no cost to the University of Pennsylvania. Subsequently, eight of the sixteen design groups chose to use DESIGN /2000, averaging $800 of computer charges per group.
DESIGN /2000 has a well-developed thermophysical property system, CHEMTRAN, with a data bank containing constants for 900 chemicals (as compared with 180 in the student version of FLOWTRAN). Programs are available to calculate constants such as the normal boiling point temperature and critical properties, given the molecular structure (the atom-bond interconnections). For nonideal solutions, programs are available to compute the interaction coefficients for the UNIQUAC equation and, when equilibrium data are unavailable, to estimate activity coefficients using the UNIF AC group interaction coefficients. Furthermore, CHEMTRAN provides the SoaveRedlich-Kwong and Peng-Robinson equations for calculations in the vapor-liquid critical region. In addition to these advantages ( compared with FLOWTRAN), alternative programs are provided for short-cut and rigorous analysis of multistaged towers.
Similarly, the PROCESS system of Simulation Sciences, Inc., provides features that are not included in the student version of FLOWTRAN. Some are equivalent to DESIGN /2000, some are not in DESIGN /2000, while some of the DESIGN/ 2000 features are not included. PROCESS has not yet been installed on our computer, so that we are less familiar with this system.
Several limitations remain and these are gradually being eliminated. However, currently FLOWTRAN, DESIGN /2000 and PROCESS do not model processes with inorganic compounds and ionic species. There are no programs to calculate compositions in phase and chemical equilibrium or to simulate CSTRs, PFTRs, and solids-handling equipment. These features have been included in the ASPEN system, but ASPEN is not yet available for routine student usage. As expected, ChemShare and Simulation Sciences are adding many of the same features.
The bottom line with respect to our design sequence is that industrial process simulators permit more routine analysis of simple processes and
WINTER 1984
give more accurate analyses for complex precesses ; for example, extractive distillation towers. These simulators enable more complete parametric analysis and examination of process alternatives. Normally, they are applicable for just parts of the analysis; rarely for analysis of the entire flowsheet. They provide our students with experience in the use of modern CAD tools.
In our research, the development of new CAD methodologies is emphasized. In the senior design course, some of these methodologies are introduced using well-tested industrial simulators which are gradually upgraded. Emphasis is placed on completing the design. Student time is not wasted working out difficulties with a prototype program.
When possible, process synthesis methodologies are emphasized. As yet, however, few projects have been found which are sufficiently openended to permit analysis of many alternate configurations in the fifteen week term. Good suggestions are welcomed. •
REFERENCES
1. Brutvan, D. R., "Economic Optimum Conditions for a Staged Separation Process," Computers in Engineering Design Education, Vol . II, Univ. of Michigan Project, Ann Arbor, 1966.
2. Carnahan, B. and J. 0 . Wilkes, Digital Computing and Numerical M ethods, Wiley, 1973.
3. Guthrie, K. M., "Capital Cost Estimating," Chem. Eng., March 24, 1969.
4. Kern, D. Q., Process H eat Transf er, McGraw-Hill, 1950.
5. Kreith, F., Principles of H eat Transf er , Third Ed., Int'l. Text Co., 1973.
6. Myers, A. L., and W. D. Seider, Introduction to Chemical Engineering and Computer Calculations, Prentice-Hall, 1976.
7. Peters, M. S., and K. D. Timmerhaus, Plant Design and Economics for Chemical Engineers, Third Ed., McGraw-Hill, 1980.
8. Rudd, D. F., and C. C. Watson, Strategy of Process Engineering, Wiley, 1968.
9. Seader, J. D., W. D. Seider, and A. C. Pauls, FLOWTRAN Simulation-An Introdu ction, Second Ed., CACHE, Ulrich's Bookstore, Ann Arbor, Michigan, 1977.
10. Soni, Y., M. K. Sood, and G. V. Reklaitis, PCOST Costing P.rogram, School of Chem. Eng., Purdue University, W. Lafayette, Indiana, May, 1979.
11. Linnhoff, B., and J. A. Turner, "Heat Recovery Networks," Chem . Eng., Nov. 2, 1981.
12. Woods, D., "Cost Data for the Process Industries," McMaster Univ. Bookstore, Hamilton, Ontario, Canada (1974).
13. Sussman, M. V., A v ailability (Exergy) Analysis, Milliken House, 1980.
43

NEW ADSORPTION METHODS Continued from page 25.
to achieve, but has been extensively studied. Counter-current schemes have included flow in open columns [2, 10, 17] ; the hypersorption process where solids flow was controlled by the opening and closing of holes in sieve trays [11 ], moving belt schemes [12] and the recent magnetically stabilized moving bed system developed by Exxon. The idealized analysis of all these systems will be similar.
A counter-current system is shown in Fig. 6. The solids flow down the column while the fluid flows up. The less strongly adsorbed solute A moves up in zone 1 while strongly adsorbed solute B moves down in this zone. Thus zone 1 purifies solute A. Zone 2 removes solute A from B and thus purifies solute B. In zone 3 solute B is desorbed with desorbent D. Zone 4 serves to remove solute A from the desorbent so that desorbent can be recycled. The desorbent could be water or a solvent.
The solute movement theory can be applied to this system. The solute wave velocities calculated from Eq. (5) or (7) were with respect to a stationary solid. The appropriate fluid velocity is then the interstitial fluid velocity relative to the solid. Thus
V = Ysuper + V a so lid (18)
where Vsuver is the superficial fluid velocity and Vsoi!d is the superficial solid velocity. Now Uso lute calculated from Eq. (5) or (7) is the solute velocity with respect to the solid. The solute
SoliJs
A-,D,P,
A+B, F
2 B-,D, Pz
3
D
FIGURE 6. Counter-current separator.
44
velocity which an observer will see is obtained by subtracting the solids velocity
Usolute CC = Usolute - Ysolld (19)
Uso lute cc is positive when the solute flow is up the column and negative when it flows down.
In the counter-current column the solids velocity is the same in all zones but the superficial fluid velocity varies from zone to zone since feed is added and products are withdrawn. If we set Ysuve,·,a as velocity in zone 3, then for relatively dilute systems
Ysuper,2 = Ysuper,3 - P 2/Ac
Ysuper,1 = Ysuper,2 + F /Ac
Ysuper,4 = Ysuper,1 -Pi/Ac
(20)
Since Vsuper changes, Uso lute cc will change from zone to zone. In addition, if the desorbent affects the adsorption of solute then the equilibrium
s 'I
P,
z F
8 3 D
TIM£
FIGURE 7. Solute movement in continuous countercurrent column.
constant A (T) will vary from zone to zone and Usolu te cc will change. This latter effect is not necessary to make the counter-current column work.
To achieve the separation indicated in Fig. 6 we want solute A to move upward in zones 1 and 2 and downward in zone 4. Thus
UA CC,1 > UA CC,2 > 0 > UA CC,4 (21)
Solute B should move downwards in zones 1 and 2 and upwards in zone 3. Thus
Un CC,3 > 0 > UB cc,1 > UB CC,2 (22)
CHEMICAL ENGINEERING EDUCATION

An alternative to continuously moving solid down the column is to move solid and entrained fluid down in pulses. This is commonly used in continuous ion exchange systems such as variants of the Higgins system and the Graver Water Treatment System. This system could also be applied to the binary separator.
Eqs. (21) and (22) are an important result since they control the operation of the continuous counter-current column. There is a range of values for P 1, P 2 and D for a given feed flow rate which will satisfy inequalities (21) and (22). In actual practice it is desirable to choose the flow rates so that all the inequalities are as large as possible.
The appropriate solute waves are shown in Fig. 7. In the ideal case at steady state there will be no solute A in zones 4, 2 or 3 and no solute B in zones 1, 3 and 4. Because of dispersion and finite mass transfer rates solute A will appear in zones 4 and 2, and B will be in zones 1 and 3. The size of the zones required depends on these dispersion and mass transfer rate effects. In addition, any axial solid or fluid mixing caused by non-perfect flow will require a larger column. Extreme mixing or channeling can destroy the desired separation.
COUNTER-CURRENT OPERATION II. Pulsed Flow
An alternative to continuously moving solid down the column is to move solid and entrained fluid down in pulses. This is commonly used in continuous ion exchange systems such as variants of the Higgins system [10, 18, 20] and the Graver Water Treatment System [14]. This system could also be applied to the binary separator shown in Fig. 6.
In the pulsed system the solid is stationary except for short periods when it moves down. Thus U 801u te is given directly by Eq. (5) or (7) with the superficial fluid velocities given by Eq. (20). When the solid and fluid are pulsed downward, the solute waves are also shifted down. The solute wave theory for the pulsed flow system is shown in Fig. 8. The net movement of solute A is upward in zones 1 and 2 and downward in zone 4. The net movement of solute B is downward in zones 1 and 2 and up in zone 3. Fig. 8 is drawn for a plug flow movement of solids and fluids during the downward pulse. Feed would be introduced continuously and withdrawn continuously. Only one feed period was shown to keep the figure simple. If mixing occurs during the pulse less separation will be obtained. This is a practical limit to sharp
WINTER 1984
fractionation of two solutes in a pulsed flow counter-current system.
(23)
where lp is the length of a pulse movement in meters and tv is the time between pulses in minutes. The average solute velocity over many pulses is given by Eq. (19). The desired separation will be achieved when inequalities (21) and (22) are satisfied.
SIMULATED COUNTER-CURRENT SYSTEMS
An alternative to moving bed systems is to simulate counter-current movement. This is done with a series of packed bed sections by switching the location of all feed and product withdrawal ports. An observer located at a product withdrawal port sees the solids move downwards everytime
s
z
I-- t, --1 TIME
FIGURE 8. Solute movement in pulsed counter-current system.
the port location is shifted upwards. Thus the observer sees a process very similar to the pulsed counter-current system analyzed in Fig. 8.
The first simulated counter-current system was the Shanks system which has been applied to leaching, adsorption and ion exchange [13, 21]. The Shanks system uses a series of columns with plumbing arranged so that feed can be input and
45

The solute movement theory can be used to analyze the simulated counter-current system in two ways.
product withdrawals removed from any column. Thus the counter-current separator shown in Fig. 6 can be simulated. Modern adaptations of the Shanks process have been done by Barker and his co-workers for gas chromatography systems [3, 5] and for gel permeation chromatography [4]. UOP has extensively used a pilot plant scale system which is a series of columns for scaling up their commercial scale units [9, 16]. The commercial UOP simulated counter-current process, Sorbex, uses a single column with many packed sections and has a rotating valve for distributing feed, desorbent and products. The commercial units simulate the system shown in Fig. 6 [6, 7, 8, 9, 16]. The UOP process was first commercialized as Molex for separation of linear paraffins from branchedchain and cyclic hydrocarbons using 5A molecular sieves. Since then, processes for p-xylene purification (Parex), Olefin separation (Olex), and separation of fructose from glucose (Sarex) have been commercialized. Pilot plant scale separations for a variety of other problems have been demonstrated [9, 16]. A large number of patents have been granted on simulated moving bed systems.
The solute movement theory can be used to analyze the simulated counter-current system in two ways. First, if the observer fixes himself at one of the outlet or inlet ports then he sees the solid and entrained fluid transferred downwards in pulses. This observer then sees solute movement as shown in Fig. 8. The average solids velocity this observer sees is given by Eq. (19), and the analysis applied for the pulsed counter-current operation is applicable.
In the second analysis the observer fixes himself on the ground and he sees the solid as stationary. With the fluid flowing up the column, he sees all the inlet and outlet ports move up the column at discrete times. When a port reaches the top of the column, it recycles back to the bottom. In between the shifting of port locations, the adsorber is a fixed bed system. Thus the solute wave velocity can be determined from Eqs. (5) or (7). The fluid velocities in each section will differ. The superficiaffluid velocities are given by Eq. (20) and the interstitial velocity v equals V s uper/a. The shifting of ports does not shift the solute waves, but does
46
change the wave velocities since it changes which zone the solute is in. This is illustrated in Fig. 9. If the desorbent changes the equilibrium constants this will also change the solute velocities.
Note in Fig. 9 that the movement of both species is up, but the more strongly adsorbed solute B moves down with respect to the port locations. Feed would be introduced continuously at the port marked A + B, but was illustrated for only one time period. The zone numbers corresponding to Fig. 6 are shown on Fig. 9. The
STREAMS
Pwl
z
TIME
FIGURE 9. Solute movement in simulated countercurrent system.
fluid velocities and hence the solute velocities are different in each zone. When fluid reaches the top of the cascade it is recycled to the bottom. Thus the solute wave~ are also recycled. If the timing of the switches is appropriate, solute A will appear in zones 1, 2 and the lower section of zone 4, and solute B will appear in zones 1, 2 and the upper section of zone 3. Solute A goes into zone 4 since only a portion of the fluid is withdrawn as product P 1 • Solute B goes into zone 3 because of the switching of ports. Dispersion and mixing effects will naturally spread out the solute waves in each zone.
To achieve the desired separation we desire to have solute A move up in zones 1 and 2 faster than the port movement and slower in zone 4. Solute B should move slower than the port movement in zones 1 and 2 and faster in zone 3. The average velocity of port movement is
Uport,nvg = lport/tport (24)
where lport is the packing height between ports and
CHEMICAL ENGINEERING EDUCATION

t port is the time between switches of ports. The conditions to achieve separation are then
(25)
These conditions follow the same order as Eqs. (21) and (22).
How close is a simulated counter-current system to a truly counter-current separator? Although the answer to this depends on the chemical system and the column length, Liapis and Rippin [15] found that the simulated system had an adsorbent utilization from 79 % to 98 % that of the truly counter-current system. With a single zone system they found that from two to four sections were sufficient and that two to four column switches were required to reach a periodic concentration profile.
Comparison of simulated counter-current and truly counter-current systems is of considerable interest. Both systems at steady state can at best do a complete binary separation. Partial separation of additional components can be obtained with side withdrawals. The simulated countercurrent system could also be extended to more complex cycles where part of the bed is temporarily operated as a batch chromatograph. The simulated moving bed system is actually a fixed bed system. Thus flooding ( unintentional upwards entrainment of solid) will not be a problem, but excessive pressure drop may result for small particles or viscous solutions. The fixed bed will have a lower a and hence a higher capacity than truly countercurrent systems, but this will be offset by the distribution zones between sections. The actual movement of solids requires means for keeping the bed stable, may result in excessive attrition, but allows for easy solids replacement or external reactivation. Both systems have mechanical difficulties to overcome. In the simulated moving bed these difficulties are the valving and timing while in an actual moving bed they involve moving .the solids without mixing. Currently, the simulated counter-current systems have been the preferred choice for large-scale adsorption installations. •
ACKNOWLEDGMENT
Some of the research reported here was supported by NSF Grant CPE-8006903. This paper is a modified version of Wankat [23]. The permission of the Corn Refiner's Association to reprint parts of that paper is gratefully
WINTER 1984
acknowledged.
NOMENCLATURE
A(T) Ac C
Cr Cs Cw F k
L
-Equilibrium parameter, Eq. (6) - Cross sectional area of column -Solute concentration in fluid, kg/L -Heat capacity of fluid -Heat capacity of solid -Heat capacity of wall -Feed rate, L /min -Exponent in Freundlich isotherm,
Eq. (14) -Fraction of interparticle volume
species can penetrate, Eq. (1) -Length of travel of pulse, or pack
ing height between ports, m -Column length, m -Product flow rates, L / min -Amount of solute adsorbed, kg/kg
adsorbent -Time,min -Time between switching port
locations, min T -Temperature, °C Tr,Ts,Tw,Tr.r-Temperature of fluid, solid, wall
and reference -Cold and hot temperatures
UA,Un,Usoln te -Solute wave velocity, m /min, Eq.
Us bock
(5) or (7) -Shock wave velocity, m /min, Eq.
(17) Utbermn I -Thermal wave velocity m /min, Eq.
(9) V
v.
z
Ps
REFERENCES
-Interstitial fluid velocity, m /min -Elution volume of non-adsorbed
species, L -Internal void volume, L -External void volume, L -Solid velocity, m /min -Superficial fluid velocity, m /min - Weight of column wall per length,
kg /m -Axial distance in column, m -Tnternarticle void fraction -Jntr:1,particle void fraction _ T)iff P.t'P.nce calculation -Solid density, kg /L
1. Baker, B. and R. L. Pigford, "Cycling Zone Adsorption: Quantitative Theory and Experimental Results," Ind. Eng. Chem. Fundam., 10, 283 (1971).
2. Barker, P. E., "Continuous Chromatographic Refining," in E . S. Perry and C. J. Van Oss (eds.), Progress in S eparation and Purification, Vol. 4, p. 325, Wiley, N.Y., 1971.
3. Barker, P. E. and R. E. Deeble, "Production Scale Organic Mixture Separation Using a New Sequential Chromatographic Machine," Anal. Chem., 45, 1121 (1973).
4. Barker, P. E ., F. J. Ellison, and B. W. Hatt, "A New
47

Process for the Continuous Fractionation of Dextran," Ind. Eng. Chem. Proc. Des. Develop., 17, 302 (1978).
5. Barker, P. E., M. I. Howari, and G. A. Irlam, "Further Developments in the Modelling of a Sequential Chromatographic Refiner Unit," Chromatographia, 14, 192 (1981).
6. Broughton, D. B., "Molex: Case History of a Process," Chem. Eng. Prog., 64, (8) 60 (1968).
7. Broughton, D. B. and D. B. Carson, "The Molex Process," Petroleum R efiner, 38 ( 4), 130 (1959).
8. Broughton, D. B., R. W. Neuzil, J. M. Pharis, and C. S. Breasley, "The Parex Process for Recovering Paraxylene," Chem. Eng. Prog. 66, (9) 70 (1970).
9. de Rosset, A. J., R. W. Neuzil, and D. J. Korous, "Liquid Column Chromatography as a Predictive Tool for Continuous Counter-current Adsorption Separations," Ind. Eng. Chem. Proc. Des. Develop., 15, 261 (1976).
10. Gold, H., A. Todisco, A . A . Sonin, and R. F. Probstein, "The Avco Continuous Moving Bed Ion Exchange Process and Large Scale Desalting," Desalination, 17, 97 (Aug. 1975) .
11. Hiester, N. K., T. Vermeulen, and G. Klein, "Adsorption and Ion Exchange," Sect. 16 in R. H. Perry, C. H. Chilton and S. D. Kirkpatrick (eds.), Chemical Engineer's Handbook, 4th ed., McGraw-Hill, N.Y., 1963.
12. Jamrack, W. D., Rare Metal Extraction by Chemical Engineering Methods, Pergamon Press, N.Y., 1963.
13. King, C. J., Separation Processes, 2nd ed., McGrawHill, N.Y., p. 172-195, 1980.
14. Levendusky, J. A., "Progress Report on the Continuous Ion Exchange Process," Water-1969, CEP Symposium Ser., 65, #97, 113 (1969).
15. Liapis, A. I. and D. W. T. Rippin, "The Simulation of Binary Adsorption in Continuous Counter-current Operation and a Comparison with Other Operating Modes," AIChE Journal, 25, 455 (1979).
16. Neuzil, R. W., D. H. Rosback, R. H. Jensen, J. R. Teague, and A. J. de Rosset, "An Energy-Saving Separation Scheme," Chemtech, 10, 498 (Aug. 1980).
17. Rendell, M., "The Real Future for Large-Scale Chromatography," Process Engineering, p. 66 (April 1975).
18. Roland, L. D., "Ion Exchange-operational advantages of continuous plants," Processing, 22, (1), 11 (1976).
19. Sherwood, T. K., R. L. Pigford, and C. R. Wilke, Mass Transfer, Chapt. 10, McGraw-Hill, N.Y., 1975.
20. Smith, J. C., A. W. Michaelson, and J. T. Roberts, "Ion Exchange Equipment," p. 19-18 to 19-26, in R. H. Perry, C. H. Chilton and S. D. Kirkpatrick (eds.), Chemical Engineer's Handbook, 4th ed., McGraw Hill, N.Y., 1963.
21. Treybal, R. E., Mass Transfer Operations, 2nd ed., McGraw-Hill, 1968.
22. Wankat, P. C., "Cyclic Separation Techniques," in A. E. Rodrigues and D. Tondeur (eds.), Percolation Processes, Theory and Applications, Sijthoff and Noordoff, Alphen aan den Rijn, Netherlands, p. 443-516 (1981).
23. Wankat, P. C., "Operational Techniques for Adsorption and Ion Exchange," Corn Refiner's Association Conf., Lincolnshire, IL, June 1982.
48
BOOK REVIEW: Carnegie-Mellon Continued from page 37.
Obviously the book is not intended for use in the usual academic sense and its particular audience is the many people ... faculty, staff and students ... who have contributed to chemical engineering at Carnegie over the years. It can also serve as a guide to those considering similar undertakings at their own institution in pointing out the monumental effort involved. Admittedly, this reviewer is not wholly unbiased in consideration of this volume inasmuch as he has spent almost half of his academic career at Carnegie, but he can attest to a considerable portion of the accuracy of Professor Rothfus' many details. Its delightful reading! ! •
[eJ;, ;I books received "Resource Recovery Economics," Stuart H. Russell; Marcel Dekker Inc., New York 10016; 312 pages, $39.75 (1982)
"Specifying Air Pollution Control Equipment," edited by Richard A. Young, Frank L. Cross, Jr.; Marcel Dekker Inc., New York 10016; 296 pages, $38.50 (1982)
"Introduction to High-Performance Liquid Chromatography," R. J. Hamilton, P. A. Sewell; Chapman & Hall, 733 Third Ave., New York 10017; 183 pages, $29.95 (1982)
"Nuclear Waste Management Abstracts," Richard A. Heckman, Camille Minichino; Plenum Publishing Corp., New York 10013; 103 pages, $45.00 (1982)
"Heat Transfer in Nuclear Reactor Safety," S. George Bankoff, N. H. Afgan; Hemisphere Publishing Corp., New York 10036; 964 pages, $95.00 (1982)
"Essentials of Nuclear Chemistry," H. J. Arnikar; John Wiley & Sons, Somerset, NJ 08873; 335 pages, $17.95 (1982)
"Technology Transfer and Innovation," Louis N. Mogavero, Robert S. Shane; Marcel Dekker Inc., New York, 10016; 168 pages, $22.50 (1982)
"Solar Heating and Cooling: Active and Passive Design," Second Edition, J. F. Kreider, F. Kreith; Hemisphere Publishing Corp., Washington DC 20005; 479 pages, $29.95 (1982)
"Liquids and Liquid Mixtures," Third Edition, J.S. Rowlinson, F. L. Swinton; Butterworths, Woburn, MA 01801; 328 pages, $69.95 (1982)
"Handbook of Multiphase Systems," edited by G. Hetsroni; Hemisphere Publishing Corp., Washington, DC 20005; $64.50 (1982)
"Liquid Filtration," Nicholas P. Cheremisinoff, David S. Azbel; Butterworth Publishers, Woburn, MA 01801; 520 pages, $49.95 (1983)
CHEMICAL ENGINEERING EDUCATION

ACl(NOWLEDGMENTS Departmental Sponsors: The following 141 departments contributed to the support of CHEMICAL ENGINEERING EDUCATION in 1984 with bulk subscriptions. University of Akron University of Alabama University of Alberta Arizona State University lJ niversity of Arizona University of Arkansas University of Aston in Birmingham Auburn University Llrigham Young UnivenitJ University of British Columbia Brown University Bucknell University University of Calgary California State Polytechnic California Institute of Technology University of California (Berkeley) University of California (Davis) Unirnrsity of California (Santa Barbara) University of California at San Diego Carnegie-Mellon University Case-Wes tern Reserve University University of Cincinnati Clarkson College of Technology Clemson University Cleveland State Univenity University of Colorado Colorado School of Mines Colorado State University Columbia University University of Connecticut Cornell University Dartmouth College University of Dayton University of Delaware U. of Detroit Drexel University University of Florida Florida Institute of Technology Georgia Technical Institute University of Houston Howard University University of Illinois (Urbana) Illinois Institute of Technology Institute of Paper Chemistry University of Iowa Iowa State University John Hopkins University Kansas State University
University of Kansas University of Kentucky Lafayette College Lamar University Laval University Lehigh University Louisiana State University Louisiana Tech. University University of Louisville University of Maine Manhattan College University of Maryland University of Massachusetts Massachusetts Institute of Technology l\lcMaster University University of Michigan Michigan State University Michigan Tech. University University of Minnesota University of Missouri (Columbia) University of Missouri (Rolla) Monash University Montana State University University of Nebraska University of New Hampshire New Jersey Inst. of Tech. New Mexico State University University of New Mexico City University of New York Polytechnic Institute of New York State University of N.Y. at Buffalo North Carolina State University University of North Dakota Northeastern University Northwestern University University of Notre Dame Nova Scotia Tech. College Ohio State University Ohio University Hniversity of Oklahoma Oklahoma State University Oregon State University University of Ottawa University of Pennsylvania Pennsylvania State University Princeton University Purdue University University of Queensland
Queen's University Rensselaer Polytechnic Institute University of Rhode Island Rice University University of Rochester Rose-Bulman Institute Rutgers U. University of South Alabama University of South Carolina University of Saskatchewan South Dakota School of Mines University of Southern California Stanford University Stevens Institute of Technology University of Sydney Syracuse University Teesside Polytechnic Institute Tennessee Technological University University of Tennessee Texas A&M University University of Texas at Austin Texas Technological University University of Toledo Tulane University University of Tulsa University of Utah Vanderbilt University Villanova University University of Virginia Virginia Polytechnic Institute Washington State University University of Washington Washmgton University University of Waterloo Wayne State University West Virginia Inst. Technology West Virginia University University of Western Ontario Widener College University of Windsor University of Wisconsin (Madison) Worcester Polytechnic Institute University of Wyoming Yale University Youngstown State University
TO OUR READERS: If your department is not a contributor, please ask your department chairman to write CHEMI• CAL ENGINEERING EDUCATION, c/o Chemical Engineering Department, University of Florida, Gainesville, Florida 32611.

•"I'.
Our name has been synonymous wi~h engineering education for over 150 years.
Here are thirteen more reasons why. ·
New GUIDE TO CHEMICAL
. ENGINEERING PROCESS DESIGN AND ECONOMICS Gael Ulrich, University of New Hampshire ·
- Solutions Manual available · January 1984 • approx. 464 pp.
New FUNDAMENTALS OF MOMENTUM, HEAT AND MASS TRANSFER, 3rd Edition James R. Welty, Charles E. Wicks, and Robert E. Wilson, Oregon State University Solutions Manual available January 1984 approx. 832 pp.
New NUMERICAL METHODS AND MODELLING FOR CHEMICAL ENGINEERS Mark E. Davis, Virginia Polytechnic Institute and University Solutions Manual available February 1984 approx . 320 pp.
New INTRODUCTION TO MATERIAL AND ENERGY BALANCES Gintaras V Reklaitis, Purdue University Solutions Manual available 1983 683 pp.
New NATURAL GAS PRODUCTION ENGINEERING Chi Ikoku, Pennsylvania State University Solutions Manual available January 1984 approx. 464 pp.
ELEMENTARY PRINCIPLES OF CHEMICAL PROCESSES Richard M. Felder, Ronald W Rousseau, North Carolina State University Solutions Manual available 1978 571 pp.
CHEMICAL AND ENGINEERING THERMODYNAMICS Stanley J. Sandler, University of Delaware Solutions Manual available 1977 587 pp.
CHEMICAL REACTION ENGINEERING, 2nd Edition Octave Levenspiel, Oregon State University Solutions Manual available 1974 - 600 pp.
AN INTRODUCTION TO CHEMICAL ENGINEERING, KINETICS AND REACTOR DESIGN Charles G. Hill,Jr., University of Wisconsin Solutions Manual available 1977 594 pp.
CHEMICAL REACTOR ANALYSIS AND DESIGN G.F. Froment, Rysksuniversteit Ghent, Belgium, and Kenneth B. Bischoff, University of Delaware 1979 765 pp.
PRINCIPLES OF UNIT OPERATIONS, 2nd Edition Alan Foust , Emeritus Lehigh University Leonard A. Wenzel and Curtis W Clumb, both of Lehigh University Louis Maus and L. Bruce Andersen, New Jersey Institute of Technology Solutions Manual available 1980 784 pp.
TRANSPORT PHENOMENA R. Byron Bird, Warren E. Stewart, and Edwin N. Lightfoot, University of Wisconsin 1960 780 pp.
EQUILIBRIUM-STAGE SEPARATION OPERATIONS IN CHEMICAL ENGINEERING Ernest]. Henley, University of Houston and]. D. Seader, University of Utah 1981 742 pp.
To be considered for complimentary copies, please write to Dennis Sawicki, Dept. 4-1315. Please include course name, enrollment, and title of present text.
JOHN WILEY & SONS, Inc. 605 Third Avenue, New York, N.Y 101.58 In C:lnada: 22 Worchester Road Rcxd21c, Om.rio M9W II.I 4-1315