Chequamegon-Nicolet National Forest Land and Resource ...
208
United States Department of Agriculture Forest Service January 2012 Chequamegon-Nicolet National Forest Land and Resource Management Plan Monitoring and Midterm Evaluation Report: 2009 - 2010
-
Upload
khangminh22 -
Category
Documents
-
view
0 -
download
0
Transcript of Chequamegon-Nicolet National Forest Land and Resource ...

United States Department of Agriculture
Forest Service
January 2012
Chequamegon-Nicolet National Forest Land and Resource Management Plan
Monitoring and Midterm Evaluation Report: 2009 - 2010

For More Information Contact:
Forest Monitoring Coordinator 500 Hanson Lake Road Rhinelander, WI 54501
715-362-1300
The U.S. Department of Agriculture (USDA) prohibits discrimination in all its programs and activities on the basis of race, color, national origin, age, disability, and where applicable, sex, marital status, familial status, parental status, religion, sexual orientation, genetic information, political beliefs, reprisal, or because all or part of an individual’s income is derived from any public assistance program. (Not all prohibited bases apply to all programs.) Persons with disabilities who require alternative means for communication of program information (Braille, large print, audiotape, etc.) should contact USDA’s TARGET Center at (202) 720-2600 (voice and TDD). To file a complaint of discrimination, write to USDA, Director, Office of Civil Rights, 1400 Independence Avenue, SW, Washington, DC 20250-9410, or call (800) 795-3272 (voice) or (202) 720-6382 (TDD). USDA is an equal opportunity provider and employer.

ApPROVAL AND DECLARA nON OF INTENT
I have reviewed the Chequamegon-Nicolet National Forests Monitoring and Mid-term Evaluation Report: 2009-2010 which was prepared by an interdisciplinary team during 2011.
I am satisfied with its findings and intend to consider recommendations made therein to maintain the Land and Resource Management Plan (Forest Plan). This monitoring and midterm evaluation report meets the intent of the Land and Resource Management Plan as well as the regulations contained in 36 CFR 219.
This report is approved by:
PAUL l.V. STRONG Forest Supervisor Chequamegon-Nicolet National Forest
Date

Year 2009/2010 Monitoring and Midterm Evaluation Report i
FOREWORD
Hi. I’m Paul Strong, Forest Supervisor of the Chequamegon-Nicolet National Forest.
I’d like to introduce you to our midterm report on the 2004 Chequamegon-Nicolet National Forest (CNNF) Land and Resource Management Plan (also called the “Forest Plan”). In the late 1990s, I was part of the Forest Plan revision team. My career took me away from the CNNF before the revision was completed. Now I’m back, but in a different role at a time when we are reflecting on and assessing what has transpired
during the first half of the plan’s lifespan, as well as looking forward to what may lie ahead during the second half.
The Forest Plan we created in 2004 was based on predictions of the future that anticipated a dynamic environment and change, but did not and could not anticipate how change would be manifested. In looking back over the first half of the plan’s lifespan, I am impressed by the rapidity and magnitude of change that has occurred.
During Forest Plan revision, northern Wisconsin was a few years into what turned out to be a prolonged drought that ended in the summer of 2010. Lake and stream levels, soil moisture, and groundwater changes affected tree growth and vigor, and fish and wildlife habitat. From the 1990s to the present, episodic weather events occurred including some of the heaviest rainfall in recent decades, severe windstorms, cold temperatures that lasted well into traditional spring months in some years, and exceptionally early warm and dry springs in others.
Against this backdrop of weather variability, unpredictable changes in our administrative environment affected how we manage the CNNF. The mission of the Forest Service is still the same, but changes in policies and regulations at levels beyond the Chequamegon-Nicolet National Forest affect how we plan and carry out our work. The Travel Management Rule of 2005 steered us to evaluate and make decisions about motorized access at a pace faster than we anticipated during Forest Plan revision. In the future, we can expect to further address roads and trails under another part of the Travel Management Rule, which focuses on establishing the minimum road system needed for management of the National Forest.
Other recent national Forest Service initiatives are focused on adapting to climate change and on improving watershed conditions; these initiatives have already shifted the way we prioritize, plan, implement, and report results of land management activities. An “all lands conservation” approach nudges us toward broader and more inclusive efforts across ownership and administrative boundaries, as we seek greater and more meaningful outcomes from natural resources management projects we accomplish with federal, tribal, state, and county land management partners.
Foreword
ii Year 2009/2010 Monitoring and Midterm Evaluation Report
Nationally, the changing economic conditions have had far-reaching effects on communities and businesses, many of which revolve around use and enjoyment of natural resources and undeveloped land. As with the rest of the country, the social and economic fabric of the Northwoods has experienced change and variability beyond predictions.
From my perspective, it appears that land and natural resources management agencies like the Forest Service are likely to operate in environments of greater variability and change than we are experiencing today. Management approaches and paradigms we have built on assumptions of stability and predictable change will have to be modified to address pressing resource management issues. Episodic events of weather, insect and disease outbreaks, rapid expansion of invasive species, and changing socioeconomic conditions will likely be the norm instead of the exception. What we predict for future conditions and effects of management in long-range planning documents will need to be regarded less as guarantees and more as our best read of a multi-factored environment.
The report that follows provides substantial detail on the statutory requirements of National Forest management as well as the numerous objectives described in the current Forest Plan. Depending on your interests, some sections may be more valuable to you than others. Hopefully, you find enough information to satisfy your interest in how your National Forest is being managed.
As I look back at what has been accomplished on the Chequamegon-Nicolet National Forest and look forward to future opportunities and challenges, I feel fortunate to be surrounded by dedicated Forest Service employees and the many organizations with which we partner. I hope you find this midterm report informative, valuable, and something that helps inspire future conversations about National Forest management.
Thank you for your continued interest in and support of the Chequamegon-Nicolet National Forest.
Paul I.V. Strong Forest Supervisor Chequamegon-Nicolet National Forest
Year 2009/2010 Monitoring and Midterm Evaluation Report iii
EXECUTIVE SUMMARY
The National Forest Management Act requires periodic monitoring and evaluation of Forest Plan implementation (36 CFR 219) to determine compliance with identified standards and guidelines. The Chequamegon-Nicolet National Forest’s monitoring and evaluation protocols were established to evaluate appropriate and sustainable management of Forest resources and subsequent impacts on communities. There are eleven legally required monitoring and evaluation items with varying frequency requirements. Ninety-seven monitoring questions aligned to Forest Plan objectives have been identified. Highlights from the monitoring and evaluation activities since 2004 include:
Goal 1 – Ensure Healthy and Sustainable Ecosystems
• Lands are being adequately restocked following timber management activities.
• Spruce budworm, gypsy moth, leaf minor, leaf roller, and oak wilt continue to impact forest health. The CNNF is responsive to these insect and disease issues.
• Endangered, threatened, and sensitive species are being managed in accordance with federal and state law and comply with existing conservation and recovery plans.
• Northern goshawk numbers are stable and well distributed across suitable habitat.
• Brook trout populations are responsive to stream water temperature. In-stream habitat restoration projects have been effective.
• The regenerating aspen community type is declining in representation (acres) across the forest.
• Mature northern hardwoods and red and white pine forest community types are increasing in representation (acres) across the forest.
• The Forest is moving toward desired future conditions of vegetation composition structure and age class.
• Water, air, and soil quality standards have been met or exceeded.
• Treatments of non-native invasive species sites have been effective where implemented.
Goal 2 – Provide Multiple Benefits for People within the Capability of Sustainable Ecosystems
• A sample of National Forest acreage identified as suitable for timber production in the forest Plan was reevaluated; over 90% of those lands were judged to be suitable.
Summary
iv Year 2009/2010 Monitoring and Midterm Evaluation Report
• An intensive-use ATV area in Bayfield County has been closed and rehabilitation is in progress.
• Active vegetation management and natural events are changing forest composition and age class structure.
• Twenty Research Natural Areas have been added to the existing eleven.
• Non-motorized recreation opportunities in SPNMs are improving.
• Additional miles of ATV routes and trails have been created.
• Collection levels of special forest products appear to be sustainable.
Goal 3 – Ensure Effective Public Service through Organizational Effectiveness
• Approximately three million dollars are paid to local counties in annual revenue sharing.
• The volume of timber sold is averaging 99% of the expectations based on allocated budget.
• Estimated and subsequent actual costs for program operations match.
• All elements of the Heritage Program have been met.
• Fire management is compliant with federal, state, and Forest Plan law, policies, and standards.
• Resource damage and safety concerns at the 25-mile 4WD/ ORV Pipeline corridor continue to be addressed.
• Total and open road densities have been reduced per Forest Plan direction.
Opportunities remain to further progress toward the desired future conditions in the second half of the Forest Plan’s lifetime. The ever-changing world of social and economic conditions, legal and regulatory requirements, and nature itself will create future challenges for National Forest management. These challenges will require that the Forest manage lands and waters within a larger landscape context to conserve and restore ecosystems and watershed health. Changes that have occurred since the inception of the Forest Plan have influenced the direction taken to implement the Forest Plan as the Chequamegon-Nicolet National Forest continues to strive toward desired future conditions and meeting Forest Plan objectives.

Contents
Year 2009/2010 Monitoring and Midterm Evaluation Report v
Contents Approval and Declaration of Intent .................................................................................................................. i Foreword .............................................................................................................................................................. i Executive Summary .......................................................................................................................................... iii Introduction .......................................................................................................................................................... 1
Forest Plan Overview .................................................................................................................................... 1 CHAPTER 1 Minimum Legally Required Monitoring ................................................................................... 3
Lands are adequately restocked (36 CFR 219.12(k)5(i)). .................................................................. 3 Lands not suited for timber production (36 CFR 219.12(k)5(ii)). .................................................... 4 Maximum opening from even-aged management (36 CFR219.12 (k)5(iii)). ................................. 7 Control of destructive insects and disease (36 CFR 219.12(k)5(iv)). ............................................... 8 Population trends of the seven management indicator species in relation to habitat changes
(36 CFR 219.19(a)(6)). ............................................................................................................ 12 Effects of Off-road Vehicles (36 CFR 219.21) ................................................................................... 34 Effects to lands and communities adjacent to or near national forest and effects to the forest
from land managed by Government entities (36 CFR 219.7(f)). ..................................... 36 Comparison of Projected and Actual Outputs and Services (36 CFR 219.12(k)(1)) ................... 40 Prescriptions and Effects (36 CFR 219.12(k)(2)) .............................................................................. 43 Comparison of Actual and Estimated Costs (36 CFR 219.12(k)(3)) .............................................. 44 Effects of Management Practices (36 CFR 219.11(d)) ..................................................................... 46
CHAPTER 2 Goal and Objective Monitoring ................................................................................................ 68 Goal 1.1 – Threatened, Endangered and Sensitive Species .................................................................... 68
Objective 1.1a: Under the Endangered Species Act (ESA), implement established recovery or conservation strategies. ........................................................................................................ 68
Objective 1.1b: Improve habitat conditions for Regional Forester Sensitive Species (RFSS) .... 73 Goal 1.2 – Ecological Communities of Special Concern ......................................................................... 78
Objective 1.2: Conserve special environmental, cultural, social and/or scientific values in protected areas including Wilderness, Wild and Scenic Rivers, Research Natural Areas, special management areas and old growth areas ................................................. 78
Goal 1.3 – Aquatic Ecosystems ................................................................................................................... 80 Objective 1.3a: Reduce the number of road and trail stream crossings. Reduce sedimentation
and improve fish passage in existing road and trail stream crossings. ......................... 80 Objective 1.3b: Reduce off-road & off-trail motorized vehicle use within wetlands, meadows,
and riparian areas. ................................................................................................................ 83 Objective 1.3c: Restore large woody debris by annually treating some lakes with tree drops
and/or cribs. Consult with the Native American Tribes when proposing this treatment on lakes where spear fishing occurs. ................................................................ 84
Objective 1.3d: Relocate some existing roads and trails out of riparian management zones. .. 84 Objective 1.3e: Improve or restore habitat in streams and lakes. ................................................. 85 Objective 1.3f: Apply lime to some lakes to improve productivity or make pH suited for
desired species. ...................................................................................................................... 90 Objective 1.3g: Protect and restore coldwater stream communities by maintaining Class I,
Class II, and Class III trout streams and their tributaries in a free-flowing condition.90
Contents
vi Year 2009/2010 Monitoring and Midterm Evaluation Report
Objective 1.3h: Maintain and/or enhance the quantity and ecological health of wild rice beds90 Objective 1.3i: Cooperate with statewide Best Management Practices (BMPs) monitoring
coordinated by the Wisconsin DNR. .................................................................................. 92 Goal 1.4 – Terrestrial Ecosystems ..............................................................................................................92
Objective 1.4a: Maintain or restore vegetation communities to their desired conditions. Emphasize restoration/maintenance in MA 2B, 4B, and 8C. .......................................... 92
Objective 1.4b: Restore and/or emulate natural disturbance regimes in Pine Barrens. .......... 102 Objective 1.4c: Restore and/or emulate natural disturbance regimes historically present
within pine communities. .................................................................................................. 102 Objective 1.4d: Maintain or expand existing dwarf bilberry populations. ................................ 102 Objective 1.4e: Increase average vegetative patch size. ................................................................ 103 Objective 1.4f: Permit some early successional forest succeed naturally toward late
successional forest types, as well as meeting desired conditions within designated old growth areas (MA 8G). ................................................................................................ 103
Objective 1.4g: Annually treat non-roadside and roadside NNIS sites. Develop an NNIS strategy to guide amounts and locations of treatment. ................................................. 103
Objective 1.4h: Increase use of prescribed fire as a management tool within fire adapted land-type associations. Reintroduce fire disturbance within research natural areas where establishment records allow. ............................................................................................. 108
Objective 1.4i: When large disturbance events (over 100 acres) occur within forested areas, maintain a portion of the damaged vegetation to provide additional site level structure and coarse woody debris. .................................................................................. 108
Objective 1.4j: Increase the long-lived conifer component in transition zones between upland and lowland. ........................................................................................................................ 108
Objective 1.4k: Increase quantity of boreal forest on the Ashland Lake-Modified Till Plain (LTA YA03) emphasizing mature older age classes and large patch sizes. ................ 110
Objective 1.4l: Maintain and enhance existing pockets of barrens and oak savanna habitat and restore characteristics described in the future condition for MA8C. Treat these areas as inclusions with other management areas. ................................................................... 111
Objective 1.4m: Increase aspen clearcut average patch size towards 25 acres, excluding ruffed grouse management areas. ................................................................................................ 111
Objective 1.4n: Restore Canada yew within northern hardwood ecosystems in management area 2B where feasible. ....................................................................................................... 112
Goal 1.5- Wildlife and Fish Habitat .........................................................................................................112 Objective 1.5a: Retain potential nest trees by reserving super-canopy pines within one-half
mile of lakes larger than 10 acres that sustain a fishery desired by osprey. ............... 112 Objective 1.5b: Cooperate with the Wisconsin DNR to establish a population and distribution
of beaver across the forest that provides naturally occurring disturbances, through flooding and direct impacts on vegetation, important to ecosystem sustainability. Juxtapose this population and distribution on the landscape in a manner that avoids detrimental effects on roads, trails, and other critical resources, such as cold-water fisheries and rare species.................................................................................................... 113
Goal 1.6 – Air Quality ................................................................................................................................115 Objective 1.6: Conduct forest management activities to protect or maintain local air quality.115
Goal 1.7 – Soils ............................................................................................................................................116
Contents
Year 2009/2010 Monitoring and Midterm Evaluation Report vii
Objective 1.7: Provide desired physical, chemical and biological soil processes and functions on the CNNF to maintain and/or improve soil productivity. ...................................... 116
Goal 2.1 – Recreation Opportunities ....................................................................................................... 121 Objective 2.1a: Improve the quality of semi-primitive nonmotorized Areas by increasing the
opportunity for quiet and remote experiences and by promoting activities that provide natural-appearing vegetation. ............................................................................ 121
Objective 2.1b: Within each MA 6B area (polygon) generally complete the harvesting planned for the decade during a consecutive 3-year period ........................................................ 122
Objective 2.1c: Reduce and strive to eliminate unacceptable changes in resource conditions due to off-road, off-trail motorized use ........................................................................... 122
Objective 2.1d: Construct up to 85 miles of ATV trail on the Nicolet landbase........................ 123 Objective 2.1e: Construct up to 100 miles of ATV trail on the Chequamegon landbase. ........ 123 Objective 2.1f: On the Nicolet, in collaboration with local governments, provide opportunities
to enhance existing town-designated ATV routes by designating specific existing classified roads .................................................................................................................... 123
Objective 2.1g: On the Chequamegon, designate and sign all classified roads as ATV routes except: (1) on roads where the CNNF does not have authority to designate as ATV routes; and (2) in instances where the local ranger district identifies and closes specific routes for management issues such as safety, resource degradation, local government concerns, or recreation use conflict. ........................................................... 123
Objective 2.1h: Close and rehabilitate one ATV “intensive use area.” ...................................... 124 Objective 2.1i: Provide well-maintained developed campgrounds that meet Forest Service
guidelines. ............................................................................................................................ 124 Objective 2.1j: Inventory and manage remote campsites to minimize environmental impacts
of recreation use. ................................................................................................................. 125 Objective 2.1k: Close unsurfaced primitive access roads to some lakes to provide a more
primitive recreation experience. Emphasize lakes with documented RFSS sites. ..... 125 Objective 2.1l: If maintenance methods prove ineffective and monitoring confirms unsafe
conditions or unacceptable resource damage, close and rehabilitate the existing 25-mile 4WD ORV trail. Then construct a replacement trail up to 25 miles long elsewhere on the CNNF providing an agreement with a non-Forest Service entity is developed to maintain and monitor trail conditions. .................................................... 125
Goal 2.2- Scenic Values .............................................................................................................................. 126 Objective 2.2a: Maintain or enhance the quality of scenic resources to provide desired
landscape character............................................................................................................. 126 Goal 2.3- Wilderness Opportunities ........................................................................................................ 126
Objective 2.3a: If opportunities arise, and in cooperation with local governments, allow decommissioning of roads that divide Wilderness areas or occur between Wilderness and Wilderness study areas to improve the Wilderness experience. .......................... 126
Goal 2.4 – Cultural Resources .................................................................................................................. 126 Objective 2.4a: Promote the scientific study of a selected cultural resource, primarily through
public participation and institutional/governmental partnerships. ........................... 127 Objective 2.4b: Consult with tribal governments, institutions, and other interested parties to
ensure the protection and preservation of areas, objects, and records that are culturally important to them. ............................................................................................ 134

Contents
viii Year 2009/2010 Monitoring and Midterm Evaluation Report
Objective 2.4c: Conduct scientific studies to further our understanding of human adaptation and influences on the landscape and to provide important information for NEPA analysis. ................................................................................................................................ 134
Objective 2.4d: Increase awareness and appreciation of cultural heritage through educational programs, university-sponsored archeology field schools or other programs. ......... 135
Goal 2.5 – Forest Commodities ................................................................................................................136 Objective 2.5: Ensure that harvest levels of special forest products are within sustainable
levels ..................................................................................................................................... 136 Goal 2.6 – Minerals and Energy Resources ............................................................................................140
Objective 2.6: Ensure that reclamation provision and environmental protections measures of operating plans and surface use plans of operations are completed to standard in field operations. ................................................................................................................... 140
Goal 2.7- Wildlife and Fish Resources .....................................................................................................141 Objective 2.7a: Cooperate with the Wisconsin and Michigan Departments of Natural
Resources on achieving desired wildlife and fish population goals through appropriate habitat management on the Chequamegon-Nicolet National Forests. .. 141
Objective 2.7b: Strive to maintain a deer herd balance within its range and compatible with existing social, economic, and ecological conditions. .................................................... 142
Goal 2.8 – Fire Management .....................................................................................................................146 Objective 2.8a: The safety of employees and the public is the highest priority during any fire
or fuels management incident. .......................................................................................... 146 Objective 2.8b: Expedite safe extinguishments of wildfires by the use of ground and/or air
resources. .............................................................................................................................. 147 Objective 2.8c: Reduce hazardous fuels within communities at risk, in cooperation with local,
Federal, and State agencies. ............................................................................................... 148 Objective 2.8d: Apply fire management as part of natural ecological disturbance regime. ... 149
Goal 2.9 – Treaty Rights ............................................................................................................................149 Goal 3.1- Capital Infrastructure................................................................................................................150
Objective 3.1a: Reduce average open and total road density on the Chequamegon-Nicolet National Forests. .................................................................................................................. 150
Goal 3.2 – Land Ownership ......................................................................................................................152 Objective 3.2: Convey, purchase or exchange lands where needed. High priority areas for
acquisition include those lands that: Protect TES or RFSS; Consolidate federal ownership within Wilderness; Increase public ownership on lakes and rivers; Provide unique ecological, scientific, heritage, or recreational qualities; and, Consolidate land ownership for efficient resource management purposes................ 152
Goal 3.3 – Public and Organization Relations ........................................................................................153 Objective 3.3a: Consult with Tribes and intertribal agencies during decision-making
processes. Consider effects of natural resource management decisions on the ability of tribes to exercise gathering rights. Site-specific project analyses address how project proposals might protect or impact the ability of tribes to exercise gathering rights. .................................................................................................................................... 153
Objective 3.3b: Through partnerships, encourage, establish and sustain a diverse and well-balanced range of recreational services and facilities on the Chequamegon-Nicolet National Forest. ................................................................................................................... 153

Contents
Year 2009/2010 Monitoring and Midterm Evaluation Report ix
Objective 3.3c: Cooperatively work with federal, state, and county agencies and other non-governmental organizations to control NNIS. ................................................................ 153
Objective 3.3d: Cooperatively work with Federal, State, and county agencies and nongovernmental organizations to integrate fire prevention programs and suppression resources. Cooperatively work across agencies to develop and implement hazardous fuels reduction projects that will reduce the risk of wildfire. 157
Objective 3.3e: Work collaboratively with other agencies and the public to protect and restore watersheds. Conduct assessments of all 5th-level watersheds with more than 25 percent federal ownership. ................................................................................................ 157
Objective 3.3f: Collaborate with the U.S. Fish and Wildlife Service in the collection and dissemination of information indicating the possible presence of Canada lynx and Kirtland’s Warbler. ............................................................................................................. 158
CHAPTER 3 Midterm Evaluation of the Forest Plan ................................................................................. 159 Progress toward Desired Future Conditions ......................................................................................... 160
Access and Recreation Opportunities ............................................................................................ 160 Biological Diversity ........................................................................................................................... 163 Special Lands Allocation .................................................................................................................. 172 Forest Products .................................................................................................................................. 173
Monitoring Program Effectiveness .......................................................................................................... 175 Access and Recreation Opportunities ............................................................................................ 176 Biological Diversity ........................................................................................................................... 177 Special Lands Allocation .................................................................................................................. 180 Forest Products .................................................................................................................................. 180
Conclusions................................................................................................................................................. 181 CHAPTER 4 Future Challenges and Partnerships ...................................................................................... 183
Fire Protection ............................................................................................................................................ 184 Forest Health .............................................................................................................................................. 185 Utilization and Marketing of Forest Products ....................................................................................... 187 Climate Change Response ........................................................................................................................ 188
List of Preparers ............................................................................................................................................... 189 References ......................................................................................................................................................... 190

Year 2009/2010 Monitoring and Midterm Evaluation Report 1
INTRODUCTION
Forest Plan Overview The Chequamegon-Nicolet National Forest (also referred to as the CNNF) covers more than a million and a half acres in northern Wisconsin. Today, this National Forest exemplifies forest restoration following the broad scale timber harvesting that denuded the area from the mid-1800s to the early 1900s. The Forest encompasses land within 11 counties (Ashland, Bayfield, Florence, Forest, Langlade, Oconto, Oneida, Price, Sawyer, Taylor and Vilas) and provides a variety of recreation opportunities (e.g., camping, hunting, and wildlife viewing), ecosystem services (e.g., clean air and water), and forest products (e.g., pulpwood and sawtimber) that contribute to the local and regional economies.
In 2004, Forest staff completed the revision and combination of the 1986 Forest Plans for the Chequamegon and Nicolet National Forests. The two National Forests combined into one administrative unit in 1993, so in 2004 one Forest Plan was produced to guide management on both landbases. The Chequamegon-Nicolet National Forest 2004 Land and Resource Management Plan (Forest Plan) was adopted under the 1982 Planning Rule with the 2000 Planning Rule provisions (36 CFR 219). The 2004 Forest Plan supports continued restoration of the terrestrial and aquatic ecosystems of the Chequamegon-Nicolet National Forests using the best science available while providing a wide array of sustainable goods and services.
The Forest Plan:
♦ establishes Forestwide multiple-use goals, objectives, and Forestwide management requirements;
♦ outlines management area direction, including area specific standards and guidelines, desired future conditions and management practices;
♦ identifies lands suitable for timber management; ♦ outlines monitoring and evaluation requirements; and ♦ recommends areas for Wilderness designation to Congress.
National Forest Management Act (NFMA) regulations (36 CFR 219) require monitoring and evaluation to take place on a regular basis to determine the efficacy of a Forest Plan. Specifically, the regulations direct monitoring and evaluation strategies must be designed to determine (1) how well the direction in the Forest Plan is being implemented, (2) whether the application of standards and guidelines is achieving objectives and whether objectives are achieving goals, and (3) whether the assumptions and predicted effects used to formulate the goals and objectives are valid. Through this strategy, the Forest Plan may be amended or revised to adapt to new information and changed conditions.
The Forest Plan provides guidance for all resource management activities on the Chequamegon-Nicolet National Forest.
Introduction
2 Year 2009/2010 Monitoring and Midterm Evaluation Report
A key requirement of a monitoring strategy is that the public be given timely, accurate information about Forest Plan implementation. Releasing an annual monitoring report accomplishes this requirement. The monitoring program must be efficient, practical, and affordable, and may make use of data that have been or will be collected for other purposes.
Monitoring tasks are performed at different levels: the Forest Plan, program, or project level. Each of these levels involves different objectives and requirements. Monitoring is not performed on every activity and is not expected to meet the statistical rigor of formal research. Some Forest Plan objectives in the monitoring program will not be monitored simply because the monitoring plan (2004 Forest Plan, chapter 4) does not require it at this
time or because budget limitations did not allow for monitoring. If budget levels limit the Forest’s ability to perform all monitoring tasks scheduled, then monitoring events specifically required by law are given the highest priority.
Chapters 1 and 2 of this document provide an assessment and evaluation of specific monitoring items in regards to legally required items as well as Forest Plan goals and objectives. Thus for the period
2004 to 2010, these chapters evaluate implementation, effectiveness and validation at a very small scale and provide the reader with information on how well the Chequamegon-Nicolet National Forest is implementing the direction in the Forest Plan and achieving goals.
Chapter 3 provides an evaluation of the Forest Plan at a larger, more integrated scale, which looks more holistically at the question “did the Forest do what it said it would do?” in terms of the overarching intent of the Forest Plan and its revision.
Finally, chapter 4 provides examples of the Chequamegon-Nicolet National Forest’s collaborations with partners to integrate management at a landscape scale to meet future challenges.
Monitoring and evaluation are separate activities. Monitoring is the process of collecting data and information. Evaluation is the analysis and interpretation of the information and collected data.
Year 2009/2010 Monitoring and Midterm Evaluation Report 3
CHAPTER 1 MINIMUM LEGALLY REQUIRED MONITORING
The National Forest Management Act at 36 CFR 219 established minimum monitoring and evaluation requirements for all National Forests. In addition, the Forest Plan prescribes minimum intervals or the frequency in which monitoring tasks must be completed (Forest Plan table 4-1, p. 4-6). This section reports all legally required monitoring tasks for fiscal years 2009 and 2010.
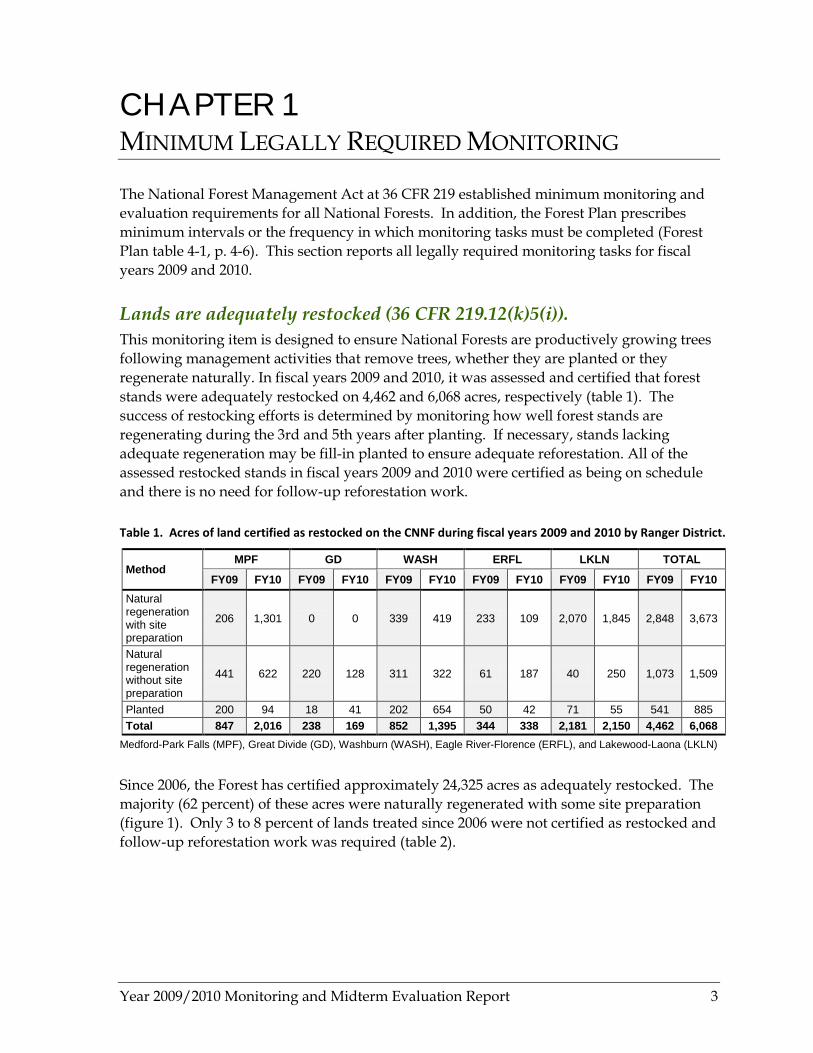
Lands are adequately restocked (36 CFR 219.12(k)5(i)). This monitoring item is designed to ensure National Forests are productively growing trees following management activities that remove trees, whether they are planted or they regenerate naturally. In fiscal years 2009 and 2010, it was assessed and certified that forest stands were adequately restocked on 4,462 and 6,068 acres, respectively (table 1). The success of restocking efforts is determined by monitoring how well forest stands are regenerating during the 3rd and 5th years after planting. If necessary, stands lacking adequate regeneration may be fill-in planted to ensure adequate reforestation. All of the assessed restocked stands in fiscal years 2009 and 2010 were certified as being on schedule and there is no need for follow-up reforestation work.
Table 1. Acres of land certified as restocked on the CNNF during fiscal years 2009 and 2010 by Ranger District.
Method MPF GD WASH ERFL LKLN TOTAL
FY09 FY10 FY09 FY10 FY09 FY10 FY09 FY10 FY09 FY10 FY09 FY10 Natural regeneration with site preparation
206 1,301 0 0 339 419 233 109 2,070 1,845 2,848 3,673
Natural regeneration without site preparation
441 622 220 128 311 322 61 187 40 250 1,073 1,509
Planted 200 94 18 41 202 654 50 42 71 55 541 885 Total 847 2,016 238 169 852 1,395 344 338 2,181 2,150 4,462 6,068
Medford-Park Falls (MPF), Great Divide (GD), Washburn (WASH), Eagle River-Florence (ERFL), and Lakewood-Laona (LKLN)
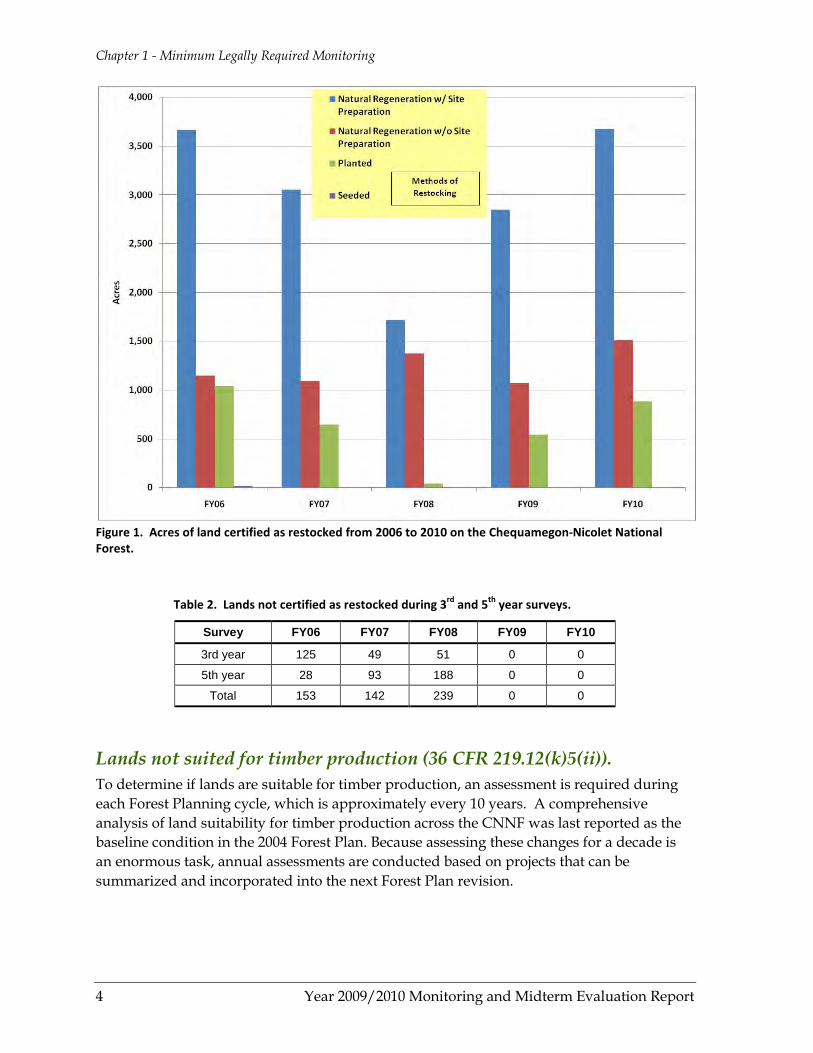
Since 2006, the Forest has certified approximately 24,325 acres as adequately restocked. The majority (62 percent) of these acres were naturally regenerated with some site preparation (figure 1). Only 3 to 8 percent of lands treated since 2006 were not certified as restocked and follow-up reforestation work was required (table 2).
Chapter 1 - Minimum Legally Required Monitoring
4 Year 2009/2010 Monitoring and Midterm Evaluation Report
Figure 1. Acres of land certified as restocked from 2006 to 2010 on the Chequamegon-Nicolet National Forest.
Table 2. Lands not certified as restocked during 3rd and 5th year surveys.
Survey FY06 FY07 FY08 FY09 FY10
3rd year 125 49 51 0 0
5th year 28 93 188 0 0
Total 153 142 239 0 0
Lands not suited for timber production (36 CFR 219.12(k)5(ii)). To determine if lands are suitable for timber production, an assessment is required during each Forest Planning cycle, which is approximately every 10 years. A comprehensive analysis of land suitability for timber production across the CNNF was last reported as the baseline condition in the 2004 Forest Plan. Because assessing these changes for a decade is an enormous task, annual assessments are conducted based on projects that can be summarized and incorporated into the next Forest Plan revision.
Chapter 1 - Minimum Legally Required Monitoring
Year 2009/2010 Monitoring and Midterm Evaluation Report 5
Lands are considered unsuitable for commercial timber production when: (a) designated or listed as Candidate Research Natural Areas, Wild/Scenic/Recreation river corridors, or Wilderness, (b) soils are not appropriate for timber production, c) designated as recreational sites, d) timber production would not be cost-efficient, or e) they are managed for open conditions.
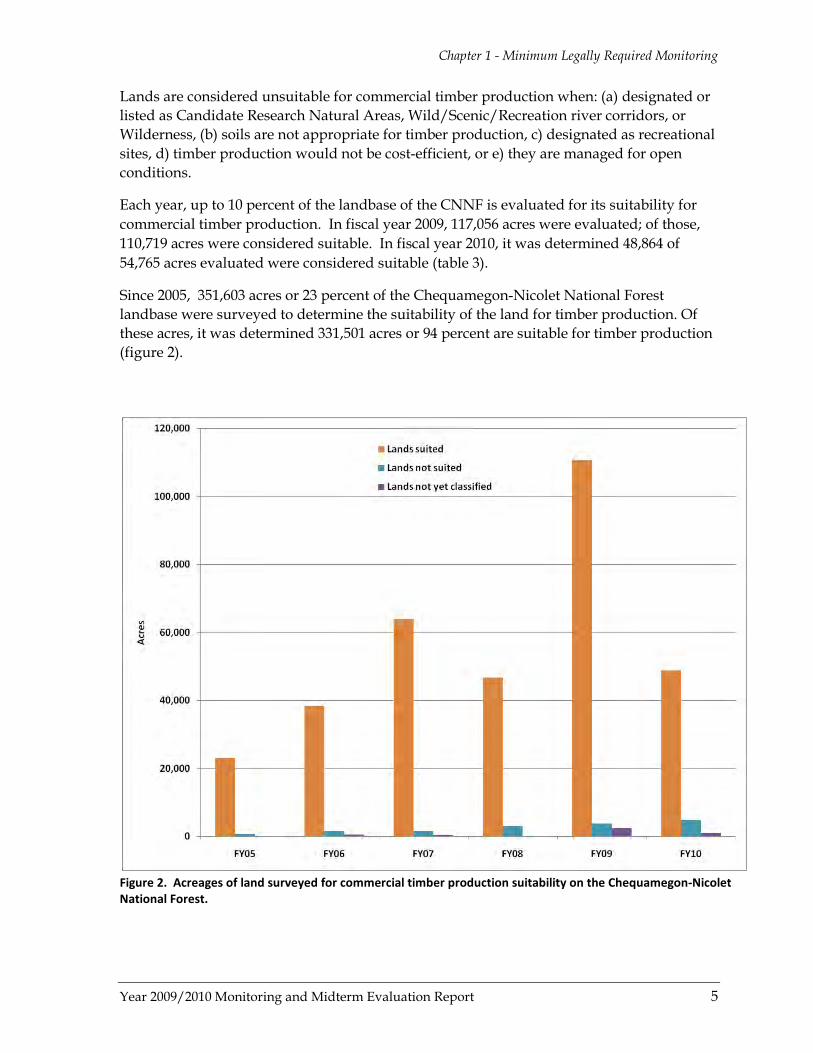
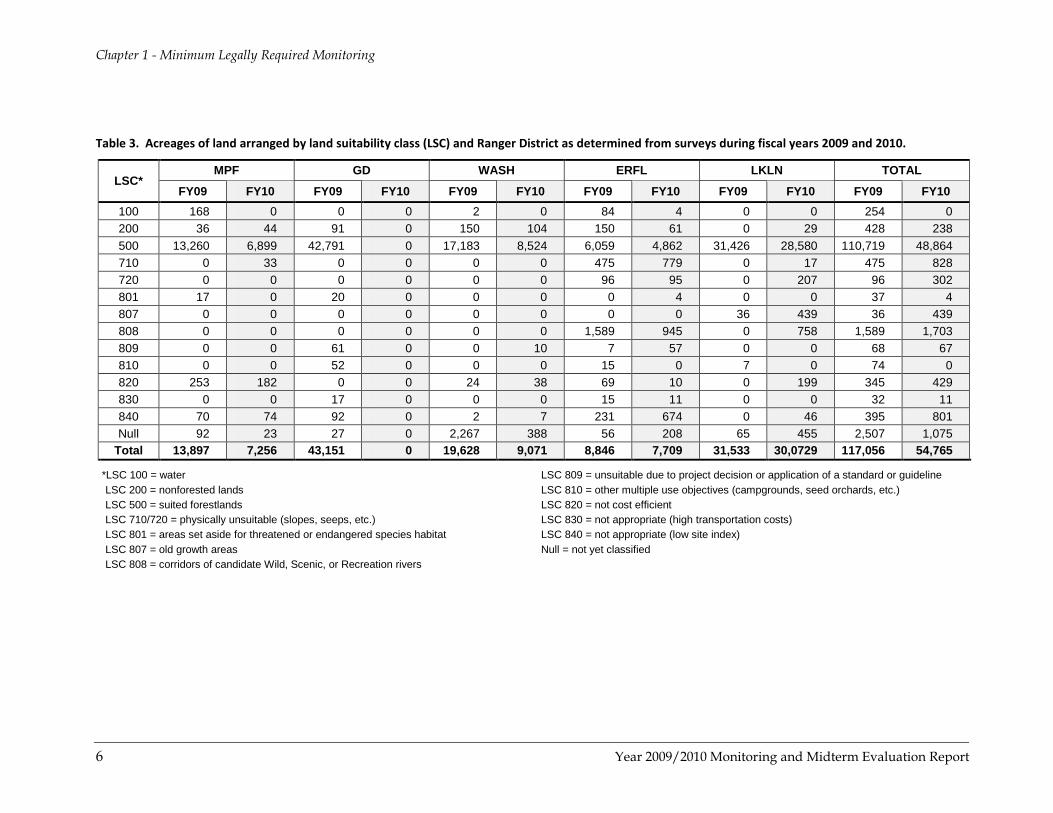
Each year, up to 10 percent of the landbase of the CNNF is evaluated for its suitability for commercial timber production. In fiscal year 2009, 117,056 acres were evaluated; of those, 110,719 acres were considered suitable. In fiscal year 2010, it was determined 48,864 of 54,765 acres evaluated were considered suitable (table 3).
Since 2005, 351,603 acres or 23 percent of the Chequamegon-Nicolet National Forest landbase were surveyed to determine the suitability of the land for timber production. Of these acres, it was determined 331,501 acres or 94 percent are suitable for timber production (figure 2).
Figure 2. Acreages of land surveyed for commercial timber production suitability on the Chequamegon-Nicolet National Forest.
Chapter 1 - Minimum Legally Required Monitoring
6 Year 2009/2010 Monitoring and Midterm Evaluation Report
Table 3. Acreages of land arranged by land suitability class (LSC) and Ranger District as determined from surveys during fiscal years 2009 and 2010.
LSC* MPF GD WASH ERFL LKLN TOTAL
FY09 FY10 FY09 FY10 FY09 FY10 FY09 FY10 FY09 FY10 FY09 FY10 100 168 0 0 0 2 0 84 4 0 0 254 0 200 36 44 91 0 150 104 150 61 0 29 428 238 500 13,260 6,899 42,791 0 17,183 8,524 6,059 4,862 31,426 28,580 110,719 48,864 710 0 33 0 0 0 0 475 779 0 17 475 828 720 0 0 0 0 0 0 96 95 0 207 96 302 801 17 0 20 0 0 0 0 4 0 0 37 4 807 0 0 0 0 0 0 0 0 36 439 36 439 808 0 0 0 0 0 0 1,589 945 0 758 1,589 1,703 809 0 0 61 0 0 10 7 57 0 0 68 67 810 0 0 52 0 0 0 15 0 7 0 74 0 820 253 182 0 0 24 38 69 10 0 199 345 429 830 0 0 17 0 0 0 15 11 0 0 32 11 840 70 74 92 0 2 7 231 674 0 46 395 801 Null 92 23 27 0 2,267 388 56 208 65 455 2,507 1,075
Total 13,897 7,256 43,151 0 19,628 9,071 8,846 7,709 31,533 30,0729 117,056 54,765
*LSC 100 = water LSC 200 = nonforested lands LSC 500 = suited forestlands LSC 710/720 = physically unsuitable (slopes, seeps, etc.) LSC 801 = areas set aside for threatened or endangered species habitat LSC 807 = old growth areas LSC 808 = corridors of candidate Wild, Scenic, or Recreation rivers
LSC 809 = unsuitable due to project decision or application of a standard or guideline LSC 810 = other multiple use objectives (campgrounds, seed orchards, etc.) LSC 820 = not cost efficient LSC 830 = not appropriate (high transportation costs) LSC 840 = not appropriate (low site index) Null = not yet classified

Chapter 1 - Minimum Legally Required Monitoring
Year 2009/2010 Monitoring and Midterm Evaluation Report 7
Maximum opening from even-aged management (36 CFR219.12 (k)5(iii)). The National Forest Management Act requires the Forest Service to monitor the size of harvest areas where even-aged management techniques are used, to determine whether existing size limits remain valid be continued. Because of the productive soils and relative abundance of pioneer tree species on the Chequamegon-Nicolet National Forest landscape, openings caused by even-aged management are quickly reforested. Forest Plan guidelines state that these temporary openings from even-aged management will not exceed 40 acres (exceptions are listed below). The temporary openings are defined in the Forest Plan as stands with an average crown closure less than 20 percent or regeneration of less than 12 feet tall. Temporary openings may exceed 40 acres when: temporary openings are within management area 4C and 8C; openings are a result of natural or catastrophic occurrences such as fire, insect and disease attack, or wind storm; or when the openings benefit Connecticut warbler within jack pine habitats (2004 Forest Plan, p. 2-4).
In fiscal year 2009, 40 blocks were harvested by clearcutting (not salvage) totaling 769 acres. Blocks are defined as openings (single or multiple adjacent stands) that are being regenerated to forest. The average size of the blocks was 19 acres; they ranged in size from 1 to 40 acres. In addition, 2,934 acres were clearcut to salvage timber on 79 blocks, averaging 37 acres per block and ranging in size from 3 to 129 acres. These activities were tied to four disturbance events:
♦ Quad County tornado ♦ Wind event at Washburn - 1,751 acres ♦ Spruce decline (insect and disease attack) - 1,031 acres ♦ Pioneer fire - 152 acres
In fiscal year 2010, 1,141 acres were clearcut to salvage timber on 35 blocks, averaging 33 acres per block and ranging in size from 1 to 141 acres. These activities were also tied to three disturbance events.
♦ Quad County tornado - 452 acres ♦ Spruce decline (insect and disease attack) - 677 acres ♦ Jack pine budworm (insect and disease attack) - 12 acres
Since 2004, the total acres of clearcuts, including salvage treatments, ranged from a low of 141 acres in 2005 to a high of 1,154 acres in 2009 with the average size of clearcut ranging from 14 acres in 2005 to 30 acres in 2008 (figure 3). The maximum opening size since 2004 ranged from 29 acres in 2005 to 117 acres in 2007. Clearcut data includes salvage, thus in some cases, the openings exceeded the 40-acre size limit.

Chapter 1 - Minimum Legally Required Monitoring
8 Year 2009/2010 Monitoring and Midterm Evaluation Report
Figure 3. Total, average, and maximum size of clearcuts on the Chequamegon-Nicolet National Forest from 2004-2010.
Control of destructive insects and disease (36 CFR 219.12(k)5(iv)). Federal regulations exist to prevent destructive insects and disease organisms from increasing to potentially damaging levels following management activities. Prevention includes early detection followed by treatment, if needed.
Detection Aerial pest detection flights occurred on all Ranger Districts within the Chequamegon-Nicolet National Forest in July of 2009 and 2010 by the State and Private Forestry branch of the Forest Service.
In fiscal year 2009, detection crews did not find any damage on the Washburn Ranger District. Widely scattered aspen “dieback” was reported on the south end of the Great Divide Ranger District and throughout the Medford-Park Falls Ranger District. Thinner crowns caused by early spring defoliation, however, may have made it appear as a dieback event. The aspen in these areas likely reflushed, which produced thinner crowns.
Crews found spruce budworm defoliation on the northern portion of the Eagle River-Florence District but they estimated defoliation was less than in previous years. They also

Chapter 1 - Minimum Legally Required Monitoring
Year 2009/2010 Monitoring and Midterm Evaluation Report 9
noted minor roadside mortality of red pine. Road salt, drought, and bark beetles may be contributing factors in the detected mortality.
On the Lakewood-Laona District, crews found gypsy moth defoliation, primarily in oak and aspen. This defoliation, in combination with greater amounts of overmature aspen in the area, may result in more trees dying in the near future.
In fiscal year 2010, crews detected mixed species of trees killed from fire in the north-central portion of the Washburn Ranger District and near Blockhouse Lake in the Medford-Park Falls Ranger District. They also observed tamarack defoliation along the west side of Chequamegon Waters Flowage. Crews found spruce budworm defoliation along the Marengo and Iron Rivers in the northeast potion of the Great Divide Ranger District, and near the Chippewa River Campground. Crews observed aspen defoliation by aspen leaf miner near Wilson Lake in the Medford Park Falls Ranger District, and west of the Whisker Lake Wilderness in the Eagle River-Florence Ranger District. In addition, aspen defoliation by the leaf miner and leaf roller was common on the northern one-third of the Lakewood landbase and most of the Laona landbase.
Crews noted black ash dieback in the northeast corner of the Medford landbase near Highway D and Forest System Road 564. They also found heavy gypsy moth defoliation primarily in oak (some aspen) stands in the Lakewood-Laona Ranger District. This damage was distributed over the southern two-thirds of the Lakewood landbase.
Treatment Oak Wilt – In fiscal years 2009 and 2010 on the Lakewood Ranger District, 2,815 oaks on 27 sites were removed, and 2,714 oaks on 16 sites to limit further oak wilt infection.
Oak wilt treatment involves harvesting the trees in the fall and winter and removing the bark or splitting the wood into small enough pieces to encourage rapid drying (i.e., split firewood) prior to April 1. In addition, the stump is completely uprooted to sever all root connections, thus limiting the spread of oak wilt through root grafts (photo 1, next page).
Oak wilt was first discovered on the CNNF in 1997 on the Lakewood-Laona Ranger District. Monitoring and treatment of infected sites began in 2001, and has occurred every year from 2004 to 2010 (table 4). Oak wilt infected areas in the Lakewood-Laona Ranger District have been treated with a vibratory plow since 2001 and it has been 77 percent effective. The effectiveness of this treatment is limited because using the vibratory plow required to slice through large root systems is difficult in uneven topography and rocky conditions common within the forests.
Table 4. Lakewood/Laona oak wilt treatment (2005-2010).
Year Number of sites treated
Number of individual
trees
2005 31 2,757
2006 35 3,679
2007 19 1,559
2008 14 900
2009 27 2,815
2010 16 2,714
Total 142 14,424

Chapter 1 - Minimum Legally Required Monitoring
10 Year 2009/2010 Monitoring and Midterm Evaluation Report
Photo 1. Preventing root-to-root spread of oak wilt by uprooting stumps of oak killed by Ceratocystis fagacearum
In the last two years, instead of a vibratory plow to cut root connections, an excavator was used to “pop” stumps of infected trees from the ground and overturn them following harvest. Monitoring to date indicates that oak wilt treatment using the excavator method has been effective on 68 percent of the sites with just one treatment. On 95 percent of the sites, the disease has been successfully controlled with either one or two treatments; that is, the follow-up treatment when needed has been effective nearly all of the time. Monitoring of known sites, reconnaissance to detect new sites, and treatment continues within the Lakewood-Laona Ranger District. Oak wilt has not been detected on any other districts of the CNNF although there was a detection near Eagle River, close to the forest boundary in 2010.
Gypsy Moth – The Forest participates annually in the national program “Gypsy Moth: Slow the Spread.” Approximately 8,330 acres were treated with pheromone flakes in 2009, and in 2010, approximately 7,663 acres were treated in five locations within Bayfield County in the Washburn Ranger District.
Fere
nc L
akat
os, U
nive
rsity
o f
Wes
t-Hun
gary
, Bug
woo
d.or
g
Photo 2. Gypsy moth egg masses
Chapter 1 - Minimum Legally Required Monitoring
Year 2009/2010 Monitoring and Midterm Evaluation Report 11
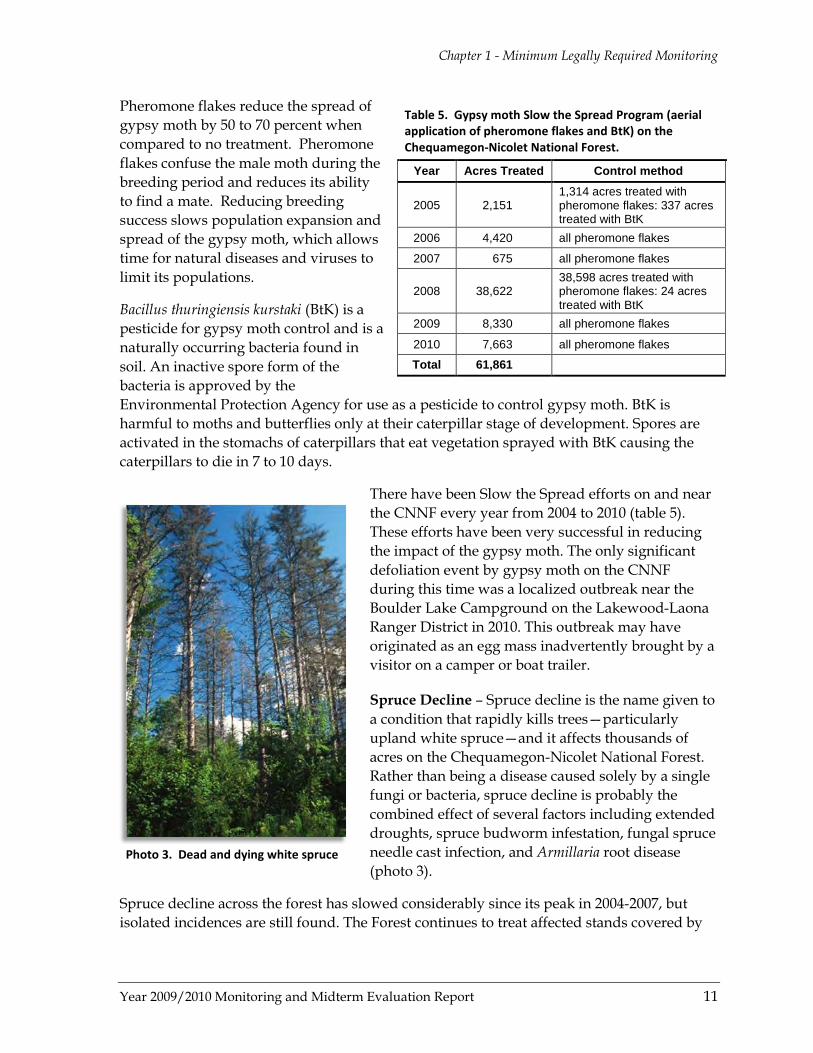
Pheromone flakes reduce the spread of gypsy moth by 50 to 70 percent when compared to no treatment. Pheromone flakes confuse the male moth during the breeding period and reduces its ability to find a mate. Reducing breeding success slows population expansion and spread of the gypsy moth, which allows time for natural diseases and viruses to limit its populations.
Bacillus thuringiensis kurstaki (BtK) is a pesticide for gypsy moth control and is a naturally occurring bacteria found in soil. An inactive spore form of the bacteria is approved by the Environmental Protection Agency for use as a pesticide to control gypsy moth. BtK is harmful to moths and butterflies only at their caterpillar stage of development. Spores are activated in the stomachs of caterpillars that eat vegetation sprayed with BtK causing the caterpillars to die in 7 to 10 days.
There have been Slow the Spread efforts on and near the CNNF every year from 2004 to 2010 (table 5). These efforts have been very successful in reducing the impact of the gypsy moth. The only significant defoliation event by gypsy moth on the CNNF during this time was a localized outbreak near the Boulder Lake Campground on the Lakewood-Laona Ranger District in 2010. This outbreak may have originated as an egg mass inadvertently brought by a visitor on a camper or boat trailer.
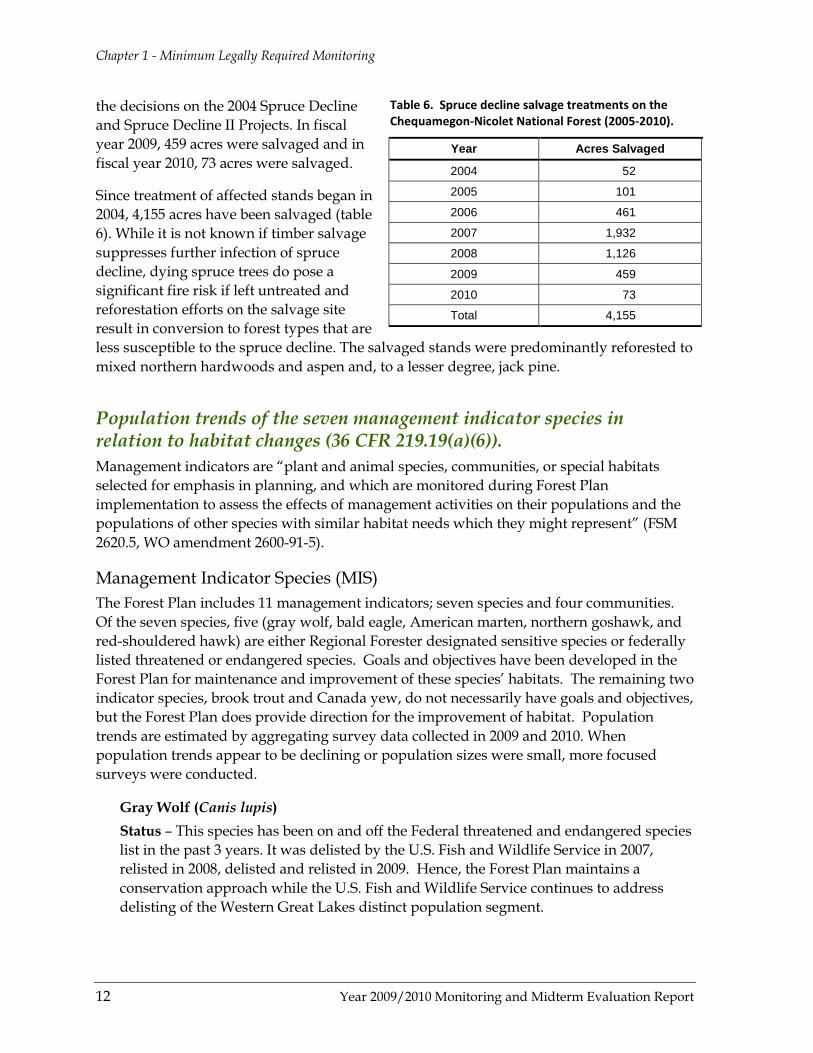
Spruce Decline – Spruce decline is the name given to a condition that rapidly kills trees—particularly upland white spruce—and it affects thousands of acres on the Chequamegon-Nicolet National Forest. Rather than being a disease caused solely by a single fungi or bacteria, spruce decline is probably the combined effect of several factors including extended droughts, spruce budworm infestation, fungal spruce needle cast infection, and Armillaria root disease (photo 3).
Spruce decline across the forest has slowed considerably since its peak in 2004-2007, but isolated incidences are still found. The Forest continues to treat affected stands covered by
Table 5. Gypsy moth Slow the Spread Program (aerial application of pheromone flakes and BtK) on the Chequamegon-Nicolet National Forest.
Year Acres Treated Control method
2005 2,151 1,314 acres treated with pheromone flakes: 337 acres treated with BtK
2006 4,420 all pheromone flakes
2007 675 all pheromone flakes
2008 38,622 38,598 acres treated with pheromone flakes: 24 acres treated with BtK
2009 8,330 all pheromone flakes
2010 7,663 all pheromone flakes
Total 61,861
Photo 3. Dead and dying white spruce
Chapter 1 - Minimum Legally Required Monitoring
12 Year 2009/2010 Monitoring and Midterm Evaluation Report
the decisions on the 2004 Spruce Decline and Spruce Decline II Projects. In fiscal year 2009, 459 acres were salvaged and in fiscal year 2010, 73 acres were salvaged.
Since treatment of affected stands began in 2004, 4,155 acres have been salvaged (table 6). While it is not known if timber salvage suppresses further infection of spruce decline, dying spruce trees do pose a significant fire risk if left untreated and reforestation efforts on the salvage site result in conversion to forest types that are less susceptible to the spruce decline. The salvaged stands were predominantly reforested to mixed northern hardwoods and aspen and, to a lesser degree, jack pine.
Population trends of the seven management indicator species in relation to habitat changes (36 CFR 219.19(a)(6)). Management indicators are “plant and animal species, communities, or special habitats selected for emphasis in planning, and which are monitored during Forest Plan implementation to assess the effects of management activities on their populations and the populations of other species with similar habitat needs which they might represent” (FSM 2620.5, WO amendment 2600-91-5).
Management Indicator Species (MIS) The Forest Plan includes 11 management indicators; seven species and four communities. Of the seven species, five (gray wolf, bald eagle, American marten, northern goshawk, and red-shouldered hawk) are either Regional Forester designated sensitive species or federally listed threatened or endangered species. Goals and objectives have been developed in the Forest Plan for maintenance and improvement of these species’ habitats. The remaining two indicator species, brook trout and Canada yew, do not necessarily have goals and objectives, but the Forest Plan does provide direction for the improvement of habitat. Population trends are estimated by aggregating survey data collected in 2009 and 2010. When population trends appear to be declining or population sizes were small, more focused surveys were conducted.
Gray Wolf (Canis lupis) Status – This species has been on and off the Federal threatened and endangered species list in the past 3 years. It was delisted by the U.S. Fish and Wildlife Service in 2007, relisted in 2008, delisted and relisted in 2009. Hence, the Forest Plan maintains a conservation approach while the U.S. Fish and Wildlife Service continues to address delisting of the Western Great Lakes distinct population segment.
Table 6. Spruce decline salvage treatments on the Chequamegon-Nicolet National Forest (2005-2010).
Year Acres Salvaged
2004 52
2005 101
2006 461
2007 1,932
2008 1,126
2009 459
2010 73
Total 4,155
Chapter 1 - Minimum Legally Required Monitoring
Year 2009/2010 Monitoring and Midterm Evaluation Report 13
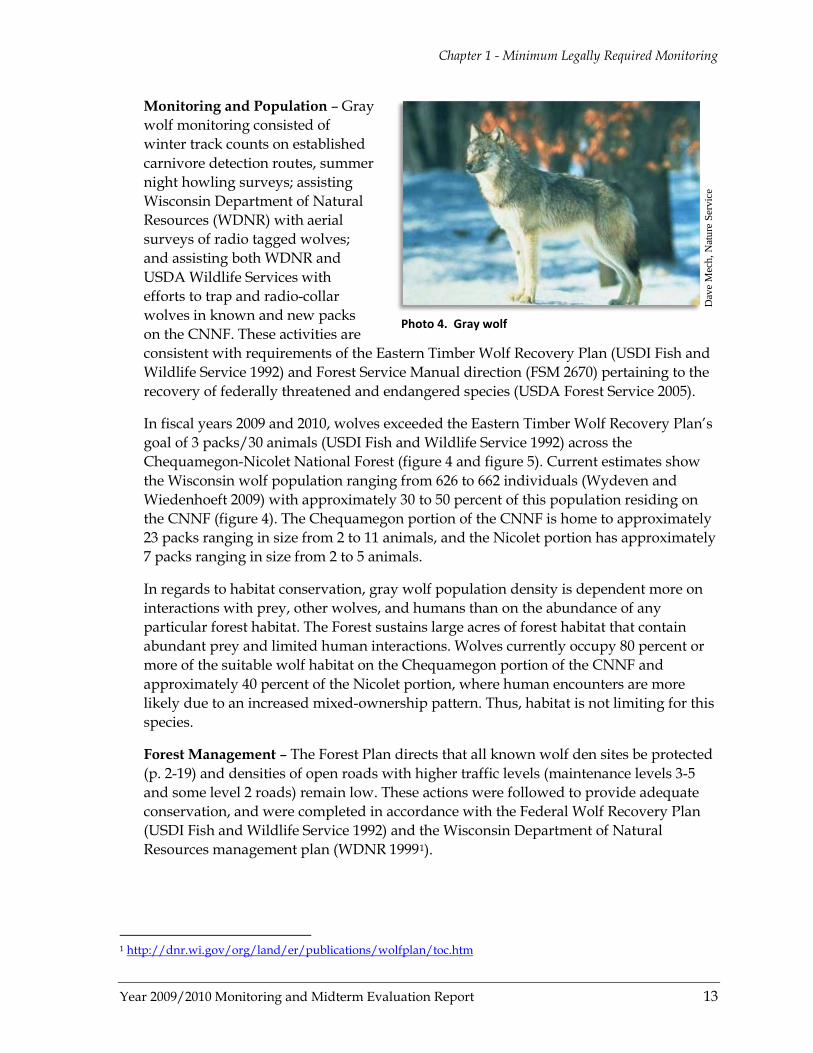
Monitoring and Population – Gray wolf monitoring consisted of winter track counts on established carnivore detection routes, summer night howling surveys; assisting Wisconsin Department of Natural Resources (WDNR) with aerial surveys of radio tagged wolves; and assisting both WDNR and USDA Wildlife Services with efforts to trap and radio-collar wolves in known and new packs on the CNNF. These activities are consistent with requirements of the Eastern Timber Wolf Recovery Plan (USDI Fish and Wildlife Service 1992) and Forest Service Manual direction (FSM 2670) pertaining to the recovery of federally threatened and endangered species (USDA Forest Service 2005).
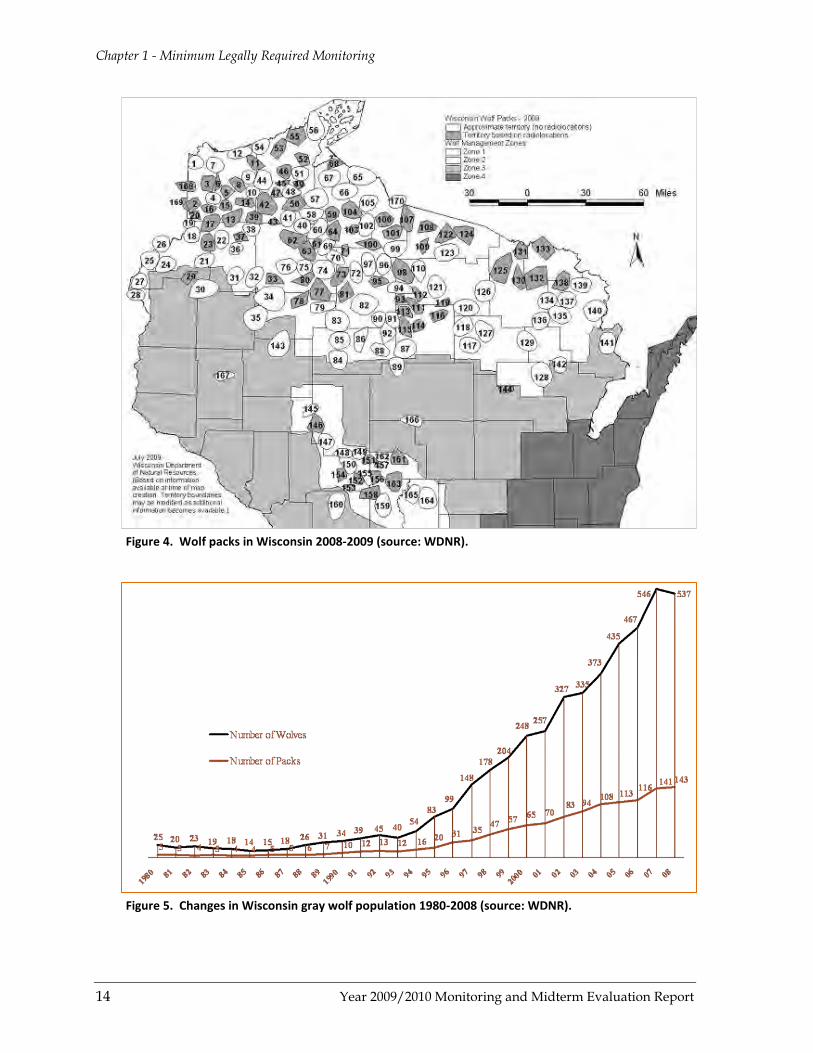
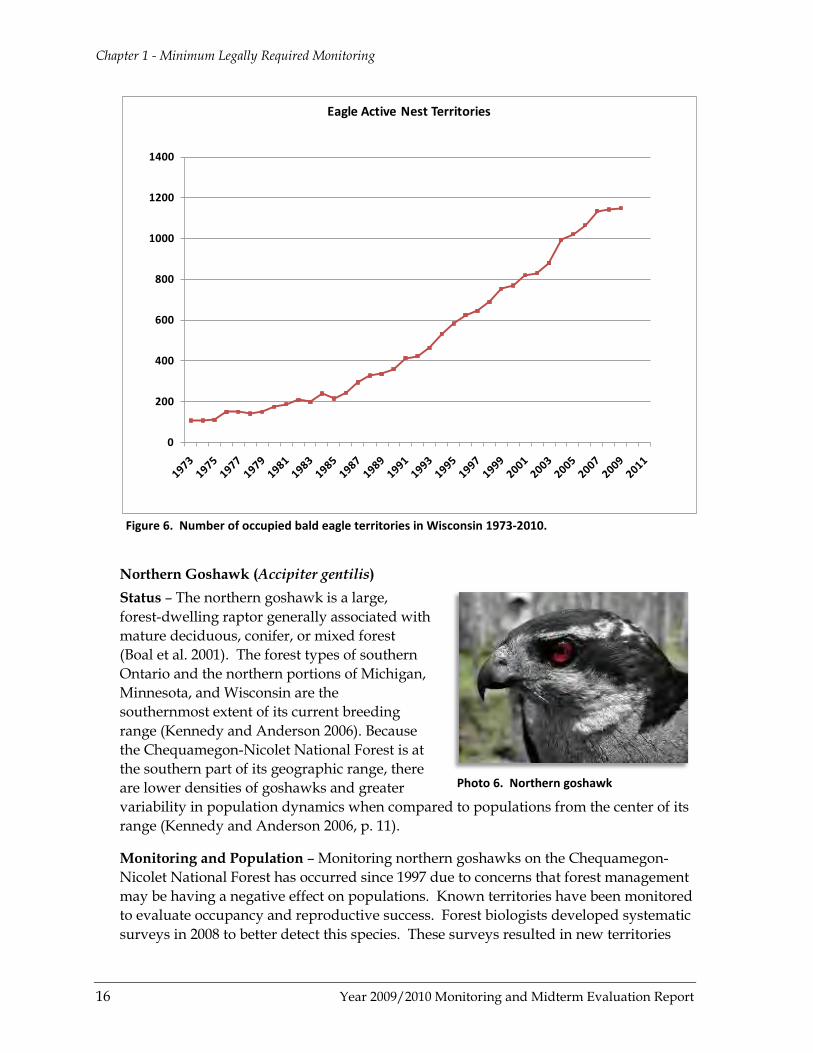
In fiscal years 2009 and 2010, wolves exceeded the Eastern Timber Wolf Recovery Plan’s goal of 3 packs/30 animals (USDI Fish and Wildlife Service 1992) across the Chequamegon-Nicolet National Forest (figure 4 and figure 5). Current estimates show the Wisconsin wolf population ranging from 626 to 662 individuals (Wydeven and Wiedenhoeft 2009) with approximately 30 to 50 percent of this population residing on the CNNF (figure 4). The Chequamegon portion of the CNNF is home to approximately 23 packs ranging in size from 2 to 11 animals, and the Nicolet portion has approximately 7 packs ranging in size from 2 to 5 animals.
In regards to habitat conservation, gray wolf population density is dependent more on interactions with prey, other wolves, and humans than on the abundance of any particular forest habitat. The Forest sustains large acres of forest habitat that contain abundant prey and limited human interactions. Wolves currently occupy 80 percent or more of the suitable wolf habitat on the Chequamegon portion of the CNNF and approximately 40 percent of the Nicolet portion, where human encounters are more likely due to an increased mixed-ownership pattern. Thus, habitat is not limiting for this species.
Forest Management – The Forest Plan directs that all known wolf den sites be protected (p. 2-19) and densities of open roads with higher traffic levels (maintenance levels 3-5 and some level 2 roads) remain low. These actions were followed to provide adequate conservation, and were completed in accordance with the Federal Wolf Recovery Plan (USDI Fish and Wildlife Service 1992) and the Wisconsin Department of Natural Resources management plan (WDNR 19991
1
).
http://dnr.wi.gov/org/land/er/publications/wolfplan/toc.htm
Dav
e M
ech,
Nat
ure
Serv
ice
Photo 4. Gray wolf
Chapter 1 - Minimum Legally Required Monitoring
14 Year 2009/2010 Monitoring and Midterm Evaluation Report
Figure 4. Wolf packs in Wisconsin 2008-2009 (source: WDNR).
Figure 5. Changes in Wisconsin gray wolf population 1980-2008 (source: WDNR).

Chapter 1 - Minimum Legally Required Monitoring
Year 2009/2010 Monitoring and Midterm Evaluation Report 15
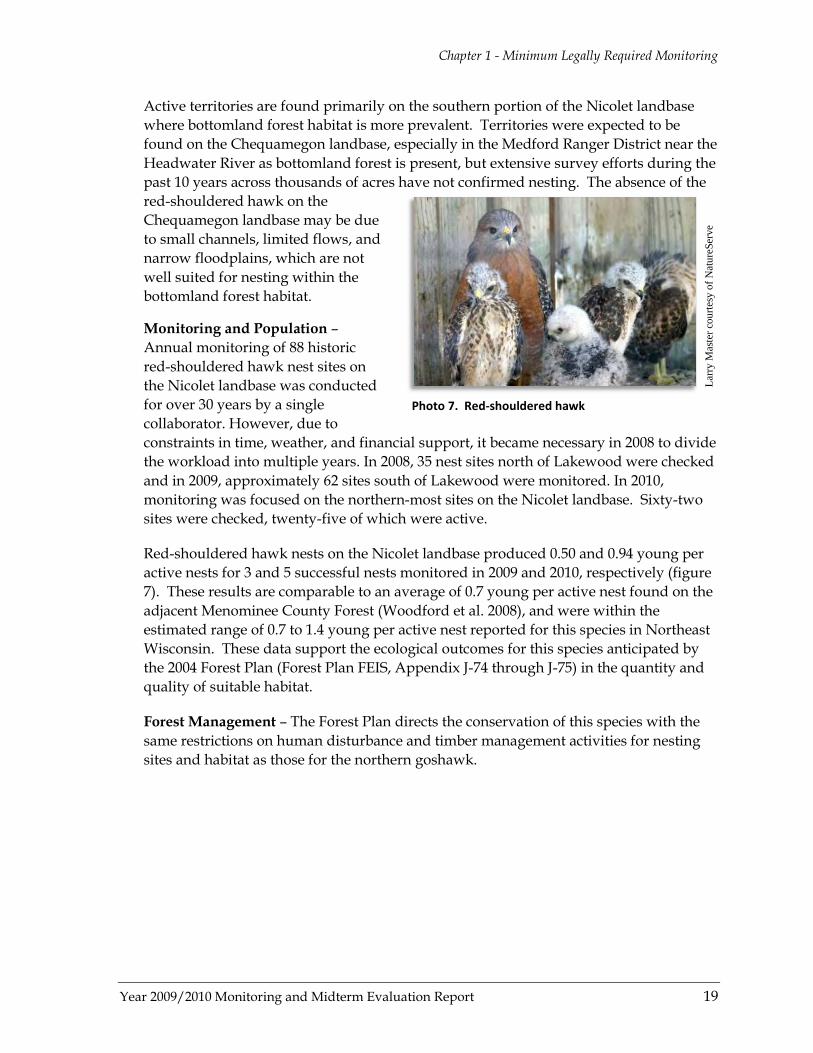
Bald Eagle (Haliaeetus leucocephalus) Status – The Forest has been an active participant in the bald eagle Federal and State recovery plans since the species was placed on the Endangered Species Act list in 1973 (USDI Fish and Wildlife Service 1983, WDNR 1986). In 1991, 414 active territories were estimated throughout the state, which was above the recovery plan’s goal of 360 set by the U.S. Fish and Wildlife Service (figure 6). Numbers have remained above this level since 1991. As a result, the bald eagle was removed from the Federal list of threatened and endangered species on August 9, 2007. Today Wisconsin is home to 1,150 nesting pairs or 12 percent of the 9,700 pairs estimated to be breeding in the lower 48 states (WDNR species fact sheet, 2010).
Monitoring and Population – The 1986 Chequamegon and Nicolet Forest Plans both had goals of 30 active nests by 2000. In 2006, 41 historic nesting territories were surveyed on the Chequamegon landbase, of which 32 were active and contained 43 young (figure 6). The Nicolet landbase had 41 historic territories surveyed, of which 35 were active. Both Forest landbases have met or exceeded the recommended recovery goal annually since 1997. Current field information continues to suggest that this species is abundant, sustaining levels well above those described for the CNNF in the Northern States Bald Eagle Recovery Plan (1983). Eagles continue colonizing new areas on the National Forest.
Bald eagles need suitable nest trees and aquatic foraging areas (lakes and rivers) as habitat. Although there is no reasonable means to evaluate the abundance of available nest trees near any of the 600 lakes greater than 10 acres in size and riverine habitat on the Chequamegon-Nicolet National Forest, nest monitoring suggests that nest trees and fish resource are abundant enough to sustain a stable population on an annual basis.
Forest Management – Even though the bald eagle is no longer listed under the Federal Endangered Species Act, the Forest Plan directs and guides their conservation according to the restrictions set in the Northern States Bald Eagle Recovery Plan by limiting activity within 330 feet of a nesting tree. In addition, the Forest Plan imposes seasonal restrictions on roads and trails within 1,320 feet of a nest, and reserves known roosting, perching, and potential nest trees within active bald eagle breeding areas.
Photo 5. Bald eagle
Chapter 1 - Minimum Legally Required Monitoring
16 Year 2009/2010 Monitoring and Midterm Evaluation Report
Figure 6. Number of occupied bald eagle territories in Wisconsin 1973-2010.
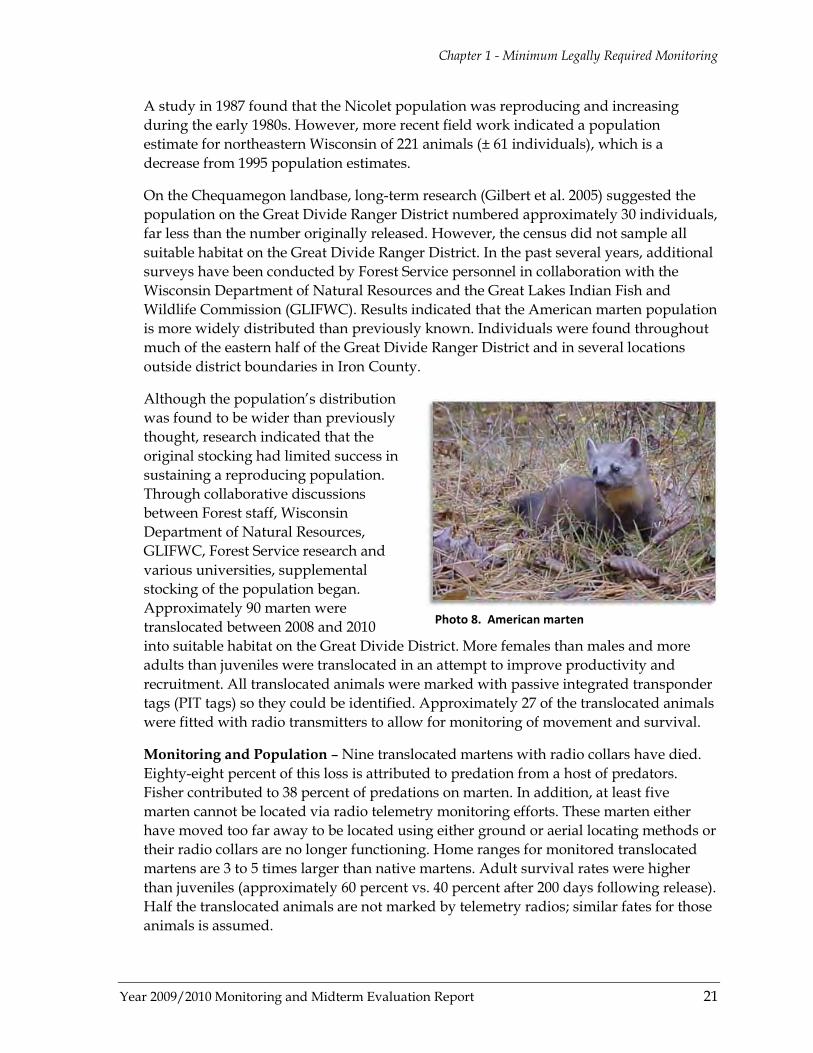
Northern Goshawk (Accipiter gentilis) Status – The northern goshawk is a large, forest-dwelling raptor generally associated with mature deciduous, conifer, or mixed forest (Boal et al. 2001). The forest types of southern Ontario and the northern portions of Michigan, Minnesota, and Wisconsin are the southernmost extent of its current breeding range (Kennedy and Anderson 2006). Because the Chequamegon-Nicolet National Forest is at the southern part of its geographic range, there are lower densities of goshawks and greater variability in population dynamics when compared to populations from the center of its range (Kennedy and Anderson 2006, p. 11).
Monitoring and Population – Monitoring northern goshawks on the Chequamegon-Nicolet National Forest has occurred since 1997 due to concerns that forest management may be having a negative effect on populations. Known territories have been monitored to evaluate occupancy and reproductive success. Forest biologists developed systematic surveys in 2008 to better detect this species. These surveys resulted in new territories
0
200
400
600
800
1000
1200
1400
Eagle Active Nest Territories
Photo 6. Northern goshawk

Chapter 1 - Minimum Legally Required Monitoring
Year 2009/2010 Monitoring and Midterm Evaluation Report 17
being discovered and known territories found to be abandoned. Trends indicate a stable to slightly increasing number of territories during the monitoring period for this species on the CNNF (see table 7 and table 8).
In 2008, Forest staff participated in a Northern Goshawk Bioregional Monitoring Study to evaluate the viability and distribution of goshawks in the Western Great Lakes. The monitoring study addresses National Forest Management Act requirements for maintaining population viability, and uses agency-developed and peer-reviewed protocols that are currently the best available science and have been used in multiple bioregions of the species. By participating in this monitoring effort, the CNNF could contribute to a population viability risk evaluation at the bioregional scale. Using the Western Great Lakes bioregional monitoring method provides an unbiased estimate of distribution and abundance across agency boundaries and addresses a wide range of management regimes, all of which have documented occurrences of goshawk.
Table 7. Nesting data for northern goshawk on the Chequamegon landbase, 1988–2008*.
Year 1992 1994 1996 1998 2000 2002 2004 2005 2006 2007 2008 Territories Checked 13 13 13 13 13 13 14 18 16 15 22
Active Territories 0 0 7 0 4 5 5 10 10 6 10 Active Nests 0 0 7 0 4 2 4 9 10 6 7 Successful Nests 0 0 4 0 1 2 2 6 5 2 5 No. Young 0 0 11 0 2 4 5 11 12 4 10+
No. Fledged 0 0 11 0 2 4 5 10 12 4 10+ * Note: Monitoring data for fiscal years 2009 and 2010 was collected but not yet evaluated
Table 8. Nesting data for northern goshawk on the Nicolet landbase, 1998–2009.
Year 1998 1999 2000 2001 2002 2003 2004 2005 2006 2007 2008 2009 Territories Checked 63 62 unk 72 74 65 65 57 63 63 51 51
Active Territories 16 17 unk 16 12 12 17 13 12 9 8 17
Active Nests 11 16 14 13 10 11 17 13 12 9 6 17 Successful Nests 9 12 9 9 3 9 13 8 9 9 6 16
No. Fledged 16 27 19 15 7 20 23 13 20 18 18 34 Unk – data not provided in 2000 report submitted by T. Erdman, #no. of young was not estimated by contractor Monitoring data for 2010 was not received prior to this report being published.
Through the Western Great Lakes bioregional monitoring effort, northern goshawk density is estimated at 5,184 (± 199) individuals and the species is widely distributed throughout the study area (consistent with densities expected for a “low-density species;” Bruggeman et al. 2009). Goshawks were detected in 12 forest types with the majority of detections found in northern hardwoods (30 percent) and aspen/birch forest types (13 percent). The monitoring efforts may have underestimated numbers in the Western Great Lakes region because habitats in Michigan (both central Upper Peninsula

Chapter 1 - Minimum Legally Required Monitoring
18 Year 2009/2010 Monitoring and Midterm Evaluation Report
and Lower Peninsula) were not surveyed. In Wisconsin, 903 (± 110) individuals were estimated (Bruggeman et al. 2009). Of these totals, 442 (± 224) individuals are estimated to live within Chequamegon-Nicolet National Forest boundaries. Overall, the Wisconsin goshawk population is considered abundant and well distributed across suitable habitat including the habitat within the CNNF. These data indicate that CNNF management is meeting the expectations of the Forest Plan regarding quantity and quality of suitable habitat for goshawk (Forest Plan FEIS2
The Forest Plan indicates that northern goshawk is a mature northern hardwoods associated species. While it is true that this species uses mature northern hardwoods for nesting and foraging, nest site selection on the CNNF shows that goshawk also use other habitats to conduct these activities suggesting that the species is more flexible than assumed during Forest Plan revision. While the majority of nests are within mature northern hardwoods habitats this is expected because this habitat is the most available.
, Appendix J-68 through J-70).
Forest Management – The Forest Plan guides the conservation of the northern goshawk through protection of active and historic nest sites, and their habitat (Forest Plan, p. 2-20). Nesting sites are protected by a 30-acre no-disturbance zone (or 660 feet from the nest) where seasonal restrictions are placed on human disturbance (February 15 to August 1), land use is limited to activities that do not reduce canopy closure, and timber harvest is not allowed.
Habitat within the immediate nesting site area is conserved through another protection zone, which extends 330 feet beyond the designated 30-acre no-disturbance zone. Even-aged management retaining at least 80 percent crown closure and a limited number of canopy gaps is permitted within this secondary protection zone.
Red-shouldered Hawk (Buteo lineatus) Status – The red-shouldered hawk is a medium to large woodland hawk that is widespread in the eastern United States, southeastern Canada, California, and Mexico. In Wisconsin, the red-shouldered hawk was probably never common, but was most abundant in mature bottomland forests along major rivers such as the St. Croix, Wisconsin, Chippewa, and Wolf Rivers (Robbins 1991, p. 213). Timber harvest activity prior to 1930 most likely affected these habitats. As these forests have regenerated and aged, the red-shouldered hawk has been and continues to be recorded in many counties across the state, although it is still considered an uncommon resident. Mature northern hardwood forest is the preferred nesting habitat for red-shouldered hawk on the CNNF.
The red-shouldered hawk is listed as threatened in the State of Wisconsin. Analysis of national Breeding Bird Survey data for Wisconsin shows a decreasing trend from 1966 to 1979, and a slightly increasing trend from 1980 to 1999. Estimated population sizes are questionable, however, due to low numbers and sample size and may not be precise (Table 12 in Jacobs and Jacobs 2002, p. 23 and 71).
2 USDA Forest Service. 2004a. Final Environmental Impact Statement to Accompany the 2004 Land and Resource
Management Plan.
Chapter 1 - Minimum Legally Required Monitoring
Year 2009/2010 Monitoring and Midterm Evaluation Report 19
Active territories are found primarily on the southern portion of the Nicolet landbase where bottomland forest habitat is more prevalent. Territories were expected to be found on the Chequamegon landbase, especially in the Medford Ranger District near the Headwater River as bottomland forest is present, but extensive survey efforts during the past 10 years across thousands of acres have not confirmed nesting. The absence of the red-shouldered hawk on the Chequamegon landbase may be due to small channels, limited flows, and narrow floodplains, which are not well suited for nesting within the bottomland forest habitat.
Monitoring and Population – Annual monitoring of 88 historic red-shouldered hawk nest sites on the Nicolet landbase was conducted for over 30 years by a single collaborator. However, due to constraints in time, weather, and financial support, it became necessary in 2008 to divide the workload into multiple years. In 2008, 35 nest sites north of Lakewood were checked and in 2009, approximately 62 sites south of Lakewood were monitored. In 2010, monitoring was focused on the northern-most sites on the Nicolet landbase. Sixty-two sites were checked, twenty-five of which were active.
Red-shouldered hawk nests on the Nicolet landbase produced 0.50 and 0.94 young per active nests for 3 and 5 successful nests monitored in 2009 and 2010, respectively (figure 7). These results are comparable to an average of 0.7 young per active nest found on the adjacent Menominee County Forest (Woodford et al. 2008), and were within the estimated range of 0.7 to 1.4 young per active nest reported for this species in Northeast Wisconsin. These data support the ecological outcomes for this species anticipated by the 2004 Forest Plan (Forest Plan FEIS, Appendix J-74 through J-75) in the quantity and quality of suitable habitat.
Forest Management – The Forest Plan directs the conservation of this species with the same restrictions on human disturbance and timber management activities for nesting sites and habitat as those for the northern goshawk.
Larry
Mas
ter c
ourte
sy o
f Nat
ureS
erve
Photo 7. Red-shouldered hawk

Chapter 1 - Minimum Legally Required Monitoring
20 Year 2009/2010 Monitoring and Midterm Evaluation Report
Figure 7. Red-shouldered hawk nesting data for Chequamegon-Nicolet National Forest, 1998-2010. Dashed red line indicates a change in sampling size and intensity. *2008-only northern Nicolet landbase was searched for active nests **2009-only southern Nicolet landbase was searched for active nests ***2010-only northern Nicolet landbase was searched for active nests
American Marten (Martes americana) Status – The mature conifer forests that covered northern Wisconsin before the 1800s provided prime habitat for American marten, which lived throughout the northern part of Wisconsin. The marten is currently listed as endangered by the State of Wisconsin. Efforts at reestablishing an American marten population began in 1953 when the Wisconsin Conservation Department imported five animals from Montana and released them on Stockton Island in Ashland County. This reintroduction effort was not successful.
Marten were then successfully reintroduced by the Wisconsin Department of Natural Resources between 1975 and 1990 on the Chequamegon and Nicolet landbases of the CNNF (WDNR 2006, p. 3).
The Chequamegon landbase received 150 animals between 1989 and 1990 from a Minnesota source. The Nicolet landbase received 173 marten between 1975 and 1983 (Williams et al. 2007). The populations of marten that currently exist are associated with the fisher restoration zones (now Marten Restoration Areas) that were established collaboratively with the Wisconsin Department of Natural Resources on National Forest land (Woodford et al. 2005a, pp. 9 and 10).
0
10
20
30
40
50
60
70
80
90
Year
Territories CheckedActive Territories
Active Nests
Successful Nests
Chapter 1 - Minimum Legally Required Monitoring
Year 2009/2010 Monitoring and Midterm Evaluation Report 21
A study in 1987 found that the Nicolet population was reproducing and increasing during the early 1980s. However, more recent field work indicated a population estimate for northeastern Wisconsin of 221 animals (± 61 individuals), which is a decrease from 1995 population estimates.
On the Chequamegon landbase, long-term research (Gilbert et al. 2005) suggested the population on the Great Divide Ranger District numbered approximately 30 individuals, far less than the number originally released. However, the census did not sample all suitable habitat on the Great Divide Ranger District. In the past several years, additional surveys have been conducted by Forest Service personnel in collaboration with the Wisconsin Department of Natural Resources and the Great Lakes Indian Fish and Wildlife Commission (GLIFWC). Results indicated that the American marten population is more widely distributed than previously known. Individuals were found throughout much of the eastern half of the Great Divide Ranger District and in several locations outside district boundaries in Iron County.
Although the population’s distribution was found to be wider than previously thought, research indicated that the original stocking had limited success in sustaining a reproducing population. Through collaborative discussions between Forest staff, Wisconsin Department of Natural Resources, GLIFWC, Forest Service research and various universities, supplemental stocking of the population began. Approximately 90 marten were translocated between 2008 and 2010 into suitable habitat on the Great Divide District. More females than males and more adults than juveniles were translocated in an attempt to improve productivity and recruitment. All translocated animals were marked with passive integrated transponder tags (PIT tags) so they could be identified. Approximately 27 of the translocated animals were fitted with radio transmitters to allow for monitoring of movement and survival.
Monitoring and Population – Nine translocated martens with radio collars have died. Eighty-eight percent of this loss is attributed to predation from a host of predators. Fisher contributed to 38 percent of predations on marten. In addition, at least five marten cannot be located via radio telemetry monitoring efforts. These marten either have moved too far away to be located using either ground or aerial locating methods or their radio collars are no longer functioning. Home ranges for monitored translocated martens are 3 to 5 times larger than native martens. Adult survival rates were higher than juveniles (approximately 60 percent vs. 40 percent after 200 days following release). Half the translocated animals are not marked by telemetry radios; similar fates for those animals is assumed.
Photo 8. American marten
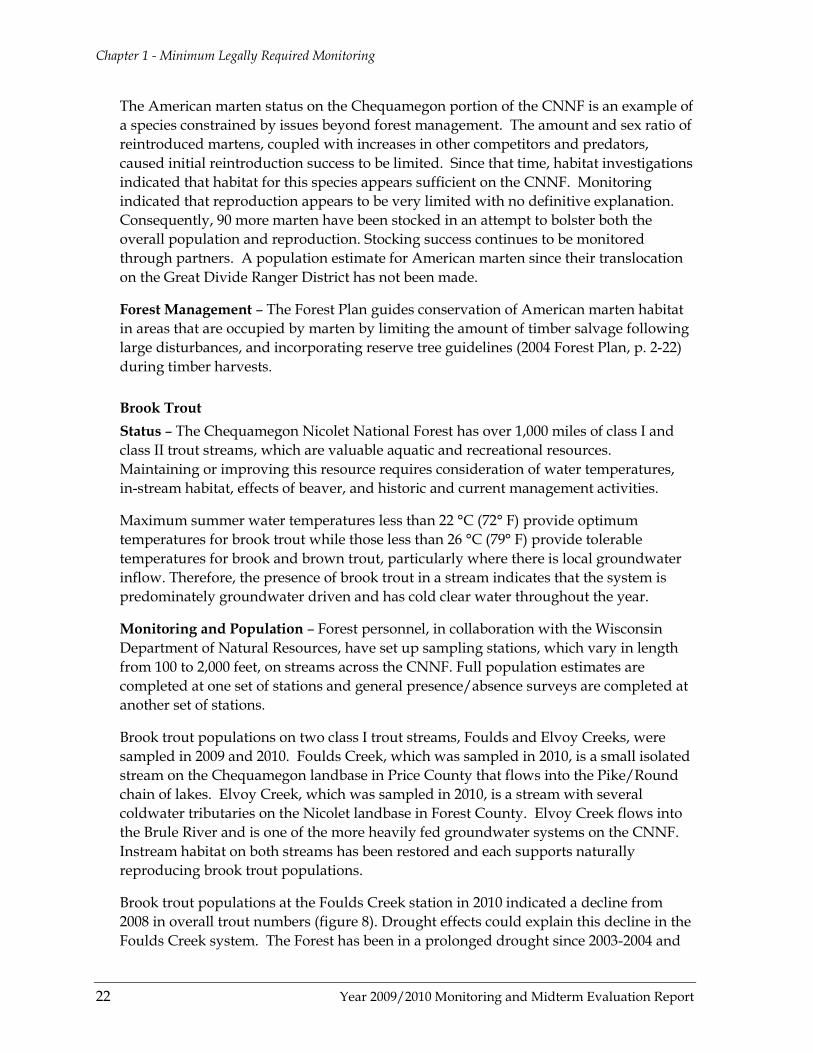
Chapter 1 - Minimum Legally Required Monitoring
22 Year 2009/2010 Monitoring and Midterm Evaluation Report
The American marten status on the Chequamegon portion of the CNNF is an example of a species constrained by issues beyond forest management. The amount and sex ratio of reintroduced martens, coupled with increases in other competitors and predators, caused initial reintroduction success to be limited. Since that time, habitat investigations indicated that habitat for this species appears sufficient on the CNNF. Monitoring indicated that reproduction appears to be very limited with no definitive explanation. Consequently, 90 more marten have been stocked in an attempt to bolster both the overall population and reproduction. Stocking success continues to be monitored through partners. A population estimate for American marten since their translocation on the Great Divide Ranger District has not been made.
Forest Management – The Forest Plan guides conservation of American marten habitat in areas that are occupied by marten by limiting the amount of timber salvage following large disturbances, and incorporating reserve tree guidelines (2004 Forest Plan, p. 2-22) during timber harvests.
Brook Trout Status – The Chequamegon Nicolet National Forest has over 1,000 miles of class I and class II trout streams, which are valuable aquatic and recreational resources. Maintaining or improving this resource requires consideration of water temperatures, in-stream habitat, effects of beaver, and historic and current management activities.
Maximum summer water temperatures less than 22 °C (72° F) provide optimum temperatures for brook trout while those less than 26 °C (79° F) provide tolerable temperatures for brook and brown trout, particularly where there is local groundwater inflow. Therefore, the presence of brook trout in a stream indicates that the system is predominately groundwater driven and has cold clear water throughout the year.
Monitoring and Population – Forest personnel, in collaboration with the Wisconsin Department of Natural Resources, have set up sampling stations, which vary in length from 100 to 2,000 feet, on streams across the CNNF. Full population estimates are completed at one set of stations and general presence/absence surveys are completed at another set of stations.
Brook trout populations on two class I trout streams, Foulds and Elvoy Creeks, were sampled in 2009 and 2010. Foulds Creek, which was sampled in 2010, is a small isolated stream on the Chequamegon landbase in Price County that flows into the Pike/Round chain of lakes. Elvoy Creek, which was sampled in 2010, is a stream with several coldwater tributaries on the Nicolet landbase in Forest County. Elvoy Creek flows into the Brule River and is one of the more heavily fed groundwater systems on the CNNF. Instream habitat on both streams has been restored and each supports naturally reproducing brook trout populations.
Brook trout populations at the Foulds Creek station in 2010 indicated a decline from 2008 in overall trout numbers (figure 8). Drought effects could explain this decline in the Foulds Creek system. The Forest has been in a prolonged drought since 2003-2004 and

Chapter 1 - Minimum Legally Required Monitoring
Year 2009/2010 Monitoring and Midterm Evaluation Report 23
in 2009 and 2010, water levels including baseflow levels in the groundwater-driven system, were very low. Since the Foulds Creek system is a small isolated stream system, impacts to water temperature, and consequently the brook trout populations, would be greater than if it had a strong groundwater influence.
Figure 8. Brook trout sampled at Foulds Creek, Price County, WI from 1980-2010. Note that samples were not taken annually.
From 1999 to 2009, the Elvoy Creek brook trout population was relatively stable with only small fluctuations over time (figure 9, next page). The population trends seen in these two stream systems are indicative of what is occurring in trout streams across the CNNF. Those systems with less groundwater saw brook trout numbers decline during the drought years, while those streams such as Elvoy that are heavily fed groundwater systems, maintained a stable brook trout numbers.
Forest Management – The Forest Plan provides guidance for management activities that avoid potentially adverse impacts on trout populations (2004 Forest Plan, p. 2-16 to 2-17). Included in this guidance is the management of aspen and beaver along streams. One of the major factors helping to provide stable populations of brook trout is the beaver management program.
The beaver management program addresses beaver habitat, which in most cases is aspen management. By discouraging regeneration of aspen, establishment of long-lived
0
100
200
300
400
500
600
700
800
Broo
k Tr
out
Popu
latio
n
Brook Trout Monitoring StationFoulds Creek, Price County # of Brook Trout > 6"
Total # of Brook Trout
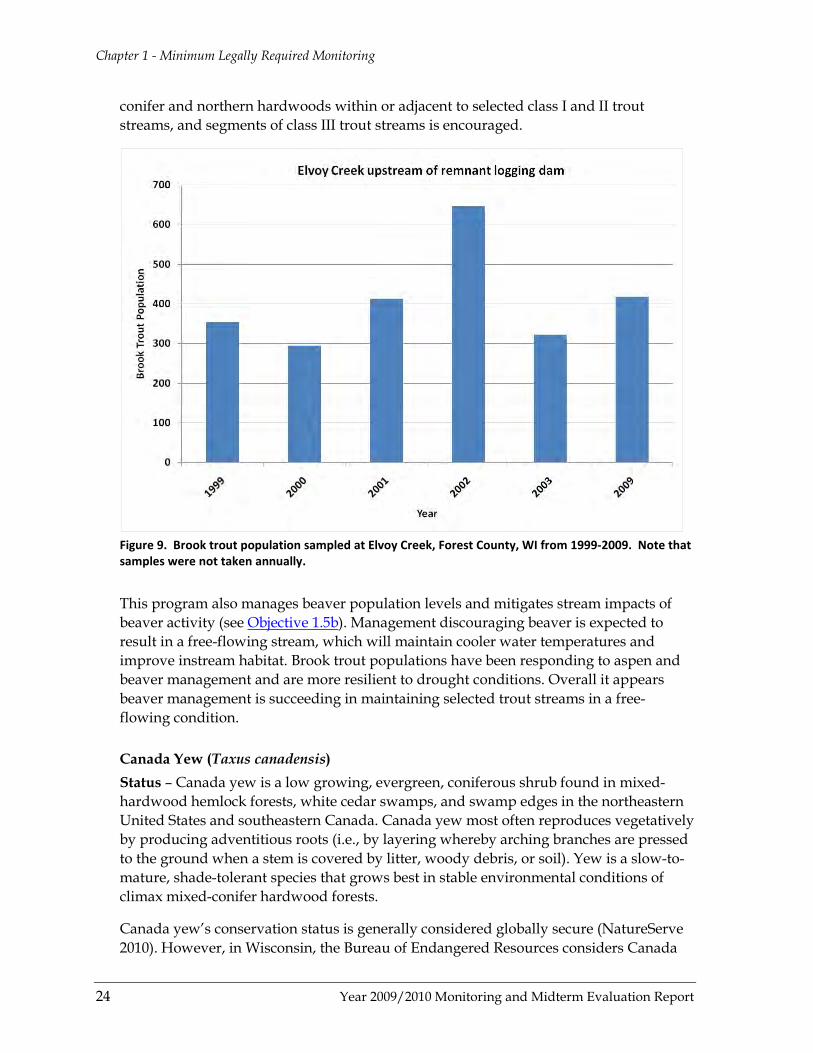
Chapter 1 - Minimum Legally Required Monitoring
24 Year 2009/2010 Monitoring and Midterm Evaluation Report
conifer and northern hardwoods within or adjacent to selected class I and II trout streams, and segments of class III trout streams is encouraged.
Figure 9. Brook trout population sampled at Elvoy Creek, Forest County, WI from 1999-2009. Note that samples were not taken annually.
This program also manages beaver population levels and mitigates stream impacts of beaver activity (see Objective 1.5b). Management discouraging beaver is expected to result in a free-flowing stream, which will maintain cooler water temperatures and improve instream habitat. Brook trout populations have been responding to aspen and beaver management and are more resilient to drought conditions. Overall it appears beaver management is succeeding in maintaining selected trout streams in a free-flowing condition.
Canada Yew (Taxus canadensis) Status – Canada yew is a low growing, evergreen, coniferous shrub found in mixed-hardwood hemlock forests, white cedar swamps, and swamp edges in the northeastern United States and southeastern Canada. Canada yew most often reproduces vegetatively by producing adventitious roots (i.e., by layering whereby arching branches are pressed to the ground when a stem is covered by litter, woody debris, or soil). Yew is a slow-to-mature, shade-tolerant species that grows best in stable environmental conditions of climax mixed-conifer hardwood forests.
Canada yew’s conservation status is generally considered globally secure (NatureServe 2010). However, in Wisconsin, the Bureau of Endangered Resources considers Canada
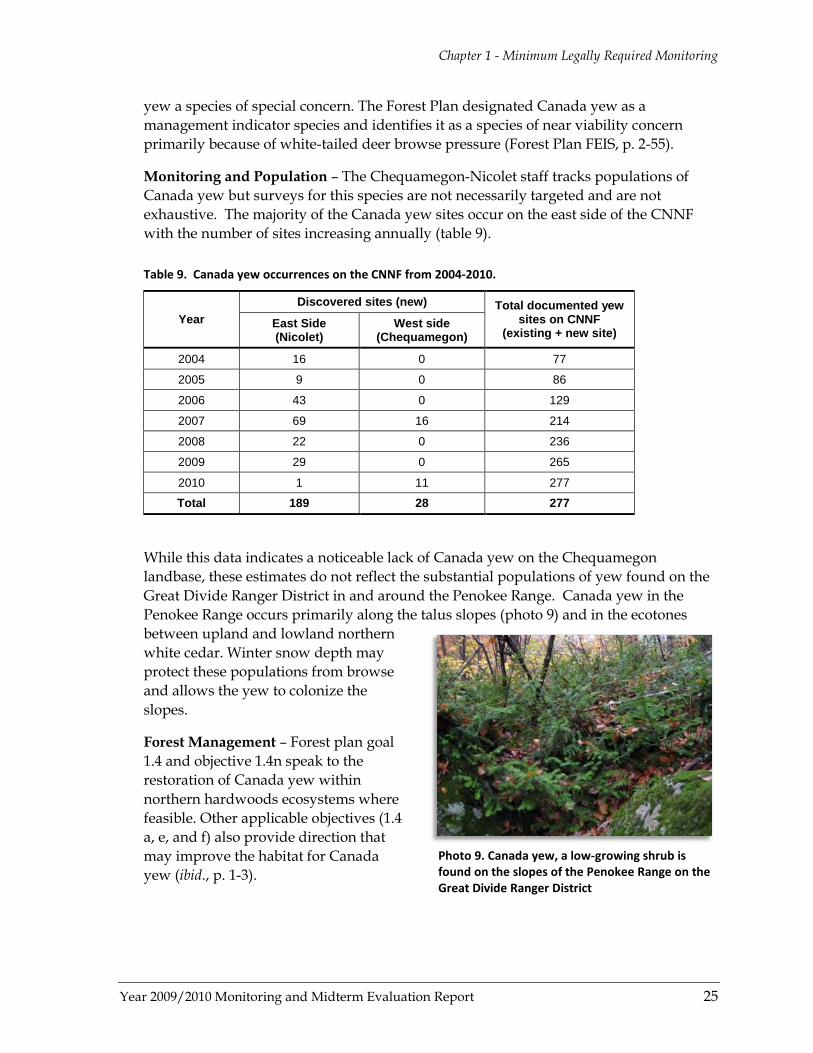
Chapter 1 - Minimum Legally Required Monitoring
Year 2009/2010 Monitoring and Midterm Evaluation Report 25
yew a species of special concern. The Forest Plan designated Canada yew as a management indicator species and identifies it as a species of near viability concern primarily because of white-tailed deer browse pressure (Forest Plan FEIS, p. 2-55).
Monitoring and Population – The Chequamegon-Nicolet staff tracks populations of Canada yew but surveys for this species are not necessarily targeted and are not exhaustive. The majority of the Canada yew sites occur on the east side of the CNNF with the number of sites increasing annually (table 9).
Table 9. Canada yew occurrences on the CNNF from 2004-2010.
Year Discovered sites (new) Total documented yew
sites on CNNF (existing + new site)
East Side (Nicolet)
West side (Chequamegon)
2004 16 0 77
2005 9 0 86
2006 43 0 129
2007 69 16 214
2008 22 0 236
2009 29 0 265
2010 1 11 277
Total 189 28 277
While this data indicates a noticeable lack of Canada yew on the Chequamegon landbase, these estimates do not reflect the substantial populations of yew found on the Great Divide Ranger District in and around the Penokee Range. Canada yew in the Penokee Range occurs primarily along the talus slopes (photo 9) and in the ecotones between upland and lowland northern white cedar. Winter snow depth may protect these populations from browse and allows the yew to colonize the slopes.
Forest Management – Forest plan goal 1.4 and objective 1.4n speak to the restoration of Canada yew within northern hardwoods ecosystems where feasible. Other applicable objectives (1.4 a, e, and f) also provide direction that may improve the habitat for Canada yew (ibid., p. 1-3).
Photo 9. Canada yew, a low-growing shrub is found on the slopes of the Penokee Range on the Great Divide Ranger District
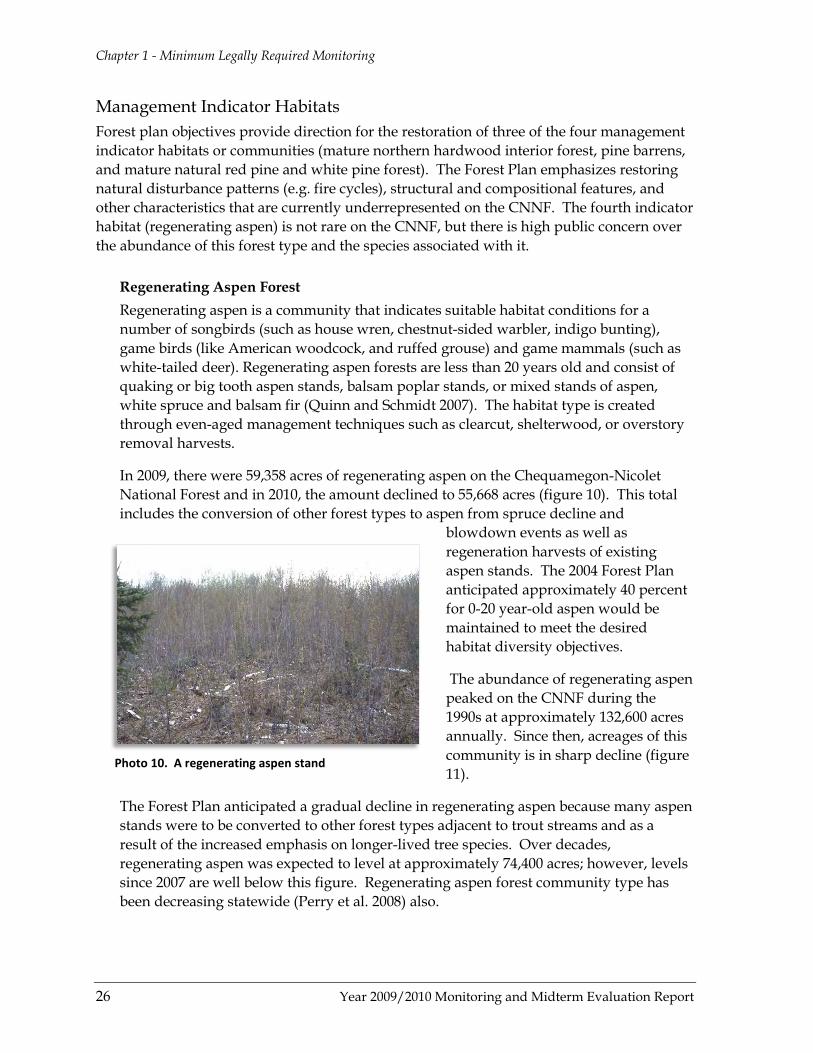
Chapter 1 - Minimum Legally Required Monitoring
26 Year 2009/2010 Monitoring and Midterm Evaluation Report
Management Indicator Habitats Forest plan objectives provide direction for the restoration of three of the four management indicator habitats or communities (mature northern hardwood interior forest, pine barrens, and mature natural red pine and white pine forest). The Forest Plan emphasizes restoring natural disturbance patterns (e.g. fire cycles), structural and compositional features, and other characteristics that are currently underrepresented on the CNNF. The fourth indicator habitat (regenerating aspen) is not rare on the CNNF, but there is high public concern over the abundance of this forest type and the species associated with it.
Regenerating Aspen Forest Regenerating aspen is a community that indicates suitable habitat conditions for a number of songbirds (such as house wren, chestnut-sided warbler, indigo bunting), game birds (like American woodcock, and ruffed grouse) and game mammals (such as white-tailed deer). Regenerating aspen forests are less than 20 years old and consist of quaking or big tooth aspen stands, balsam poplar stands, or mixed stands of aspen, white spruce and balsam fir (Quinn and Schmidt 2007). The habitat type is created through even-aged management techniques such as clearcut, shelterwood, or overstory removal harvests.
In 2009, there were 59,358 acres of regenerating aspen on the Chequamegon-Nicolet National Forest and in 2010, the amount declined to 55,668 acres (figure 10). This total includes the conversion of other forest types to aspen from spruce decline and
blowdown events as well as regeneration harvests of existing aspen stands. The 2004 Forest Plan anticipated approximately 40 percent for 0-20 year-old aspen would be maintained to meet the desired habitat diversity objectives.
The abundance of regenerating aspen peaked on the CNNF during the 1990s at approximately 132,600 acres annually. Since then, acreages of this community is in sharp decline (figure 11).
The Forest Plan anticipated a gradual decline in regenerating aspen because many aspen stands were to be converted to other forest types adjacent to trout streams and as a result of the increased emphasis on longer-lived tree species. Over decades, regenerating aspen was expected to level at approximately 74,400 acres; however, levels since 2007 are well below this figure. Regenerating aspen forest community type has been decreasing statewide (Perry et al. 2008) also.
Photo 10. A regenerating aspen stand

Chapter 1 - Minimum Legally Required Monitoring
Year 2009/2010 Monitoring and Midterm Evaluation Report 27
Figure 10. Acres of regenerating aspen on the Chequamegon-Nicolet National Forest from 2004-2010.
Figure 11. Average annual acres, by decade, of regenerating aspen on the Chequamegon-Nicolet National Forest from 1950-2010.

Chapter 1 - Minimum Legally Required Monitoring
28 Year 2009/2010 Monitoring and Midterm Evaluation Report
From a peak of 132,598 thousand acres in 1990, regenerating aspen forest has dramatically declined, becoming more heavily skewed to mature and overmature stands. Levels in 1986 were nearly 37 percent of the total, and were closer to the 2004 Forest Plan desired age diversity (40 percent) than the current condition of 16 percent. This trend is expected to continue into the near future. If rates of aspen harvest do not increase substantially over the next decade, the regenerating aspen forest community type on the CNNF will be even lower.
Mature Northern Hardwood Interior Forest
During the Forest Plan revision, it was determined that the forest landscape pattern was “outside the estimated range of variation.” Past management emphasized early successional forest types (e.g., aspen, balsam fire, paper birch) and edge habitat resulted in a landscape pattern of small patches (early successional forest types, openings, etc). Large patches of mature northern hardwood interior forest were generally lacking, and species that were once common such as hemlock and yellow birch were rare. Once uncommon species like aspen had become abundant and widespread. The estimated range of variation for both size and distribution of patches and the mix of forest types and successional stages includes larger northern hardwood interior patches sizes and a more connected landscape between these patches.
Objectives of the Forest Plan emphasize areas that maintain interior forest conditions, restore large patches across the landscape, increase mid- to late-successional forest habitat, such as northern hardwood, yellow birch, hemlock, basswood and oak forest types and decrease interspersion of late-successional habitat with early successional habitat or aspen, birch, and balsam fir forest types. Thus, mature northern hardwood interior forest is an indicator of not only habitat but also landscape pattern.
Mature northern hardwood interior forest and associated patches were defined using the following criteria (Quinn and Lopez 2006):
♦ Forest stands typed as mixed northern hardwoods-hemlock, sugar maple-black cherry, sugar maple-northern red oak, sugar maple-yellow birch, sugar maple-basswood, black cherry-white ash/yellow poplar, red maple, sugar maple, beech, and mixed hardwoods greater than 80 years old and greater than 90 meters from a forest edge.
♦ Other forest types (including lakes) less than 5 acres are considered internal to the patch; larger forest types are considered independent patches.
Photo 11. Mature northern hardwood interior forest
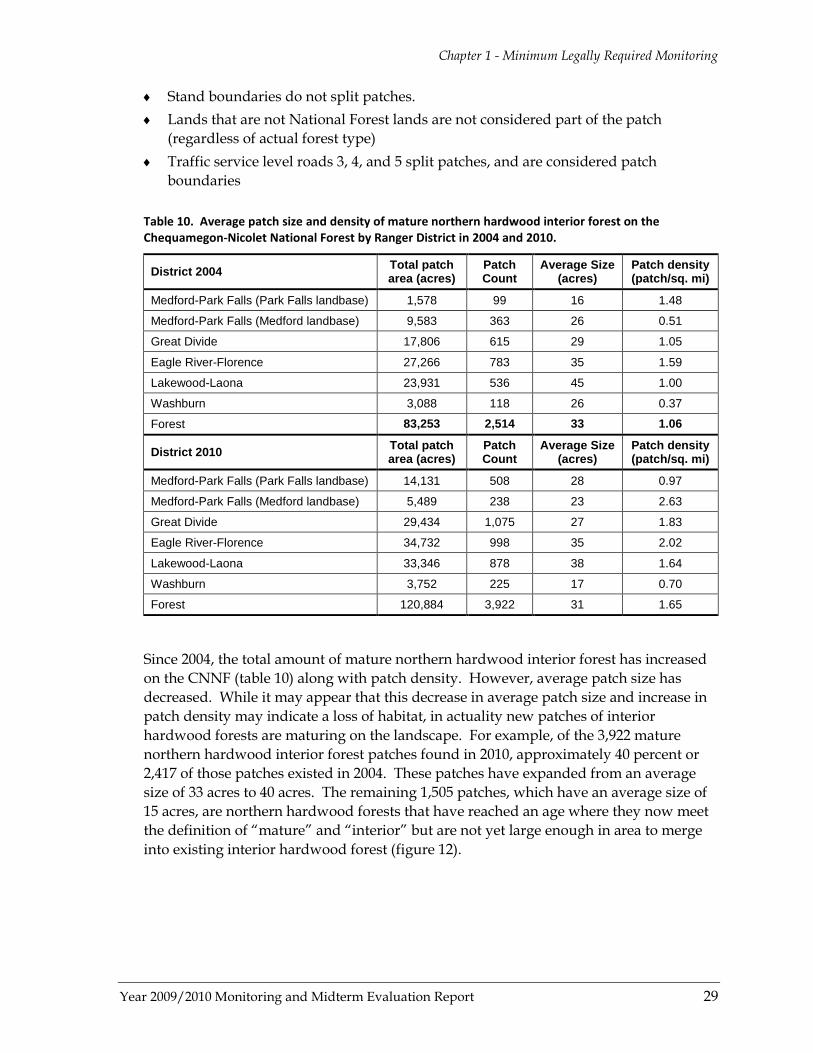
Chapter 1 - Minimum Legally Required Monitoring
Year 2009/2010 Monitoring and Midterm Evaluation Report 29
♦ Stand boundaries do not split patches. ♦ Lands that are not National Forest lands are not considered part of the patch
(regardless of actual forest type) ♦ Traffic service level roads 3, 4, and 5 split patches, and are considered patch
boundaries
Table 10. Average patch size and density of mature northern hardwood interior forest on the Chequamegon-Nicolet National Forest by Ranger District in 2004 and 2010.
District 2004 Total patch area (acres)
Patch Count
Average Size (acres)
Patch density (patch/sq. mi)
Medford-Park Falls (Park Falls landbase) 1,578 99 16 1.48
Medford-Park Falls (Medford landbase) 9,583 363 26 0.51
Great Divide 17,806 615 29 1.05
Eagle River-Florence 27,266 783 35 1.59
Lakewood-Laona 23,931 536 45 1.00
Washburn 3,088 118 26 0.37
Forest 83,253 2,514 33 1.06
District 2010 Total patch area (acres)
Patch Count
Average Size (acres)
Patch density (patch/sq. mi)
Medford-Park Falls (Park Falls landbase) 14,131 508 28 0.97
Medford-Park Falls (Medford landbase) 5,489 238 23 2.63
Great Divide 29,434 1,075 27 1.83
Eagle River-Florence 34,732 998 35 2.02
Lakewood-Laona 33,346 878 38 1.64
Washburn 3,752 225 17 0.70
Forest 120,884 3,922 31 1.65
Since 2004, the total amount of mature northern hardwood interior forest has increased on the CNNF (table 10) along with patch density. However, average patch size has decreased. While it may appear that this decrease in average patch size and increase in patch density may indicate a loss of habitat, in actuality new patches of interior hardwood forests are maturing on the landscape. For example, of the 3,922 mature northern hardwood interior forest patches found in 2010, approximately 40 percent or 2,417 of those patches existed in 2004. These patches have expanded from an average size of 33 acres to 40 acres. The remaining 1,505 patches, which have an average size of 15 acres, are northern hardwood forests that have reached an age where they now meet the definition of “mature” and “interior” but are not yet large enough in area to merge into existing interior hardwood forest (figure 12).

Chapter 1 - Minimum Legally Required Monitoring
30 Year 2009/2010 Monitoring and Midterm Evaluation Report
Figure 12. Illustration of the expansion of patches of mature northern hardwood interior forest (MNHIF) from 2004 to 2010. Shaded areas represent portions of forested stands that met the MNHIF criteria in 2004. Crosshatched areas are portions of stands that met those same criteria in 2010.
In 2010, the Chequamegon-Nicolet National Forest had approximately 120,884 acres of mature northern hardwood interior forest, with the majority of these acres occurring in management area 2 (figure 13). Overall, this represents an increase of 30 percent since 2004 (84,253 acres); the increase in representation is largely due to continued maturation of hardwood stands, with or without management. This increase was anticipated during the Forest Plan revision process because many of the hardwood stands were on the cusp of turning 80 years old. As a result, the CNNF is on target to reach 140,000 acres of mature northern hardwood interior forest projected in the Forest Plan within 20 years (Forest Plan FEIS, p. 3-102).
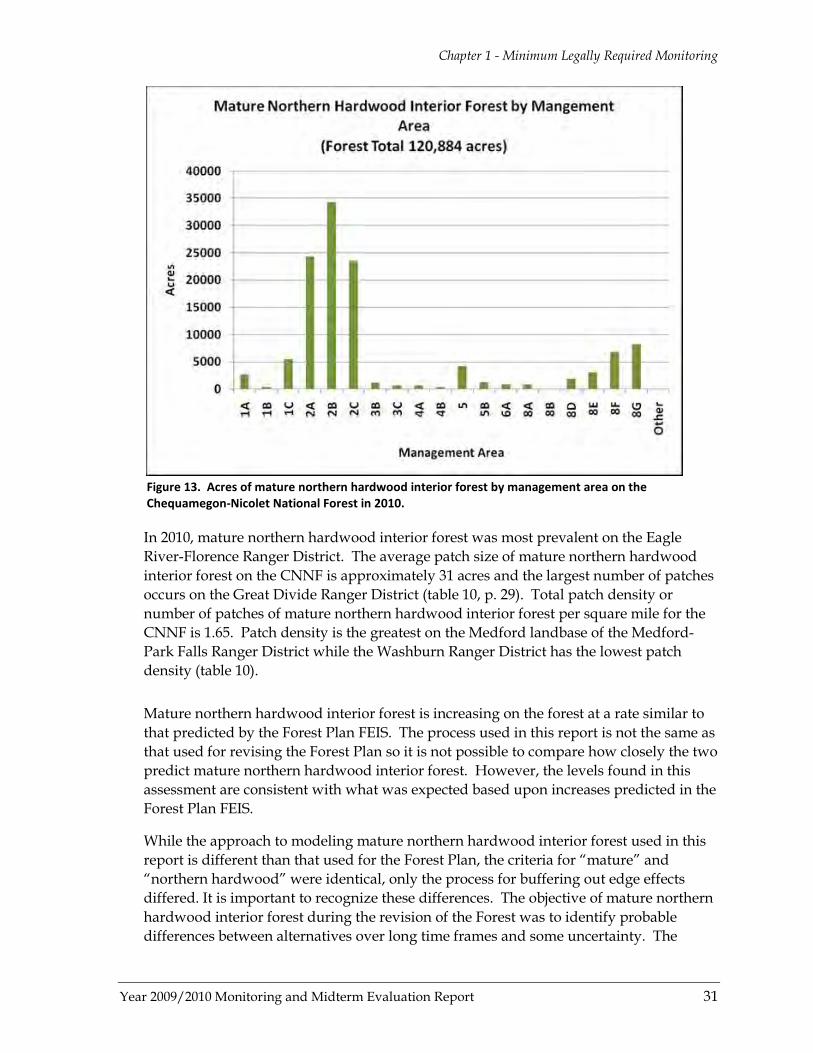
Chapter 1 - Minimum Legally Required Monitoring
Year 2009/2010 Monitoring and Midterm Evaluation Report 31
Figure 13. Acres of mature northern hardwood interior forest by management area on the Chequamegon-Nicolet National Forest in 2010.
In 2010, mature northern hardwood interior forest was most prevalent on the Eagle River-Florence Ranger District. The average patch size of mature northern hardwood interior forest on the CNNF is approximately 31 acres and the largest number of patches occurs on the Great Divide Ranger District (table 10, p. 29). Total patch density or number of patches of mature northern hardwood interior forest per square mile for the CNNF is 1.65. Patch density is the greatest on the Medford landbase of the Medford-Park Falls Ranger District while the Washburn Ranger District has the lowest patch density (table 10).
Mature northern hardwood interior forest is increasing on the forest at a rate similar to that predicted by the Forest Plan FEIS. The process used in this report is not the same as that used for revising the Forest Plan so it is not possible to compare how closely the two predict mature northern hardwood interior forest. However, the levels found in this assessment are consistent with what was expected based upon increases predicted in the Forest Plan FEIS.
While the approach to modeling mature northern hardwood interior forest used in this report is different than that used for the Forest Plan, the criteria for “mature” and “northern hardwood” were identical, only the process for buffering out edge effects differed. It is important to recognize these differences. The objective of mature northern hardwood interior forest during the revision of the Forest was to identify probable differences between alternatives over long time frames and some uncertainty. The
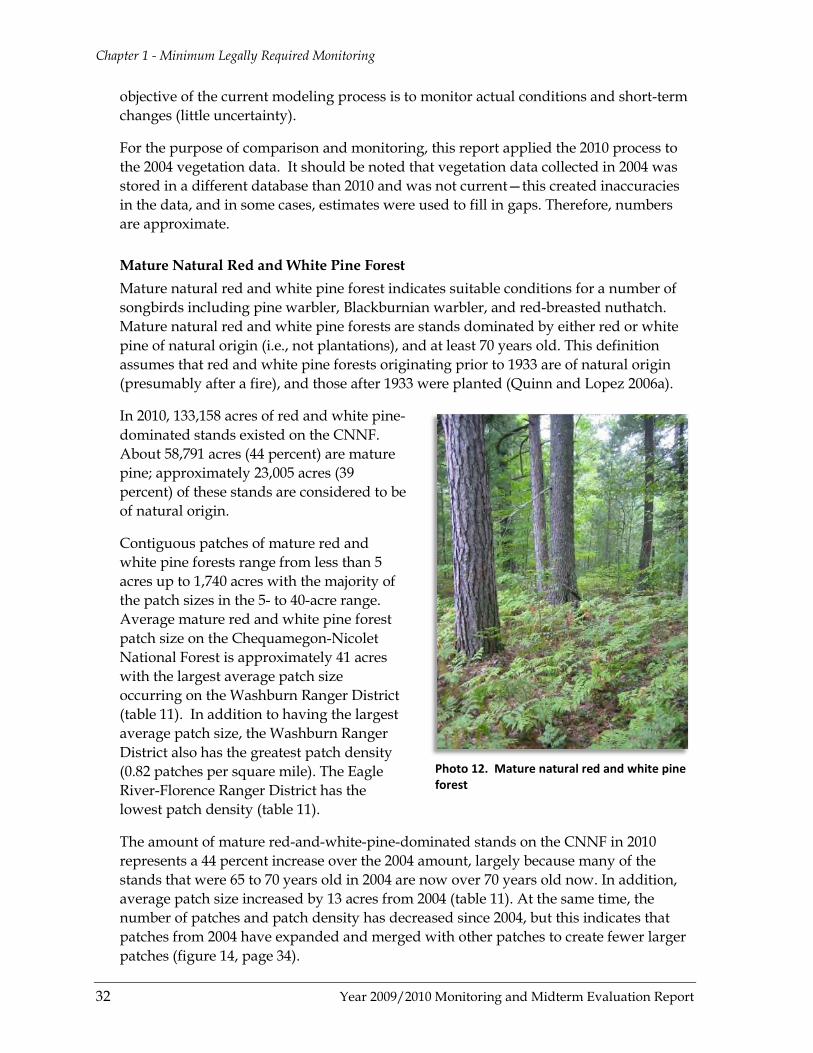
Chapter 1 - Minimum Legally Required Monitoring
32 Year 2009/2010 Monitoring and Midterm Evaluation Report
objective of the current modeling process is to monitor actual conditions and short-term changes (little uncertainty).
For the purpose of comparison and monitoring, this report applied the 2010 process to the 2004 vegetation data. It should be noted that vegetation data collected in 2004 was stored in a different database than 2010 and was not current—this created inaccuracies in the data, and in some cases, estimates were used to fill in gaps. Therefore, numbers are approximate.
Mature Natural Red and White Pine Forest Mature natural red and white pine forest indicates suitable conditions for a number of songbirds including pine warbler, Blackburnian warbler, and red-breasted nuthatch. Mature natural red and white pine forests are stands dominated by either red or white pine of natural origin (i.e., not plantations), and at least 70 years old. This definition assumes that red and white pine forests originating prior to 1933 are of natural origin (presumably after a fire), and those after 1933 were planted (Quinn and Lopez 2006a).
In 2010, 133,158 acres of red and white pine-dominated stands existed on the CNNF. About 58,791 acres (44 percent) are mature pine; approximately 23,005 acres (39 percent) of these stands are considered to be of natural origin.
Contiguous patches of mature red and white pine forests range from less than 5 acres up to 1,740 acres with the majority of the patch sizes in the 5- to 40-acre range. Average mature red and white pine forest patch size on the Chequamegon-Nicolet National Forest is approximately 41 acres with the largest average patch size occurring on the Washburn Ranger District (table 11). In addition to having the largest average patch size, the Washburn Ranger District also has the greatest patch density (0.82 patches per square mile). The Eagle River-Florence Ranger District has the lowest patch density (table 11).
The amount of mature red-and-white-pine-dominated stands on the CNNF in 2010 represents a 44 percent increase over the 2004 amount, largely because many of the stands that were 65 to 70 years old in 2004 are now over 70 years old now. In addition, average patch size increased by 13 acres from 2004 (table 11). At the same time, the number of patches and patch density has decreased since 2004, but this indicates that patches from 2004 have expanded and merged with other patches to create fewer larger patches (figure 14, page 34).
Photo 12. Mature natural red and white pine forest
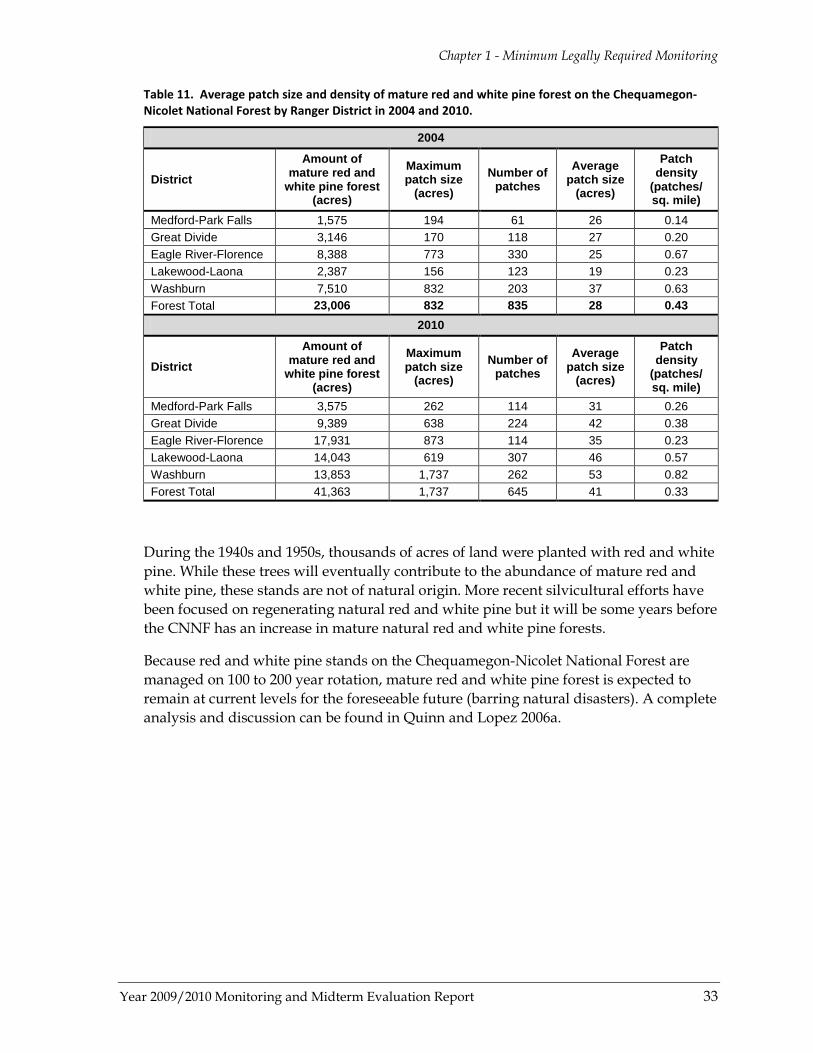
Chapter 1 - Minimum Legally Required Monitoring
Year 2009/2010 Monitoring and Midterm Evaluation Report 33
Table 11. Average patch size and density of mature red and white pine forest on the Chequamegon-Nicolet National Forest by Ranger District in 2004 and 2010.
2004
District
Amount of mature red and
white pine forest (acres)
Maximum patch size
(acres) Number of
patches Average
patch size (acres)
Patch density
(patches/ sq. mile)
Medford-Park Falls 1,575 194 61 26 0.14 Great Divide 3,146 170 118 27 0.20 Eagle River-Florence 8,388 773 330 25 0.67 Lakewood-Laona 2,387 156 123 19 0.23 Washburn 7,510 832 203 37 0.63 Forest Total 23,006 832 835 28 0.43
2010
District Amount of
mature red and white pine forest
(acres)
Maximum patch size
(acres) Number of
patches Average
patch size (acres)
Patch density
(patches/ sq. mile)
Medford-Park Falls 3,575 262 114 31 0.26 Great Divide 9,389 638 224 42 0.38 Eagle River-Florence 17,931 873 114 35 0.23 Lakewood-Laona 14,043 619 307 46 0.57 Washburn 13,853 1,737 262 53 0.82 Forest Total 41,363 1,737 645 41 0.33
During the 1940s and 1950s, thousands of acres of land were planted with red and white pine. While these trees will eventually contribute to the abundance of mature red and white pine, these stands are not of natural origin. More recent silvicultural efforts have been focused on regenerating natural red and white pine but it will be some years before the CNNF has an increase in mature natural red and white pine forests.
Because red and white pine stands on the Chequamegon-Nicolet National Forest are managed on 100 to 200 year rotation, mature red and white pine forest is expected to remain at current levels for the foreseeable future (barring natural disasters). A complete analysis and discussion can be found in Quinn and Lopez 2006a.
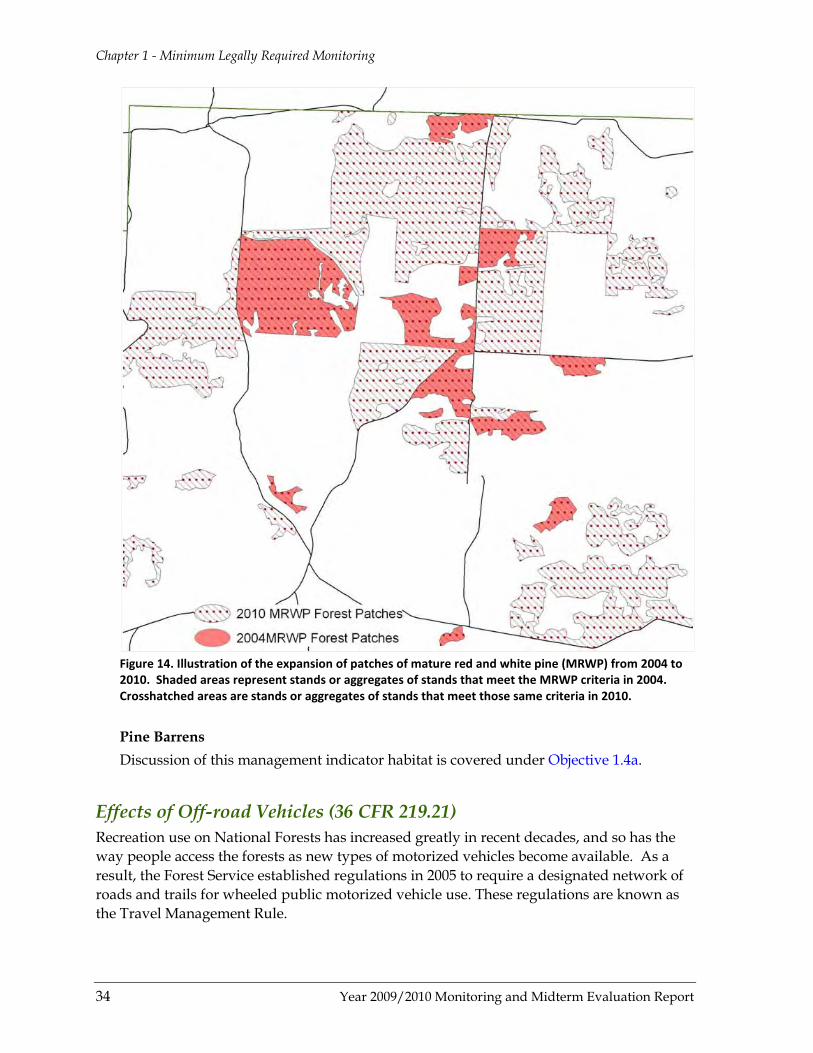
Chapter 1 - Minimum Legally Required Monitoring
34 Year 2009/2010 Monitoring and Midterm Evaluation Report
Figure 14. Illustration of the expansion of patches of mature red and white pine (MRWP) from 2004 to 2010. Shaded areas represent stands or aggregates of stands that meet the MRWP criteria in 2004. Crosshatched areas are stands or aggregates of stands that meet those same criteria in 2010.
Pine Barrens Discussion of this management indicator habitat is covered under Objective 1.4a.
Effects of Off-road Vehicles (36 CFR 219.21) Recreation use on National Forests has increased greatly in recent decades, and so has the way people access the forests as new types of motorized vehicles become available. As a result, the Forest Service established regulations in 2005 to require a designated network of roads and trails for wheeled public motorized vehicle use. These regulations are known as the Travel Management Rule.

Chapter 1 - Minimum Legally Required Monitoring
Year 2009/2010 Monitoring and Midterm Evaluation Report 35
In 2006, the Chequamegon-Nicolet National Forest began the process of designating this road and trail network by gathering input and comments from the public, which resulted in the release of the CNNF’s first Motor Vehicle Use Map (MVUM) in January of 2009.
The Motor Vehicle Use Map informs the public what roads and trails are available for public motorized travel, what type of wheeled motor vehicle can be used, and the season of use for travel on National Forest System roads and trails. The MVUM is a dynamic document that is updated annually. The second MVUM became available in August of 2010.
Prior to the Forest Plan, off-road vehicles could travel cross-country (i.e., off of established trails, roads or routes) unless specifically prohibited by a Forest closure order on the Chequamegon landbase. With the Forest Plan revision, subsequent use restriction order (Order No. R913-08-02), and the Travel Management Rule, motorized cross-country travel is no longer permitted.
While the cross-country travel restriction and the designation of a network of roads and trails for public motor vehicle use on the CNNF has reduced negative impacts to nonmotorized recreation experiences and natural resources, impacts occur and continue to be monitored. Monitoring in 2009 and 2010 focused on the effects of off-road vehicles and the spread of nonnative invasive species along ATV trails.
Surveys for nonnative invasive species in 2009 and 2010 included a proposed ATV route near May Lake on the Eagle River-Florence Ranger District; a 3-mile section of the Tuscobia Trail on the southeastern portion of the Glidden unit on the Great Divide Ranger District; and a 14-mile portion of the Dead Horse trail. The following trailheads on the Great Divide Ranger District: Grassy Trailhead, Camp Loretta Trailhead, Day Road parking area (off County Road GG), and the Dead Horse parking area off of Highway 77. A sampling of the 310 miles of ATV system trails on the CNNF indicates that approximately 5 percent, or 16 miles of these trails, are infested with nonnative invasive species (table 12). Observations from these surveys indicate that nonnative invasive species infestations along ATV trail systems tend to be larger at road crossings.
Table 12. Sampling of Chequamegon-Nicolet National Forest system trails (does not include all of Forest trail system). Numbers represent infestations as of FY 2009.
Trail system name Length of trail system (miles)
Miles of trail infested
Percent of trail infested
Acres of trailside infested*
Deadhorse – Great Divide 56 0.8 1.4 3.0 Flambeau – Park Falls 73 3.4 4.6 12.0 Perkinstown - Medford 20 0.1 0.4 0.03 Pipeline 4x4 Challenge-Lakewood 17 5.4 32.0 20.0
Washburn ATV North of US 2 55 1.3 2.4 4.7 * 1 mi = 3.63 acres of road right-of-way. Used as an estimate of infested area because GIS boundaries of nonnative invasive
species sites often extend beyond infestations.
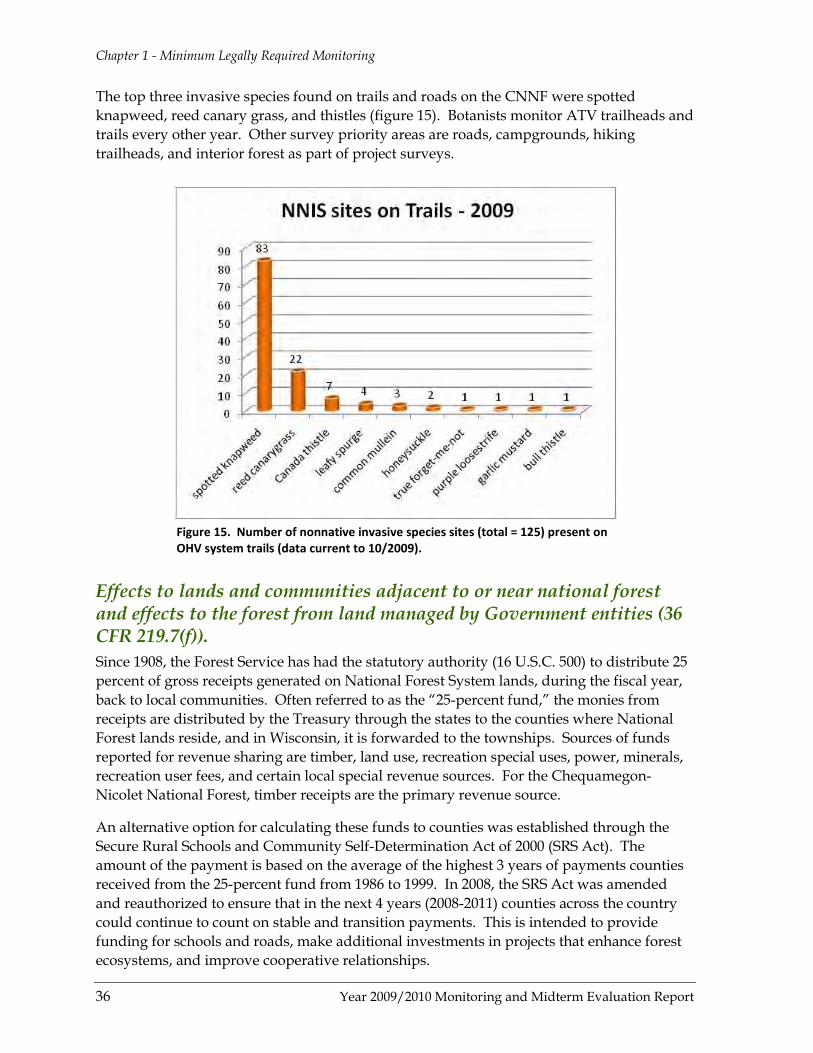
Chapter 1 - Minimum Legally Required Monitoring
36 Year 2009/2010 Monitoring and Midterm Evaluation Report
The top three invasive species found on trails and roads on the CNNF were spotted knapweed, reed canary grass, and thistles (figure 15). Botanists monitor ATV trailheads and trails every other year. Other survey priority areas are roads, campgrounds, hiking trailheads, and interior forest as part of project surveys.
Figure 15. Number of nonnative invasive species sites (total = 125) present on OHV system trails (data current to 10/2009).
Effects to lands and communities adjacent to or near national forest and effects to the forest from land managed by Government entities (36 CFR 219.7(f)). Since 1908, the Forest Service has had the statutory authority (16 U.S.C. 500) to distribute 25 percent of gross receipts generated on National Forest System lands, during the fiscal year, back to local communities. Often referred to as the “25-percent fund,” the monies from receipts are distributed by the Treasury through the states to the counties where National Forest lands reside, and in Wisconsin, it is forwarded to the townships. Sources of funds reported for revenue sharing are timber, land use, recreation special uses, power, minerals, recreation user fees, and certain local special revenue sources. For the Chequamegon-Nicolet National Forest, timber receipts are the primary revenue source.
An alternative option for calculating these funds to counties was established through the Secure Rural Schools and Community Self-Determination Act of 2000 (SRS Act). The amount of the payment is based on the average of the highest 3 years of payments counties received from the 25-percent fund from 1986 to 1999. In 2008, the SRS Act was amended and reauthorized to ensure that in the next 4 years (2008-2011) counties across the country could continue to count on stable and transition payments. This is intended to provide funding for schools and roads, make additional investments in projects that enhance forest ecosystems, and improve cooperative relationships.
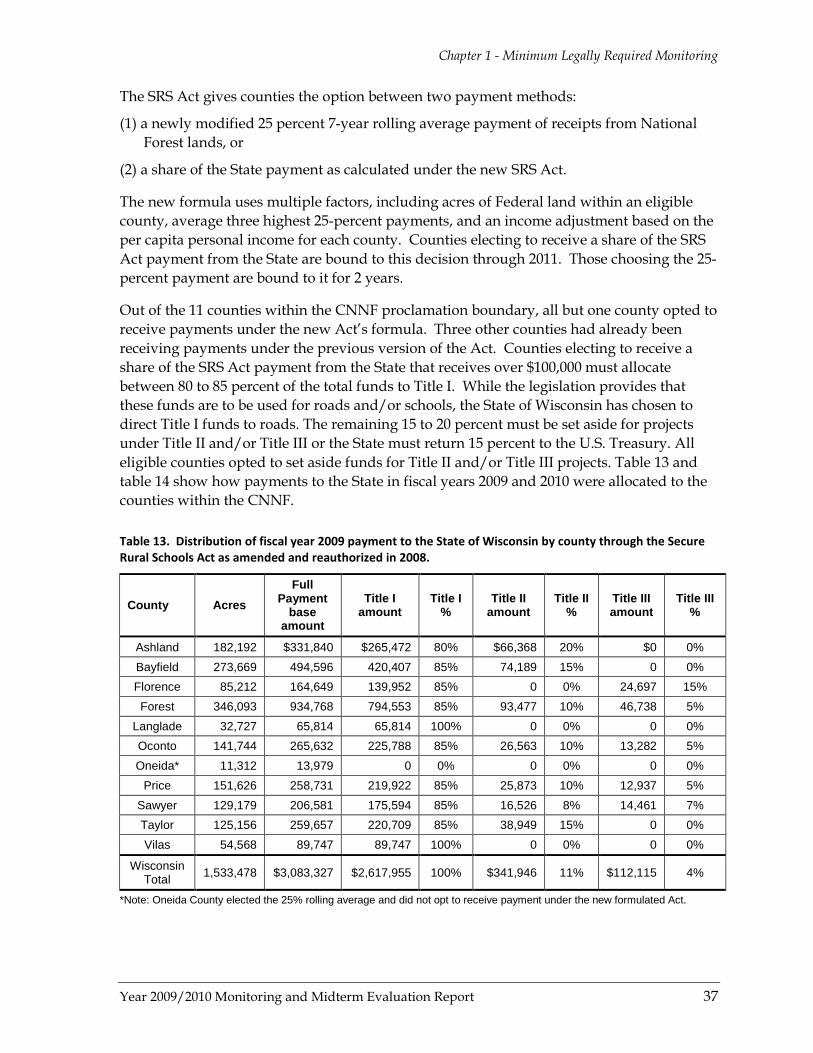
Chapter 1 - Minimum Legally Required Monitoring
Year 2009/2010 Monitoring and Midterm Evaluation Report 37
The SRS Act gives counties the option between two payment methods:
(1) a newly modified 25 percent 7-year rolling average payment of receipts from National Forest lands, or
(2) a share of the State payment as calculated under the new SRS Act.
The new formula uses multiple factors, including acres of Federal land within an eligible county, average three highest 25-percent payments, and an income adjustment based on the per capita personal income for each county. Counties electing to receive a share of the SRS Act payment from the State are bound to this decision through 2011. Those choosing the 25-percent payment are bound to it for 2 years.
Out of the 11 counties within the CNNF proclamation boundary, all but one county opted to receive payments under the new Act’s formula. Three other counties had already been receiving payments under the previous version of the Act. Counties electing to receive a share of the SRS Act payment from the State that receives over $100,000 must allocate between 80 to 85 percent of the total funds to Title I. While the legislation provides that these funds are to be used for roads and/or schools, the State of Wisconsin has chosen to direct Title I funds to roads. The remaining 15 to 20 percent must be set aside for projects under Title II and/or Title III or the State must return 15 percent to the U.S. Treasury. All eligible counties opted to set aside funds for Title II and/or Title III projects. Table 13 and table 14 show how payments to the State in fiscal years 2009 and 2010 were allocated to the counties within the CNNF.
Table 13. Distribution of fiscal year 2009 payment to the State of Wisconsin by county through the Secure Rural Schools Act as amended and reauthorized in 2008.
County Acres Full
Payment base
amount
Title I amount
Title I %
Title II amount
Title II %
Title III amount
Title III %
Ashland 182,192 $331,840 $265,472 80% $66,368 20% $0 0% Bayfield 273,669 494,596 420,407 85% 74,189 15% 0 0% Florence 85,212 164,649 139,952 85% 0 0% 24,697 15% Forest 346,093 934,768 794,553 85% 93,477 10% 46,738 5%
Langlade 32,727 65,814 65,814 100% 0 0% 0 0% Oconto 141,744 265,632 225,788 85% 26,563 10% 13,282 5% Oneida* 11,312 13,979 0 0% 0 0% 0 0%
Price 151,626 258,731 219,922 85% 25,873 10% 12,937 5% Sawyer 129,179 206,581 175,594 85% 16,526 8% 14,461 7% Taylor 125,156 259,657 220,709 85% 38,949 15% 0 0% Vilas 54,568 89,747 89,747 100% 0 0% 0 0%
Wisconsin Total 1,533,478 $3,083,327 $2,617,955 100% $341,946 11% $112,115 4%
*Note: Oneida County elected the 25% rolling average and did not opt to receive payment under the new formulated Act.

Chapter 1 - Minimum Legally Required Monitoring
38 Year 2009/2010 Monitoring and Midterm Evaluation Report
Table 14. Distribution of fiscal year 2010 payment to the State of Wisconsin by county through the Secure Rural Schools Act as amended and reauthorized in 2008.
County Acres Full Payment Base Amount
Title I Amount
Title I %
Title II Amount
Title II %
Title III Amount
Title III %
Ashland 182,192 $296,583 $252,095 85% $44,487 15% $0 0%
Bayfield 273,669 431,408 366,696 85% 64,711 15% 0 0%
Florence 85,212 163,082 138,619 85% 24,462 15% 0 0%
Forest 346,093 828,567 704,282 85% 66,285 8% 58,000 7%
Langlade 32,727 56,640 56,640 100% 0 0% 0 0%
Oconto 141,744 221,566 188,331 85% 22,157 10% 11,078 5%
Oneida* 11,312 13,559 0 0% 0 0% 0 0%
Price 151,626 232,469 197,598 85% 34,870 15% 0 0%
Sawyer 129,179 211,446 179,729 85% 16,916 8% 14,801 7%
Taylor 125,156 231,520 196,792 85% 34,728 15% 0 0%
Vilas 54,568 84,971 84,971 100% 0 0% 0 0% Wisconsin Total 1,533,478 $2,771,811 $2,365,756 85% $308,617 11% $83,879 3%
*Note: Oneida County elected the 25% rolling average and did not opt to receive payment under the new formulated Act.
In fiscal years 2009 and 2010, there was a trend of decreasing use of Title III funds and an increase in use of Title II funds. Title III funds are used only to carry out the Firewise Communities program, which provides reimbursement for emergency services paid for by counties and performed on Federal land (e.g., search and rescue or firefighting), and development of community wildfire protection plans. Title II funds are used for the protection, restoration, and enhancement of fish and wildlife habitat, and other resource objectives consistent with the Secure Rural Schools Act on Federal land and on non-Federal land where projects would benefit the resources on Federal land.
Counties electing to set aside funds for Title II projects work with the Forest Service to establish Resource Advisory Committees (RAC’s) that recommend how Title II funds should be spent. Title II funds may be used for the purpose of making additional investments and creating additional employment opportunities through projects that improve the maintenance of existing infrastructure, implement stewardship objectives that enhance forest ecosystems, and restore and improve land health and water quality. Projects are to have broad-based support with objectives that may include, but are not limited to:
♦ road, trail, and infrastructure maintenance or obliteration; ♦ soil productivity improvement; ♦ improvements in forest ecosystem health; ♦ watershed restoration and maintenance; ♦ restoration, maintenance and improvement of wildlife and fish habitat; ♦ control of noxious and exotic weeds; and ♦ reestablishment of native species.

Chapter 1 - Minimum Legally Required Monitoring
Year 2009/2010 Monitoring and Midterm Evaluation Report 39
At least 50 percent of all Title II funds must be used for projects that are primarily dedicated to road maintenance, decommissioning, or obliteration, or restoration of streams and watersheds. The authority to initiate Title II projects terminated on September 30, 2011. Funds that are not spent or obligated by September 30, 2012, will be transferred to the U.S. Treasury. More information on elections for payments to the states can be found at http://www.fs.fed.us/srs/.
In 2009, two Resource Advisory Committees were formed, one on the Nicolet landbase and one on the Chequamegon landbase. The Nicolet Resource Advisory Committee consists of Forest, Oconto and Florence Counties. The Chequamegon resource advisory committee consists of Ashland, Bayfield, Price, Sawyer, and Taylor Counties. The 15 member committees represent a variety of interests ranging from timber production, recreation use, environmental organizations, to county or state officials.
In 2010, each Resource Advisory Committee solicited projects from the public and the Forest Service to be paid for with Title II funding. These funds (table 15) can be used on projects located on National Forests or that directly benefit National Forest lands. They must have broad-based support, and help foster collaborative relationships. Projects are reviewed and recommended by Resource Advisory Committees but are approved by the Forest Supervisor.
Revenues paid out to the state of Wisconsin for distribution to local counties during fiscal year 2009 totaled $3,085,994.04 and in fiscal year 2010 totaled $2,771,810.87 (figure 16, next page).
Table 15. Funds currently available for projects recommended by the Chequamegon and Nicolet Resource Advisory Committees from 2008 and 2009 Title II monies.
County 2008 Projects 2009 Projects Total
Ashland $ 57,267 $ 66,368 $ 123,635 Bayfield 83,434 74,189 157,623 Price 28,596 25,873 54,469 Sawyer 20,130 16,526 36,656 Taylor 43,245 38,949 82,194 Forest 102,138 94,477 196,615 Oconto 29,937 26,563 56,500 TOTAL $364,747 $342,945 $707,692

Chapter 1 - Minimum Legally Required Monitoring
40 Year 2009/2010 Monitoring and Midterm Evaluation Report
Figure 16. Total revenues paid by the Chequamegon-Nicolet National Forest to the State of Wisconsin during fiscal years 2004 to 2010.
Comparison of Projected and Actual Outputs and Services (36 CFR 219.12(k)(1)) One of the methods used by the Chequamegon-Nicolet National Forest to move the land towards the desired future conditions outlined in the Forest Plan is to manage the vegetation (e.g. plant trees, harvest timber, prescribe burns). During the Forest Plan revision process, vegetation treatments to achieve the desired species composition, age class distribution, and forestwide goals and objectives were identified (see table 3-71a in the Forest Plan FEIS). Below is a comparison of the projected outcomes anticipated in the Forest Plan and the actual outcomes for fiscal years 2009 and 2010.
Comparing Projected and Actual Vegetation Treatments Table 16 and figure 17 show the projected and actual acres of vegetation treatments, based on funding level during 2009 and 2010. Roughly 58 and 54 percent of the annual projection was accomplished during fiscal years 2009 and 2010, respectively, with the greatest shortfall coming in the selection and shelterwood treatments. The most acres of vegetation treatments took place in fiscal year 2008, with the lowest in fiscal year 2006 (figure 17).
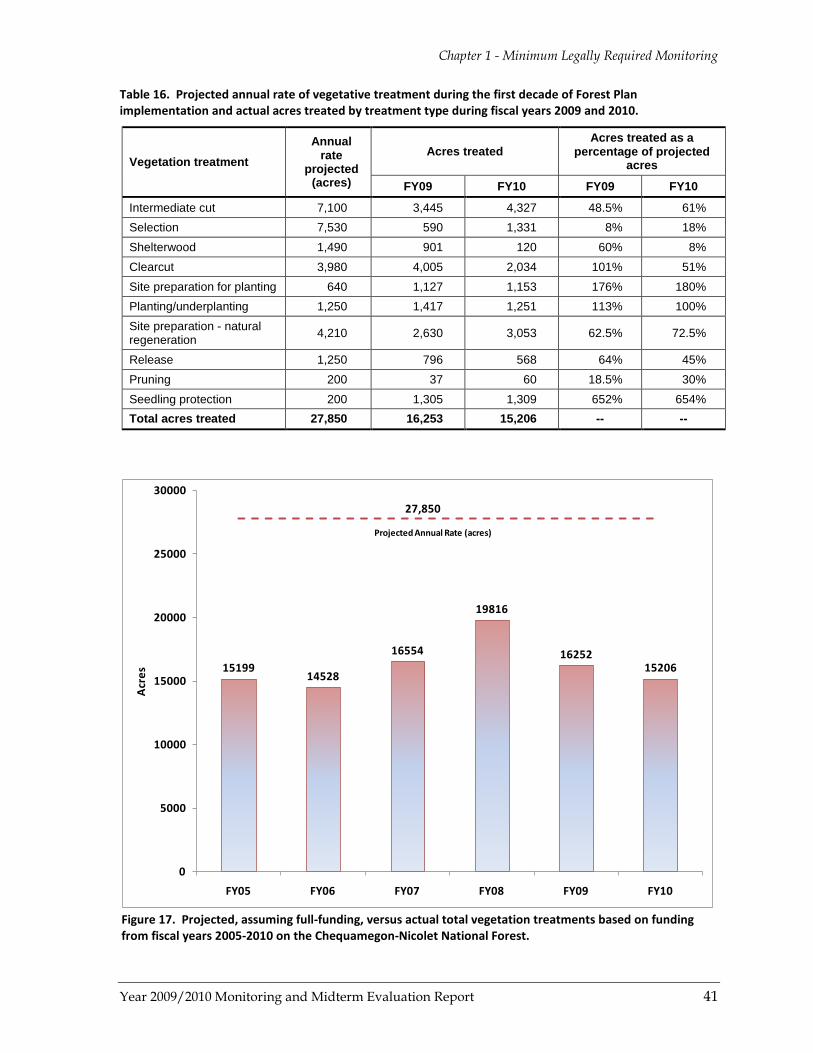
Chapter 1 - Minimum Legally Required Monitoring
Year 2009/2010 Monitoring and Midterm Evaluation Report 41
Table 16. Projected annual rate of vegetative treatment during the first decade of Forest Plan implementation and actual acres treated by treatment type during fiscal years 2009 and 2010.
Vegetation treatment Annual
rate projected
(acres)
Acres treated Acres treated as a
percentage of projected acres
FY09 FY10 FY09 FY10
Intermediate cut 7,100 3,445 4,327 48.5% 61% Selection 7,530 590 1,331 8% 18% Shelterwood 1,490 901 120 60% 8% Clearcut 3,980 4,005 2,034 101% 51% Site preparation for planting 640 1,127 1,153 176% 180% Planting/underplanting 1,250 1,417 1,251 113% 100% Site preparation - natural regeneration 4,210 2,630 3,053 62.5% 72.5%
Release 1,250 796 568 64% 45% Pruning 200 37 60 18.5% 30% Seedling protection 200 1,305 1,309 652% 654% Total acres treated 27,850 16,253 15,206 -- --
Figure 17. Projected, assuming full-funding, versus actual total vegetation treatments based on funding from fiscal years 2005-2010 on the Chequamegon-Nicolet National Forest.
1519914528
16554
19816
1625215206
0
5000
10000
15000
20000
25000
30000
FY05 FY06 FY07 FY08 FY09 FY10
Acr
es
Projected Annual Rate (acres)
27,850
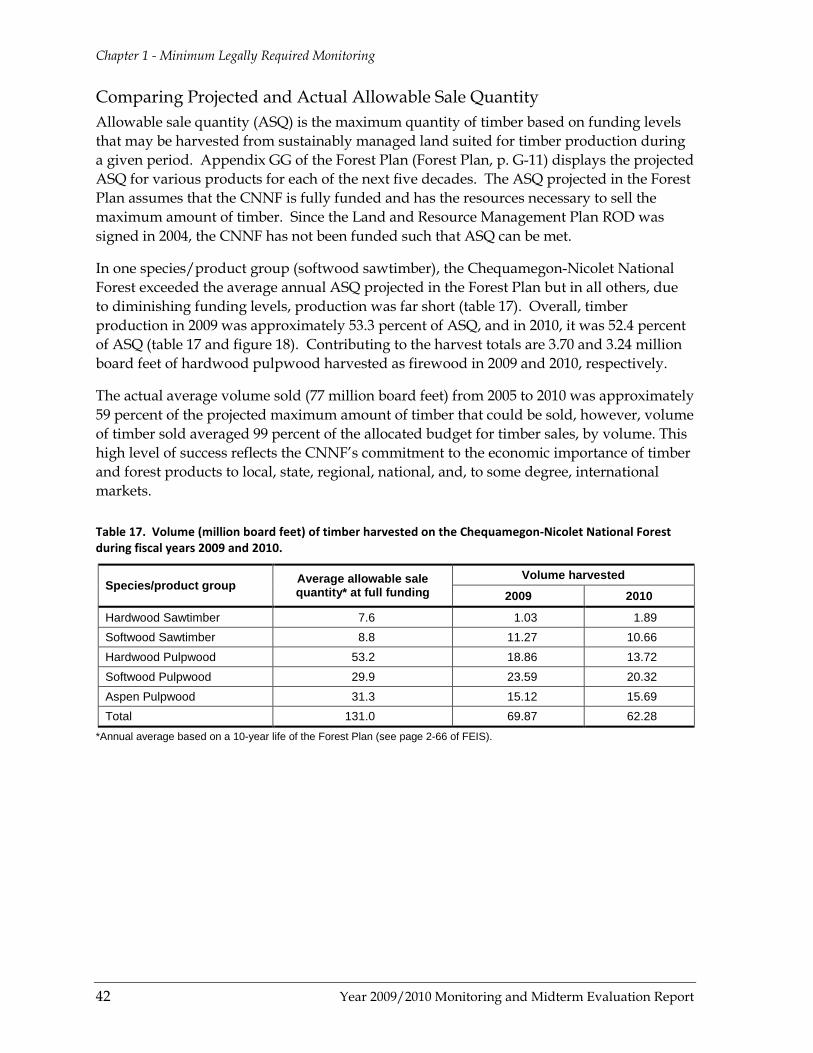
Chapter 1 - Minimum Legally Required Monitoring
42 Year 2009/2010 Monitoring and Midterm Evaluation Report
Comparing Projected and Actual Allowable Sale Quantity Allowable sale quantity (ASQ) is the maximum quantity of timber based on funding levels that may be harvested from sustainably managed land suited for timber production during a given period. Appendix GG of the Forest Plan (Forest Plan, p. G-11) displays the projected ASQ for various products for each of the next five decades. The ASQ projected in the Forest Plan assumes that the CNNF is fully funded and has the resources necessary to sell the maximum amount of timber. Since the Land and Resource Management Plan ROD was signed in 2004, the CNNF has not been funded such that ASQ can be met.
In one species/product group (softwood sawtimber), the Chequamegon-Nicolet National Forest exceeded the average annual ASQ projected in the Forest Plan but in all others, due to diminishing funding levels, production was far short (table 17). Overall, timber production in 2009 was approximately 53.3 percent of ASQ, and in 2010, it was 52.4 percent of ASQ (table 17 and figure 18). Contributing to the harvest totals are 3.70 and 3.24 million board feet of hardwood pulpwood harvested as firewood in 2009 and 2010, respectively.
The actual average volume sold (77 million board feet) from 2005 to 2010 was approximately 59 percent of the projected maximum amount of timber that could be sold, however, volume of timber sold averaged 99 percent of the allocated budget for timber sales, by volume. This high level of success reflects the CNNF’s commitment to the economic importance of timber and forest products to local, state, regional, national, and, to some degree, international markets.
Table 17. Volume (million board feet) of timber harvested on the Chequamegon-Nicolet National Forest during fiscal years 2009 and 2010.
Species/product group Average allowable sale quantity* at full funding
Volume harvested
2009 2010
Hardwood Sawtimber 7.6 1.03 1.89 Softwood Sawtimber 8.8 11.27 10.66 Hardwood Pulpwood 53.2 18.86 13.72 Softwood Pulpwood 29.9 23.59 20.32 Aspen Pulpwood 31.3 15.12 15.69 Total 131.0 69.87 62.28
*Annual average based on a 10-year life of the Forest Plan (see page 2-66 of FEIS).
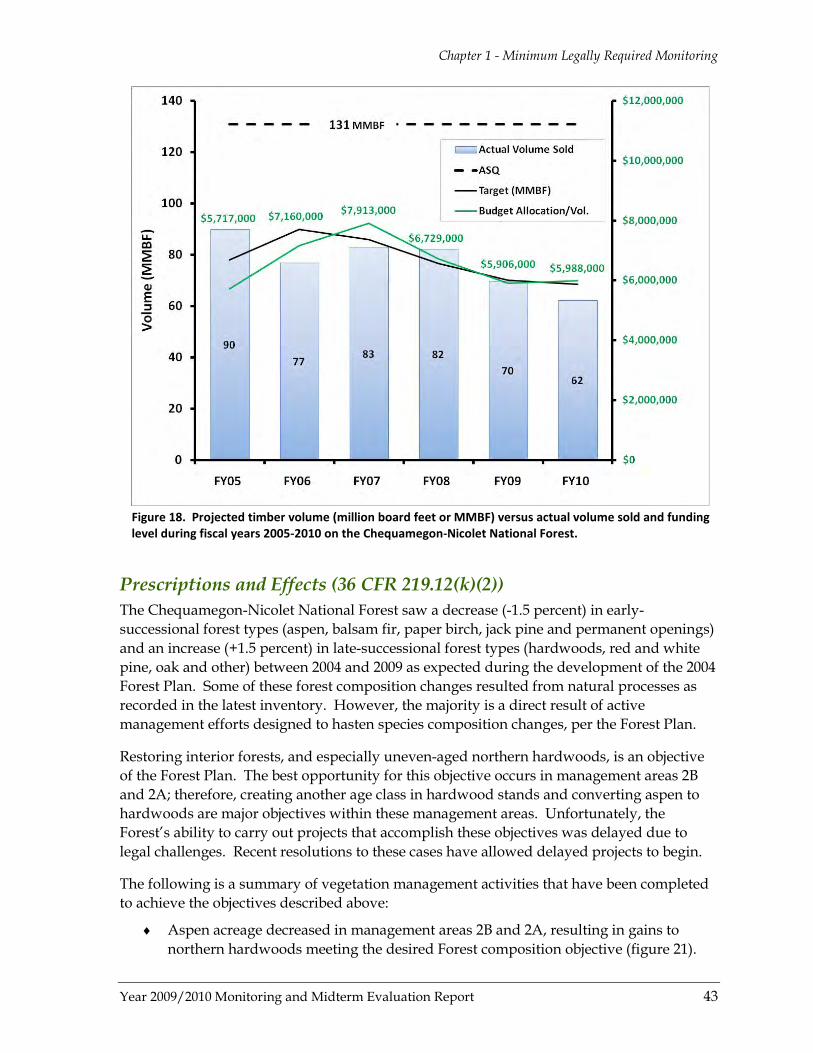
Chapter 1 - Minimum Legally Required Monitoring
Year 2009/2010 Monitoring and Midterm Evaluation Report 43
Figure 18. Projected timber volume (million board feet or MMBF) versus actual volume sold and funding level during fiscal years 2005-2010 on the Chequamegon-Nicolet National Forest.
Prescriptions and Effects (36 CFR 219.12(k)(2)) The Chequamegon-Nicolet National Forest saw a decrease (-1.5 percent) in early-successional forest types (aspen, balsam fir, paper birch, jack pine and permanent openings) and an increase (+1.5 percent) in late-successional forest types (hardwoods, red and white pine, oak and other) between 2004 and 2009 as expected during the development of the 2004 Forest Plan. Some of these forest composition changes resulted from natural processes as recorded in the latest inventory. However, the majority is a direct result of active management efforts designed to hasten species composition changes, per the Forest Plan.
Restoring interior forests, and especially uneven-aged northern hardwoods, is an objective of the Forest Plan. The best opportunity for this objective occurs in management areas 2B and 2A; therefore, creating another age class in hardwood stands and converting aspen to hardwoods are major objectives within these management areas. Unfortunately, the Forest’s ability to carry out projects that accomplish these objectives was delayed due to legal challenges. Recent resolutions to these cases have allowed delayed projects to begin.
The following is a summary of vegetation management activities that have been completed to achieve the objectives described above:
♦ Aspen acreage decreased in management areas 2B and 2A, resulting in gains to northern hardwoods meeting the desired Forest composition objective (figure 21).

Chapter 1 - Minimum Legally Required Monitoring
44 Year 2009/2010 Monitoring and Midterm Evaluation Report
♦ Aspen, paper birch and hardwood acreage decreased in management area 3B resulting in gains for red and white pine, and oak (figure 22).
♦ Red and white pine acreage decreased in management area 1A resulting in gains in hardwoods (figure 20).
♦ The category “other forest types” (including hemlock and spruce) decreased in acreage in management area 2C resulting in gains in aspen and hardwoods. This was largely the result of the spruce decline epidemic.
♦ Paper birch acreage decreased in management area 1B resulting in an oak increase. However, oak is already above desired levels (figure 20).
♦ Jack pine and paper birch acreage decreased in management area 4B resulting in an increase in aspen, oak, and hardwood. However, aspen is already above desired levels (figure 23).
♦ Aspen acreage decreased in management area 4C resulting in an increase in oak (figure 23). Many of the aspen stands were mixed nearly 50/50 with oak, so reducing the aspen stocking resulted in stands dominated by oak.
In addition to active vegetation management, other natural events on the CNNF have impacted the vegetation composition and age-class structure. Below is a summary of those events and the impact they potentially could have on the desired future conditions described in the Forest Plan.
♦ The spruce decline event (2004-2009) impacted nearly 50 percent of the spruce on the CNNF and had a significant impact on ecosystem restoration objectives. Due to conditions left by the dying spruce, options for management techniques and alternatives to regenerate the stands were limited to merely encouraging natural regeneration to forested conditions. In many cases, natural regeneration of the spruce sites resulted in an increase in aspen forest types, which contributed to achieving desired forest composition objectives in some management areas but not in others.
♦ The Quad County Tornado (2007) also had a large impact on restoration objectives. Forested stands in the tornado’s swath are in the process of regenerating; the success of the reforestation effort will be assessed in the next 5-year monitoring cycle.
Comparison of Actual and Estimated Costs (36 CFR 219.12(k)(3)) The cost of full Forest Plan implementation in 2004 was estimated to be $29,561,700 annually (not adjusted for inflation; 2004 Forest Plan FEIS, table 2-22). Since completing the Forest Plan Final Environmental Impact Statement, the methods of tracking costs have changed and the FEIS estimate does not necessarily translate to the current budget divisions. Nevertheless, the intention of this legally required monitoring item—to compare the estimated costs with actual costs—can still be fulfilled because estimated costs are made annually before the final or actual budget for that fiscal year is issued. During fiscal years 2009 and 2010, the CNNF operated 1 percent below and equal to what was estimated in the beginning of those fiscal years, respectively (table 18). The budget trend from fiscal years 2006 to 2010 is decreasing (figure 19).

Chapter 1 - Minimum Legally Required Monitoring
Year 2009/2010 Monitoring and Midterm Evaluation Report 45
Table 18. The estimated and actual costs for Chequamegon-Nicolet National Forest program operations for fiscal years 2009 and 2010.
Program description 2009 Estimated ($)
2009 Actual ($)
2010 Estimated ($)
2010 Actual ($)
Inventory and monitoring $ 814,395 $ 814,200 $ 620,036 $ 620,000
Land management 482,600 482,600 434,488 435,387
Minerals and geology 193,500 193,500 184,000 184,000
Planning 103,966 105,000 105,000 105,000
Recreation/wilderness/ heritage 1,664,133 1,628,956 1,543,927 1,533,078
Timber 4,352,093 4,240,737 4,210,256 4,209,989
Vegetation, watershed and air 845,035 845,300 623,048 633,048
Wildlife 1,073,944 1,029,924 882,090 884,339
Reforestation 235,394 239,100 198,504 200,000
Salvage sales 1,151,918 1,150,000 493,182 492,623
Timber pipeline funds 410,032 413,000 1,588,728 1,607,000
Roads and trails for States 42,025 42,000 88,000 88,000
Hazardous fuels reduction 259,277 260,000 260,695 260,000
Fire protection and preparedness 1,711,669 1,680,933 1,705,886 1,703,923
Facilities maintenance - recreation 133,815 127,000 227,043 226,200
Road maintenance and construction 3,427,164 3,316,595 3,776,625. 3,776,909
Trail maintenance 230,612 230,000 311,745 310,814
Administrative facilities maintenance 529,276 690,800 409,680 411,325
Knutsen-Vandenberg (KV) fund 1,353,534 1,310,000 1,097,960 1,107,935
KV regional projects 580,914 582,000 350,129 350,000
Funds for purchase of lands 2,550,772 2,550,800 2,209,577 2,210,000
Fee demo - recreation collections 134,536 132,000
Fee demo – rec. site maintenance 625,016 626,550 717,342 716,709
Forest health management 30,342 30,000 31,707 32,000
Rehabilitation and restoration 66,000 66,000 24,966 25,000
Administrative and visitor maps 31,000 31,000 30,000 30,000
Stewardship projects 89,820 94,250 5,000. 5,000
Total $23,122,782 $22,912,245 $22,129,614 $22,158,279

Chapter 1 - Minimum Legally Required Monitoring
46 Year 2009/2010 Monitoring and Midterm Evaluation Report
Figure 19. Chequamegon-Nicolet National Forest annual budget from fiscal years 2006 to FY2010.
Effects of Management Practices (36 CFR 219.11(d)) Forestwide goals and objectives of the Forest Plan provide the overall management direction for moving toward achieving the desired future conditions, while the standards and guidelines along with management area direction is a means of meeting those desired future conditions.
The management areas are grouped into seven major categories and each area is defined by a primary emphasis or prescription that guides activities taking place within it. The management area boundaries are based on landscape scale ecological unit (landtype association) boundaries that are relatively homogeneous with respect to terrestrial resources, such as potential vegetation communities, soils, and landforms. The development of the management area elements was guided by information from the historic range of variability for vegetation types, communities, and associated wildlife, fish and plant species, the ecological potential of the landscape, and the existing conditions.
In general, management areas 1 through 4 are based on the CNNF landtype association boundaries and include management activities that address forest health, restoration of vegetation composition and structure, and wildlife habitat.
Chapter 1 - Minimum Legally Required Monitoring
Year 2009/2010 Monitoring and Midterm Evaluation Report 47
Management area 5 lands emphasize the protection of congressionally designated Wilderness and Wilderness study areas. Management area 6, which is bounded by existing roads, emphasizes remote nonmotorized recreation opportunities.
Management area 8 lands are collectively referred to as ecological reference and special management areas. Although these lands vary somewhat in terms of management and objectives, they have many areas of overlap, including the common goals of providing ecological reference or benchmark conditions for baseline monitoring and research, refugia for rare species, and some ecological conditions or functions that are not otherwise available across the landscape. Ecological reference areas contribute to biological diversity, an element of ecosystem sustainability. Also included under this reference area umbrella are a smaller number of geological and archeological special management areas that provide cultural and geological reference conditions. The boundaries of management area 8 are generally too small to follow landtype association boundaries and often correlate with forest type or political boundaries.
In addition to management area direction for vegetation composition, Forest Plan direction on species age-class distribution provides guidance on the desired future forest structure. The purposes of the report focuss mainly on how the CNNF is progressing toward the desired future conditions of vegetation composition and age class structure.
Because the Forest Plan does not provide a specific range of desired future conditions for species composition for all management areas, this report contains information only on those management areas where species composition can be quantified and compared to a desired condition.
Data used in calculating existing conditions for vegetation composition and age class are stored in a corporate database and geographic information system layer known as FSVeg. Due to requirements of NFMA, certification of regeneration for harvested forest stands does not occur until 3 to 4 years after original harvest. Thus, the FSVeg data used in the descriptions below does not reflect newly regenerated species until the site is certified. This results in a time lag in data from the parent stand to newly regenerated stand.

Chapter 1 - Minimum Legally Required Monitoring
48 Year 2009/2010 Monitoring and Midterm Evaluation Report
Vegetation Composition by Management Area Management area 1 consists of simply structured early successional forests (primarily aspen). Ruffed grouse (Bonasa umbellus) and deer hunting are the primary recreational activities within a wide range of other recreation opportunities. White-tailed deer, ruffed grouse, beaver, and chestnut-sided warblers are some wildlife species associated with this pioneer vegetation.
In 2009, the majority of the existing species composition within all management area 1 areas was within the range of the Forest Plan desired future condition. However, there were some exceptions. Red and white pine forest was underrepresented in management area 1A by 1 percent and in management area 1B, and while paper birch decreased in management area 1B, it was still over-represented by 1 percent. In addition, oak in management area 1B was overrepresented by 2 percent (figure 20).
Between 2004 and 2010, there was a reduction in the amount of paper birch in management areas 1A and 1B (table 19). Paper birch in management area 1A is now within the desired range, and in management area 1B is significantly closer to the desired range. There was also a reduction in the amount of “other forest types” (mainly white spruce) in management area 1A, a move toward the desired range.
Table 19. Management area 1 - Forest type composition by management area with desired condition range, year 2004 and year 2010 (percent of upland acres).
Species Group
MA 1A MA 1B MA 1C
Desired Condition
Existing in 2004
Existing in 2010
Desired Condition
Existing in 2004
Existing in 2010
Desired Condition
Existing in 2004
Existing in 2010
Aspen 50-75 61.0 59.9 35-55 46.5 47.0 35-55 48.8 49.3
Balsam fir 0-10 3.0 3.0 0-10 1.7 1.3 0-10 1.9 2.0
Paper birch 0-5 5.4(+) 5.0(+) 0-5 7.2(+) 6.4(+) 0-10 3.0 2.6
Jack pine 0-2 0.3 0.5 0-10 4.1 3.7 0-5 1.0 1.1 Red pine/ white pine 5-15 4.3(-) 4.2(-) 5-30 16.2 16.6 5-20 6.9 7.1
Northern hardwoods 5-20 18.5 19.7 5-15 13.8 13.6 15-40 27.8 28.8
Oak 0-5 0.4 0.5 0-5 6.2(-) 7.1(-) 0-10 4.9 4.8 Permanent opening 1-4 1.4 1.6 1-4 2.8 2.4 1-4 2.0 1.9
Other forest types 0-5 5.8(+) 5.6(+) 0-10 1.6 1.8 0-10 3.6 2.4
(+) indicates a positive trend, (-) indicates a negative trend.
Photo 13. Aspen-conifer overstory typical of management area 1
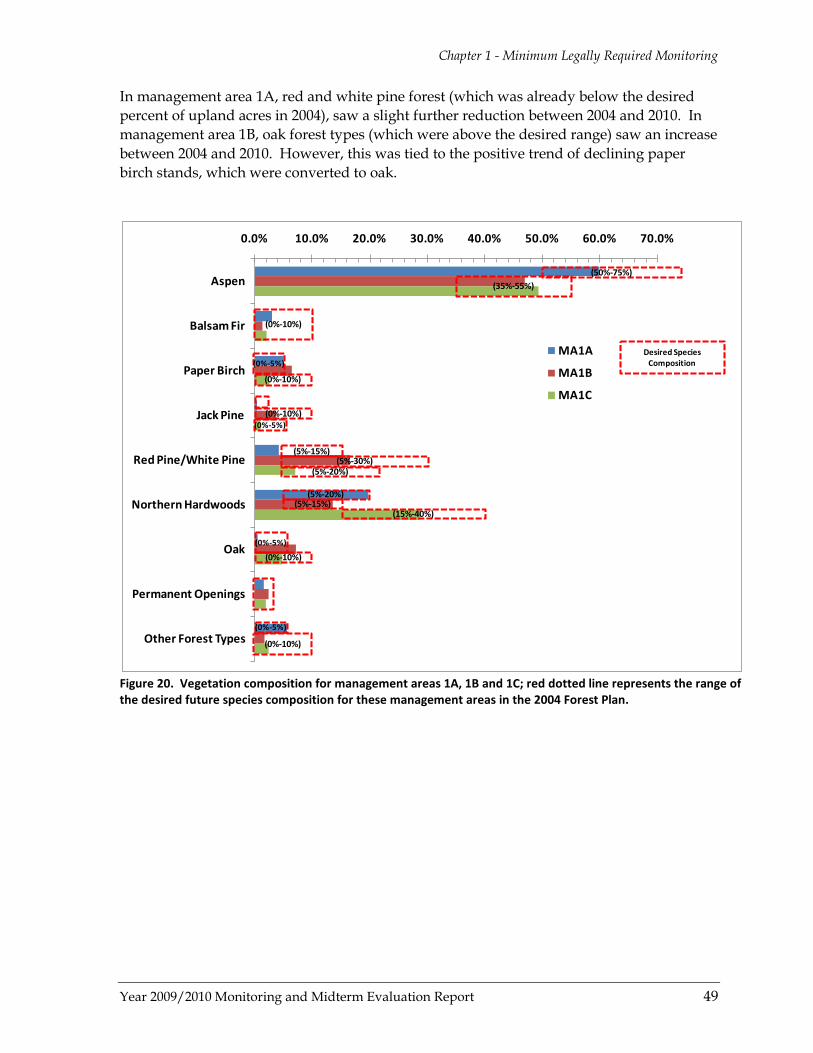
Chapter 1 - Minimum Legally Required Monitoring
Year 2009/2010 Monitoring and Midterm Evaluation Report 49
In management area 1A, red and white pine forest (which was already below the desired percent of upland acres in 2004), saw a slight further reduction between 2004 and 2010. In management area 1B, oak forest types (which were above the desired range) saw an increase between 2004 and 2010. However, this was tied to the positive trend of declining paper birch stands, which were converted to oak.
Figure 20. Vegetation composition for management areas 1A, 1B and 1C; red dotted line represents the range of the desired future species composition for these management areas in the 2004 Forest Plan.
0.0% 10.0% 20.0% 30.0% 40.0% 50.0% 60.0% 70.0%
Aspen
Balsam Fir
Paper Birch
Jack Pine
Red Pine/White Pine
Northern Hardwoods
Oak
Permanent Openings
Other Forest Types
MA1A
MA1B
MA1C
(50%-75%)(35%-55%)
(0%-10%)
(0%-10%)
(0%-5%)
(0%-10%)(0%-5%)
(5%-15%)(5%-30%)
(5%-20%)
(5%-20%)(5%-15%)
(15%-40%)
(0%-5%)
(0%-10%)
(0%-10%)
(0%-5%)
Desired SpeciesComposition
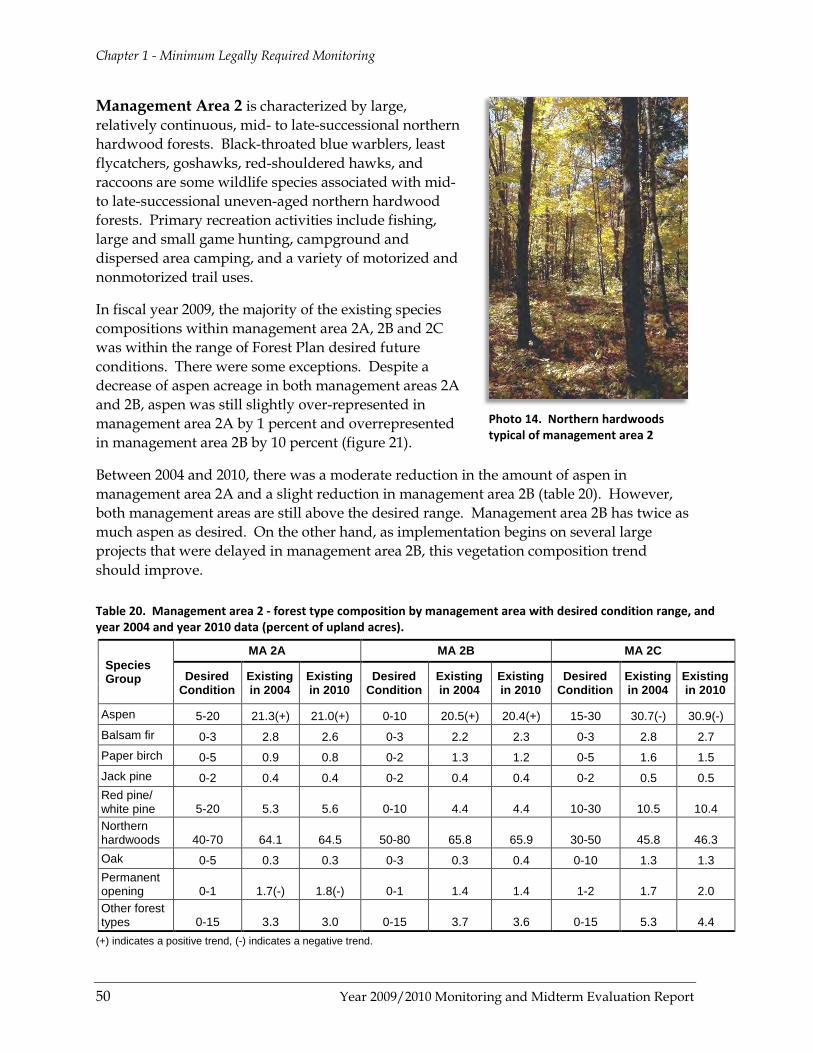
Chapter 1 - Minimum Legally Required Monitoring
50 Year 2009/2010 Monitoring and Midterm Evaluation Report
Management Area 2 is characterized by large, relatively continuous, mid- to late-successional northern hardwood forests. Black-throated blue warblers, least flycatchers, goshawks, red-shouldered hawks, and raccoons are some wildlife species associated with mid- to late-successional uneven-aged northern hardwood forests. Primary recreation activities include fishing, large and small game hunting, campground and dispersed area camping, and a variety of motorized and nonmotorized trail uses.
In fiscal year 2009, the majority of the existing species compositions within management area 2A, 2B and 2C was within the range of Forest Plan desired future conditions. There were some exceptions. Despite a decrease of aspen acreage in both management areas 2A and 2B, aspen was still slightly over-represented in management area 2A by 1 percent and overrepresented in management area 2B by 10 percent (figure 21).
Between 2004 and 2010, there was a moderate reduction in the amount of aspen in management area 2A and a slight reduction in management area 2B (table 20). However, both management areas are still above the desired range. Management area 2B has twice as much aspen as desired. On the other hand, as implementation begins on several large projects that were delayed in management area 2B, this vegetation composition trend should improve.
Table 20. Management area 2 - forest type composition by management area with desired condition range, and year 2004 and year 2010 data (percent of upland acres).
Species Group
MA 2A MA 2B MA 2C
Desired Condition
Existing in 2004
Existing in 2010
Desired Condition
Existing in 2004
Existing in 2010
Desired Condition
Existing in 2004
Existing in 2010
Aspen 5-20 21.3(+) 21.0(+) 0-10 20.5(+) 20.4(+) 15-30 30.7(-) 30.9(-) Balsam fir 0-3 2.8 2.6 0-3 2.2 2.3 0-3 2.8 2.7 Paper birch 0-5 0.9 0.8 0-2 1.3 1.2 0-5 1.6 1.5 Jack pine 0-2 0.4 0.4 0-2 0.4 0.4 0-2 0.5 0.5 Red pine/ white pine 5-20 5.3 5.6 0-10 4.4 4.4 10-30 10.5 10.4 Northern hardwoods 40-70 64.1 64.5 50-80 65.8 65.9 30-50 45.8 46.3 Oak 0-5 0.3 0.3 0-3 0.3 0.4 0-10 1.3 1.3 Permanent opening 0-1 1.7(-) 1.8(-) 0-1 1.4 1.4 1-2 1.7 2.0 Other forest types 0-15 3.3 3.0 0-15 3.7 3.6 0-15 5.3 4.4
(+) indicates a positive trend, (-) indicates a negative trend.
Photo 14. Northern hardwoods typical of management area 2
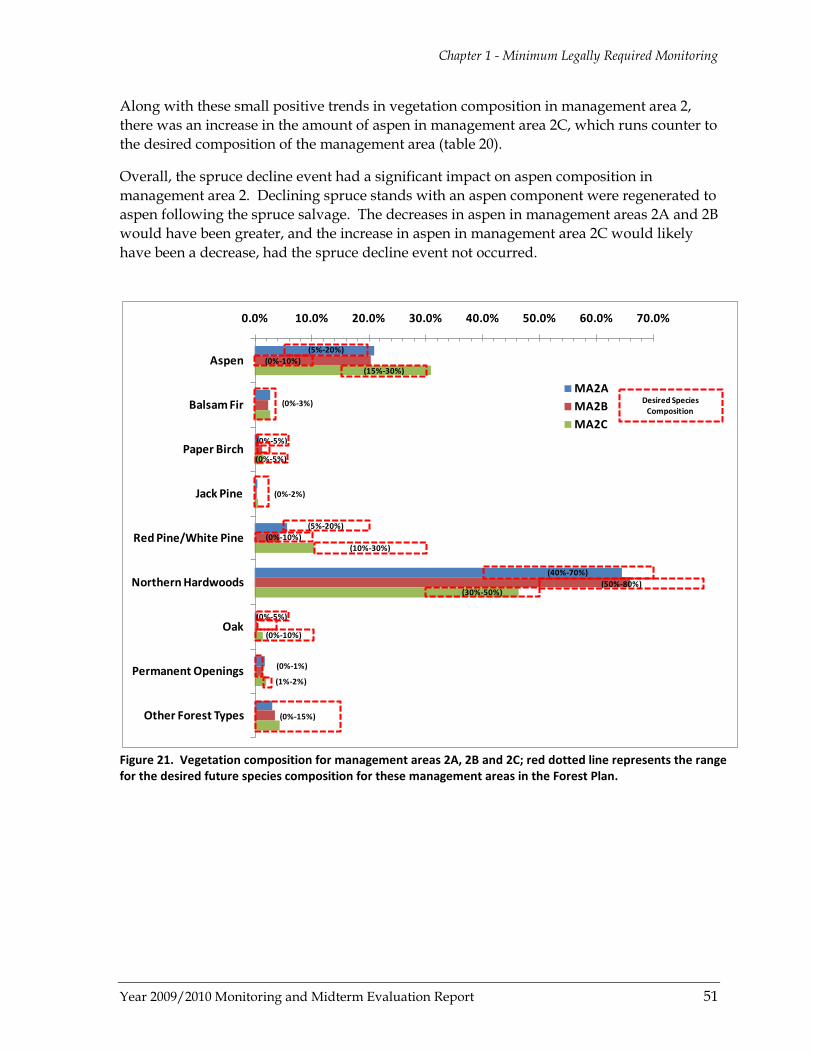
Chapter 1 - Minimum Legally Required Monitoring
Year 2009/2010 Monitoring and Midterm Evaluation Report 51
Along with these small positive trends in vegetation composition in management area 2, there was an increase in the amount of aspen in management area 2C, which runs counter to the desired composition of the management area (table 20).
Overall, the spruce decline event had a significant impact on aspen composition in management area 2. Declining spruce stands with an aspen component were regenerated to aspen following the spruce salvage. The decreases in aspen in management areas 2A and 2B would have been greater, and the increase in aspen in management area 2C would likely have been a decrease, had the spruce decline event not occurred.
Figure 21. Vegetation composition for management areas 2A, 2B and 2C; red dotted line represents the range for the desired future species composition for these management areas in the Forest Plan.
0.0% 10.0% 20.0% 30.0% 40.0% 50.0% 60.0% 70.0%
Aspen
Balsam Fir
Paper Birch
Jack Pine
Red Pine/White Pine
Northern Hardwoods
Oak
Permanent Openings
Other Forest Types
MA2AMA2BMA2C
(5%-20%)(0%-10%)
(15%-30%)
(0%-5%)
(0%-5%)
(5%-20%)(0%-10%)
(10%-30%)
(40%-70%)(50%-80%)
(30%-50%)
(0%-10%)
(0%-5%)
(0%-15%)
(0%-3%)
(0%-2%)
(0%-1%)
(1%-2%)
Desired SpeciesComposition
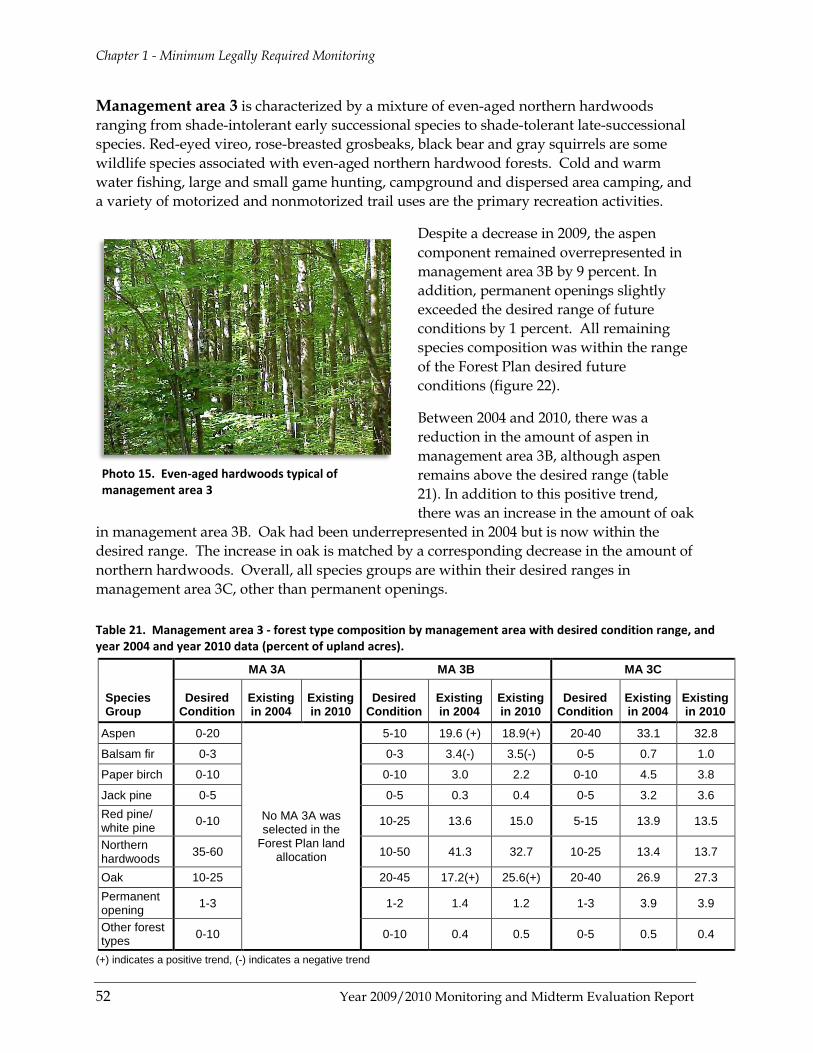
Chapter 1 - Minimum Legally Required Monitoring
52 Year 2009/2010 Monitoring and Midterm Evaluation Report
Management area 3 is characterized by a mixture of even-aged northern hardwoods ranging from shade-intolerant early successional species to shade-tolerant late-successional species. Red-eyed vireo, rose-breasted grosbeaks, black bear and gray squirrels are some wildlife species associated with even-aged northern hardwood forests. Cold and warm water fishing, large and small game hunting, campground and dispersed area camping, and a variety of motorized and nonmotorized trail uses are the primary recreation activities.
Despite a decrease in 2009, the aspen component remained overrepresented in management area 3B by 9 percent. In addition, permanent openings slightly exceeded the desired range of future conditions by 1 percent. All remaining species composition was within the range of the Forest Plan desired future conditions (figure 22).
Between 2004 and 2010, there was a reduction in the amount of aspen in management area 3B, although aspen remains above the desired range (table 21). In addition to this positive trend, there was an increase in the amount of oak
in management area 3B. Oak had been underrepresented in 2004 but is now within the desired range. The increase in oak is matched by a corresponding decrease in the amount of northern hardwoods. Overall, all species groups are within their desired ranges in management area 3C, other than permanent openings.
Table 21. Management area 3 - forest type composition by management area with desired condition range, and year 2004 and year 2010 data (percent of upland acres).
Species Group
MA 3A MA 3B MA 3C
Desired Condition
Existing in 2004
Existing in 2010
Desired Condition
Existing in 2004
Existing in 2010
Desired Condition
Existing in 2004
Existing in 2010
Aspen 0-20
No MA 3A was selected in the
Forest Plan land allocation
5-10 19.6 (+) 18.9(+) 20-40 33.1 32.8
Balsam fir 0-3 0-3 3.4(-) 3.5(-) 0-5 0.7 1.0
Paper birch 0-10 0-10 3.0 2.2 0-10 4.5 3.8
Jack pine 0-5 0-5 0.3 0.4 0-5 3.2 3.6 Red pine/ white pine 0-10 10-25 13.6 15.0 5-15 13.9 13.5
Northern hardwoods 35-60 10-50 41.3 32.7 10-25 13.4 13.7
Oak 10-25 20-45 17.2(+) 25.6(+) 20-40 26.9 27.3 Permanent opening 1-3 1-2 1.4 1.2 1-3 3.9 3.9
Other forest types 0-10 0-10 0.4 0.5 0-5 0.5 0.4
(+) indicates a positive trend, (-) indicates a negative trend
Photo 15. Even-aged hardwoods typical of management area 3
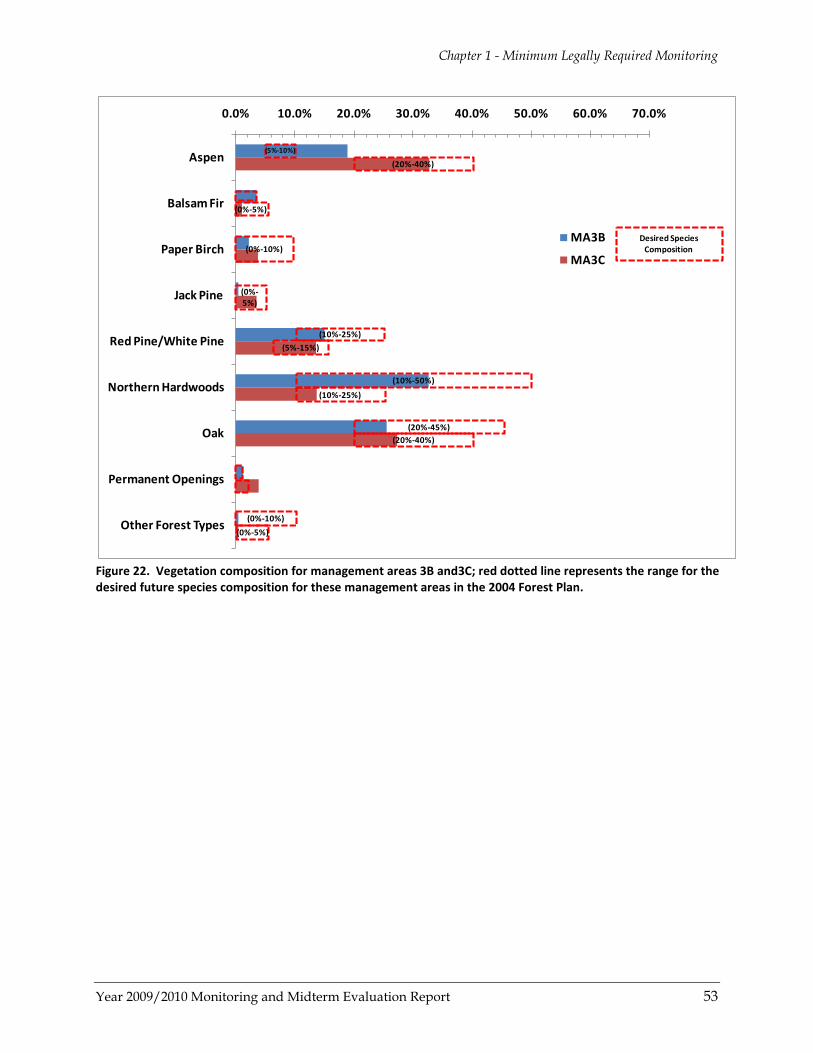
Chapter 1 - Minimum Legally Required Monitoring
Year 2009/2010 Monitoring and Midterm Evaluation Report 53
Figure 22. Vegetation composition for management areas 3B and3C; red dotted line represents the range for the desired future species composition for these management areas in the 2004 Forest Plan.
0.0% 10.0% 20.0% 30.0% 40.0% 50.0% 60.0% 70.0%
Aspen
Balsam Fir
Paper Birch
Jack Pine
Red Pine/White Pine
Northern Hardwoods
Oak
Permanent Openings
Other Forest Types
MA3B
MA3C
(5%-10%)
(20%-40%)
(0%-5%)
(0%-10%)
(0%-5%)
(10%-25%)(5%-15%)
(10%-50%)
(10%-25%)
(20%-45%)(20%-40%)
(0%-5%)(0%-10%)
Desired SpeciesComposition

Chapter 1 - Minimum Legally Required Monitoring
54 Year 2009/2010 Monitoring and Midterm Evaluation Report
Management area 4 is characterized by upland conifer forests mixed with other forest communities. Wildlife species associated with this coniferous and mixed conifer-hardwood forest include chipping sparrow, pine warbler, red-breasted nuthatch, and red squirrel.
In 2009, the aspen component was overrepresented in management area 4B by 19 percent. Jack pine was underrepresented in management area 4C by 3 percent and overrepresented in management area 4B by 3 percent. Red and white pines were underrepresented in management area 4B by 15 percent and both oak and permanent openings were underrepresented in management area 4C by 2 percent. The remaining species composition was within the range of the Forest Plan desired future conditions (figure 23).
Between 2004 and 2010, there were reductions in the amount of paper birch and jack pine in management area 4B (table 22). Paper birch and jack pine are now significantly closer to their desired ranges. In addition to this positive trend, there were increases in the amount of jack pine and oak in management area 4C, moving toward their desired ranges.
Table 22. Management area 4 - forest type composition by management area with desired condition range, year 2004 and year 2010 (percent of upland acres).
Species Group
MA 4A MA 4B MA 4C
Desired Condition
Existing in 2004
Existing in 2010
Desired Condition
Existing in 2004
Existing in 2010
Desired Condition
Existing in 2004
Existing in 2010
Aspen 10-30 28.2 28.6 0-7 25.4(-) 25.8(-) 20-35 30.5 28.9 Balsam fir 0-3 1.4 1.3 0-3 1.7 2.1 0-3 0.0 0.0 Paper birch 0-5 2.7 2.1 0-5 6.5(+) 5.8(+) 0-5 2.6 2.0 Jack pine 0-35 12.2 11.7 3-6 10.9(+) 8.9(+) 35-50 32.0(+) 32.1(+) Red pine/ white pine 10-50 35.9 36.3 45-70 30.1 30.1 20-30 26.2 28.0 Northern hardwoods 0-25 7.3 8.0 0-10 12.3(-) 12.9(-) 0-10 0.2 0.2 Oak 0-25 8.2 8.1 10-25 10.3 11.5 10-20 7.0 7.6(+) Permanent opening 1-6 2.9 2.7 2-8 2.5 2.5 2-8 1.4(-) 1.1(-) Other forest types 0-5 1.3 1.3 0-10 0.4 0.4 0-10 0.1 0.0
(+) indicates a positive trend, (-) indicates a negative trend.
Photo 16. Mixed conifer forest typical of management area 4

Chapter 1 - Minimum Legally Required Monitoring
Year 2009/2010 Monitoring and Midterm Evaluation Report 55
There were however several negative trends within management area 4 between 2004 and 2010. There was an increase in the amount of aspen in management area 4B (table 22). The amount of aspen in management area 4B is about 3½ times as much as desired. There was also an increase in northern hardwoods in management area 4B, where hardwoods were already above the desired range. In addition, there was a reduction in the amount of permanent opening in management area 4C, moving further away from the desired range.
Figure 23. Vegetation composition for management areas 4A, 4B, and 4C; red dotted line represents the range for the desired future species composition for these management areas in the 2004 Forest Plan.
0.0% 10.0% 20.0% 30.0% 40.0% 50.0% 60.0% 70.0%
Aspen
Balsam Fir
Paper Birch
Jack Pine
Red Pine/White Pine
Northern Hardwoods
Oak
Permanent Openings
Other Forest Types
MA4A
MA4B
MA4C
(10%-30%)(0%-7%)
(20%-35%)
(0%-5%)
(0%-35%)3-6%
(35%-50%)
(10%-50%)(45%-70%)
(20%-30%)
(0%-10%)
(0%-25%)
(0%-25%)(10%-25%)
(10%-20%)
(2%-8%)
(1%-6%)
(0%-10%)
(0%-5%)
Desired SpeciesComposition
(0-3%)

Chapter 1 - Minimum Legally Required Monitoring
56 Year 2009/2010 Monitoring and Midterm Evaluation Report
Management area 8C includes Riley Lake Wildlife Management Area and Moquah Barrens Area (figure 24).
In general, these areas are characterized by large open areas and barrens featuring a mixture of grasses, shrubs, and scattered trees. Sharp-tailed grouse, northern harrier, upland sandpiper, sandhill crane, and badger are some wildlife species associated with these areas. Current conditions of the Riley Lake Wildlife Management Area are described below. Moquah Barrens is discussed under Objective 1.4 a.
Riley Lake Wildlife Management Area encompasses about 4,761 acres. About 66 percent (3,133 acres) of this area is perennially wet lowland and remains mostly open without frequent disturbance. However, black spruce and tamarack eventually dominate these sites, and have grown tall enough to act as a barrier to open habitat species.
Another 19 percent (901 acres) of Riley Lake Wildlife Management Area is upland interspersed with wet, grass-forb-shrub habitat. These upland sites offer the highest habitat potential for targeted wildlife species such as sharp-tailed grouse, but rapidly evolve into trees and shrub without frequent disturbance. The desired future conditions of management area 8C are to keep 70 to 80 percent of all uplands (including the forested upland) open.
The remaining 15 percent (727 acres) of the Riley area is dominated by upland forest of aspen, birch and pine. Upland forest is desired as a minor component (though not dominant) to provide habitat diversity. Currently, upland forest conditions represent about 50 percent of the Riley uplands, while the desired condition is for less than 30 percent (table 23).
Figure 24. Management area 8C: Moquah Barrens and Riley Wildlife Management Area.
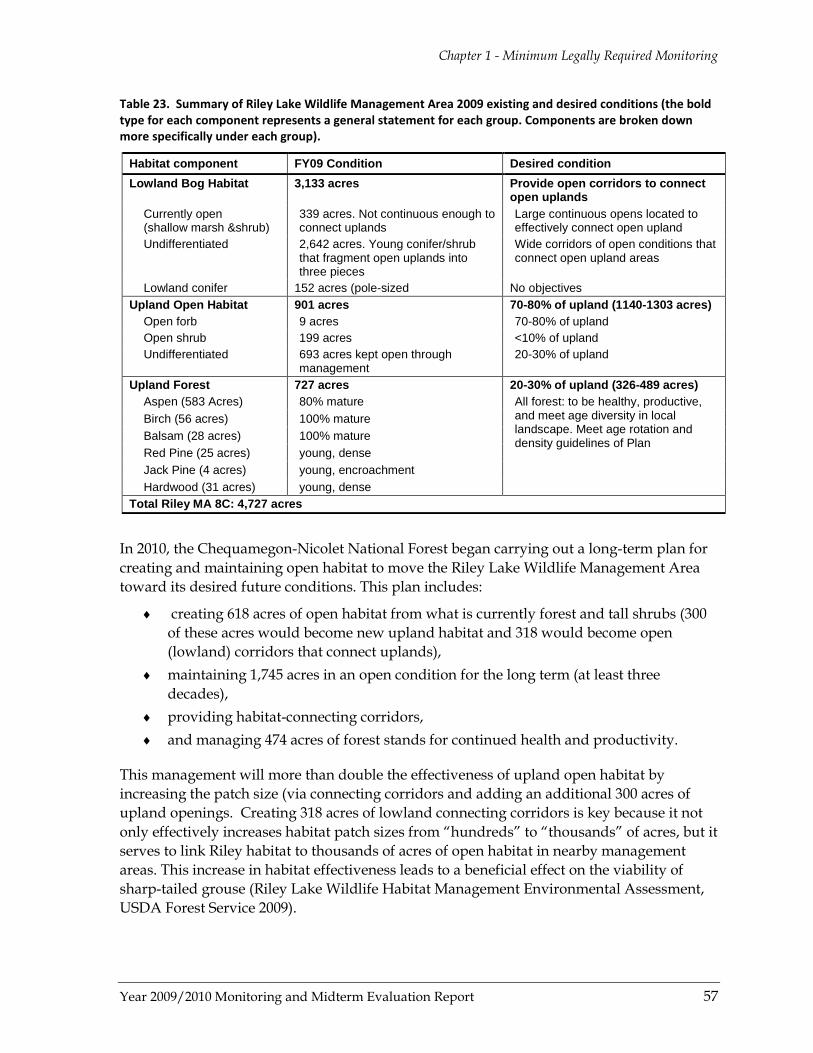
Chapter 1 - Minimum Legally Required Monitoring
Year 2009/2010 Monitoring and Midterm Evaluation Report 57
Table 23. Summary of Riley Lake Wildlife Management Area 2009 existing and desired conditions (the bold type for each component represents a general statement for each group. Components are broken down more specifically under each group).
Habitat component FY09 Condition Desired condition Lowland Bog Habitat 3,133 acres Provide open corridors to connect
open uplands Currently open (shallow marsh &shrub)
339 acres. Not continuous enough to connect uplands
Large continuous opens located to effectively connect open upland
Undifferentiated 2,642 acres. Young conifer/shrub that fragment open uplands into three pieces
Wide corridors of open conditions that connect open upland areas
Lowland conifer 152 acres (pole-sized No objectives Upland Open Habitat 901 acres 70-80% of upland (1140-1303 acres)
Open forb 9 acres 70-80% of upland Open shrub 199 acres <10% of upland Undifferentiated 693 acres kept open through
management 20-30% of upland
Upland Forest 727 acres 20-30% of upland (326-489 acres) Aspen (583 Acres) 80% mature All forest: to be healthy, productive,
and meet age diversity in local landscape. Meet age rotation and density guidelines of Plan
Birch (56 acres) 100% mature Balsam (28 acres) 100% mature Red Pine (25 acres) young, dense Jack Pine (4 acres) young, encroachment Hardwood (31 acres) young, dense
Total Riley MA 8C: 4,727 acres
In 2010, the Chequamegon-Nicolet National Forest began carrying out a long-term plan for creating and maintaining open habitat to move the Riley Lake Wildlife Management Area toward its desired future conditions. This plan includes:
♦ creating 618 acres of open habitat from what is currently forest and tall shrubs (300 of these acres would become new upland habitat and 318 would become open (lowland) corridors that connect uplands),
♦ maintaining 1,745 acres in an open condition for the long term (at least three decades),
♦ providing habitat-connecting corridors, ♦ and managing 474 acres of forest stands for continued health and productivity.
This management will more than double the effectiveness of upland open habitat by increasing the patch size (via connecting corridors and adding an additional 300 acres of upland openings. Creating 318 acres of lowland connecting corridors is key because it not only effectively increases habitat patch sizes from “hundreds” to “thousands” of acres, but it serves to link Riley habitat to thousands of acres of open habitat in nearby management areas. This increase in habitat effectiveness leads to a beneficial effect on the viability of sharp-tailed grouse (Riley Lake Wildlife Habitat Management Environmental Assessment, USDA Forest Service 2009).
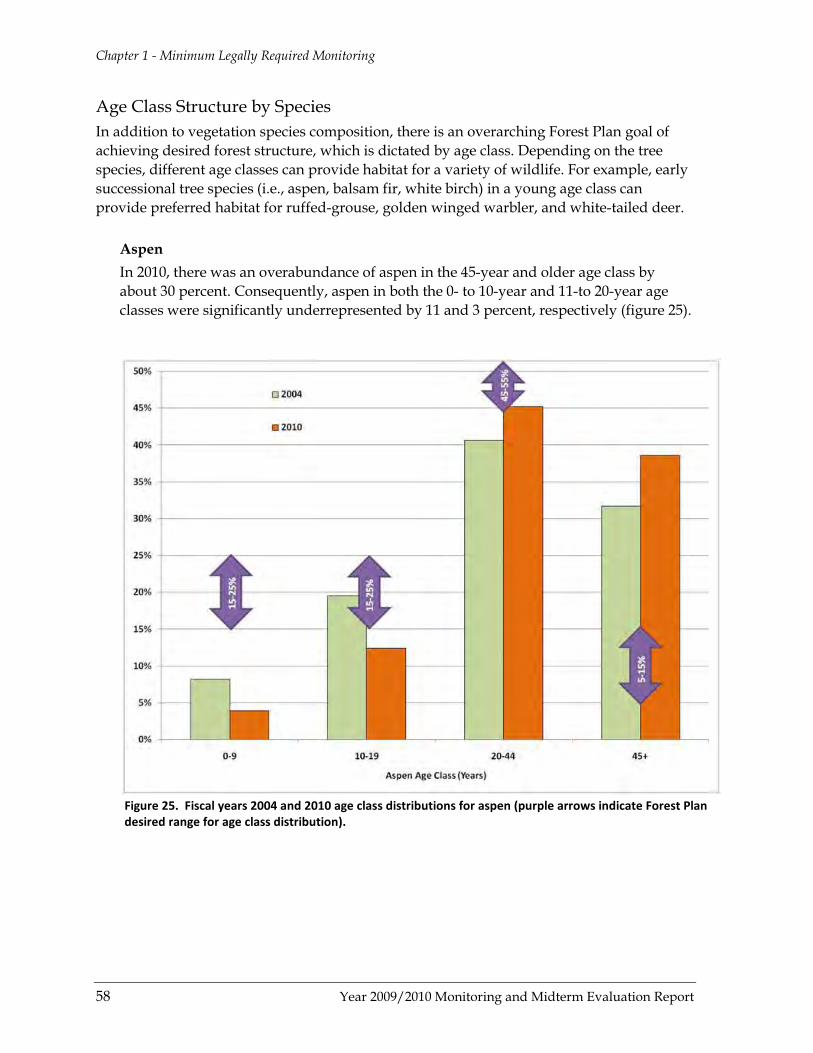
Chapter 1 - Minimum Legally Required Monitoring
58 Year 2009/2010 Monitoring and Midterm Evaluation Report
Age Class Structure by Species In addition to vegetation species composition, there is an overarching Forest Plan goal of achieving desired forest structure, which is dictated by age class. Depending on the tree species, different age classes can provide habitat for a variety of wildlife. For example, early successional tree species (i.e., aspen, balsam fir, white birch) in a young age class can provide preferred habitat for ruffed-grouse, golden winged warbler, and white-tailed deer.
Aspen In 2010, there was an overabundance of aspen in the 45-year and older age class by about 30 percent. Consequently, aspen in both the 0- to 10-year and 11-to 20-year age classes were significantly underrepresented by 11 and 3 percent, respectively (figure 25).
Figure 25. Fiscal years 2004 and 2010 age class distributions for aspen (purple arrows indicate Forest Plan desired range for age class distribution).

Chapter 1 - Minimum Legally Required Monitoring
Year 2009/2010 Monitoring and Midterm Evaluation Report 59
Paper Birch There was a striking overabundance in 2010 of paper birch in the 60-year and older age class, while all the remaining age classes (0-19, 20-39, and 40-59 years) were under-represented (figure 26).
Figure 26. Fiscal years 2004 and 2010 age class distribution for paper birch (purple arrows indicate Forest Plan desired range for age class distribution).
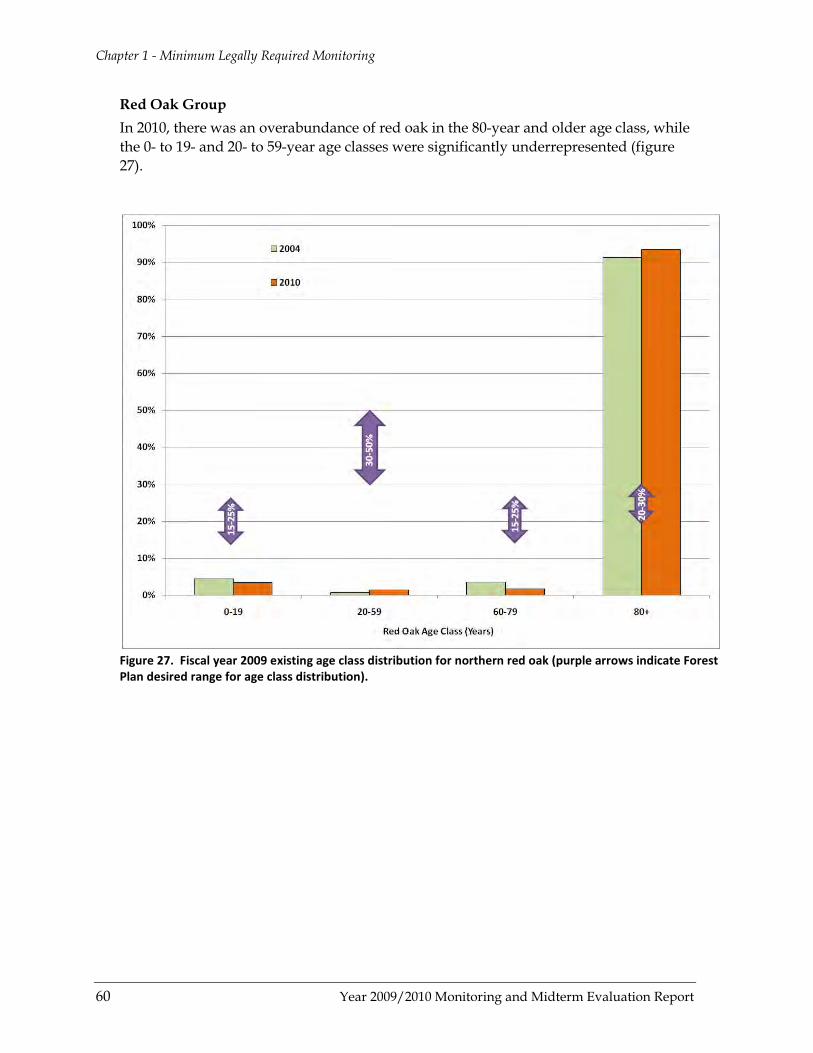
Chapter 1 - Minimum Legally Required Monitoring
60 Year 2009/2010 Monitoring and Midterm Evaluation Report
Red Oak Group In 2010, there was an overabundance of red oak in the 80-year and older age class, while the 0- to 19- and 20- to 59-year age classes were significantly underrepresented (figure 27).
Figure 27. Fiscal year 2009 existing age class distribution for northern red oak (purple arrows indicate Forest Plan desired range for age class distribution).
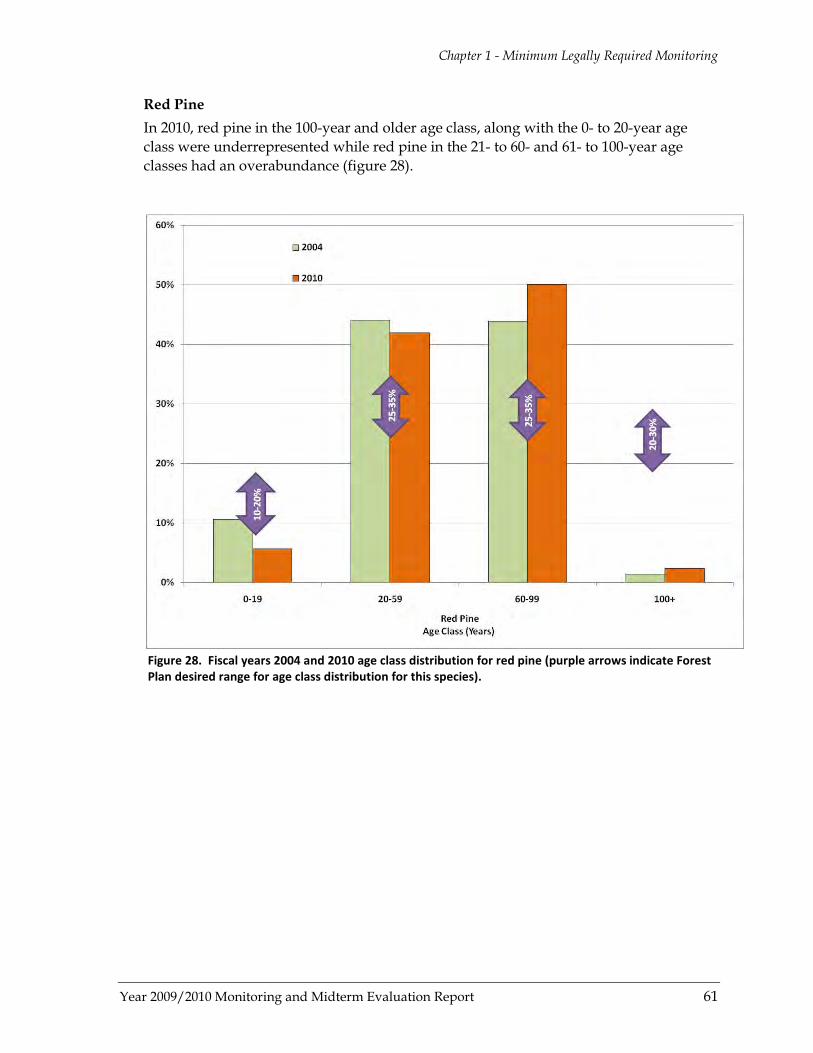
Chapter 1 - Minimum Legally Required Monitoring
Year 2009/2010 Monitoring and Midterm Evaluation Report 61
Red Pine In 2010, red pine in the 100-year and older age class, along with the 0- to 20-year age class were underrepresented while red pine in the 21- to 60- and 61- to 100-year age classes had an overabundance (figure 28).
Figure 28. Fiscal years 2004 and 2010 age class distribution for red pine (purple arrows indicate Forest Plan desired range for age class distribution for this species).

Chapter 1 – Minimum Legally Required Monitoring
Year 2009/2010 Monitoring and Midterm Evaluation Report 62
Jack Pine In 2010, there was an overabundance of jack pine in the 11- to 30-year and 50-year and older age classes, while the 0- to 11-year and 31- to 50-year age classes, were underrepresented (figure 29).
Figure 29. Fiscal years 2004 and 2010 age class distribution for Jack pine (purple arrows indicate Forest Plan desired range for age class distribution for this species).

Chapter 1 - Minimum Legally Required Monitoring
Year 2009/2010 Monitoring and Midterm Evaluation Report 63
Balsam Fir In 2010, the 45-year and older age class of balsam fir was significantly overrepresented, while all the remaining age classes were underrepresented (figure 30).
Figure 30. Fiscal year 2004 and 2010 age class distribution for balsam fir (purple arrows indicate Forest Plan desired range for age class distribution for this species).
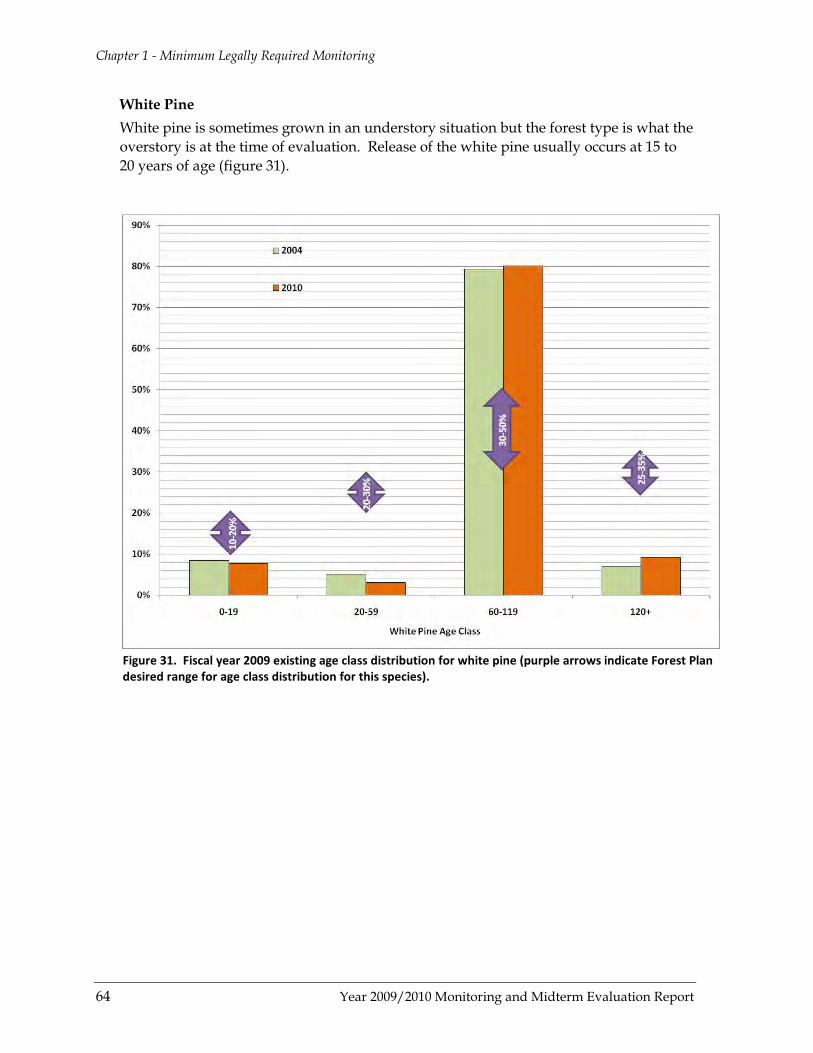
Chapter 1 - Minimum Legally Required Monitoring
64 Year 2009/2010 Monitoring and Midterm Evaluation Report
White Pine White pine is sometimes grown in an understory situation but the forest type is what the overstory is at the time of evaluation. Release of the white pine usually occurs at 15 to 20 years of age (figure 31).
Figure 31. Fiscal year 2009 existing age class distribution for white pine (purple arrows indicate Forest Plan desired range for age class distribution for this species).
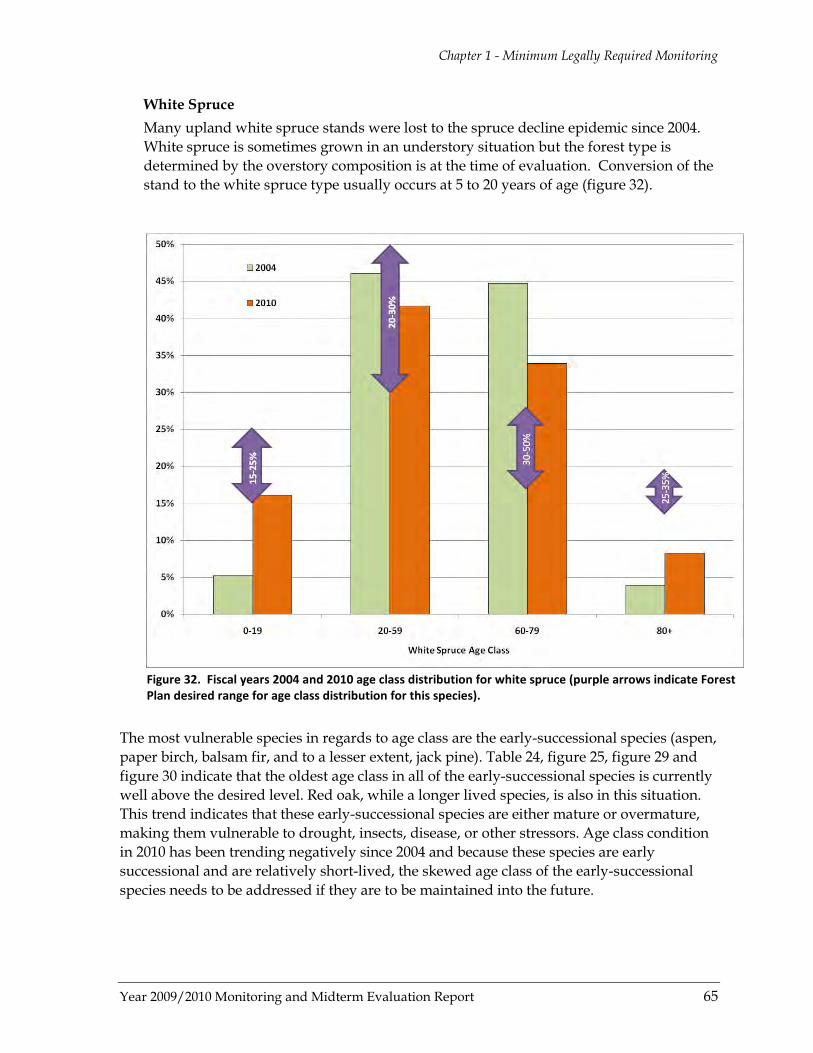
Chapter 1 - Minimum Legally Required Monitoring
Year 2009/2010 Monitoring and Midterm Evaluation Report 65
White Spruce Many upland white spruce stands were lost to the spruce decline epidemic since 2004. White spruce is sometimes grown in an understory situation but the forest type is determined by the overstory composition is at the time of evaluation. Conversion of the stand to the white spruce type usually occurs at 5 to 20 years of age (figure 32).
Figure 32. Fiscal years 2004 and 2010 age class distribution for white spruce (purple arrows indicate Forest Plan desired range for age class distribution for this species).
The most vulnerable species in regards to age class are the early-successional species (aspen, paper birch, balsam fir, and to a lesser extent, jack pine). Table 24, figure 25, figure 29 and figure 30 indicate that the oldest age class in all of the early-successional species is currently well above the desired level. Red oak, while a longer lived species, is also in this situation. This trend indicates that these early-successional species are either mature or overmature, making them vulnerable to drought, insects, disease, or other stressors. Age class condition in 2010 has been trending negatively since 2004 and because these species are early successional and are relatively short-lived, the skewed age class of the early-successional species needs to be addressed if they are to be maintained into the future.
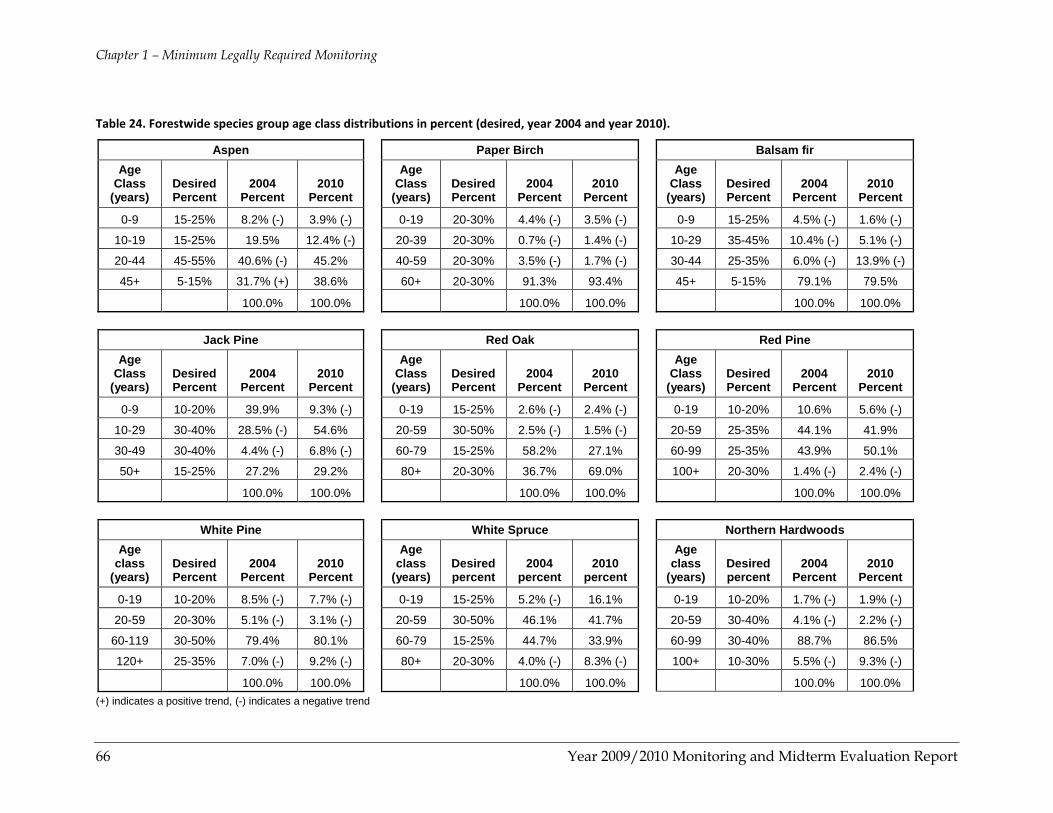
Chapter 1 – Minimum Legally Required Monitoring
66 Year 2009/2010 Monitoring and Midterm Evaluation Report
Table 24. Forestwide species group age class distributions in percent (desired, year 2004 and year 2010).
Aspen
Paper Birch
Balsam fir Age
Class (years)
Desired Percent
2004 Percent
2010 Percent
Age Class
(years) Desired Percent
2004 Percent
2010 Percent
Age Class
(years) Desired Percent
2004 Percent
2010 Percent
0-9 15-25% 8.2% (-) 3.9% (-) 0-19 20-30% 4.4% (-) 3.5% (-) 0-9 15-25% 4.5% (-) 1.6% (-)
10-19 15-25% 19.5% 12.4% (-) 20-39 20-30% 0.7% (-) 1.4% (-) 10-29 35-45% 10.4% (-) 5.1% (-)
20-44 45-55% 40.6% (-) 45.2% 40-59 20-30% 3.5% (-) 1.7% (-) 30-44 25-35% 6.0% (-) 13.9% (-)
45+ 5-15% 31.7% (+) 38.6% 60+ 20-30% 91.3% 93.4% 45+ 5-15% 79.1% 79.5%
100.0% 100.0% 100.0% 100.0% 100.0% 100.0%
Jack Pine Red Oak Red Pine Age
Class (years)
Desired Percent
2004 Percent
2010 Percent
Age Class
(years) Desired Percent
2004 Percent
2010 Percent
Age Class
(years) Desired Percent
2004 Percent
2010 Percent
0-9 10-20% 39.9% 9.3% (-) 0-19 15-25% 2.6% (-) 2.4% (-) 0-19 10-20% 10.6% 5.6% (-)
10-29 30-40% 28.5% (-) 54.6% 20-59 30-50% 2.5% (-) 1.5% (-) 20-59 25-35% 44.1% 41.9%
30-49 30-40% 4.4% (-) 6.8% (-) 60-79 15-25% 58.2% 27.1% 60-99 25-35% 43.9% 50.1%
50+ 15-25% 27.2% 29.2% 80+ 20-30% 36.7% 69.0% 100+ 20-30% 1.4% (-) 2.4% (-)
100.0% 100.0% 100.0% 100.0% 100.0% 100.0%
White Pine White Spruce Northern Hardwoods Age
class (years)
Desired Percent
2004 Percent
2010 Percent
Age class
(years) Desired percent
2004 percent
2010 percent
Age class
(years) Desired percent
2004 Percent
2010 Percent
0-19 10-20% 8.5% (-) 7.7% (-) 0-19 15-25% 5.2% (-) 16.1% 0-19 10-20% 1.7% (-) 1.9% (-)
20-59 20-30% 5.1% (-) 3.1% (-) 20-59 30-50% 46.1% 41.7% 20-59 30-40% 4.1% (-) 2.2% (-)
60-119 30-50% 79.4% 80.1% 60-79 15-25% 44.7% 33.9% 60-99 30-40% 88.7% 86.5%
120+ 25-35% 7.0% (-) 9.2% (-) 80+ 20-30% 4.0% (-) 8.3% (-) 100+ 10-30% 5.5% (-) 9.3% (-)
100.0% 100.0% 100.0% 100.0% 100.0% 100.0% (+) indicates a positive trend, (-) indicates a negative trend

Chapter 1 - Minimum Legally Required Monitoring
Year 2009/2010 Monitoring and Midterm Evaluation Report 67
The longer-lived species (oak being the exception) tend to be underpopulated in the youngest and oldest age classes, but are overpopulated in the middle-age classes. While this is an issue, there is time to adjust the age class toward the desired distribution without significant losses to the species. There have been some positive trends for longer-lived species since 2004. More than 56,000 acres of northern hardwoods have been managed to take them from even-aged/two-aged conditions to uneven-aged conditions. Another positive move is the continued maturation of the long-lived species; all of these forest types have gained acres in the oldest age class. They remain, however, below the desired threshold for the oldest age class.

Year 2009/2010 Monitoring and Midterm Evaluation Report 68
CHAPTER 2 GOAL AND OBJECTIVE MONITORING
Monitoring accomplishments for fiscal years 2009 and 2010, along with trend data from 2004 to 2010 and evaluation of that data, by Forest Plan goals and objectives, is reported in this chapter. To complete an ambitious monitoring schedule from 2004 to 2010, different programs integrated and relied heavily on cooperators to accomplish activities for selected goals described in the Forest Plan. For a comprehensive list of monitoring objectives to be conducted throughout the life of the Forest Plan, please refer to table 4-2 in that document. Not every single activity is monitored, and monitoring does not need to meet the statistical rigor of formal research. Budgetary constraints affect the level of monitoring accomplished in a particular fiscal year.
Goal 1.1 – Threatened, Endangered and Sensitive Species Objective 1.1a: Under the Endangered Species Act (ESA), implement established recovery or conservation strategies. As directed by Forest Service Manual (2670) and the Endangered Species Act, the Forest must monitor population trends of all federally listed species. The gray wolf (Canis lupus), Canada lynx (Lynx canadensis), and bald eagle (Haliaeetus leucocephalus; now delisted) are monitored in partnership with the Wisconsin Department of Natural Resources. The purpose of this monitoring is to evaluate species presence and absence, population status, and habitat use. This information is used to determine how well Forest Plan standards and guidelines are being achieved concerning conservation of the species, needs for additional protections, and to provide information to the U.S. Fish and Wildlife Service as required by the Endangered Species Act of 1973 (as amended)
In 2009 and 2010, Forest personnel coordinated with the Wisconsin Department of Natural Resources in the continued monitoring of gray wolf and Canada Lynx. In addition, surveys were conducted to locate Kirtland’s Warbler (Dendroica kirtlandii), and monitored two known stations of Fassett’s locoweed (Oxytropis campestris var. chartacea). [Note: Discussion on the gray wolf can be found above under the legally minimum requirements for management indicator species].
Canada Lynx (Lynx canadensis) Status – This listed species is not considered a resident species on the Chequamegon-Nicolet National Forest, but is considered a potential visitor. No lynx are currently known to inhabit the CNNF and no lynx analysis units or critical habitat has been designated on the Chequamegon-Nicolet National Forest by the U.S. Fish and Wildlife Service. The Forest conservation strategy revolves around maintaining current elements of lynx habitat and conducting detection surveillance.
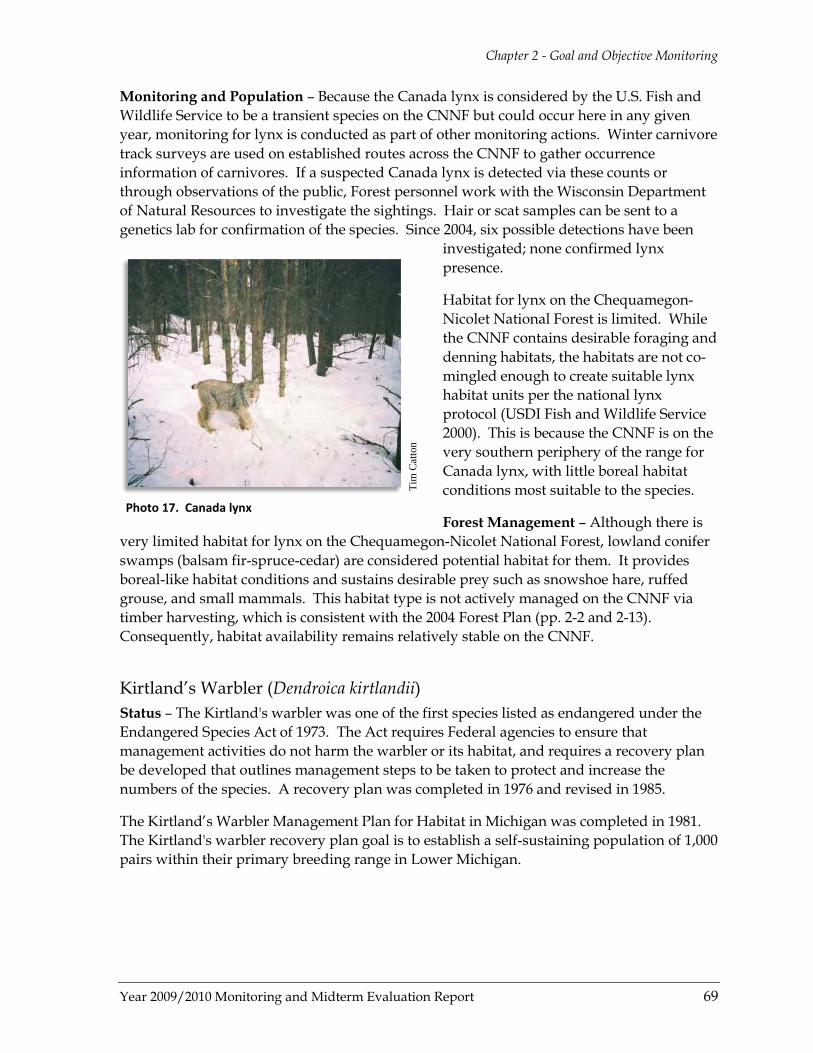
Chapter 2 - Goal and Objective Monitoring
Year 2009/2010 Monitoring and Midterm Evaluation Report 69
Monitoring and Population – Because the Canada lynx is considered by the U.S. Fish and Wildlife Service to be a transient species on the CNNF but could occur here in any given year, monitoring for lynx is conducted as part of other monitoring actions. Winter carnivore track surveys are used on established routes across the CNNF to gather occurrence information of carnivores. If a suspected Canada lynx is detected via these counts or through observations of the public, Forest personnel work with the Wisconsin Department of Natural Resources to investigate the sightings. Hair or scat samples can be sent to a genetics lab for confirmation of the species. Since 2004, six possible detections have been
investigated; none confirmed lynx presence.
Habitat for lynx on the Chequamegon-Nicolet National Forest is limited. While the CNNF contains desirable foraging and denning habitats, the habitats are not co-mingled enough to create suitable lynx habitat units per the national lynx protocol (USDI Fish and Wildlife Service 2000). This is because the CNNF is on the very southern periphery of the range for Canada lynx, with little boreal habitat conditions most suitable to the species.
Forest Management – Although there is very limited habitat for lynx on the Chequamegon-Nicolet National Forest, lowland conifer swamps (balsam fir-spruce-cedar) are considered potential habitat for them. It provides boreal-like habitat conditions and sustains desirable prey such as snowshoe hare, ruffed grouse, and small mammals. This habitat type is not actively managed on the CNNF via timber harvesting, which is consistent with the 2004 Forest Plan (pp. 2-2 and 2-13). Consequently, habitat availability remains relatively stable on the CNNF.
Kirtland’s Warbler (Dendroica kirtlandii) Status – The Kirtland's warbler was one of the first species listed as endangered under the Endangered Species Act of 1973. The Act requires Federal agencies to ensure that management activities do not harm the warbler or its habitat, and requires a recovery plan be developed that outlines management steps to be taken to protect and increase the numbers of the species. A recovery plan was completed in 1976 and revised in 1985.
The Kirtland’s Warbler Management Plan for Habitat in Michigan was completed in 1981. The Kirtland's warbler recovery plan goal is to establish a self-sustaining population of 1,000 pairs within their primary breeding range in Lower Michigan.
Tim
Cat
ton
Photo 17. Canada lynx
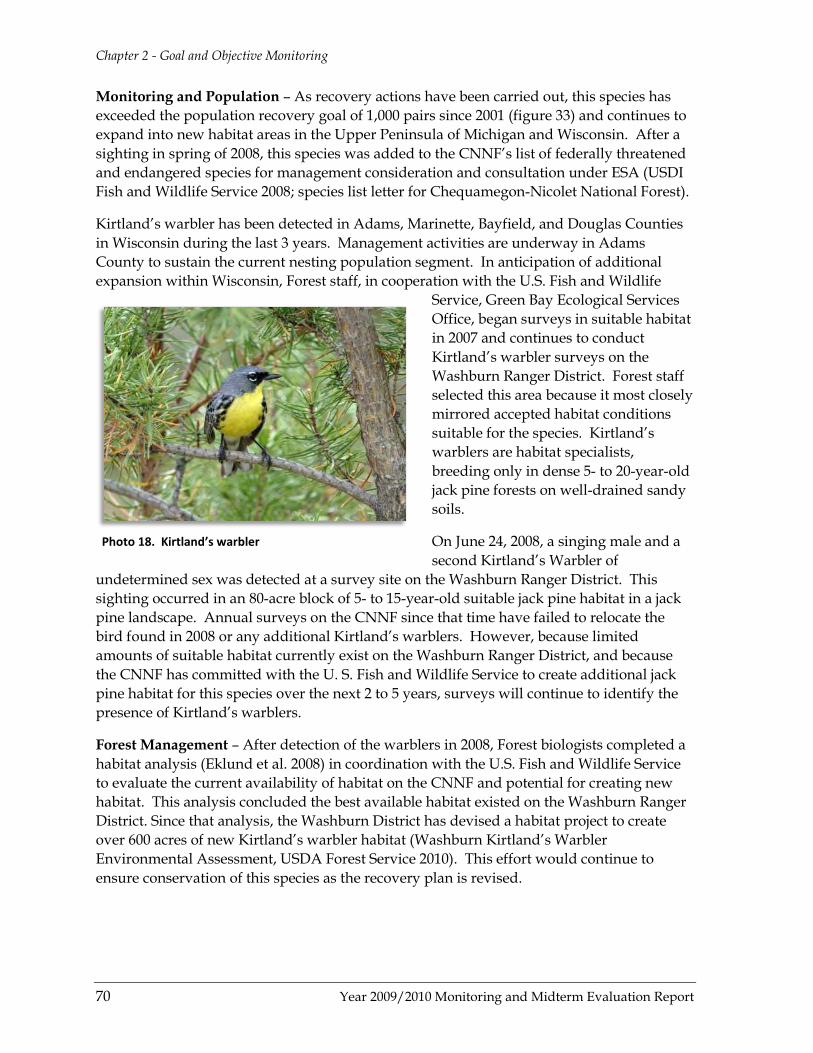
Chapter 2 - Goal and Objective Monitoring
70 Year 2009/2010 Monitoring and Midterm Evaluation Report
Monitoring and Population – As recovery actions have been carried out, this species has exceeded the population recovery goal of 1,000 pairs since 2001 (figure 33) and continues to expand into new habitat areas in the Upper Peninsula of Michigan and Wisconsin. After a sighting in spring of 2008, this species was added to the CNNF’s list of federally threatened and endangered species for management consideration and consultation under ESA (USDI Fish and Wildlife Service 2008; species list letter for Chequamegon-Nicolet National Forest).
Kirtland’s warbler has been detected in Adams, Marinette, Bayfield, and Douglas Counties in Wisconsin during the last 3 years. Management activities are underway in Adams County to sustain the current nesting population segment. In anticipation of additional expansion within Wisconsin, Forest staff, in cooperation with the U.S. Fish and Wildlife
Service, Green Bay Ecological Services Office, began surveys in suitable habitat in 2007 and continues to conduct Kirtland’s warbler surveys on the Washburn Ranger District. Forest staff selected this area because it most closely mirrored accepted habitat conditions suitable for the species. Kirtland’s warblers are habitat specialists, breeding only in dense 5- to 20-year-old jack pine forests on well-drained sandy soils.
On June 24, 2008, a singing male and a second Kirtland’s Warbler of
undetermined sex was detected at a survey site on the Washburn Ranger District. This sighting occurred in an 80-acre block of 5- to 15-year-old suitable jack pine habitat in a jack pine landscape. Annual surveys on the CNNF since that time have failed to relocate the bird found in 2008 or any additional Kirtland’s warblers. However, because limited amounts of suitable habitat currently exist on the Washburn Ranger District, and because the CNNF has committed with the U. S. Fish and Wildlife Service to create additional jack pine habitat for this species over the next 2 to 5 years, surveys will continue to identify the presence of Kirtland’s warblers.
Forest Management – After detection of the warblers in 2008, Forest biologists completed a habitat analysis (Eklund et al. 2008) in coordination with the U.S. Fish and Wildlife Service to evaluate the current availability of habitat on the CNNF and potential for creating new habitat. This analysis concluded the best available habitat existed on the Washburn Ranger District. Since that analysis, the Washburn District has devised a habitat project to create over 600 acres of new Kirtland’s warbler habitat (Washburn Kirtland’s Warbler Environmental Assessment, USDA Forest Service 2010). This effort would continue to ensure conservation of this species as the recovery plan is revised.
Photo 18. Kirtland’s warbler
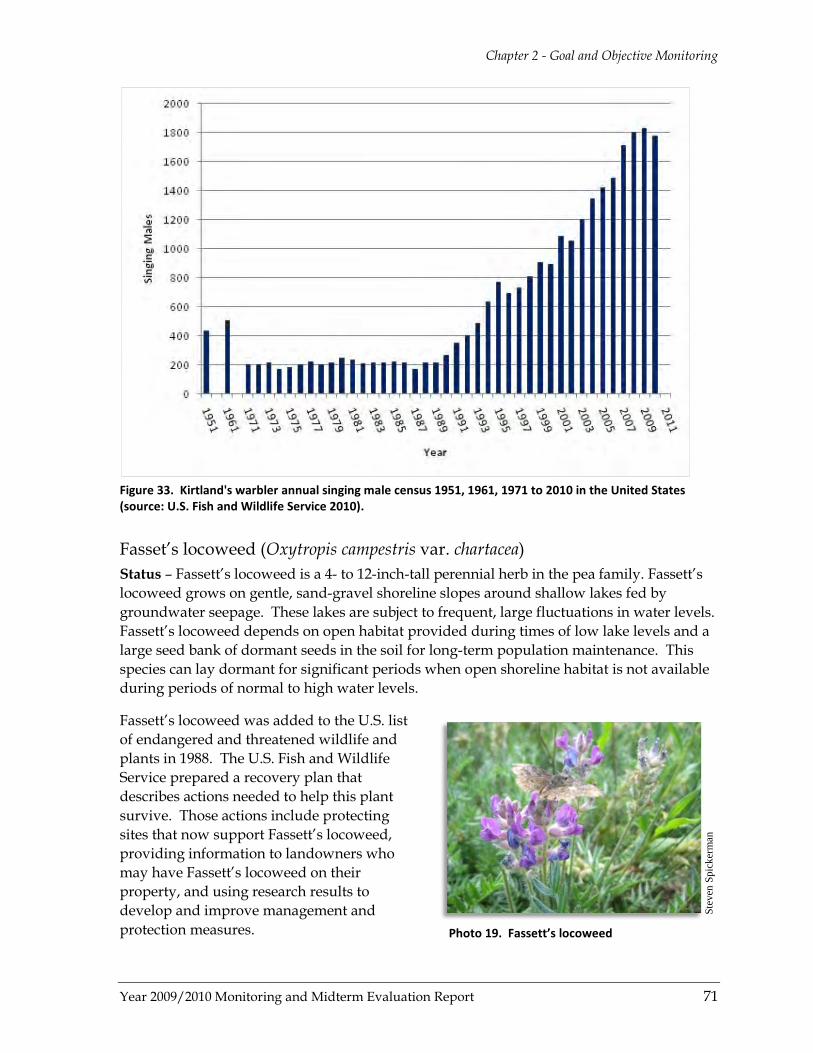
Chapter 2 - Goal and Objective Monitoring
Year 2009/2010 Monitoring and Midterm Evaluation Report 71
Figure 33. Kirtland's warbler annual singing male census 1951, 1961, 1971 to 2010 in the United States (source: U.S. Fish and Wildlife Service 2010).
Fasset’s locoweed (Oxytropis campestris var. chartacea) Status – Fassett’s locoweed is a 4- to 12-inch-tall perennial herb in the pea family. Fassett’s locoweed grows on gentle, sand-gravel shoreline slopes around shallow lakes fed by groundwater seepage. These lakes are subject to frequent, large fluctuations in water levels. Fassett’s locoweed depends on open habitat provided during times of low lake levels and a large seed bank of dormant seeds in the soil for long-term population maintenance. This species can lay dormant for significant periods when open shoreline habitat is not available during periods of normal to high water levels.
Fassett’s locoweed was added to the U.S. list of endangered and threatened wildlife and plants in 1988. The U.S. Fish and Wildlife Service prepared a recovery plan that describes actions needed to help this plant survive. Those actions include protecting sites that now support Fassett’s locoweed, providing information to landowners who may have Fassett’s locoweed on their property, and using research results to develop and improve management and protection measures.
Stev
en S
pick
erm
an
Photo 19. Fassett’s locoweed
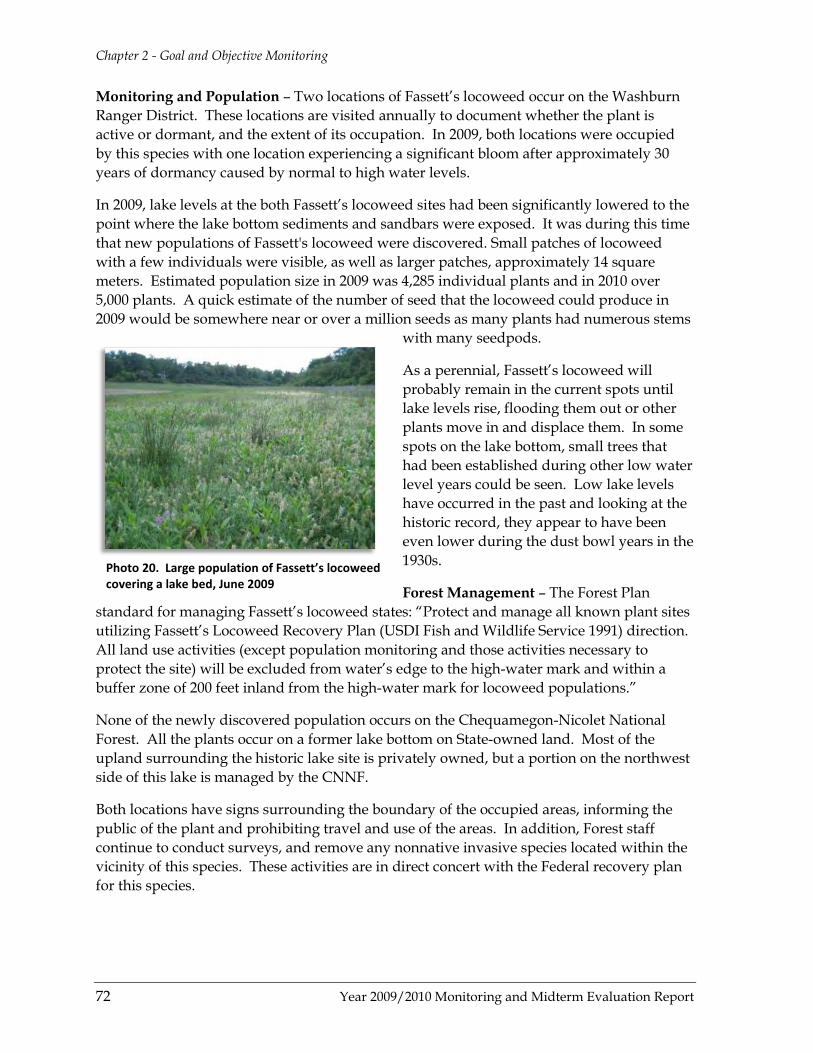
Chapter 2 - Goal and Objective Monitoring
72 Year 2009/2010 Monitoring and Midterm Evaluation Report
Monitoring and Population – Two locations of Fassett’s locoweed occur on the Washburn Ranger District. These locations are visited annually to document whether the plant is active or dormant, and the extent of its occupation. In 2009, both locations were occupied by this species with one location experiencing a significant bloom after approximately 30 years of dormancy caused by normal to high water levels.
In 2009, lake levels at the both Fassett’s locoweed sites had been significantly lowered to the point where the lake bottom sediments and sandbars were exposed. It was during this time that new populations of Fassett's locoweed were discovered. Small patches of locoweed with a few individuals were visible, as well as larger patches, approximately 14 square meters. Estimated population size in 2009 was 4,285 individual plants and in 2010 over 5,000 plants. A quick estimate of the number of seed that the locoweed could produce in 2009 would be somewhere near or over a million seeds as many plants had numerous stems
with many seedpods.
As a perennial, Fassett’s locoweed will probably remain in the current spots until lake levels rise, flooding them out or other plants move in and displace them. In some spots on the lake bottom, small trees that had been established during other low water level years could be seen. Low lake levels have occurred in the past and looking at the historic record, they appear to have been even lower during the dust bowl years in the 1930s.
Forest Management – The Forest Plan standard for managing Fassett’s locoweed states: “Protect and manage all known plant sites utilizing Fassett’s Locoweed Recovery Plan (USDI Fish and Wildlife Service 1991) direction. All land use activities (except population monitoring and those activities necessary to protect the site) will be excluded from water’s edge to the high-water mark and within a buffer zone of 200 feet inland from the high-water mark for locoweed populations.”
None of the newly discovered population occurs on the Chequamegon-Nicolet National Forest. All the plants occur on a former lake bottom on State-owned land. Most of the upland surrounding the historic lake site is privately owned, but a portion on the northwest side of this lake is managed by the CNNF.
Both locations have signs surrounding the boundary of the occupied areas, informing the public of the plant and prohibiting travel and use of the areas. In addition, Forest staff continue to conduct surveys, and remove any nonnative invasive species located within the vicinity of this species. These activities are in direct concert with the Federal recovery plan for this species.
Photo 20. Large population of Fassett’s locoweed covering a lake bed, June 2009

Chapter 2 - Goal and Objective Monitoring
Year 2009/2010 Monitoring and Midterm Evaluation Report 73
Objective 1.1b: Improve habitat conditions for Regional Forester Sensitive Species (RFSS) The Forest Plan states that habitat conditions for Regional Forester-designated sensitive species will be monitored and evaluated at least every 5 years. It is not feasible to conduct such an assessment for each species annually. Consequently, a subset of the results of monitoring of sensitive species populations and their habitats is presented in each annual Forest monitoring report. Which species are highlighted in any given report is determined by a number of factors including whether targeted monitoring or management actions occurred in that year and the level of public interest in the species. Often, changes to habitat are insignificant or immeasurable and the status of the population is a preferred measure for status of the species on the Chequamegon-Nicolet National Forest.
Approximately 18 terrestrial Regional Forester-designated sensitive species are seasonal or permanent residents on the Chequamegon-Nicolet National Forest. Regional Forester sensitive species are those species that are of conservation concern due to population decline, habitat loss, or are sensitive to management changes. These species generally fall into the following coarse habitat associations:
♦ Forest habitats (northern goshawk, red-shouldered hawk, spruce grouse, cerulean warbler, black-backed woodpecker, Connecticut warbler, West Virginia white butterfly and American marten)
♦ Riparian habitats (black tern, trumpeter swan, and wood turtle) ♦ Open land/shrub habitat (Le Conte's sparrow, sharp-tailed grouse, upland
sandpiper, Henry's elfin butterfly, Chryxus arctic butterfly, northern blue butterfly, and tawny crescent butterfly.)
Monitoring for these species occurs across the CNNF at varying intensities depending on the species and the level of management anticipated. Monitoring for these species occurs through the following:
♦ Monitoring of known occupied sites and populations ♦ Pre- and post-project surveys ♦ Collaborative surveys with partners ♦ Research ♦ General surveillance surveys ♦ Opportunistic observation
Swainson’s Thrush (Catharus ustulatus) Swainson’s thrush is one of the North American spotted thrushes within a guild of ground-foraging, mainly insectivorous birds, and is described as a complete long-distance neotropical migrant. It breeds in the western and northern U.S. to Alaska and Canada, and winters from southern Mexico to northern Argentina. Although mainly insectivorous, the bird will eat seeds and fruits. This species has been observed at high densities concurrent with population booms of forest caterpillar species. In Wisconsin and on the
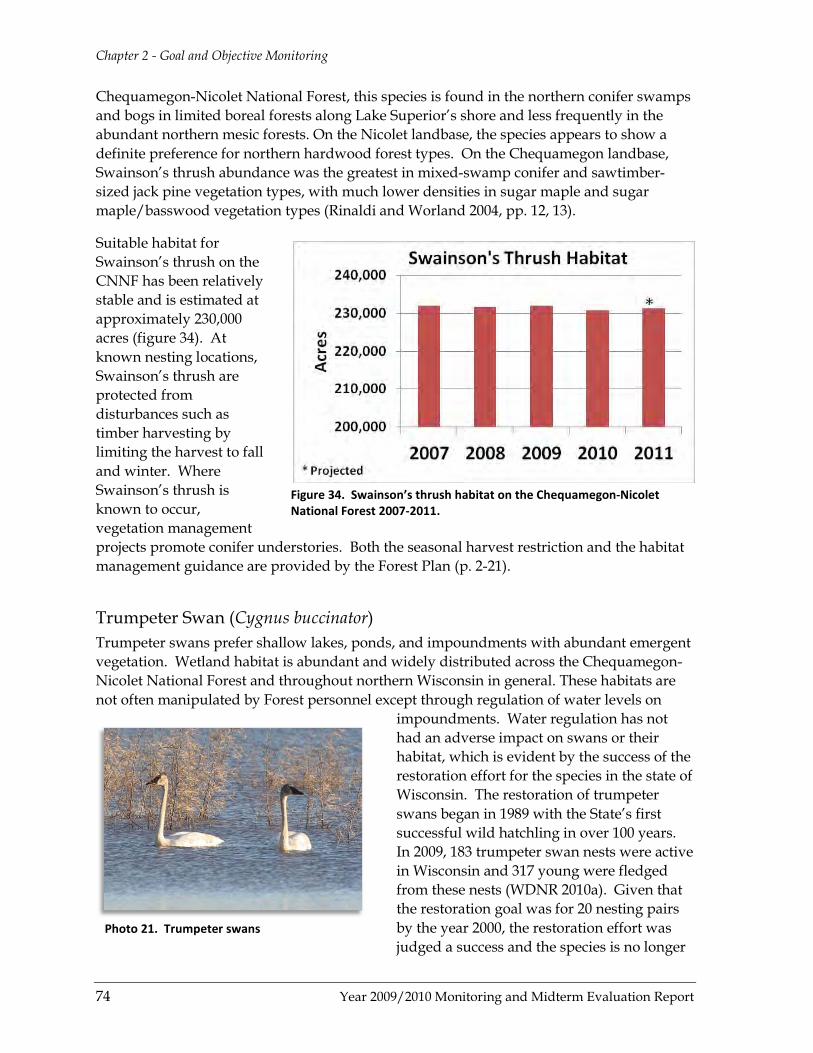
Chapter 2 - Goal and Objective Monitoring
74 Year 2009/2010 Monitoring and Midterm Evaluation Report
Chequamegon-Nicolet National Forest, this species is found in the northern conifer swamps and bogs in limited boreal forests along Lake Superior’s shore and less frequently in the abundant northern mesic forests. On the Nicolet landbase, the species appears to show a definite preference for northern hardwood forest types. On the Chequamegon landbase, Swainson’s thrush abundance was the greatest in mixed-swamp conifer and sawtimber-sized jack pine vegetation types, with much lower densities in sugar maple and sugar maple/basswood vegetation types (Rinaldi and Worland 2004, pp. 12, 13).
Suitable habitat for Swainson’s thrush on the CNNF has been relatively stable and is estimated at approximately 230,000 acres (figure 34). At known nesting locations, Swainson’s thrush are protected from disturbances such as timber harvesting by limiting the harvest to fall and winter. Where Swainson’s thrush is known to occur, vegetation management projects promote conifer understories. Both the seasonal harvest restriction and the habitat management guidance are provided by the Forest Plan (p. 2-21).
Trumpeter Swan (Cygnus buccinator) Trumpeter swans prefer shallow lakes, ponds, and impoundments with abundant emergent vegetation. Wetland habitat is abundant and widely distributed across the Chequamegon-Nicolet National Forest and throughout northern Wisconsin in general. These habitats are not often manipulated by Forest personnel except through regulation of water levels on
impoundments. Water regulation has not had an adverse impact on swans or their habitat, which is evident by the success of the restoration effort for the species in the state of Wisconsin. The restoration of trumpeter swans began in 1989 with the State’s first successful wild hatchling in over 100 years. In 2009, 183 trumpeter swan nests were active in Wisconsin and 317 young were fledged from these nests (WDNR 2010a). Given that the restoration goal was for 20 nesting pairs by the year 2000, the restoration effort was judged a success and the species is no longer
Figure 34. Swainson’s thrush habitat on the Chequamegon-Nicolet National Forest 2007-2011.
Photo 21. Trumpeter swans
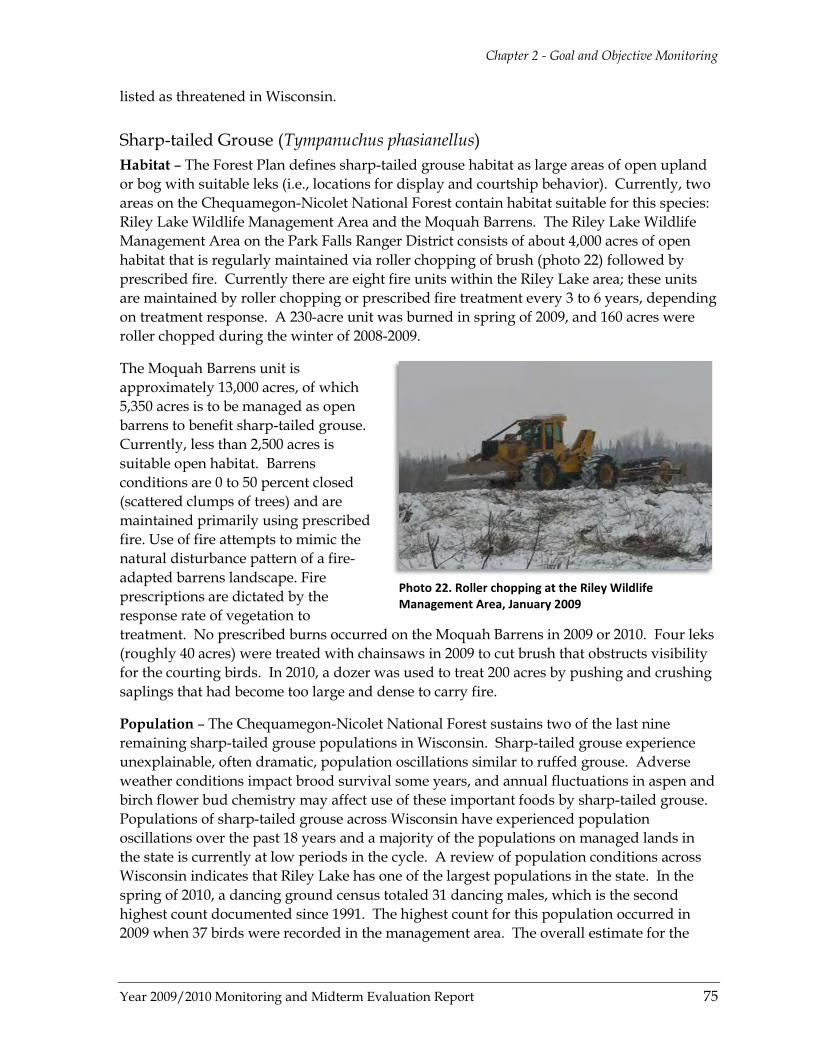
Chapter 2 - Goal and Objective Monitoring
Year 2009/2010 Monitoring and Midterm Evaluation Report 75
listed as threatened in Wisconsin.
Sharp-tailed Grouse (Tympanuchus phasianellus) Habitat – The Forest Plan defines sharp-tailed grouse habitat as large areas of open upland or bog with suitable leks (i.e., locations for display and courtship behavior). Currently, two areas on the Chequamegon-Nicolet National Forest contain habitat suitable for this species: Riley Lake Wildlife Management Area and the Moquah Barrens. The Riley Lake Wildlife Management Area on the Park Falls Ranger District consists of about 4,000 acres of open habitat that is regularly maintained via roller chopping of brush (photo 22) followed by prescribed fire. Currently there are eight fire units within the Riley Lake area; these units are maintained by roller chopping or prescribed fire treatment every 3 to 6 years, depending on treatment response. A 230-acre unit was burned in spring of 2009, and 160 acres were roller chopped during the winter of 2008-2009.
The Moquah Barrens unit is approximately 13,000 acres, of which 5,350 acres is to be managed as open barrens to benefit sharp-tailed grouse. Currently, less than 2,500 acres is suitable open habitat. Barrens conditions are 0 to 50 percent closed (scattered clumps of trees) and are maintained primarily using prescribed fire. Use of fire attempts to mimic the natural disturbance pattern of a fire-adapted barrens landscape. Fire prescriptions are dictated by the response rate of vegetation to treatment. No prescribed burns occurred on the Moquah Barrens in 2009 or 2010. Four leks (roughly 40 acres) were treated with chainsaws in 2009 to cut brush that obstructs visibility for the courting birds. In 2010, a dozer was used to treat 200 acres by pushing and crushing saplings that had become too large and dense to carry fire.
Population – The Chequamegon-Nicolet National Forest sustains two of the last nine remaining sharp-tailed grouse populations in Wisconsin. Sharp-tailed grouse experience unexplainable, often dramatic, population oscillations similar to ruffed grouse. Adverse weather conditions impact brood survival some years, and annual fluctuations in aspen and birch flower bud chemistry may affect use of these important foods by sharp-tailed grouse. Populations of sharp-tailed grouse across Wisconsin have experienced population oscillations over the past 18 years and a majority of the populations on managed lands in the state is currently at low periods in the cycle. A review of population conditions across Wisconsin indicates that Riley Lake has one of the largest populations in the state. In the spring of 2010, a dancing ground census totaled 31 dancing males, which is the second highest count documented since 1991. The highest count for this population occurred in 2009 when 37 birds were recorded in the management area. The overall estimate for the
Photo 22. Roller chopping at the Riley Wildlife Management Area, January 2009
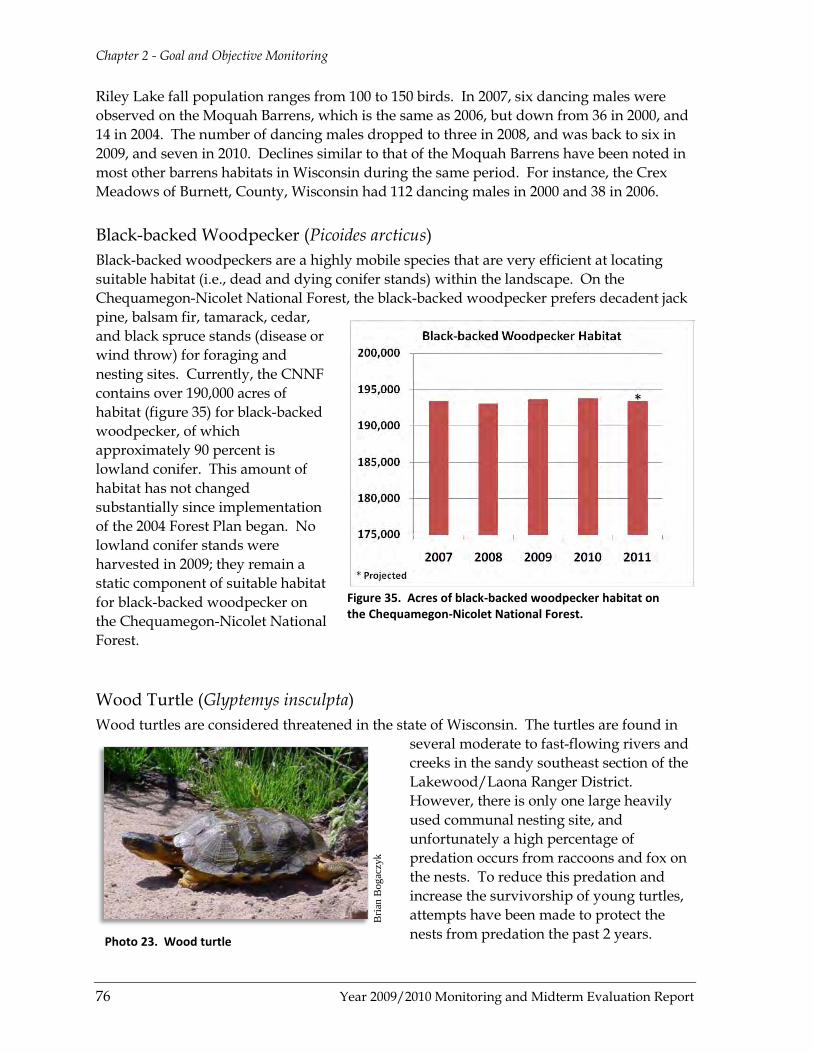
Chapter 2 - Goal and Objective Monitoring
76 Year 2009/2010 Monitoring and Midterm Evaluation Report
Riley Lake fall population ranges from 100 to 150 birds. In 2007, six dancing males were observed on the Moquah Barrens, which is the same as 2006, but down from 36 in 2000, and 14 in 2004. The number of dancing males dropped to three in 2008, and was back to six in 2009, and seven in 2010. Declines similar to that of the Moquah Barrens have been noted in most other barrens habitats in Wisconsin during the same period. For instance, the Crex Meadows of Burnett, County, Wisconsin had 112 dancing males in 2000 and 38 in 2006.
Black-backed Woodpecker (Picoides arcticus) Black-backed woodpeckers are a highly mobile species that are very efficient at locating suitable habitat (i.e., dead and dying conifer stands) within the landscape. On the Chequamegon-Nicolet National Forest, the black-backed woodpecker prefers decadent jack pine, balsam fir, tamarack, cedar, and black spruce stands (disease or wind throw) for foraging and nesting sites. Currently, the CNNF contains over 190,000 acres of habitat (figure 35) for black-backed woodpecker, of which approximately 90 percent is lowland conifer. This amount of habitat has not changed substantially since implementation of the 2004 Forest Plan began. No lowland conifer stands were harvested in 2009; they remain a static component of suitable habitat for black-backed woodpecker on the Chequamegon-Nicolet National Forest.
Wood Turtle (Glyptemys insculpta) Wood turtles are considered threatened in the state of Wisconsin. The turtles are found in
several moderate to fast-flowing rivers and creeks in the sandy southeast section of the Lakewood/Laona Ranger District. However, there is only one large heavily used communal nesting site, and unfortunately a high percentage of predation occurs from raccoons and fox on the nests. To reduce this predation and increase the survivorship of young turtles, attempts have been made to protect the nests from predation the past 2 years.
Figure 35. Acres of black-backed woodpecker habitat on the Chequamegon-Nicolet National Forest.
Bria
n B
ogac
zyk
Photo 23. Wood turtle
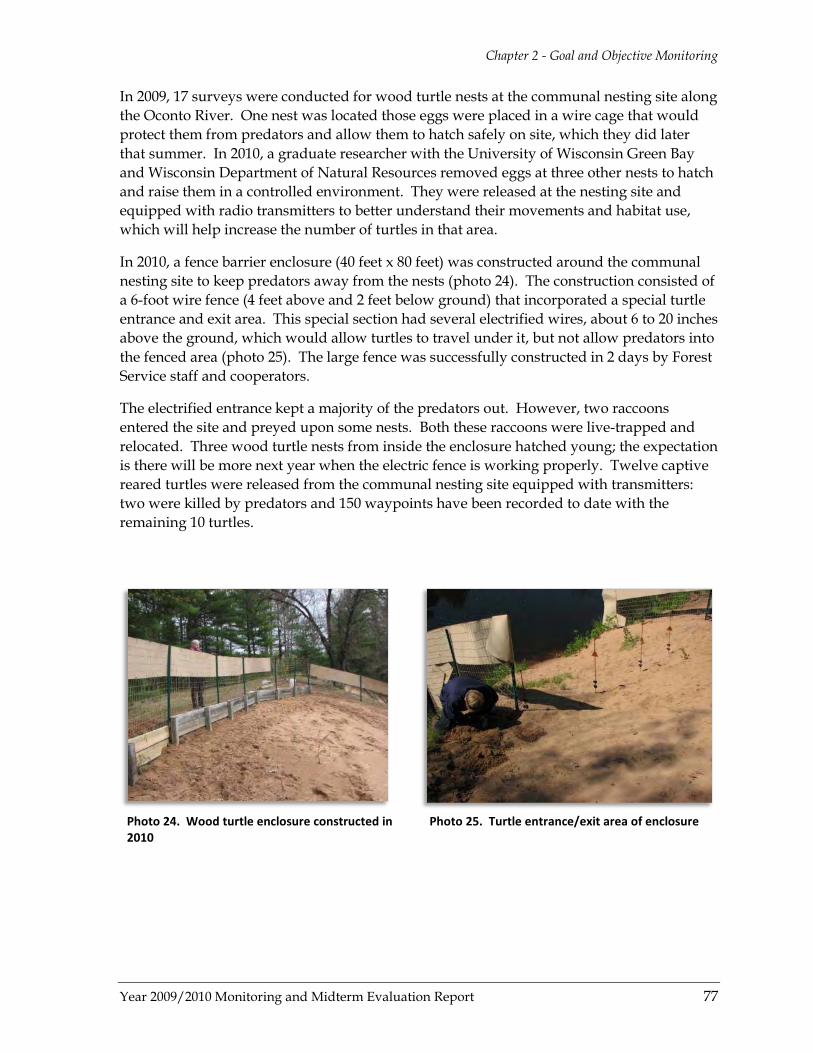
Chapter 2 - Goal and Objective Monitoring
Year 2009/2010 Monitoring and Midterm Evaluation Report 77
In 2009, 17 surveys were conducted for wood turtle nests at the communal nesting site along the Oconto River. One nest was located those eggs were placed in a wire cage that would protect them from predators and allow them to hatch safely on site, which they did later that summer. In 2010, a graduate researcher with the University of Wisconsin Green Bay and Wisconsin Department of Natural Resources removed eggs at three other nests to hatch and raise them in a controlled environment. They were released at the nesting site and equipped with radio transmitters to better understand their movements and habitat use, which will help increase the number of turtles in that area.
In 2010, a fence barrier enclosure (40 feet x 80 feet) was constructed around the communal nesting site to keep predators away from the nests (photo 24). The construction consisted of a 6-foot wire fence (4 feet above and 2 feet below ground) that incorporated a special turtle entrance and exit area. This special section had several electrified wires, about 6 to 20 inches above the ground, which would allow turtles to travel under it, but not allow predators into the fenced area (photo 25). The large fence was successfully constructed in 2 days by Forest Service staff and cooperators.
The electrified entrance kept a majority of the predators out. However, two raccoons entered the site and preyed upon some nests. Both these raccoons were live-trapped and relocated. Three wood turtle nests from inside the enclosure hatched young; the expectation is there will be more next year when the electric fence is working properly. Twelve captive reared turtles were released from the communal nesting site equipped with transmitters: two were killed by predators and 150 waypoints have been recorded to date with the remaining 10 turtles.
Photo 24. Wood turtle enclosure constructed in 2010
Photo 25. Turtle entrance/exit area of enclosure

Chapter 2 - Goal and Objective Monitoring
78 Year 2009/2010 Monitoring and Midterm Evaluation Report
Goal 1.2 – Ecological Communities of Special Concern Objective 1.2: Conserve special environmental, cultural, social and/or scientific values in protected areas including Wilderness, Wild and Scenic Rivers, Research Natural Areas, special management areas and old growth areas Research Natural Areas (RNAs) were established within the Chequamegon-Nicolet National Forest to provide a network of high-quality ecosystems for research, monitoring, and education. They serve as reference areas for documenting ecological processes, and baselines for evaluating the effects of manipulative research and management practices. Research natural areas also fill an important niche in biological conservation and natural community protection.
Newly revised national direction (FSM 4063) reaffirms the agency’s dedication to Research Natural Areas, which are co-managed by the National Forest Systems and Research branches of the Forest Service, providing mutual benefits to both. Prior to the Forest Plan revision, there were 11 areas designated as Research Natural Areas. The Forest Plan then identified 40 more areas as proposed or “candidate” Research Natural Areas (cRNAs). In 2008-2009, a joint Eastern Region and Northern Research Station committee (Nowacki et al. 2008) conducted a region-wide assessment of all candidate Research Natural Areas to help identify which of those proposed had greatest value for establishment purposes.
The region-wide assessment resulted in the recommendation of 20 of the original 40 candidate Research Natural Areas proposed by the Forest Plan to become established Research Natural Areas (Table 25). Those candidate areas that were not selected for establishment are still designated as candidates and will continue to be managed as if they were established research natural areas until an interdisciplinary team can review the designation. The candidate RNAs are now designated as State Natural Areas by the State of Wisconsin.
Table 25. Current listing of candidate (cRNA) and established (RNA) Research Natural Areas on the CNNF.
Site Name 2004 Forest Plan
management area assignment
2010 Designation1
Atkins-Hiles Swamp cRNA RNA Battle Creek cRNA RNA Bear Creek cRNA RNA Bear Lake Slough cRNA cRNA Bearsdale Creek & Hyatt Spring cRNA RNA Black Creek Bog cRNA cRNA Blackjack Springs Wilderness cRNA cRNA Brunsweiler River & Mineral Lake cRNA RNA Brush Creek cRNA RNA Camp 3 Lake/Peshtigo River Bottom cRNA cRNA Camp Nine Pines cRNA RNA

Chapter 2 - Goal and Objective Monitoring
Year 2009/2010 Monitoring and Midterm Evaluation Report 79
Table 25. Current listing of candidate (cRNA) and established (RNA) Research Natural Areas on the CNNF.
Site Name 2004 Forest Plan
management area assignment
2010 Designation1
Chequamegon Hardwoods*
RNA County E & Mondeaux cRNA RNA Doering Tract cRNA cRNA Dry Lake cRNA RNA Echo Lake cRNA RNA Elk River Valley cRNA cRNA English Lake cRNA cRNA Fairy Land*
RNA
Foulds Creek cRNA RNA Franklin-Butternut Lakes* (Bose Lake RNA)
RNA
Ghost Lake cRNA cRNA Grandma Lake/Riley Lake*
RNA
Headwater Lakes cRNA RNA Hwy GG/Upper Brunet River cRNA cRNA Kidrick Swamp cRNA cRNA McCarthy Lake & Cedars*
RNA
McCaslin Mountain*
RNA Memorial Grove*
RNA
Moose River Cedar Hills cRNA cRNA Moquah Natural Area*
RNA
Namekagon Fen cRNA cRNA No-name Lake cRNA RNA North Branch Bottoms cRNA cRNA Rat Lake Swamp-Popple River Headwaters cRNA RNA Richter Lake cRNA RNA Scott-Shelp Lakes cRNA cRNA Silver Creek & Mondeaux River cRNA cRNA Snoose Creek cRNA cRNA South Branch Beech Grove cRNA RNA Spider Lake Ash Swamp*
RNA
St. Peter's Dome cRNA RNA Thornapple cRNA cRNA Tucker Lake* expansion
RNA
Twin Lakes Bog*
RNA Waupee Lake Swamp cRNA RNA Wheeler Lake cRNA cRNA Wilson Lake (Wilson Creek Wetlands) cRNA RNA Woods Creek cRNA cRNA
* Existing RNAs established prior to 2004 Forest Plan revisions. 1. Final designation pending completion of establishment records.
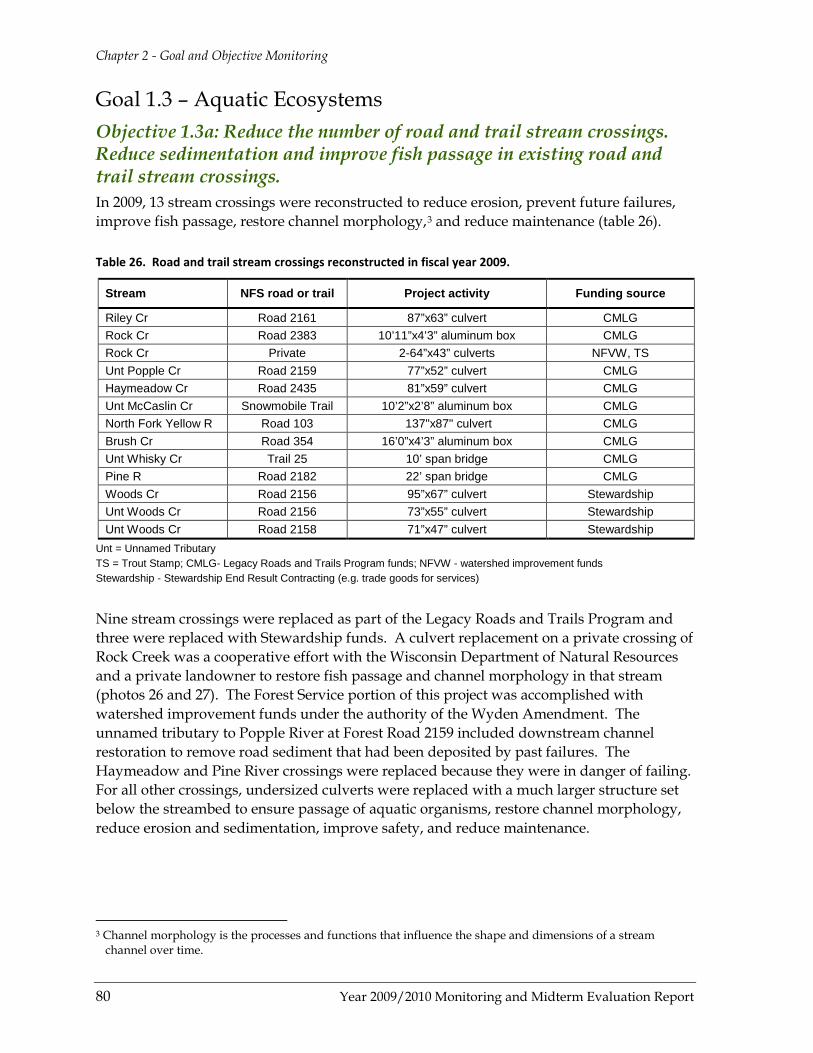
Chapter 2 - Goal and Objective Monitoring
80 Year 2009/2010 Monitoring and Midterm Evaluation Report
Goal 1.3 – Aquatic Ecosystems Objective 1.3a: Reduce the number of road and trail stream crossings. Reduce sedimentation and improve fish passage in existing road and trail stream crossings. In 2009, 13 stream crossings were reconstructed to reduce erosion, prevent future failures, improve fish passage, restore channel morphology,3 table 26 and reduce maintenance ( ).
Table 26. Road and trail stream crossings reconstructed in fiscal year 2009.
Stream NFS road or trail Project activity Funding source
Riley Cr Road 2161 87”x63” culvert CMLG Rock Cr Road 2383 10’11”x4’3” aluminum box CMLG Rock Cr Private 2-64”x43” culverts NFVW, TS Unt Popple Cr Road 2159 77”x52” culvert CMLG Haymeadow Cr Road 2435 81”x59” culvert CMLG Unt McCaslin Cr Snowmobile Trail 10’2”x2’8” aluminum box CMLG North Fork Yellow R Road 103 137"x87" culvert CMLG Brush Cr Road 354 16’0”x4’3” aluminum box CMLG Unt Whisky Cr Trail 25 10’ span bridge CMLG Pine R Road 2182 22’ span bridge CMLG Woods Cr Road 2156 95”x67” culvert Stewardship Unt Woods Cr Road 2156 73”x55” culvert Stewardship Unt Woods Cr Road 2158 71”x47” culvert Stewardship
Unt = Unnamed Tributary TS = Trout Stamp; CMLG- Legacy Roads and Trails Program funds; NFVW - watershed improvement funds Stewardship - Stewardship End Result Contracting (e.g. trade goods for services)
Nine stream crossings were replaced as part of the Legacy Roads and Trails Program and three were replaced with Stewardship funds. A culvert replacement on a private crossing of Rock Creek was a cooperative effort with the Wisconsin Department of Natural Resources and a private landowner to restore fish passage and channel morphology in that stream (photos 26 and 27). The Forest Service portion of this project was accomplished with watershed improvement funds under the authority of the Wyden Amendment. The unnamed tributary to Popple River at Forest Road 2159 included downstream channel restoration to remove road sediment that had been deposited by past failures. The Haymeadow and Pine River crossings were replaced because they were in danger of failing. For all other crossings, undersized culverts were replaced with a much larger structure set below the streambed to ensure passage of aquatic organisms, restore channel morphology, reduce erosion and sedimentation, improve safety, and reduce maintenance.
3 Channel morphology is the processes and functions that influence the shape and dimensions of a stream
channel over time.
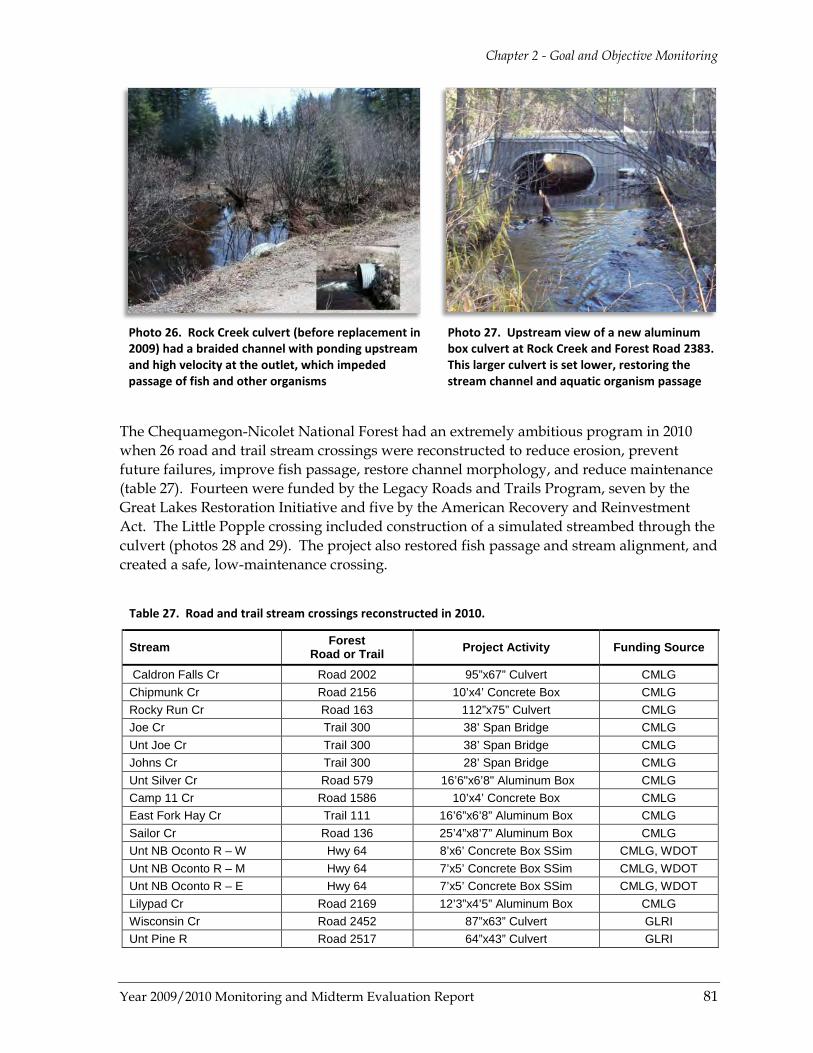
Chapter 2 - Goal and Objective Monitoring
Year 2009/2010 Monitoring and Midterm Evaluation Report 81
Photo 26. Rock Creek culvert (before replacement in 2009) had a braided channel with ponding upstream and high velocity at the outlet, which impeded passage of fish and other organisms
Photo 27. Upstream view of a new aluminum box culvert at Rock Creek and Forest Road 2383. This larger culvert is set lower, restoring the stream channel and aquatic organism passage
The Chequamegon-Nicolet National Forest had an extremely ambitious program in 2010 when 26 road and trail stream crossings were reconstructed to reduce erosion, prevent future failures, improve fish passage, restore channel morphology, and reduce maintenance (table 27). Fourteen were funded by the Legacy Roads and Trails Program, seven by the Great Lakes Restoration Initiative and five by the American Recovery and Reinvestment Act. The Little Popple crossing included construction of a simulated streambed through the culvert (photos 28 and 29). The project also restored fish passage and stream alignment, and created a safe, low-maintenance crossing.
Table 27. Road and trail stream crossings reconstructed in 2010.
Stream Forest Road or Trail Project Activity Funding Source
Caldron Falls Cr Road 2002 95”x67” Culvert CMLG Chipmunk Cr Road 2156 10’x4’ Concrete Box CMLG Rocky Run Cr Road 163 112”x75” Culvert CMLG Joe Cr Trail 300 38’ Span Bridge CMLG Unt Joe Cr Trail 300 38’ Span Bridge CMLG Johns Cr Trail 300 28’ Span Bridge CMLG Unt Silver Cr Road 579 16’6"x6’8" Aluminum Box CMLG Camp 11 Cr Road 1586 10’x4’ Concrete Box CMLG East Fork Hay Cr Trail 111 16’6”x6’8” Aluminum Box CMLG Sailor Cr Road 136 25’4”x8’7” Aluminum Box CMLG Unt NB Oconto R – W Hwy 64 8’x6’ Concrete Box SSim CMLG, WDOT Unt NB Oconto R – M Hwy 64 7’x5’ Concrete Box SSim CMLG, WDOT Unt NB Oconto R – E Hwy 64 7’x5’ Concrete Box SSim CMLG, WDOT Lilypad Cr Road 2169 12’3”x4’5” Aluminum Box CMLG Wisconsin Cr Road 2452 87”x63” Culvert GLRI Unt Pine R Road 2517 64”x43” Culvert GLRI
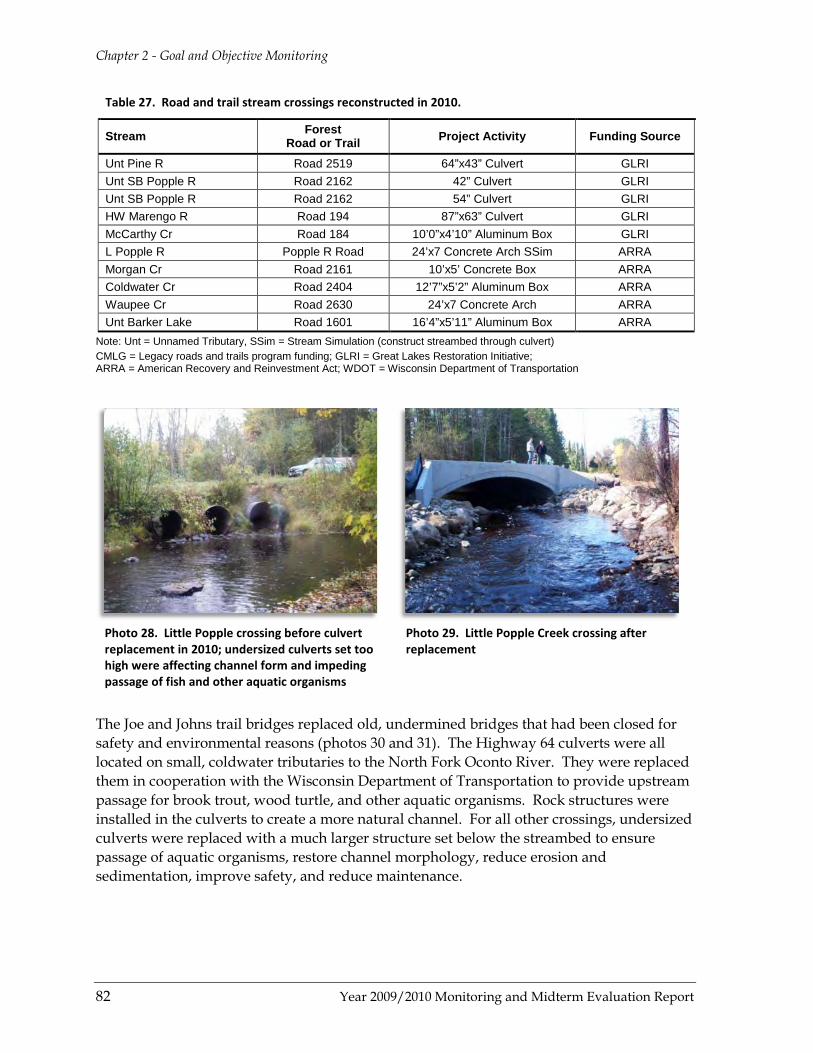
Chapter 2 - Goal and Objective Monitoring
82 Year 2009/2010 Monitoring and Midterm Evaluation Report
Table 27. Road and trail stream crossings reconstructed in 2010.
Stream Forest Road or Trail Project Activity Funding Source
Unt Pine R Road 2519 64”x43” Culvert GLRI Unt SB Popple R Road 2162 42” Culvert GLRI Unt SB Popple R Road 2162 54” Culvert GLRI HW Marengo R Road 194 87”x63” Culvert GLRI McCarthy Cr Road 184 10’0”x4’10” Aluminum Box GLRI L Popple R Popple R Road 24’x7 Concrete Arch SSim ARRA Morgan Cr Road 2161 10’x5’ Concrete Box ARRA Coldwater Cr Road 2404 12’7”x5’2” Aluminum Box ARRA Waupee Cr Road 2630 24’x7 Concrete Arch ARRA Unt Barker Lake Road 1601 16’4”x5’11” Aluminum Box ARRA
Note: Unt = Unnamed Tributary, SSim = Stream Simulation (construct streambed through culvert) CMLG = Legacy roads and trails program funding; GLRI = Great Lakes Restoration Initiative; ARRA = American Recovery and Reinvestment Act; WDOT = Wisconsin Department of Transportation
Photo 28. Little Popple crossing before culvert replacement in 2010; undersized culverts set too high were affecting channel form and impeding passage of fish and other aquatic organisms
Photo 29. Little Popple Creek crossing after replacement
The Joe and Johns trail bridges replaced old, undermined bridges that had been closed for safety and environmental reasons (photos 30 and 31). The Highway 64 culverts were all located on small, coldwater tributaries to the North Fork Oconto River. They were replaced them in cooperation with the Wisconsin Department of Transportation to provide upstream passage for brook trout, wood turtle, and other aquatic organisms. Rock structures were installed in the culverts to create a more natural channel. For all other crossings, undersized culverts were replaced with a much larger structure set below the streambed to ensure passage of aquatic organisms, restore channel morphology, reduce erosion and sedimentation, improve safety, and reduce maintenance.
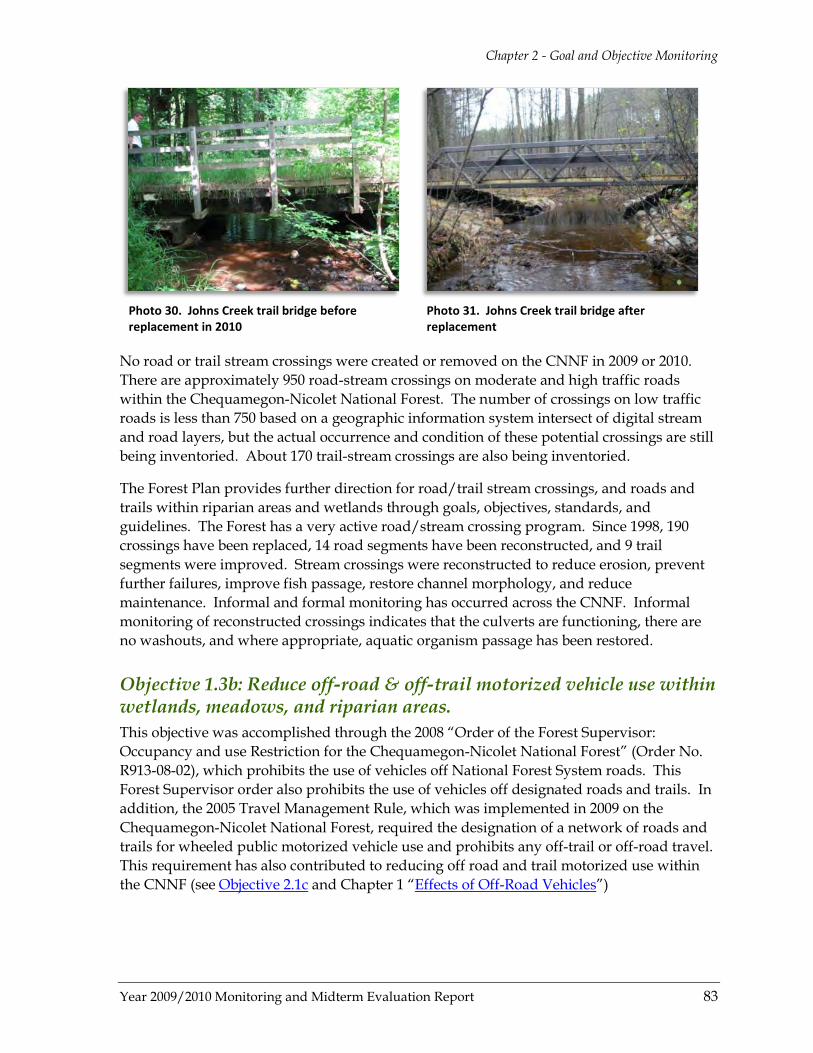
Chapter 2 - Goal and Objective Monitoring
Year 2009/2010 Monitoring and Midterm Evaluation Report 83
Photo 30. Johns Creek trail bridge before replacement in 2010
Photo 31. Johns Creek trail bridge after replacement
No road or trail stream crossings were created or removed on the CNNF in 2009 or 2010. There are approximately 950 road-stream crossings on moderate and high traffic roads within the Chequamegon-Nicolet National Forest. The number of crossings on low traffic roads is less than 750 based on a geographic information system intersect of digital stream and road layers, but the actual occurrence and condition of these potential crossings are still being inventoried. About 170 trail-stream crossings are also being inventoried.
The Forest Plan provides further direction for road/trail stream crossings, and roads and trails within riparian areas and wetlands through goals, objectives, standards, and guidelines. The Forest has a very active road/stream crossing program. Since 1998, 190 crossings have been replaced, 14 road segments have been reconstructed, and 9 trail segments were improved. Stream crossings were reconstructed to reduce erosion, prevent further failures, improve fish passage, restore channel morphology, and reduce maintenance. Informal and formal monitoring has occurred across the CNNF. Informal monitoring of reconstructed crossings indicates that the culverts are functioning, there are no washouts, and where appropriate, aquatic organism passage has been restored.
Objective 1.3b: Reduce off-road & off-trail motorized vehicle use within wetlands, meadows, and riparian areas. This objective was accomplished through the 2008 “Order of the Forest Supervisor: Occupancy and use Restriction for the Chequamegon-Nicolet National Forest” (Order No. R913-08-02), which prohibits the use of vehicles off National Forest System roads. This Forest Supervisor order also prohibits the use of vehicles off designated roads and trails. In addition, the 2005 Travel Management Rule, which was implemented in 2009 on the Chequamegon-Nicolet National Forest, required the designation of a network of roads and trails for wheeled public motorized vehicle use and prohibits any off-trail or off-road travel. This requirement has also contributed to reducing off road and trail motorized use within the CNNF (see Objective 2.1c and Chapter 1 “Effects of Off-Road Vehicles”)

Chapter 2 - Goal and Objective Monitoring
84 Year 2009/2010 Monitoring and Midterm Evaluation Report
Objective 1.3c: Restore large woody debris by annually treating some lakes with tree drops and/or cribs. Consult with the Native American Tribes when proposing this treatment on lakes where spear fishing occurs. See Objective 1.3e below.
Objective 1.3d: Relocate some existing roads and trails out of riparian management zones. Riparian management zones generally include a 100-foot distance around all streams, lakes, and ponds. The length of roads and trails within riparian management zones provides an index of potential impact to stream water quality and channel morphology from sedimentation. Any erosion from road and trail surfaces in riparian management zones has the potential for delivery to the waterbody because of its close proximity. In this sense, the distance of roads and trails in riparian management zones can be considered an estimate or approximation of their hydrologic connection to waterbodies. A geographic information system (GIS) analysis to determine the length of roads and trails in riparian management zones was conducted for the Travel Management Rule in 2008. That analysis used the CNNF’s GIS layers for roads and trails and a 100-foot buffer around all stream, lakes, and ponds using the 1:24,000 scale hydrography layer. Based on that analysis, there are 160 miles of road and trail located within riparian management zones on the CNNF (table 28).
Table 28. Length of roads and trails in riparian management zones.
Maintenance level Miles in riparian management zone
1 (Road closed to motorized traffic) low traffic 25 2 (Road suitable and open for high clearance vehicles; passenger car traffic
not a consideration) low traffic 39
3 (Road open and maintained for passenger car travel, i.e., single lane with spot surfacing) moderate traffic 11
4 (Road open for travel at moderate speeds with moderate convenience) high traffic 34
5 (Road open and provides high degree of user convenience; i.e., double lane paved) high traffic 29
Trail/other 22 Total 160
Photo 32. Decommissioned trail relocated out of East Fork Chippewa River riparian management zone
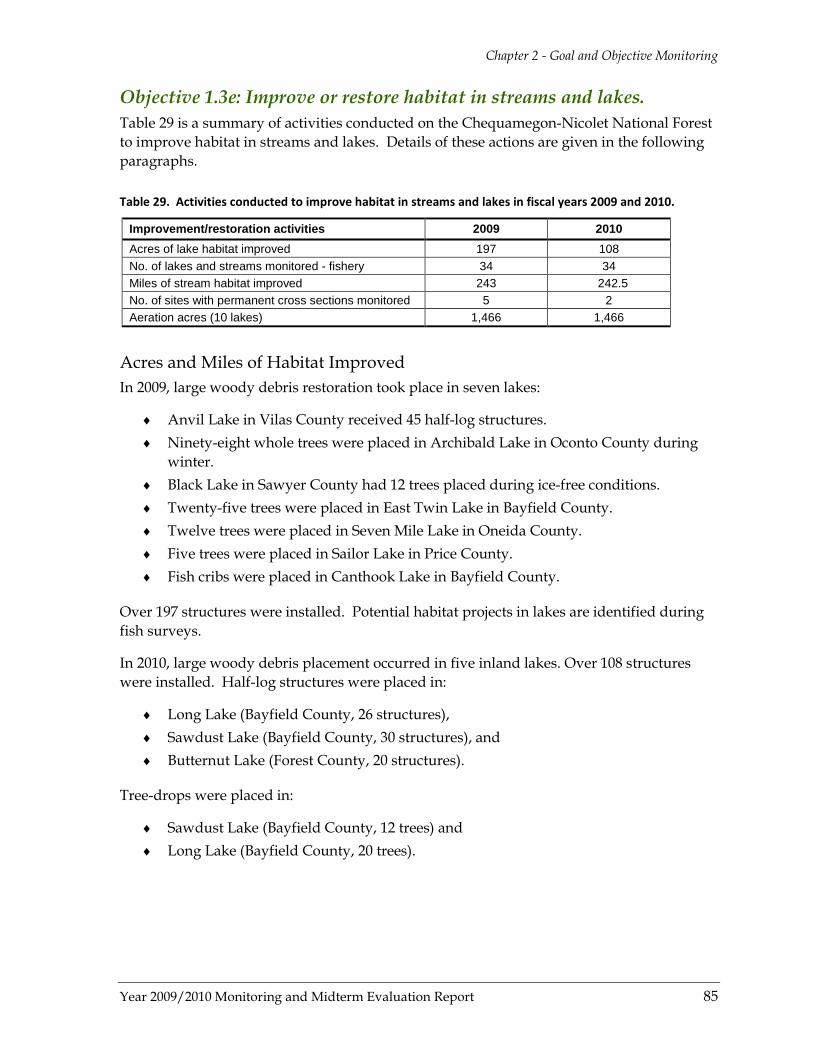
Chapter 2 - Goal and Objective Monitoring
Year 2009/2010 Monitoring and Midterm Evaluation Report 85
Objective 1.3e: Improve or restore habitat in streams and lakes. Table 29 is a summary of activities conducted on the Chequamegon-Nicolet National Forest to improve habitat in streams and lakes. Details of these actions are given in the following paragraphs.
Table 29. Activities conducted to improve habitat in streams and lakes in fiscal years 2009 and 2010.
Improvement/restoration activities 2009 2010 Acres of lake habitat improved 197 108 No. of lakes and streams monitored - fishery 34 34 Miles of stream habitat improved 243 242.5 No. of sites with permanent cross sections monitored 5 2 Aeration acres (10 lakes) 1,466 1,466
Acres and Miles of Habitat Improved In 2009, large woody debris restoration took place in seven lakes:
♦ Anvil Lake in Vilas County received 45 half-log structures. ♦ Ninety-eight whole trees were placed in Archibald Lake in Oconto County during
winter. ♦ Black Lake in Sawyer County had 12 trees placed during ice-free conditions. ♦ Twenty-five trees were placed in East Twin Lake in Bayfield County. ♦ Twelve trees were placed in Seven Mile Lake in Oneida County. ♦ Five trees were placed in Sailor Lake in Price County. ♦ Fish cribs were placed in Canthook Lake in Bayfield County.
Over 197 structures were installed. Potential habitat projects in lakes are identified during fish surveys.
In 2010, large woody debris placement occurred in five inland lakes. Over 108 structures were installed. Half-log structures were placed in:
♦ Long Lake (Bayfield County, 26 structures), ♦ Sawdust Lake (Bayfield County, 30 structures), and ♦ Butternut Lake (Forest County, 20 structures).
Tree-drops were placed in:
♦ Sawdust Lake (Bayfield County, 12 trees) and ♦ Long Lake (Bayfield County, 20 trees).

Chapter 2 - Goal and Objective Monitoring
86 Year 2009/2010 Monitoring and Midterm Evaluation Report
♦ Instream habitat restoration work occurred on seven classified trout streams (Deerskin, Swanson, Michigan, McCaslin, Foulds, Venison, and Brule River) in 2009 and along five trout streams (Deerskin, Swanson, McCaslin, Foulds, Twentymile, and Brule River) in 2010. Restoration work, which included a mixture of brush bundles, brushing, and large wood placement, narrowed the streams and improved habitat complexity. All work was done in partnership with various chapters of Trout Unlimited and Wisconsin Department of Natural Resources. In addition, approximately 240 miles of brook trout habitat were improved in 2009 and 2010 by maintaining free flowing conditions through the management of beaver (see Objective 1.5b).
♦ The Brule River project, which is a three-year project conducted in cooperation with Michigan Department of Natural Resources, Wisconsin Department of Natural Resources, WE Energies and private landowners, placed 140 whole trees along a 0.75 mile stretch of the Brule river in 2009 and 161 trees along a 1.25 mile stretch in 2010. The trees, which were taken from State of Michigan lands, were placed using a helicopter (photo 33).
Instream Habitat Monitoring (Permanent Cross-sections) Natural instream habitat restoration techniques using material removed from the thalweg4
Six instream projects (Allen, Elvoy, Brule Creek, North Otter, North Branch Oconto and South Fork Flambeau) were establishedwith permanent cross-sections to monitor stability of channel morphology. Sites at Allen, Elvoy and North Otter are no longer measured annually as monitoring data indicated the channels have stabilized.
and placed on the inside bend of the stream channel to create a narrower, deeper channel are monitored through permanent cross-sections to determine if the restored channel dimensions remain stable. Because there was some concern about how narrow and deep the channel should be, permanent cross-sections were established in a variety of channel types so changes could be monitored. If the monitoring data from the cross-sections indicated that the channel morphology stabilized, the restoration technique was deemed a success.
4 The line defining the lowest points along the length of a riverbed or valley.
Photo 33. Helicopter placement of whole trees for fish habitat improvement on the Brule River

Chapter 2 - Goal and Objective Monitoring
Year 2009/2010 Monitoring and Midterm Evaluation Report 87
In addition to the permanent cross-sections for monitoring instream habitat restoration,stream channel morphology is also monitored after culvert installations. Monitoring of the stream channel morphology with permanent cross-sections determine if the culvert was properly placed. Improper installation of culverts can impact the stream channel by causing water ponding upstream, frequent washouts, blocking fish passage, and increasing sedimentation from road surface runoff.
There are two monitoring sites (Little Deerskin and Elvoy) with permanent cross-sections that monitor culvert replacement and not instream restoration work. These sites are monitored annually for at least 5 years and are then are put on a rotating basis.
In 2009, cross-sections were monitored on three instream habitat restoration projects (South Fork Flambeau, North Branch Oconto, Brule Creek) and two culvert replacement road/stream crossings (Little Deerskin and Elvoy at Kaine Lake Road).
The instream habitat restoration cross-sections on the North Branch Oconto, which were established in 2005 upstream from the removal of a remnant logging dam, showed signs of change in the stream morphology despite a prolonged drought (figure 36, p. 88). Since 2005 there has been a deepening of the channel by over 1.5 feet since the dam’s removal.
A culvert replacement cross-section was monitored on Elvoy Creek at Kaine Lake Road. Monitoring data from the upper most portion of an old impounded area on Elvoy Creek indicated that the stream channel has changed since the culvert was replaced (figure 37, p. 88). Scouring has resulted in a deepening of the channel. Because the monitoring data indicated that the channel has been relatively stable since 2005, future monitoring of this site will be limited.
In 2010, due to high water, instream restoration cross-sectional monitoring efforts were hampered as stream flows were too high to safely wade at several of the sites, particularly North Branch Oconto and South Fork Flambeau. However, instream habitat cross-section monitoring was conducted on the Brule Creek.
The Wisconsin Department of Natural Resources reconfigured the Brule Creek stream channel in 2003 below Rock Dam road. Five permanent cross-sections were established to monitor stream channel adjustments. Monitoring data in 2010 indicated that since the project was completed, the appropriate width-to-depth ratio of the stream channel has been restored (figure 38, p. 89).
Culvert replacement cross-section monitoring at the Little Deerskin road crossing was also done in 2010. Prior to the 2003 culvert replacement, this stream channel was very wide and shallow, especially within 50 feet upstream of the culvert. Up until 2008, monitoring indicated that the channel was not naturally adjusting (figure 39, p. 89), thus a brush bundle was constructed in the area of the cross-section to try to narrow and deepen the channel. Monitoring in 2010 indicated that the stream channel is still adjusting, but is slowly narrowing and deepening.
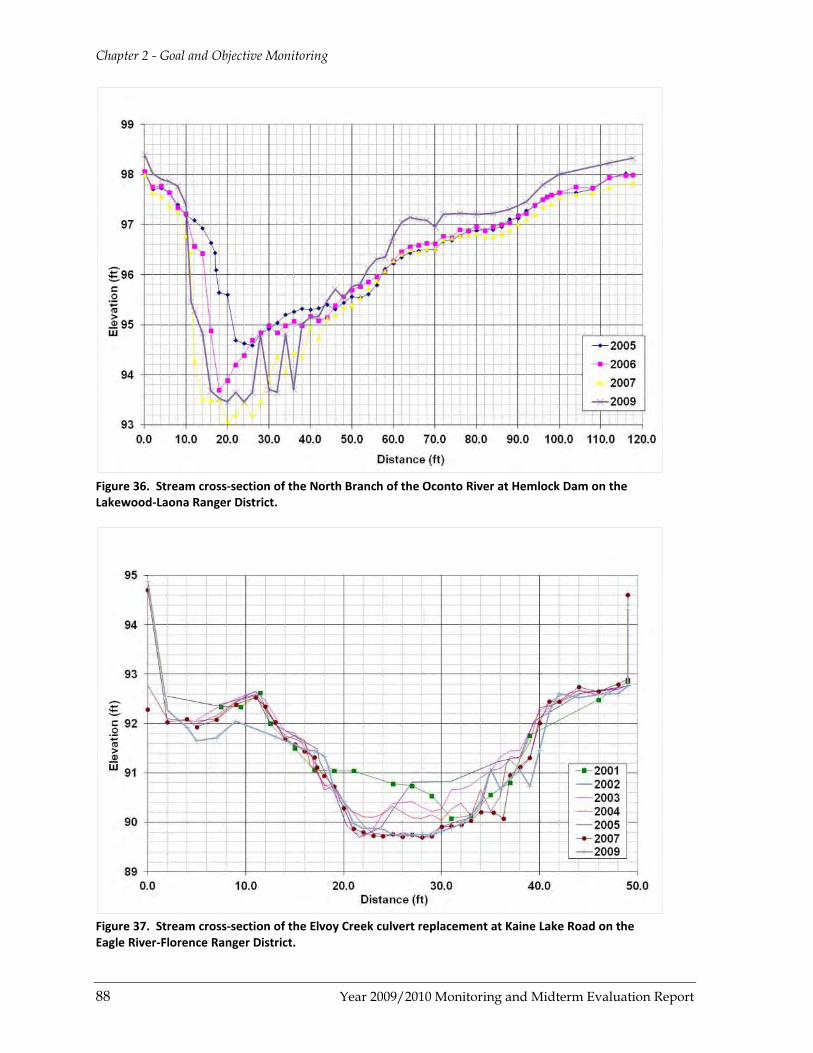
Chapter 2 - Goal and Objective Monitoring
88 Year 2009/2010 Monitoring and Midterm Evaluation Report
Figure 36. Stream cross-section of the North Branch of the Oconto River at Hemlock Dam on the Lakewood-Laona Ranger District.
Figure 37. Stream cross-section of the Elvoy Creek culvert replacement at Kaine Lake Road on the Eagle River-Florence Ranger District.
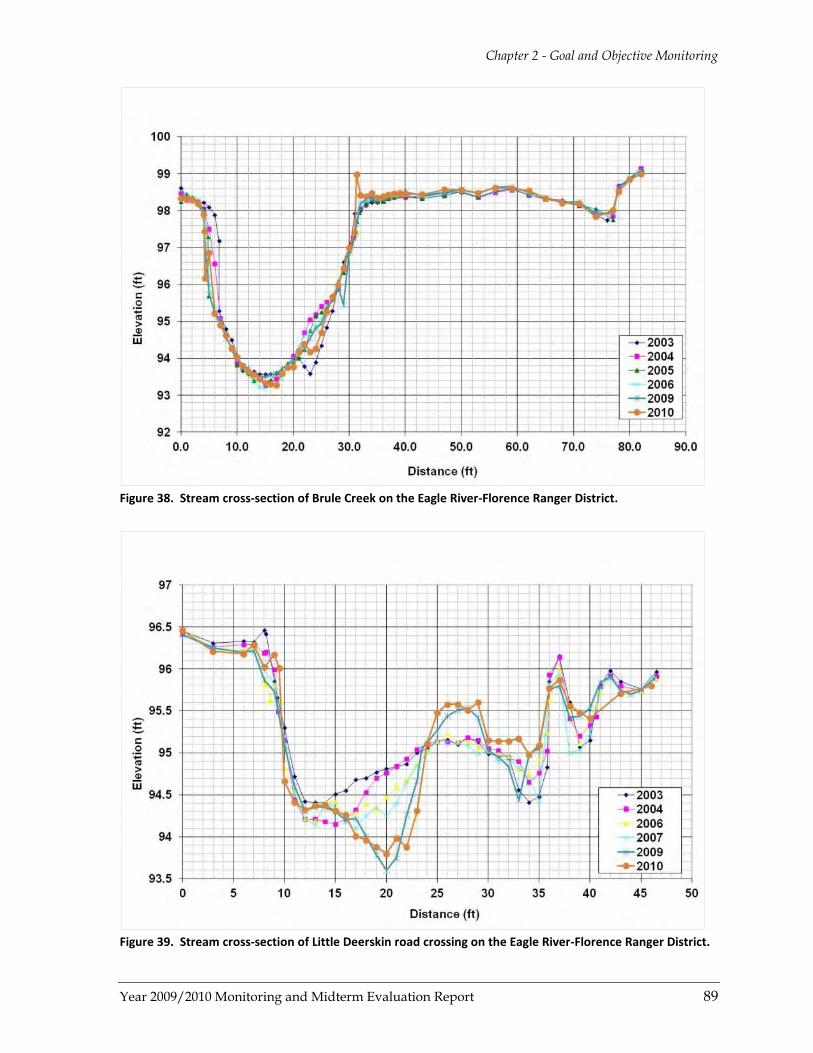
Chapter 2 - Goal and Objective Monitoring
Year 2009/2010 Monitoring and Midterm Evaluation Report 89
Figure 38. Stream cross-section of Brule Creek on the Eagle River-Florence Ranger District.
Figure 39. Stream cross-section of Little Deerskin road crossing on the Eagle River-Florence Ranger District.
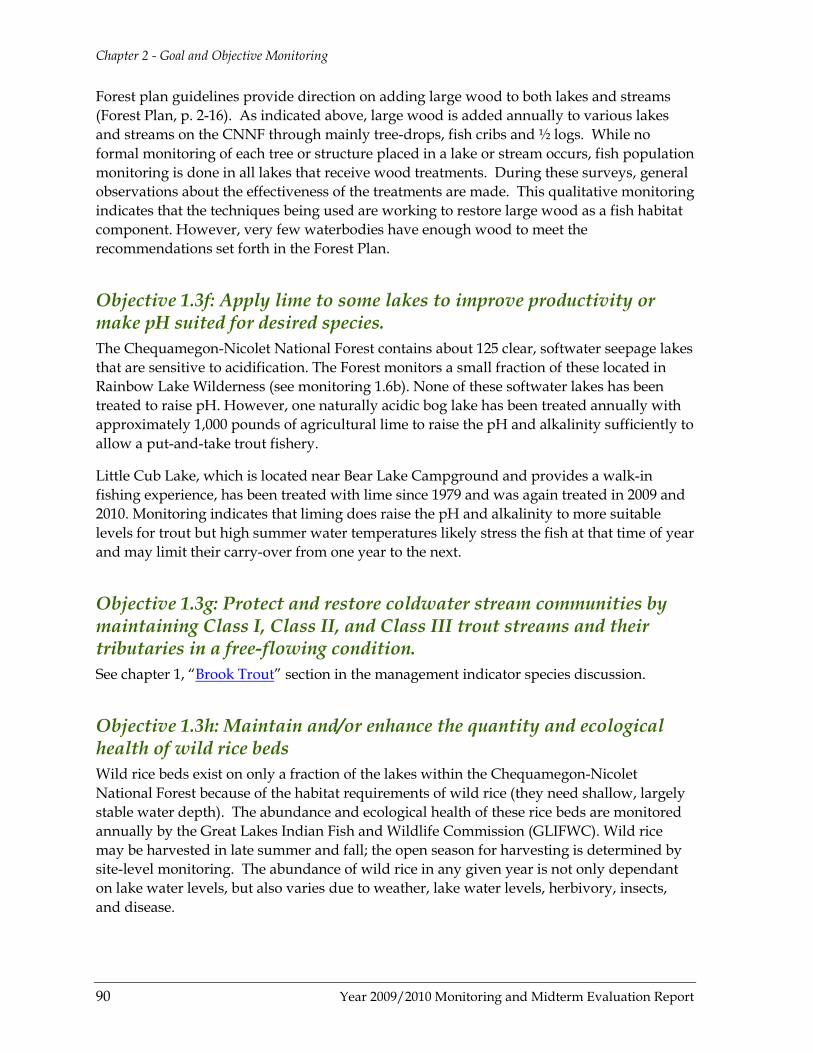
Chapter 2 - Goal and Objective Monitoring
90 Year 2009/2010 Monitoring and Midterm Evaluation Report
Forest plan guidelines provide direction on adding large wood to both lakes and streams (Forest Plan, p. 2-16). As indicated above, large wood is added annually to various lakes and streams on the CNNF through mainly tree-drops, fish cribs and ½ logs. While no formal monitoring of each tree or structure placed in a lake or stream occurs, fish population monitoring is done in all lakes that receive wood treatments. During these surveys, general observations about the effectiveness of the treatments are made. This qualitative monitoring indicates that the techniques being used are working to restore large wood as a fish habitat component. However, very few waterbodies have enough wood to meet the recommendations set forth in the Forest Plan.
Objective 1.3f: Apply lime to some lakes to improve productivity or make pH suited for desired species. The Chequamegon-Nicolet National Forest contains about 125 clear, softwater seepage lakes that are sensitive to acidification. The Forest monitors a small fraction of these located in Rainbow Lake Wilderness (see monitoring 1.6b). None of these softwater lakes has been treated to raise pH. However, one naturally acidic bog lake has been treated annually with approximately 1,000 pounds of agricultural lime to raise the pH and alkalinity sufficiently to allow a put-and-take trout fishery.
Little Cub Lake, which is located near Bear Lake Campground and provides a walk-in fishing experience, has been treated with lime since 1979 and was again treated in 2009 and 2010. Monitoring indicates that liming does raise the pH and alkalinity to more suitable levels for trout but high summer water temperatures likely stress the fish at that time of year and may limit their carry-over from one year to the next.
Objective 1.3g: Protect and restore coldwater stream communities by maintaining Class I, Class II, and Class III trout streams and their tributaries in a free-flowing condition. See chapter 1, “Brook Trout” section in the management indicator species discussion.
Objective 1.3h: Maintain and/or enhance the quantity and ecological health of wild rice beds Wild rice beds exist on only a fraction of the lakes within the Chequamegon-Nicolet National Forest because of the habitat requirements of wild rice (they need shallow, largely stable water depth). The abundance and ecological health of these rice beds are monitored annually by the Great Lakes Indian Fish and Wildlife Commission (GLIFWC). Wild rice may be harvested in late summer and fall; the open season for harvesting is determined by site-level monitoring. The abundance of wild rice in any given year is not only dependant on lake water levels, but also varies due to weather, lake water levels, herbivory, insects, and disease.
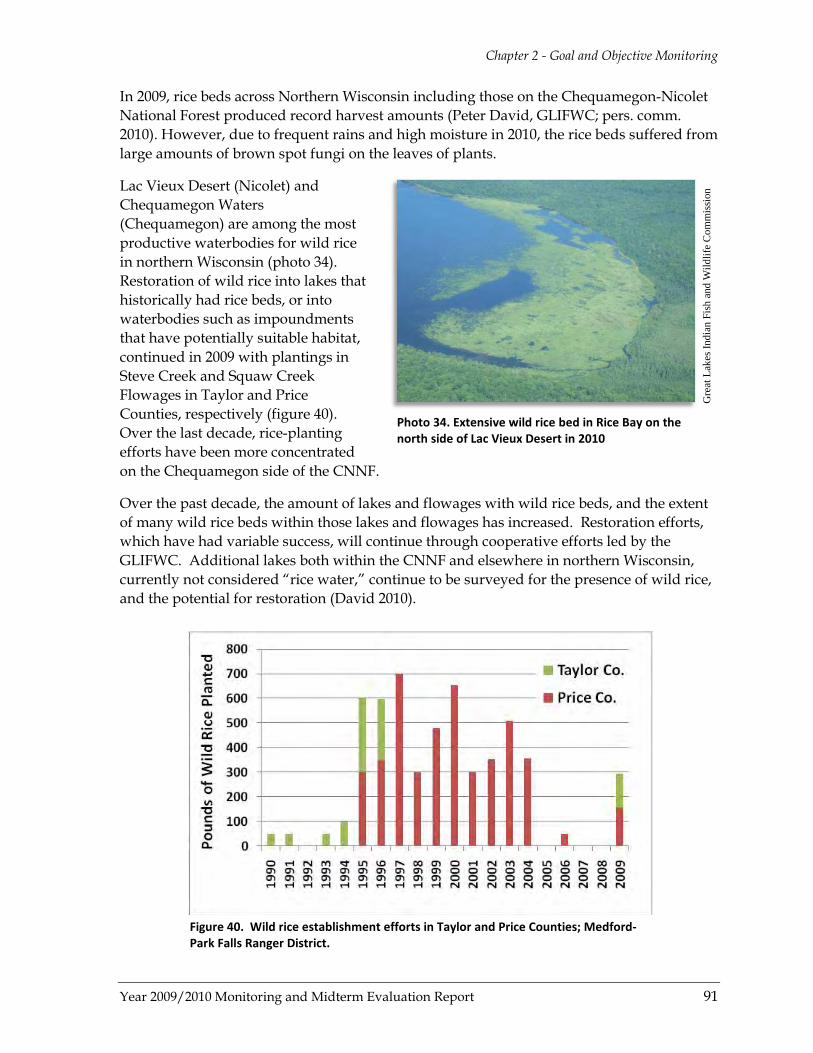
Chapter 2 - Goal and Objective Monitoring
Year 2009/2010 Monitoring and Midterm Evaluation Report 91
In 2009, rice beds across Northern Wisconsin including those on the Chequamegon-Nicolet National Forest produced record harvest amounts (Peter David, GLIFWC; pers. comm. 2010). However, due to frequent rains and high moisture in 2010, the rice beds suffered from large amounts of brown spot fungi on the leaves of plants.
Lac Vieux Desert (Nicolet) and Chequamegon Waters (Chequamegon) are among the most productive waterbodies for wild rice in northern Wisconsin (photo 34). Restoration of wild rice into lakes that historically had rice beds, or into waterbodies such as impoundments that have potentially suitable habitat, continued in 2009 with plantings in Steve Creek and Squaw Creek Flowages in Taylor and Price Counties, respectively (figure 40). Over the last decade, rice-planting efforts have been more concentrated on the Chequamegon side of the CNNF.
Over the past decade, the amount of lakes and flowages with wild rice beds, and the extent of many wild rice beds within those lakes and flowages has increased. Restoration efforts, which have had variable success, will continue through cooperative efforts led by the GLIFWC. Additional lakes both within the CNNF and elsewhere in northern Wisconsin, currently not considered “rice water,” continue to be surveyed for the presence of wild rice, and the potential for restoration (David 2010).
Figure 40. Wild rice establishment efforts in Taylor and Price Counties; Medford-Park Falls Ranger District.
Gre
at L
akes
Indi
an F
ish
and
Wild
life
Com
mis
sion
Photo 34. Extensive wild rice bed in Rice Bay on the north side of Lac Vieux Desert in 2010
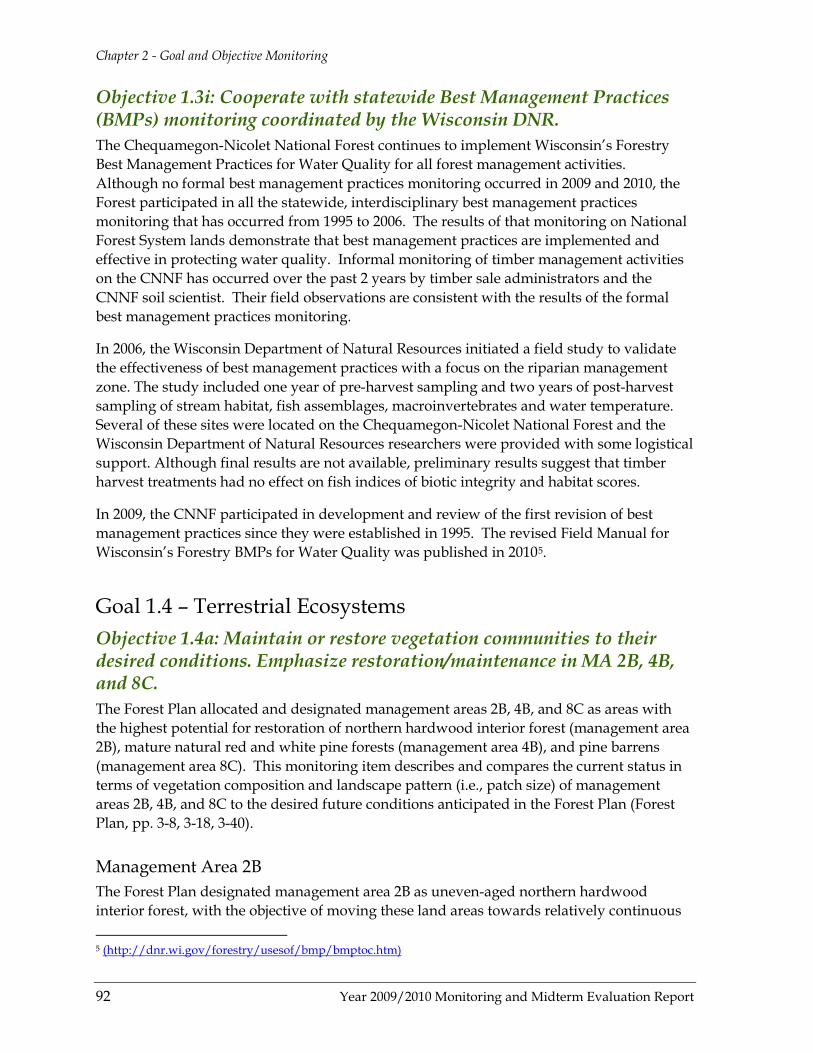
Chapter 2 - Goal and Objective Monitoring
92 Year 2009/2010 Monitoring and Midterm Evaluation Report
Objective 1.3i: Cooperate with statewide Best Management Practices (BMPs) monitoring coordinated by the Wisconsin DNR. The Chequamegon-Nicolet National Forest continues to implement Wisconsin’s Forestry Best Management Practices for Water Quality for all forest management activities. Although no formal best management practices monitoring occurred in 2009 and 2010, the Forest participated in all the statewide, interdisciplinary best management practices monitoring that has occurred from 1995 to 2006. The results of that monitoring on National Forest System lands demonstrate that best management practices are implemented and effective in protecting water quality. Informal monitoring of timber management activities on the CNNF has occurred over the past 2 years by timber sale administrators and the CNNF soil scientist. Their field observations are consistent with the results of the formal best management practices monitoring.
In 2006, the Wisconsin Department of Natural Resources initiated a field study to validate the effectiveness of best management practices with a focus on the riparian management zone. The study included one year of pre-harvest sampling and two years of post-harvest sampling of stream habitat, fish assemblages, macroinvertebrates and water temperature. Several of these sites were located on the Chequamegon-Nicolet National Forest and the Wisconsin Department of Natural Resources researchers were provided with some logistical support. Although final results are not available, preliminary results suggest that timber harvest treatments had no effect on fish indices of biotic integrity and habitat scores.
In 2009, the CNNF participated in development and review of the first revision of best management practices since they were established in 1995. The revised Field Manual for Wisconsin’s Forestry BMPs for Water Quality was published in 20105
Goal 1.4 – Terrestrial Ecosystems
.
Objective 1.4a: Maintain or restore vegetation communities to their desired conditions. Emphasize restoration/maintenance in MA 2B, 4B, and 8C. The Forest Plan allocated and designated management areas 2B, 4B, and 8C as areas with the highest potential for restoration of northern hardwood interior forest (management area 2B), mature natural red and white pine forests (management area 4B), and pine barrens (management area 8C). This monitoring item describes and compares the current status in terms of vegetation composition and landscape pattern (i.e., patch size) of management areas 2B, 4B, and 8C to the desired future conditions anticipated in the Forest Plan (Forest Plan, pp. 3-8, 3-18, 3-40).
Management Area 2B The Forest Plan designated management area 2B as uneven-aged northern hardwood interior forest, with the objective of moving these land areas towards relatively continuous 5 (http://dnr.wi.gov/forestry/usesof/bmp/bmptoc.htm)

Chapter 2 - Goal and Objective Monitoring
Year 2009/2010 Monitoring and Midterm Evaluation Report 93
mid- to late-successional, uneven-aged northern hardwood and northern hardwood-hemlock forest communities. Management area 2B was also considered an alternative management area in the Forest Plan, which is intended to emphasize ecosystem restoration. Thus, silvicultural methods were modified in this area to encourage restoration of species composition, structural components, and functional processes. The desired future conditions of this management area include large patch conditions and a relatively continuous canopy that is maintained or recreated. The desired hardwood patch sizes are in the thousands of acres. Early successional forest patches are generally allowed to succeed or are treated to encourage conversion to long-lived species. Landscape heterogeneity is low and habitat fragmentation is minimized. Forest openings are allowed to naturally revegetate, however, some will persist (such as frost pockets).
The intent of creating larger patches of vegetation communities is to help improve animal and plant species viability by decreasing dispersal distances Greater diversity of habitat-specific species occurs as patches become large. The absence of some kinds or sizes of patches can result in the absence of some species, and functions they play in the ecosystem. For example, while habitat in various seral stages across a landscape is important in providing habitat capable of supporting a diversity of species in mature northern hardwood forests, the fragmentation of this habitat into small patches has potential consequences for the population viability of many plants and animals (Saunders et al. 1991).
The design of the Forest Plan is such that the ecological reference areas (management areas 8E, 8F and 8G), all of which have limited management, are embedded or incorporated into other management areas such as management area 2B. While specific vegetation composition objectives stated in the Forest Plan only consider those stands within a specific management area boundary (management area 2B), the overall landscape pattern and patch size does take into consideration those incorporated ecological reference areas. Therefore, the desired future conditions for management area 2B vegetation species composition is determined by those forest types that are only within the management area 2B polygon boundaries. Landscape pattern or patch size of mature northern hardwood interior forest on the other hand, is determined by not only stands within management area 2B but also the associated ecological reference areas. It should also be noted that both the species composition and landscape pattern included National Forest System lands only. Data for this monitoring item is essentially a subset of the data for the management indicator habitat mature northern hardwood interior forest, reported in Chapter 1 on page 28 of this report.
In general, the 2010 vegetation species composition within management area 2B is dominated by northern hardwood tree species (figure 41) and is within the desired future composition range of the Forest Plan (table 30). However, both the amount of aspen and permanent openings within this management area exceeds the desired range of species composition.
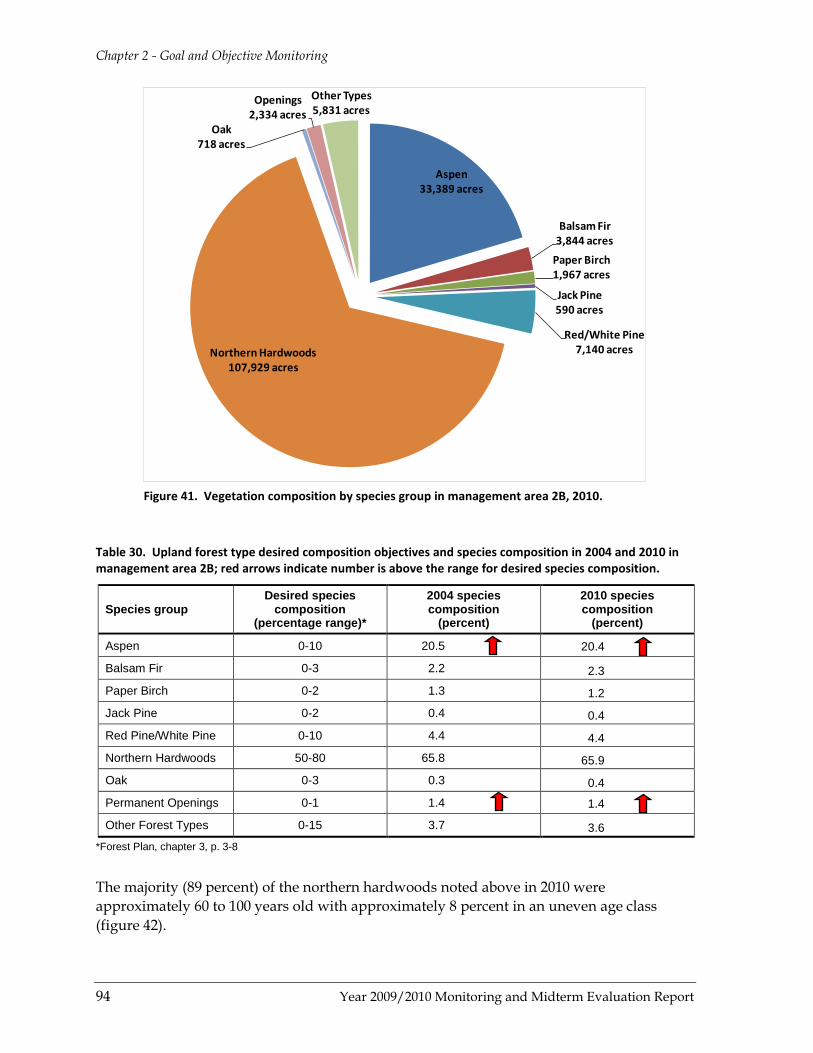
Chapter 2 - Goal and Objective Monitoring
94 Year 2009/2010 Monitoring and Midterm Evaluation Report
Figure 41. Vegetation composition by species group in management area 2B, 2010.
Table 30. Upland forest type desired composition objectives and species composition in 2004 and 2010 in management area 2B; red arrows indicate number is above the range for desired species composition.
Species group Desired species
composition (percentage range)*
2004 species composition
(percent)
2010 species composition
(percent)
Aspen 0-10 20.5 20.4
Balsam Fir 0-3 2.2 2.3 Paper Birch 0-2 1.3 1.2 Jack Pine 0-2 0.4 0.4
Red Pine/White Pine 0-10 4.4 4.4 Northern Hardwoods 50-80 65.8 65.9 Oak 0-3 0.3 0.4 Permanent Openings 0-1 1.4 1.4
Other Forest Types 0-15 3.7 3.6 *Forest Plan, chapter 3, p. 3-8
The majority (89 percent) of the northern hardwoods noted above in 2010 were approximately 60 to 100 years old with approximately 8 percent in an uneven age class (figure 42).
Aspen33,389 acres
Balsam Fir3,844 acres
Paper Birch1,967 acres
Jack Pine590 acres
Red/White Pine7,140 acresNorthern Hardwoods
107,929 acres
Oak718 acres
Openings2,334 acres
Other Types5,831 acres

Chapter 2 - Goal and Objective Monitoring
Year 2009/2010 Monitoring and Midterm Evaluation Report 95
Figure 42. Age class structure of upland vegetation in management area 2B (numbers in parentheses indicate total acres of that species) in 2010.
As indicated above, patches of mature northern hardwood interior forest that occur within ecological reference areas (management area 8) but have a base polygon of management area 2B were included when assessing or commenting on the connectivity of patches on the landscape (i.e. landscape pattern). However, only National Forest System lands within these areas were used to describe patches.
By applying the 2010 process of assessing mature northern hardwood interior forest to 2004 data, the Forest was able to assess the CNNF’s progress toward the desired condition of relatively continuous mid- to late-successional, uneven-aged northern hardwood and northern hardwood-hemlock forest communities. Since 2004, the total number of patches, the amount of mature northern hardwood interior forest, average patch size, and patch density have all increased.
The overall increase in amount and average patch size of mature northern hardwood interior forest in management area 2B suggests that northern hardwood forests are maturing and patches are merging to create a more continuous canopy within this management area. Since 2004, patches of mature northern hardwood interior forest have
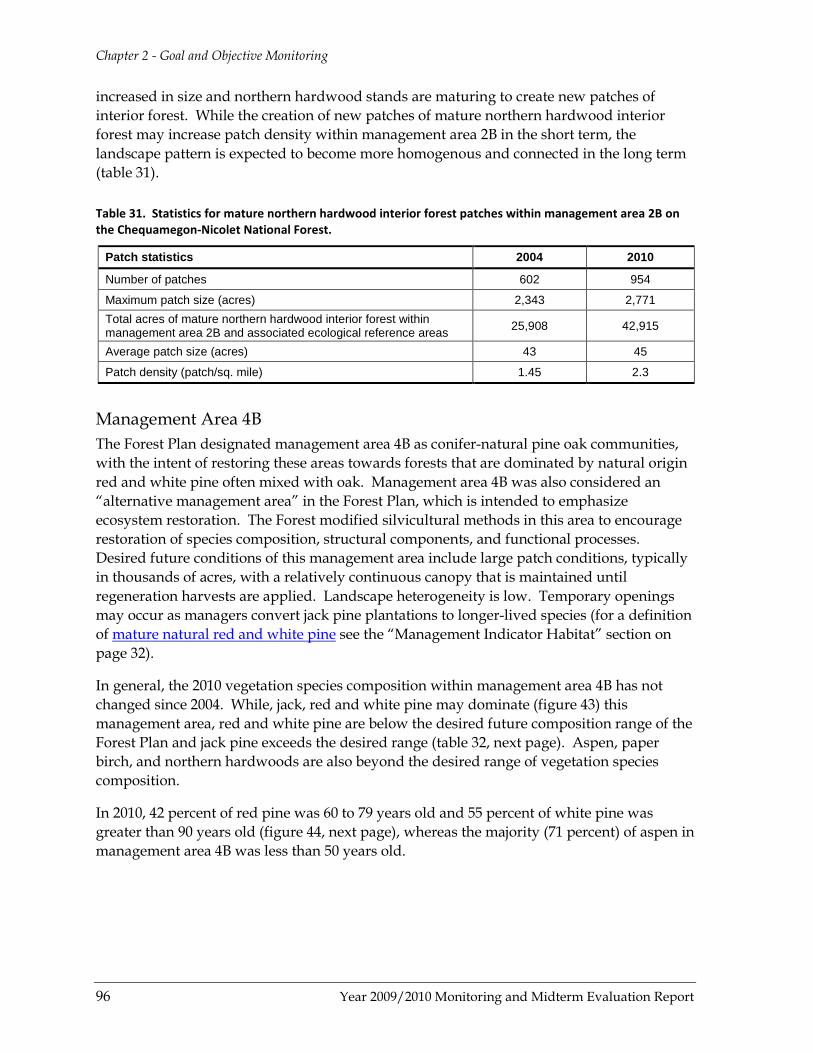
Chapter 2 - Goal and Objective Monitoring
96 Year 2009/2010 Monitoring and Midterm Evaluation Report
increased in size and northern hardwood stands are maturing to create new patches of interior forest. While the creation of new patches of mature northern hardwood interior forest may increase patch density within management area 2B in the short term, the landscape pattern is expected to become more homogenous and connected in the long term (table 31).
Table 31. Statistics for mature northern hardwood interior forest patches within management area 2B on the Chequamegon-Nicolet National Forest.
Patch statistics 2004 2010
Number of patches 602 954
Maximum patch size (acres) 2,343 2,771 Total acres of mature northern hardwood interior forest within management area 2B and associated ecological reference areas 25,908 42,915
Average patch size (acres) 43 45
Patch density (patch/sq. mile) 1.45 2.3
Management Area 4B The Forest Plan designated management area 4B as conifer-natural pine oak communities, with the intent of restoring these areas towards forests that are dominated by natural origin red and white pine often mixed with oak. Management area 4B was also considered an “alternative management area” in the Forest Plan, which is intended to emphasize ecosystem restoration. The Forest modified silvicultural methods in this area to encourage restoration of species composition, structural components, and functional processes. Desired future conditions of this management area include large patch conditions, typically in thousands of acres, with a relatively continuous canopy that is maintained until regeneration harvests are applied. Landscape heterogeneity is low. Temporary openings may occur as managers convert jack pine plantations to longer-lived species (for a definition of mature natural red and white pine see the “Management Indicator Habitat” section on page 32).
In general, the 2010 vegetation species composition within management area 4B has not changed since 2004. While, jack, red and white pine may dominate (figure 43) this management area, red and white pine are below the desired future composition range of the Forest Plan and jack pine exceeds the desired range (table 32, next page). Aspen, paper birch, and northern hardwoods are also beyond the desired range of vegetation species composition.
In 2010, 42 percent of red pine was 60 to 79 years old and 55 percent of white pine was greater than 90 years old (figure 44, next page), whereas the majority (71 percent) of aspen in management area 4B was less than 50 years old.
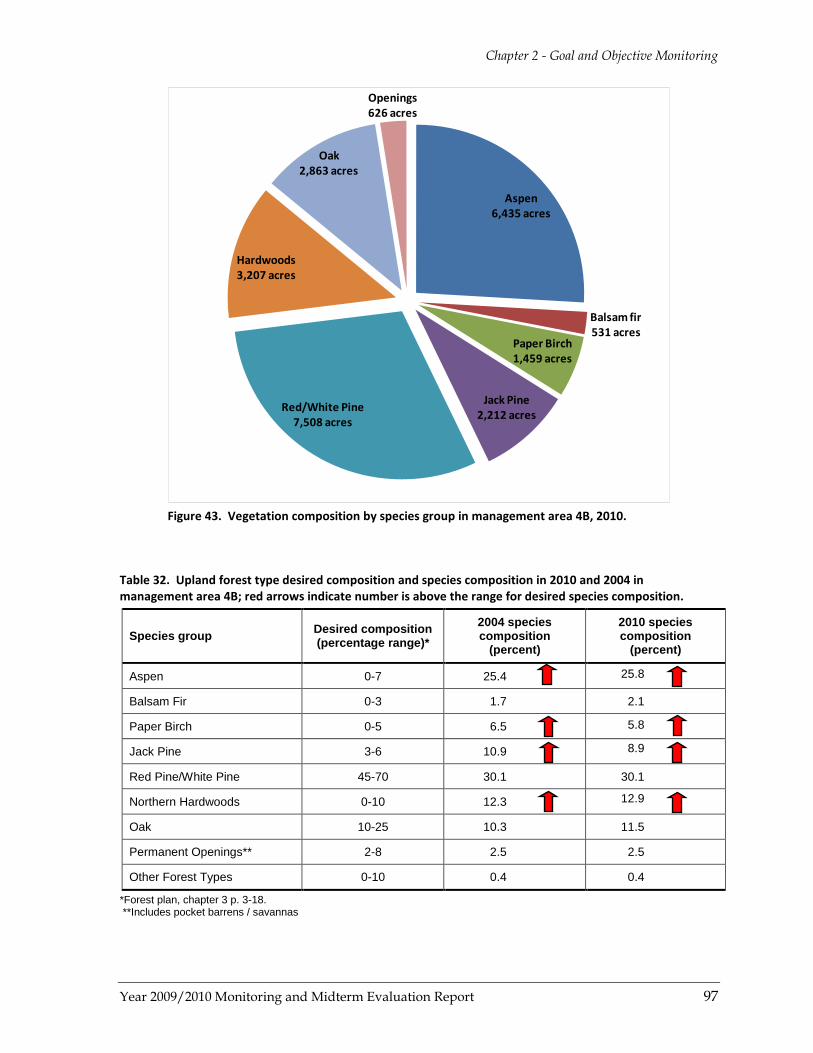
Chapter 2 - Goal and Objective Monitoring
Year 2009/2010 Monitoring and Midterm Evaluation Report 97
Figure 43. Vegetation composition by species group in management area 4B, 2010.
Table 32. Upland forest type desired composition and species composition in 2010 and 2004 in management area 4B; red arrows indicate number is above the range for desired species composition.
Species group Desired composition (percentage range)*
2004 species composition
(percent)
2010 species composition
(percent)
Aspen 0-7 25.4 25.8
Balsam Fir 0-3 1.7 2.1
Paper Birch 0-5 6.5 5.8
Jack Pine 3-6 10.9 8.9
Red Pine/White Pine 45-70 30.1 30.1
Northern Hardwoods 0-10 12.3 12.9
Oak 10-25 10.3 11.5
Permanent Openings** 2-8 2.5 2.5
Other Forest Types 0-10 0.4 0.4
*Forest plan, chapter 3 p. 3-18. **Includes pocket barrens / savannas
Aspen6,435 acres
Balsam fir531 acres
Paper Birch1,459 acres
Jack Pine2,212 acresRed/White Pine
7,508 acres
Hardwoods3,207 acres
Oak2,863 acres
Openings626 acres

Chapter 2 - Goal and Objective Monitoring
98 Year 2009/2010 Monitoring and Midterm Evaluation Report
Figure 44. Age class structure of upland vegetation in management area 4B (numbers in parentheses indicate total acres of that species).
The average patch size for mature red and white pine forest within management area 4B in 2010 is 43 acres with the maximum size approximately 1,125 acres. Patch density or number of patches of mature red and white pine forests per square mile in management area 4B and the associated ecological reference areas is 1.7 (table 33). The average patch size along with the total number of acres and number of patches has increased from 2004. This suggests that patches of mature red and white pine forests within management area 4B are increasing in size and the landscape pattern is becoming less fragmented. Thus, since 2004 progress has been made toward the desired future condition of large patch sizes with a relatively continuous canopy of mature red and white pine.
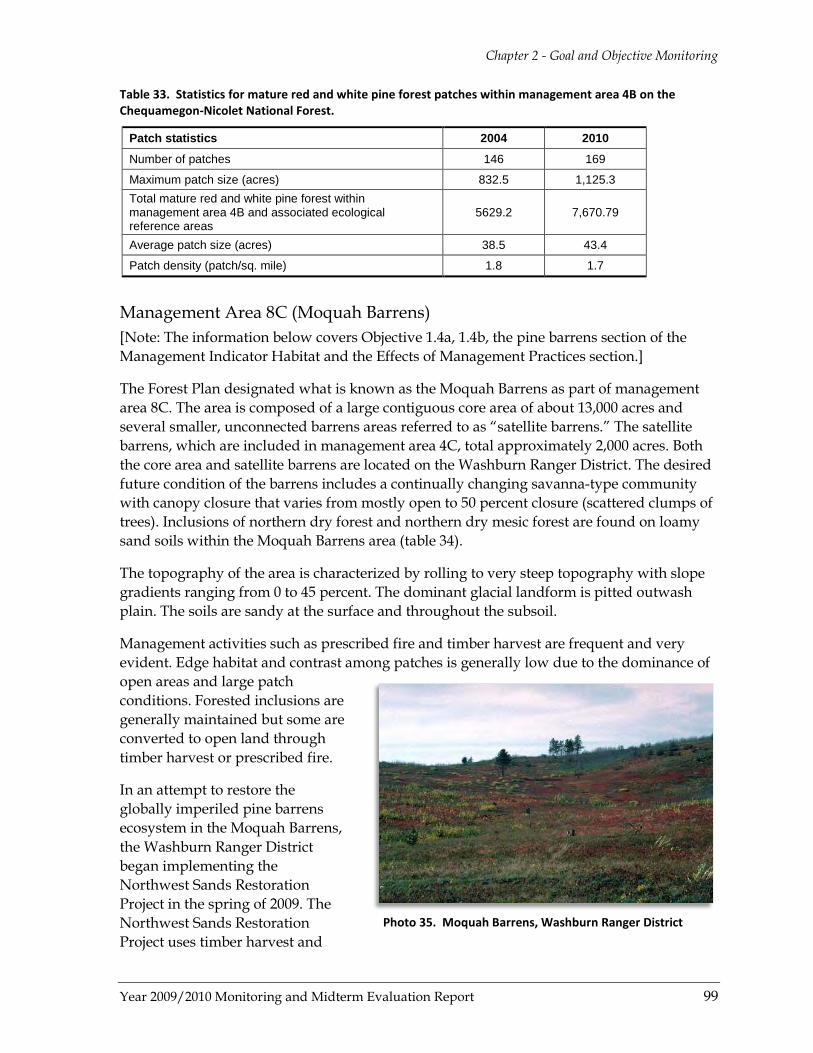
Chapter 2 - Goal and Objective Monitoring
Year 2009/2010 Monitoring and Midterm Evaluation Report 99
Table 33. Statistics for mature red and white pine forest patches within management area 4B on the Chequamegon-Nicolet National Forest.
Patch statistics 2004 2010
Number of patches 146 169
Maximum patch size (acres) 832.5 1,125.3 Total mature red and white pine forest within management area 4B and associated ecological reference areas
5629.2 7,670.79
Average patch size (acres) 38.5 43.4
Patch density (patch/sq. mile) 1.8 1.7
Management Area 8C (Moquah Barrens) [Note: The information below covers Objective 1.4a, 1.4b, the pine barrens section of the Management Indicator Habitat and the Effects of Management Practices section.]
The Forest Plan designated what is known as the Moquah Barrens as part of management area 8C. The area is composed of a large contiguous core area of about 13,000 acres and several smaller, unconnected barrens areas referred to as “satellite barrens.” The satellite barrens, which are included in management area 4C, total approximately 2,000 acres. Both the core area and satellite barrens are located on the Washburn Ranger District. The desired future condition of the barrens includes a continually changing savanna-type community with canopy closure that varies from mostly open to 50 percent closure (scattered clumps of trees). Inclusions of northern dry forest and northern dry mesic forest are found on loamy sand soils within the Moquah Barrens area (table 34).
The topography of the area is characterized by rolling to very steep topography with slope gradients ranging from 0 to 45 percent. The dominant glacial landform is pitted outwash plain. The soils are sandy at the surface and throughout the subsoil.
Management activities such as prescribed fire and timber harvest are frequent and very evident. Edge habitat and contrast among patches is generally low due to the dominance of open areas and large patch conditions. Forested inclusions are generally maintained but some are converted to open land through timber harvest or prescribed fire.
In an attempt to restore the globally imperiled pine barrens ecosystem in the Moquah Barrens, the Washburn Ranger District began implementing the Northwest Sands Restoration Project in the spring of 2009. The Northwest Sands Restoration Project uses timber harvest and
Photo 35. Moquah Barrens, Washburn Ranger District
Chapter 2 - Goal and Objective Monitoring
100 Year 2009/2010 Monitoring and Midterm Evaluation Report
prescribed fire to create the vegetation structure composition of a pine barrens ecosystem. Timber harvest has been used to achieve the desired tree density (structure) presented in table 34. Prescribed fire is also used to reach the desired vegetation structure, but more importantly, fire can be used to promote fire-adapted vegetation typical of a pine barrens ecosystem.
Table 34. Desired and existing conditions of the Moquah Barrens core area.
Component Brief description Desired percentage
FY 2009 existing
percentage
Open barrens
Very open (<1 tree/ acre) < 50% total brush cover and <30-50% and brush cover under 7 feet tall (brush is defined as tree seedling and saplings as well as shrubs capable of reaching 3 feet of height) Desired tree species = red, white, & jack pine
50 to 75% in general equal
representation of each
23%
Savanna
Mostly open (1-40 trees/acre) < 50% total brush cover and <30% brush cover under 7 feet tall Desired tree species = red, white, & jack pine
23%
Woodland
A park like forest (40-95 trees/acre) < 50% total brush cover and <30 brush cover under 7 feet tall Desired tree species = red & white pine
15 - 30% 9%
Closed forest
Typical forest conditions (>95 trees/acre) < 50% total brush cover and <30% brush cover under 7 feet tall Desired tree species = red & white pine
5 - 15% 33%
Dense small trees
Many small trees, difficult to walk through Desired tree species = jack pine 5 -10% 12%
Note: Other fire-adapted tree species such as oak, aspen and birch will be present within all components; however, the dominant desired tree species are pine.
Prescribed fire has been an important tool in the restoration of portions of the Moquah Barrens since 1963. Prescribed burns have been accomplished at return intervals ranging from 2 to 29 years (average = 8 years) on 24 different burn units (approximately 6,700 acres), to maintain open savanna habitat. Portions of the Moquah Barrens have been burned up to seven times. Most (65 percent) of the prescribed burns have been implemented in spring (April – May) with the remainder occurring in summer (20 percent) or fall (15 percent). The timing and return interval of prescribed burns is often influenced by weather, funding, and other constraints. This has resulted in variability in the conditions among burn units.
Beginning in 2004, a two-phased monitoring program was developed to determine the current vegetation structure and composition and to assess the effectiveness of pine barrens restoration. The focus of the program was on the core area, which has been actively managed for barrens restoration over the past few decades. Monitoring vegetation responses to prescribed fire gives resource managers information on how well certain management techniques are working and insight on what future management decisions to make. The overall objective of the monitoring program is to develop guidelines for

Chapter 2 - Goal and Objective Monitoring
Year 2009/2010 Monitoring and Midterm Evaluation Report 101
prescribed fire frequency, timing, and intensity for more effective restoration of the pine barrens ecosystem.
In the first phase of the program, a vegetation cover map of the Moquah Barrens was developed based on species community types. The results from the first phase of the program showed that total shrub cover significantly declined as the number of prescribed burns increased (Posner and Hildebrandt 2006). Significant differences were also observed in the frequency of occurrence of several species as the number of burns increased. Potential indicators of favorable progress in the restoration of the barrens vegetation community were shrub densities less than 50 percent, increases in sand cherry and sweet fern, and a decrease in red maple. These indicators can be used to assess the success of current restoration efforts as well as to effectively plan and monitor barrens restoration efforts in the adjacent areas that have recently been designated for barrens restoration.
In the second phase of the monitoring program, permanent monitoring plots were established to assess prescribed fire effects over time and to help determine when prescribed burns are needed using the interagency FIREMON methods (http://fire.org) FIREMON is a monitoring protocol to record changes in vegetation composition and structure over time. These data will enhance the ability of managers to assess whether restoration activities are effective in promoting the desired plant communities typical of pine barrens.
The Northwest Sands Restoration Project established some prescribed fire trigger points (more than 50 percent brush cover or more than 30 percent brush cover greater than 7 feet tall) to inform managers when a prescribed burn is needed in a portion of the barrens. FIREMON in conjunction with ocular measurements are the two methods outlined in the Northwest Sands monitoring plan as the appropriate methods for determining if prescribed fire trigger points are being met.
Forty-one permanent FIREMON plots have been established across the Moquah Barrens in satellite 8C barrens habitat areas, and representative barrens habitat outside management area 8C. These permanent plots have been sampled prior to prescribed fire and some have been resampled after the prescribed fire in order to assess changes in understory and overstory species composition, tree structure, shrub density, and the occurrence of indicator species identified in the first phase of the monitoring program.
Results from six field seasons of monitoring the FIREMON plots have shown an increase in fire-adapted pine barrens vegetation as well as a decrease in non-fire-adapted vegetation with a corresponding increase in prescribed fire. The FIREMON data has also provided insight into changes in abundance and heights of woody vegetation after prescribed fire. More specifically, in some FIREMON plots woody vegetation has achieved 7 feet of height within four growing seasons after a burn. Tree and sapling vegetation abundance has increased by 5 to 15 percent per year and shrub abundance has increased by 3 to 17 percent per year at FIREMON plots that are in a less restored state. Seedling, sapling, and shrub abundance has increased 2 to 3 percent per year at FIREMON plots that are in a more restored state. This data is important for predicting how quickly a portion of the barrens will reach a prescribed fire trigger point. Resource managers can use this data to determine
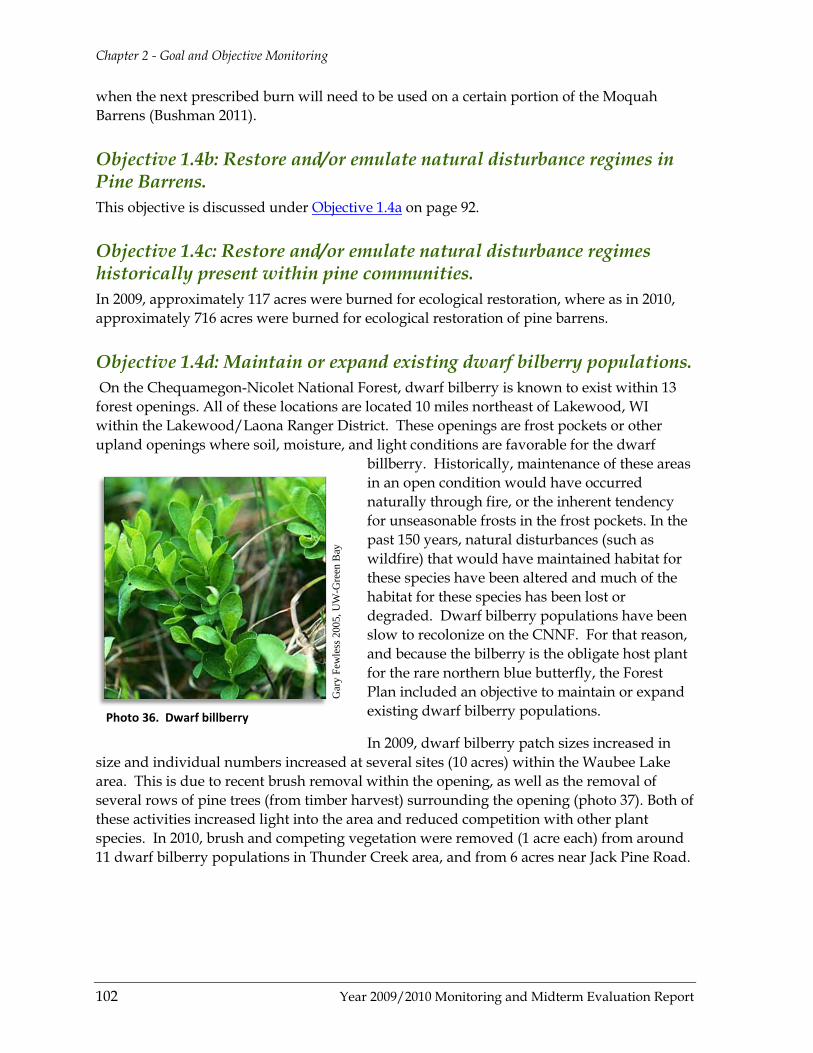
Chapter 2 - Goal and Objective Monitoring
102 Year 2009/2010 Monitoring and Midterm Evaluation Report
when the next prescribed burn will need to be used on a certain portion of the Moquah Barrens (Bushman 2011).
Objective 1.4b: Restore and/or emulate natural disturbance regimes in Pine Barrens. This objective is discussed under Objective 1.4a on page 92.
Objective 1.4c: Restore and/or emulate natural disturbance regimes historically present within pine communities. In 2009, approximately 117 acres were burned for ecological restoration, where as in 2010, approximately 716 acres were burned for ecological restoration of pine barrens.
Objective 1.4d: Maintain or expand existing dwarf bilberry populations. On the Chequamegon-Nicolet National Forest, dwarf bilberry is known to exist within 13 forest openings. All of these locations are located 10 miles northeast of Lakewood, WI within the Lakewood/Laona Ranger District. These openings are frost pockets or other upland openings where soil, moisture, and light conditions are favorable for the dwarf
billberry. Historically, maintenance of these areas in an open condition would have occurred naturally through fire, or the inherent tendency for unseasonable frosts in the frost pockets. In the past 150 years, natural disturbances (such as wildfire) that would have maintained habitat for these species have been altered and much of the habitat for these species has been lost or degraded. Dwarf bilberry populations have been slow to recolonize on the CNNF. For that reason, and because the bilberry is the obligate host plant for the rare northern blue butterfly, the Forest Plan included an objective to maintain or expand existing dwarf bilberry populations.
In 2009, dwarf bilberry patch sizes increased in size and individual numbers increased at several sites (10 acres) within the Waubee Lake area. This is due to recent brush removal within the opening, as well as the removal of several rows of pine trees (from timber harvest) surrounding the opening (photo 37). Both of these activities increased light into the area and reduced competition with other plant species. In 2010, brush and competing vegetation were removed (1 acre each) from around 11 dwarf bilberry populations in Thunder Creek area, and from 6 acres near Jack Pine Road.
Gar
y Fe
wle
ss 2
005,
UW
-Gre
en B
ay
Photo 36. Dwarf billberry

Chapter 2 - Goal and Objective Monitoring
Year 2009/2010 Monitoring and Midterm Evaluation Report 103
Photo 37. Before brush removal at Jack Pine Road site (left) and after brush removal (right)
Over the last two years, 39 dwarf bilberry fruits were collected to be grown out at the Oconto County Seed Orchard. This is part of a restoration plan that includes transplanting the greenhouse-grown plants at historical sites or at sites that have suitable habitat.
Objective 1.4e: Increase average vegetative patch size. This Forest Plan objective is intended to increase landscape connectivity and influence landscape pattern by increasing patch size. The Forest Plan focused on patches of important vegetation communities such as openings in pine barrens, mature northern hardwood interior forest, and mature red and white pine forests. Information on this objective in regards to patch size for mature northern hardwood interior forests, mature red and white pine forests, and large openings in pine barrens can be found under the “Management Indicator Habitats” in chapter 1 and Objective 1.4a above.
Objective 1.4f: Permit some early successional forest succeed naturally toward late successional forest types, as well as meeting desired conditions within designated old growth areas (MA 8G). Monitoring and evaluation of this objective will be reported at the end of the decade.
Objective 1.4g: Annually treat non-roadside and roadside NNIS sites. Develop an NNIS strategy to guide amounts and locations of treatment. Nonnative Invasive Species Treatment (NNIS) Currently 4,675 nonnative invasive plant sites occupy 2,659 infested acres on the Chequamegon-Nicolet National Forest6
figure 54
with the majority (80 percent) of these sites less than one acre. In 2009 and 2010, 519 and 115 new acres of infestation were documented at 500 and 391 new sites, respectively ( ).
6 Infested acres reflect the area actually infested with nonnative invasive plants, and is measured by multiplying
the gross area of infestation by the percent cover of the nonnative invasive plants.

Chapter 2 - Goal and Objective Monitoring
104 Year 2009/2010 Monitoring and Midterm Evaluation Report
Since 2004, the number of sites of nonnative invasive species within the Chequamegon-Nicolet National Forest peaked in 2007 at 1,106 sites (figure 45). Part of the increase in new sites during the first several years of Forest Plan implementation was a result of an increased effort in inventorying National Forest System lands for invasive species. While this inventory or early detection effort continues, the focus of the nonnative invasive species program has shifted more to treatment and control. Thus, the number of new sites since 2007 has decreased.
Figure 45. Number of new nonnative invasive species sites and total new infested acres documented on Chequamegon-Nicolet National Forest during 2004-2010.
Treatment of infested sites included herbicide application, mowing, hand-pulling, prescribed fire, and biocontrol. In 2009, a total of 1,517 acres on 632 sites were treated and in 2010, a total of 1,931 acres on 597 sites were treated (table 35). The majority of treatments for both 2009 and 2010 were herbicide applications (figure 46), with areas of treated infestations ranging from less than 1 acre up to 80 acres. Since 2006, between 23 and 53 percent of the sites treated in a given year were monitored for treatment efficacy (table 36).
129 94
564
1106
653
500
391
0
100
200
300
400
500
600
700
0
200
400
600
800
1000
1200
2004 2005 2006 2007 2008 2009 2010
Infe
sted
Acr
es
Num
ber o
f Site
s
Year
Number of Sites Infested Acres
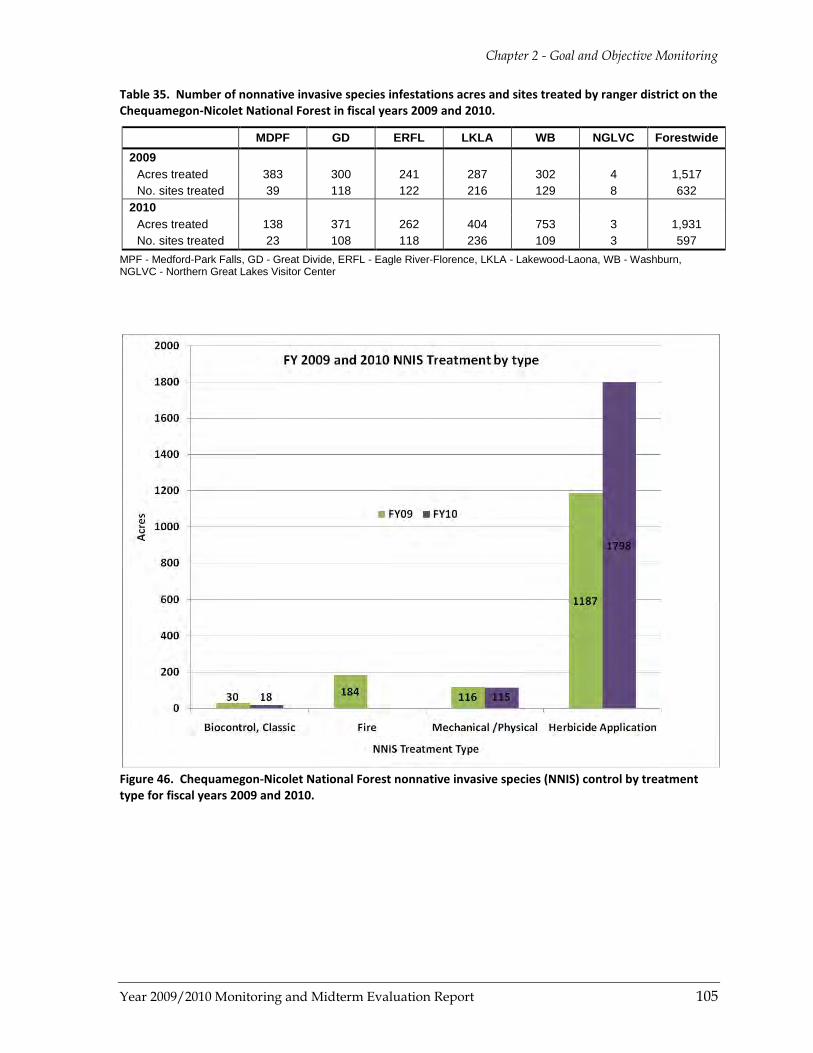
Chapter 2 - Goal and Objective Monitoring
Year 2009/2010 Monitoring and Midterm Evaluation Report 105
Table 35. Number of nonnative invasive species infestations acres and sites treated by ranger district on the Chequamegon-Nicolet National Forest in fiscal years 2009 and 2010.
MDPF GD ERFL LKLA WB NGLVC Forestwide 2009
Acres treated 383 300 241 287 302 4 1,517 No. sites treated 39 118 122 216 129 8 632
2010 Acres treated 138 371 262 404 753 3 1,931 No. sites treated 23 108 118 236 109 3 597
MPF - Medford-Park Falls, GD - Great Divide, ERFL - Eagle River-Florence, LKLA - Lakewood-Laona, WB - Washburn, NGLVC - Northern Great Lakes Visitor Center
Figure 46. Chequamegon-Nicolet National Forest nonnative invasive species (NNIS) control by treatment type for fiscal years 2009 and 2010.
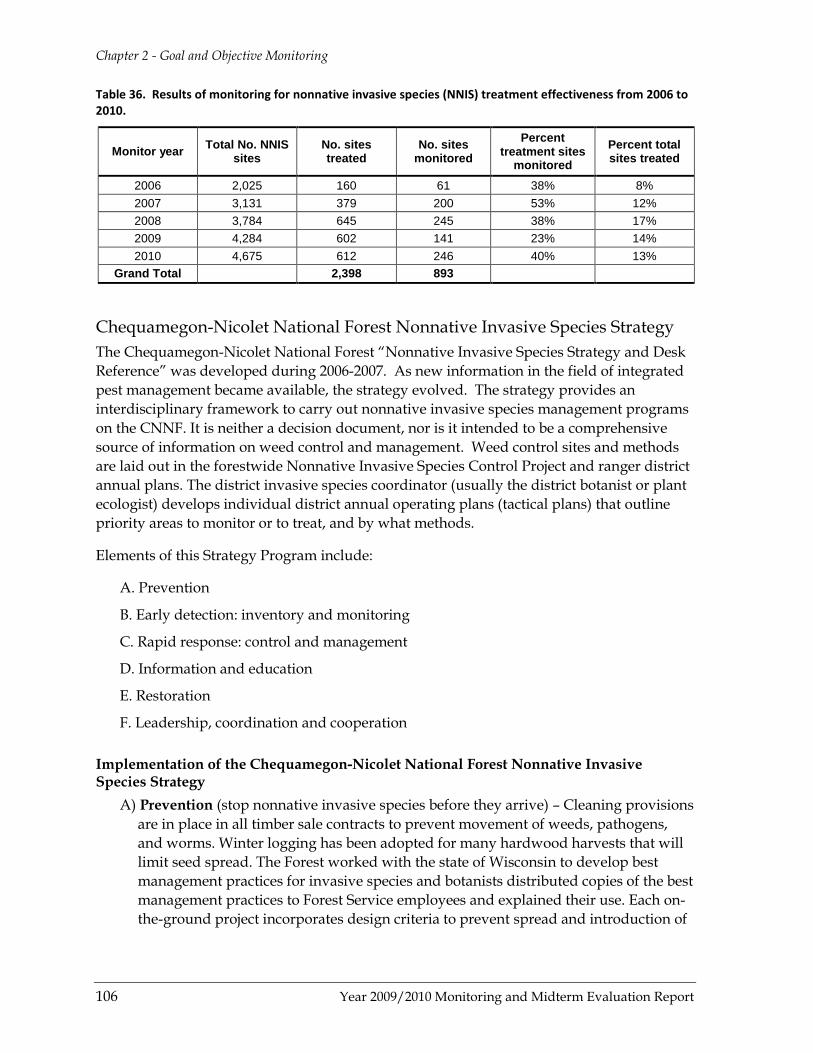
Chapter 2 - Goal and Objective Monitoring
106 Year 2009/2010 Monitoring and Midterm Evaluation Report
Table 36. Results of monitoring for nonnative invasive species (NNIS) treatment effectiveness from 2006 to 2010.
Monitor year Total No. NNIS sites
No. sites treated
No. sites monitored
Percent treatment sites
monitored Percent total sites treated
2006 2,025 160 61 38% 8% 2007 3,131 379 200 53% 12% 2008 3,784 645 245 38% 17% 2009 4,284 602 141 23% 14% 2010 4,675 612 246 40% 13%
Grand Total
2,398 893
Chequamegon-Nicolet National Forest Nonnative Invasive Species Strategy The Chequamegon-Nicolet National Forest “Nonnative Invasive Species Strategy and Desk Reference” was developed during 2006-2007. As new information in the field of integrated pest management became available, the strategy evolved. The strategy provides an interdisciplinary framework to carry out nonnative invasive species management programs on the CNNF. It is neither a decision document, nor is it intended to be a comprehensive source of information on weed control and management. Weed control sites and methods are laid out in the forestwide Nonnative Invasive Species Control Project and ranger district annual plans. The district invasive species coordinator (usually the district botanist or plant ecologist) develops individual district annual operating plans (tactical plans) that outline priority areas to monitor or to treat, and by what methods.
Elements of this Strategy Program include:
A. Prevention
B. Early detection: inventory and monitoring
C. Rapid response: control and management
D. Information and education
E. Restoration
F. Leadership, coordination and cooperation
Implementation of the Chequamegon-Nicolet National Forest Nonnative Invasive Species Strategy
A) Prevention (stop nonnative invasive species before they arrive) – Cleaning provisions are in place in all timber sale contracts to prevent movement of weeds, pathogens, and worms. Winter logging has been adopted for many hardwood harvests that will limit seed spread. The Forest worked with the state of Wisconsin to develop best management practices for invasive species and botanists distributed copies of the best management practices to Forest Service employees and explained their use. Each on-the-ground project incorporates design criteria to prevent spread and introduction of

Chapter 2 - Goal and Objective Monitoring
Year 2009/2010 Monitoring and Midterm Evaluation Report 107
nonnative invasive species. Forest projects use weed-free mulch and gravel to the extent practical.
B) Early Detection/Inventory and Monitoring (find new infestations and monitor high-risk areas) – The Forest conducts yearly surveys of areas at high risk for infestation. About 730 nonnative invasive species sites were found in 2009 and 2010 and were mapped and entered in NRIS TESP-Invasives database. The decision notice to treat new sites will be amended in 2011. All forest projects include specialist reports on nonnative invasive species, which analyze and assess the risk of spread and introduction of nonnative invasive species based on the proposed actions. Most project areas are monitored for nonnative invasive species for several years after activity. Two valuable field guides have been distributed to field-going personnel: “A Guide to NNIS in the North by FIA” (Olson and Cholewa 2009) and “A Field Guide to Terrestrial Invasive Plants in Wisconsin (Boos et al. 2010).
C) Rapid Response/ Control and Management (contain and reduce existing infestations) – Each Ranger District or zone develops an annual management plan (tactical plan) that lists priority actions for the year. In 2009, 632 sites (1,517 acres) were treated and in 2010, 597 sites (1,930 acres) were treated. In 2010, bio-control insects were released for spotted knapweed for the first time. Weed coordinators and seasonal workers are certified as pesticide applicators.
D) Information and Education (develop teaching products and increase awareness) – The forest disseminated information on all aspects of nonnative invasive species management to the public and to its employees. Much of the public information is spread through the Cooperative Weed Management Area (CWMA) partnerships (for more information see Objective 3.3c). Forest Service personnel alone made at least 50 presentations in 2009 and 2010, not counting collaborative work with CWMAs. Numerous publications are available at all offices and on the Forest’s website. In 2009, one botanist served on a state best management practices education committee to develop methods to reach stakeholders.
E) Restoration (reclaim native habitats and ecosystems) – The majority of restoration efforts on the Forest focused on seeding with native species to prevent the introduction of invasive species. Forest contractors collected about 50 pounds of native plant seed in three ecological zones. This local seed was used in several roadside restoration projects. All Forest Service offices including the new Rhinelander Supervisor’s Office have native plant gardens, both for education and to harvest seed. In addition, the Oconto River Seed Orchard began growing native grasses for seed harvest in 2010.
F) Leadership, Coordination and Cooperation – Partnership is a theme common to all program areas on the CNNF. The Chequamegon-Nicolet National Forest has taken the lead on developing four Cooperative Weed Management Areas across the forest and received national recognition in 2010 for these efforts. This includes 9 of the 11 counties containing National Forest System lands. These partnerships include many agencies, groups, and individuals who have signed a Memorandum of

Chapter 2 - Goal and Objective Monitoring
108 Year 2009/2010 Monitoring and Midterm Evaluation Report
Understanding, which is a formal agreement that establishes roles and responsibilities of each partner. See Objective 3.3c regarding CWMAs. Annually, the Forest reevaluates the nonnative invasive species list and priority areas, and collaborate with Great Lakes Indian Fish and Wildlife Commission; Wisconsin Department of Natural Resources, counties and other agencies in northern Wisconsin.
Objective 1.4h: Increase use of prescribed fire as a management tool within fire adapted land-type associations. Reintroduce fire disturbance within research natural areas where establishment records allow. Prescribed fire was applied as a management tool on 117 and 716 acres of fire-adapted landtype associations in 2009 and 2010, respectively.
Objective 1.4i: When large disturbance events (over 100 acres) occur within forested areas, maintain a portion of the damaged vegetation to provide additional site level structure and coarse woody debris. In fiscal year 2009, there were no large disturbance events on the Chequamegon-Nicolet National Forest. In fiscal year 2010, a wind event caused some patchy damage on three of the five ranger districts (Great Divide, Medford-Park Falls, and Eagle River-Florence). The total area affected amounted to approximately 300 acres. Damage to trees impacted an existing timber sale and one red pine thinning sale that was being offered at the time of the event. Both sales were modified to adjust volumes and defect. The remainder of the affected area was being analyzed for potential additional salvage operations.
Since 2004, only two large disturbance events (one wind and one insect and disease) have occurred within the Chequamegon-Nicolet National Forest. The wind event was the Quad County Tornado that impacted approximately 6,900 acres on the Lakewood-Laona Ranger District. Approximately 47 percent of this area was left to provide coarse woody debris. The second event was the forestwide spruce decline insect and disease event that impacted approximately 8,780 acres. Of that, approximately 13 percent of the impacted area was left to provide additional site level structure.
Objective 1.4j: Increase the long-lived conifer component in transition zones between upland and lowland. During the development of the Forest Plan, the comparison of present conditions to estimates of natural variation indicated that present forests in Wisconsin lack the stand structure and composition that was noted during the 1850s and 1860s. The present stand
Table 37. Acres within fire-adapted landtype associations treated with prescribed fires.
Year Acres treated with prescribed fire
2005 325
2006 0
2007 508
2008 3,450
2009 117
2010 716
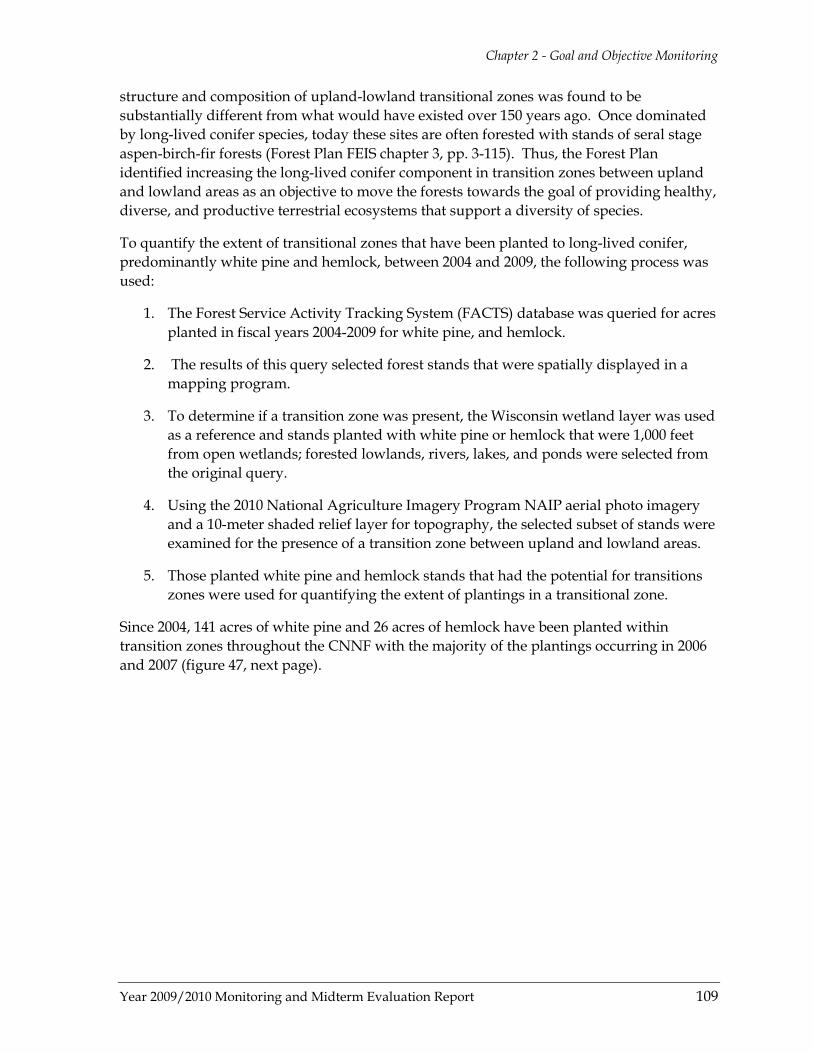
Chapter 2 - Goal and Objective Monitoring
Year 2009/2010 Monitoring and Midterm Evaluation Report 109
structure and composition of upland-lowland transitional zones was found to be substantially different from what would have existed over 150 years ago. Once dominated by long-lived conifer species, today these sites are often forested with stands of seral stage aspen-birch-fir forests (Forest Plan FEIS chapter 3, pp. 3-115). Thus, the Forest Plan identified increasing the long-lived conifer component in transition zones between upland and lowland areas as an objective to move the forests towards the goal of providing healthy, diverse, and productive terrestrial ecosystems that support a diversity of species.
To quantify the extent of transitional zones that have been planted to long-lived conifer, predominantly white pine and hemlock, between 2004 and 2009, the following process was used:
1. The Forest Service Activity Tracking System (FACTS) database was queried for acres planted in fiscal years 2004-2009 for white pine, and hemlock.
2. The results of this query selected forest stands that were spatially displayed in a mapping program.
3. To determine if a transition zone was present, the Wisconsin wetland layer was used as a reference and stands planted with white pine or hemlock that were 1,000 feet from open wetlands; forested lowlands, rivers, lakes, and ponds were selected from the original query.
4. Using the 2010 National Agriculture Imagery Program NAIP aerial photo imagery and a 10-meter shaded relief layer for topography, the selected subset of stands were examined for the presence of a transition zone between upland and lowland areas.
5. Those planted white pine and hemlock stands that had the potential for transitions zones were used for quantifying the extent of plantings in a transitional zone.
Since 2004, 141 acres of white pine and 26 acres of hemlock have been planted within transition zones throughout the CNNF with the majority of the plantings occurring in 2006 and 2007 (figure 47, next page).
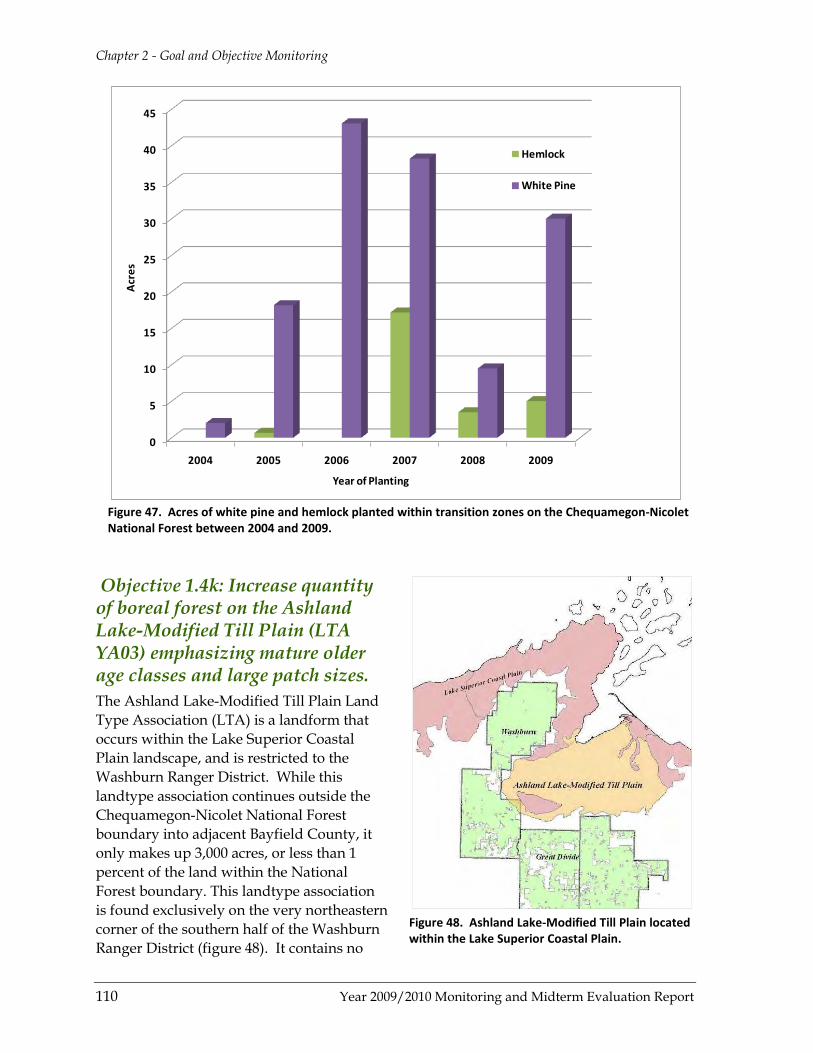
Chapter 2 - Goal and Objective Monitoring
110 Year 2009/2010 Monitoring and Midterm Evaluation Report
Figure 47. Acres of white pine and hemlock planted within transition zones on the Chequamegon-Nicolet National Forest between 2004 and 2009.
Objective 1.4k: Increase quantity of boreal forest on the Ashland Lake-Modified Till Plain (LTA YA03) emphasizing mature older age classes and large patch sizes. The Ashland Lake-Modified Till Plain Land Type Association (LTA) is a landform that occurs within the Lake Superior Coastal Plain landscape, and is restricted to the Washburn Ranger District. While this landtype association continues outside the Chequamegon-Nicolet National Forest boundary into adjacent Bayfield County, it only makes up 3,000 acres, or less than 1 percent of the land within the National Forest boundary. This landtype association is found exclusively on the very northeastern corner of the southern half of the Washburn Ranger District (figure 48). It contains no
0
5
10
15
20
25
30
35
40
45
2004 2005 2006 2007 2008 2009
Acr
es
Year of Planting
Hemlock
White Pine
Figure 48. Ashland Lake-Modified Till Plain located within the Lake Superior Coastal Plain.
Chapter 2 - Goal and Objective Monitoring
Year 2009/2010 Monitoring and Midterm Evaluation Report 111
lakes, but does include the headwaters of three streams that drain into the White River, a 1-mile stretch of Long Lake Branch (a class I trout stream), and a few small wetlands.
Aspen-white birch and northern hardwoods patches within this landtype association range from 20 to 100 acres in size. Most breaks in patches are created by the natural bogs and wetlands and contrast between patches is relatively low. This landtype association has been greatly modified; young plantations occur on the sandier portions and young aspen dominates the remainder. Undisturbed areas are restricted to Star Lake and along the stream corridors of Johnson Creek, Jader Creek, and Long Lake Branch Gorge.
No projects impacting the existing age class structure or patch sizes within this portion of the Ashland Lake-Modified Till Plain have been implemented
Objective 1.4l: Maintain and enhance existing pockets of barrens and oak savanna habitat and restore characteristics described in the future condition for MA8C. Treat these areas as inclusions with other management areas. See Objective 1.4a under management area 8C (Moquah Barrens).
Objective 1.4m: Increase aspen clearcut average patch size towards 25 acres, excluding ruffed grouse management areas. Landscape pattern, including forest composition and structure, was a prominent issue during the Forest Plan revision. A main conclusion reached during the Forest Plan revision was that the landscape structure in northern Wisconsin lacked large patch sizes and there was excessive interspersion of forest types. Increasing the average aspen clearcut size would help reduce fragmentation and begin to minimize edge effects.
Prior to the 2004 Forest Plan revision, the average aspen clearcut was 7 acres. During the last 6 years, the average aspen clearcut size has increased with the largest increase occurring in 2008. Current trends in clearcut patches indicate that, at the mid-term of implementing the Forest Plan, an average aspen clearcut size of 25 acres may be attainable in the next five years (figure 49).

Chapter 2 - Goal and Objective Monitoring
112 Year 2009/2010 Monitoring and Midterm Evaluation Report
Figure 49. Average size of aspen clearcuts on the Chequamegon-Nicolet National Forest from 2004-2010.
Objective 1.4n: Restore Canada yew within northern hardwood ecosystems in management area 2B where feasible. To date, no restoration projects for Canada yew have been proposed in management area 2B. For additional information regarding this objective, see the “Management Indicator Species” section under the “Minimum Legally Required Elements.”
Goal 1.5- Wildlife and Fish Habitat Objective 1.5a: Retain potential nest trees by reserving super-canopy pines within one-half mile of lakes larger than 10 acres that sustain a fishery desired by osprey. There have been no Chequamegon-Nicolet National Forest projects under the Forest Plan that harvested super-canopy white pine trees in areas designated as osprey or bald eagle nesting habitat (i.e., within 330 foot of former or current nest sites). These important structural features of osprey and eagle habitat were reserved per Forest Plan direction (pp. 1-4; Objective 1.5a). Both osprey and bald eagle have continued to increase in numbers since statewide nest surveys became available in the 1970s (figure 50).
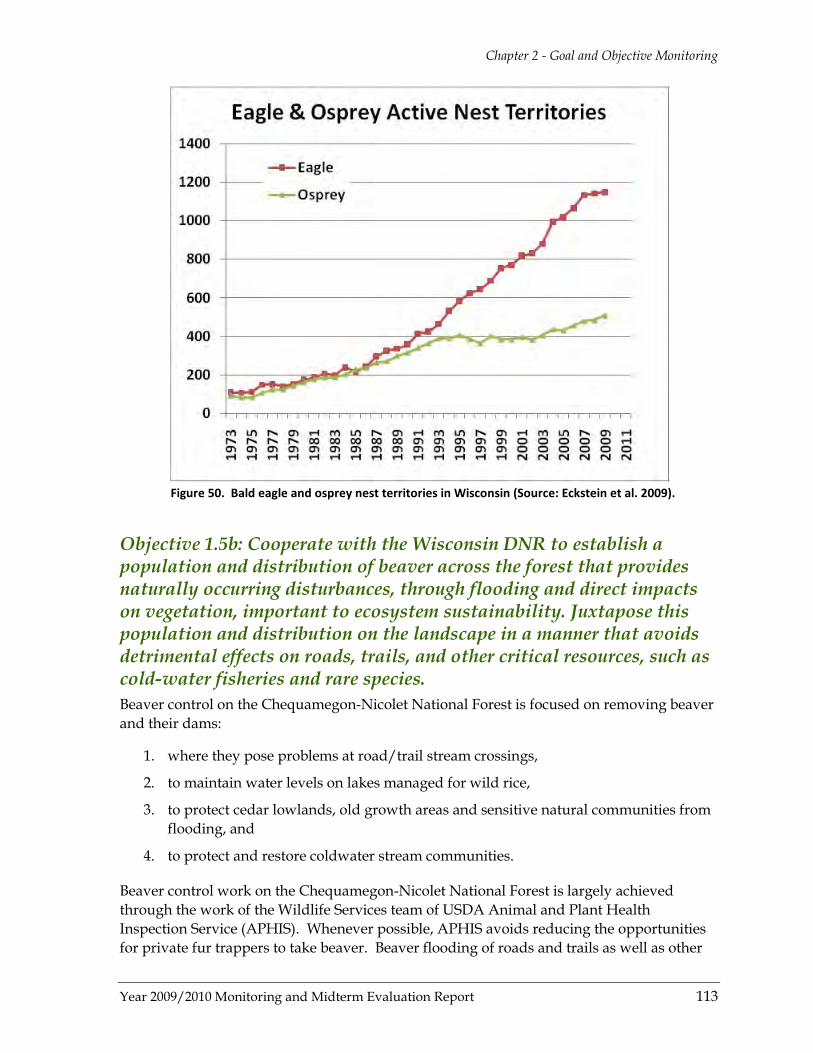
Chapter 2 - Goal and Objective Monitoring
Year 2009/2010 Monitoring and Midterm Evaluation Report 113
Figure 50. Bald eagle and osprey nest territories in Wisconsin (Source: Eckstein et al. 2009).
Objective 1.5b: Cooperate with the Wisconsin DNR to establish a population and distribution of beaver across the forest that provides naturally occurring disturbances, through flooding and direct impacts on vegetation, important to ecosystem sustainability. Juxtapose this population and distribution on the landscape in a manner that avoids detrimental effects on roads, trails, and other critical resources, such as cold-water fisheries and rare species. Beaver control on the Chequamegon-Nicolet National Forest is focused on removing beaver and their dams:
1. where they pose problems at road/trail stream crossings,
2. to maintain water levels on lakes managed for wild rice,
3. to protect cedar lowlands, old growth areas and sensitive natural communities from flooding, and
4. to protect and restore coldwater stream communities.
Beaver control work on the Chequamegon-Nicolet National Forest is largely achieved through the work of the Wildlife Services team of USDA Animal and Plant Health Inspection Service (APHIS). Whenever possible, APHIS avoids reducing the opportunities for private fur trappers to take beaver. Beaver flooding of roads and trails as well as other
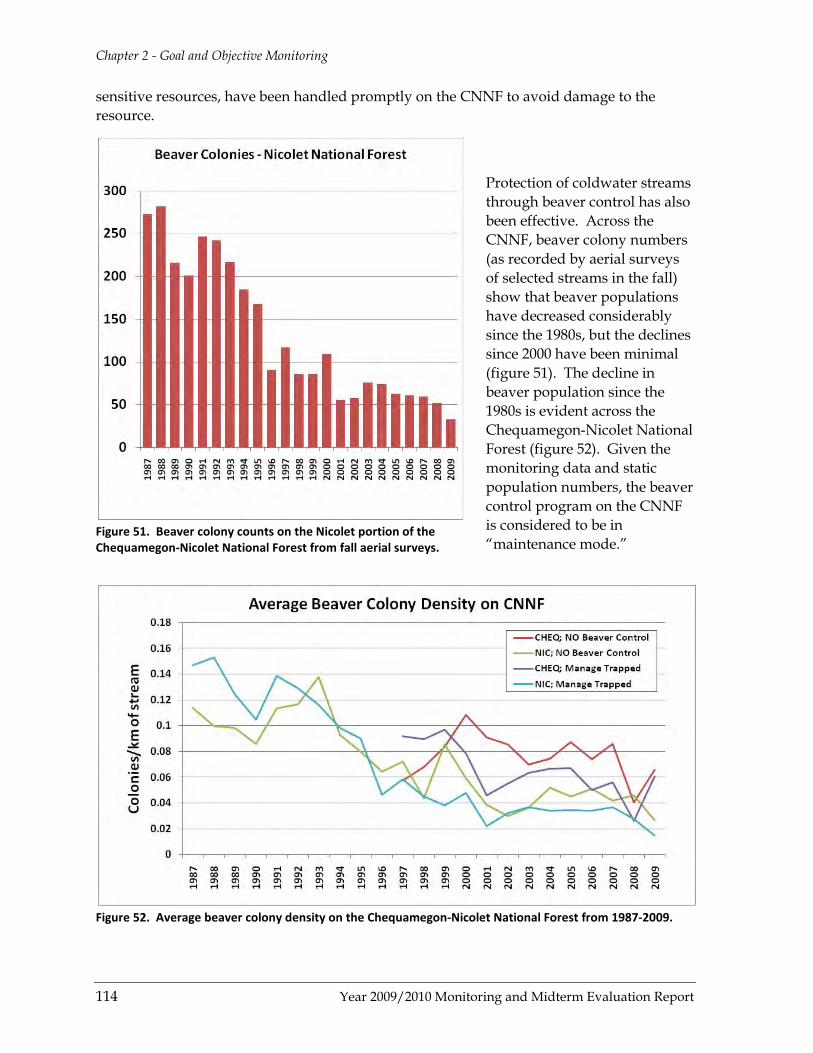
Chapter 2 - Goal and Objective Monitoring
114 Year 2009/2010 Monitoring and Midterm Evaluation Report
sensitive resources, have been handled promptly on the CNNF to avoid damage to the resource.
Protection of coldwater streams through beaver control has also been effective. Across the CNNF, beaver colony numbers (as recorded by aerial surveys of selected streams in the fall) show that beaver populations have decreased considerably since the 1980s, but the declines since 2000 have been minimal (figure 51). The decline in beaver population since the 1980s is evident across the Chequamegon-Nicolet National Forest (figure 52). Given the monitoring data and static population numbers, the beaver control program on the CNNF is considered to be in “maintenance mode.”
Figure 52. Average beaver colony density on the Chequamegon-Nicolet National Forest from 1987-2009.
Figure 51. Beaver colony counts on the Nicolet portion of the Chequamegon-Nicolet National Forest from fall aerial surveys.
Chapter 2 - Goal and Objective Monitoring
Year 2009/2010 Monitoring and Midterm Evaluation Report 115
Goal 1.6 – Air Quality Objective 1.6: Conduct forest management activities to protect or maintain local air quality. The 1977 amendments to the Clean Air Act contained provisions for a Prevention of Significant Deterioration program to prevent new stationary industrial sources from causing a significant deterioration of air quality in attainment areas. Federal land managers are responsible for ensuring that major new sources of air pollution permitted under prevention of significant deterioration will not adversely affect the air quality-related values of class I airshed areas. Most class I areas are national parks or Wildernesses designated in the 1977 amendments.
Particulate matter is the primary pollutant that can be generated on National Forests through prescribed fire or wildfire. It can affect human health, visibility, and temporarily affect road safety by reducing visibility along travelways. Ozone, sulfur dioxide, nitrogen oxides, and mercury tend to be generated in urban and industrial areas but can be transported to the CNNF where they can affect sensitive resources such as vegetation, lakes, and wildlife.
Rainbow Lake Wilderness is a class I air quality area. Air quality-related values are important Wilderness resource characteristics that could be affected by air pollution. The Forest Service has an affirmative responsibility to protect air quality-related values of the Wilderness from major new sources of air pollution. Doing so requires monitoring of air quality-related values to understand their status and trend relative to air quality conditions.
Water is one of the most sensitive air quality-related values because there are several soft-water seepage lakes in Rainbow Lake Wilderness that have minimal ability to buffer or neutralize acids and therefore are very susceptible to acid deposition. Three thresholds have been identified for alkalinity or acid neutralizing capacity in these lakes. The thresholds include an episodic “red line” value of 0 ueq/l (microequivalents per liter), a general red line value of 10 ueq/l and a “green line” value of 25 ueq/l. Concentrations below the red line values indicate adverse impacts from acidification are likely occurring to aquatic resources while those above the green line value indicate impacts are unlikely. Concentrations between 10 and 25 ueq/l are considered in the “yellow zone” where impacts from acidification are uncertain.
The alkalinity and pH of seven lakes has been monitored several times beginning in 1984. Except for 2006, each lake was monitored once per year in late summer from 1999 through 2010.
For only the second time in the 27-year sample period, all lake samples had acid neutralizing capacity above the green line value of 25 ueq/l in 2010. Mean acid neutralizing capacity values for the period of record remain above the red line value of 10 ueq/l for all lakes (see table 38). The three most sensitive lakes, Anderson, Bufo and Reynard, have mean acid neutralizing capacities within the yellow zone. In addition, there were no statistically
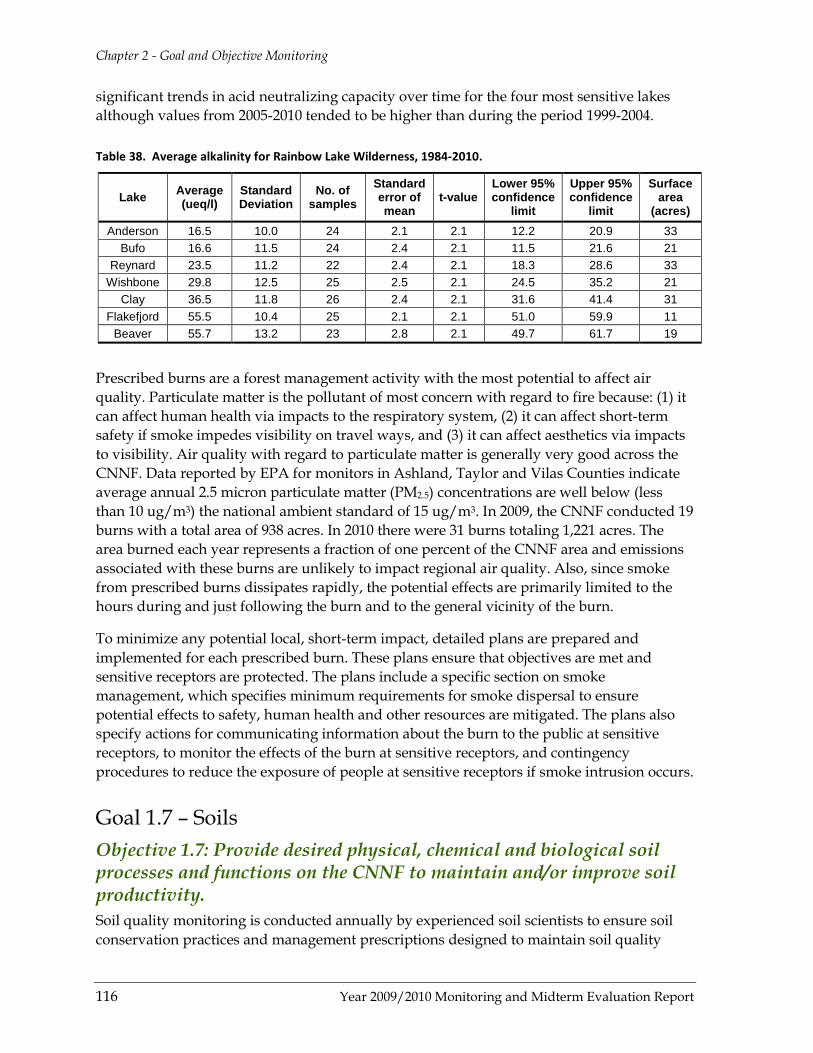
Chapter 2 - Goal and Objective Monitoring
116 Year 2009/2010 Monitoring and Midterm Evaluation Report
significant trends in acid neutralizing capacity over time for the four most sensitive lakes although values from 2005-2010 tended to be higher than during the period 1999-2004.
Table 38. Average alkalinity for Rainbow Lake Wilderness, 1984-2010.
Lake Average (ueq/l)
Standard Deviation
No. of samples
Standard error of mean
t-value Lower 95% confidence
limit
Upper 95% confidence
limit
Surface area
(acres) Anderson 16.5 10.0 24 2.1 2.1 12.2 20.9 33
Bufo 16.6 11.5 24 2.4 2.1 11.5 21.6 21 Reynard 23.5 11.2 22 2.4 2.1 18.3 28.6 33
Wishbone 29.8 12.5 25 2.5 2.1 24.5 35.2 21 Clay 36.5 11.8 26 2.4 2.1 31.6 41.4 31
Flakefjord 55.5 10.4 25 2.1 2.1 51.0 59.9 11 Beaver 55.7 13.2 23 2.8 2.1 49.7 61.7 19
Prescribed burns are a forest management activity with the most potential to affect air quality. Particulate matter is the pollutant of most concern with regard to fire because: (1) it can affect human health via impacts to the respiratory system, (2) it can affect short-term safety if smoke impedes visibility on travel ways, and (3) it can affect aesthetics via impacts to visibility. Air quality with regard to particulate matter is generally very good across the CNNF. Data reported by EPA for monitors in Ashland, Taylor and Vilas Counties indicate average annual 2.5 micron particulate matter (PM2.5) concentrations are well below (less than 10 ug/m3) the national ambient standard of 15 ug/m3. In 2009, the CNNF conducted 19 burns with a total area of 938 acres. In 2010 there were 31 burns totaling 1,221 acres. The area burned each year represents a fraction of one percent of the CNNF area and emissions associated with these burns are unlikely to impact regional air quality. Also, since smoke from prescribed burns dissipates rapidly, the potential effects are primarily limited to the hours during and just following the burn and to the general vicinity of the burn.
To minimize any potential local, short-term impact, detailed plans are prepared and implemented for each prescribed burn. These plans ensure that objectives are met and sensitive receptors are protected. The plans include a specific section on smoke management, which specifies minimum requirements for smoke dispersal to ensure potential effects to safety, human health and other resources are mitigated. The plans also specify actions for communicating information about the burn to the public at sensitive receptors, to monitor the effects of the burn at sensitive receptors, and contingency procedures to reduce the exposure of people at sensitive receptors if smoke intrusion occurs.
Goal 1.7 – Soils Objective 1.7: Provide desired physical, chemical and biological soil processes and functions on the CNNF to maintain and/or improve soil productivity. Soil quality monitoring is conducted annually by experienced soil scientists to ensure soil conservation practices and management prescriptions designed to maintain soil quality
Chapter 2 - Goal and Objective Monitoring
Year 2009/2010 Monitoring and Midterm Evaluation Report 117
have been implemented and are effective. The intent is to determine if site-specific project design features maintain the soil resource in an acceptable condition. Effectiveness monitoring on the Chequamegon-Nicolet National Forest is primarily done through qualitative assessments (mostly ocular) using indicators and measurement techniques defined by the Forest Service’s Eastern Region. Selected harvest units averaging about 25 acres in size are evaluated for detrimental soil conditions such as rutting, compaction, or erosion that may result from heavy equipment used in harvest activities. The degree, extent, and distribution of soil disturbance is documented and compared to the Regional soil quality standards. Additional quantitative monitoring may be conducted when qualitative assessments of management practices appear to have produced unacceptable results.
In addition to the methodology described above, in 2010 Forest soil scientists began using the Standardized Forest Soil Disturbance Monitoring Protocol developed by the Rocky Mountain Research Station and San Dimas Technology and Development Center. This protocol provides a statistically robust rapid assessment method for consistent monitoring of soil disturbance on National Forest System lands before and after management activities (Page-Dumreose et al. 2009a and b, Napper et al. 2009).
During fiscal years 2009 and 2010, Chequamegon-Nicolet National Forest soil scientists monitored and recorded soil resource impacts from timber harvest activities on 45 harvest units, from 20 different timber sales, across all five ranger districts on 33 different soil types. Each timber sale payment unit was evaluated individually for soil disturbance by a complete walk-through with the sale administrator, or by transecting the units using the new protocol to assess soil compaction, rutting, displacement, and erosion. Findings for each harvest unit were documented qualitatively and quantitatively, including supportive digital photos.
About 10 percent of each area was traveled on by timber-harvesting equipment. Winter (frozen ground) harvests had the least amount of soil disturbance with less than 1 percent of the area detrimentally compacted, usually at the landings and on main skid trails. All-season harvest during dry ground conditions left about 2 to 3 percent of the area detrimentally compacted at the landings and main skid trails, with no soil rutting. Harvest operations on wet soils with a loamy surface texture resulted in isolated ruts that were 6 to 10 inches deep and 10 to 20 feet long on some sections of the main skid trails in eight of the harvest units visited. Monitoring indicates less than 1 percent of these harvest units had detrimental ruts because Forest timber sale administrators followed soils guidelines to restrict heavy equipment operations during wet periods to minimize rutting of main trails and to avoid soil rutting in the general harvest area. No detrimental soil erosion, displacement, or organic matter removal was observed on any of the monitored harvest units.
Soil disturbance was also monitored across 700 acres of mechanical site treatments (five areas) within the Riley Lake Wildlife Management Area in 2010. Drum choppers had been pulled across the sites by a crawler or skidder to reduce the small tree and shrub components of these open lands and enhance sharp-tail grouse habitat. Results indicate restricting equipment operations to frozen ground very effectively minimized the risk of soil
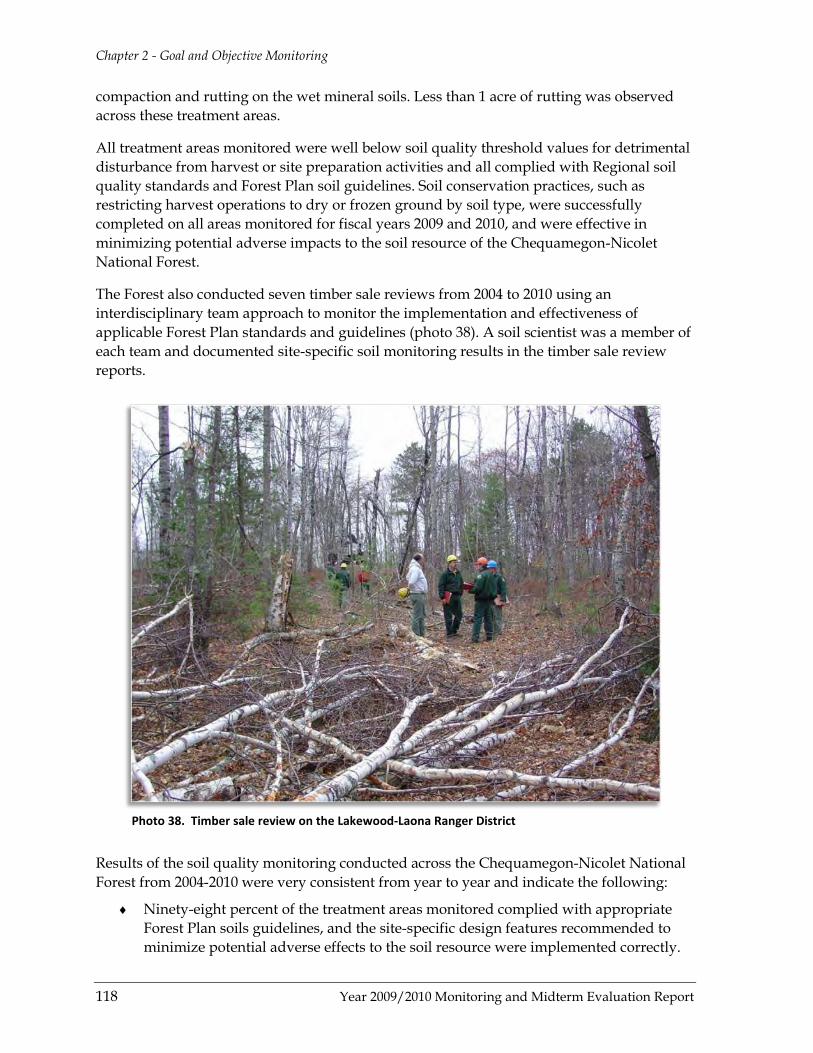
Chapter 2 - Goal and Objective Monitoring
118 Year 2009/2010 Monitoring and Midterm Evaluation Report
compaction and rutting on the wet mineral soils. Less than 1 acre of rutting was observed across these treatment areas.
All treatment areas monitored were well below soil quality threshold values for detrimental disturbance from harvest or site preparation activities and all complied with Regional soil quality standards and Forest Plan soil guidelines. Soil conservation practices, such as restricting harvest operations to dry or frozen ground by soil type, were successfully completed on all areas monitored for fiscal years 2009 and 2010, and were effective in minimizing potential adverse impacts to the soil resource of the Chequamegon-Nicolet National Forest.
The Forest also conducted seven timber sale reviews from 2004 to 2010 using an interdisciplinary team approach to monitor the implementation and effectiveness of applicable Forest Plan standards and guidelines (photo 38). A soil scientist was a member of each team and documented site-specific soil monitoring results in the timber sale review reports.
Photo 38. Timber sale review on the Lakewood-Laona Ranger District
Results of the soil quality monitoring conducted across the Chequamegon-Nicolet National Forest from 2004-2010 were very consistent from year to year and indicate the following:
♦ Ninety-eight percent of the treatment areas monitored complied with appropriate Forest Plan soils guidelines, and the site-specific design features recommended to minimize potential adverse effects to the soil resource were implemented correctly.
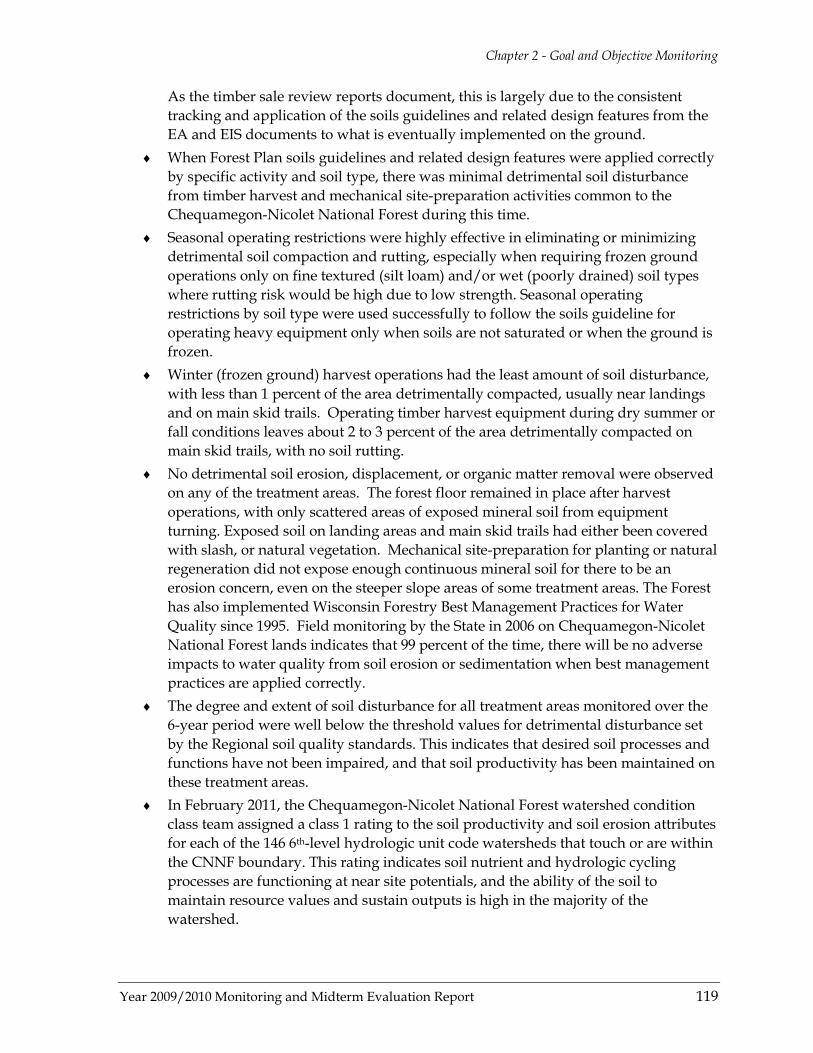
Chapter 2 - Goal and Objective Monitoring
Year 2009/2010 Monitoring and Midterm Evaluation Report 119
As the timber sale review reports document, this is largely due to the consistent tracking and application of the soils guidelines and related design features from the EA and EIS documents to what is eventually implemented on the ground.
♦ When Forest Plan soils guidelines and related design features were applied correctly by specific activity and soil type, there was minimal detrimental soil disturbance from timber harvest and mechanical site-preparation activities common to the Chequamegon-Nicolet National Forest during this time.
♦ Seasonal operating restrictions were highly effective in eliminating or minimizing detrimental soil compaction and rutting, especially when requiring frozen ground operations only on fine textured (silt loam) and/or wet (poorly drained) soil types where rutting risk would be high due to low strength. Seasonal operating restrictions by soil type were used successfully to follow the soils guideline for operating heavy equipment only when soils are not saturated or when the ground is frozen.
♦ Winter (frozen ground) harvest operations had the least amount of soil disturbance, with less than 1 percent of the area detrimentally compacted, usually near landings and on main skid trails. Operating timber harvest equipment during dry summer or fall conditions leaves about 2 to 3 percent of the area detrimentally compacted on main skid trails, with no soil rutting.
♦ No detrimental soil erosion, displacement, or organic matter removal were observed on any of the treatment areas. The forest floor remained in place after harvest operations, with only scattered areas of exposed mineral soil from equipment turning. Exposed soil on landing areas and main skid trails had either been covered with slash, or natural vegetation. Mechanical site-preparation for planting or natural regeneration did not expose enough continuous mineral soil for there to be an erosion concern, even on the steeper slope areas of some treatment areas. The Forest has also implemented Wisconsin Forestry Best Management Practices for Water Quality since 1995. Field monitoring by the State in 2006 on Chequamegon-Nicolet National Forest lands indicates that 99 percent of the time, there will be no adverse impacts to water quality from soil erosion or sedimentation when best management practices are applied correctly.
♦ The degree and extent of soil disturbance for all treatment areas monitored over the 6-year period were well below the threshold values for detrimental disturbance set by the Regional soil quality standards. This indicates that desired soil processes and functions have not been impaired, and that soil productivity has been maintained on these treatment areas.
♦ In February 2011, the Chequamegon-Nicolet National Forest watershed condition class team assigned a class 1 rating to the soil productivity and soil erosion attributes for each of the 146 6th-level hydrologic unit code watersheds that touch or are within the CNNF boundary. This rating indicates soil nutrient and hydrologic cycling processes are functioning at near site potentials, and the ability of the soil to maintain resource values and sustain outputs is high in the majority of the watershed.
Chapter 2 - Goal and Objective Monitoring
120 Year 2009/2010 Monitoring and Midterm Evaluation Report
The soil resource information in the Forest Plan and assumptions regarding direct, indirect and cumulative effects in the Forest Plan FEIS remain valid today, as documented in each project EA or EIS and on-the-ground monitoring results. The soil resources of the Chequamegon-Nicolet National Forest are well mapped and characterized with landtype phases providing the site-specific physical, chemical, biological, and interpretive soil information necessary to implement 2004-2010 Forest Plan activities while maintaining long-term soil quality and productivity. This information is never static because refinements are made to landtype phase interpretations to reflect new science and address new activities, such as biomass removal. In addition to following Forest Plan soils guidelines, design features based on site-specific soil characteristics, best management practices for water quality, and woody biomass harvesting guidelines, the risk of soil disturbance from project activities is further evaluated based on current applicable research and the professional judgment of a soil scientist. Current soil issues and concerns were assessed for each new project area, and design features to minimize soil disturbance were refined based on new information, adjusted soil interpretations, and/or past monitoring results.
The soil resource of the Chequamegon-Nicolet National Forest continues to be studied to ensure guidelines and design features are adequate to maintain soil quality. Forest staff participated in a winter logging study to better quantify the combined depth of frost and packed snow conditions necessary to prevent detrimental soil rutting or compaction. Soil scientists with the San Dimas Technology and Development Center, San Dimas California, led the study, which also includes sites on the Okanagan-Wenatchee, Idaho Panhandle, and Hiawatha National Forests. The Chequamegon-Nicolet National Forest study sites were located in two timber sale units with somewhat poor to poorly drained Magnor and Capitola soil types on the Medford-Park Falls Ranger District. Soil scientists collected baseline data from frost tubes and buried temperature and moisture sensors from October 2008 through April 2009 (photo 39). Timber harvesting and additional data collection took place during the winter of 2009-2010.
The Forest Service national soil disturbance monitoring protocol mentioned above was also tested before and after harvest as part of this study. One objective of the study is to develop winter logging guidelines that incorporate the latest research on snowpack strength and frozen soil, and will provide measurable criteria for determining when appropriate conditions exist. A final published technical report from San Dimas Technology and Development Center is pending.
Assumptions made in the Forest Plan FEIS about trends in the amount of soil disturbance expected across the Chequamegon-Nicolet National Forest that were correct for 2004-2010 and continue to be the trend include the following:
Photo 39. Checking frost depth

Chapter 2 - Goal and Objective Monitoring
Year 2009/2010 Monitoring and Midterm Evaluation Report 121
♦ After 15 years of implementing the Chequamegon and Nicolet Forest Plans, there is a trend toward reducing ground-disturbing activities such as road construction, timber harvest, and mechanical site preparation. In addition, road closures and obliteration are increasing in an effort to reduce forestwide road density. This trend continues for acres harvested, site-preparation acres, and road miles.
♦ Of the 1,494,000 acres of Chequamegon-Nicolet National Forest land, 1.3 to 1.5 percent is projected to have potential ground-disturbing activities proposed annually through the first decade for all alternatives, leaving more than 98.5 percent with no disturbance, and 85 percent undisturbed over the decade. The actual average annual harvested area from 2004 to 2010 was 8,990 acres, or 0.60 percent per year. This was less than half the predicted amount, leaving 99.4 percent undisturbed annually and 95 percent undisturbed over the first decade if the trend continues for the next 3 years.
♦ Leaving logging slash on site is common practice for all types of harvest on the Chequamegon-Nicolet National Forest. This continues to be true, because while Wisconsin's forestry community has recognized an emerging interest in wood-based bio-energy, the actual demand for woody biomass from the CNNF has been low, accounting for less than 3 percent of the total wood volume harvested from 2007-2010. A Forest Plan soils guideline requires logging slash to be retained on designated soil types, and is concurrent with the new State woody biomass guidelines, which together continue to guide where biomass removal is acceptable on the Chequamegon-Nicolet National Forest through site-specific EA and EIS analysis.
Goal 2.1 – Recreation Opportunities Objective 2.1a: Improve the quality of semi-primitive nonmotorized Areas by increasing the opportunity for quiet and remote experiences and by promoting activities that provide natural-appearing vegetation. Semi-primitive nonmotorized areas are specifically intended to provide the forest visitor with a remote, secluded experience, free from the sounds and presence of motorized vehicles. The Chequamegon-Nicolet National Forest is one of the few places in Wisconsin with a landbase large enough and contiguous enough to provide opportunities for solitude or relatively primitive, unconfined types of recreation.
The Forest Plan identified two levels of semi-primitive nonmotorized experiences: low disturbance areas (management area 6A) and moderate disturbance areas (management area 6B). Forest visitor experiences of solitude and remoteness may be increased in management area 6A because timber harvest is excluded through provisions established in the Forest Plan. There are approximately 20,000 acres in management area 6A where no scheduled timber harvests are allowed.
Moderate disturbance semi-primitive nonmotorized (management area 6B) recreation emphasis areas are overlaid on other vegetation management areas, but include additional
Chapter 2 - Goal and Objective Monitoring
122 Year 2009/2010 Monitoring and Midterm Evaluation Report
standards and guidelines that increase the semi-primitive nonmotorized experience. These standards and guidelines are designed to enhance the feeling of remoteness and natural appearing vegetation, while still allowing for some timber harvest.
Management area 6B includes approximately 49,000 acres that are overlaid on management areas 1B, 2A, 2B, 3B, and 8D (table 39). Management of management area 6B is accomplished by specific guidelines for 6B as well as guidelines for the associated vegetation management areas. Standards and guidelines for both management areas are applied, when they conflict the more restrictive standards and guidelines prevail.
Since the signing of the Forest Plan, no timber harvests have taken place in these semi-primitive nonmotorized areas thereby having a positive effect on the sense of quiet and remoteness of these areas.
Table 39. Underlying management areas of management area 6B.
Management Area Acres
1B 8,519
2A 19,455
2B 14,534
3B 5,613
8D 742
Total 48,864
Objective 2.1b: Within each MA 6B area (polygon) generally complete the harvesting planned for the decade during a consecutive 3-year period Since implementation of the Forest Plan began, no harvest activities have occurred within management area 6B, semi-primitive nonmotorized areas.
Objective 2.1c: Reduce and strive to eliminate unacceptable changes in resource conditions due to off-road, off-trail motorized use The Forest Plan Record of Decision eliminated cross-country all-terrain vehicle (ATV) travel and restricted ATV use to designated trails and system roads. Starting in 2009, the Motor Vehicle Use Map reduced the miles of unauthorized roads available to highway-legal vehicles. Both of these decisions have helped reduce resource damage from off-road or off-trail vehicle use. Through public education and law enforcement, the forest continues to work on reducing resource damage that may occur from unauthorized off-road or off-trail vehicle use.
Chapter 2 - Goal and Objective Monitoring
Year 2009/2010 Monitoring and Midterm Evaluation Report 123
Objective 2.1d: Construct up to 85 miles of ATV trail on the Nicolet landbase. Objective 2.1e: Construct up to 100 miles of ATV trail on the Chequamegon landbase. On the Nicolet side of the CNNF, 0.6 mile of trail was constructed, and 10.0 miles of ATV trail were designated in 2009. In 2010, 1.9 miles of trail were constructed, and 1.2 miles of trail were designated (table 40). On the Chequamegon side of the CNNF, 0.1 mile of trail was constructed in 2009 and 2.2 miles were constructed in 2010.
In 2009, the total miles of designated ATV trail was approximately 283 miles on the Chequamegon landbase of the CNNF and approximately 9.5 miles on the Nicolet landbase. In 2010, the Chequamegon landbase had an increase in designated ATV trails up to 306 miles while the Nicolet increased to 9.9 miles of trail.
Table 40. Miles of ATV trail created each year on the Chequamegon-Nicolet National Forest.
Landbase 2005 2006 2007 2008 2009 2010 Total Nicolet 0 0 2.0 4 0.6 1.9 8.5 Chequamegon 0 0 0 3 0.1 2.2 5.3
Objective 2.1f: On the Nicolet, in collaboration with local governments, provide opportunities to enhance existing town-designated ATV routes by designating specific existing classified roads Under the 2005 Travel Management Rule, the public (including town governments) has been able to participate in the Motor Vehicle Use Map update process and request roads or trails be added to the motor vehicle use map. In 2009 and 2010, approximately 19 miles and 31 miles of roads on the Nicolet landbase, respectively were designated as ATV routes during the Motor Vehicle Use Map update process.
Objective 2.1g: On the Chequamegon, designate and sign all classified roads as ATV routes except: (1) on roads where the CNNF does not have authority to designate as ATV routes; and (2) in instances where the local ranger district identifies and closes specific routes for management issues such as safety, resource degradation, local government concerns, or recreation use conflict. The 2005 ATV Transition Plan provided direction on the designation of roads for ATV use. The plan allowed for a 1- to 2-year transition period to complete the signing of classified roads as ATV routes. After this transition period, roads were closed to ATV use unless posted open. To assist the public with identifying the roads open to ATV use, the CNNF published maps titled “Chequamegon-Nicolet National Forest ATV Routes and Trails.” These maps were in effect until the CNNF implemented the Travel Management Rule and published the first Motor Vehicle Use Map in 2009. On the "ATV Routes and Trails" map,
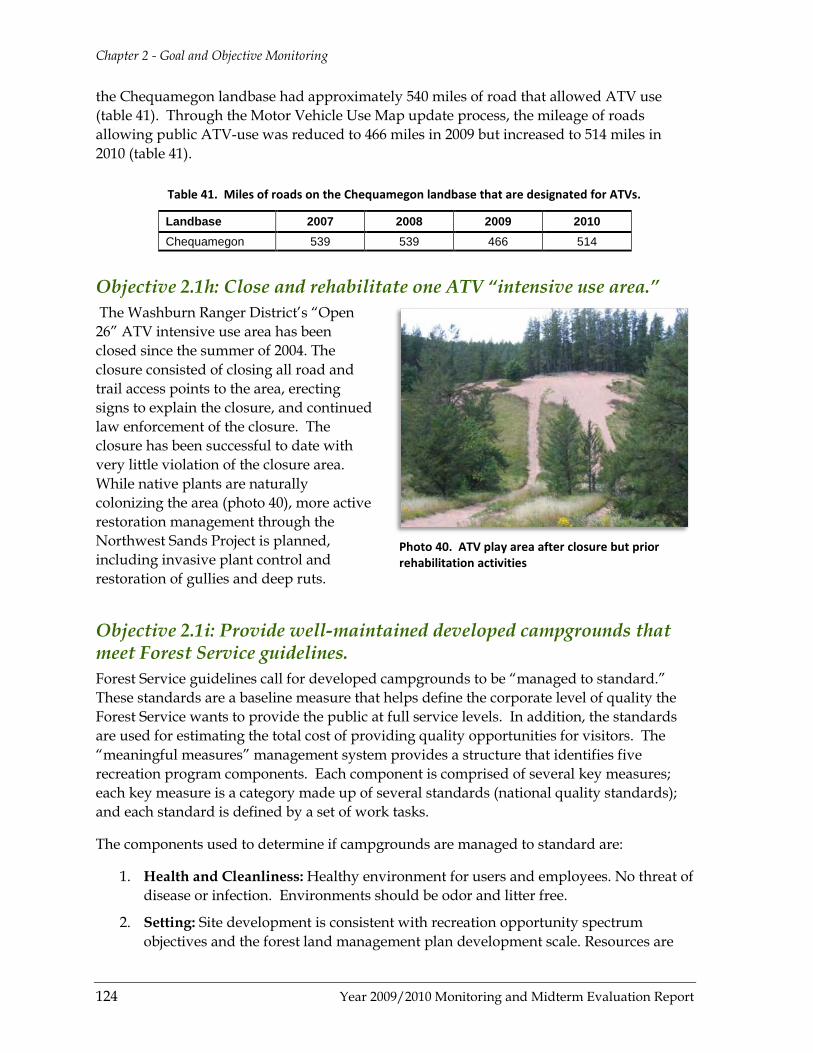
Chapter 2 - Goal and Objective Monitoring
124 Year 2009/2010 Monitoring and Midterm Evaluation Report
the Chequamegon landbase had approximately 540 miles of road that allowed ATV use (table 41). Through the Motor Vehicle Use Map update process, the mileage of roads allowing public ATV-use was reduced to 466 miles in 2009 but increased to 514 miles in 2010 (table 41).
Table 41. Miles of roads on the Chequamegon landbase that are designated for ATVs.
Landbase 2007 2008 2009 2010 Chequamegon 539 539 466 514
Objective 2.1h: Close and rehabilitate one ATV “intensive use area.” The Washburn Ranger District’s “Open 26” ATV intensive use area has been closed since the summer of 2004. The closure consisted of closing all road and trail access points to the area, erecting signs to explain the closure, and continued law enforcement of the closure. The closure has been successful to date with very little violation of the closure area. While native plants are naturally colonizing the area (photo 40), more active restoration management through the Northwest Sands Project is planned, including invasive plant control and restoration of gullies and deep ruts.
Objective 2.1i: Provide well-maintained developed campgrounds that meet Forest Service guidelines. Forest Service guidelines call for developed campgrounds to be “managed to standard.” These standards are a baseline measure that helps define the corporate level of quality the Forest Service wants to provide the public at full service levels. In addition, the standards are used for estimating the total cost of providing quality opportunities for visitors. The “meaningful measures” management system provides a structure that identifies five recreation program components. Each component is comprised of several key measures; each key measure is a category made up of several standards (national quality standards); and each standard is defined by a set of work tasks.
The components used to determine if campgrounds are managed to standard are:
1. Health and Cleanliness: Healthy environment for users and employees. No threat of disease or infection. Environments should be odor and litter free.
2. Setting: Site development is consistent with recreation opportunity spectrum objectives and the forest land management plan development scale. Resources are
Photo 40. ATV play area after closure but prior rehabilitation activities

Chapter 2 - Goal and Objective Monitoring
Year 2009/2010 Monitoring and Midterm Evaluation Report 125
maintained or enhanced, scenery management is consistent with objectives, and density of users is appropriate
3. Safety and Security: Provide for a safe environment for users and employees. Uniformed Forest Service personnel are present. Abusive and nonconforming activities are controlled and risk of crime is eliminated.
4. Responsiveness: Experience meets visitor expectations, needs, and preferences. Information and interpretive services are available along with appropriate unique amenities with good hosting services.
5. Condition of Facilities and Equipment: They have an overall good appearance, function properly, are in good repair, and appropriate.
During fiscal year 2009, approximately 80 percent of campgrounds met standards. During fiscal year 2010, 85 percent of campgrounds conformed to standards. Replacement of many toilet buildings under an American Reinvestment and Recovery Act project helped to increase some sites compliance with being "managed to standard.” Since 2004, more than 70 percent of the campgrounds annually have conformed to standards.
Objective 2.1j: Inventory and manage remote campsites to minimize environmental impacts of recreation use. In fiscal years 2009 and 2010, no campsites were identified as seriously damaged or in need of major repair or closing.
Objective 2.1k: Close unsurfaced primitive access roads to some lakes to provide a more primitive recreation experience. Emphasize lakes with documented RFSS sites. Motorized access roads to four lakes have been closed. The road access to Kieper Lake on the Eagle River-Florence Ranger District was closed because the Lauterman Lake area was designated as a non-motorized area under the 2004 Forest Plan. Similarly, access roads to Patsy Lake, Wilson Lake, and Spring Lake were closed to motorized access because they are in the Rock Lake non-motorized area of the Great Divide Ranger District. No RFSS sites are known from these four lakes.
Objective 2.1l: If maintenance methods prove ineffective and monitoring confirms unsafe conditions or unacceptable resource damage, close and rehabilitate the existing 25-mile 4WD ORV trail. Then construct a replacement trail up to 25 miles long elsewhere on the CNNF providing an agreement with a non-Forest Service entity is developed to maintain and monitor trail conditions. During 2009 and 2010, trail conditions surveys of the existing off-road vehicle (ORV) trail indicated that there were instances of exposed natural gas pipe along sections of the trail as well as areas of extreme rutting. Boulder barriers and other closure structures were used to

Chapter 2 - Goal and Objective Monitoring
126 Year 2009/2010 Monitoring and Midterm Evaluation Report
mitigate the risk of vehicles from contacting the pipe. Unauthorized motorized access via roads that are signed as closed to public motorized vehicle travel continued to decrease the effectiveness of the protection measures along the utility corridor. The Chequamegon-Nicolet National Forest continues to work internally and with partners to monitor the ORV trail with a goal of maintaining a safe, environmentally secure trail.
Goal 2.2- Scenic Values Objective 2.2a: Maintain or enhance the quality of scenic resources to provide desired landscape character. The Forest Plan provides scenery management guidance for activities on the Chequamegon-Nicolet National Forest. Scenery management guidelines address roads, trails, recreation use areas, and water bodies. The design of permanent and temporary openings, utility lines that intersect the CNNF, and reforestation also have scenic integrity objectives, along with tree marking of timber harvests, treatment of residue from timber harvest or other vegetation removal activities, and visual management for riparian areas along shorelines and within streams.
The effect of management practices on scenery is being evaluated at the project level. As part of project analysis, the scenery management guidelines set up in the Forest Plan are being applied and scenery management standards are being met.
Goal 2.3- Wilderness Opportunities Objective 2.3a: If opportunities arise, and in cooperation with local governments, allow decommissioning of roads that divide Wilderness areas or occur between Wilderness and Wilderness study areas to improve the Wilderness experience. The Chequamegon-Nicolet National Forest has been working toward ensuring all Wilderness Areas meet the standard as defined under the 10-year Wilderness Stewardship Challenge to obtain desired condition. In 2009, the CNNF made progress and increased some Wilderness Areas’ scores toward meeting the minimum stewardship level.
All roads dividing Wilderness are township gas tax roads. No current proposals include decommissioning roads separating Wilderness.
Goal 2.4 – Cultural Resources The Chequamegon-Nicolet National Forest, through its Heritage Program, is charged with the responsibility of protecting, managing and interpreting cultural resources; that is, significant archaeological sites and historically significant buildings, structures, objects and cultural modifications to the landscape. The Forest Plan’s standards and guidelines reflect statutory direction provided in the National Historic Preservation Act (NHPA) of 1966, as amended. Specifically, NHPA section 106 requires agencies to take into consideration the

Chapter 2 - Goal and Objective Monitoring
Year 2009/2010 Monitoring and Midterm Evaluation Report 127
effect of its actions on cultural resources, and section 110 provides direction to Federal agencies regarding cultural resource management and protection.
Beyond legal compliance, the Forest Plan’s standards and guidelines also establishes an approach to resource management that allows the public, as well as institutional and governmental partners, to join the Forest Service in the goal of understanding the diversity of human history in northern Wisconsin.
All elements of the CNNF’s Heritage Program goal statement were met from 2004 to 2010. Through the remaining period of Forest Plan implementation, it is essential that Heritage Program philosophy continues to balance support to other areas of resource management along with the essential elements of heritage stewardship (scientific understanding, resource protection, and interpretation for the public benefit). Prior to implementation of the current Forest Plan, the CNNF’s Heritage Program was primarily a vehicle for providing NHPA reviews and clearances for other areas of resource management, but arguably this is no longer the case. Along with achieving program balance, the Chequamegon-Nicolet National Forest attracted a broad historic preservation constituency that includes representatives of governmental, tribal, public, academic, and professional organizations. Many will continue to observe and review the CNNF’s progress, and in accord with Forest Plan direction, the Chequamegon-Nicolet National Forest must work closely with all sectors of the historic preservation community to demonstrate effective cultural resource stewardship, and Forest Plan implementation.
Objective 2.4a: Promote the scientific study of a selected cultural resource, primarily through public participation and institutional/governmental partnerships. As a means of protecting recorded cultural resources, each year 50 or more sites are monitored to ensure they have not been damaged through natural causes, or through inadvertent or unlawful activities.
All cultural resources are considered potentially significant until formally evaluated. Evaluation, however, is a time-consuming task. Archaeological evaluation, for example, includes a range of activities such as excavation and post-field analyses.
The results of field observations and analyses serve as a basis for determining site type and cultural context. With such an understanding, Forest staff determine whether a property is significant, measuring significance against National Register of Historic Places evaluation criteria (36 CFR 60). Though a difficult and expensive task, the Chequamegon-Nicolet National Forest evaluated over 300 sites through contractual agreements, volunteerism, and partnerships.
Chapter 2 - Goal and Objective Monitoring
128 Year 2009/2010 Monitoring and Midterm Evaluation Report
Properties and Sites Eligible for, or Listed on the National Register of Historic Places The Forest Plan provides direction to nominate significant properties to the National Register of Historic Places. Examples of significant properties that were placed on the Register since 2004 include:
♦ Butternut-Franklin Lakes Archaeological District (Forest County) – Through partnership and volunteerism, the archaeological resources of the Butternut-Franklin Lakes area were established as a National Register of Historic Places district, one of the few such districts in the state. Sites included in this district represent a 10,000-year continuum of occupation.
♦ Fifield Fire Lookout Tower (Price County) – The Fifield Tower is one of nine remaining Depression-Era fire lookout towers within the Chequamegon-Nicolet National Forest, and it was placed on the National Register of Historic Places in 2007. The nomination process included gathering an oral history of one of the tower's earlier lookouts, one of the first female fire lookouts in the county.
♦ Mountain Fire Lookout Tower (Oconto County) – Another of the CNNF's nine remaining Depression-Era fire lookout towers, the Mountain Tower has the distinction of being the only fire lookout in the State that is open to climb by the public. Visitors are invited to climb the tower and experience a dramatic view of the CNNF landscape.
♦ Lake Owen Archaeological District (Bayfield County) – Years of research focusing on the shores of Lake Owen resulted in the discovery of numerous archaeological sites. With completion of post-field analyses, the Forest has concluded that Native occupation dates back 6,000 years, with evidence that Native peoples continued to live along the lake as recently as several hundred years ago. In 2010, the Chequamegon-Nicolet National Forest completed a National Register of Historic Places district nomination, and it is anticipated that the district will likely be placed on the National Register in 2011.
In addition and most recently, the sites listed below were evaluated to be placed on the National Register of Historic Places through agreements, volunteerism, and partnerships.
Minertown Historic Site – In 2009, the Chequamegon-Nicolet National Forest Heritage Program staff, through contractual agreement with Commonwealth Cultural Resources Group, Inc., (CCRG) evaluated an archaeological property referred to as Minertown (47FR112), on the Lakewood-Laona Ranger District. The study was facilitated by the support and assistance of the citizens of Forest and Vilas County, which included informant interviews that provided significant information regarding site history. The project was further aided by volunteers who assisted with field mapping activities. Minertown is a remnant mill and company town complex in Forest County. It was established in 1899 soon after the Chicago & Northwestern Railroad had expanded into Forest County. Brothers Wilbur and Henry T. Miner from Vernon County, Wisconsin, assisted by their sister Mary, purchased a 4,000-acre tract of land covered with hardwoods from the railroad and began constructing a sawmill.
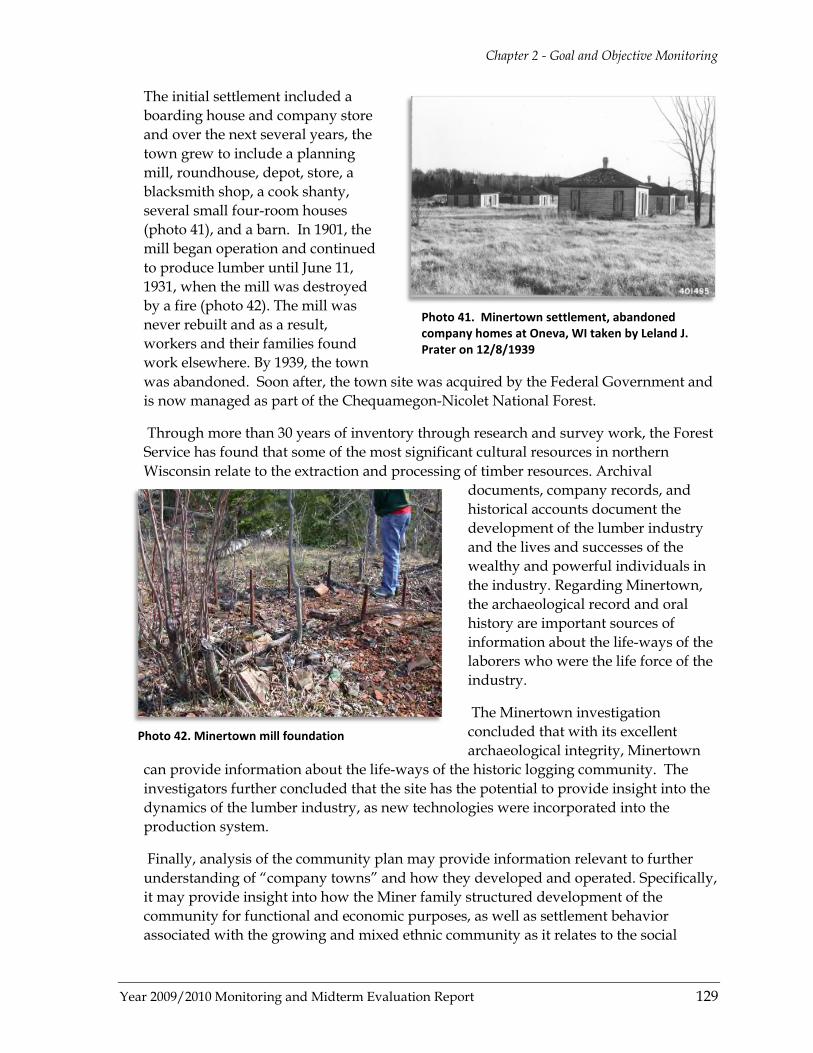
Chapter 2 - Goal and Objective Monitoring
Year 2009/2010 Monitoring and Midterm Evaluation Report 129
The initial settlement included a boarding house and company store and over the next several years, the town grew to include a planning mill, roundhouse, depot, store, a blacksmith shop, a cook shanty, several small four-room houses (photo 41), and a barn. In 1901, the mill began operation and continued to produce lumber until June 11, 1931, when the mill was destroyed by a fire (photo 42). The mill was never rebuilt and as a result, workers and their families found work elsewhere. By 1939, the town was abandoned. Soon after, the town site was acquired by the Federal Government and is now managed as part of the Chequamegon-Nicolet National Forest.
Through more than 30 years of inventory through research and survey work, the Forest Service has found that some of the most significant cultural resources in northern Wisconsin relate to the extraction and processing of timber resources. Archival
documents, company records, and historical accounts document the development of the lumber industry and the lives and successes of the wealthy and powerful individuals in the industry. Regarding Minertown, the archaeological record and oral history are important sources of information about the life-ways of the laborers who were the life force of the industry.
The Minertown investigation concluded that with its excellent archaeological integrity, Minertown
can provide information about the life-ways of the historic logging community. The investigators further concluded that the site has the potential to provide insight into the dynamics of the lumber industry, as new technologies were incorporated into the production system.
Finally, analysis of the community plan may provide information relevant to further understanding of “company towns” and how they developed and operated. Specifically, it may provide insight into how the Miner family structured development of the community for functional and economic purposes, as well as settlement behavior associated with the growing and mixed ethnic community as it relates to the social
Photo 41. Minertown settlement, abandoned company homes at Oneva, WI taken by Leland J. Prater on 12/8/1939
Photo 42. Minertown mill foundation

Chapter 2 - Goal and Objective Monitoring
130 Year 2009/2010 Monitoring and Midterm Evaluation Report
history of the region. It also has a strong link with Vernon County, WI where the Miner Family also ran a community called Minertown. There is evidence yet to explore of the links and ways they moved animals and people back and forth between southern and northern Wisconsin. Minertown was listed on the State Register of Historic Places in November 2009 and it is the only site of its type in Wisconsin so designated.
Archibald Lake Mounds and Village Site – In 2009, the Forest Service, through contractual agreement with Commonwealth Cultural Resource Group (CCRG) and in partnership with the College of the Menominee Nation (CMN) undertook the evaluation of Archibald Lake Mounds and Village (47OC309). Under the direction of Forest Service, CCRG, and CMN archaeologists, volunteers recruited through the Passport in Time program served as a field crew (photo 43). The Forest Service received ownership of this remarkable Oconto County site in 1988, and based on the presence of numerous conical and linear mounds, it was recorded as a mortuary complex.
In the years that followed acquisition, continued site visits resulted in documenting over 150 cache pits, garden beds, and likely habitation areas adjacent to and surrounding the mounds. Consequently, it was concluded that the site also served as a horticultural village. In early 2009, the Forest Service, CCRG, and CMN developed a research strategy. The goals of this research were to determine the occupants’ cultural backgrounds, when they occupied the site, and the nature of their community plan. Based on the 2009 and 2010 investigations, Forest staff determined the site was occupied between the thirteenth and fifteenth centuries A.D. based on calibrated radiocarbon dates.
Regarding cultural affiliation, recovered ceramics include both Oneota (Mero complex) and Terminal Woodland (Point Sauble) wares, and it is argued the site relates to the provisional Wolf River Tradition, a northern Oneota manifestation recognized throughout northeastern Wisconsin and the Upper Peninsula of Michigan. Analyses of excavated materials and surface features are ongoing, and investigation continued into 2010, again cooperatively with CCRG and the CMN. Though the investigation
continued into 2010, a National Register of Historic Places nomination was prepared in 2009 and submitted to the Wisconsin Historical Society.
As a means of ascertaining what was grown in the gardens, the 2010 study broadened its investigative methods to include the phytolith analysis and analysis of starch grains associated with soil and ceramic samples recovered from garden bed context. The
Photo 43. Archibald Lake excavation
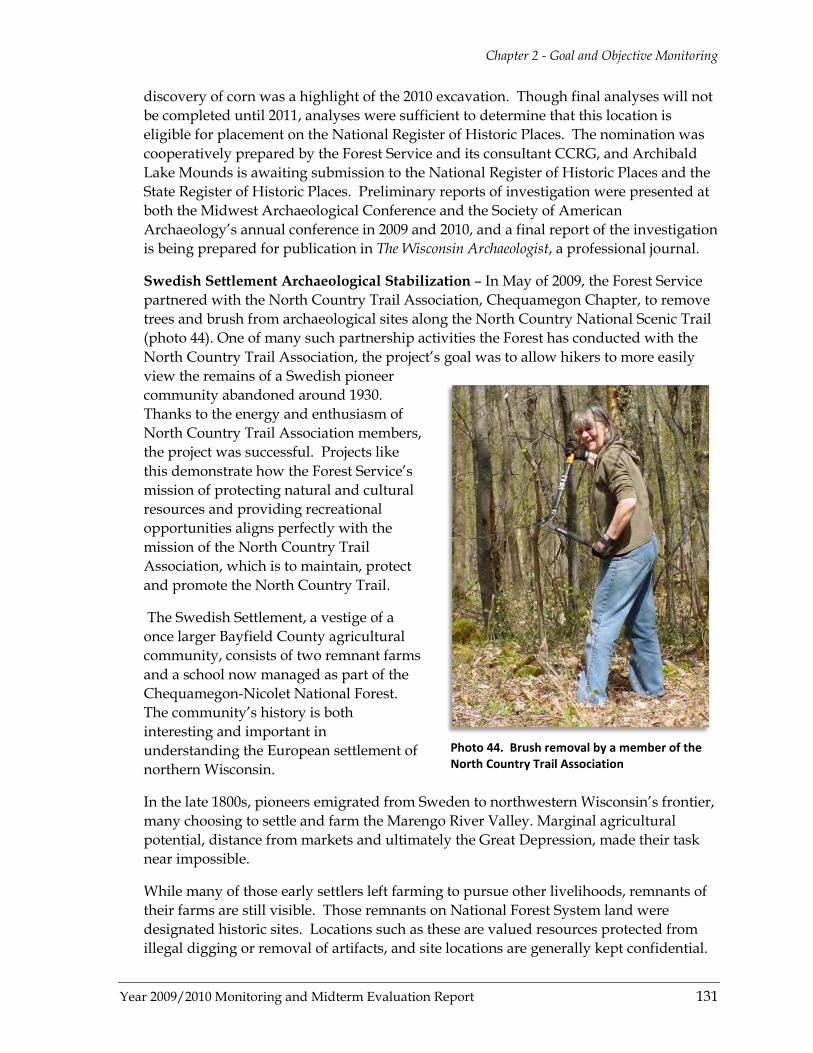
Chapter 2 - Goal and Objective Monitoring
Year 2009/2010 Monitoring and Midterm Evaluation Report 131
discovery of corn was a highlight of the 2010 excavation. Though final analyses will not be completed until 2011, analyses were sufficient to determine that this location is eligible for placement on the National Register of Historic Places. The nomination was cooperatively prepared by the Forest Service and its consultant CCRG, and Archibald Lake Mounds is awaiting submission to the National Register of Historic Places and the State Register of Historic Places. Preliminary reports of investigation were presented at both the Midwest Archaeological Conference and the Society of American Archaeology’s annual conference in 2009 and 2010, and a final report of the investigation is being prepared for publication in The Wisconsin Archaeologist, a professional journal.
Swedish Settlement Archaeological Stabilization – In May of 2009, the Forest Service partnered with the North Country Trail Association, Chequamegon Chapter, to remove trees and brush from archaeological sites along the North Country National Scenic Trail (photo 44). One of many such partnership activities the Forest has conducted with the North Country Trail Association, the project’s goal was to allow hikers to more easily view the remains of a Swedish pioneer community abandoned around 1930. Thanks to the energy and enthusiasm of North Country Trail Association members, the project was successful. Projects like this demonstrate how the Forest Service’s mission of protecting natural and cultural resources and providing recreational opportunities aligns perfectly with the mission of the North Country Trail Association, which is to maintain, protect and promote the North Country Trail.
The Swedish Settlement, a vestige of a once larger Bayfield County agricultural community, consists of two remnant farms and a school now managed as part of the Chequamegon-Nicolet National Forest. The community’s history is both interesting and important in understanding the European settlement of northern Wisconsin.
In the late 1800s, pioneers emigrated from Sweden to northwestern Wisconsin’s frontier, many choosing to settle and farm the Marengo River Valley. Marginal agricultural potential, distance from markets and ultimately the Great Depression, made their task near impossible.
While many of those early settlers left farming to pursue other livelihoods, remnants of their farms are still visible. Those remnants on National Forest System land were designated historic sites. Locations such as these are valued resources protected from illegal digging or removal of artifacts, and site locations are generally kept confidential.
Photo 44. Brush removal by a member of the North Country Trail Association
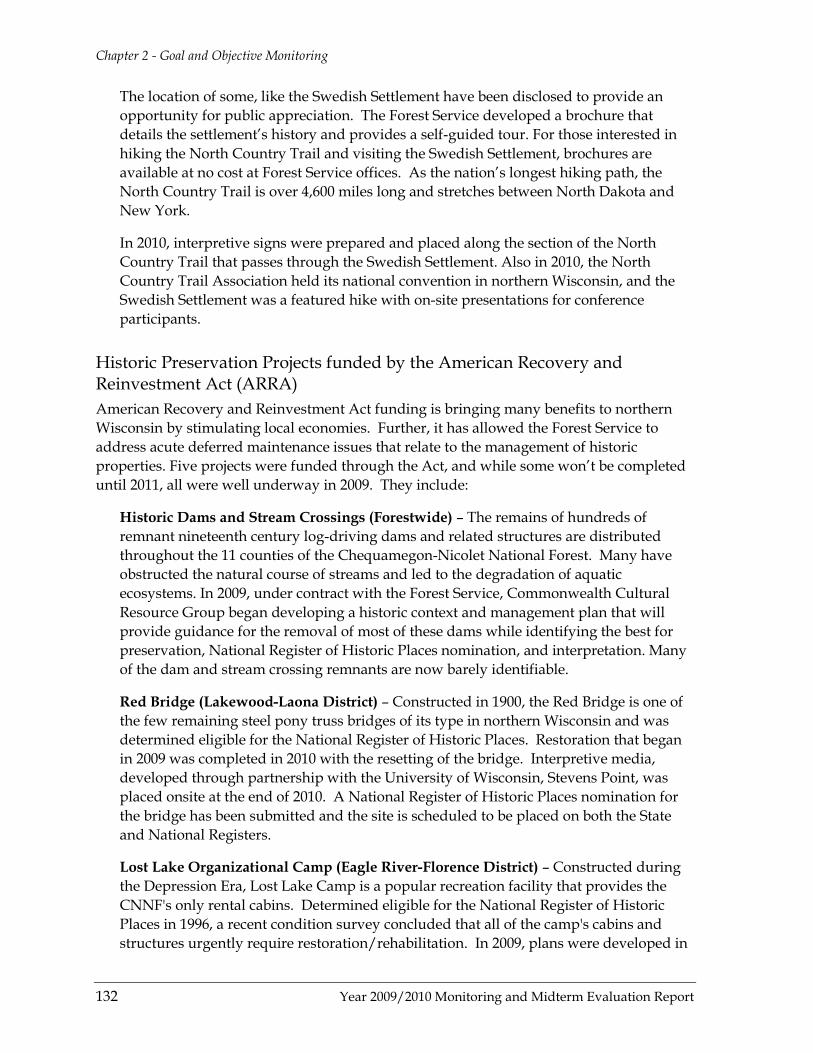
Chapter 2 - Goal and Objective Monitoring
132 Year 2009/2010 Monitoring and Midterm Evaluation Report
The location of some, like the Swedish Settlement have been disclosed to provide an opportunity for public appreciation. The Forest Service developed a brochure that details the settlement’s history and provides a self-guided tour. For those interested in hiking the North Country Trail and visiting the Swedish Settlement, brochures are available at no cost at Forest Service offices. As the nation’s longest hiking path, the North Country Trail is over 4,600 miles long and stretches between North Dakota and New York.
In 2010, interpretive signs were prepared and placed along the section of the North Country Trail that passes through the Swedish Settlement. Also in 2010, the North Country Trail Association held its national convention in northern Wisconsin, and the Swedish Settlement was a featured hike with on-site presentations for conference participants.
Historic Preservation Projects funded by the American Recovery and Reinvestment Act (ARRA) American Recovery and Reinvestment Act funding is bringing many benefits to northern Wisconsin by stimulating local economies. Further, it has allowed the Forest Service to address acute deferred maintenance issues that relate to the management of historic properties. Five projects were funded through the Act, and while some won’t be completed until 2011, all were well underway in 2009. They include:
Historic Dams and Stream Crossings (Forestwide) – The remains of hundreds of remnant nineteenth century log-driving dams and related structures are distributed throughout the 11 counties of the Chequamegon-Nicolet National Forest. Many have obstructed the natural course of streams and led to the degradation of aquatic ecosystems. In 2009, under contract with the Forest Service, Commonwealth Cultural Resource Group began developing a historic context and management plan that will provide guidance for the removal of most of these dams while identifying the best for preservation, National Register of Historic Places nomination, and interpretation. Many of the dam and stream crossing remnants are now barely identifiable.
Red Bridge (Lakewood-Laona District) – Constructed in 1900, the Red Bridge is one of the few remaining steel pony truss bridges of its type in northern Wisconsin and was determined eligible for the National Register of Historic Places. Restoration that began in 2009 was completed in 2010 with the resetting of the bridge. Interpretive media, developed through partnership with the University of Wisconsin, Stevens Point, was placed onsite at the end of 2010. A National Register of Historic Places nomination for the bridge has been submitted and the site is scheduled to be placed on both the State and National Registers.
Lost Lake Organizational Camp (Eagle River-Florence District) – Constructed during the Depression Era, Lost Lake Camp is a popular recreation facility that provides the CNNF's only rental cabins. Determined eligible for the National Register of Historic Places in 1996, a recent condition survey concluded that all of the camp's cabins and structures urgently require restoration/rehabilitation. In 2009, plans were developed in
Chapter 2 - Goal and Objective Monitoring
Year 2009/2010 Monitoring and Midterm Evaluation Report 133
coordination with the State Historic Preservation Office, and implementation began in 2010. Full restoration/rehabilitation will be completed in 2011, and the property will be placed on the State and National Registers after that time. Further, interpretive media detailing site history, Forest Service history, and the importance of American Recovery and Reinvestment Act funding is being developed and will be placed on site in 2011/2012.
Franklin Lake Campground (Eagle River-Florence District) – Franklin Lake Campground, one of the Chequamegon-Nicolet National Forest's most valued Depression-Era recreation facilities, was developed by the Forest Service in cooperation with the Civilian Conservation Corps and Work Projects Administration. Its history, unique setting, and dramatic log buildings led to its placement on the National Register of Historic Places. In 2009, restoration/rehabilitation planning began, in cooperation with the State Historic Preservation Office, and will be completed in 2011.
Trees for Tomorrow Natural Resources Education Center (Eagle River-Florence District) – Constructed during the Depression Era, this property initially served as a training center for Forest Service managers. Closed during World War II, it was later leased to the nonprofit organization "Trees for Tomorrow Natural Resources Education Center." Time and continued use have taken its toll and in 2009, American Recovery and Reinvestment Act funding allowed for the development of restoration plans. These plans have been implemented with construction to be completed in 2011.
Historic Preservation through Land Acquisition – while the Chequamegon-Nicolet National Forest has benefited from numerous acquisitions of endangered private lands in recent years, two notable acquisitions that relate to historic preservation occurred between 2004 and 2010.
♦ Indian Farms Sacred Site (Taylor County) – During the late 19th and early 20th centuries, Potawatomi and Ojibwe peoples occupied a village along the shores of the Yellow River. In 1904, a smallpox epidemic decimated the population and those who survived moved on. Before leaving, however, they buried their dead and to this day, their descendants regard Indian Farms as a sacred site. Only a portion of the site was on National Forest System lands, and the owners of the other portion wanted to sell the land for development. With the assistance of the Trust for Public Land and the support of the Forest County Potawatomi and Lac du Flambeau Band, the Forest Service acquired the property so it can forever be protected.
♦ Zarling Lake Archaeological Site (Forest County) – The oral traditions of the Menominee people point to northeastern Wisconsin as their ancestral home. In the 1980s, the Forest Service discovered an important archaeological village along Zarling Lake, and it was concluded that it appeared to be associated with the pre-European contact Menominee. A portion of this important archaeological site was held in private ownership, and in 2007, the owners attempted to sell their land for development. Through the assistance of the Trust for Public Land and with the support of the Menominee Nation, the Forest Service acquired the property in 2008 and will forever protect this important property.
Chapter 2 - Goal and Objective Monitoring
134 Year 2009/2010 Monitoring and Midterm Evaluation Report
Volunteerism – In 1989, the CNNF cofounded a volunteer recruitment initiative called “Passport in Time.” Since then, over a thousand volunteers have been recruited to participate in a variety of historic preservation projects, projects that include archaeology, historic building restoration, oral history and archaeological collections management. The 2009 and 2010 seasons marked the 21st and 22nd years of the Passport in Time program on the CNNF.
Partnerships – the Forest Service cannot, by itself, effectively achieve the goals of heritage stewardship. For this reason, the Chequamegon-Nicolet National Forest has effectively engaged a variety of partners and cooperators in the goal of studying the CNNF’s most significant cultural resources. The diversity of partners and cooperators has been broad and includes academic institutions, State agencies, tribal governments, and private cultural resource management firms.
Objective 2.4b: Consult with tribal governments, institutions, and other interested parties to ensure the protection and preservation of areas, objects, and records that are culturally important to them. In accordance with government-to-government consultation protocol, the Chequamegon-Nicolet National Forest leadership team actively consults with tribal governments regarding proposed Forest Service undertakings. In 2009 and 2010, in those instances where cultural resource stewardship was a project’s primary purpose, the CNNF notified and initiated consultation with the following governments: Forest County Potawatomi Community, Menominee Tribe, Lac du Flambeau Band, Bad River Band, Red Cliff Band, Lac Courte Oreilles Band, and Lac Vieux Desert Band.
Additionally, in 2009 and 2010, Forest staff invited tribal governments to participate in several Heritage Program activities:
♦ Six tribal governments were invited to attend the Chequamegon-Nicolet National Forest annual archaeological paraprofessional training, and representatives of the Lac Vieux Desert Band, Menominee Tribe, Forest County Potawatomi and the Keweenaw Bay Indian Community participated.
♦ The Menominee Tribal Historic Preservation Officer and College of Menominee Nation archaeologists participated in the 2009 and 2010 archaeological investigation of Archibald Lake Mounds and Village Site.
♦ Six tribal governments have requested to be apprised of all cultural resource management activities proposed for the CNNF; this request is consistently fulfilled.
Objective 2.4c: Conduct scientific studies to further our understanding of human adaptation and influences on the landscape and to provide important information for NEPA analysis. As noted above, through American Recovery and Reinvestment Act funding, and in cooperation with the Chequamegon-Nicolet National Forest watershed staff, Heritage Program staff initiated a strategy for comprehensive inventory of historic dams and

Chapter 2 - Goal and Objective Monitoring
Year 2009/2010 Monitoring and Midterm Evaluation Report 135
structures that were built within the CNNF’s riparian features. The goals of this work are to: (1) better understand the location and function of structures historically placed within riparian features, (2) to better understand how these features affected the contemporary Forest landscape, (3) to develop guidelines for removal of some of these features to enhance watershed restoration, while at the same time selecting others as historically important resources to preserve for future generations, and (4) to connect citizens to the land through development of an interpretive plan that will convey the importance of riparian restoration as well as the preservation of significant historic features.
In support of other areas of resource management, such as timber production, approximately 200,000 acres of cultural resource surveys took place between 2004 and 2010. These surveys, and those that occurred earlier, resulted in the discovery of approximately 2,500 cultural resources within the Chequamegon-Nicolet National Forest. Further, at the end of 2010, approximately 75 percent of the Chequamegon-Nicolet National Forest landbase were examined for the presence of cultural resources. However many of these properties remain to be evaluated for significance to the National Register of Historic Places and as such all are being protected.
Objective 2.4d: Increase awareness and appreciation of cultural heritage through educational programs, university-sponsored archeology field schools or other programs. In 2009 and 2010, raising the public’s awareness of the importance and fragility of cultural resources was accomplished through several activities:
♦ In 2009 and 2010, volunteers were recruited through the Passport in Time program to assist in five cultural resource stewardship projects. These projects included two archaeological investigations, two oral history studies, and one site stabilization project.
♦ In 2009, an interpretive media plan was developed for the historic pony truss structure known as Armstrong Creek or Red Bridge through partnership with University of Wisconsin, Stevens Point. In 2010, interpretive panels were fabricated and placed on-site through cooperation with Blackwell Job Corps Center.
♦ In 2009 and 2010, four press releases were distributed to media sources that focused on significant cultural resources and Chequamegon-Nicolet National Forest historic preservation activities.
♦ In 2009 and 2010, 10 presentations were given at professional conferences that describe recent Chequamegon-Nicolet National Forest archaeological research. Two were presented at the Midwestern Archaeological Conference, two at the Wisconsin Historical Society, two at Nicolet College, two at the annual meeting of the Society for American Archaeology, and two at the Wisconsin Archaeology Society.
Interpretation for the public benefit is a critical element of effective cultural resource management, and the Forest Service understands the importance of conveying to visitors the diversity of human history embodied in the Chequamegon-Nicolet National Forest’s historic sites. To achieve this goal, the Forest Service partnered with the University of

Chapter 2 - Goal and Objective Monitoring
136 Year 2009/2010 Monitoring and Midterm Evaluation Report
Wisconsin, Stevens Point and included two tribal entities (the Menominee and the Lac Vieux Desert Band of Ojibwe tribal historic preservation office). From 2004 to present, interpretive panels have been placed at a variety of cultural resources. They include the Fifield Fire Lookout Tower, the Boulder Lake Archaeological Site, the Medford Ranger District historic site, the Butternut-Franklin Lakes Archaeological District, and the Armstrong Creek/Red Bridge.
Goal 2.5 – Forest Commodities Objective 2.5: Ensure that harvest levels of special forest products are within sustainable levels Special forest products are products or natural resources that are not traditional timber and fiber products. Another name for special forest products is nonconvertible products, because they are products that are not converted into board foot or cubic foot measure. Examples include such products as floral greenery, Christmas trees and boughs, mushrooms, transplants (trees, shrubs or herbaceous plants), cones, medicinal plants, cuttings, herbs, nuts, berries, decorative wood, sheet moss and princess pine.
The growing interest in collecting special forest products stimulated the need to develop a National Forest policy for collection (2001). In 2009, the Chequamegon-Nicolet National Forest supplemented the national policy (FSH 2409.18_80-2009-1) to further identify areas where collection of special forest products is limited and to establish collection guidelines for specific products such as princess pine and sheet moss.
This supplemental policy states that harvesting of all plants and other products7
♦ Research Natural Areas
is prohibited in the following areas on the CNNF:
♦ candidate Research Natural Areas ♦ Wilderness Areas ♦ administrative sites ♦ developed recreation sites ♦ wetlands ♦ within 100 feet of trails with high scenic integrity ♦ within 100 feet of perennial water bodies
7 Gathering of small amounts of fruit, nuts, berries, and fungi (mushrooms) for personal use is allowed.
Photo 45. Princess pine

Chapter 2 - Goal and Objective Monitoring
Year 2009/2010 Monitoring and Midterm Evaluation Report 137
♦ northeast portion of the Argonne Experimental Forest
The Forest tracks collection of special forest products such as princess pine and sheet moss through collection permits that are required if products are to be sold for commercial use. Guidelines for princess pine and sheet moss collection permits include:
♦ Permittees must be able to identify princess pine and be aware that other Lycopodium species occur on the CNNF, some of which are rare. No sphagnum or reindeer moss may be collected.
♦ Princess pine must be harvested by cutting or pulling the vertical "off shoots" only. The "off shoot" refers to the vertical green part that may be removed all the way down to the runner. The runners (i.e., horizontal part of the plant) must be left in place. Pulling of the runners kills the entire plant.
♦ Permits for both princess pine and sheet moss are limited to 400 pounds (wet weight) per person per year. Any permit issued will require the permittee to locate within a 40-acre area on a map where harvesting is intended. Gathering areas indicated by permittee is given to the CNNF ecologist for monitoring purposes. The permittee is also given a monitoring form and is required to return the form to the Chequamegon-Nicolet National Forest before any subsequent permit will be issued to them.
♦ Permittees will not collect more than 10 percent of the collection area to ensure the sustainable harvest of this product.
The amount of commercial and personal-use permits and pounds of princess pine and sheet moss harvested each year has varied considerably (table 42 and figure 53 through figure 56).
Table 42. The amount (pounds) of princess pine and sheet moss permitted for harvest on the Chequamegon-Nicolet National Forest from 2004-2010.
Fiscal Year Princess Pine
(No. of lbs. removed)
Permits issued Sheet moss (No. of lbs. removed)
Permits issued
2004 620 5 5600 28 2005 220 3 4900 24 2006 434 4 6100 30 2007 425 3 5800 29 2008 810 5 4000 19 2009 840 6 4800 23 2010 690 7 3800 19
In 2009, 840 pounds of princess pine and 4,800 pounds of sheet moss were collected. In 2010, there was a decrease in the amount of princess pine and sheet moss collected, at 690 pounds and 3,800 pounds, respectively. The amount harvested and the locations of the harvest will continue to be monitored to ensure the forest can sustain the production of these products.

Chapter 2 - Goal and Objective Monitoring
138 Year 2009/2010 Monitoring and Midterm Evaluation Report
Figure 53. Number of permits for sheet moss issued on the CNNF between 2004 and 2010.
Figure 54. Pounds of sheet moss permitted for collection on the CNNF between 2004 and 2010.
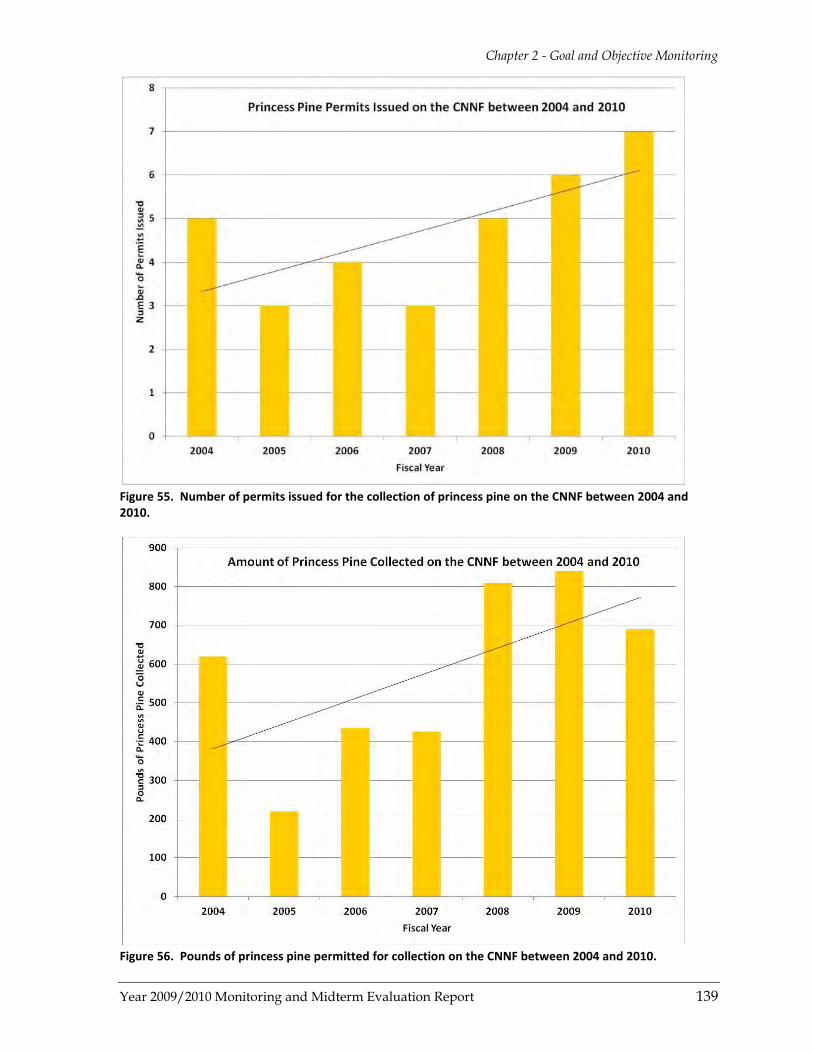
Chapter 2 - Goal and Objective Monitoring
Year 2009/2010 Monitoring and Midterm Evaluation Report 139
Figure 55. Number of permits issued for the collection of princess pine on the CNNF between 2004 and 2010.
Figure 56. Pounds of princess pine permitted for collection on the CNNF between 2004 and 2010.

Chapter 2 - Goal and Objective Monitoring
140 Year 2009/2010 Monitoring and Midterm Evaluation Report
Permit holders are required to fill out a survey card describing the location and quantity of harvest under the permit issued. Five sheet moss permits were issued to people in 2010 that had permits in 2009, and had not returned a harvest survey card.
The collection guidelines developed in the Chequamegon-Nicolet National Forest supplement to the national policy are intended to ensure the sustainable removal of these resources. Requiring permit holders to provide information about location and actual quantity of princess pine and sheet moss harvested allows for more direct monitoring of the regeneration rate and sustainability of the harvest. For example, monitoring shows that the number of harvest permits of both species is relatively low, and that the locations are widely dispersed. This reduces the risk to the viability of these two species. While plot level regeneration data has not been gathered, the results of this broad-scale monitoring effort indicate that harvest levels are sustainable.
Goal 2.6 – Minerals and Energy Resources Objective 2.6: Ensure that reclamation provision and environmental protections measures of operating plans and surface use plans of operations are completed to standard in field operations. On the Chequamegon-Nicolet National Forest, the mineral materials database is used for issuing and monitoring permits for external use and internal use of sand and gravel resources. To ensure compliance with the Wisconsin Department of Natural Resources storm water permit for gravel pit operations, operating plans and permit stipulations along with inspections are required. In 2009 and 2010, there were a total of 32 and 23 internal and external permits issued, respectively, for cooperative road maintenance activity, timber sales, and recreation facility maintenance.
Pit management plans are written for each gravel pit to ensure adequate utilization of the resource, safety, and to mitigate impacts on surface resources. In 2009 and 2010, four pit management plans were updated or completed to ensure efficient utilization of the resource and provide environmental protection.
Control of nonnative invasive species is a part of the management plan for these pits. All active gravel pits are monitored and treated for nonnative invasive species. In 2009, 50 acres were treated, and in 2010, 110 acres were treated. In addition, tree planting reclamation is used to reduce potential habitat for nonnative invasive species, which in turn reduces the need for nonnative invasive species treatment activities. Tree planting can also create a physical barrier to off highway vehicles, which discourages unauthorized access to gravel pits, and consequently can reduce the risk of spreading nonnative invasive species from infested pits. In 2009, two gravel pit sites, totaling 3 acres, were reclaimed and planted with jack pine.
There was no energy prospecting and no known potential prospecting in 2009 and 2010 on the Chequamegon-Nicolet National Forest. There was no hardrock mineral prospecting or development activity either. The status of the hardrock mineral program is the permanent abandonment of four existing prospecting drill holes, and final reclamation of those four
Chapter 2 - Goal and Objective Monitoring
Year 2009/2010 Monitoring and Midterm Evaluation Report 141
drill hole sites on a discovered copper/gold ore body known as the “Bend deposit” in Taylor County. In 2009 and 2010, there were no drill holes abandoned; however, once they are abandoned, the final reclamation will be certified by the Wisconsin Department of Natural Resources.
Goal 2.7- Wildlife and Fish Resources Objective 2.7a: Cooperate with the Wisconsin and Michigan Departments of Natural Resources on achieving desired wildlife and fish population goals through appropriate habitat management on the Chequamegon-Nicolet National Forests. The Chequamegon-Nicolet National Forest works collaboratively with the Wisconsin and Michigan Department of Natural Resources to manage native and desired nonnative species of fish and wildlife on lands and waters within the CNNF. At least 13 different Federal laws and orders direct the Forest Service to establish collaborative management efforts as it pertains to fish and wildlife residing on the National Forest. The Sikes Act of 1960 provides for carrying out wildlife and fish conservation on Federal lands, including the development of a cooperative State-Federal plan. The Chequamegon-Nicolet National Forest established a memorandum of understanding with the Wisconsin Department of Natural Resources (WDNR) in 1964 (as amended) per the Sikes Act of 1960 to guide the collaborative management of fish and wildlife on the CNNF.
Major components of the WDNR memorandum are:
♦ For the CNNF to practice forms of land and resource management that will benefit wildlife as fully as practicable, in coordination with the requirements of other forest uses.
♦ For the CNNF to work collaboratively with the WDNR on jointly planned and approved habitat improvement projects.
♦ For the CNNF and WDNR to cooperate in the restoration and management of fish and wildlife resources on the Chequamegon-Nicolet National Forest in proper relation with the land use plans of the CNNF.
From this memorandum of understanding, the staffs of the Chequamegon-Nicolet National Forest and the WDNR regularly collaborate on matters pertaining to fish and wildlife management on the CNNF. Although, there are no identified targets or goals for fish and wildlife populations on the CNNF by the WDNR, collaborative management has been highly beneficial to ensuring fish and wildlife are being managed on the Chequamegon-Nicolet National Forest to the benefit of users.
Current examples of this collaborative management include but are not limited to:
♦ Member of Wildlife Advisory Committee: The Forest is a standing member of pertinent WDNR wildlife species advisory committees to provide and receive input on the management of fish and wildlife within the CNNF.
Chapter 2 - Goal and Objective Monitoring
142 Year 2009/2010 Monitoring and Midterm Evaluation Report
♦ Fisheries Management: The Chequamegon-Nicolet National Forest has a collaborative fish management agreement (25+ years in operation) where two to three WDNR staff members are involved in an interagency personnel agreement to census fisheries resources on the Chequamegon-Nicolet National Forest with Forest fisheries staff. This has been a highly successful co-management opportunity to ensure fisheries resources on the CNNF are well managed.
♦ Elk Management: Since the arrival of elk on the Great Divide Ranger District, the CNNF has managed habitat for the species via the management of habitats preferred by elk. It regularly partners with the State on management of this species. CNNF staff are very involved in elk restoration planning efforts with DNR and Tribal Governments.
♦ Sharp-tailed Grouse Management: The Forest has been working cooperatively with the WDNR and partners to improve both habitat and populations for this species at both Riley Lake and Moquah Barrens.
♦ Spruce Grouse Monitoring: The Forest and WDNR are cooperating on a population and habitat use project to provide information for future habitat management for this species both on and off the Chequamegon-Nicolet National Forest.
♦ American Marten Supplemental Stocking: The Forest, WDNR and Great Lakes Indian Fish and Wildlife Commission are on the 3rd year of supplemental stocking of American marten from Minnesota to the Great Divide Ranger District to bolster this species’ population in Wisconsin.
♦ Stream Trout Management: The Forest is working with the WDNR to improve stream trout habitat on the class I, II and selected class III trout streams across the Chequamegon-Nicolet National Forest.
♦ Early Successional Habitat Improvement Project: The Forest is collaborating with the WDNR in developing an Early Successional Habitat Improvement Project to restore habitat for ruffed grouse, golden wing warblers, and American woodcock on 10 areas across the Chequamegon-Nicolet National Forest.
Beyond these specific examples of collaboration between the WDNR and the Chequamegon-Nicolet National Forest on fish and wildlife population management, population surveys to assist the WDNR in assessing populations of wildlife are also conducted. These surveys include breeding bird surveys for neotropical migrants, woodland raptor surveys, carnivore track surveys, ruffed grouse drumming surveys, turkey gobble surveys, frog and toad surveys, salamander surveys, and black bear bait stations.
Objective 2.7b: Strive to maintain a deer herd balance within its range and compatible with existing social, economic, and ecological conditions.{section sent by Paul Strong to John G of WDNR for a review} White-tailed deer (Odocoileus virginianus) have received significant attention in recent years over concerns of impacts to forests. As deer herds across the United States including Wisconsin have grown, impacts from this species have become more apparent in forested

Chapter 2 - Goal and Objective Monitoring
Year 2009/2010 Monitoring and Midterm Evaluation Report 143
landscapes. Research indicates that at high population levels, deer can influence regeneration of some tree species and impact native plant communities (Alverson et al. 1989, Côte et al. 2004, Rooney 2001). Deer herbivory was identified in the Forest Plan as a potential concern to various tree and native plant species. Consequently, the Forest Plan strives to create habitat conditions conducive to maintain deer in balance with its habitat.
White-tailed deer population management falls under the jurisdiction of the Wisconsin Department of Natural Resources. Although the CNNF participates as a member of the WDNR-Deer Management Advisory committee to provide input and concerns regarding deer management on the CNNF, final decisions on deer goals lie with the WDNR in consultation with Native American tribes. Deer management unit goals across the State (including the 12 deer management units on or partially on the CNNF; figure 57) are based on many factors including (but not limited to): harvest rates, age and sex ratios, recruitment rate estimates, reported agricultural damage, amounts and condition of deer range within the deer management units, winter severity impacts, public tolerance and desires. Because there are so many factors affecting deer population size, it is difficult to determine the degree to which forest management is acting to maintain a deer herd in balance with its range.
Figure 57. Wisconsin DNR deer management unit structure for northern Wisconsin.
Because management of regenerating aspen forests is directly related to controlling deer numbers and reducing potential herbivory on trees and native plants (Forest Plan FEIS), the Forest Plan identified regenerating aspen as a management indicator habitat. Thus, looking only at the question of habitat levels for white-tailed deer on the Chequamegon-Nicolet National Forest, a review of regenerating aspen forests conducted in 2006 (Quinn et al.) and again in 2010 (see Management Indicator Habitat for Regenerating Aspen) for this report, concluded that based on the trends of past, present and reasonably foreseeable future actions that could influence the regeneration of aspen, active management by the CNNF
Chapter 2 - Goal and Objective Monitoring
144 Year 2009/2010 Monitoring and Midterm Evaluation Report
was not increasing the amount of regenerating aspen. Thus, across the Chequamegon-Nicolet National Forest, habitat considered by McCaffery (2000) to be highly favorable to white-tailed deer (0- to 20-year-old regenerating aspen) was being lost at a faster rate through maturation or through management to convert aspen stands to stands of other forest types than was being created through management actions. Most of the losses were the result of stand maturation rather than active conversion.
Further, Quinn et al. (2006) found that the CNNF’s aspen management actions have resulted in a substantial movement away from Forest Plan goals of balanced aspen ages across the CNNF. Recent analysis continues to show that the 0- to 19-year age class trend for regenerating aspen on the Chequamegon-Nicolet National Forest remains well below the Forest Plan goals (figure 25). When averaged, the rate of foreseeable future aspen regeneration was anticipated to be about 1,500 acres per year (Quinn et al. 2006). To attain and sustain desired conditions of the Forest Plan, an aspen regeneration rate over 5,000 acres per year would be required.
Additionally, Quinn et al. (2006) concluded that aspen and overall timber harvest on the Chequamegon-Nicolet National Forest does not support a positive correlation between high deer populations and habitat or deer populations and logging levels. Other factors such as winter severity, baiting and feeding, population goals, and social carrying capacity issues (aggressive vs. conservative harvest frameworks) are more likely the major drivers in deer herd sizes on the CNNF as well as across the Northern Forest Region in Wisconsin. Therefore, creating habitat through vegetation management is not causing an overabundance of white-tailed deer on the CNNF. Deer browsing continues to impact trees and native plants even as preferred habitat for the species declines.
To address the portion of this objective that refers to the social and economic aspects of deer herd balance, it is important to define “social carrying capacity” as it pertains to white-tailed deer management. Because deer population management goals are the responsibility of the Wisconsin Department of Natural Resources, it is important to evaluate social and economic compatibility under the WDNR’s approach. WDNR Wildlife Managers Handbook (Chapter 4) defines this as follows:
Sociological Carrying Capacity (SCC) is the maximum number of deer that can coexist compatibly with local human populations (Strickland et al. 1994). This population level has also been called Cultural Carrying Capacity (Ellingwood and Caturano 1988) or Wildlife Acceptance Capacity (Decker and Purdy 1988). The concept of SCC can be extended to consider economic and public health effects of deer.
Deer hunting on the Chequamegon-Nicolet National Forest is one of the most popular recreational uses of the CNNF. Recreation use surveys conducted approximately every 5 years forestwide, documents hunting as one of the top three highest uses on the Chequamegon-Nicolet National Forest.
Looking at the 12 WDNR deer management units (units 3, 6, 13, 29A, 30, 39, 40, 44, 45, 49A, and 50) in the Northern Forest Management Region that are either solely or partially within the Chequamegon-Nicolet National Forest, on average, deer management unit over-winter

Chapter 2 - Goal and Objective Monitoring
Year 2009/2010 Monitoring and Midterm Evaluation Report 145
goals averaged approximately 16 deer per square mile of deer range when implementation of the 2004 Forest Plan began (Forest Plan FEIS, p. 3-106). This goal represents the WDNR’s “Sociological Carrying Capacity” for these deer management units, when both ecological conditions and social tolerances are considered. Since 2004, deer population levels within these units have varied (from more than 20 percent above post-hunt goals to a range of 5 to 57 percent below post-hunt goal) due to a host of factors including but not limited to: special hunts (T-Zones, Earn-A-Buck), archery and firearm seasons frameworks and success rates, winter weather conditions, and predation.
However, in 2005 many deer management units on the CNNF were at or above post-hunt goals. Deer experienced a hard winter in 2007-08 followed by a long, delayed spring in 2008. These two factors resulted in direct mortality and significantly reduced recruitment going into the 2008 season. Population estimates, however, were artificially high due to a high buck harvest rate in 2007. The delayed spring occurred after the quota setting timeframe and unfortunately quotas could not be adjusted accordingly. Buck harvest rates dropped across Northern Wisconsin in 2008. The poor hunting conditions during the 2009 gun deer season compounded the problem by reducing the number of deer seen by hunters. Conservative quotas were recommended and zero antlerless quotas were chosen due to public input in many of the units comprising the CNNF. In 2010, 6 of the 12 deer management units on or partially on the CNNF had no allowable antlerless harvest and the remaining 5+ units had highly restricted antlerless harvest quotas in an attempt to increase deer numbers in these deer management units. Thus, management framework plays a significant role in post-hunt deer populations.
In 2009, all deer management units on or partially on the Chequamegon-Nicolet National Forest were below post-hunt population goals set by WDNR (average 16 deer per square mile for deer management units on the CNNF in 2004). The percent below post-hunt goals ranged from 5 percent below goal in deer management unit 26 to 57 percent below goal in deer management unit 39 (Rolley 2009). Rolley (2009) attributes these deer management unit post-hunt population changes to implementation of varying harvest frameworks (conservative vs. aggressive) and winter conditions (extreme to mild winter severity conditions) that cause the herd to either grow or retreat. Hence, deer numbers in 2009 were below the sociological carrying capacity desired by the WDNR in deer management units across the Chequamegon-Nicolet National Forest. In 2010, overwinter goals were increased in Deer Management Units 3, 6, 13, and 30 as a result of the Deer Management Unit review process. Higher goals in these units resulted in more conservative harvest strategies to increase the population to this new overwinter goal in these units.
In 2009, all deer management units on or partially on the Chequamegon-Nicolet National Forest were below post-hunt population goals set by WDNR (average 16 deer per square mile for deer management units on the CNNF in 2004). The percent below post-hunt goals ranged from 5 percent below goal in deer management unit 26 to 57 percent below goal in deer management unit 39 (Rolley 2009). Rolley (2009) attributes these deer management unit post-hunt population changes to implementation of varying harvest frameworks (conservative vs. aggressive) and winter conditions (extreme to mild winter severity conditions) that cause the herd to either grow or retreat. Hence, deer numbers in 2009 were
Chapter 2 - Goal and Objective Monitoring
146 Year 2009/2010 Monitoring and Midterm Evaluation Report
below the sociological carrying capacity desired by the WDNR in deer management units across the Chequamegon-Nicolet National Forest. In 2010, overwinter goals were increased in Deer Management Units 3, 6, 13, and 30 as a result of the Deer Management Unit review process. Higher goals in these units resulted in more conservative harvest strategies to increase the population to this new overwinter goal in these units.
In summary, aggressive herd control strategies were successfully implemented across Northern Wisconsin since 2000 due to high deer populations that were significantly above overwinter goals. These strategies were successful because they brought deer populations closer to overwinter goals. During this same time period, winter and spring conditions controlled the deer herd and herd re-building was necessary to bring populations back to overwinter goals; primarily in eastern Northern Wisconsin. However, deer hunter acceptance of these "new" population levels is low.
As to the CNNF’s management activities and sociological carrying capacity, research suggests that hunter harvest rates and lack of winter severity (Rolley 2009) coupled with supplemental feeding (McCaffery 2000b) has more influence on deer populations than National Forest management activities. Reduced acreage of younger succession forests in Northern Wisconsin is a major influence on deer populations. Regenerating aspen forests are considered by McCaffery (2000a) as the second highest forest deer habitat behind aspen-oak-jack pine on sandy soils (generally post fire conditions on sandy soils). McCaffery (2000a) notes that both aspen and forest openings continue to be lost as habitat such as hardwoods and conifer forest types increase in the Northern Forest Deer Management Region, which includes the Chequamegon-Nicolet National Forest.
Looking at overall forest management activities on the CNNF, aspen-dominated cover types (includes both mixed aspen and aspen) are being lost to maturation faster than its being regenerated. Forest analysis indicates that aspen age class distributions continue to remain skewed in the older year classes that are less favorable to white-tailed deer than young regeneration aspen (0-10 and 11-19 years old; figure 25). The Forest’s focus on hardwoods management from 2004 to 2009 may have provided some limited deer benefits by providing winter browse, but it is not considered good deer management as it holds forest stands in longer rotations that are not considered preferred habitat (Blouch 1984). Hence, the amount of management actions across the entire CNNF that benefit white-tailed deer continues to decline as either aspen is lost to the natural maturation process or actively converted to other forest types. While some management areas currently have more forest openings than desired in the Forest Plan, overall forest openings are declining, especially in management areas where northern hardwood interior forests are the emphasis per Forest Plan direction.
Goal 2.8 – Fire Management Objective 2.8a: The safety of employees and the public is the highest priority during any fire or fuels management incident. Ten percent of wildfires were reviewed in compliance with the Thirty Mile Accident Prevention Plan and additional after action reviews were conducted on six of the largest fires, to identify further safety concerns, as well as measures that were effective.

Chapter 2 - Goal and Objective Monitoring
Year 2009/2010 Monitoring and Midterm Evaluation Report 147
Although large catastrophic fires rarely occur in this region of the country, fires on the Chequamegon-Nicolet National Forest are relatively common, and require an immediate and organized response to minimize their severity. While combating wildfires and prescribed fire, safety of Forest employees and the public is the highest priority.
Two distinct sessions in 2010 focused on raising awareness and improving communications to create a safer environment for firefighters on the Chequamegon-Nicolet National Forest. The first was a risk management session attended by the forest supervisor, deputy forest supervisor, and forest fire management officer. The second was a facilitated and coached session attended by all members of the CNNF fire organization, as well as district rangers, to improve communications and trust.
In March 2010, a Prescribed Fire Workshop coupled with lessons learned and proactive safety leadership was held for burn bosses, line officers, and firefighters to review safety procedures and burn plan preparation. Burn plans are developed following Forest, Regional, and National direction. Prior to and after implementation of the action, each prescribed burn is fully reviewed and complete briefings are conducted to assess any possible means for improvement.
Prescribed burning: There were no escaped prescribed burns on the CNNF during 2009. One escaped prescribed burn occurred on the CNNF during 2010, burning 7 acres unintentionally. A review team external to the forest was commissioned to investigate the escape and recommend corrective measures. No private lands were threatened.
Wildfire: Under the Thirty Mile Accident Prevention Plan, the Forest Service requires each unit to review their response to wildfire each year. These reviews are to be conducted by the line officer, Forest fire staff officer and/or the CNNF safety officer. Additional after action reviews were conducted on six of the largest fires, where safety concerns were identified as well as measures that were effective. In 2010, four of the Chequamegon-Nicolet National Forest wildfire responses were reviewed for adequate safety measures. No safety inadequacies were identified. After-action reviews were conducted on all fires.
Objective 2.8b: Expedite safe extinguishments of wildfires by the use of ground and/or air resources. There were 62 wildfires on the Chequamegon-Nicolet National Forest during 2009 (table 43). The largest fire reached 100 acres and the average wildfire size was 4 acres. Sixteen fires were greater than 1 acre. Two fire-related ATV accidents occurred, one on a wildfire involving a cooperator outside of Forest Service command, and one on a prescribed burn involving a Forest Service employee. Numerous safety concerns related to communications systems were reported in the interagency information sharing system, Safenet.
In 2010, the CNNF responded to 56 wildfires (table 43). The largest fire reached 18 acres with the average fire size of 1.4 acres. Thirteen fires were greater than 1 acre. No accidents, injuries, or safety violations occurred. In response to communications system safety concerns reported over the past several years, a number of repairs and improvements to
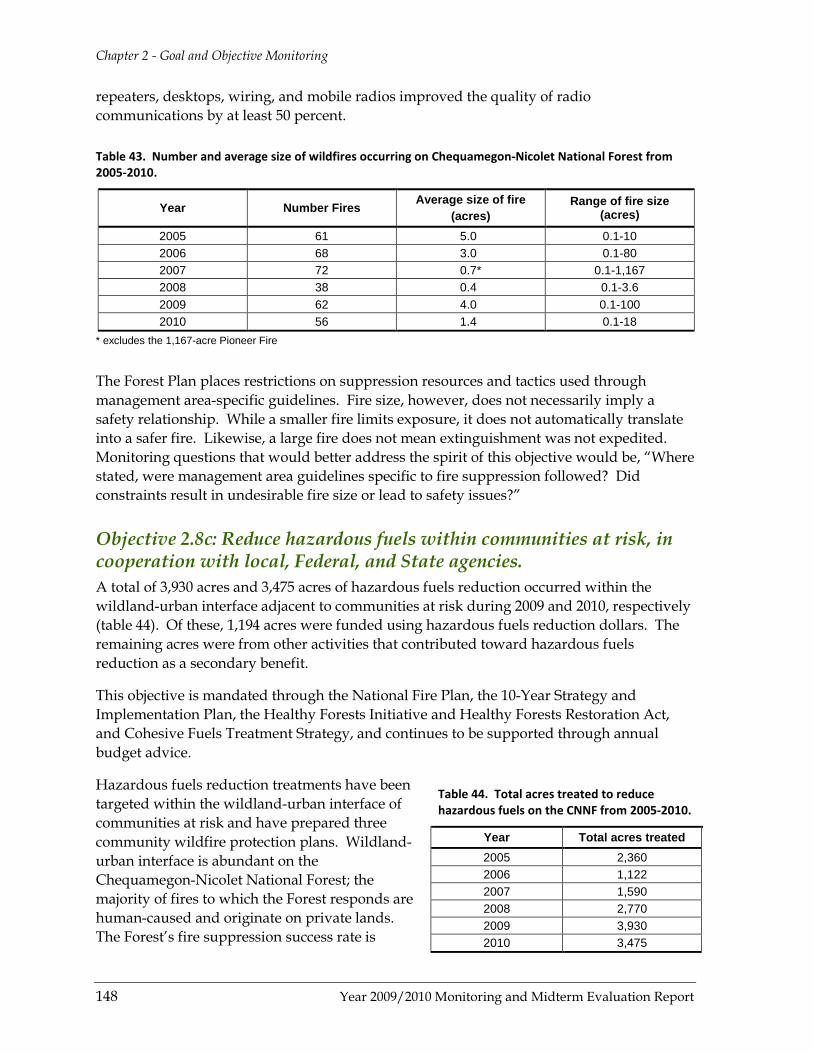
Chapter 2 - Goal and Objective Monitoring
148 Year 2009/2010 Monitoring and Midterm Evaluation Report
repeaters, desktops, wiring, and mobile radios improved the quality of radio communications by at least 50 percent.
Table 43. Number and average size of wildfires occurring on Chequamegon-Nicolet National Forest from 2005-2010.
Year Number Fires Average size of fire (acres)
Range of fire size (acres)
2005 61 5.0 0.1-10 2006 68 3.0 0.1-80 2007 72 0.7* 0.1-1,167 2008 38 0.4 0.1-3.6 2009 62 4.0 0.1-100 2010 56 1.4 0.1-18
* excludes the 1,167-acre Pioneer Fire
The Forest Plan places restrictions on suppression resources and tactics used through management area-specific guidelines. Fire size, however, does not necessarily imply a safety relationship. While a smaller fire limits exposure, it does not automatically translate into a safer fire. Likewise, a large fire does not mean extinguishment was not expedited. Monitoring questions that would better address the spirit of this objective would be, “Where stated, were management area guidelines specific to fire suppression followed? Did constraints result in undesirable fire size or lead to safety issues?”
Objective 2.8c: Reduce hazardous fuels within communities at risk, in cooperation with local, Federal, and State agencies. A total of 3,930 acres and 3,475 acres of hazardous fuels reduction occurred within the wildland-urban interface adjacent to communities at risk during 2009 and 2010, respectively (table 44). Of these, 1,194 acres were funded using hazardous fuels reduction dollars. The remaining acres were from other activities that contributed toward hazardous fuels reduction as a secondary benefit.
This objective is mandated through the National Fire Plan, the 10-Year Strategy and Implementation Plan, the Healthy Forests Initiative and Healthy Forests Restoration Act, and Cohesive Fuels Treatment Strategy, and continues to be supported through annual budget advice.
Hazardous fuels reduction treatments have been targeted within the wildland-urban interface of communities at risk and have prepared three community wildfire protection plans. Wildland-urban interface is abundant on the Chequamegon-Nicolet National Forest; the majority of fires to which the Forest responds are human-caused and originate on private lands. The Forest’s fire suppression success rate is
Table 44. Total acres treated to reduce hazardous fuels on the CNNF from 2005-2010.
Year Total acres treated 2005 2,360 2006 1,122 2007 1,590 2008 2,770 2009 3,930 2010 3,475
Chapter 2 - Goal and Objective Monitoring
Year 2009/2010 Monitoring and Midterm Evaluation Report 149
extremely high.
Objective 2.8d: Apply fire management as part of natural ecological disturbance regime. In 2009, 938 acres of prescribed burns were accomplished. Of these, 117 acres were burned for ecological restoration objectives. Another 270 acres were burned to enhance wildlife habitat. Site preparation for reforestation accounted for 16 acres and a handful of small burns totaling 10 acres helped maintain administrative sites. Over one half of the prescribed burning (525 acres), was for hazardous fuels reduction objectives.
In 2010, 1,221 acres of prescribed burns were accomplished. Of these, 716 acres were burned for ecological restoration of pine barrens. Another 27 acres were burned to enhance wildlife habitat, primarily small openings. Site preparation for reforestation accounted for 106 acres. In addition, two small burns totaling 2 acres helped maintain administrative sites. The remaining 370 acres, mostly consisting of pile burning, were burned for hazardous fuels reduction objectives.
Fire has been successfully employed in Moquah Barrens (Northwest Sands Project) where fire is part of the natural disturbance regime. Fire is used as a management tool at the Medford Buffalo Farm and Riley Lake Wildlife Management Area; however, in these areas it does not have a strong role as a part of the natural disturbance regime. The Forest has opportunities to restore the natural disturbance regime and employ fire in Lac Vieux Desert/Phelps area. Planning efforts are underway for restoration treatments in the Lakewood Southeast project area. The application of fire has yet to be implemented and may unfold less than initially envisioned in the Flower Lake project area.
Goal 2.9 – Treaty Rights The Forest Service shares in the United States’ trust responsibility and treaty obligations to work with federally recognized tribes on a government-to-government basis, to protect the tribes’ ceded territories on lands administered by the Forest Service. As such, the policies of the Forest Service toward federally recognized tribes are intended to strengthen relationships, and further tribal sovereignty by fulfilling mandated responsibilities. The Chequamegon-Nicolet National Forest outlines its policies and responsibilities on tribal relations in a 1999 memorandum of understanding, (that is, the memorandum regarding tribal – USDA Forest Service relations on National Forest Lands within the territories ceded in treaties of 1836, 1837, and 1842) including tribal consultation on proposed forest projects and policies.
Every October, Forest Service leadership meets with the memorandum’s tribal signatories to discuss implementing the memorandum, to facilitate ongoing communication, and to discuss arising issues. Through provisions laid out in the memorandum, projects and processes have been put into place without notable instances of complications. Some activities include notification of birch bark gathering opportunities, waivers of camping fees and length of stay requirements for tribal members exercising treaty rights, and allowing an off-reservation National Forest gathering code. The memorandum has been in place for
Chapter 2 - Goal and Objective Monitoring
150 Year 2009/2010 Monitoring and Midterm Evaluation Report
over 10 years, and continues to function effectively. More information on the annual meeting of the Forest Service and the tribes on the memorandum implementation can be found at http://www.glifwc.org/About/VITF.html.
Goal 3.1- Capital Infrastructure Objective 3.1a: Reduce average open and total road density on the Chequamegon-Nicolet National Forests. Wheeled motorized transportation infrastructure around and within the Chequamegon-Nicolet National Forest can be characterized as a rural road system. No freeways, interstates, or expressways cross the CNNF. Paved state roads and paved and graveled town and country roads typify the roadway network. Many roads on National Forest land have multiple or concurrent jurisdictions where the Forest Service shares management authorities and responsibilities.
In 2004, cross-country travel on the Forest was banned and ATV access was restricted to designated roads and trails. In 2005, the Forest Service, revised their travel management regulations on National Forest System lands clarifying policies related to motor vehicle use, including the use of off-highway vehicles. The final rule, known as the Travel Management Rule, requires the Forest Service to work in conjunction with State, local, and tribal governments, and the public to designate roads, trails, and areas that are open to motor vehicle use. Designations are made by class of vehicle and, if appropriate, by time of year. The Travel Management Rule prohibits the use of motor vehicles off the designated system as well as use of motor vehicles on routes and in areas that are not consistent with the designations (36 CFR 212).
In 2006, the Forest began the process of designating roads and trails for wheeled motorized vehicles in accordance with the Travel Management Rule. In 2009, the first Motor Vehicle Use Map was published. The map, which is annually updated and free to the public, is the legal document used to identify roads and trails open for use. In March of 2010, the second Motor Vehicle Use Map became available.
Appendix BB of the Forest Plan serves as a guide for reducing open and total road densities on the Chequamegon-Nicolet National Forest. This table was designed to focus efforts on decreasing overall road densities, a concern brought up during plan revision. The table in Appendix BB identifies the upper limits established in the Forest Plan for open and total road densities. A designated open road defined in the Travel Management Rule is “A National Forest System road on National Forest System lands that is designated for motor vehicle use pursuant to §212.51 on a Motor Vehicle Use Map.” The Forest Plan defines open road density as the linear measure of all roads open to public traffic per unit area, commonly expressed in units of miles of open road per square mile of land. Total road density, defined in the Forest Plan, is the linear measure of all roads (whether open or closed to vehicular traffic) per unit area, commonly expressed in units of miles of road per square mile of land. Open and total road density calculations include all roads, regardless of their jurisdiction (State, county, township).

Chapter 2 - Goal and Objective Monitoring
Year 2009/2010 Monitoring and Midterm Evaluation Report 151
Table 45. Desired open and total road densities, and fiscal year 2010 road densities by recreation opportunity spectrum. Figures include state, county and town roads.
Open road density (mi/mi2)
Total road density (mi/mi2)
Management Area (MA); Recreation Opportunity Spectrum class Upper limits 2010
actual Upper limits 2010 actual
0.0
0.0
0.0
1.0 MA 5; Wilderness
0.0 1.2 MA 5B; semi-primitive nonmotorized
0.1 2.2 MA 6A; semi-primitive nonmotorized
0.0
0.1
Up to 3.0
3.0 MA 6B; semi-primitive nonmotorized
0.2 2.5 various MAs; nonmotorized recreation emphasis areas
Up to 2.0 1.6 Up to 3.0 3.5
MA 8C MA 8D Areas included as MA 6A or 6B in other alternatives during Forest Plan revision Semi-primitive motorized areas Roaded natural remote areas Select large blocks dominated by northern hardwood (Penokee Range, Diamond Roof, and area surrounding Headwaters Wilderness)
Up to 4.0 1.9 Up to 4.0 3.8 roaded natural rural
The Travel Management Rule and Motor Vehicle Use Map are now the basis for managing wheeled motorized use on the Forest. Consequently 2009 Motor Vehicle Use Map data have become the baseline for road density analysis. Information used to determine open and total road densities in this report came primarily from Geographic Information System (GIS) data used in the production of the 2009 and 2010 CNNF Motor Vehicle Use Map. Additional data were used from the CNNF corporate roads and management area layers, recreation opportunity spectrum class, and the Automated Lands Program. Perimeter roads bordering Wilderness Areas, semi-primitive nonmotorized areas, and nonmotorized areas, (management areas 5, 5B, 6A, 6B) were not included in the calculations. Only interior roads within those areas were used to determine road densities. Boundary roads were used in calculating open and total road densities in all other management areas.
Photo 46. Typical forest system road in the Chequamegon-Nicolet National Forest

Chapter 2 - Goal and Objective Monitoring
152 Year 2009/2010 Monitoring and Midterm Evaluation Report
The 2005, Travel Management Rule, and subsequent 2009, CNNF Motor Vehicle Use Map accelerated the high level of achievement of Forest Plan road density objectives as shown in table 45. The precise methodology and data afforded by the Travel Management Rule and Motor Vehicle Use Map process will permit accurate future monitoring of this Forest Plan objective and will enable management to track action toward the outstanding desired outcomes.
Goal 3.2 – Land Ownership Objective 3.2: Convey, purchase or exchange lands where needed. High priority areas for acquisition include those lands that: Protect TES or RFSS; Consolidate federal ownership within Wilderness; Increase public ownership on lakes and rivers; Provide unique ecological, scientific, heritage, or recreational qualities; and, Consolidate land ownership for efficient resource management purposes. There were no conveyances or exchanges in fiscal year 2009. There were six land purchases in fiscal year 2009 totaling 1,145 acres, and four land purchases in fiscal year 2010 totaling 633 acres. All of these purchases:
♦ helped protect threatened, endangered, or Regional Forester sensitive species, ♦ increased public ownership on lakes or rivers, ♦ had unique ecological or recreation qualities, and ♦ helped make forest management more efficient by consolidating ownership and
reducing landline construction and maintenance.
There were no exchanges completed in fiscal year 2010. There was one conveyance totaling 173 acres to the town of Wabeno, WI. This conveyance was done in accordance with Public Law 109-387 mandating the Chequamegon-Nicolet National Forest to sell the parcel to the town of Wabeno.
Since 2004, a total of 8,200 acres have been acquired either through a conveyance or land exchange in an effort to consolidate land ownership, provide protection for rare species, and increase access to lakes and rivers. Of the 8,200 acres, approximately 5,000 acres have yet to be assigned to a management area.

Chapter 2 - Goal and Objective Monitoring
Year 2009/2010 Monitoring and Midterm Evaluation Report 153
Goal 3.3 – Public and Organization Relations Objective 3.3a: Consult with Tribes and intertribal agencies during decision-making processes. Consider effects of natural resource management decisions on the ability of tribes to exercise gathering rights. Site-specific project analyses address how project proposals might protect or impact the ability of tribes to exercise gathering rights. The Chequamegon-Nicolet National Forest deciding officials lead consultation efforts on all project-level decisions. The deciding officials along with interdisciplinary team members make themselves available to tribal elected officials, tribal natural resource staff, and Tribal Historic Preservation Officers to discuss project proposals, solicit tribal concerns, and encourage further input on projects. This occurs at various times and with varied degrees of interest and input from the tribes. A comprehensive tribal contact list is maintained and updated regularly and includes federally recognized tribes in Wisconsin, Michigan, Minnesota, the Voigt Intertribal Task Force, and the Great Lakes Indian Fish and Wildlife Commission.
Objective 3.3b: Through partnerships, encourage, establish and sustain a diverse and well-balanced range of recreational services and facilities on the Chequamegon-Nicolet National Forest. Partnerships with state and local governments, recreation user groups, volunteers, and permittees are helping to sustain a diverse set of recreational services and facilities on the Chequamegon-Nicolet National Forest. Many miles of forest ATV trails are being maintained with help through a grant program managed by the Wisconsin Department of Natural Resources. The CNNF has partnered with many local ATV clubs as well as the Wisconsin ATV Association to identify and accomplish future and existing trail needs including new trail construction, maintenance, and signing. Snowmobile trail grooming, maintenance, and signing are also being accomplished in partnership with many snowmobile clubs across the forest.
Recreation permittees on the forest are providing services such as camping and outfitting. Hiking trail clubs are helping to provide trail maintenance on many miles of trail throughout the forest and mountain biking organizations are helping to maintain, construct, and sign many miles of mountain biking trails on the Great Divide and Lakewood-Laona Ranger Districts.
Objective 3.3c: Cooperatively work with federal, state, and county agencies and other non-governmental organizations to control NNIS. Cooperation is a critical element in the Chequamegon-Nicolet’s Nonnative Invasive Species Strategy. The Forest is a partner in four cooperative weed management areas, covering 9 of the 11 counties that have National Forest land within their boundaries (figure 58). Working with other agencies and groups through these cooperative weed management areas has
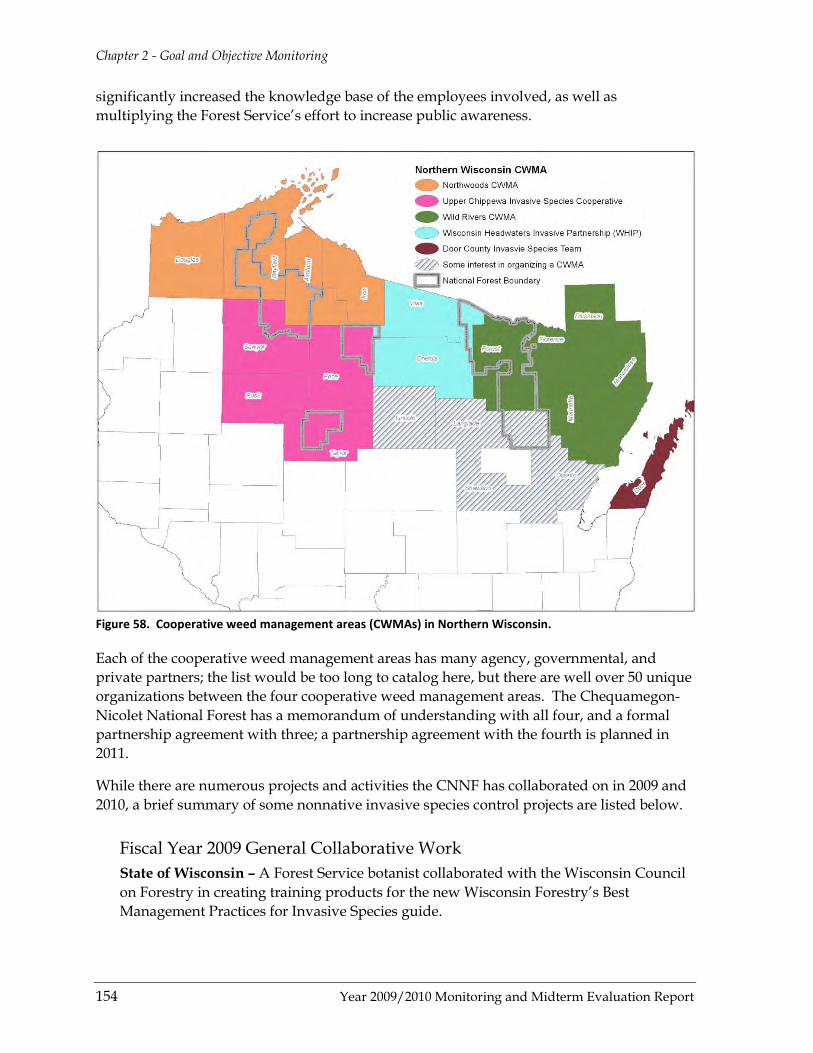
Chapter 2 - Goal and Objective Monitoring
154 Year 2009/2010 Monitoring and Midterm Evaluation Report
significantly increased the knowledge base of the employees involved, as well as multiplying the Forest Service’s effort to increase public awareness.
Figure 58. Cooperative weed management areas (CWMAs) in Northern Wisconsin.
Each of the cooperative weed management areas has many agency, governmental, and private partners; the list would be too long to catalog here, but there are well over 50 unique organizations between the four cooperative weed management areas. The Chequamegon-Nicolet National Forest has a memorandum of understanding with all four, and a formal partnership agreement with three; a partnership agreement with the fourth is planned in 2011.
While there are numerous projects and activities the CNNF has collaborated on in 2009 and 2010, a brief summary of some nonnative invasive species control projects are listed below.
Fiscal Year 2009 General Collaborative Work State of Wisconsin – A Forest Service botanist collaborated with the Wisconsin Council on Forestry in creating training products for the new Wisconsin Forestry’s Best Management Practices for Invasive Species guide.

Chapter 2 - Goal and Objective Monitoring
Year 2009/2010 Monitoring and Midterm Evaluation Report 155
Great Lakes Indian Fish and Wildlife Commission – Forest Service botanists worked with partners to gather purple loosestrife beetles for use across northern Wisconsin.
Fiscal Year 2009 Collaborative Work with Cooperative Weed Management Areas (CWMAs) in Northern Wisconsin Wisconsin Headwater Invasive Partnership – This CWMA, which was established in 2008 and includes Vilas and Oneida Counties in Wisconsin, signed a memorandum of understanding with 13 partners, distributed a letter to 2,000 residents about garlic mustard in their neighborhood, and conducted Japanese knotweed control projects and garlic mustard eradication project.
Northwoods CWMA – This CWMA was established in 2005 and includes Douglas, Iron, Ashland, and Bayfield Counties in Wisconsin. They signed a participating agreement with the Forest Service, hired a part-time coordinator with funding provided from the Great Lakes Restoration Initiative, and was awarded a grant from National Fish and Wildlife Foundation. They organized volunteers to control weeds at six large sites, attended a weekly local farmer’s market to talk with gardeners and citizens, participated in the Madeline Island Wilderness Boy Scout project, and conducted leafy spurge control in the Town of Washburn for the fifth consecutive year.
Upper Chippewa Invasive Species Cooperative – This CWMA was established in 2007 and includes Price, Rusk, Sawyer and Taylor Counties in Wisconsin. They signed a memorandum of understanding with the Forest Service, and used Pulling Together Initiative grant money to purchase tools, herbicide, and education materials. They continued work on demonstration projects and control work on five project areas within Price and Taylor Counties. They released purple loosestrife beetle in Taylor and Price Counties. Education efforts included placing traveling displays at four libraries and two county fairs, participating in the Earth Day celebration in Medford, WI, , and making over 20 other presentations to schools, recreation groups, and public seminars.
Wild Rivers Invasive Species Cooperative – This CWMA was established in 2008 and is the only multi-state CWMA. The Wild Rivers Invasive Species Cooperative includes Forest, Florence, and Marinette Counties in Wisconsin, and Dickinson and Menominee Counties in Michigan. Activities conducted in fiscal year 2009 include a spotted knapweed removal project, a public awareness meeting, and staffing a county fair booth with volunteers.
Photo 47. Forest Service botanist attending the Northwoods CWMA information booth at Farmer's Market in Ashland, WI

Chapter 2 - Goal and Objective Monitoring
156 Year 2009/2010 Monitoring and Midterm Evaluation Report
Fiscal Year 2010 General Collaborative Work CWMA Symposium – The Chequamegon-Nicolet National Forest worked with Northwoods CWMA to organize a meeting and training for CWMAs and other professionals to share knowledge on weed identification and control methods, funding sources, and how to recruit volunteers.
Wisconsin DNR – Four Forest employees helped a WDNR biologist collect knapweed biocontrol insects for distribution around the state and in return, the CNNF received six releases of insects for National Forest lands.
Fiscal Year 2010 Collaborative Work with CWMAs in Northern Wisconsin Wisconsin Headwater Invasive Partnership (WHIP) – WHIP finalized a color brochure to highlight the Cooperative’s mission, signed a memorandum of understanding and master agreement with the Forest Service, held a honeysuckle and buckthorn informational workshop and removal demonstration, created a large banner for display, created a priority species flyer, and promoted invasive species awareness through articles in local papers.
Northwoods CWMA – NCWMA organized four Right-of-Way manager workshops, worked with over 100 volunteers to control invasive plants, began a quarterly newsletter for partners, and conducted a garlic mustard pull at the Copper Falls State Park.
Upper Chippewa Invasive Species Cooperative (UCISC) – UCISC submitted grant applications to the National Fish and Wildlife Foundation, conducted over 25 presentations to the public, continued to place traveling displays used at county fairs and schools, conducted Japanese knotweed control in Taylor County, and installed permanent color signs at two demonstration sites.
Wild Rivers Invasive Species Cooperative (WRISC) – WRISC hired a part-time coordinator with Resource Conservation and Development funding, gave a public informational meeting to over 40 people, developed a color brochure with new logo, established a website, and signed a memorandum of understanding and master agreement with the Forest Service. They also conducted nonnative invasive species workshops in Dickinson and Menominee Counties in MI and Marinette County in WI, had booths at farmers markets, several county fairs, and boating events, accomplished nonnative invasive species mapping at Fumee Lake natural area in Dickinson County, MI, and designed and distributed placemats and magnets.
Photo 48. 2010 CWMA Symposium in Park Falls, WI

Chapter 2 - Goal and Objective Monitoring
Year 2009/2010 Monitoring and Midterm Evaluation Report 157
Objective 3.3d: Cooperatively work with Federal, State, and county agencies and nongovernmental organizations to integrate fire prevention programs and suppression resources. Cooperatively work across agencies to develop and implement hazardous fuels reduction projects that will reduce the risk of wildfire. The Chequamegon-Nicolet National Forest is heavily involved with other state and federal partners; this includes all aspects of fire management such as prevention, suppression, training, and fuels management. The fire program has written partnership agreements with the following agencies: National Park Service, Bureau of Indian Affairs, Menominee Tribal Enterprises, Fish and Wildlife Service, Bureau of Land Management, National Weather Service, and the WDNR. These agencies routinely assist with prescribed burns and readily provide suppression resources when needed. The Chequamegon-Nicolet National Forest, WDNR and local fire departments commonly share equipment and personnel and support each other on wildfires throughout the year
Objective 3.3e: Work collaboratively with other agencies and the public to protect and restore watersheds. Conduct assessments of all 5th-level watersheds with more than 25 percent federal ownership. In fiscal years 2009 and 2010, the Chequamegon-Nicolet National Forest undertook a number of collaborative actions to protect and restore watersheds. The Forest has cooperated with the Bad River Watershed Association in their development of a Marengo River Watershed Action Plan, to develop a road-stream crossing inventory and monitoring program, and to replace problem crossings on Trout Brook. The Forest helped host road-stream crossing workshops in Rhinelander in the spring of 2009 and Green Bay in the spring and fall of 2010. The workshops teach students how to recognize problems and construct safe, environmentally sound crossings that restore watershed conditions. The workshops are taught by an interagency team.
The Forest continues to cooperate with the WDNR to implement, monitor and refine forestry best management practices for water quality. The past two years, the CNNF has participated in efforts to conduct validation monitoring of best management practices and the first revision of best management practices since they were first established in 1995.
In 2009, the CNNF cooperated with the WDNR and a private landowner to restore fish passage and stream channel morphology on a private crossing on Rock Creek. In 2010, the CNNF cooperated with the Wisconsin Department of Transportation (WDOT) to replace three stream crossings on Highway 64 that were impeding aquatic organism passage and affecting channel conditions. All three crossings were unnamed coldwater tributaries to the North Branch Oconto River. The Forest also cooperated with the Forest County Potawatomi and WDOT on the design of a new culvert for Torpee Creek at Highway 32. Torpee Creek is an important coldwater stream containing native brook trout. The new culvert will restore passage for aquatic organisms and provide the opportunity for other species of wildlife to pass under the highway.

Chapter 2 - Goal and Objective Monitoring
158 Year 2009/2010 Monitoring and Midterm Evaluation Report
Previous Forest Service policy was to assess all 5th-level watersheds over time that contained more than 25 percent National Forest System land. More recently, the Forest Service has developed a watershed condition framework that includes a six-step process for classifying and restoring 6th-level watersheds. The six steps include:
1. classification of watershed condition,
2. prioritization of watersheds for restoration,
3. development of watershed action plans for priority watersheds,
4. implementation of integrated projects,
5. tracking of restoration accomplishments, and
6. verifying and monitoring watershed condition class.
In 2011, the CNNF will perform an initial classification of watershed condition for all 6th-level watersheds. Up to five of these watersheds will be identified for priority watershed work. Watershed action plans will be developed for each of these priority watersheds based on detailed field assessments of watershed condition. The action plans will identify essential projects that are necessary to restore watershed health and improve watershed condition class.
Objective 3.3f: Collaborate with the U.S. Fish and Wildlife Service in the collection and dissemination of information indicating the possible presence of Canada lynx and Kirtland’s Warbler. The Chequamegon-Nicolet National Forest continues to consult with the U.S. Fish and Wildlife Service concerning the Canada lynx and Kirtland's warbler. No lynx sightings or potential signs for this species were detected in 2009 or 2010 on the CNNF. Additional information regarding management and collaboration with the U.S. Fish and Wildlife Service on Canada lynx and Kirtland’s warbler can be found under the discussion of Objective 1.1a (beginning on page 68).
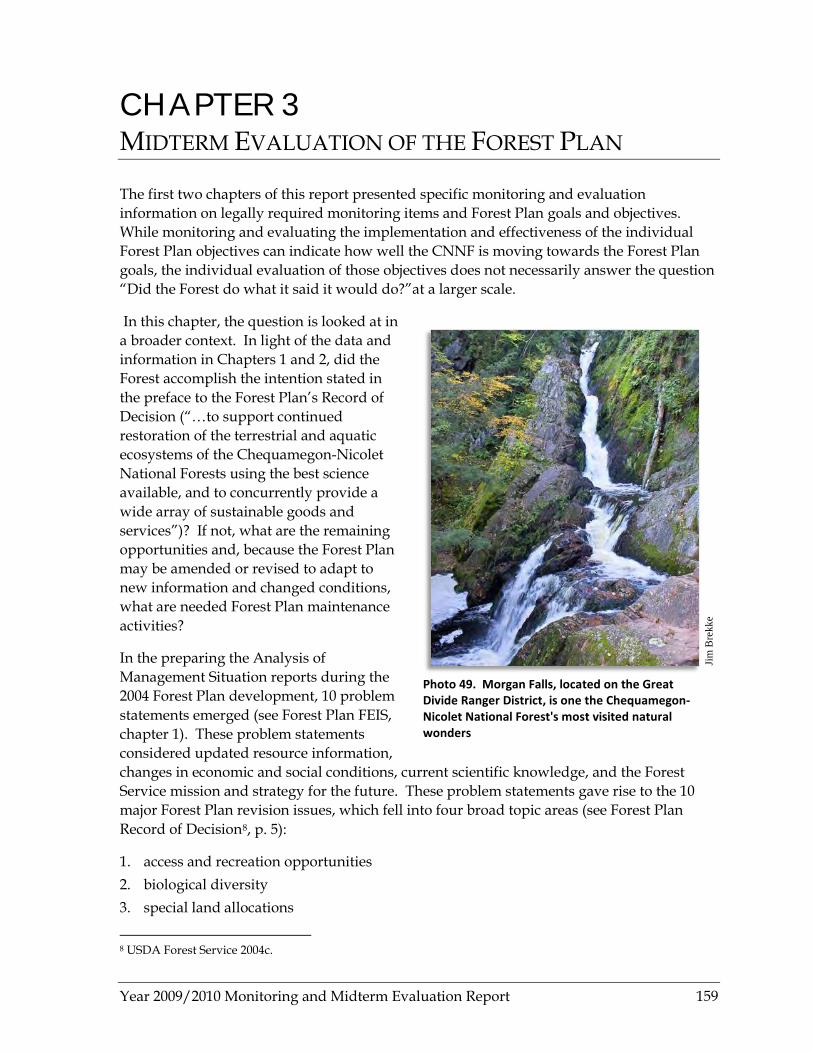
Year 2009/2010 Monitoring and Midterm Evaluation Report 159
CHAPTER 3 MIDTERM EVALUATION OF THE FOREST PLAN
The first two chapters of this report presented specific monitoring and evaluation information on legally required monitoring items and Forest Plan goals and objectives. While monitoring and evaluating the implementation and effectiveness of the individual Forest Plan objectives can indicate how well the CNNF is moving towards the Forest Plan goals, the individual evaluation of those objectives does not necessarily answer the question “Did the Forest do what it said it would do?”at a larger scale.
In this chapter, the question is looked at in a broader context. In light of the data and information in Chapters 1 and 2, did the Forest accomplish the intention stated in the preface to the Forest Plan’s Record of Decision (“…to support continued restoration of the terrestrial and aquatic ecosystems of the Chequamegon-Nicolet National Forests using the best science available, and to concurrently provide a wide array of sustainable goods and services”)? If not, what are the remaining opportunities and, because the Forest Plan may be amended or revised to adapt to new information and changed conditions, what are needed Forest Plan maintenance activities?
In the preparing the Analysis of Management Situation reports during the 2004 Forest Plan development, 10 problem statements emerged (see Forest Plan FEIS, chapter 1). These problem statements considered updated resource information, changes in economic and social conditions, current scientific knowledge, and the Forest Service mission and strategy for the future. These problem statements gave rise to the 10 major Forest Plan revision issues, which fell into four broad topic areas (see Forest Plan Record of Decision8
1. access and recreation opportunities
, p. 5):
2. biological diversity 3. special land allocations
8 USDA Forest Service 2004c.
Jim
Bre
kke
Photo 49. Morgan Falls, located on the Great Divide Ranger District, is one the Chequamegon-Nicolet National Forest's most visited natural wonders
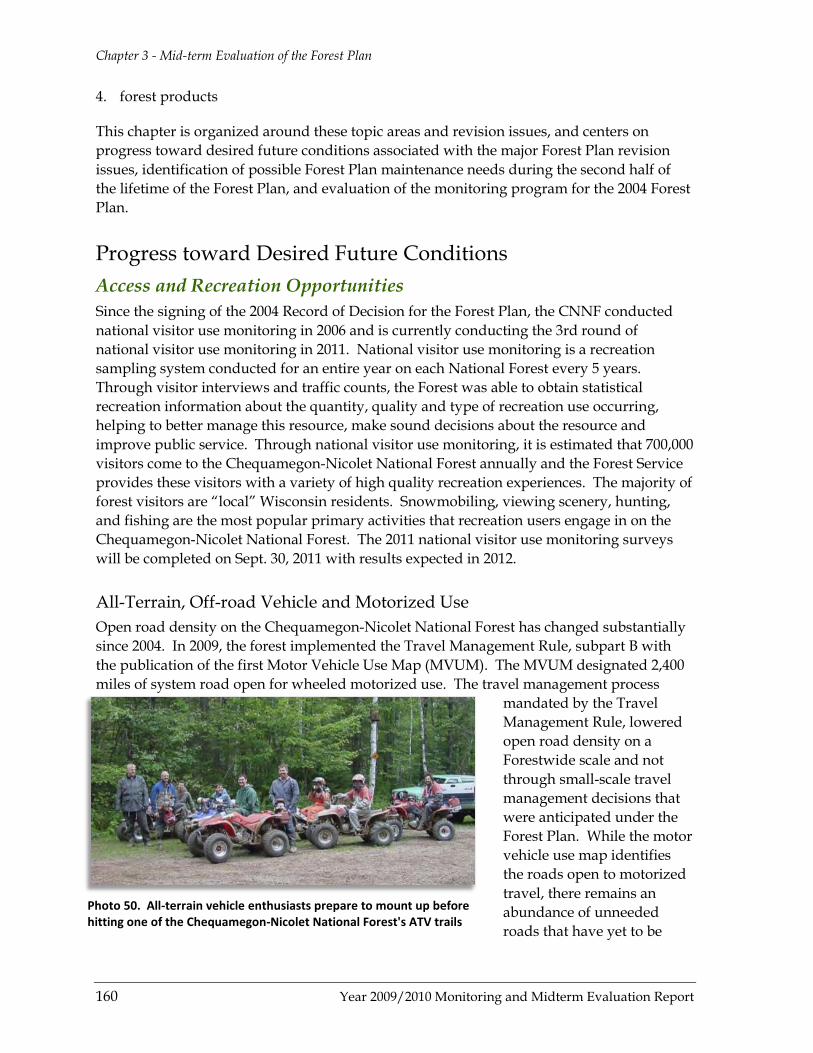
Chapter 3 - Mid-term Evaluation of the Forest Plan
160 Year 2009/2010 Monitoring and Midterm Evaluation Report
4. forest products
This chapter is organized around these topic areas and revision issues, and centers on progress toward desired future conditions associated with the major Forest Plan revision issues, identification of possible Forest Plan maintenance needs during the second half of the lifetime of the Forest Plan, and evaluation of the monitoring program for the 2004 Forest Plan.
Progress toward Desired Future Conditions Access and Recreation Opportunities Since the signing of the 2004 Record of Decision for the Forest Plan, the CNNF conducted national visitor use monitoring in 2006 and is currently conducting the 3rd round of national visitor use monitoring in 2011. National visitor use monitoring is a recreation sampling system conducted for an entire year on each National Forest every 5 years. Through visitor interviews and traffic counts, the Forest was able to obtain statistical recreation information about the quantity, quality and type of recreation use occurring, helping to better manage this resource, make sound decisions about the resource and improve public service. Through national visitor use monitoring, it is estimated that 700,000 visitors come to the Chequamegon-Nicolet National Forest annually and the Forest Service provides these visitors with a variety of high quality recreation experiences. The majority of forest visitors are “local” Wisconsin residents. Snowmobiling, viewing scenery, hunting, and fishing are the most popular primary activities that recreation users engage in on the Chequamegon-Nicolet National Forest. The 2011 national visitor use monitoring surveys will be completed on Sept. 30, 2011 with results expected in 2012.
All-Terrain, Off-road Vehicle and Motorized Use Open road density on the Chequamegon-Nicolet National Forest has changed substantially since 2004. In 2009, the forest implemented the Travel Management Rule, subpart B with the publication of the first Motor Vehicle Use Map (MVUM). The MVUM designated 2,400 miles of system road open for wheeled motorized use. The travel management process
mandated by the Travel Management Rule, lowered open road density on a Forestwide scale and not through small-scale travel management decisions that were anticipated under the Forest Plan. While the motor vehicle use map identifies the roads open to motorized travel, there remains an abundance of unneeded roads that have yet to be
Photo 50. All-terrain vehicle enthusiasts prepare to mount up before hitting one of the Chequamegon-Nicolet National Forest's ATV trails
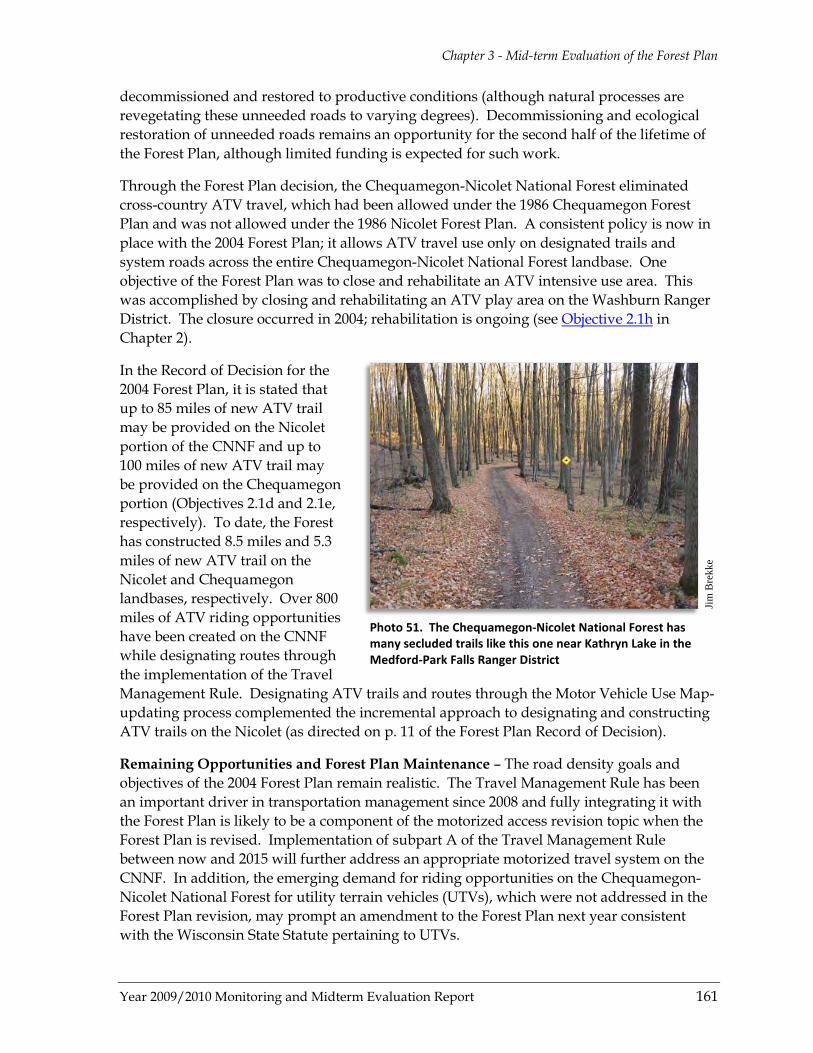
Chapter 3 - Mid-term Evaluation of the Forest Plan
Year 2009/2010 Monitoring and Midterm Evaluation Report 161
decommissioned and restored to productive conditions (although natural processes are revegetating these unneeded roads to varying degrees). Decommissioning and ecological restoration of unneeded roads remains an opportunity for the second half of the lifetime of the Forest Plan, although limited funding is expected for such work.
Through the Forest Plan decision, the Chequamegon-Nicolet National Forest eliminated cross-country ATV travel, which had been allowed under the 1986 Chequamegon Forest Plan and was not allowed under the 1986 Nicolet Forest Plan. A consistent policy is now in place with the 2004 Forest Plan; it allows ATV travel use only on designated trails and system roads across the entire Chequamegon-Nicolet National Forest landbase. One objective of the Forest Plan was to close and rehabilitate an ATV intensive use area. This was accomplished by closing and rehabilitating an ATV play area on the Washburn Ranger District. The closure occurred in 2004; rehabilitation is ongoing (see Objective 2.1h in Chapter 2).
In the Record of Decision for the 2004 Forest Plan, it is stated that up to 85 miles of new ATV trail may be provided on the Nicolet portion of the CNNF and up to 100 miles of new ATV trail may be provided on the Chequamegon portion (Objectives 2.1d and 2.1e, respectively). To date, the Forest has constructed 8.5 miles and 5.3 miles of new ATV trail on the Nicolet and Chequamegon landbases, respectively. Over 800 miles of ATV riding opportunities have been created on the CNNF while designating routes through the implementation of the Travel Management Rule. Designating ATV trails and routes through the Motor Vehicle Use Map-updating process complemented the incremental approach to designating and constructing ATV trails on the Nicolet (as directed on p. 11 of the Forest Plan Record of Decision).
Remaining Opportunities and Forest Plan Maintenance – The road density goals and objectives of the 2004 Forest Plan remain realistic. The Travel Management Rule has been an important driver in transportation management since 2008 and fully integrating it with the Forest Plan is likely to be a component of the motorized access revision topic when the Forest Plan is revised. Implementation of subpart A of the Travel Management Rule between now and 2015 will further address an appropriate motorized travel system on the CNNF. In addition, the emerging demand for riding opportunities on the Chequamegon-Nicolet National Forest for utility terrain vehicles (UTVs), which were not addressed in the Forest Plan revision, may prompt an amendment to the Forest Plan next year consistent with the Wisconsin State Statute pertaining to UTVs.
Jim
Bre
kke
Photo 51. The Chequamegon-Nicolet National Forest has many secluded trails like this one near Kathryn Lake in the Medford-Park Falls Ranger District

Chapter 3 - Mid-term Evaluation of the Forest Plan
162 Year 2009/2010 Monitoring and Midterm Evaluation Report
Wilderness and Semi-primitive Non-motorized Areas The Forest Plan offers a variety of nonmotorized recreation areas. These different designations allow the public to know what conditions to expect when entering a specific area, and provide a wide range of options to people seeking a nonmotorized experience. These options range from very low levels of human effects (Wilderness) to settings with visible human changes (semi-primitive nonmotorized areas). Semi-primitive nonmotorized areas are specifically intended to provide the forest visitor with a remote, secluded experience, free from the sounds and presence of motorized vehicles. The Chequamegon-Nicolet’s Wilderness and semi-primitive nonmotorized areas are among the few places in Wisconsin where people can go to enjoy quality primitive or semi-primitive nonmotorized recreation experiences.
Since the signing of the Forest Plan in 2004, very few management activities have taken place in semi-primitive nonmotorized areas, which has likely increased their feeling of quiet and remoteness. In all of the Wilderness Areas, the Forest has been working towards meeting the desired condition defined in the Forest Service’s Wilderness Stewardship Challenge standards. The Wilderness Stewardship Challenge identifies 10 key elements that help define successful Wilderness
stewardship. These 10 elements combine many essential qualities of Wilderness character and define how the Forest manages fire, invasive species, and outfitters and guides within Wilderness, and how recreation sites are monitored.
In 2009 and 2010, the CNNF increased some Wilderness Areas’ scores toward meeting the minimum stewardship level under the Wilderness Stewardship Challenge. In fiscal year 2011, the CNNF received a grant to fund a Wilderness campsite inventory, which will further increase the score for all Wildernesses. With continued focus on the Stewardship Challenge, it is expected that the CNNF will continue to increase Wilderness scores and move closer to having all Wilderness areas managed to minimum standard level.
Remaining Opportunities and Plan Maintenance – The desired condition within semi-primitive nonmotorized areas has yet to be achieved because motorized travel is still occurring on some roads and trails within them. Many snowmobile and ATV trails cross nonmotorized areas; there may be opportunities to reroute these outside the nonmotorized area as suggested by the Forest Plan (pp. 3-32 and 3-34), consistent with Objective 2.1a.
Jim
Bre
kke
Photo 52. The Rock Lake cross-country ski trail by Rock Lake, in the Washburn Ranger District, stands ready for use
Chapter 3 - Mid-term Evaluation of the Forest Plan
Year 2009/2010 Monitoring and Midterm Evaluation Report 163
Approximately 26 percent of the CNNF landbase is allocated into management areas such as semi-primitive nonmotorized and Wilderness that prohibit the development of new borrow pits. However, the CNNF is obligated by laws and regulations to provide mineral material resources (e.g. gravel) for use and to townships, counties, and the State for maintenance of roads and highways within the CNNF boundary. Current demand for mineral materials is being met with existing developed gravel pits and a few new gravel pit developments that have been brought online within the last 5 years. However, the majority of existing developed gravel pits are becoming depleted and will likely need to be replaced with new sources in the coming decade. Such development may require adjustments to the Forest Plan.
More generally, an access issue that may emerge in the second half of the lifetime of the plan is hardrock mineral exploration. Hardrock mineral exploration has been occurring on the Chequamegon-Nicolet National Forest over the last 30 years. The hardrock mineral estate (Federal mineral ownership) is managed by the Bureau of Land Management (BLM) while the Forest Service has responsibility for the surface resources and works cooperatively with BLM to mitigate surface impacts from exploration activity. Because the Chequamegon-Nicolet National Forest was created through the purchase of private and local/State government-owned lands, not all of the mineral estate was transferred when those purchases were made. Currently about 35 percent of the CNNF’s mineral estate is reserved or outstanding mineral rights (minerals owned by non-Federal 2nd or 3rd parties).
Private mineral owners have a property right to explore and develop mineral resources on National Forest System lands with a surface use permit issued by the Forest Service. The Forest Service cannot prevent a private mineral owner from exercising their mineral property rights. It is the policy of the BLM and Forest Service to encourage the discovery and development of valuable hardrock minerals. As a result, about 97 percent of the Chequamegon-Nicolet National Forest is open to hardrock prospecting of the federal mineral estate. Because of the discovery of significant hardrock mineral deposits in northern Wisconsin and the Upper Peninsula of Michigan in similar geological settings as the Chequamegon-Nicolet National Forest over the last 30 years, continued interest in hardrock exploration on the National Forest is expected. The extent to which such exploration will impact the CNNF’s surface management remains to be seen.
Biological Diversity Aquatic, Riparian and Wetland Ecosystems The aquatic desired condition in the 2004 Forest Plan provides direction for the protection and restoration of watersheds, riparian areas, and aquatic resources across the Chequamegon-Nicolet National Forest. The lack of specific desired conditions for aquatic resources, and standards and guidelines for managing them, was identified as a problem with the 1986 Forest Plans during Forest Plan revision.
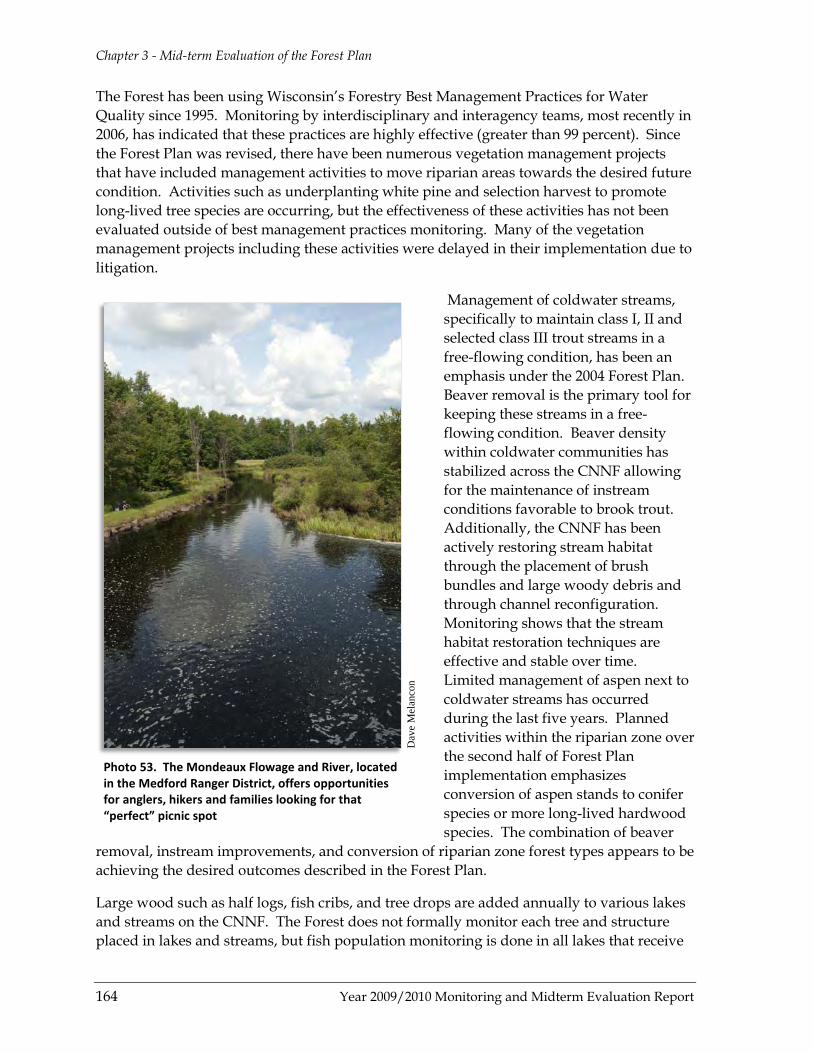
Chapter 3 - Mid-term Evaluation of the Forest Plan
164 Year 2009/2010 Monitoring and Midterm Evaluation Report
The Forest has been using Wisconsin’s Forestry Best Management Practices for Water Quality since 1995. Monitoring by interdisciplinary and interagency teams, most recently in 2006, has indicated that these practices are highly effective (greater than 99 percent). Since the Forest Plan was revised, there have been numerous vegetation management projects that have included management activities to move riparian areas towards the desired future condition. Activities such as underplanting white pine and selection harvest to promote long-lived tree species are occurring, but the effectiveness of these activities has not been evaluated outside of best management practices monitoring. Many of the vegetation management projects including these activities were delayed in their implementation due to litigation.
Management of coldwater streams, specifically to maintain class I, II and selected class III trout streams in a free-flowing condition, has been an emphasis under the 2004 Forest Plan. Beaver removal is the primary tool for keeping these streams in a free-flowing condition. Beaver density within coldwater communities has stabilized across the CNNF allowing for the maintenance of instream conditions favorable to brook trout. Additionally, the CNNF has been actively restoring stream habitat through the placement of brush bundles and large woody debris and through channel reconfiguration. Monitoring shows that the stream habitat restoration techniques are effective and stable over time. Limited management of aspen next to coldwater streams has occurred during the last five years. Planned activities within the riparian zone over the second half of Forest Plan implementation emphasizes conversion of aspen stands to conifer species or more long-lived hardwood species. The combination of beaver
removal, instream improvements, and conversion of riparian zone forest types appears to be achieving the desired outcomes described in the Forest Plan.
Large wood such as half logs, fish cribs, and tree drops are added annually to various lakes and streams on the CNNF. The Forest does not formally monitor each tree and structure placed in lakes and streams, but fish population monitoring is done in all lakes that receive
Dav
e M
elan
con
Photo 53. The Mondeaux Flowage and River, located in the Medford Ranger District, offers opportunities for anglers, hikers and families looking for that “perfect” picnic spot
Chapter 3 - Mid-term Evaluation of the Forest Plan
Year 2009/2010 Monitoring and Midterm Evaluation Report 165
wood treatments. During these surveys, general observations indicate that they are effective at providing structural habitat for fish but it is worth noting that very few waterbodies have enough wood to meet the recommendations set forth in the Forest Plan.
The Forest has had an active road/stream crossing improvement program. Since 1998, 190 crossings have been replaced and 14 road and 9 trail segments, respectively, have been reconstructed. Stream crossings were reconstructed to reduce erosion, improve fish passage, restore channel morphology, and reduce maintenance needs. Monitoring of reconstructed crossings indicates that the culverts are functioning and that aquatic organism passage has been restored.
Remaining Opportunities and Plan Maintenance – The American Recovery and Reinvestment Act (ARRA) and Secure Rural Schools Act (SRSA) provided, and continue to provide, funding for projects that improved watersheds through improved road-stream crossings. As a result, accomplishments in the restoration of aquatic and riparian ecosystems have been more numerous than expected in 2004. Continued progress toward desired future conditions is expected during the second half of the lifetime of the Forest Plan. No amendments are expected. An administrative correction and update with new State of Wisconsin information data to clarify riparian management zone guidance adjacent to trout streams is in preparation.
In addition to surface water management, inventory, and monitoring, the ground water resources need to be better understood and inventoried. Currently the ground water resources of the Chequamegon-Nicolet National Forest are not mapped or well described in terms of function, quantity, or quality. The Forest is important habitat to many ground water-dependent resources such as coldwater fisheries. In fiscal year 2010, a contract to inventory the ground water resources of the CNNF was initiated with the Wisconsin Geological and Natural History Survey (WGNHS) and U.S. Geological Survey (USGS). Use and management of the groundwater resource is an emerging issue in northern Wisconsin as populations and developments expand and water shortages and quality concerns start to emerge. In the future, the Forest may receive requests for significant ground water withdrawals for municipal or commercial uses. In addition, the effects of climate change and predicted climate change models indicate potential impacts on groundwater resources that may have negative effects on groundwater-dependent resources or create demands for water withdrawals from the National Forest. It will likely become more important in the future to have a ground water inventory to better understand and estimate the impacts of management activities, climate change, and groundwater withdrawals.
Ecosystem Restoration Vegetation Composition – Restoring historic conditions, thus providing terrestrial ecosystems in healthy, diverse, and productive conditions that support the diversity of plant and animal communities and tree species is the backbone of the Chequamegon-Nicolet Forest Plan (Goal 1.4). In 2004, when the Forest Plan was approved, most of the management areas were relatively close to their desired forest type composition. In general, the forest type composition in 2004 on the Chequamegon-Nicolet National Forest can be characterized as follows:

Chapter 3 - Mid-term Evaluation of the Forest Plan
166 Year 2009/2010 Monitoring and Midterm Evaluation Report
♦ Aspen stands and upland openings were above the desired level in management areas designed to feature northern hardwoods or conifers.
♦ Red pine and white pine stands were below desired levels in management areas designed to feature conifers.
♦ Oak was below desired levels in management areas designed for oak and pine.
Restoration of interior forest, specifically uneven-aged northern hardwoods was a focus of the first round of vegetation management projects under the 2004 Forest Plan. The best opportunity for this type of restoration occurs in management areas 2B and 2A where creating another age class in hardwood stands and converting aspen stands to northern hardwoods is a major focus. Projects that had been delayed by legal challenges in the first few years of the Forest Plan will occur in the next 5 years and forest type composition within management areas 2A and 2B are expected to progress toward the Forest Plan objectives.
Other Forest vegetation management projects outside of management areas 2B and 2A focused on achieving the desired forest type composition and age class structure of various forest types. While progress was made in most management areas, there is still work to be done. Notably, in management area 4B there is a need to increase the amount of red pine and white pine stands, and decrease the amount of aspen.
The overall Forest trend over the last 6 years was a decrease (-1.5 percent) in early-successional types (aspen, balsam fir, paper birch, jack pine and permanent opening) and an increase (+1.5 percent) in late-successional types (hardwoods, red/white pine, and oak). Some of these forest composition changes are a result of natural processes recorded with the latest inventory. However, a large percentage is a direct result of active management efforts designed to speed up natural succession.
Natural succession and disturbance processes shape the vegetation composition in management areas 5, 5B, 6A, 8E, 8F, and 8G. These areas can provide a baseline for comparing vegetation composition against actively managed landscapes.
Disturbance Events – Since 2004, two major disturbance events had a large influence on forest type composition and species age class distribution of the CNNF.
♦ The Spruce Decline event (2004-2009) impacted nearly 50 percent of the white spruce on the CNNF and had a significant impact on ecosystem restoration objectives. Simply put, restoration on these sites was merely an effort to restore productive, forested conditions as quickly as possible. In many cases, advanced regeneration of aspen or northern hardwoods had already become established beneath the dying spruce. Rather than fight the natural change, The Forest chose to allow it. This did not always fit the desired forest type composition objectives for individual management areas. However, the dying spruce left few options. Aspen was the most dominant species regenerated, although northern hardwood was a close second in terms of acres gained.
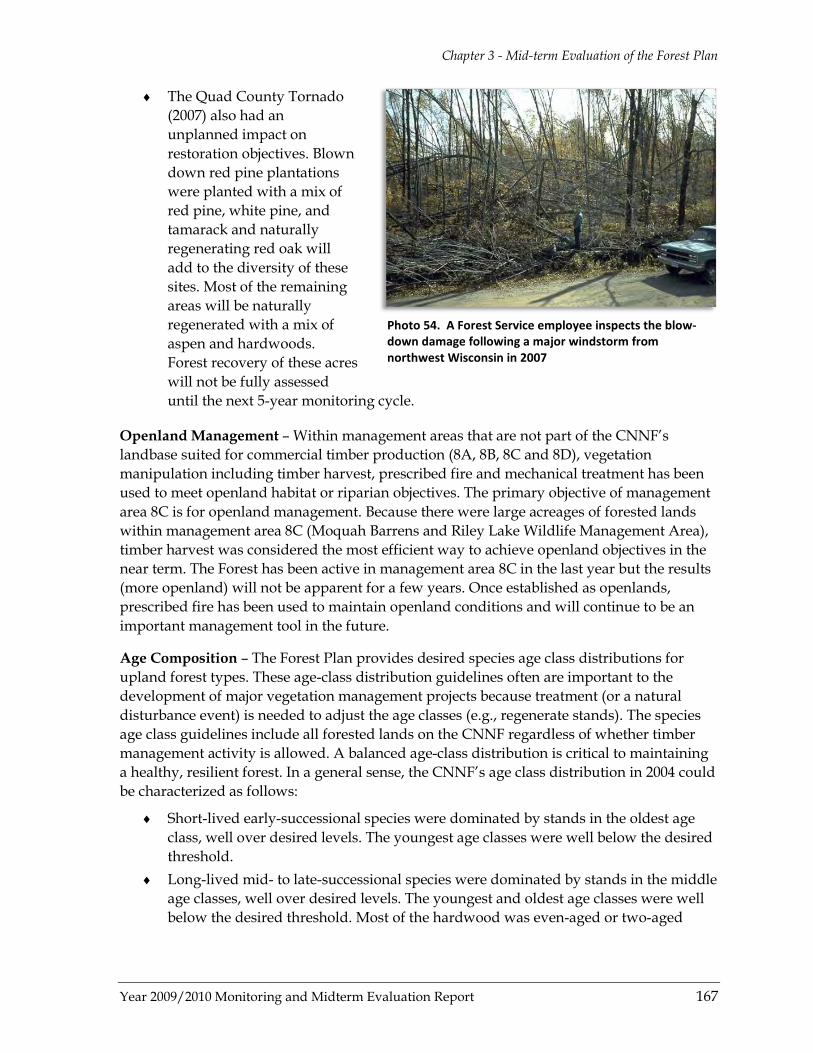
Chapter 3 - Mid-term Evaluation of the Forest Plan
Year 2009/2010 Monitoring and Midterm Evaluation Report 167
♦ The Quad County Tornado (2007) also had an unplanned impact on restoration objectives. Blown down red pine plantations were planted with a mix of red pine, white pine, and tamarack and naturally regenerating red oak will add to the diversity of these sites. Most of the remaining areas will be naturally regenerated with a mix of aspen and hardwoods. Forest recovery of these acres will not be fully assessed until the next 5-year monitoring cycle.
Openland Management – Within management areas that are not part of the CNNF’s landbase suited for commercial timber production (8A, 8B, 8C and 8D), vegetation manipulation including timber harvest, prescribed fire and mechanical treatment has been used to meet openland habitat or riparian objectives. The primary objective of management area 8C is for openland management. Because there were large acreages of forested lands within management area 8C (Moquah Barrens and Riley Lake Wildlife Management Area), timber harvest was considered the most efficient way to achieve openland objectives in the near term. The Forest has been active in management area 8C in the last year but the results (more openland) will not be apparent for a few years. Once established as openlands, prescribed fire has been used to maintain openland conditions and will continue to be an important management tool in the future.
Age Composition – The Forest Plan provides desired species age class distributions for upland forest types. These age-class distribution guidelines often are important to the development of major vegetation management projects because treatment (or a natural disturbance event) is needed to adjust the age classes (e.g., regenerate stands). The species age class guidelines include all forested lands on the CNNF regardless of whether timber management activity is allowed. A balanced age-class distribution is critical to maintaining a healthy, resilient forest. In a general sense, the CNNF’s age class distribution in 2004 could be characterized as follows:
♦ Short-lived early-successional species were dominated by stands in the oldest age class, well over desired levels. The youngest age classes were well below the desired threshold.
♦ Long-lived mid- to late-successional species were dominated by stands in the middle age classes, well over desired levels. The youngest and oldest age classes were well below the desired threshold. Most of the hardwood was even-aged or two-aged
Photo 54. A Forest Service employee inspects the blow-down damage following a major windstorm from northwest Wisconsin in 2007
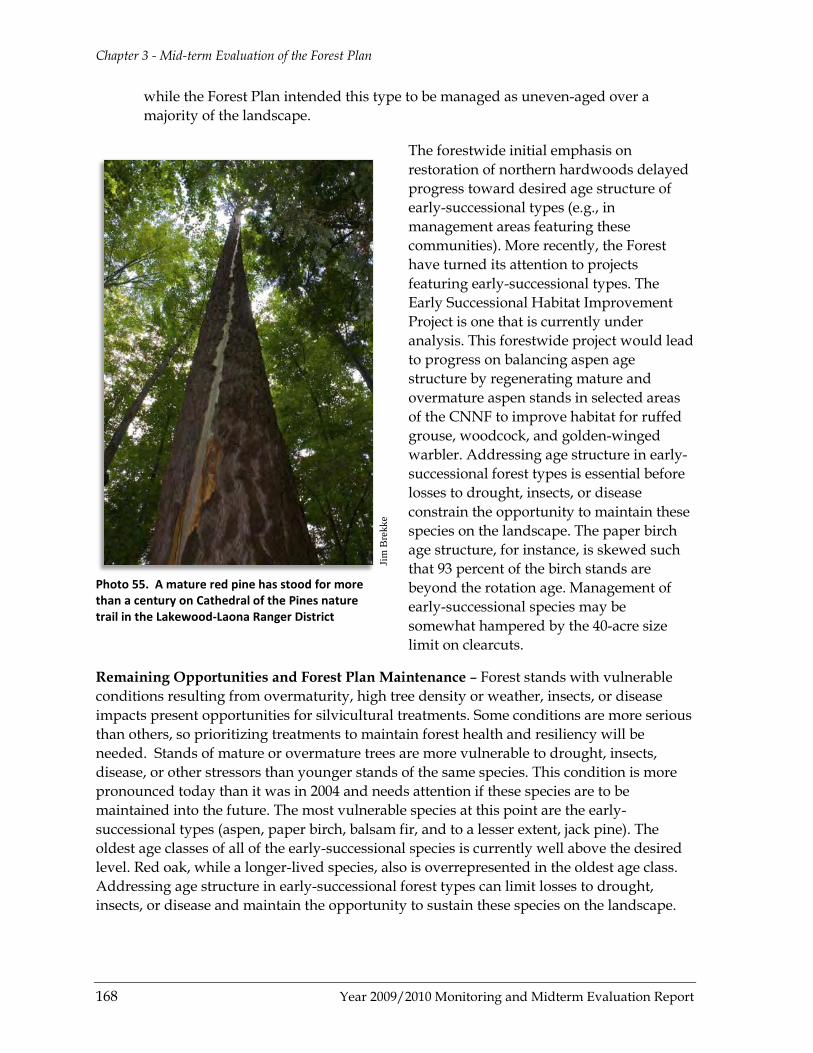
Chapter 3 - Mid-term Evaluation of the Forest Plan
168 Year 2009/2010 Monitoring and Midterm Evaluation Report
while the Forest Plan intended this type to be managed as uneven-aged over a majority of the landscape.
The forestwide initial emphasis on restoration of northern hardwoods delayed progress toward desired age structure of early-successional types (e.g., in management areas featuring these communities). More recently, the Forest have turned its attention to projects featuring early-successional types. The Early Successional Habitat Improvement Project is one that is currently under analysis. This forestwide project would lead to progress on balancing aspen age structure by regenerating mature and overmature aspen stands in selected areas of the CNNF to improve habitat for ruffed grouse, woodcock, and golden-winged warbler. Addressing age structure in early-successional forest types is essential before losses to drought, insects, or disease constrain the opportunity to maintain these species on the landscape. The paper birch age structure, for instance, is skewed such that 93 percent of the birch stands are beyond the rotation age. Management of early-successional species may be somewhat hampered by the 40-acre size limit on clearcuts.
Remaining Opportunities and Forest Plan Maintenance – Forest stands with vulnerable conditions resulting from overmaturity, high tree density or weather, insects, or disease impacts present opportunities for silvicultural treatments. Some conditions are more serious than others, so prioritizing treatments to maintain forest health and resiliency will be needed. Stands of mature or overmature trees are more vulnerable to drought, insects, disease, or other stressors than younger stands of the same species. This condition is more pronounced today than it was in 2004 and needs attention if these species are to be maintained into the future. The most vulnerable species at this point are the early-successional types (aspen, paper birch, balsam fir, and to a lesser extent, jack pine). The oldest age classes of all of the early-successional species is currently well above the desired level. Red oak, while a longer-lived species, also is overrepresented in the oldest age class. Addressing age structure in early-successional forest types can limit losses to drought, insects, or disease and maintain the opportunity to sustain these species on the landscape.
Jim
Bre
kke
Photo 55. A mature red pine has stood for more than a century on Cathedral of the Pines nature trail in the Lakewood-Laona Ranger District
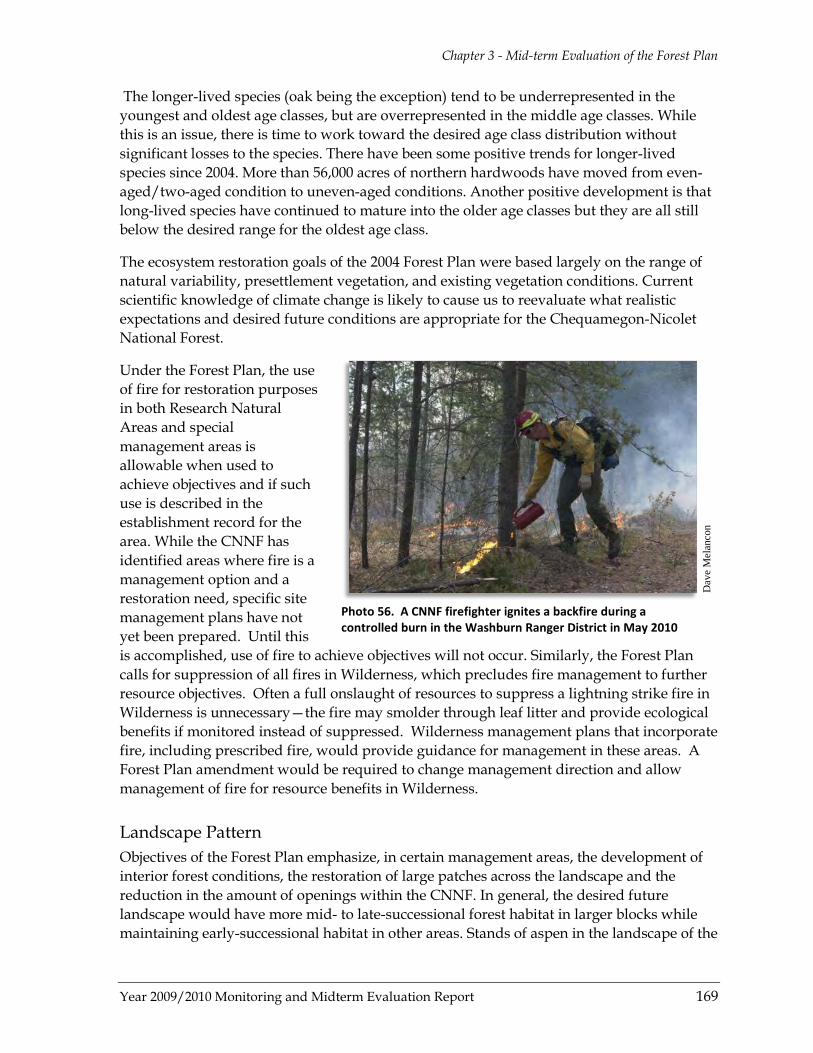
Chapter 3 - Mid-term Evaluation of the Forest Plan
Year 2009/2010 Monitoring and Midterm Evaluation Report 169
The longer-lived species (oak being the exception) tend to be underrepresented in the youngest and oldest age classes, but are overrepresented in the middle age classes. While this is an issue, there is time to work toward the desired age class distribution without significant losses to the species. There have been some positive trends for longer-lived species since 2004. More than 56,000 acres of northern hardwoods have moved from even-aged/two-aged condition to uneven-aged conditions. Another positive development is that long-lived species have continued to mature into the older age classes but they are all still below the desired range for the oldest age class.
The ecosystem restoration goals of the 2004 Forest Plan were based largely on the range of natural variability, presettlement vegetation, and existing vegetation conditions. Current scientific knowledge of climate change is likely to cause us to reevaluate what realistic expectations and desired future conditions are appropriate for the Chequamegon-Nicolet National Forest.
Under the Forest Plan, the use of fire for restoration purposes in both Research Natural Areas and special management areas is allowable when used to achieve objectives and if such use is described in the establishment record for the area. While the CNNF has identified areas where fire is a management option and a restoration need, specific site management plans have not yet been prepared. Until this is accomplished, use of fire to achieve objectives will not occur. Similarly, the Forest Plan calls for suppression of all fires in Wilderness, which precludes fire management to further resource objectives. Often a full onslaught of resources to suppress a lightning strike fire in Wilderness is unnecessary—the fire may smolder through leaf litter and provide ecological benefits if monitored instead of suppressed. Wilderness management plans that incorporate fire, including prescribed fire, would provide guidance for management in these areas. A Forest Plan amendment would be required to change management direction and allow management of fire for resource benefits in Wilderness.
Landscape Pattern Objectives of the Forest Plan emphasize, in certain management areas, the development of interior forest conditions, the restoration of large patches across the landscape and the reduction in the amount of openings within the CNNF. In general, the desired future landscape would have more mid- to late-successional forest habitat in larger blocks while maintaining early-successional habitat in other areas. Stands of aspen in the landscape of the
Dav
e M
elan
con
Photo 56. A CNNF firefighter ignites a backfire during a controlled burn in the Washburn Ranger District in May 2010
Chapter 3 - Mid-term Evaluation of the Forest Plan
170 Year 2009/2010 Monitoring and Midterm Evaluation Report
Chequamegon-Nicolet National Forest were expected to decrease as a result of the landscape pattern objectives of the Forest Plan and it was acknowledged that wildlife species that favor aspen may see declines. Landscape-scale ecosystem restoration was expected to maintain or enhance the viability of the diversity of species, especially those that favor mature, interior forest conditions. Mature (80 years and older or uneven aged) northern hardwoods have greatly increased since 2004 due to stand aging. Changing the landscape pattern of the CNNF will take time but modest gains were made.
Most of the large vegetation management projects since 2004 have occurred in northern hardwoods emphasis areas, therefore, opening maintenance opportunities were deferred such that further progress toward contiguous forest conditions could be achieved. For example, the Twentymile Restoration Project in a northern hardwood emphasis area on the Great Divide Ranger District deferred maintenance of 50 of the 67 acres of openings within the project area (2007 decision). The Long Rail Project in a hardwoods emphasis area on the Eagle River-Florence Ranger District deferred maintenance on 291 of the 840 acres of openings (2006 decision). Without brushing, mowing, or prescribed fire, most of these openings are naturally filling in with woody vegetation, consistent with Forest Plan direction.
Remaining Opportunities and Forest Plan Maintenance – Continued management to further progress toward desired future conditions in each management area will, in turn, further landscape pattern objectives.
Old Growth Management of mature and old-growth stands differed between the Chequamegon and Nicolet National Forests under the 1986 Forest Plans but under the 2004 Forest Plan a consistent management approach to old growth was achieved. Old growth areas, research natural areas (management area 8E), and special management areas (management area 8F) together with State Natural Areas form a network of ecological reference areas representing the range of communities present in northern Wisconsin. A total of 85,500 acres of the Chequamegon-Nicolet National Forest was designated as management area 8G (old growth and natural features complexes) where commercial timber harvest does not occur and natural disturbance processes predominate. To further contribute to their natural character, many roads (about 68 percent of those that existed in 2004) within the old growth areas were made unavailable to public motor vehicle travel through the analyses of the Travel Management Rule and vegetation management projects from 2008-2011. Instances of insect and disease mortality and storm damage have occurred within old growth areas since 2004; these areas have remained unsalvaged per Forest Plan direction to increase coarse woody debris retention. Should an emerald ash borer infestation be discovered within an old growth area, initial attack (including ash tree removal) to slow or arrest the spread of emerald ash borer may occur in the old growth (2010 decision).
Remaining Opportunities and Forest Plan Maintenance – The management problem associated with old growth during Forest Plan revision was largely corrected through the establishment of consistent standards and guidelines for lands allocated to old growth (management area 8G). Progress toward the desired future conditions within each
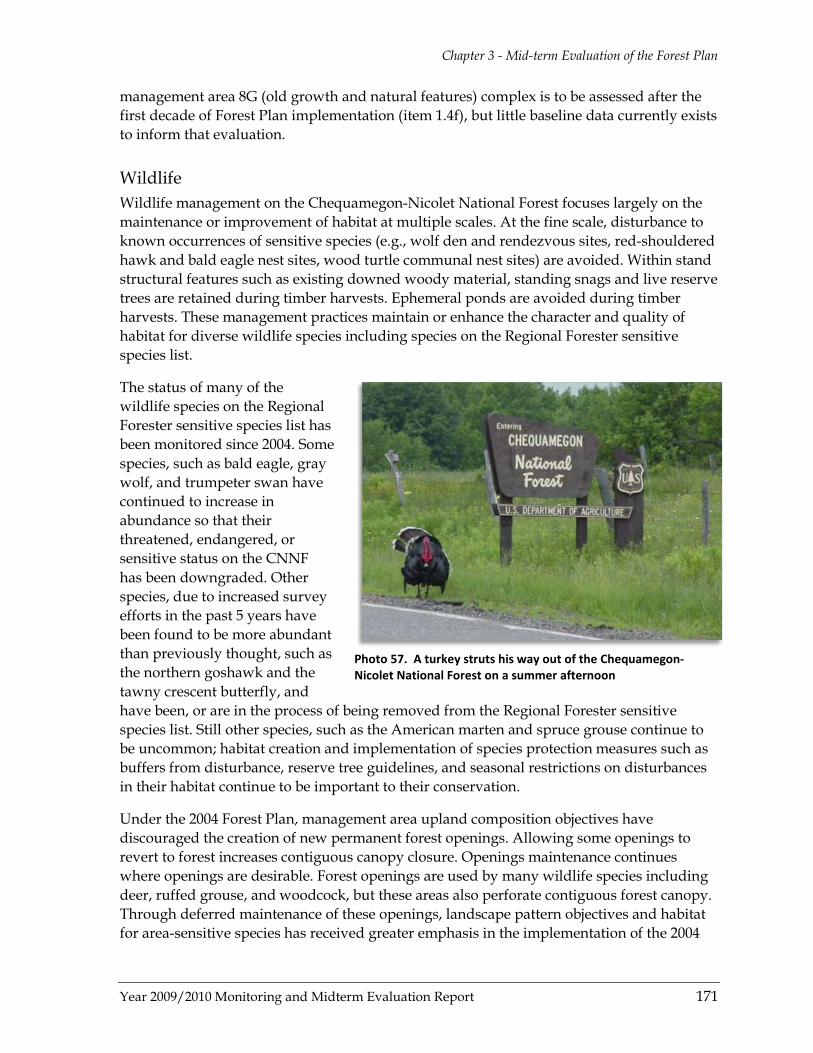
Chapter 3 - Mid-term Evaluation of the Forest Plan
Year 2009/2010 Monitoring and Midterm Evaluation Report 171
management area 8G (old growth and natural features) complex is to be assessed after the first decade of Forest Plan implementation (item 1.4f), but little baseline data currently exists to inform that evaluation.
Wildlife Wildlife management on the Chequamegon-Nicolet National Forest focuses largely on the maintenance or improvement of habitat at multiple scales. At the fine scale, disturbance to known occurrences of sensitive species (e.g., wolf den and rendezvous sites, red-shouldered hawk and bald eagle nest sites, wood turtle communal nest sites) are avoided. Within stand structural features such as existing downed woody material, standing snags and live reserve trees are retained during timber harvests. Ephemeral ponds are avoided during timber harvests. These management practices maintain or enhance the character and quality of habitat for diverse wildlife species including species on the Regional Forester sensitive species list.
The status of many of the wildlife species on the Regional Forester sensitive species list has been monitored since 2004. Some species, such as bald eagle, gray wolf, and trumpeter swan have continued to increase in abundance so that their threatened, endangered, or sensitive status on the CNNF has been downgraded. Other species, due to increased survey efforts in the past 5 years have been found to be more abundant than previously thought, such as the northern goshawk and the tawny crescent butterfly, and have been, or are in the process of being removed from the Regional Forester sensitive species list. Still other species, such as the American marten and spruce grouse continue to be uncommon; habitat creation and implementation of species protection measures such as buffers from disturbance, reserve tree guidelines, and seasonal restrictions on disturbances in their habitat continue to be important to their conservation.
Under the 2004 Forest Plan, management area upland composition objectives have discouraged the creation of new permanent forest openings. Allowing some openings to revert to forest increases contiguous canopy closure. Openings maintenance continues where openings are desirable. Forest openings are used by many wildlife species including deer, ruffed grouse, and woodcock, but these areas also perforate contiguous forest canopy. Through deferred maintenance of these openings, landscape pattern objectives and habitat for area-sensitive species has received greater emphasis in the implementation of the 2004
Photo 57. A turkey struts his way out of the Chequamegon-Nicolet National Forest on a summer afternoon
Chapter 3 - Mid-term Evaluation of the Forest Plan
172 Year 2009/2010 Monitoring and Midterm Evaluation Report
Forest Plan thus far when compared to early-successional habitat maintenance (see “Landscape Pattern” on p. 169) This is largely the result of the location (areas emphasizing northern hardwoods management) of the projects implemented since 2004.
Remaining Opportunities and Forest Plan Maintenance – The U.S. Fish and Wildlife Service is currently considering adding golden-winged warbler to the endangered species list. The Chequamegon-Nicolet National Forest provides suitable habitat for the species (both upland and lowland) and could provide additional habitat for the species. The U.S. Fish and Wildlife Service determination will factor into the CNNF’s decision about what Forest Plan maintenance actions, if any, are needed related to golden-winged warbler.
Special Lands Allocation The research natural areas and special management areas existing prior to the 2004 Forest Plan were small and isolated, did not represent a wide range of vegetation communities, and were not integrated into a systematic network of reserves where proximity, continuity, and presence of connecting corridors were considered. Through the 2004 Forest Plan’s management area allocations (99,100 acres) and management area-specific standards and guidelines, the Forest remedied these deficiencies. The current collection of Research Natural Areas and special management areas represent the range of vegetation communities found historically on the landscape. They are part of a systematic network of reserves and include areas with outstanding scenic, recreational, geological, botanical, zoological, and historical features. These Research Natural Areas (RNA’s) and special management areas now provide opportunities for monitoring natural processes, studying ecosystems and their component parts, and investigating successional and other long-term changes. Approximately half of the candidate RNA’s identified in the 2004 Forest Plan have since been identified for formal establishment as research natural areas by Region 9 and the Northern Research Station, consistent with the Region 9 framework for ecological reference areas.
The Chequamegon-Nicolet National Forest has had an active land acquisition program since 1996. The lands program under the 2004 Forest Plan has concentrated mainly on acquisition of water frontage on lakes, rivers, and streams, and to acquire important inholdings. The acquisition of numerous properties with water frontage have allowed the Forest to enhance the quality recreation provided to the public as well as protecting these areas from development, enhancing water quality, protecting valuable riparian areas and extending effective wildlife habitat. Over the years, there have been many unique properties available for acquisition. The purchase of many of these properties has only been possible through strong partnerships with several conservation organizations that have served as effective facilitators and a financial bridge for National Forest acquisitions.
Remaining Opportunities and Forest Plan Maintenance – An administrative correction is needed to complete the designation process of the research natural areas selected by the Regional Forester. Candidate RNA’s that were not selected for formal designation will need to be reassigned a management area.
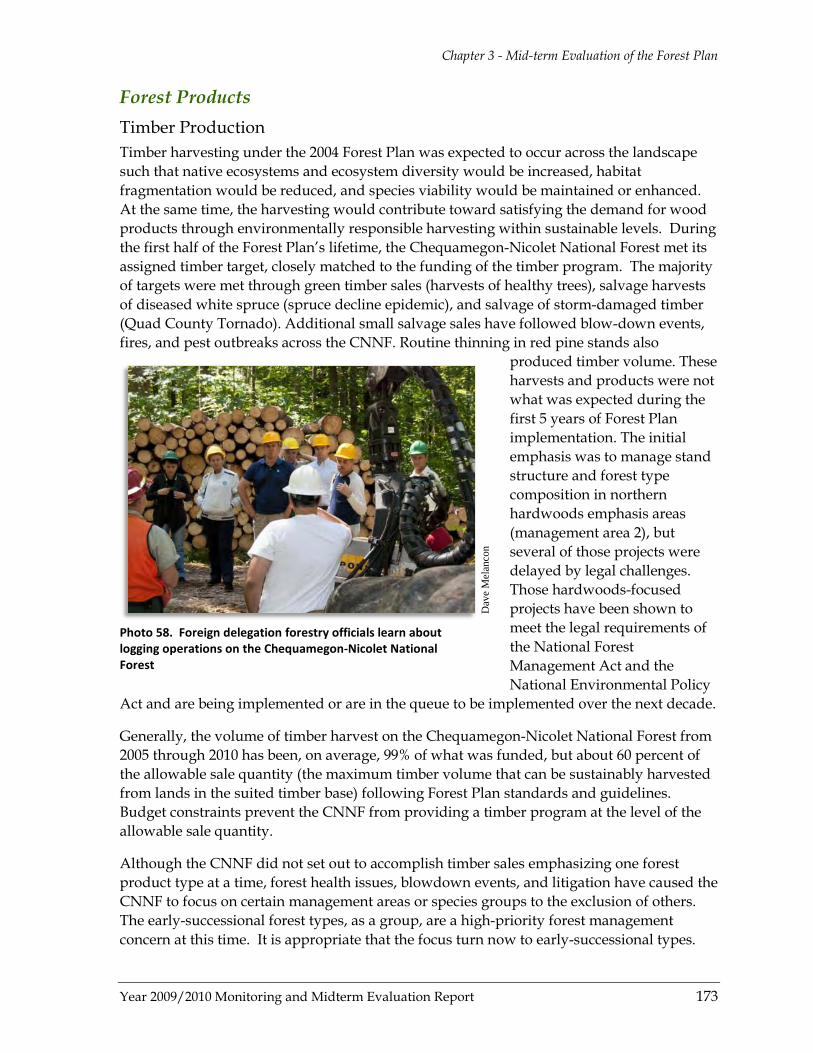
Chapter 3 - Mid-term Evaluation of the Forest Plan
Year 2009/2010 Monitoring and Midterm Evaluation Report 173
Forest Products Timber Production Timber harvesting under the 2004 Forest Plan was expected to occur across the landscape such that native ecosystems and ecosystem diversity would be increased, habitat fragmentation would be reduced, and species viability would be maintained or enhanced. At the same time, the harvesting would contribute toward satisfying the demand for wood products through environmentally responsible harvesting within sustainable levels. During the first half of the Forest Plan’s lifetime, the Chequamegon-Nicolet National Forest met its assigned timber target, closely matched to the funding of the timber program. The majority of targets were met through green timber sales (harvests of healthy trees), salvage harvests of diseased white spruce (spruce decline epidemic), and salvage of storm-damaged timber (Quad County Tornado). Additional small salvage sales have followed blow-down events, fires, and pest outbreaks across the CNNF. Routine thinning in red pine stands also
produced timber volume. These harvests and products were not what was expected during the first 5 years of Forest Plan implementation. The initial emphasis was to manage stand structure and forest type composition in northern hardwoods emphasis areas (management area 2), but several of those projects were delayed by legal challenges. Those hardwoods-focused projects have been shown to meet the legal requirements of the National Forest Management Act and the National Environmental Policy
Act and are being implemented or are in the queue to be implemented over the next decade.
Generally, the volume of timber harvest on the Chequamegon-Nicolet National Forest from 2005 through 2010 has been, on average, 99% of what was funded, but about 60 percent of the allowable sale quantity (the maximum timber volume that can be sustainably harvested from lands in the suited timber base) following Forest Plan standards and guidelines. Budget constraints prevent the CNNF from providing a timber program at the level of the allowable sale quantity.
Although the CNNF did not set out to accomplish timber sales emphasizing one forest product type at a time, forest health issues, blowdown events, and litigation have caused the CNNF to focus on certain management areas or species groups to the exclusion of others. The early-successional forest types, as a group, are a high-priority forest management concern at this time. It is appropriate that the focus turn now to early-successional types.
Dav
e M
elan
con
Photo 58. Foreign delegation forestry officials learn about logging operations on the Chequamegon-Nicolet National Forest

Chapter 3 - Mid-term Evaluation of the Forest Plan
174 Year 2009/2010 Monitoring and Midterm Evaluation Report
Overall timber harvest volume from the Chequamegon-Nicolet National Forest matched funding allocations with 99 percent efficiency although the harvest products were not balanced equally. Softwood sawtimber harvests consistently exceeded the allowable sale quantity from 2005-2010 (because of the salvage opportunities that arose during this time period), and softwood pulpwood harvest was near allowable sale quantity during the same period. Hardwood pulpwood harvest has been about one quarter to one-half of the allowable sale quantity, but hardwood harvesting is expected to increase over the next few years as the management area 2 projects that were delayed by litigation move forward. The harvest of hardwood sawtimber has mirrored hardwood pulpwood harvest, from one-quarter to one-half of allowable sale quantity, but the ratio of sawtimber to pulpwood in hardwood sales is increasing incrementally and will continue to increase over the coming decades as repeated selection harvests move stands closer to the desired stand structure.
Aspen pulpwood harvests have been less than expected from 2005 through 2010. Analysis is underway, however, on the Early Successional Habitat Improvement Project, and some ranger districts are about to initiate projects in management area 1 aspen emphasis areas. Although it will take time for NEPA analysis, sale preparation, offer, sell, and harvest, the volume of aspen pulpwood harvest is expected to increase over the next several years,
lagging behind the hardwood harvest by the time it takes to complete the analysis.
Remaining Opportunities and Forest Plan Maintenance – No Forest Plan maintenance issues specific to timber production have emerged.
Special Forest Products During the development of the 2004 Forest Plan, there was growing interest in the collection of special forest products such as princess pine, Christmas trees and boughs, birch bark, firewood, and sheet moss. Increasing interest in special forest products nationally prompted the agency to develop a national policy for collection in 2001. The 2004 Forest Plan provides direction to regulate special forest product harvesting through a permit system and to restrict harvesting in areas where the harvest of these products runs counter to other resource objectives. In 2009, the CNNF supplemented the national policy (FSH 2409.18_80-2009-1) to further identify areas where collection of special forest products is
Jim
Bre
kke
Photo 59. Winter logging operations in the Argonne Experimental Forest, Eagle River–Florence Ranger District

Chapter 3 - Mid-term Evaluation of the Forest Plan
Year 2009/2010 Monitoring and Midterm Evaluation Report 175
limited, and to establish collection guidelines for specific products such as princess pine and sheet moss.
Contrary to expectations, while special forest products continue to be collected from the Chequamegon-Nicolet National Forest, harvest amounts and permit issuances have not continued to rise during the past 5 to 10 years. Although collections of special forest products through the permit process have been tracked, the sustainability of such harvests remains difficult to assess for some of the special forest products. Baseline population estimates of princess pine and sheet moss, against which removals could be compared, do not exist. Given the low numbers of permits issued and the dispersed nature of the collections, however, detailed site-level monitoring is probably not necessary. Presently, management direction related to the collection of special forest products appears adequate for sustaining these products on the CNNF.
Remaining Opportunities and Forest Plan Maintenance – A determination of the sustainable amount of harvest of special forest products has yet to occur.
Monitoring Program Effectiveness A brief evaluation of the monitoring program in the context of the 10 major Forest Plan revision issues is presented in this section. This evaluation focuses on the success the Forest has had in reporting quantifiable information to answer monitoring questions in the CNNF Plan and whether the questions asked in the monitoring plan asked remain valid. This evaluation also is intended to set realistic expectations for the monitoring programs on the Chequamegon-Nicolet National Forest for the remainder of the lifetime of the Forest Plan. Minimum legal requirements remain a top priority for the monitoring program. Quantitative monitoring will take precedence over qualitative monitoring but the former generally is more expensive and, given limited funding, some monitoring actions in the Forest Plan likely will not occur.
Monitoring questions to address the effectiveness and validation of forestwide goals and objectives were formulated during the development of the 2004 Forest Plan and are presented in chapter 4 of the Forest Plan. Monitoring questions are tied to the goals and objectives of the Forest Plan and, as such, embody the resource concerns that were the focus of the development of the 2004 Forest Plan. Some are measurable and can be answered in a
Photo 60. Christmas trees are just one type of special forest products produced on the Chequamegon-Nicolet National Forest. In 2010, more than 700 holiday trees were harvested.

Chapter 3 - Mid-term Evaluation of the Forest Plan
176 Year 2009/2010 Monitoring and Midterm Evaluation Report
quantifiable way, others are not easily measured or can only be assessed qualitatively. The answerability of these questions has been variable for a variety of reasons including (1) the open-ended nature of the monitoring questions, (2) lack of a baseline against which to compare collected data and, (3) limited funding for data collection.
The legally required monitoring items are largely covered by monitoring Forest Plan goals and objectives. For instance, the requirement to monitor the effects of off-road vehicles (36 CFR 219.21) are addressed at a minimum through monitoring efforts to address Objectives 1.3b, 1.3d and 2.1c. However, only 17 of the 63 Forest Plan objectives in chapter 1 of the Forest Plan are defined to the point of being measurable and time-specific as directed by the
1982 Planning Rule [an objective is “a concise, time specific statement of measurable planned results that respond to pre-established goals”]. The subjectivity of the objectives that lack explicit measurable results has made evaluation of the progress toward the Forest Plan’s goals a challenge while also providing flexibility in the monitoring program to adjust it as circumstances change.
The monitoring program has generally relied on the “Annual
Monitoring Plan of Operations” derived from the Monitoring Guide, which is a more detailed version of the Monitoring Plan presented in the Forest Plan chapter 4 (tables 4-1, 4-2a, b and c). The reporting frequency for the monitoring items largely followed the expected monitoring and evaluation frequency outlined in tables 4-1 and 4-2 of the Forest Plan. Reporting frequency for some items was more frequent than stated because of high public interest. For example, although it is on an every-five-year schedule, monitoring of habitat conditions for a selection of Regional Forester sensitive species (Objective 1.1b) were reported in all but one annual report since 2005. For many of the items that are to be monitored every five years, the fiscal year 2009-2010 report is the first time that information on these items is reported.
Access and Recreation Opportunities All-Terrain, Off-road Vehicle and Motorized Use There are many quantifiable attributes related to motorized use on the Chequamegon-Nicolet National Forest including miles of road and trail by vehicle type and the miles of road constructed, closed, or decommissioned. The Forest has regularly reported results on monitoring questions related to these quantities since 2007. Monitoring the environmental impacts of motorized use (and effectiveness of Forest management of the transportation system) has been much more variable. The spread of nonnative invasive plant species along
Photo 61. An all-terrain vehicle rider cruises along the Three County Corridor which runs through the Washburn Ranger District
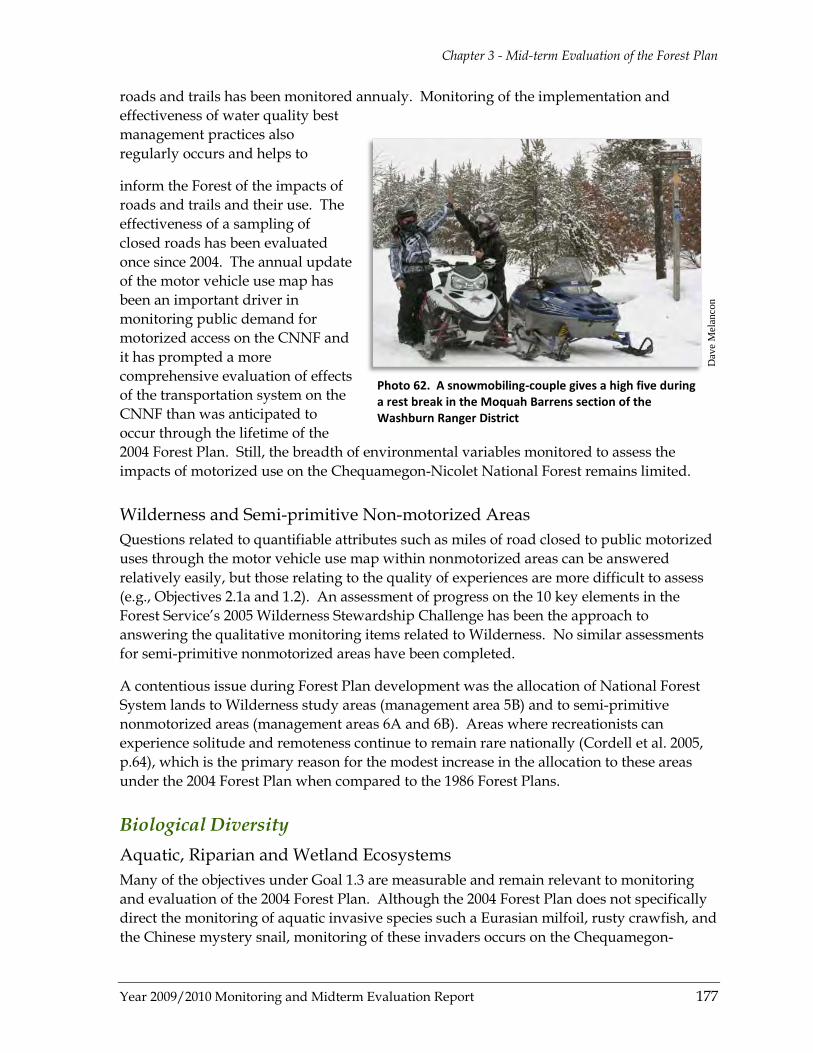
Chapter 3 - Mid-term Evaluation of the Forest Plan
Year 2009/2010 Monitoring and Midterm Evaluation Report 177
roads and trails has been monitored annualy. Monitoring of the implementation and effectiveness of water quality best management practices also regularly occurs and helps to
inform the Forest of the impacts of roads and trails and their use. The effectiveness of a sampling of closed roads has been evaluated once since 2004. The annual update of the motor vehicle use map has been an important driver in monitoring public demand for motorized access on the CNNF and it has prompted a more comprehensive evaluation of effects of the transportation system on the CNNF than was anticipated to occur through the lifetime of the 2004 Forest Plan. Still, the breadth of environmental variables monitored to assess the impacts of motorized use on the Chequamegon-Nicolet National Forest remains limited.
Wilderness and Semi-primitive Non-motorized Areas Questions related to quantifiable attributes such as miles of road closed to public motorized uses through the motor vehicle use map within nonmotorized areas can be answered relatively easily, but those relating to the quality of experiences are more difficult to assess (e.g., Objectives 2.1a and 1.2). An assessment of progress on the 10 key elements in the Forest Service’s 2005 Wilderness Stewardship Challenge has been the approach to answering the qualitative monitoring items related to Wilderness. No similar assessments for semi-primitive nonmotorized areas have been completed.
A contentious issue during Forest Plan development was the allocation of National Forest System lands to Wilderness study areas (management area 5B) and to semi-primitive nonmotorized areas (management areas 6A and 6B). Areas where recreationists can experience solitude and remoteness continue to remain rare nationally (Cordell et al. 2005, p.64), which is the primary reason for the modest increase in the allocation to these areas under the 2004 Forest Plan when compared to the 1986 Forest Plans.
Biological Diversity Aquatic, Riparian and Wetland Ecosystems Many of the objectives under Goal 1.3 are measurable and remain relevant to monitoring and evaluation of the 2004 Forest Plan. Although the 2004 Forest Plan does not specifically direct the monitoring of aquatic invasive species such a Eurasian milfoil, rusty crawfish, and the Chinese mystery snail, monitoring of these invaders occurs on the Chequamegon-
Dav
e M
elan
con
Photo 62. A snowmobiling-couple gives a high five during a rest break in the Moquah Barrens section of the Washburn Ranger District
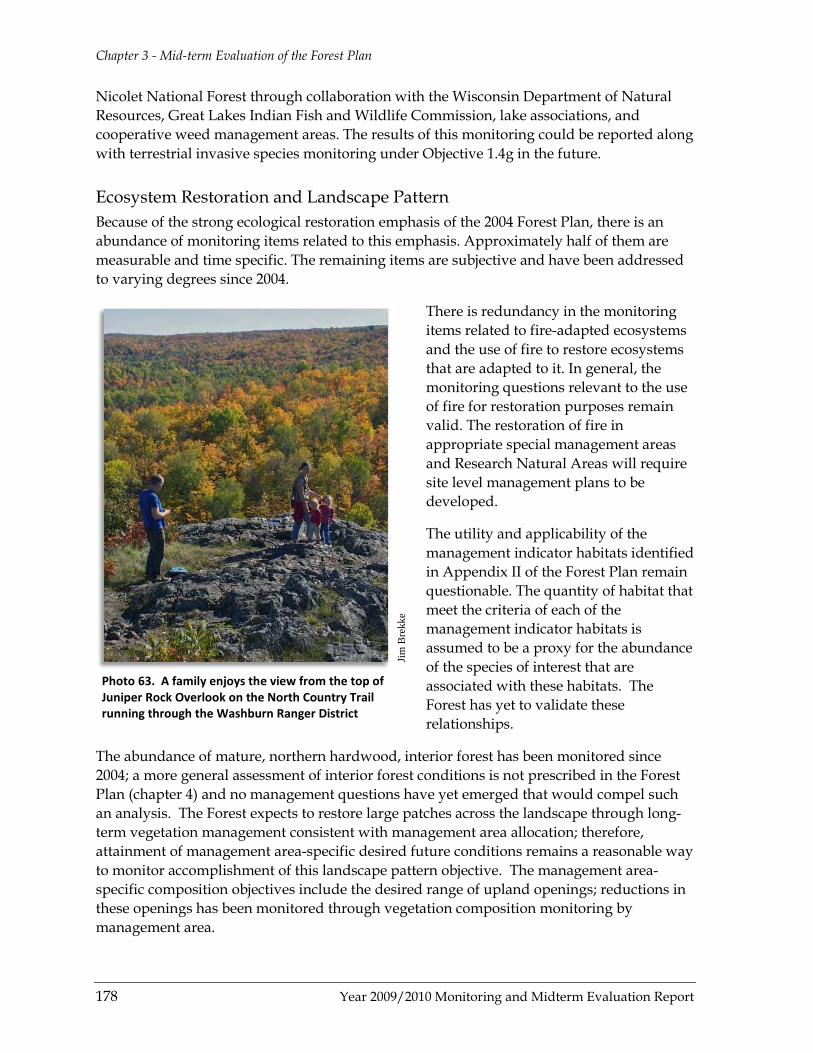
Chapter 3 - Mid-term Evaluation of the Forest Plan
178 Year 2009/2010 Monitoring and Midterm Evaluation Report
Nicolet National Forest through collaboration with the Wisconsin Department of Natural Resources, Great Lakes Indian Fish and Wildlife Commission, lake associations, and cooperative weed management areas. The results of this monitoring could be reported along with terrestrial invasive species monitoring under Objective 1.4g in the future.
Ecosystem Restoration and Landscape Pattern Because of the strong ecological restoration emphasis of the 2004 Forest Plan, there is an abundance of monitoring items related to this emphasis. Approximately half of them are measurable and time specific. The remaining items are subjective and have been addressed to varying degrees since 2004.
There is redundancy in the monitoring items related to fire-adapted ecosystems and the use of fire to restore ecosystems that are adapted to it. In general, the monitoring questions relevant to the use of fire for restoration purposes remain valid. The restoration of fire in appropriate special management areas and Research Natural Areas will require site level management plans to be developed.
The utility and applicability of the management indicator habitats identified in Appendix II of the Forest Plan remain questionable. The quantity of habitat that meet the criteria of each of the management indicator habitats is assumed to be a proxy for the abundance of the species of interest that are associated with these habitats. The Forest has yet to validate these relationships.
The abundance of mature, northern hardwood, interior forest has been monitored since 2004; a more general assessment of interior forest conditions is not prescribed in the Forest Plan (chapter 4) and no management questions have yet emerged that would compel such an analysis. The Forest expects to restore large patches across the landscape through long-term vegetation management consistent with management area allocation; therefore, attainment of management area-specific desired future conditions remains a reasonable way to monitor accomplishment of this landscape pattern objective. The management area-specific composition objectives include the desired range of upland openings; reductions in these openings has been monitored through vegetation composition monitoring by management area.
Jim
Bre
kke
Photo 63. A family enjoys the view from the top of Juniper Rock Overlook on the North Country Trail running through the Washburn Ranger District

Chapter 3 - Mid-term Evaluation of the Forest Plan
Year 2009/2010 Monitoring and Midterm Evaluation Report 179
It may be important in future management decision-making to reevaluate whether the current forest type composition guidelines are appropriate given the new science that suggests that upland openings are important to a wider array of wildlife than previously thought, and to ensure that current guidelines are not reducing connectivity of this habitat.
During the Forest Plan development, scenic integrity objectives were not well integrated with management area assignment. Consequently, scenic integrity objectives have, in some cases, limited proposals to manage stands toward desired forest type composition and age structure objectives. The extent to which these resource objectives compete is worth evaluating during the second half of the 2004 Forest Plan lifetime.
Old Growth – Old growth areas (management area 8G) are only cursorily monitored for changes in species composition or other ecological characteristics. Evaluating the degree to which early-successional forest (e.g., aspen and jack pine) are succeeding to late-successional forest types in old growth areas and to what extent these areas have progressed toward desired future conditions is difficult without quantitative vegetation survey data.
Wildlife Mature (80 years and older or uneven aged) northern hardwoods have greatly increased since 2004 due to stand aging, but the Forest has not yet validated whether the viability of the diversity of species that favor mature interior forest has been affected.
It is expected snag and reserve tree retention guidelines will benefit a variety of wildlife species, and other ecosystem processes remain an important ecological restoration practice, but the Forest has yet to thoroughly evaluate the effectiveness of these measures. Because these retention guidelines are given as ranges, retention levels have varied on a project-by-project basis.
Forest plan objectives relating directly to wildlife and wildlife management agencies such as the Wisconsin Department of Natural Resources and the U.S. Fish and Wildlife Service (e.g., Objectives 1.5a, 1.5b, 2.7, and 3.3f) are not quantifiable and time-specific; therefore, evaluating the attainment of these objectives has been subjective.
An increased emphasis on validation monitoring for many of the ecosystem restoration and landscape pattern objectives will be valuable during the second half of the 2004 Forest Plan
Dav
e M
elan
con
Photo 64. A common loon prepares to take off from Wanoka Lake in the Washburn Ranger District
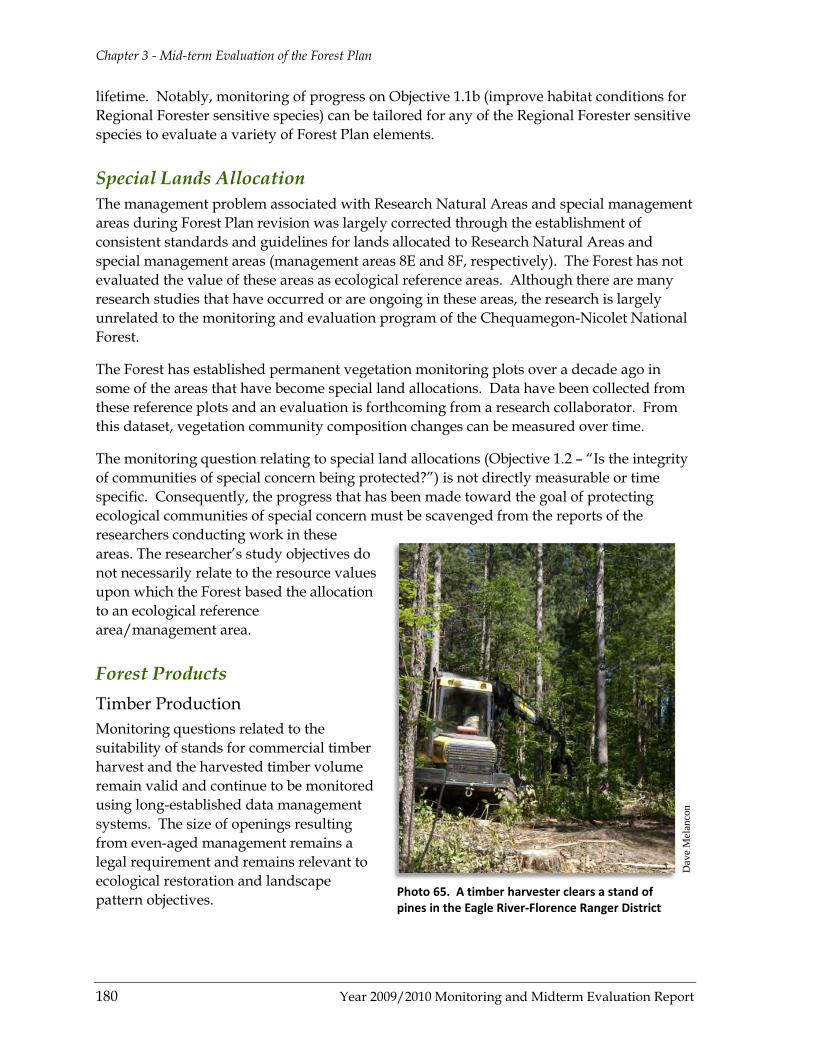
Chapter 3 - Mid-term Evaluation of the Forest Plan
180 Year 2009/2010 Monitoring and Midterm Evaluation Report
lifetime. Notably, monitoring of progress on Objective 1.1b (improve habitat conditions for Regional Forester sensitive species) can be tailored for any of the Regional Forester sensitive species to evaluate a variety of Forest Plan elements.
Special Lands Allocation The management problem associated with Research Natural Areas and special management areas during Forest Plan revision was largely corrected through the establishment of consistent standards and guidelines for lands allocated to Research Natural Areas and special management areas (management areas 8E and 8F, respectively). The Forest has not evaluated the value of these areas as ecological reference areas. Although there are many research studies that have occurred or are ongoing in these areas, the research is largely unrelated to the monitoring and evaluation program of the Chequamegon-Nicolet National Forest.
The Forest has established permanent vegetation monitoring plots over a decade ago in some of the areas that have become special land allocations. Data have been collected from these reference plots and an evaluation is forthcoming from a research collaborator. From this dataset, vegetation community composition changes can be measured over time.
The monitoring question relating to special land allocations (Objective 1.2 – “Is the integrity of communities of special concern being protected?”) is not directly measurable or time specific. Consequently, the progress that has been made toward the goal of protecting ecological communities of special concern must be scavenged from the reports of the researchers conducting work in these areas. The researcher’s study objectives do not necessarily relate to the resource values upon which the Forest based the allocation to an ecological reference area/management area.
Forest Products Timber Production Monitoring questions related to the suitability of stands for commercial timber harvest and the harvested timber volume remain valid and continue to be monitored using long-established data management systems. The size of openings resulting from even-aged management remains a legal requirement and remains relevant to ecological restoration and landscape pattern objectives.
Dav
e M
elan
con
Photo 65. A timber harvester clears a stand of pines in the Eagle River-Florence Ranger District
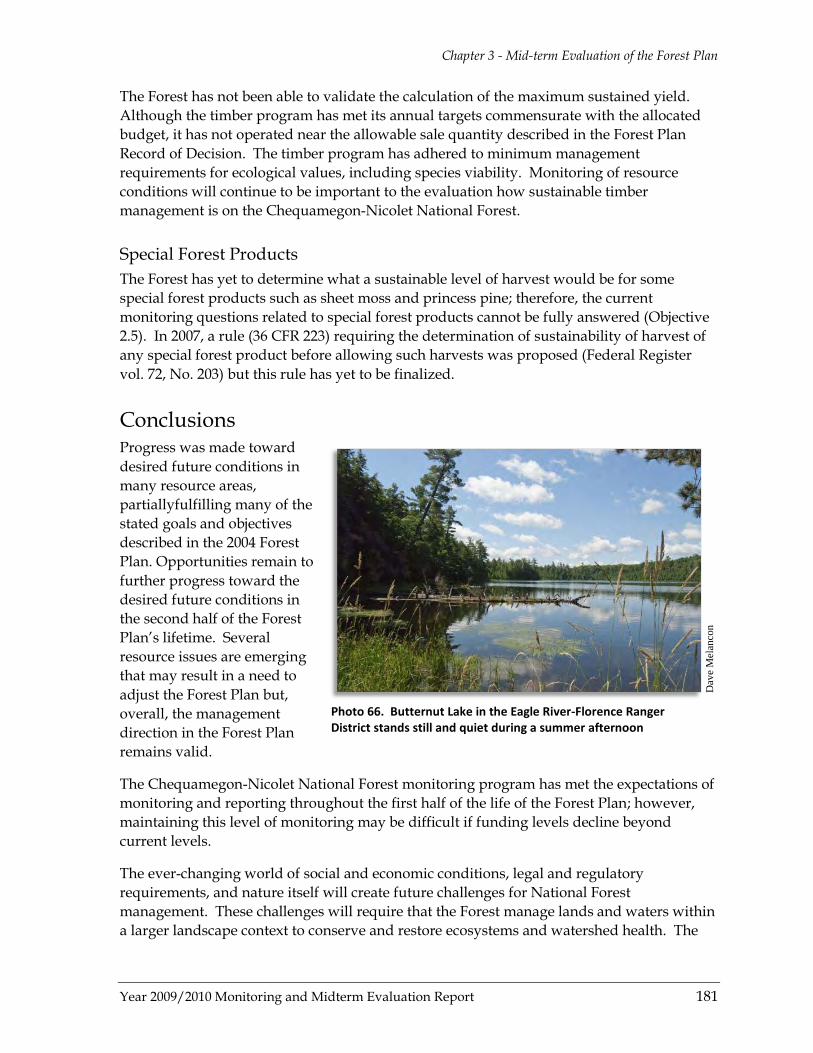
Chapter 3 - Mid-term Evaluation of the Forest Plan
Year 2009/2010 Monitoring and Midterm Evaluation Report 181
The Forest has not been able to validate the calculation of the maximum sustained yield. Although the timber program has met its annual targets commensurate with the allocated budget, it has not operated near the allowable sale quantity described in the Forest Plan Record of Decision. The timber program has adhered to minimum management requirements for ecological values, including species viability. Monitoring of resource conditions will continue to be important to the evaluation how sustainable timber management is on the Chequamegon-Nicolet National Forest.
Special Forest Products The Forest has yet to determine what a sustainable level of harvest would be for some special forest products such as sheet moss and princess pine; therefore, the current monitoring questions related to special forest products cannot be fully answered (Objective 2.5). In 2007, a rule (36 CFR 223) requiring the determination of sustainability of harvest of any special forest product before allowing such harvests was proposed (Federal Register vol. 72, No. 203) but this rule has yet to be finalized.
Conclusions Progress was made toward desired future conditions in many resource areas, partiallyfulfilling many of the stated goals and objectives described in the 2004 Forest Plan. Opportunities remain to further progress toward the desired future conditions in the second half of the Forest Plan’s lifetime. Several resource issues are emerging that may result in a need to adjust the Forest Plan but, overall, the management direction in the Forest Plan remains valid.
The Chequamegon-Nicolet National Forest monitoring program has met the expectations of monitoring and reporting throughout the first half of the life of the Forest Plan; however, maintaining this level of monitoring may be difficult if funding levels decline beyond current levels.
The ever-changing world of social and economic conditions, legal and regulatory requirements, and nature itself will create future challenges for National Forest management. These challenges will require that the Forest manage lands and waters within a larger landscape context to conserve and restore ecosystems and watershed health. The
Dav
e M
elan
con
Photo 66. Butternut Lake in the Eagle River-Florence Ranger District stands still and quiet during a summer afternoon
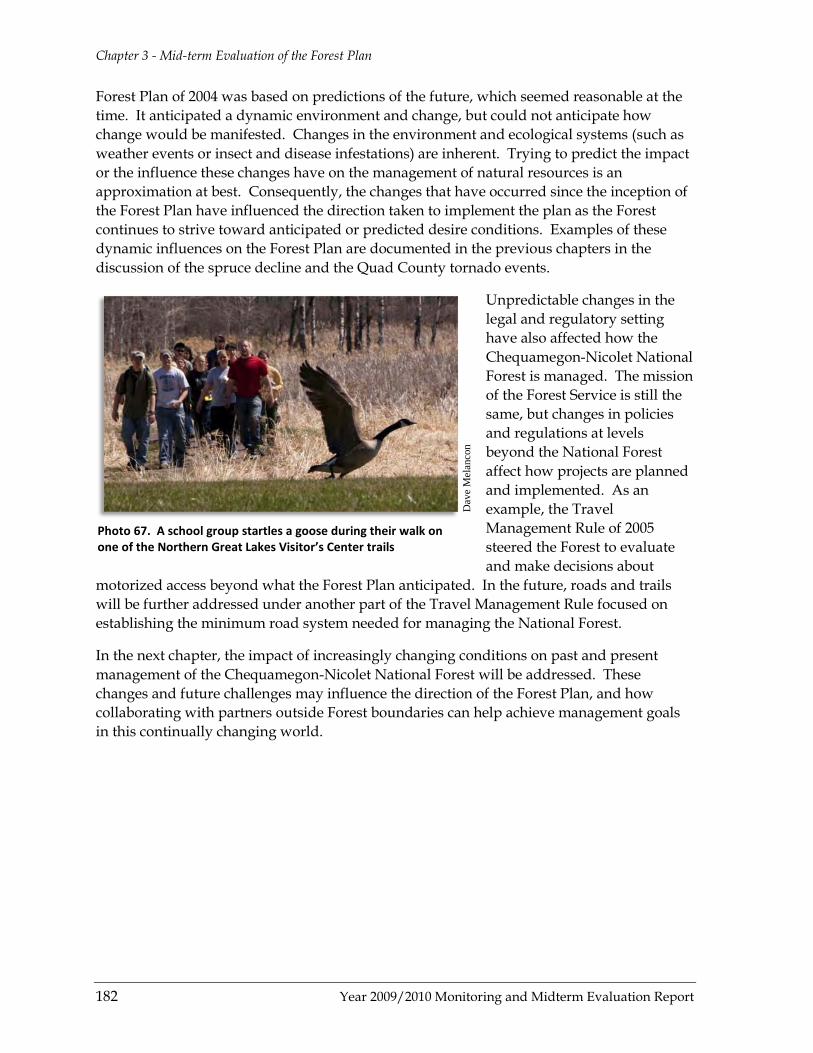
Chapter 3 - Mid-term Evaluation of the Forest Plan
182 Year 2009/2010 Monitoring and Midterm Evaluation Report
Forest Plan of 2004 was based on predictions of the future, which seemed reasonable at the time. It anticipated a dynamic environment and change, but could not anticipate how change would be manifested. Changes in the environment and ecological systems (such as weather events or insect and disease infestations) are inherent. Trying to predict the impact or the influence these changes have on the management of natural resources is an approximation at best. Consequently, the changes that have occurred since the inception of the Forest Plan have influenced the direction taken to implement the plan as the Forest continues to strive toward anticipated or predicted desire conditions. Examples of these dynamic influences on the Forest Plan are documented in the previous chapters in the discussion of the spruce decline and the Quad County tornado events.
Unpredictable changes in the legal and regulatory setting have also affected how the Chequamegon-Nicolet National Forest is managed. The mission of the Forest Service is still the same, but changes in policies and regulations at levels beyond the National Forest affect how projects are planned and implemented. As an example, the Travel Management Rule of 2005 steered the Forest to evaluate and make decisions about
motorized access beyond what the Forest Plan anticipated. In the future, roads and trails will be further addressed under another part of the Travel Management Rule focused on establishing the minimum road system needed for managing the National Forest.
In the next chapter, the impact of increasingly changing conditions on past and present management of the Chequamegon-Nicolet National Forest will be addressed. These changes and future challenges may influence the direction of the Forest Plan, and how collaborating with partners outside Forest boundaries can help achieve management goals in this continually changing world.
Dav
e M
elan
con
Photo 67. A school group startles a goose during their walk on one of the Northern Great Lakes Visitor’s Center trails
Year 2009/2010 Monitoring and Midterm Evaluation Report 183
CHAPTER 4 FUTURE CHALLENGES AND PARTNERSHIPS
While change is inevitable and a constant, it appears that agencies responsible for managing natural resources are likely to operate in environments of greater variability and change than is typical today. This final chapter presents a sample of how the increasingly dynamic nature of natural resource management is influencing the Chequamegon-Nicolet National Forest’s management and collaboration with partners at larger scales.
It’s becoming evident that management approaches and paradigms been built on assumptions of stability and predictable change will have to be modified to address pressing resource management issues. Episodic weather events, insect and disease outbreaks, and changing socioeconomic conditions will likely be the norm instead of the exception. To respond effectively to these events, The Forest will need to consider partners that have a vested interest in those resources.
Because future challenges and threats potentially affecting the Chequamegon-Nicolet National Forest may also impact regional, State, tribal, county, and private forests and woodlands, the resources necessary to overcome these challenges will likely exceed the abilities of any single agency, tribe, organization, group, or owner. Coordination across all entities to consider the differing perspectives and financial constraints is essential to achieving sustainable forest management. By intentionally working in concert with others, the Chequamegon-Nicolet National Forest is contributing to a more collaborative natural resource management approach that maximizes benefits across the State of Wisconsin and the Western Great Lakes.
The Chequamegon-Nicolet National Forest staff continues to identify issues important to conserving forest resources, as well as a broad range of partners in addressing these issues. The following examples demonstrate some of the future challenges or issues the Forest has identified through partnership with the State of Wisconsin in the development of the Statewide Forest Assessment Project, and partners who are involved with formulating management strategies for these challenges.
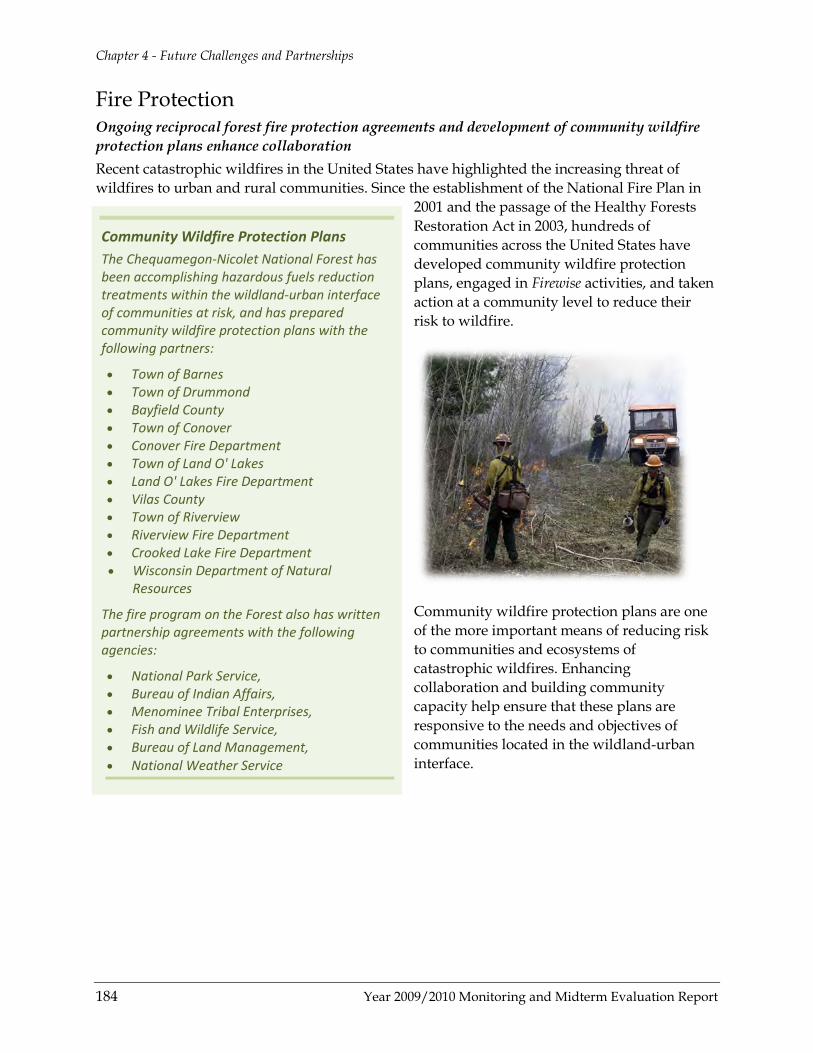
Chapter 4 - Future Challenges and Partnerships
184 Year 2009/2010 Monitoring and Midterm Evaluation Report
Fire Protection Ongoing reciprocal forest fire protection agreements and development of community wildfire protection plans enhance collaboration Recent catastrophic wildfires in the United States have highlighted the increasing threat of wildfires to urban and rural communities. Since the establishment of the National Fire Plan in
2001 and the passage of the Healthy Forests Restoration Act in 2003, hundreds of communities across the United States have developed community wildfire protection plans, engaged in Firewise activities, and taken action at a community level to reduce their risk to wildfire.
Community wildfire protection plans are one of the more important means of reducing risk to communities and ecosystems of catastrophic wildfires. Enhancing collaboration and building community capacity help ensure that these plans are responsive to the needs and objectives of communities located in the wildland-urban interface.
Community Wildfire Protection Plans The Chequamegon-Nicolet National Forest has been accomplishing hazardous fuels reduction treatments within the wildland-urban interface of communities at risk, and has prepared community wildfire protection plans with the following partners:
• Town of Barnes • Town of Drummond • Bayfield County • Town of Conover • Conover Fire Department • Town of Land O' Lakes • Land O' Lakes Fire Department • Vilas County • Town of Riverview • Riverview Fire Department • Crooked Lake Fire Department • Wisconsin Department of Natural
Resources
The fire program on the Forest also has written partnership agreements with the following agencies:
• National Park Service, • Bureau of Indian Affairs, • Menominee Tribal Enterprises, • Fish and Wildlife Service, • Bureau of Land Management, • National Weather Service
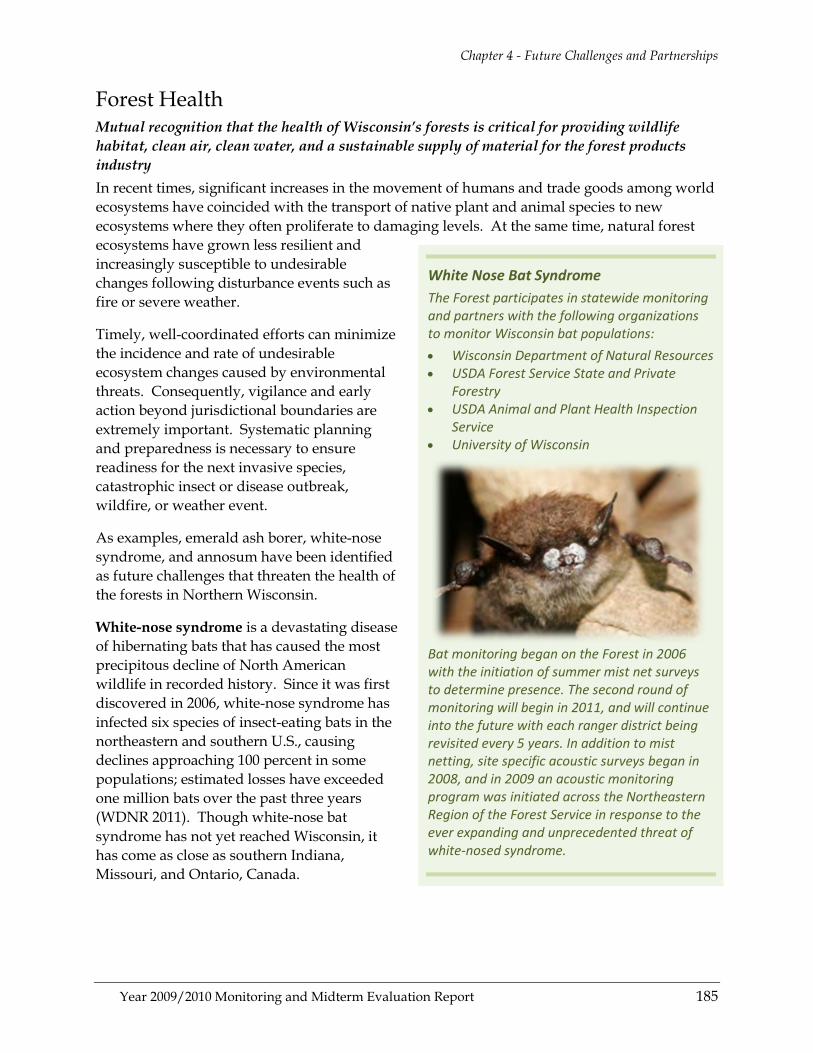
Chapter 4 - Future Challenges and Partnerships
Year 2009/2010 Monitoring and Midterm Evaluation Report 185
Forest Health Mutual recognition that the health of Wisconsin’s forests is critical for providing wildlife habitat, clean air, clean water, and a sustainable supply of material for the forest products industry In recent times, significant increases in the movement of humans and trade goods among world ecosystems have coincided with the transport of native plant and animal species to new ecosystems where they often proliferate to damaging levels. At the same time, natural forest ecosystems have grown less resilient and increasingly susceptible to undesirable changes following disturbance events such as fire or severe weather.
Timely, well-coordinated efforts can minimize the incidence and rate of undesirable ecosystem changes caused by environmental threats. Consequently, vigilance and early action beyond jurisdictional boundaries are extremely important. Systematic planning and preparedness is necessary to ensure readiness for the next invasive species, catastrophic insect or disease outbreak, wildfire, or weather event.
As examples, emerald ash borer, white-nose syndrome, and annosum have been identified as future challenges that threaten the health of the forests in Northern Wisconsin.
White-nose syndrome is a devastating disease of hibernating bats that has caused the most precipitous decline of North American wildlife in recorded history. Since it was first discovered in 2006, white-nose syndrome has infected six species of insect-eating bats in the northeastern and southern U.S., causing declines approaching 100 percent in some populations; estimated losses have exceeded one million bats over the past three years (WDNR 2011). Though white-nose bat syndrome has not yet reached Wisconsin, it has come as close as southern Indiana, Missouri, and Ontario, Canada.
White Nose Bat Syndrome The Forest participates in statewide monitoring and partners with the following organizations to monitor Wisconsin bat populations: • Wisconsin Department of Natural Resources • USDA Forest Service State and Private
Forestry • USDA Animal and Plant Health Inspection
Service • University of Wisconsin
Bat monitoring began on the Forest in 2006 with the initiation of summer mist net surveys to determine presence. The second round of monitoring will begin in 2011, and will continue into the future with each ranger district being revisited every 5 years. In addition to mist netting, site specific acoustic surveys began in 2008, and in 2009 an acoustic monitoring program was initiated across the Northeastern Region of the Forest Service in response to the ever expanding and unprecedented threat of white-nosed syndrome.
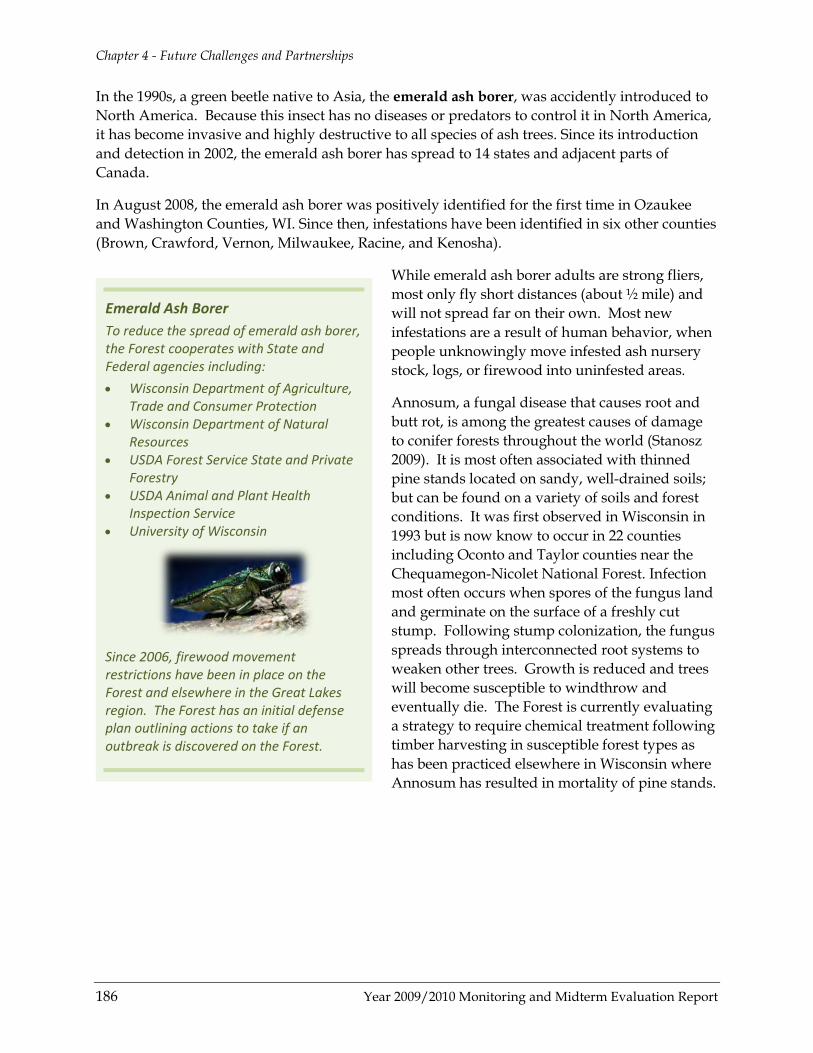
Chapter 4 - Future Challenges and Partnerships
186 Year 2009/2010 Monitoring and Midterm Evaluation Report
In the 1990s, a green beetle native to Asia, the emerald ash borer, was accidently introduced to North America. Because this insect has no diseases or predators to control it in North America, it has become invasive and highly destructive to all species of ash trees. Since its introduction and detection in 2002, the emerald ash borer has spread to 14 states and adjacent parts of Canada.
In August 2008, the emerald ash borer was positively identified for the first time in Ozaukee and Washington Counties, WI. Since then, infestations have been identified in six other counties (Brown, Crawford, Vernon, Milwaukee, Racine, and Kenosha).
While emerald ash borer adults are strong fliers, most only fly short distances (about ½ mile) and will not spread far on their own. Most new infestations are a result of human behavior, when people unknowingly move infested ash nursery stock, logs, or firewood into uninfested areas.
Annosum, a fungal disease that causes root and butt rot, is among the greatest causes of damage to conifer forests throughout the world (Stanosz 2009). It is most often associated with thinned pine stands located on sandy, well-drained soils; but can be found on a variety of soils and forest conditions. It was first observed in Wisconsin in 1993 but is now know to occur in 22 counties including Oconto and Taylor counties near the Chequamegon-Nicolet National Forest. Infection most often occurs when spores of the fungus land and germinate on the surface of a freshly cut stump. Following stump colonization, the fungus spreads through interconnected root systems to weaken other trees. Growth is reduced and trees will become susceptible to windthrow and eventually die. The Forest is currently evaluating a strategy to require chemical treatment following timber harvesting in susceptible forest types as has been practiced elsewhere in Wisconsin where Annosum has resulted in mortality of pine stands.
Emerald Ash Borer To reduce the spread of emerald ash borer, the Forest cooperates with State and Federal agencies including: • Wisconsin Department of Agriculture,
Trade and Consumer Protection • Wisconsin Department of Natural
Resources • USDA Forest Service State and Private
Forestry • USDA Animal and Plant Health
Inspection Service • University of Wisconsin
Since 2006, firewood movement restrictions have been in place on the Forest and elsewhere in the Great Lakes region. The Forest has an initial defense plan outlining actions to take if an outbreak is discovered on the Forest.
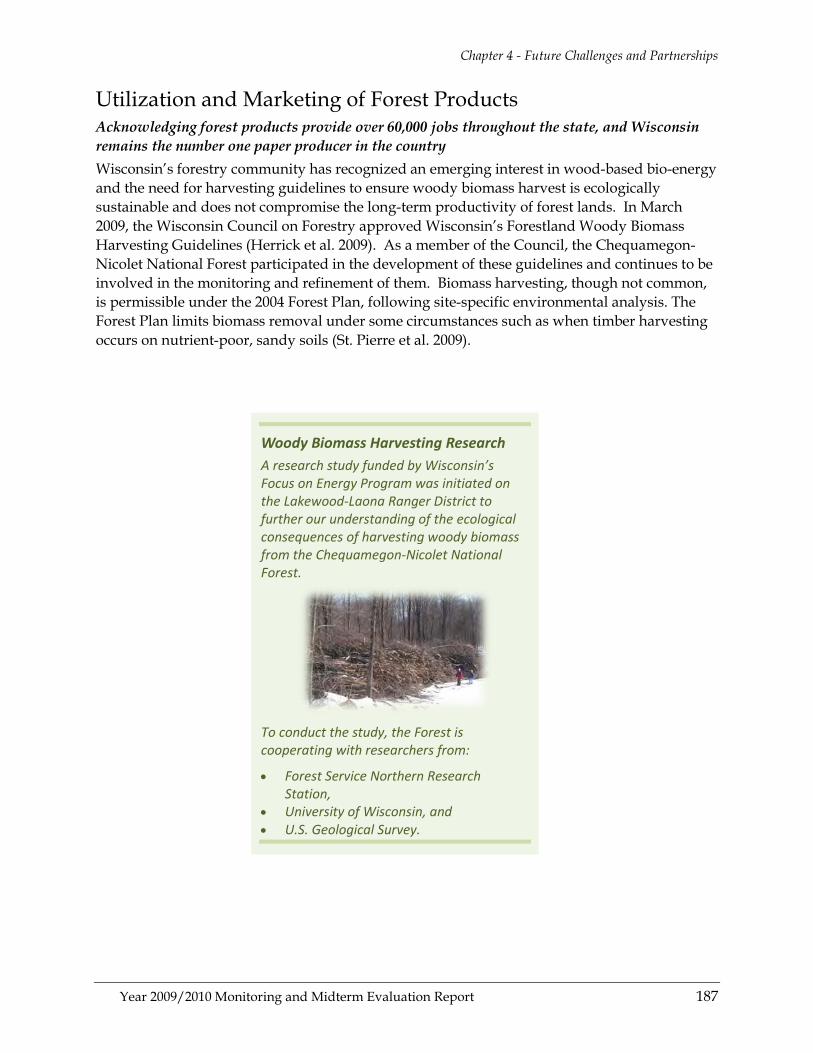
Chapter 4 - Future Challenges and Partnerships
Year 2009/2010 Monitoring and Midterm Evaluation Report 187
Utilization and Marketing of Forest Products Acknowledging forest products provide over 60,000 jobs throughout the state, and Wisconsin remains the number one paper producer in the country Wisconsin’s forestry community has recognized an emerging interest in wood-based bio-energy and the need for harvesting guidelines to ensure woody biomass harvest is ecologically sustainable and does not compromise the long-term productivity of forest lands. In March 2009, the Wisconsin Council on Forestry approved Wisconsin’s Forestland Woody Biomass Harvesting Guidelines (Herrick et al. 2009). As a member of the Council, the Chequamegon-Nicolet National Forest participated in the development of these guidelines and continues to be involved in the monitoring and refinement of them. Biomass harvesting, though not common, is permissible under the 2004 Forest Plan, following site-specific environmental analysis. The Forest Plan limits biomass removal under some circumstances such as when timber harvesting occurs on nutrient-poor, sandy soils (St. Pierre et al. 2009).
Woody Biomass Harvesting Research A research study funded by Wisconsin’s Focus on Energy Program was initiated on the Lakewood-Laona Ranger District to further our understanding of the ecological consequences of harvesting woody biomass from the Chequamegon-Nicolet National Forest.
To conduct the study, the Forest is cooperating with researchers from:
• Forest Service Northern Research Station,
• University of Wisconsin, and • U.S. Geological Survey.
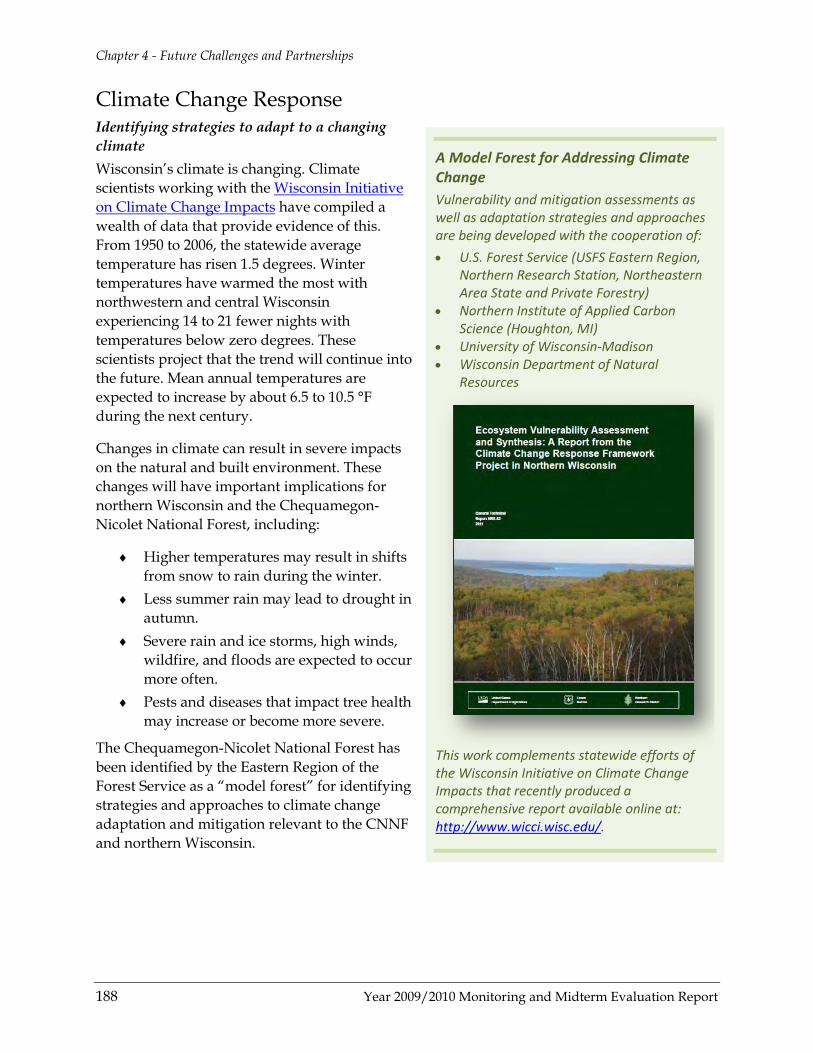
Chapter 4 - Future Challenges and Partnerships
188 Year 2009/2010 Monitoring and Midterm Evaluation Report
Climate Change Response Identifying strategies to adapt to a changing climate Wisconsin’s climate is changing. Climate scientists working with the Wisconsin Initiative on Climate Change Impacts have compiled a wealth of data that provide evidence of this. From 1950 to 2006, the statewide average temperature has risen 1.5 degrees. Winter temperatures have warmed the most with northwestern and central Wisconsin experiencing 14 to 21 fewer nights with temperatures below zero degrees. These scientists project that the trend will continue into the future. Mean annual temperatures are expected to increase by about 6.5 to 10.5 °F during the next century.
Changes in climate can result in severe impacts on the natural and built environment. These changes will have important implications for northern Wisconsin and the Chequamegon-Nicolet National Forest, including:
♦ Higher temperatures may result in shifts from snow to rain during the winter.
♦ Less summer rain may lead to drought in autumn.
♦ Severe rain and ice storms, high winds, wildfire, and floods are expected to occur more often.
♦ Pests and diseases that impact tree health may increase or become more severe.
The Chequamegon-Nicolet National Forest has been identified by the Eastern Region of the Forest Service as a “model forest” for identifying strategies and approaches to climate change adaptation and mitigation relevant to the CNNF and northern Wisconsin.
A Model Forest for Addressing Climate Change Vulnerability and mitigation assessments as well as adaptation strategies and approaches are being developed with the cooperation of: • U.S. Forest Service (USFS Eastern Region,
Northern Research Station, Northeastern Area State and Private Forestry)
• Northern Institute of Applied Carbon Science (Houghton, MI)
• University of Wisconsin-Madison • Wisconsin Department of Natural
Resources
This work complements statewide efforts of the Wisconsin Initiative on Climate Change Impacts that recently produced a comprehensive report available online at: http://www.wicci.wisc.edu/.

Year 2009/2010 Monitoring and Midterm Evaluation Report 189
LIST OF PREPARERS
Ann Dassow Forest Monitoring Coordinator (Project Leader)
Dan Eklund Forest Wildlife Biologist
Dale Higgins Forest Hydrologist
Dave Hoppe Forest Soil Scientist
Greg Knight Forest Minerals Program Manager
Catherine Pinegar Forest Lands Specialist/ Recreation Program Manager
Sue Reinecke Forest Fisheries Biologist
Walt Ruckheim Forest Timber Program Manager (Retired)
Tina Smith Forest Timber Resource Specialist
Mark Theisen Forest Silviculturist (Retired)
Dave Campbell Civil Engineering Technician
Matt St. Pierre Planning Wildlife Biologist
Mary Lucas Fire NEPA Specialist
Scott Anderson Lakewood-Laona Wildlife Biologist
Marjy Brzeskiewicz Botanist
Mary Rasmussen Tribal Liaison
Matt Bushman Washburn Botanist
Brian Herringa Washburn Wildlife Technician/ Forest Service Contact for WNS
William Johnson Forest Planner
Paul Strong Forest Supervisor
Deb Kidd Planning and Public Affairs Staff Officer
Linda Parker Forest Ecologist
Mark Bruhy Forest Archaeologist (Retired)
Ingrid Mendoza Forest Archaeologist
References
190 Year 2009/2010 Monitoring and Midterm Evaluation Report
REFERENCES
Alverson, W.S., D. M. Waller, S. Solheim. 1989. “Forests Too Deer: Edge Effects in Northern Wisconsin.” Conservation Biology 2(4): 348-358.
Blouch, R. I. 1984. “Northern Great Lakes states and Ontario forests.” In: White-tailed deer ecology and management, L.K. Halls (editor). Harrisburg, PA: Stackpole Books. 391-410
Boal, C.S., D.E. Andersen, and P.L. Kennedy. 2001. Home range and habitat use of northern goshawks (Accipiter gentilis) in Minnesota. St. Paul, Minnesota: Minnesota Cooperative Fish and Wildlife Research Unit. 50 p.
Boos, T., K. Kearns, C. LeClair, B. Panke, B. Scriver, and B. Williams. 2010. Field Guide to terrestrial Invasive Plants in Wisconsin. DNR PUB-FR 436-2010. Madison, WI: Wisconsin Department of Natural Resources.
Bruggeman, J.E., D.E. Andersen, and J.E. Woodford. 2009. Bioregional monitoring for northern goshawks in the Western Great Lakes. St. Paul, Minnesota: Minnesota Cooperative Fish and Wildlife Research Unit. 86 p.
Bushman, M. 2011. An analysis of the Washburn District FIREMON Data 2005-2010. Unpublished report, available from the Washburn Ranger District, Chequamegon-Nicolet National Forest. 39 p.
Cordell, H.K., J. C. Bergstrom and J.M. Bowker. 2005. The Multiple values of Wilderness. State College, PA: Venture Publishing.
Côte, S.D., T.R. Rooney, J. Tremblay, C. Dussault, and D.M. Waller. 2004. Ecological Impacts of Deer Overabundance. Annu. Rev. Ecol. Evol. Syst. 35:113–47.
David, P. 2010. Wisconsin Ceded Territory Manoomin Inventory Ver. 1.0. GLIFWC Project Report 2010-01; March, 2010. 287pp.
Eklund, D., L. Parker and J. Schmidt. 2008. Status of Kirtland Warbler Habitat on the CNNF; a summary. July 10, 2008. Unpublished report available from the Chequamegon-Nicolet National Forest. Rhinelander, WI. 14 p.
Eckstein, R., Dahl, G., Easterly, S., Ishmael, B., Nelson, J., Manthey, P., Meyer, M., Tesky, L., Goltz, D., Glenzinski, B. 2009. Wisconsin Bald Eagle and Osprey Surveys; 2009. Wisconsin Department of Natural Resources. 8 p. Available online at: http://dnr.wi.gov/org/land/wildlife/harvest/reports/eagleospreysurv.pdf (last accessed: 2010-AUG-19).
Erba, A.E. Acting Forest Supervisor letter to District Rangers. Woody Biomass Harvesting Guidelines; File Code: 2430-5/2400. May 21, 2010. Chequamegon-Nicolet National Forest. Rhinelander, WI. 2 p.
References
Year 2009/2010 Monitoring and Midterm Evaluation Report 191
Gilbert, J.H., B.W. Williams, P.A. Zollner and D. Eklund. 2005. Use of a Non-Invasive Survey Technique and DNA to Determine Marten Distribution in Wisconsin, 2005: DRAFT. 15 p.
Jacobs, J.P. and E.A Jacobs. 2002. Conservation Assessment for Red-shouldered Hawk (Buteo lineatus) National Forests of North Central States. U.S. Forest Service. 100 p.
Herrick, S.K., J.A. Kovach, E.A. Padley, C.R. Wagner and D.E. Zastrow. 2009. Wisconsin’s forestland woody biomass harvesting guidelines. PUB-FR-435-2009. WI DNR Division of Forestry and Wisconsin Council on Forestry; Madison, WI. 51 p.
Kennedy, P.L. and D.E. Andersen. 2006. Research and Monitoring Plan for the northern goshwaks (Accipter gentilis atricapillus) in the Western Great Lakes Region. Minnesota Cooperative Fish and Wildlife Research Unit St. Paul, Minnesota. 83 p.
McCaffery, K.R. 2000a. Deer baiting and feeding issue. Adapted from paper to Midwest and Northeast deer groups. Meeting at Hillman, MI. 21-AUG-2000. Unpublished report available from the Chequamegon-Nicolet National Forest. Rhinelander, WI. 5 p.
McCaffery, K.R. 2000b. Estimating deer carrying capacity and impacts. Aspen Summit, Ottawa National Forest. 05-APR-2000. Unpublished report available at the Rhinelander WI office of the CNNF. 6 p.
NatureServe. 2010. NatureServe Explorer: An online encyclopedia of life [web application]. Version 7.1. NatureServe, Arlington, Virginia. Taxus canadensis. Available online at: http://www.natureserve.org/explorer. (Accessed: September 27, 2011 )
Napper, C.; Howes, S.; Page-Dumroese, D. 2009. Soil-disturbance field guide.0819 1815-SDTDC. San Dimas, CA: San Dimas Technology Center
Nowakci, G. D. Shadis, L. Parker, D. Burbank, C. Kern, S. Lientz, and J. Pontius (Joint R9-NRS RNA Steering Committee). 2008. The evaluation and ranking of candidate Research Natural Areas in the Eastern Region. 38 p.
Olson, C. and A.F. Cholewa. 2009. A guide to nonnative invasive plants inventoried in the north by Forest Inventory and Analysis. GTR NRS-52. US Forest Service Northern Research Station. 194 p.
Page-Dumroese, D.; Abbott, A.M., Rice; T.M. 2009a. Forest soil disturbance monitoring protocol, volume 1 – rapid assessment. FS-WO-82a. Moscow, ID: USDA, FS, Rocky Mountain Research Station, 29 p.
Page-Dumroese, D.; Abbott, A.M.; Rice, T.M. 2009b. Forest soil disturbance monitoring protocol, volume 2 – supplementary methods, statistics, and data collection. FS-WO-82b. Moscow, ID: USDA Forest Service Rocky Mountain Research Station, 64 p.
Patton-Mallory, M. [ed.] 2008. Forest Service, U.S. Department of Agriculture woody biomass utilization strategy. FS-899. Washington D.C.; U.S. Department of Agriculture, Forest Service. 17 p.
References
192 Year 2009/2010 Monitoring and Midterm Evaluation Report
Perry, Charles H. (Hobie); Everson, Vern A.; Brown, Ian K.; Cummings-Carlson, Jane; Dahir, Sally E.; Jepsen, Edward A.; Kovach, Joe; Labissoniere, Michael D.; Mace, Terry R.; Padley, Eunice A.; Rideout, Richard B.; Butler, Brett J.; Crocker, Susan J.; Liknes, Greg C.; Morin, Randall S.; Nelson, Mark D.; Wilson, Barry T. (Ty); Woodall, Christopher W. 2008. Wisconsin’s forests, 2004. Resour. Bull. NRS-23. Newtown Square, PA: USDAForest Service, Northern Research Station. 104 p.
Peterson, D.R. 2005. The cost of extracting logging residues for biomass fuels; Great Lakes region. Unpublished report. Renewable Resource Solutions, LLC. 17 p.
Posner, S. and L. Hildebrandt. 2006. Variations in Vegetation Composition and Cover Related to Prescribed Burning In the Moquah Barrens. USDA. Forest Service. 20 p.
Quinn, B. and V. Lopez. 2006. An assessment of mature northern hardwood interior forest on the Chequamegon-Nicolet National Forest. USDA Forest Service. Unpublished report. 24 p.
Quinn, B. and V. Lopez. 2006a. An assessment of mature, natural red & white pine management indicator habitat on the Chequamegon-Nicolet National Forest. Unpublished report available from the Chequamegon-Nicolet National Forest, Park Falls, WI. 11 p.
Quinn, B., D. Eklund, M. St. Pierre & J. Schmidt. 2006. Aspen and deer trends on the Chequamegon-Nicolet National Forest (including overall trends in northern Wisconsin). Unpublished report available from the Chequamegon-Nicolet National Forest, Park Falls, WI. 29 p.
Quinn, B. and J. Schmidt. 2007. An assessment of regenerating aspen management indicator habitat on the Chequamegon-Nicolet National Forest. Unpublished report available from the Chequamegon-Nicolet National Forest, Park Falls, WI. 14 p.
Rinaldi, T. and M. Worland. 2004. Conservation assessment for Swainson’s thrush (Catharus ustulatus). Milwaukee, WI: USDA Forest Service, Eastern Region. 43 p. Available online at: http://www.fs.fed.us/r9/wildlife/tes/ca-overview/index.htm.
Robbins, S.D. 1991. Wisconsin Birdlife: Population & Distribution Past and Present. The University of Wisconsin Press. 702 p.
Rolley, R.E. 2009. White-tailed deer population status, 2009. Wisconsin Department of Natural Resources. Unpublished report. 7 p. Available online at: http://dnr.wi.gov/org/land/wildlife/harvest/reports/wtaildeerpop.pdf [last accessed 9/27/2011]
Rooney T.P. 2001. Deer impacts on forest ecosystems: a North American perspective. Forestry v. 74(3): 201-208.
Saunders, D.A, R.J. Hobbs, and C.R. Margules. 1991. Biological consequences of ecosystem fragmentation: a review. Conservation Biology: the journal of the Society for Conservation Biology. Mar 1991. v. 5 (1) p. 18-32
References
Year 2009/2010 Monitoring and Midterm Evaluation Report 193
Stanosz, G. 2009. Protect conifer health by preventing Heterobasidion root disease. Unpublished report. Departments of Plant Pathology and Forest and Wildlife Ecology, University of Wisconsin-Madison. 1 p.
St. Pierre, M., M. Theisen, D. Hoppe, W. Johnson, W. Ruckheim and D. Eklund. 2009. Comparison of the 2008 Wisconsin Forestry Biomass Harvesting Guidelines and Chequamegon-Nicolet National Forest Management Practices. June 19, 2009. 5 p.
USDA Forest Service. 2004. Chequamegon-Nicolet Land and Resource Management Plan. Chequamegon-Nicolet National Forest. Milwaukee, WI.
USDA Forest Service. 2004a. Final Environmental Impact Statement to Accompany the 2004 Land and Resource Management Plan. Chequamegon-Nicolet National Forest. Milwaukee, WI.
USDA Forest Service. 2004b. Chequamegon-Nicolet Land and Resource Management Plan. Chequamegon-Nicolet National Forest. Milwaukee, WI.
USDA Forest Service. 2004c. Record of Decision for the Final Environmental Impact Statement to Accompany the 2004 Land and Resource Management Plan. Chequamegon-Nicolet National Forest. Milwaukee, WI.
USDA Forest Service. 2008. Order of the Forest Supervisor occupancy and use restrictions for the Chequamegon-Nicolet National Forest. Order No. R913-08-02. 11 p.
USDA Forest Service. 2009. Riley Lake Wildlife Habitat Management Environmental Assessment. Chequamegon-Nicolet National Forest. Rhinelander, WI.
USDA Forest Service. 2010. Environmental Assessment for the Kirtland’s Warbler Habitat Improvement Project. Chequamegon-Nicolet National Forest. Rhinelander, WI. 52 p.
USDI Fish and Wildlife Service. 1983. Northern States Bald Eagle Recovery Plan. Denver, CO. 131 p. Available online at: http://www.fws.gov/midwest/eagle/recovery/be_n_recplan.pdf
USDI Fish and Wildlife Service. 1991. Fassett’s Locoweed Recovery Plan. Twin Cities, MN. 51 p. Available online at: http://ecos.fws.gov/docs/recovery_plans/1991/910329.pdf
USDI Fish and Wildlife Service. 1992. Recovery Plan for the Eastern Timber Wolf. Twin Cities, MN. 73 p.
USDI Fish and Wildlife Service. 2000. Correspondence to Ms. Kathleen A. McAllister, U.S. Forest Service regarding transmitting a Biological Opinion to the U.S. Forest Service and Bureau of Land Management regarding the effects of agency Land and Resource Management Plans on the Canada Lynx (Lynx canadensis). 81 p.
USDI Fish and Wildlife Service 2010. “Kirtland's warbler annual singing male census.” Available online at:

References
194 Year 2009/2010 Monitoring and Midterm Evaluation Report
http://www.fws.gov/midwest/endangered/birds/Kirtland/Kwpop.html [last accessed 2011-SEPT-27.]
Williams, B.W., J.H. Gilbert, and P.A. Zollner. 2007. Historical Perspective on the Reintroduction of the Fisher and American Marten in Wisconsin and Michigan. US Forest Service Northern Research Station. GTR NRS-5. 33 p.
WDNR (Wisconsin Department of Natural Resources). 1986. Wisconsin Department of Natural Resources Bald Eagle Recovery Plan. WDNR Bureau of Endangered Resources, Madison, WI. 44 p.
WDNR (Wisconsin Department of Natural Resources). 1999. 1999 Wisconsin Wolf Management Plan. Publ-ER-099. Madison, WI. 75 p. Online at: http://dnr.wi.gov/org/land/er/publications/wolfplan/toc.htm
WDNR. 2006. Pine Marten Fact Sheet. Online at: http://www.dnr.state.wi.us/org/land/er/biodiversity/index.asp?mode=info&Grp=17&SpecCode=AMAJF01010
WDNR. 2010b. Wisconsin Bald Eagle and Osprey Surveys, 2010. Available online at: http://dnr.wi.gov/org/land/wildlife/harvest/reports/eagleospreysurv2.pdf [last accessed 2011-SEPT-27.]
WDNR. 2010a. “Endangered Resources Program Species Information; Trumpeter Swan (Cygnus buccinator).” Available online at: http://dnr.wi.gov/org/land/er/biodiversity/index.asp?mode=info&Grp=7&SpecCode=ABNJB02030 (last accessed: 2010-AUG-19).
WDNR. 2011. “Saving Wisconsin’s Bats.” Wisconsin Department of Natural Resources, Endangered Resources Web Page. Available online at: http://dnr.wi.gov/org/land/er/bats/ [last accessed: 2011-JUN-23].
Woodford, J., B. Kohn, K. Russell, C. Thomas, T. White and A. Wydeven. 2005. Summary report: Inventory, status, and management needs of American Marten in Wisconsin. Rhinelander, WI: Wisconsin DNR, Bureau of Endangered Resources, Ecological Inventory and Monitoring Section, 10 p.
Woodford, J.E., C.A. Elorant, and A. Rinaldi. 2008. “Nest density, productivity, and habitat selection of red-shouldered hawks in a contiguous forest.” J. Raptor Res. 42(2):79–86
Wydeven, A.P. and J.E. Wiedenhoeft. 2009. “Gray Wolf Population, 2008-2009.” Unpublished report. 20 p. Available online at: http://dnr.wi.gov/org/land/wildlife/harvest/reports/09graywolfpop.pdf [last accessed 2011-SEPT-27.]