Charter School Quality and Parental Decision Making With School Choice
45
NBER WORKING PAPER SERIES CHARTER SCHOOL QUALITY AND PARENTAL DECISION MAKING WITH SCHOOL CHOICE Eric A. Hanushek John F. Kain Steven G. Rivkin Gregory F. Branch Working Paper 11252 http://www.nber.org/papers/w11252 NATIONAL BUREAU OF ECONOMIC RESEARCH 1050 Massachusetts Avenue Cambridge, MA 02138 March 2005 The views expressed herein are those of the author(s) and do not necessarily reflect the views of the National Bureau of Economic Research. ©2005 by Eric A. Hanushek, John F. Kain, Steven G. Rivkin, and Gregory F. Branch. All rights reserved. Short sections of text, not to exceed two paragraphs, may be quoted without explicit permission provided that full credit, including © notice, is given to the source.
Transcript of Charter School Quality and Parental Decision Making With School Choice

NBER WORKING PAPER SERIES
CHARTER SCHOOL QUALITY AND PARENTALDECISION MAKING WITH SCHOOL CHOICE
Eric A. HanushekJohn F. Kain
Steven G. RivkinGregory F. Branch
Working Paper 11252http://www.nber.org/papers/w11252
NATIONAL BUREAU OF ECONOMIC RESEARCH1050 Massachusetts Avenue
Cambridge, MA 02138March 2005
The views expressed herein are those of the author(s) and do not necessarily reflect the views of the NationalBureau of Economic Research.
©2005 by Eric A. Hanushek, John F. Kain, Steven G. Rivkin, and Gregory F. Branch. All rights reserved.Short sections of text, not to exceed two paragraphs, may be quoted without explicit permission providedthat full credit, including © notice, is given to the source.

Charter School Quality and Parental Decision Making with School ChoiceEric A. Hanushek, John F. Kain, Steven G. Rivkin, and Gregory F. BranchNBER Working Paper No. 11252March 2005JEL No. I2, H4, D1
ABSTRACT
Charter schools have become a very popular instrument for reforming public schools, because they
expand choices, facilitate local innovation, and provide incentives for the regular public schools
while remaining under public control. Despite their conceptual appeal, evaluating their performance
has been hindered by the selective nature of their student populations. This paper investigates the
quality of charter schools in Texas in terms of mathematics and reading achievement and finds that,
after an initial start-up period, average school quality in the charter sector is not significantly
different from that in regular public schools. Perhaps most important, the parental decision to exit
a charter school is much more sensitive to education quality than the decision to exit a regular public
school, consistent with the notion that the introduction of charter schools substantially reduces the
transactions costs of switching schools. Low income charter school families are, however, less
sensitive to school quality than higher income families.
Eric A. HanushekHoover InstitutionStanford UniversityStanford, CA 94305-6010and [email protected]
John F. KainSchool of Social SciencesUniversity of Texas at DallasRichardson, TX 75083
Steven G. RivkinAmherst CollegeDepartment of EconomicsP.O. Box 5000Amherst, MA 01002-5000and [email protected]
Gregory F. BranchTexas Schools ProjectUniversity of Texas at DallasRichardson, TX [email protected]

Charter School Quality and Parental Decision Making with School Choice
by Eric A. Hanushek, John F. Kain, Steven G. Rivkin, and Gregory F. Branch* Charter schools have been championed as the politically feasible form of school choice
that offers most of the advantages of voucher schools without sacrificing the benefits of
government oversight. The freedom from many of the constraints under which regular public
schools operate allows for a diversity of educational approaches and increased competition within
the public sector. In just ten years of development, they are found in over three-fourths of the
states and their enrollment reaches four percent of the public school population in some states.
Nonetheless, even though charter schools have captured the imagination of many school
reformers and the ire of others, little credible evidence about their impact on student achievement
is available.1 This comes about primarily because of the difficulty separating differences in the
quality of charter and regular public schools from differences in the students who attend schools
in the respective sectors.
This paper uses very rich panel data for the state of Texas to overcome impediments to
the evaluation of charter school performance and to investigate the quality of charter schools
relative to traditional public schools. Additionally, it provides a first glimpse at how the
availability of charter schools affects the ways in which parents respond to school quality
differences. By eliminating the need to move residences in order to switch schools, charter
* Stanford University, National Bureau of Economic Research, and University of Texas at Dallas;
University of Texas at Dallas (deceased); Amherst College and University of Texas at Dallas; and University of Texas at Dallas, respectively. We mourn the loss of John Kain who did not see the completion of this project. Macke Raymond and numerous conference participants provided useful comments. The analysis in this paper has been supported by grants from the Smith Richardson Foundation and the Packard Humanities Institute. We would like to thank Aurora Swanson for excellent research assistance.
1 Evidence of the intensity of the debate was clear inn late 2004 when a controversy was ignited by the publication of an analysis by the American Federation of Teachers (Nelson, Rosenberg, and Van Meter (2004)) and its wide media coverage. This drew both public and professional reactions (see Hoxby (2004)).

schools would be expected to lead to an increase the sensitivity of parents to school quality and
amplify the competitive pressure on public schools.
Although the exact character differs by state, charter schools are hybrids of public and
private institutions that allow independent development and decision-making in publicly financed
schools that operate under the auspices of some form of public oversight. Charter schools are
funded by state and local governments but are exempted from many of the state and local
regulations that school reformers have argued stifle innovation and reduce the effectiveness of
public schools (Nathan (1996)). To achieve this status, the charter must develop an acceptable
educational plan (their charter) and must attract sufficient students to be economically viable.
Although appealing as an institutional device to encourage innovation, charter schools are
frequently started by people with relatively little experience at either developing new enterprises
or running schools.2 By any standard, running effective schools is complex. Thus, the public
policy issue is how these opposing forces – enthusiasm, freedom, and innovation versus
inexperience and complexity – net out in terms of student achievement.
Since the nation’s first charter school legislation was enacted into law in Minnesota in
1991, some 41 states and the District of Columbia have enacted legislation that provides for
charter schools, although some had yet to open any schools by 2004.3 For the nation as a whole,
charter schools increased from a handful in 1991 to over 3,000 schools serving an estimated
700,000 students or approximately 1.5 percent of the public school population in 2004.
Much of the existing research and discussion of charter schools focuses on their growth
and characteristics of students enrolling in them (e.g., see U.S. Department of Education (1999),
Finn, Manno, and Vanourek (2000)). There is also a small but growing body of evidence on
2 For a description of charter schools including both the legislation surrounding them and the heterogeneity of the sector, see Finn, Manno, and Vanourek (2000). 3 Current data about charters is fragmentary and must be pieced together from various private sources. See U.S. Charter Schools (http://www.uscharterschools.org); Center for Education Reform (http://www.edreform.com/).
2

charter school quality as measured by student performance.4 Recent work on North Carolina and
Florida schools follow the approach used in this paper, but with mixed results. The average
North Carolina charter appears less effective than the average traditional public school (Bifulco
and Ladd (2004)), while the average Florida charter is on par with the regular public schools after
a start-up phase (Sass (2005)). On the other hand, relying upon comparisons between charter
applicants in Chicago that were randomly accepted or randomly denied admission, Hoxby and
Rockoff (2004) conclude that these charter schools significantly outperformed their regular
school counterparts. Texas open enrollment charter schools have been evaluated annually under
state contract (see Texas Center for Educational Research (2003)) and by private researchers
(Gronberg and Jansen (2001), Booker et al. (2004)). The latter analyses conclude that Texas
charters do better than traditional schools, but the analysis depends on a series of analytical
adjustments of performance measures.
Our analysis of Texas schools begins by showing that, although charter schools have
difficult start-up periods, they settle down within two or three years and are as effective as
traditional public schools on average in terms of value added to reading and mathematics
achievement. The most novel, and potentially most important aspect of our analysis from a
policy perspective, relates to parental decision making. Even though parents undoubtedly have a
variety of motivations for choosing individual charter schools, most are likely to be sensitive to
the narrow question of quality in basic skills. The results show that the probability of exiting a
charter school declines with school quality, although the relationship is weaker for lower income
students. The quality responsiveness of families satisfies a necessary condition for the education
market to favor higher quality charter schools over time, but the full market dynamics also
depend on the character of entry into charters – something that we cannot investigate here.
4 In between the descriptive studies of charter schools and their populations and the evaluations of student performance, Hoxby (2001, (2002) examines the impact on charter schools on teacher hiring.
3

The next section describes the charter school market in Texas. Section III develops the
analytical approach used to evaluate charter school performance, focusing on the problems
caused by the endogeneity of school choice. The subsequent section presents the findings on
average quality differences between charter and regular public schools, which leads into an
analysis of how parents react to the heterogeneity of quality. In the following section, we analyze
the degree to which exit rates out of charter schools are sensitive to school quality and compare
these to quality-exit rate patterns of regular public schools. The final section summarizes the
results and policy implications and describes potential extensions for future work.
I. The Texas Charter School Program
Texas – the focus of analysis here – is one of the most active charter school states. Since
enacting charter school legislation in 1995, the Texas charter sector has grown into one of the
largest – ranking fourth among the states in both number of charter schools and number of
students in 2004. Because Texas offers a large and diverse set of charter schools, it can provide
insights about the potential implications for states that have not been as aggressive in pursuing
this reform strategy.
The Texas Education Code established three types of charter schools: home rule school
districts, campus or program charters, and open enrollment schools. Open enrollment schools
receive their charters directly from the state, while campus and program charters are creatures of
individual districts and are chartered by them. The largest number falls under the open
enrollment charters governed by the State Board of Education. The Texas legislature placed
limits on the number of charter schools that could be operated under the open enrollment
program, and this limit has been raised since the introduction of the program in 1995. In 2002, the
limit on open-enrollment charters was raised to 215 but a previously uncapped category for
schools serving 75 percent or more at-risk students was folded into the total.5
5 Charter schools can also have multiple campuses. In 2002, 83 percent operated a single campus but the
4

Prior to 1997 there were only a handful of charter schools in Texas, but since then the
number of charter schools has increased dramatically. Table 1 shows that the percentage of 4th
through 7th grade public school students attending charter schools rises from 0.03 percent in 1997
to almost one percent in 2002.6 Though still only a small fraction of the entire student body, this
growth rate shows both an interest in alternative schools and the consequent supply response.
Continued growth at this rate would make charter schools an increasingly important component
of Texas public schools.
Participation in charter schools varies substantially by ethnicity and to a lesser extent by
family income. As seen in Table 2, blacks have consistently been far more likely to attend charter
schools than any other ethnic group. Whites, on the other hand, are much less likely to attend
charter schools, although they also have had growth in attendance rates during this period.
Interestingly, the differences among ethnic groups are far larger than the differences by family
income despite the fact that the initial charter legislation favored schools for disadvantaged
populations. (Note, however, that the crude measure of income captured by eligibility for
subsidized lunch may conceal important differences by family economic circumstances).
Not surprisingly, the growth in charter school attendance resulted in large part from a
rapid increase in the number of charter schools. Table 3 shows that the number of charter schools
in their first year of operation rose from less than 20 in 1997 to over 200 in 2001 and 2002. The
vast majority of these new schools are chartered by the state, and the number of state charters
now dwarfs the number of district charters, a reverse of the situation in the mid 1990s. This
change reflects new state legislation that opened up the number of schools that could be
chartered. For our purposes, the dramatic growth means that our observations are heavily
remainder had multiple campuses (Texas Center for Educational Research (2003)). 6 The description of Texas charter schools and the comparisons to regular public schools here relies upon calculations from the UTD Texas Schools Microdata Panel, described below and used in the estimation. Our analytical sample differs from various published charter data because of restrictions on observed student data.
5

Table 1. Percentage of Texas Public School Students in Grades 4-7 Attending Charter Schools: 1997-2002
Charter School Attendance 1997 1998 1999 2000 2001 2002
Percentage attending charter schools 4th Grade <0.01% 0.01% 0.19% 0.42% 0.60% 0.77% 5th Grade <0.01% 0.03% 0.21% 0.47% 0.56% 0.79% 6th Grade 0.04% 0.09% 0.35% 0.55% 0.78% 0.92% 7th Grade 0.07% 0.10% 0.31% 0.51% 0.66% 0.91% All Grades 0.03% 0.6% 0.26% 0.49% 0.65% 0.85%
Enrollment in charter schools
4th Grade 20 33 568 1,257 1,696 2,168 5th Grade 10 81 603 1,401 1,573 2,265 6th Grade 104 268 1,027 1,671 2,245 2,711 7th Grade 213 324 922 1,559 1,937 2,697
All Grades 347 706 3,120 5,888 7,451 9,841
Table 2. Charter School Attendance by Race/Ethnicity and
Income in Texas Public Elementary Schools Grades 4-7, 1997-2002
1997 1998 1999 2000 2001 2002
Race/Ethnicity Asians 0.02% 0.12% 0.23% 0.40% 0.51% 0.66% Blacks 0.06% 0.09% 0.45% 1.06% 1.57% 2.14%
Hispanics 0.04% 0.07% 0.30% 0.48% 0.66% 0.80% Whites 0.01% 0.04% 0.16% 0.28% 0.34% 0.46%
Incomea
Low Income 0.03% 0.05% 0.28% 0.52% 0.73% 0.95% Not Low Income 0.03% 0.07% 0.25% 0.46% 0.58% 0.74%
a. Students eligible for a subsidized lunch are classified as low income.
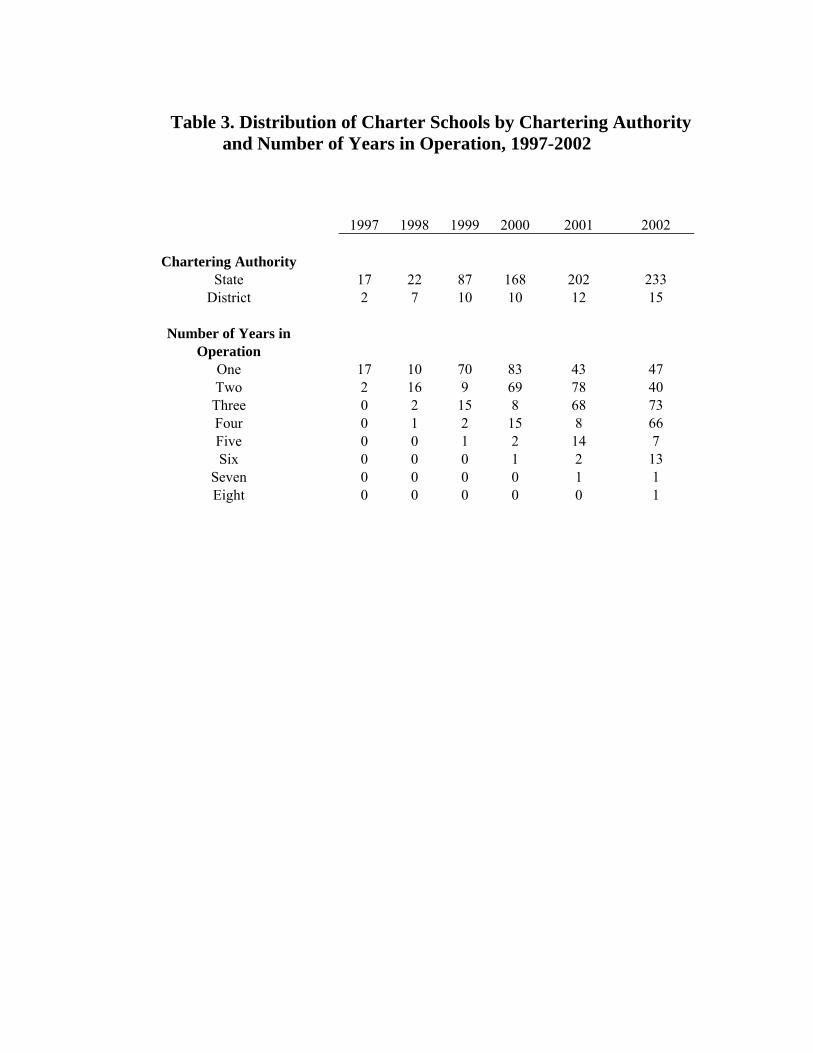
Table 3. Distribution of Charter Schools by Chartering Authority
and Number of Years in Operation, 1997-2002
1997 1998 1999 2000 2001 2002
Chartering Authority State 17 22 87 168 202 233
District 2 7 10 10 12 15
Number of Years in Operation
One 17 10 70 83 43 47 Two 2 16 9 69 78 40 Three 0 2 15 8 68 73 Four 0 1 2 15 8 66 Five 0 0 1 2 14 7 Six 0 0 0 1 2 13
Seven 0 0 0 0 1 1 Eight 0 0 0 0 0 1

weighted toward recently opened charter schools. Over 50 percent of our annual observations
record performance during the first year two years of school operations.
A substantial decline in average enrollment accompanied the expansion of charter
schools, particularly following 1998 (see Appendix Table A1). The median number of students
per grade in grades 6 and 7 fell by more than 50 percent, leaving roughly 14-18 students in each
grade.
Charters, like all Texas schools, experience considerable student turnover. Table 4
compares the percentages of students leaving a charter school with those leaving a regular public
school (given that the schools had the subsequent grade available). Not surprisingly, exit rates
are greater for charters than for the regular public schools, although a portion of this appears to be
compositional. The charters have a disproportionate black population, and, independent of the
type of school, blacks tend to move much more frequently than other race and ethnic groups
(Hanushek, Kain, and Rivkin (2004)). Nonetheless, students attending charter schools show
mobility rates substantially above students in regular public schools.
The charter school exit rates show a slight peak in the fifth and sixth grade, suggesting
that some transitions might also relate to the structure of the regular public schools and the ability
to re-enter at logical points (i.e., middle school transitions). Although we calculate exit rates just
for schools that offer the next grade, charter schools still do not in general cover the complete age
spectrum – often necessitating a subsequent a return to a traditional public elementary school or a
private alternative.
Regardless of ethnicity, however, charter school students are also much more likely to
exit Texas public schools than are regular public school students. This summary statistic
underscores the necessity of fully accounting for individual differences, because the group that
would select charter schools also appears more likely to attend private schools.7
7 We do not observe where a student goes following an exit from the Texas public schools. While we can observe mobility across all public schools in the state, including charters, we have no way of tracking
6

Table 4. Charter and Regular Public School Annual Exit Rates by Destination, Grade, Income and Ethnicity (exit rates calculated only for schools that offer the next grade)
% charter school students
exiting to: % regular public school students
exiting to:
Destination Charter Regular Out of Texas public schools Charter Regular Out of Texas
public schools All students 1.9% 21.1% 18.3% 0.1% 12.1% 7.0% Grade 4th to 5th grade 2.1% 22.2% 22.8% 0.1% 12.9% 7.2% 5th to 6th grade 1.8% 22.4% 19.27% 0.1% 12.5% 6.6% 6th to 7th grade 1.9% 19.8% 15.9% 0.1% 10.8% 7.0% Income Disadvantaged 1.8% 20.8% 20.1% 0.2% 14.7% 8.4% Not Disadvantaged 2.1% 21.3% 16.5% 0.1% 9.7% 5.7% Ethnicity Black 2.9% 27.4% 22.9% 0.3% 17.6% 8.6% Hispanic 1.5% 16.8% 14.4% 0.1% 12.2% 7.0% White 1.5% 21.2% 16.0% 0.1% 10.4% 6.4%

This summary view of the evolution of charter schools highlights two features that must
enter into the analysis of performance. First, because mobility is high, explicit consideration of
the effects of moving is necessary. Our prior work (Hanushek, Kain, and Rivkin (2004)) that
investigated mobility in regular public schools found that performance is likely to suffer in the
year of the move.8 But, more importantly for this analysis, student turnover appears to harm all
students in a school regardless of whether or not they themselves move. Charter schools, many of
which are start-ups, clearly face challenges of this nature. Second, as highlighted by the pattern
of exits out of the Texas public school system, charter school students do not follow the same
paths as regular public school students, suggesting that they may differ from regular school
students in potentially important ways.
Many questions have also been raised about what choice might do for the composition of
schools and particularly the peer groups. Much of the early discussion, perhaps extrapolating
from the experiences in elite private schools, suggested that choice would lead to more racial and
economic segregation in schools. Past history, however, suggests that private enrollment need not
increase overall segregation (e.g., Coleman, Hoffer, and Kilgore (1982); Howell and Peterson
(2002)), and charter school effects almost certainly depend on program details.
The charter school experiences in Texas show interesting and diverse patterns of
enrollment. Table 5 indicates that the percentage black increases by 14.4 percentage points for
black students entering charter schools. In other words, blacks entering charter schools go into
more segregated surroundings. At the same time the average black entering a charter school has
10.3 percentage points fewer Hispanic classmates. Hispanics also enter charters with more blacks
(0.9 percent) and 5.4 percent fewer Hispanics. For whites, the proportion of both blacks and
movement to private schools or out of the state. We interpret the larger exit rates from Texas public schools as arising from private school attendance, because we see no reason why mobility out of state would be significantly related to attending charter schools. 8 The exact cause of this achievement loss is difficult to ascertain. Many moves are associated with other family disruptions – divorce, job loss, and the like – and it is not possible to partition the losses between school adjustment factors and nonschool factors; see Hanushek, Kain, and Rivkin (2004).
7

Table 5. Change in Racial and Ethnic Composition by Ethnicity and Type of School Transition
Change in Percentage Black when: Change in Percentage Hispanic when: Enters Charter Remains in a Enters Charter Remains in a School Regular Public School Regular Public
Blacks 14.4% -1.5% -10.3% 1.0% Hispanics 0.9% 0.3% -5.4% -0.8%
Whites -2.3% 0.3% -10.0% 0.5%

Hispanics falls upon charter entry (2.3 and 10 percent, respectively). Thus, it appears that Texas
charters have led to some additional racial and ethnic concentration, but it does so importantly
because of increased choice by black students. Our previous work on racial composition found
that higher black enrollment reduced achievement for blacks (Hanushek, Kain, and Rivkin
(2002b)), but in this case, where the charters frequently offer specialized programs, it seems
entirely possible that the racial composition effects found for regular public schools do not apply.
II. An Empirical Model of Charter School Effects
The key estimation issues center on separating charter school effects from simple student
selection. We begin with a discussion of related analyses of private school effects, a research line
that must address virtually the same methodological issues as those in the study of charter
schools, prior to describing the fixed effect approach used in the analysis.
a. Research on Private School Quality
Starting with the work by Coleman, Hoffer, and Kilgore (1982), the debate over research
on public/private school quality differences has centered largely on whether a methodology is
able to account for the nonrandom selection of students into private schooling.9
One line of research has sought to deal with this problem by modeling the selection
process itself. Specifically, if one can obtain a consistent estimate of the probability of attending
a private school, it is possible to correct the models of achievement for this in the spirit of
Heckman (1979). The typical problem with this approach, however, is that it is difficult to find
factors that drive selection into private schools but that are unrelated to achievement, making
identification dependent upon tenuous functional form or exclusion restrictions. The validity of
any particular approach hinges on the assumptions that the instrument is correlated with the
9 Murnane, Newstead, and Olsen (1985) discuss the difficulties of isolating the impact of private schools on achievement. Studies of the public/private school quality difference include Evans and Schwab (1995); Sander (1996, (2001); Neal (1997); and Grogger and Neal (2000)).
8
probability of attending private school but otherwise uncorrelated with the outcome of interest,
and tests of the latter assumption are generally weak or nonexistent.
A number of recent papers use information on religion as instruments to identify
public/private school differences. Yet even if the student’s religion (Evans and Schwab (1995)) or
the pattern of religion in the area (Neal (1997)) are valid instruments, there is no straightforward
generalization to the charter school case.
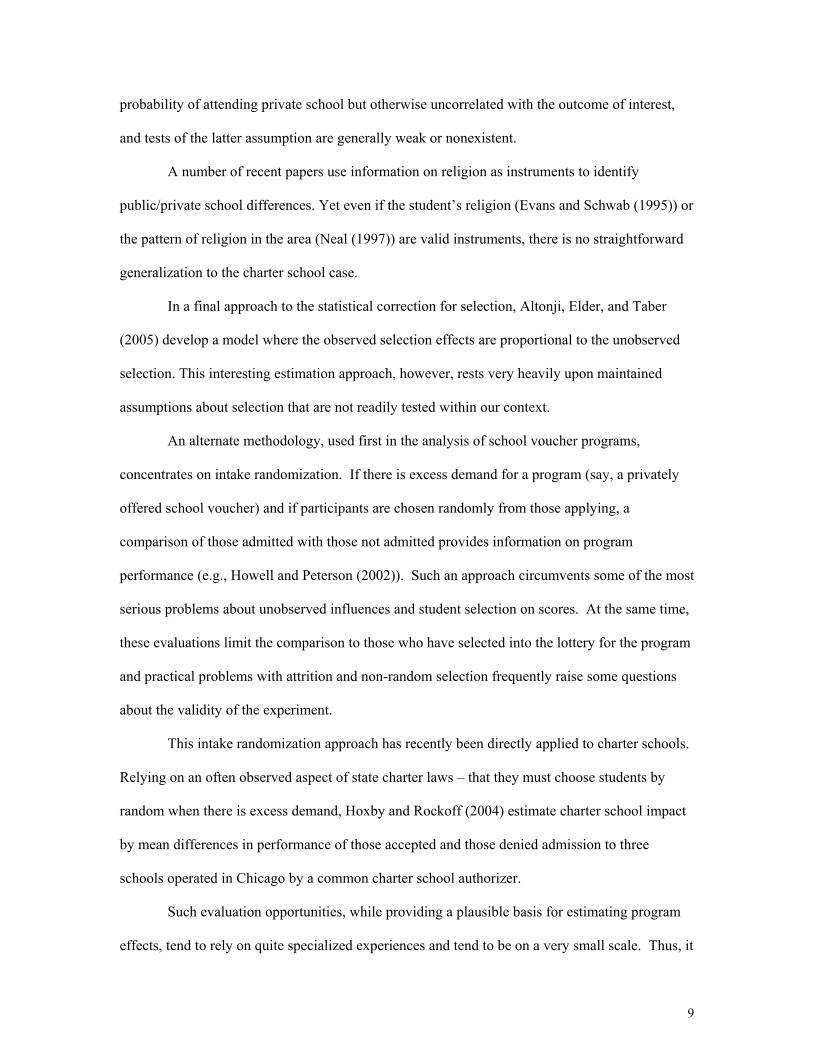
In a final approach to the statistical correction for selection, Altonji, Elder, and Taber
(2005) develop a model where the observed selection effects are proportional to the unobserved
selection. This interesting estimation approach, however, rests very heavily upon maintained
assumptions about selection that are not readily tested within our context.
An alternate methodology, used first in the analysis of school voucher programs,
concentrates on intake randomization. If there is excess demand for a program (say, a privately
offered school voucher) and if participants are chosen randomly from those applying, a
comparison of those admitted with those not admitted provides information on program
performance (e.g., Howell and Peterson (2002)). Such an approach circumvents some of the most
serious problems about unobserved influences and student selection on scores. At the same time,
these evaluations limit the comparison to those who have selected into the lottery for the program
and practical problems with attrition and non-random selection frequently raise some questions
about the validity of the experiment.
This intake randomization approach has recently been directly applied to charter schools.
Relying on an often observed aspect of state charter laws – that they must choose students by
random when there is excess demand, Hoxby and Rockoff (2004) estimate charter school impact
by mean differences in performance of those accepted and those denied admission to three
schools operated in Chicago by a common charter school authorizer.
Such evaluation opportunities, while providing a plausible basis for estimating program
effects, tend to rely on quite specialized experiences and tend to be on a very small scale. Thus, it
9

is difficult to know exactly to what circumstances generalizations can be made, and it generally
precludes saying anything about program heterogeneity.
The evaluation approach found in the private schooling literature typically compares the
average private school to the average public school, ignoring any heterogeneity of either public or
private schools. But such treatment heterogeneity is the focus of most research on regular public
schools.10 We return to treatment heterogeneity below in the context of parental choice.
b. Panel Based Estimators of Mean Differences
Rather than attempting to adjust outcome comparisons among different students, we deal
with the selection problems by concentrating on outcome differences for students moving
between regular public schools and charter schools. This panel data approach immediately
removes the most obvious sources of bias caused by unobserved heterogeneity, although some
concerns remain.
As an overarching framework, we view the schooling process as cumulative in the sense
that achievement depends upon the entire past history of family, community, and school inputs
including mobility. The data requirements to model the entire achievement process are generally
prohibitive. Consider, however, a value-added model of achievement growth in which annual
learning gains (∆A) for student i in school s in year t is a function of individual and family factors
and type of public school. To the extent that historical factors are captured by prior achievement,
such a formulation permits concentration on just contemporaneous circumstances.11
(1) istitiistst
tsiistist
mCHAAA
εδγλβ ++++=
−=∆ −− 1,1,
10 In a refinement of the basic approach, Neal (1997) considers how private school choice varies by geography (central cities and suburban areas), but the comparisons still disregard significant differences among schools with more tightly defined markets. 11 Since the level of achievement at any point will be related to cumulative family and school inputs to the time, value-added models can circumvent many problems of omitted or mismeasured past inputs. See Rivkin, Hanushek, and Kain (2005) for the development of a comprehensive model of education production. While various alternative specifications have been employed, preliminary work showed that coefficients on variables of interest were not sensitive to the precise form of the value added model.
10

where CHst is a dummy variable indicating that school s is a charter school, mist is a dummy
variable indicating a school transfer in year t, γ captures all fixed family and individual influences
on achievement, δit captures systematic influences that vary over time for student i, and ε is an
idiosyncratic error.
Cross-sectional estimation of this gains model would generate an estimate of β based on
the difference in achievement gains between students attending charter schools and those
attending regular schools, controlling for any observable differences in family and community
background. Such an approach likely leads to biased estimates of the benefits of charter schools,
because the probability of attending a charter school is almost certainly correlated with
unobserved differences among students (i.e., cov(CH, γ+δ+ε) ≠0). This is precisely the problem
that has impeded the estimation of the private school premium.12
Our approach employs panel data with multiple observations of gains for each student,
enabling students to serve as their own controls. By introducing student fixed effects in
achievement growth (γ), our estimates of the benefit of charter schools come from the difference
between achievement gain while attending a charter school versus achievement gain while
attending a regular public school.
The use of transitions to identify the charter school effects, although having many
advantages, also raises a number of concerns that need to be addressed. First, the decision to
switch into a charter school might result from a negative school quality shock in the regular
public schools such as placement in a classroom with an ineffective teacher or disruptive group of
peers. In this case the gains of those who subsequently transition to a charter would be
systematically lower than the average for the regular public school, leading to an upward biased
estimate of the average quality differential between the charter and regular public schools
attended by these students.
12 In reality, the majority of studies of private schools have looked at the level of achievement, making the problems of omitted variables much more severe and unquestionably increasing the bias.
11

Second, a negative shock to the family might temporarily reduce performance and
prompt a switch to a charter school. Both phenomena are very similar to the evaluation problem
when there is a preprogram dip in earnings prior to entering job training.13 Fortunately, the
availability of multiple years of data permits us to directly investigate the existence of such
temporary declines through the use of interrupted panel estimators that exclude the year prior to
the move from the analysis.14 We can also compute separate estimates for those who transition
from regular to charter schools and those who transition from charter to regular schools.
A third concern is the direct effect of mobility on academic achievement (see Hanushek,
Kain, and Rivkin (2004)). Again, the panel data permit us to control directly for any systematic
move related transactions cost through the inclusion of an indicator variable for a school transfer.
A fourth issue is whether the TAAS examination used by the State of Texas can provide a
meaningful estimate of school quality differences given the non-random selection of students
among schools. Because the test focuses on basic skills, differences in instructional quality likely
translate into very different rates of improvement in measured test score gains across the initial
achievement distribution. For example, the difference in test scores generated by a substantial
improvement in the quality of instruction may be quite sizeable for a student who begins at the
lower end of the skill distribution and for whom the test covers much of the knowledge gained by
virtue of higher school quality. On the other hand, it may be that a student higher up the initial
skill distribution would answer most of the questions correctly, even if taught in quite a low
quality school. That is, better instructional quality may translate into only a few additional correct
answers if the test does not concentrate on or cover the additional knowledge generated for high
performing students by the better instruction.
13 Heckman and Smith (1999) discuss the implications of a preprogram decline for the estimation of job training program effects. 14 In our related work using similar methods, analysis of special education program effects failed to find any evidence of temporary dips or improvements prior to program entry (see Hanushek, Kain, and Rivkin (2002a).
12

In the context of equation 1, this problem suggests that measured school quality is a
function of the initial distribution of student achievement, and that the difference in test score
gains produced by two schools may depend critically on this distribution. Importantly, because
student fixed effects identify charter school effects on the basis of changes in achievement gain
following a transition, their inclusion mitigates this problem by comparing a student with herself.
Nevertheless, both to reduce further the possibility that sector differences in student academic
preparation across schools influence the results and to learn more about the sources of differences
of estimated charter school effects from fixed effects and from regression based estimates
employing just measured factors, we generate a standardized gain for each student. This
standardized gain is based on comparisons between a student’s nominal gain and the average gain
in achievement for all students in Texas at the same initial achievement level.
First, we divide the initial test score distribution into twenty equal intervals (cm for
m=1,…, 20) and for each year compute the mean and standard deviation of the gains for all
students starting in that interval. Specifically, suppressing the notation for year and school, for all
students with Ait-1 in the interval cm defined by 1 1,m mc ct tA A− −⎡ ⎤⎣ ⎦ for a given year,
(2) ( )1mc
t it itA Aµ −= − , and
(3) ( )( )2
1m m
m
c ct it it t cA A nσ µ−= − −∑
The standardized gain score for each student in the interval cm is then calculated as:
(4) ( )1m mc c
ist ist ist tA A A tµ σ−⎡ ⎤∆ = − −⎣ ⎦
Consequently, gains in each interval are distributed with a mean of zero and a standard deviation
of one in each year.
A fifth concern not addressed here is that the presence of a charter school in the
community provides an incentive for regular schools to raise the quality of instruction. Given that
Texas already had a school reward program linked to the TAAS test in place, it may be unlikely
13
that the entry of a new charter school has a large additional impact on regular school
performance. Nonetheless, the possibility that regular schools responded and raised achievement
gains thereby biasing downward the estimated charter school effect should be considered.15
A final issue concerns the generalizability of the results. Because the charter school effect
is identified from the change in achievement gains for those who enter or exit charter schools, it is
an open question as to the extent that these estimates are relevant for the student body as a whole.
The general issue frequently arises in program evaluations; see Heckman, LaLonde, and Smith
(1999). If those who expect to receive higher benefits from attending a charter school are more
likely to enroll (perhaps because they attend lower quality public schools), the estimated benefit
may overstate the expected gain to the average student, even though it provides a consistent
estimate of the benefit of charters for those who attend. This is also complicated in the charter
school case because state testing begins in grade 3, meaning that earlier entry into charters is not
observed and may be different.
In addition, estimates of sector average differences during the 1990s almost certainly
provide inaccurate information on likely differences in the coming years for two important
reasons. First, because the legislation creating the charter school program was only recently
implemented, most charter schools have been in existence for only a short period of time. If it
takes schools a year or two to get up to speed, estimates of the average benefits of charter schools
for the period under study will not capture the long term or steady state differences between the
two sectors. Consequently we divide charter schools into groups based on years in existence and
examine average differences in charter school effectiveness by age. Second, the stock of charter
schools at any point in time is determined by the pattern of school openings and closings in prior
years. One of the main assumptions underlying support for school choice is that information on
15 Hoxby (2003) suggests that charters and vouchers in other states have spurred the public schools to perform better, although the competitive effects are less clear in Arizona, a rapidly growing state like Texas. On the other hand, Texas Center for Educational Research and others (2001) suggests from survey information that there is limited reaction of the public schools to the existence of a charter.
14

school quality is available and that parents act on that information by gravitating toward effective
schools and away from ineffective schools, leading to quality based closings.
III. The UTD Texas Schools Microdata Panel
The cornerstone of this research is the analysis of a unique microdata set of school
operations constructed by the Texas Schools Project at the University of Texas at Dallas.16 The
database tracks students as they progress through school; it measures student performance each
spring; and it contains detailed information about schools and teachers. This analysis follows four
consecutive cohorts for the period 1996 to 2002, focusing on student achievement gains in grades
4 through 7. For each cohort there are more than 200,000 students in over 3,000 public schools
eventually including over 200 charter schools. The large numbers of students who enter and exit
charter schools are especially important for the methodology pursued here.
Beginning in 1993, the Texas Assessment of Academic Skills (TAAS) was administered
each spring to eligible students enrolled in grades three through eight. Unique IDs link the student
records with the test data. The criteria referenced tests evaluate student mastery of grade-specific
subject matter and provide the basis for our measure of student outcomes. We use mathematics
and reading test scores in this paper. Because the number of questions and average percent right
vary across time and grades, we begin by transforming all test results into standardized scores
with a mean of zero and variance equal to one. Preliminary results for mathematics and reading
were quite similar, leading us to concentrate on a composite score constructed by averaging the
standardized math and reading scores for each student in each year and re-standardizing to yield a
single achievement measure as a z-score.17 The adjusted gain measure derived in equation 4 is
calculated using this composite score.
16 A more detailed description of the underlying database can be found in John F. Kain, “Description of the UTD Texas Schools Project” (2001), and other publications on the website for the UTD Texas Schools Project (http://www.utdallas.edu/research/tsp/).17 The composite score ( ) 2 2M R A A
ist ist t tA A istA µ σ⎡ ⎤= +⎣ ⎦− where ( ) / 2A M Rt ist istA Aµ = + ,
15

The data contain a limited number of student, family and program characteristics
including race, ethnicity, gender and eligibility for a free or reduced price lunch. Nonetheless, the
panel feature can be exploited to account implicitly for time invariant individual effects on
achievement. Importantly, students who switch schools can be followed as long as they remain in
a Texas public school.
The TAAS data are merged with information on whether a school is a state authorized
charter, a district authorized charter, or a regular public school. Any school without any students
in the TAAS data set is excluded from the sample, therefore our number of charters will differ
from public records of the number of authorized charter schools. (Note that students do not have
to have to complete the tests to be included in the TAAS file). Also omitted are those charter
schools exclusively serving children with special needs, as well as those serving the residents in
treatment programs or disciplinary facilities.
School transitions (mit) are constructed to exclude those that result from the structure of
school districts. In other words, the transitions from elementary to middle or junior high schools
are not considered moves, and a separate dummy variable captures the effect of such transitions.
IV. Average Effects of Charter Schools on Achievement
Initial estimates of overall charter school effects on combined mathematics and reading
achievement come from a series of specifications based upon equation (1). For each
specification, charter school effects are presented for all charters (top panel) and by years in
operation (bottom panel). All specifications include indicators for subsidized school lunch
eligibility and year-by-grade (to allow for differences in tests across years). Specifications that
do not remove student fixed effects also include a vector of ethnic dummy variables (Asian,
black, Hispanic and Native American) and a dummy for gender. Standard errors are adjusted for
( )( )A M R At ist ist t tA A nσ µ= + −∑ M
istARistA
, is the student’s math score at school s in year t standardized
with respect to the statewide distribution, and is the analogous metric for reading.
16

the clustering of students into schools. Following discussion of the basic results, we report a
series of specification checks.
a. Basic Results
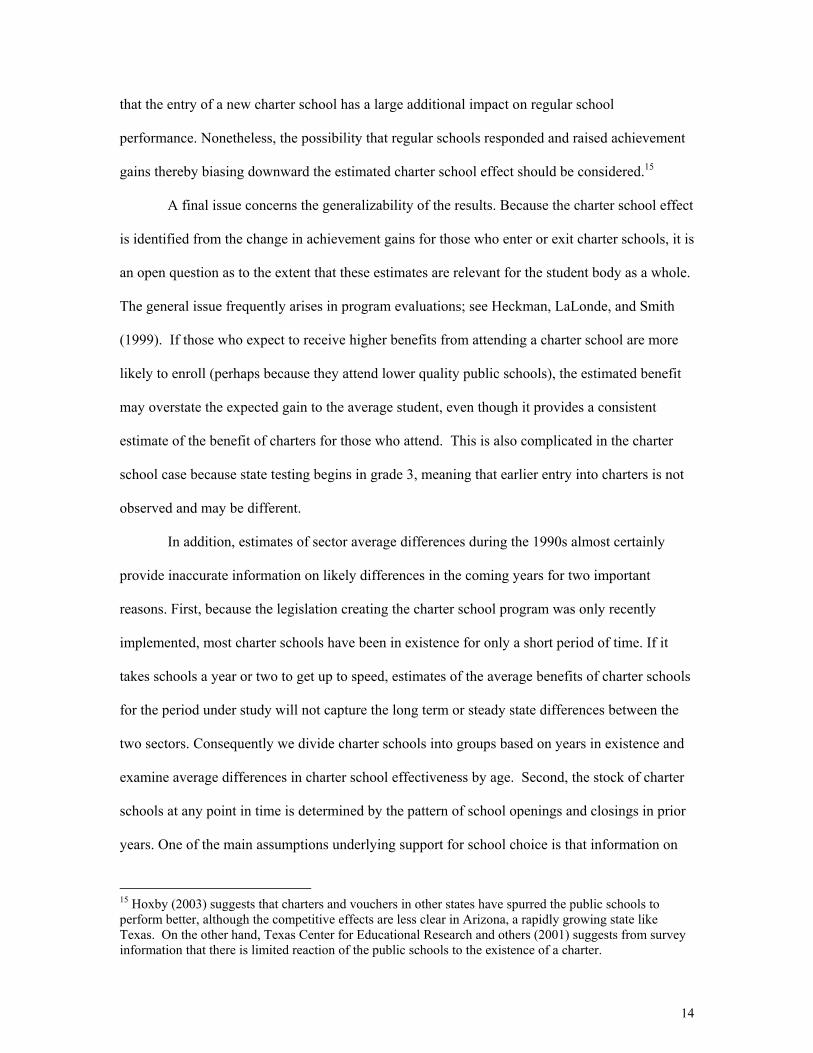
The simple analysis of the level of achievement, found in the first column of Table 6,
provides a convenient benchmark that can be readily compared to some of the early analyses of
performance, including those using the National Assessment of Educational Progress (Nelson,
Rosenberg, and Van Meter (2004)). The estimated difference in scores combines both the
immediate effect of the charter and the entire past history of family and school differences. It
shows that charters on average tend to attract a sample of students with systematically lower
levels of achievement than do regular public schools. However, the estimates for all charter
schools combined conceal differences by number of years in operation. The difference is greatest
for schools in their first year of operation (0.39 standard deviations) and decreases with
operational experience, becoming insignificant after three years of school operation.
The remaining columns report results from a series of value added specifications that
successively add student fixed effects and controls for mobility, peer turnover, and peer average
initial achievement. Using a value added, or gain, specification rather than a levels specification
reduces the magnitude of the charter school coefficient by roughly 0.06, but the additional
inclusion of student fixed effects increases the effect size above that of the simple levels model.
This indicates that compositional differences across sectors tend to attenuate estimates of the
average charter school deficit in Texas.
Although controls for student mobility have little effect on the charter school coefficient,
the inclusion of the peer turnover variable reduces its magnitude by more than 50 percent. This is
consistent with the much higher share of new students in charter schools and the negative impact
of student turnover found in earlier work on Texas (Hanushek, Kain, and Rivkin (2004)). It is
nonetheless premature to attribute such an important role to turnover, because turnover is by
definition much higher in new schools in which none of the students are non-movers; thus, as
17
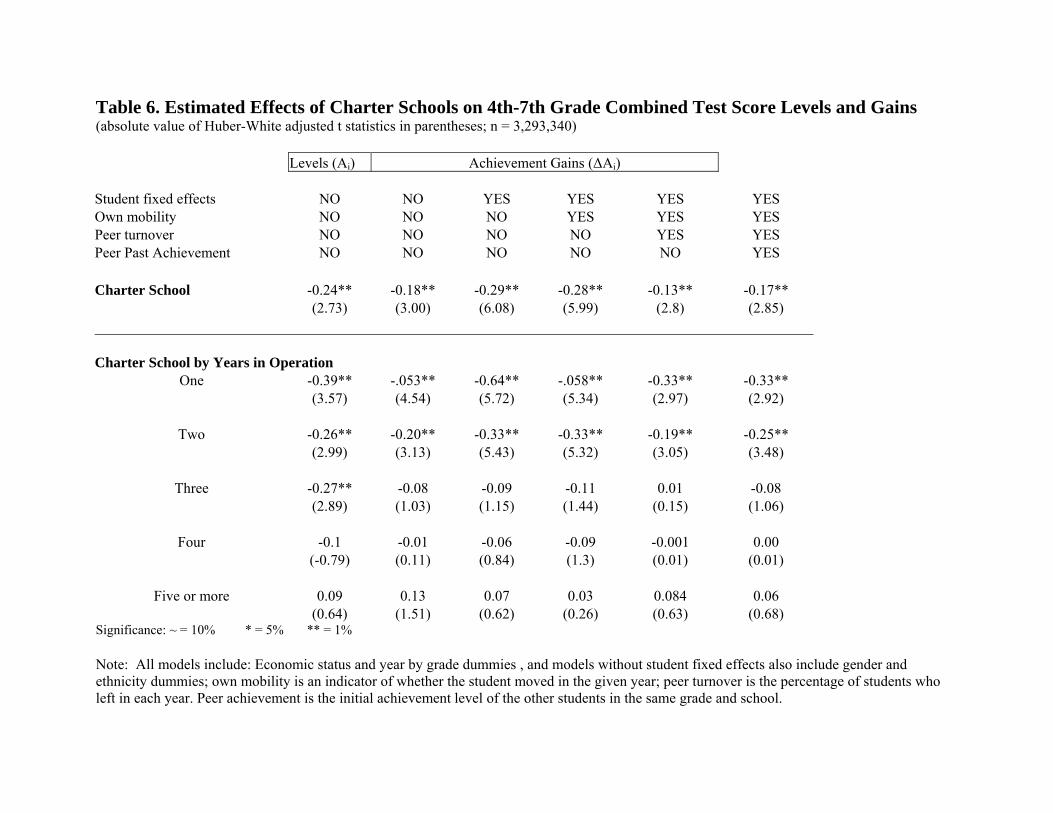
Table 6. Estimated Effects of Charter Schools on 4th-7th Grade Combined Test Score Levels and Gains (absolute value of Huber-White adjusted t statistics in parentheses; n = 3,293,340) Levels (Ai) Achievement Gains (∆Ai) Student fixed effects
NO NO YES YES YES YES
Own mobility NO
NO NO YES YES YESPeer turnover NO NO NO NO YES YESPeer Past Achievement
NO NO NO NO NO YES
Charter School
-0.24** -0.18** -0.29** -0.28** -0.13** -0.17** (2.73) (3.00) (6.08) (5.99) (2.8) (2.85)
Charter School by Years in Operation
One -0.39** -.053** -0.64** -.058** -0.33** -0.33**
(3.57) (4.54) (5.72) (5.34) (2.97) (2.92)
Two -0.26** -0.20** -0.33** -0.33** -0.19** -0.25** (2.99) (3.13) (5.43) (5.32) (3.05) (3.48)
Three -0.27** -0.08 -0.09 -0.11 0.01 -0.08
(2.89) (1.03) (1.15) (1.44) (0.15) (1.06)
Four -0.1 -0.01 -0.06 -0.09 -0.001 0.00 (-0.79) (0.11) (0.84) (1.3) (0.01) (0.01)
Five or more
0.09 0.13 0.07 0.03 0.084 0.06
(0.64) (1.51) (0.62) (0.26) (0.63) (0.68) Significance: ~ = 10% * = 5% ** = 1% Note: All models include: Economic status and year by grade dummies , and models without student fixed effects also include gender and ethnicity dummies; own mobility is an indicator of whether the student moved in the given year; peer turnover is the percentage of students who left in each year. Peer achievement is the initial achievement level of the other students in the same grade and school.
discussed below, the turnover coefficient may also capture problems endemic to new schools.
Finally, the addition of peer initial achievement slightly increases the magnitude of the charter
school coefficient, indicating that the initial achievement differential between traditional public
and charter schools is not one of the net contributors to the poorer average performance in charter
schools.18
To investigate the linkage between charter school quality and years of operation,
specifications reported in the lower panel of Table 6 replace the single charter school treatment
variable with a series of dummy variables indicating the age of the charter school. The results
show that the inferior performance of charter schools is concentrated among schools in their first
and second years. In no specifications do older charter schools perform systematically worse
than traditional public schools. In addition, the inclusion of the turnover variables has the largest
effect on the first and second year charter school coefficients, not surprising given that a much
higher share of students are new entrants in these schools.
We also explored the possibility of systematic differences by student demographic
characteristics including family income and race. If lower income and minority students attend
lower quality public schools, one might expect these students to enjoy larger benefits from charter
school attendance. The results (not reported), do not reveal such systematic differences. 19
b. Sensitivity Analysis
The charter school effects in the fixed effects specifications are identified by the
difference in achievement gains in a charter and in a traditional public school, implying that the
estimates will be biased if there are unmeasured changes in personal well-being or the family
environment (captured in itδ in Equation 1) that are systematically related to the decision to enter
or exit a charter school. For example, a temporary downturn in a student’s academic performance 18 As noted in a variety of places, estimation of peer effects is difficult because of both omitted variables problems and possible simultaneity (see the discussion in Hanushek, Kain, and Rivkin (2002b)). Here we employ lagged peer characteristics to capture “characteristics” as opposed to current behavior. 19 These findings differ from those of Gronberg and Jansen (2001), who find larger benefits for disadvantaged students but using very different empirical specifications.
18

that triggers entry into a charter but that is subsequently reversed will bias estimated charter
school quality upward because it induces a positive covariance between the charter treatment and
the error. In essence, the estimates of the charter school coefficient confound the actual charter
school effect with the recovery from the negative shock, similar to the phenomenon described as
Ashenfelter’s dip in the job training literature (Heckman and Smith 1999).
Even in the absence of any such changes, the decision to transfer depends on both the
quality of the specific charter or traditional school and the match quality of the student with the
school. This is particularly important in the case of students exiting charter schools who are likely
to have attended lower quality charters than the average student.20
We examine a series of additional specifications to understand the magnitude of these
potential biases. First, we separate transitions into charter schools from transitions out of charter
schools, generating two different estimates of the charter/traditional public school differential.
Second, to consider any biases introduced by temporary falls in achievement, we compute
interrupted panel estimates of charter school quality. Consider a student who faces a temporary
downturn in grade 6 and transfers to a charter school in grade 7. Because the grade 6 test score is
both the post-test score in calculating the grade 6 achievement gain and the pretest score in
calculating the grade 7 gain, the temporary downturn would deflate achievement growth while
not in a charter and inflate it while in a charter, both of which bias upward estimates of charter
school quality. If, however, information on gains in the year prior to entering a charter (grade 6)
were not considered and the estimates were computed from comparisons of gains in just grades 7
and 5, any upward bias should be much smaller, because the transitory dip during grade 6 is
removed from the pre-program comparison (even though it still inflates the gain in grade 7).
Table 7 reports separate charter school coefficients for entrants and exits. The much
more negative charter school coefficient for exits in Table 7 fits with the notion that those who
20 These issues and sensitivity analyses are similar to those described in Hanushek, Kain, and Rivkin (2002a) in the context of special education.
19
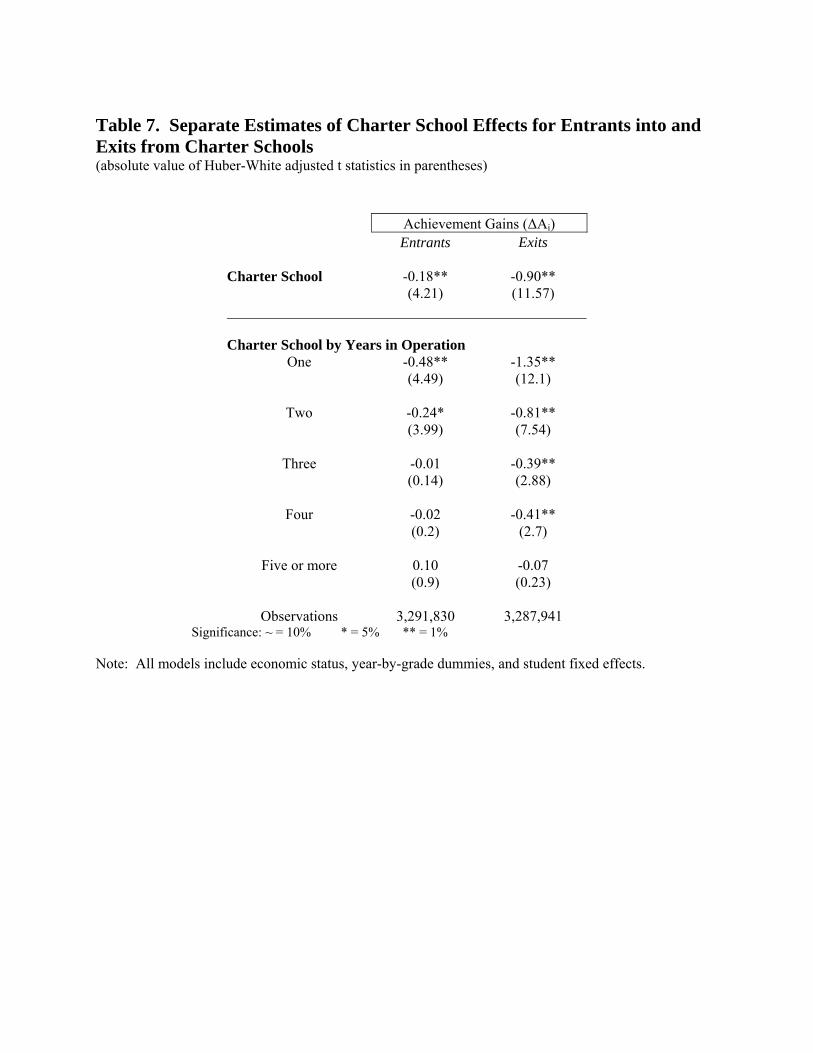
Table 7. Separate Estimates of Charter School Effects for Entrants into and Exits from Charter Schools (absolute value of Huber-White adjusted t statistics in parentheses)
Achievement Gains (∆Ai) Entrants Exits Charter School -0.18** -0.90** (4.21) (11.57)
Charter School by Years in Operation
One -0.48** -1.35** (4.49) (12.1)
Two -0.24* -0.81** (3.99) (7.54)
Three -0.01 -0.39** (0.14) (2.88)
Four -0.02 -0.41** (0.2) (2.7)
Five or more 0.10 -0.07 (0.9) (0.23)
Observations 3,291,830 3,287,941 Significance: ~ = 10% * = 5% ** = 1%
Note: All models include economic status, year-by-grade dummies, and student fixed effects.

exit charter schools have had a far worse experience in the charter school than the typical charter
school student. Even students who exit older charter schools fare significantly better upon
returning to a traditional public school. These results suggest that school-student match may be
quite important (and nonuniform across students). It could also be explained by within school
variation in teacher quality (Hanushek et al. (2005)) that led to exits.
Finally, the pattern of estimates in Table 8, relying on the interrupted panel estimates for
entrants, provides little support for the view that many entrants to charter schools experience
temporary negative shocks that precipitate the switch. The similarity of results from estimation
with all switches and estimation excluding the year of switching is striking. Therefore it does not
appear that the charter school coefficients conflate the true charter school effect with recovery
from a temporary negative shock.
V. Heterogeneity and Parental Decision Making
The conceptual arguments undergirding charter school reform efforts are directly adapted
from the original arguments of Milton Friedman for support of voucher schools (Friedman
(1962)). Developing competitive markets for schooling would offer alternative types of schools
that better meet consumer desires, would foster innovation and the introduction of alternative
pedagogies and curriculum, and would lead to more efficient supply through competition of
schools for students. But, while picking up the conceptual arguments for more choice, charter
schools also pick up the arguments against.21 One persistent assertion is that parents, and
particularly low-income parents, are likely to be poor consumers of quality – perhaps because of
informational problems, lack of attention, lack of experience, or the complexity of the problem
given the time until the results can be fully observed. To investigate the responsiveness of
parents to school quality, we analyze the effects of school quality on the decision to exit a school
21 Charter schools avoid the argument that the competitive schools would only seek profits and would not serve society’s interests. An appeal of charter schools is that they are fully under public control and thus would not be permitted to pursue programs outside of society’s interest.
20

Table 8. Interrupted Panel Estimates of Charter School Effects for Entrants into Charter Schools (absolute value of Huber-White adjusted t statistics in parentheses)
All Entrant
observations Before & After
Only Omit Before Switch
Charter School -0.187** -0.025** -0.192** (3.62) (4.72) (4.2)
Charter School by Years in Operation
One -0.427** -0.463** -0.461** (3.98) (3.97) (4.52)
Two -0.263** -0.297** -0.27** (3.85) (4.31) (4.17)
Three -0.028 -0.06 -0.003 (0.34) (0.68) (0.03)
Four -0.039 -0.16 -0.013 (0.46) (1.48) (0.16)
Five or more 0.045 0.08 -0.015 (0.36) (0.58) (0.12)
Observations 3,288,448 3,284,291 3,285,922 Significance: ~ = 10% * = 5% ** = 1% Note: All models include economic status, year-by-grade dummies, and student fixed effects.

a. Analytical Focus
The charter schools that have developed follow a wide variety of principles and
conceptual models, including simply “doing better” than the regular public schools, providing
alternative curricular and pedagogical focus, emphasizing discipline or moral values, developing
the arts, and the like (Texas Center for Educational Research (2003)). These alternatives may not
map simply into measured student achievement, and, as such, consumers with different
preferences may well be accurately making optimal choices – even if they do not reflect quality in
terms of math and reading performance.
Nevertheless, in designing their testing system the State of Texas has made higher
achievement a primary objective of public education. Thus, we evaluate the narrow question of
whether consumers respond to academic quality. This focus is also important because
competition in this dimension could more directly influence the quality of instruction in the
overall school market through forcing lower quality schools to either reform or exit the market.
Given that most charter schools are quite new, we are unable to examine the longer term
dynamics of the market. In addition, we can currently provide only limited information on the
determinants of the decision to enter a charter and no information about the decision to open a
charter, even though both are important aspects of market dynamics. Here we focus on the
responsiveness of families to quality in terms of the decision to exit the current school.
It is natural to believe that some charters are much better than others in raising the
achievement of children, just as we observe substantial variation within the regular public school
sector. The consumer problem is not trivial, however, because consumers lack direct information
on school quality. The state accountability system produces information on the level of student
performance but not on the value added of the school or even on the gains of students in the
school. Parents must supplement the limited performance information with first-hand knowledge
of school operations that may or may not be strongly related to actual school effectiveness at
raising achievement.
21

We develop an outcome based school quality measure equal to the residual of a
regression of school average achievement gain in a given year on a number of student
demographic characteristics. In order to account fully for school differences in the distribution of
initial achievement, the school average gain measure weights students in each achievement
interval by the state-wide share of students in that interval (instead of the specific distribution in
each school):
(5) ( )20
1
C
m m
wst c st c
mA A w
=
∆ = ∆∑
where mc stA∆ is the average standardized achievement gain for group m at school s in year t
(from equation 4), and is the statewide share of students for interval m. This fixed weight
measure goes one step further than previously to ensure that the school performance is not biased
by the particular selection of students in each school.22 This aggregate school performance is
then regression adjusted for demographic and gender composition, proportion of disadvantaged
and migrant students, grade distribution in the school, and the proportion of new students. Our
school quality measure, which varies by school and year, is the residual:
mcw
(6) Cwstst stA pυ κ= ∆ − .
where stp is the vector of student body composition and school structure variables and κ are the
estimated OLS parameters.
Kernel density plots of υ in Figure 1 reveal considerable heterogeneity in the
effectiveness of charter and traditional public schools. Of course a portion of the variation
reflects sampling error, and the much larger variation in the charter sector results at least in part
from the much smaller enrollment levels in most charter schools. Nevertheless, the systematic
22 It would, however, go too far if some schools in fact developed specialized programs that were complementary to specific groups of students (in terms of entering performance). Investigations of individual teacher differences in Texas data for one central city, however, did not indicate strong specialization with students (Hanushek et al. (2005)).
22
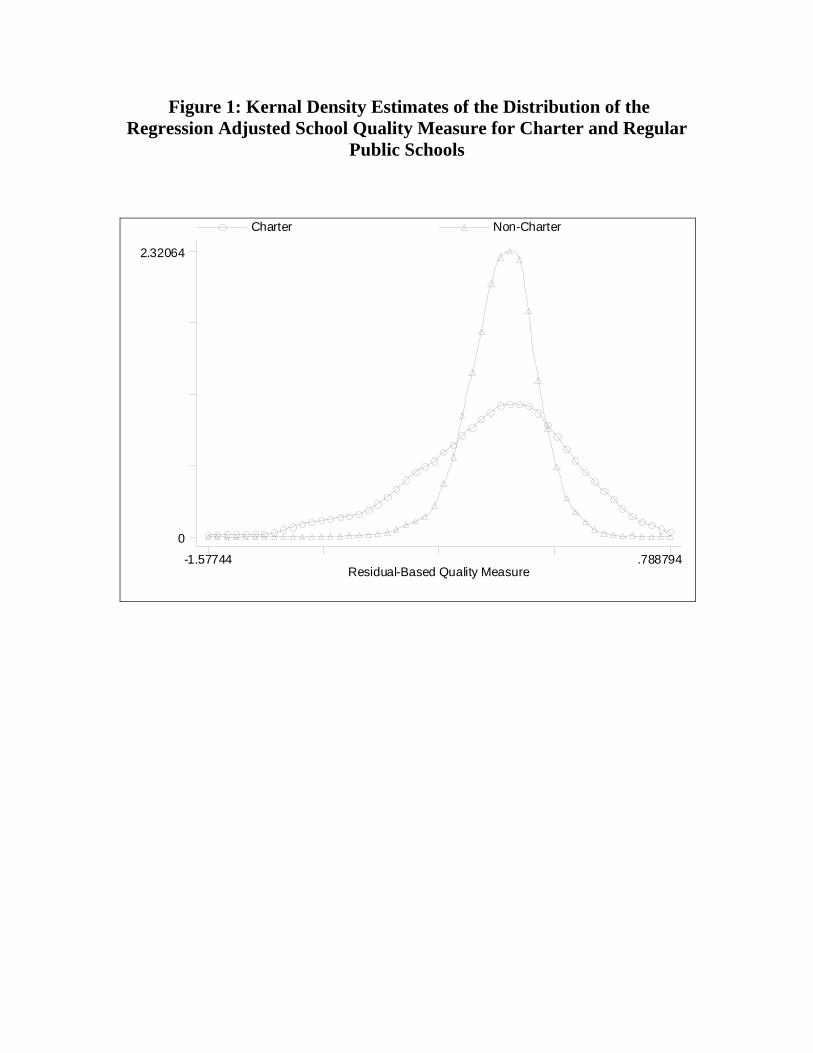
Figure 1: Kernal Density Estimates of the Distribution of the Regression Adjusted School Quality Measure for Charter and Regular
Public Schools
Residual-Based Quality Measure
Charter Non-Charter
-1.57744 .788794
0
2.32064

quality differences by years of operation capture real performance differences, and there can be
little doubt given existing evidence on the variation in teacher and school quality that there are
substantial quality differences even for charters of the same age.23
b. Parental Decisions
Are school exit decisions affected by the quality of instruction? And is the sensitivity to
school quality greater in the charter school sector? To answer these questions, we estimate a
series of linear probability models in which the probability of exiting is regressed on school
average standardized gain (equation 6) in charter schools and regular public schools.24 All models
include a vector of dummy variables for student ethnicity, migrant status, school mobility,
gender, and family income, and indicator variables for individual years of school operation
(which are all equal to zero for traditional public schools).25 The addition of peer turnover and
other school composition variables provides information on the extent to which peer factors
appear to enter independent of school quality. We also include a student’s own academic gain in
some specifications, because factors specific to an individual student’s performance may also be
related to the probability of moving.26
Table 9 presents estimates of the effects of school quality on the probability of exit. In
contrast to the very small and mostly insignificant effect of quality on the probability of exiting
regular public schools, school quality has a negative and highly significant effect on the
probability of exiting charter schools in all specifications.27 Importantly, the virtual invariance of
the point estimates to the inclusion of peer turnover or peer initial achievement suggests that 23 See Rivkin, Hanushek, and Kain (2005) and Hanushek et al. (2005) for evidence on variation in the quality of instruction both within and between schools. 24 For this estimation, the precision of the school quality estimates is ignored, and no adjustments are made to the standard errors because of the inclusion of estimated residuals as regressors. Logit models produce an identical pattern of results. 25 Given the growth in the school population over the period, new regular public schools do open in our sample. Nonetheless, the appropriate school age for regular public schools seems much more associated with having an on-going administrative structure, curriculum, and so forth than just building age. 26 Hanushek et al. (2005) find considerable within school variation in teacher quality, explaining how individual student performance could systematically differ from the expectation for the whole school. 27 The hypothesis that the effect of quality on the probability of exit equals zero is rejected at the one percent level in all specifications.
23

Table 9. Estimated Effects of School Quality on the Probabilities of Exiting Charter and Regular Public Schools (absolute value of t-statistics in parentheses; n = 1, 349, 909)
(1) (2) (3) (4) Student Characteristics YES YES YES YES School/Peer Characteristics NO YES YES YES Peer Achievement NO NO YES YES Linear Probability Model Quality -0.002 0.006 0.006 0.015** (0.47) (1.42) (1.4) (3.66) Quality X Charter -0.152** -0.142** -0.138** -0.126** (4.57) (4.23) (4.12) (3.72) Own Gain -0.009** (25.67) Own Gain X Charter -0.012 (1.61) Significance: ~ = 10% * = 5% ** = 1% Note: Student characteristics include ethnicity, gender, economic status, migrant status and own mobility indicators; school/peer characteristics include enrollment, grade distribution, and ethnic, disadvantaged and migrant student shares, and percent of student body new; peer achievement is the initial achievement level of the other students in the same grade and school.

parents are responding to the quality of the school’s instructional program rather than the peers.
Moreover, inclusion of own gain has virtually no effect on the quality coefficient, providing
strong support that the relationship is not driven by omitted factors affecting both performance
and the probability of leaving. It is also notable that the coefficients for the student’s own
achievement gain during the year leading up to the potential exit are also negative and significant
(Column 4) and not significantly different for students in charter and traditional public schools.
The magnitude of the coefficients indicates that a one standard deviation increase in
school quality reduces the probability of leaving the school by roughly 7 percentage points.28
Whatever else parents may be looking for in a charter school, they respond to performance
differences in the core academic subjects.
The muted exit response of students in regular public schools almost certainly results in
part from the much higher transactions costs typically associated with moving. With fixed
attendance zones, parents of students in regular public schools usually have to change residences
in order for their child to attend another public school, while children in charter schools can opt
back into the regular public schools without having to move. At this time the relatively small
number of existing charter schools cannot provide viable alternatives for the large number of
regular public school students attending below average schools. Therefore, transactions costs are
much higher for most students in regular public schools who desire to change schools.
We can also exploit the added information about the destination of exiting students to
learn more about the behavior of regular and charter school students. The three destination
categories are “charter school”, “regular public school”, and “out of the data set”. Note that a
student can exit from our data entirely by transferring to a private school, moving out of state, or
stopping attending schools (largely home schooling), but we have no information to distinguish
among these categories. Nevertheless, the “out of the data set” category is included in the model
28 The standard deviation of the school quality distribution is 0.49 for charter schools, although a substantial portion of this variance is measurement error. The error attenuates the coefficient on school quality proportional to its share of the total variance of the school quality residual.
24
because its share of school exits is not insignificant; Table 4 shows that 18 percent of charter
school students and 7 percent of regular public school students disappear from the data each year.
Table 10 reports multinomial logit estimates of the effects of school quality on the
probabilities of switching to each of the destinations relative to remaining in the same school. The
results suggest that higher quality reduces the probabilities that charter school students return to a
traditional public school and exit the data entirely, though the results on exiting the data are not
significant at conventional levels. To the extent that a portion of the exits from the data are
caused by geographic moves largely unrelated to school quality, it is not surprising that the
quality effect would be weaker for this category. Interestingly, the results also suggest a strong
relationship between the probability of transitioning from a regular public school to a charter and
school quality. It appears that the insignificant estimates for regular public school students in
specifications that combine all destinations into a single category result from the fact that most
transitions out of regular public schools are not driven by the same quality considerations as the
decision to enter a charter school – partly because of a lack of charter school alternatives and
partly because most geographic moves are not driven by school quality considerations.
c. Differences by Family Income
An important question is whether the responsiveness to school quality varies by family
income. Table 11 describes the exit regression results from specifications that add interactions
between both school quality and own gain and classification as economically disadvantaged.
(The coefficients in the multinomial logit specifications were quite imprecise and uninformative,
and we do not report these results).
The results suggest that low income families are less responsive to quality than higher
income families in both the charter and non-charter school sectors. These estimates suggest that
the effect of a one standard deviation reduction in charter school quality on the probability of
exiting is roughly half as large for students classified as economically disadvantaged. A number
of factors may contribute to this finding including greater mobility for non-school considerations,
25

Table 10. Estimated Effects of School Quality on the Probabilities of Exiting Charter and Regular Public Schools, by Destination (absolute value of z-statistics in parentheses; n = 1, 349, 909) Multinomial Logistic Regression (1) (2) (3) (4) (base alternative = remain in current school) Student Characteristics YES YES YES YES School/Peer Characteristics NO YES YES YES Peer Achievement NO NO YES YES To Public School Quality -0.017 0.047 0.044 0.11** (0.45) (1.29) (1.2) (2.95) Quality X Charter -0.742** -0.727** -0.675** -0.564** (4.04) (3.57) (3.33) (2.8) Own Gain -0.065** (20.79) Own Gain X Charter 0.118* (2.44) To Charter Quality -0.664** -0.344** -0.381** -0.318** (5.15) (2.96) (3.23) (2.66) Quality X Charter 0.174 0.06 0.151 0.172 (0.6) (0.22) (0.51) (0.55) Own Gain -0.061* (2.52) Own Gain X Charter -0.023 (0.26) Out of Data Quality 0.005 -0.009 -0.006 0.115** (0.16) (0.3) (0.21) (3.66) Quality X Charter -0.508* -0.384~ -0.423~ -0.678** (2.27) (1.69) (1.86) (2.92) Own Gain -0.114** (20.73) Own Gain X Charter 0.283** (3.15) Significance: ~ = 10% * = 5% ** = 1% Note: Student characteristics include ethnicity, gender, economic status, migrant status and own mobility indicators; school/peer characteristics include enrollment, grade distribution, and ethnic, disadvantaged and migrant student shares, and percent of student body new; peer achievement is the initial achievement level of the other students in the same grade and school.

Table 11. Estimated Effects of School Quality on the Probabilities of Exiting Charter and Regular Public Schools by Family Income (absolute value of t-statistics in parentheses; n = 1, 349, 909)
(1) (2) Quality 0.000 0.008 (0.09) (1.47) Quality X Charter -0.193** -0.177** (5.18) (4.34) Quality X Low Income 0.009~ 0.013* (1.76) (2.3) Quality X Low Income X Charter 0.089* 0.08~ (2.22) (1.76) Own Gain -0.008** (17.05) Own Gain X Charter -0.015 (1.49) Own Gain X Low Income -0.002** (3.4) Own Gain X Low Income 0.007 X Charter (0.46)
Significance: ~ = 10% * = 5% ** = 1% Note: Linear probability models include student and school/peer characteristics including peer achievement. Student characteristics include ethnicity, gender, economic status, migrant status and own mobility indicators; school/peer characteristics include enrollment, grade distribution, and ethnic, disadvantaged and migrant student shares, and percent of student body new; peer achievement is the initial achievement level of the other students in the same grade and school.

lower quality public school alternatives, less focus on the quality of academic instruction as well
as less skill at judging quality for lower income families on average.29 Notice that the inverse
relationship between the probability of exit and own gain is larger for those classified as
economically disadvantaged, consistent with the notion that family shocks that both adversely
affect achievement and precipitate school changes are either stronger or more frequent for these
students.
VII. Conclusions
Charter schools have become the primary means to introduce additional choice and
competition into the system of publicly supported elementary and secondary education. These
schools enjoy enormous popularity as witnessed by the rapid growth of the number of charter
schools in many states. Yet, although charter schools may satisfy family preferences regarding
various aspects of the education environment, there is little in the way of solid evidence regarding
the academic quality of charter schools in comparison to the local public school alternative.
Deducing the effectiveness of charters is difficult, because they exclusively enroll a self-
selected group of students. To the extent that factors influencing selection also affect
achievement, simple comparisons of scores between charters and regular publics will obviously
be very misleading. Texas provides a unique opportunity to gain insight into the quality of
charter schools because of both a sizeable number of charter schools and a comprehensive system
of collecting data on individual student performance that permits credible analysis.
The results in this paper show that charter schools typically have a rough beginning.
Their performance (measured by average value-added in student performance) begins below that
of regular public schools during the first year, even after allowing for the selective nature of the
student population. But, by the second or third year there are not significant differences in
average performance. Of course this start-up phase leads to some uncertainty, as greater numbers
29 In future work we intend to identify geographically defined education markets and explore market dynamics in greater detail.
26

of students exit charters than comparable regular public schools, and this feeds back to make the
start-up even more difficult. Nonetheless, surviving charters perform similarly to regular public
schools on average, suggesting that any regulatory judgments should not be made too early.
In terms of the larger implications of introducing additional choice into the school sector,
charter school parents appear to respond to quality differences measured in terms of value added
to learning in math and reading in deciding whether to remain in the school. Higher quality
lowers exit rates in charter schools, though the effect is weaker for lower income families. The
comparison of school exit behavior for charters and regular public schools is also informative:
the responsiveness to quality in the regular public sector is much smaller than that in the charter
sector, but regular school quality does affect the decision to switch to a charter school if available.
The responsiveness of both charter school parents and regular school parents considering
charter schools to school quality bodes well for the possibility of an education market that
systematically favors higher quality schools. The fact that parents can evaluate the quality of
instruction in their own school is important, but a successful education market also requires the
families of prospective students to be able to judge the quality of charter schools. At this point we
have little direct knowledge about the ability of outsiders to evaluate charter schools, and we hope
to investigate this issue in future work using GIS methods to construct local education markets.
We do observe only a small, albeit positive correlation between charter school quality and the
change in enrollment, suggesting the need to disseminate information more effectively.
These results, which indicate that the average charter school is not overwhelmingly
superior to the average regular public school, can be viewed from two very different perspectives
on charter school policy. Some have suggested that, if not significantly better in producing
achievement gains, they should be eliminated or at least their expansion should be slowed and
they should be further regulated. Particular attention is given to the left hand tail of the charter
distribution (figure 1) with calls for quick and decisive charter revocation for those at the bottom
27

of the distribution. Moreover, low income families appear to act less on quality differences,
perhaps because they are either less able to discern quality or less discerning consumers.
The other view is that the calls for eliminating charters come from interested parties and
simply reflect the competitive pressures that charters are generating – pressures that should be
reinforced and not weakened. Especially given the fact that the poor performers are very
disproportionately found in charters in the first years of operation, they should be better supported
in their early development so that they can grow to viable schools. Moreover, even disregarding
other school outcomes, the negative relationship between the probability of exiting and school
quality indicates that parents do place pressure on schools by withdrawing their children in
response to poor quality. This quality responsiveness may be reinforced by improving the
content of school performance information disseminated, particularly to low income families.
Finally, on this side, concerns about poor performers are much more serious with respect to
regular public schools, where students without choice alternatives face much more severe
problems than a charter school student who can return to the public schools.
Part of these differences simply reflects different philosophical and policy positions that
are not much affected by evidence. But part of the differences also reflects current shortcomings
in our knowledge: What will the distribution of mature charter schools be? Will parental
decision making be sufficient to eliminate poor quality charter (and regular public) schools? Will
public schools respond to competitive pressures? These important questions remain unanswered,
and even unanswerable given the immaturity of the charter school market today. Understanding
the important longer run dynamic outcomes will require patience and a longer period of
observation.
28

Appendix Table A1. Mean, 25th Percentile, Median and 75th Percentile of Charter School Enrollment in Grades 4-7: 1997-2002
1997 1998 1999 2000 2001
4th Grade 10th Percentile 4 6 2 3 3 25th Percentile 4 6 6 7 8
Median 8 8 13 14 14.5 75th Percentile 8 19 23 24 23
5th Grade 10th Percentile 2 5 4 2 1 25th Percentile 2 6 6 5.5 6
Median 5 9 12 13.5 13 75th Percentile 8 34.5 23 27 26
6th Grade 10th Percentile 15 6 4 1 2 25th Percentile 15 12 6.5 3 5
Median 39 42.5 14 13 13 75th Percentile 50 78 34.5 27 29
7th Grade 10th Percentile 16 15 5 2 2 25th Percentile 36 31 6 3 6
Median 39 42.5 17.5 10 12.5 75th Percentile 45 61 38 18.5 25.5

References Altonji, Joseph G., Todd E. Elder, and Christopher R. Taber. 2005. "Selection on observed adn
unobserved variables: Assessing teh effectiveness of Catholic schools." Journal of Political Economy 113,no.1 (February):151-184.
Bifulco, Robert, and Helen F. Ladd. 2004. "The impacts of charter schools on student
achievement: Evidence from North Carolina." Terry Sanford Institute of Public Policy, SAN04-01, Duke University (August).
Booker, Kevin, Scott M. Gilpatric, Timothy J. Gronberg, and Dennis W. Jansen. 2004. "Charter
school performance in Texas." mimeo, Texas A&M University (May). Coleman, James S., Thomas Hoffer, and Sally Kilgore. 1982. High school achievement: public,
Catholic and private schools compared. NY: Basic Books. Evans, William N., and Robert M. Schwab. 1995. "Finishing high school and starting college: Do
Catholic schools make a difference?" Quarterly Journal of Economics 110,no.4 (November):941-974.
Finn, Chester E. Jr, Bruno V. Manno, and Gregg Vanourek. 2000. Charter schools in action.
Princeton, NJ: Princeton University Press. Friedman, Milton. 1962. Capitalism and freedom. Chicago: University of Chicago Press. Grogger, Jeffrey, and Derek Neal. 2000. "Further evidence on the effects of Catholic secondary
schooling." In Brookings-Wharton papers on urban affairs, 2000, edited by William G. Gale and Janet Rothenberg Pack. Washington, DC: Brookings Institution Press:151-193.
Gronberg, Timothy J., and Dennis W. Jansen. 2001. Navigating newly chartered waters: An
analysis of Texas charter school performance. Austin, TX: Texas Public Policy Foundation.
Hanushek, Eric A., John F. Kain, Daniel M. O'Brien, and Steve G. Rivkin. 2005. "The market for
teacher quality." National Bureau of Economic Research, Working Paper No. 11154, (February).
Hanushek, Eric A., John F. Kain, and Steve G. Rivkin. 2002a. "Inferring program effects for
specialized populations: Does special education raise achievement for students with disabilities?" Review of Economics and Statistics 84,no.4 (November):584-599.
———. 2002b. "New evidence about Brown v. Board of Education: The Complex Effects of
School Racial Composition on Achievement." Working Paper 8741, National Bureau of Economic Research (January).
———. 2004. "Disruption versus Tiebout improvement: The costs and benefits of switching
schools." Journal of Public Economics Vol 88/9-10:1721-1746.

Heckman, James J. 1979. "Sample selection bias as a specification error." Econometrica 47:153-161.
Heckman, James J., Robert LaLonde, and Jeffrey Smith. 1999. "The economics and econometrics
of active labor market programs." In Handbook of labor economics, edited by Orley Ashenfelter and David Card. Amsterdam: Elsevier Science:1865-2097.
Heckman, James J., and Jeffrey A. Smith. 1999. "The pre-programme earnings dip and the
determinants of participation in a social programme: Implications for simple programme evaluation strategies." The Economic Journal 109(July):313-348.
Howell, William G., and Paul E. Peterson. 2002. The education gap: Vouchers and urban
schools. Washington, DC: Grookings. Hoxby, Caroline Minter. 2001. "Changing the profession: How would school choice affect
teachers?" Education Matters 1,no.1 (Spring):57-63. ———. 2002. "Would school choice change the teaching profession?" Journal of Human
Resources 37,no.4 (Fall):846-891. ———. 2003. "School choice and school productivity (or could school choice be a tide that lifts
all boats?)." In The Economics of School Choice, edited by Caroline Minter Hoxby. Chicago: University of Chicago Press.
———. 2004. "Achievement in charter schools and regular public schools in the United States:
Understanding the differences." (mimeo) (December). Hoxby, Caroline Minter, and Jonah E. Rockoff. 2004. "The impact of charter schools on student
achievement." (mimeo), (November). Murnane, Richard J., Stuart Newstead, and Randall Olsen. 1985. "Comparing public and private
schools: The puzzling role of selectivity bias." Journal of Business and Economic Statistics 3,no.1 (January):23-35.
Nathan, Joe. 1996. Charter schools: Creating hope and opportunity for American education. San
Francisco: Jossey-Bass Publishers. Neal, Derek. 1997. "The effect of Catholic secondary schooling on educational attainment."
Journal of Labor Economics 15,no.1, Part 1 (January):98-123. Nelson, F. Howard, Bella Rosenberg, and Nancy Van Meter. 2004. "Charter school achievement
on the 2003 National Assessment of Educational Progress." American Federation of Teachers (August).
Rivkin, Steven G., Eric A. Hanushek, and John F. Kain. 2005. "Teachers, schools, and academic
achievement." Econometrica 73,no.2 (March):417-458. Sander, William. 1996. "Catholic grade schools and academic achievement." Journal of Human
Resources 31,no.3 (Summer):540-548. ———. 2001. Catholic schools: Private and social effects. Boston: Kluwer Academic Publishers.

Sass, Tim R. 2005. "Charter schools and student achievement in Florida." Paper presented at
American Economic Association Annual Meetings. Philadelphia. Texas Center for Educational Research. 2003. Texas open-enrollment charter schools: Sixth year
evaluation. Austin, TX: Texas Center for Educational Research (July). U.S. Department of Education. 1999. State of charter schools third-year report. Washington, DC:
U.S. Department of Education.