Characterization of Dose-Dependent Metabolic Responses to Close Arterial Infusion of Cimaterol in...
12
T. M. Byrem, D. H. Beermann and T. F. Robinson cimaterol in the hindlimb of steers Characterization of dose-dependent metabolic responses to close arterial infusion of 1996, 74:2907-2916. J ANIM SCI http://jas.fass.org/content/74/12/2907 the World Wide Web at: The online version of this article, along with updated information and services, is located on www.asas.org by guest on July 14, 2011 jas.fass.org Downloaded from
-
Upload
independent -
Category
Documents
-
view
0 -
download
0
Transcript of Characterization of Dose-Dependent Metabolic Responses to Close Arterial Infusion of Cimaterol in...

T. M. Byrem, D. H. Beermann and T. F. Robinsoncimaterol in the hindlimb of steers
Characterization of dose-dependent metabolic responses to close arterial infusion of
1996, 74:2907-2916.J ANIM SCI
http://jas.fass.org/content/74/12/2907the World Wide Web at:
The online version of this article, along with updated information and services, is located on
www.asas.org
by guest on July 14, 2011jas.fass.orgDownloaded from
2907
1The authors gratefully acknowledge the technical assistance ofScott Butler, Bill English, Julie Ferguson, Kathy Finnerty, andJoanne Parsons. The authors also express their gratitude to YvesBoisclair for his useful discussions of experimental protocol.
2To whom correspondence should be addressed.Received March 18, 1996.Accepted August 1, 1996.
Characterization of Dose-Dependent Metabolic Responses to CloseArterial Infusion of Cimaterol in the Hindlimb of Steers1
Todd M. Byrem, Don H. Beermann2, and Todd F. Robinson
Department of Animal Science, Cornell University, Ithaca, NY 14853
ABSTRACT: Dose-dependent effects of cimaterol(CIM) on hindlimb metabolism were determined insix steers (247 ± 22 kg BW) using a close arterialinfusion. The external iliac vessels of both hindlimbswere catheterized to accommodate measurement ofblood flow, circulating concentrations, and net flux ofNEFA, lactate, and alpha-amino nitrogen (AAN)during infusion of CIM at 0, .05, .1, .3, .7, 1, and 3 mg/min. Close arterial infusion of CIM in the hindlimb ofsteers can be used to achieve a local concentrationelevation that is required to differentiate local andsystemic effects in vivo. Calculated plasma thresholdCIM concentration required to initiate cardiovascularresponses was 21 pg/mL, which resulted from aninfusion rate of .3 mg/min. Threshold concentrations ofCIM for stimulation of NEFA and lactate net flux in
the hindlimb were 38 and 34 pg/mL, respectively, andwould be achieved with an infusion rate of .7 mg/min.All measured responses except AAN net flux exhibitedsignificant linear and quadratic dose effects, andresponses in the treated hindlimb were always sever-alfold greater than in the contralateral control hind-limb. Maximal differences between treated and controlhindlimb blood flow occurred with a CIM infusion rateof .7 mg/min, but the highest infusion rate (3 mg/min)was required to maximize differences in NEFA andlactate flux. Therefore, to minimize cardiovascularand other systemic responses and optimize directhindlimb responses, an infusion rate of .5 mg of CIM/min should cause significant stimulation of beta-adrenergic receptors only in the CIM-infused hindlimbof young, growing steers.
Key Words: Cimaterol, Close Arterial Infusion, Hindlimb Metabolism, Steers
J. Anim. Sci. 1996. 74:2907–2916
Introduction
Certain synthetic beta-adrenergic agonists ( BAA)markedly stimulate skeletal muscle hypertrophy inmammals (Kim and Sainz, 1991). Although endocrinestatus is significantly altered by exogenous adminis-tration of these compounds (O’Connor et al., 1991),anabolic effects of BAA in various experimentalhormone deficiency models (Almond et al., 1988;Rothwell and Stock, 1988; Thiel et al., 1987), anddenervated laboratory animals (Zeman et al., 1987)argue for a direct effect of BAA on skeletal muscleprotein metabolism. Conversely, in vitro studies onisolated skeletal muscle preparations have yieldedequivocal results (Anderson et al., 1990; Harper et al.,1990; McMillan et al., 1992) and fail to demonstrate a
true muscle growth response even when proteinmetabolism has been altered by BAA (Li and Jeffer-son, 1977).
Chronic catheterization of external iliac vessels ingrowing cattle has been used for measurement of netflux of nutrients across the hindlimb (Boisclair et al.,1993a). This preparation is appropriate for the studyof the regulation of nutrient flux in skeletal muscle ingrowing cattle (Boisclair et al., 1993b, 1994), whereskeletal muscle accounts for approximately 62% of thehindlimb tissue mass. Pharmacological characteristicsof cimaterol (CIM), a synthetic BAA, are compatiblewith close arterial infusion to achieve and maintain anelevated differential concentration in contralateralhindlimbs of growing cattle (Byrem et al., 1992). Theobjectives of the present study were 1) to characterizethe dose-response relationships for direct metaboliceffects of CIM in the hindlimb of growing steers and2) to determine the thresholds for systemic responsesto CIM. These data are essential for subsequentinvestigations using a close arterial infusion to studythe mechanisms by which CIM alters proteinmetabolism in skeletal muscle in vivo.
by guest on July 14, 2011jas.fass.orgDownloaded from
BYREM ET AL.2908
Table 1. Composition of total mixed diet
aProvided a minimum of 2.9 g NaCl, 7.2 mg Mn, 8.5 mg Fe, 1.8mg Mg, 1.1 mg Cu, .3 mg Co, .2 mg I, and .2 mg Zn per kg of dietDM.
bProvided 2,200 IU of vitamin A, 1,100 IU of vitamin D, and 110IU of vitamin E per kg of diet DM.
Ingredient % of DM
Chopped timothy hay 33.1Cracked corn 57.4Soybean meal 8.3Limestone .8Trace mineralized salta .3Vitamin premixb .1
Materials and Methods
Animals. Protocols and procedures that involvedanimals used in this study were approved by theCornell University Institutional Animal Care and Usecommittee. Six Holstein steers (247 ± 22 kg BW and11 mo of age) were acclimated to the diet andexperimental conditions for 4 wk before surgery. Thediet (Table 1) was formulated to exceed by 10% thedaily nutritional requirements of large-frame steersgaining 1 kg/d (NRC, 1984). Ninety percent of theestimated daily ad libitum dry matter intake wasprovided in 24 hourly aliquots via a mechanical feederto facilitate the maintenance of steady-state nutrientfluxes. Access to water was free choice. The steerswere confined in metabolism stalls in a thermoneutralenvironment under a 16:8 h light:dark cycle.
Surgical Preparation. Feed and water were withheldfrom the steers for 24 and 12 h, respectively, beforesurgical placement of the catheters. Antibiotic(penicillin G procaine, Pfi-Pen G, Pfizer, New York)was administered the day before and for 3 d followingthe surgery. Anesthesia was induced with an in-travenous injection of xylazine (Rompun, .18 mg/kgBW) and maintained with 2% halothane(Fluothane) at 4 L O2/min using a semi-closedcircuit inhalation anesthetic unit.
Chronic catheterization of the external iliac vessels(artery and vein) of both hindlimbs was accomplishedwith a modification of the technique described byBoisclair et al. (1993a). The external iliac vesselswere catheterized through their corresponding medialsaphenous vessels through an incision made directlyadjacent to the medial condyle of the tibia. The arterywas catheterized first after lidocaine (Butler, Colum-bus, OH) was topically applied to minimize vasocon-striction during insertion of the catheter. A double-lumen catheter (Braintree Scientific, Braintree, MA)with the distal and proximal openings located 38 and41 cm from the anchoring cuff, respectively, was usedfor arterial sampling. The double-lumen cathetersallowed simultaneous sampling of arterial blood whileinfusing test solutions into the external iliac artery.Suture (Ethicon, Sommerville, NJ) was used to ligateeach vessel distally to the point of insertion and toanchor the respective catheter after insertion(Boisclair et al., 1993a). An additional length ofsuture was tied around the vessel and the catheterproximal to the point of insertion to stop bleeding andprovide additional support. Catheters were flushedwith heparinized saline (1,000 U/mL) that contained50,000 U/mL penicillin G sodium (Squibb, Princeton,NJ) before they were externalized 5 cm below theoriginal incision.
A large silastic catheter was secured with the tiplocated 25 cm into the medial saphenous vein. Thiscatheter accommodated access to the external iliacvein, which was sampled via a smaller PVC catheterinserted through the silastic catheter on the day of
sampling with the aid of a guide wire (Cook,Bloomington, IN) and silicone oil (RTU diluent,Allied Resin, East Weymouth, MA). The length of theinserted catheters required to ensure that the tipreside in the external iliac vein during sampling wasdetermined in vivo with reference to the bifurcation ofthe caudal vena cava into the left and right iliacvessels. The distance to the bifurcation was deter-mined for every venous preparation by infusing para-aminohippuric acid ( PAH, .5 M in equal-molarNaOH, pH = 7.4) into the external iliac artery andcalculating the apparent blood flow at 2-cm intervalsas the inserted catheter was withdrawn from the venacava distally toward the medial saphenous vein. Theconcentration of PAH in venous blood near thebifurcation would be markedly decreased (indicatinghigher blood flow) as a result of dilution by venousblood from the contralateral hindlimb, which was notinfused with PAH. Based on preliminary dissections,sampling catheter lengths ( ≈80 cm) were obtained bysubtracting 10 cm from the calculated distance to thebifurcation so the tip of the catheter would reside atthe midpoint of the external iliac vein. Correctplacement was verified postmortem. Before closing theincision, 2.5 × 10⁶ U of penicillin G sodium wassolubilized in saline and used to irrigate the incision.
All catheters were flushed every 48 h withheparinized saline (500 U/mL) that contained 25,000U/mL of penicillin G sodium to maintain patency.Cloth pouches were fixed to the medial side of the hockto store the catheters when not in use. A recoveryperiod of 2 wk was allowed before commencement ofthe infusions.
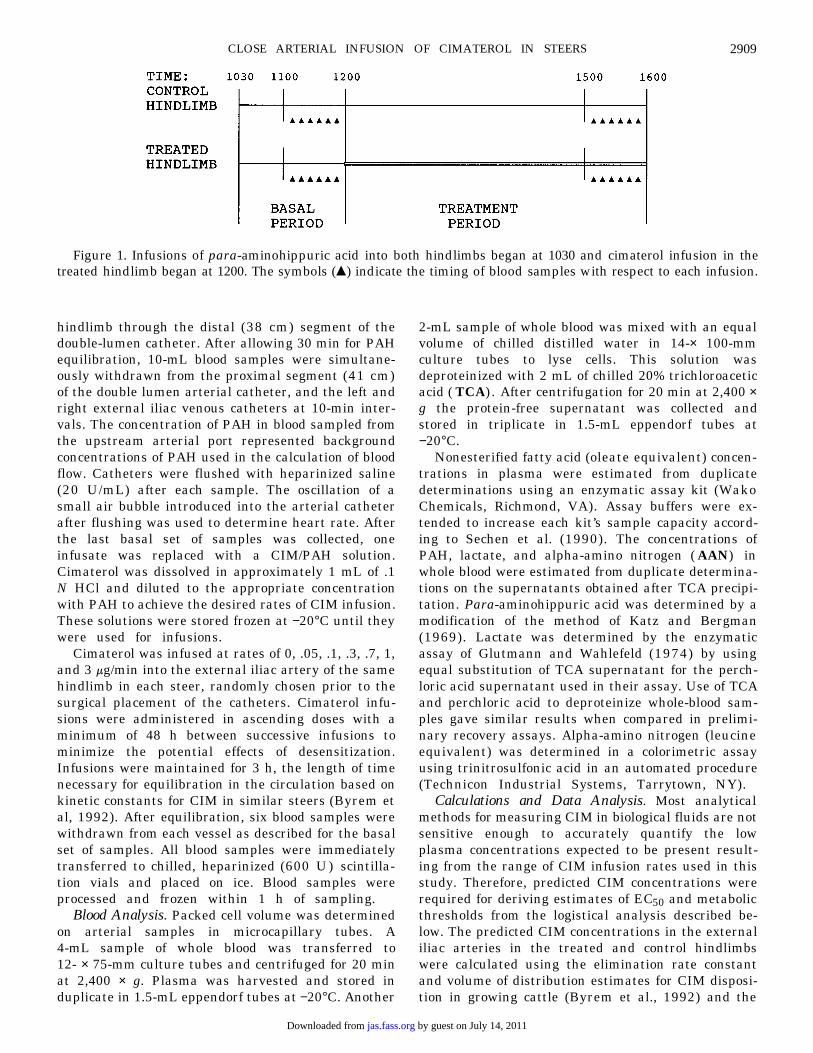
Infusions. The venous sampling catheters wereinserted through the silastic catheters and positionedin the external iliac veins just before the initiation ofeach infusion. Access to feed and water was main-tained, and the steers remained in a standing positionfor the entire infusion period, which lasted 5.5 h andincluded two 1-h sampling periods, basal and treated(Figure 1).
Infusions were initiated with a priming dose of 6mmol PAH followed by continuous infusion of .3 mmolPAH/min into the external iliac artery of each
by guest on July 14, 2011jas.fass.orgDownloaded from
CLOSE ARTERIAL INFUSION OF CIMATEROL IN STEERS 2909
Figure 1. Infusions of para-aminohippuric acid into both hindlimbs began at 1030 and cimaterol infusion in thetreated hindlimb began at 1200. The symbols (π) indicate the timing of blood samples with respect to each infusion.
hindlimb through the distal (38 cm) segment of thedouble-lumen catheter. After allowing 30 min for PAHequilibration, 10-mL blood samples were simultane-ously withdrawn from the proximal segment (41 cm)of the double lumen arterial catheter, and the left andright external iliac venous catheters at 10-min inter-vals. The concentration of PAH in blood sampled fromthe upstream arterial port represented backgroundconcentrations of PAH used in the calculation of bloodflow. Catheters were flushed with heparinized saline(20 U/mL) after each sample. The oscillation of asmall air bubble introduced into the arterial catheterafter flushing was used to determine heart rate. Afterthe last basal set of samples was collected, oneinfusate was replaced with a CIM/PAH solution.Cimaterol was dissolved in approximately 1 mL of .1N HCl and diluted to the appropriate concentrationwith PAH to achieve the desired rates of CIM infusion.These solutions were stored frozen at −20°C until theywere used for infusions.
Cimaterol was infused at rates of 0, .05, .1, .3, .7, 1,and 3 mg/min into the external iliac artery of the samehindlimb in each steer, randomly chosen prior to thesurgical placement of the catheters. Cimaterol infu-sions were administered in ascending doses with aminimum of 48 h between successive infusions tominimize the potential effects of desensitization.Infusions were maintained for 3 h, the length of timenecessary for equilibration in the circulation based onkinetic constants for CIM in similar steers (Byrem etal, 1992). After equilibration, six blood samples werewithdrawn from each vessel as described for the basalset of samples. All blood samples were immediatelytransferred to chilled, heparinized (600 U) scintilla-tion vials and placed on ice. Blood samples wereprocessed and frozen within 1 h of sampling.
Blood Analysis. Packed cell volume was determinedon arterial samples in microcapillary tubes. A4-mL sample of whole blood was transferred to12- × 75-mm culture tubes and centrifuged for 20 minat 2,400 × g. Plasma was harvested and stored induplicate in 1.5-mL eppendorf tubes at −20°C. Another
2-mL sample of whole blood was mixed with an equalvolume of chilled distilled water in 14-× 100-mmculture tubes to lyse cells. This solution wasdeproteinized with 2 mL of chilled 20% trichloroaceticacid ( TCA) . After centrifugation for 20 min at 2,400 ×g the protein-free supernatant was collected andstored in triplicate in 1.5-mL eppendorf tubes at−20°C.
Nonesterified fatty acid (oleate equivalent) concen-trations in plasma were estimated from duplicatedeterminations using an enzymatic assay kit (WakoChemicals, Richmond, VA). Assay buffers were ex-tended to increase each kit’s sample capacity accord-ing to Sechen et al. (1990). The concentrations ofPAH, lactate, and alpha-amino nitrogen ( AAN) inwhole blood were estimated from duplicate determina-tions on the supernatants obtained after TCA precipi-tation. Para-aminohippuric acid was determined by amodification of the method of Katz and Bergman(1969). Lactate was determined by the enzymaticassay of Glutmann and Wahlefeld (1974) by usingequal substitution of TCA supernatant for the perch-loric acid supernatant used in their assay. Use of TCAand perchloric acid to deproteinize whole-blood sam-ples gave similar results when compared in prelimi-nary recovery assays. Alpha-amino nitrogen (leucineequivalent) was determined in a colorimetric assayusing trinitrosulfonic acid in an automated procedure(Technicon Industrial Systems, Tarrytown, NY).
Calculations and Data Analysis. Most analyticalmethods for measuring CIM in biological fluids are notsensitive enough to accurately quantify the lowplasma concentrations expected to be present result-ing from the range of CIM infusion rates used in thisstudy. Therefore, predicted CIM concentrations wererequired for deriving estimates of EC50 and metabolicthresholds from the logistical analysis described be-low. The predicted CIM concentrations in the externaliliac arteries in the treated and control hindlimbswere calculated using the elimination rate constantand volume of distribution estimates for CIM disposi-tion in growing cattle (Byrem et al., 1992) and the
by guest on July 14, 2011jas.fass.orgDownloaded from
BYREM ET AL.2910
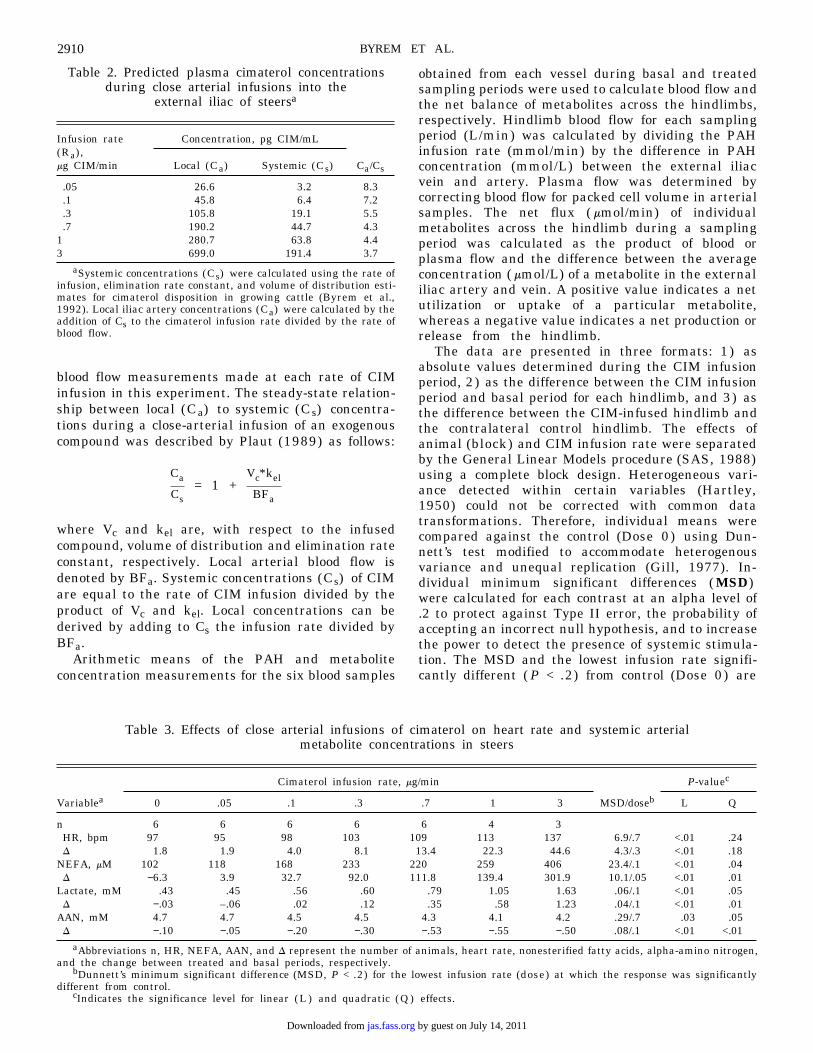
Table 3. Effects of close arterial infusions of cimaterol on heart rate and systemic arterialmetabolite concentrations in steers
aAbbreviations n, HR, NEFA, AAN, and D represent the number of animals, heart rate, nonesterified fatty acids, alpha-amino nitrogen,and the change between treated and basal periods, respectively.
bDunnett’s minimum significant difference (MSD, P < .2) for the lowest infusion rate (dose) at which the response was significantlydifferent from control.
cIndicates the significance level for linear ( L ) and quadratic ( Q ) effects.
Cimaterol infusion rate, mg/min P-valuec
Variablea 0 .05 .1 .3 .7 1 3 MSD/doseb L Q
n 6 6 6 6 6 4 3HR, bpm 97 95 98 103 109 113 137 6.9/.7 <.01 .24D 1.8 1.9 4.0 8.1 13.4 22.3 44.6 4.3/.3 <.01 .18
NEFA, mM 102 118 168 233 220 259 406 23.4/.1 <.01 .04D −6.3 3.9 32.7 92.0 111.8 139.4 301.9 10.1/.05 <.01 .01
Lactate, mM .43 .45 .56 .60 .79 1.05 1.63 .06/.1 <.01 .05D −.03 –.06 .02 .12 .35 .58 1.23 .04/.1 <.01 .01
AAN, mM 4.7 4.7 4.5 4.5 4.3 4.1 4.2 .29/.7 .03 .05D −.10 −.05 −.20 −.30 −.53 −.55 −.50 .08/.1 <.01 <.01
Table 2. Predicted plasma cimaterol concentrationsduring close arterial infusions into the
external iliac of steersa
aSystemic concentrations (Cs) were calculated using the rate ofinfusion, elimination rate constant, and volume of distribution esti-mates for cimaterol disposition in growing cattle (Byrem et al.,1992). Local iliac artery concentrations (Ca) were calculated by theaddition of Cs to the cimaterol infusion rate divided by the rate ofblood flow.
Infusion rate(Ra),mg CIM/min
Concentration, pg CIM/mL
Local (Ca) Systemic (Cs) Ca/Cs
.05 26.6 3.2 8.3
.1 45.8 6.4 7.2
.3 105.8 19.1 5.5
.7 190.2 44.7 4.31 280.7 63.8 4.43 699.0 191.4 3.7
blood flow measurements made at each rate of CIMinfusion in this experiment. The steady-state relation-ship between local (Ca) to systemic (Cs) concentra-tions during a close-arterial infusion of an exogenouscompound was described by Plaut (1989) as follows:
= 1 +Ca
Cs
*Vc kel
BFa
where Vc and kel are, with respect to the infusedcompound, volume of distribution and elimination rateconstant, respectively. Local arterial blood flow isdenoted by BFa. Systemic concentrations (Cs) of CIMare equal to the rate of CIM infusion divided by theproduct of Vc and kel. Local concentrations can bederived by adding to Cs the infusion rate divided byBFa.
Arithmetic means of the PAH and metaboliteconcentration measurements for the six blood samples
obtained from each vessel during basal and treatedsampling periods were used to calculate blood flow andthe net balance of metabolites across the hindlimbs,respectively. Hindlimb blood flow for each samplingperiod (L/min) was calculated by dividing the PAHinfusion rate (mmol/min) by the difference in PAHconcentration (mmol/L) between the external iliacvein and artery. Plasma flow was determined bycorrecting blood flow for packed cell volume in arterialsamples. The net flux ( mmol/min) of individualmetabolites across the hindlimb during a samplingperiod was calculated as the product of blood orplasma flow and the difference between the averageconcentration ( mmol/L) of a metabolite in the externaliliac artery and vein. A positive value indicates a netutilization or uptake of a particular metabolite,whereas a negative value indicates a net production orrelease from the hindlimb.
The data are presented in three formats: 1) asabsolute values determined during the CIM infusionperiod, 2) as the difference between the CIM infusionperiod and basal period for each hindlimb, and 3) asthe difference between the CIM-infused hindlimb andthe contralateral control hindlimb. The effects ofanimal (block) and CIM infusion rate were separatedby the General Linear Models procedure (SAS, 1988)using a complete block design. Heterogeneous vari-ance detected within certain variables (Hartley,1950) could not be corrected with common datatransformations. Therefore, individual means werecompared against the control (Dose 0) using Dun-nett’s test modified to accommodate heterogenousvariance and unequal replication (Gill, 1977). In-dividual minimum significant differences ( MSD)were calculated for each contrast at an alpha level of.2 to protect against Type II error, the probability ofaccepting an incorrect null hypothesis, and to increasethe power to detect the presence of systemic stimula-tion. The MSD and the lowest infusion rate signifi-cantly different ( P < .2) from control (Dose 0) are
by guest on July 14, 2011jas.fass.orgDownloaded from
CLOSE ARTERIAL INFUSION OF CIMATEROL IN STEERS 2911
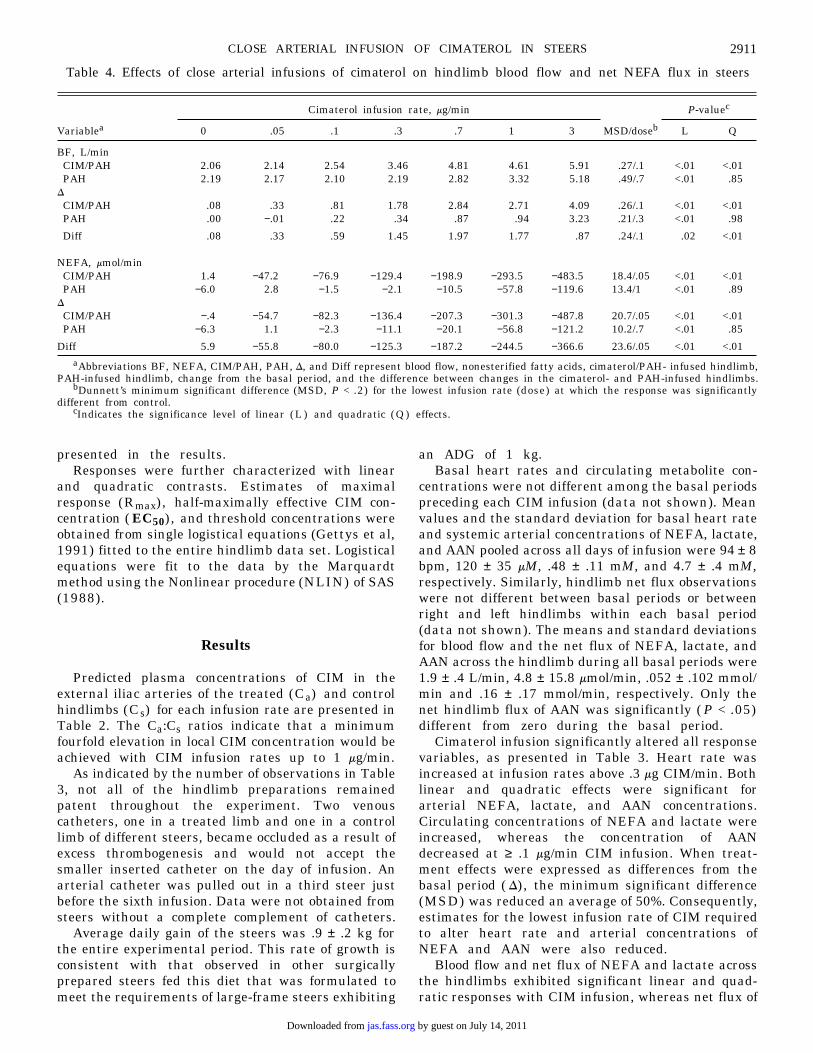
Table 4. Effects of close arterial infusions of cimaterol on hindlimb blood flow and net NEFA flux in steers
aAbbreviations BF, NEFA, CIM/PAH, PAH, D, and Diff represent blood flow, nonesterified fatty acids, cimaterol/PAH- infused hindlimb,PAH-infused hindlimb, change from the basal period, and the difference between changes in the cimaterol- and PAH-infused hindlimbs.
bDunnett’s minimum significant difference (MSD, P < .2) for the lowest infusion rate (dose) at which the response was significantlydifferent from control.
cIndicates the significance level of linear ( L ) and quadratic ( Q ) effects.
Cimaterol infusion rate, mg/min P-valuec
Variablea 0 .05 .1 .3 .7 1 3 MSD/doseb L Q
BF, L/minCIM/PAH 2.06 2.14 2.54 3.46 4.81 4.61 5.91 .27/.1 <.01 <.01PAH 2.19 2.17 2.10 2.19 2.82 3.32 5.18 .49/.7 <.01 .85
DCIM/PAH .08 .33 .81 1.78 2.84 2.71 4.09 .26/.1 <.01 <.01PAH .00 −.01 .22 .34 .87 .94 3.23 .21/.3 <.01 .98
Diff .08 .33 .59 1.45 1.97 1.77 .87 .24/.1 .02 <.01
NEFA, mmol/minCIM/PAH 1.4 −47.2 −76.9 −129.4 −198.9 −293.5 −483.5 18.4/.05 <.01 <.01PAH −6.0 2.8 −1.5 −2.1 −10.5 −57.8 −119.6 13.4/1 <.01 .89
DCIM/PAH −.4 −54.7 −82.3 −136.4 −207.3 −301.3 −487.8 20.7/.05 <.01 <.01PAH −6.3 1.1 −2.3 −11.1 −20.1 −56.8 −121.2 10.2/.7 <.01 .85
Diff 5.9 −55.8 −80.0 −125.3 −187.2 −244.5 −366.6 23.6/.05 <.01 <.01
presented in the results.Responses were further characterized with linear
and quadratic contrasts. Estimates of maximalresponse (Rmax) , half-maximally effective CIM con-centration ( EC50) , and threshold concentrations wereobtained from single logistical equations (Gettys et al,1991) fitted to the entire hindlimb data set. Logisticalequations were fit to the data by the Marquardtmethod using the Nonlinear procedure (NLIN) of SAS(1988).
Results
Predicted plasma concentrations of CIM in theexternal iliac arteries of the treated (Ca) and controlhindlimbs (Cs) for each infusion rate are presented inTable 2. The Ca:Cs ratios indicate that a minimumfourfold elevation in local CIM concentration would beachieved with CIM infusion rates up to 1 mg/min.
As indicated by the number of observations in Table3, not all of the hindlimb preparations remainedpatent throughout the experiment. Two venouscatheters, one in a treated limb and one in a controllimb of different steers, became occluded as a result ofexcess thrombogenesis and would not accept thesmaller inserted catheter on the day of infusion. Anarterial catheter was pulled out in a third steer justbefore the sixth infusion. Data were not obtained fromsteers without a complete complement of catheters.
Average daily gain of the steers was .9 ± .2 kg forthe entire experimental period. This rate of growth isconsistent with that observed in other surgicallyprepared steers fed this diet that was formulated tomeet the requirements of large-frame steers exhibiting
an ADG of 1 kg.Basal heart rates and circulating metabolite con-
centrations were not different among the basal periodspreceding each CIM infusion (data not shown). Meanvalues and the standard deviation for basal heart rateand systemic arterial concentrations of NEFA, lactate,and AAN pooled across all days of infusion were 94 ± 8bpm, 120 ± 35 mM, .48 ± .11 mM, and 4.7 ± .4 mM,respectively. Similarly, hindlimb net flux observationswere not different between basal periods or betweenright and left hindlimbs within each basal period(data not shown). The means and standard deviationsfor blood flow and the net flux of NEFA, lactate, andAAN across the hindlimb during all basal periods were1.9 ± .4 L/min, 4.8 ± 15.8 mmol/min, .052 ± .102 mmol/min and .16 ± .17 mmol/min, respectively. Only thenet hindlimb flux of AAN was significantly ( P < .05)different from zero during the basal period.
Cimaterol infusion significantly altered all responsevariables, as presented in Table 3. Heart rate wasincreased at infusion rates above .3 mg CIM/min. Bothlinear and quadratic effects were significant forarterial NEFA, lactate, and AAN concentrations.Circulating concentrations of NEFA and lactate wereincreased, whereas the concentration of AANdecreased at ≥ .1 mg/min CIM infusion. When treat-ment effects were expressed as differences from thebasal period ( D) , the minimum significant difference(MSD) was reduced an average of 50%. Consequently,estimates for the lowest infusion rate of CIM requiredto alter heart rate and arterial concentrations ofNEFA and AAN were also reduced.
Blood flow and net flux of NEFA and lactate acrossthe hindlimbs exhibited significant linear and quad-ratic responses with CIM infusion, whereas net flux of
by guest on July 14, 2011jas.fass.orgDownloaded from

BYREM ET AL.2912
Table 5. Effects of close arterial influsions of cimaterol on net hindlimb flux of lactateand alpha-amino nitrogen in steers
aAbbreviations AAN, CIM/PAH, PAH, D, and Diff represent alpha-amino nitrogen, cimaterol/PAH-infused hindlimb, PAH-infusedhindlimb, the change from the basal period and the difference between changes in the cimaterol- and PAH-infused hindlimb, respectively.
bDunnett’s minimum significant difference (MSD, P < .2) for the lowest infusion rate (dose) at which the response was significantlydifferent from control. The effects of cimaterol infusion were not significant ( P > .2) for net hindlimb flux of alpha-amino nitrogen; therefore,values presented are standard deviations of the means.
cIndicates the significance level of linear ( L ) and quadratic ( Q ) effects.
Cimaterol infusion rate, mg/min P-valuec
Variablea 0 .05 .1 .3 .7 1 3 MSD/doseb L Q
Lactate, mmol/minCIM/PAH .08 −.15 −.13 −.32 −.88 −1.22 −2.31 .08/.05 <.01 <.01PAH .05 −.03 .04 .07 −.07 −.20 −.62 .06/.7 <.01 .69
DCIM/PAH .01 −.18 −.16 −.38 −.93 −1.27 −2.35 .04/.05 <.01 <.01PAH −.04 −.02 −.01 −.02 −.13 −.30 −.66 .04/.7 <.01 .89
Diff .05 −.15 −.15 −.36 −.80 −.97 −1.69 .08/.05 <.01 <.01
AAN, mmol/minCIM/PAH .12 .07 .02 −.03 .13 .13 .12 .25 .57 .79PAH .13 .12 .06 −.05 .05 .29 −.10 .23 .37 .29
DCIM/PAH −.11 −.06 −.18 −.12 −.06 .03 −.04 .21 .43 .40PAH −.08 −.11 −.12 −.17 −.13 .27 −.20 .23 .98 .06
Diff −.03 .05 −.06 .05 .07 −.24 .16 .21 .43 .21
AAN was not changed (Tables 4 and 5). Significantchanges in blood flow and net flux of NEFA andlactate in the treated hindlimb were first observed atrates of .1, .05, and .05 mg CIM/min, respectively. Theresponses to incremental rates of CIM infusion werelinear in the contralateral control hindlimb. Signifi-cant changes in blood flow and net flux of NEFA andlactate were detected in the control hindlimb whenCIM was infused at rates of .7, 1, and .7 mg/min,respectively. When expressed as differences from basalvalues ( D) , the estimates for the lowest infusion raterequired to alter blood flow and NEFA release in thecontrol limb was reduced to .3 and .7 mg CIM/min,respectively.
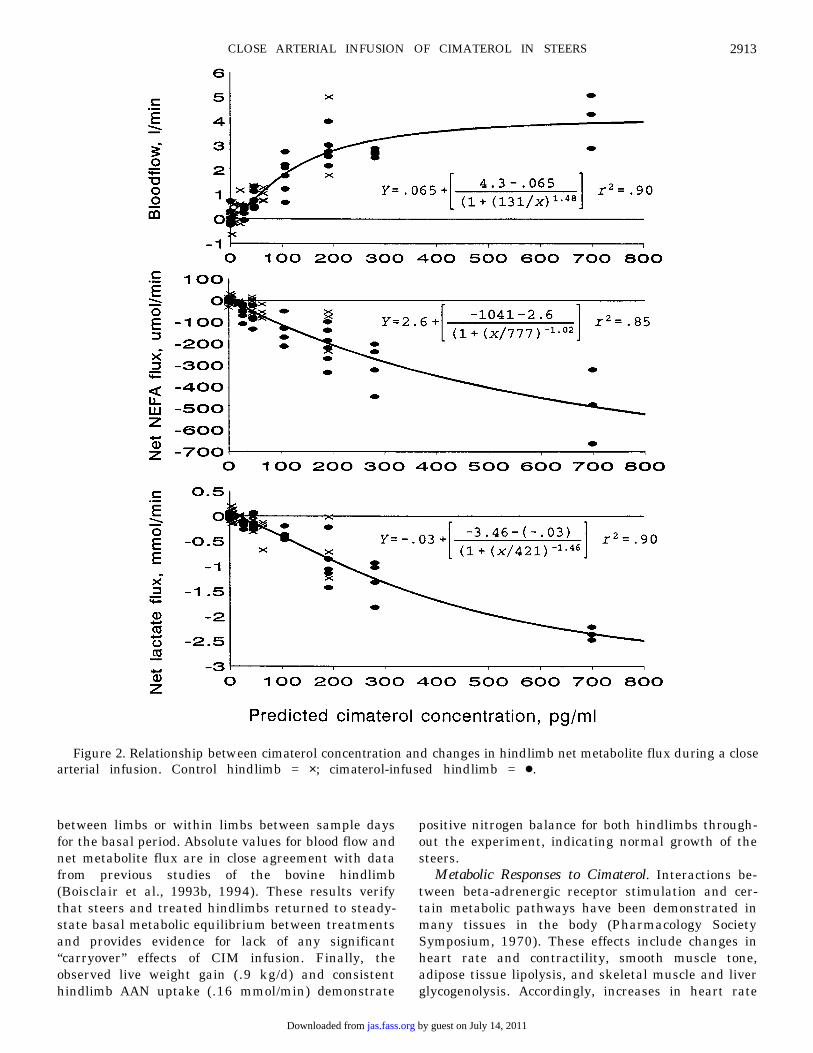
Combining the data from both the treated andcontrol hindlimbs allows derivation of single logisticalogives that describe the concentration-response rela-tionships as shown in Figure 2. Estimates of thresholdCIM concentrations for hindlimb blood flow and netflux of NEFA and lactate were 21, 38, and 34 pg CIM/mL, respectively. Corresponding estimates of EC50values and their standard deviations were 130 ± 30,780 ± 116, and 420 ± 188 pg CIM/mL, respectively.Maximum values for blood flow, net NEFA flux, andnet lactate flux were 4.3 ± .61 L/min, −1,040 ± 860mmol/min, and −3.5 ± 1.0 mmol/min.
Discussion
General Considerations. The validity of the presentresults and their physiological representation of hind-limb metabolism in young growing steers is dependent
on maintaining continuous, steady-state conditionsduring the entire experiment. More importantly,conclusions based on results obtained during thetreatment periods assume that a new metabolicequilibrium had been achieved (Zierler, 1961). Theseissues were addressed in preliminary comparisonswithin basal and treated periods and in analyseswithin the basal periods.
Metabolic effects of CIM are manifest withinminutes of initiating intravenous administration(Beermann, unpublished data), and new equilibriumconditions would be expected to result soon afterreaching maximal CIM concentrations 3 h after theinitiation of infusion (Byrem et al., 1992). Presence ofsteady-state conditions during treatment period sam-pling was verified by comparing the results obtainedfrom the first and last blood samples by paired t-tests(data not shown). Results demonstrated that therewere no significant differences between these sam-pling times for circulating metabolite concentrations,blood flow, or net metabolite flux in either hindlimbfor any CIM infusion rate. Therefore, the absence ofany trend in hindlimb response during this hourindicates that a steady-state equilibrium was presentduring this sampling time.
Analysis of variance of data collected during thebasal period detected no significant differences be-tween sampling days for heart rate, blood flow, orcirculating concentrations of NEFA, lactate, and AAN.Absolute values were in close agreement with datareported for cattle sampled with less invasive tech-niques (Blum et al., 1982; Zimmerli and Blum, 1990).Similarly, hindlimb metabolism was not different
by guest on July 14, 2011jas.fass.orgDownloaded from
CLOSE ARTERIAL INFUSION OF CIMATEROL IN STEERS 2913
Figure 2. Relationship between cimaterol concentration and changes in hindlimb net metabolite flux during a closearterial infusion. Control hindlimb = ×; cimaterol-infused hindlimb = ÿ.
between limbs or within limbs between sample daysfor the basal period. Absolute values for blood flow andnet metabolite flux are in close agreement with datafrom previous studies of the bovine hindlimb(Boisclair et al., 1993b, 1994). These results verifythat steers and treated hindlimbs returned to steady-state basal metabolic equilibrium between treatmentsand provides evidence for lack of any significant“carryover” effects of CIM infusion. Finally, theobserved live weight gain (.9 kg/d) and consistenthindlimb AAN uptake (.16 mmol/min) demonstrate
positive nitrogen balance for both hindlimbs through-out the experiment, indicating normal growth of thesteers.
Metabolic Responses to Cimaterol. Interactions be-tween beta-adrenergic receptor stimulation and cer-tain metabolic pathways have been demonstrated inmany tissues in the body (Pharmacology SocietySymposium, 1970). These effects include changes inheart rate and contractility, smooth muscle tone,adipose tissue lipolysis, and skeletal muscle and liverglycogenolysis. Accordingly, increases in heart rate
by guest on July 14, 2011jas.fass.orgDownloaded from
BYREM ET AL.2914
and circulating concentrations of NEFA and lactatehave been measured in domestic animals treated withBAA (Basset et al., 1970; Eisemann et al., 1988;Mersmann, 1989; Zimmerli and Blum, 1990; O’Connoret al., 1991).
Systemic CIM concentrations should have increasedlinearly with increasing infusion rate (Table 2).Therefore, systemic effects, such as heart rate andcirculating concentrations of metabolites, would beexpected to increase linearly prior to reaching max-imally stimulated values. A linear increase in heartrate beginning at an infusion rate of .3 mg CIM/mincorresponded well with the anticipated changes insystemic CIM concentrations. The systemic concentra-tion at an infusion rate of .3 mg CIM/min would havebeen approximately 20 pg/mL, and represents theapparent threshold for heart rate response in theseyoung steers. In humans and sheep, cardiovascularresponses are extremely sensitive to epinephrine withthreshold concentrations (80 to 120 pg/mL) thatapproach normal endogenous circulating concentra-tions (Bassett, 1970; Buhler et al., 1978; Webber andMacDonald, 1993). Because epinephrine is a mixedadrenergic agonist, the lower threshold concentrationfor CIM observed here is not unrealistic, although weare unaware of any direct comparisons between thetwo.
Close arterial infusion of CIM elicited dose-depen-dent increases in systemic NEFA (beginning at .05 mgCIM/min) and lactate (beginning at .1 mg CIM/min)concentrations and caused a dose-dependent decreasein systemic AAN concentration (beginning at .1 mgCIM/min). Both linear and quadratic componentswere significant for these variables, suggesting CIM-induced changes in circulating NEFA, lactate, andAAN concentrations were beginning to decline at thehighest rate of infusion. This was not anticipated withthe relatively low rates of CIM infusion used in thisstudy, because significantly greater changes inmetabolite levels have been observed in cattle fedother BAA (Eisemann et al., 1988; Zimmerli andBlum, 1990). Eisemann et al. (1988) reported a 75%reduction in plasma AAN concentration from 1.8 to .6mM in cattle 6 h after initial ingestion of 2 mg ofclenbuterol. A reduction of only 13% in AAN concen-tration was observed in the present study, and thismaximal response occurred with the 1 mg/min rate ofCIM infusion.
It is possible that the curvilinear changes incirculating blood metabolite levels are caused by thequadratic effects of CIM infusion on net metaboliteflux in the treated hindlimb (Tables 4 and 5). The netflux of NEFA and lactate from the treated hindlimb atthe higher doses are large relative to the predictedwhole-body turnover of these metabolites (Huntingtonet al., 1981; Pethick and Dunshea, 1993). Althoughtreatment with BAA would also be expected toincrease whole-body turnover of these metabolites, it
is probable that the route of infusion and low dosesused in the present study would cause a greater effecton turnover in the hindlimb than in the whole body.Thus, with the range of CIM infusions used in thisstudy, the significant output of NEFA and lactate fromthe treated hindlimb (Table 3) would represent asubstantial contribution to their circulating concentra-tions.
Similar logic cannot explain the curvilinear reduc-tion in circulating concentrations of AAN because nethindlimb flux of AAN was not altered by CIM. Othershave demonstrated that the stimulation of b-adrener-gic receptors reduces AAN levels (Shamoon et al.,1980; Eisemann et al., 1988), but the activity seems tobe associated with increased splanchnic uptake ofamino acids in fasted humans (Wernerman et al.,1985; Kraenzlin et al, 1989) or decreased release ofamino acids from the portal-drained viscera in well-finished steers (Eisemann and Huntington, 1993).Although the CIM-induced decline in blood AAN maynot be related to a direct effect of CIM on hindlimbnitrogen metabolism, there is evidence suggesting thatgreater NEFA availability can affect whole-bodyamino acid metabolism and reduce AAN levels (Tes-sari et al., 1986; Wicklmayr et al., 1987).
Alternatively, the quadratic component of thesystemic metabolite response curves may have beencaused by acute or chronic desensitization ofperipheral tissues to repeated exposure to CIM. Acutedesensitization is unlikely, however, because magni-tude of responses was similar between the first andsixth observation of each treatment period. Kim et al.(1992) did not observe b-adrenergic receptor down-regulation until several days of BAA treatment in therat. In the present study, CIM would have beencleared within 4 h after the end of each infusion period(Byrem et al., 1992), and total exposure to CIM wouldnot have exceeded 7 h. In addition, a minimum of 48 hbetween successive infusion rates was allowed, which,according to the results of Holmberg et al. (1981), issufficient time for complete recovery of skeletal musclerefractoriness to BAA administration in guinea pigs.The absence of chronic receptor down-regulation isunlikely because the heart rate response was linearand, for all variables, the basal values were consistentbetween infusion periods. In conclusion, changes incirculating concentrations of these metabolites are notgood indices of systemic stimulation caused by sys-temic spillover of CIM from the hindlimb during aclose arterial infusion.
Linear responses for blood flow and net NEFA andlactate flux in the control hindlimb are consistent withthe linear increase of estimated systemic CIM concen-trations during incremental rates of CIM infusion(Table 2). Thus, contralateral hindlimb data arebetter indices of systemic stimulation during a hind-limb close arterial infusion of CIM. Analysis of thedata indicated systemic stimulation by CIM, which
by guest on July 14, 2011jas.fass.orgDownloaded from
CLOSE ARTERIAL INFUSION OF CIMATEROL IN STEERS 2915
should be avoided during a close arterial infusion, waspresent at the infusion rates of .3 and .7 mg/min whenchanges in blood flow and hindlimb NEFA and lactatenet flux were evaluated. Figure 2 describes thelogistical relationship between these metabolicresponses and predicted CIM concentration when datawere combined from both the treated and controlhindlimbs. Threshold levels of CIM required to alterblood flow (21 pg/mL), lipid metabolism (38 pg/mL),and carbohydrate metabolism (34 pg/mL) in thehindlimb were calculated by solving each logisticalequation for the average minimum significant differ-ence ( P < .2). Use of the higher probability value ( P <.2) increases the sensitivity for detection of systemic“spillover.” Similar estimates for other BAA are notavailable, but the lower threshold for cardiovascularvs metabolic responses is in agreement with relativevalues summarized for epinephrine concentrations inhumans (Webber and MacDonald, 1993). Thesethreshold concentrations of CIM represent the bestestimates for systemic levels that initiate metabolicresponses in cattle.
Metabolic effects were evident in the treatedhindlimb at the lowest rate of CIM infusion, and themagnitude of the responses always exceeded thatobserved in the control limb (Tables 4 and 5). Allresponses except AAN net flux exhibited both linearand quadratic components in the dose-responsecurves. This was expected based on calculated valuesfor CIM concentrations in the treated hindlimb (Table2). However, quadratic effects were significant, evenwhen CIM concentration in the treated hindlimb wasused as the dependent variable (analysis not shown),indicating that maximal stimulation in the treatedhindlimb was approached with the range of CIMinfusions used in the present study.
The maximum levels of response obtained from thelogistical analysis of the changes in blood flow, netNEFA flux, and net lactate flux in the hindlimb were4.3 L/min, −1,040 mmol/min, and −3.5 mmol/min,respectively. Corresponding estimates for half-max-imal effective concentrations (EC50) were 130, 780,and 420 pg CIM/mL, respectively. The marked differ-ence in sensitivity (EC50) between cardiovascular andother metabolic effects of b-stimulation has beendemonstrated previously in ruminants (Bassett,1970). Estimates of Rmax and EC50 for epinephrineeffects on heart rate, cardiac output, NEFA, glycerol,and lactate concentrations have been obtained inhumans (Webber and MacDonald, 1993) and cattle(Sechen et al., 1990), but these estimates represent asummation of effects that occur in peripheral tissuesand metabolic organs. In contrast, Rmax and EC50estimates obtained with the hindlimb preparationcharacterize the in vivo stimulation of glycogenolysisand(or) glycolysis and lipolysis in muscle and adiposetissue, respectively, independent of effects in the liverand other major metabolic organs. We are unaware of
other published in-vivo estimates of Rmax and EC50 forBAA stimulation of these metabolic pathways inspecific tissues.
In summary, results from this study demonstratethat close arterial infusion of CIM in the hindlimb ofsteers can be used to achieve the local concentrationelevation that is required to differentiate local andsystemic effects in vivo. The rate of CIM infusionrequired to achieve threshold concentrations wasdifferent for individual response variables studied.Although the difference between responses in treatedand control limbs increased with increasing rates ofCIM infusion, rates of .7 mg/min and above causedsignificant responses in the contralateral control limb,thereby violating the definition of a close arterialinfusion. We conclude that CIM infusion rates below .7mg/min will satisfy all qualifying criteria for a closearterial infusion in the steer hindlimb preparation.
Implications
Response profiles are required to determine ap-propriate close arterial infusion rates for the study ofdirect effects of compounds on tissue metabolism. ForB-adrenergic agonist effects in the hindlimb, changesin systemic concentrations of nonesterified fatty acids,lactate, and d-amino N are poor indices of systemicstimulation during close arterial infusions. Instead,characterization of the hindlimb response profile tocimaterol, particularly in the contralateral controlhindlimb, provided essential information for the deter-mination of an appropriate dose for close arterialinfusion. Cimaterol infused at a rate of .5 mg/min intothe hindlimb of steers will allow the study of directeffects of B-adrenergic agonists on skeletal musclemetabolism in vivo.
Literature Cited
Almond, R. E., M. A. Cawthorne, and M. Enser. 1988. Muscles ofdiabetic (DB/DB) mice: Fiber size, fiber type and the effects ofa thermogenic, b-adrenoceptor agonist. Int. J. Obes. 12:81.
Anderson, P. T., W. G. Helferich, L. C. Parkhill, R. A. Merkel, andW. G. Bergen. 1990. Ractopamine increases total and myofibril-lar protein synthesis in cultured rat myotubes. J. Nutr. 120:1677.
Basset, J. M. 1970. Metabolic effects of catecholamines in sheep.Aust. J. Biol. Sci. 23:903.
Blum, J. W., D. Froehli, and P. Kunz. 1982. Effects of catechola-mines of plasma free fatty acids in fed and fasted cattle.Endocrinology. 110:452.
Boisclair, Y. R., D. E. Bauman, A. W. Bell, F. R. Dunshea, and M.Harkins. 1994. Nutrient utilization and protein turnover in thehind limb of cattle treated with bovine somatotropin. J. Nutr.124:664.
Boisclair, Y. R., A. W. Bell, and D. E. Bauman. 1993a. Chroniccatheterization of external iliac vessels in growing cattle. J.Appl. Physiol. 74(1):444.
Boisclair, Y. R., A. W. Bell, F. R. Dunshea, M. Harkins, and D. E.Bauman. 1993b. Evaluation of the arteriovenous difference
by guest on July 14, 2011jas.fass.orgDownloaded from
BYREM ET AL.2916
technique to simultaneously estimate protein synthesis anddegradation in the hindlimb of fed and chronically underfedsteers. J. Nutr. 123:1076.
Buhler, H. V., M. D. Daprada, W. Haefely, and G. B. Picotti. 1978.Plasma adrenaline, noradrenaline and dopamine in man anddifferent animal species. J. Physiol. 276:311.
Byrem, T. M., T. F. Robinson, Y. R. Boisclair, A. W. Bell, W. S.Schwark, and D. H. Beermann. 1992. Analysis and phar-macokinetics of cimaterol in growing holstein steers. J. Anim.Sci. 70:3812.
Eisemann, J. H., and G. B. Huntington. 1993. Effects of dietaryclenbuterol on net flux across the portal-drained viscera, liverand hindquarter of steers (BOS TAURUS). Comp. Biochem.Physiol. 104C(3):401.
Eisemann, J. H., G. B. Huntington, and C. L. Ferrell. 1988. Effectsof dietary clenbuterol on metabolism of the hindquarters insteers. J. Anim. Sci. 66:342.
Gill, J. L. 1977. Multiple comparisons of means when variance is nothomogeneous. J. Dairy Sci. 60:444.
Gettys, T. W., V. Ramkumar, R. J. Uhing, L. Seger, and I. L. Taylor.1991. Alterations in mRNA levels, expression and function ofGTP-binding regulatory binding proteins in adipocytes fromobese mice (C57BL/GJ/ob/ob). J. Biol. Chem. 266:15949.
Glutmann, N. I., and A. W. Wahlefeld. 1974. L-(+)-lactate determi-nation with lactate dehydrogenase and NAD. In: H. V. Berg-meyer (Ed.) Methods of Enzymatic Analysis. (2nd Ed.). pp.1464−1467. Academic Press, London.
Harper, J.M.M., I. Mackinson, and P. J. Buttery. 1990. The effects ofbeta-agonists on muscle cells in culture. Domest. Anim. En-docrinol. 72:477.
Hartley, H. Q. 1950. The maximum F-ratio as a short-cut test forheterogeneity of variance. Biometrika 37:308.
Holmberg, E., A. B. Jeppsson, and B. Waldeck. 1981. Selectivedevelopment of tolerance to b-adrenoceptor agonists in skeletalmuscle as compared with airway smooth muscle from theguinea-pig. Clin. Exp. Pharmacol. Physiol. 8:49.
Huntington, G. B., R. L. Prior, and R. A. Britton. 1981. Glucose andlactate absorption and metabolic interrelationships in steerschanged from low to high carbohydrate diets. J. Nutr. 110:1904.
Katz, M. L., and E. N. Bergman. 1969. Simultaneous measurementsof hepatic and portal venous blood flow in the sheep and dog.Am. J. Physiol. 216:946.
Kim, Y. S., and R. D. Sainz. 1991. Minireview: b-adrenergic agonistsand hypertrophy of skeletal muscles. Life Sci. 50:397.
Kim, Y. S., R. D. Sainz, R. J. Summers, and P. Molennar. 1992.Cimaterol reduces b-adrenergic receptor density in rat skeletalmuscles. J. Anim. Sci. 70:115.
Kraenzlin, M. E., V. Keller, A. Keller, A. Thelin, M. J. Arnaud, andW. Strauffacher. 1989. Elevation of plasma epinephrine concen-trations inhibits proteolysis and leucine oxidation in man via -adrenergic mechanisms. J. Clin. Invest. 84:388.
Li, J. B., and L. S. Jefferson. 1977. Effect of isoproterenol on aminoacid levels and protein turnover in skeletal muscle. Am. J.Physiol. 1(2):E243.
McMillan, D. N., B. S. Noble, and C. A. Maltin. 1992. The effect ofthe b-adrenergic agonist clenbuterol on growth and proteinmetabolism in rat muscle cell cultures. J. Anim. Sci. 70:3014.
Mersmann, H. J. 1989. Acute changes in blood flow in pigs infusedwith b-adrenergic agonists. J. Anim. Sci. 67:2913.
NRC. 1984. Nutrient Requirements of Beef Cattle (6th Rev. Ed.).National Academy Press, Washington, DC.
O’Connor, R. M., W. R. Butler, K. D. Finnerty, D. E. Hogue, and D.H. Beermann. 1991. Acute and chronic hormone and metabolitechanges in lambs fed the beta-agonist, cimaterol. Domest.Anim. Endocrinol. 8:537.
Pethick, D. W., and F. R. Dunshea. 1993. Fat metabolism andturnover. In: F. M. Forbes and F. France (Ed.) QuantitativeAspects of Ruminant Digestion and Metabolism. pp 291−312.University Press, Cambridge, U. K.
Pharmacology Society Symposium. 1970. Adrenergic receptors medi-ating metabolic responses. Fed. Proc. 29:1350.
Plaut, K. 1989. Endocrine regulation of lactation: Prolactin,somatotropin, and insulin-like growth factor-1. Ph.D. Disserta-tion. Cornell University, Ithaca, NY.
Rothwell, N. J., and M. J. Stock. 1988. Increased body weight gainand body protein in castrated and adrenalectomized ratstreated with clenbuterol. Br. J. Nutr. 60:355.
SAS. 1988. SAS/STAT User’s Guide (Release 6−03). SAS Inst.Inc., Cary, NC.
Sechen, S. J., F. R. Dunshea, and D. E. Bauman. 1990. Somatotropinin lactating cows. Effects on response to epinephrine and insu-lin. Am. J. Physiol. 258:E582.
Shamoon, H., R. Jacob, and R. S. Sherwin. 1980. Epinephrine-induced hypoaminoacidemia in normal and diabetic humansubjects. Effect of beta blockade. Diabetes 29:875.
Tessari, P., S. L. Nissen, J. M. Miles, and M. W. Haymond. 1986.Inverse relationship of leucine flux and oxidation to free fattyacid availability in vivo. J. Clin. Invest. 77:575.
Thiel, L. F., D. H. Beermann, V. K. Fishell, and B. A. Crooker. 1987.Effects of cimaterol on growth of hypophysectomized rats. Fed.Proc. 46:1176.
Webber, J., and I. A. MacDonald. 1993. Metabolic actions ofcatecholamines in man. Bailliers Clin. Endocrinol. Metab. 7(a):393.
Wernerman, R., R. Brandt, T. Strandell, L.-G. Allgen, and E. Vin-nars. 1985. The effect of stress hormones on the inter-organflux of amino acids and on the concentration of free amino acidsin skeletal muscle. Clin. Nutr. 4:207.
Wicklmayr, M., K. Rett, B. Schweigelshohn, G. Wolfram, S. Hailer,and G. Dietze. 1987. Inhibition of muscular amino acid releaseby lipid infusion in man. Eur. J. Clin. Invest. 17:301.
Zeman, R. J., R. Ludemann, and J. D. Etlinger. 1987. Clenbuterol, ab2-agonist retards atrophy in denervated muscles. Am. J. Phys-iol. 252:E152.
Zierler, K. L. 1961. Theory of the use of arteriovenous concentrationdifferences for measuring metabolism in steady and non-steadystates. J. Clin. Invest. 40:2111.
Zimmerli, V. V., and J. W. Blum. 1990. Acute and long term meta-bolic endocrine respiratory, cardiac and skeletal muscle activitychanges in response to perorally administered b-adrenoceptoragonists in calves. J. Anim. Physiol. Anim. Nutr. 64:157.
by guest on July 14, 2011jas.fass.orgDownloaded from

Citationshttp://jas.fass.org/content/74/12/2907#otherarticlesThis article has been cited by 1 HighWire-hosted articles:
by guest on July 14, 2011jas.fass.orgDownloaded from