Redefining Art and Culture: The Welsh Arts Council’s Art and Society Exhibition Series 1969-1976
Upload
khangminh22Category
view
0download
0
CHAPTER IV
SOCIAL, CULTURE, ARTS and
ECONOMIC SCIENCE
Proceedings of The 1th Almuslim International Conference on Science, Technology and Society (AICSTS) 2015
November 7-8, 2015, Bireuen, Indonesia
Editor in Chief : Prof. Dr. Drh. Darmawi (University of Syiah Kuala, Indonesia)
Editors :
Prof. Mohamad Ali Fulazzaky (University Teknologi Malaysia)
Prof. Gloria Sheila E. Coyoca (Mindanao State University – Iligan Institute of
Technology, Philippines)
Prof. Dr. Jamaluddin Iddris, M.Ed (UIN Arraniry, Indonesia)
Prof. Dr. Abdul Hamid, M.Pd (State University of Medan, Indonesia)
Dr. Gregory Vanderbilt (Department of History, UCLA/ CRCS)
Natsuko Saeki, P.hD (Nagoya Gaekin University, Japan)
Dr. Boriboon Pinprayong (AIT, Thailand)
Dr. H.M. Sayuti, M.Sc (Malikussaleh University, Indonesia)
Dr. Halus Satriawan, S.P, M.Si (Almuslim University, Indonesia)
ISSN : 2477-1899
Copyright © 2015 Printed November 2015

Message from the Rector
Assalamu’alaikum Wr. Wb.
Greetings.
Ladies and gentlemen,
It is an honor indeed to open this conference, the 1stAlmuslim International Conference on Science,
Technology, and Society (AICSTS). On behalf of Almuslim University (Umuslim), I would like to extend a
warm welcome to all participants and our speakers who are with us to make this a notable and exciting
event a success.
At Almuslim University, we emphasize the best possible achievements in education and research and are
also committed to innovation and technology. Today, we are faced with more challenges in these
spheres, and therefore, as members of the academic community, we have a duty to find innovative
research solutions for them. Hence, this conference is an excellent forum for experts, professionals,
researchers, and students as well, to present, share, and discuss their knowledge and experiences with
all of us. In line with such idealism, it is really a privilege for us to host you, not just this year, but for years
to come, to give and provide opportunities to contribute lasting and practical solutions to the challenges
that confront us from time to time. This conference includes keynote speeches, oral and poster parallel
sessions on topics in the field of sciences, life sciences, engineering, social sciences and humanities.
Finally, we know that in the origination of this conference there may be some shortcomings, for which we
would like deeply apologize in advance to all of you. This is the University’s first experience in organizing
an international conference like this. With deepest sincerity hereby we would also like to thank all the
keynote speakers for your contribution, time and support for this conference. Our heartfelt appreciation
goes to all the authors of the selected papers for their effort and hard work. I also would like thank the
organizing committee of the conference for their hard work in making this event a success. I wish to
encourage them to continue organizing more events and to take other initiatives as well in future. To
support and sustain important research linkages for dialogue and facilitate exchanges of ideas such as
this will certainly generate more new discoveries and innovations in years to come. It is everyone’s
optimism that all we will learn from this first international conference in 2015 will be used as a reference
for the development of research, as well as guidance for the readers in education and in academic
profession.
I am sure the committee of this conference has served you in the best way they can to make your brief
stay with us a lasting memory.
Thank you.
Dr. Amiruddin Idris, SE, M.Si
Message from the Committee Chairman
Assalamu’alaikum Wr. Wb.
Greetings,
Ladies and Gentlemen,
I would like to take this occasion to cordially welcome all participants of the 1stAlmuslim International
Conference on Science, Technology, and Society (AICSTS). This conference is held at our beloved
campus of Almuslim University (Umuslim), Bireuen, from November 7th to November 8th, 2015. Almuslim
University, the home of 7 faculties, is one of the major private universities in Aceh. We are assured that
the 416 scientific participants will contribute to productive discussions and exchanges of scientific
experiences that will bring about success to this conference. Participants from 9 countries, Indonesia,
Malaysia, Thailand, Philippines, United States, India, Taiwan, England, and Qatar, have optimally marked
an international scope to the conference.
I would like to express my gratitude to the Coordination of Private Higher Education Regional XIII Aceh,
the Institute of Research and Community Services of Almuslim University and the committee members for
helping us in organizing the conference. The conference and proceedings are a credit to a large group of
people and everyone should be proud of the outcome.
We are delighted with the vast responses of 152 submissions from researchers and practitioners. The
knowledge bases that we are aiming to generate in the conferences topics are overwhelming due to the
involvement of these experts from various fields of studies. Their papers will be published in the
proceedings to provide permanent records of what has been presented. The proceedings are divided into
four, Life Sciences, Engineering, Social Sciences and Humanities (Science Educations), and Social
Sciences and Humanities (Economics, Social and Arts), and the papers published here will exhibit the
current state of development in all aspects of important topics that are instrumental to all researchers in
the various fields. They have succeeded in bringing together various aspects of developments and
innovations in knowledge and technology that will benefit not only the academic community, but the
society itself as well.
We realize that there are still many shortcomings in the implementation of the arrangements of this
conference. Therefore at this opportunity we also expect criticism and constructive suggestions from all
stakeholders so that the conference arrangements in future will be more successful. Finally we would like
to thank you all for all the support and assistance you have contributed to making this conference and its
proceedings successful.
Thank you,
Drs. Marwan Hamid, M.Pd
KKEEYYNNOOTTEE SSPPEEAAKKEERRSS
Boriboon Pinprayong:
ASEAN ICT Manpower: (Case Study of Thailand, Indonesia, and Vietnam) 1
Mohamad Ali Fulazzaky:
Water Quality Evaluation System for Assessing the Status and Suitability
of the Citarum River Water for Various Uses and Its Aquatic Ecosystem 12
Gregory Vanderbilt:
Religious Memory and Scientific Ethics after Hiroshima and Nagasaki 28
Gloria Shiela E Coyoca:
Undertaking Global Health Issues through Research and Innovation 36
Cornelis Johan (Keess) Stigter:
Climate Change: Its Danger for Our Production and Why it Escapes
Our Prediction 38

Proceedings of The 1th Almuslim International Conference on Science, Technology and Society (AICSTS) 2015
November 7-8, 2015, Bireuen, Indonesia
1
ASEAN ICT Manpower: (Case Study of Thailand, Indonesia, and
Vietnam)
Boriboon Pinprayong
Adjunct Researcher of Internet Education and Research Laboratory, Asian Institute of Technology,
Thailand
Corressponding Author: [email protected]
Abstract
This study investigates the situations of ICT manpower in Thailand, Indonesia, and
Vietnam in 2012 and performs a projection of ICT manpower for 2018. This study
involved both qualitative and quantitative research approaches. It describes the ICT
development policies in the three countries to provide some context of the study. In-
depth interviews and questionnaires were conducted to collect data from ICT manpower
in core ICT industries, non-ICT industries and education sectors. The majority of ICT
manpower in Thailand, Indonesia and Vietnam obtained a bachelor’s degree, and are
currently officer/technician/ engineer. In addition, the average salary rate is 690 USD in
Thailand, 630 USD in Indonesia, and 350 USD in Vietnam. In 2018, the number of ICT
manpower in Thailand will have about 634,981 persons, 3,122,800 persons in
Indonesia, and 868,136 persons in Vietnam. It is found in the study that the ICT
manpower in these countries has the same weakness, which is English communication.
Regarding AEC, most ICT companies in three countries will gain advantages from AEC
by seeking business opportunities and expanding businesses. This is an empirical study
which investigates cross-country the profile of the ICT Manpower in Thailand,
Indonesia, and Vietnam in 2012. It identifies the strengths and weaknesses of ICT
manpower in the three countries based on the survey data obtained. Based on the
results, it offers some recommendations on how to develop ICT manpower for a global
labour-market competition and ASEAN.
Keywords: ASEAN, ICT Manpower, Thailand, Indonesia, Vietnam, ICT Professional
Standards
Introduction
Nowadays, information technology has been rapidly changed with respect to an algorithm, structure and
platform. In order to cope with the challenges of the waves of innovation and technological changes,
ASEAN submitted ICT development in the next five years under the name “ASEAN ICT Masterplan 2015

Proceedings of The 1th Almuslim International Conference on Science, Technology and Society (AICSTS) 2015
November 7-8, 2015, Bireuen, Indonesia
2
(AIM 2015)”. This Masterplan is driven by six strategies of economic transformation, people
empowerment and engagement, innovation, infrastructure development, human capital development, and
bridging the digital divide to deliver 4 key outcomes: 1) ICT as an engine of growth for ASEAN countries,
2) recognition for ASEAN as a global ICT hub, 3) enhanced quality of life for peoples of ASEAN, and 4)
contribution towards ASEAN integration (ASEAN, 2011). As a result, ASEAN Membership: Brunei
Darussalam, Cambodia, Indonesia, Laos, Malaysia, Myanmar, Philippines, Singapore, Thailand, and
Vietnamwill planto develop their ICT infrastructures and ICT manpower. Nevertheless, factors that affect
the development and capacity of ICT manpower in ASEAN countries are: 1) the mechanisms of education
and innovation, 2) the support for ICT infrastructure in the country, 3) facilities of education/training, 4) the
wages of labour, 5) the desire for a country to move forward, 6) the level of the community's economy,
and 7) Government policies related to ICT.
The paper first describes briefly the ICT development policies of Thailand, Indonesia and Vietnam. Then,
it discusses ICT professional standards, and describes the research methodology and data collection.
After that, it provides the results of the quantitative and qualitative analyses on the current situations of
ICT manpower, number of the ICT manpower, need for ICT manpower in market, strengths and
weaknesses of ICT manpower, professional standards of ICT employees. Finally, it provides the impacts
of ASEAN Economic Community (AEC) and ICT business trends in Thailand, Indonesia, and Vietnam.
ICT Development Policies in Thailand, Indonesia and Vietnam
In 2011, Thailand had been upgraded income categorization from a lower-middle income economy to an
upper-middle income economy by The World Bank, and rank sixty-seven in the Networked Readiness
Index in 2015 by The World Economic Forum. In order to enhance the competitiveness of the Thai
industrial sector and prepare Thailand for the ASEAN Economic Community, the Government has
revealed the Masterplan under name “Digital Economy”. This Masterplan covers in four areas: Digital
Commerce, Digital Entrepreneur, Digital Innovation, and Digital Content, and consists of five strategies,
namely, Hard Infrastructure, Soft Infrastructure, Service Infrastructure, Digital Economy Promotion, and
Digital Society (GSMA, 2015).
According to Thailand ICT Development Policy, the Ministry of Information and Communication
Technology (MICT) has formulated the ICT 2020 Policy Framework. According to vision and goals of the
ICT 2020 policy, “ICT is a key driving force in leading Thai people towards knowledge and wisdom and
leading society towards equality and sustainable economy” (NECTEC, 2011). Furthermore, the ICT 2020
policy framework set five strategies: Strategy 1: Universal and secure ICT and broadband infrastructure,
Strategy 2: ICT Human Resource and ICT Competent Workforce to emphasise the development of ICT
employees’ knowledge and skills and the expansion of a number and quality highly-skilled ICT manpower
based on international standard. Strategy 3: ICT industry competitiveness and ASEAN integration,
Strategy 4: Smart government: ICT for government service innovation and good governance, and
Strategy 5: ICT for Thailand competitiveness and vibrant economy.
Proceedings of The 1th Almuslim International Conference on Science, Technology and Society (AICSTS) 2015
November 7-8, 2015, Bireuen, Indonesia
3
Indonesia has the largest of population in ASEAN and ranks seventy-nine in the Networked Readiness
Index in 2015. In order to develop Indonesia as one of the world’s main food suppliers, the Government
has revealed the Masterplan for the Acceleration and Expansion of Economic Development of Indonesia
(MP3EI). This plan is implemented for the period of 2005-2025 by focusing on eight main programs,
namely the development of agriculture, mining, energy, industry, maritime, tourism, telecommunication,
and development of strategic zones. The implementation strategy of MP3EI will integrate three main
elements: 1) developing the regional economic potential in six Indonesia Economic Corridors: Sumatra
Economic Corridor, Java Economic Corridor, Kalimantan Economic Corridor, Sulawesi Economic
Corridor, Bali – Nusa Tenggara Economic Corridor, and Papua – Kepulauan Maluku Economic Corridor;
2) strengthening national connectivity locally and internationally; and 3) strengthening human resource
capacity and national science & technology to support the development of main programs in every
economic corridor (Ministry for Economic Affairs, 2011).
According to ICT development, this Masterplan emphasises ICT industry development in Java Economic
Corridor only. Furthermore, in order to link the producers and users of science and technology, the
government of Indonesia established intermediary institutions to achieve this objective such as Business
Innovation Center (BIC), Business Technology Center (BTC), Center for Innovation - LIPI, Center for
Nuclear Partnership - BATAN, BPPT engineering, and Technology Incubator Center – BPPT.
Meanwhile, Vietnam has quickly and continuously developed all ICT sectors, and ranks eighty-five in the
Networked Readiness Index in 2015. In order to develop Vietnam into an industrialised and modernised
country in 2020, the government has revealed Vietnam’s Socio-Economic Development Strategy for the
period of 2011-2020 (Ministry of Planning and Investment, 2012). This strategy is aimed to stimulate
investments in major industries through tax incentives, for example, goods export, agriculture and
forestry, advanced technology industries (such as manufacturing computer software and components),
environment, research and development, labour intensive industries, and natural resources and
infrastructure.
Regarding ICT development in Vietnam, Ministry of Information and Communication set the National
strategies and plannings on ICT development to drive ICT sector during 2011-2020. . In 2013, the
Government of Vietnam established the National Commission on Application Information Technology
(NCAIT) to promote the use and development of IT in state agencies. Moreover, Vietnam expanded ICT
sector to upcountry by establishing Department of Information Communication in 63 provinces (MIC,
2014). As for ICT manpower development, by the end of the year 2013, Vietnam had 290 universities and
colleges and 228 vocational schools which offered training courses on telecommunications and IT majors
with the total enrollment quota exceeding 80.000 students (MIC, 2014).
ICT Professional Standards
The ICT professional standards have been used to measure or evaluate each individual ICT employee in
terms of potential, skills, attitudes, competency, and knowledge. In addition, the ICT professional
standard can enable public and private organisationsto more effectively recruit and develop ICT
Proceedings of The 1th Almuslim International Conference on Science, Technology and Society (AICSTS) 2015
November 7-8, 2015, Bireuen, Indonesia
4
employees. Based on the existing relevant data and information, it is found that various ICT professional
standards to implement in several countries.InEurope, the European Commission developed and
implemented European Qualification Framework (EQF) and European e-Competence Framework (e-
CF).The EQF uses to compare the education standard levels between the European Union member
countries. The e-CFaims to develop ICT manpower, and support all industries in Europe. In the United
Kingdom (UK), government developed The ICT professional standards under name Skills Framework for
the Information Age (SFIA). In Asia, Japan proposed standard under name Skill Standards for IT
Professional (ITSS).
Meanwhile, ASEANhave developed ICT professional standard, in order to measure ICT manpower
knowledge and skills, and use to compare the ICT professional standard between the ASEAN member
states. ASEAN ICT professional standard set ICT competency at three levels as follows: Level 1 Basic
Level - Has basic knowledge and skills which is adequate to perform a given task(s) under supervision of
management. Level 2 Intermediate Level - Has professional knowledge and skills to perform a given
task(s) independently, and, if required, can supervise others; understand the number of comparative
approaches to problems in their fields; and be able to apply them efficiently, and Level 3 Advanced Level
- Has professional knowledge and skills in both technical and management to lead a team in
inexperienced environment.
Methodology
This study used qualitative research, and quantitative research approaches. We conducted in-depth
interviews with executives responsible for ICT management in public and private organisations, and then
questionnaire surveys to collect relevant data during 2012 –2014 in Thailand, Indonesia and Vietnam.
The sampling respondents were selected from ICT manpower in core and non-core ICT industries sectors
in the three countries. The total number of returned and usable questionnaires are 589 questionnaires
and 87 interviews from Thailand, 214 questionnaires and 15 interviews from Indonesia, and 200
questionnaires and 15 interviews from Vietnam.
Findings
The results of the study on ICT manpower in Thailand, Indonesia, and Vietnam are presented as follows:
ICT Manpower in Thailand
The study of demographic characteristics reveals that there were 589 respondents, 70.6% of which were
male and 29.4% were female and the average age of the respondent was not over 33 years old. Most
respondents are employed as technician/ engineer. Regarding education, most of them had a bachelor’s
degree, followed by master’s degree, and their average work experiences are between 1-10 years. For
salary rate, the average salary rate was 690 USD.
1. The Number of ICT Manpower in Thailand. Base on the report of Thailand ICT manpower -
National Statistical Office of Thailand and Office of the National Economic and Social
Development Board during 2001-2012, in order to forecast the number of ICT manpower in

Proceedings of The 1th Almuslim International Conference on Science, Technology and Society (AICSTS) 2015
November 7-8, 2015, Bireuen, Indonesia
5
Thailand during 2013 – 2018, this study uses the Inverse Cobb – Douglas Production Functions,
which uses Regression Analysis for the calculation to find the relationship between the number
of manpower and gross capital stock, and time. Thus, if the Thai economy keeps expanding
with consistent growth of GDP and CAP, the overall number of ICT manpower also tends to
increase from 519,703 persons in 2013 to 540,947 persons in 2014, 563,065 persons in 2015,
and 634,981 persons in 2018.
2. Need for ICT Manpower in Thailand Market. The result of interviews suggest that hardware
sector needed for employees to fill in the position of product managers (who possess understanding and
knowledge about ICT businesses and technology), network engineer, system engineer, developer, data
communication specialist, security specialist, system manager, project manager, and system architecture
specialist. The software and service sectors required employees in the level of software development
specialist and project manager with the software specialist abilities. While telecommunication sector
required employees in telecommunication engineering, radio network, database administration, IT
security, network security and data analytic (Employee with IT knowledge and abilities to analyse data to
find out customers’ needs which will enable the company to better respond to their needs).
3. Strengths and Weaknesses of ICT Manpower in Thailand. As for strengths of Thai ICT
manpower when compared with those of other ASEAN countries, the executives of the sample
organisations viewed that Thai employees are careful and can work effectively in programming. They
have problem solving skills and can effectively develop systems. Also, they are flexible and helpful, which
are good for consultation services. Meanwhile, the weaknesses mentioned by the interviewed executives
include the following: lack of presentation skills, lack of management skills, lack of business knowledge,
lack of overall business pictures, lack of discipline, lack of responsibilities, impatience, lack of
determination, lack of motivation to seek more knowledge by themselves, and lack of English skill.
All the executives advised that English texts are necessary. Thus, Thai ICT manpower must be
increased English skills because English is important for development of knowledge and abilities since
ICT technology originated from the West while Eastern countries adopted such technology from them.
4. Professional Standards of ICT Employees in Thailand. According to the professional standards
of ICT Employees in Thailand, several government offices,such as Thailand Professional Qualification
Institute (TPQI), Council of Engineers, Department of Skill Development, Office of the Education Council,
etc.are attempted to develop professional standards to evaluate the potential of ICT manpower. This
might affect the ICT manpower or entrepreneurs. Meanwhile, private sectoremphasised universal
standards, such as ISO, ITIL and COBIT, as well as vendor certificates, such as MCITP (Microsoft
Certificate IT Professional), CCNA (CISCO Certified Network Associate), VCP (VMware Certified
Professional), SAP and ORACLE.
However, the results of surveys and interviews suggested a advantages of ICT professional
standards to support the ICT manpower and companies as follows: 1) increase potential: ICT professional
standards enable employees to learn about their own knowledge and abilities, it is a way to encourage
Proceedings of The 1th Almuslim International Conference on Science, Technology and Society (AICSTS) 2015
November 7-8, 2015, Bireuen, Indonesia
6
themselves to learn and meet the set standards; 2) clear self-development strategies: ICT professional
standard framework set requirements for ICT employees to pass criteria in each level so employees see
how they can grow in their professions, set the goals for themselves, and learn which areas they need to
develop to meet the goals; 3) reliability and acceptance: ICT professional standards are criteria for setting
the minimum knowledge and expertise in professions, employee passing professional standards will
receive certificates certifying the knowledge and abilities in accordance with what is specified in the
professional standards; 4) employee planning: ICT certificates that an employee receives from passing
the professional standards certifies skills, knowledge and the minimum abilities of that person, it is an
additional information useful for recruiting employee for work to suit each position; 5) build mutual
understanding: ICT professional standards enable all the sectors related with ICT systems in Thailand to
understand correctly about ICT ability levels in different fields. This professional standard framework can
also be used as a reference for developing ICT manpower; 6) upgrade industries: ICT professional
standards help develop the ICT manpower in terms of knowledge and abilities, they can perform tasks
better. Once employees possess knowledge and abilities in accordance with the set standards, the
overall productivity of the industry will be better, meet the standards, and is more widely accepted.
In addition, the results of the surveys and in-depth interviews showed disadvantages of ICT Professional
Standards to impact ICT manpower and companies as follows: 1) lack of knowledge in the field of work:
as professional standards encourage employees to have expertise; this may lead to the fact that ICT
employees view the tasks only in the dimension of their own expertise. As a result, the overall Thai ICT
employees may lack the comprehensive ICT knowledge; 2) higher expenses: Various businesses will
have more expenses on employee as they are needed for supporting ICT employees to pass the
professional standard tests.
5. The Impacts of AEC and ICT Business Trends in Thailand. AEC will bring advantages to
Thailand in term of businesses, technologies and manpower. At the business level, most companies are
expected to be able to rapidly expand business and outsource their business activities in the ICT service
sector. Furthermore, they can recruit foreignmanpower with lower wage. On the other hand,In order to
compete in AEC market, Thai companies should be developed and adjusted products quality to high
standards, including technology change. At the same time, ICT manpower should be developed individual
skills such as English language skill and working skills.
Regarding the new ICT business in the future, the results of technology and customer behaviour
continued to change in Thailand market. As a result, most of ICT companiesand non-ICT companies will
adjust business plans and develop new products/services by focusing on Cloud Computing, Big Data,
and Mobile Application and Business.
ICT Manpower in Indonesia
The study of demographic characteristics found that there were 216 respondents, 74.10% of which were
male and 25.90% were female and the average age of the respondent was 30 years old or below. Most
respondents were employed as a technician/ engineer. Regarding education, most of them had a

Proceedings of The 1th Almuslim International Conference on Science, Technology and Society (AICSTS) 2015
November 7-8, 2015, Bireuen, Indonesia
7
bachelor’s degree, followed by diploma, and the experience was 1- 5 years. For salary rate, the average
salary rate was 630 USD.
1. The Number of ICT Manpower in Indonesia. Based on the information of ICT manpower in
Indonesia during 2005-2010 by The Economic and Social Commission for Asia and the Pacific
(UNESCAP or ESCAP), this study used the method of Linear Regression to predict ICT manpower in
Indonesia during 2011-2018. The result suggested that, the ICT manpower in Indonesia will increase from
2,042,000 persons in 2013 to 2,258,000 persons in 2014, and 2,474,000 persons in 2015. Moreover,
Indonesia will have about 3,122,800 persons of ICT manpower in 2018.
2. Need for ICT Manpower in Indonesia Market. According to a study by the Economist
Intelligence Unit conducted for British Council in June 2012, it was found that the Indonesian economy is
experiencing changes, from the focus on agriculture to manufacturing industry. According to Indonesia’s
economic plan for 2011 – 2023 (MP3EI), most of the budget is allocated for coal, mine, petroleum and
natural gas. Meanwhile, the ICT industry is one of the ten industries the government aims to develop. The
ICT industry development developed the broadband business to reach the growth of 8% in 2014 (from
0.5% in 2010) and aimed to stimulate four main businesses, including device manufacturing, professional
and consulting services, content and applications development, and ecosystems innovation. In order to
develop these businesses, Indonesia needs to have employees with a degree in computer science, which
is still rare at present.
For Indonesian market need, important knowledge and expertise for the ICT manpower were in
network, databases, integrated systems, software engineering and the ability to analyse needs, system
planning, quality assurance, filing system, and integration with Cloud Computing.
However, there are some factors about how significant changes can affect demand for Indonesia
ICT manpower: 1) when companies use computerized devices and modern tools, 2) the entry of foreign
companies in the pioneering technology to Indonesia, 3) the flow of information and communication
needs that are quite high in every work unit/institution/company, 4) started to use the system information
in doing a job that is considered to be more practical and easier than the job manually.
3. Strengths and Weaknesses of ICT Manpower in Indonesia. According to a review of strength in
ICT manpower in Indonesia when compared with other ASEAN countries, the executives of sample
organisations who were interviewed gave the opinion that IT manpower in Indonesia is of high potential,
particularly in software operation and adoption. Some Indonesian employees possess qualifications
suitable for job positions in ICT large companies. The ICT manpower in Indonesia has some weaknesses,
for instance, initiatives, innovation, diligence, access of information, lack of interest from the government
sector to develop ICT knowledge and English skills, and breadth of knowledge.
In order to increase ICT manpower performance, some organisationsrecognised the importance
of aiding technology of developers, such as programming, education, knowledge and experience
development, logics in problem solving, importance of computer systems, and organisation leadership.
Moreover, mutual guidance for operation should be established, for example, arranging regular training to
Proceedings of The 1th Almuslim International Conference on Science, Technology and Society (AICSTS) 2015
November 7-8, 2015, Bireuen, Indonesia
8
develop new knowledge, undergoing training, workshops and seminars to gain modern knowledge and
expertise by including the Employee training budget in the annual budget, and organizing internal and
external training.
4. Professional Standards of ICT Manpower in Indonesia. For professional standards of ICT
manpower in Indonesia, the standards mentioned by Indonesian respondents are for certificates issued
by some companies like Cisco, Mikrotik, Microsoft and others. Furthermore, there are some standards in
Indonesia which have received the international certification, for instance, standards for ICT graduates or
SKKNI. It was mentioned that the standards should link with the international standards. The organisation
with the role to set Indonesia’s professional standards is the Ministry of Communications and Informatics).
In general, professional standards are one of the factors for determining the manpower’s salary rates.
The sample respondents viewed that the current professional standards are good and sufficient, for
example, certificates of various companies, such as CISCO, MSEE, ORACLE, JAVA, etc. which are
accepted in Indonesia and internationally.
In their view, The advantage of ICT professional standards are: 1) develop universal language
system to facilitate ICT jobs without having to undergo long training 2) have manpower with widely
accepted certification 3) potential of ICT manpower is determined by the same standard, and they have a
chance to prove their potential both at national and international levels 4) professional standards help
increase skills of ICT manpower. Despite a lot of advantages, ICT professional standards also had some
loopholes, including 1) financial problems related with the certificate issuing organisations as they are not
located in Indonesia. 2) ICT professional standards will not be taken into consideration or neglect to
process the application portfolio. When ICT employees have the knowledge and accept their performance
by their agencies. 3) It will be more difficult to search for employees which meet ICT professional
standards. As a result, all the related organisations should involve ICT curriculum, including private and
foreign organisations, in the same way as Indonesia’s governmental organisations.
5. The Impacts of AEC and ICT Business Trends in Indonesia. Regarding the impacts of AEC,
most of the ICT executives thought that they can gain benefits from AEC by seeking business opportunity
into AEC market, exchanging knowledge and technology, sharing technological development, and
expanding cooperation. On the other hand, some ICT executives thought that they will not gain
advantages from AEC.
For the ICT business trends in the future, enterprise state and private sector firms have important
roles to drive ICT industry in Indonesia. Most of companies expect changes in the ICT industry such as:
1) a more "user friendly" technology, 2) the establishment of strong technology-based companies, like
Google, Microsoft or Macintosh, in Indonesia, 3) the ability to compete internationally, 4) the shift towards
the use of mobile devices (mobile device), 5) the development of software industry as well as hardware
industry. Based on telecommunication structure and ICT manpower skills, ICT companies in Indonesia
will use joint venture strategy to develop new products/services by focusing on Cloud Computing, Mobile
Business, ICT Outsourcing, and Call Center.
Proceedings of The 1th Almuslim International Conference on Science, Technology and Society (AICSTS) 2015
November 7-8, 2015, Bireuen, Indonesia
9
ICT Manpower in Vietnam
The study of demographic characteristics found that there were 200 respondents, 69.5% of which
were male and 30.5% were female and the average age of the respondent was not over 30 years. Most
of the respondents were employed as a technician/ engineer. Regarding education, most of them have a
bachelor’s degree, followed by diploma, and their work experiencesare in the range of 1- 5 years. For
salary rate, the average salary rate was 350 USD.
1. The Number of ICT Manpower in Vietnam. Based on Vietnam ICT White Book in 2009 - 2014,
this study used the method of Linear Regression to predict ICT manpower in Vietnam during 2013 - 2018,
and found that, Vietnam ICT manpower will have about 441,008 persons in 2013, 505,086 persons in
2014, 578,324 persons in 2015, and 868,136 persons in 2018. However, the ICT personnel development
plan of the Ministry of Information and Communication (MIC) aims to increase the number of Vietnam ICT
manpower to 1 million persons in 2020 in order to support ICT Industry and export ICT manpower to
global market (Minister of Information and Communications, 2012).
2. Need for ICT Manpower in Vietnam Market. The result of in-depth interviews suggested that
the ICT manpower should possess knowledge and expertise in hardware and software. Employees must
be able to control themselves emotionally and be flexible in stressful working environment, develop
specialisation and accomplish tasks assigned by the company. In addition, Vietnam market need
manpower with good communication skills and could communicate with foreigners. Thus, the most
important elements are foreign language skills, abilities to do research, management, team work and
presentation skills. In other words, Vietnam has a lot of knowledgeable ICT manpower, but without
expertise.
3. Strengths and Weaknesses of ICT Manpower in Vietnam. According to a review of strength in
the ICT manpower in Vietnam when compared with other ASEAN countries, the executives of sample
organisationsviewed that Vietnam has large number of ICT manpower who are youths with creativity, and
love for learning and new experiences. They are active and dedicate themselves to work, and can learn
fast. Its ICT manpower has high skills and the wages are lower than in other countries. Strength of
Vietnam’s ICT is knowledge. Vietnam possesses knowledge and the ICT manpower with the right degree
and potential in research and development in specialised ICT. In general, Vietnam manpower is hard-
working and determined. Each employee has various abilities. For example, programmers can learn
about network or system integration. For weaknesses, the ICT manpower in Vietnam has limitations in
language and professional training. These include the lack of creativity, independence, teamwork skills,
knowledge and experience. As a result, they are required for more technical training. Their working
environment is not professional and there is no training in educational institutions. But the training in
Vietnam is not systematically organised. Many training institutions have been established without trainers’
quality control. The ICT manpower can increase their skills only through work experiences. As a result,
new graduates have low-level skills.
Proceedings of The 1th Almuslim International Conference on Science, Technology and Society (AICSTS) 2015
November 7-8, 2015, Bireuen, Indonesia
10
4. Professional Standards of ICT Manpower in Vietnam. Based on the result of interviews, this
study found that ICT professional standards do not affect the worker’s salary rate. The salary rate is
dependent on the employee’s ability, knowledge and work experiences. However, the Vietnam
government has a plan to develop professional standards of ICT manpower in the future.
5. The Impacts of AEC and ICT Business Trends in Vietnam. Most of the ICT executives believed
that AEC will bring advantages in that Vietnamese ICT manpower will get to learn new technology more.
Manpower with required skills will be easier to find, their wages will be cheaper than those in ASEAN, and
more cooperation will be enhanced. The chance to export software and expand markets will also
increase, with the focus on Indonesia or Malaysia market. The cooperation with other ASEAN countries
can help promote the company among their overseas counterparts. In addition, there will be transfers of
manpower, knowledge, new working methods, and exchanges of expertise or problem solving strategies.
Regarding the new ICT business trends in the future, most of the ICT executives viewed that ICT
companies in Vietnam will use joint venture strategy to develop and launchnew products/services. There
are 1) Software Outsourcing Cluster 2) Data Center Service, and 3) Cloud Computing.
Conclusion
Regarding ICT demographic data of Thailand, Indonesia, and Vietnam, most of the ICT manpower in the
three countries were male. Vietnam ICT manpower had a higher ratio of female manpower than Thailand
and Indonesia, and most respondents in the three countries are employed as a technician/ engineer.
Regarding education, most of the respondents have a bachelor’s degree, followed by master’s degree for
Thailand, and diploma for Indonesia and Vietnam. Their ICT work experiences range from 1-10 years for
Thailand and 1-5 years for Indonesia and Vietnam. For the average salary rate, Thailand has higher
salary rates than Indonesia and Vietnam (690 USD in Thailand, 630 USD in Indonesia, and 350 USD in
Vietnam). According the forecast of the number of ICT manpower in 2018, Thailand will have about
634,981 persons, 3.2 million persons in Indonesia, and 887,025 persons in Vietnam. Thus, Indonesia has
the largest number of ICT manpower in ASEAN. As a result, Indonesia can quickly develop and launch
ICT products/services to domestic markets and global markets. As for strengths and weaknesses of ICT
employees in Thailand, Indonesia, and Vietnam, the interviewed executives of sample organisations
viewed that the strengths of ICT employees in each country is different. Meanwhile the ICT employees in
every country have the same weakness, which is English communication.
Based on AEC in 2015, most ICT companies in three countries will gain advantages from AEC by seeking
business opportunities and expanding businesses. However, they must be emphasised manpower skill
development. For ICT businesses in the future, Thailand has planned to develop Cloud Computing, Big
Data, and Mobile Application and Business. Indonesia will develop Cloud Computing, Mobile Business,
ICT Outsourcing, and Call Center. Meanwhile, Vietnam has emphasiseddevelopment in terms of
Software Outsourcing Cluster, Data Center Service, and Cloud Computing. Thus, these countries should
plan to developed ICT manpower skills to serve new ICT businesses.

Proceedings of The 1th Almuslim International Conference on Science, Technology and Society (AICSTS) 2015
November 7-8, 2015, Bireuen, Indonesia
11
In sum, the result of this study can help the public and private sectors in these three countries as well as
in other countries in ASEAN to plan for the development of ICT manpower for a global labour-market
competition and ASEAN.
References
ASEAN (2011),“We’re Stronger When We’re Connected: ASEAN ICT Masterplan 2015”, Jakarta,
Indonesia.
Business Monitor International (2012), “Indonesia Information Technology Report Q3 2012”, London, UK.
GSMA (2015) “Socio-economic impact of mobile broadband in Thailand and contribution to the digital
economy”, London, UK.
Information and Communication Technology Industry Promotion Bureau (2013), “A Study of ICT
Professions to Create the ICT Professional Standards under the Thailand ICT Employee’s
Potential Enhancement Project”, Bangkok, Thailand.
Ministry for Economic Affairs (2011), “Masterplan for Acceleration and Expansion of Indonesia Economic
Development”, Jakarta: Coordinating Ministry for Economic Affairs, Republic of Indonesia.
National Electronics and Computer Technology Center: NECTEC (2011), “Thailand Information and
Communication Technology Policy Framework (2011-2020)”, Bangkok, Thailand.
Minister of Information and Communications (MIC) (2009-2014), “Vietnam Information and
Communication Technology White Book”, Information and Communication Publishing House, Ha
Noi, Vietnam.
Ministry of Planning and Investment (2012), “Implementation of Sustainable Development”, National
Report at the United Nations Conference on Sustainable Development (RIO+20), Ha Noi,
Vietnam.
Soumitra Dutta, Thierry Geiger, and Bruno Lanvin (2015),“The Global InformationTechnology Report
2015”, World Economic Forum and INSEAD.
Unesco Bangkok (2008), “Strategy Framework for Promoting ICT Literacy in the Asia-Pacific Region”,
Bangkok, Thailand.
Proceedings of The 1th Almuslim International Conference on Science, Technology and Society (AICSTS) 2015
November 7-8, 2015, Bireuen, Indonesia
12
Water Quality Evaluation System for Assessing the Status and
Suitability of the Citarum River Water for Various Uses and Its
Aquatic Ecosystem
Mohamad Ali Fulazzaky
Centre for Environmental Sustainability and Water Security, Research Institute for Sustainable
Environment, Faculty of Civil Engineering, Universiti Teknologi Malaysia, 81310 UTM Skudai, Johor
Bahru, Malaysia
Abstract
The Citarum river water is the most important water sources in Indonesia. The river that
supports a population of 28 million people, delivers 20% of Indonesia's gross domestic
product, and provides 80% of surface water to carry through the West Tarum Canal to
the Jakarta’s water supply authority, is one of the most polluted rivers in the world.
Water quality degradation of this river increases from the year to year due to the
increasing pollutant loads when released particularly from Bandung region of the
upstream areas into river without treatment. This will be facing the chronic problems of
water pollution for supporting the suitability of water for different uses. This study used
the Water Quality Evaluation System to asses the suitability of water in term of the
Water Quality Aptitude (WQA) for five different uses and its aquatic ecosystem. The
assessment of ten selected stations was found that the WQA ranges from the suitable
quality for agriculture and livestock watering uses to unsuitable for biological potential
function, drinking water production, and leisure and sport upstream the Saguling
reservoir, generally. The role of Citarum river water in providing the demands of
multipurpose uses particularly for Jakarta’s water supply will still be present in question
for the years to come. The aptitude of water along the river is evaluated to contribute to
decision support system for decision-making process and to provide as proper
information for water users in allocating their water right wisely.
Keywords: Citarum River, water quality aptitude, water quality evaluation system, water use.
Introduction
The problems of water quality degradation in the Citarum river will increase from the year to year due to
the increasing of the pollutant loads particularly from Bandung region located in the upper areas of the
river basin when released without treatment. Deterioration of water quality causing by the human
activities in upper river basin reduces the usability of the resources for stakeholders in the down-stream
Proceedings of The 1th Almuslim International Conference on Science, Technology and Society (AICSTS) 2015
November 7-8, 2015, Bireuen, Indonesia
13
areas. Over the past 20 years, rapid urbanization and industrial growth have resulted in growing
quantities of untreated domestic sewage, solid waste and industrial effluents being dumped in the river.
Pollution levels now compromise public health, and the livelihoods of impoverished fishing families have
been jeopardized by widespread fish kill (DGWR, 2007). To handle the problems in implementing of
integrated water quality management are necessary to consider all the related aspects entire the basin to
ensure the quality of stream water managed will improve gradually. For example, a refined the waste load
allocation process is proposed with a reexamination of water quality violation to improve the allocation
decision under uncertainty (Chen and Ma, 2008). Participatory surface water management is emphasized
in order to achieve a holistic and sustainable water management decision-making process (Hartmann et
al., 2006).
The government of Indonesia has been acquainted with integrated approach since the Government
Regulation No. 82 on water quality management and pollution control (PP No. 82/2001) was enacted in
the year 2001. The PP No. 82/2001 serves as the national guideline to be referred in managing of water
quality especially for water managers and operators who work at the national, provincial, and river basin
level institutions. Although this regulation guides the role sharing amongst the related institutions and
provides the technical arrangements including the classification of the national water quality criteria, the
operational guidelines in implementing of the regulation to the specific characteristics of a river basin are
still not envisaged properly. However, conducting an adaptive guideline in managing of water quality to
the specific local condition is necessary (Fulazzaky, 2005). For example, salinity tolerance of macro-
invertebrate communities varies in Eastern Australia; hence, water quality guidelines should be
developed at a local or regional scale (Dunlop et al., 2008), and the nutrient pollution effects of moderate
eutrophication to Runde river in Zimbabwe need to be addressed by appropriate agricultural and
environmental policies that relate to water pollution and land use (Tafangenyasha and Dube, 2008).
Water quality evaluation system (WQES) has been developed to aim two objectives that are (1) to
classify the water quality in accordance with the actual condition of water in the stream and (2) to classify
the water suitability for different uses and its ecosystem in accordance with the available water quality in
the river (Oudin et al., 1999). Thus, the WQES serves to assess the status of water quality in the stream
and to identify what the level of water is suitable to provide for the different uses and its ecosystem. This
tool is considerable to a comprehensive approach in evaluating of water quality. The earlier study showed
that a modeling approach can be used to estimate the impacts of water quality management programs in
river basins (Holvoet et al., 2007). The models are possible to analyze the best recommendations needed
for different levels of treatment derived in order to improve the water quality (Muhammetoglu et al., 2005).
The results of water quality analysis using the WQES are offered to be considered in formulating of the
water quality standards and the priority of measures needed to each region in the country, or anywhere,
based on the specific local conditions. A systematical analysis of water quality data scientifically
introduces to translate the data to actual explanations may be envisaged as decision support system
(DSS). The accurate information obtained helps the decision makers in preparing the locally adaptive

Proceedings of The 1th Almuslim International Conference on Science, Technology and Society (AICSTS) 2015
November 7-8, 2015, Bireuen, Indonesia
14
policies and guidelines to water quality assessment and management besides serves as the proper tool
to water users in allocating their water right wisely.
The objectives of this study are (1) to identify the suitability of Citarum river water in providing the different
water uses and its aquatic ecosystem, (2) to warn the water users in allocating their water right wisely
based on the actual quality of water, and (3) to recommend the priorities of measures needed to be
envisaged by the local authorities, central government, and all related stakeholders for improving water
quality.
The importance of WQES to assess the Citarum river water
The Citarum river is the largest river in western Java, the region which contains Jakarta, the capital of
Indonesia. The river originates in the mountain range near the southern coast of Java that includes many
high volcanic peaks including Mount Wayang (elevation 2,200 m), and travels in a generally north-
westerly direction for about 270 km until it empties into the Java sea east of Jakarta. Its drainage area is
about 6,600 km2. The upstream reaches of the river run in mountainous to gently undulating hilly lands for
about 200 km while the lower 70 km stretch drains a vast plat alluvial plain. The total area of the river
basin to include certain bordering rivers and its tributaries as shown in Figure 1 is about 11,500 km2
situated at latitude of 6°43′ S to 7°04′ S and longitude of 107°15′ E to 107°55′ E. The climate of the basin
area is characterized by two distinct seasons: rainy season and dry season. The rainy season occurs
during the months of November to April, while the dry season occurs during the remaining months.
January is the wettest month, while August is the driest month. Naturally, runoff follows the same
seasonal pattern. The average annual rainfall varies from 1,500 mm in the coastal areas to 4,000 mm in
the mountainous areas in the upper part of the basin. This total runoff from the catchments is generally
considered to be adequate to supply demands for all uses well into the future. To regulate surface water
the Citarum river system has three cascade reservoirs, i.e., Saguling in the uppermost, Cirata in the
middle, and Jatiluhur in the lower location. However, the spatial distribution of surface water resources is
not uniform, and shortages do occur from time to time in certain areas.
Figure 1. Location of Citarum river basin
Proceedings of The 1th Almuslim International Conference on Science, Technology and Society (AICSTS) 2015
November 7-8, 2015, Bireuen, Indonesia
15
The population in the river basin area in 2003 was 17.8 million, with 4.1 million households – 30% derived
livelihood from agriculture, 25% from industry and 45% from services. The population is projected to rise
to 21.3 million by 2010. Industrial locations are generally interwoven with settlement and there is no clear
zoning or separation of these land uses in the region. The area is a key rice producer for the country.
There are a total of 390,000 ha of irrigated paddy fields, with 240,000 ha served by the Jatiluhur reservoir
and canal system in the lower basin. Average annual demand from the Jatiluhur dam has increased from
140 m3/s in 1996 to 156 m3/s in 2004. The river that supports a population of 28 million people, delivers
20% of Indonesia's gross domestic product, and provides 80% of surface water to carry through the West
Tarum Canal to the Jakarta’s water supply authority is one of the most polluted rivers in the world
(DGWR, 2007). Urbanization in the last three decades was followed by rise in untreated household
sewage, solid waste and industrial effluents. The more waste enters the river the more chances for
spreading diseases, and already there are many fishing families that are starving because of tremendous
decrease in fish population due to heavy pollution.
Methodology
General of quality evaluation system
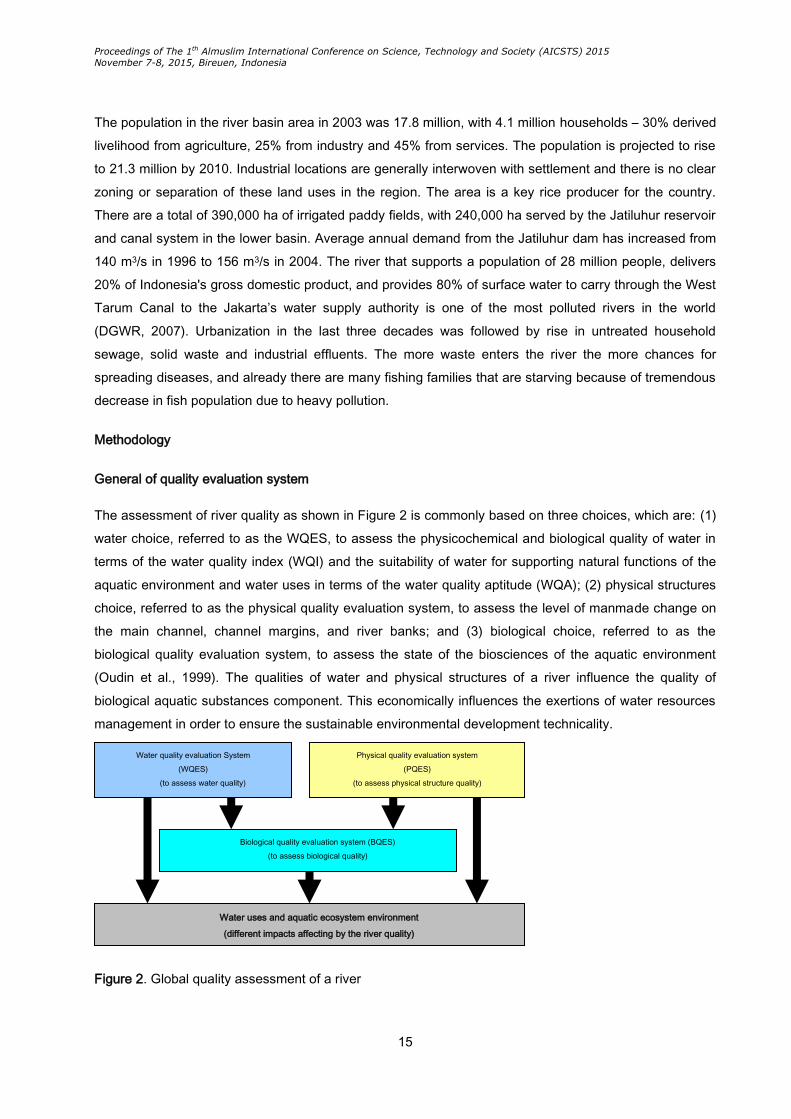
The assessment of river quality as shown in Figure 2 is commonly based on three choices, which are: (1)
water choice, referred to as the WQES, to assess the physicochemical and biological quality of water in
terms of the water quality index (WQI) and the suitability of water for supporting natural functions of the
aquatic environment and water uses in terms of the water quality aptitude (WQA); (2) physical structures
choice, referred to as the physical quality evaluation system, to assess the level of manmade change on
the main channel, channel margins, and river banks; and (3) biological choice, referred to as the
biological quality evaluation system, to assess the state of the biosciences of the aquatic environment
(Oudin et al., 1999). The qualities of water and physical structures of a river influence the quality of
biological aquatic substances component. This economically influences the exertions of water resources
management in order to ensure the sustainable environmental development technicality.
Figure 2. Global quality assessment of a river
Water quality evaluation System
(WQES)
(to assess water quality)
Physical quality evaluation system
(PQES)
(to assess physical structure quality)
Biological quality evaluation system (BQES)
(to assess biological quality)
Water uses and aquatic ecosystem environment
(different impacts affecting by the river quality)

Proceedings of The 1th Almuslim International Conference on Science, Technology and Society (AICSTS) 2015
November 7-8, 2015, Bireuen, Indonesia
16
The aims of the system are to assess river quality according to the qualities of each component, to
identify the alterations in water quality or physical environment which are the cause of biological
inbalances, and to assess the effects of an alteration of the river quality for human uses or on the natural
functions of rivers. The tools for the assessment of the quality of rivers have been defined in a modular
way and are adaptable to scientific and technical development as well as regional peculiarities. For
example, water quality is assessed by reference to average alterations of parameter groups; new
parameters can be included later in the description of quality by modifying the framework and functions of
the evaluation tool. The evaluation tools for river quality consider three quality evaluations system that
are: (1) common to all water partners consisting of the technicians, decision makers, and water users, (2)
consistent with the international, regional, and local water regulations, and (3) help appreciate the
environmental and asset problems. They make a link among partners. In this way, they are a tool for
decision-making in the monitoring and the planning of the protection of rivers.
Application of WQES is a part of river quality assessment that aims to convert the data of water quality to
information is more suitable. This envisages possess the operational procedure standard generating the
data to information based on all the parameters monitored. The information produced from the WQES as
shown in Figure 3 provides two categories that are the water quality status and the water suitability for
different uses and its aquatic ecosystem (Fulazzaky, 2009; Fulazzaky at al. 2010). Besides, to identify the
critical parameter(s) affecting the quality of water and to verify the sources of pollution discharged to the
stream water are reasonable (Fulazzaky, 2005). The WQES is based on the notion of indicators of
modification from natural conditions. Parameters of similar nature and impact on environment are
grouped into 15 alterations of indicators of water quality (see Table 1).
Figure 3. Link of river water quality condition to river water quality information
Sources: Fulazzaky 2009; Fulazzaky et al. 2010
Certain institutions have the different objectives of water quality standardized such as WHO’s water
quality standards specifically aim to standardize drinking and recreational water qualities, it is not
compatible to only use the standard formalized by an institution to assess all the criteria of river water
quality for the different uses of aquatic biota, drinking water production, recreation and aquatic sports,
irrigation, livestock watering, and aquaculture comprehensively. This study used the thresholds criteria of
French Water Agencies Study No. 64 original from the different sources of water quality standards i.e.,
Directive European, France, EPA USA, WHO and Canada, and completed by the rational advices from
1. Water quality status
2. Water suitability for biology and uses
River water
condition Water quality
monitoring
WQES
Information Database
River’
condition River’ info

Proceedings of The 1th Almuslim International Conference on Science, Technology and Society (AICSTS) 2015
November 7-8, 2015, Bireuen, Indonesia
17
the water quality experts (Oudin et al., 1999). The WQES promotes a tool to synchronize the evaluation
of all water quality parameters data monitored to convert to the WQI or WQA. Hence, this study only
focused on the analysis of WQA for understanding the suitability of Citarum river water for the different
uses and its aquatic ecosystem.
The use of WQES in examining the valid data to assess the suitability of water for different uses and
aquatic biota is systematized using an aggregation method. Since the aggregation method to study the
data of water quality monitored from a river is not necessary to conduct with a statistical analysis, the
probability of exceptional situation takes account into evaluation in excluding the inconvenient results of
lower than 10% from the list of useable data when the anomalous consequences of samples monitoring
were verified. To assess the classes of WQA of stream water in a river using the WQES is to carry out
after screening of the data via the Rule of 90% that is
F = (i - 0.5)/N or i = 0.9 N + 0.5 (1)
where i is row of the results, N is total number of results; and F = 0.9 is percentage or 90% of acceptable
data to evaluate.
To assess the alteration of suspended particles, the withheld rule is the 50% percentage, to avoid
qualifying water after rainfall events which no exceptional characteristics and with a frequency superior to
10%. The formula is then
i = 0.5 N + 0.5 (2)
The rules need to be implemented due to the results monitoring the same parameter(s) of water quality
are numerous. For instance, the parameters used to be analyzed as the valuable data in preparation of
water quality management plan are indispensable to monitor regularly for certain locations along the river.
Table 1 Water quality parameters in accordance with their alteration
No Alteration Parameters
1 Oxidized organic matter O2, %O2, COD, KMnO4, BOD, DOC,
NKJ, NH4+
2 Nitrogen matter NH4+, NKJ, NO2-
3 Nitrates NO3-
4 Phosphorus matter PO43+, P-total
5 Suspended particles SS, Turbidity, Transparency
6 Colour Colour
7 Temperature Temperature
8 Mineralization Conductivity, Salinity, Hardness, Cl-,
SO42-, Ca2+, Mg2+, K+, Na+, TAC,
Hardness
9 Acidification pH, Dissolved Al
10 Micro organisms Total Coliforms, Feacal Coliforms,
Feacal Streptococci
Proceedings of The 1th Almuslim International Conference on Science, Technology and Society (AICSTS) 2015
November 7-8, 2015, Bireuen, Indonesia
18
11 Phytoplankton ∆O2, ∆pH, %O2, and pH, Chlorophyl a +
pheopigments, Algae
12 Mineral micro pollutants
in raw water
As, Hg, Cd, Cr-total, Pb, Zn, Cu, Ni, Se,
Ba, CN
13 Metals in Bryophytes As, Hg, Cd, Cr-total, Pb, Zn, Cu, Ni
14 Pesticides in raw water List of pesticides (see Oudin et al.,
1999)
15 Organic micro
pollutants non
pesticides in raw water
List of organic micro pollutants non
pesticides (see Oudin et al., 1999)
Sources: Oudin et al., 1999
WQA assignment for different purposes
The assignment of WQA as shown in Figure 4 is fixed to assess the suitability of water for different
destinations of water uses and to verify the impact of pollution downgrading biodiversity. The biological
potential function shows the suitability of water for aquatic life, when hydrological and morphological
conditions of the habitat are good. The pollutants in the stream water such as metals and organic matters
affect the declination of biodiversity and sediment quality. For instance, despite high metal concentrations
associated with roots, the major part of the metals in the marsh soil is still associated with the sediment
as the overall biomass of roots is small compared to the sediment (Teuchies et al., 2008). Five suitability
classes of WQA have been defined. They indicate a gradual impoverishment of the biological structure,
including the disappearance of the taxa most sensitive to pollution.
Defining the suitability classes for drinking water production depend on (1) the related regulations which
are held as priorities for defining the blue/green class thresholds associated with suitability for
consumption and orange/red class thresholds associated with unsuitability for production of drinking
water and (2) the opinion of the producers and of the suppliers in defining intermediary thresholds for
simple and complex treatments of raw water. The definition of suitability classes is grouped into five
classes. The use of leisure and aquatic sports is mainly applied in bathing areas and the legislation
thresholds which principally relate to the turbidity of the water and the occurrence of microorganisms.
Three suitability classes for recreation and aquatic sports have been defined.
The main factors to classify the suitability of water for irrigation are: ground texture, irrigated crop,
frequency, and duration of irrigation. Crops have been divided into four sensitivity groups, ranging from
very sensitive plants to very hardy plants. The crops taken into account in these groups are liable to differ
from one parameter to another, meaning that the composition of each group is also variable. For
instance, the arsenic content in soil and plants is influenced by the degree of arsenic amount in irrigated
water (Dahal et al., 2008). It is equally necessary to take into account the type of soils. These have been
divided into two groups which overlap, i.e., (1) all soils including the most sensitive and (2) neutral or
alkaline soils, which are the most resistant. Combinations of soil/plant groups have been limited to
Proceedings of The 1th Almuslim International Conference on Science, Technology and Society (AICSTS) 2015
November 7-8, 2015, Bireuen, Indonesia
19
sensitive-very sensitive plants/all soils and to resistant-very resistant plants/alkaline or neutral soils. Five
suitability classes for irrigation uses have been defined. Water quality indices provide a simple and
understandable tool for managers on the quality and possible uses for irrigation water (Almeida et al.,
2008).
Figure 4. Flow chart of WQI and WQA class assignment
Livestock watering use is the suitability of water to allow the watering of breeding animals. These can be
classified according to three age classes and sensitivity i.e., (1) young animals as chicken, pigs, calves,
which are growing fast and are very sensitive to all pollutants, (2) animals of mature age which have a
slow growth and are less vulnerable, and (3) animals for reproduction, they have strict needs during the
gestation and milking period. In the case of livestock watering, water has to be useable immediately by
the breeder. If the water is not useable, the breeder will then turn to the water supply. Three suitability
classes for livestock watering use are adopted (Oudin et al., 1999).
Aquaculture use mainly shows the water suitability to be used in fish breeding. Water is the main factor of
production in intensive fish breeding, particularly in salmon breeding. Water carries oxygen, eliminates
151 parameters of water quality
15 alterations of water quality to include 151 parameters
To group the parameter(s) into 15 alterations
To define the thresholds of
each parameter in the alterations (Oudin et al., 1999)
5 classes of water quality, each
class representing by an index
WQI or status of water quality
To assign the suitable class to
represent as the WQI or status of water quality
To define the thresholds of
each parameter in the related alterations (Oudin et al., 1999)
3 classes for aquaculture
5 classes for irrigation
3 classes for livestock watering
3 classes for leisure and sport
5 classes for drinking water production
5 classes for aquatic ecosystem
WQA for differ uses and aquatic ecosystem
To assign the suitable class to represent as the
WQA for different uses and aquatic ecosystem
Proceedings of The 1th Almuslim International Conference on Science, Technology and Society (AICSTS) 2015
November 7-8, 2015, Bireuen, Indonesia
20
wastes, and conductions production performances by its physicochemical variability. Three suitability
classes for aquaculture have been defined.
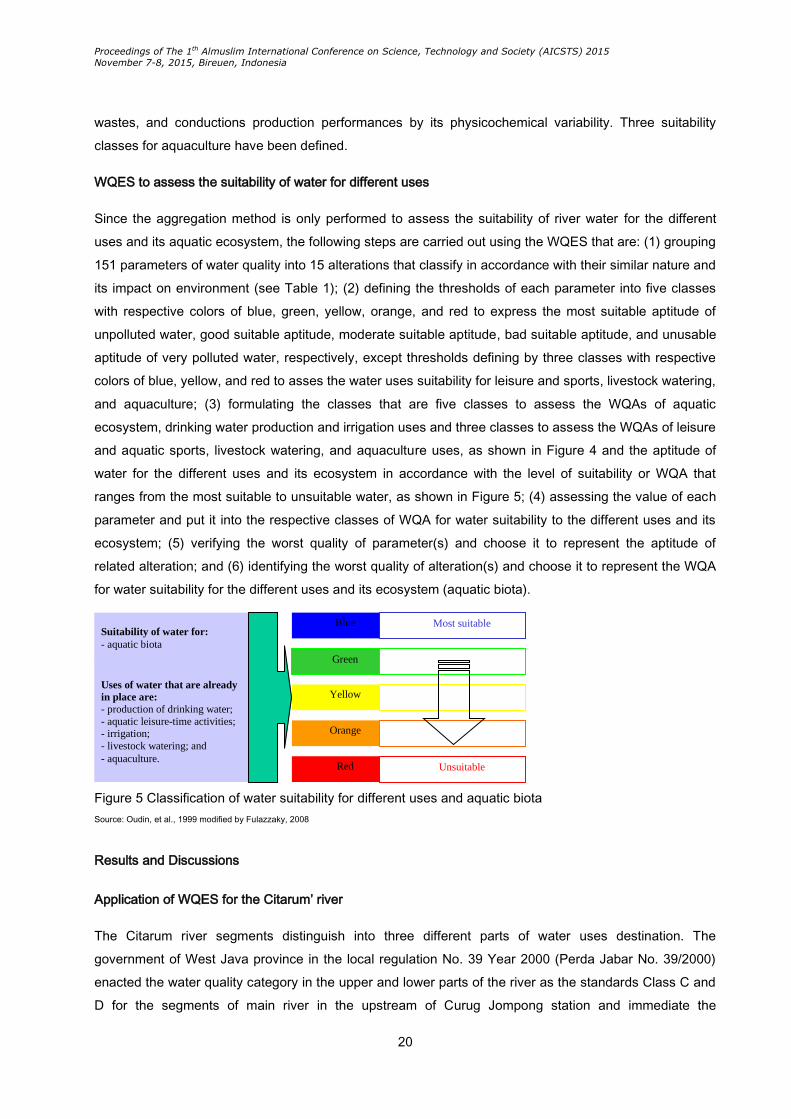
WQES to assess the suitability of water for different uses
Since the aggregation method is only performed to assess the suitability of river water for the different
uses and its aquatic ecosystem, the following steps are carried out using the WQES that are: (1) grouping
151 parameters of water quality into 15 alterations that classify in accordance with their similar nature and
its impact on environment (see Table 1); (2) defining the thresholds of each parameter into five classes
with respective colors of blue, green, yellow, orange, and red to express the most suitable aptitude of
unpolluted water, good suitable aptitude, moderate suitable aptitude, bad suitable aptitude, and unusable
aptitude of very polluted water, respectively, except thresholds defining by three classes with respective
colors of blue, yellow, and red to asses the water uses suitability for leisure and sports, livestock watering,
and aquaculture; (3) formulating the classes that are five classes to assess the WQAs of aquatic
ecosystem, drinking water production and irrigation uses and three classes to assess the WQAs of leisure
and aquatic sports, livestock watering, and aquaculture uses, as shown in Figure 4 and the aptitude of
water for the different uses and its ecosystem in accordance with the level of suitability or WQA that
ranges from the most suitable to unsuitable water, as shown in Figure 5; (4) assessing the value of each
parameter and put it into the respective classes of WQA for water suitability to the different uses and its
ecosystem; (5) verifying the worst quality of parameter(s) and choose it to represent the aptitude of
related alteration; and (6) identifying the worst quality of alteration(s) and choose it to represent the WQA
for water suitability for the different uses and its ecosystem (aquatic biota).
Figure 5 Classification of water suitability for different uses and aquatic biota
Source: Oudin, et al., 1999 modified by Fulazzaky, 2008
Results and Discussions
Application of WQES for the Citarum’ river
The Citarum river segments distinguish into three different parts of water uses destination. The
government of West Java province in the local regulation No. 39 Year 2000 (Perda Jabar No. 39/2000)
enacted the water quality category in the upper and lower parts of the river as the standards Class C and
D for the segments of main river in the upstream of Curug Jompong station and immediate the
Unsuitable Red
Orange
Yellow
Green
Most suitable Blue
Uses of water that are already
in place are:
- production of drinking water;
- aquatic leisure-time activities; - irrigation;
- livestock watering; and
- aquaculture.
Suitability of water for:
- aquatic biota
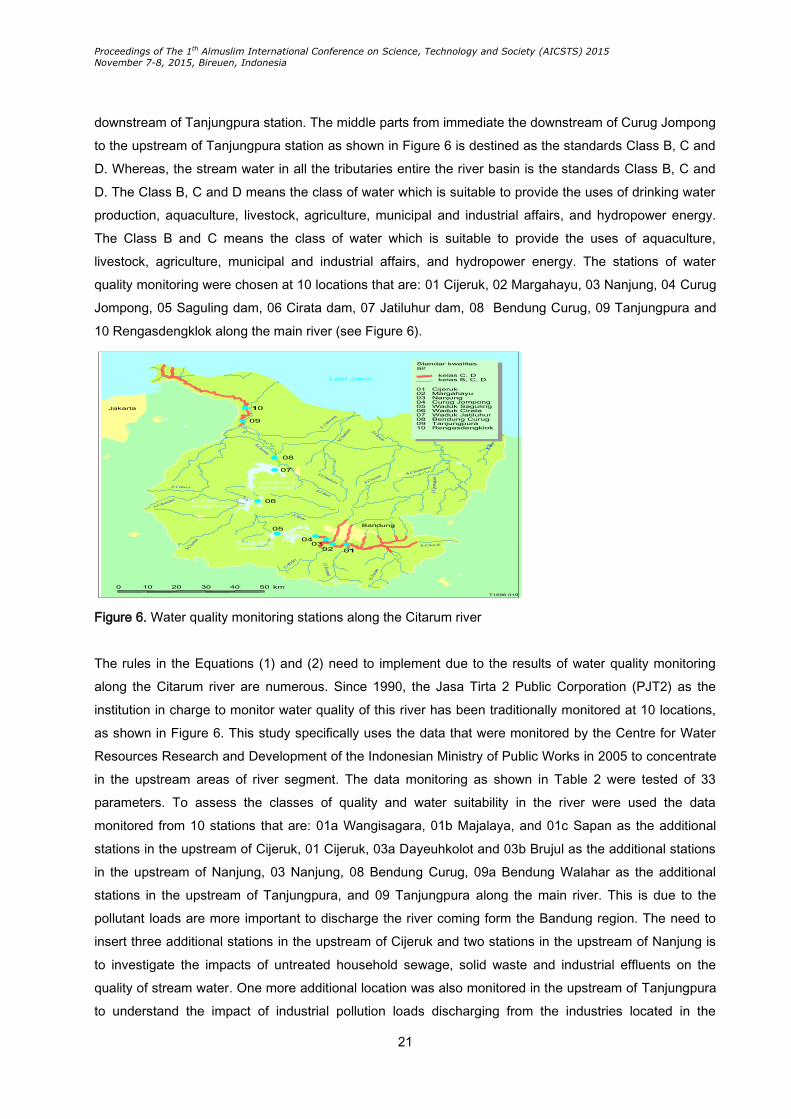
Proceedings of The 1th Almuslim International Conference on Science, Technology and Society (AICSTS) 2015
November 7-8, 2015, Bireuen, Indonesia
21
downstream of Tanjungpura station. The middle parts from immediate the downstream of Curug Jompong
to the upstream of Tanjungpura station as shown in Figure 6 is destined as the standards Class B, C and
D. Whereas, the stream water in all the tributaries entire the river basin is the standards Class B, C and
D. The Class B, C and D means the class of water which is suitable to provide the uses of drinking water
production, aquaculture, livestock, agriculture, municipal and industrial affairs, and hydropower energy.
The Class B and C means the class of water which is suitable to provide the uses of aquaculture,
livestock, agriculture, municipal and industrial affairs, and hydropower energy. The stations of water
quality monitoring were chosen at 10 locations that are: 01 Cijeruk, 02 Margahayu, 03 Nanjung, 04 Curug
Jompong, 05 Saguling dam, 06 Cirata dam, 07 Jatiluhur dam, 08 Bendung Curug, 09 Tanjungpura and
10 Rengasdengklok along the main river (see Figure 6).
Figure 6. Water quality monitoring stations along the Citarum river
The rules in the Equations (1) and (2) need to implement due to the results of water quality monitoring
along the Citarum river are numerous. Since 1990, the Jasa Tirta 2 Public Corporation (PJT2) as the
institution in charge to monitor water quality of this river has been traditionally monitored at 10 locations,
as shown in Figure 6. This study specifically uses the data that were monitored by the Centre for Water
Resources Research and Development of the Indonesian Ministry of Public Works in 2005 to concentrate
in the upstream areas of river segment. The data monitoring as shown in Table 2 were tested of 33
parameters. To assess the classes of quality and water suitability in the river were used the data
monitored from 10 stations that are: 01a Wangisagara, 01b Majalaya, and 01c Sapan as the additional
stations in the upstream of Cijeruk, 01 Cijeruk, 03a Dayeuhkolot and 03b Brujul as the additional stations
in the upstream of Nanjung, 03 Nanjung, 08 Bendung Curug, 09a Bendung Walahar as the additional
stations in the upstream of Tanjungpura, and 09 Tanjungpura along the main river. This is due to the
pollutant loads are more important to discharge the river coming form the Bandung region. The need to
insert three additional stations in the upstream of Cijeruk and two stations in the upstream of Nanjung is
to investigate the impacts of untreated household sewage, solid waste and industrial effluents on the
quality of stream water. One more additional location was also monitored in the upstream of Tanjungpura
to understand the impact of industrial pollution loads discharging from the industries located in the
Proceedings of The 1th Almuslim International Conference on Science, Technology and Society (AICSTS) 2015
November 7-8, 2015, Bireuen, Indonesia
22
downstream areas. Because of the lack of data monitoring, two alterations i.e., pesticides in raw water
and organic micro pollutants non pesticides in raw water as shown in Table 2 were no included to
evaluate in this study. To assess WQA, this study examines 3,960 testing results that were specially
monitored from 10 selected stations above along the main river during the period of 1 year with the
frequency of monitoring was one per month.
WQA of the Citarum River
The excessive pollutants in the stream water will face the problems of biodiversity degradation. The
earlier study supports the need for incorporating functional measures in evaluations of stream ecological
integrity (Castela et al., 2008). The effects on zooplankton were caused by changes in habitat structure
due to the strong decline of macrophytes. The slow degradation of metazachlor combined with the
absence of recovery in both chlorophytes and macrophytes is likely to cause long-lasting effects on
aquatic ecosystems (Mohr et al., 2008). Considering the results of WQA analysis, this study remarks that
the stream water in the upper part of Saguling dam as shown in Table 2 is unusable to conduct the
sustainability of aquatic ecosystem, judging the WQA class is red. This translates water capability of
considerably reducing the number of sensitive taxa or eliminating them with a very low diversity. In the
downstream areas of Jatiluhur dam, water quality causing the disappearance of certain sensitive taxa
with adequate diversity is evident, see location 09a Bendung Walahar, judging the WQA class is green, or
water capabilities of considerably reducing the number of sensitive taxa with adequate diversity are
manifested, see locations 08 Bendung Curug and 09 Tanjungpura, judging the WQA classes are yellow.
To improve the quality of the stream water particularly in the upper part of the basin is still will be suitable
for aquatic biota this study recommends to the related local authorities including all the stakeholders to
envisage as high priority the problems of river pollution. This suggests the need to have a specific legal
instrument of integrated water quality management plan in order to guide all the participatory of multiparty
entire the river basin to involve in improvement of water quality in accordance with the role and
responsibility of each participant.
A deeper understanding of the practical and theoretical underpinnings of risk management can be made
between organizational capabilities in the essential water business process (MacGillivray and Pollard,
2008). This preventive feature lies at the core of risk management for the provision of safe drinking water
(Hrudey et al., 2006). Referring to this study, water in the upper Citarum river as shown in Table 2 is not
recommended to produce drinking water generally excluding in the stream water from the upper part of
Bandung city see upper part of the station 01a Wangisagara and at the station 03a Dayeuhkolot, judging
the WQA classes are red. Because of no more industries located in the upstream areas of Bandung city,
water quality upper the station 01a Wangisagara was justified as moderate (yellow). The improvement of
water quality at the station 03a Dayeuhkolot was verified as orange due to a good water quality from
Ciwidey river penetrates the water quality of Citarum’ river. Utilization of Citarum river water from the
upstream areas of Bandung city is acceptable to produce drinking water. This study recommends to
perform the conventional technologies in producing of drinking water for raw water in the stream from the
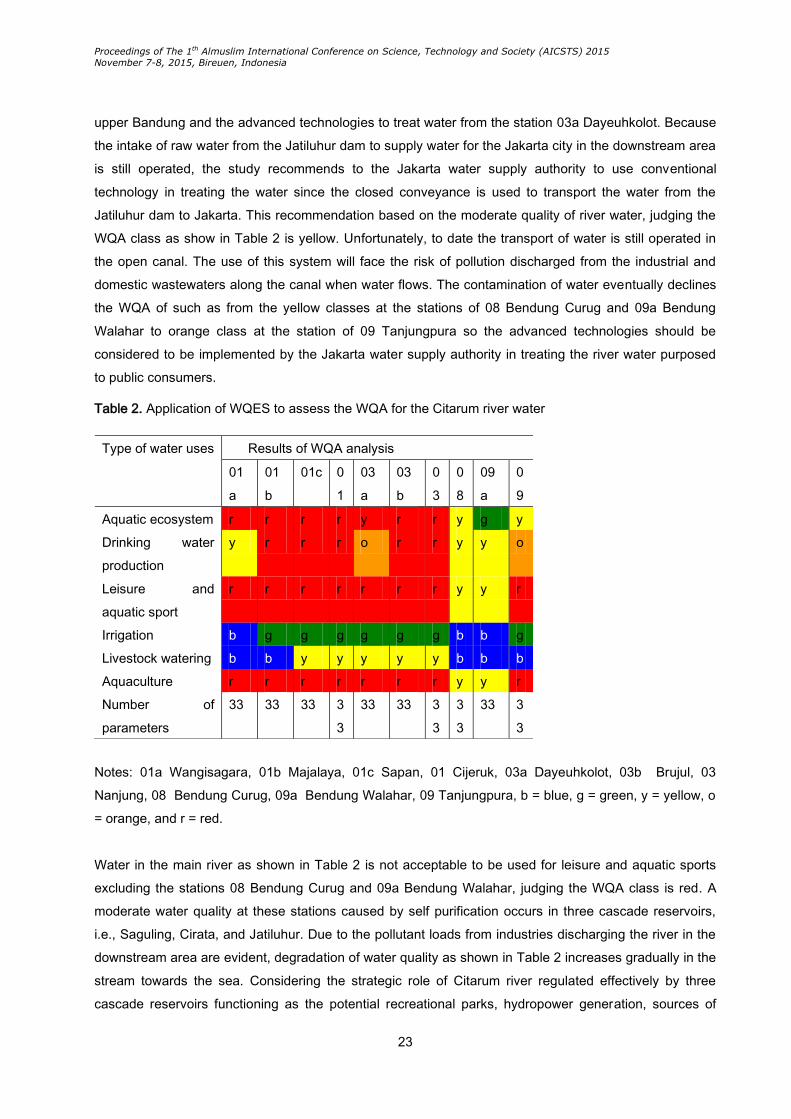
Proceedings of The 1th Almuslim International Conference on Science, Technology and Society (AICSTS) 2015
November 7-8, 2015, Bireuen, Indonesia
23
upper Bandung and the advanced technologies to treat water from the station 03a Dayeuhkolot. Because
the intake of raw water from the Jatiluhur dam to supply water for the Jakarta city in the downstream area
is still operated, the study recommends to the Jakarta water supply authority to use conventional
technology in treating the water since the closed conveyance is used to transport the water from the
Jatiluhur dam to Jakarta. This recommendation based on the moderate quality of river water, judging the
WQA class as show in Table 2 is yellow. Unfortunately, to date the transport of water is still operated in
the open canal. The use of this system will face the risk of pollution discharged from the industrial and
domestic wastewaters along the canal when water flows. The contamination of water eventually declines
the WQA of such as from the yellow classes at the stations of 08 Bendung Curug and 09a Bendung
Walahar to orange class at the station of 09 Tanjungpura so the advanced technologies should be
considered to be implemented by the Jakarta water supply authority in treating the river water purposed
to public consumers.
Table 2. Application of WQES to assess the WQA for the Citarum river water
Notes: 01a Wangisagara, 01b Majalaya, 01c Sapan, 01 Cijeruk, 03a Dayeuhkolot, 03b Brujul, 03
Nanjung, 08 Bendung Curug, 09a Bendung Walahar, 09 Tanjungpura, b = blue, g = green, y = yellow, o
= orange, and r = red.
Water in the main river as shown in Table 2 is not acceptable to be used for leisure and aquatic sports
excluding the stations 08 Bendung Curug and 09a Bendung Walahar, judging the WQA class is red. A
moderate water quality at these stations caused by self purification occurs in three cascade reservoirs,
i.e., Saguling, Cirata, and Jatiluhur. Due to the pollutant loads from industries discharging the river in the
downstream area are evident, degradation of water quality as shown in Table 2 increases gradually in the
stream towards the sea. Considering the strategic role of Citarum river regulated effectively by three
cascade reservoirs functioning as the potential recreational parks, hydropower generation, sources of
Type of water uses Results of WQA analysis
01
a
01
b
01c 0
1
03
a
03
b
0
3
0
8
09
a
0
9
Aquatic ecosystem r r r r y r r y g y
Drinking water
production
y r r r o r r y y o
Leisure and
aquatic sport
r r r r r r r y y r
Irrigation b g g g g g g b b g
Livestock watering b b y y y y y b b b
Aquaculture r r r r r r r y y r
Number of
parameters
33 33 33 3
3
33 33 3
3
3
3
33 3
3

Proceedings of The 1th Almuslim International Conference on Science, Technology and Society (AICSTS) 2015
November 7-8, 2015, Bireuen, Indonesia
24
water for domestic, municipality and industry, as well as the source of irrigated water for paddy fields and
fishponds, delivers 20% of Indonesia's gross domestic product, this study recommends to the central
government of Indonesia to envisage as first priority the problems of this river pollution. This suggests the
need to install correctly the wastewater treatment plants for each industry and for each city of the entire
the Citarum river basin particularly for the upstream areas of the basin to reduce the pollutants of organic
matter, microorganisms, and suspended particles. Besides to improve the quality of water related to
suspended particles, there is a need to consider the occupation of lands to implement the best practice of
soil conservation effectively.
To analyze the suitability of water for irrigation purpose is summarized in Table 2. This informs that water
quality in the river is still suitable to irrigate especially for paddy fields of as the major part of water uses in
the region, judging the WQA classes for all the station selected are classified as blue or green aptitude. It
is remarkable that the Jatiluhur dam serves suitably water for 240,000 ha of paddy fields in the
downstream areas. Unfortunately, the overflow of irrigated water is usually to drain back into the river.
The runoff from paddy field as verified in the Ile de Camargue, France, carries important loads of
dissolved pesticides to the wetlands including river (Comoretto et al., 2008). Drinking water pollution in
the Evros region Northern Greece can be attributed to excessive fertilizer use from agricultural sources
(Nikolaidis et al., 2008).
For more accurate assessment of the effects of water quality, for a given livestock production system the
format should be based on ingestion levels, as opposed to a mg/l basis, and should take into account
site-specific synergistic and antagonistic interactions within and external to the water to a greater extent
(Meyer et al. 1997). The aggregation method of WQES using in this study led to the formulation of a
water quality guideline index system based on WQA basis. Referring to the classification in the literature
(Oudin et al., 1999), this study concludes that utilization of Citarum water to provide the livestock watering
of all animals including the most sensitive such as young animals, animals in gestation or milking is still
suitable for the stream waters from the upper Bandung city (see the stations 01a Wangisagara and 01b
Majalaya) and the downstream of Jatiluhur dam (see the stations 08 Bendung Curug, 09a Bendung
Walahar, 09 Tanjungpura), judging the WQA classes are blue (see Table 2). The stream water along the
river segments between Bandung city and Saguling dam is suitable to provide the livestock watering of
mature animals that are less vulnerable such bovine and ovine and needs to control strictly the quality of
water used, judging the WQA classes as shown in Table 2 are yellow (see the stations 01c Sapan, 01
Cijeruk, 03a Dayeuhkolot, 03b Brujul, 03 Nanjung).
Fish and crayfish perform all bodily functions in water which include eating, breathing, excreting wastes,
reproducing and taking in or removing salts. Water quality can affect these functions and therefore will
determine the health of the fish and consequently the success or failure of a fish farming operation. For
example, carbohydrate addition in water affects to (1) increase the nitrogen retention in harvested shrimp
biomass, (2) reduce the demand for feed protein, (3) reduce the concentration of NKJ and NO2−, and (4)
reduce nitrogen discharge making extensive shrimp farming more ecologically sustainable and
economically viable (Hari et al. 2006). Despite the stream water in the river is unsuitable for direct use in
Proceedings of The 1th Almuslim International Conference on Science, Technology and Society (AICSTS) 2015
November 7-8, 2015, Bireuen, Indonesia
25
aquaculture generally, judging the WQA classes are red (see stations 01a Wangisagara, 01b Majalaya,
01c Sapan, 01 Cijeruk, 03a Dayeuhkolot, 03b Brujul, 03 Nanjung, and 09 Tanjungpura), Table 2 shows
that the river water immediate the downstream of Jatiluhur dam is suitable for all adult fishes which are
not very sensitive to pollution, judging the WQA classes are yellow.
Conclusion
This study used the WQES to assess the suitability of water for different uses and its ecosystem for the
Citarum river water. The suitability of the river water was examined through WQA assessment to forbid
strongly the uses of water in the upstream the Saguling dam to provide (1) the suitability of biodiversity
growth and productivity, (2) drinking water production except the stream water upper Bandung city, (3)
leisure and sport activities, and (4) aquaculture uses. Although the stream water of the river segment
between the Bandung city and Saguling dam needs to be controlled strictly, the quality of water is still
suitable to be used for irrigated lands and livestock watering. The improvement of water quality was
verified immediate the downstream areas of Jatiluhur dam due to the self purification occurs in three
cascade reservoirs, i.e., Saguling, Cirata, and Jatiluhur, consecutively. This gives the advantage to supply
raw water from the Jatiluhur dam to Jakarta city for drinking water production with adequate quality since
the closed conveyance is used for transporting the water.
The stream water upstream the Suguling dam (see upper the station 03 Nanjung) is totally prohibited for
supporting the biological potential function, leisure and aquatic sports, and aquaculture purposes judging
the WQAs of these water uses are unsuitable, indicating as red color (see Table 2). This study justifies
that the factual water quality of the river no matches the standards regulated in Perda Jabar No. 39/2000.
This gives the rational argument to urge the local authorities, central government, and all related
stakeholders to concern for improving the river water quality. This study shows that the use of WQES
practically remained comprehensive in evaluating water quality systematically. There is the analysis of
water quality data to convert into the usable information that serves as DSS in managing of available
water comprehensively.
References
Almeida, C., Quintar, S., González. P., & Mallea, M. (2008) Assessment of irrigation water quality: A
proposal of a quality profile. Environ Monit Assess, 142(1), 149-152
Castela, J., Ferreira, V., & Graça, M.A.S. (2008) Evaluation of stream ecological integrity using litter
decomposition and benthic invertebrates. Environ Pollut, 153(2), 440-449
Chen, C.F., & Ma, H.W. (2008) The uncertainty effects of design flow on water quality management.
Environ Monit Assess, 144(1), 81-91
Comoretto, L., Arfib, B., Talva, R., et al (2008) Runoff of pesticides from rice fields in the Ile de Camargue
(Rhône river delta, France): Field study and modeling. Environ Pollut, 151(3), 486-493
Dahal, B.M., Fuerhacker, M., Mentler, A., et. al., (2008) Arsenic contamination of soils and agricultural
plants through irrigation water in Nepal. Environ Pollut, 155(1), 157-163
Proceedings of The 1th Almuslim International Conference on Science, Technology and Society (AICSTS) 2015
November 7-8, 2015, Bireuen, Indonesia
26
Directorate General of Water Resources (DGWR). (2007) Integrated Ciatrum water resources
management project: Report on roadmap and program development. In: Technical assistance
consultant’s report.
Dunlop J.E., Horrigan N., McGregor, G., et al., (2008) Effect of spatial variation on salinity tolerance of
macro-invertebrates in Eastern Australia and implications for ecosystem protection trigger values.
Environ Pollut, 151(3), 621-630
Fulazzaky, M.A. (2005) Assessment of river water quality degradation of the Citarum and Brantas rivers
by using a new developed water quality index system. In: Proceeding of The 2nd Southeast Asia
Water Forum:, Bali, Indonesia, 31 August to 3 September 2005
Fulazzaky MA (2008) Water quality evaluation system to assess the river water quality. In: Universiti Tun
Hussein Onn Malaysia Colloquium.
Fulazzaky MA (2009) Water quality evaluation system to assess the Brantas river water. Water Resour
Manage, 23(14), 3019-3033
Fulazzaky, M.A; Teng, W.S; & Mohd Masirin, M.I. (2010) Assessment of water quality status for the
Selangor river in Malaysia. Water Air Soil Pollut, 205(1): 63-77.
Hari, B., Madhusoodana Kurup, B., Varghese, J.T., et al., (2006) The effect of carbohydrate addition on
water quality and the nitrogen budget in extensive shrimp culture systems. Aquaculture, 252(2-4),
248-263
Hartmann, J., Lev, J.K.,& Okada, N. (2006) Managing surface water contamination in Nagoya, Japan: An
integrated water basin management decision framework. Water Resour Manage, 20(3), 411-430
Holvoet, K., Gevaert, V., van Griensven, A., et al., (2007) Modelling the effectiveness of agricultural
measures to reduce the amount of pesticides entering surface waters. Water Resour Manage,
21(12), 2027-2035
Hrudey, S.E., Hrudey, E.J., & Pollard, S.J.T., (2006) Risk management for assuring safe drinking water.
Environ International 32 (2006) 948–957
MacGillivray, B.H., & Pollard, S.J.T., (2008) What can water utilities do to improve risk management
within their business functions? An improved tool and application of process benchmarking.
Environ International 34: 1120-1131
Meyer, J.A., Casey, N.H., & Coetzee, C.B. (1997) Water quality guidelines for livestock watering in
Southern Africa. Water S.A. 23(1), 7-12
Mohr, S., Feibicke, M., Berghahn, R., et.al., (2008) Response of plankton communities in freshwater pond
and stream mesocosms to the herbicide metazachlor. Environ Pollut, 152(3), 530-542
Muhammetoglu, A., Muhammetoglu, H., Oktas, S., et. al., (2005) Impact assessment of different
management scenarios on water quality of Porsuk river and dam system – Turkey. Water Resour
Manage, 19(2), 199-210
Nikolaidis, C., Mandalos, P., & Vantarakis, A. (2008) Impact of intensive agricultural practices on drinking
water quality in the Evros region (Northern Greece) by GIS analysis. Environ Monit Assess,
143(1), 43-50

Proceedings of The 1th Almuslim International Conference on Science, Technology and Society (AICSTS) 2015
November 7-8, 2015, Bireuen, Indonesia
27
Oudin, L.C., Meybeck, M., & Roussel, P. (1999) Système d’évaluation de la qualité de l’eau des cours
d’eau. Rapport de presentation SEQ-Eau (version 1), Agence de l’eau Loire-Bretagne, France.
Tafangenyasha, C., & Dube, L.T. (2008) An investigation of the impacts of agricultural runoff on the water
quality and aquatic organisms in a Lowveld Sand river system in Southeast Zimbabwe. Water
Resour Manage, 22(3), 119-130
Teuchies, J., de Deckere, E., Bervoets, L., et. al., (2008) Influence of tidal regime on the distribution of
trace metals in a contaminated tidal freshwater marsh soil colonized with common reed. Environ
Pollut, 155(1), 20-30
Proceedings of The 1th Almuslim International Conference on Science, Technology and Society (AICSTS) 2015
November 7-8, 2015, Bireuen, Indonesia
28
Religious Memory and Scientific Ethics after Hiroshima and
Nagasaki
Gregory Vanderbilt
Department of History, UCLA/ CRCS
Abstract
2015 has been a year of anniversaries, notable for the 70th anniversaries of the events
of the last year of World War II (or the Asia-Pacific War) and the advent of our still
postwar world. Japan’s surrender on August 15th, 1945, followed a series of heavy fire-
bombings of Japanese cities, including Tokyo on March 10th; the fall of the German
Reich in April; the invasion of Okinawa in April and its surrender in June, culminating in
mass, coerced suicides; the Potsdam Declaration promising “complete and utter
destruction” in July; and then, on August 6th, and again on the 9th, the destruction in a
flash of two Japanese cities. Because Indonesian independence was declared
immediately after the collapse of the Japanese empire and because Americans were
anticipating an invasion of the main islands as intensive as the one in Okinawa, the
general perspective in both countries has been that the Atomic Bombs were somehow
necessary, a perspective we can call “from above the mushroom cloud.” At the same
time, to consider what happened “below the mushroom cloud” and even begin to
recognize the sheer horror of the instantaneous destruction and annihilation also forbid
us to think only from that perspective, as this events as two more in the long history of
hostilities, but rather as unparalleled, as also outside history. I went back to Hiroshima
and Nagasaki this August. I went partly to grapple with what happened there and how it
is remembered in the present and partly to try to see how religion and religious studies
can be a helpful framework for examining the process of memory, which is at once
deeply situated in political contexts and transcending such limits for the taste of
existential destruction that happened there. In this paper, I attempt to ask about religion
and memory after seventy years and to then raise the questions of science and ethics,
given that Hiroshima (like Auschwitz) was a marvel of science, the result of intensive
and secretive scientific inquiry, the largest in world history to that date.
Religious Memory
On August 6th 1945, 90% of Hiroshima was incinerated. Thousands in the immediate zone of the
hypocenter disappeared, sometimes leaving a shadow of carbon on concrete or a bit of metal—a
lunchbox, a watch, a tricycle. 140,000 were dead by the end of 1945 and as of this year a total of almost

Proceedings of The 1th Almuslim International Conference on Science, Technology and Society (AICSTS) 2015
November 7-8, 2015, Bireuen, Indonesia
29
300,000 victims—called in Japanese hibakusha-- have been entered into the memorial books. This was
a city with military operations but it was a city and the victims were men, women, and children; Japanese
citizens and Korean forced laborers, Southeast Asian students, European prisoners of war. A smaller city
in the far southwest, Nagasaki was not the first target for the 9th but cloud cover over Kokura led the plane
carrying the second atomic bomb to be redirected. Nagasaki has a long history as a trading port, the one
place the Dutch were allowed to maintain a base during the 250 years during which the country was
closed to the West, and a center for Catholics who just thirty years earlier had dedicated a cathedral
barely a kilometer from where the bomb was detonated. 70,000 were dead by the end of 1945 and the
memorial books now record close to 170,000. The average age of the survivors is now past 80 but it still
possible to hear their testimonies directly, of the flash and the boom (pika and don in Japanese), of the
blistering bewildering heat, of making their way home to discover who among their family and community
was still alive, of health problems without end, of discrimination.
Memory can be understood in at least three interconnected senses here. First, memory as an operation
of the human mind to store and recall the past in the present is paired with the two operations which
disrupt this humanly fallible process: forgetting, on one hand, happens to us all and trauma, on the other,
follows injury to the body, the psyche, the community. Such memory is also at times set against history
that is defined and seemingly supported through a documentary basis and bias. As in the case of the so-
called comfort women or jugun ianfu whose memories of sexual enslavement by the Japanese military
have challenged the documented and often male official narrative, it can be what the subaltern possesses
in order to make claims on dignity and justice. Second, as famously explicated by Pierre Nora and his
research team in their search for the lieux de memoire that define the French nation, memory can mean
the explicitly political narration of a past that holds together a nation or other community. Two decades
ago, a controversy over the exhibition of the B-52 called Enola Gay, from which the atomic bomb was
detonated on Hiroshima, was reduced to simplistic terms and then reached the United States Senate
which felt compelled to pass a resolution declaring the use of the A-bomb morally good and force the
elimination of nuanced historical explanation, an indication of the moral ambivalence still pervading the
U.S. Third, memory can mean remembrance, the obligation to the dead to hold onto and honor their
existence until it too, with us, slips into oblivion. Memory is pursued through the activities of
memorialization and commemoration, of holding rituals and erecting monuments, of visiting graves and
memorials as a moral and emotional obligation. This is one of the tasks of religion, though one it often
rejects.
To inquire into religion likewise means to take on two interconnected meanings. First, there are the ways
that religious language and ritual patterns pervade memory and the ways of commemoration, particularly
at sites and on occasions that are sanctified with reference to memory and the community—which
remains, by design, not clearly designated. Second, there are the activities of specifically religious
groups that extend beyond this occasion and which bring religious and inter-religious purposes to the
project of memory. Though Robert Bellah reportedly described “civil religion” in response to questions
from Shinto priests visiting Washington in the 1950s and asking how it could be that American

Proceedings of The 1th Almuslim International Conference on Science, Technology and Society (AICSTS) 2015
November 7-8, 2015, Bireuen, Indonesia
30
nationalism was so full of God-talk while the American occupiers had banned the State Shinto of the
prewar state, this is not quite his civil religion because it does not make clear who it defines—indeed it is
generally, on one hand, a specific community of experience transposed onto a modern city, often at odds
with the national government, and, on the other, a “universalized” experience that could easily be the fate
of any person anywhere, regardless of the specificities of culture or history. It does however retain the
prophetic potential pointed to by Bellah to make demands from its own logic and sense of what is right
In the first category, I can point to four ways religious forms pervade these commemorations.
1. Prayer. In the official ceremonies, “prayer” occupies a prominent place in the name and
function of the ceremony. Consider the very names of the official annual ceremonies held on
the anniversaries of the two atomic bombings: (in my literal translation; the usual English is
simply “Memorial”) the Hiroshima City Atomic Bomb Dead Spirit Consolation Ceremony and
Peace Prayer Ceremony and the Nagasaki Atomic Bomb Sacrificed Spirit Consolation Peace
Prayer Ceremony. There is a homonym at work here as well: ki’nen, with one of two other
characters pronounced ki, ones meaning to record, indicates memory in the sense of
memorial: such a ki’nen appears in the names of the museum and park at Hiroshima though
not at Nagasaki: the setting for transcendent memory is within secular memory. Prayer, in
the form of silent prayer (mokutō), is at the heart of the official ceremonies which are timed
such that the moment of the detonation of each bomb—8:15am, 11:01am—is one of silence
and/or the tolling of a bell. Wordless and led by no one, no direction is suggested for this
prayer and it concludes as the moment of the detonation passes. In both locations, silence is
immediately followed by speech act by the central event of the commemoration: the peace
declaration read by the mayor. Beginning in 1947 and 1948, these declarations have issued
annually without interruption since 1951. They are appeals to world leaders to enact and
enforce treaties against nuclear weapons and to the Japanese government to provide
adequately for the surviving hibakusha. One might also see prayer in the practice of folding
origami cranes and bringing strings of a thousand to lay before the children’s monument
recalling the story of Sadako Sasaki, a girl who was exposed to radiation in the womb and
died of leukemia.
2. The concept of witness is also key to the memory of the atomic bombs and of particular
importance at this juncture of 70 years, for as was noted repeatedly the average age of the
survivors has now passed 80. Because of instant annihilation of untold thousands followed
by the agonized deaths from internal and external burns of thousands more, many beyond
recognition (totaling, by the end of 1945, 140,000 in Hiroshima and 70,000 in Nagasaki), the
physical presence of those who did survive has come to be of great importance. As Lisa
Yoneyama has shown, the process of narrating memory as kataribe or testifiers is fraught
with a kind of politics of recognition as survivors (for whom access to specialized health care
Proceedings of The 1th Almuslim International Conference on Science, Technology and Society (AICSTS) 2015
November 7-8, 2015, Bireuen, Indonesia
31
was contingent on proving where one was at the moment of the blast or if one entered the
city later) but at the same time it carries a kind of urgency on behalf of others who cannot
speak and on behalf of a future peace in which nuclear weapons will not be used again.
3. A third way religious concepts are central to memory is in the hallowed ground of the
memorial sites, the two Peace Parks and adjacent areas. In the delta of Hiroshima, the park
was built between two branches of the river, below a T-shaped bridge said to have provided
the target, and a central memorial was put in place in line with the ruins of one of the few
structures to have survived the blast, the Prefectural Products Exhibition Hall now known as
the A-Bomb Dome. It is now known that the architect Tange Kenzō’s cenotaph is the
repurposing, on a smaller scale, of an earlier design that was meant to align with Mt. Fuji and
commemorate Japan’s victory in Asia. Few other traces of the mostly wooden neighborhood
remain in Hiroshima, though one of the many smaller ceremonies each year commemorates
that neighborhood. Instead, a new park was built on the burned out grounds, centered on the
museum and the cenotaph, but with space for a variety of monuments that met certain
“universalizing” gestures. Famously, the monument to Korean victims was constructed
outside the park, on the facing river bank, and was moved into the grounds only in the late
1990s. At Nagasaki, the Peace Park or grounds for the annual official ceremony face a statue
of a seated man with arms and legs in different directions, echoing in that way a Buddha but
looking more like a Greek god. (for years I assumed it represented Prometheus who brought
down fire from the heavens to the earth) This “sacred ground” is in fact the site of a prison,
the foundations of which remain visible, in striking contrast to the structure that parallels most
closely the A-bomb dome: the Urakami Cathedral which was reconstructed with only a few
pieces of its previous existence preserved in statuary. The monuments that fill this peace
park are of two types: memorial greetings primarily erected in the 1980s by socialist states
and recent monuments to the diversity of the victims, including for example the Chinese
(forced laborers) who died in the prison. On the anniversaries, these grounds and the
surrounding streets become the site of multiple commemorations as well as protests.
Perhaps because of its more central location and its historical position, there were far more
groups in Hiroshima, high school students with petitions, leftists with alternate publications,
religious groups considered outside the mainstream, peace commemorators seeking out
foreigners, and so on. Most moving were the hibakusha who came to speak without a
platform other than their story. There were also government directed memorial activities in
the twilight: the famous floating lanterns in Hiroshima echoed by wax candles at Nagasaki.
4. The language of “comforting souls” irei is present in the titles of the Hiroshima cenotaph and
the memorial ceremonies in both cities. It is linked to what we might call a Japanese “mystic
Proceedings of The 1th Almuslim International Conference on Science, Technology and Society (AICSTS) 2015
November 7-8, 2015, Bireuen, Indonesia
32
synthesis,” in which the spirits of the dead are present alongside the divinity within nature and
do need consolation, especially when they have died traumatically. One unique and moving
addition to atomic bomb commemorations is water imagery, recalling how those who were
badly burned but not killed instantly sought water to relieve their unquenchable thirst and cool
their burned flesh. They were often heard crying “mizu kure” “give me water” but often their
badly shocked systems could not accept the water they did find and they died immediately.
When water is poured from individual containers—as in those carried by various religious
leaders into their shared ceremony in Hiroshima or when, in the official ceremony in
Nagasaki, brought from springs in various corners of the city—into one bowl, it can be a
reminder of the collectivity of life itself. The second is that the most material remains honored
in these places is a set of books containing the names of the atomic bomb dead. These
books have been and will be updated annually until the last hibakusha has died. This
August, 5,359 names were added to bring the total to 297,684 (recorded in 109 books) in
Hiroshima and 3,373 names were added in Nagasaki to bring the new total to 168,767
(recorded in 170 books). Each city maintains an office to manage the books and to process
applications for inclusion and the names of non-Japanese are also included. Curiously, the
other place this act of memorializing through names handwritten in books is at the Yasukuni
Shrine in Tokyo, where nearly 2.5 million war dead from Japan’s modern wars from 1868 to
1945 are enshrined as kami. There are significant differences in that the Yasukuni Shrine is
formerly part of a state civil religious apparatus and now technically a private religious
organization that uses religious language a ritual, which, when patronized by government
officials, potentially violates the Constitution’s proscription against government use of
religious activities. Moreover, there have been no new entries into enshrinement register
since 1978, when the top-level officials executed as a class-A war criminals were added,
ratcheting up the controversy over the lack of remorse the shrine represents to the countries
in Asia Japan invaded. Still, the same question of how physical presence following the
devastation of war, either through the advanced weaponry or through death in distant lands
and oceans, is part of memorialization. These books, stored deep inside monuments, are
also different from the Cornerstone of Peace in Okinawa, an extensive black granite
monument carved with the names of combatants and civilians from all sides killed in the
Battle of Okinawa (April to June 1945).
The second meaning of religion and memory is, of course, the activities of religious groups and
surrounding the official ceremony in each place are both joint and specific memorial services and actions.
At Hiroshima, this took the form of first a joint Buddhist-Shinto-Christian service early on the morning of
the 6th, followed throughout the day by various sects of Buddhism as well as Catholicism and
Protestantism. Not included are the so-called new religions which originated in Japan (some of which,

Proceedings of The 1th Almuslim International Conference on Science, Technology and Society (AICSTS) 2015
November 7-8, 2015, Bireuen, Indonesia
33
like Tenri, date to the nineteenth century). These services face the genbaku kūyōtō, a mound-style grave
containing unclaimed hibakusha remains, with a list nearby inviting families to take these ashes back to
the family graves. Kuyō is Buddhist language originating in the concept of pūja or reverence for the
presence but seemingly shared here.
At Nagasaki, the 43rd Genbaku Junnansha Ireisai (Festival to Console the Spirits of those who Suffered
from the Atomic Bomb) was held on the night of the 8th in the park surrounding the hypocenter, at the
base of the hill where the peace ceremony would be held the next day. While this service had many of
the same elements as the public ceremony, each was led by a different religious leader and member of
the sponsoring organization which translates its name to English as the Fellowship of Religionists in
Nagasaki for Dialogue. According to its roster, it is made up of clergy of Japan’s religions including
eleven Christians (among them the organization’s advisor, the archbishop), eight Shinto priests, thirty-six
Buddhist priests, and nine “miscellaneous,” including Tenri which invited a Turkish Sufi to do whirling
meditation. This category of religionist (shūkyōsha) was a new one for me, invoking a category as reified
in law and academia as agama but one which most Japanese reject as requiring some kind of extreme
doctrinal loyalty that takes them into dangerous territory, as with AUM Supreme Truth which launched
apocalyptic terror in the subways in 1995: it seems to recognize that religion has a definite interest in
certain issues, especially peace and the memory of atrocity (regardless of the religious identities of the
victims) and it is always plural. The most prominent use of the terms is in the name of the global network
Religions for Peace which was launched in Kyoto in 1970, but its Japanese branch dates to 1951 and a
sense of the shared responsibility of religious organizations for the war, an opportunity for penitence
(metanoetics).
Scientific Ethics
In the weeks following this commemoration, from the perspective of many Japanese, the memory of the
A-bomb victims was violated in two ways by the actions of the current Liberal Democratic Party-led
government of Prime Minister Shinzō Abe. First, two days after the Nagasaki memorial, the Sendai
Nuclear Power plant 100 miles to the south was restarted, the first nuclear power plant to go back into
operation since all were taken offline in the wake of the triple disaster that hit northeast Japan on March
11th, 2011. In its wake, and in the fears of long-lasting radiation contamination over a wide area,
Fukushima has become a third disaster in which a city name is written with phonetic syllabary. But this
requires a redefinition of what happened at Hiroshima and Nagasaki, from technologically advanced
atrocities that have not been repeated and serve as warning to the use of nuclear weapons and the need
for disarmament to a broader warning against nuclear energy in all forms. While the Nagasaki Museum
and the Nippon Myozan (Buddhist) peace marchers already included those exposed to radiation from
nuclear weapons tests in the South Pacific and elsewhere (most famously the Japanese fishing boat
Lucky Dragon #5, exposed in the Marshall Islands in 1955), Fukushima is something new and unresolved
(and part of a history in which the U.S. foisted “atoms for peace” onto the same country it had used two
atomic bombs on just years earlier.). Where the appeals remain directed against nuclear weapons and in

Proceedings of The 1th Almuslim International Conference on Science, Technology and Society (AICSTS) 2015
November 7-8, 2015, Bireuen, Indonesia
34
support of the non-proliferation treaties, the Religionist group fasted instead for “a 21st century without
nuclear weapons or nuclear power.”
Second, as the commemorations were going on, Japan was being shaken by perhaps the most
substantial public political demonstrations since Prime Minister Abe’s grandfather forced through a
renewal of the U.S.-Japan Joint Security Treaty in 1960. The bill the government finally did push through
the Diet in September re-interprets Article 9 of the 1947 Constitution, “forever renounc[ing] war as a
sovereign right of the nation,” as allowing something called a “right of collective self-defense” through
which Japan may enter, for example, U.S.-led military interventions. The movement against it, which took
form in mass demonstrations in many cities as well as surrounding the Diet building, was quick to name it
the “War Bill” and to see in it a dark turn in Japanese politics away from democracy and peace. Prime
Ministers have spoken at both ceremonies for several decades and their remarks, which follow the
“pledge for peace” (heiwa he no chikai) read by local children, are the one unscripted part of the program.
Abe’s remarks at Hiroshima were criticized for mentioning neither Article 9 nor Japan’s so-called “Three
Nuclear Principles” (not making, not possessing, not harboring nuclear weapons) and in Nagasaki he did
make a gesture at the latter. Because the programs are timed so carefully around the exact moment of
the detonation, demonstrators were able to intrude sonically on Abe as he spoke, reminding the
assembled that he had not earned a sacralized atmosphere.
By way of conclusion, I would like to go a little deeper into the work of religion in memory: to the concept
of sacrifice. Recently, the secular philosopher Takahashi Tetsuya has named a sacrificial system which
inculcates the belief that some part of the community must accept that it must be sacrificed for the whole:
his examples are Okinawa, where American military bases are an obnoxious and destructive presence,
and Fukushima, the cost of which is far from understood but the calculations were made long ago by
politicians, electric company executives, compliant scientists and the public. Since I first visited
Hiroshima and Nagasaki in the mid1990s, the Japanese State has built its own memorial halls in each
place (Hall to Pray for Peace and Eulogize the Atomic Bomb Dead). Borrowing methods from Holocaust
memorials, these halls seem set to counter the city-run museums which set the cities apart as
universalized sacrifices (hence the slogans: no more Hiroshima, no more Nagasaki, to which is now
added no more Fukushima) apart from the nation. Even so I was surprised by the statement at the
entrance in Hiroshima: in the official translation: “The National Peace Memorial Halls for the Atomic
Bomb Victims in Hiroshima and Nagasaki are an effort by the Japanese national government to
remember and mourn the sacred sacrifice of the atomic bomb victims. They are also an expression of
Japan's desire for genuine and lasting peace.” Sacred sacrifice by whom, for what? Can we continue to
allow there to be sacrifice without meaning? Is that a question religions and/or religionists should try to
answer?
One answer is in the refusal to sacrifice or to sacrifice others. Here the example of a second Japanese
intellectual Takagi Jinzaburō. Takagi promoted the idea of the “citizen-scientist” who can utilize the
knowledge and method of science but is self-consciously independent of power, including the intimate
relationship of the university with the military, government, and the corporate world. For a nuclear

Proceedings of The 1th Almuslim International Conference on Science, Technology and Society (AICSTS) 2015
November 7-8, 2015, Bireuen, Indonesia
35
chemist like Takagi, severing ties with this kind of power meant loss of access to the high-tech methods
of research but it also gave him the freedom to use his knowledge to counter the government and
academic experts, particular in their interpretation of data most citizens cannot make sense of, which
sometimes, as with nuclear power, has life-and-death consequences. With the prize money from the
1997 Right Livelihood Award, sometimes called the alternative Nobel Prize for lives well lived, his little
community gives small grants to independent science and, after the March 11th triple disaster, they, the
Citizens’ Nuclear Information Center (www.cnic.jp) were some of the very few independent experts who
could understand what was happening and counter the official government-corporate assurances that
nothing was wrong. On one hand, citizen science might be understood as the most secular conclusion to
the idea of the rational scientist, but on the other was Takagi’s Buddhist ethic of reverence for all life,
which came through less in some kind of religionist practice than in his love of the Buddhist Japanese
writer Miyazawa Kenji, who died in 1937 and did not see the destruction of August 1945. But we have
seen it and we must learn to see it from below the mushroom cloud. And remember.

Proceedings of The 1th Almuslim International Conference on Science, Technology and Society (AICSTS) 2015
November 7-8, 2015, Bireuen, Indonesia
36
Undertaking Global Health Issues through Research and
Innovation
Gloria Shiela E Coyoca
Mindanao State University – Iligan Institute of Technology College of Nursing
Abstract
There is an estimated 8.2 million under –five child deaths per year, and from this
number, 3.3 million occur during the neonatal period – babies in their first 28 dyas of life.
Around 66.67% of these newborn deaths are preventable if effective health
interventions are provided at birth & during the first week of life.Moreover, maternal
mortality is exceesively high, around 830 women die daily from preganancy or childbirth
- related complications globally and these deaths could have been prevented. The aim
of this study is to identify the contributory factors of maternal and neonatal mortality
globally and to determine interventions in addressing these global health issues. Meta –
analysis showed that the contibutory factors of both maternal & neonatal deaths include
LACK, this is an acronym, which stands for L- location, A – age, C – cultural beliefs, and
K – knowledge deficit.For the location, it has been validated by published researches
that the distance of the home residence among pregnant mothers would greatly affect
their utilization of maternal health care services, as to age, it has been found out that
extreme age, adolescents (13 – 17 years old) and 42 years old and above have been
associated with both high maternal & neonatal deaths, in addition, cultural beliefs was
the priority measure that pregnant mothers would embrace in dealing with their
pregnancy problems, and employing health care services would be their last resort,
regarding knowledge , it has been revealed that insuffient knowledge of mothers on the
complication of pregnancy and the importance of pre natal check up affects their
utilization of health care services, furthermore, deficient knowldge of the health care
providers also contributed to the increasing maternal & neonatal deaths. For the
interventions, HEALTH should be implemented, H – stands for health education,
educating mothers, families, communities on the importance of pre- natal and post –
natal check – up, nutrition, exclusive breastfeeding, complications of pregnancy, would
change the mothers behavior, there will be improvement in their utilization of health
care services, educating health care providers through trainings, seminars and
workshops, E – stands for empowerment , building capacities of mothers families and
comminity, A stands for access, health care insurance should be provided to all
mothers, focusing on those living in the remote areas, establishing birth camps should
also be introduced to those far away areas, E also refers to the implementation of

Proceedings of The 1th Almuslim International Conference on Science, Technology and Society (AICSTS) 2015
November 7-8, 2015, Bireuen, Indonesia
37
Essential Intrapartum Newborn Care, L – stands for leadership and governance, which
specifically comprised five (5) equally important variables, and these include,
transparency & accountability, community participation, fair access to quality care,
increase coverage of skilled care at birth in health facilities, and sustainable programs,
T – stands for technology, all health care facilities should be equipped with sufficient
supply of medicines, devices, laboratory agents, equipments for medical and surgical
procedures, laslty, H – stands for home visits, health care providers should visit the
mothers and their newborn on the first day, third day and seventh day after delivery, to
thoroughly assess the mothers and their babies , to be able to address any untoward
complcations. Employing the HEALTH interventions may be able to solve the maternal
and neonatal deaths.
Keywords: Location, access, cultural beliefs, knowledge, health education,
empowerment, essential intrapartum newborn care, leadership & governance,
technology, home visits, maternal & neonatal deaths

Proceedings of The 1th Almuslim International Conference on Science, Technology and Society (AICSTS) 2015
November 7-8, 2015, Bireuen, Indonesia
38
Climate Change: Its danger for our production and why it
escapes our prediction
Cornelis Johan (Keess) Stigter
International Society for Agricultural Meteorology (INSAM)
Abstract
Our planet earth has a unique but complicated climate that presently is changing due to
the influence that our (mankind’s) activities appear to have on the composition of its
atmosphere. It is called anthropogenic (man made) climate change. The world’s
agricultural systems face an uphill struggle
in feeding a projected nine to ten billion people by 2050. Climate change introduces a
significant hurdle in this struggle. There is general and widely held scientific consensus
that the observed trends in atmospheric & ocean temperature, sea ice, glaciers as well
as climate extremes, during the last hundred years, cannot be explained solely by
natural climate processes and so reflect human influences. The argument that what we
experience could be natural climate change can also be refuted by the fact
that present understanding of cyclic climatology of the past points to a cooling planet
without the presence of mankind. On the simplest level, the weather is what is
happening in the atmosphere at any given time. The climate, in a narrow sense, can
be considered as the “average weather”. In a more scientifically accurate way, it can be
defined as: “the statistical description in terms of the mean and variability of relevant
quantities over a period of time”. One may argue that “global warming” is like “ageing”:
You can reduce the consequences but it will continue to happen. Stopping it is
impossible, so adaptation is necessary.

SSOOCCIIAALL,, CCUULLTTUURREE,, AARRTTSS aanndd EECCOONNOOMMIICC SSCCIIEENNCCEE CCHHAAPPTTEERR
Asnawi, Bachtiar Akob, Mufti Riyani:
Social dysmenorrhea: Impact Forecast in the Social Process (Case Study in Acehnese
Community, Indonesia) 39
Cut Khairani:
Forms of Social Interactions of People in Coffee Shops in Banda Aceh 45
Iswadi:
Acehnese Cultural Heritage: Between A Black Portrait and Hope 55
Ruslan:
Agriculture as the Basis of Indonesian Culture: Understanding Agriculture as the Basic Ability of
Civic Education 65
Saifuddin A. Haitamy:
How English Infiltrated Into Acehnese Language 75
Sufri Eka Bhakti:
The Uses and Effects of Online Social Media among Acehnese Students 83
Wildan:
Epistolary Technique in a. Hasjmy Novels 94
Hamdani:
Analysis of Organizational Culture and Job Rotation Regional Secretariat on employee
performance in Bireuen 102
Khairil Anwar, Naufal Bachri:
Role of Wage and Gross Domestic Product in Declining the Rate of Unemployment in Indonesia 110
Nova, Megasari Gusandra Saragih:
Effect of Competence, Task Attractions, Situational Factors Toward Employee Motivation and Performance in
Central Administration of the University of Almuslim 122
Sabri:
The Economic Community of Asea 2015 Trade Liberalization and Investment Trade and Investment Realize
Southeast Asia Regional Economic Interaction 133
Syaifuddin Yana, Badaruddin, Syamsul, Bahtar:
Supply Chain Performance Management Toward Plastic Waste Suppliers With Using Analytical
Hierarchy Process 144
Zulkarnaini, Zuarni, Fakriah:
The Contribution of Corporate Social Responsibility on External Stakeholders Perspective 156
Benni Sinaga:
Relationship Factors Economic Growth with Environmental Quality in Indonesia 165
Hendra Raza, Rita Meutia:
The Indirect Effect of Empowerment, Innovation, Professionalism, Role Ambiguity, Role Conflict to
Organizational Commitment, Individual Performance and Turnover Intention 179

Nurhalima Pandiangan:
Employee Satisfaction Analysis on PT. Bintang Surya Perkasa Medan 190
Sitti Zubaidah:
Potential of Sustainable Livestock Agroindustry in Indonesia 196
Togu Harlen Lbn. Raja:
Behavior Analysis of Employees and Human Resources Development Policy to Performance of Employees
at Sekolah Tinggi Ilmu Ekonomi LMII Medan 209
Aditya Wardhana, Win Konadi:
Analysis of Factors Consumer Preferences Ojek Online in Indonesia Using Conjoint Technique Analysis 217
Em Yusuf Iis: Human Resources Management and Performance of Employees at Bureau of Aceh Government 224
Hilmi, Mukhlis Yunus:
Determinant Factor of Competencies and Implication to Performance 234
Muammar Khaddafi, Mohammad Heikal:
Micro Finance Model of Agriculture in Supporting Economic Growth in Aceh 243
Rasmulia Sembiring:
The Effect of Individual Skills, Motivation and Support Organization to Performance Employees in Torganda
Company, Medan 256
Sonny Muhammad Ikhsan Mangkuwinata:
Implications Local Revenue against Public Welfare Improvement in Bireuen 268
Zahraini:
Role of Microfinance Institutions (MFIS) in Poverty Alleviation 277
Ridwan:
Human Resources Management Function in Developing the Discipline Reform in Education, Youth and Sports
Lhokseumawe 287
Hakim Mutaqim:
The Role of Gross Regional Domestic Product (GDP) against Poverty in Bireuen 296
Ibrahim, T. M. Nur:
Ginie Ratio Analysis 303
H. A. Lawali Hasibuan:
The Application of Criminal Sanctions againts the Perpetrators of the Domestic Violence Crime 312
M. Ridha Siregar, Teuku Azmi:
Influence Awareness Activities Corporate Social Responsibility and Customer Satisfaction on Purchase Intentions
and its Impact on Customer Loyalty in Customer PT. Bank Aceh in Banda Aceh 318
Boriboon Pinprayong:
HRM and Change Management in Thai Banking Industry: Case of Siam Commercial Bank 331
Chairul Bariah, Saudah:
Analysis of Leadership Style Effect of Camat toward Job Performance Employees 347

Edy Putra Kelana:
Education Decentralization Policy Implementation In the context of Aceh Government 359
Muhammad Hatta, Tengku Noor Azira Binti Tengku Zainuddin, Cut Khairunnisa:
Role of the Doctor as Expert Witness in Medical Malpractice Cases 367
Amiruddin Idris:
Effect of Regulations, the Availability of Budget and Work Motivation of Public Service Quality In Office
Of Education Aceh Province 377
Fajri M Kasim, Abidin Nurdin:
Local-Wisdom-Based Conflict Resolution in Aceh: (The Study of the Role of Customary Institution for
Building Peace in Lhokseumawe, Aceh, Indonesia) 384
Roza Espandeary Rosman:
Human rights in Indonesia: An analysis of The Effects of Regime Change and Ongoing Economic development on
Human Rights Violations in Indonesia 393
Syamsuddin Lubis:
How to Find Work Crazy 404
Khairul Hasni:
Gold Mines in Four Districts as Economic Sector, and Become Dilemma for Community in Aceh 412
Proceedings of The 1th Almuslim International Conference on Science, Technology and Society (AICSTS) 2015
November 7-8, 2015, Bireuen, Indonesia
39
Social Dysmenorrhea: Impact Forecast in the Social Process
(Case Study in Acehnese Community, Indonesia)
¹*Asnawi, ² Bachtiar Akob, 3Mufti Riyani
1.2.3Department of History, Faculty of Teaching and Education, Samudra University, Langsa, 24416,
Indonesia;
Corresponding Author: [email protected]
Abstract
In the social process, we can find a certain social phenomena which precedes other
phenomena. Acehnese society have a unique phenomenon. Acehnese, often feel that
certain social mobility is a sign of the coming of a recess, chaos or crisis. The Acehnese
people who believe in the forecast ensure that a crisis will repeat in a phase of 10-year and
responded through various actions that would hamper social mobility. This forecast reflects
the condition of social cognition community. Simply put, social cognition to explain the
thoughts of the social world. Thus social cognition is a mental framework to organize and
use social information.This study aims to determine the causes and effects of the forecast
of the social process and finding appropriate treatment. Because there are no adequate
social concept, as a conclusion, the writer refer to this phenomenon by borrowing medical
terms, dysmenorrhea (social). Dysmenorrhea is a condition which is a nuisance pain during
menstruation. Dysmenorrhea is characterized by tremendous pain due to uterine
contractions. In a social concept, the womb can be analogized as a public entity. A
menstruating can be understood as a common cycle which is prevalent in society.
Keyword: social process, social change, forecast, collective experience, social
dysmenorrhea
Introduction
The alteration is usual cyclical which is absolutely in the society of human being, however, not for all
society having prosperity toward it. In the theory of sociology was organic analogy as the classical
approach about social change. August Comte divided two of the theory of system. There were social
statistic and social dynamic. Based on the difference, Herbert Spencer was analogized society as the
biological organism. Social statistic has been examining social anatomy divided from the structure and
Proceedings of The 1th Almuslim International Conference on Science, Technology and Society (AICSTS) 2015
November 7-8, 2015, Bireuen, Indonesia
40
social function. The social function has been marking the manner of operation and social change in
society. Furthermore, social dynamic has been focusing itself on the social psychology or social
processing (Sztompka, 2008).
In the Acehnese, occasionally were traumatic social changes as far as decennials. The alteration being
reduced in the collective memory had been called as “prognosis”. It has been existed and rounded like as
snow ball and spreading from each other, including migrant. Consequently, there was physical
phenomenon like as anxiety, traumatic and others, which obstructed social dynamic. It might be marked
as the negative social process. At the time it has been oriented on the social changed, Acehnese were
experienced what be called “abdomen disorder” or social strain because of conflict. It was the illness of
society on psychopathology on the broad of sociology. The social process can be found on other society
with different causing and preventing. The probably causing might collective memory sources by
Acehnese. As the partial social research, this case purposed to answer some basic problems. There were
understanding causes of social dysmenorrhea in the Acehnese, finding effective preventing to the
problems. The research trying to establish the hypothesis that social reaction against social process
connected with mentality or cognition of society.
Research Methods
Subject of the research are Acehnese, they were people who inhabited on the promontory northern of
Sumatera, Indonesia. Acehnese can be divided of people were inhabited on eastern and western
territories of coast of Aceh. Eastern Acehnese having various type and social information sources
because there were being border territory and centre of external social migration. On the other hand,
western Acehnese were much more homogeny. Sources from the two of countries purposed what
indications in social process of the meaning had been happened broadly or segmented.
This is social research with case study. Following Robert K. Yin (1989) case study is efficient used to
“empirical inquiry that investigates a contemporary phenomenon within its real ice context”. The focusing
of it is social dynamic based on physical society in the social process. The methodology of research is
called diachronic research which being centre of modern sociology study.
The research has been being used observatory technique, literature, and interview. Observation has
been done directly on the object of the research as the participant. The sources can be found through
intensively communication with Acehnese to get opinion, behaviour, belief, motive, perception, and
knowledge of society about the prognosis. Literature was used as the supplement sources to
understanding processing of prognosis and social psychology and break in hidden transcript in collective
memorial Acehnese. Analyse of source exploration with other approach that suitable to goal of research.
Procedures
Procedures of research have beginning from problem formulation, determining of hypothesis, object and
subject of research. It was followed by collecting of source in qualitative form. The kinds of sources are
opinion, behaviour, motive, belief, perception, and knowledge of research subject. The following step is
Proceedings of The 1th Almuslim International Conference on Science, Technology and Society (AICSTS) 2015
November 7-8, 2015, Bireuen, Indonesia
41
technique of source verification of triangulation. Next, exploration analyse and interpretation. It is using
historical approach, cultural, and psychoanalyze. Finally, the research is using inductive-deductive
interpretation to get generalization.
Results and Discussion
Social dysmenorrhea as the physiological phenomenon has been based on source collecting by subject
of research. People’s opinions about the prognosis objectively were various respecting of meaning it as
the preventive act. Most people and more grassroots were having much belief of decennial prognosis of
conflict. The social dysmenorrhea indicated as the physiological phenomenon can be seen by existing of
anxiety and social strain. Nearly decennial cycling of conflict, most of Acehnese will be frightened toward
the conflict. Certain social group will be limiting social movement and other communication to the other.
Social strain has been exhibited by limiting social access.
Social Cognition
Sources of Knowledge and Behaviour
Post the Helsinki Convention on 2005, conflict will be repeating about the year of 2015/2016 according to
the most of people. It can be seen from dissociative social process. Almost of Acehnese have been
recognized the decennial prognosis of conflict. The older group viewing the nature of it, but the younger
groups were not any information about it.
The reactions of social movement were various. However, generally, if social strain intergroup were
existing, hostility between apparatus and civil mysteriously will be seen as the truth of the prognosis. Any
discuss at the corner coffee, market, or other public were the issues of it.
This research ever is done by any local researches. One of the research is the study of Ajar Triharjo,
”Pancasila: Between The Myth of Messiah and Pancasila Education”. (Proceeding of Congress Pancasila
IV: Strategy of Institutionalizing the Value of Pancasila, page 150-157). The research is focusing on the
prognosis of King of Java, Jaya Baya. He was predicted will be presented of Kalabendu or destruction
era. The prognosis was stated that the Indian Archipelago will be intercrossing Kaliyuga era or mad era.
Consequently, the people of the state viewing that every social movement according the prognosis of
Jaya Baya, as form of the truth of it. The people unawareness will be reacting toward it. Another
alternative has been following stream with dissociative social movement to representation if the era
should be destructed according to the prognosis, Ajar called this as cultural pathology.
The condition is much different with that of Acehnese. In the Acehnese, the cycling of decennial
prognosis is viewed by some historical event causing trauma. It is based on vertical political conflict that
impacting horizontally. The beginning spot of internal Aceh conflict involving between ulama group (the
priests) and uleebalang (aristocrat). The conflict has been existing since 1945-1946, or known by
Cumbok war that having much impact. At the present context, however Cumbok war was took place
many years ago, but anxiety which caused by demolished customary law had been being established
Proceedings of The 1th Almuslim International Conference on Science, Technology and Society (AICSTS) 2015
November 7-8, 2015, Bireuen, Indonesia
42
during long period ago in Aceh (Uleebalang Government in Netherland Indies called Uleebalang
scappen) (Muhammad Ibrahim, 1983: 87). It was still existing as collective memory.
Next, the struggle of DI/TII on 1953-1960 between Acehnese group leading by T. Daud Beureuh and
Government State. The end of Cumbok war in 1952 brought Aceh into stability, however Aceh internal
social politic have been changed. Conflict again took place when Daud Beureuh who was successor of
Indonesia’s Independent, precisely struggling in Aceh against Government State on 20 September
(Nazaruddin Syamsuddin, 1990). He purposed to establish Indonesia Islamic State (NII) in Aceh
simultaneously between Kartosuwiryo in Java and Kahar Muzakar in Celebes. The motive of Daud
Beureuh struggling because of his disappointment to Government State who will uniting Aceh into
Northern of Sumatra Province. He is also desired to applying Syariat Islam (Al-Chaidar, 2008: 74). Beside
his anxiety of the return of Uleebalang powerful in Aceh (Cumbok war trauma). The ending of DI/TII
struggle on 1960, where Aceh be given extraordinary province. This status being new reason struggle of
independent Aceh (AM) and Independent Aceh Movement (GAM) in 1976 were established by Hasan
Tiro. There were supported by the priest who was interconnecting into PUSA. One of them is T. Ilyas
Leube, friend of T. Daud Beureuh, founder of Independent Aceh to the next generation. In true, more
much the priests who not supporting Hasan Tiro.
Aceh were stated conflict transformation between Cumbok war and DI/TII struggle having historical
connecting with Independent Aceh Movement, not only on hostility aspect but also in its actor’s relation.
(Sulaiman, 2000). The ending of GAM struggle was peaceable where two rivalry objects agreeing
Memorandum of Understanding in Helsinki, 15 August 2005 (Wahyudi, 2011). On the next improvement,
conflict in Aceh has not stopped until 2005. After the agreement, in 2006 Indonesia Government has been
applying extraordinary acts about Aceh Government through UU No. 11 2006 as mandatory of the first
point in agreement notes (Wahyudi, 2011).
The combinations of event if accounted mathematically were not exactly decennial of conflict. Among the
conflict time, peaceable, to others connecting event has been changed to collective experience which
reduced as “prognosis”. It has been being survived by oral culture. On the Malay society, oral culture is
different from literature inclined on the certain group and oral culture directly intercourse on grassroots
with different social cognition.
The prognosis as if a great energy, there were connecting between limited duration and combination of
traumatically period which shortly after. It was also caused by historical perspective in memory with its
social time through Acehnese (Ishak and Syamsuddin, 2013). Social time according to Sorokin and
Merton: “In general a time filled with varied and interesting experiences seems short in passing, but long
as we look back. On the other hand, a tract of time empty of experiences seems long in passing, but in
retrospect short” (Sorokin and Merton, 1937). In the present context, collective experience about the
conflict time, not repeating steadily only connected with the other connecting event. People became not
objective to view the signal of event and social processes are called social dysmenorrhea.
Proceedings of The 1th Almuslim International Conference on Science, Technology and Society (AICSTS) 2015
November 7-8, 2015, Bireuen, Indonesia
43
The analysis to understand causing, impacting, and preventing from Acehnese physiological were the first
Freud’s psychoanalyzed. It was supported by historical and cultural approaches. In time of social
movement, Acehnese unawareness will be their social communication by built homogeneity of
community, imitation with the other society, exodus planning, and arranged aggrandizements analyse
toward changed of the future. There were called by social anxiety. It was being patternmaking action
unconsciousness’ caused by repression (Ackerman Raquel, 2000). Freud’s psychoanalyze called it as
neurotic anxiety (Mc. Crone John, 2004) not objective anxiety. It was being frightened from effect if a
desire or necessity being be done. The necessity in the social concept called as social change itself. The
anxiety has been reduced socially as preventing act. However, because it neurologic, so the reaction of
social act became not planning and intrude on social dynamic.
Different from Freud’s analyse, so in the case of social psychopathology sourced by historical repression.
There were as same as of political repression in the Acehnese. Acehnese collective experience
established traumatic based on the failure of principle and identity negotiations. Identity of group had ever
repressed causing social cognition of unconsciousness (Russel, 2006). Historical traumatic in the case of
Acehnese cause them on disappointment dilemmatic and treatment of identity rooted by not clearing
problematic in the past. According to Freud and Breur dysmenorrhea or social pathology that ego either
conscious or unconscious which they called defense mechanism to preventing of anxiety. It was yet
Acehnese’s. It must be found through social collective experiences in history or culture of themselves.
Social invention need to therapy of them. Psychoanalyze therapy trying to demolish the prognosis
repression and helped people against past conflict based on reality.
Second approaches are social cognition. It is a mentality design to organized social information. They act
to responses social movement as the same as social cognitive of them. It is focusing on experiences
structure of them, awareness and transformation of stimulate into using information.
Prognosis is working as information to emotion forming and social behaviour. Information was given from
older group as the part of actor and narrator of history to younger group or others. They were in the
collective behaviour became mediation of group who purposing to give awareness all of people toward
social change of decennial conflict. The information became collective behaviour on the type of
Acquisitive Crazes or spreading belief (Coleman, S. James, 2001). Social cognition is ideology
representation towards social world. Post decennial perception causing political trauma. Either internal or
external social movement responded by stimulation form resulted internal meditational respond of active
interpretation aspect. If mediation group has been seeing stimulation automatically, cognitive group would
view character minor of reinforcement. Handling model of it can be done by cognitive therapist to their
patients. They were trying to suggested mind process of them to changed their emotion and behaviour.
Some of therapy models were introduced: cognitive restructuring by Davidson, rational emotive by Albert
Ellis and selectively by Aaron Beck.
On the indication of social dysmenorrhea, social activity will be stagnated and obstructed wealthy. It is
suitable to Robert Nisbet’s theory. He revised ideology of developmental and evolutional of materialism

Proceedings of The 1th Almuslim International Conference on Science, Technology and Society (AICSTS) 2015
November 7-8, 2015, Bireuen, Indonesia
44
history. He stated that social development and alteration have been not naturalistic and absolute, but
there were special factor natured by social history of a society.
References
Aackerman, Raquel. Sigmund Freud: Conflict and Culture. American Antropologis;Mar 2000; 102;1; Art
and Humanities. Full Text.Pg 147. viewed 1 sep 2015, http://proquest.umi.com/>.
Beck, A. T., Epstein, N., & Harrison, R. 1983. Cognitions, attitudes and personality dimensions in
depression. British Journal of Cognitive Psychotherapy.
Ajar Triharso. 2012. Pancasila: Antara Mitos Ratu Adil dan Pendidikan Multikultural. Prosiding Kongres
pancasila IV: Strategi Pelembagaan Nilai-Nilai Pancasila.pp.150-157).
Baron & Byrne. 2003.Social Psychology.Allyn and Bacon
Coleman, S James. 2011. Dasar-Dasar Teori Sosial:Referensi Bagi Reformasi, Restorasi dan Revolusi.
Bandung: Nusa Media
Darr, Orna Alyagon, The devil’s mark: a socio-cultural analysis of physical evidence. Continuity and
Change 24 (2), 2009, 361–387. Cambridge University Press 2009. viewed 01 sep 2015,
http://proquest.umi.com/>
Ishak, Otto Syamsuddin. 2013.Aceh Pasca Konflik; Kontestasi 3 Varian Nasionalisme. Banda Aceh:
Bandar Publishing.
M. Isa Sulaiman. 2000.Aceh Merdeka: Idiologi, Kepemimpinan dan Gerakan. Jakarta: Pustaka Al Kautsar
McCrone, John. 2004. THE LANCET Neurology. Vol 3 May 2004; http://neurology.thelancet.com. viewed
01 sep 2015, http://proquest.umi.com/>
Muhammad Ibrahim, et. Al. 1983. Sejarah Revolusi Kemerdekaan di Aceh. Jakarta: Departemen
Pendidikan dan Kebudayaan
Nazaruddin Sjamsuddin. 1990. Pemberontakan Kaum Republik, Jakarta: Graffiti
Robert K. Yin. 1989. Case Study Reserch Design and Methods. California: Sage publishing, Inc, p.23
Russel, Ian. Freud and Volkan; Psycoanalysis, group identity and archeology. Antiquity; mar 2006; 80;
307: Arts and Humanities Full Text. Pg185. viewed 1 sep 2015, http://proquest.umi.com/>
Sorokin and Merton. 1937. Social Time; A Methodological And Fungtional Analysis. American. Journal Of
Sociology, Vol 42, Issue 5, pp.616-617
Sztompka, PiÖtr. 2008. Sosiologi Perubahan Sosial. Jakarta: Prenada
Wahyudi Djafar. Menyelesaikan Masa Lalu, Memulihkan Aceh Sepenuhnya, dimuat dalam Jurnal Juris,
Lembaga Kajian Keilmuan (LK2) Fakultas Hukum UI, 2011.
Proceedings of The 1th Almuslim International Conference on Science, Technology and Society (AICSTS) 2015
November 7-8, 2015, Bireuen, Indonesia
45
Forms of Social Interactions of People in Coffee Shops in Banda
Aceh
Cut Khairani
Faculty of Social and Political Sciences, Universitas Almuslim,
Corresponding Author: [email protected]
Abstract
The objective of this study was to find out the forms of social interactions that took place
among the coffee shop customers in Banda Aceh. This study used survey method with
observation conducted in three sample coffee shops in Banda Aceh involving 14
informants. Data analysis was conducted from the time prior to making the field visits,
during the field visits and after the field visits by using coding procedure as guidance,
namely open coding, axial coding, and selective coding. The result of this study indicated
that social interactions that took place in coffee shops were associative in nature,
resulting in various forms of collaboration, an attitude caused by the relaxed cultural room
in coffee shops where such collaborative attitude could develop profusely, enabling to
bridge various structural and cultural differences among the coffee shop customers.
Traditional form of collaboration and harmony is the image of Acehnese community
cultural activities that take place among the customers in the coffee shops. The form of
collaborative bargaining and coalition in coffee shops occurring in coffee shops is
relatively free of psychological and sociological encumbrance so that various forms of
social interaction can manifest without any negative propensity among the customers.
Coffee shops in Banda Aceh have become a non-formal arena where cultural contacts
occurs, social structural barriers become dissolved, going on within the corridor of
politeness.
Key words: Forms of social interaction, coffee shops, Banda Aceh city.
Introduction
Aceh is one of western-most provinces in the unitary state of the Republic of Indonesia, which has special
cultural structures. One of them is coffee shop culture which has been going on since the time when Aceh
was ruled by sultans. Coffee shop or Keude Kupi (Acehnese) is a kind of shop where ‘sell and buy’ takes
place particularly coffee in the form of beverage. The fact that coffee shops also sell various kinds of

Proceedings of The 1th Almuslim International Conference on Science, Technology and Society (AICSTS) 2015
November 7-8, 2015, Bireuen, Indonesia
46
other beverages such as tea, syrup, and bottled or canned beverages, and various kinds of light food
such as noodle (called mi Aceh), “martabak” Aceh, and Acehnese cakes (Khairani, 2014).
Coffee shop has become a sign of strengthened new identity of Acehnese people, developed through the
meetings of people of all kinds, various institutions, different social statuses, and those with multicultural
identities. At such a stage of a shifting mode as this, coffee shops could colour the emergence of cultural
narration that crosses Acehnese cultural boundaries. On the one hand, coffee shops have been able to
become a kind of cultural cohesion, which is acceptable to all different social levels, on the other hand the
creation of such community centres as these can become part of cultural escalation process that can
bring about the emergence of new identity in the young generation in Aceh. In line with this, at this stage
there should be followed with some forms of delicate and more critical reading of the cultural change
phenomena (Mujib, 2009).
Mushalla (meunasah, praying house) as well as coffee shops (keude kupi) are two social institutions in
Acehnese community, which are inseparable in their daily life and have become part of Acehnese
community itself. The existence of the two institutions has largely spread in all corners of Aceh and the
two institutions have similar functions as media for socialization and interaction activities among the
people of the community. While the existence of Meunasah could be described to have been present in
Aceh since the time Islam was initially spread in Aceh, the existence of coffee shop, on the other hand,
could hardly be traced historically. Coffee shops, however, are presumed to have been present since the
time of Dutch colonization, and it was there where people at that time could probably socialize and
associate freely.
Formerly coffee shops were mostly developed within the vicinity of the mosques, which were taken as a
place where participative cultural system and positive climate were inspired in the life of Acehnese
community. It was these places that eventually brought about the birth of Islamic civilization in Aceh,
which was renowned to the entire world. When the call for prayers was made, the people would in groups
hurry to the mosques. When it was the time for ‘religious course’, they would leave the coffee shop for the
place where they would learn religious teachings and other general fields of study. In addition, when there
were problems in the community, they, in full respect of moral codes, would discuss in the coffee shop to
seek solutions to the problems, and then they would take the case to the mosque if the discussion in the
coffee shop met a stalemate.
There was indication that coffee shops turned to be so popular during the 1980s through mid-1990s when
DOM (Military Operation Region) was imposed on Aceh. There was even a discourse that said that coffee
shops also became coordinating media and as well among the commanders of the Free Aceh Movement
(GAM), and this place was also used for informal peace negotiations between GAM and TNI (Indonesian
National Military). However, in various news media the spotlight was only beamed on the uncountable
number of coffee shops and the habit of the Acehnese people sitting idle in coffee shops. Up to the
present there has been no information that describes in details whatsoever was there behind the habit of

Proceedings of The 1th Almuslim International Conference on Science, Technology and Society (AICSTS) 2015
November 7-8, 2015, Bireuen, Indonesia
47
sitting idle in coffee shops as such and what forms of Acehnese people’s social interactions that take
place in the coffee shop ambiance.
Research Methods
Research location refers to the definition of place or location of social research, which is characterized by
the existence of three elements: the actor, the place, and the activity that can be observed. The research
was conducted during the year 2013 in three locations, namely 3 (three coffeeshops) in separate
locations of Banda Aceh city area. Coffeeshops which were deemed representative as the objects of this
study were: Warung Kopi (coffee shop) “Cut Zein”, “Solong coffee shop”, and “Cek Juke coffee shop”.
These coffee shops were regarded to represent all other coffee shops in Banda Aceh city. These
coffeeshops were fixed as objects of the study based on several reasons: business experience,
customers elements, and the locations being in Banda Aceh. Cut Zein is a coffee shop managed in
relatively traditional nuance. “Solong coffee shop” represents all coffee shops that have been operating
for a long time in Banda Aceh and have spread to several other towns in Aceh. Cek Juke coffee shop
represents those that were classified as new and modern with high number of customers. All of these
coffee shops are those most called on by visitors from outside Aceh.
Study approach which was regarded suitable in this study was Descriptive Qualitative Research with the
objective being to develop the natural traits of an individual, situation, symptom, or of a certain group,
and/or to determine the frequency or the spread of a phenomenon in the community at present
(Koentjaraningrat, 1991), Moleong (2006). To develop a theory at substantive level, it was needed a
model analysis known as grounded theory approach (Strauss dan Corbin, 1990). Formulation of
theoretical interpretation was based on the data resulting from field observation.
Grounded theory is a theory inductively originated from the study of phenomena that represent it. Those
phenomena were about the discovered, the developed and the provision of stitistical data through data
collection and data analysis that represented a phenomenon. Thus the collection and the analysis of data
and the theory, were based on reciprocal relation of one with another.
The study about the forms of social interactions in coffeeshops was conducted directly coming down right
to the field without having any concept, theory or hypothesis. The expectation was so that the researchers
would not be tricked into verificative study that would use emperical level adjusted to conceptual-
theoretical desire, and they would fully be able to catch the reality based on the field facts, both in
describing what happened and in explaining why such thing happened.
Thus in theorecal formulation, the concept about the forms of social interactions in coffee shops was
really based on the data resulting from obervation, which was developed inductively. The study was
focused on the forms of Acehnese people’s social interactions that take place in coffee shops, with
indicators being as follows: (1) Associative cooperation with indicators and subindicators as follows;
cooperation that covers spontanious cooperation, direct cooperation, traditional cooperation, harmony,
bargaining and coalition; (2) Culturalization or culture contact, a social process that emerges as the result
Proceedings of The 1th Almuslim International Conference on Science, Technology and Society (AICSTS) 2015
November 7-8, 2015, Bireuen, Indonesia
48
of cultural attitude of accepting elements of an alien culture without causing the negation of the Acehnese
people’s own cultural dignity.
The determination of samples in this study was the kind of nonprobability due to the fact that it was very
much dependent on the researcher’s choice and objective. The most important thing in sampling
technique in qualitative research is how to determine key informant or certain social situation and
condition, which are full of various kinds of information relevant to research focus. Therefore the
determination of samples in this study used purposive sampling technique.
The researcher chose informants who visited the coffee shops and the managers of the coffeeshops who
were considered having deep and incredible information to be data sources. In determining informants or
respondents, the researcher referred to Rahan’s statement (2011) and Bakri’s (2002), namely: (1) the
subject should be long and intensive enough being united with the activity or with the field activity about
which information was inquired; (2) the subject was still actively involved in the environment or activity
which was the object of the rearcher’s attention; (3) the subject had sufficient time to be interviewed; and
(4) subject, in giving information, should not be inclined to manipulate or to be prepared in advance. In
order to obtain the diversity of study result, informants were fixed to be 14: (1) the owners or the
managers of the coffeeshops, 3 persons; (2) civil servants, 3 persons; (3) businessmen, 2 persons; (4)
politicians, 2 persons; (5) ordinary people, 4 persons.
Data analysis technique in this study also used those as developed by Strauss and Corbin (1990) in
Basic of Qualitatie Research, Grounded Theory Procedures and Techniques, that is coding procedure
consisting of three stages; open coding, axial coding, and selective coding. The process of analyzing the
data was done before the researchers came down to the field, while in the field and after completing work
in the field. In the data analysing process, the researchers used coding procedure as guidance, namely
open coding, axial coding, and selective coding.
The validity of all of the research data was done by using triangulation, that is a technique to check the
validity of data by using something other than the data as comparison against the data that have been
collected from the research objects (Bungin, 2009). Triangulation can be done by using different
techniques (Nasution, 2003); interview, observation and documentation. Triangulation used in this study
covered triangulation with data sources, observers, theory, and triangulation with methods. This
triangulation was not only used for checking the validity of data but also used for enriching data. Other
than this, triangulation could also be of use to assess the validity of the researcher’s interpretation of the
data, therefore triangulation is reflective in nature.
Results and Discussions
The Form of Associative Cooperation
Spontaneous cooperation that is cooperation that emerges spontaneously and immediately. The result of
the study indicated that spontaneous cooperation in coffee shops emerged without being planned in
advance. The coffee shop customers got together and mixed with themselves, paid the bills for what they

Proceedings of The 1th Almuslim International Conference on Science, Technology and Society (AICSTS) 2015
November 7-8, 2015, Bireuen, Indonesia
49
had consumed together in the coffee shops; cooperation in the use of information media facilities or any
other information aid available in the coffee shop area.
Whereas Directed Cooperation, it is a cooperation that takes place because there is an order from the top
or the one in authority. This kind of cooperation often comes about in coffee shop in response to the
command from the top of an organization, either a formal or a non-formal one. This direct cooperation in
coffee shop took place Banda Aceh community just like what happens in direct cooperation of bank
marketing, promotion and selling activities, as well as services such as safety lockers of various products.
Contractual Cooperation is a cooperation based on certain stipulation jointly agreed upon for a certain
period of time. In this case the visitors deliberately come to the coffee shop to discuss cooperation related
matters in certain field and conclude with a contract document. What is going on in the coffee shop is only
limited to discussion about aspects needed to be considered in order to achieve mutual understanding
between the parties, either regarding the requirements, obligations, and duties and responsibilities, time
limit, and other matters deemed as necessary. The result of the study about contractual cooperation
taking place in coffee shops shows that a contractual cooperation that takes place in coffee shops is
usually one that is designed and agreed upon in coffee shop space, stipulating matters about leasing of
buildings and vehicles, heavy equipment, products, projects and services.
The role of coffee shops as information centres in Acehnese community is still going on until now. With
presence of printing media, electronic media, coffee shops provide newspapers, and television, as well as
internet connections free for their customers. This is done so in order to attract customers, because
people need information, and therefore while enjoying drinking coffee the customers would access to
information they need. Sometimes the customers receive various kinds of information from other
customers. All kinds of information are talked about in coffee shops, from issues that are flowing at the
village level to international issues. This is because coffee shops in Aceh are a public place accessible to
all community elements. Therefore various forms of associative social interactions can take place in
coffee shops, as customers’ background, coffee shop atmosphere, and the facilities are very supportive
of the occurrence of people’s social interactions (Hayati, 2015).
As a phenomenal public space, the presence of coffee shops creates pluralism culture in the community
of the coffee shop customers. Pluralistic in cultural diversity, social situation, social stratification, gender
egalitarianism; and even religious differentiation is not recognized in a coffee shop. Everyone can freely
come into a coffee shop. This condition has been able to create an acculturation form of social
interaction, harmony, coalition, and even traditional cooperation.
It is understandable that coffee shop culture has the tendency toward values and norms identical to
modern culture, a culture that is always tolerant to the various differences in existence. So coffee shops
become a medium in creating associative social process like brotherhood (ukhuwah) and friendship and
it is gender respective (Khairani, 2014; Khoironi, 2009).

Proceedings of The 1th Almuslim International Conference on Science, Technology and Society (AICSTS) 2015
November 7-8, 2015, Bireuen, Indonesia
50
Harmony, Bargaining and Coalition
Another form of cooperation which often occurs in coffee shop is cooperation for harmony aimed at
developing activities which are mutually carried out. This kind of cooperation takes place in amongst
village government officials of a village in planning a mutual work activity in the village (Kampung or
Desa). The social interaction with cooperative in manner also often occurs in the community at the
commemoration ceremonies of Islamic Holidays such as the Prophet’s Birth Day, Friday’s cleanliness
mutual work, and mutual work to build a mosque. In several areas of Banda Aceh, coffee shops also
function as a place where bride or bridegroom escorts will get together, and those in the activity to pay
condolence visit to a family suffering from a calamity or to an ailing one.
In human life there always occurs some kind of reciprocal relationship, there always occurs an interaction
according to a traditional system which is perpetual in manner. Several kinds of social process in the life
of a community turn to be identifications of perpetual interactions (Cita, 2015). Such relationships have
been illustrated by Abdullah (2007) and Wibowo (2004), identifying the existence of Acehnese people in
four icons: Aceh is known as a territory where religion and tradition become two important pillars of the
social structuring; Acehnese people are known as brave; having high confidence attributable to their pride
as Acehnese; and upholding collective values as reflected in their habit of getting together, visiting one
another, having activities, and reflected in the coffee shop phenomena, and in ceremonies that involve a
large number of people.
Bargaining is an agreement implementer regarding the exchange of goods and services between
business agencies or organizations through bargaining process. Based on the result of the study it was
found bargaining cooperation that takes place in coffee shops was often done by coffee shop customers
whose professions were sale agents of various products and services; among others, selling and burying
cars and motorcycles, land, shop buildings, houses, and goods, and bargaining in carpentering services,
labour, and rental or leasing services.
Coalition is a form of cooperation in social interaction, which is a merging between two organizations or
more that have the same objectives. Regarding the social interaction in the form of coalition in coffee
shops, it is obvious in the coalition in the use of the coffee shop space between the food sellers and the
managers of the coffee shop. The coffee shop manager often rents some space of the coffee shop to
food sellers, such as rice, noodle, and “martabak” sellers.
On occasion, there are coffee shops that develop coalition with other parties by allowing the coffee shop
space to be the an activity/program or by renting it to an institution like legal aid, or renting it as a
boarding place, or as office of an organization.
The form of social interaction of coalition type in coffee shops is obvious in the way the customers sit
together by combining the tables and the chairs into a unified unit, and in the sharing of the coffee shop
space between the manager of the coffee shop and the food sellers in the coffee shop, or between a
certain social organization and a banking institution.
Proceedings of The 1th Almuslim International Conference on Science, Technology and Society (AICSTS) 2015
November 7-8, 2015, Bireuen, Indonesia
51
Coalition as a type of cooperation in a social interaction in coffee shops in Banda Aceh downtown,
generally occurs between the coffee shop management and government or non-government institutions,
and social organizations. A number of the said coalition forms which are often encountered within coffee
shop space are, among others: (1) coalition between a banking institution and the coffee shop, a bank
would install an ATM unit at one of the corners of the coffee shop; (2) coalition between the coffee shop
and a social organization, like the coalition with the “Forum Silaturrahmi Kopi Beurawe” (Forsilakubra); (3)
coalition between government institution and the coffee shop, usually in the form of dissemination of
leaflets from the Mayor to every coffee shop, and these leaflets carry calls to the public; and (4)
collaboration between a food and beverage producer and the coffee shop.
Social interactions taking place in coffee shops are relatively free of psychological and sociological hitch,
therefore it can to eradicate any negative prejudice among the customers. Coffee shops are a social
interaction arena that accommodates friendliness attitudes and therefore it can eliminate conflicts among
the customers of a coffee shop. The customers are so aware that coffee shops have become a public
forum and therefore the customers are more attentive toward other’s feeling and as the result they
communicate vigilantly by advancing or fostering togetherness and mutual respect.
Coffee shops and cafés (especially in Banda Aceh city) have become a ‘non-formal’ arena, where social
structural barriers are temporarily disregarded though still within the acceptable corridor of politeness.
People, especially the youth, would find a more lax or slack arena where for the time being they can find
themselves free of economic burden, social structure, authority pressure, or probably of the shadow of
past psychological pressure due to the long conflict (Elip, 2010). The local wisdom that has developed as
cultural ideology in Aceh is in need of identity symbols which of course are not only acceptable to the
Acehnese people with their various created moral consensuses, but also able to bridge the diverse
aspects that come from the various subcultures that develop in Aceh (Mujib, 2009).
Of the factors that render the sense of peace and convenience to the people in coffee shops are the
mutual respect, the sense of togetherness, and the sense of mutual work. According to Prihartanti,
Taufik, and Thoyibi (2009: 114), mutual respect is recognition or reciprocal acceptance that every
individual has the right and freedom to manage himself/herself primarily in actualizing their respective
convictions, and that everyone has his/her own natural propensity, which should not be necessarily the
same as that of other person.
Acculturation
Acculturation or culture contact is a social process that emerges as the result of a culture receiving
elements of an alien culture without causing own identity and culture to be ignored. The advent of
acculturation in coffee shops is often obvious in the fashion culture, particularly of women; Muslim fashion
and national fashion or non-Muslim fashion of women among coffee shop customers. The culture
intended here is among others the culture of visiting coffee shops by women, something rarely done by
women before tsunami. The reason was coffee shop was a place for men to get together. So there was
Proceedings of The 1th Almuslim International Conference on Science, Technology and Society (AICSTS) 2015
November 7-8, 2015, Bireuen, Indonesia
52
the feeling of shame or discomfort for women to sit and drink coffee in a coffee shop. An acculturation
thus has occurs in coffee shops, that is the cultural contact has resulted in the change of cultural value in
the life of women who now have begun to visit coffee shops, something which was before regarded as
taboo or shameful now has become common and taken for granted. Acculturation is also obvious in the
way people greet one another in coffee shops.
Coffee shops as public space are understood as a space that can be used for conducting open critical
discussions for everyone. In this public space, private persons get together to form a public (community)
whose logical reasoning are led to social, economic, cultural and political activities. Public space is
assumed to have freedom of speech and freedom of gathering, press freedom, the right to freely
participate in all aspects of discussion such as political and decision making. Furthermore, public space in
this case consists of information media like newspapers and televison, and internet. In addition, included
in public space are drinking places, coffee shops, meeting halls, and other public spaces where socio-
political discussions may take place (Jasmadi, 2011; Firmansyah, 2014; Cita, 2015).
Coffee shops have widened cultural space in Aceh. On the one hand, in the past not many Acehnese
women participated in coffee shop cultural processes as such. At present, quite a few Acehnese women
begin to fill in coffee shop cultural spaces (Khairani, 2014). On the other hand, the entrance of global
culture post-tsunami Aceh also has indicated various traces of change at various levels. From life style,
life view, mentality, imagination, to materialistic values, all have expanded into the very heart of the
Acehnese people (Derwentyana and Dharmawan, 2011; Mujib, 2009).
During the period of rehabilitation and reconstruction program in Aceh until now social interactions with
cultural nuance remain solidly visible in coffee shops. Foreign workers can be recognized easily based on
the skin colours, physical movements, and the language they use. Similarly as well, the workers from
outside Aceh obviously appear to be different in the language and the way they are clad. Language plays
a large role and becomes important basic identity in a community. Language issue and its relation to
culture in theoretical frame work are known as utterance ethnography that is it has something to do with
language study and linguistic practices (Mahali, 2008).
In a more macro view, coffee shops also are a part of subculture that brings into contacts various new
cultures and identities. It could thus be imagined the emergence of large global culture in Ace, which
slowly but certainly has formed orientation, mentality, life style, and even the formation of new social
capital that will usher Acehnese people dissolved in political symbols of culture. Social capital is the
power that can move people, developed through various social interactions and social institutions (Rudy,
2006). According to an initiator of social capital, Robert Putnan, social capital is a part of social
organization and mutual trust that facilitates coordination and cooperation for common interest (Putnam,
1995). Thus no wonder, coffee shop culture politics, when the time comes, will become a new agent
toward the emergence of openness culture in Aceh.
Proceedings of The 1th Almuslim International Conference on Science, Technology and Society (AICSTS) 2015
November 7-8, 2015, Bireuen, Indonesia
53
Conclusion
Social interactions that take place in the space of coffee shops are associative, resulting in various forms
of cooperation. This has been due to the laxness culture space in the coffee shop for the cooperative
attitude to develop, and to be able to bridge the various structural and cultural diversities of the coffee
shop customers.
The form of traditional cooperation and harmony are the image of cultural activities of Acehnese people
that occur among the customers in the coffee shops. Bargaining cooperation and coalition in coffee shops
relatively free of psychological and sociological hindrance so that various forms of social interactions
could exist without negative prejudice among the customers.
Coffee shops in Banda Aceh city have become a non-formal arena where cultural contacts take place,
social structure barriers become fused in coffee shops but all remain within the corridor of politeness.
Customers cross gender boundaries by adjusting fashion culture, expressions of greetings, and tolerance
attitude in an interaction that takes place.
References
Abdullah, I. 2007. Kontruksi dan Reproduksi Kebudayaan. Yogyakarta: Pustaka Pelajar Offset.
Bakri. 2002. Metodologi Penelitian KualitatifbTinjauan Teoritis dan Praktis. Malang: Lembaga Penelitian
Universitas Islam Malang.
Bungin, B. 2009. Analisis Data Penelitian Kualitatif. Jakarta: Rajagrafindo Persada
Cita, G. 2015. Studi fungsi warung kopi bagi masyarakat di Kota Bagansiapiapi. J. Jom Fisip. Vol. 2, No.
2. pp. 1-13
Derwentyana dan C. Dharmawan. 2011. Desain interior kedai kopi dan gaya hidup masyarakat di
Indonesia (Studi komparatif gaya hidup Antara konsumen kedai kopi tradisional dan kedai kopi
modern). Maj. Ilmiah Unikom. Vol 9. No 2: pp. 125-132
Firmansyah. 2014. Pemanfaatan warung kopi sebagai ruang public di Kota Banda Aceh. Skripsi. Prodi
Perencanaan Wilayah dan Kota, Universitas Gadjah Mada
Hayati, N. 2015. Eksistensi Penggunaan WIFI di warung kopi di Kota Banda Aceh. J. Al-Ijtimaiyyah. Vol
1, No.1. pp. 64-72
Jasmadi. 2011. Media cetak dan kesehatan mental masyarakat Provinsi Aceh. J. Psikologi An Nafs, Vol.
1, No.1.
Khairani, C. 2014. Pendorong interaksi sosial masyarakat Aceh dalam warung kopi. J. Lentera, Vol.14,
No. 10: hal. 50-58
Khairani, C. 2014. Warung Kopi Sebagai Media Interaksi Sosial Masyarakat Aceh (Kajian Realitas Sosial
Masyarakat Kota Banda Aceh). Disertasi. Program Pascasarjana Universitas Merdeka, Malang
Proceedings of The 1th Almuslim International Conference on Science, Technology and Society (AICSTS) 2015
November 7-8, 2015, Bireuen, Indonesia
54
Khoironi, F. 2009. Ekspresi Keberagamaan Komunitas Warung Kopi (Analisis Profil Komunitas Warung
Kopi “Blandongan” di Yogyakarta. Skripsi. Yogyakarta, Fakultas Ushuluddin Universitas Negeri
Sunan Kalijaga.
Koentjaraningrat, 1991. Metode Penelitian Masyarakat. Jakarta : Universitas Indonesia (UI-Press).
Mahali, S. N. 2008. Social Interaction in Bajau Isun-isun. Akademika. 74:59-87
Moleong, L. J. 2006. Metode Penelitian Kualitatif. Bandung: Remaja Rosdakarya.
Mujib, I. 2009. Pergeseran Ruang Politik: Catatan Etnografis. http://serambinews.net/ news/printit/5108.
diakses Tanggal 29 Desember 2011
Nasution. 2003. Metode Research: Penelitian Ilmiah. Jakarta: Bumi Aksara
Prihartanti, N., Taufik, dan M. Thoyibi. 2009. Mengurai Akar Kekerasan Etnis pada Masyarakat Pluralis.
J. Pen. Humaniora. Vol. 10. No. 2. hal: 107-120
Putnam, R.D. 1995. Bowling alone: American’s Declining Social Capital. J. of Democracy. 6: (1). Hal: 65-
78.
Rahan, N.W.S. 2011. Pola Interaksi Sosial Masyarakat Transmigran dengan Penduduk Lokal di
Kabupaten Pulang Pisau. Disertasi. Universitas Merdeka Malang, Malang Jawa Timur.
Rudy. 2006. Hilangnya Ruang Publik Ancaman Bagi Kapital Sosial. J. Inovasi Online, Vol 7 (28). hal: 31-
32
Strauss, A. and J. Corbin. 1990. Basic of Qualitative Research: Grounded Theory Procedure and
Technique. London. New Delhi: SAGE Publication. Thousand Oaks.
Wibowo .2004. Kopi Aceh. Aceh Cofee. Banda Aceh: Dinas Perindustrian dan Perdagangan Provinsi
NAD.
Proceedings of The 1th Almuslim International Conference on Science, Technology and Society (AICSTS) 2015
November 7-8, 2015, Bireuen, Indonesia
55
Acehnese Cultural Heritage: Between A Black Portrait and Hope
Iswadi
English Department, Almuslim University Bireuen, Aceh-Indonesia
Corresponding Author: [email protected]
Abstract
This paper is concerned with the Acehnese cultural heritage that must be explored as an
effort to build the cultural consciousness in Aceh. In the conflict era, it seems that
Acehnese cultural heritage had been destroyed by political system in Indonesia. The
power of political instrument was used by Indonesian government seem to have impact
toward Acehnese society in the way of thinking, and the way of life in the daily activities.
The values change and money oriented become the dominant problem in the future,
without taking care of human values. Therefore, the cultural revitalization becomes the
important thing to gain the didactic values through cultural activities like cultural
documentation, cultural studies, and cultural exhibition in Aceh. In another word that the
impacts of political system in the past seem to have a bad impact toward Acehnese
cultural heritage like a black portrait, but in another side that we still have the horizon of
hope by doing human values revitalization and creating the success myth based on the
history of Aceh in the past.
Key words: Acehnese cultural heritage, black portrait, revitalization.
Introduction
When standing a nation state named Indonesia, Aceh has directly mounted as an integral part of the
unitary state of Indonesia (NKRI). But if we reflect further, it seems that Aceh as an area that can’t be
separated in distress, especially when politics has become a "commander" in this country. Various
assumptions negative stereotypes that have been attached to Acehnese has occurred. Aceh is seen as
an area of conflict, separatist rebels, to the famous as well as the number one region marijuana fields in
Indonesia and various other negative things. This situation is certainly not all true, but Indonesia seems to
have conditioned the political situation in Aceh like that and it is no wonder that people from outside of
Aceh and other peoples from various parts of the world are reluctant even harder to visit Aceh.

Proceedings of The 1th Almuslim International Conference on Science, Technology and Society (AICSTS) 2015
November 7-8, 2015, Bireuen, Indonesia
56
The situation and condition likes above make Aceh has been lost in the world of tourism both locally and
foreign countries. And even more ironic is that Aceh throughout history is seen as a nation that likes to
fight, not only to fight against Dutch colonialism, but also the fight against the occupation of his own
people Indonesia, and also have ever occurred a civil war or perhaps there will be a civil war which only
caused by political interest and economic group of humans who have covered his soul by humanitarian
values. The condition like this seem to have a negative impact on the people of Aceh as if Aceh was
closed for other nations in the world and if it is not corrected through the truth of course, also be harmful
to the morale where the Acehnese is a nation that is loaded with values become Muslim in Mecca's porch
country.
In other words that the political situation in Indonesia has brought disorder to the peoples of Aceh are not
only physically and mentally, but also has destroyed the Acehnese civilization through historical heritage
and culture of Aceh and it will be unclear situation caused by prolonged conflict for more than 30 years.
Therefore, it is need to revitalize the various historical and cultural heritage of Aceh, where it is not only
belong to the nation's heritage of Aceh, but also can be seen as a world heritage which are located in
different parts of the world.
History has shown that the conflict situation in Aceh coupled with natural disasters such as earthquakes
and Tsunami, make Aceh better feel devastated again. This situation impacts on the system of
development in Aceh are not balanced between physical development to the development oriented
precisely the values contained in the various local heritages and different artefact charged seen the
values of local wisdom. This is where we need to realize that development of values oriented is as
important as the development of economic and development-oriented physical material. Therefore, it
should be carried out various development activities of values as an effort to maintain the balance of life
more meaningful and unseen.
What is meant by the development of values in Aceh is in the form of activities that are not only the
reconstruction of various artefact of Aceh that has been lost, but also necessary for revitalization of the
values contained in it and to build a sense of moral responsibility which have reciprocal relationships
between history and the results of culture with the people of Aceh as the owner as well as with the local
government of Aceh which was already responsible ought to be able to accommodate some things like
this. The series of activities within the framework of the development of values through the exploration of
various wisdoms that exist, can systematically be done in the form of activities: 1). Documenting the
cultural heritage and history of Aceh, 2) .maintenance of the Acehnese heritage as a priority , 3) .doing
assessment that can reveal the existence of values and a variety of local wisdom that exist, and 4), do the
exhibition (exhibition of culture) in order to promote tourism and cultural history of Aceh that could
increase the country's foreign exchange through tourism visit to Aceh more Islamic.
Because of the 4 series of activities that had to be integrated with each other, then as a first step in this
activity need to be an understanding in advance of how important the documentation and preservation,
and will then be forwarded to the program further the assessment and attributed to the tourism world

Proceedings of The 1th Almuslim International Conference on Science, Technology and Society (AICSTS) 2015
November 7-8, 2015, Bireuen, Indonesia
57
history and culture of Aceh. It is necessary to involve a wide range of experts from both within the country
and abroad with the interdisciplinary approach, so that the cultural heritage of Aceh will be understood as
a whole (total studies). In other words that the existence of the history and culture of Aceh during this can
be seen as a portrait of black, of course, would be a hope that can provide enlightenment for the people
of Aceh and for the world community.
Data Collection and preservation (maintenance) of Aceh's heritage as an effort to build the cultural
consciousness
Although it can be said that the period of war and conflict in Aceh is a period of darkness (the dark ages),
but the people in Aceh seem to never feel hungry. This is because it is the natural wealth of Aceh were
very supportive and coupled with a sense of social attitudes which should help one another fellow human
beings in the midst of the people of Aceh are also very pretty good. Even at the time of the tsunami in
Aceh people are not starving because of the food aid, clothing, housing, and other demands of other
nations in the world. Unfortunately, since the state (nation state) Indonesia, apparently through its policy,
it has been exploiting natural resources benefit of the people in Aceh for the central government in
Jakarta. The political situation like this has conditioned the people of Aceh as a nation are marginalized,
deprived and full of pace, especially in the economic field which will have an impact on other fields such
as education and culture. This situation also continued during the post-conflict and post-tsunami where
Aceh ethnography is a portrait as a nation that must grapple with a variety of economic activities.
The condition as above, directly or indirectly have the affects on the pattern of thinking, way of life, and
Acehnese world view. In the political and economic situation that is uncertain as it is, it seems there has
been a paradigm shift in thinking that as if no money everything can’t be up and running as it should, so it
does not have time to think about values and various wisdom that can maintain the balance of life, In
other words that there is a tendency to think pragmatically for the people of Aceh post-conflict and
tsunami that practical thinking where what matters is "peng" (money). Hence activities of documentation
and preservation of the cultural heritage of Aceh is considered not so important because it is practically
regarded as activities that can’t produce economically. For that is necessary to build cultural awareness
so that the Acehnese people will not lose his soul as a nation of Aceh that has values and various
wisdoms through documentation and do the preservation of historical and cultural heritage of Aceh.
The efforts to build the cultural awareness for the importance of documentation and preservation of the
cultural heritage in Aceh would not be successful without the people amend thought patterns that appear
to have been dominated by a way of life oriented to the physical material culture and money. For that
need to be instilled awareness orientated values that can build the character (character building) of
Acehnese themselves which are believed to exist and had triumphed in the past were photographed
through the relics of cultural heritage. In other words, the act of doing the data collection and preservation
of cultural heritage will not succeed entirely without returning the function of the value to the community
owner of the culture.
Proceedings of The 1th Almuslim International Conference on Science, Technology and Society (AICSTS) 2015
November 7-8, 2015, Bireuen, Indonesia
58
If the Acehnese people have realized that all forms of Acehnese heritage will give the value to the life
functions as the moral values and the various values of didactic values, then the data collection and
conservation measures will be easier done. It is due to be the emergence of collective consciousness that
is a sense (sense of belonging) to the cultural heritage. Furthermore, if we have created an atmosphere
of feeling a sense of belonging, it is easily to make the steps of mapping and preservation (maintenance),
and it can be done in an integrated manner with the cultural community. For those, the involvement of
community leaders, religious leaders, traditional leaders, local governments and various other related
institutions is necessary, and this is what is meant as an attempt to build an integrated cultural awareness
and not merely political interests and benefit projects for a particular party and contemporary nature only.
The effort of documentation and preservation of historical and cultural heritage of Aceh today is an effort
to revive the Acehnese civilization through the values that had been destroyed by political instrument in
Indonesia. The strength of the political instrument through republic of Indonesian armed forces has deep
wounds and black portrait which is an act of destruction of Aceh civilization .It is not wonder if in the midst
of the bitterness of the people in Aceh, revealed the words addressed to the government of Indonesia
namely: "come take M16, brought home 16M". Coupled with a system that did not reflect the culture
ministry in favour of the public needs that should not be repeated. That is why the revitalization of values
through the preservation of cultural heritage Aceh becomes very important.
Conduct a study of the legacy of Aceh as efforts to revitalize the values.
Until now, it seems that a review of the various Acehnese heritage is still very little compared to what has
been done as a scientific tradition in Western countries and Europe. The background which depicting the
prolonged conflict situation in Aceh is certainly no excuse for not bounce in building a more civilized
society in Aceh. That’s why, it need to be replicated back to the various forms of culture in Aceh either the
form of culture that are non-physical and physical culture (artefact) to uncover the return values contained
in it, so that any Acehnese culture form will be viewed not only as a spectacle but also guidance in
cultural life behaviour.
As has been mentioned above that the documentation and preservation of the heritage of Aceh in
principle is to maintain the authenticity and continuity, but there is still more important that is to use it as
an object of study that may reveal the spirit of the times (zeitgeist) to be used in building values through
existing of social system. An example is the saman dance is one of Aceh art products that have been
registered in UNESCO as a non-physical cultural heritage needs to be studied and reflected further.
Saman dance that has a lot to amaze audiences from all over the world seem to have a pattern of hand
gestures with the rhythm and the time is so fast and devastating, but it looks so beautiful, harmony, and it
never happens clash fellow dancers on the stage that will lead to an unpleasant sight. If we reflect further,
the meaning is that the people of Aceh also never crash fellow Aceh and also among others, which
means that the saman dance here may also be viewed not only as a spectacle but also as a guide that
provides lessons on the audience.

Proceedings of The 1th Almuslim International Conference on Science, Technology and Society (AICSTS) 2015
November 7-8, 2015, Bireuen, Indonesia
59
However, if in fact that the people of Aceh are still also always experience the horizontal conflict among
the Acehnese and causing social conflict in the midst of the society, this means that we have not learned
through Saman dance and also do not make the saman dance as an instrument of culture that can be
used as instructional media. Therefore, students of culture today or cultural researchers have to be able
to bridge uncover values and various wisdom contained in the cultural heritage of the people of Aceh to
the owner. Thus, all forms of cultural heritage of Aceh in the future can be used again as an instrument of
culture, where it is very important as same as a political instrument. In other words that the approach
used to build the Acehnese society that would be more dignified is a cultural approach, and using the
instrument of culture will be better than a political approach where during this time it will produce a wide
range of policy and political decisions in favor of the interests only.
It is very sorry for this country if the cultural heritage of Aceh had seemed lost, the suburbs, and even
may have been exploited only for the sake of money and positions in which the holders of power that has
been given a mandate by the people just behave politically as if it had thought through rules and
regulations which have been made. While some of non arts universities in Aceh also has rightly providing
support to the development of the values of cultural heritage, and not otherwise make products of
Acehnese arts such as saman dance,it has been used as an instrument of political imagery to be sold
outside the country as if also promote culture but the substance of what has been promoted seem empty.
It would be like an empty keg tinny sound. In 2010, I and some friends lecturer in one of the non-arts
college in the land of Mecca porch has won the goodwill proposal of arts abroad which to some Asian
countries with funding of Higher Education Jakarta. For me this is the first step in post-conflict and
tsunami to revive Aceh's cultural heritage through a program which includes the Higher Education;
goodwill arts, performing MOU with several universities abroad, and no less important is the cultural
discussion after the signing of the MOU in order to reveal and inform important substance contained in
the cultural heritage of Aceh. But what is happening today? Various attempts to uncover vital substances
through the cultural heritage of Aceh had apparently been politicized for political gain university imaging.
It would not be ethical we as citizens are only able to manipulate other people's efforts to be success as a
track record in order to win the goodwill institution-goodwill subsequent arts abroad and only for mere
imaging without cultural understanding.
The above situation is quite so sad as Aceh Islamic nation. Never imagined if a college is supposed as an
agent of moral strength and social change, was actually behave manipulative because just to cover his
great inability and so is seen by the public. Consciously or unconsciously, it is a reality that should not be
repeated. Therefore scientific tradition must be rebuilt through total studies. Various studies of the cultural
heritage of Aceh after tsunami and conflict must be done by involving the kinds of experts from both
within and outside the country. It is possible if the various values and local wisdom that there are also the
universal values that apply to all nations, and it is time for the Aceh government to be more open to the
presence of other nations to each other which can contribute in building the wisdom of the nation.
Proceedings of The 1th Almuslim International Conference on Science, Technology and Society (AICSTS) 2015
November 7-8, 2015, Bireuen, Indonesia
60
Currently, the studies relating to the cultural heritage of Aceh both done within the scope of local,
national, and international numbers are still very little compared to what has been done in Java and
elsewhere in Indonesia. It has occurs because of the political situation and the economy in Aceh unstable
and greatly influence the mindset and way of life of the people in Aceh who tend to be pragmatic. It
means that the people of Aceh are now more inclined to build its economic life in accordance with the
realities of life there rather than to think about anything else. While the organizers of governance in Aceh
apparently still running in place and have not thought about let alone accommodate the problems of
cultural heritage as it may be regarded as a project that can’t make money or provide direct economic
benefit. How to think like that should not happen in the effort to build values and local wisdom through
cultural studies. Instead they should be constructed balance between economic needs as the demands of
life with the needs of these values as character development efforts of the nation.
In other words that the efforts to revitalize the values through studies of the cultural heritage of Aceh can
be done not only to be supported by the government and related institutions, but also by the paradigm of
thinking of the people in Aceh. That is why, the study results will be important to be understood and to be
published, so that the public will also be easier to get the information of culture. In addition, the study
results also will be recommended to the government as contribution for Aceh and other related institutions
and to be considered more objective in taking policies. Here, the position of the cultural heritage of Aceh
will have more significance, so it will be a cultural instrument that can provide the educational sustainable.
Acehnese cultural heritage significance will be clear to the public as the owner if it is done by deeper
understanding through cultural studies, seminars, workshops, and a variety of other discussions. So it will
be revealing various cultural elements that reflect the way of life of the Acehnese as how it is used in the
system of social and religious, Acehnese language, Acehnese arts, system of livelihood, system of
technology used, and how the way of life of people in Aceh (Acehnese world view) are reflected in it. The
dance of Ranup Lampuan for example, has shown that how arts of Acehnese who not only can be
enjoyed from the values of aesthetics only, but also illustrates how the Acehnese always respect other
people (guests) are photographed through certain events such as Preh dara baro (waiting for the bride),
Preh linto baro (waiting for the groom) and social events as well as various other ceremonial. Not only
those,where the people of Aceh have also been attached to the tradition of glorifying the guest (tradisi
pemulia jame) that if we reflect further basically, Acehnese society is a society that is always open
(welcome) to the presence of various other ethnic groups and not as imagined has always been closed to
other nations that may also be the political provocation which seems as the truth, especially when linked
with the small door of Aceh as a symbol that seems to indicate a boundary that covers the entry of other
nations.
From the description above, of course, can be traced further that all Acehnese cultural heritage both
physical and non-physical form, now it is time to be used as an instrument of national character building.
In this case, the strategy is certainly needed as cultural strategy (not political strategy), and that is a way
to build the values-based on society and a variety of cultural heritage. An example is if it had been done

Proceedings of The 1th Almuslim International Conference on Science, Technology and Society (AICSTS) 2015
November 7-8, 2015, Bireuen, Indonesia
61
the exhibitions and promotional products of Acehnese culture both at home and abroad, but substantially
apparently has not happened something "catchy" (for something that can evoke feelings and thoughts)
are positive, and has a unique of its own, as well as the wisdom and something that can be taken that are
not included in the territory of other cultures. This is where the cultural strategy is necessary not only
through exhibitions and promotions, but also have to do with creating a cultural provocation or reconstruct
myths that illustrate the successes and the figure of the Acehnese in the past time.
Conducting the exhibition and promotion of the heritage of Aceh in order to build the success myth of
Acehnese as a cultural strategy
If in America we know the dream of the American people to make himself successful (American dream),
then there is no harm in also if today we build the myth of the successful people in Aceh (Acehnese
success myth) that can be used as inspiration, motivation, and at the same time a dream that will
translate into success in the land of Mecca's porch. What is meant by success myth for Acehnese people
here is something that is believed to exist in the mindset of the people in Aceh as something form the
successes that have been made by the ancestors of the nation of Aceh in the past. Forms of success that
will be revealed through various forms of cultural heritage that reflects the life of the nation is a wise and
prudent of Aceh in the past time, such as the Acehnese believe their heyday during the Sultan Iskandar
Muda who has provided the best of all aspects of human life. Here we need a cultural strategy by doing
an exhibition and promotion as well as to reconstruct the myths of success (success myth) that exist in
the cultural heritage. So the exhibition and promotion of Acehnese culture is not solely for the benefit of
the development of tourism as it will increase the number of tourists to the province and will be also
increased foreign exchange income, but also to build the mindset of success as had happened in the
history and culture of Aceh in the past.
In other words that all forms of Acehnese heritage here can be viewed as an instrument of culture which
used to revive the flow of public awareness that there is something important (significant) which may be
taken as a learning cultural heritage reversed itself. It means that the cultural heritage of Aceh not only
seated as relics merely just "stroked" and "hailed" for his prowess in the past, but also something which
can lead to the creation of the myth of success both successful in the economic, social, constitutional,
literary, and others. The next steps here is that the successful in the past should be promoted in the
mindset of society so that they can also build the new dreams towards a better life. During this time we
stopped at the level of exhibition and promotion of culture, so that not yet have maximum impact on social
life and others.
Building a successful myth in the middle of the Acehnese people must also be supported by the
government of Aceh as the strengthening of culture as well as cultural pride that will have an impact on
confidence as a nation of Aceh that had been destroyed by various political conspiracy in Indonesia. No
one is sure of the Acehnese people today who are not proud of the series of names like; Sultan Iskandar
Muda, Malikulsaleh, Syiahkuala, until lately appeared Tun Sri Lanang name the legacy of the region of
Samalanga Bireuen district of Aceh, and many more series of other names. Although the people of Aceh

Proceedings of The 1th Almuslim International Conference on Science, Technology and Society (AICSTS) 2015
November 7-8, 2015, Bireuen, Indonesia
62
has experienced the change from one generation to the next, but the feeling of pride in the names of the
above example will still dwells in every generation of Aceh. This is due to the belief that in all activities
and the whole heritage legacy attached to themselves to have the values of success in his time that can
be used as examples in the life of mankind in the past, present, and future.
It is different with what has been true in America that the myth of the successful of American people seem
to have packed into the dreams of Americans (American dream) who believes that America is the land
promised by God (promised land) as a land that promises to anyone who want to be success and come
to America for making the dream become successful. But what has happened in the midst of the people
in Aceh just the opposite. Various myths of success that essentially there had to be resurrected and
revitalised, it seemed obscured by the situation and the political situation in Aceh. All the dreams of the
people of Aceh have been destroyed by various political machines either from the start of operational
areas of Indonesian army to national parties or local filled with promises and dreams, but in reality it has
destroyed the civilization of Aceh. The existence of the power of the political machinery of Indonesia has
made the people of Aceh is now losing references that refer to his ancestors, so do not be surprised if
there are deviations of behaviour and ways of life of the Acehnese ostensibly seem like a nation of Aceh
in general. And this is where a variety of local wisdom and something that can be taken from the
Acehnese ancestors is due to maintain the cultural identity and re-establish the values that should not be
sacrificed in the interests of the political machine.
To rebuild the successful creation of the myth of the people in Aceh so that’s not run over again by the
political machine in Indonesia would need to be created first; build self-confidence and pride in the
cultural heritage of Aceh with the substance of everything that exists. It means that the people of Aceh
should be proud and not ashamed to be the Acehnese as a whole with all its inherent ethnicity. Secondly,
strengthening identity as a nation of Aceh with dignity caused by the power of the values as had
happened in the past, and not dignified because the legitimacy of political correctness that is oriented to
the contemporary interest. Third, make values and a variety of local wisdom that exist, as well as various
myths of success in the past to strengthen the local identity which automatically will support the national
identity. Because in essence that the substance of national culture are various ethnic cultures that exist in
all parts of Indonesia, including Aceh and also with their culture.
Furthermore, it is also necessary demonstrated to the world through a variety of information of
technology that the people of Aceh is not as bad as what might be imagined by people from outside of
Aceh, and it has been caused by the political provocations that divide the nation. Therefore, it is
necessary to do an exhibition and promotion of cultural heritage of Aceh which charged the values and
various wisdoms that can create a successful myth of the Acehnese. However, it should be noted here
that the myth of success referred to in this article is not related to the myths associated with the world of
the mystical and superstitious example of what is happening on the island of Java, or the myth of success
figures of mafia or figures thuggery in Medan, North Sumaetra , but is related to the myth of success and

Proceedings of The 1th Almuslim International Conference on Science, Technology and Society (AICSTS) 2015
November 7-8, 2015, Bireuen, Indonesia
63
wisdom of the people of Aceh and also for creating the horizon of expectations (horizon of hope) to get up
to success for generations in the future.
Conclusion
As a citizen of Indonesia that should already guaranteed in the Basic Law 1945 and various government
regulations that exist to undergo various life activities well, but in fact the people of Aceh seems to be
fighting for his life from a variety of political action in Indonesia with various of the political instruments
has been ravaged the Aceh civilization. Moreover, if politics had acted as a "commander" who have done
in the name of the interests of the integrity of the nation and the State unitary republic of Indonesia and
nationalism, then the political situation is certainly Aceh in position cornered and is regarded as
separatist, rebels, and others which must be destroyed by political machine. This situation once had
destroyed various cultural activities and replaced with activity area of war and conflict.
The above situation coupled with the earthquake and tsunami on December 26, 2004, it was complete
that the Acehnese people with all their cultural heritage looks like a portrait of an increasingly dark days,
turned into months and years of increasingly unclear changed his ethnicity. The lack of clarity is due to
the criminalization and decay of the cultural values and religion as well as a variety of local wisdom in the
midst of the people of Aceh who have been conditioned as an area of conflict. Acehnese cultural values
that do not conflict with Islamic law and values of religion (Islam) which is an absolute need in the midst of
the people of Aceh are 100 % Muslims appear to have hegemonized by national political interests. This
means that the people of Aceh have lost their rights in social life, culture, and religion that should be
accommodated in order to establish the dignity of the people of Aceh and not even done the decay of the
substances contained.
In such conditions above, there should be a variety of efforts to revitalize the cultural heritage of Aceh in
order to restore the integrity of the national identity of Aceh who have been marginalized. And one
strategy is to reveal the return values and the various existing wisdom through various cultural heritage in
Aceh both cultural heritage in the form of physical culture (artefacts) and intangible cultural heritage.
Further departing from the values that can be used as the best of the way of life of the people in Aceh,
and to be recreated the myth of success that will build a positive mindset, and that is the mindset of a
successful dignified that reflect on the success of his ancestors in the past. And this is one of hope for the
people of Aceh which be able to bounce back from the various adversity. Insha Allah.
References
Alfian, Teuku Ibrahim, 2005. Wajah Aceh Dalam Lintasan Sejarah. Yogyakarta: Gadjah Mada University
Press.
Bustamam Ahmad, Kamaruzzaman, 2012. Acehnologi. Banda Aceh: Bandar Publishing.
Cassirer, Ernst, 1987. Manusia dan Kebudayaan. Jakarta: Gramedia.
Proceedings of The 1th Almuslim International Conference on Science, Technology and Society (AICSTS) 2015
November 7-8, 2015, Bireuen, Indonesia
64
Haslinda Muda, Hj Pocut, 2011. Tun Sri Lanang Dalam Sejarah Dua Bangsa Indonesia – Malaysia.
Jakarta: Yayasan Tun Sri Lanang.
Hadiwinata, Bob Sugeng, Dkk., 2010. Transformasi Gerakan Aceh Merdeka. Jakarta: FES.
Harun, Mohd., 2012. Pengantar Sastra Aceh. Bandung: Citapustaka Media Perintis.
Ismail, H.Badruzzaman, 2013. Sistem Budaya Adat Aceh Dalam Membangun Kesejahteraan. Banda
Aceh: CV.Boebon Jaya.
Kawilarang, Harry, 2010. Aceh Dari Sultan Iskandar Muda Ke Helsinki. Banda Aceh: Bandar Publishing.
Loh Angen, Thayeb, 2014. Aceh 2025. Banda Aceh: Yatsrib Baru.
M.Ditiro, Tengku Hasan, 2013. Aceh Di Mata Dunia. Banda Aceh: Bandar Publishing.
Syamsuddin Ishak, Otto, 2006. SAGO. Jakarta: Penerbit Aceh Kita.
Proceedings of The 1th Almuslim International Conference on Science, Technology and Society (AICSTS) 2015
November 7-8, 2015, Bireuen, Indonesia
65
Agriculture as the Basis of Indonesian Culture: Understanding
Agriculture as the Basic Ability of Civic Education
Ruslan
Lecturer of Civics, Faculty of Education, Unsyiah University, Banda Aceh
Corresponding Author: [email protected]
Abstract
Agriculture in general is defined as the effort to take advantage of natural resources by
farming, livestock breeding, fishing and other industrial attempts like the fish industry etc.
Through agriculture, and of course by society being able to utilise agricultural
technologies and agricultural yield, Indonesia can achieve self-dependency. Agriculture is
a fundamental part of Indonesia, therefore, has to be cultivated into further generations.
The effort of cultivating through civic education has three domains; civic knowledge, civic
skills and civic disposition. From these three domains, civic skills constitute and
appropriate means of agricultural cultivation. Civic skills are skills that are developed by
civic knowledge so that the knowledge attained can become useful and fully utilised in
order to solve problems in society. These problems haves to be viewed holistically
because the scope of human life is not only humanity itself, but also the earth and all its
inhabitants. Agriculture helps students understand human problems in a more holistic
manner. Understanding the importance of agriculture as a substance is plants produce
oxygen for human life which means a place to life, due to this an increase of population in
Indonesia should be balanced by an increase in plants. Agriculture as a basis of civic
skills is the ability for every young generation of Indonesia to identify and describe,
explain and analyse, evaluate, decide and hold on personalities or opinions that are part
of public problems in a holistic manner that is useful not only for the continued living of
humans in Indonesia but also the Indonesian ecology. Strategies for agricultural
cultivation as a basis for cultural civic skills must be done in stages and through the
education system by making use of green education.
Keywords: Civic Skills, Agriculture, Culture, Green Education
Introduction
Agriculture to the Indonesian people is not only a form of occupation, it is a cultural part of Indonesia and
has been done since 2500 to 3000 BC. Agriculture in general is defined as the effort to take advantage of
Proceedings of The 1th Almuslim International Conference on Science, Technology and Society (AICSTS) 2015
November 7-8, 2015, Bireuen, Indonesia
66
natural resources by farming, livestock breeding, fishing and other industrial attempts like the fish industry
etc. (http://id.wikipedia.org/wiki/Pertanian). Through agriculture, the Indonesian people can fulfil the needs
of the economy as a primary producer and as a means to create a balanced ecosystem.
Civic education becomes very important in creating a stable ecosystem by following the first goal of civic
education, developing good and smart citizens. In order to fulfil the aforementioned goal, civic education
has to pay attention to 3 components identified by Margaret S. Branson (1999:8) that are civic knowledge,
civic skills and civic disposition. These three components complement each other and can’t be separated,
even so the component that best fits agricultural cultivation is civic skill because by planting awareness
about the importance of a stable ecosystem cannot be through theory alone, it has to be implemented
into agricultural skills in order for students to fully understand the nature of an agricultural nation.
Implementation of agricultural skills in civic education is best implemented in the domain of civic skills,
that involve the ability in order for students to be democratic citizens that can fully master a wide array of
intellectual skills and participatory skills required by living in a society.
The relation between agriculture with civic skills namely; First on the terms of the nature of Indonesia, the
implementation of civic skills which includes two components are always based on the interests of
agriculture. Second, the implementation of democracy in a country based on the active participation of
citizens. It is very important to instil an understanding of agriculture to students as a fundamental basis of
civic skills.
Discussion
Views on civic skills and the role of agriculture in life in Indonesia
Civic skills are, with respect to the learners, skills in order to become democratic citizens by mastering a
number of abilities, further Margaret S. Branson (1999: 70) stated; “If citizens are to exercise their rights
and discharge their responsibilities as members of self-governing communities, they not only need to
acquire a body of knowledge such as that embodied in the five organizing questions just described, they
also need to acquire relevant intellectual and participatory skill”.
From the statement above, civic skills include intellectual skills and participatory skills in society.
Intellectual skills are essential for the formation of citizens who are knowledgeable, effective, and
responsible. Those skills, among others identify and describe, explain and analyse, evaluate determine
and maintain the attitude or opinion with respect to public affairs. While participatory skills are the skills
required for the participation of citizens knowledgeable, effective and responsible in political processes
and in civil society such as the skills to interact, monitor, and make a difference (Branson. et.al, 1999).
Agriculture's role in the life of the Indonesian people is that Agriculture is a series of activities that
cultivate plants and animals on a piece of land for the necessities of life without damaging the plants (Tati
Nurmala, et al., 2012). Plants and animals that are processed from agriculture are very important in the
balance of the ecosystem in Indonesia and has a major contribution in the production of clouds in the air.

Proceedings of The 1th Almuslim International Conference on Science, Technology and Society (AICSTS) 2015
November 7-8, 2015, Bireuen, Indonesia
67
(Source: IndroyonoSoesilo/ Kompas/ Sabtu 17 Mei 2003 - Hal 33/ Zadrah/ Mezak/ Pr/ Sobirin-Mubiar/
Dpklts-2003)
Indonesia, Brazil and Central Africa are the region most active in cloud formation and as a centre for
global or macro climate changes, environmental damage in these areas can disrupt the global climate.
Mostly Indonesia over Brazil and Central Africa, as it has wide and shallow seas and abundant amounts
sun, resulting in very active convection currents. Due to this, imbalances in the Indonesian ecosystem
could lead to global climate changes. In turn it is almost mandatory for the development of industries in
Indonesia be focused around agriculture in order to keep the ecosystem balanced (Putrawan, 2014).
Economic needs are divided into three types: primary, secondary and tertiary need. Primary needs that
are fundamental to human life is food obtained from agriculture. But industrial development is not based
on agriculture and the government adopts a capitalist economy. As a result, industries have been growing
more rapidly consuming agricultural lands and waste generated by these industries have damaged
agricultural lands surrounding industrial land sites (Daryanto, et al., 2013).
Analysis of Agricultural Relations with Civic Skills
Analysis of agricultural relations with the civic skills of Indonesian people based on some rational
consideration, namely; first, the function and role of agriculture is fundamental to life and living for the
people of Indonesia; Second, the balance of the ecosystem affects the social system; Third, agriculture is
the implementation of the philosophy of Pancasila in Indonesia.
First, the implementation of agriculture in the broad sense that takes into account the balance of the
ecosystem is the duty of every citizen, because every human life is always in need of oxygen. Each of the
plants produces oxygen and absorbs carbon dioxide, therefore for every population growth there must
also be a proportionally equal amount of plant growth.
EQUATORIAL WALKER CIRCULATION

Proceedings of The 1th Almuslim International Conference on Science, Technology and Society (AICSTS) 2015
November 7-8, 2015, Bireuen, Indonesia
68
Source: Mubiar P, 2015
Agriculture is the main solution in order to protect the living space of Indonesia, this is based on the fact
that Indonesia is made up of thousands of islands with the majority of the territory being water. On the
basis that the main interest of life is to maintain the presence of oxygen, civic skills in Indonesia is
designed around the importance of nature conservation based on agricultural value. Agricultural values
developed based on the philosophy of Pancasila modelled through the rice crop. Rice crops consists of
roots, stems, leaves, flowers, and the fruit, which in turn is the basis of civic skills.
Secondly, the balance of the ecosystem affects the social system.Agriculture functions as providing the
nutritional needs of the Indonesian people as economical needs, but aside from that plays an active role
in the balance of the Indonesian ecosystem. The social system is strongly influenced by the ecosystem,
the relationship between the social system and the ecosystem is built by the interaction betweenthem.
The interaction is described as follows.
Source: A. Terry Rambo (1983) in Amos Neolaka, (2008)
The imbalance of the soil, water, air and other parts of ecosystem will affect the flow of energy, materials
and information submitted to the social system, and more so, the social system would otherwise affect the
Advantages of trees:
1.Produces 1.2 kg of oxygen/tree/day
2.Absorbs 8x as much heat 3.Evaporates back 75% of rainwater
4.Hold water in soil
Forests and Jungle Natural Infrastructure
Generates:
Air Cycle
Oxygen Cycle
Biomass Cycle
Cycle of Space
Life Cycle
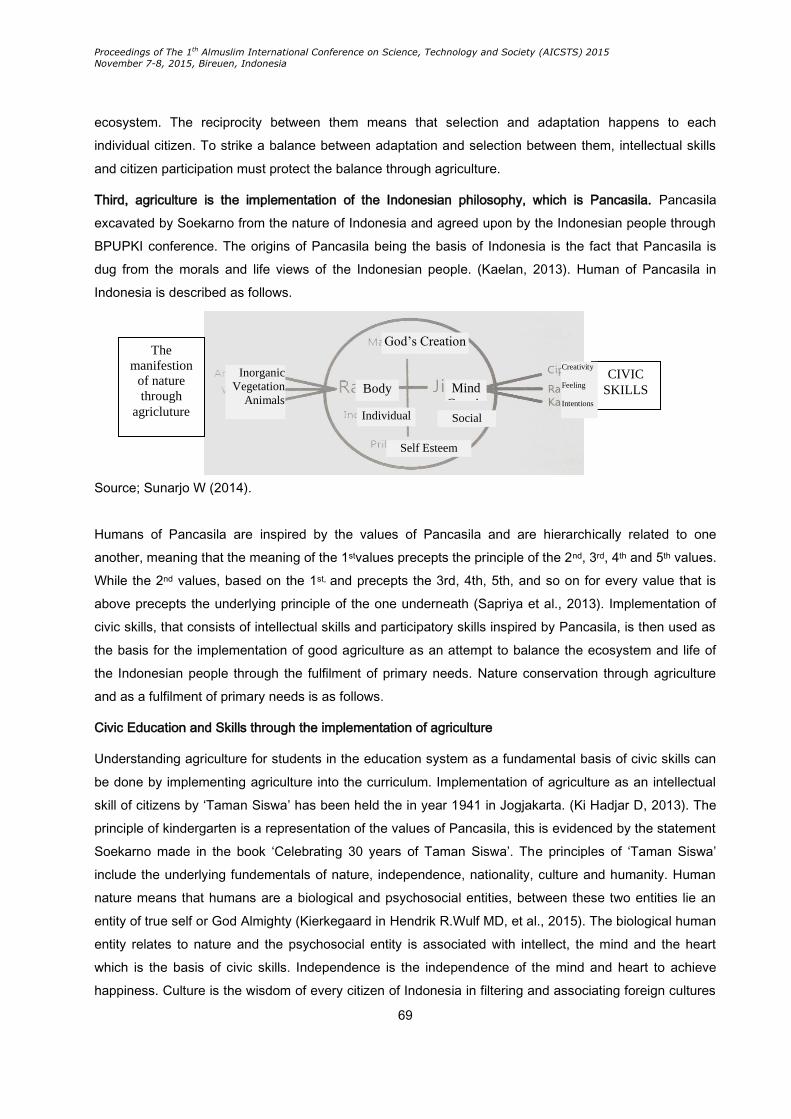
Proceedings of The 1th Almuslim International Conference on Science, Technology and Society (AICSTS) 2015
November 7-8, 2015, Bireuen, Indonesia
69
ecosystem. The reciprocity between them means that selection and adaptation happens to each
individual citizen. To strike a balance between adaptation and selection between them, intellectual skills
and citizen participation must protect the balance through agriculture.
Third, agriculture is the implementation of the Indonesian philosophy, which is Pancasila. Pancasila
excavated by Soekarno from the nature of Indonesia and agreed upon by the Indonesian people through
BPUPKI conference. The origins of Pancasila being the basis of Indonesia is the fact that Pancasila is
dug from the morals and life views of the Indonesian people. (Kaelan, 2013). Human of Pancasila in
Indonesia is described as follows.
Source; Sunarjo W (2014).
Humans of Pancasila are inspired by the values of Pancasila and are hierarchically related to one
another, meaning that the meaning of the 1stvalues precepts the principle of the 2nd, 3rd, 4th and 5th values.
While the 2nd values, based on the 1st, and precepts the 3rd, 4th, 5th, and so on for every value that is
above precepts the underlying principle of the one underneath (Sapriya et al., 2013). Implementation of
civic skills, that consists of intellectual skills and participatory skills inspired by Pancasila, is then used as
the basis for the implementation of good agriculture as an attempt to balance the ecosystem and life of
the Indonesian people through the fulfilment of primary needs. Nature conservation through agriculture
and as a fulfilment of primary needs is as follows.
Civic Education and Skills through the implementation of agriculture
Understanding agriculture for students in the education system as a fundamental basis of civic skills can
be done by implementing agriculture into the curriculum. Implementation of agriculture as an intellectual
skill of citizens by ‘Taman Siswa’ has been held the in year 1941 in Jogjakarta. (Ki Hadjar D, 2013). The
principle of kindergarten is a representation of the values of Pancasila, this is evidenced by the statement
Soekarno made in the book ‘Celebrating 30 years of Taman Siswa’. The principles of ‘Taman Siswa’
include the underlying fundementals of nature, independence, nationality, culture and humanity. Human
nature means that humans are a biological and psychosocial entities, between these two entities lie an
entity of true self or God Almighty (Kierkegaard in Hendrik R.Wulf MD, et al., 2015). The biological human
entity relates to nature and the psychosocial entity is associated with intellect, the mind and the heart
which is the basis of civic skills. Independence is the independence of the mind and heart to achieve
happiness. Culture is the wisdom of every citizen of Indonesia in filtering and associating foreign cultures
CIVIC
SKILLS
The
manifestion
of nature
through
agricluture
God’s Creation
Mind
CreatioBody
Individual Social
Self Esteem
Creativity
Feeling
Intentions
Inorganic
Vegetation
Animals
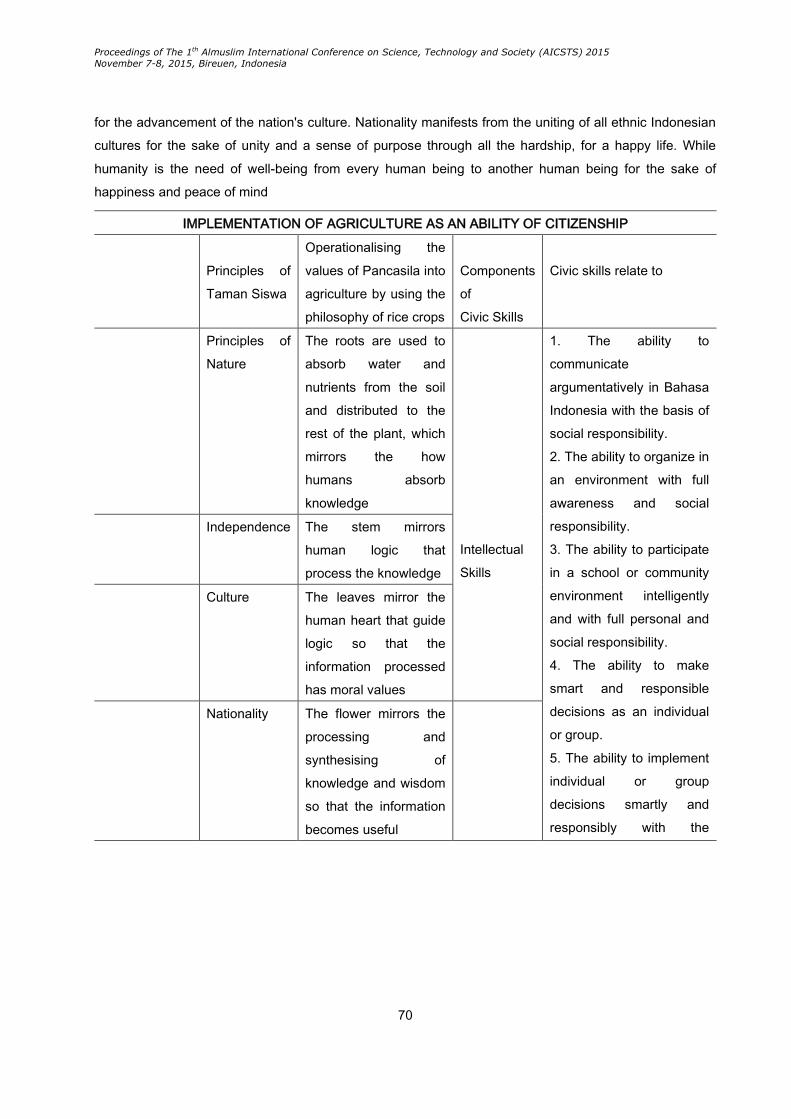
Proceedings of The 1th Almuslim International Conference on Science, Technology and Society (AICSTS) 2015
November 7-8, 2015, Bireuen, Indonesia
70
for the advancement of the nation's culture. Nationality manifests from the uniting of all ethnic Indonesian
cultures for the sake of unity and a sense of purpose through all the hardship, for a happy life. While
humanity is the need of well-being from every human being to another human being for the sake of
happiness and peace of mind
IMPLEMENTATION OF AGRICULTURE AS AN ABILITY OF CITIZENSHIP
Pancasila
Principles of
Taman Siswa
Operationalising the
values of Pancasila into
agriculture by using the
philosophy of rice crops
Components
of
Civic Skills
Civic skills relate to
A One and
Only God
Principles of
Nature
The roots are used to
absorb water and
nutrients from the soil
and distributed to the
rest of the plant, which
mirrors the how
humans absorb
knowledge
Intellectual
Skills
1. The ability to
communicate
argumentatively in Bahasa
Indonesia with the basis of
social responsibility.
2. The ability to organize in
an environment with full
awareness and social
responsibility.
3. The ability to participate
in a school or community
environment intelligently
and with full personal and
social responsibility.
4. The ability to make
smart and responsible
decisions as an individual
or group.
5. The ability to implement
individual or group
decisions smartly and
responsibly with the
A fair, just and
civilised
humanity
Independence The stem mirrors
human logic that
process the knowledge
Unity of
Indonesia
Culture The leaves mirror the
human heart that guide
logic so that the
information processed
has moral values
A society that
is governed by
wise leaders
Nationality The flower mirrors the
processing and
synthesising of
knowledge and wisdom
so that the information
becomes useful

Proceedings of The 1th Almuslim International Conference on Science, Technology and Society (AICSTS) 2015
November 7-8, 2015, Bireuen, Indonesia
71
Social justice
for all the
citizens of
Indonesia
Humanity The fruit is useful for
other living beings and
bows down in order
mirror the
implementation of said
knowledge without
arrogance
Participatory
Skills
appropriate context.
6. The ability to
communicate smartly and
ethically in the right
context.
7. The ability to influence
public policy in accordance
with the norms applicable
in the context of a socio-
cultural environment.
8. The ability to build
teamwork on the basis of
tolerance, understanding
and mutual interests.
9. The ability to compete
to achieve better and be
more useful.
10. The ability to actively
discuss social issues
intelligently and
responsibly.
11. The ability to oppose
various forms of
harassment against civic
skills in a way that is
socially and culturally
Acceptable.
12. The ability to resolve
social conflicts in a way
that right and acceptable.
13. The ability to critically
analyse social problems
by using a variety of
existing sources.
14. The ability to lead
community activities in a
responsible manner.
15. The ability to support
Proceedings of The 1th Almuslim International Conference on Science, Technology and Society (AICSTS) 2015
November 7-8, 2015, Bireuen, Indonesia
72
and give responsibility to
future leaders in their
environment.
16. Students have the
ability to provide healthy
and sincere support to the
democratically elected
leaders.
17. The ability to perform a
variety of social obligations
as members of society
with full awareness.
18. The ability to build
mutual understanding
between different
ethnicities, religions, races
and classes in order to
maintain the integrity and
spirit of family.
19. The ability to establish
mutual understanding
among nations through
various social and
communication medias
available
20. The ability to strives
and improve personal
abilities and socio-cultural
activities with the
awareness to do better.
Source: Udin S.
Winataputra 2001
Model developed by Ruslan
Conclusion
In a democratic society, citizens are decision makers. So to make decisions that reflect smart and good
citizenship, civic skills have a significant role. Due to that, decisions made by citizens must be supported
Proceedings of The 1th Almuslim International Conference on Science, Technology and Society (AICSTS) 2015
November 7-8, 2015, Bireuen, Indonesia
73
by a set of civic skills. Civic skills include intellectual skills participatory skills in society (Margaret S.
Branson, 1999).
The civic skills of Indonesia are based on some rational consideration, namely; first, the function and role
of agriculture is fundamental for life to the people of Indonesia; meaning, on the basis that the main
interest of life is to maintain the presence of oxygen, civic skills in Indonesia are based on the interests of
nature conservation from agricultural values. Agricultural values are developed based on the philosophy
of Pancasila, which are values derived from the rice crop. The philosophy of rice crops consists of the
roots, stems, leaves, flowers and fruit, which in turn is the basis of civic skills. Secondly, the balance of
the ecosystem affects the social system. That is, an imbalance the soil, water, air and other parts of the
ecosystems will affect the flow of energy, materials and information given to the social system, and vice
versa. The reciprocity between them means that selection and adaptation happens to each individual
citizen. To strike a balance between adaptation and selection between them, intellectual skills and citizen
participation must protect the balance through agriculture. Third, agriculture is the implementation of the
philosophy of Pancasila. That is, the implementation of civic skills. Skills that consists of intellectual skills
and participatory skills inspired by Pancasila which is then used as the basis for the implementation of
good agriculture as an attempt to balance the ecosystem and life of the Indonesian people through the
fulfilment of primary needs.
On the basis of these ideals, understanding of agriculture for students as a fundamental basis of civic
skills can be conducted using aspects of civic skills described above by implementing agriculture through
the education system based on the principles of ‘Taman Siswa’.
Reference
Branson, Margaret S., et all., 1999. Belajar “Civic Education” dari Amerika. Yogyakarta. LKiS.
Daryanto and Agung S., 2013. PengantarPendidikanLingkunganHidup. Yogyakarta: Gava Media
Kaelan, 2013. Negara Kebangsaan Pancasila: Kultural, Historis, Filosofis, Yuridis, dan Aktualisasinya.
Yogyakarta: Paradigma.
Kahin, George McTurnan, 2013. Nasionalisme dan Revolusi Indonesia. Depok: Komunitas Bambu.
MajelisLuhurPersatuan Taman Siswa, 2013. Ki Hadjar Dewantara: Pemikiran, Konsepsi, Keteladanan,
Sikap Merdeka. Yogyakarta: UST Press.
Neolaka, Amos, 2008. Kesadaran Lingkungan. Jakarta: RinekaCipta
Nurmala, Tati, et all., 2012. Pengantar Ilmu Pertanian. Yogyakarta: GrahaI lmu.
http://id.wikipedia.org/wiki/Pertanian/ accessible 7th May 2015
Putrawan, I Made, 2014. Konsep-Konsep Dasar Ekologi dalam Berbagai Aktivitas Lingkungan. Bandung:
Alvabeta.

Proceedings of The 1th Almuslim International Conference on Science, Technology and Society (AICSTS) 2015
November 7-8, 2015, Bireuen, Indonesia
74
Sapriya and A. Aziz Wahab, 2011. Teoridan Landasan Pendidikan Kewarganegaraan. Bandung:
Alvabeta
Soesilo, Indroyono/ Kompas/Saturday 17 May 2003 - Page 33/ Zadrah/ Mezak/ Pr/ Sobirin-Mubiar/
Dpklts-2003
Taman Siswa 30 years’ remembrance committee. 1952. Buku Peringatan Taman Siswa 30 Tahun.
Yogyakarta: Taman Siswa 30 years’ Remembrance Committee.
Wreksosuhardjo, Sunarjo, 2014. Berfilsafat MenujuI lmu Filsafat Pancasila: Padmonobo Pembawa
Amanat Dewata Mengajarkan Kesaktian. Yogyakarta: Andi.

Proceedings of The 1th Almuslim International Conference on Science, Technology and Society (AICSTS) 2015
November 7-8, 2015, Bireuen, Indonesia
75
How English Infiltrated Into Acehnese Language
Saifuddin A. Haitamy
Language Center of Almuslim University, Bireuen, 24261, Indonesia
Corresponding Author: [email protected]
Abstract
Throughout of its history, the Acehnese language had adopted a vast number of loan-
words from the English language. Most of the loan-words had gone through slight
variation in morphology, pronunciation, and meaning, but the words are still easily
recognized that they are derived from English language. The process of this adoption is
called borrowing in linguistics. The borrowing naturally happens in any language as a
consequence of intensive interaction between two nations speaking different languages.
The British and the Dutch who once lived in Aceh and used English when communicating
with the Acehnese people had allowed this borrowing to take place. Because of the
limited space, the writer only presents 30 data (words) in this presentation, among of
them are six data having the similar pronunciation and the meaning but a little difference
in the morpheme, while the other 24 data have slightly changed in the morphology, the
pronunciation, and the meaning. The data were collected from the literatures (Oxford
Advanced Learner’s Dictionary, Acehnese – Indonesian – English Thesaurus and
Linguistics) and field interview. The interviewees were the elders living in Aceh, who had
once communicated with the Dutch during colonization era. So, the borrowing had
allowed the English language to penetrate into the Acehnese language.
Keywords: Acehnese, English, borrowing, loaned-words, similarity, slight variation
Introduction
A great deal of words in the Acehnese language (a local language used by the Acehnese people) are
nearly similar in morphology, pronunciation and meaning with the words of English language. Even
though most of these words had gone through variation in the morphology and the pronunciation, but they
still remain similar in the meaning. The slight variation in the morphology and the pronunciation was
mainly caused by the adaptation to the tongues of speakers and the span of time that took for centuries of
their usages. It is assumed that the intensive interaction between the Acehnese and the English people

Proceedings of The 1th Almuslim International Conference on Science, Technology and Society (AICSTS) 2015
November 7-8, 2015, Bireuen, Indonesia
76
for centuries ago had allowed the Acehnese language to borrow a vast number of loaned-words from the
English language.
Princess Elisabeth of England (1558 – 1603) sent Sir James Lancaster with four armadas which were full
of the British to Banda Aceh on 26 May 1602. Since then, the relationship between the Acehnese and the
British flourished until the military conflict flared up in 18th century (aulia87.wordpress.com). It means that
the relationship between the Acehnese and the British blossomed in 200 years. In that long period, the
Aceh language was infiltrated by the English; this infiltration occurred when Aceh people borrowed the
English words to enrich and develop the Acehnese language.
Another assumption for this language borrowing is that the Dutch, who colonized Aceh for quite many
years (1873 – 1942) used English as lingua franca when they communicated with people in Aceh. This
assumption was based on the interview conducted to the elders, who once lived in Aceh and interacted
with the Dutch in the time of the Dutch colonization. The Dutch might think that English was an
appropriate medium of communication with the indigenous people because they were once exposed to
English when the British lived in Aceh before the Dutch arrived.
Language borrowing is a word or phrase which has been taken from one language and used in another
language (Jack Richard, 1985:30). And the borrowing naturally happens in any language as a
consequence of intensive interaction between two nations who speak different language. For instance,
English adopted a great number of loan-words from other languages, including alcohol from Arabic, boss
from Dutch, piano from Italian, tycoon from Japanese, yogurt from Turkish, and zebra from Bantu.
The loan-words may slightly change their morphology, pronunciation or even meaning for at least 2
reasons: First, the speakers adapted the words to their tongues. Second, the words were used for
centuries. Here are some examples: Japanese borrowed the word supermarket from English then it
becomes suupaamaaketto, radio becomes rajio, etc. English borrowed the words salaam from Arabic
then it becomes so long (Alice Oshima, 2006) and borrowed the word ubermensch from German and it
becomes superman, lehnwort becomes loan-word (Refnaldy, 2003:4.28), Indonesian borrowed the word
organization from English then it becomes organisasi, management becomes manajemen, Acehnese
borrowed the word batu from the Indonesian language and then it becomes batèe, baju becomes bajèe
etc. In short, the borrowing had allowed the English language to penetrate into the Acehnese language
and a loan-word might slightly change due to the time span and adaptation to the tongues of the
speakers; however, the loan-words still can be easily recognized that they originated from the English
language.
Methodology
The methodology used for this study is the library research and field interview focusing on words in the
Acehnese and English languages which have similarity in morphology, pronunciation, and meaning. The
data source is the Acehnese language words listed in Acehnese – Indonesian – English Thesaurus and

Proceedings of The 1th Almuslim International Conference on Science, Technology and Society (AICSTS) 2015
November 7-8, 2015, Bireuen, Indonesia
77
the English language listed in the Oxford Advanced Learner’s Dictionary and the field interview conducted
to the Acehnese elders living in Peusangan, Bireuen Regency.
Result and Discussion
The data were listed in the table which describes some similarities in the morphology, pronunciation, and
the meaning between Acehnese and English words. The English words were defined by referring to
Oxford Advanced Learner’s Dictionary and the Acehnese words are defined by using Acehnese –
Indonesian – English Thesaurus or the data obtained through interview in the field. The phonetic symbols
of words for both languages are also referred to the phonetic symbol used in Oxford Advanced Learner’s
Dictionary. Due to the limited space, the writer only presents 30 data; whereas there are still a lot more
data stored in my file.
Table of Data Display
English Acehnese Remarks
Road /rƏυd/, hard surface built for vehicle
to travel on
Crux /krɅks/, the most important or difficult
parts
Dance /dæn/, series of movements and
steps that are usually performed to music.
Broken /brƏυkƏn/, that has been damaged
or injured.
Wring /rIŋ/, to twist and squeeze clothes,
etc
Prate /preit/, (disapproving) to talk too
much in a stupid or boring way
Rewind /ri:waind/ to make a tape in a
cassette player etc to go backwards
Good /gυd/ of high quality or an acceptable
standard
RÖt /rot/, hard surface built for vehicle to
travel on
Krak /krɅk/, the most important part
Dèn-dèn /dændæn/, series of movement
and steps that are usually performed when
one is feeling severely hurt.
Brôk /brƏυk/, that has been rotten or
damaged.
Hréng /hreiŋ/, to twist and squeeze clothes,
etc
Prak /prɅk/, (derogatory remark) to talk too
much in a stupid or boring way
Riwang /riwang/ to return or go backwards
Gôt /gǝt/, high quality or an acceptable
standard
Data 1
Data 2
Data 3
Data 4
Data 5
Data 6
Data 7
Data 8

Proceedings of The 1th Almuslim International Conference on Science, Technology and Society (AICSTS) 2015
November 7-8, 2015, Bireuen, Indonesia
78
Lame /leim/ unable to walk because of an
injury to the leg or foot
Male /meil/ belong to sex that does not give
birth to babies
Yoke /yǝυk/ a long piece of wood that is
fastened across the necks of two animals,
especially oxen so that they can pull heavy
load.
Up /Ʌp/ to suddenly stand up and do
something suddenly
Sieve /sIv/ to sort out things between small
size and the big size by using net
Rampage /ræmpeidƷ/ to remove through a
place in a group, usually breaking things
and causing damage
Shield /ʃi:ld/ a plate or screen to protect the
machine or person using it from damage or
injury
Grunt /grɅnt/ to make a short low sound in
your throat especially to show you are in
pain, annoyed or not interested
Plunge /plɅndƷ/ to move or make
somebody move suddenly forward
Hint /hint/ something that you say or do in
an indirect way in order to show somebody
what you are thinking.
Chance /tʃa:ns/ possibility of something
happening, especially something that you
Leumiek /leumiek/ soft, unable to walk
because of an injury to leg or foot
Malé /malei/ (esp. female) that does not
give birth to babies
Yôk /yǝυk/ a long piece of wood that is
fastened across the necks of one or two
animals, especially oxen so that they can
pull heavy load.
ôp, /ǝp/ to stand, especially an order given
to a toddler to stand up and move
Seut /seut/ to sort out grain between small
size and the big size by using winnow
Rampôt /rampǝt/ to remove through a place
in a group, usually breaking things and
causing damage
Seung /seuŋ/ a makeshift shelter to protect
person from sunlight
Gram /grɅm/ to make a short low sound in
your throat especially to show you are in
pain, annoyed or not interested
Plueng /plυǝŋ/ to run or move suddenly
forward
H’iem /h’im/ puzzle or something you say
or do in an indirect way in order to show
what you are thinking.
Can /tʃa:n/ good opportunity or possibility of
something happening, especially something
Data 9
Data 10
Data 11
Data 12
Data 13
Data 14
Data 15
Data 16
Data 17
Data 18
Data 19
Proceedings of The 1th Almuslim International Conference on Science, Technology and Society (AICSTS) 2015
November 7-8, 2015, Bireuen, Indonesia
79
want
Glee /gli:/ a feeling of happiness, usually
because something good has happened to
you.
Pause /pↄ:z/ to stop talking or doing
something for a short time before
continuing
Burping /bƷ:piŋ/ to let out air from the
stomach through the mouth, making noise
Plateau /plætǝυ/ an area of flat land that is
higher than the land around.
Blank /blæŋk/ an empty space on a printed
form
Drop /drα:p/ to fall or allow something to fall
by accident
Kiosk /ki:ɒst/ a small shop/store open at the
front, where news paper, drinks, etc. are
sold.
Be good /bi:gυd/ behave in a good manner.
Hook /hυk/ fasten something on something
else using a hook.
Dogged /dɒgId/ showing determination; not
that you want
Gli /gli:/ a feeling of fun or excitement when
you are tickled
Posé /pↄsei/ to stop playing game for a
short time before continuing. It is commonly
used in football game.
Beuténg /beuteiŋ/ suffering from
stomachache where the stomach is full of
wind
Panté /pɅntei/ an area of flat land on river
beach
Blang /blɅŋ/ an empty space of land in
which no tree grows, usually rice is grown
in it.
Drap /drα:p/ to make an opponent fall to the
ground in order to stop them running (in a
football game)
Kios /ki:ↄs/ a small shop/store open at the
front, where news paper, drinks, etc. are
sold.
Beu gôt /beu gǝt/ be careful.
Huk /hυk/ fishbone fasten on the flesh in
your throat when you eat fish, or bullets
fasten in a rifle barrel.
Dok /dok/ engrossed in something, showing
Data 20
Data 21
Data 22
Data 23
Data 24
Data 25
Data 26
Data 27
Data 28
Data 29

Proceedings of The 1th Almuslim International Conference on Science, Technology and Society (AICSTS) 2015
November 7-8, 2015, Bireuen, Indonesia
80
giving up easily
Sway /sweI/ movement from side to side
determination and not easy to switch the
attention to something else
Suwé /sweI/ propeller (the device with two
or more blades that turn quickly from side to
side)
Data 30
If the words pairs (English and Acehnese in the table) are compared, you cannot encounter the exactly
similar morpheme and pronunciation; they have been slightly adapted to the speakers’ tongues and
modified by the centuries of their uses; nevertheless, the meaning remain similar even if it changes
slightly in the context and the situation.
The following is a description showing the slight variations both in meaning and morpheme.
Data 1. The words road and rÖt have slight variation in morpheme and pronunciation but have the similar
meaning.
Data 2. The words crux and krak have slight variation in the morpheme but they are rather similar in the
pronunciation and the meaning.
Data 3. The words dance and dèn-dèn have slight variation in the morpheme (the word is pronounced
twice in Acehnese) but the meaning is fairly similar; the difference is only the context in which the word is
used.
Data 4. The words broken and brôk have a little variation in the morpheme and the pronunciation but
have a similarity in meaning.
Data 5. The word wring and hréng have a little variation in the morpheme but they are fairly similar in the
pronunciation and very similar in the meaning.
Data 6. The word prate and prak have a little bit variation in the morpheme and pronunciation but
completely similar in the meaning.
Data 7. The words rewind and riwang have a slight variation in the morpheme, the pronunciation and the
meaning. Rewind has a specific meaning that is to make a tape in a cassette player etc. to go backwards;
rewang is used for wider meaning that is to return or go backwards that includes making tape in a
cassette player to go backwards.
Data 8. The words good and gôt have a little variation in the morpheme and the pronunciation but they
are completely similar in the meaning.
Data 9. The words lame and leumiek have a difference in the morpheme and the pronunciation but have
similarity in the meaning.
Proceedings of The 1th Almuslim International Conference on Science, Technology and Society (AICSTS) 2015
November 7-8, 2015, Bireuen, Indonesia
81
Data 10. The words male and malé have the similar morpheme, the only different is the use of
apostrophe on the letter e. The pronunciation and the meaning have a little variation; malé means a
female who does not give birth to babies.
Data 11. The words yoke and yôk have a little variation in morpheme but they are very similar in the
pronunciation and the meaning.
Data 12. The words up and ôp have a little variation in the morpheme but have the similarity in the
meaning. The only difference is that the word ôp is specifically used when asking toddlers to stand up.
Data 13. The words sieve and seut have the slight variation in the morpheme and the pronunciation but
have the same meaning. The difference only with the tool used to sieve.
Data 14. The words rampage and rampôt have a slight variation in the morpheme and the pronunciation
but they are quite similar in the meaning.
Data 15. The words shield and seung have variation in the morpheme, the pronunciation, and have a little
change in meaning, but the similarity is at the material used to protect person from injury. Seung is a
makeshift structure whose roof is made of coconut leaves or hay. It is used in the rice paddy to protect
people threshing rice from sunshine.
Data 16. The words grunt and gram have a tiny change in the morpheme and the pronunciation but they
are similar in the meaning.
Data 17. The words plunge and plueng have a little variation in the morpheme, difference in the
pronunciation, and have a little bit difference in the meaning.
Data 18. The words hint and h’iem have a slight difference in the morpheme and the pronunciation, but
they have the same meaning. The only difference is that h’iem can also mean puzzle.
Data 19. The words chance and can have a little difference in the morpheme and the pronunciation but
have similarity in the meaning.
Data 20. The words glee and gli have a slight difference in the morpheme and the meaning, but have
similarity in the pronunciation.
Data 21. The words pause and posé have a little difference in the morpheme, the pronunciation, and
meaning.
Data 22. The words burping and beuténg almost have the same morpheme, the pronunciation, and the
meaning. The obvious difference is that burping to let out air from stomach but beuténg the situation
where stomach is suffering from excessive wind.
Data 23. The words plateau and panté almost have the same morpheme but have the difference in the
pronunciation but they are nearly similar in the meaning. The only difference is that panté is the flat land
beside the river, but plateau is the flat land in general.

Proceedings of The 1th Almuslim International Conference on Science, Technology and Society (AICSTS) 2015
November 7-8, 2015, Bireuen, Indonesia
82
Data 24. The words blank and blang almost have similar morpheme and pronunciation, and have a
similarity in meaning. The difference is in the use of the word, blank is the space on the printed form but
blang is the space on the land.
Data 25. The words drop and drap, drop has general meaning but the word drap has specific meaning, it
is only used in football game.
Data 26. The words kiosk and kios almost have the similar morpheme and pronunciation but have a
similar meaning.
Data 27. The phrases be good and beu gôt have a little difference in physical form and pronunciation but
have similarity in meaning.
Data 28. The words hook and huk have the similar pronunciation and the meaning, but the morpheme is
slightly different.
Data 29. The words dogged and dok have the similarity in the pronunciation and the meaning but a little
difference in the morpheme.
Data 30. The words sway and swé have the similarity in the pronunciation and the meaning but have
slight difference in the morpheme. Swé is almost similar with the windmill but its blade is made of wood
strip. In Aceh, it is a kind of game played in the rice paddy in the harvesting season.
Conclusion
It is assumed that the existence of many English words in Acehnese language was caused by the
intensive interaction between the Acehnese and the British or the Dutch. Both foreign peoples used
English in their communication with the Acehnese; therefore, the Acehnese people adopted some English
words from those foreigners in order to enrich their language. This borrowing naturally happened in all
languages as the consequence of intensive interaction between two nations who speak the different
language. For instance, English adopted a huge number of loan-words from other languages as Arabic,
Dutch, Italian, Japanese, Turkish, etc. the Indonesian borrowed some loan-words from the English, the
Acehnese borrowed from the Indonesian. Even though the loaned-words changed, but their origins
remain recognizable.
References
Daud Bukhari, Durie Mark. 2002. Acehnese-Indonesian-English Thesaurus. PDIA.
Hornby, A.S. 2003. Oxford Advanced Learner’s Dictionary. Oxford University Press
Oshima Alice. 2006. Writing Academic English. Longman
Aulia87. 2011. Hubungan Mesra Aceh dengan Inggris (Online)
Refnaldy, et.al. 2003. Introduction to Linguistics. Universitas Terbuka
Richard Jack, et.al. 1985. Longman Dictionary of Applied Linguistics. Longman

Proceedings of The 1th Almuslim International Conference on Science, Technology and Society (AICSTS) 2015
November 7-8, 2015, Bireuen, Indonesia
83
The Uses and Effects of Online Social Media among Acehnese
Students
Sufri Eka Bhakti
Almuslim University
Corresponding Author: [email protected]
Abstract
Students on Social Media have dramatically increased in recent years. Online media
such as Facebook, Instagram, Path, LiNE, WhatApp and Twitter allows millions of
students to create their personal profiles and also learn about bridging and bonding
relationship. Using the uses and gratification theory approach, the study was written with
the intent of discovering study about common typologies of Social Media use generally.
The study purposed to find out the reasons and effects of students used Social Media to
satisfy their needs and wants. This exploratory study examined students through survey
and in depth interview on Acehnese Students Community. This theory is expected to help
communication researchers enhance a better understanding of the powerful influence
Social Media have on students. Based on the results acquired through the questionnaire
quantitative approach, it was discovered that there were actually three typologies which
were information, entertainment, and social interaction underlying the Social Media
usage. Therefore, specifically many students shared that they used Social Media to
inform their friends about information and events quickly.
Keywords: Social Media and Uses and Gratifications
Introduction
Social Media has become the most popular networking site on the web today, such as: US, Indonesia,
Japan, and Malaysia, Philippine as the five largest Social Media users in the World (E-marketer – 2015).
Now, Social Media is not only an integral part of college students' vocabulary, but it has also become a
verb. Students exclaim to new acquaintances." Social Media has become, like Google before it,
something to do and not just somewhere on the internet to be. (Sarah K. Foregger - 2008). Social Media
allow students to present themselves, articulate connections with others and built their social networking.
In addition, it’s also enables to maintain social capital that assessing bonding and bridging on Social
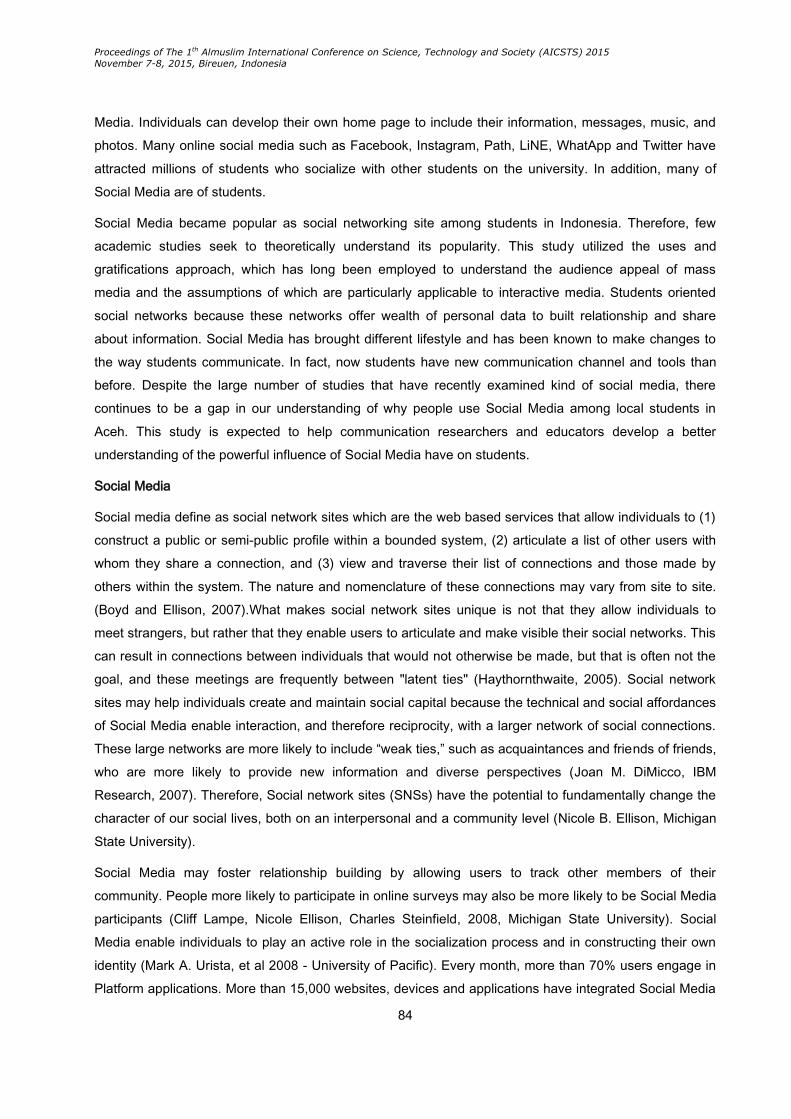
Proceedings of The 1th Almuslim International Conference on Science, Technology and Society (AICSTS) 2015
November 7-8, 2015, Bireuen, Indonesia
84
Media. Individuals can develop their own home page to include their information, messages, music, and
photos. Many online social media such as Facebook, Instagram, Path, LiNE, WhatApp and Twitter have
attracted millions of students who socialize with other students on the university. In addition, many of
Social Media are of students.
Social Media became popular as social networking site among students in Indonesia. Therefore, few
academic studies seek to theoretically understand its popularity. This study utilized the uses and
gratifications approach, which has long been employed to understand the audience appeal of mass
media and the assumptions of which are particularly applicable to interactive media. Students oriented
social networks because these networks offer wealth of personal data to built relationship and share
about information. Social Media has brought different lifestyle and has been known to make changes to
the way students communicate. In fact, now students have new communication channel and tools than
before. Despite the large number of studies that have recently examined kind of social media, there
continues to be a gap in our understanding of why people use Social Media among local students in
Aceh. This study is expected to help communication researchers and educators develop a better
understanding of the powerful influence of Social Media have on students.
Social Media
Social media define as social network sites which are the web based services that allow individuals to (1)
construct a public or semi-public profile within a bounded system, (2) articulate a list of other users with
whom they share a connection, and (3) view and traverse their list of connections and those made by
others within the system. The nature and nomenclature of these connections may vary from site to site.
(Boyd and Ellison, 2007).What makes social network sites unique is not that they allow individuals to
meet strangers, but rather that they enable users to articulate and make visible their social networks. This
can result in connections between individuals that would not otherwise be made, but that is often not the
goal, and these meetings are frequently between "latent ties" (Haythornthwaite, 2005). Social network
sites may help individuals create and maintain social capital because the technical and social affordances
of Social Media enable interaction, and therefore reciprocity, with a larger network of social connections.
These large networks are more likely to include “weak ties,” such as acquaintances and friends of friends,
who are more likely to provide new information and diverse perspectives (Joan M. DiMicco, IBM
Research, 2007). Therefore, Social network sites (SNSs) have the potential to fundamentally change the
character of our social lives, both on an interpersonal and a community level (Nicole B. Ellison, Michigan
State University).
Social Media may foster relationship building by allowing users to track other members of their
community. People more likely to participate in online surveys may also be more likely to be Social Media
participants (Cliff Lampe, Nicole Ellison, Charles Steinfield, 2008, Michigan State University). Social
Media enable individuals to play an active role in the socialization process and in constructing their own
identity (Mark A. Urista, et al 2008 - University of Pacific). Every month, more than 70% users engage in
Platform applications. More than 15,000 websites, devices and applications have integrated Social Media
Proceedings of The 1th Almuslim International Conference on Science, Technology and Society (AICSTS) 2015
November 7-8, 2015, Bireuen, Indonesia
85
Connect since its general availability in December 2008. More than 1.6 million active Pages on Social
Media and have created more than 5.3 billion fans. Social Media, a social networking site that began with
a focus on colleges and universities, but now includes high schools and other organizations, has been
studied (Acquisti and Gross, Lampe, Ellison, and Steinfield, Stutzman, 2007). The use of technology to
carry out communication leads to persistence (Erickson and Kellogg, 2000). The web traffic data for
Social Media, a social Networking site oriented towards college students, shows 15 million unique US
visitors a month (QuantCast, 2007). Social Media is an online social networking community that has
become popular at academic institutions (Anne Hewitt and Andrea Forte, GVU Center, Georgia Institute
of Technology, 2006).
Uses and gratifications
According to Ruggiero (2000), what mass communication scholars today refer to as the uses and
gratifications (U&G) approach is generally recognized to be a sub tradition of media effects research
(McQuail, 1994). Early in the history of communications research, an approach was developed to study
the gratifications that attract and hold audiences to the kinds of media and the types of content that satisfy
their social and psychological needs (Cantril, 1942). Much early effects research adopted the
experimental or quasi-experimental approach, in which communication conditions were manipulated in
search of general lessons about how better to communicate, or about the unintended consequences of
messages (Klapper, 1960).
The uses and gratifications approach focuses on the audience member rather than the message. This
approach imagines the audiences’ member to be a discriminating user of media (Stephen W. Littlejohn,
2002:323). Many researchers believe that uses and gratifications approach is well suited for studying the
internet (Eighmey & McCord, 1998; Johnson & Kaye, 2004; Ko, et.al, 2005; Ruggerio, 2000; Stafford,
2004). The uses and gratification perspective as focusing on “the social and psychological origins of
needs, which generate expectation of the mass media or other sources, which lead to different patterns of
media exposure resulting in need gratifications and other consequences” (Katz & Foulkes, 1962;
Ruggerio, 2000). Furthermore, the uses and gratifications approach is especially well suited for studying
the internet, as the interactive nature of the internet underscores the "core notion" of uses and
gratifications; that of audience choice (Ruggerio, 2000). However, Katz proposed that we should focus
more on the question “What do people do with the media?” than on the question“What do media do to
people?” (Katz, 1959). Other researchers reopened the basic question of “what do we use the media for”
by beginning with focus groups (Charney & Greenberg, 2001). This resulted in the discovery of “new”
gratifications that were either downplayed in conventional mass media Uses and gratifications research
(e.g. interpersonal communication, Papacharissi & Rubin, 2000). The uses and gratification perspective
as focusing on “the social and psychological origins of needs, which generate expectation of the mass
media or other sources, which lead to different patterns of media exposure resulting in need gratifications
and other consequences” (as cited in Rubin, 1994, p. 419). Uses and gratifications assumptions which
Proceedings of The 1th Almuslim International Conference on Science, Technology and Society (AICSTS) 2015
November 7-8, 2015, Bireuen, Indonesia
86
are: communication behavior is goal-directed, purposive, and motivated, people select media, many
factors guide media selection (Rubin, 1994).
Studying Social Media with the uses and gratifications approach (Blumler & Katz, 1974) may help people
to enhance better understanding and answer questions about student use. Social Media is most often
labeled as a social-networking site. Social Media such as Facebook, Instagram, Path, LiNE, WhatApp
and Twitter according to Ellison, et.al. (2006) are "online spaces where individuals are allowed to present
themselves, articulate their social networks, and establish or maintain connections to others. Social Media
is, as he states, a way to share information through the "social graph" - a term that Zuckerberg defines as
a digital map of our real-world connections (Social Media.com; Levy, 2007).The network feature of Social
Media distinguishes it from other Social Media where users typically meet new people online and then
move toward offline friendships (Ellison, et.al., 2006).Uses and gratifications research emerged as a
distinct shift away from the traditional media effects perspective toward a more functionalist approach
(Katz, et.al., 1974; Rubin, 1994)
Research Questions
Using an analysis of survey and interview responses, this study attempts to answer the following
questions:
1. What are factor affecting Acehnese students used Social Media?.
The questions purposed to find out the typologies of students use Social Media.
2. Why Acehnese students used Social Media?
The questions purposed to find out the reasons and effects of students use Social Media
Research Methods
The study of an online social media designed for students in a specific media to meet specific needs. To
answer the research questions, this study used mixed-methods. First, study using a quantitative online
survey. Second, study a series of qualitative in-depth interview. Survey results provided demographic
data about respondents, frequency using Social Media and described activities of online communities and
related to factor affecting students of using Social Media at a particular point in time. Follow-up depth-
interviews will be conducted to further explore purposefully selected participants’ online community needs
to explore why students used Social Media as Social Media.
Survey
Survey user on Social Media allows respondents to answer more specifically. Another Important way
researcher use e-mail is to participate in electronic discussion groups (Rubin, 2005, p.87). The survey
respondents need to choose a suitable answer in form of questionnaire. Purposive sample was used
because the study was more exploring the correlations between Social Media use and the uses and
gratifications of seeking dominant factor affecting student’s use of Social Media.

Proceedings of The 1th Almuslim International Conference on Science, Technology and Society (AICSTS) 2015
November 7-8, 2015, Bireuen, Indonesia
87
The survey was pre-tested by 11 students recruited from the any school in all over university in Aceh who
are concern with media development. The students took the survey and then were interviewed to
determine whether questions were ambiguous or unwell utterance. The pre-test helped this research
improve the validity of the survey. The survey was available for responses for three weeks. After pre-
tested, 192 students examine demographic, frequently using and online activities of Social Media, as well
as the uses and gratifications factor affecting the student’s use of Social Media specifically. The survey
was entered onto Zoomerang.com and surveymonkey.com. The results of the survey were analyzed
using SPSS. Statistics descriptive were run to obtain uses and gratification of Social Media in general.
Interview
The purpose of in-depth interviewing is not to get answers to questions, nor to test hypotheses, and not to
“evaluate” as the term is normally used. The root of in-depth interviewing is an interest in understanding
the lived experience of other people and the meaning they make of that experience (Irving Seidman,
2006, 7:10). A total of 11 students were interviewed: 7 male and 4 female participants using a different
question asking if they would be willing to participate. Furthermore, a qualitative component was used to
ask more in-depth questions on how students used Social Media to satisfy their needs and wants. These
interviews ranged in length from 25 to 40 minutes, and consisted of a series of questions asking about
why students used.
Participant
The participant took Acehnese Students Community. The rationale for these populations was students
because they are the largest number users in Aceh. Researcher also feel attracted to Acehnese students
because the assumptions that they are far from crowded of capital city which only small village that far
away from technology development. Thus, they need Social Media also to bridging, bonding and
maintaining a relationship. Therefore, participants were 192 Social Media users who recruited through a
number of different methods: postings to the ‘wall’, email, and private message.
Result and Discussion
Students in Acehnese Students Community completed a survey on Social Media. Respondents' majors
represented all school that enrolls undergraduate and postgraduate students. Demographics
Respondents' majors represented all Students in Aceh that enroll as Acehnese Students Community. The
sample size is 192 respondents based on PPI group members on Social Media. The respondents ranged
in age from 18-32, with a mean age of 22.26 (SD=1.69).
Table 1. Level in School
Level in School Male Female Total
Undergraduate 42 27 69
Graduate 31 13 44
Master 26 11 37
Proceedings of The 1th Almuslim International Conference on Science, Technology and Society (AICSTS) 2015
November 7-8, 2015, Bireuen, Indonesia
88
Doctoral 19 3 22
Total 118 54 172
+20 "no responses" for sex were not included in this table: 17 undergraduate, 5 graduates, and 3 'other';
2 students did not provide their year in school.
Table 2. Frequency Using Social Media
Respon Male Female Total
More than once in a day 42 27 98
Once a day 31 13 66
More than once in a week 26 11 20
Once a week 19 3 11
Table 3. Information
Factors 1 N Min Max Mean
to look at pictures of my friends' friends 165 1 5 2.82
to see if my friends in common 173 2 5 3.72
to look at the photo of people I know 171 1 5 2.91
to help me put faces to names 177 2 5 3.60
to see who knows who on it 176 2 5 3.41
to find out what friends are up to now 171 2 5 3.34
Valid N 103
Table 4. Entertainment
Factors 2 N Min Max Mean
just to waste time 176 2 5 3.28
using Social Media is enjoyable 166 2 5 3.34
because it's interesting 171 2 5 3.63
when I'm using Social Media, I'm entertained 166 2 5 3.27
for me, Social Media prevents boredom 155 2 5 3.37
when I'm on Social Media, time flies by 164 2 5 3.56
because it's fun 168 2 5 3.42
when I don't want to study 169 2 5 3.25
to pass the time 181 2 5 3.08
Valid N 59

Proceedings of The 1th Almuslim International Conference on Science, Technology and Society (AICSTS) 2015
November 7-8, 2015, Bireuen, Indonesia
89
Table 5. Social Interaction
Factors 3 N Min Max Mean
is a great way to contact out of state friends 172 2 5 3.12
to find out what family are up to now 175 2 5 3.21
to keep in touch with High School friends. 183 2 5 3.86
to keep in contact with friends of my friends. 170 3 5 3.87
I am part of the offline community. 175 3 5 3.69
I trust Social Media friends. 192 3 5 3.70
I ask my friends to do a small favor for me. 179 3 5 3.89
I feel like a part of a larger online community. 167 3 5 3.81
to find information about a job or internship 178 3 5 3.80
There is someone at Social Media I can turn to for advice 192 3 5 3.64
to find out about events in another town 192 3 5 4.03
Valid N 89
Based on the categories revealed by the analysis run on the online survey, the interview transcripts were
reviewed for similar themes of social interaction, entertainment, information or surveillance. As the
findings of researchers that uses and gratifications approach is well suited for studying the internet.
Therefore, expectations of Social Media which lead to different patterns of media exposure resulting in
need gratifications and other consequences”. The overall convenience of using Social Media was
predicated social interaction was also frequently mentioned as a use of Social Media. It offers a kind of
communication methods for students to use to keep in touch and make new friends.
Some students use Social Media for entertainment. They report using and liking Social Media simply
because: its fun interesting, or entertaining. Social Media is a way to pass time. It’s also a convenience
came up as a reason for using Social Media, in particularly relating to the communication properties of the
social network.
So if it wasn’t information specific to a user’s friends, surveillance was one of important factor in why the
interviewees used Social Media. Furthermore, the students reporting using Social Media for information.
Many students volunteer that they use Social Media to observe what is going on in the lives of those also
on Social Media. "I use Social Media to check up on my friends". A few of the closed-ended questions
asked whether students used Social Media to find out information such as events or announcements, and
several students wrote informational purposes, such as finding out the latest new gadget, book and movie
release.
Other interviewee said that additional function of Social Media. Many students feel a Social Media more
easily to send email, save contact and address. In response to close ended questions, students reported
logging onto Social Media to upload photos to their albums and log on in order to adjust their profile
information. Checking sell and buy stuff was also reported to be a reason for using Social Media. One

Proceedings of The 1th Almuslim International Conference on Science, Technology and Society (AICSTS) 2015
November 7-8, 2015, Bireuen, Indonesia
90
student mentioned using Social Media 'in lieu of Yahoo Messenger and Twitter. However, some scholars
(Ferguson & Perse, 2000) have used the uses and gratifications approach to examine how then-new
technologies replaced older ones (i.e.: internet replacing television).
Discussion
This study is concerned with patterns of consumptions in typology and process of Social Media use
among student. Survey follow up with interview will explore factors affecting students use Social Media
and other issues about the use of Social Media because the uses and gratifications approach focuses on
the audience member rather than the message (Stephen W. Littlejohn, 2002). The respondent indicated
they felt four dominant factors of Social Media use: Social Interaction, Entertainment,
Information/Surveillance, and Function. Social interaction is the most frequently mention based on mean
scores for factors, the overall maintenance of using Social Media is often predicated as replacement
function in lieu yahoo messenger to Social Media chat.
Each major piece of uses and gratifications research has yielded its own classification scheme of
audience functions (Katz, Blumler and gurevitch).This is an important finding when considering the
potential of Social Media as a tool for directory function that enable students to maintain contact and
information their friends. The student assumes that using Social Media is used to maintain their social.
Social capital is "the ability of people to work together for common purposes in groups and organizations"
(Fukuyama, 1995). "Social capital can be defined simply as the existence of a certain set of informal
values or norms shared among members of a group that permit cooperation among them". Social Media
considered being part of the daily routine of student in a social searching. "Social capital is defined by its
function. It is not a single entity, but a variety of different entities having two characteristics in common:
They all consist of some aspect of social structure, and they facilitate certain actions of individuals who
are within the structure" (Coleman, 1990). This process of Social Media seemed to indicate that social
interaction such as: establish old ties, seeking was more important in how interviewees sought out social
capital found on Social Media. Woolcock define social capital as "the information, trust, and norms of
reciprocity inhering in one's social networks" (1998). Recently, this study has emphasized the importance
of online social media for the strenght of weak ties. Additionally, on Social Media, I come into contact with
new people all the time.” It is enables that new pattern of social capital and relationship developing will
occur in Social Media as social network sites enables several other students to solve their problems each
other.
Conclusion
Based on survey and interview in this study, Social Media used by many Indonesian students and seem
to see Social Media as a social interaction tool, an information source and entertainment. Social Media
allow them to articulate their social networks, and establish or maintain connections with others. Now,
Social Media enable students to play an actor in socialization process. The social interactions among
students through online social media help to assessing increase social capital. Both the quantitative and
Proceedings of The 1th Almuslim International Conference on Science, Technology and Society (AICSTS) 2015
November 7-8, 2015, Bireuen, Indonesia
91
qualitative data suggest that Social Media was an easy to use tool that enabled users to effectively
communicate with friends. Uses and Gratifications researchers, communication on the Internet also
leaves a trail that is easily traceable. Messages have time stamps, accurate to one hundredth of a
second. Content is readily observable, recorded, and copied. Participant demography and behaviors of
consumption, choice, attention, reaction, and learning afford extraordinary research opportunities
(Newhagen &Rafaeli, 1996). For Indonesian student such as: text, voice, pictures, animation, video,
virtual reality motion codes, and even smell have already become part of the Internet experience
(Newhagen and Rafaeli, 1996). James et al. (1995) also suggested internet forums such as Social Media
fulfill many expectations of both mass and interpersonal communication. Hence, if the Social Media is a
new dominion of human activity, it is also a new dominion for Uses and Gratifications researchers.
References
Anderson, K. 2001. Internet Use Among College Students: An Exploratory Study. Journal of American
College Health, 50(1), 21. Retrieved October 13, 2007, from Academic Search Premier
Database.
Bagozzi, R. P., & Lee, K. H. 2002. Multiple routes for social influence. The role of compliance,
internalization and social identity. Social Psychology Quarterly, 65 (3), 226–247
Bailey, D. S. and E. D. Zanders 2008. Drug discovery in the era of Facebook - new tools for scientific
networking. Drug Discovery Today, 13(19-20): 863-868.
Bargh, J. A., McKenna, K. Y., & Fitzsimons, G. M. 2002. Can You See The Real Me? Activation and
Expression of The "True Self" On The Internet. Journal of Social Issues, 58 (1), 33-48.
Bhakti, Sufri Eka. 2012. Students on Facebook through Uses and Gratifications Perspectives. Komunika,
Volume VIII, No.2. Universitas Sumatera Utara.
Boyd, D. M. and N. B. Ellison. 2008. Social Network Sites: Definition, History, and Scholarship. Journal of
Computer-Mediated Communication, 13(1): 210-230.
Bryant & D. ZiIImann (Eds.), Media effects: Advances in theory and research. Hillsdale, N J: Lawrence
Erlbaum Associates, Inc.
Cassidy, J. 2006. Me media. The New Yorker, 50-59.
Cheung, C. M. K., P.-Y. Chiu, et al. Online social networks: Why do students use Facebook? Computers
in Human Behavior In Press, Corrected Proof.
Cliff Lampe, Nicole B. Ellison, Charles Steinfield. 2008. Changes in Use and Perception of Facebook.
Computer Support Cooperative Work '08, November 8-12, 2008, San Diego, California, USA
Coleman, J. S. 1988. Social Capital in the Creation of Human Capital. American Journal of Sociology,
Vol. 94, S95-S120.

Proceedings of The 1th Almuslim International Conference on Science, Technology and Society (AICSTS) 2015
November 7-8, 2015, Bireuen, Indonesia
92
Creswell, J. W. 2003. Research design: Qualitative, quantitative, and mixed methods approaches.
Thousand Oaks, CA: Sage.
Daymon, C. and Holloway, I. 2002. Qualitative Research Methods in Public Relation and Marketing
Communication. UK. Routledge
DiMicco, J., D. R. Millen. 2008. Motivations for social networking at work. Proceedings of the 2008 ACM
conference on Computer supported cooperative work. San Diego, CA, USA, ACM: 711-720.
Emarketer.com’s website Top 10 countries. 2015. Ranked by Gain in Facebook Users.
Fisher, R. 2010. Generation f: How Facebook is changing our lives. The New Scientist 207(2768): 39-41.
Foregger, S. 2008. Uses and gratifications of Facebook.com. Ph.D. Dissertation, Michigan State
University.
Granovetter, M. S. 1973. The Strength of Weak Ties. American Journal of Sociology, 78 (6), 1360-1380.
Giles, J. 2010. Is Facebook. taking over the world? The New Scientist, 206(2766): 50-50.
Gross, R & Acquisti, A. 2005. Information Revelation and Privacy in Online Social Networks (The
Facebook case). Pre-proceedings version ACM Workshop on Privacy in the Electronic Society
(WPES).
Haythornthwaite, C. 2005. Social Networks and Internet Connectivity Effects. Information,
Communication, & Society, 8 (2), 125-147.
Hogan, B. 2011. Visualizing and Interpreting Facebook. Networks. Analyzing Facebook Networks.
Boston, Morgan Kaufmann: 165-179.
Joinson, A. N. 2008. Looking at, looking up or keeping up with people: motives and use of Facebook..
Proceeding of the twenty-sixth annual SIGCHI conference on Human factors in computing
systems. Florence, Italy, ACM: 1027-1036.
Katz, E., Blumler, J. G., & Gurevitch, M. 1974. Uses and Gratifications Research. Public Opinion
Quarerly, 37 (4), 509-524.
Kraut, R., Kiesler, S., Boneva, B., Cummings, J., Helgeson, V., & Crawford, A. 2002. Internet Paradox
Revisited. Journal of Social Issues, 58 (1), 49-74.
Lampe, C., and N. B. Ellison. 2008. Changes in use and perception of Facebook. Proceedings of the
2008 ACM conference on Computer supported cooperative work. San Diego, CA, USA, ACM:
721-730.
LaRose, R., Mastro, D., and Eastin, M.S. 2001. Understanding Internet usage: a social cognitive
approach to uses and gratifications. Social Science Computer Review, 19(4), 395-413.
Littlejohn, Stephen 2002. Theories of Human Communication. California, Wadsworth Publishing
Company.

Proceedings of The 1th Almuslim International Conference on Science, Technology and Society (AICSTS) 2015
November 7-8, 2015, Bireuen, Indonesia
93
Mark A. Urista, Qingwen Dong, Kenneth D. Day. 2008. Explaining Why Young Adults Use MySpace and
Facebook through Uses and Gratifications Theory, Human Communication. A Publication of the
Pacific and Asian Communication Association.Vol. 12, No. 2, pp.215 – 229.
McQuail, Dennis. 1987. Mass Communication Theory: an Introduction. Thousand Oaks California. Sage
Publication.
Nosko, A., E. Wood. 2010. All about me: Disclosure in online social networking profiles: The case of
FACEBOOK. Computers in Human Behavior. 26(3): 406-418.
Rosengren, K. 1974. Uses and gratifications: A paradigm outlined. In J. G. Blumler & E. Katz (Eds.), The
uses of mass communications: Current perspectives on gratifications research (pp. 269-286).
Beverly Hills, CA: Sage.
Yusoff, M. M. 2006. "Mass media in Malaysia: diversity in changing times”. Universiti Sains Malaysia.

Proceedings of The 1th Almuslim International Conference on Science, Technology and Society (AICSTS) 2015
November 7-8, 2015, Bireuen, Indonesia
94
Epistolary Technique in A. Hasjmy Novels
Wildan
Lecturer at Syiah Kuala University, Darussalam, Banda Aceh, Indonesia
Corresponding Author: [email protected]
Abstract
This study is about epistolary technique which is normally used in the novels written by A.
Hasjmy, an Acehnese writer. The aim of the study is to analyze such technique of
epistolary as a technique to express opinion/ideas and narration. The study is
quantitatively approached. The finding of the study shows that Hasjmy commonly used
two kinds of letter writing in developing his novels, viz., fully-letter and partly-letter.
Epistolary technique in the form of fully-letter consists of the following categories: (a) fully
common letter, (b) fully diary letter, (c) fully-letter inserted into diary, (d) fully-letter
followed by poem, (e) fully document letter, (f) fully-letter as novel ending point. The
epistolary technique in the form of partly-letter is considered as partially letter which is
inserted into novel. The analysis concludes that literary writing may be developed by
means of epistolary technique, through which A. Hasjmy expounded his novel as if it is
the factual phenomenon, in which it brought about the impression of the perfectness of
story line and conveyance of gist of the story. Such impression represents the nuance of
specific notion for the characteristics of his (Hasjmy) novels.
Key word: epistolary, novel, A. Hasjmy
Introduction
Based on study on the content of A. Hasjmy novels, it can be said that his novels could deliver many
massages. He used a range of techniques in delivering the problems and one of them is the epistolary or
corespondence technique among others such as speech, diary, poem insertion, and footnote. The
application of epistolary technique will be discussed aiming at finding how work of literature takes role in
delivering various matters and stories.
A Hasjmy is a writer, a muslim leader, a culture expert, a historian, a statesman, politician, and also an
academician. He is an Indonesian novelist from Aceh that had started his works in the colonial era as the
era of Angkatan Pujangga Baru (the generation of new artists) in 1930s and continued to the
Proceedings of The 1th Almuslim International Conference on Science, Technology and Society (AICSTS) 2015
November 7-8, 2015, Bireuen, Indonesia
95
Independence and post independence era. He was born on March 28, 1914 in Montasik, Aceh and died
on January 18, 1998.
The study of the epistolary technique is based on seven of his work of literature, namely (1) Melalui Jalan
Raya Dunia (Through the world’s main road) (1938), henceforth will be mentioned as MJRD; (2)
Bermandi Cahaya Bulan (Moonlight shower) (1939), henceforth will be mentioned BCB; (3) Suara Azan
dan Lonceng Gereja (Azan and Church Bell) (1940), henceforth will be mentioned as SALG; (4) Nona
Pressroom (Miss Pressroom) (1951), henceforth will be mentioned NP; (5) Elly Gadis Nica (Elly the girl
of Nica) (1951), henceforth will be mentioned as EGN; (6) Meurah Djohan: Sultan Aceh Pertama
(Meurah Djohan: The first Sultan of Aceh) (1976), henceforth will be mentioned as MJ; and (7) Tanah
Merah: Digul Bumi Pahlawan Kemerdekaan Indonesia (Tanah Merah” Digul The land of Indonesian
National Heroes) (1976), henceforth will be mentioned as TM.
Discussion
Epistolary means correspondence (refer to Lodge, 1992:21-24). The epistolary technique is dominant in
A. Hasjmy novels in delivering various messages and stories. The technique is one of storytelling
technique as well as a media for him to develop his novels. There are twenty seven letters in his novels.
The letters in A. Hasjmy novels are divided into two kinds, namely fully-letter and patly-letter. Fully-letter
is the letter that appeared completely, meanwhile partly-letter means only parts of the complete letter
were discussed.
Fully-Letter
The delivery technique in full letter is used by A. Hasjmy for some category, namely (a) fully common
letter, (b) fully diary letter, (c) fully-letter inserted into diary, (d) fully-letter followed by poem, (e) fully
document letter, (f) fully-letter as novel ending point.
a. Fully Common Letter
The ordinary full letter used by A. Hasjmy in his novels has some characteristics. First, the letters are
explicitly mentioned in the chapter such as “Surat-surat dari Hamid” / Letters from Hamid (BCB 53),
Surat-surat dari Medan/ Letters from Medan (BCB 76) and Dua Pucuk Surat/ Two letters (SALG 57).
Second, the letters are appeared continuously as if attach in series. This kind in two situation, there are
(1) among those letters label as ‘the first letter’, ‘the second letter’, ‘the third letter’, and ‘the fourth letter’
(BCB 53-61), and (2) among those letters without any explanation followed as in five letters in BCB (76-
85) and two letters in SALG (57-65).
Four letters in BCB that come in series of a special chapter entitled ‘Letters from Hamid’ are the letters
from Hamid for Zuraida (three letters) and to Halim (one letter). In Hamid’s first letter to Zuraida, A
Hasjmy describes the nation fertility along Hamid’s journey from Kutaraja-Medan-Deli to the West
Sumatra. The topic of the nation prosperity is related to the ownership by the foreigners and the labor
Proceedings of The 1th Almuslim International Conference on Science, Technology and Society (AICSTS) 2015
November 7-8, 2015, Bireuen, Indonesia
96
conditions of being underpaid. The image of prosperity is highlighted by referring Aceh as Tanah
Rencong, Deli as Dollarland, Medan as the Paris van Sumatra or the Mesir van Andalas (BCB 53-4).
The progress of religious practice is mentioned in the second letter. Here A. Hasjmy describes West
Sumatra as the center of Indonesian Islamic development. The fact that people of that area pilgrimage to
the grave of Syekh Burhanuddin in Ulakan, Pariaman and the Tabut celebration on 10th day of
Muharram; the first month in Islamic calendar are critized by A. Hasjmy since those practices are
forbidden in Islam. He also admit that ”… Sumatera Baratlah menjadi jiwanya kebangunan ummat Islam
Indonesia.” (the West Sumatra is truly the spirit of the Moslem awakening in Indonesia.) Even so, the
expression, ”Tidak tahukah, orang muda, bahwa kalau genap tujuh tahun berturut-turut menziarahi
kuburan itu di bulan ini, sama pahalanya dengan pergi naik haji ....?’ jawab perempuan tua itu dengan
yakinnya.” (don’t you know young man, that if you pilgrim for the straight seven years to the Syekh grave
in this month, the reward is similar if you go on Hajj to Mecca?’ answer the old lady conficingly.) this fact
is the sign that the Islamic practice is far from the true practice (BCB 53-7).
The similar description is also applied for Hamid letters to Halim. In those letters Hamid informed the
terrible condition of the Java people whose lands and plantation are taken over by the foreigners. For
seeing those conditions that finally Hamid decided to join the political party to stand for the true practice of
Islam and improve the economic condition of his people. These two things are ultimate objective of
Hamid’s struggle in BCB (57-8).
In the next letter, also through Hamid, A. Hasjmy expresses his nationalism in term of social levelling. A.
Hasjmy intends to change the condition. He delivers the message through Hamid’s letter to Zuraiada, one
of which as follows:
Jika di zaman kita masyarakat masih membagi-bagi manusia, sehingga satu golongan terlarang
berjalan seiring, dengan golongan yang lain dalam melalui jalan raya di taman hidup ini,
janganlah sampai di anak kita tetap demikian juga. ..., marilah sama-sama kita dengung-
dengungkan semboyan: Hiduplah persaudaraan! Hiduplah persamaan! Hiduplah persatuan!
(BCB 58—60) (If in our era the society still devide people so that one social group of people are
forbidden to walk along with other social group on the road of this life garden, hopefully in our
children’s era things are improving. .... let’s unite to shout: Long live brotherhood! Long live
equity! Long live unity! (BCB 58-60)
Those four letters are designed by giving words or expressions of connection as ’surat pertama’ or ’surat
kedua’ (the first letter or the second letter) and so worth in between the letters. The next dicussion will be
on the letter insertion of continuous letters that does not mention as the above expression.
In the chapter “Surat-Surat dari Medan” (Letters from Medan) all the letters are for Hamid. In those letters
the ideas of A. Hasjmy about patriotism, the spirit of independent struggling particularly in ommiting
feodalism in the life of the nation. The letters express A.Hasjmy persuasively, for example in the first letter
(BCB-76-7), Rusli, the character admits, ”... Hati saya yang keras, sebagai seorang politik yang selalu

Proceedings of The 1th Almuslim International Conference on Science, Technology and Society (AICSTS) 2015
November 7-8, 2015, Bireuen, Indonesia
97
menghadapi soal-soal yang pelik...,” (... My tough hard, as a politician always experiencing complicted
problems...”) is weaken at seeing Zuraida’s condition after the disaster. Here, before closing the letter,
Rusli informed her the efforts that the party made in east Sumatra were satisfying especially because
there are party’s branches in most places. The third letter (BCB 80-3), contains complaints of Zuraida on
Hamid effort to avoid her. She informed him that she needs his help urgently. Zuraida regretted how
Hamid has neglected her where she suffers alone. She still remembers that Hamid promised her to fight
together against the inequality in the society particularly practice by the feudal. The idealism of the
struggle is continuing in the next letter (BCB 83-4), the letter from Halimah informing Hamid that Zuraida
was saved as the access of the struggle. Zuraida found her identity as to fight for her nation because of
Hamid’s letters.
Next, there are also fully letter appear continuously without spacing, that are the letters from Amiruddin to
Ramayati and Ramayati’s reply to Amiruddin (SALG 57-65). The term “Dua Pucuk Surat” (Two Letters) is
used as the title of the chapter. In the first letter, Amiruddin stated after he returned from Aceh, he is now
in Jakarta with new ideas and ideology, that is the awareness of his religion, and starting to leave his way
of life as an urban person. Amiruddin asked Ramayati to think about their will of a marriage of two
different religions.
The next letter is an independent common full letter. It means the letters are shown once in a time based
on the novel’s context. One of those letters is the letter from Hamid to Halim that informed about
Zuraida’s family had a train accident in Medan. Hamid also informed that he will continue his journey to
Aceh in order to spread his party’s idealism. Hamid expressed his satisfaction on Halim success in
developing the farmer union as a political movement in every village in Aceh. (BCB 66-8)
b. Fully Dairy Letters
The second category of epistolary technique is applied by A. Hasjmy in BCB novel. In one of the letter
(BCB 38-46) of eight-page long from Hamid to Zuraida that contains Hamid daily notes. In that letter,
Hamid expressed his disappointment of Zuraida’s father refuse his proposal. The refusal is caused by
their social level difference. Hamid wrote, “It is my fault of not considering first before I proposed you to
your father, has it come an era where my request is not on the right place? ... that ‘equal society “ has not
come real yet, it is in my ideas.” Hamid also expressed that he is freed from the disappointment. He
hopes that young people of his age should be alert on whatever situation they face. The young people
should not behave negatively if they face problem in life. It can be concluded that through this letter A.
Hasjmy conveys his ideas to lit up the spirit of the young people.
c. Fully-Letter Inserted into Dairy
The example of this technique is found in NP novel (22-4). The letter is written by Nila Kesuma to Suryadi
contains her reply of Suryadi suspicion that she deserted to the enemy. There are many things expose in
the letter. There is an image of argumentation among the characters and certainly will add to the logic of
the story itself. Through it A. Hasjmy wants to show how persistent the warriors are, men and women, all

Proceedings of The 1th Almuslim International Conference on Science, Technology and Society (AICSTS) 2015
November 7-8, 2015, Bireuen, Indonesia
98
take part in the freedom of the nation. The confession of Nila Kesuma in her letter is the proof of women
involvement in the struggle. She worked as the informant in the Ministry of Information, in the Indonesian
Radio Broadcast and also in the state intelligent agency. Through this letter A. Hasjmy shows women
contribution for the nation. Nila Kesuma involved in the aggression done by the Dutch. In the first
aggression, she entered Semarang to contact the sabotage army where she stole the Dutch map of
defense area in Semarang and the ammunition storage of the Dutch.
d. Fully-Letter Followed by Poem
This technique is found in NCB and MJRD. In BCB (80-83), the letter is written by Zuraida to Hamid. Here
the poetry is to beautify the letter which means the poetry is not used as the technique to deliver A.
Hasjmy ideas.
Full letter with poetry insertion is also found in MRJD novel of totally five letters. In one of Ridwan letters,
he wrote, “… in our village the paintings of nature are beautiful that brings to wonder the bless of The All
Mighty and the beauty of our nation. …. Our land is beautiful indeed, Rusmawar, ….” Ridwan also
mentioned about making the graveyard of a certain honored person as the worship place by some
people. To him, it is a sign of awareness of the people in the religious practice. He hopes that one day the
forbidden practices will vanish in this nation. It is what the young people fight for. Ridwan also tells about
the hospitality of the people who served him in a hut with coconut drink and coffee leaves in a coconut
shell bowl. All are from coconut, which is the symbol of Indonesian land. According to A. Hasjmy,
agriculture is one of the noble works in achieving the people prosperity. He thinks that a country will be in
destruction if its people neglect the agriculture and underestimated by the young generation. Through this
letter, A. Hasjmy reminds the importance of loving and appreciating agriculture sector.
e. Fully Document Letter
It is found in EGN where the withdrawal of the nation independent declaration was mentioned. First, the
letter is in the form of secret document on the betrayal of the feudal that is the agreement made by Raden
Sastra Atmaja aiming at asking the Ducth to govern Indonesia again (EGN 42-3). The letter signed on
January 3rd, 1946 contains information such as the statement that Sunda, not Indonesia as the nation
identity. Besides being anti-colonialism, A. Hasjmy also shows his hatred on the royal by describing their
foolishness. It is indicated with the harsh language in the letter.
Second, the letter also mentioned some ideas about Indonesia as a republic, some made countries by
other party such as Pasundan State, Indonesian State, Eastern State of Indonesia and Dutch Indies.
f. Fully-Letter As Novel Ending Point
Full letter is also used by A. Hasjmy to end his novel. It is found in EGN novel. It is Elly’s letter to Raden
Sastra. She informed that she is caught by the republic spies, Rusmiati (EGN 57).
Through the letter Elly requested Raden Sastra Atmaja to tell the Dutch to realize their mistake. She also
hoped that the Dutch not ”... lagi terus-menerus memperkosa Kedaulatan Negara Republik Indonesia.” (to
Proceedings of The 1th Almuslim International Conference on Science, Technology and Society (AICSTS) 2015
November 7-8, 2015, Bireuen, Indonesia
99
keep raping the dignity of the Republic of Indonesia.) On the other hand, the Dutch should withdrawal
themselves from all the islands of Indonesia, ”agar rakjat Indonesia mendapat kesempatan menjusun ta-
nah airnja sendiri.” (so that the people of Indonesia have the chance to manage their own country.)
Partly-Letter
A. Hasjmy is persistent in using epistolary technique also found in partly-letter form. The letter is inserted
in the diary such as in NP novel (15-6 and 19).
In the other letter (NP 19) contains Suryadi suspicion that Nila Kesuma has betrayed and pro the Dutch.
Through his letter, Suryadi expressed his disappointment. He informed her that ”... aku telah berangkat
untuk menunaikan kewadjibanku sebagai putera bangsa. Kemana dan dimana aku tidak perlu engkau
ketahuinja. ....” (… I left to fulfill my responsibility as a child of the mother nation. Where I am and where I
go should you not concern about. …) Suryadi really shows his hatred to his lover for double crossing the
nation. Suryadi’s attitude is actually the reflection of A. Hasjmy himself, the nation’s dignity is above
everything.
In TM novel, besides 50 words mention letter, there are three letters that their parts are inserted explicitly.
The first one is the letter from father (Teungku Syahkobat) that was received by Jalaluddin on his 23rd
birthday and was reread when he turned 25 (TM 59-64). As a flash back, the letter is not completely
exposed; hence it is only as a clip. There are many issues discussed in the letter, particularly concerning
to Indonesian condition in the physical revolution era, the post-independence era, including the era when
Indonesia started to build its nation. Teungku Syahkobat told his son that in the physical revolution era
(1945-1949), the people of Indonesia were gambling with god’s name to defend the independency that
was withdrawal by the Dutch. However, after the nation gained its victory by the sacrify of its people that
95% of them are Moslem including the Digul warriors that are mostly Moslem, the Islamic practice is
taken for granted. Syakobat was worried if the victory gained would be in vain if god curses the people of
Indonesia. People have forgotten that the victory after the Ducth is the blessing from god to the
Indonesian people. In his letter, Syahkobat also mentioned about many issues around Aceh; security
recovery, the development of education (Kopelma Darussalam), the development of Islam, and also
about communism. It is shown that A. Hasjmy through Shaykobat letter has given a special concern on
Aceh. Also, the attention is also given for Irian Jaya, especially Digul where he was expelled by the
Dutch. Syahkobat expected his son, Jalaluddin willing to devote himself to Tanah Merah since there are
four kinds of enemies he would face; false beliefs, stupidity, illnesses, and poverty. He expected
Jalaluddin to be able to improve the condition of his nation that has been deteriorated.
Pada akhir surat, ayah memberi nasehat kepadaku, agar aku tetap thaat kepada Allah, tekun
belajar, berbakti kepada Agama dan Tanah Air, membela rakyat jelata yang tertindas. Ayah
mengharap aku mengabdi kepada tanah tempat ayah dibuang. (At the end of his letter, father
advice me to worship Allah, study hard, devoted myself for the religion and the nation, defend the
Proceedings of The 1th Almuslim International Conference on Science, Technology and Society (AICSTS) 2015
November 7-8, 2015, Bireuen, Indonesia
100
weak and the oppressed people. Father expected me to devote myself to the place where he was
expelled.)
The second one is in the letter from Markus Kaisiepo, a native Papuan. The letter is for the Dutch
government that was posted in the newspaper Penyuluh published by NICA in Brisbane, on Saturday,
September 8, 1945 (TM 83-4). The content of the letter was memorized by Hamra. It was about the hope
for the Dutch government to free Papuan from colonialism.
The next one is the letter from Salahuddin to his brother, Jalaluddin, that was written in Tanah Merah on
September 1962 and send through Port Darwin (TM 94-9). The letter was about parachute troops landing
and the struggle of Salahuddin with his friends in West Irian and the death of Hamra parents in Irian. The
letter described Salahuddin experience in an ambush of the city of Tanah Merah in the dust of August 17,
1962. With the force of a fully armed troop and 35 people from Mandobo tribe armed with poisoned
arrows, they defeated the Dutch-Indo troop and the city of Tanah Merah was taken over. Hamra parents
died in the ambush and were laid in The Heroes Cemetery in the city of Tanah Merah.
In addition, some of the A. Hasjmy novels also mention about the existence of the letters. It means the
letters do not exist, but their existence is still mentioned as the method of narration. For example, beside
the letters inserted in the letter as parts of the text, correspondence is also mentioned among the
characters in MJRD novel. One of the issues is about the request of an official letter from the Sultan of
Aceh by the Engku Penghulu (the traditional leader) when Ridhwan reported to Batu Sangkar (60-70),
about Ridhwan correspondence with his mother (91-91, about Rusmawar who missed the letter from
Ridhwan who was still in Aceh (105) and letter to Rusmawar and his family when he was about to return
to Padang (108), and other issues. Correspondence is very much highlighted in MJRD. It is proven by
mentioning the word letter for sixty nine times. A. Hasjmy also does not mention the letter when
describing Hamra’s intention to send letter to his parents in Irian Jaya and it would be sent through
Salahuddin (TM 89). Also in MJ, there are many issues deliver through letters, but the letters are not
inserted in the novel. Another example is the narration about the request of Indera Purba military to the
Islam sultanate of Perlak that is sent via special messenger.
There are some indications why A. Hasjmy uses lettering techniques in delivering his ideas. The first one
is the development of knowledge and technology of the era when he became a writer that is the era of the
New Writer (1930s) (Nasution and Sartuni, 1980), also influence his way of writing. The trend of era was
on correspondence technique. The second reason is that A.Hasjmy was used to write letters in his daily
life. He even wrote two books that contains letters, that are Risalah Akhlak: Surat-Surat Ayah kepada
Anak (The moral notes: Father’s letters to his childern; A. Hasjmy, 1976c) and a book of Surat-Surat dari
Penjara: Surat-Surat Ayah kepada Puterinya (Letters from the prison: The father’s letters to his daughter;
A. Hasjmy, 1976d). The third reason, epistolary technique us easy to develop and comprehend easily by
the readers. The fourth, letters can provide a space between the author and the characters so that the
readers feel that it is the character’s letter not the property of the author. Lodge (1992:21-24) stated that a
letter is always to a particular addressee, that enable the respond estimation in the paragraph. Rethorical
Proceedings of The 1th Almuslim International Conference on Science, Technology and Society (AICSTS) 2015
November 7-8, 2015, Bireuen, Indonesia
101
letters are very complex and interesting, that is sometime appears as a dramatic monolog. The technique
develops the text to be a kind of writing that exposes the first person narration, although it is not as
compact as autobiography, and the process is ’in progress.’ A fictional letter certainly differenciable than
the real one.
Conclusion
The literature concept as an imaginative work of art that can develop well through epistolary technique.
Through it, A. Hasjmy has shaped his novels as if they are exist. He use this technique to deliver various
messages in his novels and he uses it to provide impression of the perfection of a novel and significantly
shaped it. It is obvious that through epistolary technique applied by A. Hasjmy, he expressses his own
background and it becomes the characteristic of his novels.
References
Hasjmy, A. 1976a. Meurah Djohan: Sultan Aceh Pertama. (Novel). Jakarta: Bulan Bintang.
Hasjmy, A. 1976b. Tanah Merah: Digul Bumi Pahlawan Kemerdekaan Indonesia. (Novel). Jakarta: Bulan
Bintang.
Hasjmy, A. 1976c. Risalah Akhlak (surat-surat ayah kepada anak). Seri I. Jakarta: Bulan Bintang.
Hasjmy, A. 1976d. Surat-Surat dari Penjara (surat-surat ayah kepada puterinya). Seri II. Jakarta: Bulan
Bintang.
Hasjmy, A. 1978a. Melalui Jalan Raya Dunia. 2nd Ed.. (Novel). Jakarta: Bulan Bintang.
Hasjmy, A. 1978b. Bermandi Cahaya Bulan. 2nd Ed.. (Novel). Jakarta: Bulan Bintang.
Hasjmy, A. 1983. Suara Azan dan Lonceng Gereja. 3rd Ed.. (Novel). Serawak, Malaysia: Angkatan
Nahdatul Islam Bersatu (BINA).
Hasjmy, A.; A.G. Mutiara; & T.A. Talsya. 1963. Asmara dalam Pelukan Pelangi. 2nd Ed. (Novel). Banda
Atjeh: Pustaka Putroe Tjanden.
Lodge, D. 1992. The Art Of Fiction: Illustrated from Classic and Modern Text. London: Penguin Books.
Nasution, J.U. & Rasyid Sartuni. 1980. A. Hasjmy: Tokoh Angkatan Pujangga Baru. Jakarta: Pusat
Pembinaan dan Pengembangan Bahasa.
Wildan. 2009. ”Nasionalisme: Kajian Novel A. Hasjmy”. Disertation. Bangi: UKM.

Proceedings of The 1th Almuslim International Conference on Science, Technology and Society (AICSTS) 2015
November 7-8, 2015, Bireuen, Indonesia
102
Analysis of Organizational Culture and Job RotationRegional
Secretariat on employee performance in Bireuen
1,2,3 Hamdani
1Commerce Department, State Polytechnic of Lhokseumawe;
2The Faculty of Economics, Almuslim University, Bireuen
3STIE Nationality Bireuen
Corresponding Author: [email protected]
Abstract
This study analyzed the influence of organizational culture and job rotation on
performance. The aim of this study was to determine the influence of organizational
culture on employee performance and how the effects of job rotation on employee
performance. This study is expected to provide additional references to the object of
research is Government Bireuen, particularly the Regional Secretariat of Bireuen in an
effort to improve employee performance, as well as a contribution to the development of
management science, especially relating to the management of Human Resources (HR),
is also expected to provide information additional or comparison to other researchers
whose research is similar. To answer the problem posed in this study, the data obtained
from 208 employees at the Regional Secretariat Bireuen using questionnaires. The
collected data was then analyzed using quantitative and qualitative research methods.
The analysis showed that organizational culture does not significantly affect the
performance of employees, while job rotation influence on employee performance.
Keywords: Organizational culture, job rotation, employee performance
Introduction
Successful organizations affected by the performance of employees. Therefore, employees are assets of
an organization or enterprise, because employees can be achieved through the activity of a common
goal. To achieve this common goal, an organization needs to make improvements to the performance of
employees.
Organizational culture is growing and is well maintained will be able to spur the organization towards
better development. The values of a strong organizational culture embraced an organization including a
Proceedings of The 1th Almuslim International Conference on Science, Technology and Society (AICSTS) 2015
November 7-8, 2015, Bireuen, Indonesia
103
government organization is indispensable, particularly to overcome the various problems in the
development and adaptation of external changes (globalization) and the integration of the internal forces
(autonomy).
Bireuen District with a total headcount of 9,600 people (Report of February in 2013), in the post-conflict
era broad autonomy in Aceh province, an organizational culture that had previously been relatively well
organized, there was a shift values of habit adopted by government organizations. This is because of the
strong influence of external political forces. The indicator looks at the lack of involvement of employees in
decision-making in government organizations (internal), factors outside the government (ektern) is more
dominant in influencing any decisions and measures taken by the government.
The phenomenon that occurred in recent years seen happen disharmony regional leaders and between
leaders and subordinates, and among fellow employees. The indicator visible from the lack of harmony in
the relationship and the performance of employees in some tribal agencies in the Government of Bireuen.
This phenomenon is seen by many officials, especially former officials eseloning formerly had positions in
government and when there are no more positions decreased productivity.
While the indicators related to the organizational culture of adaptability within the organization there is no
obstacle, especially since they occupy a new government buildings since the year 2010. Government
employee Bireuen, especially in the ranks of the Regional Secretariat employees who occupy
government headquarters also always involved in every activity and in the mission of the organization in
the government.
Another factor of concern in addition to the organization's culture is job rotation. Job rotation is a
consequence of a change in organizational structure, job rotation policy aims to meet the need for human
resources to run the system from the office that has been modernized.
Based on observations, this time in the Aceh Government both at the provincial and district governments
and municipalities across the province of Aceh frequent job rotation. Surely perotasian process on
employee work will greatly affect the performance of employees. In Bireuen, as job rotation has become a
routine agenda of government. Rotation intentioned, namely that the addition of new capabilities in the
new working environment, gain new knowledge for employees, and reduce the saturation level in the
work environment long even be counterproductive if done too often, because the rotation is often done to
cause discomfort among employees. This phenomenon is visible in Bireuen District Government,
especially at the Regional Secretariat Bireuen. At least in the last five years, namely from the year 2007 -
2012 has occurred 25 times rotation job.
Based on the phenomenon and the above mentioned problems, the object used in this study is an
employee at the Regional Secretariat Bireuen. Objects have been selected Regional Secretariat Bireuen
is one part of the Government Bireuen, which is considered to be very heterogeneous, as a reflection of
the attitude of employees in Bireuen.

Proceedings of The 1th Almuslim International Conference on Science, Technology and Society (AICSTS) 2015
November 7-8, 2015, Bireuen, Indonesia
104
This study were conducted to: 1) determine the influence of organizational culture on employee
performance; and 2) determine the effect of job rotation on employee performance.
Literature
Organizational Culture
Organizational culture and values is a product of the interaction between the selection process, the
function of managerial, organizational behavior, structure and processes as well as the environment in
which the organization is located. It is as disclosed Robbins (2006). Organizational culture is a system of
shared meaning held by members of the organization that distinguishes the organization from other
organizations. Organizational culture is a system of values that is acquired and developed by the
organization and the pattern of habits and basic philosophy of its founder, which is formed into the rules
that are used as a guide in thinking and acting in achieving organizational goals. Cultures were grown to
become a strong organization capable spur towards better development.
Further, Robbins (2006) state Cultural change can be done by: (1) to make management behavior as a
model, (2) creating a new history, symbols and customs and beliefs in accordance with the culture you
want, (3) selecting, promoting and supporting employees, (4) determine the return process of
socialization to the values of the new, (5) to change the reward system with new values, (6) replace the
norms that are not written with formal rules or written, (7) scrambles sub-culture through the rotation
position, and (8) increased cooperation group.
Meanwhile Robbins (2006) also said that strong cultural organizations will have certain characteristics
that can provide attraction for individuals to join, think, act and behave in accordance with the values of
the organization. Correspondence between the organizational cultures with the values held by members
of the organization will lead to job satisfaction, thus encouraging individuals to survive in one company
and a career in the long term.
Based on some opinions on the above, it can be concluded that the organizational culture as a system of
meanings, values and beliefs held together in an organization that is a reference to action and
differentiate one organization to another organization. Organizational culture is also a system of shared
meaning held by members of the organization that distinguishes the organization from other
organizations. Organizational culture with regard to the context of organizational development, cultural
meaning is rooted in the history of the organization, is believed to be together.
Definition of Job Rotation
Rotation has an important role in the implementation of employment system of an organization. There are
at least three benefits or interests that may be drawn from the rotation, the official interests, the interests
of the concerned officials, and the public interest.
Robbins (2006) explained the strength of job rotation is able to reduce boredom and increase employee
motivation through diversification activities. Of course it also has indirect benefits for the organization,

Proceedings of The 1th Almuslim International Conference on Science, Technology and Society (AICSTS) 2015
November 7-8, 2015, Bireuen, Indonesia
105
because the employees with a wider range of skills that give management more flexibility in scheduling
work, adapt to change, and fill in the blanks personnel.
Furthermore, Maznah (2012) verivy the purpose of the rotation job (job rotation) is to give employees
more variety in his work. Job rotation to move employees from one particular job field to other fields.
Employees are trained and given the opportunity to do two or more jobs in a rotation system. With this job
rotation, the manager believes can stimulate the willingness and motivation of employees when providing
a broad perspective of employees in the organization. Another advantage in this job rotation is to increase
flexibility and simplify scheduling employees because the employees have been trained to do different
jobs.
From the above it can be concluded that the rotation has an important role in the implementation of
employment system of an organization. The strength of job rotation is able to reduce boredom and
increase employee motivation through diversification activities. Of course it also has indirect benefits for
the organization, remain at least 3 (three) benefits / interests that may be drawn from the rotation, the
official interests, the interests of the concerned officials, and the public interest. Then the more important
of the rotation is is to give more variation in the work of employees.
Understanding Employee Performance
In the theory of human resources, mentioned performance is a result that has been achieved than has
been done, is done in executing the work or task. Performance is the result or the overall success rate of
a person during a certain period in the duty compared to the various possibilities, such as the standard of
the work, the target or targets or criteria that have been determined in advance and have been agreed.
Performance is the translation of the word performance.
Robbins (2006) vervy employee performance is a function of the interaction between ability and
motivation. In a study of employee performance management there are things that need consideration
are important because individual performance of an employee in the organization is part of the
organization's performance and can determine the performance of the organization. Success or failure of
performance of employees who have achieved the organization will be affected by the level of
performance of individual employees or groups.
From the definition presented above it can be concluded that the performance of employees is a result
achieved by the employee in his job. It is obtained from a function of the interaction between ability and
motivation. Success or failure of performance of employees who have achieved the organization will be
affected by the level of performance of individual employees or groups.
Results
Profile of Respondents Research
a. Gender
Proceedings of The 1th Almuslim International Conference on Science, Technology and Society (AICSTS) 2015
November 7-8, 2015, Bireuen, Indonesia
106
Number of male respondents as many as 108 people (51.92%) while the number of female respondents
as many as 100 people (48.08%). The sampling of respondents by sex is almost balanced between men
and women suggests that employees who work at the Regional Secretariat Bireuen not distinguish
gender in the work, it is because it is in the field of administrative services.
b. Age
Civil Servants Regional Secretariat Bireuen respondents in this study is based on the age composition is
aged less than 30 years as many as 50 people (24.04%), aged 31-40 years as many as 109 people
(52.40%), aged 41-50 years were 38 people (18:27%), and age over 50 years as many as 11 people
(5:29%). That the largest percentage of respondents aged 31-40 years which at that age, including the
productive age group and still be able to work optimally because of physical conditions support so that a
positive impact on the work he does.
c. Rank / Group
Based on an analysis of the 208 respondents obtained data on rank / class of Civil Servants in the
Secretariat Bireuen that 107 people (51.44%) have a rank / class II / A-II / d, while the rank III / A-III / d 92
(44.23 %) and rank / class IV / A-IV / d as many as 9 people (4:33%).
d. The duration of work
Based on the results of the analysis of the characteristics of respondents by length of work indicates that
respondents who work period of less than five years as many as 83 people (39.90%), years 6-10 years as
many as 72 people (34.62%), 11-15 year tenure as many as 53 people (25.48%). This shows that in
general Bireuen District Secretariat employees already have a working life 6-10 years.
e. Educational level
Based on the analysis of the obtained data on 208 respondents last education level of respondents, the
highest composition of the Regional Secretariat staff Bireuen is S1 as many as 89 people (42.79%), then
SMU as many as 74 people (35.58%), D. III as many as 40 people (19:23 %) and S2 as many as 5
people (2:40%). This indicates that the majority of respondents in this study educated Strata-1 (SI). Level
of education like this allow the respondent's ability to answer the questions properly accountable.
f. Description of Respondents Statement Against Research Variables
To get an overview and information on the research variables used in this study. Description of the
variables descriptive statistics were used in this study includes the minimum, maximum, range, mean and
standard deviation of the dependent variable and independent variables. Descriptive statistics illustrate
the character of the sample used in this study. More descriptive statistics is shown in the following table:
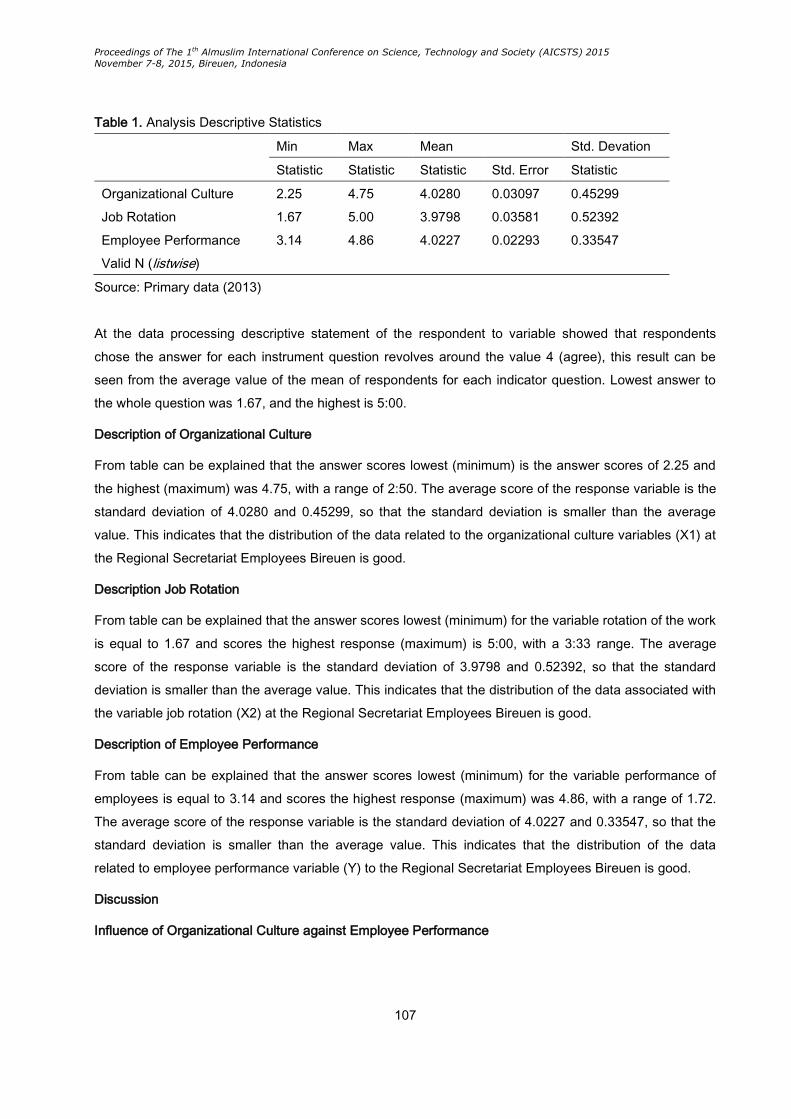
Proceedings of The 1th Almuslim International Conference on Science, Technology and Society (AICSTS) 2015
November 7-8, 2015, Bireuen, Indonesia
107
Table 1. Analysis Descriptive Statistics
Min Max Mean Std. Devation
Statistic Statistic Statistic Std. Error Statistic
Organizational Culture 2.25 4.75 4.0280 0.03097 0.45299
Job Rotation 1.67 5.00 3.9798 0.03581 0.52392
Employee Performance 3.14 4.86 4.0227 0.02293 0.33547
Valid N (listwise)
Source: Primary data (2013)
At the data processing descriptive statement of the respondent to variable showed that respondents
chose the answer for each instrument question revolves around the value 4 (agree), this result can be
seen from the average value of the mean of respondents for each indicator question. Lowest answer to
the whole question was 1.67, and the highest is 5:00.
Description of Organizational Culture
From table can be explained that the answer scores lowest (minimum) is the answer scores of 2.25 and
the highest (maximum) was 4.75, with a range of 2:50. The average score of the response variable is the
standard deviation of 4.0280 and 0.45299, so that the standard deviation is smaller than the average
value. This indicates that the distribution of the data related to the organizational culture variables (X1) at
the Regional Secretariat Employees Bireuen is good.
Description Job Rotation
From table can be explained that the answer scores lowest (minimum) for the variable rotation of the work
is equal to 1.67 and scores the highest response (maximum) is 5:00, with a 3:33 range. The average
score of the response variable is the standard deviation of 3.9798 and 0.52392, so that the standard
deviation is smaller than the average value. This indicates that the distribution of the data associated with
the variable job rotation (X2) at the Regional Secretariat Employees Bireuen is good.
Description of Employee Performance
From table can be explained that the answer scores lowest (minimum) for the variable performance of
employees is equal to 3.14 and scores the highest response (maximum) was 4.86, with a range of 1.72.
The average score of the response variable is the standard deviation of 4.0227 and 0.33547, so that the
standard deviation is smaller than the average value. This indicates that the distribution of the data
related to employee performance variable (Y) to the Regional Secretariat Employees Bireuen is good.
Discussion
Influence of Organizational Culture against Employee Performance
Proceedings of The 1th Almuslim International Conference on Science, Technology and Society (AICSTS) 2015
November 7-8, 2015, Bireuen, Indonesia
108
Organizational culture has a positive influence direction but no significant effect on employee
performance, thus it can be concluded that the culture of the organization but not significant positive
effect on employee performance.
The results of this study reinforce some of the results of previous studies, such as research conducted
Miswan, (2008) which showed that organizational climate affect the performance of lecturers by 1.3%.
That is the organizational climate showed a positive effect but not significant. Interpretation of the effect it
indicates a change in an employee's performance as a result of the influence of organizational climate is
not real.
The influence of positive and not significant between the culture of the organization with the performance
of employees at the District Secretariat Bireuen caused by organizational culture that formed today in the
Regional Secretariat Bireuen not yet have specific characteristics in the institutionalization of a culture
that is real and concrete, which can be understood or accepted by all employees as something that is
believed to be true value which is positive towards the development and progress of the organization.
Effect of Job Rotation against Employee Performance
Based on the results of the analysis found that the direction of rotation of the work has a positive and
significant influence on employee performance, thus it can be concluded that job rotation significantly
influence employee performance.
Results of this research generally supports much previous research, especially in terms of the direction of
a positive relationship and such studies that have been conducted Mansur (2009) showed that the
estimated parameters variable job rotation positive effect on employee performance.
Conclusions
1. Rotation direction of work has a positive and significant influence on employee performance. Plus
the value of job rotation on the performance of employees at the Regional Secretariat Bireuen
caused by the rotation of jobs capable of providing a change so that it is positive towards the
development and progress of employee performance.
2. Cultural organizations but not significant positive effect on employee performance. Then work
motivation was also not mediate organizational culture on employee performance in the Regional
Secretariat Bireuen.
References
Gibson, Ivannevic, Donnelly. 2000. "Organization", Fifth Edition, Jakarta: Erland.
Masrukhin and Waridin. 2006. "Effect of Work Motivation, Job Satisfaction, Organizational Culture and
Leadership on Employee Performance", Journal of Economics and Business, Vol. 7, No. 2

Proceedings of The 1th Almuslim International Conference on Science, Technology and Society (AICSTS) 2015
November 7-8, 2015, Bireuen, Indonesia
109
Maznah, Jasman J. Ma'Ruf, and Sofyan Idris. 2012. "The Influence of Neighborhood Organizations, Job
Satisfaction on Work Motivation and implication in Lhokseumawe State Polytechnic Employee
Performance", Journal of Management Sciences, UNSYIAH, Vol. 1, No. 1, in 2012.
Mourdoukoutas, Panos. 2009. "Job Rotation and Public Policy: Theory with Applications to Japan and the
USA," International Journal of Manpower, Vol.15.
Robbins, S.P. 2006. Organizational Behaviour, Issue 10, PT. Gramedia Group Index.

Proceedings of The 1th Almuslim International Conference on Science, Technology and Society (AICSTS) 2015
November 7-8, 2015, Bireuen, Indonesia
110
Role of Wage and Gross Domestic Product in Declining the Rate
of Unemployment in Indonesia
1*Khairil Anwar and 2Naufal Bachri
1Faculty of Economics and Business, University of Malikussaleh, Indonesia and PhD Student at
Economics of Syiah Kuala University, Indonesia
2Faculty of Economics and Business, University of Malikussaleh, Indonesia and PhD Student at
Management Science of Syiah Kuala University, Indonesia
*Corresponding Author:[email protected]
Abstract
This study aims to determine the effect of wages and gross domestic product (GDP)
toward the rate of unemployment in Indonesia in the period 2000-2013. The data used in
this research is secondary data about the Provincial Minimum Wage, GDP at constant
prices in 2000 according to the sector of business and open unemployment rate in
Indonesia. The method of data analysis used in the study is the multiple regressions. The
study concluded that simultaneously the variable of wages and GDP influence
significantly toward the rate of open unemployment. Partially variable of wages positive
and significantly influence toward the rate of the open unemployment but the variable of
Gross Domestic Product negative and significantly influence the rate of open
unemployment in Indonesia in 2000-2013.
Keywords: Unemployment, Wages, Gross Domestic Product
Introduction
Unemployment is a serious problem and become one of the major problems to be overcome by
developing countries. This may have an impact on the country's economy. Unemployment occurs as a
result of the lack of jobs that cannot absorb the entire workforce. The total population grow brings as a
result of the increase in the labour force every year. It means that the number of people seeking jobs will
increase and labour will also increase. Many workers are not able to be absorbed. It will cause
unemployment (Murniasih, 2014).
Indonesia is a country with a population very much. It will actually provide benefits for Indonesia if it is
able to run well. A lot of human resources must be used carefully so that it will produce quality goods and
Proceedings of The 1th Almuslim International Conference on Science, Technology and Society (AICSTS) 2015
November 7-8, 2015, Bireuen, Indonesia
111
services which in turn will increase state revenues. The quality human resource can be done by
increasing skills and improving education. The fact that a lot of human resource are not able to be
managed properly. The economy of Indonesia is in bad performance. The negative impact of human
resources is not well managed as the unemployed.
According to BPS (2014) From 2000 to 2006, the percentage of open unemployment rate continued to
rise significantly, namely in the unemployment rate by 6.08% in 2000 reach 10.28% in 2006, or for 6
years has increased by 4,20%. Of course, a fairly high unemployment rate is a burden of development
and can worsen the country's economy. Meanwhile in 2007 to 2013 the unemployment rate in Indonesia
began to decline significantly from 9.11% 2007 to 5.80%. It occurred because the government realized
that high unemployment will aggravate economic activity so that the various efforts such as increased
employment opportunities, the government's effort succeeded in lowering the unemployment rate. Yet still
the unemployment rate in Indonesia is still relatively high. Therefore, the government should make
greater efforts to reduce unemployment in order that the existing workforce can be absorbed.
The Government needs to avoid unemployment by taking into account factors that are strongly
associated with unemployment such as the Gross Domestic Product (GDP) and wages. GDP is the
market value of all final goods and services produced in a country during a certain period. GDP measures
the total income at the same time the total expenditure on various goods and services of an economy.
While GDP per capita measure of income and average expenditure per capita of the economy is
concerned (Mankiw, 2003).
Dornbusch (2004) explains that Okun's Law states that 1 additional point of unemployment weigh on 2
percent of GDP. Some related studies found mixed results, among others; Murniasih et al (2014) who
conducted the research in Bali found that GDP variable has positive and significant influence toward
unemployment. Research conducted by Kurniawan (2013) in Malang. The result of research that variable
of Gross Regional Domestic Product has a negative effect on unemployment. Variable of City Minimum
Wage has a positive effect on unemployment. Wijaya (2014) conducted a study on the use of data
Gerbangkertasusila years 2007-2012. The results obtained, a variable of minimum wage has a negative
correlation to the rate of unemployment. GDP variable has a positive relationship to the rate of
unemployment. Utomo (2013) said that the wage variable has a significant impact on unemployment in
Indonesia during the period 1980-2010. Mansur et al (2014) said that the variable of wage has a
significant negative impact on unemployment in the city of Manado.
Literature Reviews
Unemployment
BPS (2014), unemployment is someone who does not work but looking for work or are preparing new
venture. Besides unemployment can also be said of people not looking for work because of despair or
find it impossible to get a job (discourage workers) or people who are not looking for work because they
accepted to work or have a job but have not started to work.

Proceedings of The 1th Almuslim International Conference on Science, Technology and Society (AICSTS) 2015
November 7-8, 2015, Bireuen, Indonesia
112
According to Sukirno (2012) said that there are three types of unemployment based on the circumstances
that caused, among other things:
1. The frictional unemployment refers to unemployment caused by the actions of someone workers
to leave work and seek better employment or in accordance with his wishes.
2. Structural unemployment refers to the unemployment caused by structural changes in the
economy.
3. Unemployment conjuncture refers to unemployment caused by excess natural unemployment
and applicable as a result of a reduction in aggregate demand.
Marius (2004) stated that unemployment can be divided into three types, namely:
1. Open Unemployment is the labours that really do not have a job. Unemployment is happening
because it has not got a job when I have tried to the maximum and some are too lazy to find a job
or lazy to work.
2. Disguised Unemployment is unemployment that occurred because of too much labor for one unit
of work while reducing the work force to keep a certain amount does not reduce the amount of
production. Underemployment could also occur because someone who works not in accordance
with their talents and abilities, ultimately do not work optimally.
3. Under Unemployment are workers who do not work optimally because there is no job for a while.
Some say that the workforce is underemployed workers who work less than 35 hours a week or
less than 7 hours a day. For example, a construction worker who has completed work on a
project, to temporarily idle while waiting for the next project.
Marius (2004) added that there are seven categories of unemployment based on its causes, namely:
1. Frictional Unemployment refers to unemployment caused by the movement of people from one
region to another, from one job to another, and because of the different stages of the life cycle.
2. Structural Unemployment refers to unemployment is due to changes in the economic structure
that causes weakness in other areas of expertise. Example: An area that had an agricultural
(agriculture) into an industrial area, the agricultural sector will be unemployed workers.
3. Unemployment Cyclical refers to unemployment that relates to the conjuncture wave, namely the
existence of a recession or a slowdown in economic activity. Example: In a company while
advancing new labour needed for expansion. Conversely when the business losses continue,
there will be layoffs (Termination) or dismissal.
4. Unemployment Seasonal refers to unemployment that occurs because of the changing seasons.
Example: during the harvest season, farmers work hard, while previously many unemployed.
5. Unemployment Technology refers to unemployment relates to the use of technology tools that
more modern.
6. Political Unemployment refers to unemployment relates to government regulations that directly or
indirectly, lead to unemployment.
Proceedings of The 1th Almuslim International Conference on Science, Technology and Society (AICSTS) 2015
November 7-8, 2015, Bireuen, Indonesia
113
7. Unemployment Deflatoir refers to unemployment relates to the unavailability of jobs in the
economy as a whole, or because the number of workers exceeds the employment, then
unemployment arises.
The relationship among variables
The relationship between GDP and Unemployment
According to Okun's Law (Mankiw, 2003), there is a strong correlation and negative between the
unemployment rate and the Real GDP. If rate of unemployment increases 1%, it will weigh on GDP by
2%. If the GDP increase, the demand for goods and services will greater. It means that the company will
produce a lot of the goods and services. The increasing of production will increase the use of labour.
However, there is strong correlation between the national income and the use of labour.
The relationship between Wages and Unemployment
Kaufman and Hotckiss (1999) said described that there is relationship between the wages and the rate of
unemployment. The Labour will set the rate of the minimum wage at the rate of a certain wage. If the
wage is offered under the wage rate, the labour will refuse the wages. It will consequently lead to
unemployment. If the wage is set too low, it will result in high levels of unemployment. However, if the
wage increases and the cost are quite high, it will reduce the efficiently spending so that employers will
reduce labour in order to reduce production costs. This will result in an increase in unemployment.
Research Methods
This study uses secondary data collected and obtained in time series of the year 2000-2013. The
necessary data for this study are: (a) Data on the rate of unemployment in Indonesia during the period
2000-2013 were obtained from the website of BPS Indonesia (2014), (b) Data on the magnitude of the
national minimum wage in the period 2000-2013 were obtained from the website of BPS Indonesia
(2014), (c) Data on the amount of the Gross Domestic Product based on constant prices were obtained
from the website of BPS Indonesia (2014).
Methods of data analysis in the research used multiple linear regression analysis. In the study also test
several the classic assumptions include multicolinerity, autocorrelation and normality test. Besides that
the research tests the accuracy of the hypothesis as partial, simultaneous, correlation and determination.
The function of the multiple linear regression analysis in this study can be denoted as follows:
Unemployment = f (wages, GDP)........................................1)
The function can be transformed into a semi-log model equations are as follows:
UNEM = α + β1LnWG + β2LnGDP + e......................................2)
Where:
UNEM : Unemployment Rate
WG : Wages
GDP : Gross Domestic Product
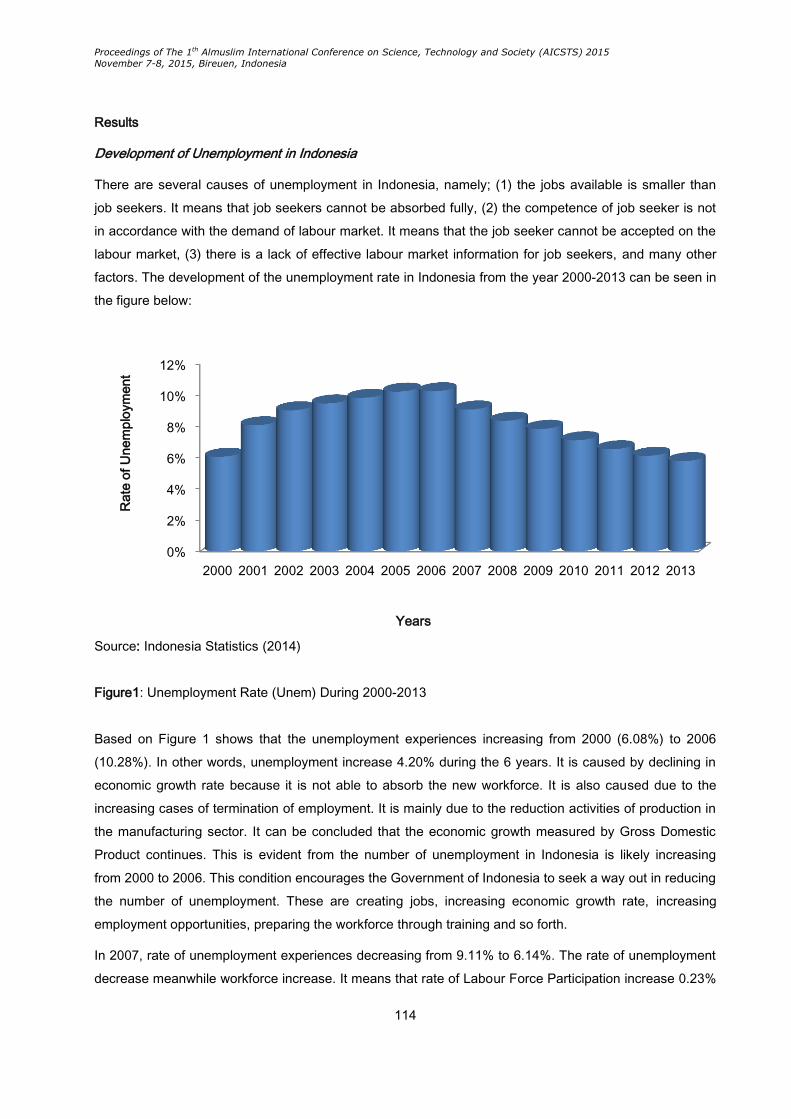
Proceedings of The 1th Almuslim International Conference on Science, Technology and Society (AICSTS) 2015
November 7-8, 2015, Bireuen, Indonesia
114
Results
Development of Unemployment in Indonesia
There are several causes of unemployment in Indonesia, namely; (1) the jobs available is smaller than
job seekers. It means that job seekers cannot be absorbed fully, (2) the competence of job seeker is not
in accordance with the demand of labour market. It means that the job seeker cannot be accepted on the
labour market, (3) there is a lack of effective labour market information for job seekers, and many other
factors. The development of the unemployment rate in Indonesia from the year 2000-2013 can be seen in
the figure below:
Source: Indonesia Statistics (2014)
Figure1: Unemployment Rate (Unem) During 2000-2013
Based on Figure 1 shows that the unemployment experiences increasing from 2000 (6.08%) to 2006
(10.28%). In other words, unemployment increase 4.20% during the 6 years. It is caused by declining in
economic growth rate because it is not able to absorb the new workforce. It is also caused due to the
increasing cases of termination of employment. It is mainly due to the reduction activities of production in
the manufacturing sector. It can be concluded that the economic growth measured by Gross Domestic
Product continues. This is evident from the number of unemployment in Indonesia is likely increasing
from 2000 to 2006. This condition encourages the Government of Indonesia to seek a way out in reducing
the number of unemployment. These are creating jobs, increasing economic growth rate, increasing
employment opportunities, preparing the workforce through training and so forth.
In 2007, rate of unemployment experiences decreasing from 9.11% to 6.14%. The rate of unemployment
decrease meanwhile workforce increase. It means that rate of Labour Force Participation increase 0.23%
0%
2%
4%
6%
8%
10%
12%
2000 2001 2002 2003 2004 2005 2006 2007 2008 2009 2010 2011 2012 2013
Ra
te o
f U
ne
mp
loym
en
t
Years
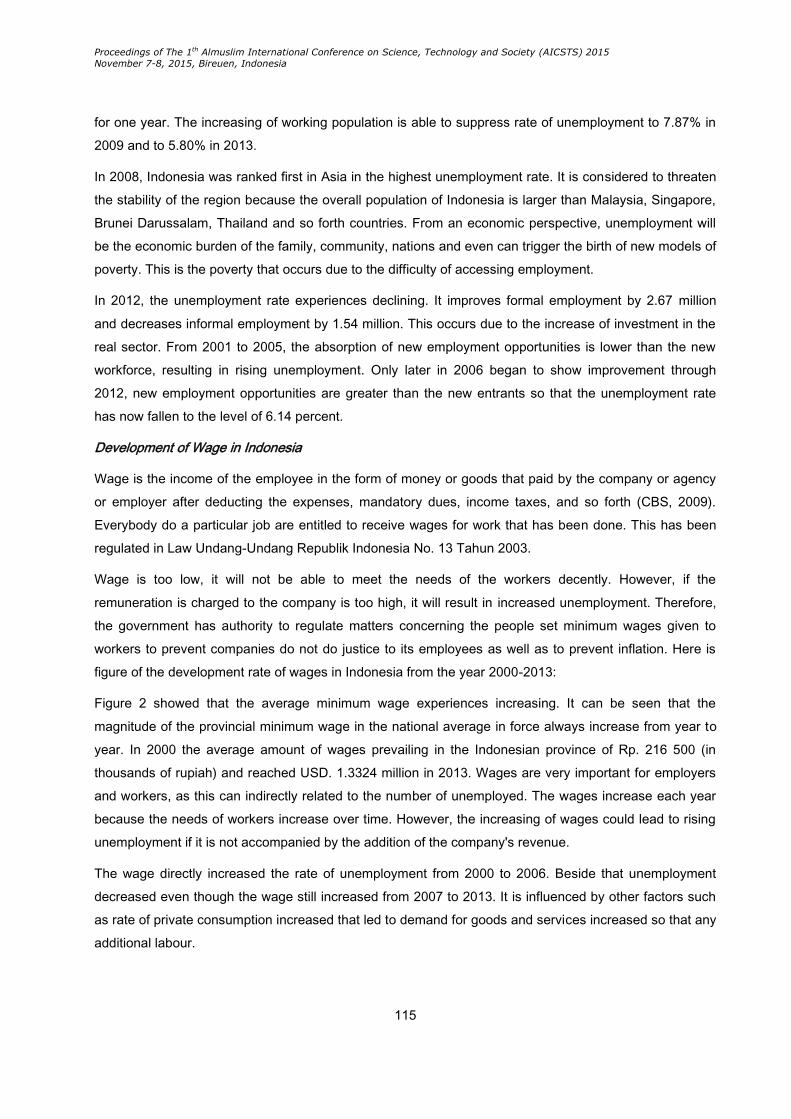
Proceedings of The 1th Almuslim International Conference on Science, Technology and Society (AICSTS) 2015
November 7-8, 2015, Bireuen, Indonesia
115
for one year. The increasing of working population is able to suppress rate of unemployment to 7.87% in
2009 and to 5.80% in 2013.
In 2008, Indonesia was ranked first in Asia in the highest unemployment rate. It is considered to threaten
the stability of the region because the overall population of Indonesia is larger than Malaysia, Singapore,
Brunei Darussalam, Thailand and so forth countries. From an economic perspective, unemployment will
be the economic burden of the family, community, nations and even can trigger the birth of new models of
poverty. This is the poverty that occurs due to the difficulty of accessing employment.
In 2012, the unemployment rate experiences declining. It improves formal employment by 2.67 million
and decreases informal employment by 1.54 million. This occurs due to the increase of investment in the
real sector. From 2001 to 2005, the absorption of new employment opportunities is lower than the new
workforce, resulting in rising unemployment. Only later in 2006 began to show improvement through
2012, new employment opportunities are greater than the new entrants so that the unemployment rate
has now fallen to the level of 6.14 percent.
Development of Wage in Indonesia
Wage is the income of the employee in the form of money or goods that paid by the company or agency
or employer after deducting the expenses, mandatory dues, income taxes, and so forth (CBS, 2009).
Everybody do a particular job are entitled to receive wages for work that has been done. This has been
regulated in Law Undang-Undang Republik Indonesia No. 13 Tahun 2003.
Wage is too low, it will not be able to meet the needs of the workers decently. However, if the
remuneration is charged to the company is too high, it will result in increased unemployment. Therefore,
the government has authority to regulate matters concerning the people set minimum wages given to
workers to prevent companies do not do justice to its employees as well as to prevent inflation. Here is
figure of the development rate of wages in Indonesia from the year 2000-2013:
Figure 2 showed that the average minimum wage experiences increasing. It can be seen that the
magnitude of the provincial minimum wage in the national average in force always increase from year to
year. In 2000 the average amount of wages prevailing in the Indonesian province of Rp. 216 500 (in
thousands of rupiah) and reached USD. 1.3324 million in 2013. Wages are very important for employers
and workers, as this can indirectly related to the number of unemployed. The wages increase each year
because the needs of workers increase over time. However, the increasing of wages could lead to rising
unemployment if it is not accompanied by the addition of the company's revenue.
The wage directly increased the rate of unemployment from 2000 to 2006. Beside that unemployment
decreased even though the wage still increased from 2007 to 2013. It is influenced by other factors such
as rate of private consumption increased that led to demand for goods and services increased so that any
additional labour.
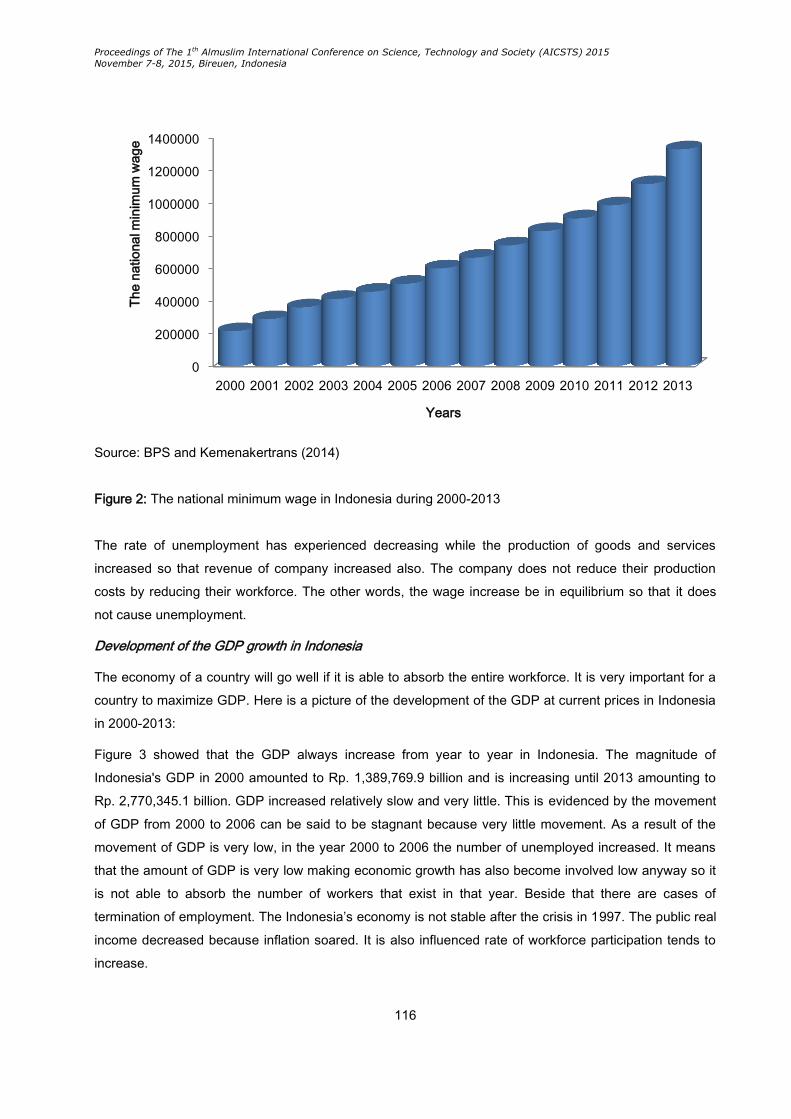
Proceedings of The 1th Almuslim International Conference on Science, Technology and Society (AICSTS) 2015
November 7-8, 2015, Bireuen, Indonesia
116
Source: BPS and Kemenakertrans (2014)
Figure 2: The national minimum wage in Indonesia during 2000-2013
The rate of unemployment has experienced decreasing while the production of goods and services
increased so that revenue of company increased also. The company does not reduce their production
costs by reducing their workforce. The other words, the wage increase be in equilibrium so that it does
not cause unemployment.
Development of the GDP growth in Indonesia
The economy of a country will go well if it is able to absorb the entire workforce. It is very important for a
country to maximize GDP. Here is a picture of the development of the GDP at current prices in Indonesia
in 2000-2013:
Figure 3 showed that the GDP always increase from year to year in Indonesia. The magnitude of
Indonesia's GDP in 2000 amounted to Rp. 1,389,769.9 billion and is increasing until 2013 amounting to
Rp. 2,770,345.1 billion. GDP increased relatively slow and very little. This is evidenced by the movement
of GDP from 2000 to 2006 can be said to be stagnant because very little movement. As a result of the
movement of GDP is very low, in the year 2000 to 2006 the number of unemployed increased. It means
that the amount of GDP is very low making economic growth has also become involved low anyway so it
is not able to absorb the number of workers that exist in that year. Beside that there are cases of
termination of employment. The Indonesia’s economy is not stable after the crisis in 1997. The public real
income decreased because inflation soared. It is also influenced rate of workforce participation tends to
increase.
0
200000
400000
600000
800000
1000000
1200000
1400000
2000 2001 2002 2003 2004 2005 2006 2007 2008 2009 2010 2011 2012 2013
Th
e n
atio
na
l min
imu
m w
ag
e
Years

Proceedings of The 1th Almuslim International Conference on Science, Technology and Society (AICSTS) 2015
November 7-8, 2015, Bireuen, Indonesia
117
Source: Website BPS Indonesia, 2014
Figure 3. Gross Domestic Product In Indonesia During 2000-2013
It means that the number of people who want to work has increased as well so it requires the availability
of new jobs. The government conducted stabilizing the economic circumstances in 2007 – 2013. The
GDP growth has been slightly higher increase so that at least it is able to reduce the rate of
unemployment.
The Classic Assumption Tests
Before analyzing the data further, it is necessary to be fully tested toward irregularities classical
assumption. These need to be done in order to meet the criteria of the estimation BLUE (Best, Linear
Unbiased, Estimator). Some deviation classical assumptions that need to be tested in this study are
normality test, multicolinierity test and autocorrelation test.
Normality test is analyzed by non-parametric test-Kolmogorov-Smirnov (KS). The results showed that
data are normally distributed residuals. Multicolinearity test showed that there is not multicolinerity among
independent variables. The other one is autocorrelation, the data residual random (random) or non-
occurrence of autocorrelation between residual value.
Model Estimation Results
This study uses multiple linear regression analyzes were used to examine whether or not the influence of
independent variables on the dependent variable. The independent variable in this study is wages and
0
500000
1000000
1500000
2000000
2500000
3000000
2000 2001 2002 2003 2004 2005 2006 2007 2008 2009 2010 2011 2012 2013
GD
P
Years

Proceedings of The 1th Almuslim International Conference on Science, Technology and Society (AICSTS) 2015
November 7-8, 2015, Bireuen, Indonesia
118
GDP, while the dependent variable is unemployment by using a semi-log regression model. Model
estimation results as shown in Table 1 below:
Table 1. Regression Analysis
Variabel Independen Koefisien Regresi (α) Standar
Error t Sig. t F Sig. F
Konstanta 318,025 32,902 9,666 0,000
47,620 0,000 LnWG 12,893 1,569 8,218 0,000
LnGDP -33,268 3,675 -9,052 0,000
R
R2
Adjusted R2
ttabel
Ftabel
= 0,947
= 0,896
= 0,878
= 1.796
= 3.982
Based on the estimates of the analysis results shown in Table 1, the constant that is worth 318.025 has
meaning if wages and GDP variables held constant, the unemployment in Indonesia amounted to
318.025%. Then the value of the variable wage (WG) has a coefficient of 12.893 means that if wages
increased by 1%, the open unemployment rate will also be increased to 12.893%. Furthermore, -33.268
GDP variable coefficient means that the increase in GDP increased by 1% would be able to lower the
open unemployment rate amounted to 33.268%.
Testing Statistics
Goodness of Fit Test
The goodness of fit of model can be seen from the correlation and can also be used the coefficient of
determination (R2). The coefficient of determination (R2) is a number that gives the proportion or
percentage of the total variation in the dependent variable (Y) which is explained by the independent
variable (X) (Gujarati, 2006). The coefficient of determination is between zero and one. R2 has small
value means the ability of the independent variables in explaining the variation of the dependent variable
is very limited. A value closes to one means of independent variables provide almost all the information
needed to predict the variation of the dependent variable (Ghozali, 2012).
Based on the test results obtained by the R value of 0.947, which means that there is a strong
relationship among the independent variables, namely wages and GDP toward the dependent variable is
the rate of open unemployment. Furthermore, to determine the effect of the variable wages and GDP to
variable rate of open unemployment in Indonesia can be seen in the value of R2. From the test results
obtained R2 value of 0.896. It means that 89.6% of the variation changes in the rate of unemployment is
influenced by variations in wages and GDP while the remaining 10.4% is influenced by other variables
outside the variations of this research model.
Proceedings of The 1th Almuslim International Conference on Science, Technology and Society (AICSTS) 2015
November 7-8, 2015, Bireuen, Indonesia
119
Partial Test
The t statistical tests conducted to show the influence of an independent explanatory variable individually
or in explaining the variation of the dependent variable (Ghozali, 2012). Based on the test results of the
wage variable has a tanalysis value of 8.218 with significant at α 1%. It indicates that wages are positive and
significant impact on the rate of unemployment in Indonesia. Furthermore, GDP variable has a tanalysis
value of 9.052 significant at α 1%. It indicates that the GDP is negative and significant impact on the open
unemployment rate in Indonesia.
Simultaneous Test
Based on the results of tests that have been carried out simultaneous showed that the Fanalysis value of
47.620 with significant at α 1%. It indicates that wages and GDP simultaneously significant impact on the
rate of open unemployment in Indonesia.
Discussions
Based on the partial testing, the variables wage significant impact on the rate of open unemployment in
Indonesia. Results of this study are consistent with the theory of Mankiw (2003). The theory said that the
curve of equilibrium wage rate explains that if wages imposed is above the equilibrium level, the quantity
of labour supplied will increase while the demand for labour will fall. The excess supply of labour reflects
the occurrence of unemployment. In addition, research is also consistent with the theory described
Kaufman and Hotckiss (1999). They said that if viewed from the side of the employer or company, the
wage increases and the cost is quite high, it will reduce the efficiency of spending so that employers
would take the policy of downsizing working to reduce production costs.
This will result in an increase in unemployment so that it can be concluded that increasing the wage rate
will increase the rate of open unemployment. Results of authors are consistent with previous research
that conducted by Murniasih (2014), Kurniawan (2013) and Utomo (2013). It has the opposite result to the
research conducted by Wijaya (2014) and Mansur (2014). It is because when the excess supply of labor
that led to declining demand for labour in the formal sector when minimum wage increases, the excess
supply of labour to migrate to the informal sector so that the open unemployment rate decreased.
The variable of GDP significantly influences the rate of open unemployment in Indonesia. The results are
consistent with the opinion of economists that said that to reduce unemployment, economic growth must
be a minimum of 7% annually. The economy of the country will go well and the country would prosper if it
is able to absorb the entire workforce. That is to push the unemployment rate then the entire existing
supply must be able to be absorbed by the labour market. A country will be able to absorb all the labour
force each year when economic growth is high. Improving economic growth of a country is reflected in
increasing GDP is earned by the country annually. In other words, increasing GDP would be able to
absorb the available labour supply so that to reduce the rate of unemployment.
Proceedings of The 1th Almuslim International Conference on Science, Technology and Society (AICSTS) 2015
November 7-8, 2015, Bireuen, Indonesia
120
Results of this study are also consistent with Okun's Law (Mankiw, 2003) which suggests that there is a
strong correlation between the rate of unemployment and the real GDP. There is a negative relationship
between the rate of unemployment and the real GDP. Each of the 1 percent increase in rate of
unemployment in a country, it will weigh on GDP by 2 percent. It means that if the GDP has increased,
the demand for goods and services is greater so that the goods and services greatly that will be produced
by the company.
Increasing production is done will increase the use of labour. Thus, there is a strong relationship between
the national income/GDP and the use of labour. If the national income increases, the use of labour also
increases in the economy.
Effect of GDP on unemployment is also consistent with previous studies conducted by Kurniawan (2013),
but not in line with Murniasih’s research (2014) and Wijaya (2014). They found that the GDP positive and
significant impact on unemployment. This happens because of the economic growth in the regions they
studied oriented capital intensive so many companies that reduce the cost of inputs to obtain the
maximum benefit either by reducing human labour and replace it with technology.
Conclusions
The result of linear regression showed that increasing wage 1% will increase the rate of open
unemployment amount to 12.893%. An increase in GDP of 1% would be able to lower the open
unemployment rate amounted to 33.268%. From the results of correlation, there is a strong relationship
between the independent variables (wages and GDP) and the dependent variable (unemployment rate) of
94.7%. Furthermore, result of determination test showed variations in changes in the rate of
unemployment is influenced by variations in wages and GDP amounted to 89.6%.
The results of hypothesis testing showed that the wages positive and significant impact on the rate of
unemployment in Indonesia. Furthermore, the GDP is negative and significant impact on the rate of
unemployment in Indonesia. Simultaneously wages and GDP significant influence toward the rate of open
unemployment in Indonesia in 2000-2013 with α = 0.01.
References
BPS. 2014. Konsep Produk Domestik Bruto. http://www.bps.go.id/menutab.php Diunduh Tanggal 7
Desember 2014.
BPS. 2014. Produk Domestik Bruto Atas Dasar Harga Konstan 2000 Menurut Lapangan Usaha Tahun
2000-2013. http://www.bps.go.id/tab_sub/ view.php Diunduh Tanggal 1 Desember 2014.
BPS. 2014. UMP Rata-Rata Nasional Tahun 1994-2007. http://www.bps.go.id/ tab_sub/view.php Diunduh
Tanggal 1 Desember 2014.
Dornbusch, Rudiger. Stanley Fischer dan Richard Startz. 2004. Makroekonomi. PT. Jakarta. Media
Global Edukasi.

Proceedings of The 1th Almuslim International Conference on Science, Technology and Society (AICSTS) 2015
November 7-8, 2015, Bireuen, Indonesia
121
Feriyanto, Nur. 2014. Ekonomi Sumber Daya Manusia Dalam Perspektif Indonesia Cetakan ke-1.
Yogyakarta. UPP STIM YKPN.
Ghozali, Imam. 2012. Aplikasi Analisis Multivariate Dengan Program IBM SPSS 20. Semarang. Badan
Penerbit Undip.
Gujarati, Damodar N. 2006. Dasar-dasar Ekonometrika Jilid I. Jakarta. Erlangga.
Kaufman, Bruce E dan Julie L. Hotchkiss. 1999. The Economics of Labor Markets Fifth Edition. The
Dryden Press.
Kurniawan, Roby Cahyadi. 2013. Analisis Pengaruh PDRB, UMK, dan Inflasi Terhadap Tingkat
Pengangguran Terbuka di Kota Malang Tahun 1980-2011. Jurnal Ilmiah. Malang. Universitas
Brawijaya.
Mankiw, N.Gregory. 2003. Pengantar Ekonomi Edisi Kedua Jilid 2. Jakarta. Erlangga.
Mansur, Nirmala. Daisy Engka dan Steeva Tumangkeng. 2014. Analisis Upah Terhadap Pengangguran
Di Kota Manado Tahun 2003-2012. Jurnal Berkala Ilmiah Efisiensi Volume 14 Nomer 2. Manado.
Universitas Sam Ratulangi.
Marius, Jelamu Ardu. 2004. Memecahkan masalah Pengangguran di Indonesia. Makalah Pada
Pengantar Falsafah Sains. IPB.
Murniasih, Ni Kadek. Ketut Dunia dan Made Ary Meitriana. 2014. Pengaruh Nilai PDRB, Tingkat Upah
dan Tingkat Inflasi Terhadap Pengangguran Terbuka Provinsi Bali Tahun 2003-2012. Jurnal
Jurusan Pendidikan Ekonomi Volume 4 Nomer 1. Universitas Pendidikan Ganesha. Singaraja.
Sukirno, Sadono. 2012. Makroekonomi Teori Pengantar Edisi ke-1 Cetakan ke-21. PT. Jakarta. Raja
Grafindo Persada
Utomo, Fajar Wahyu. 2013. Pengaruh Inflasi Dan Upah Terhadap Pengangguran Di Indonesia Periode
Tahun 1980-2010. Jurnal Ilmiah. Malang. Universitas Brawijaya.
Wijaya, Radewa Rizki Mirma. 2014. Pengaruh Upah Minimum, PDRB, Dan Populasi Penduduk Terhadap
Tingkat Pengangguran Terbuka (Studi Kasus Gerbangkertasusila Tahun 2007-2012). Jurnal
Ilmiah. Malang. Universitas Brawijaya.
Proceedings of The 1th Almuslim International Conference on Science, Technology and Society (AICSTS) 2015
November 7-8, 2015, Bireuen, Indonesia
122
Effect of Competence, Task Attractions, Situational Factors
toward Employee Motivation and Performance in Central
Administration of the University of Almuslim
1*Nova, 2Megasari Gusandra Saragih
1National College of Economics Bireuen
2Islamic Institute Almuslim Aceh
Corresponding Author: [email protected]
Abstract
This research aims to identify the effect of competence, task attractions, situational
factors to motivation and performance of employee at central administration of the
University of Almuslim. There are 150 employees as samples of research. The analytical
tool used Structural Equation Modeling (SEM) using AMOS device-20 (Analysis of
Moment Structure). The results showed that the competence, task attractiveness,
situational, have positive and significantly effect toward motivation of employees at
central administration of the University Almuslim. Motivation has a positive and
significantly effect toward performance of employees at central administration of the
University Almuslim Matangglumpangdua. Motivations mediate with partial mediation the
effect of competence, task attractiveness, and situational factors toward performance of
employees at central administration of the University Almuslim Matangglumpangdua.
Keywords: Competence, Task Attractiveness, Situational Factors, Motivation,
Performance.
Introduction
Today employees are viewed as one of the important organizational asset and need to be developed to
support the survival of the organization. In order to create high employee performance, organizations
need to improve the competence of employees, giving a load tasks in accordance with their expertise in
order to increase the attractiveness of their duties, as well as situational factors that the organization is
always ready to support each employee. Organizational performance is expected to increase with the
employee's performance.

Proceedings of The 1th Almuslim International Conference on Science, Technology and Society (AICSTS) 2015
November 7-8, 2015, Bireuen, Indonesia
123
Administrative center is the venue for registration activities (recording), computing (processing),
communication and information. The activity was organized to achieve administrative center of which is
provide particulars complete and accurate, creating a harmonious working atmosphere and overall,
achieve administrative work effectively and efficiently and provide optimal service to all stakeholders
exists, be it employee, lecturers, students and the community to improve the performance of the
organization, which in turn gives a good image of the organization itself later. Thus was the case with the
University Almuslim Matangglumpangdua. The rise in the organization's performance is expected to give
a good image of the organization.
This study aims to prove whether employees at the Central Administration of the University of Almuslim
Matangglumpangdua also experienced the same thing as the alleged Fessler (2003), when the task was
initially perceived attractive, incentive-based compensation will decrease the appeal on duty, so its
performance will also be lower than when the duty is felt attractive with fixed compensation. And also the
study of Arniati (2005) also found the same thing with Fessler (2003) only in research Arniati is unable to
obtain empirical evidence about the situational factors (control) suspected that the subject controlled, are
not interested in the job-based compensation incentives, performance will be better than the subjects that
are not controlled, interested in the task and the fixed compensation. What distinguishes this study with
research Fessler (2003) and Arniati (2005), namely the addition of variable competence and motivation
variable in this research.
Motivated of the phenomenon and the results of previous studies, the researchers are interested to test
the extent to which the "Influence of Competence, Fascination task, Situational Factors Employee
Motivation and Performance at the University of Central Administration Almuslim Matangglumpangdua".
Research Methods
The object of this research is the employee at the Central Administration of the University of Almuslim
Matangglumpangdua status as permanent employees. And this research is located at Jl. Almuslim
Matangglumpangdua Peusangan District of Bireuen. The study was conducted at the beginning of April
2014.
The population in this study were all employees at the Central Administration of the University of
Almuslim Matangglumpangdua totaling 158 people. In SEM ideal number of samples between 100-200
(Hair et al., 2009) and also should consider the number of existing indicators in the model. Hair et al.
(2009) further says for the determination of the number of samples may amount to 5-10 on the number of
indicators. In this research, there are 29 indicators so that the sample size could range between 145-290
respondents. The number of samples is determined by multiplying the number of indicators to 5 and the
total sample of 29 x 5 = 145 respondents. Since the total population is 158 employees, then the sample is
rounded to 158 respondents in case the occurrence of data outliers. Sampling using census method, ie
the entire population sampled in the study (Usman & Akbar, 2008).

Proceedings of The 1th Almuslim International Conference on Science, Technology and Society (AICSTS) 2015
November 7-8, 2015, Bireuen, Indonesia
124
The variables that will be observed in this study is limited as follows: competence (X1), the appeal of the
task (X2) and situational factors (X3) as the independent variable and motivation (Y) and performance (Z)
as the dependent variable.
Form a flowchart full model with mediating variables of this study are shown in Figure 1 below:
Figure 1. Research Models
Results and Discussion
Validity Test Instruments
1. Test Validity
In SEM validity testing performed by Confirmatory Factor Analysis (CFA) each construct is to see the
loading factor value of each indicator. An indicator is said to be valid when the loading factor value for
each item or indicator is the greater of 0.50 although ideally is 0.70 or higher (Ghozali, 2013; and Hair et
al, 2010).
1. Variable CFA Competency Test
To see if the construct of competence throughout the indicator variable is valid then tested the validity as
in Figure 2 below:
Figure 2. CFA Variabel Kompetensi

Proceedings of The 1th Almuslim International Conference on Science, Technology and Society (AICSTS) 2015
November 7-8, 2015, Bireuen, Indonesia
125
2. Fascination CFA test Variable Tasks
To see if a variable constructs Fascination indicator Task valid throughout the validity test as in Figure 3
below:
Figure 3. CFA Variable Task Fascination
3. CFA test variables Situational Factors
To see if the construct entire indicator variables Situational Factors valid then tested the validity as in
Figure 4 below:
Figure 4. Variable CFA Situational Factors
4. Variable CFA Test Performance
To see if the construct of variable performance indicator valid throughout the validity test as inFigure 5
below:
Figure 5. CFA Variable Performance
5. CFA Test Variables Motivation
To see if the construct of motivation throughout the indicator variable is valid then tested the validity as in
Figure 6 below:

Proceedings of The 1th Almuslim International Conference on Science, Technology and Society (AICSTS) 2015
November 7-8, 2015, Bireuen, Indonesia
126
Figure 6. Variable CFA Motivation
2. Test Reliability
Reliability test results can be seen in Table 1 and Table 2 below:
Tabel 1. Uji Reliabilitas Construct Reliability dan Variance Extracted
NO Variabel
Uji
Conclusion Construct Reliability Variance Extracted
Cut Of
Value
Value Cut Of
Value
Value
1 Efektivitas Kerja 0,70 0,789 0,30 0,386 Reliabel
2 Motivasi 0,70 0,753 0,30 0,381 Reliabel
3 Komunikasi 0,70 0,726 0,30 0,348 Reliabel
4 Lingkungan
Kerja
0,70 0,825 0,30 0,402 Reliabel
5 Kepemimpinan 0,70 0,739 0,30 0,365 Reliabel
Based on the data as shown in Table 1 that can be explained that the overall value of CR is above or
greater than 0.70 and the value of VE is above 0.30. Thus the whole construct in this study is reliable so
that the model established is eligible to be tested in the next stage.
Tabel 2. Correlation Between construct and value Dicriminant Validity
Kompetensi Daya Tarik Tugas Faktor Situasional Motivasi Kinerja
0,589 0,634 0,604
Motivasi 0,193 0,445 0,399 0,617
Kinerja 0,175 0,290 0,175 0,414 0,621
Based on Table 2 clearly shows that the latent constructs each have Discriminant Validity good, it can be
seen from the square root of VE (√VE) each latent constructs a higher value than the value of the
correlation between the constructs. Like the Discriminant Validity value to construct the competence of
0.589 is greater in value than the correlation between motivation.193 with a .175 performance. So is the
value Discriminant Validity to construct the appeal of 0.634 tasks of greater value than the correlation
between motivation 0.445 to 0.290 performance. Validity Discriminant value to construct situational factor
Proceedings of The 1th Almuslim International Conference on Science, Technology and Society (AICSTS) 2015
November 7-8, 2015, Bireuen, Indonesia
127
of 0.604 is greater in value than the correlation between motivation 0.399 to 0.175 performance. And the
last is the value Discriminant Validity of 0.617 to construct motivation is greater than the correlation value
is equal to 0.414 performances.
Testing Assumptions SEM
1. Sample Size
In the SEM analysis, appropriate sample size is between 100-200 (Hair et al., 1999). The entire
questionnaire distributed as many as 158 questionnaires had been returned by the respondent and the
whole are in good condition and can be treated. After the process of analyzing data using devices AMOS-
20 with SEM models include 8 (eight) data outliers (data that is extreme or very different from other data),
so that the data or samples x should be excluded from the number of samples, thus the number of
samples remaining as many as 150 samples.
2. Normality Test Data
Based on the data as shown in Table 5:16 that the critical ratio value of skewness none univariate values
that are outside the range of values ± 2.58. It can be concluded overall univariate data are normally
distributed, as well as multivariate kurtosis value of the critical ratio also were within ± 2.58 that is equal to
-, 359 then it can be concluded with both univariate and multivariate data in this study are normally
distributed.
3. Outlier Test Data
Figures extreme (outliers) is an observation that appears to value the extreme-value either univariate or
multivariate, arises because of the combination of its unique characteristics and look very much different
from other observations (Ferdinand, 2002: 52). In this study, the test data outliers using Mahalanobis
Distance test, by comparing the value of p1 and p2. P1 and p2 values above 0.05 indicates no data
outliers again. Based on the analysis of data outliers seen that after the disposal of the entire data outlier
data has a value p1 or p2 above 0.05 is thus all the data in the study there are data outliers.
4. Multicolinearity and Singuliritas Data
Based on the test results show the value of Determinant multicolinierity of the sample covariance matrix
of 0.200 so far from 0, it can be said that there is no multicollinearity (perfect correlation or larger)
between the endogenous variables in this study.
Suitability Test Model
Test the suitability of the model is done through flowcharts in full equation models, the tests performed on
the entire both exogenous and endogenous variables that have been combined into one diagram (path)
intact through variance or covariance matrix and the full model is referred to as a research model. Full
model test carried out in two stages, the full model SEM prior to the modification and full model SEM after
modification.
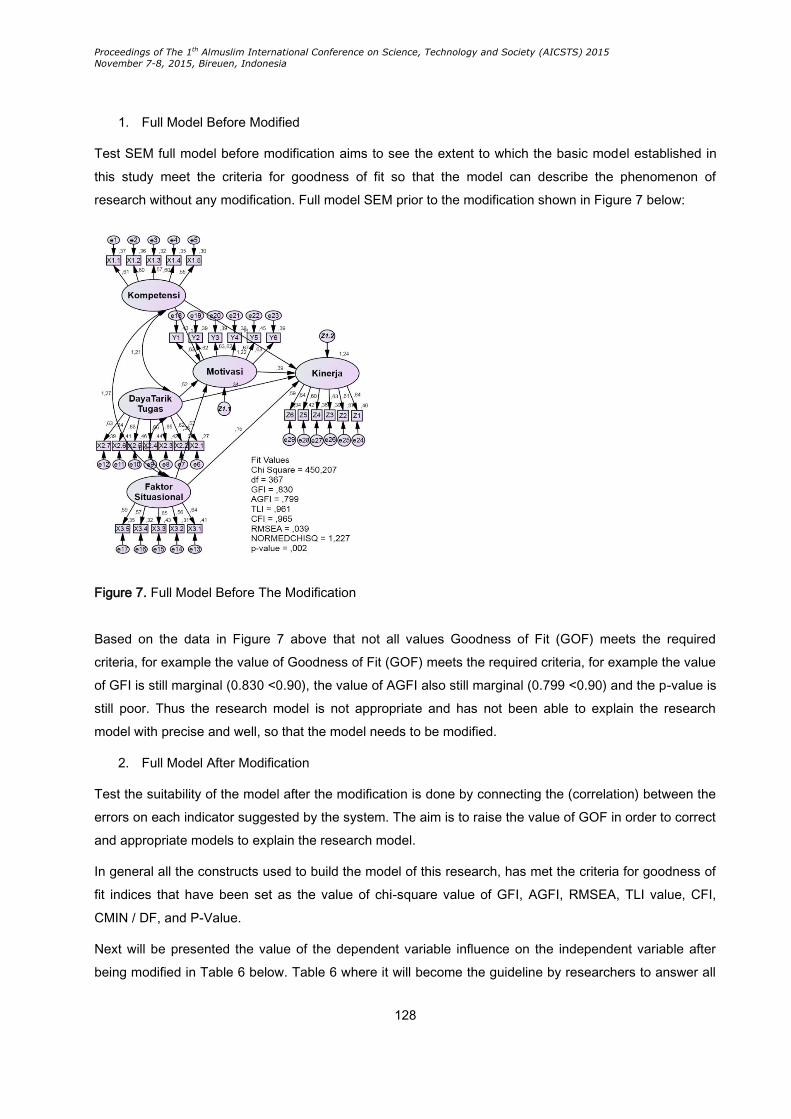
Proceedings of The 1th Almuslim International Conference on Science, Technology and Society (AICSTS) 2015
November 7-8, 2015, Bireuen, Indonesia
128
1. Full Model Before Modified
Test SEM full model before modification aims to see the extent to which the basic model established in
this study meet the criteria for goodness of fit so that the model can describe the phenomenon of
research without any modification. Full model SEM prior to the modification shown in Figure 7 below:
Figure 7. Full Model Before The Modification
Based on the data in Figure 7 above that not all values Goodness of Fit (GOF) meets the required
criteria, for example the value of Goodness of Fit (GOF) meets the required criteria, for example the value
of GFI is still marginal (0.830 <0.90), the value of AGFI also still marginal (0.799 <0.90) and the p-value is
still poor. Thus the research model is not appropriate and has not been able to explain the research
model with precise and well, so that the model needs to be modified.
2. Full Model After Modification
Test the suitability of the model after the modification is done by connecting the (correlation) between the
errors on each indicator suggested by the system. The aim is to raise the value of GOF in order to correct
and appropriate models to explain the research model.
In general all the constructs used to build the model of this research, has met the criteria for goodness of
fit indices that have been set as the value of chi-square value of GFI, AGFI, RMSEA, TLI value, CFI,
CMIN / DF, and P-Value.
Next will be presented the value of the dependent variable influence on the independent variable after
being modified in Table 6 below. Table 6 where it will become the guideline by researchers to answer all

Proceedings of The 1th Almuslim International Conference on Science, Technology and Society (AICSTS) 2015
November 7-8, 2015, Bireuen, Indonesia
129
the hypothesis proposed in this study. To see how big the influence of exogenous variables (competence,
attractiveness task and situational factors) on endogenous variables (motivation and performance) is
shown in Table 6.
Figure 8. Full Model After Modified
Tabel 6. Regression Weight Full Model after Modified
Estimate Std. Estimate S.E. C.R. P
Motivasi <--- DayaTarik_Tugas ,612 ,445 ,119 5,134 ***
Motivasi <--- Kompetensi ,217 ,193 ,043 5,041 ***
Motivasi <--- Faktor_Situasional ,395 ,399 ,073 5,424 ***
Kinerja <--- DayaTarik_Tugas ,402 ,290 ,094 4,275 ***
Kinerja <--- Motivasi ,418 ,414 ,073 5,697 ***
Kinerja <--- Kompetensi ,201 ,177 ,033 6,041 ***
Kinerja <--- Faktor_Situasional ,175 ,175 ,057 3,058 ,002
Discussion
1. Effect of Competence Motivation
Based on the analysis of data can be explained that the effect of variable competence of the motivation
was positive and significant coefficient standardized regression weight estimate of 0.193 (19.3%), the
probability value or significance of *** or <0.05 (significant) and value CR amounted to 5,041. Which
means that the null hypothesis is rejected and one accepted hypothesis. In other words that the

Proceedings of The 1th Almuslim International Conference on Science, Technology and Society (AICSTS) 2015
November 7-8, 2015, Bireuen, Indonesia
130
competence and significant positive effect on employee motivation at the centre of administration of
Almuslim University.
2. Effects of Task Motivation Fascination
Can be explained also that the variable duty attractiveness has a positive and significant effect on the
motivation. It can be seen from coefficient estimate standardized regression weight 0,445 (44.5%), the
probability value or significance of *** or <0.05 (significant) and a CR value of 5.134. Which means that
the null hypothesis is rejected and the second hypothesis is accepted. It can be concluded that the appeal
of a variable duty and significant positive effect on employee motivation at the centre of administration of
Almuslim University.
3. Situational Factors Influence Motivation Work
Variable situational factors have a significant positive influence on work motivation. It can be seen from
the value of standardized regression weight coefficient estimate of 0.399 (39.9%), the probability value or
significance of *** or <0.05 (significant) and a CR value of 5.424 greater than 2.58. Which means that the
null hypothesis is rejected and the third hypothesis is accepted. It can be concluded that the variables of
situational factors and significant positive effect on employee motivation at the University Almuslim
Matangglumpangdua Administration Center.
4. Effect on Performance Competence
Variable competency has a positive and significant effect on performance. It can be seen from the value
of standardized regression weight coefficient estimate of 0.177 (17.7%), the probability value or
significance of *** or <0.05 (significant) and a CR value of 6.041. Which means that the null hypothesis is
rejected and accepted hypothesis 4. It can be concluded that the competence variable positive and
significant impact on the performance of employees at the centre of administration of Almuslim University.
5. Effect on Performance Task Fascination
Likewise, the appeal of variable assignment has a positive and significant effect on performance. It can
be seen from the value of standardized regression weight coefficient estimate of 1.290 (29%), the
probability value or significance of *** or <0.05 (significant) and a CR value of 4.275. Which means that
the null hypothesis is rejected and accepted hypothesis 5. It can be concluded that the appeal of variable
assignment positive and significant impact on the performance of employees at the centre of
administration of Almuslim University.
6. Situational Factors Influence on Performance
Variable situational factors have a positive and significant effect on performance. It can be seen from the
value of standardized regression weight coefficient estimate of 0.175 (17.5%), the value or significance
probability of 0.002 (significant) and a CR value of 3.058. Which means that the null hypothesis is
rejected and accepted hypothesis 6. It can be concluded that the situational factor variable positive and
significant impact on the performance of employees at the centre of administration of Almuslim University.
Proceedings of The 1th Almuslim International Conference on Science, Technology and Society (AICSTS) 2015
November 7-8, 2015, Bireuen, Indonesia
131
7. Effect of Motivation on Performance
Motivation variable has a positive and significant effect on performance. It can be seen from the value of
standardized regression weight coefficient estimate of 0.414 (41.4%), the probability value or significance
of *** or <0.05 (significant) and a CR value of 5.697. Which means that the null hypothesis is rejected and
accepted hypothesis 7. It can be concluded that the motivation variable positive and significant impact on
the performance of employees in the centre of administration of Almuslim University.
Test Mediation
1. Motivation Mediating Relationships between Competence With Employee Performance On the
Central Administration of the centre of administration of Almuslim University.
Based on the calculation coefficient found a lane, lanes b, c lanes, and lane c 'significant. In other words,
work motivation variable partially mediates the relationship between competence mediation with the
performance of employees at the University of Almuslim Matangglumpangdua Administration Center.
2. Motivation Mediating Relationships Between Task Fascination on Employee Performance In
Central Administration of the University of Almuslim.
Based on the calculation coefficient found a lane, lanes b, c lanes, and lane c 'significant. In other words,
work motivation variable partially mediates the relationship between attractiveness mediation tasks with
the performance of employees at the centre of administration of Almuslim University.
3. Motivation Mediating Relationships between Situational Factors on Employee Performance On
the Central Administration of the University of Almuslim Matangglumpangdua.
Based on the calculation coefficient found a lane, lanes b, c lanes, and lane c 'significant. In other words,
work motivation variable partially mediates the relationship between situational factors mediation with the
performance of employees at the centre of administration of Almuslim University.
Conclusion
Based on the discussion that has been described, this research may provide some conclusions as
follows:
Competence variable direction and significant positive effect on employee motivation at the centre of
administration of Almuslim University. In other words, the higher the competency of employees, the
motivation of employees will also increase.
Variable appeal task has a positive and significant influence on employee motivation at the centre of
administration of Almuslim University. This means that the higher the attractiveness of the employee's
duties also increase the employee motivation.
Variable direction situational factors have a significant and positive effect on employee motivation at the
centre of administration of Almuslim University. This means that situational factors that exist within the
organization can influence employee motivation.
Proceedings of The 1th Almuslim International Conference on Science, Technology and Society (AICSTS) 2015
November 7-8, 2015, Bireuen, Indonesia
132
Variable competencies have a positive direction and significant influence on the performance of
employees at the centre of administration of Almuslim University. In other words, if the employee's
competency increases, the performance will also increase.
Variable appeal task has a positive and significant effect on the performance of employees at the
University of Almuslim Matangglumpangdua Administration Center. This means that the higher the
attractiveness of the employee's duties also increase the performance of employees at the University of
Almuslim Matangglumpangdua Administration Center, where the influence of the task appeal against very
strong performance (significantly).
Variable direction situational factors have a positive and significant effect on the performance of
employees at the University of Almuslim Matangglumpangdua Administration Center. This means better
situational factors that can support the performance of employees at the University of Almuslim
Matangglumpangdua Administration Center.
References
Arniati. 2005. Pengaruh Insentif Keuangan, Daya Tarik Tugas Dan Faktor Situasional Pada Kinerja.
Politeknik Negeri Batam.
Baron, R. M., & Kenny, D. A. 1986. The moderator-mediator variable distinction in social psychological
research: Conceptual, strategic, and statistical considerations. Journal of Personality and Social
Psychology, 51, 1173-1182.
Ferdinand, A. 2002. Structural Equation Modelling dalam Penelitian Manajemen, Badan Penerbit
Diponegoro.
Fessler, Nicholas J. 2003. Experimental Evidence on the Links among Monetary Incentives, Task
Attractiveness, and Task Performance. Journal of Management Accounting Research, 15, 161-
176.
Ghozali, Imam. 2013. Model Persamaan Struktural Konsep dan Aplikasi dengan Program Amos 21.0.
Cetakan V: Januari 2013. Universitas Diponegoro. Semarang.
Hair, J, Anderson, R, Tatham, R. Black, W. 2006. Multivariate Data Analysis, 6th ed, Pentice-Hall,
Englewood Cliffs, New Jersey, Prentice Hall.
Hair, J. F. JR., et al. 2009. Multivariate Data Analysis. Seventh Edition. Uper Sadle River. New Jersey.
PrenticeHall.
Usman, H., & Akbar, P. S. 2008. Metodologi Penelitian Sosial. PT. Bumi Aksara, Jakarta.

Proceedings of The 1th Almuslim International Conference on Science, Technology and Society (AICSTS) 2015
November 7-8, 2015, Bireuen, Indonesia
133
The Economic Community of ASEAN 2015 Trade Liberalization
and Investment Trade and Investment Realize Southeast Asia
Regional Economic Interaction
Sabri
Doctoral Students in Economics Science, Syiah Kuala University, Banda Aceh
Abstract
This study aimed to analyze the Asean Economic Community in 2015 Liberalization of
Trade and Investment Trade and Investment Realize Southeast Asia Regional Economic
Interaction. This study is a qualitative research. The analytical method used is descriptive
and qualitative, which analyze the data that has been collected to determine the MEA.
The ASEAN region has two great potential in global trade, which regulate global trade big
capital can freely enter into the realm of production, distribution and allocation of MEA
region. Cooperation between Indonesia-Malaysia-Thailand Growth Triangle (IMT-GT)
was established at the Ministerial Meeting (PTM) to-1 in Langkawi, Malaysia, on July 20,
1993. The IMT-GT is intended to enhance the prosperity and economic growth of the
communities in the border area countries IMT-GT-states.
Keywords: MEA, IMT-GT
Introduction
ASEAN was founded by five countries initiators, namely Indonesia, Malaysia, the Philippines, Singapore
and Thailand in Bangkok through the Bangkok Declaration. The foreign minister signatories to the
Bangkok Declaration when it was Adam Malik (Indonesia), Narsisco Ramos (Philippines), Tun Abdul
Razak (Malaysia), S. Rajaratnam (Singapore), and thanat khoman (Thailand).
Brunei Darussalam became the first member of ASEAN in five countries outside the initiator. Brunei
joined the ASEAN on January 7, 1984 (exactly a week after commemorating kemerdekannya). Eleven
years later, again received a new member of ASEAN, namely Vietnam who became the seventh member
on July 28, 1995. Two years later, Laos and Myanmar following the entry into ASEAN members, namely
on 23 July 1997. Although Cambodia is planning to become members ASEAN with Myanmar and Laos,
the plan had to be postponed because of the political problems in the country Cambodia. Even so, one
year later Cambodia finally became a member of ASEAN, namely on 16 December 1998.
Proceedings of The 1th Almuslim International Conference on Science, Technology and Society (AICSTS) 2015
November 7-8, 2015, Bireuen, Indonesia
134
This cooperation includes not only economic, but jugailmu fields of knowledge and technology, culture
and information, security and development as well as other transnational cooperation. ASEAN + 3 is
already doing some of meeting the energy security cooperation among ASEAN + 3 arise as a result of the
increasing energy needs of both regional and world level. The first meeting took place on the ladder of
June 9, 2004 in Manila, Philippines and ratify the Energy Security Forum program activities, Natural Gas
Forum, Oil Market Forum, Oil Forum and Renewable Energy Stockpliling Forum'Teks will be italicized and
many more meetings held ASEAN + 3.
There are several factors why ASEAN cooperation with the three countries, Japan. Diman role of Japan is
expected to take a more assertive role of the economy. On the other hand, the Japanese themselves look
passive in the role of political and military power because there is still a strong rival, namely the PRC.
Japan still considers that the sovereignty of a country as the most important factor. Japanese interest in
the region as we see now is: stability in the Southeast Asian region and the security of maritime / sea
lines of communication. The elite of the Japanese government appears to be vigilant and proactive to any
developments at regional level. Japan should give greater attention to regional stability. Moreover, Japan
itself psychologically certainly still feel as a great nation in the Asia Pacific region. In implementing
political role in the ASEAN region will arise differences of opinion with the United States. The most
effective instrument to deal with the US is the economy. More gentle attitude of the Japanese people is
needed to confront the US. Japan itself has planned a significant increase in its military strength. And
directly or indirectly, this will impact on the member countries of ASEAN in the form of increased arms
race in the region.
Dimensional contours of an increasingly complex multipolar require each ASEAN member country to be
adaptive to the geopolitical and geo-strategic dynamics of the region. Such as the improvement of military
capabilities PRC by the United States was seen as a threat. International Role PRC has been opened
wide to invite capital and technology from the West and Japan. PRC apparently will continue to maintain
their influence and strategic interests in the ASEAN region both politically and military. There are
concerns about the actions of China a few years ago in the Spratley Islands. Development institutions
stronger security in the region is needed. In the field of economic and industrial, step PRC encourage its
citizens to migrate from rural areas to cities to create 270 million jobs in the next 10 years should be
appreciated. The main interest of the PRC against Asian countries focused on rapid economic
development, and for the PRC, to be recognized as a great Asian powers are also very important. In a
novel published in 1997 that describes the global-scale war between the United States against the PRC,
we are told that the trigger was a PRC attack to the South China Sea and the military invasion of the PRC
to Vietnam. Although the novel is fictional, but still no correlation with conditions that occur at this time,
and there are similarities with what is disclosed by US political scientist Samuel Huntington in his book
The Clash of Civilization.
So also with South Korea, tidka undeniable that the economy of the country is very advanced and the
views of ASEAN partnership with South Korea goes smoothly as stated by the President of South Korea,
Proceedings of The 1th Almuslim International Conference on Science, Technology and Society (AICSTS) 2015
November 7-8, 2015, Bireuen, Indonesia
135
Lee Myung Bak in 2009 that trade in the ASEAN-South Korea has grown 11 times fold in the last two
decades to be worth US $ 90.2 billion last year, said Lee. The figure is even expected to increase to US $
150 billion in 2015. And plan to increasing better and besides doing cultural exchange and so on.
AFTA is the acronym stands for the ASEAN Free Trade Area. AFTA organization founded in 1992 in
Singapore at the time of the Summit (Summit) ASEAN to IV. AFTA is an agreement established by the
ASEAN countries to create a free trade zone. AFTA is deemed necessary in order to improve the
economic competitiveness of the planned ASEAN region achieved within 9 years (1993-2002). This plan
is executed by way of the elimination of the cost of tariffs (customs duties of 0-5%) and fee rates for the
member countries of ASEAN. In this way, hoping AFTA ASEAN becomes the production base of the
world and creating a regional market for ASEAN's 500 million population.
Cooperation between Indonesia-Malaysia-Thailand Growth Triangle (IMT-GT) was established at the
Ministerial Meeting (PTM) to-1 in Langkawi, Malaysia, on July 20, 1993. The IMT-GT is intended to
enhance the prosperity and economic growth of the communities in the border area countries IMT-GT-
states. Through the IMT-GT cooperation, the private sector continues to be driven into "engine of growth".
For this purpose has established a forum for entrepreneurs in the region called IMT-GT Joint Business
Council (JBC). JBC actively be involved in a series of SOM / MM IMT-GT annually.
Indonesian territory that became part of the IMT-GT cooperation is the provinces: Aceh, Bangka-Belitung,
Bengkulu, Jambi, Lampung, South Sumatra, Riau, Riau, North Sumatra and West Sumatra.
Asean Economic Community
ASEAN Economic Community (AEC) which is made in the Declaration of Concord II in Bali, Indonesia, on
7 October 2003; at the 12th Asean Summit in January 2007, the leaders of ASEAN countries reiterated
their strong commitment to accelerate the ASEAN community by 2015.
This leaves a big question mark until now for the experts and observers of economic, political, ecological,
and cultural soial in addressing critically ASEAN community. Especially for the sustainability of the
economic development of Indonesia, of which Indonesia is a member of the community. In general,
fundamental and profound questions that they are asking yourself is how economic and political
implications of Indonesia in the face of the MEA, how about the new leader (Jokowi-JK) in guarding the
MEA, and how the impact to the welfare of the Indonesian people.
MEA needs to know that the goal of regional economic integration by 2015. The MEA has the following
main characteristics: (a) a single market and a single production base, (b) a competitive economic region,
(c) region of equitable economic development, and (d) region fully integrated into the global economy.
To achieve these characteristics then in need of ASEAN Connectivity through the development of
infrastructure that connects the natural resources industry and trade which will facilitate international
investment to do business in this region.

Proceedings of The 1th Almuslim International Conference on Science, Technology and Society (AICSTS) 2015
November 7-8, 2015, Bireuen, Indonesia
136
Market Liberalization
Economic growth in Asia Pacific, especially in the ASEAN region can not be separated from the
development of international trade in the region. Trade liberalization that has been and will run is
expected to increase international trade in ASEAN countries, so as to boost economic growth in the
region. The liberalization of international trade makes the allocation and use of resources becomes more
efficient, increased prosperity, and economic growth to be faster. World economic environment
competitive world will increase the demand for labor and capital, so that resources will move to more
productive sectors in response to the increased demand.
ASEAN countries are members of WTO and has given a commitment to the Uruguay Round agreement
to run the trade liberalization. In addition, these countries also participate actively in APEC, which
keikutsertaanya voluntary and more a pattern of unilateral trade liberalization. Each APEC members can
submit their respective plans in the trade liberalization called IAP (Individual Action Plan). Free trades
scheme is another form of free trade area between ASEAN countries has also been established with the
name of AFTA. Thus, each ASEAN country to face at least three kinds of pressure to follow trade
liberalization.
Regional Economic Integration
In a global world, many see the economic integration between countries like EU, CER, CARICOM, AEC
and others indirectly represent developments with regard to interdependence. In general, all of those
mentioned adopting integration single market as their primary goal. The meaning of the single market
itself can not be described as an absolute into one definition of absolute, but the interpretation of each
member involved as to what is meant by single market will impact vital to the implementation of the
agreements that have been agreed (Lloyd, 2005).
The idea of the single market itself was first coined in the formation of the European Economic
Community (EEC) under the Treaty of Rome in 1957. Previously, this idea is called the common market
with a foundation called "four freedoms", namely the freedom to trade in goods, services, current capital,
and labor (Lloyd, 2005). All of which are also required under "common policies" in four specific areas
namely external trade, agriculture, transport, and competition. However, before the formation of the
concept of common market, prior to the date of May 9, 1950, Robert Schuman presented his ideas in a
European rescue missions that formed the European Coal and Steel Community (ECSC). ECSC was
signed on 18 April 1951 by six countries pinoir (the Inner Six) which is also a member of the Council of
Europe, namely: France, Germany, Belgium, Netherlands, Luxemburg, and Italy (Krueger, 1997). The
main objective the implementation of the ECSC is to eliminate various obstacles in the process of
production and trade in the sectors of coal and steel, as well as creating a common market a product,
labor, and capital from the sectors of coal and steel of the member countries can move freely ,
Then, because of the growing need finally born the Custom Union (CU) between these countries. CU is
an effort for the elimination of customs duties, import quotas, and other trade barriers among fellow
Proceedings of The 1th Almuslim International Conference on Science, Technology and Society (AICSTS) 2015
November 7-8, 2015, Bireuen, Indonesia
137
members. After obtaining the elimination of customs duties, import quotas there are still some obstacles,
including the movement of people and capital, and therefore made another deal that resulted in the
Common Market (CM) (Krueger, 1997). CM was made to free up the movement of trade goods, services,
capital and people among member countries (potential workers) until there are no obstacles at all. The
existence of a common market (CM) runs very good, therefore the member countries belonging to the
implementation feel the need to create a single market / Single Market (SM). The purpose of the
establishment of BC is to create an economic standardizing every element involved (capital, goods,
services, and human). However, the agreement proposal (White Paper) in 1985 not to use the term
"single market" but "fully unified internal market". Only later, set off thinking about the idea of the
establishment of the single market. In the end, the Single European Act in 1987 ratified the creation of the
Single Market. The term single market here means more than the common market, due to the single
market refers to "an area without internal frontiers in which the free movement of goods, persons,
services and capital is ensured" (Lloyd, 2005). More specifically, single the market is expected to shape
the market without discrimination to sources in the regional market, be it goods, services, and so forth.
The harmonization of the laws and regulations between member countries are also increasingly
enhanced in this regard.
ASEAN within the scope of the current form of the agreement is no longer in the form of economic
cooperation but has an economic integration. In the study of international trade theory known several
stages of regional economic integration. Standard integration scheme, in terms of the depth of integration
consists of: (1) a preferential trade agreement (PTA); (2) free trade area (FTA); (3) custom union (CU); (4)
single market; (5) monetary union; (6) political union (Balassa, 1962). Stages of economic integration is
tiered, from the simplest, namely the Preferential Trade Arrangement (PTA) to the most comprehensive is
political union (MIRUS and Rylska, tt). Within ASEAN, especially if associated with AEC as one part of
the ASEAN Community (ASEAN Community). Summit IX ASEAN in Bali in 2003 and a new history for
solidarity Southeast Asia with the achievement of the Bali Concord II, because it brings the three pillars of
cooperation, namely, ASEAN Economic Community (AEC), ASEAN Security Community and ASEAN
Socio-Cultural Community (Henry 2007). During the meeting resulted in the AEC blueprint that essentially
that ASEAN as a regional trade center that is integrated and can be aligned with the EU community.
In the blueprint is there are four priorities within the framework of AEC namely, the flow of goods and
services that are free (free flow of good services), regional economy competitive (competitive economic
region), development of economic equity (equitable economic development), integration of entering the
global economy (full integration into the global economy) and energy infrastructure, incentives, strengthen
FTZ (Free Trade Zone) and establishing special economic region, the expansion of access to financing,
simplification of the rules, as well as industrial development priorities and core competency areas (Henry,
2007). AEC aims to create a single market and production base characterized by free flow of goods,
services, investment, skilled labor and capital movement of goods more freely.
Proceedings of The 1th Almuslim International Conference on Science, Technology and Society (AICSTS) 2015
November 7-8, 2015, Bireuen, Indonesia
138
This can be interpreted as the full integration, except in the financial and monetary fields. Trade
consequences of participation in regional institutional actually depend on the extent to which it gives
effect to the other aspects of the domestic sphere, such as the purpose of political, social and others.
Here, some of the consequences of trade generally should be facing the country in participation. First,
successful regional integration is usually accompanied by a decrease in rates for all partners. Therefore,
regional trade figures may not rise despite the increased trading volume. Second, trade agreements
which facilitate the removal or reduction in trading costs than those associated with formal trade policies
(such as custom improves procedures) can stimulate trade from all sources. And three regional trade
agreements that generally include non-trade issues such as investment, services, and labor. This can
have important consequences for growth and income (siteresources.worldbank.org, tt).
Research Methods
This research is qualitative descriptive study that revealed the facts, circumstances, phenomena,
variables and circumstances that occurred while running the research and presenting what it is. Interpret
qualitative descriptive study and said that the data is concerned with the current situation, (McMillan &
Schumacher, 2003). In addition it is also some of the information obtained from various sources of media,
both newspapers and electronic media, all of which were applied to the interpretation applied in data
analysis methods.
The object of this study is data relating to the MEA, while the subject of this study is the electronic media.
The type of data used in this research is secondary data is data that is already available / researchers
indirectly through an intermediary medium
In a study carried out this, the authors used data collection techniques litereir or library research
(literature). Therefore, materials used in this study are:
1. Library materials, such as books containing the opinion of the experts or practitioners or things
that are closely related to the issues being studied.
2. Materials obtained from articles, journals, and the Internet that has relevance to the issues
intended as a support in compiling analytical sharpness.
The technique of data processing is done by collecting all the data in the can, making it easier for authors
to analyze the data and produce a conclusion relating to this study.
Results and Discussion
The ASEAN Economic Community or commonly abbreviated as MEA in a nutshell could be interpreted as
a form of economic integration of ASEAN, which means all the countries located area of Southeast Asia
(ASEAN) introduced a system of free trade. Indonesia and all other ASEAN countries (9 countries) have
agreed on the MEA agreement or which in English is ASEAN Economy Community or AEC.
Approximately two decades ago, precisely in December 1997 when the ASEAN Summit held in Kuala
Lumpur, Malaysia agreed upon the ASEAN Vision 2020 which essentially focuses on the establishment of
Proceedings of The 1th Almuslim International Conference on Science, Technology and Society (AICSTS) 2015
November 7-8, 2015, Bireuen, Indonesia
139
the ASEAN region that is stable, prosperous, and competitive with the growth ekomoni fair and equitable
and can reduce poverty and social inequality.
Some time later, in October 2003 when the ASEAN Summit in Bali, Indonesia stated that the ASEAN
Economic Community (AEC) became the goal of regional economic integration in Southeast Asia region
will be implemented in 2020. However, in fact, we know that this is the beginning of the year 2015 the
implementation of MEAs. This is in accordance with the Declaration of Cebu, which is one outcome of the
ASEAN Summit, the 12th of January 2007. At the summit of ASEAN leaders besepakat to transform
ASEAN into a region with free trade of goods maupunjasa, investment, professional workforce, and also
flow capital (funds).
Without felt no longer than 1.5 years Indonesia will enter a new world trade Asean countries. Trade
liberalization Southeast Asian countries that are part of the Asean Economic Community cooperation
(Asean Economic Community / AEC) will be effective December 31, 2015.
As is known, the AEC is part of the three pillars of cooperation Asean countries. Two other pillars are the
ASEAN Political-Security Community (APSC) and the ASEAN Social and Cultural Community (ASCC)
The question whether the AEC into opportunities or otherwise a threat?
The entry into force of the single market is not just going to happen the flow of goods, but also services,
investment, skilled labor and freer out in Asean countries. Under the deal, there are 12 priority integration
sectors namely, agriculture, automotive, electronics, fisheries, healthcare, rubber, ICT, textiles, forestry,
aviation, tourism and logistic services.
Seeing the cooperation experience of the free market, it turns out the Indonesian nation is not quite ready
to face it. For example, when the Indonesian government signed a contract with China in CAFTA (China
Asean Free Trade Area), was much surprised when the flood of products Bamboo Curtain country to the
Indonesian market.
Director of ASEAN Cooperation, Ministry of Foreign Affairs, Amri Suyudhie Iwan admitted three pillars
agreed Asean countries namely political-security, economic, social and cultural issues are critical and
directly affect economic integration.
Indonesian people are not surprised by this Asean free market. Do not let the case of CAFTA happen
again. Because the commitment Asean countries had actually been agreed upon since 2003, "he said.
If you see the potential of Indonesia in the world economy is quite large. Results of the study, Standard
Chartered Global Research said the magnitude of the working age population in Indonesia will support
economic growth in the medium and long term. This condition makes Indonesia a large domestic market
and abundant labor.
A large domestic market will protect Indonesia from external shocks and strengthen the national financial
resilience. While the transformation of labor from agriculture to other sectors with higher incomes will
strengthen the middle class that became the backbone of the 'super cycle' in Indonesia.

Proceedings of The 1th Almuslim International Conference on Science, Technology and Society (AICSTS) 2015
November 7-8, 2015, Bireuen, Indonesia
140
Meanwhile HSBC study specifically mention that Indonesia has the best demographic profiles among the
other ASEAN member countries sebagaidestinasi foreign investment. Among others the population of the
fourth-largest in the world, and continues to grow from 242 million people (2012) to 300 million (2050).
Availability of labor with a very large number of productive age population of 165 million people (2012) to
183 million people (2020). In addition, a dynamic domestic market by the number of middle class
continues to increase, the rich natural resources of interest to the export market. The level of domestic
demand is strong enough to grow above 6 percent of GDP in 2012-2013.
Seeing the great potential that it could be a big opportunity for the Indonesian people to fill the Asean
market. Conversely, if it is not ready to AEC, the people of Indonesia will be a big loss. Therefore, the
impact will take place instantly. In fact, Indonesia could become a great country that lost the market,
because the exploited of other countries. Even the population of Indonesia is very big into attractive
markets for foreign products. The signal is delivered Ambassador of the Republic of Indonesia to the
Kingdom of Thailand, Lutfi Rauf. According to him, the Board of Investment of Thailand has identified
Indonesia, Vietnam, and Myanmar as an investment target for the White Elephant Affairs entrepreneurs.
The Thai government continues to encourage the expansion of investment of Thai businesses, especially
SMEs to neighboring countries in the region. Board of Investment of Thailand has identified Indonesia,
Myanmar, and Vietnam as an investment destination.
Discussion
Related MEA, the ASEAN region has two great potential in global trade, which regulate global trade big
capital can freely enter into the realm of production, distribution and allocation of MEA region. Although
judging framework MEA is regionalism, but in practice later is globalism. Two potential ASEAN region in
the global trade is as a provider of raw materials (raw material) and the market for industrial production of
developed countries including the items required in the construction of infrastructure itself.
MEA is no longer viewed with the perspective of "threat" that would turn off the local products in the
regions. MEA instead should be viewed as an opportunity to introduce all the potential of Indonesia and
mission of trade, tourism and investment within ASEAN. There is should be skeptical in advance with the
inclusion of the era of MEA. I was skeptical analysis ASEAN infrastructure market which would seem to
be a very big fight industrialized nations to channel their debt and industrial products related to
infrastructure development.
How threatened not try? One that is expected to spur growth, development and empowerment in the
ASEAN region especially and Indonesia in particular. Before entering the era of MEA alone in 2015, has
been on the tourism potential of the islands in western Indonesia, the island Beetles in South Coastal
District, West Sumatra offered for sale online by overseas sites www.privateislandonline.com worth 1.88
million US dollars States or around Rp. 22 billion. (Source: Compass, Edition 27.08.2014.) How ironic is
not it? Not to mention the fate of trade and investment in Indonesia.

Proceedings of The 1th Almuslim International Conference on Science, Technology and Society (AICSTS) 2015
November 7-8, 2015, Bireuen, Indonesia
141
Dependensia refers to the theory put forward by Andre Gunder Frank, he made three hypotheses; (1) the
structure of the relationship between the countries of the metropolis developed with the satellite countries
backward, the metropolis will grow rapidly while the satellite will remain in the position of backwardness,
(2) poor countries are now becoming a satellite, the economy can grow and be able develop industrial
autonomous when it is not linked to the metropolis of the capitalist world, or the connection is very weak,
and (3) areas that are now very underdeveloped and is in a situation similar to the situation in the feudal
system are areas that in the past has nothing to do Strong with the metropolis of the international
capitalist system. These areas are the primary raw material export earners were displaced as a result of
international trade relations.
For MEA advantage of Southeast Asian Countries
Recent research from the World Labour Organization, or ILO mentions the opening of labor markets to
bring great benefits. Besides being able to create millions of new jobs, these schemes can also improve
the welfare of 600 million people living in Southeast Asia. In 2015, the ILO specifies that the demand for
professional workforce will increase by 41% or about 14 million. While the demand for labor middle class
will be up 22% or 38 million, while the labor force increased by 24% a low level, or 12 million.
Competitiveness and Prosperity
In order to establish the ASEAN Economic Community (AEC) in 2015, ASEAN countries need to take the
level of competitiveness of the city related to community economic development and investment
opportunities. Competitiveness of the city will increase the comfort for the entry of businessmen to the
ASEAN countries. Based on the order of US Chamber survey in 2014, ASEAN countries actually become
a favorite investment destination, namely Indonesia, Vietnam, Thailand, Myanmar, Malaysia, Philippines,
Singapore, Cambodia, Laos and Brunei Darussalam last.
When viewed from the side of the competitiveness of the city, not all the major cities in ASEAN are
included in the survey the economist as cities in the world to achieve the best level of competitiveness in
2025.
The cities are:
1. Singapore (3rd). This city-state is still the best investment in the ASEAN region. Technology,
human resources and investment policies are very supportive. Singapore as a transit hub world
that became a big economic power in ASEAN.
2. Kuala Lumpur (31st). Malaysia has had investment climate, infrastructure and quality of
resources. Some Malaysian companies are also growing rapidly, including Petronas and Proton.
3. Bangkok (62nd). Bangkok became one of the metropolitan cities with relatively high levels of
congestion. However, investments from Korea started to go to Bangkok and advancement of
tourism is increasing from year to year.
4. Jakarta (74th). Megacities including 6th in the world. Population and technological advances are
very supportive, but traffic jams and high gap becomes a challenge. The new Indonesian

Proceedings of The 1th Almuslim International Conference on Science, Technology and Society (AICSTS) 2015
November 7-8, 2015, Bireuen, Indonesia
142
government to bring fresh wind to the improvement of the investment climate in Jakarta and
Indonesia.
5. Manila (79th). Philippines capital has a fairly dense population as one of the metropolitan cities in
ASEAN.
6. The Ho Chi Minh City (96th in the world). The former capital of Vietnam has a fairly high
competitiveness with growth rates well supported by a large population.
7. Bandung (110th). Bandung is one city that is quite advanced in Indonesia. Education centers,
centers of tourism and creative industries.
8. Hanoi (112th). Currently, many industries began to go into Vietnam, one of Samsung.
9. Surabaya (to 114). Surabaya has high competitiveness as a center of trade and industry in
eastern Indonesia.
The entrance to 9 city as a city with high competitiveness in the world are classified based on based on a)
the growth rate, b) number of the rich and the poor, and c) how well it is integrated with the global cities in
the ASEAN region. Determine the progress of the city determines the well-being of the region. One of the
obstacles faced in achieving high competitiveness of our cities in ASEAN is that high levels of inequality.
Countries dbandingkan CMLV quite behind other ASEAN-6 countries. Myanmar, Cambodia, Laos, Brunei
does not even managed to get into the cities with high competitiveness. Yet today Cambodia, Myanmar
began ogled by foreign investment to do business.
Thus, the level of competitiveness of the city should be an indicator to see the level of welfare of the
peoples of ASEAN. In keeping with the goal of achieving ASEAN community that one vision, one identity
and one community of the principles of justice and welfare for the development of the competitiveness of
cities in ASEAN should start to be considered.
Conclusion
ASEAN (Association of South East Asian Nations) is a regional organization in Southeast Asia. ASEAN
was established by the nations of Southeast Asia on the basis of equality destiny and common interests.
Five countries agreed to become a pioneer of establishing the ASEAN are Indonesia, Malaysia, Thailand,
Singapore and the Philippines. This organization was established on 8 August 1967 in Bangkok, Thailand
and through the signing of the Bangkok Declaration by the Minister of Foreign Affairs of the Philippines,
Indonesia, Thailand, Malaysia, and Singapore.
References
McMillan & Schumacher, 2003. Methods: Jakarta
Balassa, Bela. 1962. The Theory of Economic Integration. UK: George Allen & Unwin.
Henry, Laurence., 2007. The ASEAN Way and Community Integration: Two Different Models of
Regionalism, European Law Journal, 13 (6).

Proceedings of The 1th Almuslim International Conference on Science, Technology and Society (AICSTS) 2015
November 7-8, 2015, Bireuen, Indonesia
143
http://adhityache.blogspot.co.id/2014/09/analisis-kritis-masyarakat-ekonomi.html
http://hizbut-tahrir.or.id/2014/10/09/ancaman-liberalisasi-pasar-asean-di-depan-mata/
http://siteresources.worldbank.org/INTGEP2005/Resources/GEP107053_Ch03.pdf (Retrieved on March
17, 2015).
https://meganisfa.wordpress.com/mentions/meganisfa/Lloyd, Peter J., 2005. What is Single Market: An
Application to the Case of ASEAN, the ASEAN Economic Bulletin, Vol. 22, No.3. ISEAS
Siteresources.worldbank.org, t.t. Regional Trade Agreements: Effects on Trade [online]
Proceedings of The 1th Almuslim International Conference on Science, Technology and Society (AICSTS) 2015
November 7-8, 2015, Bireuen, Indonesia
144
Supply Chain Performance Management Toward Plastic Waste
Suppliers With Using Analytical Hierarchy Process
1*Syaifuddin Yana, 2Badaruddin, 3Syamsul, 4Bahtar
1Faculty of Engineering, Serambi Mekkah University Banda Aceh – Indonesia
2Faculty of Economics, Serambi Mekkah University, Banda Aceh.
3Faculty of Economics, Muhammadiyah University, Banda Aceh.
*Corresponding Author: [email protected]
Abstract
The purpose of this study was to determine how to manage capability level for fulfillment
of plastic waste as a raw material for the manufacture of plastic chips by the supplier by
using a hierarchical analysis process (AHP). The results of the analysis process hierarchy
matrix obtained that the order of supplier which can meet the demands of the
manufacturer is a supplier 1, 3, 2 and 4, in which the first supplier has the highest value
of 0.359, followed by the supplier 3 with a value of 0.235, supplier 2 with a value of 0.205
and suppliers 4 with a value of 0.201. The sequence is a reflection of the most give
contribution for satisfaction and fulfilling production needs required by manufacturers at
this moment. Criteria for the assessment on a transaction of this plastic waste are: the
type of plastic waste, price, color, quality, quantity and time delivery. To meet the need for
raw materials, manufacturing (industrial processing plastic waste into plastic chips) in
cooperation with several suppliers to get some kind of plastic waste that is required by
the manufacturer where the request is a reflection of the demand for buyers in the
plastics conversion industry into finished plastic products, it is undertake in order to keep
the needs (capacity) factory production both short term and in the long term.
Keywors: Matrix Analysis Hierarchy Process, suppliers, industrial processing waste
plastics and plastic chips.
Introduction
The process of formation the supply chain and management plays a very important role and can be seen
as an organizational transformation of the conventional system to the new system. A lot of research that
conducting a review of the supply chain with a different level of success and more important that it has a
positive impact in implementation of supply chain activities to the company's in overall activities. Supply

Proceedings of The 1th Almuslim International Conference on Science, Technology and Society (AICSTS) 2015
November 7-8, 2015, Bireuen, Indonesia
145
chain and logistics activities can help the development of strategies to minimize the risk, helping to
improve the supply chain which have encounter problems, and can avoid complicated and inefficient
problems which can certainly impacted to the greater losses for the company.
Industrial processing of waste plastics into semi-finished products or finished products is classified
relatively simple industry and does not require high technology. To support the processing of plastic
products it takes a lot of sources of plastic waste which is in fact many are in the middle of society and at
the environment whether community life up until the end of waste disposal/garbage in the city and its
surroundings. Nevertheless, industrial processing of plastic waste into plastic chips is common and there
are many in Aceh. Along with this, waste collection activities, especially plastic waste is something that
we often see in serrounding of our environment and also in the places where garbage collection and final
disposal (landfill).
The chain process of collecting the plastic waste is tiered from scavengers either using collectors sack or
basket at the back or scavengers simple pedicabs every day to collect the plastic waste and subsequently
sold to the collectors who in this activity is referred to as the collecting agent. The collectors is also
divided ranging from small-scale of collectors, medium, up to large scale or in a chain of activities is also
a small collectors is further selling plastic waste collected to the large agency or sold to other
manufacturers for processing into chips.
Besides that, after the chips plastic products produced by local manufacturer and then sold to other larger
manufacturers and of course a large manufacturer of plastic chips will then process it into finished plastics
products that have higher sale value. All activities are initiated from the collection, storage, sale and
subsequent processing and distribution at the same time is a chain of important events that have
sustained economic value. Of course, these activities from the supplier to the consumer until the end of
the industrial chain of activities which are integrated a networking activity, namely the supply chain, or
better known as supply chain management.
Literature Review
Supply Chain Management of Waste Plastic
In supply chain is known with the term of supply chain management. Supply chain management is an
activity that is mutually integrated or interconnected through the planning, coordination and control of the
entire process and business activity in the supply chain to get the superior value of the consumer with the
lowest cost to the customer. Supply chain more emphasis on the material and information flow series,
while supply chain management emphasis on collection combines supply chain (Vorst 2004). Based on
such understanding, then some of the models that have been developed include Korpela et al. (2002)
using the Analytic Hierarchy Process (AHP) for the allocation of production capacity, Aghezzaf (2005)
uses relaxation Langrangian for the plant site selection and planning capacity, Jung et al. (2004) used a
simulation technique and many variety of methods used to solve problems in supply chain management.
Proceedings of The 1th Almuslim International Conference on Science, Technology and Society (AICSTS) 2015
November 7-8, 2015, Bireuen, Indonesia
146
Supply chain management is more focused on the integration and management of the flow of goods and
services and the flow of information through the supply chain to make it more responsive to customer
needs while lowering the total cost by Russell and Taylor (2006). According to Li Ling (2007), the supply
chain is a set of activities and decisions are interlinked with each other to integrate suppliers,
manufacturing, warehouse, transportation services, retailers and consumers more efficiently. It can be
concluded that the goods and services can be distributed in the amount, timing and precise location to
minimize costs in order to meet the needs of end consumer.
Distribution activitiy is one of the keys to success and an important thing to be considered by the
company because it will directly affect the distribution cost of the supply chain and consumer needs.
Proper distribution network can be used to achieve various objectives of the supply chain, ranging from
low cost to high response against customers requested (Chopra 2010).
To be a serious concern in the business sector against the impact of the increase in the competitive
market environment and the types of adaptive strategies needed to succeed in a dynamic business
environment and continue to undertake the changes. Success in a competition will be determined by the
level of success in building and maintaining cooperation and alliances (Morgant and Hunt, 1994), it is a
basic concept in supply chain management. In a supply chain management will greatly depend on
coordination between enterprise and business interactions related products, services, financial resources
and information. The objective of supply chain management is to coordinate relations between actors in
the supply chain, which is in this cases means creating an organized manner in the supply chain to
interact with one another. The scope of the supply chain will depend on the consensus of the actors
involved in building relationships in the supply chain system.
With the increasingly competitive business environment and high uncertainty, the required design an
adaptive supply chain and it is able to respond to the market environment which is easy to change. To
manage the supply chain possibility may not to continue, if only considering the efficiency, value-added
and competition. Therefore, the supply chain must also develop the capacity to adapt to environmental
changes.
In addition, there are similarities and differences between logistics management and supply chain
management. The equation of the two, namely: (1). Both concerning the management of the flow of
goods or services, (2). Both are concerned about the management of the purchase, movement, storage,
transportation, administration, and distribution of goods and (3). Both involve efforts to improve the
efficiency and effectiveness of the management of goods. While the difference can be seen in the
following table.
Logistic Management Supply Chain Management
Giving priority to management, including the
flow of goods within the company.
Prioritizing the flow of goods between
companies, since most upstream up to most

Proceedings of The 1th Almuslim International Conference on Science, Technology and Society (AICSTS) 2015
November 7-8, 2015, Bireuen, Indonesia
147
downstream.
Oriented planning and frameworks that
produce a single plan the flow of goods and
information across the enterprise.
On the basis of this framework, attempted
relationships and coordination between
processes to other companies in the business
of pipelines, ranging from suppliers to
customers.
Source: Indrajit and Djokopranoto (2002)
Research Methods
Research methods and problem-solving approach in which the stages of research to be conducted in this
study are as follows:
1. Supply chain activities that began with the collection of plastic waste, is collected by agents and
distributors (collector) and then sold to the manufacturer to be processed and then sold to the
final buyer is the other major manufacturers (plastic conversion industry) to be processed into
various types of plastic end products. So that is part of this activity is the collection starts from the
beginning until the end of processing and sales, including in this case the transportation service
to deliver logistics to its destination.
2. Suppliers (distributor) of plastic waste is plastic waste collection either small scale and large scale
collectors is sometimes referred to as agents collecting plastic waste. Sometimes the scavengers
may also act to become a distributor if a certain amount they can collect the waste in a relatively
large amount and there is an agreement between the manufacturer with the suppliers (including
scavengers).
3. The raw material intended is plastic waste that comprises of various types, colors, quality and
price which would then be used as a material for processing plastic waste.
4. Products intended in this research that the plastic chips resulting from the processing
(production) by using a grinding machine.
5. There are many types of plastics waste are sold by the supplier, but the type that interest by
buyer in the market is the type of PP cup and PP injection (polypropylene), PET bottles
(Polyethylene Terephthalate) and HDPE (High Density Polyethylene), and others. All raw
materials (waste plastic) is made from plastic waste of various kinds of products and consists of a
wide range of colors.
6. Model approach is using Analytic Hierarchy Process (AHP) with a decision matrix that is used as
a tool for decision making on suppliers (distributors) raw material of plastic waste that the best
one which will be helping manufacturers to make decision in purchasing.
7. Supply chain intended in this research is describes how the process of information that occurred
began with the purchase of raw materials, production, storage and sales of plastic chips to the
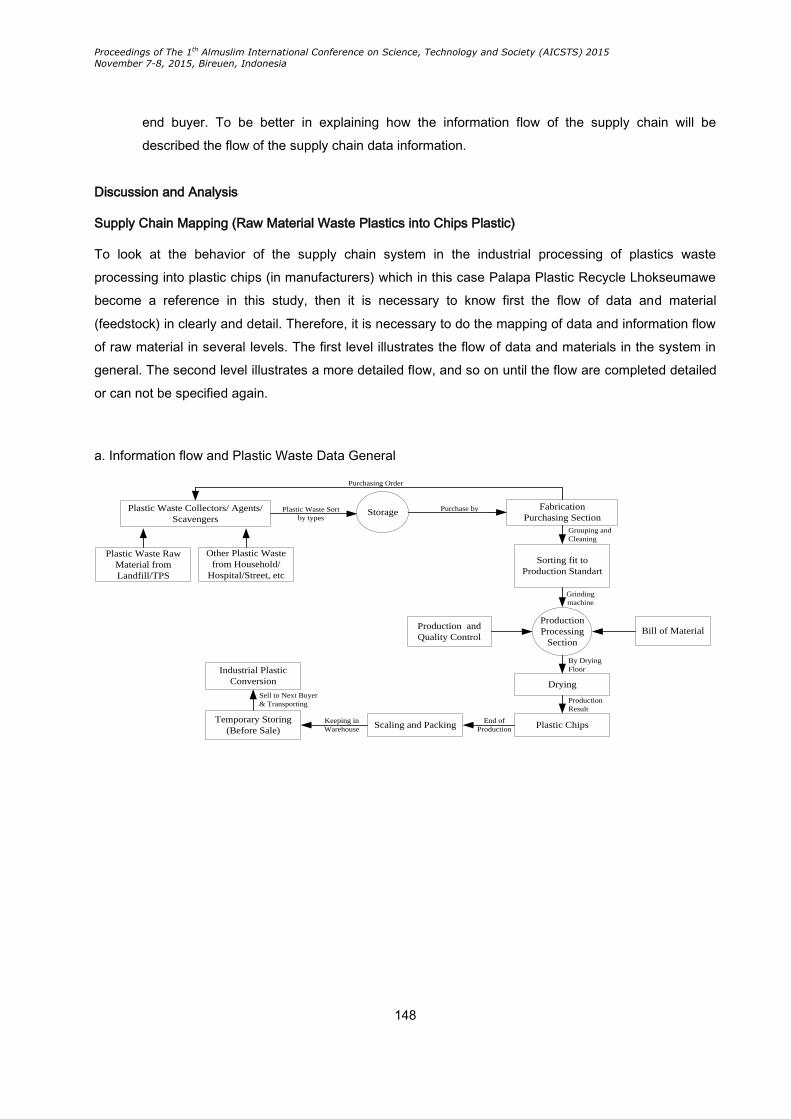
Proceedings of The 1th Almuslim International Conference on Science, Technology and Society (AICSTS) 2015
November 7-8, 2015, Bireuen, Indonesia
148
end buyer. To be better in explaining how the information flow of the supply chain will be
described the flow of the supply chain data information.
Discussion and Analysis
Supply Chain Mapping (Raw Material Waste Plastics into Chips Plastic)
To look at the behavior of the supply chain system in the industrial processing of plastics waste
processing into plastic chips (in manufacturers) which in this case Palapa Plastic Recycle Lhokseumawe
become a reference in this study, then it is necessary to know first the flow of data and material
(feedstock) in clearly and detail. Therefore, it is necessary to do the mapping of data and information flow
of raw material in several levels. The first level illustrates the flow of data and materials in the system in
general. The second level illustrates a more detailed flow, and so on until the flow are completed detailed
or can not be specified again.
a. Information flow and Plastic Waste Data General
Plastic Waste Raw
Material from
Landfill/TPS
Other Plastic Waste
from Household/
Hospital/Street, etc
Plastic Waste Collectors/ Agents/
ScavengersStorage
Fabrication
Purchasing SectionPurchase byPlastic Waste Sort
by types
Sorting fit to
Production Standart
Grouping and
Cleaning
Production
Processing
Section
Grinding
machine
Drying
By Drying
Floor
Production
Result
Production and
Quality Control
Plastic Chips
Industrial Plastic
Conversion
Scaling and PackingTemporary Storing
(Before Sale)
Sell to Next Buyer
& Transporting
End of
Production
Bill of Material
Purchasing Order
Keeping in
Warehouse

Proceedings of The 1th Almuslim International Conference on Science, Technology and Society (AICSTS) 2015
November 7-8, 2015, Bireuen, Indonesia
149
b. Datas Information Flow and Plastic Waste Purchase
Purchasing SectionRaw Material Storage
Section
Production Processing
Section
Information
Confirmation
Information
Request Order
Plastic Waste Collectors/
Agents/Scavengers:
Check
For
Availability
and Fit to
Order
Request Order of Plastic Waste:
- Types
- Prices
- Colour
- Quality
- Quantity
- Time Delivery
Raw Material
is not Fit to
OrderRaw Material
is Fit to Order
c. Information Flow of Plastic Waste (Raw Material) at Production Level
Raw Material Storage
Section
- Types
- Colour
- Quality
- Quantity
- Time Delivery
Production Section
Request Order/need
of Plastic Waste
Check
For Availability
and Fit to Order
Raw Material is
not Fit or not
Available in
Storage
Raw Material is
Fit and Available
to Order
Purchasing Section
Request Purchase
Order of Plastic
Waste
Plastic Waste Suppliers
(Collectors/Agents/
Scavengers)
Production Processing
Grinding Process
Plastic Chips Product
Industrial Plastic
Conversion
End Product
Sell To Next Buyer
- Types
- Colour
- Prices
- Quality
- Quantity
- Time Delivery
Considering Request
Order by Production
Request Purchase
Order to Potential
Supplayers

Proceedings of The 1th Almuslim International Conference on Science, Technology and Society (AICSTS) 2015
November 7-8, 2015, Bireuen, Indonesia
150
d. Datas Information Flow and Plastic Waste (Raw Material) Inventories
Plastic Waste Suppliers
(Collectors/Agents/
Scavengers)
Check
For Availability
and Fit to
Order
Raw Material Storage
SectionProduction Section
Request Order of
Plastic Waste
Raw Material is Available
and Fit to Order
Check in
inventory book
Purchasing SectionRaw Material is not Available
and not Fit to Order
Request Purchase
Order of Plastic
Waste
e. Data Information Flow and Plastic Chips Inventories
Chips Plastic Storage
Section
Production Section
- Types
- Price
- Colour
- Quality
- Quantity
- Time Delivery
Request Order
of Chips Plastic Next Buyers
- Buyer 1
- Buyer 2
- Buyer 3
- Buyer 4
- Etc
Check
For Availability
and Fit to
Order
Raw Material is Available
and Fit to Order
Raw Material is not Available
and not Fit to Order
Received Order
of Chips Plastic
Send and Keep
Chips Plastic
The Parties interaction
Plastic Waste Suppliers
Industrial processing of plastic waste into plastic chips is relatively classified simple industry. Suppliers of
plastic waste in the waste business and the processing industry is composed of collecting agent
(distributor). Waste plastics obtained by them will be collected in gunny sacks to take home before the
sale, sorting and cleaned first. In general, collection agency activity does not have a formal business
entity except the plastic waste processing industry had a business entity such as UD, cooperatives or
other governmental agencies. Therefore, in order to easier to the assessment or scoring, then to group
Proceedings of The 1th Almuslim International Conference on Science, Technology and Society (AICSTS) 2015
November 7-8, 2015, Bireuen, Indonesia
151
these suppliers will be coding with (S1, S2, S3 and S4), the coding is abbreviated such a way with the
aim in oder to easier to conduct the scoring.
Table 1. List of Plastic Waste (Raw Materials), Derivatives and Suppliers
No. Jenis Plastik
Daur Ulang
Jenis Produk Pemasok
1 PET Beverage bottles, soy sauce, perfume,
candy holder, etc.
Supplier 1 (S1), Supplier 2 (S2),
Supplier 3 (S3) dan Supplier 4
(S4). 2 HDPE Oil bottles, cosmetics, shampoos,
packing of bottles, etc.
3 PVC Pipes, guttering, packing of bottles,
Baygon, etc.
4 LDPE Aqua lid bottle, aqua gallon, packaging,
etc.
5 PP Aqua cup, frutang, jelly, ades, etc
6 PS CD, waste baskets, children's toys, etc.
7 Others (ABS,
Hi-Impact)
Computer, radio, tv, children's toys, etc.
Source: Palapa Plastic Recycle - PPR (modified)
Plastic Waste Supplier Assessment
Plastic waste supplier assessment criteria in the supply chain activities is one of the criteria used as a
reflection of supply chain activities. Criteria for the assessment on a transaction of this plastic waste are:
the type of plastic waste, price, color, quality, quantity and delivery time. Typically consideration of
industrial / manufacturing in the purchase and the transaction is different from one manufacturer to
another manufacturer.
Provision Weight For Each criteria and Sub-Criteria
The model that will be used in the processing of this data is by using AHP (Analysis Hierarchy Process),
which this assessment will be given the weighting for criteria and sub-criteria. The AHP model is
appropriate to be applied to cases that are relatively difficult decision-making and complex by using
several assessment criteria.

Proceedings of The 1th Almuslim International Conference on Science, Technology and Society (AICSTS) 2015
November 7-8, 2015, Bireuen, Indonesia
152
Plastic Waste Suppliers
Assesessment
Types Prices Colours Quality Quantity Time Delivery
Type of chips plastic
request by buyers
Type of chips plastic
most request by
markets
Lower Prices and
Bargaining
Potential of
Savings
Cost of Purchase
Specific Colour
Request by Buyers
Colour that most
request by
Markets
Good Quality that
Result the Best
Chips Plastic
Specific Quality
Request by
Buyers
Quantity is
Provide when
Requested
Quantity Purchase
fit to Production
Needs
No Delay When
Requested
No Cancelation by
Suppliers Side
At the Time Confirmation
to Purchase, Suppliers
should Provided
Supplier 1
(S1)
Supplier 2
(S2)
Supplier 3
(S3)
Supplier 4
(S3)
Figure 1. Criteria and Sub-Criteria Assessment of Plastic Waste Suppliers With Approach Analysis
Hierarchy Process (AHP) Structure
At the AHP structure, assigning weights to each criterion, namely by way of comparison in pairs. Wherein
if the comparison between the two criteria considered equally important as it is rated 1 for both criterion,
whereas when there is a difference which one is more important, these criteria are given greater value
than the others, namely 3, 5, 7, or 9, in accordance with level of importance of the other criteria into
comparison.
Table 2. Pairwise comparisons Of Plastic Waste (Raw Materials) Supplier Selection
Types Prices Colours Quality Quantity Time Delivery
Types 1.00 1.00 3.00 1.00 3.00 2.00
Prices 1.00 1.00 2.00 1.00 2.00 2.00
Colours 1.00 0.50 1.00 0.50 2.00 1.00
Quality 0.50 0.33 1.00 1.00 2.00 3.00
Quantity 0.33 0.20 0.33 0.33 1.00 0.50
Time Delivery 0.50 0.33 0.33 1.00 0.33 1.00
Total 4.33 3.37 7.67 4.83 10.33 9.50
At this stage compares the criteria from the purchase of raw materials of plastic waste and assessment of
the level of priority (comparative) or which become more important relative to one another criterion,
namely the criteria of the type, price, color, quality, quantity and time of delivery of the raw material of
plastic waste.
Proceedings of The 1th Almuslim International Conference on Science, Technology and Society (AICSTS) 2015
November 7-8, 2015, Bireuen, Indonesia
153
Table 3. Weight Calculation Of Each Criteria
Types Prices Colours Quality Quantity Time Delivery Bobot
Types 0.23 0.30 0.39 0.21 0.29 0.21 0.27
Prices 0.23 0.30 0.26 0.21 0.19 0.21 0.23
Colours 0.23 0.15 0.13 0.10 0.19 0.11 0.15
Quality 0.12 0.10 0.13 0.21 0.19 0.32 0.18
Quantity 0.08 0.06 0.04 0.07 0.10 0.05 0.07
Time Delivery 0.12 0.10 0.04 0.21 0.03 0.11 0.10
From the table above, obtained weighting of each criterion are sequentially: 0.27; 0.23; 0.15; 0.18; 0.07
and 0.10.
Weight calculation Of Suppliers Plastic Waste (Raw Materials)
Supplier assessment undertaken by the buyer in this case is plastic waste processing industry
(manufacturers). Assessment of waste plastics that purchased by the manufacturer that is with
consideration by the type of plastic waste, price, color, quality, quantity and delivery time. After the
manufacturer doing consideration to such criteria, the manufacturer will consider buying plastic waste
The next step is to calculate the weight value of each supplier. Value is obtained by summing the results
of multiplication of the weight of each sub-criterion is concerned.
Table 4. Final Suppliers Assesessment
Criteria/Sub-criteria Weight Supplier 1 Supplier 2 Supplier 3 Supplier 4
Types 0.27
(T1) 0.18 0.345 0.125 0.255 0.275
(T2) 0.09 0.277 0.156 0.334 0.233
Prices 0.23
(P1) 0.10 0.637 0.124 0.135 0.104
(P2) 0.08 0.267 0.276 0.176 0.281
(P3) 0.05 0.231 0.311 0.323 0.135
Colours 0.15
(C1) 0.08 0.313 0.215 0.357 0.115
(C2) 0.07 0.274 0.197 0.276 0.253
Quality 0.18
(Q1) 0.07 0.471 0.211 0.216 0.102
(Q2) 0.11 0.383 0.276 0.139 0.202
Quantity 0.07
(Qt1) 0.02 0.376 0.219 0.212 0.193
(Qt2) 0.05 0.289 0.319 0.201 0.191
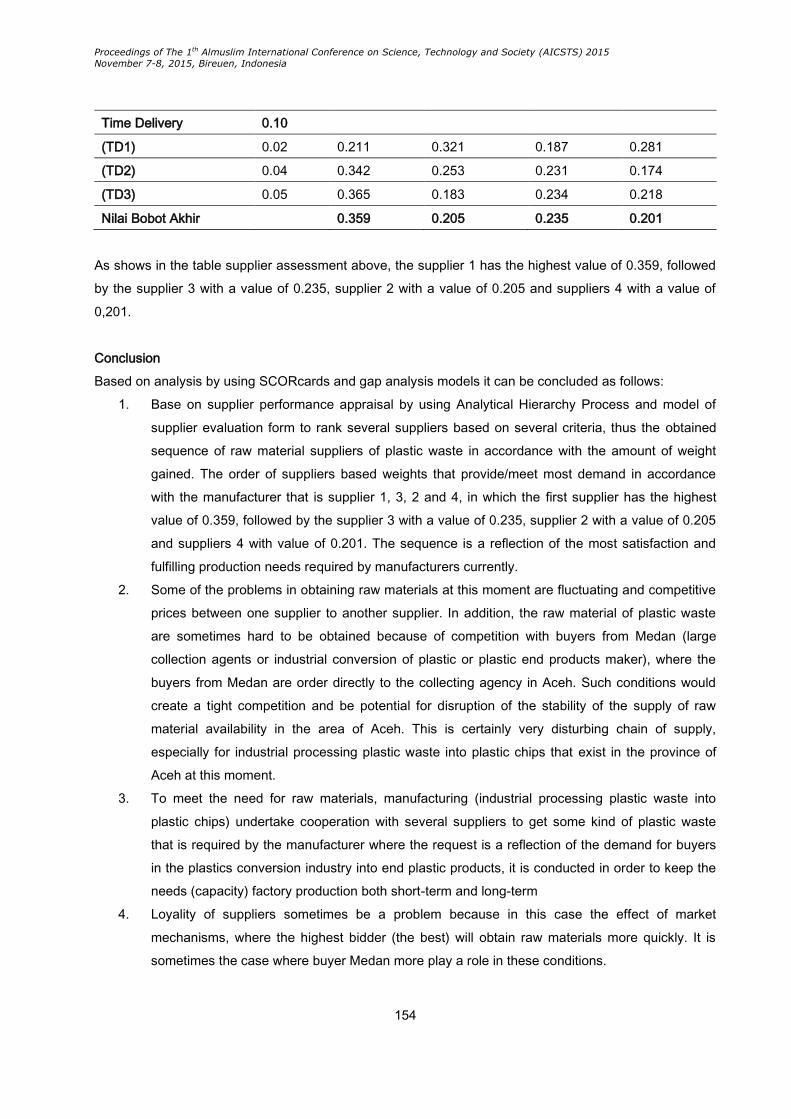
Proceedings of The 1th Almuslim International Conference on Science, Technology and Society (AICSTS) 2015
November 7-8, 2015, Bireuen, Indonesia
154
Time Delivery 0.10
(TD1) 0.02 0.211 0.321 0.187 0.281
(TD2) 0.04 0.342 0.253 0.231 0.174
(TD3) 0.05 0.365 0.183 0.234 0.218
Nilai Bobot Akhir 0.359 0.205 0.235 0.201
As shows in the table supplier assessment above, the supplier 1 has the highest value of 0.359, followed
by the supplier 3 with a value of 0.235, supplier 2 with a value of 0.205 and suppliers 4 with a value of
0,201.
Conclusion
Based on analysis by using SCORcards and gap analysis models it can be concluded as follows:
1. Base on supplier performance appraisal by using Analytical Hierarchy Process and model of
supplier evaluation form to rank several suppliers based on several criteria, thus the obtained
sequence of raw material suppliers of plastic waste in accordance with the amount of weight
gained. The order of suppliers based weights that provide/meet most demand in accordance
with the manufacturer that is supplier 1, 3, 2 and 4, in which the first supplier has the highest
value of 0.359, followed by the supplier 3 with a value of 0.235, supplier 2 with a value of 0.205
and suppliers 4 with value of 0.201. The sequence is a reflection of the most satisfaction and
fulfilling production needs required by manufacturers currently.
2. Some of the problems in obtaining raw materials at this moment are fluctuating and competitive
prices between one supplier to another supplier. In addition, the raw material of plastic waste
are sometimes hard to be obtained because of competition with buyers from Medan (large
collection agents or industrial conversion of plastic or plastic end products maker), where the
buyers from Medan are order directly to the collecting agency in Aceh. Such conditions would
create a tight competition and be potential for disruption of the stability of the supply of raw
material availability in the area of Aceh. This is certainly very disturbing chain of supply,
especially for industrial processing plastic waste into plastic chips that exist in the province of
Aceh at this moment.
3. To meet the need for raw materials, manufacturing (industrial processing plastic waste into
plastic chips) undertake cooperation with several suppliers to get some kind of plastic waste
that is required by the manufacturer where the request is a reflection of the demand for buyers
in the plastics conversion industry into end plastic products, it is conducted in order to keep the
needs (capacity) factory production both short-term and long-term
4. Loyality of suppliers sometimes be a problem because in this case the effect of market
mechanisms, where the highest bidder (the best) will obtain raw materials more quickly. It is
sometimes the case where buyer Medan more play a role in these conditions.
Proceedings of The 1th Almuslim International Conference on Science, Technology and Society (AICSTS) 2015
November 7-8, 2015, Bireuen, Indonesia
155
References
Aghezzaf, E., 2005. Capacity Planning and Warehouse Location in Supply Chains with Uncertain
Demand. Journal of. Operational Research Society 56: 453-462
Anggreini, Widya (2002). Pengukuran Kinerja Rantai Pasokan Pada PT. Crown Closeres Indonesia.
Jurnal Teknik Industri.
Chopra, S., Meindl, Peter (2010). Supply Chain Management: Strategy, Planning, and Operation. Fourth
Edition. Pearson, New Jersey.
Indrajit, Richardus Eko dan Djokopranoto, Richardus (2002). Konsep Manajemen Supply Chain. Cara
Baru Memandang Mata Rantai Penyediaan Barang. Grasindo, Jakarta.
Jung, J.Y., G. Blau, J.F. Pekny, G.V. Reklaitis, and D. Everdyks, 2004. A Simulation Based Optimization
Approach to Supply Chain Management under Demand Uncertainty. Computers and Chemical
Engineering 28: 2087-2106
Korpela, J., K. Kyläheiko, A. Lehmusvaara, and M. Tuominem, 2002. An Analytic Approach to Production
Capacity Allocation and Supply Chain Design. Int. J Production Economic 78: 187-195.
Li, Ling (2007). Supply Chain Management: Concept, Techniques and Practices. Enhancing Value
Through Collaboration. World Scientific Publishing Co. Pte. Ltd. Old Dominion University, United
States.
Morgan, RM & Hunt, SD 1994, ‘The Commitment- Trust Theory of Relationship Marketing’, Journal of
Marketing, vol. 58, pp. 20-38.
Muhammad, Amri dan Yuslidar, Cut Eli (2012). Evaluasi Pengelolaan Kinerja Rantai Pasok Dengan
Pendekatan Scor Model Pada Swalayan Asiamart Lhokseumawe. Malikussaleh Industrial
Engineering Journal Vo.1 No.1 (2012) 44-51 ISSN 2302 934X.
Russell R. S. dan Taylor B. W. (2006). Operation Management. Wiley, United States.
Said, Andi Ilham et al (2006), Produktivitas dan Efisiensi dengan Supply Chain Manajement.
Vorst, J.G.A.J. van der, 2004. Supply Chain Management: Theory and Practice. Didalam: T.Camps,
P.Diederen, G.J. Hofstede, B.Vos (Eds). The Emerging World of Chains & Networks. Hoofdstuk:
Elsevier.

Proceedings of The 1th Almuslim International Conference on Science, Technology and Society (AICSTS) 2015
November 7-8, 2015, Bireuen, Indonesia
156
The Contribution of Corporate Social Responsibility on External
Stakeholders Perspective
1*Zulkarnaini, 2Zuarni and 3Fakriah
1,2,3 Commerce Department, Lhokseumawe State Polytechnic, Aceh – Indonesia
*Corresponding Author: [email protected]
Abstract
The company is a form of organization that can not be separated with a maximum profit.
All forms of activities and programs implemented by the company will have an impact on
the environment both internal and external. The impact on the external side will trigger its
own problems, including the presence in an area. Through local government policy, the
company is considered able to be controlled under the authority of the local government
through the autonomy. The research objective is to see the limitation of contributions
made by the company through its social responsibility as a percentage of the area
through perspective of external stakeholders including government regulations, public
pressure, environmental organizations/Non Governmental Organization (NGO), and the
mass media. This research has been conducted in three different areas, namely in the
province of Aceh are region of Banda Aceh, Aceh Utara and Lhokseumawe. The
analytical tool used is Multiple Regression with the purposive sampling. Total of
respondents has been stated by using the criteria are 750 people. The results have been
showed that external stakeholders include government regulations, public pressure,
environmental organizations/Non Governmental Organization (NGO), and the mass
media simultaneously significant effect on corporate social responsibility. Partially, only
environmental organizations/NGOs that does not have a significant impact on corporate
social responsibility.
Keywords: External stakeholders, government regulation, public pressure, environmental
organizations/NGOs, mass media and corporate social responsibility.
Background
The existence of the company or the industry in the area has been inviting a problem for local
governments. This is a problem that must be addressed by the local government through autonomy held
in accordance with Law No. 32 of 2004. This regulation has been a strong foundation for local
Proceedings of The 1th Almuslim International Conference on Science, Technology and Society (AICSTS) 2015
November 7-8, 2015, Bireuen, Indonesia
157
government to be able to organize and manage their own affairs and interests of local communities in
accordance with the regulations legislation in force. Any kind of company or any industry including those
labeled State Owned Enterprises (SOEs) has to support the development or progress of a region. The
presence of various forms of companies or state-owned companies in each region has become a
necessity for economic growth in the region that must be synchronized with certain rules or policies that
are expected to have a form of harmonization for the development of the region. According to Kiroyan
(2006) in Rosiyana R. Mariani Dewi and Sitinjak (2009) that corporate social responsibility is the
obligation of the company to maintain the quality of the social and physical environment and also make a
positive contribution to the values of public welfare. This is particularly relevant to Law No. 40/2007
regarding Limited Liability Company (Company Law) which is clearly stated in Article 74 that the
requirement for any company to make an annual report on the implementation of social and
environmental responsibility. Internal problems that occurred in the region, still need to look for a solution
through various research evidence, including problems with the presence of companies or industries that
are directly able to contribute to the region. Zulkarnaini (2011) proved that the majority of state-owned
companies have given positive indications on corporate social responsibility to the primary stakeholders
including of government regulations, public pressure and labor, when assessed from the point of view of
the company itself. Results were only seen standpoint of company without regard to external parties such
as the community, NGOs, suppliers, the media and local government that is supposed to be a side that is
very objective and independent in assessing the company's actions. Through this research needs to be
studied again that the existence of the company or the industry should really be judged from the
standpoint of independent parties in order to give a perception that eventually can strengthen to local
government policy. Luhgiatno (2007) argued that the concept of corporate social responsibility becomes
very heavily promoted by the company, but in fact it is just a sweetener or done to improve the image of
the company, without actually fulfill their obligations and improve performance substantially. The final
results of this study are expected how local governments can set policies regarding the interests of the
region based on the input obtained from the public or external parties. The local government wanted the
company or the industry, including state-owned companies to demonstrate the seriousness of the social
responsibility held, so that between the company and the community will have a social contract, either
implicitly or explicitly allowing the public to evaluate the social performance of the organization in making
a judgment about the operational feasibility of the organization or enterprise (Yulia Setyarini and Melvie
Paramitha, 2011).
The Concept of Corporate Social Responsibility
Freeman in Azhar Maksum and Azizul Kholis (2003) states that "stakeholder is a group or individual who
can affect or is affected by the achievement of the organization's objectives". Freeman's definition states
that a stakeholder group or individual who can affect or be affected by the achievement of corporate
goals, thereby implicitly this definition indicates survival (going concern) companies among others
influenced by the behavior and response to the company's stakeholders.
Proceedings of The 1th Almuslim International Conference on Science, Technology and Society (AICSTS) 2015
November 7-8, 2015, Bireuen, Indonesia
158
Stakeholder Concept
Stakeholder is groups of people/institutions which include shareholders, management, employees,
suppliers, customers, the community around the factory or the location of the company, the public,
government and the environment, in which all components have an interest in a business (Bertens,
2004). Steiner and Steiner (2003) divided these stakeholders based on its effect on the company, which
are then grouped into primary stakeholders and secondary stakeholders, where is defined as follows:
“Primary stakeholders have an immediate, and powerful impact on a firm. They are stockholders
(owners), customers, employees, communities, and governments and may, depending on the firm,
secondary stakeholders include a wide range of entities that have less power to include the firm's
activities but that effect or are affected by its operations”. While Estes (1976: 3) dividing up the internal
and external stakeholders. Internal parties are the management, labor, public relations and corporate
legal departments. External parties include (1) The Association comprised of investors (shareholders),
customers and suppliers; (2) Government; (3) public organizations; (4) Others such as mass media,
capital markets and the general public. Kelley (1991) and Kirby (1998) in Irene (1999) reveals four things
that become a crucial issue in the scope of stakeholders, as follows: (a) Government regulation, the
whole shape of the rules issued by the government to be fundamental importance for the company.
Companies must pay attention to these rules as regulations that have an impact on the sustainability of
their activities, such as the company's operating license, analysis and environmental impact standards,
regulation of labor / labor and others. Thus it can be ensured that the role of government is high in
interfering in how the success of a business (Coghill, 1999); (b) Community groups (Community). The
fundamental reason for the public notice is given that it is consumers who will consume the elements of
production of the company. Another group that can be categorized society is education agency that
always responds academic study if something happens in the corporate world especially detrimental for
the sake of common interests and objectives of a particular group; (c) Environmental Conservation
(Environmental Organization), which has elements of environmental organizations or other organizations
such as the Non Governmental Organization (NGO). These organizations can mobilize people and
opinions on the activities of the company, so that the interests of the organization; (d) Mass Media, is the
role of the mass media simply provide a very significant meaning in shaping public opinion on a
company's activities.
Research Hypothesis
Based on the theoretical discussed above, the research hypothesis can be derived as follows:
1. Stakeholders include government regulations, public pressure, environmental organizations and
mass media have partially effect on corporate social responsibility in the region of Banda Aceh,
Aceh Utara and Lhokseumawe.
2. Stakeholders include government regulations, public pressure, environmental organizations and
mass media have simultaneously effect on corporate social responsibility in the region of Banda
Aceh, Aceh Utara and Lhokseumawe.

Proceedings of The 1th Almuslim International Conference on Science, Technology and Society (AICSTS) 2015
November 7-8, 2015, Bireuen, Indonesia
159
Research Methods
The research variables consisted of the independent variables are (1) Government regulation
represented by the local government in three areas through the entire work units (SKPD) with 23 in
Banda Aceh, 35 in Aceh Utara, and 25 in Lhokseumawe; (2) Public pressure is represented by all higher
education institutions; (3) Environmental organizations will be represented by the entire organization or
non-governmental organizations; (4) The mass media, each will be represented by all the media
contained in the province of Aceh located in three regions. This study uses a survey method to collect
data on three research areas. Determination of the target population in accordance with the purpose or
research problem (Nur Indriantoro and Bambang Supomo, 2002). Based on the target population, the
determination of the number of samples based on a purposive sampling with the following criteria (a)
Middle management positions and above; (b) Involved in decision making; (c) Especially colleges that
have been accredited and reputable within the scope of the three research areas; (d) NGOs or
environmental organizations contained in three research areas; (e) Special mass media which are well
known in the province of Aceh. The total number of respondents who assigned to each representation of
a unit as much as 5 people. The total respondents are 750 people.
To be able to analyze the data in this study we will use multiple linear regression analysis to determine
the influence of external stakeholders on corporate social responsibility. The research models can be
derived as follows:
Y=β0+β1X1+β2X2+β3X3+β4X4+ε1
Where Y=Corporate Social Responsibility, β0=constant, i.e the value Y if the value of all other variables to
zero, β1=coefficient of regression of X1, β2=coefficient of regression of X2, β3=regression coefficient of X3,
β4=regression coefficient of X4, X1=Government Regulation, X2=Public Pressure, X3=Environmental
Organization/Non Governmental Organization (NGO), X4=Mass Media, and ε=Error terms of other
variables
Classical assumption test.
The main classical assumptions according to Gujarati (2003) consisting of (1) Normality disturbance
variable (disturbance errors); (2) There is no multikolinearitas, is a condition in which one or more
independent variables correlated with other independent variable, an independent variable is a linear
function of other independent variables; (3) There is no heteroskedastisitas, occur because of changes in
circumstances that are not reflected in the regression model specifically or if the residuals do not have a
constant variance; and (4) There is no autocorrelation which can be interpreted as a correlation exists
between the members of a series of adjacent observation time (time series) or the adjacent holder (cross
section).
Proceedings of The 1th Almuslim International Conference on Science, Technology and Society (AICSTS) 2015
November 7-8, 2015, Bireuen, Indonesia
160
Hypothesis Testing
Statistic F Test, To calculate the value of F calculated used the formula (Gujarati, 2003):
F = )/()1
1/2
2
knR
kR
, Where R2 is the coefficient of determination, k is the independent variable amount,
n is the sample size. Fcalculation results are then compared with Ftable with a 95% confidence level (α = 0.05)
with the decision criteria as follows (1) If Fcalculation ≤ Ftable: Ho accepted or Ha rejected; (2) If Fcalculation >
Ftable: H0 is rejected or accepted Ha.
Statistics t Test, Partial test or called by t test, which is a significant test constant and independent
variables included in the equation individually whether an effect on the value of the independent variables
(Gujarati, 2003: 259). The formula is: t =
i
i
S
, Where βi is the regression coefficient for each independent
variable, Sβi is the standard error of βi. From these calculations we then compare between tcalculation with
ttable value at 95% confidence level (α=0.05), with the decision criteria (1) If tcalculation ≤ ttable: Ho accepted or
Ha rejected; (2) If tcalculation > ttable: H0 is rejected or accepted Ha.
Test coefficient of determination (R2). Test The coefficient of determination (R2) was conducted to see
the great variety of independent variables together in influencing the dependent variable by using the
following formula: R2 =
Y
R
JK
JK
Where JKR: sum of squares regression (explained sum of square), JKY:
total number of squares (the total sumof the square). R2 value is between 0 and 1. The closer the value of
1 or 100%, the greater the influence of the independent variable on the dependent variable. Calculating
the partial determination coefficient is to determine the influence of independent variables on the
dependent variable partially. Partial determination coefficient obtained by squaring partial correlation
coefficients for each independent variable. To determine the relationship between the independent
variable on the dependent variable, use objective criteria as interpretation guidelines (Sugiyono,
2011:214) with frequency (1) 0,00 - 0,199/very low; (2) 0,20 - 0,399/low; (3) 0,40 – 0,599/medium; (4)
0,60 – 0,799/strong; (5) 0,80 – 1,000/very strong.
Result and Discussion
Descriptive overview of the results showed that as many as 750 respondents who became the target
population in this study, only 615 respondents who restore and fill out a questionnaire study (82%). From
the results if the data obtained, both validity and reliability have qualified as indicators that can
demonstrate the quality of statements/questions where the overall indicator has validity> 0.30 and
reliability levels> 0.70. The classical assumption test has been associated to the data and showed the
result unbiased. Analysis of Multiple Linear Regression Equations can be seen on table 1 below:

Proceedings of The 1th Almuslim International Conference on Science, Technology and Society (AICSTS) 2015
November 7-8, 2015, Bireuen, Indonesia
161
Table 1. Analisys of Multiple Regression Model
Table 1 above, it can be derived models as Y = β 0 + β β 1x1 + 3x3 + 2x2 + β + ε β4X4
The correlation coefficient and determination
To determine the relationship between the dependent and independent variables via the correlation
coefficient (R) and the coefficient of determination (R2) can be seen in the summary table 2 below.
Table 2. Correlation coefficient (R) and Determination (R2)
Analysis above that it can be seen that the correlation coefficient (R) is equal to 0.613. Based on
interpretation of the correlation coefficient that has been presented, the correlation coefficient of 61.3%
showed a strong relationship between the independent variables simultaneously with the dependent
variable. Furthermore, based on the table above obtained value of R-Square (R2) of 0.376, thus the
coefficient of determination influence stakeholders simultaneously on corporate social responsibility (Y) is
equal to 37.6 %, while the remaining 62.4% is the influence of other variables that are not observed in this
study. A large percentage partial effect can be determined by multiplying the value of the coefficient Beta
coefficient value Zero Order as follows: (Variable X1 = 0.108 × 0.360 = 0.0389 = 3.89%); (Variable X2 =
0.327 × 0.518 = 0.1694 = 16.94%); (Variable X3 = -0.015 × 0.398 = - 0.006 = -0.6%); and (Variable X4 =
0.336 × 0.517 = 0.1737 = 17.37%). They have showed limitation of contribution each variable.
Hypothesis Testing. Results of hypothesis testing can be summarized as follow:
Table 3. Summary of hypothesis testing
Variable F Test Conclusion
Fcalculation Ftable
X1,X2,X3,X4 91,891 2,113 H0 rejected
t Test
tcalculation ttable
X1 2,741 1,964 H0 rejected
X2 7,948 1,964 H0 rejected
Coefficientsa
-1,088 1,172 -,928 ,354
,228 ,083 ,108 2,741 ,006
,679 ,085 ,327 7,948 ,000
-,017 ,050 -,015 -,332 ,740
,535 ,060 ,336 8,924 ,000
(Constant)
X1
X2
X3
X4
Model
1
B Std. Error
Unstandardized
Coeff icients
Beta
Standardized
Coeff icients
t Sig.
Dependent Variable: Ya.
Model Summary
,613a ,376 ,372 4,39718
Model
1
R R Square
Adjusted
R Square
Std. Error of
the Estimate
Predictors: (Constant), X4, X1, X2, X3a.

Proceedings of The 1th Almuslim International Conference on Science, Technology and Society (AICSTS) 2015
November 7-8, 2015, Bireuen, Indonesia
162
X3 -0,332 1,964 H0 accepted
X4 8,924 1,964 H0 rejected
Source: Result research (2015)
Discussion
Government regulations has been arranging the various activities of the company or industry have a
positive impact for the company's existence today, where the value of the coefficient of determination (R2)
obtained only by 3.89%. It means that there is still a small contribution of government regulations that
could force the company to pay attention to the rules or policies made by the government (Coghill: 1999).
This indicates that essentially the government regulation has full power to supervise or control the
activities undertaken by the company or industry. The results support the evidence that has been
investigated by Zulkarnaini (2011), which state-owned companies are generally consistent with the rules
set by the government in the form of contributions to be distributed to the public. Besides that, the
pressure of society represented by higher education institutions, clearly had a significant influence for
corporate social responsibility, where the value (R2) obtained by 16.94%.
The results support the evidence found by Zulkarnaini (2011) that the public pressure on the internal side
of the company provide a very significant influence on the various forms of social programs carried out by
state-owned companies. However, the external side is found, the author suspected that many college
activities have been supported directly by the company or the industry, such as the recruitment process
on campus, entrepreneurial programs, character development programs, scholarships and others. Then,
author summarized that the presence of environmental organizations or NGOs sampled in this study,
most of the NGOs that are not oriented or highlight to activities of the company or industry that exist
around the community. In general, the presence and activities of NGOs more focused on issues related to
governance, social and other legal issues of public life. For the media, the results showed the value of the
coefficient (R2) is highest among the other three variables, 17.37%. The role of mass media is very
influential for the development of the company or industry.
Conclusions
The result of research has supported local governments to involve the active participation of stakeholders
component in various activities related to the establishment of policies. For further research in order to
add other variables such as good governance (good governance), decentralization, the regional financial
system, managerial performance of local government and so on, expanding the respondent samples or
study and research sites, and state the specialized observations on certain types of enterprises such as
manufacturing companies that directly impact on the environment. Limitations of this study is to determine
the samples, especially the number of environmental organizations/NGOs still has been taken in general,
it means that the activity of NGOs is still very low associated with the actions of the company or industry.
This effect to the source of the information obtained is still so common that tends to effect the desired
Proceedings of The 1th Almuslim International Conference on Science, Technology and Society (AICSTS) 2015
November 7-8, 2015, Bireuen, Indonesia
163
result. Besides that, the indicators has been not showed the specifications that drawn up issues
concerning to both the company's activities and certain types of companies.
References
Azhar Maksum and Azizul Kholis. (2003). Analisis Tentang Pentingnya Tanggung Jawab Sosial Dan
Akuntansi Sosial Perusahaan: Studi Empiris Di kota Medan. Simposium Nasional Akuntansi VI.
Surabaya, Ikatan Akuntan Indonesia.
Bertens, K. (2004). Pengantar Etika Bisnis. Penerbit Kanisius. Yogyakarta.
Coghill, Ken. (1999). Global Social Responsibility and The End Neo Liberali Fundamentalism. Paper on
Governance and Corporate Responsibility, Deakin University. Australia.
Estes, Ralp. (1976). Corporate Social Accounting. New York, John Wiley and Sons
Gujarati, Damodar N. (2003). Basic Econometrics. 4th Edition, New York, McGraw Hill.
I. Januarti and D. Dini Apriyanti. (2005). Pengaruh Tanggung Jawab Sosial Terhadap Kinerja Keuangan.
Jurnal MAKSI. Program Undip, Volume 5 No. 2, p.227-242.
Irene, Sadorsky. (1999). The Relationship Between Environmental Commitment and Managerial
Perception of Stakeholder Importance. Academy of Management Journal. Vol. 42.1.87-99.
Lalu Roby Rajafi and Gugus Irianto. (2007). Analisis Pengungkapan Laporan Sosial dan Lingkungan
Dalam Akuntansi Pertanggungjawaban Sosial Perusahaan (Studi Pada Bursa Efek Jakarta).
TEMA, Volume 8, Nomor 1, Maret 2007.
Luhgiatno. (2007). Akuntansi Sosial Bentuk Kepedulian Perusahaan Terhadap Lingkungan. Fokus
Ekonomi, Volume 2 Nomor 2, Desember 2007, p.1-16.
Nur Indriantoro dan Bambang Supomo. (2002). Metodologi Penelitian Bisnis untuk Manajemen dan
Akuntansi. BPFE-UGM. Yogyakarta.
Putri Mardiandari and Sri Rustiyaningsih. (2013). Tanggungjawab Sosial dan Kinerja Keuangan pada
Perusahaan Manufaktur Go Publik di Bursa Efek Indonesia. Jurnal Riset Manajemen dan
Akuntansi, Volume I No. I, Februari 2013.
R. Rosiyana Dewi and Mariani Sitinjak. (2009). Analisis Pengaruh Karakteristik Perusahaan Terhadap
Earning Response Coeficient Dengan Corporate Social Responsibility Sebagai Variabel
Intervening pada Perusahaan Manufaktur Yang Terdaftar di BEI. Jurnal Informasi, Perpajakan,
Akuntansi dan Keuangan Publik. Vol. 4 No. 2 Juli 2009, p.149-170.
Steiner,George Albert and John F. Steiner. (2003). Business, Government and Society: A Managerial
Perpective, Text and Cases. McGraw-Hill Higher Education, New York.
Yulia Setyarini and Melvie Paramitha, (2011). Pengaruh Mekanisme Good Corporate Governance
Terhadap Corporate Social Responsibility. Jurnal Kewirausahaan Vol. 5 No. 2, Desember 2011.

Proceedings of The 1th Almuslim International Conference on Science, Technology and Society (AICSTS) 2015
November 7-8, 2015, Bireuen, Indonesia
164
Zulkarnaini. (2011). Faktor-Faktor Yang Mempengaruhi Tanggung Jawab Sosial Perusahaan (Sensus
Pada Perusahaan BUMN di Wilayah Kota Banda Aceh). Jurnal Ekonomi dan Bisnis. Volume 10
No. 1. Februari 2011.
Proceedings of The 1th Almuslim International Conference on Science, Technology and Society (AICSTS) 2015
November 7-8, 2015, Bireuen, Indonesia
165
Relationship Factors Economic Growth with Environmental
Quality in Indonesia
Benni Sinaga
Sekolah Tinggi Ilmu Ekonomi LMII Medan
Corresponding Author: [email protected]
Abstract
Economic growth is an important concept in the development of a region. This is because
economic growth in a region is a very important indicator in determining the successful
development of a region. National economic growth is calculated through the GDP (Gross
Domestic Product) can also be used as indicator of the rate of the national economy
which in this case concerns the effectiveness of the determinants of economic growth
such as, population, total employment, per capita income, land area per capita and the
level of technological development. Economic growth is an important concept in the
development of a region. This is because economic growth in a region is a very important
indicator in determining the successful development of a region. National economic
growth is calculated through the GDP (Gross Domestic Product) can also be used as
indicator of the rate of the national economy which in this case concerns the
effectiveness of the determinants of economic growth such as, population, total
employment, per capita income, land area per capita and the level of technological
development. Based on the data published by the Ministry of Resources and Energy and
the Ministry of Environment in 2005, the CO2 generated by energy use accounts for
approximately 99% of greenhouse gas emissions, while the remaining 1% is generated
by methane (CH4), and nitrous oxide (N2O) , Furthermore, based on its source, tersebur
80% of CO2 emissions come from three main sectors: power generation, industry and
transport while the rest comes from household and other sectors. This sector is the third
largest energy user to follow the trend of increasing population and economic growth.
Keywords: Economic Growth Factor Relation with Environmental Quality
Background
Economic growth is an important concept in the development of a region. This is because economic
growth in a region is a very important indicator in determining the successful development of a region.

Proceedings of The 1th Almuslim International Conference on Science, Technology and Society (AICSTS) 2015
November 7-8, 2015, Bireuen, Indonesia
166
National economic growth is calculated through the GDP (Gross Domestic Product) can also be used as
indicator of the rate of the national economy which in this case concerns the effectiveness of the
determinants of economic growth such as, population, total employment, per capita income, land area per
capita and the level of technological development. The development of economic growth in Indonesia can
be seen in Table 1 below explaining that Indonesia's economic growth changes which fluctuate from year
to year but tend to grow positively.
Table 1. GDP growth of Indonesia Year 2000 – 2007 On Constant Prices of 2000
YEAR GDP Growth (Milyar Rp) Enhancement (%)
2000 1.389.770.20 4,86
2001 1.443.014,60 3,83
2002 1.504.380,60 4,25
2003 1.572.159,30 4,51
2004 1.656.757,54 5,38
2005 1.750.656,10 5,67
2006 1.846.654,90 5,48
2007 1.901.147,50 2,95
Average 4,618
On the other hand, as a comparison of the national level of economic growth, economic growth in North
Sumatra Province on 8 (eight) years on average showed positive growth and higher than the national
level, which is about 5.44%. The following description of economic growth in Sumatra at 8 (eight) years.
Figure 1. Economic growth in North Sumatra Province
Source: Central Bureau of Statistics (processed)
Proceedings of The 1th Almuslim International Conference on Science, Technology and Society (AICSTS) 2015
November 7-8, 2015, Bireuen, Indonesia
167
In line with the positive economic growth rate, on the other hand the quality of the environmental
problems that we are currently facing is the degradation of the environment around our area, especially
around the industrial area. Various cases of environmental pollution caused by the behavior of the
economy that are likely only concerned with economic growth and environmental neglect have a lot going
on in our country, among others, is the case of environmental pollution by PT. Lapindo hot mudflow
impacts resulting from the bowels of the earth so that pulverize all existing ecosystems in the region and
the case of environmental pollution by industrial wastewater PT. Kawasan Industri Medan that led to the
demonstration of residents around PT. KIM due to pollution of groundwater and river water Deli.
Cases of overlapping land use for mining in protected forests, for example, is not a difficult case we find in
these areas. The cases of environmental pollution also tends to increase. Advanced transportation and
industrialization are not accompanied by the application of clean technologies had a negative impact,
especially in the urban environment. Urban rivers polluted by industrial waste and household. Soil
conditions increasingly polluted by chemicals either from solid waste, fertilizers and pesticides. This
pollution problem due to low awareness of us, especially the business community for clean and healthy
life with good environmental quality. Coupled with the case of deforestation is also a matter of risky and
very broad impact not only on the mainland ex. The deforstasi, but also on the environment around the
area, even at the national and international environment.Privinsi Special District Capital of Jakarta with
PAD in Indonesia did not guarantee the realization of a healthy environment and clean in the province, it
can be seen based on the assessment of the Ministry of Environment of the 28 provinces of the index of
environmental quality (in terms of air quality, water and forest cover) the province is the province that has
the lowest environmental quality index is with a value of 41.73.
In implementing the national development, especially economic development in Indonesia are required to
pay attention to the three pillars of sustainable development equally. This is consistent with the results of
the UN Conference on the Environment held in Stockholm in 1972 and a Declaration of Environmental
Earth Summit in Rio de Janeiro of 1992 which agreed on the principle of decision making dimension of
development should pay attention to the environment and humans. Summit on Sustainable Development
in Johannesburg in 2002 which discussed and overcome the deterioration of environmental quality and
the Summit of the Environment in Bali in 2010 with an emphasis on global challenges based development
environment, the key issues on consumption and production patterns which deplete natural resources
faster than the effort conservation / recycling.
Environmental issues (environmental problems) is the excess / impact on the progress of the industrial
countries and the poverty of developing countries. All of it was covered in so-called "growth-problem"
which include rapid population growth needs, the growth of technology and industry are rapidly thus
requiring more input materials for the production process. Changes in mindset in memanfaatan natural
resources caused finally growth not only will involve fulfillment, but also reserves and limit carrying
capacity (carrying capacity) of natural resources used.
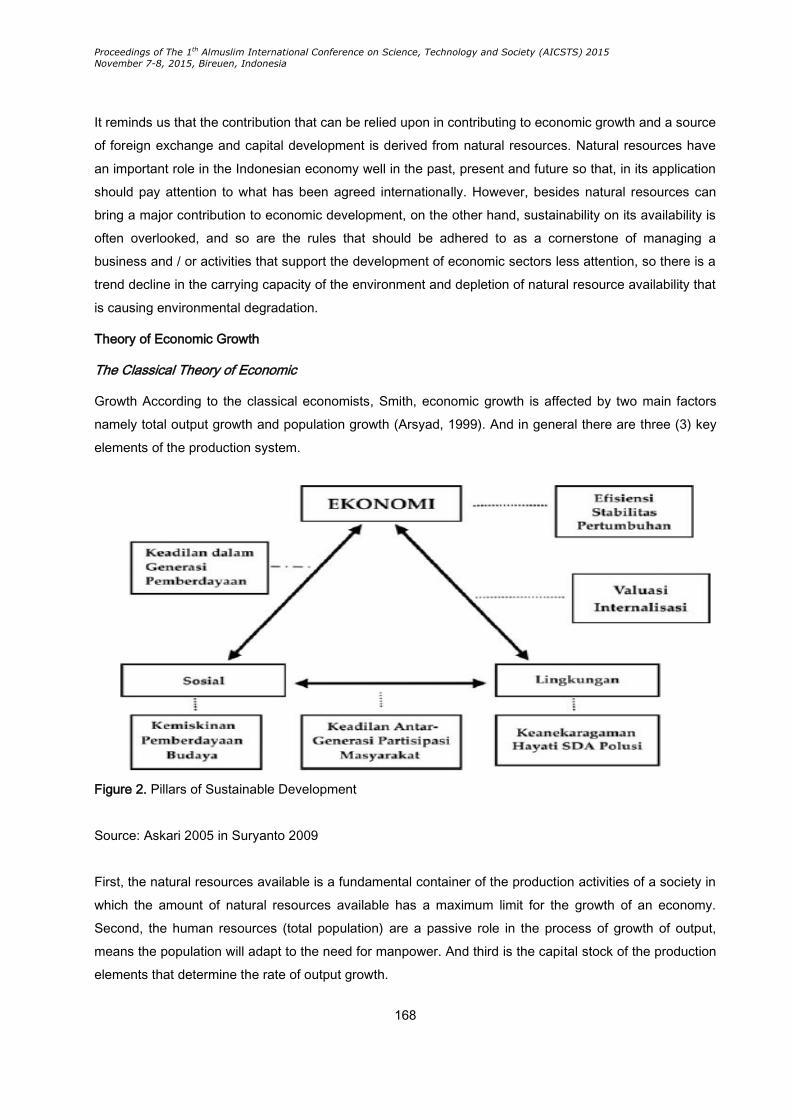
Proceedings of The 1th Almuslim International Conference on Science, Technology and Society (AICSTS) 2015
November 7-8, 2015, Bireuen, Indonesia
168
It reminds us that the contribution that can be relied upon in contributing to economic growth and a source
of foreign exchange and capital development is derived from natural resources. Natural resources have
an important role in the Indonesian economy well in the past, present and future so that, in its application
should pay attention to what has been agreed internationally. However, besides natural resources can
bring a major contribution to economic development, on the other hand, sustainability on its availability is
often overlooked, and so are the rules that should be adhered to as a cornerstone of managing a
business and / or activities that support the development of economic sectors less attention, so there is a
trend decline in the carrying capacity of the environment and depletion of natural resource availability that
is causing environmental degradation.
Theory of Economic Growth
The Classical Theory of Economic
Growth According to the classical economists, Smith, economic growth is affected by two main factors
namely total output growth and population growth (Arsyad, 1999). And in general there are three (3) key
elements of the production system.
Figure 2. Pillars of Sustainable Development
Source: Askari 2005 in Suryanto 2009
First, the natural resources available is a fundamental container of the production activities of a society in
which the amount of natural resources available has a maximum limit for the growth of an economy.
Second, the human resources (total population) are a passive role in the process of growth of output,
means the population will adapt to the need for manpower. And third is the capital stock of the production
elements that determine the rate of output growth.

Proceedings of The 1th Almuslim International Conference on Science, Technology and Society (AICSTS) 2015
November 7-8, 2015, Bireuen, Indonesia
169
Figures of the economy in this period include the Harrod-Domar through the model Harrod-Domar growth
model (Harrod Domar growth model). Growth theory Harrod - Domar essentially trying to show the
necessary requirement in order to create a state of steady growth (Steady Growth) which can be defined
as growth that will always create full use of production factors and capital will always prevail in the
economy. According to this theory of investment is a major factor of economic growth of a country, this is
because the investment has a dual character (Jhingan, 2005): first he can create revenue, and secondly it
could also increase the production capacity of the economy by increasing the capital stock. In contrast to
the classical past that only paying attention to one aspect of the formation of capital, Harrod-Domar not
only considers that capital formation as an expense that will add to the ability of an economy to produce
goods and are also looking at forming capital as an expense, which will eventually add to effective
demand throughout society.
Besides, Harrod-Domar also agreed with the opinion of Keynes (viewpoint request) which states that the
added ability to produce is not in itself will create additional production and the increase in people's
income but which led to the addition of production and the rise in national income was the increase in
public expenditure.
In this growth model assumes that there is a direct economic relationship between the magnitude of the
overall capital stock (K) and GNP (Y). The relationship is commonly known as the capital ratio / output
(capital / output ratio). If we let capital / out ratio as k, and the ratio of national saving (national saving
ratio), s, is an established part of the national output. If the amount of the investment (capital investment)
is determined by the amount of new savings, it can be arranged simple model of economic growth as
follows:
S = s. Y 2.1.
Definition: Savings (S) is a part, s, from National Income (Y)
I = 2.2
And because the amount of capital stock (K) is directly related to the amount of national income / output
(Y), as shown by the capital / output ratio, then:Definition: Investment (I) represents a change in capital
stock (K)
= k
= k = k 2.3.
Where from the equation obtained bahya / Y is the rate of change or the rate of GNP growth (percentage
change in GNP). So it can be said that economic growth is determined by the ratio of national savings, s,
and the ratio of capital / national output k. Thus the more you save and then implanted will have an
impact on the more rapid growth in demand. But what happens is not that simple, because the rate of
growth that can be reached by the investment / savings depends on its productivity.
Model Pezzey (Economic and Environmental Stock and Flows - a General Model)
Economic environment has three functions namely as a provider of raw materials, waste assimilation, and
appeal (insitue resources). The first and second function has a reciprocal relationship, that the production

Proceedings of The 1th Almuslim International Conference on Science, Technology and Society (AICSTS) 2015
November 7-8, 2015, Bireuen, Indonesia
170
process of processing raw materials into final goods at the same time produce waste that will be returned
to the environment. The third function that the natural environment is also providing services that can be
directly consumed, as well as fresh air and natural beauty. Pezzey (1992) describes the relationship
between the economy and the environment in more detail the so-called "economic and environmental
stocks and flows - a general model" as can be seen in Figure 3.
Figure 3. Economic and Environmental Srocks and Flows - a General Moedel
Source : Pezzey (1992:7)
From the figure it is seen that the rate of production of goods (Q) is not only determined by the availability
of capital (K), technology (T) and labor (L), but also by the quality of the environment (E). Quality of the
environment consists of stock SDA (R), the level of pollution (E1), and the value of the appeal (E2). The
dependence of production on the environment is called the productivity of the environment, namely Q (K,
L, T, R, E1, E2). The impact of the five variables on production levels is positive. So that the
environmental quality deteriorates mean lower production levels.
Model Pezzey is essentially an extension of Cobb Douglas production function by incorporating
environmental quality as an input that will affect the output. In contrast to other production factor inputs of
capital and labor that would raise output if both inputs are increased, increasing damage to the
environment will decrease output. Thus the basic theory in the research is the theory of production
expanded by incorporating elements of the environment. The production process that processes input so
the output at the same time produce waste as a by-product, so that the growing amount of BOD, TDS,
Proceedings of The 1th Almuslim International Conference on Science, Technology and Society (AICSTS) 2015
November 7-8, 2015, Bireuen, Indonesia
171
CO and CO2 will follow the development of economic activity, ceteris paribus, thus the amount of BOD,
TDS, CO, CO2 and critical lands also an output which is affected by economic activity. When more higher
economic activity, the amount of BOD, TDS, CO, CO2 and critical lands will increase which in turn will
lower the aggregate output. In this context it becomes relevant limits to growth. The concept of limits to
growth developed by Meadow suggests that the impact of economic growth on environmental
degradation is a trade off. It is based on two reasons, first the limited environmental capacity to
accommodate waste generated by economic activity, and the second limited non-renewable natural
resources. Meadow thinking has implications for an option that is economic growth or the environment. If
you want to preserve the environment, should limit economic growth. Conversely, if economic growth
takes precedence then the environment will bear the burden which in turn will limit the economy to grow.
Some criticism of the concept of limits to growth suggests that there are a number of reasons why in
some cases there are no limitations to grow, such as: the elasticity of income positive and increased the
quality of the environment, changes in the composition of production and consumption, increased levels
of education and awareness of the environment, advances in technology, and more open political
systems (Lim, 1997).
This implies that the relationship of economic growth against environmental problems depends on market
forces and policies and environmental regulations imposed by the government. Model Pezzey correcting
the concept of limits to growth that environmental quality is strongly influenced by the environmental
expenditure allocation of funds derived from the total revenue. Experience South Korean government
through its fiscal policy has proved this (Min, 2003). Thus Meadow fears about limits to growth will not
occur as long as there are efforts to control environmental degradation through appropriate environmental
expenditure. Pezzey thinking is synonymous with the Environmental Kusnetz Curve theory as an analogy
to the Kuznets curve that links between income per capita and income distribution.
Environmental degradation occurs because of the actions that lead to changes either directly or indirectly,
physical properties and / or biological environment that no longer function optimally in supporting
sustainable development (sustainability development). Environmental damage occurred on land, air and
water. Management of natural resources and the environment that are not conducted in accordance with
the capability of carrying capacity may trigger a food crisis, the water crisis, the energy crisis and the
environment. In general it can be said that almost all types of natural resources and environmental
components in Indonesia tend to decrease the quality and quantity over time. With a total forest area
located in Indonesia (123 459 514 Ha). The rate of deforestation in Indonesia according to World Bank
estimates between 700,000 to 1.2 million ha per year. Meanwhile, according to the Food Agricultural
Organization (FAO), said the rate of deforestation in Indonesia reached 1.315 million ha per year or
annually forest area was reduced by one percent (1%). Following the data of deforestation in the larger
islands are located in Indonesia.
From the above data, it can be indicated that the high level of exploitation of the forests in Indonesia
could lead to increased deforestation in Indonesia. Some forms of human exploitation of the forest that

Proceedings of The 1th Almuslim International Conference on Science, Technology and Society (AICSTS) 2015
November 7-8, 2015, Bireuen, Indonesia
172
we often encounter, including the activities of shifting cultivation, illegal logging, and logging by owners
Forest Management Rights (HPH) is none other than the purpose of these activities is the economic
value (economic growth, income and unemployment). This of course resulted in a decrease in forest main
function, namely as part of a life support system. With the onset of deforestation, coupled with the various
sources of pollution such as vehicle fumes, factory and domestic waste led to a decline in the quality of
the environment around us. One immediate concrete evidence that we feel as a result of environmental
degradation is the rise in sea level and changes in temperature and extreme climate.
Figure 4. Monthly CO2 concentration from 1980 to 2008. Trends Increase
Amounting to 162 ppm CO2 concentration / Ages
Air Temperature Time Series Data Using Observation and Model From 1870 until 2000, with the increase
in About 1 ° C.
The increase in CO2 concentration and air temperature, as can be seen in the two images above are
symptoms of a warming globe caused by the phenomenon of the greenhouse effect (greenhouse effect)
which causes the depletion of the ozone layer, shrinking area of tropical forests, and the spread of
deserts, as well as melumernnya permafrost in the North and South Pole of Earth may be indicated as
signs of environmental pollution, either because they use energy and the use of various chemicals are out

Proceedings of The 1th Almuslim International Conference on Science, Technology and Society (AICSTS) 2015
November 7-8, 2015, Bireuen, Indonesia
173
of balance and harmony. Uncontrolled pollution and environmental pollution due to a lot of waste
materials and industrial waste and household, showed ignorance of various parties and stakeholders
surrounding environment.
As a result of ignorance of the environment is of course very detrimental to us (living creatures, especially
humans), as disaster for life. Therefore, the problem of environmental pollution caused by the activities of
production and human consumption, requires an attitude patterns that can be used as capital to manage
and deal with environmental problems that occur. Based on the source, pollutant emissions of CO2, 80%
comes from three main sectors: power generation, industry and transport while the rest comes from
household and other sectors. This sector is the third largest energy user to follow the trend of increasing
population and economic growth (Idris, 2010). The increase in CO2 emissions would be potentially
damaging to the landscape and increase the earth's temperature due to the greenhouse effect.
In 2002, on the World Summit on Sustainable Development (World Summit on Sustainable Development-
WSSD) in Johannesburg, Indonesia is active in discussing and seeking to address the deterioration of
environmental quality, in the event it was decided that all the countries in this hemisphere are required to
implement sustainable development for the benefit of present and future with bersendikan on economic
development, social, cultural, environmental impartial as pillars are interdependent and reinforce one
another. Sustainable economic development is defined as development that meets the needs of the
present without compromising the right to meet the needs of future generations. Sustainable development
implies a guarantee of quality of human life and not beyond the ability of the ecosystem to support it. And
in general there are at least three (3) important reasons of the concept of sustainable development,
namely:
1. The reason, the present generation who enjoy the goods and services are sourced from nature
have an obligation to keep preserving natural resources and exploit excessively so that the
quality of natural resources and the environment is not reduced and future generations can also
enjoy and obtain goods and services services that are sourced from nature.
2. Reason ecology, natural resources in which biodiversity has a very strong ecological function, so
that production activities are carried out in order to produce goods and services should be
directed to things that threaten / reduce function is for the welfare of the creatures on earth.
3. Economic reasons, this reason is a reason that can not be separated because there is an
element in the development process of economic growth and true human being to live their lives
in general economic (rational to satisfy the utilities) Schumpeter (in Marchinelli and Smelser,
1990: 14-20) suggests the importance of innovation in the process of economic development in a
country. In this case, the rapid new findings can be used as a measure of the progress of
economic development of a nation. Technology allows tropical countries (particularly developing
countries) to take advantage of the wealth of natural forests in order to improve sources of foreign
exchange and various financing for development, but due to the resulting damage of tropical
forests at the same time various types of medicinal plants and a variety of rare species of fauna.

Proceedings of The 1th Almuslim International Conference on Science, Technology and Society (AICSTS) 2015
November 7-8, 2015, Bireuen, Indonesia
174
Technology provides advances to the steel industry, industrial ships, rail way, automobile industry, which
enrich human civilization. On the other hand technology is also capable of producing sulfur dioxide,
carbon dioxide, CFCs, and other exhaust gases that threaten human survival due to warming of the earth
due to the effect of "greenhouse". Technology is relied upon as the main instrument of a concept of the
"green revolution" can increase agricultural output because of the seeds, various types of fertilizers that
are supplements, pesticides and insecticides. So that the positive impact on the economic growth, per
capita income and the amount of labour.
As well as the experience of other countries that have gone through various stages of development
reached the stage of industrialization, Indonesia also relies on technology in the industry to maintain the
momentum of economic development with growth rates above 5% per year. The entry of technology into
Indonesia has been started since the enactment UUPMA (Act No. 1 of 1967, which is updated with
PP.No. 20 in 1994). With the support of the Law of Patents (Property Right) and the Law on the
Protection of Copyright (Intellectual Right), many multinational and foreign companies that use, wear and
develop technologies to produce a wide range of industrial products, especially the manufacturing
industry.
Apart from the success of the development donated by technologies and sectors indusri in Indonesia, in
fact there has been a deterioration of natural resources and increased environmental pollution, especially
in cities such emerging Gresik, Suarbaya, Jakarta, Bandung Lhoksumawe, Medan, and so on. In fact,
almost all regions in Java has gained increased air temperature, so a lot of people who feel swelter in the
area despite relatively rapid air cool and not industry. In this regard, Amsyari (in Sudjana and Burhan ed.,
1996: 104), noted the environmental circumstances in several cities in Indonesia, that has been a decline
in the quality of surface water around industrial areas. The concentration of pollutants that are harmful to
the health of the population such as mercury, cadmium, lead, pesticides, pcb, a sharp increase in the
water content of the surface and the water biota. Fresh water scarcity is increasingly felt, particularly in
the dry season, while in the rainy season tends to occur floods that hit many areas that cause harm due
to the condition of ecosystems that have been damaged.
Based on the data published by the Ministry of Resources and Energy and the Ministry of Environment in
2005, the CO2 generated by energy use accounts for approximately 99% of greenhouse gas emissions,
while the remaining 1% is generated by methane (CH4), and nitrous oxide (N2O) , Furthermore, based on
its source, tersebur 80% of CO2 emissions come from three main sectors: power generation, industry and
transport while the rest comes from household and other sectors. This sector is the third largest energy
user to follow the trend of increasing population and economic growth.
Maximum and minimum air temperature often varies, even the highest temperatures in some kola as
Jakarta has reached 37 degrees Celsius. An increase in the concentration of air pollution such as CO,
NO2 S02, and dust. The natural resources of the Indonesian nation was dwindling, such as petroleum
and coal are expected to be depleted by 2020. The forest area Indonsia getting narrower due to
uncontrolled encroachment deliberate or by catastrophic fires. Conditions increasingly fertile soil
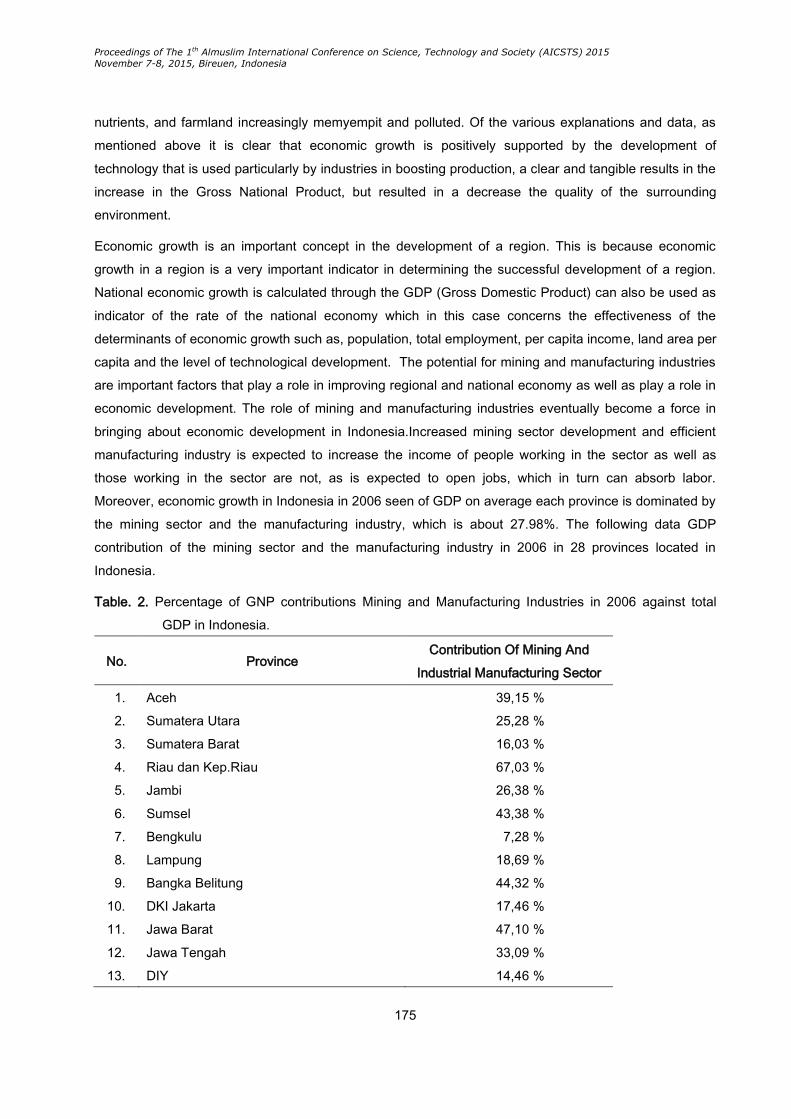
Proceedings of The 1th Almuslim International Conference on Science, Technology and Society (AICSTS) 2015
November 7-8, 2015, Bireuen, Indonesia
175
nutrients, and farmland increasingly memyempit and polluted. Of the various explanations and data, as
mentioned above it is clear that economic growth is positively supported by the development of
technology that is used particularly by industries in boosting production, a clear and tangible results in the
increase in the Gross National Product, but resulted in a decrease the quality of the surrounding
environment.
Economic growth is an important concept in the development of a region. This is because economic
growth in a region is a very important indicator in determining the successful development of a region.
National economic growth is calculated through the GDP (Gross Domestic Product) can also be used as
indicator of the rate of the national economy which in this case concerns the effectiveness of the
determinants of economic growth such as, population, total employment, per capita income, land area per
capita and the level of technological development. The potential for mining and manufacturing industries
are important factors that play a role in improving regional and national economy as well as play a role in
economic development. The role of mining and manufacturing industries eventually become a force in
bringing about economic development in Indonesia.Increased mining sector development and efficient
manufacturing industry is expected to increase the income of people working in the sector as well as
those working in the sector are not, as is expected to open jobs, which in turn can absorb labor.
Moreover, economic growth in Indonesia in 2006 seen of GDP on average each province is dominated by
the mining sector and the manufacturing industry, which is about 27.98%. The following data GDP
contribution of the mining sector and the manufacturing industry in 2006 in 28 provinces located in
Indonesia.
Table. 2. Percentage of GNP contributions Mining and Manufacturing Industries in 2006 against total
GDP in Indonesia.
No. Province Contribution Of Mining And
Industrial Manufacturing Sector
1. Aceh 39,15 %
2. Sumatera Utara 25,28 %
3. Sumatera Barat 16,03 %
4. Riau dan Kep.Riau 67,03 %
5. Jambi 26,38 %
6. Sumsel 43,38 %
7. Bengkulu 7,28 %
8. Lampung 18,69 %
9. Bangka Belitung 44,32 %
10. DKI Jakarta 17,46 %
11. Jawa Barat 47,10 %
12. Jawa Tengah 33,09 %
13. DIY 14,46 %

Proceedings of The 1th Almuslim International Conference on Science, Technology and Society (AICSTS) 2015
November 7-8, 2015, Bireuen, Indonesia
176
1 2 3
14. Jawa Timur 28,85 %
15. Banten 49,92 %
16. Bali 10,08 %
17. Nusa Tenggara Barat 30,29 %
18. Nusa Tenggara Timur 2,96 %
19. Kalimantan Barat 20,11 %
20. Kalimantan Tengah 16,49 %
21. Kalimantan Selatan 33,00 %
22. Kalimantan Timur 73,07 %
23. Sulawesi Utara 11,25 %
24. Sulawesi Tengah 9,02 %
25. Sulawesi Selatan dan Sulawesi Barat 22,84 %
26. Sulawesi Tenggara 13,76 %
27. Maluku Utara 11,31 %
28. Papua & Papua Barat 50,81 %
Source: BPS (processed)
Mean while, there has been a debate about the relationship between economic growth and environmental
quality, and this is because the difference and heterogeneity of the facts found by the researchers of the
study sites were meraka do. More specifically, the debate occurred in the attitude determination whether
prioritized environmental or growth economics put forward. And until today, the relationship between
environmental quality and economic growth remains an open question for anyone. So the relationship
between them is still controversial. Vincent (1997b) found evidence in the State Malaysia (1987-1991)
that specifically in the case of emissions of sulfur dioxide (SO2) there has been a decrease in quantity at
the time there was no increase in revenue. And of course, Vincent invention is contrary to the predictions
described by the Environmental Kuznets Curve (EKC). Carson et al. (1997b) in his research using time
series data on the states in the United States (1988 to 1994) obtained negative correlation between the
seven (7) the type of pollutants and economic growth. This indicates the relationship between the two that
still can not be explained and understood.
Studies related to the environmental index has been widely carried out mainly by universities abroad,
such as Yale University and Columbia University which resulted in the Environmental Sustainability Index
(ESI), and Virginia Commonwealth University who produce Environmental Quality Index (EQI). One
interesting study was published in 2008 by Yale University and Columbia University in collaboration with
the World Economic Forum and the Joint Research Center of the European Commission. The study
resulted in an index called Environmental Performance Index (EPI), and based on the index of Indonesia
ranks 102 of 149 countries with a value of 66.2.

Proceedings of The 1th Almuslim International Conference on Science, Technology and Society (AICSTS) 2015
November 7-8, 2015, Bireuen, Indonesia
177
Several studies have been conducted in Indonesia on the issue of economic growth (economic growth)
and environmental quality, but the authors argue that there is still need for a more complex analysis and
thorough review of the relationship between the two, particularly the factors of economic growth.
References
Ahmad Fauzi. 2010. Ekonomi Sumber Daya Alam dan Lingkungan Teori dan Aplikasi. PT. Gramedia
Pustaka Utama.x
Aminuddin, B. 2012. Dampak Kemajuan Teknologi Industri Terhadap Degradasi Lingkungan Hidup.
http://www.infopedia-van. blogspot.com / 2012 / 01 / valuasi-dampak-kemajuan-teknologi.html.
Diakses tanggal 6 Desember pukul 11.50 WIB.
Arsyad, Lincoln. 1999. Ekonomi Pembangunan. Edisi Keempat. STIE YKPN Yogyakarta
Barros, Fabio, et. Al (2002), “Poverty and Environmental Degradation : the Kuznets Environmental Curve
for the Brazilian Case”.
Berman, E., and L. T. M. Bui. (1998). “Environmental Regulation and Productivity: Evidence from Oil
Refineries.” National Bureau of Economic Research Working Paper 6776.
Boediono. 1999. Seri Pengantar Ilmu Ekonomi No. 4, Teori Pertumbuhan Ekonomi, UGM : BPFE
Brown, R.S., Christensen, L.R., 1981. Estimating the elasticities of substitution in
a model of partial static equilibrium: An application to U.S. Agriculture 1947 to 1974, in: Berndt, E.R.,
Field, B.C. (Eds.), Modeling and Measuring Natural Resource Substitution.
Budi Santoso (2005), “Keterkaitan Antara Pertumbuhan Ekonomi Nasional, Sektor Pertanian, dan Emisi
Gas Rumah Kaca”.
Carlino, G.A., and E.S.Mills. “The Determinants of County Growth.” J. Regl. Sci.
27 (February 1987): 39 – 54
Chali Nondo, Peter V. Schaeffer, Tesfa G. Gebremedhin, and Jerald J. Fletcher. 2010. “An Empirical
Analysis Of The Interactions Between Environmental Regulations and Economic Growth”.
Deller, S.C.T.H. Tsai, D. W. Marcouiller, and D.B.K. English. (2001). “The Role
of Amenities and Quality of Life in Rural Economic Growth.” American Journal of Agriculture Economics
83(2): 352 - 365
Dornbusch R, Fischer S, Startz R 2004. Macroeconomics 8th Edition. New York: Mc Graw-Hill
Francisia Seda. Sumber Daya Alam Dan Pembangunan: Sebuah Perspektif Komparatif. Makara, Sosial
Humaniora, Vol. 10, No. 1, Juni 2006: 33-48 3333. Departemen Sosiologi, Fakultas Ilmu Sosial
Dan Ilmu Politik, Universitas Indonesia, Depok 16424, Indonesia. E-Mail:

Proceedings of The 1th Almuslim International Conference on Science, Technology and Society (AICSTS) 2015
November 7-8, 2015, Bireuen, Indonesia
178
Frediksson, P.G. and D.L. Milliment. (2002). “Is There a ‘California Effect’ in
U.S. Environmental Policymaking.” Regional Science and Urban Economics 32(6) : 737-764
Folland, C.K., N.A. Rayner, S.J. Brown, T.M. Smith, S.S.P. Shen, D.E. Parker, I. Macadam, P.D. Jones,
R.N. Jones, N. Nicholls and D.M.H. Sexton (2001). "Global temperature change and its
uncertainties since 1861". Geophysical Research Letters 28: 2621-2624.
Glasson, J. 1977. An Introduction to Regional Planning. Terjemahan Paul Sitohang, 1990. Pengantar
Perencanaan Regional. Jakarta: LPFE-UI.
Proceedings of The 1th Almuslim International Conference on Science, Technology and Society (AICSTS) 2015
November 7-8, 2015, Bireuen, Indonesia
179
The Indirect Effect of Empowerment, Innovation, Professionalism,
Role Ambiguity, Role Conflict to Organizational Commitment,
Individual Performance and Turnover Intention
1*Hendra Raza, and 2 Rita Meutia
1,2Department of Accountancy, Faculty of Economic, Malikussaleh University, Lhokseumawe, Indonesia;
*Coresponding Author: [email protected]
Abstract
This study aims to examine empirically the indirect effect of empowerment, innovation,
professionalism, role ambiguity, role conflict to organizational commitment, individual
performance and turnover intention. This research based on a model of past research,
Raza et al (2014) developed and validated a general model of the antecedents and
consequences of turnover intention based on a survey of public accountant. Data
analysis is based on 163 public accountant using the structural Equation Modeling
assisted with an application of the Analysis Moment Structure (AMOS). The findings have
revealed that the model is acceptable and successfully proves on indirect effect
empowerment, innovation, professionalism on commitment organizational with throught
the mediating influence role ambiquity, indirect effect professional to organizational
commitment with throught the mediating influence role conflict and indirect effect
organizational commitment to turnover intention throught the mediating influence
performance.
Keywords: Empowerment, innovation, professionalism, role ambiguity, role conflict,
organizational commitment, individual performance and turnover intention
Introduction
This research based on a model of past research, Raza et al (2014) developed and validated a general
model of the antecedents and consequences of turnover intention based on a survey of public
accountant. Toly (2001) suggests that an organizational performance is determined by the condition and
behavior of the employees. It is common occurrence that the well-performing organizations can be
tampered with, either directly or indirectly, by a variety of employee behaviors that are difficult to prevent.
One of the forms is the employees’ behavior in developing the intention to leave the job. The contribution

Proceedings of The 1th Almuslim International Conference on Science, Technology and Society (AICSTS) 2015
November 7-8, 2015, Bireuen, Indonesia
180
of these studies on the literature is by providing evidence that the performance variable serves as a
determinant variable to turnover intention. The performance variable is rarely tested as the antecedent
variable in the turnover intention model. This model development is different from previous studies as it
includes the examination of variables that is importantly useful in the public accountant firms, namely,
auditors’ empowerment and innovation. An auditor who has empowerment, innovation and is highly
professional will contribute to the good name and image of the public accountant firms. This study has
also successfully developed the instruments on innovation by Margison and Binh (2009) that is from three
to six questions whereby the development of the questions in those instruments has become a special
instrument for an innovative auditor. The antecedents of individual performance consist of empowerment,
innovation, profesional, while, the role ambiguity and conflict used as the variables perceived by the
public accountants would affect the performance widely. Meanwhile, the organizational commitment
refers to a desire to maintain membership in an organization or profession which has been adopted as an
important variable (Aranya et al., 1981). The study also examines the consequences of performance on
turnover intention in public accountant firms. This model of performance and turnover intention analysis is
chosen because the findings in existing studies do not show the consistency and very seldom find any
researches that directly test the performance on the turnover intention of auditors. This research provides
empirical evidence of the public accountants and public accountant firms on the influence and direction of
the relationship among the variables of empowerment, innovation, professional, role ambiguity, role
conflict, organizational commitment, performance and turnover intention, so that the rate of auditors’
turnover can be reduced. This study refers to both behavioral and role theories. The theory emphasizes
on the role of individual characteristics as social actors who learn behaviors according to the position they
occupy in the workplace and society. Individuals will experience conflicts in themselves when there are
two or more pressure occurring simultaneously addressed in a person (Burney & Widener, 2007). Pujisari
(2001) states that the auditor is a profession closely related to conditions of stress because of the work
pressure and the fact that the role of accounting profession is considered as one of the ten professions
with the highest stress level in the United States (Bamber & Tubbs, 1989).
Research Methods
Procedure
Sampling Frame and Data Collection
The research data were collected by sending questionnaires through the postal mail. The list of public
accounting firms obtained from the Directory of Public Accountant and Certified Public Accountants was
issued by the ndonesian Institute of Certified Public Accountants (IAPI) in 2011. The members of the IAPI
who are registered with the Ministry of Finance as of January 28, 2011 are 1,322 accountants consisting
of 920 CPAs and 402 of non-CPAs. The questionnaires were sent to 902 accountants or to 451 public
accounting firms.

Proceedings of The 1th Almuslim International Conference on Science, Technology and Society (AICSTS) 2015
November 7-8, 2015, Bireuen, Indonesia
181
Validity and Reliability Tests
Validity test results have shown that all of the items are valid, while the reliability coefficient of the
questionnaire examining the five variables are all greater than 0.7, so that it can be concluded that the
instrument measures used in this study have given consistent results.
Variables Operationalization
The empowerment variable was measured using an instrument that was adopted from Margison and Binh
(2009), which consists of 5 questions with a 5-point interval scale ranging from strongly disagree (1) to
strongly agree (5). An individual innovation measured by using an instrument was developed by Margison
and Binh (2009) having 3 questions with a scale of 5 points interval scale ranging from strongly disagree
(1) to strongly agree (5). This questionnaire developed the instrument and it was translated into the
formation of 6 questions.Indicators for auditor professionalism were adopted from Wahyudi and Mardiyah
(2006) consist of 24 questions using 5 dimensions of professional auditors. The role of ambiguity variable
was measured with 6 indicators.Role conflict instrument consists of 12 questions with a scale of 5-point
interval scale ranging from strongly disagree (1) to strongly agree (5). The organizational commitment
was measured using the Organizational Commitment questionnaire (OCQ) adopted from Darlis (2000)
consisting of 9 questions with 5 point Likert scale ranging from strongly disagree (1) to strongly agree (5).
Performance was measured using an instrument that was adopted from Fisher (2001) consisting of 12
questions with a 5-point interval scale ranging from strongly disagree (1) to strongly agree (5). Turnover
intention. The research instrument of this variable was adopted from Pujisari (2001) which consists of 5
questions answered with a 5-point interval scale ranging from strongly disagree (1) to strongly agree (5).
Results and Discussion
Respondent Profile
The data were obtained from a total of 902 questionnaires that had been distributed to all public
accountant offices in Indonesia. Each office received two questionnaires with only 163 questionnaires
returned or with 18.03% return rate. This shows that the level of response rate is suffice for the size of
Indonesia by average of 10-20 percent. All of these questionnaires were used for data analysis consisting
of 97 (59.50%) male respondents and 66 (40.50%) female respondents.
Normality Test
Table 1 and 2 present the summary of the multivariate normality test on the first model.
As noted by Bryman and Cramer (2001), the value of the critical ratio> 5.00 indicates that the data are not
multivariate normal distribution, thus the data with the largest outliers need to be removed. After the data
were removed, the value of the critical ratio dropped to 4.978, so that it can be assumed that the data
were normally distributed and could be continued in the subsequent analysis.
Proceedings of The 1th Almuslim International Conference on Science, Technology and Society (AICSTS) 2015
November 7-8, 2015, Bireuen, Indonesia
182
Tabel 1. Summary of multivariate normality test on the first model
Variable min max Skew c.r. Kurtosis c.r.
Multivariate
176.514 10.216
Tabel 2. Summary of multivariate normality test on the last model
Variable min max Skew c.r. Kurtosis c.r.
Multivariate
92.159 4.978
Multicollinierity Assumption
The assumption of multicollinearity was tested to determine whether or not there is a strong correlation
between variables or even perfectly related among the variables’ measurements and latent variables. In
this study, the multicollinearity test is done by observing the output of the correlation matrix using the
AMOS program on the correlation of pairwise comparison parameter estimates. Based on the observation
of a correlation matrix, it is revealed that a correlation coefficient is greater than 0.80, therefore the
conclusion that can be made is that there are no multicollinearity problems among measurements and
latent variables.
Significance of the Model (Goodness of Fit)
The test of goodness of fit aims to determine whether the model has been obtained appropriately in
describing the relationship among variables. A test model fit in the structural equation modeling can be
analyzed based on several criteria such as testing the suitability of the model as presented in the
following table.
Table 3. Summary of Goodness of Fit Model Test
Indeks Estimation Value GOF Test Criteria Hasil Uji
CMIN 4997 (DF=2830)
The model is Accepted
p-value <0.001 p>0.05 (fit)
CMIN/DF 1.766 < 2 (marginal fit)
RMSEA 0.074 < 0.08 (fit)
RMR 0.042 < 0.05 (fit)
GFI 0.554 > 0.90 (marginal fit)
AGFI 0527 > 0.90 (marginal fit)
Based on the results in Table 3. It can be seen from the overall model fit test that the model estimation
results are acceptable, meaning that the empirical model is related to other theoretical models.
Proceedings of The 1th Almuslim International Conference on Science, Technology and Society (AICSTS) 2015
November 7-8, 2015, Bireuen, Indonesia
183
Figure 1. Standard Coefficient of Full Model
Measurement Model
The measurement model links between latent variables to the manifest variables. There are 8 latent
variables with a total of 77 manifest variables. The results for model goodness of fit is acceptable, thus it
can be used to test the proposed research hypotheses. It is followed with the validity test of each indicator
of the latent variables. The indicators are valid if it they have a weight factor greater than 0.45 and the
critical ratio is greater than 1.96. Figure 1 below presents the full path diagram model.
EA1
EA2
EA3
EA4
EA
0.463
0.467
0.542
0.578
EA50.552
0.7330.730
0.6770.650
0.669
KO
KO2
KO3
KO4
KO5
0.638
0.497
0.529
0.6720.573
KO6 0.624
KO7 0.639
KO8 0.645
AP
AP1 AP2 AP3 AP4 AP5
0.752 0.487 0.442 0.433 0.502
1
IA1
IA2
IA3
IA4IA
0.466
0.555
0.406
0.486
IA50.504
0.7310.667
0.771
07170.704
IA60.454
0.739
PA1
PA2
PA3
PA4
0.483
0.538
0.628
0.579
PA50.6550.7190.6800.6100.6490.587
PA60.594
0.637
PA7
PA8
PA9
PA10
0.603
0.639
0.690
0.606
PA110.567
0.630
0.601
0.5570.6280.658
PA120.674 0.571
PA13
PA14
PA15
PA16
0.612
0.542
0.539
0.562
PA170.594
0.6230.6770.6790.6620.637
PA180.550
0.671
PA19
PA20
PA21
PA22
0.550
0.589
0.641
0.607
PA230.690
0.6420.641
0.5990.6270.557
PA240.652
0.590
PA
AP6
0.699
KP
KP3 KP4 KP5 KP6 KP7
0.384 0.594 0.487 0.490 0.321
2
KP8
0.368
KP9
0.433
KP10
0.489
KP1 KP2
0.581 0.399
KO1 0.682
KO9 0.628
KIN
KIN5
KIN6
KIN7
KIN8
0.334
0.532
0.339
0.457
KIN9 0.578
KIN10 0.438
KIN11 0.460
KIN4 0.421
KIN12 0.566
KB
KB1
KB2
KB3
0.399
0.617
0.4220.760
KB4 0.487
KB5 0.365
KIN2
KIN3
0.301
0.421
KIN1 0.341
3
0.813
4
5
-0.215
-0.273
0.673
0.129

Proceedings of The 1th Almuslim International Conference on Science, Technology and Society (AICSTS) 2015
November 7-8, 2015, Bireuen, Indonesia
184
Measurement Model Latent Variables of Auditors’ Empowerment
The measurement on latent variables of empowerment, innovation, professional, role ambiguity, role
conflict, organizational commitment and performance as well as the auditor's turnover intention adopt the
weight values in each indicator greater than the value of critical ratio of 0.45, while all the critical value
ratios was > 1.96, meaning that all are valid indicators used as a tool to measure the latent variables.
Structural Model
The structural analysis models aims to identify the causal relationships among latent variables. This
model is a model that links the latent exogenous variable and latent endogenous variable or the latent
endogenous variables with other latent endogenous variables. Based on the existing research paradigm,
there are five structural models that will be tested in this study, which are mathematically formulated as
follows:
Role Ambiguity (AP) = 1.1 EA + 1.2 IA + 1.3 PA + 1
Role conflict (KP) = 2.1 EA + 2.2 IA + 2.3 PA + 2
Organizational commitment (KO) = 3.1 EA + 3.2 IA + 3.3 PA + 2.1 AP + 2.2 KP + 3
Performance (KIN) = 3.1 AP + 3.2 KP + 3.3 KO + 4
Turnover Intention (KB)= 4.1 EA + 4.2 IA + 4.3 PA + 4.1 KO +4.2 KIN + 5
Based on the results of the processed data using AMOS software, the estimation results obtained from
the five structural models are presented in the form of a path diagram as follows:
Figure 2. Path Diagram of the Research
EA
IA
PA
AP
KO
KP
KIN
KB
-0.442
-0.140
0.085
-0.170
-0.273
1
3
2
4
5
0.684
0.628
0.673
0.129
Proceedings of The 1th Almuslim International Conference on Science, Technology and Society (AICSTS) 2015
November 7-8, 2015, Bireuen, Indonesia
185
Analysis of the Indirect Effect
Empowerment, innovation, professional has indirect effect on the performance and turnover intention
through role ambiguity, role conflict and organizational commitment
In this research developed a model that connects role ambiguity as an intervening variable in the
relationship between empowerment, innovation and professional with organizational commitment, role
conflict as an intervening variable in the relationship empowerment, innovation and professional with
organizational commitment, organizational commitment as an intervening variable in the relationship
between role ambiguity and role conflict with auditor performance, the auditor performance as an
intervening variable in the relationship with the organizational commitment with the turnover intention. The
table below shows the direct and indirect effects of a construct to construct other.
Table 4. Standardized Direct Effects
PA IA EA KP AP KO KIN KB
KP -.754 -.519 -.266 .000 .000 .000 .000 .000
AP -.306 -.245 -.071 .000 .000 .000 .000 .000
KO .228 .109 .058 -.428 -.331 .000 .000 .000
KIN .000 .000 .000 -.012 -.263 .270 .000 .000
KB -.357 -.410 -.444 .000 .000 -.424 -.497 .000
Table 5. Standardized Indirect Effects
PA IA EA KP AP KO KIN KB
KP .000 .000 .000 .000 .000 .000 .000 .000
AP .000 .000 .000 .000 .000 .000 .000 .000
KO .285 .235 .138 .000 .000 .000 .000 .000
KIN .283 .224 .120 -.210 -.073 .000 .000 .000
KB -.239 -.179 -.105 .244 .141 -.117 .000 .000
The direct effect is the loading factor or lambda value of each indicator that form latent variables were
analyzed (Agusty, 2001). Explanation of direct and indirect effect is based on the table above will be
explained as follows:
The empowerment effect through an intervening variable of role ambiguity towards organizational
commitment
To discover the empowerment indirect effect through intervening variable of role ambiguity towards
organizational commitment will be compared between the magnitude of the direct and indirect effects of
the constructs. Empowerment direct effect on organizational commitment amounted to 0.058, while the
indirect effect through an intervening variable role ambiguity toward organizational commitment amounted

Proceedings of The 1th Almuslim International Conference on Science, Technology and Society (AICSTS) 2015
November 7-8, 2015, Bireuen, Indonesia
186
to 0.138, meaning that role ambiguity was intervening variable relationship between empowerment and
organizational commitment.
Effect of innovation auditor through intervening variable of role ambiguity towards organizational
commitment.
To discover the indirect innovation auditor effect through intervening variables of role ambiguity toward
organizational commitment will be compared between the magnitude of direct and indirect effects the
construct. Empowerment direct effect towards organizational commitment amounted to 0.109, while the
indirect effect of innovation auditor through an intervening variable of role ambiguity toward organizational
commitment amounted to 0.235, meaning that the role ambiguity was intervening variable relationship
between the auditor innovation and organizational commitment.
Professionals effect through an intervening variable of role ambiguity towards organizational commitment.
To know the effect of professional indirectly through an intervening variable of roole ambiguity towards
organizational commitment will be compared between the magnitude of the direct and indirect effects of
the constructs. The direct effect of professional towards organizational commitment amounted to 0.228,
while the indirect effect of professionals through an intervening variable of role ambiguity toward
organizational commitment amounted to 0.285, meaning that the role ambiguity was intervening variable
relationship between the professional and organizational commitment.
The empowerment effect through an intervening variable of role conflict towards organizational
commitment.
To know the indirect effect of empowerment through an intervening variable of role ambiguity towards
organizational commitment will be compared between the magnitude of the direct and indirect effects of
the constructs. The direct effect of empowerment towards organizational commitment amounted to -
0.428, while the indirect effect of empowerment through an intervening variable of role conflict towards
organizational commitment amounted to 0.000, meaning that the role conflict was intervening variables
relationship between empowerment and organizational commitment.
The innovation auditor effect through an intervening variable of role conflict towards organizational
commitment.
To know the indirect effect of innovation through intervening variables of role ambiguity towards
organizational commitment will be compared between the magnitude of the direct and indirect effects the
constructs. The direct effect of innovation towards organizational commitment amounted to -0.519, while
the indirect effect of innovation through an intervening variable of role conflict towards organizational
commitment amounted to 0.235, meaning that the role conflict was not intervening variables auditor
relationship between innovation and organizational commitment.
Proceedings of The 1th Almuslim International Conference on Science, Technology and Society (AICSTS) 2015
November 7-8, 2015, Bireuen, Indonesia
187
The professionals effect through an intervening variable of role conflict towards organizational
commitment.
To discover the indirect effect of professional through an intervening variable of role conflict towards
organizational commitment will be compared between the magnitude of the direct and indirect effects of
the constructs. The direct effect of innovation towards organizational commitment amounted to 0.109,
while the indirect effect of professional through an intervening variable of role conflict towards
organizational commitment amounted to 0.235, meaning that the role conflict was intervening variables
relationship between the professional and organizational commitment.
The role ambiguity effect through an intervening variable of organizational commitment towards auditors
performance.
To discover the indirect effect of role ambiguity through an intervening variable of organizational
commitment towards auditors performance will be compared between the magnitude of the direct and
indirect effects of the constructs. The direct effect of role ambiguity towards auditors performance
amounted to -0.263, while the indirect effect of role ambiguity through intervening variables of
organizational commitment towards auditors performance amounted to -0.073, which means that
organizational commitment was not an intervening variable relationship between role ambiguity and
performance.
The role conflict effect through an intervening variable of organizational commitment towards auditors
performance.
To discover the indirect effect of role conflict through an intervening variable of organizational
commitment towards auditor performance will be compared between the magnitude of the direct and
indirect effects of the constructs. The direct effect of role conflict towards auditors performance amounted
to -0.012, while the indirect effect of role conflict through an intervening variable of organizational
commitment towards performance amounted to -0.210, which means that organizational commitment was
intervening variable relationship between the role conflict and auditors performance.
The organizational commitment effect through intervening variables of auditor performance towards the
turnover intention
To know the indirect effect of organizational commitment through an intervening variable of performance
towards the desire to turnover of auditors will be compared between the magnitude of the direct and
indirect effects of the constructs. The direct effect of organizational commitment towards auditoors
performance amounted to 0.270, while the indirect effect of organizational commitment through an
intervening variable towards the desire to turnover amounted to -0.117, which means that the
performance was not an intervening variable relationship between organizational commitment and
turnover.

Proceedings of The 1th Almuslim International Conference on Science, Technology and Society (AICSTS) 2015
November 7-8, 2015, Bireuen, Indonesia
188
Conclusions
From testing the indirect effect is obtained tha role ambiguity was intervening variable relationship
between empowerment and organizational commitment, role ambiguity is an intervening variable
relationship between innovation auditors and organizational commitment, role ambiguity was an
intervening variable relationship between the professional and organizational commitment, role conflict
was an intervening variable relationship between professional and organizational commitment,
organizational commitment was an intervening variable relationship between role conflict and auditors
performance. While the role conflict was not an intervening variable relationship between empowerment
and organizational commitment, role conflict was not an intervening variable relationship between
innovation auditors and organizational commitment, organizational commitment was not an intervening
variable relationship between role ambiguity and performance, and performance was not an intervening
variable relationship between organizational commitment towards to turnover.
Acknowledgements
Acknowledgements to the management of Public Accountant granted permission to use the facilities and
time for this research. Thanks and highest appreciation to the dean of the faculty of Economic for
permission to participate in this research. Thanks also to the Almuslim University as an organizer The 1th
Almuslim International Conference on Science, Technology and Society (AICSTS) 2015.
References
Bamber, S. & Tubbs, L. (1989). An Audit Structure and Its Relationship to Role Conflict and Role
Ambiguity: An Empirical Investigation. The Accounting Review, 3, 285-299
Bryman, A. & Cramer, D. (2001). Quantitative Data Analysis with SPSS Release 10 for Windows,
London: Routledge.
Burney, L. & Widener, S. K. (2007). Strategic Performance Measurement Systems, Job Relevant
Information, and Managerial Behavioral Responses Role Stress and Performance. Behavioral
Research in Accounting, 19, 43-69.
Darlis, E. (2000), Analisis Pengaruh Komitment Organisasional dan Ketidakpastian Lingkungan terhadap
Hubungan antara Partisipasi Anggaran dengan Senjangan Anggaran (An Analysis on
Organizational Committement and Environment Uncertainty). Tesis Program Pascasarjana
Universitas Gadjah Mada. Yogyakarta.
Fisher, R. T. (2001). Role stress, the Type A behavior Pattern, and External Auditor, Job satisfaction and
Performance. Behavior Research and Accounting, 13, 164-176.
Margison, D. & Binh, B. (2009). Examining the human Cost of Multiple Role Expectations. Behavioral
Research in Accounting, 21(1), 59-81.
Proceedings of The 1th Almuslim International Conference on Science, Technology and Society (AICSTS) 2015
November 7-8, 2015, Bireuen, Indonesia
189
Pujisari, Y. (2001). Pengaruh Jenis Kelamin dan Peran Jenis Terhadap Kepuasan Kerja, Stres Kerja, dan
Keinginan Berpindah (The Influence of Gender and Type of Roles towards Job Satisfaction, Work
Stress and Turnover Intention). Tesis S2 Akuntansi Universitas Gadjah Mada. Yogyakarta
Raza, Hendra. Azhar Maksum, Erlina and Prihatin Lumban Raja (2014). Antecedents and
Consequences of Individual Performance: Analysis of Turnover Intention Model (Empirical Study of
Public Accountants in Indonesia). Journal of Economics and Bahavior Studies. Vol 6, No. 3, pp.
169-180, March.
Toly, A. A. (2001). Analisis Faktor-faktor yang Mempengaruhi Turnover Intention pada Staf Akuntan
Publik (An Analysis of Fcators affect the Turnover Intention on Public Accountants Staff). Skripsi.
Jurusan Ekonomi Akuntansi. Fakultas Ekonomi. Universitas Kristen Petra. http://Puslit.Petra.
Ac.Id/Journals/accounting.
Wahyudi, H. & Mardiyah, A. A. (2006). Pengaruh Profesionalisme Auditor Terhadap Tingkat Materialitas
dalam Pemeriksaan Laporan Keuangan. Simposium Nasional Akuntansi IX. Padang, 1-26. 180.

Proceedings of The 1th Almuslim International Conference on Science, Technology and Society (AICSTS) 2015
November 7-8, 2015, Bireuen, Indonesia
190
Employee Satisfaction Analysis on PT. Bintang Surya Perkasa
Medan
Nurhalima Pandiangan
Sekolah Tinggi Ilmu Ekonomi LMII Medan
Corresponding Author: [email protected]
Abstract
PT. Bintang Surya Perkasa Medan is a company engaged in oil palm. The background
for researchers to conduct this study are employees who feel less satisfied with the
facilities, salaries and working system of the company but can last working for decades to
PT. Bintang Surya Perkasa Medan. The theory was used is the theory according to
Sutrisno where job satisfaction is an employee attitudes toward work related to the
employment situation, cooperation among employees, remuneration in the works, and
matters concerning the physical and psychological factors. The analysis of data using the
data model analysis Miles and Huberman that consists of data reduction, display and
verification of data. The findings that the authors get is (1) 10 Person employees of PT.
Bintang Surya Perkasa field for 3-25 years, (2) The employees of PT. Bintang Surya
Perkasa Medan dissatisfied during work, (3) a good co-worker is the reason employees
of PT. Bintang Surya Perkasa field in order to feel at home working, (4) All employees of
PT. Bintang Surya Perkasa field can work together to solve problems or work, (5) PT.
Bintang Surya Perkasa Medan haven’t provide equal remuneration for work of the job, (6)
4 out of 10 employees of PT. Bintang Surya Perkasa Medan longtime choose to look for
a new job.
Keywords: Job Satisfaction
Introduction
Employees and companies are the two things that can not be separated. Employees play a major role in
running the survival of a company. If the employee has high morale, the company will run well and
towards the achievement of good. On the other hand, how could the company be able to run well, if
employees are not productive, which means that employees hasn’t a high morale, not tenacious in their
work and have low moral.

Proceedings of The 1th Almuslim International Conference on Science, Technology and Society (AICSTS) 2015
November 7-8, 2015, Bireuen, Indonesia
191
This is the main task of management so that employees have a high morale and tenacious work. So that
permanent employees provide optimal results and good company, then one way to find out what is
desired and expected by the employees is to determine employee satisfaction.
As the development of global business, currently competeting entrepreneurs to enter the market or even
be able to dominate the market. To that end, first the company must have the resources, especially
human resources. Because of human resources is a workforce that has a major role in the company to
support the company's success. Besides, to complete its work, the employee also has a responsibility to
maintain the confidentiality of the enterprise. Therefore, corporate leaders must keep permanent
employees working at home in the company.
Job satisfaction depends on the difference between what is expected and what is obtained. If the
employee obtained as expected, then the employees will feel satisfied. And vice versa, if the employees
are not obtained in accordance with those obtained from the company, it will causing the employees do
not feel satisfied.
PT. Bintang Surya Perkasa Medan is a company engaged in oil palm. Currently, the issue of exit-entry of
the employee is already a commonplace. But how would happen if the velocity of the incoming and
outgoing employees too quickly and in a relatively short time? We need to look at what is actually
happening and what is wrong from the company and the need to be cautious because it is dangerous for
the future of the company.
Formulation of the Problem
Based on the background presented above it can be the formulation of the problem is: How can job
satisfaction at PT. Bintang Surya Perkasa Medan.
Research Purposes
This study aimed to find out the factors that influence job satisfaction of employees at PT. Bintang Surya
Perkasa Medan.
Research Methods
In conducting this study the authors used a qualitative descriptive method that is data that has been
collected will be compiled and analyzed, so that it can be used as a clear statement about the condition of
the company.
Descriptive research method is used to describe a variety of symptoms and facts contained in the social
life in depth. This method aims to describe and understand a condition in society as fenomologis in this
study, the analysis of job satisfaction given by the company to its employees.
Data Research
1. Secondary Data

Proceedings of The 1th Almuslim International Conference on Science, Technology and Society (AICSTS) 2015
November 7-8, 2015, Bireuen, Indonesia
192
Secondary data is data that is collected by others, not by the researchers themselves. Researchers just
noted, accessing, or requesting other data that has been gathered kepihak field. Researchers only utilize
existing data for research.
Secondary data include supporting data obtained from the document PT. Bintang Surya Perkasa field as
the organizational structure or the data obtained from various sources related to the object of research.
2. Primary Data
Primary data is the original data collected by researchers to answer the research question specifically.
This data is not available in a complicated form or in the form of files. Therefore, researchers need to
procure the data itself because it can not rely on data from other sources. In this study, the primary data
obtained directly from the source, so priset is the first to obtain the data.
Data Collection Procedures
a. Structured Interview (Structured Interview)
Structured interviews be used as a data collection technique when researchers have known for certain
about what information will be obtained. In conducting interviews, data collectors have set up a research
instrument in the form of alternative answers to written questions has been prepared.
b. Semistructured interview (semistructured interview)
This type of interview in the implementation freer when compared with a structured interview. The
purpose of this interview is to find problems more openly, where the parties invited to the interview are
asked their opinions and ideas.
c. Unstructured interviewing (Unstructured Interview)
Is a free interview in which researchers used structured interview guide that has been systematically and
fully equipped for data collection.
Researchers will carry out a structured interview, namely by preparing and compiling a list of questions
well before fulfilling the interview process to employees who work in PT. Bintang Surya Perkasa field to
obtain the necessary data in the study.
Implementing Procedures Research
This research is conducted in stages - the following stages:
1. First the researchers seek approval from the company that will be examined to allow researchers to
conduct research on job satisfaction of employees working in the company.
2. The authors observe matters related to employee job satisfaction and making lists of questions to do
interviews on matters to be observed regarding employees satisfied or not satisfied with what has
been obtained from the company for the purpose of gathering information or data- the necessary data
so that it can produce a conclusion.

Proceedings of The 1th Almuslim International Conference on Science, Technology and Society (AICSTS) 2015
November 7-8, 2015, Bireuen, Indonesia
193
Analysis Data
a. Data reduction
The data obtained from the field is quite a lot, for it then to be noted carefully and in detail.
b. Presentation of Data
Once the data is reduced, then the next step is to present the data. With the present data, it will be easier
to understand what is happening, to plan further work based on what has been understood.
c. Verification
The third step in the analysis of qualitative data is the conclusion and verification. Preliminary conclusions
presented are still provisional, and will change if not found strong evidence that supports the next stage of
data collection. But if the conclusions put forward in the early stages, supported by evidence of valid and
consistent when researchers returned spaciousness collect the data, the conclusions put forward a
credible conclusion.
Validity of Data
By using triangulation, in fact researchers have collected simultaneously test the credibility of the data, ie
checking the credibility of the data with a variety of data collection techniques and data sources. The
purpose of triangulation is not for the truth about some phenomenon, but rather the approach to the
understanding of what researchers have found.
According to Saebani (2008), triangulation can be divided into two kinds:
a. Triangulation techniques, the researchers used data collection techniques are different to obtain
data from the same source.
b. Triangulation of sources, namely the researchers used data from different sources using the
same technique.
In testing the validity of the data collected, the authors use triangulation Source.
Discussion
From the interview above can we describe some of the new findings, namely:
1. Causes of job satisfaction is not only of salaries and incentives earned and facilities provided, but the
employees also wanted the company prioritizes the welfare of employees.
2. Giving money craft is one of the causes of job satisfaction increased while cutting the salaries of
employees is one of the causes of job satisfaction decreases.
3. If PT. Bintang Surya Perkasa Terrain requested permission to miss half a day, the employee will be
considered absent 1 day (full) and will be subject to pay cuts in accordance with the calculation of the
company.
Proceedings of The 1th Almuslim International Conference on Science, Technology and Society (AICSTS) 2015
November 7-8, 2015, Bireuen, Indonesia
194
Conclusion
Based on the discussion that has been done in previous chapters, the authors put forward some
conclusions as follows:
1. Factors that influence job satisfaction and lead to employee turnover at the PT. Bintang Surya
Perkasa Medan is the employee feels uncomfortable because the company does not give priority to
the welfare of employees, do not give overtime pay and incentives, and the lack of facilities provided.
2. Job satisfaction depends on the difference between what is expected and what is obtained. If the
employee obtained as expected, then the employees will feel satisfied. And vice versa, if the
employees are not obtained in accordance with those obtained from the company, it will cause
employees to feel dissatisfied.
3. Based on the analysis and evaluation by the author to analyze the existing data in the job satisfaction
of employees at PT. Bintang Surya Perkasa Medan, the obtained results that generally employees
working in PT. Bintang Surya Perkasa field is dissatisfied.
References
Fathoni, abdurrahmat. 2006. Manajemen Sumber Daya Manusia. Cetakan Pertama. Jakarta : PT. Rineka
Cipta.
Handoko, T. Hani. 2001. Manajemen Personalia dan Sumber Daya Manusia. Yogyakarta: BPFE-
YOGYAKARTA
Hasibuan, H. Malayu S. P. 2009. Manajamen Sumber Daya Manusia. Cetakan ketiga belas. Jakarta: PT.
Bumi Aksara.
Junaidy, 2007. Metode Penelitian. Cetakan Kedua. Jakarta: PT. SINAR INDO.
Mangkunegara, Anwar Prabu. 2004. Manajemen Sumber Daya Manusia Perusahaan. Bandung: PT
Remaja Rosdakarya Bandung.
Nawawi, H. Hadari. 2005. Metode Penelitian Bidang Sosial. Cetakan kedua belas. Jakarta: Gadjah Mada
University Press.
Saebani, Beni Ahmad. 2008. Metode Penelitian. Bandung: CV. PUSTAKA SETIA
Siregar, Syofianh. 2010. Statistika Deskripif untuk Penelitian. Jakarta: PT. Raja Grafindo Persada.
Sondang P. Siagian. 2009. Manajemen Sumber Daya Manusia. Cetakan ketujuh belas. Jakarta: PT Bumi
Aksara.
Sopiah, 2008. Perilaku Organisasional. Yogyakarta: CV. ANDI OFFSET.
Stephen, P Robbins. 2007. Manajemen. Cetakan kedelapan. Jakarta: PT. INDEKS.

Proceedings of The 1th Almuslim International Conference on Science, Technology and Society (AICSTS) 2015
November 7-8, 2015, Bireuen, Indonesia
195
Sugiyono. 2010. Metode Penelitian Kuantitatif kualitatif dan R&D. Cetakan ketiga belas Bandung:
Alfabeta.
Sutrisno, Edy.2009. Manajemen Sunber Daya Manusia. Cetakan Pertama. Jakarta: Kencana Prenada
Media Group.
Triton PB. 2010. Manajemen Sumber Daya Manusia. Cetakan Pertama. Jakarta: PT. SUKA BUKU.
Wibowo. 2008. Manajemen Kinerja. Edisi Pertama. Jakarta: PT. Raja Grafindo Persada.

Proceedings of The 1th Almuslim International Conference on Science, Technology and Society (AICSTS) 2015
November 7-8, 2015, Bireuen, Indonesia
196
Potential of Sustainable Livestock Agroindustry in Indonesia
*1,2) Sitti Zubaidah
1Lecturer in Animal Science of Agriculture Faculty, Almuslim University, Aceh Province, Indonesia.
2Doctoral Student in Program Study of Agribusiness Management Department Livestock Faculty,
Brawijaya University, Malang, Indonesia.
Corresponding Author: [email protected]
Abstract
Indonesia is one of the high population country every year and high daily consumption of
food. Sustainable livestock agroindustry serve as important link between livestock,
agriculture and industry. Livestock agroindustries in Indonesia have not been develop on
scientific lines, as is the case in the developed countries of the worlds. Lack of proper
infrastructure, inadequacy of capital, lack of entrepreneurial environment and the
absence of proper policy framework are some of constrains that did not allow this industry
to grow on scientific line. Thus, in the present review an attempt has been made to
analyze the prospect of livestock agroindustry in Indonesia to see and to analyze the
pontensial business for smallholder livestock may be defined as a set of economic
activities that are concerned with the conservation, handling and processing of agriculture
product. These activities try to make livestock agroindustry product usable as food, fuel or
industrial raw material. Development of livestock agroindustry has a great opportunity to
expand because of its substantial capacity. There is a vital need to frame policies and
their implementation for livestock agroindustry development, considering the conservation
of biodiversity both floral and fauna species. Sustainable livestock agroindustry
contribute immensely to Indonesia economy in various way, namely in the provision of
food for the increasing population; supply of adequate raw materials to a growing more
industrial sector; a major source of employment; generation of foreign earning; and
provision of market for the products of the agroindustry sector among others.
Keywords: Sustainable, Agroindustrial, Livestock Farming, Economic Analysis, Feed
Supply.
Introduction
Livestock agroindustry is one of potential sectors in increasing community economic besides income for
the country such as Indonesia. Indonesia is a developing country that has a various diversity livestock

Proceedings of The 1th Almuslim International Conference on Science, Technology and Society (AICSTS) 2015
November 7-8, 2015, Bireuen, Indonesia
197
farming system which done by smallholder agribusiness. This activity is to raise up their economic needs
as their investation, and daily needs.The productivity of smallholder agribusiness is key for promoting
agribusiness growth. It is crucial to expand smallholder access to finance, risk management strategies,
inputs, services, and extension, and increase investment in rural infrastructure. If investments in public
agribusiness research are doubled to US$ 10 billion by 2013 and are targeted toward poor regions,
overall agribusiness output growth increase by 1.1 percentage points a year and lift about 282 million
people out of poverty by 2020 (von Braun, 2008).
There are many definitions of sustainable, but here the sustainable livestock agroindustry use the one
formulated by the Food and Agriculture Organization (FAO) of the United Nations that is the management
and conservation of the natural resources base, and the orientation of technology and institutional change
in such a manner as to ensure the attainment and continued satisfaction of human needs for present and
future generations. Such sustainable development (in the agriculture, forestry and fisheries sectors)
conserves land, water, plant and animal genetic resources, is environmentally viable and socially
acceptable.
Demand of livestock meat in Indonesia affected by the real domestic price of beef, the real price of fish,
the real price of chicken, income per capita and the change of population, while domestic supply of beef
in Indonesia affected by the real price of beef imports, import tariffs and the exchange rate. Own price
elasticity of demand of beef is elastic, that is equal to 0.81. While the import price elasticity of imports of
beef import is elastic, that is equal to 1.40 (Januarti, 2009).
Based on The Global Competitiveness Report, World Economic Forum (2009), one of the important
strategy should done by Indonesia is to increase competitive value product export to international market.
Based on competitive value position, Indonesia is the lowest ranking in Asia Pacific that is 55 from 125
countries. As comparing ranking in Asia Pacific namely: Singapore (5), Hongkong (11), South Korea (13),
Taiwan (17), Malaysia (21), China (30) and India (48). Also The World Development Report (World Bank,
2007) state that in developing economies that are a hub of rural poor, rising inequalities lead to the
unfulfilled expectation that create political tensions. It necessitates the growth in agriculture and the rural
non farm economy to reduce rural poverty and narrow down the prevailing inequality.
Expanding decentralization to properly manage resources at the local level and prevent conflict or
disaster, and implementing legal action and legal aid are essential to support the poor who are threatened
by conflict or disaster. Strengthening property rights is particularly important. For land acquisitions
abroad, a proper code of conduct needs to be put in place to prevent negative effectson the poor and
escalation of conflict or disaster (von Braun, 2009).
Through livestock agroindustry activities, it is expected that the smallholder livestock enable to obtain
value-added products/ services, income generation, and futher lead to promote regional economic growt
and create employment opportunities for rural communities. On the hand, the slow development in the
beef processing-industry is currently caused by low level of knowledge and skill the farmers, weak
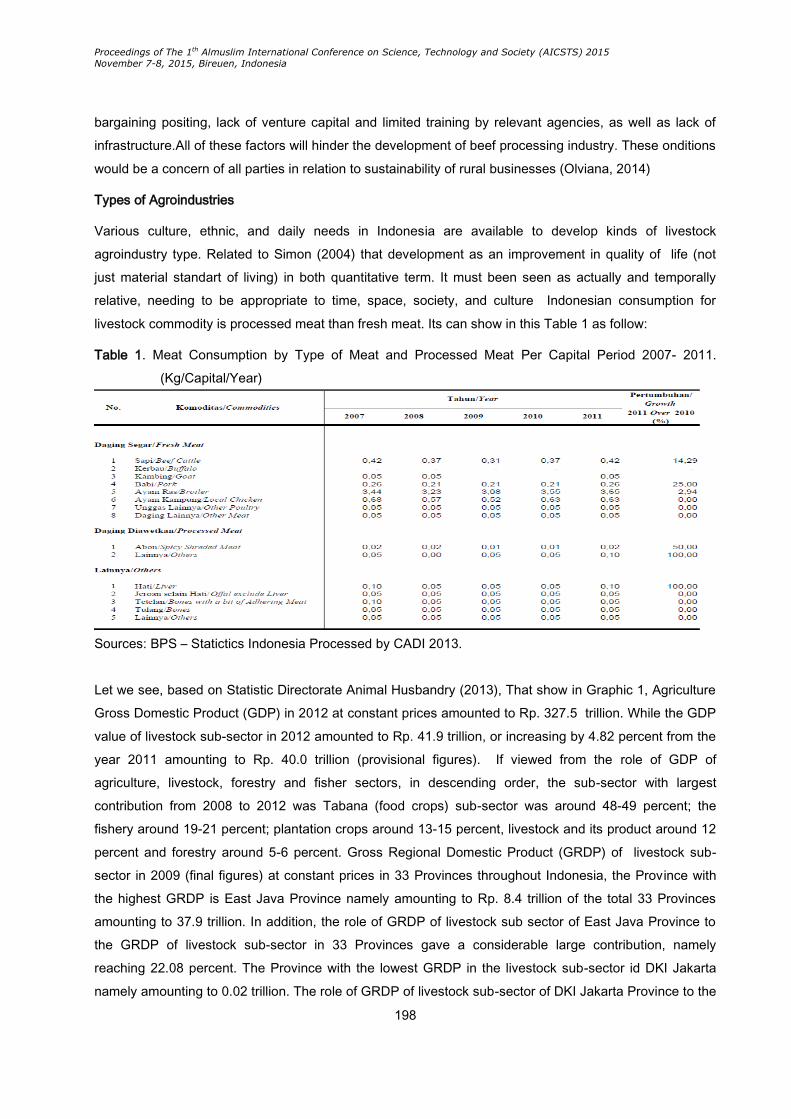
Proceedings of The 1th Almuslim International Conference on Science, Technology and Society (AICSTS) 2015
November 7-8, 2015, Bireuen, Indonesia
198
bargaining positing, lack of venture capital and limited training by relevant agencies, as well as lack of
infrastructure.All of these factors will hinder the development of beef processing industry. These onditions
would be a concern of all parties in relation to sustainability of rural businesses (Olviana, 2014)
Types of Agroindustries
Various culture, ethnic, and daily needs in Indonesia are available to develop kinds of livestock
agroindustry type. Related to Simon (2004) that development as an improvement in quality of life (not
just material standart of living) in both quantitative term. It must been seen as actually and temporally
relative, needing to be appropriate to time, space, society, and culture Indonesian consumption for
livestock commodity is processed meat than fresh meat. Its can show in this Table 1 as follow:
Table 1. Meat Consumption by Type of Meat and Processed Meat Per Capital Period 2007- 2011.
(Kg/Capital/Year)
Sources: BPS – Statictics Indonesia Processed by CADI 2013.
Let we see, based on Statistic Directorate Animal Husbandry (2013), That show in Graphic 1, Agriculture
Gross Domestic Product (GDP) in 2012 at constant prices amounted to Rp. 327.5 trillion. While the GDP
value of livestock sub-sector in 2012 amounted to Rp. 41.9 trillion, or increasing by 4.82 percent from the
year 2011 amounting to Rp. 40.0 trillion (provisional figures). If viewed from the role of GDP of
agriculture, livestock, forestry and fisher sectors, in descending order, the sub-sector with largest
contribution from 2008 to 2012 was Tabana (food crops) sub-sector was around 48-49 percent; the
fishery around 19-21 percent; plantation crops around 13-15 percent, livestock and its product around 12
percent and forestry around 5-6 percent. Gross Regional Domestic Product (GRDP) of livestock sub-
sector in 2009 (final figures) at constant prices in 33 Provinces throughout Indonesia, the Province with
the highest GRDP is East Java Province namely amounting to Rp. 8.4 trillion of the total 33 Provinces
amounting to 37.9 trillion. In addition, the role of GRDP of livestock sub sector of East Java Province to
the GRDP of livestock sub-sector in 33 Provinces gave a considerable large contribution, namely
reaching 22.08 percent. The Province with the lowest GRDP in the livestock sub-sector id DKI Jakarta
namely amounting to 0.02 trillion. The role of GRDP of livestock sub-sector of DKI Jakarta Province to the

Proceedings of The 1th Almuslim International Conference on Science, Technology and Society (AICSTS) 2015
November 7-8, 2015, Bireuen, Indonesia
199
GRDP of livestock sub-sector in 33 Province gave a considerable low contribution, 0.05 percent as Table
2 and 3 explanation.
Source : BPS Statistic Indonesia (2013)
Figure 1. GDP value of livestock Periode 2008 - 2011 (Milyar RP)
Table 2. GDRP of Livestock 2007 - 2011 (at constant market price 2000) by Province (Billion Rupiahs)
Source: BPS Statistic Indonesia (2013)

Proceedings of The 1th Almuslim International Conference on Science, Technology and Society (AICSTS) 2015
November 7-8, 2015, Bireuen, Indonesia
200
Table 3. GDRP of Agriculture 2007 - 2011 (at constant market price 2000) by Province (Billion rupiahs)
Source: BPS Statistic Indonesia (2013)
Related to BPS Statistic Indonesia (2013) that is a large of livestock companies which have lend capital
increase each year is 182 units. They are Foreign Investment 17 units, Domestic Investment 113 units,
and others 52 unitsinclude PT/CV/ Firma companies 152 units, Government Company 3 units,
Cooperative 2 units, and Community Organization 25 units. Total of livestock processing industry in
Indonesia is 23.941 units, its consist of 19.773 in Java Island and 4.168 unit outside Java Island.
Beef Cattle Agroindustry
Beef cattle is one of potential commodity for development in Indonesia. The cattle population is spread
throughout the country. In certain area, beef cattle are seen as a superior commodity and it can be
developed to be an agroindustrial product. Development of beef processing industry is largely determined
by the availability and distribution of livestock. The importance role of beef cattle agroindustry in
Indonesia can be seen in terms of employment for approximately 44.3% of the Indonesia population and
as a source of raw material to the industry. Development of beef processing industry should be seen as a
cooperation network in the form of Triple Helic Partnerships among government, farmers and capital
owners. To develop beef cattle agroindustry performance such as in Kupang, Indonesia need to make a
strategic map and set priorities based on the relation of performance measures dependency and
Proceedings of The 1th Almuslim International Conference on Science, Technology and Society (AICSTS) 2015
November 7-8, 2015, Bireuen, Indonesia
201
feedback of intra and inter cluster strategic goals. This research showed that the model approach in an
integrated Interpretive Structure Model (ISM) and Analytic Network Process ANP are able too explore
insight and opinions with regard to decision makers in the organization’s strategic objectives agroindustry
development of the area of beef cattle in Indonesia (Olviana, 2014).
Based on the Table 3 above show that Beef Cattle Population in Indonesia is up every year. There are
large beef cattle population specially in Kalimantan Tengah, Papua Barat, and D.I. Yogyakarta, and
lower in D.K.I. Jakarta, Nusa Tenggara Timur, and Gorontalo. Population of beef cattle of course
supported by breeding of beef cattle company since 2000 - 2012 from 6 units to 33 units, and beef cattle
farming from 71 units to 109 units (BPS, 2013). Similarly to beef meat production by Province in
Indonesia as Table 4.
Poultry Agroindustry
Poultry industry in Indonesia nowadays develops related to global poultry that focus on effectiveness level
(productivity and efficiency) which of optimum one. But effort to develop poultry industry still have
obstacle to face global market included product competitive, its related to labour service, available feed
for poultry that spent of 60 - 70% from production cost, for that depend on import feed poultry product
(Departemen Pertanian, 2008). The Table 5 and 6 show in that poultry population and production
increase each years with total of broiler industry are 176 units. They are breeding pure line activity 3
units, Grand Parent Stock 7 units, Parent Stock 60 units and broiler farming 106 units (BPS, 2013).
Economic Analysis of Agroindustry
Population growth, urbanization and income growth determine demands for agricultural and animal
products. The highest income elasticity of demand for livestock products is found in Africa and Asia, while
milk exhibit a generally lower elasticity of demand than meat and eggs. The analysis of beef cattle
marketing in Indonesia – Gunungkidul Regency, shows that a marketing chain in cow trading includes
cattler-cattle broker-trader-wholesaler-butcher-consumer. The highest marketing margin which is found in
such a marketing chain is Rp. 2.200.000,- for each cow, the highest share which is as much as 100% is
gained in the direct marketing channel from the cattle raiser to the consumer; and the direct marketing
channel from the cattle raiser to consumer is the most efficient chain in marketing beef cattle. The lowest
cost and marketing margin is found in the first type of marketing chain which directly goes from the cattle
raiser to the consumer; and the lowest farmers share is found in the fourth type of marketing channel, and
the first type of marketing channel which directly goes from the cattle raiser to the consumer is the most
efficient chain, it has the highest farmer share which reaches up to 100% (Widitananto, et al., 2012).
Generation of bio-gas plants has a promising role to reduce the burden of firewood in the mid-slopes and
valley regions, where human population concentration is high. It is emerging in these area greatly and
becoming a supplement to firewood for household energy needs. Data were gathered regrading the
generation and uses of bio-gas and their favorable impact on the local natural resource base particularly
on firewood (Sati, 2008).
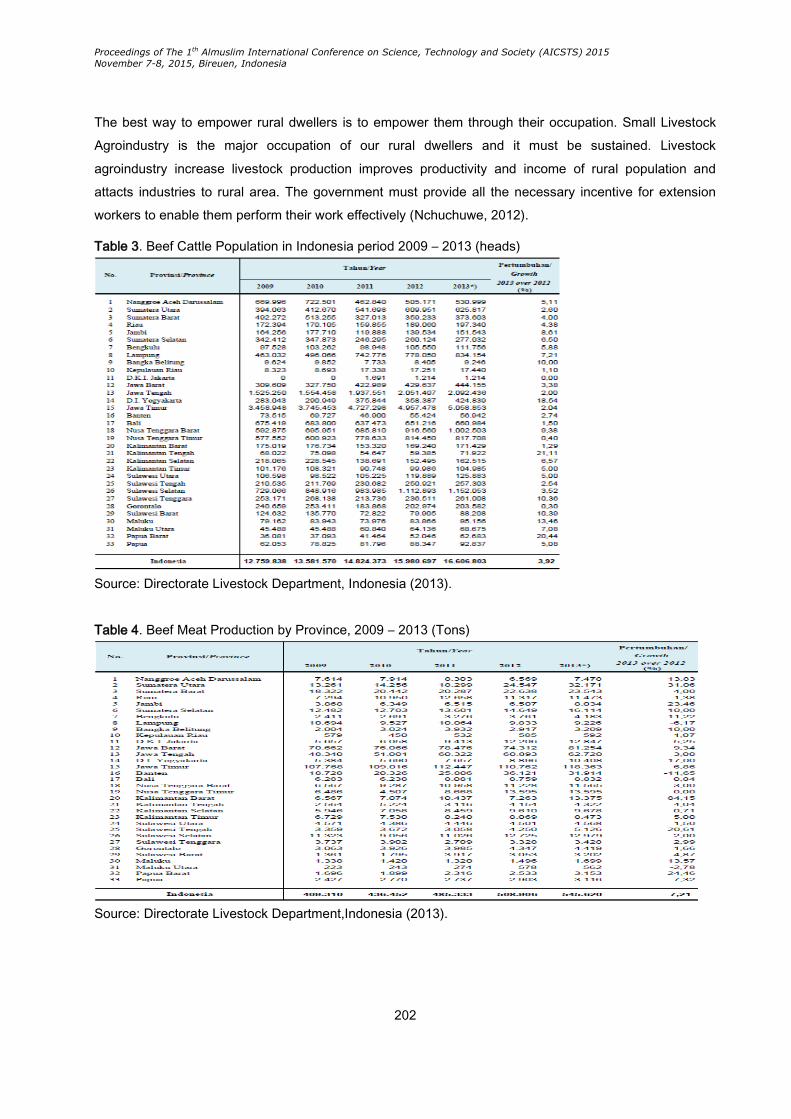
Proceedings of The 1th Almuslim International Conference on Science, Technology and Society (AICSTS) 2015
November 7-8, 2015, Bireuen, Indonesia
202
The best way to empower rural dwellers is to empower them through their occupation. Small Livestock
Agroindustry is the major occupation of our rural dwellers and it must be sustained. Livestock
agroindustry increase livestock production improves productivity and income of rural population and
attacts industries to rural area. The government must provide all the necessary incentive for extension
workers to enable them perform their work effectively (Nchuchuwe, 2012).
Table 3. Beef Cattle Population in Indonesia period 2009 – 2013 (heads)
Source: Directorate Livestock Department, Indonesia (2013).
Table 4. Beef Meat Production by Province, 2009 – 2013 (Tons)
Source: Directorate Livestock Department,Indonesia (2013).
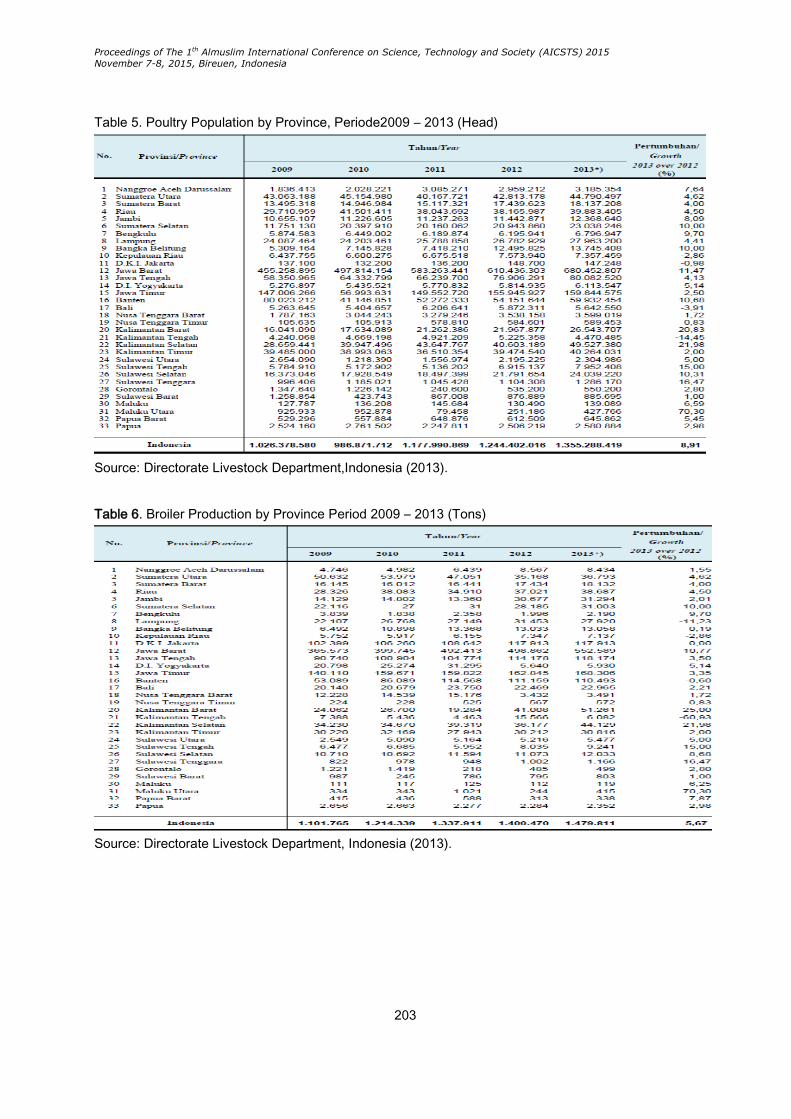
Proceedings of The 1th Almuslim International Conference on Science, Technology and Society (AICSTS) 2015
November 7-8, 2015, Bireuen, Indonesia
203
Table 5. Poultry Population by Province, Periode2009 – 2013 (Head)
Source: Directorate Livestock Department,Indonesia (2013).
Table 6. Broiler Production by Province Period 2009 – 2013 (Tons)
Source: Directorate Livestock Department, Indonesia (2013).
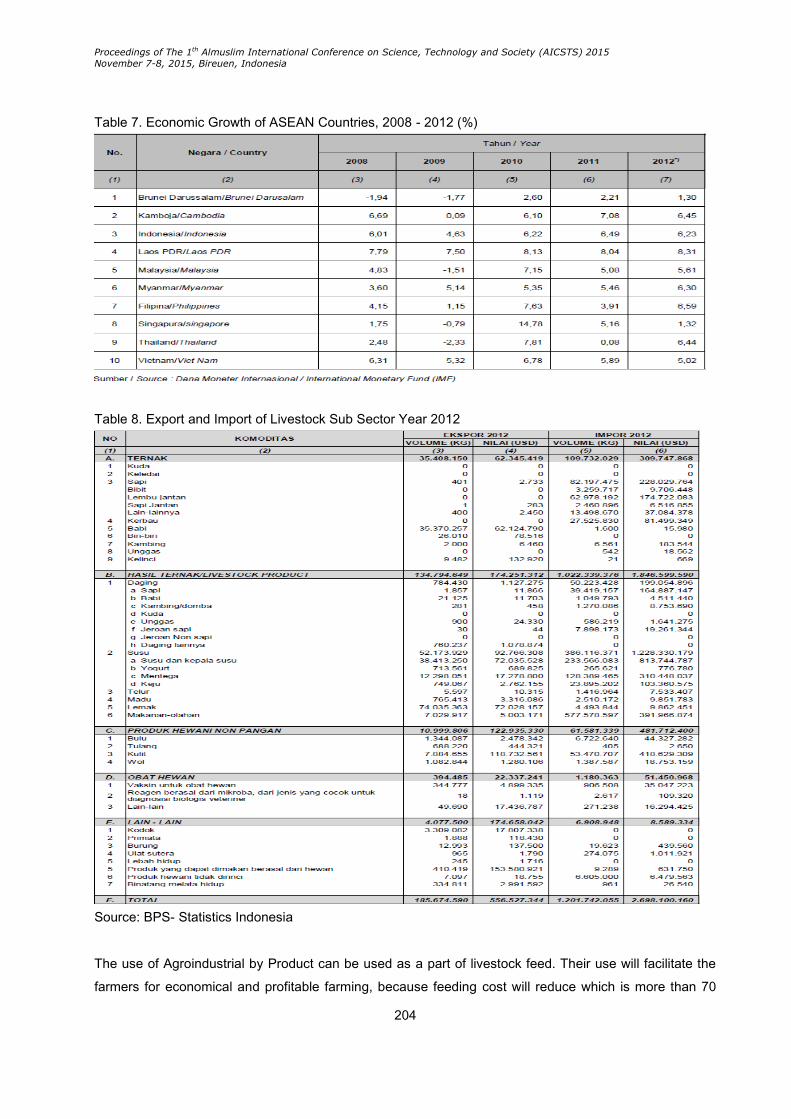
Proceedings of The 1th Almuslim International Conference on Science, Technology and Society (AICSTS) 2015
November 7-8, 2015, Bireuen, Indonesia
204
Table 7. Economic Growth of ASEAN Countries, 2008 - 2012 (%)
Table 8. Export and Import of Livestock Sub Sector Year 2012
Source: BPS- Statistics Indonesia
The use of Agroindustrial by Product can be used as a part of livestock feed. Their use will facilitate the
farmers for economical and profitable farming, because feeding cost will reduce which is more than 70

Proceedings of The 1th Almuslim International Conference on Science, Technology and Society (AICSTS) 2015
November 7-8, 2015, Bireuen, Indonesia
205
percent of the total cost of production. Agroindustry has high potential to develop and has impact to
economic specially for society and country. Almost 14% labour in total of millennium country are actve
participate in agroindustrial processing directly or indirectly (Dhiman, 2011)
A contract, in essence, is a tool to settle individual interest, allowing the parties involved to move closer to
achieving a particular interest in a business environment that, in theory, would have zero cost.
Economically speaking, in a free business environment, adjusting interest will lead to to the best possible
allocation of resources, maximizing results to the parties and, if one chooses to address more than
individual interest alone, a better result to society (Freire, 2013)
Problem of Sustainable Livestock Agroindustry
Two global collective actions are needed to reduce volatility and prevent the price spikes that caused
violent responses in so many countries in 2008: first, a small, independent physical reserve should be
established under the auspices of the Word Food Programme exclusively for emergency response and
humanitarian assistance. Second, a virtual reserve and intervention mechanism should be created to help
avoid the next price spikes. Normally, Intervention will not be necessary, as the signaling mechanism will
be sufficient to divert speculators (Von Braun, 2009).
There are many constraints of sustainable livestock agroindustry resources in the Indonesia like poor
quality and quantity, drought, ecological deterioration, over grazing, land tenure/change of ownership,
border conflict, weed and bush encroachment, soil infertility and lack of seed and planting material
(Birham, 2014). However, in addition to the efficiency of individual contracts, when they are insensible to
the economy of a specific region, there are other aspects of social efficiency that lead to the expectation
that an analysis identifying limits of contractual model could be important in the pursuit of the economic
development of a country (Freire, 2013). Livestock agroindustry development program up to now were
hardly based on the understanding of the livestock production systems, multipurpose production and its
complex relationship between the biological, technical and social components of these system.
Development is not measured only by the production levels and purchase power of a country (Sen, 2000)
but also helps to form a developed society and most importantly to improve social matters, and evaluation
of development can come from other parameters particularly the evaluation of available substantive
freedoms that can involve, likes, political freedom, economic amenities, social opportunities, assurances
of transparency, and protective safety.
Estimated farm-specific technical efficiency indecies ranged from 0.54 - 0.99 with a mean of 0.77. The
average level of technicals efficiency suggest that from a technical standpoint, the opportunity exist to
expand beef production using the cureent level of inputs and the technology already availble in the area.
The inefficiency model showed that education, experience, number of cattle ownership, and credit have
significat impact on technical inefficiency (Isyanto, et al., 2013)
Proceedings of The 1th Almuslim International Conference on Science, Technology and Society (AICSTS) 2015
November 7-8, 2015, Bireuen, Indonesia
206
Suggestion and Recommendation in Future Priorities
Livestock agroindustry development has the potential not only to modernize sector of the economy other
that agriculture, construction and services, but also contributes to achieving a variety of social objectives
such as employment, gender equality, maintaining labor standards and facilitating greater access to
education and health care. The more developed a country’s industrial capacity, the greater the potential
for economic growth and human development. UNIDO as a specialized agency of the United Nations in
industrial development aims to promote and accelerate sustainable industrial development worldwide,
especially in developing countries.
The economic literature provides clear indications that agroindustries have a significant global impact on
industrial development and poverty reduction in both urban and rural communities. Agroindustry
generates employment and income opportunities by providing work placements in both farming and off
farming activities (FAO & UNIDO, 2008).
Province of Indonesia have a tremendous potential to develop and potential for expand the merchandise
export of agroindustrial products, for which there is growing demand in the international market. Exporting
agroindustrial products carries two major benefits: first, such export can be instrumental in the acquisition
of modern technology in return for the mechanization of livestock; second, sustained growth of
agroindustrial exports can help Indonesia countries reduce poverty and jobless
Acknowledgment
The author want to say thank you for Brawijaya University Lecture who support and give many idea in this
article related to dissertation.
References
Atmiyati (2006). Daya dukung Hijauan Pakan Terhadap Pengembangan Ternak di Kabupaten Sambas.
Balai Penelitian, Ternak. Bogor.
Birham, M and Adugne, T (2014). Livestock Feed Resources Assessment, Constraints and Improvement
Strategies in Ethiopia. Middle-East Journal of Scientific Research 21 (4): 616-622, 2014.
Budiarsana, IGM (2009). Economic Analysis of PE Goat as Milk and Meat Producer in a Farming System.
Seminar Nasional Teknologi dan Veteriner 2009.
Departemen Pertanian (2008). Analisis Produktivitas Usaha Peternakan Ayam Pedaging Pola Kemitraan
Perusahaan Pengelola di Kecamatan Kandat Kebupaten Kediri. Jurnal Fakultas Pertanian Institut
Pertanian Bogor.
Freire, W and Carla M, (2013). Institutional Environment and Contract: A Case Stusy in The
Agroindustrial system of Broiler Factory Farming in the West of the State of Parana, Brazil. Ano 2
(2013), no 2/ http://www.idb-fdul.com/ ISSN: 2182-7567, pp.1541-1567.

Proceedings of The 1th Almuslim International Conference on Science, Technology and Society (AICSTS) 2015
November 7-8, 2015, Bireuen, Indonesia
207
FAO/ UNIDO (2008). Agriculturl Mechanization in Africa. Time for action. Report of an Expert Group
Meeting. FAO/ UNIDO, Vienna. January 2008.
Isynato AY, Iksan M, Hanani N, and Syafrial (2013). Measurement of Farm Level Efficiency of Beef
Cattle Fattening in West Java Province, Indonesia. Journal of Economic and Sustainable
Development. Vol. 4 , No. 10, 2013.
Januarti, I. (2009). Demand and Supply of Beef in Indonesia. Prosiding Seminar Nasional Peternakan
Berkelanjtan. “Inovasi Agribisnis Peternakan unuk Ketahanan Pangan”. Fakultas Peternakan
Universitas Padjadjaran. http://peternakan.unpad.ac.id
Directorat Jenderal Peternakan dan Kesehatan Hewan. Livestock and Animal Health Statistics. 2013.
Kementerian Pertanian. http://ditjennal.deptan.go.id
Olviana, T, Darmawan DP, Ambarawati A, and Sulistyowati L (2014). Development of Beef Cattle
Agroindustries Performance Model in East Nusa Tenggara, Indonesia. Journal of Economic and
Sustainable Development. Vol.5, No.21, 2014.
Nchuchuve, FF and Adejuwon, KD (2012). The Challenges of Agriculture and Rural Development in
Africa: The Case Nigeria. International Journal of Academic Research in Progressive Educaton
and Development. July 2012, Vol.1, No.3.
Sati,V.P. and Singh R.B (2008). Prospect of Sustainable Livestock Farming in the Uttarakhand Himalaya,
India. Journal of Livestock Science 1 (1): 9-16.
Simon, D (2004). Recent Trends in Development Theory and Policy: Implication for Democratization and
Government.
Sen, A (2000) Desenvolvimento como Liberdade. Sáo Paulo: Companhia das Letras.
von Braun J., S.Fan, R.Meizen, M.W. Rosegrant, and A. Nin Pratt (2008). International Agricultural
Research for Food Security, Poverty Reduction, and The Environment: What to expect from
scaling up CGIAR investment and “best bet” programs. Washington, DC: International Food Policy
Research Institute. http://www.ifpri.org/pubs/books/oc58.asp .
von Broun J., and M. Torero (2009). Implementing physical and virtual food reserves to proteck the poor
and prevent market failure. Policy Brief 10. Washington, DC: International Food Policy Research
Institute. hhtp://www.ifpri.org/pubs/bp/bp010.asp.
von Broun J. (2009). Threat to Security Related to Food, Agriculture, and Natural Resources – What to
Do?. Strategic Discussion Circle’ EADS, Berlin March 26, 2009.
Widitananto A, Sihombing G, and Sari AI (2012). The Analysis of Marketing of Beef Cattle in Playen
district, Gunungkidul regency. Tropical Animal Husbandry Vol. 1 (1), October 2012: 59 – 66. ISSN
2301-9921.

Proceedings of The 1th Almuslim International Conference on Science, Technology and Society (AICSTS) 2015
November 7-8, 2015, Bireuen, Indonesia
208
World Economic Forum (2009). The Global Competitiveness Report 2008 – 2009.
Source:http//www.gcr.weforum.org.
World Bank (2007). World Development Report 2008: Agriculture for Development, Washington, DC.
Proceedings of The 1th Almuslim International Conference on Science, Technology and Society (AICSTS) 2015
November 7-8, 2015, Bireuen, Indonesia
209
Behavior Analysis of Employees and Human Resources
Development Policy to Performance of Employees at Sekolah
Tinggi Ilmu Ekonomi LMII Medan
Togu Harlen Lbn. Raja
Sekolah Tinggi Ilmu Ekonomi LMII
Corresponding Author: [email protected]
Abstract
In an organization that is composed of several employees explained that there are
behaviors of different employee that needed a leader who is able to manage the different
employee behavior. Organized employee behavior will influence the performance of
employees in the organization. Then a leader of the organization must also plan the
development of human resources within the organization to support the performance of
employees in the organization. Human resource development policies greatly affect the
improvement of the performance of employees in the organization so that it makes the
head of the organization to create a policy for the development of human resources.
Keywords: Employee Behavior, Human Resources Development Policy and Performance
Officer.
Introduction
In a growing organization must be supported by the availability of existing human resources and other
resources that contribute to the performance of the organization. The leadership of the organization must
have a strong commitment in taking into account the organization's future and the future of the human
resources available so that organizational goals can be achieved annually and can be further enhanced.
As a leader of an organization does require a good idea, especially in managing the human resources
that exist within the organization to raise the morale of the workers in achieving the goals of the
organization and the individuals themselves.
Every human being that exist in an organization has a different behavior because it is based on the
background of each human being so that if an organization has 100 workers then there are 100 behaviors
that exist in the organization.
Proceedings of The 1th Almuslim International Conference on Science, Technology and Society (AICSTS) 2015
November 7-8, 2015, Bireuen, Indonesia
210
The role of leadership of the organization is very important because it required the ability to manage a
number of behaviors that exist in the organization into a similar attitude in working for the organization. To
realize one's behavior in an organization then the organization can create rules to be followed jointly by
all the workers that exist in the organization. Human resources that exist in every organization must be
maintained and enhanced by the organization throughout the year because it will be able to maintain the
existence of the organization throughout the year.
Human resources that exist in any organization is a very valuable asset to the organization where the
human resources as the driving force of all activities that exist in the organization. However, it should be
considered by organizations that the increase in human resources should be improved always in order to
provide a greater contribution to the organization. Improved human resources can be done in various
ways, among others: training, education and human resource development.
With the holding of training and improvement of education and human resource development will obtain
qualified human resources so as to produce a good performance.
Human resource development is a planned effort by the organization in canoes improving human
resources so as to change the behavior of workers who are in the organization. Miftah Thoha 2011,
explains that the organization's behavior is a study concerning aspects of human behavior within an
organization or a particular group. All activities take place in the company is a performance conducted by
labor and management of company in order to carry out the ongoing activities of the company in
achieving their respective goals. Employee who is in the Sekolah Tinggi Ilmu Ekonomi LMII Medan to
create a good performance for the Sekolah Tinggi Ilmu Ekonomi LMII Medan can achieve the expected
performance by the institution. Employee performance both as employees in the company carrying out
the duties and responsibilities assigned to it so that the burden of such work can be completed in
accordance with the time.
Formulation of the Problem
Based on the background described the existing problems can be formulated as follows:
1. Is there any influence employee behavior to employee performance at the Sekolah Tinggi Ilmu
Ekonomi LMII Medan.
2. Is there any influence of human resource development to employee performance at the Sekolah
Tinggi Ilmu Ekonomi LMII Medan.
3. Is there any influence employee behavior and human resource policies floating on the
performance of employees at the Sekolah Tinggi Ilmu Ekonomi LMII Medan.
The Objectives
1. To analyze how much influence employee behavior to employee performance at the Sekolah
Tinggi Ilmu Ekonomi LMII Medan.
2. To see how much influence the development of human resources to employee performance at
the Sekolah Tinggi Ilmu Ekonomi LMII Medan.
Proceedings of The 1th Almuslim International Conference on Science, Technology and Society (AICSTS) 2015
November 7-8, 2015, Bireuen, Indonesia
211
3. To see how much influence employee behavior and human resource development to employee
performance at the Sekolah Tinggi Ilmu Ekonomi LMII Medan.
Understanding Behaviour
In the course of the company's human behavior influence the future development of the organization
because of human behavior that will positively impact the company's performance.
According Soetjipto and Noor, 2003, says that behavior is behavior that is considered a person in his life
both abstract and not causing anything for himself as well as a process for others and the behavior is the
result and purpose and can be observed and measured to motivate himself. Griffin, in 2000, explained
that that personality has a relationship to human behavior consisting of 5 types of behavior, namely:
1. The level of approval that indicates the level of the individual to interact and cooperate with
others.
2. Level of seriousness and awareness that is the serious effort in achieving the objectives of the
organization.
3. The level of negative emotions that explains emotional instability owned by individuals in the
work.
4. The level of flexibility and convenience is the ability of individuals to feel comfortable and free for
others to interact with it.
5. The level of openness that is the behavior of individuals to be open to others.
Then used to measure the parameters of employee behavior on employee behavior, namely:
1. The spirit and excitement of working.
2. Power work initiatives.
3. Engagement work.
4. The linkage to the organization.
Then Robbins, 2007, explaining that when studying the behavior of employees in an organization
includes three levels, namely:
1. The individual level is an innate characteristic of individuals in the organization.
2. The level of the dynamics of groups is group behavior and its determinant factors.
3. Depth organizations is organizational factors that affect behavior.
To get employees who have good behavior, the organization should seek to improve human resources
employee who is in each organization through increased education, training and development of human
resources that exist in the organization.
Human Resource Development
Development of human resources that exist in the organization must be improved by the organization to
facilitate the achievement of organizational goals. Organizations should make human resource
development plan that aims may provide better performance for the organization resulting in improvement
and self-development of existing employees in the organization.

Proceedings of The 1th Almuslim International Conference on Science, Technology and Society (AICSTS) 2015
November 7-8, 2015, Bireuen, Indonesia
212
Marwansyah, 2000, said that in order to increase the competence of workers in a planned management
seeks to develop human resources. In improving the human resources it needs to make human resource
planning activities, namely (Edy Sutrisno, 2009):
1. Inventory supply of human resources.
2. Predicting human resources.
3. Preparation of plans for human resources.
4. Monitoring and evaluation.
In doing human resource development, the company must make a measurable planning through training
and improvement of formal education so as to produce employees who have the expertise, skill,
knowledge and good behavior in the self-employees. Singodimedjo, 2000, said that human resource
development is the process of preparing individuals to take responsibility for a different or higher in the
organization and is usually associated with increased intellectual ability to carry out a better job.Then the
purpose of the development of human resources is as follows (Mathis and Jackson, 2001):
1. Increase labor productivity.
2. The realization of a harmonious relationship between superiors and subordinates and the
opportunity for innovative thinking.
3. The occurrence of the decision-making process more quickly and precisely because it involves
employees.
4. Improving morale (motivation) of all employees.
Then Malayu P., Hasibuan, 2009, explains that there are parameters used in measuring the development
of human resources, among others:
1. Achievement of employees.
2. Discipline employee.
3. Attendance employees.
4. The level of cooperation.
5. Initiative employees.
Robbins, 1991, explained that the policy of human resource development consists of: training and
development, career development, performance appraisal, reward system.
Performance of Employees
Organization is very focused on the performance of employees where this is caused by the interest of the
organization to the performance generated by employees to realize the expectations of the organization
for the future. Employee performance is the result of the work of employees in carrying out their duties
and responsibilities in the organization as employees are sincere and honest in their work and have the
attitude to work not because of compulsion.
Wibowo, 2007, said that the performance was the result of work that has a strong relationship with the
organization's strategic objectives, customer satisfaction and contribute to the economy. Then Irham
Proceedings of The 1th Almuslim International Conference on Science, Technology and Society (AICSTS) 2015
November 7-8, 2015, Bireuen, Indonesia
213
Fahmi, 2011, said that the performance is the result obtained by a good organization the organization is
non-profit oriented and profit oriented produced during a period of time.
Organizational performance is as effectiveness of the organization as a whole to meet the needs of a
group defined with respect to the systematic efforts and improve the organization continuously achieves
their needs effectively (Chaizi Nasucha, 2004).
According to Anwar A., Mangkunagara, 2005, said that the factors that can measure the performance of
employees is:
1. Quality of work includes accuracy, thoroughness, skill and cleanliness.
2. The quantity of work consists of the output routine and non-routine or extra.
3. Reliability or whether or not reliable ie whether or not to follow instructions, the ability of
initiative and prudence.
4. Attitude is covering attitudes toward the company, another employee to work and cooperation.
According Malthis and Jackson 2006, which explains that the employes performance parameters are:
1. The quantity of results.
2. The quality of the results.
3. Timeliness of the results.
4. Presence.
5. The ability to cooperate.
Research Paradigm
Where :
X 1 = Behaviour Officer.
X 2 = Human Resources Development.
Y = Performance Officer.
Research Methods
In this study as an object of research is the High Sekolah Tinggi Ilmu Ekonomi LMII Medan.
The study was conducted in 3 months since June until August 2015. In this study were used as the
population is the entire faculty and staff in the Sekolah Tinggi Ilmu Ekonomi LMII Medan field totaling 45
people. Samples that used in research are the entire faculty and staff in the environment Sekolah Tinggi
Ilmu Ekonomi LMII Medan.
X 1
PRILA
X 2
PRILA
Y
PRILA
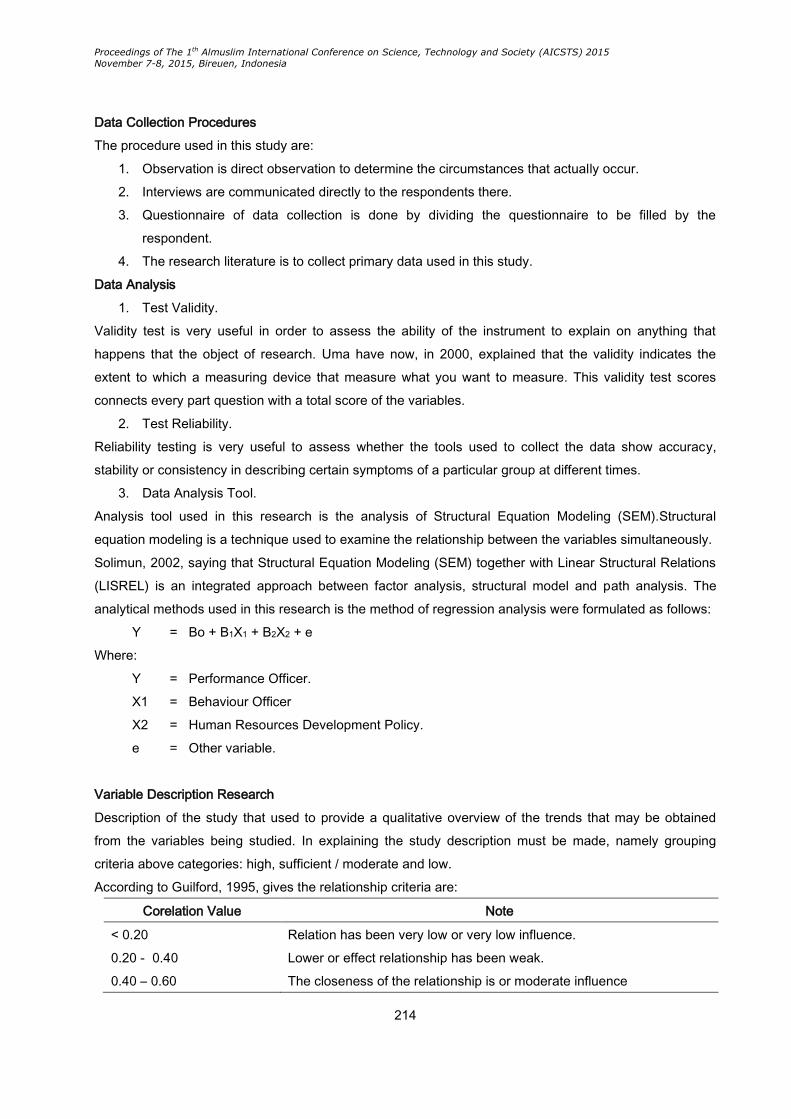
Proceedings of The 1th Almuslim International Conference on Science, Technology and Society (AICSTS) 2015
November 7-8, 2015, Bireuen, Indonesia
214
Data Collection Procedures
The procedure used in this study are:
1. Observation is direct observation to determine the circumstances that actually occur.
2. Interviews are communicated directly to the respondents there.
3. Questionnaire of data collection is done by dividing the questionnaire to be filled by the
respondent.
4. The research literature is to collect primary data used in this study.
Data Analysis
1. Test Validity.
Validity test is very useful in order to assess the ability of the instrument to explain on anything that
happens that the object of research. Uma have now, in 2000, explained that the validity indicates the
extent to which a measuring device that measure what you want to measure. This validity test scores
connects every part question with a total score of the variables.
2. Test Reliability.
Reliability testing is very useful to assess whether the tools used to collect the data show accuracy,
stability or consistency in describing certain symptoms of a particular group at different times.
3. Data Analysis Tool.
Analysis tool used in this research is the analysis of Structural Equation Modeling (SEM).Structural
equation modeling is a technique used to examine the relationship between the variables simultaneously.
Solimun, 2002, saying that Structural Equation Modeling (SEM) together with Linear Structural Relations
(LISREL) is an integrated approach between factor analysis, structural model and path analysis. The
analytical methods used in this research is the method of regression analysis were formulated as follows:
Y = Bo + B1X1 + B2X2 + e
Where:
Y = Performance Officer.
X1 = Behaviour Officer
X2 = Human Resources Development Policy.
e = Other variable.
Variable Description Research
Description of the study that used to provide a qualitative overview of the trends that may be obtained
from the variables being studied. In explaining the study description must be made, namely grouping
criteria above categories: high, sufficient / moderate and low.
According to Guilford, 1995, gives the relationship criteria are:
Corelation Value Note
< 0.20 Relation has been very low or very low influence.
0.20 - 0.40 Lower or effect relationship has been weak.
0.40 – 0.60 The closeness of the relationship is or moderate influence
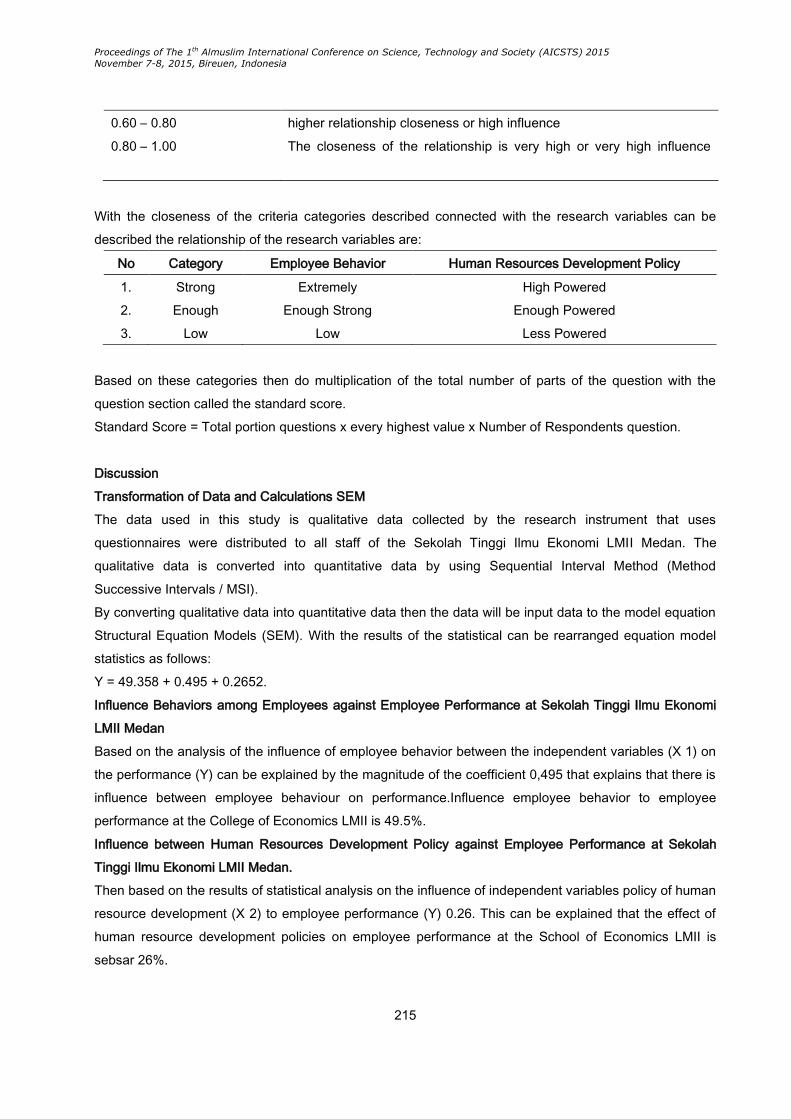
Proceedings of The 1th Almuslim International Conference on Science, Technology and Society (AICSTS) 2015
November 7-8, 2015, Bireuen, Indonesia
215
0.60 – 0.80 higher relationship closeness or high influence
0.80 – 1.00 The closeness of the relationship is very high or very high influence
With the closeness of the criteria categories described connected with the research variables can be
described the relationship of the research variables are:
No Category Employee Behavior Human Resources Development Policy
1. Strong Extremely High Powered
2. Enough Enough Strong Enough Powered
3. Low Low Less Powered
Based on these categories then do multiplication of the total number of parts of the question with the
question section called the standard score.
Standard Score = Total portion questions x every highest value x Number of Respondents question.
Discussion
Transformation of Data and Calculations SEM
The data used in this study is qualitative data collected by the research instrument that uses
questionnaires were distributed to all staff of the Sekolah Tinggi Ilmu Ekonomi LMII Medan. The
qualitative data is converted into quantitative data by using Sequential Interval Method (Method
Successive Intervals / MSI).
By converting qualitative data into quantitative data then the data will be input data to the model equation
Structural Equation Models (SEM). With the results of the statistical can be rearranged equation model
statistics as follows:
Y = 49.358 + 0.495 + 0.2652.
Influence Behaviors among Employees against Employee Performance at Sekolah Tinggi Ilmu Ekonomi
LMII Medan
Based on the analysis of the influence of employee behavior between the independent variables (X 1) on
the performance (Y) can be explained by the magnitude of the coefficient 0,495 that explains that there is
influence between employee behaviour on performance.Influence employee behavior to employee
performance at the College of Economics LMII is 49.5%.
Influence between Human Resources Development Policy against Employee Performance at Sekolah
Tinggi Ilmu Ekonomi LMII Medan.
Then based on the results of statistical analysis on the influence of independent variables policy of human
resource development (X 2) to employee performance (Y) 0.26. This can be explained that the effect of
human resource development policies on employee performance at the School of Economics LMII is
sebsar 26%.

Proceedings of The 1th Almuslim International Conference on Science, Technology and Society (AICSTS) 2015
November 7-8, 2015, Bireuen, Indonesia
216
Influence between Employee Behaviour and Human Resource Development Policy to Employee
Performance at Sekolah Tinggi Ilmu Ekonomi LMII Medan.
Based on the analysis above influence employee behavior and human resource development policies on
employee performance at the Sekolah Tinggi Ilmu Ekonomi LMII Medan amounted to 12.67. It is clear
that employee behavior independent variable (X 1) and the policy of human resource development (X 2)
to employee performance (Y) at the Sekolah Tinggi Ilmu Ekonomi LMII Medan is 12.67%.
Conclusion
1. The employee behavior has an influence on the performance of employees at the Sekolah Tinggi
Ilmu Ekonomi LMII Medan where there are significant based on statistical analysis of 49.5%.
2. Human Resources Development policy has an influence on the performance of employees at the
Sekolah Tinggi Ilmu Ekonomi LMII Medan by 26%.
3. Behaviour of employees and human resource development policies have an influence on the
performance of employees at the Sekolah Tinggi Ilmu Ekonomi LMII Medan by 12.67%.
References
Agustina Maria, 2012, Pengaruh Gaya Kepemimpinan, Pengembangan Sumber Daya Manusia dan
Disiplin Kerja Pegawai Sekretariat Dewan Perwakilan Rakyat Daerah Provinsi Sulawesi tengah, e-
journal Katalogis, Volume 1 Nomor 1, Desember 2012, p 95-103.
Anwar Prabu A., Mangkunegara, 2005, Manajemen Sumber Daya Manusia, Penerbit PT. Gramedia,
Jakarta.
Edy Sutrisno, 2009, Manajemen Sumber Daya Manusia, Penerbit Kencana, Jakarta.
Chaizi Nasucha, 2004, Reformasi Administrasi Publik: Teori Dan Praktek, Penerbit Grasindo, Jakarta.
Griffin, Ricky, W., 2000, Manajemen, Jilid 1, Edisi 7, Penerbit Erlangga, Jakarta.
Guilford, J.P., 1956, Psychometric Method, Mc-Graw-Hill Book Company Inc, New York.
Malayu S., P., Hasibuan, 2009, Manajemen Sumber Daya Manusia, Edisi Revisi, Penerbit Bumi Aksara,
Jakarta.
Marwansyah dan Mukarram, 2000, Manajemen Sumber Daya Manusia, Penerbit Pusat Administrasi
Niaga Politeknik, Bandung.
Miftha Thoha, 2011, Prilaku Organisasi; Konsep dasar Dan Aplikasinya, Penerbit PT. RajaGrafindo
Persada, Jakarta.
Robbins, Stephen P., & Mary Coulter, 2007, Manajemen, Jilid 1, Penerbit PT. Indeks, Jakarta.
------------------------------, 1991, Organizational Behavior, Ftifth Ed, Prentice Hall International Inc, New
Jersey.
Sekaran, Uma, 2000, Research Methods for Business, 3th Edition, John Willey And Sons Inc. New York.
Singodimedjo, Markum, 2000, Manajemen Sumber Daya Manusia, Penerbit SMMAS, Surabaya.
Solimun, 2002, Structural Equation Modeling: Lisrel dan Amos, Penerbit Universitas Negeri Malang.
Wibowo, 2007, Manajemen Kinerja, Edisi Ke 2, Penerbit PT. Raja Grafindo Persada, Jakarta.
Proceedings of The 1th Almuslim International Conference on Science, Technology and Society (AICSTS) 2015
November 7-8, 2015, Bireuen, Indonesia
217
Analysis of Factors Consumer Preferences Ojek Online in
Indonesia Using Conjoint Technique Analysis
1*Aditya Wardhana and 2Win Konadi
1Lecturer Bussines Administration, FKB Universitas Telkom, Indonesia
2Lecturer Economic Statistic, Faculty of Economic Almuslim University, Aceh, Indonesia
*Corresponding Author: [email protected]
Abstract
An increase in mobility of the community in the big cities in Indonesia with high jam level
encouraged the rapid growth of online motorcyle transportation business in Indonesia.
Eight companies were Go-Jek, Grabbike, Blu-Jek, Lady-Jek, Ojek Syar’i (Ojesy), Jeger,
Uber-Jek, and Top-Jek. The purpose of this research was examined the factors
formingconsumers ofonline motorcycle transporter (ojek) in Indonesia. The research
method used was quantitaive analysis using conjoint analysis. Data obtained from
observation, interview, questionnaire, and a study of the literature. The number of
consumers of online motorcyle transportation business in Indonesia as much as
18.421.339. The number of sample using Slovin formula with confidency level at 95% as
many as 400 respondents. There search results illustrated factors forming consumers
ofonline motorcycle transporter in Indonesia based on the highest priorities until the
lowest priorities which were tariff, ease order, cost saving, time saving, praticality,
assurance, conformity, and security.
Keywords: Online motorcycle transporter (ojek), conjoint analysis
Introduction
Congestion happens in big cities in Indonesia such as Jakarta, Bandung, Surabaya, Medan and
Makassar, and the lack of availability of mass transportation facilities become the driving public demand
for a mode of transportation that is fast, safe, and in expensive. Therefore, the existence of services
between the motorcycle or familiar as ojek to be one option. Ojek are also growing like mush rooms in the
middle of the limitations of formal sector employ ment during the monetary crisisin 1998.
In 2011, ojek (motorcycle taxi) reservations can be made by telephone and in 2015 became the beginning
of the revolution conventional ojek service by utilizing digital technology and professional management
system. There are four significant as typical service ojek digital namely: (1) how to order quite simply use
Proceedings of The 1th Almuslim International Conference on Science, Technology and Society (AICSTS) 2015
November 7-8, 2015, Bireuen, Indonesia
218
applications where passengers can simply order online by downloading the application from the App
Store for iOS or Google Play for Android, (2) no again transactions bargain fares between passengers
with ojek where the mileage and the price to be paid passengers clearly visible on the screen after
selecting a pick-up and destination delivery, (3) there is no cash transaction between passengers with
ojek because the payment is done by cutting balances first owned by the customer, and (4) by accessing
an application on the smart phone, the passenger can also find out where the order ojek drivers who
monitored via GPS. Ojek service is not regulated by law (Ridwan and Suherni, 2015). Susanta (2015)
states that an online business can be a threat to conventional business.
The existencemotorcycleonlinecanprovide benefits, namely: (1) create new jobs, (2) to motivate and
encourage people to be more productive in generating income, (3) create a business that is fair to
consumers, where consumerscan evaluate and review the direct products and services purchased, (4)
creatingequal opportunity, since consumers whodo nothave the purchasing power can enjoy public
service, while those with purchasing powercanenjoyspecial servicesaccordingthe content and services on
the site, and (5) create creativity for companies considering an online business quickly duplicated and
open space for any business to compete.
Applications shuttle into booming in Indonesia, not just one application even now there are some
applications that have similar concepts. The use of the application in this digital ageis some what able to
help the users. Only use a smartphone, customers can be delivered to the destination without having to
laboriously get the service. To access the application data required valid customer such as name, email,
and evenphone numbers (HP). In ensuring the security of the misuse of data that can be done is to use
call center.
Governments need to make special regulations in the form of local regulations (Perda) related to the
presence of online motor cycle (based application), considering the online ojek serviceis not regulated by
law. So the existence of online motorcycle can be considered as illegal or unlicensed transport and
absence of over sight that are contrary to the Law of Traffic and Road Transport No.22/2009 about Public
Transport Persons and Goods. AnandaandParikshit(2015) statedthat theregulation of online motorcycle
Regulation should establish reference standards such asload maps online motorcycle road network that
can be passedmotorcycles, condition ofthe driver, as well as the maximum and minimum limits of rates.
Magnusson (2015) states the connectivity needed to simplify the migrationof citizens that can be
achievedby sharing mobility (mobility sharing) such ascar sharing or bikes haring can reduce traffic
congestion, pollution, boost the economy which is cheaper thanbuilding ahighway infrastructure.
Online taxi service available today includes eight companies: Go-Jek, Grabbike, Blu-Jek, Lady-Jek,
OjeksSyar'i (Ojesy), Ojeks Taxis using the argometer (Jeger), Uber-Jek, and Top-Jek , Gojek established
by NadiemMakarim and started operating since 2011 using the phone and in January 2015 using the
online application. Ojekssyar'i (Ojesy) established by EvilitaAdriani and Reza Zamir and began operating
in March 2015. Grabbike founded by Anthony Tan and began operation in May 2015. The taxi motorcycle
taxi using the argometer (Jeger) was founded by Vicky Wijaya and began operations in August 2015. Blu
-Jek founded by Garret Kartono& Michael Manuhutu and began operations in September 2015. Lady-Jek
Proceedings of The 1th Almuslim International Conference on Science, Technology and Society (AICSTS) 2015
November 7-8, 2015, Bireuen, Indonesia
219
founded by Brian Mulyadi and began operating in October 2015. Uber-Jek established by ArisWahyudi
and began operations in 2016. Top-Jek established by Cempaka Adina Devi and began operating in
2016. The difference between each motorcycle online can be explained in the table in appendix.
Based on the preliminary survey (preliminary research) to 30 customers ojek online data showed
consumer preferences on ojek online as follows: tariff (22%), ease of order (18%), cost savings (16%),
saving time (15%) practicality (13%), certainty (9%), convenience (4%), and security (3%). Rates to be
one factor consumer preferences for online motorcycle has the advantage of transparency as taxi fare, so
that consumers can know the tariffs should pays based on mileage. In addition, the ease of orders
through an online application that can be downloaded for free by consumers turned out to make it easy
for consumers to order (order) ojek services online.
The use of online ojek felt also savings to be incurred by consumers as compared to using conventional
taxis and other public transportation such as taxis. Online ojeks excellence in negotiating the congestion
and reach places that cannot be reached by other public transport to be one factor in the preferences of
consumers using the services of this online ojek service. Consumers find it more practical to use online
motorcycle considering the consumer does not need to bring a helmet, jacket, raincoat and carrying
luggage because it has been supplied by motorcycle online. With the map application online so
consumers can easily find out where ojeks are ordered online so that consumers can be sure to know
when the ojek will arrive online. The convenience factor contributed to the preferences of consumers in
view of consumers feel more comfortable using online motorcycle because the ojek driver online has the
ability to drive his vehicle properly. And lastly, the safety factor of the vehicle into consumer preferences
in using online motorcycle considering the safety standards of vehicles and vehicle facilities have decent
roads and according to the rules. The aim of this study was to determine what factors are shaping
consumer preferences online motorcycles in Indonesia.
Research Methods
The method used is quantitative method using conjoint analysis (conjoint analysis) to determine the
preferences of consumers by creating a list of the order stated the utility value of an attribute level. The
level of importance of attributes is the utility value of each attribute is used as a parameter in which the
level of importance of attributes obtained from the average value of each interest attributes generated
from the utility value of the attributes of each respondent (Malhotra, 2012). The purpose of conjoint
analysis in this study was to determine the utility of each attribute tested using SPSS.
Types and sourcesof data used inthis research isthe primary datais data obtainedthrough
thequestionnaireswerecollected through interviewsto usersojekonline, while secondary datais the
datacollected fromthe literatureandprevious studiesas well asthe official website ofthe company'sojek
online orother sources.
The scaleof measurement using a Likert scale used to measure attitudes, opinions, andperceptions
ofindividuals and groupsto an event. The variablesto be measuredare translated intothe indicator
variableas a starting point for preparing items questionnaire (Sarjono & Jualianita, 2011). The scale of
measurement usedin the studyprepared bycategory: Strongly Agree (SS), Agree(S), Simply Agree (CS),
Proceedings of The 1th Almuslim International Conference on Science, Technology and Society (AICSTS) 2015
November 7-8, 2015, Bireuen, Indonesia
220
Disagree (TS), andStrongly Disagree (STS). Scoringfor eachanswer toa questionthat isenforcedSSscore
of5, Swas givena score of4, the CSwas givena score of3, TSwas givena score of2, andSTSwas givena
score of 1.
Pearson correlation test and Kendall conducted to determine the magnitude of the estimates with the
actual value or are predictive accuracy of the conjoint analysis. If the value of Pearson and Kendall
correlation above 0.50 and a significance test produces a value below 0.05 indicates a relatively strong
value and significant (Sari, Prastawa, &Lintang, 2010).
Number of members of the population in this study as many as 18,421,339 people online consumer ojek
of eight companies in Indonesia ojek online by October 31, 2015 with a sample size of 400 respondents
using Slovin formula at the 95% confidence level. The sampling technique using non probability sampling
with the sampling method using incidental sampling (Sugiyono, 2013).
Discussion
Calculation of utility value to a standard attribute that has been done with SPSS can be shown as Table
2. Based on the results of processing the data in Table 1 shows the respondents chose ojek online with a
transparent tariff according kilometers (0.558), ease of orders via the application (0.533),'m really save
costs compared toojek conventional (0.457), saves time compared to other public transportation (0.421),
more practical than taxis conventional (0.368), time of arrival can be ensured (0.327), really comfortable
(0.262), and feel safe (0.136).
Table1. Top Degree Utility Value Attributes
Atribut Taraf Atributes Utility value Std. Error
Tariff Less Transparent according kilometers
Transparent according kilometers
-0.558
0.558
0.027
0.027
Ease order Difficult clicking order via app Easy to order via
app
-0.533
0.533
0.027
0.027
Cost savings Same thing with the cost of conventional ojek
Actually save costs compared to conventional
ojek
-0.457
0.457
0.027
0.027
Saving time The same as the time spent with other public
transport Actually save money compared to
other public transport
-0.421
0.421
0.027
0.027
Practicality Equally impractical with conventional ojek
More practical than a conventional ojek
-0.368
0.368
0.027
0.027
Certainty
Assurance
Time of arrival can be ensured
Arrival time cannot be ensured
0.327
-0.327
0.027
0.027
Conformity Little comfortable
Really feel comfortable
-0.262
0.262
0.027
0.027
Security Feeling unsafe
Feel safe
-0.136
0.136
0.027
0.027
Proceedings of The 1th Almuslim International Conference on Science, Technology and Society (AICSTS) 2015
November 7-8, 2015, Bireuen, Indonesia
221
(Constant) 3.217 0.027
The level of importance of attributes is the utility value on the attribute that is used as a
parameter/attribute importance level is obtained from the average value of each interest attributes
generated from the utility value of the attributes of each respondent as shown in Table 2 below;
Table 2. Value Attribute Importance
Aribut Attribute Importance (%)
Tariff 34.776
Ease order 19.435
Cost saving 13.892
Time saving 11.542
Practicality 9.368
Assurance 6.721
Conformity 3.183
Security 1.083
Based on the results of processing the data in Table 1 and Table 2 above, shows that:
1) The first important factor is the value of the attribute ojek fare online with weight value of
34.776%. Online ojek fare is supported by the use of the meter so that the tariff can be known by
consumers in a transparent manner based on the distance.
2) The second important factor is the ease of orders with a value of 19.435% weighting. Ease of
orders is supported by the use of online applications that are downloaded by the consumer so
that the consumer can easily place an order online ojek.
3) The third most important factor is the cost savings to the value of a weight of 13.892%. These
cost savings are supported by the enactment of the basic rate and the rate per kilometer which is
cheaper than using a conventional ojek.
4) The fourth most important factor is the value of time savings with a weight of 11.542%. This time
savings is supported by the ability to deal with online motorcycle traffic jams in big cities when
using public transport such as taxis, buses, metromini, and the ability of these online motorcycles
in reaching places that are not able to reach by public transport such as small streets or alleys.
5) The fifth most important factor is the practicality of the weight value of 9.368%. This is because
the practicality of using a ojek online, consumers do not need to bring a helmet, raincoat, jacket,
and goods as helmets, raincoats and jackets have been provided by the following online
motorcycle with storage of goods (box).
6) Sixth most important factor is the certainty of the value of a weighting of 6.721%. Online
motorcycle certainty arrival time can be ascertained by consumers to see the map application
online.

Proceedings of The 1th Almuslim International Conference on Science, Technology and Society (AICSTS) 2015
November 7-8, 2015, Bireuen, Indonesia
222
7) The seventh most important factor is the convenience with value weighting of 3.183%. Comfort
provided by the online motorcycle includes driving comfort for the driver have been given the
knowledge and training of service standard drive (safety riding) and is equipped with a driver's
license.
8) The eighth most important factor is security with value weighting of 1.083%. Security provided
online motorcycle includes a vehicle tracking by the company and the consumer, safety
standards appropriate manufacturer of motor vehicles, and road safety facilities.
Pearson correlation test and Kendall generate strong value relaif. This is demonstrated by the Pearson
correlation coefficient of 0.976 and a correlation coefficient of 0.863 Kendall where the value of the
correlation coefficient is above 0.50. Significance test produces a value of 0.000 below 0.05 indicates a
relatively strong value and significant.
References
Ananda, S., dan Parikesit, D. 2015. Pemerintah Segera Susun Perda Ojek Daring. Harian Kompas, 22
Oktober 2015, 26.
Bank Dunia. 2007. Connecting to Compete: Trade Logistics in the Global Economy – The Logistics
Performance Index and Its Indicators. Washington D.C: The World Bank.
Limasal, F.S., & Marcus, T. 2007. Sistem Aplikasi Pemesanan Tiker Pesawat “M Airline System” Berbasis
WAP. Jurnal Sistem Informasi, Vol.2, No.2, 153-166.
Magnusson, J. 2015. The Power of Sharing Mobility. Diskusi Ilmiah FakultasTeknik UI, 20 Oktober 2015.
Malhotra, N.K. 2012. Marketing Research: An Applied Orientation. New Nersey: Prentice Hall.
Mardiasmo. 2009. Akuntansi Sektor Publik. Yogyakarta: Andi
MujiyanadanIngge Elissa. 2013. Analisis Faktor-Faktor yang Mempengaruhi Keputusan Pembelian Via
Internet padaToko Online. Jurnal TI Undip, Vol. 3, No. 3, pp. 143-152
Nurdianto, R. 2013. Pengaruh Media Promosi Terhadap Preferensi Belanja Online Produk Elektronik.
Jurnal SEGMEN Manajemen.Vol. 9, No.1, 1-8
Purnomo, H., dan Haryanto. 2010. Analisis Preferensi Konsumen sebagai dasar Penentuan Segmentasi
di Perbankan Syariah (Studi Kasus PT Bank Muamalat Indonesia Cabang Solo).Jurnal Ekonomi dan
Kewirausahaan, Vol.10 No.1, 22-31
Sarjono, H., & Julianita, W. 2011. SPSS vs LISREL. Jakarta: Salemba Empat
Sari, D.P., Prastawa, H., dan Lintang, D. 2010. Analisis Tingkat Kepentingan Atribut Perpustakaan
Berbasis Riset Melalui Metode Conjoint Analysis. International Journal TI Universitas Diponegoro,
Vol. V, No.2, 105-118
Setiadi, N.J. 2005. Perilaku Konsumen Konsep dan Implikasi untuk Strategi dan Penelitian Pemasaran.
Jakarta: Prenada Media
Persadha, P. 2015. Cara Aman Konsumen Gunakan Ojek Online.
https://www.cissrec.org/news/detail/234/Ini-Cara-Aman-Konsumen-Gunakan-Ojek-
Online.html#sthash.zfyCLOj8.dpuf
Purnama, Surya dan Rangga Raditya. 2011. Analisis Faktor-Faktor yang Menentukan Keputusan
Proceedings of The 1th Almuslim International Conference on Science, Technology and Society (AICSTS) 2015
November 7-8, 2015, Bireuen, Indonesia
223
Konsumen dalam Pemilihan Penggunaan Jasa Transportasi Udara pada Maskapai Penerbangan
Eva Air. Jurnal Forum Ilmiah, Vol. 8, No. 3, pp. 184-196.
Resmita, D, et al. 2013. Pengukuran Indeks Kepuasan Masyarakat Pengguna Jasa Layanan Transportasi
Kereta Api. Research Study. Malang: Universitas Brawijaya.
Ridwan, M., Suherni, N. 2015. Ketika Ojek Digital Menjadi Pilihan.
http://www.sinarharapan.co/news/read/150613027/ketika-ojek-digital-jadi-pilihan.
Simamora, B. 2004. Panduan Riset Perilaku Konsumen. Jakarta: PT GramediaPustakaUtama.
Sugiyono. 2013. Metode Penelitian Manajemen. Bandung: Alfabeta.
Susanta, R. 2015. Gojek. Majalah Marketing, Edisi 09, XV, September 2015, hal.168.
Verina, Eunike, et al. 2014 Faktor-faktor yang Mempengaruhi Keputusan Pembelian pada Toko Fashion
di Jejaring Social Facebook. Jurnal Administrasi Bisnis, Vol.10, No.1, pp. 1-10
Warman, Andri, et al. 2014. Karakteristik Penumpang Travel Jakarta-Bandung. Jurnal Manajemen
Transportasi dan Logistik, Vol.1, No.1, pp. 1-12
Yusta, Alicia Izquierdo dan María Pilar Martínez-Ruiz. 2011. Assessing the Consumer'sChoice of
Purchase Channel in The Tourism Sector. Euro Med Journal of Business, Vol.6, No.1 pp. 77-99
Proceedings of The 1th Almuslim International Conference on Science, Technology and Society (AICSTS) 2015
November 7-8, 2015, Bireuen, Indonesia
224
Human Resources Management and Performance of Employees
at Bureau of Aceh Government
Em Yusuf Iis
Ph.D Student at Management Science of Syiah Kuala University, Aceh-Indonesia and Economics Faculty
of Malikussaleh University, Aceh-Indonesia
Corresponding Author: [email protected]
Abstract
Employees are an organization's resources; they must be employed in an effective,
efficient, and humane. In the process, the organization will face labor problems
increasingly complex. Therefore, the management of labor as a Human Resources (HR)
must be done professionally by a separate department within an organization, namely the
Human Resource Department (HRD). Compensation is any form of remuneration to
employees in return for the implementation of the tasks performed by the employee.
Career is a series of positions held by a person throughout his life. The work environment
can be interpreted as the forces that affect, either directly or indirectly to the performance
of the organization or company. The work environment includes a working relationship
between subordinates and superiors as well as the physical environment where
employees work. Motivation is one of the most important variables in determining the
performance and productivity of a person, including work behavior. Employee
performance is a record of the work/specific activity attained during a specific time period.
Keywords: Compensation, Career, Work Environment, Motivation and the
Performance of Employees
Introduction
The purpose of the topics discussed in the management of human resources is about employee
performance, motivation, compensation, career and work environment. Nowadays latest development
sees human resource rather than as a mere resource, but rather in the form of capital or assets of the
institution or organization. Employees are an organization's resources, they must be employed in an
effective, efficient, and human. In the process, the organization will face labor problems increasingly
Proceedings of The 1th Almuslim International Conference on Science, Technology and Society (AICSTS) 2015
November 7-8, 2015, Bireuen, Indonesia
225
complex. Therefore, the management of labor as a Human Resources (HR) must be done professionally
by a separate department within an organization, namely the Human Resource Department (HRD).
Human resource management can be defined as the planning, procurement, development, maintenance,
and the use of human resources in order to achieve individual and organizational goals. One part of
human resource management is the commitment of human resources as labor, or the employees
themselves. Bureau of Human Resources is one of the units that are responsible for the ability of civil
servants and welfare across both the government of district/city and province. There are many problems
faced by the work unit among others, as reported by the news media. This phenomenon occurs during
Aceh government leadership shaken by the NGO coordinator asked the Governor to resign from office
(Daily Alert, Tuesday 9 September 2014), due to the poor quality of the bureaucracy as a result of making
a group of people or an individual so not satisfied and encouraged him to take actions radical (Daily porch
Indonesia Wednesday, October 29th, 2014). The phenomenon of the early studies conducted showed
that a career in the Bureau of Human Resources Government of Aceh is based on consideration of the
proximity of employees with leadership as management. However, there is also the career development
of employees is determined by performance. The information obtained in the initial study illustrates that
career development is run by the Bureau of Human Resources Government of Aceh over the state of the
proximity of employees with the leadership of the Bureau of Human Resources Government of Aceh. The
proximity factor can sometimes lead to disappointment employees that affect employee performance. Yet
according to Robert (2006), in a work environment in the employee's career development of leadership
must gather information on the basis of character and the nature of such employees, the attitude of the
initiative, or creativity associated with a particular job.
The problem of synchronization between the aims of the Government and civil servants, particularly in the
provision of employee compensation occurs in the Bureau of Human Resources Government of Aceh
whose existence very much. Where there is the level of competition between industrial organizations are
quite strict. So that the operating costs for the government needs to be pressed to achieve effectiveness
and efficiency performance. As a result, employees are often used as "victims" of the effectiveness and
efficiency of the public services. For government organizations, these efforts made to face competition of
excellent service in order to survive in running the organization.
The employees of Bureau of Human Resources Government of Aceh want a compensation system that
they perceive as a fair and in line with their expectations, so that when the fair compensation based on
the demands of the job, the level of individual skills and wage standards, it will most likely produce a
positive job satisfaction for employees and will ultimately have an impact on organization-wide
performance improvement. Based on the observations and interviews in the field, the phenomenon of
employee satisfaction of Bureau of Human Resources Government of Aceh is used to overcome the
problems above, it is required a good relationship between employees with the organization so that the
employee is expected to work well and to obtain the optimal results. Good relationships can be
interpreted that the organization pays attention to the system of compensation for employees with respect

Proceedings of The 1th Almuslim International Conference on Science, Technology and Society (AICSTS) 2015
November 7-8, 2015, Bireuen, Indonesia
226
to the standards of wages, skills in the work and performance of employees is given to achieve the goals
of the organization, so that job satisfaction can be created. Whether we realize or not, the organization
that every employee has a background and different expectations, which in turn will affect the dynamics
of the relationship of employees in the organization. Meanwhile, the organization also has expectations
and specific objectives, which can be the same, different or even completely contrary to the expectations
of employees.
One of the criteria as would only get by development of human resources in accordance with the
employee's performance, motivation, compensation, career and supportive working environment. The
factors in improving employee performance include individual capabilities (knowledge, skills, abilities),
and the effort, and organizational support. The employee performance is the result of a thought and effort
of an employee in their work, it can be tangible, visible, and calculated in number, but in many ways, the
result of a thought and effort cannot be calculated and seen, such as the ideas in solving a problem, a
new innovation of a product or service, it also may be the discovery of more efficient work procedures.
Literature Review
Definition of Performance
In the process, the organization will face a higly complex.labor problem. Therefore, the management of
labor as a Human Resources (HR) must be done professionally by a separate department within an
organization, namely the Human Resource Department (HRD). The Applied Theory used are theories
related to, compensation, career, work environment, motivation and performance of employees.
Bernardin and Russell (1998). Employee performance is a record of the work/specific activity attained
during a specific time period.
The dimensions, indicators, and measures that are as follows:
(1) The output quality, the degree to which the process and the results of a perfect activity, in the other
words, carring out an activity in an ideal way/in accordance with the objectives set. The indicators
are: Quality of work, with size: Rate of quality of output produced by employees.
(2) The quantity of output, the amount produced in the form of value, a unit or a number of activities
completed. The amount of the work, with size: Rate the quantity of output produced by employees.
(3) The provisions of the time, the degree to which the activities completed, or completed with results
more quickly than the time set and use the time available in improving other activities. The period of
employment, with size: Level of punctuality.
(4) The effectiveness, the degree to which the use of organizational resources include human
resources, money, technology, material that is maximized to obtain the highest target or vice versa,
its reducing effectiveness, the use of organizational resources is reduced. The effectiveness of work
completion by measure: The level of effectiveness.
Proceedings of The 1th Almuslim International Conference on Science, Technology and Society (AICSTS) 2015
November 7-8, 2015, Bireuen, Indonesia
227
(5) The need for the degree to which employees perform their work without fulfillment or otherwise to
avoid mistakes. In accordance with the needs of the company, by measure: Level of fulfillment.
(6) Monitoring. Monitoring of the work, by measure: level of supervision conducted by leader.
(7) The effect of interpersonal, expressing the degree to which the employees self-esteem, goodwill and
cooperation among peers and subordinates. Relationships between employees, with size: Levels of
interpersonal influence in the workplace
On the other hand, Wood, etc, (2001) describe triangles dimensional determinants of individual
performance variability of individual performance as measured by work effort, organizational support and
individual attributes of each individual involved in an organization. Then in some reference of human
resource management is much discussed about motivation theory.
The theory of performance that has been described, there are some benefits gained from studying the
theory of performance, among others:
a. Can be used as a reference in its assessment and performance measurement.
b. Recognizing the strategies and efforts to improve the performance of individuals and the performance
of the team / group.
c. Knowing the factors that can increase or decrease the performance results. It is very important to pay
attention to the factors that may affect performance.
Motivation
Motivation is one of the most important variables in determining the performance and productivity of a
person, including work behavior. Motivation is a process that acts on intensity, direction and duration of
ongoing efforts towards the achievement of individual goals (Robbins 2006). The Dimensions, indicators
and measures that are as follows:
1. Need For Achievement
Indicates a desire; Opportunities for employees are available facilities and infrastructure and policies
implemented; the level of opportunity for employees and available infrastructure is a level of
implemented policies.
2. Need For Affiliation
It is the desire to engage in a friendly and warm with others.
3. Need For Power
The need to influence and control others; Career development opportunities are promotion system is
the opportunity to achieve goals. Abraham Maslow (Mangkunagara, 2005) suggests that the
hierarchy of human needs are as follows:
1. Physiological needs; the need to eat, drink, physical protection, breathable, and sexual. Those
are basic needs

Proceedings of The 1th Almuslim International Conference on Science, Technology and Society (AICSTS) 2015
November 7-8, 2015, Bireuen, Indonesia
228
2. The need for a sense of security, namely the need to protect themselves from the threat, danger,
conflict, and environmental
3. The need for a sense of belonging (social), which needs to be accepted by the group, affiliated,
interact, and the need to love and be loved
4. The need for self-esteem, which needs to be respected and appreciated by others
5. The need to express themselves, namely the need to use the abilities, skills and potential.
Theory X and Y Douglas McGregor in his book entitled "The Human Side of Enterprise" formulate his
ideas about management and behavior. This theory is known as Theory X and Y. He examines how
managers deal with employees in an organization. He was confident that extend beyond any managerial
decisions or managerial actions are assumptions about human nature and human behavior are important
in determining the style of ways of each manager. He divides these assumptions into two broad
categories, namely Theory X (based on assumptions guidance and control) and Theory Y (Based on the
assumptions of integration and support).
The relation between motivation and increasing Work is a result of the interaction of a person with a
particular situation. Robbins (2002: 55) argues that motivation is the desire to do as a willingness to
expend high level effort for the purposes of the organization, which is conditioned by the effort's ability to
get the individual needs.
Compensation
Ivancevich (2004), compensation is a function of human resource management related to all forms of
remuneration to employees as a reward for the implementation of the tasks performed by the employee.
According to Werther and Davis (1993), Compensation is what employees receive in exchange for
Reviews their contribution to the organization. Compensation management helps the organization Obtain,
maintain, and retain a productive work force. Without adequate compensation, current employees are
Likely to leave, and the replacement will be difficult, to recruit. This means that compensation is what
employees receive in exchange for their contributions to the organization.
Willliam B. And Keith Davis (1989), compensation is what employees receive in exchange for Reviews
their work. It gives meaning that compensation is what is received by the employee on the work done to
the company or organization. Mathis and Jackson, (2002) points out, a total compensation system
includes financial and non-financial compensation. Furthermore, Jackson (1999) describes that, financial
compensation consists of direct compensation and indirect compensation. Direct compensation consists
of base salary, performance-based payments (such as stock options, bonuses, incentives) and payments
based on the skills. Meanwhile indirect compensation consists of a general protection (such as social
security, unemployment and disability), time off work, sick, vacation and red day; and life cycle benefits
(such as legal assistance, child care, and the cost of moving.
Non-financial compensation consists of compensation career and social compensation. Compensation
career consisted of a sense of security, opportunity and self-development, salary growth opportunities
Proceedings of The 1th Almuslim International Conference on Science, Technology and Society (AICSTS) 2015
November 7-8, 2015, Bireuen, Indonesia
229
and career flexibility. While social compensation consists of a status symbol, praise, recognition, comfort
task and friendship task.
Based on expert opinions above, the compensation referred to in this research is the assessment of a
person about all forms of compensation for both financial and non-financial earned by the employees as
compensation of the execution of their duties, namely: Assessment of direct compensation, indirect
compensation assessment, assessment of compensation career and social compensation assessment.
Dimensions of Compensation
Dimensions of Compensation According to (Moorhead & Griffin, 1999), compensation may categorized
into five levels which ilustrate from the lowest to the highest level. All of those are: 1) salary; 2)
allowances / benefits; 3) bonus for achievement / incentive; 4) perquisite; and 5) rewards. Ivancevich
(2004), compensation is a function of human resource management related to all forms of remuneration
to employees as reward for the implementation of the tasks. As for dimensions, indicators and measures
of compensation variables used in this study are as follows:
(1) Salary, compensations in the form of money received by an employee as a consequence of his
status as an employee who contributes to achieving the company's goals. Total Salary, by
measure: salary rate; 2) Compliance salaries, by measure: Suistability salary.
(2) Allowances; designed by the company in various type to help employees. By measure: Level of
giving allowances
(3) Bonus/incentive,bonus is given based on the yearly performance. Indicator: the bonus received, by
measure: The level of bonuses are awarded for achievement
(4) Additional income / perquisite, additional wages earned for over standard work. Indicator: Additional
income earned in the works, by measure: level of additional income earned by employees.
(5) reward, indicator: reward for performance , by measure: level of reward.
While Armstrong (2003) explains, financial compensation consists of 1) a contingent salary is
performance related to salary, compensation and skills and 2). Benefits (death benefit, personal accident
protection to health, illness, severance vacation, leave childcare, sports facilities, official car. Meanwhile,
non-financial compensation consists of: 1) Achievement; 2) Recognition, 3) Responsibility; 4) the
influence; and 5) personal growth. Cascio (1995) proposes three dimensions which can beused he
measure the fairness of compensation, namely: 1) internal Justice (relative value of each job in the
organization); 2) external justice (competitive value of market); and 3) the individual Justice (relative
value to the similar work). Internal and external justice influence directly toward retention (Griffeth &
Horn, 2001).
Proceedings of The 1th Almuslim International Conference on Science, Technology and Society (AICSTS) 2015
November 7-8, 2015, Bireuen, Indonesia
230
Career
According to Dessler (2006) The position of an individual's work for many years a person's career that
can affect caused by career satisfaction and success. 1). Career management; a process that can create
your employees understand and develop better authenticity and their career interests and to utilize the
expertise and interests in a way that is most effective. 2). Career development; a series of activities
throughout life, as workshop which contributes to the exploration, achievement of success and
achievement of one's career. 3). Career planning, process of full consideration when a person has an
understanding of the skills, knowledge, motivation and other personal characteristic, and establish a plan
not to achieve specific goals. According to Robbins (1998), a career is a series of positions held by a
person throughout his life. While Werther, Jr. and keith Davis (1996) argues, a career is all the jobs that
are held during one's working life. While Milkovich and Boudreau (1991: 364) argue, a career is the
evolving sequence of a person's work experiences over time.
Career planning
Career planning is a planning about the possibility of employee of an organization or enterprise as
individuals in which pursues the promotion or position as the requirements and capabilities. Career
Management complements the development of management which related to the planning and
establishment of the road taken by the employee in a career in the organization.
Career Development
According to Dessler (2007), career development program is the feedback given by the company on the
performance of employees in the form of employee development plans and providing access to
employees for training related to the planning of company by facilitating learning which related to the work
competence of employee. Competencies include: knowledge, skills, or behaviors to achieve the success
of employee performance.
The purpose of career development are satisfying the needs of human resource organization will both
immediate and long-term timeframe, Providing information for individuals and organizations about their
potential career paths within the organization and using human resource development programs as much
as possible by integrating a variety of activities in the form of elections, assignments, individual career
development and management in line with the plan (Byars & Roe, 2000)
Work Environment
According to George R. Terry (2006) work environment can be interpreted as affecting powers, either
directly or indirectly to the performance of the organization or organizations. Work environment indicators
are (1) working facilities, (2) salaries and allowances, (3) employment (Sihombing, 2004). Employee
motivation will be pushed out of the work environment. Irene Christofidon Gregoriou (2008), the indicator
is working environment are; 1) Opportunity to improve job skills, 2) Social status of the job, 3) Freedom to
decide how to do the job, 4) Salary, 5) Opportunities to use their skills and abilities, 6) Professional
Proceedings of The 1th Almuslim International Conference on Science, Technology and Society (AICSTS) 2015
November 7-8, 2015, Bireuen, Indonesia
231
growth possibilities, 7) Possibility of promotion, 8) Job security, 9) Participation in in-service training, 10)
Recognition of work on behalf of the superior, 11) Recognition of work on behalf of the associate, 12) The
prevailing climate in the work environment, 13) Relationship with superiors, 14) assessment of existing
systems, 15) Meritocracy are present in the promotion, 16) Everyday work Schedule, 17) Holiday.
According to Wibowo (2007) environmental work can motivate employees to improve performance can be
divided into two, namely: (1) Internal Environment, The factors that affect the internal
environment, bureau of Aceh government
resources are competence, job satisfaction, stress of employee and compensation. (2) External
Environment, The factors that affect the performance of employees of the external
environment are sector of socio-Economic, government and competitors.
Factors Influencing the Work Environment
Terry in Hasibuan (2001) says that the most successful work environment is self -direction by the
employee. Work environment is a power that encourages the spirit either inside or outside of employee such
as reward and punishment. Herberg in Luthans (2003) says that there are six satisfying factors exist in
human, 1) Achievement, 2) recognition, 3) responsibility, 4) advancement, 5) the work itself, 6) the
possibility of growth. Sihombing (2004) stated that Working Environments are factors beyond of human
physical and non-physical in an organization. Physical factors include work equipment, workplace
temperature, crowding and congestion, noise, spacious workspace while the non-physical includes
working relationship formed between superior and subordinate agencies and among employees. Herberg
and Luthans (2003), Work condition; Security and safety; Status, organizational procedures; Quality of
technical supervision of the relationship between peers, superiors, and subordinates.
Dimensions of work environments
Herberg and Luthans (2003), Dimensions, the indicators used to measure the followings: 1) Work
condition; includes physical and five senses, 2) Security and work safety, 3) Status, 4) O rganizational
procedure, 5) Quality of technical supervision of the relationship between peers, superiors, and
subordinates
Conclusion
Human resource management functions related to all forms of remuneration to the employees as reward
or punishment for the for performance. Assessment of performance is very important in making decisions
like the identification of the needs of education and training programs, recruitment, selection, induction
programs, placement, promotion, transfer, rotation, system of remuneration, and any other aspects of
procces of human resource management. Based on the use of competence, the good judgment should
be formally based on a set of rational criteria and objective system and systematically documented. notes
of the work or activity is achieved during a certain period.
Proceedings of The 1th Almuslim International Conference on Science, Technology and Society (AICSTS) 2015
November 7-8, 2015, Bireuen, Indonesia
232
Management simplifies the employees to be promoted through career management, career development,
and career planning. Employees must promoted through career planning, career management and career
development of appropriate career positions that can affect organizational goals that can give feedback.
The benefits of working environment is creating morale, so that increases productivity and performance,
the benefits gained by working with people who are motivated by the work can be completed on time, the
benefits of scale of his achievement will be monitored and will not cause too much supervision, and high
spirits.
The Organizations whose are committed to the strategic significance for the internal and external
environment is the Bureau of Human Resources Government of Aceh. Specifically, if public organizations
that perform various steps to provide services to the public and the government will provide compensation
in accordance with the performance of an employee's career in the work environment and incentives
given to highly motivated employees that will have an impact on improving labor productivity and loyalty is
a commitment. Employee skill is a leader in the organization's success in accordance with service
aspects.
Career planning closely related to the the future of the organization or individual and has many benefits,
because the career planning can be a benchmark and motivation for the plan can be achieved
References
Abraham Maslow (1954). Motivation and personality. New York, NY: Harper
Andreas G.M Nauchbauaer and Gabriela Riedl, 2002, Effects of concepts of career plateus on
performance, work satisfaction and commitment, International Journal of Manpower, Volume 23,
Number 8.
Armstrong, Michael and Baron A., 1995,A Handbook of job Evaluation, Institute Reward Management, 4th
Edition, Lo of Personnel & Development, London.
Armstrong, Michael and halen Murlis, 2003, Reward Management, 4th Edition, London.
Bernandin, H John & Joice A. Russel, 1998 Human Resource Management New York McGraw Hill Inc.
Black, Stewart J. and Mendenhall, Mark, 1990. Cross-Cultural Training Effectiveness : A Review and a
Theoritical Framework for Future Research, Academy of Management Review, Volume 15, No. 1
Carrell, Michael R., Norbert F. Elbert and Robert D. Hatfield. 1995. Human Resource Management Global
Strategies for Managing a Diverse Work Force. Fifth Edition. Prentice Hall. Englewood.
Cascio, Wayne F. 2006. Managing Human Resources: Productivity. Qualify of Work Life. and Profit.
Seventh edition. McGraw-Hill, Inc.
Dalton, D. R. and W. D. Todor. 1998. Functional Turnover and Absenteeism: An Empirical Assessment.
Journal of Applied Psychology and Industry. Desember p. 62.
Davis, Keith and John W. Newstrom. 1985. Human Behavior at Work: Organization Behavior. Seventh
Proceedings of The 1th Almuslim International Conference on Science, Technology and Society (AICSTS) 2015
November 7-8, 2015, Bireuen, Indonesia
233
Edition. McGraw-Hill Book Company.
Davis, L. E. and A B. Chems. 1975. The Quality of Working Life. VaL l. Problem, Prospects, and The
State of The Art. The Free Press. New York.
Dessler, Gary. 2000. Human Resources Management Eight Edition. Prentice Hall
International Inc.
Flannery Thomas P.: David A Hofrichter: Paul E. Platten, 1996, People Performance and Pay. Library of
Congress Cataloging in Publication Data, USA
Ford, Kevin J., A. Quinones, Miguel, Sego, Douglas J., Sorra, Joann Speer, 1992. Factors Affecting the
Opportunity to Perform Trained Tasks on The Job, Personnel Psychology, Autumn 1992, Vol. 45,
No. 3.
Imam Ghozali 2011. Model Persamaan Struktural, Konsep dan Aplikasi Dengan Program IBM, SPSS,
AMOS 21.0 Universitas Diponegoro Semarang.
Irene Christofidon Gregariou (2008) need fulfillment Deficiencies and Job Satisfaction in the Republic
of Cyprus, the case of the Ministry of Finance Juornal European University Cyprus.
Ivancevich John M., 2004. Human Resource Management, Ninth Edition., McGraw Hill Companies,
Inc., USA.
James A. F. Stoner, Charles Wankel 1986 Management, Fordham University of New Haven.
Kaplan Robert M & Dennis P. Saccuzzo.1993. Psychological Testing. Belmont, California.
Luthans Fred, 1992. Organizational Belwvior, McGraw-Hill Book Company, Singapore.
Masri Singarimbun dan Sofyan Effendi 1995 Metode Penelitian Survai LP3ES.
Milkvovich; Nowrnan, 1996. Compensation, McGraw-Hill Companies, Inc., USA.
Mondy Wayne R: Robert M. Noe; Shane R. Premeanx, 1999. Human Resource Management. Seventh
editions, Prentice-Hall International., Inc, USA.
Mondy, R. W. and R M. Noe. 1995. Human Resource Management. Massachusetts: Allyn and Bacon.
Noe, Hollenbeck, Gerhart, Wright, 2003. Human Resource management, International edition.
McGraw-Hill, Inc., USA.
Palan, R. PhD. 2003, Competency Management: A Practitioner’s Guide, Specialist Management
Resources Sdn. Bhd, Kuala Lumpur.
Rampersaad, Hubert K., 2006. Total Performance Score card: Konsep Manajemen Baru Mencapai
Kinerja Dengan Integritas, alih bahasa Edy Dukarno dan Vinsensius Djemadu, Gramedia Pustaka
Utama, Jakarta
Robbins, Stephen P. 2007. Organizational Behavior 9 th Edition.Prentice-Hall International Inc
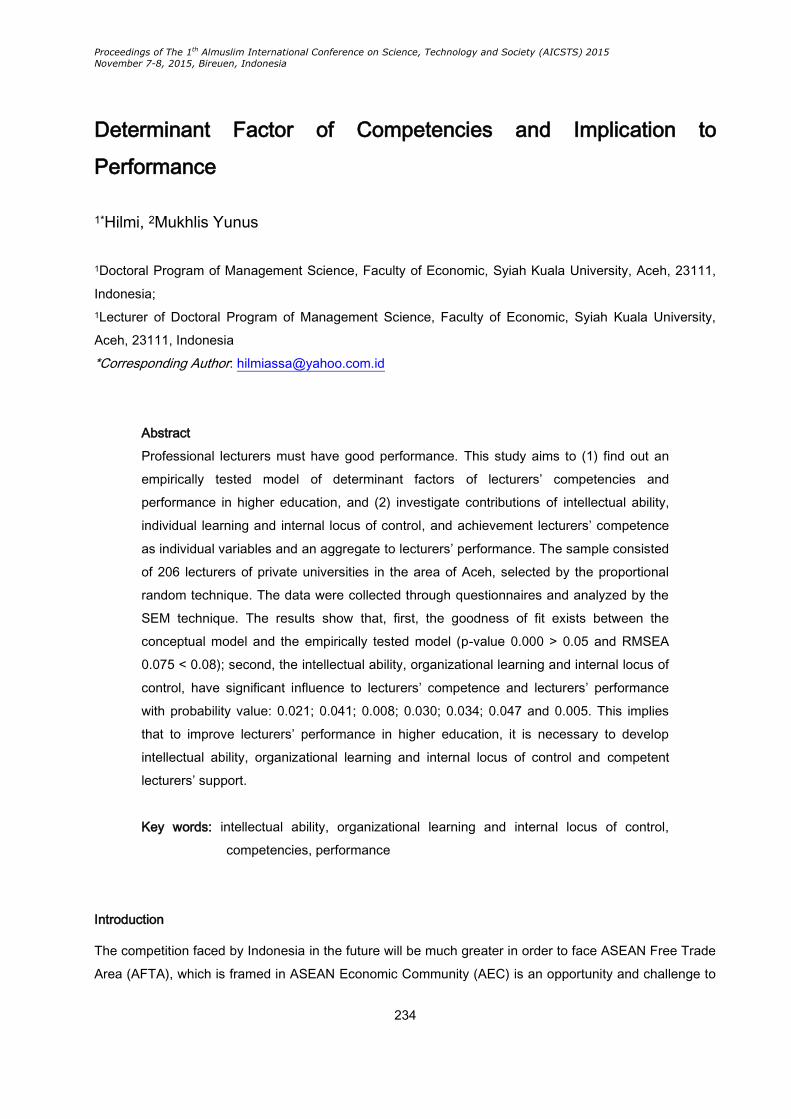
Proceedings of The 1th Almuslim International Conference on Science, Technology and Society (AICSTS) 2015
November 7-8, 2015, Bireuen, Indonesia
234
Determinant Factor of Competencies and Implication to
Performance
1*Hilmi, 2Mukhlis Yunus
1Doctoral Program of Management Science, Faculty of Economic, Syiah Kuala University, Aceh, 23111,
Indonesia;
1Lecturer of Doctoral Program of Management Science, Faculty of Economic, Syiah Kuala University,
Aceh, 23111, Indonesia
*Corresponding Author: [email protected]
Abstract
Professional lecturers must have good performance. This study aims to (1) find out an
empirically tested model of determinant factors of lecturers’ competencies and
performance in higher education, and (2) investigate contributions of intellectual ability,
individual learning and internal locus of control, and achievement lecturers’ competence
as individual variables and an aggregate to lecturers’ performance. The sample consisted
of 206 lecturers of private universities in the area of Aceh, selected by the proportional
random technique. The data were collected through questionnaires and analyzed by the
SEM technique. The results show that, first, the goodness of fit exists between the
conceptual model and the empirically tested model (p-value 0.000 > 0.05 and RMSEA
0.075 < 0.08); second, the intellectual ability, organizational learning and internal locus of
control, have significant influence to lecturers’ competence and lecturers’ performance
with probability value: 0.021; 0.041; 0.008; 0.030; 0.034; 0.047 and 0.005. This implies
that to improve lecturers’ performance in higher education, it is necessary to develop
intellectual ability, organizational learning and internal locus of control and competent
lecturers’ support.
Key words: intellectual ability, organizational learning and internal locus of control,
competencies, performance
Introduction
The competition faced by Indonesia in the future will be much greater in order to face ASEAN Free Trade
Area (AFTA), which is framed in ASEAN Economic Community (AEC) is an opportunity and challenge to
Proceedings of The 1th Almuslim International Conference on Science, Technology and Society (AICSTS) 2015
November 7-8, 2015, Bireuen, Indonesia
235
Indonesia, especially in the educational challenge scored reliable and skilled labor in the education level
of the people of Indonesia, especially the productive labor force was still low when compared to the
ASEAN member other countries. In other words, the impact of AFTA penetrated into many areas of life,
including education and the world of higher education. Public demands on the quality of higher education
as a result of globalization are a concrete problem, the solution of which can not be delayed. This means
that the learning process in universities must be qualified and meet the quality standards set. The
existence and the challenges of a college depend on the assessment of the stakeholders. Therefore,
universities need to run a quality assurance process for the convening of education.
In addition, demand in improving higher education today needs to take into account the addition of human
resources, especially lecturers as qualified educators. According Sonhadji (1990) says that the principal
mission of the college is to develop, transfer and apply knowledge through experience of Tri Dharma
College by placing the lecturer as major human resources.
The problem faced by the management of organizations or universities in Aceh is a problem concerning
the faculty performance, because management needs to know and understand the factors that affect the
performance of the lecturer. Factors that affect the performance of the lecturer is going to make the
management can take the necessary policies, so as to improve the performance of lecturer’s demands
can be met in accordance with the purpose of Management in Private Universities. In addition to the
success of the high performance of the lecturer is a key to the success of education, and the presence of
a lecturer is very influential on all the educational resources available. Therefore, to create a high
performance lecturer in higher education environments often associated with factors that influence the
performance of lecturers, including factors related to intellectual ability, factors related to organizational
learning, factors relating to the locus of control, and factors related to competence.
As known in the laws of the Republic of Indonesia Number 14 Year 2005 about teachers and lecturers,
explained that: "competence is a set of knowledge, skills and behaviors that should be owned,
internalized and mastered by teachers or lecturers in carry out the task in a professional manner. Mc
Ashan argued that competence is defined as the knowledge, skills and abilities controlled by someone
who has been a part of him, so that it can perform behaviors cognitive, affective, and psychomotor as well
as possible. Finch and Cruncilton defines competence as a mastery of tasks, skills, attitudes, and
appreciation done to sustain success (Mulyasa, 2009).
According to Grote in Pramudyo (2010) , the competence can be used to predict performance, ie who is
performing well and less well depends on the competence which has, measured from the criteria or used
standards. Competence is a set of knowledge, skills, behavior that must be owned by a person in carrying
out the task of professionalism (Pramudyo, 2010). Meanwhile, according to Rivai and Sagala (2009),
competence is a desire to make an impact on others and the ability for influence other. Thus, to realize
that education is successful, then an educator must master duties and skilled in performing their duties as
educators.

Proceedings of The 1th Almuslim International Conference on Science, Technology and Society (AICSTS) 2015
November 7-8, 2015, Bireuen, Indonesia
236
From the foregoing it appears that the competence is reference of the ability to implement something that
is acquired through education, lecturer competence refers to performance and act rationally to meet
certain specifications in implementation of educational tasks. Said to be rational because have direction
and purpose, while the performance is real behavior in the sense not only be observed, but includes
something invisible.
Becher, et.al. (2001) in their research stated that competence as the knowledge, expertise, ability, or
personal characteristics of the individual that directly affect job performance. In contrast to Munene (2008)
says that the main role of the competence of educators in preparing human resources is priority set
based training competency-based management including educator competence, and performance
assessment targets educators. The competence of lecturers measured perceptional can be done through
a " pedagogical competence (in the field of learning / academic), professional competence, social
competence and personal competence ", acquired through professional education (Law of the Republic of
Indonesia Number 14 of 2005). Whereas Feryal (2010) that the competence of lecturers must have the
ability to use a variety of teaching methods in the classroom, their learning needs to meet with students,
creating a relaxing environment to meet the needs and interests of the student motivation to learn, but as
the affective side is considered the most important faculty should have the performance. When they fail
that they are responsible, but students believe they would receive if lecture give sufficient encouragement
and positive feedback, it will increase their desire to study harder.
As mention above, determinant factor for competencies are intellectual ability, organizational learning and
internal locus of control. According to Goleman (2002), said that intellectual ability is the ability to
recognize our own feelings and the feelings of others, the ability to motivate yourself and the ability to
manage emotions well in ourselves and in relationships with others. Intellectual ability will make the
individual has the competence to carry out his duties without any doubt to one that can yield better
performance. Intellectual ability is the capacity needed to run a mental activity (Robbins, 2008). The
results of study from Kak et. al. (2001), that the intellectual ability to make people have the competence
includes the knowledge, skills, abilities and characteristics. It is obtained from professional services
through pre -service education, in-service training and work experience as well as standard personal
relationships can be achieved with a high work results.
While learning organization is an organization of activities to improve the mastery of science, skill,
professionalism, and other fields, that are sustainable both through formal and informal will make
improvement in the performance of one's own carry out their duties . Pedler in Dale (2003) says that the
learning organization is an organization that facilitates the learning of all its members and continuously
transforms them. The study results Kogut Zander (1992); Henderson and Cockburn (1994) said the
organization is a learning process in which organizations use existing knowledge and build new
knowledge to shape the development of new competencies that are essential in a constantly changing
environment . Results of another study by Wang Lo (2003) stated that organizational learning has positive
influence on competence. The study results Khandekar Sharma (2006) aims to show the role of

Proceedings of The 1th Almuslim International Conference on Science, Technology and Society (AICSTS) 2015
November 7-8, 2015, Bireuen, Indonesia
237
organizational learning are increasingly important for performance. Research found that organizational
learning through activities of human resources has a positive influence on performance.
Beside that, Individuals who have external locus of control have confidence that the controlling of all
aspects of life and the amplifier receives is luck, fate, or anyone else outside himself (Rotter, 1990). The
study results Howell Avolio (1983) that an internal locus of control affect performance significantly and
positively. The positive influence between internal locus of control with the achievement of the
performance is the belief that what happened to him, failure or success due to the influence of his own.
While the study of Sheldon (2010) describes that communication competence is positively influenced by
internal locus of control, means internal locus of control a significant effect on the competence of
individuals to achieve success in obtaining achievements.
Based on all the descriptions, the purpose of this study was to assess and obtain empirical evidence,
namely:
1. Examine and analyze the effect of intellectual abilities on the performance of lecturers.
2. Examine and analyze the influence of organizational learning on the performance of lecturers
3. Examine and analyze the influence locus of control on the performance of lecturers.
4. Test and analyze the influence intellectual abilities on the competence of lecturers.
5. Examine and analyze the impact of organizational learning on the competence of lecturers.
6. Examine and analyze the influence locus of control on the competence of lecturers.
7. Examine and analyze the influence of competence on the performance of the lecturer
Research Methods
Procedure
The method of this study is descriptive correlation which was performed by field approach. The measures
for all the constructs in this study were adapted from past research. The 5-point Likert scale was used for
the entire study. The statistical population consisted of lecturers and managers working in university at
Kopertis XIII Aceh. The sample size was considered equal to the population. SPSS (Version 16) software
was used to analyze the data which is taken from questionnaires. As to the statistical measures,
descriptive statistics including frequency, percentage, mean, standard deviation and tabulations were
used to describe the data.
Instrument Test
Test reliability and validity test questionnaire. Reliability measured by Cronbach's coefficient alpha. Test
the validity of items to test whether each the questions really have valid / invalid. Some other test with
SEM, among others, namely: a. Univariate outlier test, b. Multivariate outlier test, c. Unidimensionalitas
Test, d. Causality Test.
Data Analysis

Proceedings of The 1th Almuslim International Conference on Science, Technology and Society (AICSTS) 2015
November 7-8, 2015, Bireuen, Indonesia
238
The analysis model is Structural Equation Modeling or SEM. SEM analysis process model is done
through seven stages, namely:
1. Conceptualization models
2. Preparation of the path diagram
3. Preparation of structural equation
4. Select the type of input matrix and estimation models
5. Assess the structural model identification
6. Judging GOF criteria
7. Interpretation and modification of the model
Results and Discussion
Test Reliability and Validity
The test results showed that all items quite valid questions with Cronbach's Alpha Coefficient above 0.60
means that the indicators used in each constructs is acceptable.
Multivariate Outlier Test
The test results outlier is said that all the cases that have mahalonobis greater than 45.315 is due to the
result (p1) is still under 0.001 of observation we can conclude there is no in data.
Confirmatory factor analysis
Results of confirmatory factor analysis is any indicator variables or dimensions forming respective latent
variables showed a good result, values (CR) above 1.96 with a P less than 0.05. Formed latent variables
certainly have a cut-off value above 0.7 for CR (constructs reliability) declare or all indicators to a p-value
less than 0.05. Concluded indicators forming latent variable - CONSTRUCTS construct exogenous and
endogenous showed a strong indicator in the measurement of latent variables.
Normality Test
Testing normality of the data on all the variables of this study indicated that the results of the analysis of
multivariate normality has a value of 1.754 CR 2.58, so it can be said that the data ditributed multivariate
normal.
Goodness of Fit Test
After testing on all latent variables, the results are valid and reliable, the data multivariate normal, does
not occur multi-collinearity and outliers, then the latent variables can be continued in the form of Figure 1.
The analysis by the presented the following:
Proceedings of The 1th Almuslim International Conference on Science, Technology and Society (AICSTS) 2015
November 7-8, 2015, Bireuen, Indonesia
239
Figure 1. Result of Path Analysis Model
Hypothesis Test
In detail the results of the study hypothesis testing are discussed gradually in accordance with the
hypothesis that has been filed, namely 7 (seven) hypothesis presented as follows;
1. Intellectual ability (X1) significant effect on Lecturer performance (Y2) with direction positive
relationship. This can be seen from the path marked positive coefficient of 0.170 with a value of
CR at 2.214 and obtained a significance probability (p) of 0.021 which is smaller than the
significance level () which was set at 0.05,
2. Organizational learning (X2) significantly affects the Lecturer performance (Y2) with the direction
of a positive relationship. This can be seen from the path marked positive coefficient of 0.235 with
a value of CR at 2.046 and obtained a significance probability (p) of 0.041 which is smaller than
the significance level () which was set at 0.05,
3. Locus of control (X3) significant effect on Lecturer performance (Y2) with direction positive
relationship. This can be seen from the path marked positive coefficient of 0.186 with a value of
CR at 2.313 and obtained a significance probability (p) of 0.008 which is smaller than the
significance level () which was set at 0.05,
4. Intellectual ability (X1) significant effect on Lecturer competencies (Y1) with direction positive
relationship. This can be seen from the path marked positive coefficient of 0.236 with a value of
CR at 2.166 and obtained a significance probability (p) of 0.030 which is smaller than the
significance level () which was set at 0.05,
5. Organizational learning (X2) significantly affects the competencies (Y1) with the direction of a
positive relationship. This can be seen from the path marked positive coefficient of 0.254 with a
value of CR at 2.120 and obtained a significance probability (p) of 0.034 which is smaller than the
significance level () which was set at 0.05,
Intellectual
abilities
Organizational
Learning
Locus of
Control
Competencies Performance
(Y2)
Proceedings of The 1th Almuslim International Conference on Science, Technology and Society (AICSTS) 2015
November 7-8, 2015, Bireuen, Indonesia
240
6. Locus of control (X3) significant effect on competencies (Y1) with direction positive relationship.
This can be seen from the path marked positive coefficient of 0.230 with a value of CR at 1.986
and obtained a significance probability (p) of 0.047 which is smaller than the significance level ()
which was set at 0.05,
7. Competencies (Y1) significant effect on Lecturer performance (Y2) with direction positive
relationship. This can be seen from the path marked positive coefficient of 0.315 with a value of
CR at 2.782 and obtained a significance probability (p) of 0.005 which is smaller than the
significance level () which was set at 0.05.
Discussion
Results of the first hypothesis, intellectual ability affect the performance of the lecturers, the results
otherwise significant to the direction of a positive relationship. This is because the lecturers are able to
think rationally, creative, and innovative, is also able to decide right and fair, able to produce results
employment and self belief that they can demonstrated expertise in the field of learning. Results of this
study support the findings of Bettin (2001), Yuliana (2006), Sturman (2007) and Yunanto (2008).
Results of the second hypothesis, organizational learning affect the performance of the lecturers, the
results are declared a significant positive correlation with the direction. This matter because the lecturers
are able to think systemically to completing his work, able to deepen mastery of himself , with their self-
confidence can improve their skills and have commitment to transfer knowledge and experience to
students. Result of this study supports the findings of Chaston Sadler (2000), Friedman (2005), Shantha
Liyanege (2002), López (2005) and Khandekar Sharma (2006).
Results of the third hypothesis, affect the performance of the lecturers, the results otherwise significant to
the direction of a positive relationship. This is because there is confidence of lecturer to demonstrate the
capabilities and skills, have a strong grasp to achieve triumph, and confident that his efforts could
success. Results of this study support the results the findings of Hyatt T. D. Prawitt (2001), Kustini (2004),
Syaiful (2009).
Results of the fourth hypothesis, competence affect the performance of the lecturers, the results revealed
a significant with the direction of a positive relationship. This is because lecturers are required to improve
the competence of learning such as understanding of lecture material in accordance with syllabus / SAP,
can utilize technology learning, prosecuted as a role model for students and the community, and be able
to embed a sense of loyalty in the mix. The study results support the findings of Endah Setyowati (2002)
and Vathanophas Thaingam (2007).
Results of the fifth hypothesis, intellectual ability affect the competence of lecturers, the results a
significant positive correlation with the direction. This matter because the professor is able to design and
develop learning, develop knowledge by utilizing technology, able to motivate the students, has a concept
Proceedings of The 1th Almuslim International Conference on Science, Technology and Society (AICSTS) 2015
November 7-8, 2015, Bireuen, Indonesia
241
and disciplines, able to understand the material lectures and teaching methods for the purpose
competence. Results of this study support the results the findings of Sister (2001), Silverman (2008).
Results of the sixth hypothesis, organizational learning significant effect on the competence of lecturers,
significant results are expressed with direction positive relationship. This is because the lecturer has the
ability to create a learning process, embody confidence in improving skills, creating a shared vision, to
develop self-control in competence. Result this study supports the findings of O'Keeffe T. (2002), Wang
Lo (2003), Pillay, Richard Wilss (2005), Leyking, Chikova Loos (2007), Shaihah, Sarmad Karaghouli
(2009).
Results of the seventh hypothesis, competence has significant effect on the of lecturers performance,
significant results expressed with direction positive relationship. This is because the lecturer have
confidence that he is able to implement the learning process and realize plans are perceived, fruitless
valuable, success or triumph, understand the concepts and scientific disciplines, and able to develop
professionally. Results of this study support the findings of Zulkaida (2007).
Conclusions
The results of the data analysis showed that intellectual ability, organizational learning and internal locus
of control, have significant influence to lecturers’ competence and lecturers’ performance. Lecturer of
Aceh universities should convert competencies as a strategy into their core operations and systems to
meet lecturers’ demands and the universities goals. This conversion shall make lecturers show their
sincere competency that is beneficial for the lecturer’s performance which has a significant impact on
performance. This study was based on a single service industry (higher education sector) with its own
peculiar characteristics. It is not clear to what extent the substantive results of this study can be
generalized to other industries. Future research should apply the study’s model on a larger population of
other types of universities and other service and manufacturing industries.
References
Becher, Brian, M. Huselid D. Ulrich. 2001. The HR Scorecard Linking People, Strategy and Performance.
Boston: Havard Business School Press.
Chaston I., B. Badger and E.S. Sadler. 2000. Organizational Learning Style and Competences, Group
Organizational Learning Development Centre. Plymouth Business School, University of
Playmouth, UK.
Dale, Margaret. 2003. Developing Management Skills, Techniques for Improving Learning Performance,
Jakarta: Penerbit Gramedia.
E. Mulyasa, 2009, Kurikulum Berbasis Kompetensi, (Bandung: Remaja Rosdakarya), ed. 11, p. 38.
Endah, Setyowati. 2002. Pengembangan SDM Berbasis Kompetensi, Solusi untuk Meningkatkan Kinerja
Organisasi, Jurnal Ekonomi & Bisnis, Volume IV,No.1, September, hal. 21-39.
Friedman, H.H., L.W. Friedman S. Pollack. 2005. Transforming a University from a Teaching
Organization to a Learning Organization. Review od Business, 26 (3), pp.31-35.
Proceedings of The 1th Almuslim International Conference on Science, Technology and Society (AICSTS) 2015
November 7-8, 2015, Bireuen, Indonesia
242
Goleman, Daniel. 2002. Emotional Intelegence-Kecerdasan Emosional, Terjemahan Alex Tri Kancoro
Widodo. Jakarta: PT. Gramedia.
Hyatt, T., and D. Prawitt. 2001. Does Congruence Between Audit Structure and Auditors Locus of Control
Affect Job Performance?, The Accounting Review 76,pp.60-89.
Kak, Neeraj, B. Burkhalter, and M.A. Cooper. 2001, Measuring the Competence of Healthcare Providers,
Issue Paper, Volume No. 2, Issue 1.
Khandekar, A. and A. Sharma. 2006, Organizational Learning and Performmance: Understanding Indian
Scenario in Present Global Context Education and Training, Vol.48, No.8/9,pp.682-695
Kustini, Kuntoro. 2004, Analisis Pengaruh Locus of Control Orientasi Tujuan Pembelajaran dan
Lingkungan Kerja Terhadap Self Ecicacy dan Transfer Pelatihan Karyawan PT. Telkom Kandatel
Surabaya, Disertasi, Pascasarjana Universitas Airlangga Surabaya
Leyking K., P. Chikova and P. Loos. 2007, Competency-and Process-Driven e-Learning-a Model-Based
Approach, The Electronic Journal of e-Learning, Vol 5. Issue 3, pp 183-194
Lopez, S.P., J. M. Peon, and C.J.V. Ordas. 2005, Organizational Learning as a Determining Factor in
Business Performance, The Learning Organization, Vol.12 No.3, pp.227-145
Munene, J.C., F. Mulira and F. Kasekende. 2008, Teacher Operant Competences and Organisational
Citizenship Behaviour in the Performance of Ugandan Primary Schools, Kampala, Uganda
National Examination Board
Pramudyo, Anung. 2010. Analisis Faktor-faktor yang Mempengaruhi Kinerja Dosen Negeri Dipekerjakan
Pada Kopertis Wilayah V Yogyakarta. Volume 1, Nomor 1, JBTI: Yogyakarta -586.
Rivai, Veithzal dan Ella Jauvani Sagala. 2009. Manajemen Sumber Daya Manusia Untuk Perusahaan.
PT. Raja Grafindo Persada: Jakarta.
Robbins, S.P. dan J.Timothy A. 2008, Perilaku Organisasi, Buku 1 dan 2. Jakarta: Salemba Empat
Sturman, M.C., C.O. Trevor, J.W. Boudreau, and B. Gerhart. 2007, Is it Worth it to Win The Talent War?
Evaluating the Utility of Performance-Based Pay Personnel Psychology, 997-1035
Yuliana, Eka. 2006, Pengaruh Kemampuan Intelektual dan Motivasi Kerja Terhadap Kinerja Guru Mata
Diklat Produktif Penjualan Di SMK Bisnis dan Manajemen, Semarang, Universitas Diponegoro
Yunanto, Agus. 2008, Pengaruh Eksistensi Diri, Keterkaitan Sosial, Pertumbuhan Individu dan
Peningkatan Kemampuan Intelektual Terhadap Prestasi Kerja Pegawai Kantor Pelayanan Pajak
Pratama Di Surakarta, Semarang, Universitas Diponegoro
Zulkaida, A. 2007, Pengaruh Locus of Control dan Efikasi Diri Terhadap Kematangan Karir Siswa
Sekolah Menengah Atas (SMA), Proceeding Pesat 2, B1-B4. Available FTP:
e_journal.gunadarma.ac.id

Proceedings of The 1th Almuslim International Conference on Science, Technology and Society (AICSTS) 2015
November 7-8, 2015, Bireuen, Indonesia
243
Micro Finance Model of Agriculture in Supporting Economic
Growth in Aceh
1*Muammar Khaddafi, 2Mohammad Heikal
Faculty of Economics and Business, University of Malikussaleh Lhokseumawe, Indonesia
*Corresponding Author: [email protected]
Abstract
The general objective of this study was to analyze the model of micro-financing of
agriculture in order to develop the rural economy and support economic growth in Aceh.
The specific purpose of this study is to identify and analyze the social and economic
profile of households recipient farmer agricultural credit and micro enterprises in Aceh, to
evaluate the performance of credit financing to the Government Bank Sector Micro
Farms, identify prospects, challenges and constraints of microfinance institutions in
microfinance lending farming in Aceh and analyze the sustainability of microfinance
models of agriculture in Aceh, and formulate policies appropriate agricultural micro-
financing in supporting economic growth in Aceh. Financing system analysis conducted
qualitative description, including ease of access to credit, credit suitability, filling and
retrieval mechanism of credit, smoothness, obstacles and constraints in lending, loan
interest rate and loan repayment system including congestion anticipation loans.
Determination of the effectiveness of microcredit agriculture Scoring is done via method.
The effectiveness of agricultural micro-credit schemes assessed through monitoring and
evaluation of the performance of some aspects of inputs, processes, outputs, outcomes,
benefits and impact. Analysis of the sustainability of credit schemes analyzed based on
financial viability, institutional viability (managerial), and the viability of the participants.
Results of studies in which micro-financing system for farming and still there has been no
financial institution that helps, financing done still in the form of government assistance to
the farmers and there is no oversight of government ranging from distribution, so that
harvesting and collection processes, outputs, outcomes, benefits and can not feel the
impact in the community.
Keywords: finance, micro, outcomes, benefits and impact
Introduction
Echoes of the role of credit, particularly micro-credit for the creation of self-employment (self-employment)
in order to reduce poverty in rural areas began to develop widely in the world since the convening of
microcredit summit in 1997 in Washington DC. United States of America. Socialization and large-scale
Proceedings of The 1th Almuslim International Conference on Science, Technology and Society (AICSTS) 2015
November 7-8, 2015, Bireuen, Indonesia
244
campaign carried out in almost all countries in the world. The micro summit aims to reach 100 million poor
people in the world in 2003. Microfinance is a powerful tool to promote economic growth, reduce poverty,
promotes growth of human resources and improving the status of women (Asian Development Bank,
1998).
The agricultural sector is not only the largest contributor to the Gross Domestic product (GDP) of Aceh,
but also sectors that support economic growth in Aceh. Data Bank Indonesia said that in 2011, economic
growth in Aceh grew significantly by 5.02 percent from 2.79 percent in 2010. The increase in growth only
occurs in the agricultural sector and the services sector with growth of 6.74 each percent and 4.43
percent. However, the development of this sector is still underdeveloped (Kompas, 2012).
The agricultural sector in Aceh mostly in the category of micro, small and medium enterprises sector
(MSM). Credit statistics show, MKM agricultural sector only has a share of 0.76 percent, far than lending
to the trade sector, which reached 25.96 percent. In fact, credit, capital urgently needed agricultural
sector actors, especially farmers to be able to develop its agricultural business. In terms of the level of
non-performing loan (NPL) or non-performing loans, the agricultural sector only showed figures of 7.89
percent or far below the construction sector, which reached 34.49 percent. NPL rate of the agricultural
sector also recorded lower than the manufacturing industry and trade, which respectively reached 9.95
percent and 8.17 percent. Some of the factors that lead to low credit at MKM sectors, especially
agriculture, which are weak capital structure and lack of access to sources of financing, the lack of market
access to potential markets, and the quality of goods produced have not been standardized. Agricultural
businesses are usually not achieves economies of scale so that the overhead costs high and cause very
minimal benefit farmers (Bank Indonesia, 2012). In 2011, economic growth in Aceh grew significantly,
namely 5.02 percent from 2.79 percent in 2010. The increase in growth occurred in the agricultural sector
and the services sector with growth of respectively 6.74 percent and 4.43 percent, while other sectors
slowed. In the structure of GDP, the agricultural sector in Aceh with contributes 27.70 percent by the
fourth quarter of 2011. The sector is dominated by the food crops, such as grains, corn, tubers, and nuts.
Research on the model of development and micro-finance systems in the agricultural sector is very
important given the finance function effectively to achieve the optimum level in terms of the scale of
business and technology adoption both production and post-harvest technologies that can create
business efficiency that can increase the income of farmers in particular, economic development rural and
economic growth in Aceh in general.
Research Objectives
Analyzing agricultural micro-financing models in order to develop the rural economy and support
economic growth in Aceh. The specific objective of this research can be described as follows:
1. Identify the socioeconomic profile of farmers' households and micro credit recipients agriculture in
Aceh
Proceedings of The 1th Almuslim International Conference on Science, Technology and Society (AICSTS) 2015
November 7-8, 2015, Bireuen, Indonesia
245
2. Evaluate the financial performance of the Bank's credit to the Government of Micro Agricultural
Sector
3. Identifying prospects, challenges and constraints of microfinance institutions in microfinance
lending agriculture in Aceh.
4. Analyze the micro-financing system of agriculture include access to credit, the distribution
mechanism and micro-finance loan repayment system of agriculture in Aceh.
Literature
Micro Financing Program of Agricultural Development in Indonesia
Financing is one of the strategic components in the revitalization of agriculture. Broadly speaking,
agricultural finance policy covers two things: (1) agricultural development financing policies that prioritize
the budget for agriculture and supporting sectors; and (2) agricultural finance policy that is accessible to
the public (MOA, 2005). Both of these policies aim to provide capital assistance for businesses in
agriculture. In general, capital assistance program or a credit for the agricultural sector comes from the
following sources: (1) from the State Budget (APBN), such as credit BIMAS, KUT, Food Security Credit
(CTF), Skim Agricultural Financing Services (SP3), BLM , development of Microfinance Institutions
(LKMA); (2) foreign aid projects in the form of bilateral relations such as Second Kennedy Round (SKR)
and of multilateral cooperation such as Farmers' Income Improvement Program / Small Fishermen (P4K)
(Ashari, 2009).
In 2008 the government through the Ministry of Agriculture launched a new program called the Rural
Agribusiness Development (PUAP). PUAP is part of the implementation of the PNPM - Mandiri through
the help of venture capital in order to develop agribusiness in accordance with agricultural potential target
villages which aims to reduce poverty and increase employment opportunities (Paloma, 2013).
Strengthening venture capital group / PMUK, interest subsidy (Food Security Credit / CTF) or who have a
commercial approach (Skim Care Financing Agriculture / SP3). SP3 is agricultural finance schemes to
encourage financing / credit on micro enterprises and small-scale agriculture through executing banks by
way of the provision of underwriting services and facilities for credit risk. In general guideline Agricultural
Financing Services Scheme issued by the Ministry of Agriculture in 2006, the goal rather than SP3 are:
(1) Provide certainty every effort micro and small agricultural sector to obtain the services of credit /
financing; (2) encourage lending / financing of banks implementing the agricultural sector through
insurance mechanisms and for risk; (3) increase the portfolio of credit / bank financing to the agricultural
sector.
Each scheme has rules, procedures and administrative requirements and different objectives. For
managers of financial institutions, the problems encountered varied, ranging from the selection of
potential borrowers to the implementation on the ground. As for businesses, the problems faced not only

Proceedings of The 1th Almuslim International Conference on Science, Technology and Society (AICSTS) 2015
November 7-8, 2015, Bireuen, Indonesia
246
in business activities, but also problems related to accessibility to financing schemes that exist (Aha et al,
2003).
Problems in Credit Markets
In rural areas, there are two types of credit markets or market financing (Aha et al, 2003), the formal
financial market and informal financial markets. Formal financing sorted again into the financing program
and non-program financing. Financing non-program operates in rural filing and distribution mechanisms
follow the market mechanism. That is, the rules of eligibility applied formally, such as the interest rate is
the interest rate charged to commercial and serviced by formal institutions. While financing is financing
schemes in implementation associated with a government program that generally sector program.
Typically the program is a sector effort to achieve certain objectives, such as CTF (Credit Food Security)
to increase food production, Primary Cooperatives Members (KKPA), Family Income Improvement Effort
Acceptor (UUPKA) and others. In practice, the program is admittedly still face many obstacles and
barriers, not only on the provider of funds but also on the part of the beneficiary as businesses. For
example, credit uptake and energy food security program is not more than 30%.
New-Keynesian approach suggests that basically runs the credit markets are not perfect (imperfect
market), especially in the presence of asymmetric information among market participants. The information
asymmetry leads to moral hazard of action is to use the credit for other purposes that are at high risk. In
addition, adverse selection problem arises that the declining quality of the credit worthiness of the debtor.
Role of Microfinance Agriculture and Economic Growth
Much of the literature and research results have proved that the interrelation between financial system
development / financing with the level of investment and economic growth is to exist. The main focus of
the development of the financial system, especially the banking system, is an increase in external
financing or bank credit to the business or the real sector. Some research has also shown that the
development of the financial system is closely linked to the level of investment and economic growth.
There is relationship between the type of financial system with the level of investment and economic
growth. Five basic functions of financial intermediation can enhance the effect of the financial sector to
economic growth, among others: (a) mobilize savings; (B) risk management; (C) obtaining information;
(D) monitor the borrower and the use of controlled companies; and (e) facilitate transactions (Levine,
1997: Allen and Gale, 2000, Beck et. al. 2001 and Wachtel, 2001 in Wahid, 2011).
Dey and Falherty (2005) explains that the provision of bank credit was instrumental in determining the
level of investment and economic growth rates. Another factor determining the level of investment and
economic growth rate is the interest rate of bank credit. The development of the financial system and the
efficiency of the financial system as a whole has affected the level of investment and economic growth.
The study is supported by studies Freedman and Paul (2004), which explains the positive relationship
between institutional structure with economic growth and investment rates in industrialized countries.
Proceedings of The 1th Almuslim International Conference on Science, Technology and Society (AICSTS) 2015
November 7-8, 2015, Bireuen, Indonesia
247
Preliminary Study
Previous research underlying this research, including research analysis PUKK lending Pertamina UPMS I
Medan for small entrepreneurs in Nanggroe Aceh Darussalam. The survey results revealed that the
current ratio, profit margins, credit guarantees, level of experience, and the economic sector effect on
lending. While the quick ratio, economic profitability, character debtor has no effect on lending decisions
(Khadafi, 2003).
Support previous research related to micro loans and credit utilization for the community based micro-
finance research on finance and community development in 12 Rural Environment PT Arun Kota
Lhokseumawe, known that alms productive positive and significant impact on the economic
empowerment of the community. Micro financing of alms proceeds channeled to communities, companies
PT. Arun Kota Lhokseumawe through venture capital greatly assist the growth of income for the recipient.
The provision of such assistance to the people who have a business. This empowerment through
productive alms (Khadafi, 2010).
Research Methods
Method Location and Respondent Research
The research location is determined by purposive taking into account the objectives of the program
financing or financing the implementation of the scheme, including credit and interest rate of financing to
develop the commodity / target institution. Location studies to analyze agricultural micro finance schemes
include Credit Food Security (CTF), Skim Agricultural Financing Services (SP3), and PUAP done in Pidie
and Aceh Utara District. In each district, will be selected one district and two rural credit development
potential. Each village would have been 15 farmers agricultural micro-credit users. So the number of
farmer respondents is 60 people. Determination of the respondent institutions loan portfolio will be
adjusted with the structure and credit problems.
Methods and Data Collection Procedures
Data sources can be classified into primary data sources (primary sources of data) and secondary data
sources (secondary of data sources). Primary data were obtained using a structured questionnaire based
on interviews with survey respondents. Secondary data sources of documentation on the various relevant
agencies and BPS BAPPEDA Aceh include, Ministry of Agriculture Office, Statistical Office of the District,
journals and scientific publications, as well as a variety of other official data sources.
Data Analysis
Identifying a descriptive analysis of socio-economic profile of house holds farmers and micro credit
recipients agriculture in Aceh.

Proceedings of The 1th Almuslim International Conference on Science, Technology and Society (AICSTS) 2015
November 7-8, 2015, Bireuen, Indonesia
248
Results and Discussion
Agricultural Microfinance Program In Aceh
Agricultural micro businesses are constrained by lack of access to capital, management of farmers,
availability of production facilities and infrastructure limited impact on the decline in production and farm
productivity. Farmer's capital can be sourced from own funds, loans from the kiosk farmer (specifically for
seeds, fertilizers and pharmaceuticals), moneylenders loan / brokers, and finance programs originating
from government funds. Until now, there has been no private investment in the form of Private
Microfinance Institutions which provide loan finance for capital for farmers farming in Aceh. This is due to
the high risk of crop failure due to poor management of human resources, lack of infrastructure support,
moral hazard, and security conditions in Aceh are not yet supported. Although Aceh has considerable
potential for agricultural development.
Currently, the program encouraged the government is financing the distribution of program funds Direct
Aid Society of Rural Agribusiness Development (BLM-PUAP) which is a breakthrough program the
Department of Agriculture for poverty reduction and job creation in rural areas while reducing the
development gap between regions and between the center and regions subsector. Location PUAP in
focus in 10,000 poor villages / under developed agricultural potential with a total budget of 1 trillion.
The government is also planning the development of infrastructure through the village funds that are
tailored to the needs of the village. The program is still in progress and is planned in 2015, the fund has
been able to be rolled village for the construction of infrastructure such as roads, bridges, markets,
irrigation, and others to support agricultural activities in rural areas.
In the framework of the protection and empowerment of farmers, farmer groups, and / or GAPOKTAN
against a fall in prices of grain, rice and / or corn at harvest time and the problems of food accessibility,
the government through the Ministry of Agriculture cq Food Security Agency carry out activities of the
Institute of Food Distribution Society Strengthening (Strengthening -LDPM). Through strengthening
activities-LDPM, government social assistance funds sourced from the State Budget (APBN) to
GAPOKTAN in order to empower these institutions so that they are able and empowered to conduct food
distribution activities, as well as the provision of food reserves. Distribution of social grants and the
provision of mentoring and coaching gradually expected to have an impact, among others, the
establishment of food prices, especially at the level of the farmer group union members and the
realization of food security at the household level of farmers through increased incomes and improved
food access GAPOKTAN members.
Direct Assistance Program Disbursement Unit Agribusiness Rural Development Society (BLM-PUAP)
Rural Agribusiness Development Program (PUAP) implemented by the farmers (owners of tenants or
tenants), farm laborers and poor farm households in rural areas through coordination GAPOKTAN as an

Proceedings of The 1th Almuslim International Conference on Science, Technology and Society (AICSTS) 2015
November 7-8, 2015, Bireuen, Indonesia
249
institution that is owned and managed by farmers. The Ministry of Agriculture has implemented since the
year 2008-2014 Rural Agribusiness Development Program (PUAP) under the coordination of the National
Program for Community Empowerment (PNPM Mandiri) and is in a group of community empowerment
program.
Implementation of Rural Agribusiness Development (PUAP) Year 2015 refers to the basic pattern laid
down in the Regulation of the Minister of Agriculture No. 06 / PERMENTAN / OT.140 / 2/2015 on
Guidelines for Rural Agribusiness Development (PUAP) in 2015, to improve the success of the
distribution of BLM -PUAP to GAPOKTAN in developing productive farmers. The basic strategy is carried
out through community empowerment, to optimize the potential of agribusiness, small farmers venture
capital facilitation, institutional strengthening and empowerment.
GAPOKTAN as executor PUAP, a collection of some farmer groups work together to increase economies
of scale and efficiency of businesses that receive funds PUAP BLM. Joint development of farmer group
(union) aimed at improving the ability of GAPOKTAN in carrying out its functions, increase the ability of
the members to develop agribusiness, institutional strengthening farmer organizations farmer be strong
and independent.
Strengthening Institutions Program Food Distribution Society (LDPM)
The policy conducted by the government through the Ministry of Agriculture in the implementation of
activities aimed at achieving Strengthening-LDPM stabilization of food prices at the farm level and food
security at the household level farmers through:
a. Development of business units (business unit distribution or marketing or processing and
management of food reserves)
b. Construction of storage facilities owned by GAPOKTAN order to improve the bargaining position
of farmers, increase value-added production of farmers and bring people's access to food
sources
Strengthening-LDPM activities aimed at:
1. Empowering GAPOKTAN to be able to develop a business unit of distribution or marketing or
processing of food reserves and the management unit, among other things in terms of:
a. Storage facilities (warehouses) itself.
b. Providing and managing food reserves (grain / rice) at least for the needs of its members in
the face of famine.
c. The stabilization of the purchase price for the commodity grain farmer members, rice and /
or corn at harvest time through the purchase-sales activities.
2. Developing agribusiness through increased business of buying and selling of grain, rice and /
or corn and other strategic food outside the harvest of grain / rice / corn.
3. Increase the value-added products farmer members through storage or processing or
packaging and others.
Proceedings of The 1th Almuslim International Conference on Science, Technology and Society (AICSTS) 2015
November 7-8, 2015, Bireuen, Indonesia
250
Target-strengthening activities LDPM is GAPOKTAN existing / already exist, is not a new formation and
meets the criteria, namely:
1. Located in the area of rice production centers / corn.
2. Have a business unit of distribution or marketing or processing of food reserves and the
management unit
3. Have a warehouse for the storage facilities can be built or land for storage facilities
(warehouses). The land is owned by GAPOKTAN or land donated to GAPOKTAN.
Socio-economic profiles of farmers recipient household credit / grants and micro-enterprise farming in
Aceh
Table 1 explains that the growth in acreage, harvested area, productivity and production of rice in Aceh
Utara District from 2008 to 2014. The growth in acreage by increasing from 57 804 hectares to 72 702
(25.77%), harvested area increased from 57 694 ha to 72 747 ha (26.09%), productivity increased from
48.02 kw / ha to 56.05 kw / ha (16.72%), and rice production increased from 277,034.20 tons to be 407
716, 14 tons (47.17 %).
Tabel 1. Developments Land Area, Harvested Area, Production and Productivity of Rice Intensification in
Aceh Utara District
Year Planted (ha) Harvested Area (Ha) Productivity (Kw / Ha) Production (Ton)
2008 57.804,00 57.694,00 48,02 277 034,20
2009 56 627,00 53 724,00 53,05 285 019,80
2010 60 492,00 60 097,00 53,55 321 799,07
2011 72 702,00 72 747.00 56,05 407 716,14
Source: Department of Agriculture and Animal Husbandry Aceh Utara District
Livestock sub-sector which received funding from the government also increased, namely goats
increased from 129 009 142 176 tail into a tail (10.21%), domestic poultry increased from 579 324 603
819 tail into a tail (4.23%), broilers increased from 332 420 head may be tails 335 190 (0.83%) and ducks
increased from 322 512 332 703 tail into tail (3.16%). Percentage growth in broiler small relative because
of the high risk of death due to disease and higher chicken feed prices (Table 2).
Table 2. Development of Goats and Poultry Population in Aceh Utara District
year Goats (Tail) Native Chicken (Tail) Broiler (Tail) Ducks (Tail)
2008 129.009 579.324 332.420 322.512
2009 139.373 591.620 328.640 325.829
2010 140.767 597.837 331.927 329.410
2011 142.176 603.819 335.190 332.703
Source: Department of Agriculture and Animal Husbandry Aceh Utara District
Proceedings of The 1th Almuslim International Conference on Science, Technology and Society (AICSTS) 2015
November 7-8, 2015, Bireuen, Indonesia
251
Concomitant with rice growth and goats and poultry farms, in general, regional per capita income in Aceh
Utara District also increased from 2008 to 2013 is Rp. 9.27887 million increases to USD 12.0244 million,
or a growth of 29.59% (Table 3).
Table 3. Development of Regional Income Per Capita Without Oil and Gas in Aceh Utara District
Year Regional income per capita (Thousand)
2009 9.278,87
2010 10.143,33
2011 10.994,66
2012 12.024,40
Source: BPS - BPS Aceh Utara District
Identify prospects, challenges and constraints of microfinance institutions in channeling agricultural
microfinance in Aceh
Agricultural micro finance portfolio is channeled through GAPOKTAN because until now there is no Micro
Finance Institutions (MFIs) in Aceh. Although there have been directives from the government to establish
a Microfinance Institution, but in fact GAPOKTAN not want to form a Microfinance Institution that is a
savings and loan, because it is based on the rhetoric of failure of savings and credit cooperatives in Aceh
is the crisis of confidence between the cooperative management with cooperative members because of
the high misappropriation of funds in Aceh through cooperatives. Therefore, in this study the prospects,
challenges and constraints of agricultural micro finance portfolio focused on GAPOKTAN level.
Efforts to empower GAPOKTAN and develop productive business through Direct Assistance Program
Disbursement Unit Agribusiness Rural Development Society (BLM-PUAP) not only provide financial
assistance but the government is also providing training for a number of GAPOKTAN as was done by
GAPOKTAN PUAP in 2012, which is already undergoing training PUAP, special GAPOKTAN carried by
Ciawi Management Training Centre, which is housed in Saree Aceh Besar district.
Until now, an estimated 20% GAPOKTAN successful in managing BLM-PUAP with final balance above
Rp 100 million (> Rp. 100 million), 50% were classified GAPOKTAN successfully manage BLM-PUAP
with the final balance ranging> Rp. 30 million to <IDR. 100 million, and 30% GAPOKTAN who do not
successfully manage BLM-PUAP or refund due to the development of moral hazard at the farm level
recipients of BLM-PUAP that the fund is a grant from the government is and does not need to be returned
and also due to crop failure and is unable to return the BLM-PUAP so that the DAA can not be used again
as a revolving fund that can be reused for GAPOKTAN empowerment and development of productive
enterprises.
The problems that arise in the body GAPOKTAN because returns are very few in comparison with the
distribution of the Fund In the first stage, it was caused by the many members of farmers who

Proceedings of The 1th Almuslim International Conference on Science, Technology and Society (AICSTS) 2015
November 7-8, 2015, Bireuen, Indonesia
252
experienced crop failure or declining crop yields. However, based on the results of a routine consultation
committee and members of farmer groups, it was decided that the time period of repayment phase II
members of the group who have not paid off stage I shall repay the remainder of the first stage which has
not paid off until the next harvest.
Another issue is the development of moral hazard in a number of beneficiary farmers BLM-PUAP that the
fund is a grant and does not need to be returned as well as financial management GAPOKTAN are not
well structured which allows the misappropriation of funds at the level of BLM-PUAP GAPOKTAN, farmer
groups and farmers recipient BLM-PUAP.
Another issue is the development of moral hazard in a number of beneficiary farmers BLM-PUAP that the
fund is a grant and does not need to be returned as well as financial management GAPOKTAN are not
well structured which allows the misappropriation of funds at the level of BLM-PUAP GAPOKTAN, farmer
groups and farmers recipient BLM-PUAP Another issue is the development of moral hazard in a number
of beneficiary farmers BLM-PUAP that the fund is a grant and does not need to be returned as well as
financial management GAPOKTAN are not well structured which allows the misappropriation of funds at
the level of BLM-PUAP GAPOKTAN, farmer groups and farmers recipient BLM-PUAP. Another issue is
the development of moral hazard in a number of beneficiary farmers BLM-PUAP that the fund is a grant
and does not need to be returned as well as financial management GAPOKTAN are not well structured
which allows the misappropriation of funds at the level of BLM-PUAP GAPOKTAN, farmer groups and
farmers recipient BLM-PUAP.
Although there are a number of problems in implementation, but the program Disbursement BLM-PUAP
very good for development and business management guidance accompanied by relevant agencies
because it can overcome the problems of access to capital at the level of farmers and farmer
organizations improve performance in order to realize food security and economic resilience of the region
of Aceh, since until now there is no any microfinance institutions in Aceh who want to give credit to the
farming activities are laden with risk of crop failure, land tenure is relatively small, modern agricultural
system transition, and security conditions are unfavorable.
Agricultural micro finance portfolio is channeled through GAPOKTAN because until now there is no Micro
Finance Institutions (MFIs) in Aceh. Although there have been directives from the government to establish
a Microfinance Institution, but in fact GAPOKTAN not want to form a Microfinance Institution that is a
savings and loan, because it is based on the rhetoric of failure of savings and credit cooperatives in Aceh
is the crisis of confidence between the cooperative management with cooperative members because of
the high misappropriation of funds in Aceh through cooperatives. Therefore, in this study the prospects,
challenges and constraints of agricultural micro finance portfolio focused on GAPOKTAN level.
Efforts to empower GAPOKTAN and develop productive business through Direct Assistance Program
Disbursement Unit Agribusiness Rural Development Society (BLM-PUAP) not only provide financial
assistance but the government is also providing training for a number of GAPOKTAN as was done by
Proceedings of The 1th Almuslim International Conference on Science, Technology and Society (AICSTS) 2015
November 7-8, 2015, Bireuen, Indonesia
253
GAPOKTAN PUAP in 2012, which is already undergoing training PUAP, special GAPOKTAN carried by
Ciawi Management Training Centre, which is housed in Saree Aceh Besar district.
Until now, an estimated 20% GAPOKTAN successful in managing BLM-PUAP with final balance above
Rp 100 million (> Rp. 100 million), 50% were classified GAPOKTAN successfully manage BLM-PUAP
with the final balance ranging> Rp. 30 million to <IDR. 100 million, and 30% GAPOKTAN who do not
successfully manage BLM-PUAP or refund due to the development of moral hazard at the farm level
recipients of BLM-PUAP that the fund is a grant from the government is and does not need to be returned
and also due to crop failure and is unable to return the BLM-PUAP so that the DAA can not be used again
as a revolving fund that can be reused for GAPOKTAN empowerment and development of productive
enterprises.
The problems that arise in the body GAPOKTAN because returns are very few in comparison with the
distribution of the Fund In the first stage, it was caused by the many members of farmers who
experienced crop failure or declining crop yields. However, based on the results of a routine consultation
committee and members of farmer groups, it was decided that the time period of repayment phase II
members of the group who have not paid off stage I shall repay the remainder of the first stage which has
not paid off until the next harvest.
Another issue is the development of moral hazard in a number of beneficiary farmers BLM-PUAP that the
fund is a grant and does not need to be returned as well as financial management GAPOKTAN are not
well structured which allows the misappropriation of funds at the level of BLM-PUAP GAPOKTAN, farmer
groups and farmers recipient BLM-PUAP.
Although there are a number of problems in implementation, but the program Disbursement BLM-PUAP
very good for development and business management guidance accompanied by relevant agencies
because it can overcome the problems of access to capital at the level of farmers and farmer
organizations improve performance in order to realize food security and economic resilience of the region
of Aceh, since until now there is no any microfinance institutions in Aceh who want to give credit to the
farming activities are laden with risk of crop failure, land tenure is relatively small, modern agricultural
system transition, and security conditions are unfavorable.
References
Asian Development Bank. 1998. Microfinance: An Interim Action Plan. Asian Development Bank. Manila.
Ashari. 2009. Optimization of Agriculture Sector Program Loan Policies in Indonesia. Agricultural Policy
Analysis. Volume 7 Number March 1, 2009.
Food Security Agency. 2015. Guidelines for Strengthening Institutions Year 2015 Community Food
Distribution Food Security Agency of the Ministry of Agriculture. Jakarta.
Bank Indonesia. 2012. Indonesian Economic Report 2012. Bank Indonesia. Jakarta.
Proceedings of The 1th Almuslim International Conference on Science, Technology and Society (AICSTS) 2015
November 7-8, 2015, Bireuen, Indonesia
254
Braverman, A. and J.L. Gausch. 1989. Rural Credit in Development Countries. Working Paper Series
219. The World Bank, Washington DC.
Dahri, 2014. Economic Impact Analysis of accessibility and Credit Programs KKPE in East Java.
Colloquium Papers. Program of Agricultural Economics. Bogor Agricultural Institute. Bogor.
Dey, Malay K and Susan Falherty. 2005. Stock Exchange Liquidity, Bank Credit, and Economic Growth.
International Conference on Finance, University of Copenhagen.
Freedman and Paul L. 2004. Designing Loan Guarantees to Spur Growth in Developing Countries.
USAID Working Paper.
Hubeis, M. 2001. Introduction to Small and Medium Industries. Lecture module PS MPI SPs IPB. Bogor.
Kasmadi. 2005. Effect of Direct Aid Societies KemandirianPetani Livestock. (Case on Livestock Farmers
and Rural Villages Bungai Tambun Jaya Raya, District Basarang, Central Kapuas Kalimantan
district. [Thesis]. Bogor: [ID] Social Sciences Department of Agricultural Economics, Faculty of
Agriculture, Bogor Agricultural University.
Khadafi. 2003. Analysis Lending PUKK Pertamina UPMS I Field For Small Entrepreneurs in Nanggroe
Aceh Darussalam. Research Report. Faculty of Economics, University Malikussaleh.
Lhokseumawe.
_______. 2010. Funding Microfinance and Community Empowerment in Rural Environment PT Arun Kota
Lhokseumawe. Research Report. PT. Arun. Lhokseumawe.
Compass, 2012. Main contributors Agricultural Economic Growth Aceh. March 14, 2012.
Lubis. Effectiveness 2005. Loans Food Security and Farmer Income Analysis Users kedit (Case Study on
Sugar Cane Growers Cooperative Members Madusari, Sugar Factory Tasikmadu Karanganyar,
Solo). [Essay]. Bogor: [ID] Social Sciences Department of Agricultural Economics. Faculty of
Agriculture. Bogor Agricultural Institute.
Nurmanaf, et al. 2006. Analysis of Micro Financing System in Support of Agricultural Enterprises in Rural.
Papers Results for Fiscal Year 2006. The Centre Socio Economic and Policy. Agency for
Agricultural Research and Development. Agriculture department.
Paloma Cindy. 2013. Adverse Selection and Moral Hazard on Credit Scheme Microfinance Institutions
(MFI-A) PUAP In the city of Padang. Graduate School of Bogor Agricultural University. [Thesis
Not Posted]. Bogor.
Prihartono, M. Koko, 2009. Impact of Rural Agribusiness Development Program on Performance and
Revenue GAPOKTAN Members GAPOKTAN. [Essay]. Bogor: [ID] Department of Agribusiness.
Faculty of Economics and Management. Bogor Agricultural Institute
Rangkuti, F. 2006. SWOT Analysis: Dissecting Engineering Business Case. Gramedia Pustaka Utama.
Jakarta.
Proceedings of The 1th Almuslim International Conference on Science, Technology and Society (AICSTS) 2015
November 7-8, 2015, Bireuen, Indonesia
255
Sudaryanto, T. and M. Gratitude. 2000. Development of Alternative Financial Institutions Support with
establishment of the Rural Economy. Mimeo. Socio-Economic Research Center of Agriculture,
Agricultural Research Agency.
Gratitude, M., Sugiarto, Hendiarto and Budi Wiryono. 2003. Analysis of Agricultural Engineering
Institutional Financing. Research Report. Socio-Economic Research Center of Agriculture,
Agricultural Research Agency.
Wahid Nusron. 2011. The role of SMEs Productive Credit in Indonesian Economy: Macro and Micro
Approach. Bogor Agricultural Institute. Thesis [not published]. Bogor
Environmental Business Development Foundation, 2006 Overview of Formulation of Credit Guarantee
Fund Facility in Indonesia, an Indonesian-EU Partnership and Institutional Capacity Building on
Micro-Finance, prepared for The Commission of the European Communities
Proceedings of The 1th Almuslim International Conference on Science, Technology and Society (AICSTS) 2015
November 7-8, 2015, Bireuen, Indonesia
256
The Effect of Individual Skills, Motivation and Support
Organization to Performance Employees in Torganda Company,
Medan
Rasmulia Sembiring
Lecturer in Kopertis Region I in Methodist University of Indonesia, Medan.
Abstract
This study aims to determine the effect of individual ability, motivation and organizational
support to the performance of employees at Torganda Company, Medan. Based on the
calculations above, it is known that the sample of 31 people. Sampling technique is
probability sampling that gives equal opportunity for every member of the population to be
elected as members of the sample. The variables in this study consisted of independent
variables and the dependent variable. The independent variable is the individual ability
(X1), motivation (X2), organizational support (X3). The dependent variable is employee
performance (Y), which results in quality and quantity of work achieved an employee in
performing their duties in accordance with the responsibilities given to him. The analysis
technique used is multiple linear regression equation that is useful to know the effect of
individual abilities, level of effort and organizational support on employee performance.
The results showed that the individual ability, motivation and organizational support
simultaneous significant effect on the performance of employees. T test results showed
that individual ability, motivation and organizational support significant influence on
employee performance. Individual factors are ability to have more dominant influence on
employee performance compared with the motivation and support organization.
Keywords: Individual, motivation, organizational support and performance
Introduction
One of the most difficult aspects faced by management in all organizations today is how to make their
employees work efficiently. Organizational aspects have caused most of the industries using the
strategies used to motivate their work force. According to Ivancevich (2007) the performance of the
individual is the foundation of organizational performance. An important factor in the success of an
organization is the employee who is able and skilled and have high morale, so it can be expected a
satisfactory work. The fact is not all employees have the ability and the skills and moral of the
organization in line with expectations. An employee who has the ability to conform to the expectations of

Proceedings of The 1th Almuslim International Conference on Science, Technology and Society (AICSTS) 2015
November 7-8, 2015, Bireuen, Indonesia
257
the organization, sometimes do not have a high moral so that performance is not as expected.
(Sumarsono, 2004). In addition to increased capacity, the company take steps to motivate the employees.
Some steps motivation conducted among others by inviting an expert motivator, awarded in the form of
material / financial, opportunity to participate in the promotion process to employees who are considered
to have the best performance. With the availability of qualified human resources is expected to address
the problems facing both internal and external problems. This can be done by improving employee
performance through enhanced capabilities, motivation and organizational support. Individuals become
the motor running of the organization, the achievement of organizational goals one of which is highly
dependent on both the poor performance of employees. Ability, Motivating and organizational support is
urgently needed to improve the performance of the employees themselves. Performance (P) is the result
of ability / ability (A) multiplied by motivation / motivation (M) multiplied by support / support (S), P = A x M
x S. Then Mathis and Jackson explained also that the performance will be reduced if one one factor is
reduced or absent. Ability is a natural ability that involves the talents and interests are appropriate for a
given job. Motivation is a boost in self-esteem related to the level, direction and persistence-consistency
of the work done in the working person. Support organization is the support received from the
organization in the form of training, equipment, expectations and productive work team (Mathis and
Jackson, 2001).
Performance is an overview of the level of achievement of the implementation of a program of activities or
policies in realizing the goals, objectives, vision and mission of the organization that poured through the
strategic planning of an organization. Performance can be identified and measured if individual or group
of employees have had success criteria or benchmark standards set by the organization (Moeheriono,
2010) Torganda Company field in improving the performance of employees faced with obstacles that
arise, namely:
1. The low understanding of the duties of employees in support of the implementation of tasks.
Where to support the implementation of existing tasks each employee should always have a good
ability against what has become tupoksinya.
2. The low ability of employees seen with the placement of employees who are not in accordance
with the education, skills and expertise.
3. The existence of the gap workload on each employee, causing jealousy among employees.
4. The division of work that does not match the capabilities of each employee lead to less than
optimal performance of employees. Based on these descriptions writer interested in conducting
research with the title: "The influence of individual ability, motivation and organizational support to
the performance of employees at Torganda Company, Medan ".
This study aims to determine the effect of individual ability, motivation and organizational support to the
performance of employees at Torganda Company, Medan.

Proceedings of The 1th Almuslim International Conference on Science, Technology and Society (AICSTS) 2015
November 7-8, 2015, Bireuen, Indonesia
258
Reseacrh Methods
The study population in this study were all employees at Torganda Company field as many as 100
people. Determination of the number of samples needed if population numbers is Slovin formula
(Sunyoto, 2013), namely:
n = )²e(N1
N
Where:
N = sample size
N = Many populations
e = Percentage of error can be tolerated. In this study, the percentage of errors that can be tolerated or
desirable by 15%, then the amount of sample is:
n = )²e(N1
N
n = )²15,0(1001
100
= 30.76 31
Based on the above calculation, it is known that the sample of 31 people. Sampling technique is
probability sampling, sampling technique that gives equal opportunity for every member of the population
to be elected as members of the sample.
The variables in this study consisted of independent variables and the dependent variable. The
independent variable is the individual ability (X1), motivation (X2), organizational support (X3). The
dependent variable is employee performance (Y), which results in quality and quantity of work achieved
an employee in performing their duties in accordance with the responsibilities given to him.
The analysis technique used is multiple linear regression equation that is useful to know the effect of
individual abilities, level of effort and organizational support on employee performance (Sugiyono, 2010),
using the formula:
Y = b0 + b1x1 + b2X2 + b3X3 + ei
Description:
Y = the performance of employees
X1 = the ability of individual
X2 = motivation
X3 = organizational support
b1 b2 b3 = coefficient independent variable
b0 = intercept (constant)
ei = the estimated error rate.
Proceedings of The 1th Almuslim International Conference on Science, Technology and Society (AICSTS) 2015
November 7-8, 2015, Bireuen, Indonesia
259
Theoretical Description
Individual Abilities
The ability of the individual is a person's capacity to perform various tasks in a job. According to Spencer
in Moeheriono (2010), the ability or competence is the underlying characteristics of a person related to
the effectiveness of the performance of the individual in his work or the basic characteristics of individuals
who have a casual relationship or a causal criteria referenced, effective or performing excellent or
superior place work in certain situations.
Mathis and Jackson (2006), explains that the ability of the individual is a natural ability that involves the
talents and interests are appropriate for a given job. According to Ivancevich et al (2007) the ability of the
individual is a person of talent to perform mental or physical tasks. From the definition can be concluded
that the ability is an individual's capacity to perform various tasks in a job that has the knowledge, ability
and interpersonal skills as well as technical skills and energy to generate performance.
Where the individual's ability in fact composed of two sets of factors: intellectual ability and capability in
the management of operational functions of the individual working ability is a function of understanding
and development, because of the employee's function is very important to note. Arfida BR (2003: 37)
states the individual skills of each employee affected by level of education, training, motivation, work
ethic, mental and physical capabilities of the employees concerned.
Motivation
Motivation is very important for the level of performance of a company. Without the motivation of
employees to work for the benefit of the company will not be achieved. Conversely, if there is a high
motivation of employees, this is a guarantee for the company's success in achieving its objectives,
(Sutrisno, 2011).
Motivation is formed of an attitude (attitude) of employees in the face of work in the company's situation
(situation). Motivation is a condition or energy that drives the employee-directed pro and positive impact
on the employment situation that strengthen motivation to work to achieve maximum performance, the
mental attitude of the employees should have an attitude ready in psikofis (prepared mentally, physically,
situation and goals). That is, employees in the work are mentally prepared, physically healthy, understand
the situation and conditions and strive to achieve employment targets (the main purpose of the
organization) (Mangkunagara, 2005).
As'ad (2000) imposes limits on motivation as the process by which behavior is energized and directed.
Understanding motivation as proposed by Wexl & Yukl is granting or they can be interpreted as a motive
or circumstances. So motivation is something that raises the spirit or boost employment. Motivation is
powering the motion of a person who created excitement to get them to cooperate, to work effectively,
and integrated with all its resources to achieve satisfaction. On such knowledge by not doing so,
managers will miss a lot of opportunities to help motivate employees in a way that positif.

Proceedings of The 1th Almuslim International Conference on Science, Technology and Society (AICSTS) 2015
November 7-8, 2015, Bireuen, Indonesia
260
Simply put, (Ivancevich, Konopaske, and Matteson 2006) argues that the motivation is that the manager
is actively involved. If the motivation is driven, maintained, and directed, managers must know about the
needs, intense, preferences, goals and comparisons, and they should act. So, motivation is a condition or
energy that drives self-directed or directed employees to achieve organizational goals of the company.
Support Organizations
That support is the organization that feel proud of their work, which compensate fairly and follow the job
requirements. Support organization is a basic relationship between the employee and the organization,
the relationship between superiors and subordinates. Rhoades and Eisenberger (2002: 64) argues that
the psychological support that the perception in the organization of high-level employees bring three
things, namely:
a). Based on the law of reciprocity, creating a feeling of obligation to care for the safety of the
organization and help the organization to achieve its objectives.
b). Awareness, recognition, and respect for their organization will meet the social and emotional
needs of employees, so that they are proud to be members of an organization and incorporate
organized status of their role as their social identity
c). Reinforce the belief that the organization's employees recognize and appreciate the improved
performance, in other words, the better the performance of employees the greater the rewards
given organization.
These three things mentioned above brings the advantage that states that perceived organizational
support high levels would create an obligation for individuals to provide reciprocal (Blau, 2002; Gouldner,
2000). Setton et al, (2002) for employees (eg: increase job satisfaction and work motivation positive) and
the organization (for example: improving the effective commitment and performance of employees and
reduce turnover).
According to Robbins (2001) that support the organization is that organizations are facing a dynamic and
changing environment in order to adapt the organization. According to Flippo (2002: 97) that the support
organization is a relief from the application of technology, humans perform the functions or tasks that lead
to the achievement of specified targets rationally. Explaining social organization and technology is a
device that consists of human factors and physical. According to Mathis and Jackson (2006: 84) that the
support organization is the support received from the organization in the form of training, equipment,
expectations and productive work team. From the above understanding can be concluded that the
support organization is how companies and organizations appreciate the employee contributions to the
progress of the company (valuation of employees 'contribution) or the organization and the company's
attention to their life (care about the employees' well-being). Some support organizations that affect
performance, among others:

Proceedings of The 1th Almuslim International Conference on Science, Technology and Society (AICSTS) 2015
November 7-8, 2015, Bireuen, Indonesia
261
a. Training is a process where people get the capabilities to help achieve the organization's goals.
In a limited sense, the training gives employees the knowledge and skills that are specific and
can be identified for use in their current jobs.
b. Labor standards define the expected level of performance and the comparison of performance or
destination. The performance standards are realistic, measurable, clearly understood will benefit
both the organization and its employees.
c. Equipment and technology are tools / equipment provided by the company to support the work
process. To get good performance from employees, then a company must have the tools and
technologies that support these employees have worked hard.
Performance
Performance by Big Indonesian Dictionary (2008) is something that is achieved or achievements shown.
According Rival (2005), performance was essentially a feat achieved by a person in performing their
duties or work in accordance with the standards and criteria set by the job. According to Wirawan (2009)
Performance is the abbreviation of kinetic energy working counterpart in English is a performance, so
performance is the output generated by the functions or indicators of a job or a profession within a certain
time. Lawler and Porter in Sutrisno (2011) states that the role job performance is succesful achievement
obtained by a person of his actions. The extent of a person's level of success in carrying out his job duties
is called the level of performance.
Individual performance related to work one's behavior. Gibson (2003) agreed with Kurt Lewin stating a
worker's behavior is a function of the interaction of individual variables and environment variables. Worker
behavior will produce positive long-term performance and increase the ability of personnel, or vice versa,
causing a negative long-term performance as well as a decrease in the ability of personnel.
Ndraha (2003) says that behavior is the operationalization and actualization attitude of a person or a
group or against a situation and environmental conditions both in the community, nature, technology and
organization. If the environment in question is an organization, it is the behavior that occurs organizational
behavior (organizational behavior), the behavior that is based on awareness of their rights and
obligations, freedom or authority and responsibility, both individuals and groups in society.
Hasibuan (2008) suggests performance (performance) is a result of work achieved in executing the tasks
assigned to him based on skills, experience and seriousness as well as time. The level of employee
performance is closely related to the award system applied by the institution / organization they work for.
Awarding handling can affect the performance improvement of a person.
According to Gibson (2003), individual factors that affect performance include physical ability, mental
ability (intelligence) and skills, demographic factors (eg age, gender, race, ethnicity and culture) as well
as variable-psychological variables (perception, attribution, attitude and personality). Work environment
variables (job design, regulation and policy, leadership, resources, rewards and sanctions) and the non-

Proceedings of The 1th Almuslim International Conference on Science, Technology and Society (AICSTS) 2015
November 7-8, 2015, Bireuen, Indonesia
262
work (family, economic conditions and hobbies) also affects the behavior of work that eventually form the
individual's performance.
Results and Discussion
Hypothesis testing
Analysis of the data in this study using multiple linear regression analysis using SPSS 19.0 for windows..
Analysis of each variable is explained in the following description:
Table 1. Results of Multiple Linear Regression
From the table above can be formulated a regression equation for the employee's performance as
follows:
Y = -4.181 + 0.334 X1 + 0.662 X2 + 0.320 X3
Description:
Y = employee performance
X1 = Capability individual
X2 = Motivation
X3 = Support Organization Based on the results of multiple regression equation suggests that:
a. Coefficient X1 (individual abilities) of 0.334 which indicates a positive correlation, meaning that if
the individual kemampan increased by 1 unit, the performance of employees rose by 0.334 units.
b. Coefficient X2 (motivation) of 0.662 which indicates a positive correlation, meaning that if the
motivation was increased by 1 unit, the performance of employees rose by 0.662 units.
c. Coefficient X3 (support organization) of 0.320 which indicates a positive correlation, meaning that
if support organizations increased by 1 unit, the performance of employees rose by 0.320 units.
d. Individual ability (X1) has a greater influence than the motivation variable (X2) and support
organizations (X3). This means that individual ability is crucial in employee performance. This is
indicated by standardized beta value of the variable individual ability (X1)> motivation (X2)>
support organization (X3), which amounted to 0.419> 0.389> 0.277.
a) Significance test (test F)
F test conducted to examine the effect individual ability, motivation and organizational support
simultaneously on employee performance. The F test results are shown in Table 2.
Proceedings of The 1th Almuslim International Conference on Science, Technology and Society (AICSTS) 2015
November 7-8, 2015, Bireuen, Indonesia
263
Table 2. Test F
Procedures and criteria for acceptance and rejection of the hypothesis determined as follows:
As the basis for accepting or rejecting a hypothesis, testing the causal relationship using t-test.
Hypothesis testing the influence of independent variables on the dependent variable by comparing the
value of t count with a value of t-table at significant level of 0.05 or 5% on the degrees of freedom (nk) the
obtained t-table = 1.697. T test results of variable individual ability, motivation and organizational support
on employee performance can be seen in Table 3.
Table 3. Test t
From the table above, to determine the effect of individual variables on the performance of employees'
capabilities is done by comparing the t-count of 3.634 and 1.697 t-table, which means t count> t-table, so
that it can be concluded that the variables affect individual abilities significantly to the performance of the
employee.
To test the effect of motivation on employee performance variables by comparing the t-count of 3.386 and
1.697 t-table, which means t count> t-table, so that it can be concluded that the motivation variables
significantly influence employee performance.
To test the effect of variable organizational support on employee performance is done by comparing the t-
count of 2.319 and 1.697 t-table, which means t count> t-table, so it can be concluded that the variable
organizational support significant influence on employee performance.
Based on this it can be concluded that the partial factor of individual ability, motivation and organizational
support has positive and significant impact on the performance of employees of Torganda Company,
Medan, thus the hypothesis is accepted.
b) The coefficient of determination (R ²)

Proceedings of The 1th Almuslim International Conference on Science, Technology and Society (AICSTS) 2015
November 7-8, 2015, Bireuen, Indonesia
264
Value is used in view of the coefficient of determination in this study is the adjusted R-square column.
That is because the value of adjusted R-square is not susceptible to the addition of independent
variables. The coefficient of determination can be seen in Table 4.
Table 4. Value Coefficient of Determination
From Table 4 it can be seen that the adjusted R-square value of 0.728 or 72.80% is the percentage of the
effect of individual ability (X1), motivation (X2) and support organizations (X3) on employee performance
(Y) is equal to 72.80%. While the rest of 27.20% (100% - 72.80%) is influenced by other variables outside
the model of this study.
The ability of individuals to influence Employee Performance
Statistical tests showed that the ability of individuals have significant influence on employee performance.
This suggests that the ability of individual employees affect employee performance. According to Gibson
(2003), individual factors that affect performance include physical ability, mental ability (intelligence) and
skills, demographic factors (eg age, gender, race, ethnicity and culture) as well as variable-psychological
variables (perception, attribution, attitude and personality). Work environment variables (job design,
regulation and policy, leadership, resources, rewards and sanctions) and the non-work (family, economic
conditions and hobbies) also affects the behavior of work that eventually form the individual's
performance. This is supported by Robbins, S.P. and Judge, (2009) baha ability is influenced by
kecedasan intellectual (cognitive intelligence, social, emotional, cultural) and physical abilities mean when
employees have high intellectual and supported by the physical condition in accordance with the needs of
the job then the employee will be more easily perform his duties so that it will easily achieve the expected
performance. From the above definition if the ability of employees is increasing the performance of
employees will increase.
One of the most difficult aspects faced by management in all organizations today is how to make their
employees work efficiently. A company can be successful, then its members must be willing and able to
do their work according to their ability. According to Gana (2011) that the employee's performance is
determined by ability and motivation of employees. This is important because in the levels of a certain
level, the lack of ability can not be compensated with high motivation and conversely the lack of
motivation can not be compensated with higher capabilities. Both are important components of an
Proceedings of The 1th Almuslim International Conference on Science, Technology and Society (AICSTS) 2015
November 7-8, 2015, Bireuen, Indonesia
265
effective performance in organizations. Employee performance is the foundation of organizational
performance.
The higher the performance of employees will improve the performance of the organization / company as
a whole. According Ivancevich M.John (2007: 85) that an important factor in the success of an
organization is the employee who is able and skilled and have high morale, so it can be expected a
satisfactory work. The fact that not all employees have the ability and the skills and moral of the
organization in line with expectations. An employee who has the ability to conform to the expectations of
the organization, sometimes do not have a high moral so that performance is not as expected.
Effect of Motivation on Employee Performance
Statistical tests showed that motivation significantly influence employee performance. This suggests that
the motivation may affect employee performance. This is in line with the opinion of Vroom (in
Mangkunegara, 2006: 51) that the motivation is to build a major factor of performance, for the application
of the wage / salary associated with the performance of the individual will be able to further increase
motivation, as well as fill factor of the opportunity to improve performance.
Influence of Organizational Support the Employee Performance
Statistical tests showed that support organizations have a significant effect on employee performance.
This indicates that the support organization can affect employee performance. Employees are committed
to do the work according to that stipulated in the employment contract and believe that will be met with
the organization's commitment to them by providing support as the fulfillment of the obligations of such
exchanges. In other words, the provision of organizational support is a response that is comparable and it
should be given to the employee organization that has been doing the job as specified. The results are
consistent with research Kuncoro (2009) which states that affect the performance of business support. If
the organizational support enhanced the performance of employees will also increase.
Conclusion
1. The results showed that individual ability, motivation and organizational support simultaneous
significant effect on the performance of employees.
2. T test results showed that individual ability, motivation and organizational support significant
influence on employee performance.
3. Factors individual's ability to have more dominant influence on employee performance compared
with the motivation and support organization.
References
As’ad, M. 2005. Psikologi Islami: Seri Sumber Daya Manusia. Liberty. Yogyakarta.
Chen, Yuen, Li, 2001, “Examining The Effect of Organizational Culture and Leadership behaviorsmen
Organizational Commitment, Job Satisfaction, and Job Performance at Small and Middle Sized
Firms of Taiwan”, The Journal of American Academy of Bussiness, September.
Proceedings of The 1th Almuslim International Conference on Science, Technology and Society (AICSTS) 2015
November 7-8, 2015, Bireuen, Indonesia
266
Flippo, 2002. Faktor-faktor Manusia dan Fisik Organisasi Sumberdaya Manusia Edisi Cetakan Kelima.
Jakarta : Bumi Aksara.
Gana, Ali Baba. 2011. The Effect of Motivation on Workers Perfromance (A case Study of Maiduguriflour
Mill Ltd. Borno State, Nigeria). Continental J. Social Sciences, Willolud Journal 4 (2), ISSN: 2141-
4265, p. 8-13.
Gibson James L. 2006. Organization Behavior, Structure, Processes. 12th Edition. Mc Graw-Hill.
NewYork.
Gibson, 2003. Perilaku organisasi. Jakarta: Rineka Cipta.
Handoko, H. 2011. Manajemen Personalia dan Sumber Daya Manusia, Cetakan ke-10. Yogyakarta:
BPFE.
Hasibuan, H. Malayu, S.P. 2008. Manajemen Sumber Daya Manusia, Edisi Keenam, Jakarta: Haji Mas
Agung.
Ivancevich M, John dkk., 2007. Perilaku dan Manajemen Organisasi, Jilid 1, Edisi Ketujuh, Jakarta:
Erlangga.
Kuncoro, A,K dan Acin, Efendi, 2009. Pengaruh Effort, Support dan Ability Terhadap Kinerja Karyawan,
Jurnal Manajemen: ISEI Cabang Jakarta Komisariat Universitas Bina Nusantara Volume 1 nomor
1 – 2009.
Mangkunegara, Anwar Prabu, 2005. Evaluasi Kinerja SDM, Cetakan Pertama. Bandung: PT. Refika
Aditama.
Mathis, Robert L dan John H Jackson, 2006, Human Resource Management, terjemahan, Edisi
Kesepuluh. Jakarta: Salemba Empat.
Mathis, Robert L dan John H Jackson. 2006. Manajemen Sumber Daya Manusia, Buku 2, Alih Bahasa:
Sadeli dan Prawira Hie. Jakarta: Salemba Empat.
Moehyi, Achmad dkk., 2005. Manajemen Sumber Daya Manusia, Edisi Pertama. Yogyakarta: UPFE-
UMY.
Nalbandion dan Klingner, 2002. Hubungan Antara Motivasi dan Kemampuan. Cetakan Pertama.
Yogyakarta: Caps Graha Ilmu.
Ndraha, T. 2003. Budaya Organisasi. Rieka Cipta. Jakarta.
Pusat Bahasa. 2008. Kamus Besar Bahasa Indonesia. Gramedia Pustaka Utama. Jakarta.
Robbin, P, Stephen dan Timothy A Judge , 2009, Perilaku Organisasi, Jilid I dan II Terjemahan, Edisi 12.
Jakarta: Penerbit Salemba Empat.
Robbin, P, Stephen, 2006. Perilaku Organisasi, Konsep, Kontroversi, Aplikasi, Jilid I dan II, Edisi
Kedelapan. Jakarta: Prenhallindo.
Santono, Singgih dan Fandy Tjiptono, 2001. Riset Pemasaran: Konsep dan Aplikasi dengan SPSS, Edisi
Pertama. Jakarta: Alex Media Komputindo.
Schuler dan John H Jackson. 2010. Manajemen Sumberdaya Manusia Menghadapi abad ke-21. Alih
Bahasa: Abdul Rosyit. Jakarta: Erlanga.
Proceedings of The 1th Almuslim International Conference on Science, Technology and Society (AICSTS) 2015
November 7-8, 2015, Bireuen, Indonesia
267
Sinuhaji, Effendi. 2011. Analisis Pengaruh Kepribadian, Kemampuan Kerja dan Motivasi Kerja terhadap
kinerja SDM Outsourcing pada PT. Catur Karya Sentosa Medan. Tesis. Medan : Universitas
Sumatera Utara.
Sugiyono, 2010. Metode Penelitian Bisnis, Cetakan Keenem. Bandung:Alfabeta.
Sumarsono, Sonny. 2004. Metode Riset Sumber Daya Manusia. Yogyakarta: Graha Ilmu.
Sunyoto, Danang. 2013. Metode dan Instrumen Penelitian ekonomi dan Bisnis. Cetakan Pertama.
Yogyakarta: Caps.
Sutrisno, Edy. 2011. Manajemen Sumber Daya manusia. Kencana Prenada Media Group. Jakarta.
Wahjono, Sentot Iman. 2010. Perilaku Organisasi. Cetakan Pertama. Edisi Pertma. Yogyakarta: Graha
Ilmu.
Wahyudi, dan Rivai 2002. Manajemen Sumber Daya Manusia. Jakarta: PT. Gramedia Widiasarana
Indonesia.
Wirawan. 2009. Evaluasi Kinerja Sumber Daya Manusia. Salemba Empat. Jakarta.
Yossa, S. 2013. Analisis Pengaruh Kemampuan Karyawan,Pembagian Tugas, dan Motivasi terhadap
Kinerja Karyawan pada PT. Pelabuhan Indonesia II (Persero) Cabang Palembang. Jurnal
Manajemen dan Bisnis Sriwijaya Vol.11 No.4 Desember 2013.Yogyakarta.

Proceedings of The 1th Almuslim International Conference on Science, Technology and Society (AICSTS) 2015
November 7-8, 2015, Bireuen, Indonesia
268
Implications Local Revenue against Public Welfare Improvement
in Bireuen
Sonny Muhammad Ikhsan Mangkuwinata
Lecturer at the Faculty of Economics, University Almuslim
Abstract
The purpose of this study was to explain the implications How Local Revenue against
Public Welfare Improvement in Bireuen. Subject in this study is revenue Bireuen
documentation obtained from the Department of Finance and Wealth Management Area.
While the object of this research is the level of public welfare as measured by per capita
income from the distribution of Gross Regional Domestic Product (GDP) by the total
population and life expectancy obtained from the documentation of the Central Statistics
Agency Bireuen of 2009 -2013. The result showed that from 2009 to 2013 the number of
residents in Bireuen always increase and require an increase in financial resources of the
region, notably from local revenue to be able to carry out the distribution of development
in order to improve the quality of life and well-being of society in the era of autonomy
area. In 2013 the increase in revenue in Bireuen negative implications towards improving
the welfare of the community, where revenue has increased by 57.79%, but led to a
decline in life expectancy of 0.06%.
Keywords: Local Revenue, Public Welfare
Introduction
Appearances the reform in Indonesia provides an opportunity for a paradigm shift from the paradigm of
national development paradigm of growth towards equitable development and create increased prosperity
for society as a more fair and balanced. This paradigm shift among others realized through regional
autonomy and financial balance between the center and regions dia¬tur in a package of legislation,
namely Law No. 23 of 1999 jungto Act 32 of 2004 jungto Act No. 23 of 2014 About government
responsibility area that describes the political and administrative responsibilities as well as the Local
Government Act No. 33 of 2004 about Financial Balance of the Central Government and Local
Government which provides a legal basis about fiscal decentralization, and explain the financial
management between central and local government.

Proceedings of The 1th Almuslim International Conference on Science, Technology and Society (AICSTS) 2015
November 7-8, 2015, Bireuen, Indonesia
269
As an autonomous region, the area required to be able to develop and optimize all the potential areas
excavated from the area of the region concerned which is composed of the results of local taxes, the
result of levies, wealth management are separated and other local revenues legitimate a source of
revenue, then in terms of the government also has an obligation for improve the welfare of the people and
preserve and maintain public peace and order.
In accordance with the principle of local autonomy is real, dynamic and responsible, implementation of
central and local governments will gradually be more and more delegated to the regions. By increasing
the authority vested in local, regional financial role is very important because the area required to be more
active in mobilizing resources in addition to its own funds to manage funds received from the central
government efficiently, it also needs to be done by the government Bireuen.
Role of Local Revenue for an autonomous region like Bireuen become very important as a source of
government funding can be used as a benchmark in the implementation of regional autonomy. That is
because the higher the degree of financial independence in Bireuen, it shows that the government
Bireuen increasingly able to finance its spending without having to wait entirely on financial aid from the
central government. When combined with the degree of fiscal decentralization that is used to see the
contribution of revenue to regional revenue as a whole, it will show the financial performance of an area
as a whole, both in order to carry out development in various fields as well as in the welfare of the
community. In an effort to create regional autonomy, local revenue becomes a very important factor
because constitute sources of funds from the region itself.
Regional autonomy policy to bring fundamental change to increase revenue. With regional autonomy,
each area is always a race for innovation for the creation of autonomous regions. Efforts to comply with
the welfare of society is one of the responsibilities of government Bireuen in governing autonomous and
an overview of the government's success in implementing regional development. Therefore, the
development in the field of welfare should be developed and harmonized with economic development.
Improvement of social welfare in Bireuen can be seen from the improvement of the quality and the ability
to fulfill the necessities of life, it can be manifested by an increase in per capita income community.
Improving the welfare of the community is proof of the success of the development which is one of the
tasks of government. Revenues showed an average per capita income levels in the region. So in this
case, revenue is a part of the circle of the economy related to per capita income, government spending
and regional economic activity also plays a role in improving the welfare.
In carrying out public services and increased prosperity for the people of Bireuen government is
inseparable from the success of managing finances. Policies on regional financial management pursued
by the government have direction Bireuen to finance regional development aimed at the welfare of the
community in accordance with the principle of local autonomy.

Proceedings of The 1th Almuslim International Conference on Science, Technology and Society (AICSTS) 2015
November 7-8, 2015, Bireuen, Indonesia
270
Framework Theory
Definition of Local Revenue
Understanding Local Revenue According to Article 1 of Law No. 33 of 2004 on Financial Balance
between Central and Local Government Regional revenue earned is levied based on Local Regulation in
accordance with the legislation. Furthermore, the Act No. 28 of 2009 on Local Taxes and Levies
mentioned that understanding local revenue that regional financial sources excavated from the area
concerned region consisting of the results of local taxes, the result of retribution, the results of the wealth
management area that is separated and other local revenue legitimate. Meanwhile, according to
Nurcholish (2007), the local revenue is revenue obtainable area of local tax revenue, levies, local
corporate profits, and others are legitimate.
Based on some of the above opinion, the authors conclude that the Local Revenue is income earned
through the efforts made by local governments to improve local cash right - really come from the region
itself for the creation of autonomous regions.
Definition of Welfare
Welfare of the community, including as a process or a concerted effort undertaken by individuals, social
institutions, communities and government agencies to improve the quality of life through the provision of
social services and social benefits. Signifies a state of public welfare in general, which includes a state of
physical, spiritual, and social and not only the improvement and eradication of certain social evils.
According to Wijaya (2006) the welfare of a series of activities organized were shown to improve quality
of life or improving people's lives in line with the standards and norms of society as a goal is a dream,
guidelines and aspirations in order to fulfill the needs of the material, social and spiritual.
Meanwhile, According to Syahrir (2007) sense of well-being in the concept of the modern world is a
condition where one can meet the basic needs, be it the need for food, clothing, shelter, clean drinking
water and opportunities for continuing education and has an adequate job that can support the quality of
life so that it has a social status that leads to the same social status against other fellow citizens.
Public welfare is improving the quality of well-being of individuals, groups and communities who have the
dignity, where everyone is able to take the role and perform its functions in life. Basically all humans,
families, communities and societies have social needs that must be met in order that they can achieve
what is meant by social happiness. The requirement refers to the biological needs, education, decent
health and harmonious social interaction.
Social welfare can include all forms of social interventions that have a major concern and immediately on
improving the welfare of individuals and society as a whole. Social welfare include the provision of aid
and processes that directly pertain to the healing and prevention of social problems, human resource
development, and improvement of quality of life that includes social services for individuals and families
also attempts to strengthen or improve social institutions.

Proceedings of The 1th Almuslim International Conference on Science, Technology and Society (AICSTS) 2015
November 7-8, 2015, Bireuen, Indonesia
271
Indicators of Social Welfare
Indications of increased prosperity as a measure of success can be seen from the quality of the Human
Development Index (HDI) or Human Development Index (HDI), covering life expectancy, literacy rates,
average length of school and the average real spending per capita. According to Rahadian (2008) Human
Development Index (HDI) of the average of a country can be measured by the basic dimensions of
human development is as follows:
1. Live a healthy and long life as measured by life expectancy at birth.
2. Knowledge measured by the level of adult literacy and combined primary, and secondary.
3. Adequate standard of living measured by the natural logarithm of the gross domestic product per
capita in purchasing power paritasi.
In general, the public welfare is often interpreted as a prosperous state, a condition the fulfillment of any
form of necessities of life, especially fundamental as food, clothing, housing, education and health
perwatan. The sense of well-being also refers to all activities of the organization and distribution of social
services to communities, especially disadvantaged groups (disadvantage groups). The implementation of
various schemes of social protection (social protection) both formal and informal are examples of social
welfare activities.
To improve people's welfare, development also seeks to foster the aspirations and demands of society to
realize a better life. Development can not only be seen from the aspect of growth alone. One result of
development which only applies the paradigm of economic growth is the emergence of the gap between
rich and poor, and unemployment continues to rise. Growth has always been associated with increased
national revenue.
Research Methods
This research was conducted with qualitative. According Arikunto (200) study is a qualitative descriptive
study, which in obtaining and interpreting the data is done with the aim to create a picture of a situation
objectively. In carrying out this study, the authors conducted a study on the implications of local revenue
in Bireuen against Welfare Improvement Peoples.
Results and Discussion
Revenue Revenue in Bireuen
As an autonomous region, governments are required to Bireuen develop and optimize all the potential
areas excavated from within the region consisting of the results of local taxes, levies, wealth management
separated areas and other areas of legitimate revenues that can be used as a source of revenue.
Through this policy, the government has the obligation Bireuen un¬tuk improve the welfare of society as
well as preserve and maintain public peace and order.

Proceedings of The 1th Almuslim International Conference on Science, Technology and Society (AICSTS) 2015
November 7-8, 2015, Bireuen, Indonesia
272
By increasing the authority of local autonomy in Bireuen, the role of regional finances are very important,
because the regions are required to be more active in mobilizing resources from the results of the original
wealth of the region in addition to managing the funds received from the central government efficiently. To
that end, the government Bireuen should be able to explore the potential of local finance in order to
increase acceptance of local revenue so that regional development and improving standards of public
welfare is still running, but it does not mean that the government Bireuen have to finance the needs of
local revenue. The acceptance of Revenue Bireuen can be seen in the following table:
Table 1. Local Revenue Bireuen Year 2009-2013
Years Regional Revenue Realization year (Rp) Change (%)
2009 37.097.000.000 -
2010 35.000.000.000 -5,65
2011 60.535.081.153 72,96
2012 73.276.843.890 21,05
2013 115.622.741.577 57,79
Source: Central Bureau of Statistics Bireuen 2014
Based on table 1 above can be explained that over the last five years, the realization of revenue revenue
show an unstable value in the statement of budget realization and government spending Bireuen. In
2010, the realization of revenue realization Revenue Bireuen decreased by 5.65% due to the low
contribution of local taxes and levies to the reception revenue. With the intensification of government
policy in the types of local taxes and levies, then in 2011 the condition of local revenue in Bireuen
increased by 72.96%. In 2012 and in 2013 the realization of revenue revenue in the statement of budget
realization and government spending Bireuen still figures show an increase, although the increase is not
as optimal as the government expected.
Development of Population in Bireuen
Increasing the number of residents in Bireuen always increasing every year, so that by itself requires
additional local revenue each year. Population growth also requires a growth in employment or source of
income in order to overcome the problem of unemployment and poverty that cause interference with
macro-economic indicators of a region and a decline in social welfare.
Population growth in Bireuen are not aligned with the addition of employment will lead to imbalance in the
distribution of income that would create a state population growth with an increase in unemployment and
a decline in the level of welfare. Population growth is also a problem that will impact the equity gap
welfare, if the population growth is not followed by economic growth equivalent. Population growth is
affected by the increasing number of marriages and migration factors. The population growth in Bireuen
can be seen in the following table:

Proceedings of The 1th Almuslim International Conference on Science, Technology and Society (AICSTS) 2015
November 7-8, 2015, Bireuen, Indonesia
273
Table 2. Population Developments In Bireuen Year 2009-2011
Year Population (People) Change (%)
2009 382.277 -
2010 389.288 1,83
2011 398.201 2,29
2012 406.083 1,98
2013 413.817 1,90
Source: Central Bureau of Statistics Bireuen 2014
Based on table 2 above can be expained that from 2009 to 2013 the number of populations in Bireuen
always increased. This is due to high birth rates and increasing life expectancy society. In this case, the
government should strive to increase the financial resources of the region, especially from Local Revenue
to be able to carry out the distribution of development in order to improve the quality of life and well-being
of society in the era of regional autonomy.
Development Community per Capita Income In Bireuen
One of the indicators that can be used to measure the level of prosperity of the community in Bireuen is
per capita income per capita income is a picture and the average income received by each resident for
one year in an area. Per capita income of the people is obtained from the quotient of the Gross Domestic
Product (GDP) by the total population at mid year.
The higher the per capita income of people in Bireuen, it means the better the welfare of the community,
and vice versa. Per capita income could also be interpreted as the sum of the value of goods and
services the average available to every resident of an area in a given period. The per capita income
growth in Bireuen society can be seen in the following table:
Table 3. Community Per Capita Income In Bireuen Year 2009-2013
Year Income Per Capita ( (Rp) Change (%)
2009 1.369.920,00 -
2010 1.487.086,00 8,55
2011 1.622.912,00 9,13
2012 1.774.616,00 9,35
2013 1.929.850,00 8,75
Source: Central Bureau of Statistics Bireuen 2014
Based on table 3 above can be explained that from 2009 to 2013 per capita income of people in Bireuen
always increase. It is caused by the presence of pemerntah expenditure in implementing economic
development in the various sectors which leads to enhancing regional gross domestic product (GDP).
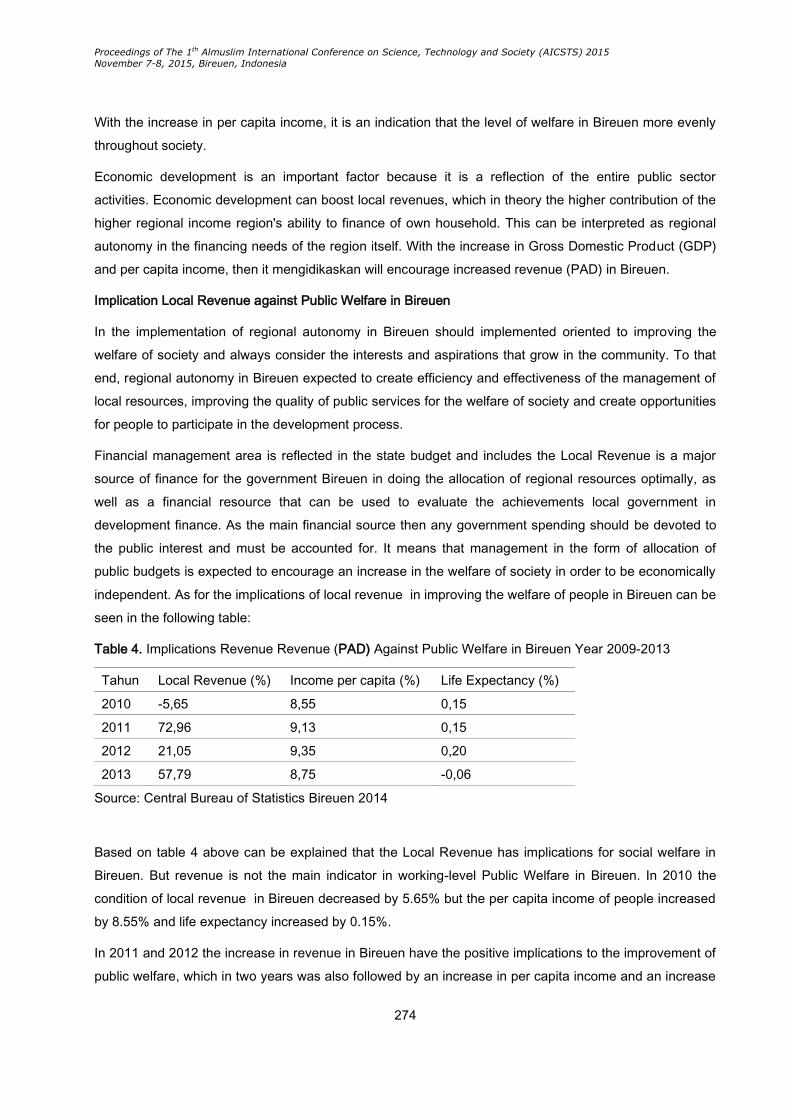
Proceedings of The 1th Almuslim International Conference on Science, Technology and Society (AICSTS) 2015
November 7-8, 2015, Bireuen, Indonesia
274
With the increase in per capita income, it is an indication that the level of welfare in Bireuen more evenly
throughout society.
Economic development is an important factor because it is a reflection of the entire public sector
activities. Economic development can boost local revenues, which in theory the higher contribution of the
higher regional income region's ability to finance of own household. This can be interpreted as regional
autonomy in the financing needs of the region itself. With the increase in Gross Domestic Product (GDP)
and per capita income, then it mengidikaskan will encourage increased revenue (PAD) in Bireuen.
Implication Local Revenue against Public Welfare in Bireuen
In the implementation of regional autonomy in Bireuen should implemented oriented to improving the
welfare of society and always consider the interests and aspirations that grow in the community. To that
end, regional autonomy in Bireuen expected to create efficiency and effectiveness of the management of
local resources, improving the quality of public services for the welfare of society and create opportunities
for people to participate in the development process.
Financial management area is reflected in the state budget and includes the Local Revenue is a major
source of finance for the government Bireuen in doing the allocation of regional resources optimally, as
well as a financial resource that can be used to evaluate the achievements local government in
development finance. As the main financial source then any government spending should be devoted to
the public interest and must be accounted for. It means that management in the form of allocation of
public budgets is expected to encourage an increase in the welfare of society in order to be economically
independent. As for the implications of local revenue in improving the welfare of people in Bireuen can be
seen in the following table:
Table 4. Implications Revenue Revenue (PAD) Against Public Welfare in Bireuen Year 2009-2013
Tahun Local Revenue (%) Income per capita (%) Life Expectancy (%)
2010 -5,65 8,55 0,15
2011 72,96 9,13 0,15
2012 21,05 9,35 0,20
2013 57,79 8,75 -0,06
Source: Central Bureau of Statistics Bireuen 2014
Based on table 4 above can be explained that the Local Revenue has implications for social welfare in
Bireuen. But revenue is not the main indicator in working-level Public Welfare in Bireuen. In 2010 the
condition of local revenue in Bireuen decreased by 5.65% but the per capita income of people increased
by 8.55% and life expectancy increased by 0.15%.
In 2011 and 2012 the increase in revenue in Bireuen have the positive implications to the improvement of
public welfare, which in two years was also followed by an increase in per capita income and an increase

Proceedings of The 1th Almuslim International Conference on Science, Technology and Society (AICSTS) 2015
November 7-8, 2015, Bireuen, Indonesia
275
in life expectancy. In 2013 the increase in revenue in Bireuen negative implications towards improving the
welfare of society, where in the increased revenue amounted to 57.79% and was followed by an increase
of 8.75 % per capita income communities, but led to a decline in life expectancy of 0.06%. So in this case
the increase in revenue causes a decrease in the quality of life in Bireuen.
To increase the implication of local revenue to improve the welfare of society in a fair and equitable, the
government Bireuen need to improve the productivity of government spending is sourced from local
revenue and allocated to expenditures that are productive and investment in order to boost economic
growth. With the allocation of revenue expenditure that is productive, it will be able to increase the supply
of jobs which will ultimately resulted in increased revenues and achieving prosperity.
In carrying out various activities, including efforts to improve the welfare of society, government budget
Bireuen requires large amounts. That is because the budget is a planning tool on the expenditure and
revenue in the future in a certain period and as a means of control or supervision of the expenditure and
revenue in the future. As a means of control or supervision, budget has three main functions, namely the
function of the needs of people, income distribution, and economic stabilization function.
Then in realizing the desire in society welfare, government Bireuen district needs to provide goods and
services that impact public welfare nature to equity, such as improving the quality of education, improving
the quality of health and other activities that are supporting and improving the quality of life Human
Development Index (HDI). It can be reached by the government Bireuen through the utilization of the
Regional Budget and mainly revenue.
Conclusion
Based on the research that has been done, then the conclusions in this study are as follows:
1. From 2009 until 2013 the number of residents in Bireuen increased so requires increased
financial resources of the region, especially from Local Revenue to be able to carry out the
distribution of development in order to improve the quality of life and well-being of society in the
era of regional autonomy.
2. From 2009 to 2013 life expectancy residents in Bireuen in unstable conditions, it is caused by a
lack of the ability of local revenue in the realization of health development.
3. Implications Local Revenue to the improvement of public welfare in Bireuen can be optimally
realized through increased efficiency and productivity of local revenue on productive spending
and investment can drive economic growth in the region.
References
Arikunto. Suharsimi. 2008. Research methodology. Jakarta. Rineka Reserved
The Central Statistics Agency (BPS) Bireuen Year 2009-2013
Department of Finance and Wealth Management Area (DPKKD) Bireuen Year 2009-2013
Rahadian. Basri. 2008. Financial aspects of the Regions. Jakarta. Raja Grafindo Persada
Republic of Indonesia. 2009. Law No. 28 On Local Taxes

Proceedings of The 1th Almuslim International Conference on Science, Technology and Society (AICSTS) 2015
November 7-8, 2015, Bireuen, Indonesia
276
Republic of Indonesia. 2014. Law No. 23 on Local Government
Republic of Indonesia. 2004. Law No. 33 On Financial Balance between Central and Local Government.
Syahrir. Hendrajaya. 2007. Aspects of Regional Development. Jakarta. Raja Grafindo Persada.
Widjaja. H.A.W. 2006. Autonomous Regions and Autonomous Regions. Jakarta. Raja Grafindo Persada
Proceedings of The 1th Almuslim International Conference on Science, Technology and Society (AICSTS) 2015
November 7-8, 2015, Bireuen, Indonesia
277
Role of Microfinance Institutions (MFIS) in Poverty Alleviation
Zahraini
Lecturer of Business Administration Study Program, Faculty of Social and Politics Science, Almuslim
University, Aceh, Indonesia.
Abstract
This article tries to explain the role of Microfinance Institutions in poverty reduction. The
institute is engaged in the financial sector, specifically established to provide business
development services and community empowerment, either through a loan or financing
for micro enterprises to members and the public, savings management, as well as the
provision of consulting services business development that is not solely for profit. The
exercise of Microfinance Institutions in Nagari experience many problems. One with many
cases of micro-credit assistance nagari jammed. The studies results prove that the
problem of bad loans that involve implementing many activities and members. The article
aims to analyze how microfinance institutions nagari management can be performed well
from the perspective of Law No. 1 of 2013 on microfinance institutions that can play a role
both in alleviating poverty. This article specifically describes the ability of the managerial
board and the service factor of Microfinance Institutions Nagari. From the results of this
study are expected to provide a view of the contribution of this institution in the process of
developing the concept of weak economic and community development in the future.
Keywords: Non-performing loans, the MFI, the MFI management.
Introduction
Referring to Law No. 1 of 2013 on Micro Finance Institutions (MFIs), the institution is a formal non-
banking institutions that are part of the restructuring of the national economy. This means that in their
activities Nagari Micro Finance Institutions (MFIs) took part in taking part to the achievement of a
prosperous economic life, both for people who become members of the association itself or to the
Customer and the surrounding community. MFIs as a special association founded to provide business
development services and community empowerment, either through a loan or financing for micro
enterprises to members and the public, savings management, as well as the provision of consulting
services in developing businesses that are not solely for profit.
Proceedings of The 1th Almuslim International Conference on Science, Technology and Society (AICSTS) 2015
November 7-8, 2015, Bireuen, Indonesia
278
In the Republic of Indonesia the state constitution provides a basis for the preparation and management
of the national economy in order to provide prosperity to all citizens of the Republic of Indonesia to the
principles of economic democracy. Obviously this is confirmed in Article 33 paragraph (1) of the Act of
1945 that the economy is structured as a joint venture on family principles. In a broader sense, defined in
paragraph (4) of article mentioned above, that the national economy was organized based on economic
democracy with the principles of togetherness, efficiency, justice, sustainability and environmental
friendliness, independence, and balancing progress and national economic unity. Microfinance
Institutions (MFIs) are often referred to as the executor of this community economy, the limit defined in
the Act No. 1 of 2013 on microfinance institutions Article 1 (1) as follows:
"Microfinance Institutions hereinafter referred MFI is a financial institution that is specifically established to
provide business development services and community empowerment, either through a loan or financing
for micro enterprises to members and the public, savings management, as well as the provision of
consulting services are not primarily business development eye for profit".
From the above article, it is clear bahwasannya MFI is a financial institution incorporated, has a capital
and obtains a business license. Legal form can be in the form of a cooperative or limite liability
companies. MFIs in the rules of Law No. 1 of 2013 can have its share of the government district / city or
village owned enterprises, cooperatives and the citizens of Indonesia. The main purpose of the
establishment of MFIs is to increase access to micro-scale funding for the community; it is also expected
to help increase productivity and economic empowerment of the community; and help increase the
income and welfare of the community. Because this activity is oriented are micro-enterprises, the main
target was the poor or low-income and also as an economic movement Populist.
MFIs have a significant role in giving small loans to poor people with their goals can be self-employed.
Micro credit intended for people who do not have collateral, steady job, and credit history are reliable, and
not being able to obtain regular credit. Microcredit is a part of microfinance, a financial services help poor
people who have limited economic capacity. In order to attempt to advance the position of the people who
have limited economic capacity, then the Indonesian government attention to the growth and
development of associations of MFIs.
This article tries to provide its own perspective on how MFIs can contribute to poverty reduction in West
Sumatra province, although in another perspective recognized MFI program is often weighed on local
budgets and performance area because of frequent administration of these loans are often jammed. To
deliver these objectives, this article is divided into several sections. The first part tries to explain KUR
History and notions such as People's Business Credit (KUR) in the perspective of MFIs in West
Sumatera. The second part explains the rational role of MFIs in poverty reduction in West Sumatra. The
final part is the crystallization of the article summarized the conclusions and suggestions.
Theoretical Study

Proceedings of The 1th Almuslim International Conference on Science, Technology and Society (AICSTS) 2015
November 7-8, 2015, Bireuen, Indonesia
279
According to the Microcredit Summit (1997) in Ashari (2006: 147) definition of micro-credit is
"Programmes extend small loans to very poor for self-employment projects that generate income,
allowing them to care for Themselves and their families" or "Program loans totaling little to the poor to
finance productive activities that he do yourself in order to generate income, allowing them care about
themselves and their families".
Meanwhile, according to Package Policy (1993) in the book Totok Budisantoso (2005) that "Credit for
small businesses are loans granted to small business customers with a maximum credit limit of Rp250
million to finance productive activities". While the definition of credit for micro enterprises are "loans to
small business customers with a credit limit of up to Rp 25 million".
Although there are differences, but the two statements above have similarities that micro-credit is given to
micro and small entrepreneurs with different credit limit to finance productive business activities.
Produktife if said the business venture can provide added value in producing goods and services as well
as their income.
The micro loans channeled through financial institutions that are generally referred to Microfinance
Institutions (MFIs). Mandala Manurung and prathama Rahardja (2004) states that "MFIs are financial
institutions that provide services to low-income people and the poor and small entrepreneurs".
Meanwhile, according to other experts, "MFI is defined as a provider of financial services for micro and
small entrepreneurs as well as serve as a development tool for rural communities" (Soetanto Hadinoto,
2005). According to the Directorate of Finance (Department of Agriculture), (2004) in Ashari (2006) that
"MFI developed by a passion to help and facilitate poor people both for consumptive and productive
activities of the poor families".
Although there are many definitions of MFIs, there are three important elements of the various definitions,
namely:
1. Provide a wide range of financial services
Microfinance in Indonesia experience of traditional societies such as village barn, granary pitih villages
and so provide diversified financial services such as savings, loans, payments, deposits and insurance.
2. Serving the poor
Microfinance is alive and growing in the beginning was to serve the people who are marginalized by the
formal financial system so that it has the characteristics of a typical constituents.
3. Using the procedures and mechanisms for contextual and flexible
This is a consequence of the communities served, so that the procedures and mechanisms developed to
microfinance will always be contextual and flexible.
From the total MFI (Microfinance Institutions) in West Sumatera, which is 3,186 units, the percentage of
units that have not been incorporated MFI greater than the unit MFIs that have incorporated the Law.
From the data received while 3,024 units of MFIs in West Sumatra has not incorporated the Law and 162
Proceedings of The 1th Almuslim International Conference on Science, Technology and Society (AICSTS) 2015
November 7-8, 2015, Bireuen, Indonesia
280
units of MFIs that have incorporated the Law", said Vice Governor Muslim Kasim before opening
Socialization of Law No. 1 of 2013 About the Microfinance Institutions (MFIs) and Basic Training
Development and Supervision MFI at Hotel Mercure.
It is held that the existence of MFIs as financial institutions can be well ordered. This is particularly
important with a view to minimizing errors and penyalahgunaan.seluruh unit MFIs in West Sumatra is
already incorporated, so that later on people in West Sumatra future get peace and comfort in borrowing,
"says MK.
Chief Executive Supervisory Financial Industry Non-bank (IKNB) Financial Services Authority (FSA) The
center also explains the MFI must obtain a business license from the FSA, especially for MFIs that are
already established and in operation before the enactment of the Law MFI (effective from January 8,
2015) as the Village Bank, The village barn, Bank Markets, Small People's Business Credit (KURK) and
other institutions equivalent, is required to obtain a business license through pengkuhan.
"Inauguration at the latest on January 8, 2016, and MFIs are one of its business activities to collect public
funds and have not obtained a business license FSA until such time limit imposed criminal sanctions",
explained Firdaus Djaelani. Then Chief Executive of the FSA Supervisory IKNB further identifies MFI
capital is determined based on broad coverage of the MFI's business. "To Village / Sub at least Rp. 50
million, the District at least Rp. 100 million and district / city at least Rp. 500 million ", he said.
Furthermore, to prepare for Government Human Resources District / City as manager and supervisor of
MFIs and improve the effectiveness of the guidance and supervision of MFIs, the FSA has built a web-
based information system-based MFIs, which among other things serves to store data inventory that has
not been incorporated MFI Law.
MFI information system is also equipped with the licensing application process and financial statements
and financial statement analysis, which is expected to facilitate the implementation of the guidance and
supervision of MFIs", added Firdaus Djaelani. Microfinance and Poverty Reduction Program Microfinance
Institutions Micro Finance Institution or an institution conducting the provision of financial services to
micro and small entrepreneurs and low-income people who are not served by formal financial institutions
and which have been market-oriented for business purposes.
BRI itself, micro finance credit services is defined as less than Rp 50 million. There are many more
definitions of micro-finance or micro finance depends on the angle of the talks. However, the target or
segment of micro finance is always in contact with people who are relatively poor or low-income program
P4K handled in BRI defines the poor as those fishermen small (PNK) and a rural population of other living
below the poverty line, with the criteria of earnings a maximum equivalent to 320 kg of rice per capita per
year.
According Marguiret Robinson (2000), poverty alleviation can be done through many means and
programs, including the programs for food, health, housing, education, family planning and the course is
through a loan in the form of micro credit. In the form of micro credit loan is one that is effective in dealing
Proceedings of The 1th Almuslim International Conference on Science, Technology and Society (AICSTS) 2015
November 7-8, 2015, Bireuen, Indonesia
281
with poverty. Nevertheless, it should be noted that, when the loan is given to those who are very poor,
most likely the loan will never go back. This is reasonable, given they (the extreme poor) are not income
and does not have a productive activity. Food programs and job creation is more suitable for the poorest
communities. While most other people were classified as poor but have economic activities (economically
active working poor) or people with low income (lower income), they have an income, though not much. It
is necessary for the approach, the subsidy program or other type of micro-loan is right for each of these
poor communities.
Besides BRI, BRI is also working with the government or other agencies manage P4K and BKD, of
course, there are other financial institutions such as rural banks and Non Governmental Organization
(NGO) were involved in poverty alleviation in Indonesia such as in the picture below.
The many types of microfinance institutions to grow and flourish in Indonesia shows that microfinance
institutions are needed by the community, especially the low-income communities, small and micro
entrepreneurs that have not been covered by banking financial services, especially commercial banks.
In the microfinance institutions can foster interest in rural communities to strive or grow small businesses
in rural areas, which in turn can help the government program to:
1. Increase the productivity of small businesses in rural communities.
2. Increase the income of the villagers.
3. Creating new jobs in rural areas, so as to minimize the desire of rural communities do
urbanization.
4. Supporting the government program in villagers seeking income distribution and poverty
reduction.
Contributions MFIs in Poverty Alleviation
Regardless of the breakdown of outstanding loans, MFIs in many ways has contributed to poverty
reduction. How not, since KUR distributed in 2007, SMEs with small-scale enterprises accounted for
42.61% of the national GDP. The role of SMEs in employment is also quite significant. In 2007, the
number of workers absorbed in this sector reached 87.73 million people, or 94.3% of the total national
workforce.
Furthermore, data from the Ministry KUKM (2009) mentions more than 26.4 million units of micro and
small enterprises in 2008. They were engaged in primary sectors such as agriculture, fisheries and
plantations. If the rough assumption for the average SME needs one million to five million for working
capital, then there will be demand for the financing of approximately Rp. 26 trillion to 132 trillion.
Although the cost of the process of MFI loans slightly higher than conventional bank interest rates, but in
terms of lending mechanisms, MFIs have several advantages including no requirement of collateral /
guarantees as applied to the formal banking. This is because the lending mechanisms used channeling

Proceedings of The 1th Almuslim International Conference on Science, Technology and Society (AICSTS) 2015
November 7-8, 2015, Bireuen, Indonesia
282
system. There are even some MFIs, lending is based more on trust because usually the borrower is
already known by the managers.
Another plus is the procedure of disbursement and repayment of loans are very flexible and are often
tailored to the borrower's cash flow. Under these conditions, MFIs in many ways can contribute to
accelerating economic growth in order to alleviate poverty, especially in rural areas. It supported the
statement Ashari (2006) MFIs generally are, or at least close to the rural areas so it is easily accessible
by the public that the majority of farmers; (2) The rural community is more like a short process and
without a lot of procedures; (3) business characteristics generally require a credit limit that is not too large
to fit on the financial ability of MFIs; (4) the proximity of MFIs and farmers enables MFIs to understand the
characteristics of the business so that it can disburse loans in a timely manner and amount; and (5) the
existence of socio-cultural relations as well as personal rapport emotionally so that they can be expected
to reduce the fraudulent nature of the loan repayment.
Qualifications that must be met by Microfinance Institutions
Noting the geographical conditions in Indonesia are very broad and tesebar in many islands, as well as
considering the market real sector is almost entirely a micro-businesses / SMEs, so that the function of
micro-finance institutions in the operations of the regional economy may be optimized, microfinance
institutions must fulfilled qualifications:
1. Having a strong network.
2. Functions as a payment gateway is running properly.
3. Understand the needs of local government and the business community.
Research Methods
This research is qualitative descriptive study that revealed the facts, circumstances, phenomena,
variables and circumstances that occurred while running the research and presenting what it is. Interpret
qualitative descriptive study and said that the data is concerned with the current situation, (McMillan &
Schumacher, 2003). In addition it is also some of the information obtained from various sources of media,
both newspapers and electronic media, all of which were applied to the interpretation applied in data
analysis methods.
The object of this study is data relating to the MFI, while the subject of this study is the electronic media.
The type of data used in this research is secondary data is data that is already available / researchers
indirectly through an intermediary medium
In a study carried out this, the authors used data collection techniques litereir or library research
(literature). Therefore, materials used in this study are:
1. Library materials, such as books containing the opinion of the experts or practitioners or things
that are closely related to the issues being studied.
Proceedings of The 1th Almuslim International Conference on Science, Technology and Society (AICSTS) 2015
November 7-8, 2015, Bireuen, Indonesia
283
2. Materials obtained from articles, journals, and the Internet that has relevance to the issues
intended as a support in compiling analytical sharpness.
The technique of data processing is done by collecting all the data in the can, making it easier for authors
to analyze the data and produce a conclusion relating to this study.
Results and Discussion
Anyone who is engaged in the business of KUR, often hear a famous bank in Bangladesh Grameen
Bank. Esty (2011) interviewed a founder, Muhammad Yunus. Inspiration Grameen Bank he founded in
the early 1972's. He never thought it would become a banker in Bangladesh. That he is thinking about is
how Bangladesh out of the slump because of liberalization.
Long story short, he founded and led the successful Grameen Bank in 1983 to help small communities of
hunger and poverty. Starting from the environment in which he lived is the village Jobra. He set up a kind
of cooperative for farmers. He lends money to members of the public to trust the system. That is, there is
no guarantee that the material is equal to the people who borrow. Only trust the bank to the people so
that the bank would lend money to a borrower.
Armed with the success of Grameen Bank, many other countries in a variety of modifications
mencontohnya businesses including Indonesia. At first performed Indonesia is creating a revolving credit
channeled through state banks. In 2007 the Government launched the KUR for small businesses in
obtaining venture capital through loans. Banks dealer at that time include BRI, BNI, Bukopin, BSM and
Mandiri. KUR is aimed at helping SMEs and cooperatives in obtaining capital financing.
From the above explanation, it is clear that the role of government in terms of funding to support the
activities of MFIs in the form of cooperatives and SMEs felt very big. But on the coaching side, the role of
government that is less than the maximum. This can be evidenced by the state of consciousness of
today's society to play a role in MFIs also looks still very low. As in West Sumatra in 2008 recorded 6910
new small business group managed economy of the poor in West Sumatra has leveraged its distribution
MFI loan through Bank area. Of the many that group, 5.3% group be in arrears. As example, Solok
arrears for revolving credit about Rp. 2.06 Milyar, and at Padang Pariaman 4.05 Billion.
One major factor is caused by the bad debts because there are many members who actively participate
less in activities usahanyanya. Whereas the participation of members in the MFI very important role to
promote and develop their own institutions. Without the active participation of members in overseeing the
business, capital, and enjoy the benefits of the business, as well as the involvement of members in
evaluating the results of activities MFI will not mean anything, and will not be able to work effectively and
efficiently which resulted These institutions will not be able to flourish.
In general, there are some things that become the background inhibiting business development MFIs in
West Sumatera:

Proceedings of The 1th Almuslim International Conference on Science, Technology and Society (AICSTS) 2015
November 7-8, 2015, Bireuen, Indonesia
284
1. The existence of contradictions in the dualism of the MFI's business objectives, which on the one
hand, aims for the welfare of its members based on the principle of kinship and helping each
other, the other side aiming for profit as a business entity, which is basically the main factors
inhibiting the application of economic principles in an attempt Institute for profit MFIs.
2. Ability to limited human resources, which directly resulted in limited managerial capacity of MFIs.
3. Geography and limited distribution network business.
4. Support adequate infrastructure is not owned.
5. Capital Limited.
6. The limited application of economic principles consistently in MFI.
7. Bad service MFIs so that members are reluctant to contribute actively in the agency business.
8. The level of trust board member of the lower MFI caused by poor performance management
agencies.
9. The members of the low level of active participation in the business activities of MFIs.
10. Economic and political factors that occurred in Indonesia.
Based on MFI conditions mentioned above, it is understood that many factors inhibiting the development
of MFIs in West Sumatra, then in this context more will discuss how MFI managerial factors that can
either mensolidkan their contribution to poverty reduction. Managerial capability is a knowledge, attitudes,
behaviors and skills that can make the job more effectively so as to achieve the goals set by the efficient
(Manullang, 1994).
Managerial capabilities can be interpreted also an attempt to mobilize the resources available to engage
in a program or activity in order to achieve the stated goals effectively and efficiently. This ability is a
prerequisite that must be owned by the manager of the peak level of management that his ability to lead
the organization as a prerequisite in the management of top-level management (top management).
In the MFI, managerial capability is the ability to be possessed by the board of managers for the board
managers have managerial functions that drive in managing the institution. Therefore caretaker manager
of the MFI's main role is to manage it includes a variety of business activities. Of the task, clearly implied
that the development of this institution is very much determined by the quality of the management board.
Where managers have a role of factors that determine the position and dominant. In addition, the board of
managers have a duty to implement the agreement and the MFI program.
To select an administrator let individuals chosen because it has good managerial abilities, with indicators
of managerial capacity according Winardi (1995) as follows:
1. Conceptual Ability (Conceptual Skill)
Have a mental ability to think in giving understanding, views, perceptions, and opinions in handling the
activities of the organization as a whole, either on policies, possibilities in the face of change and how to
anticipate them, and synchronize all the activities in mancapai organizational goals.
2. Ability Humanity (Human Skill)
Proceedings of The 1th Almuslim International Conference on Science, Technology and Society (AICSTS) 2015
November 7-8, 2015, Bireuen, Indonesia
285
Have an ability to work in a group or with other groups in the organization and the individual, to provide
motivation, communication, leading and directing people to do something in achieving the goals set.
3. Technical Capability (Technical Skill)
Has an ability to deal with a problem which is demonstrated by the ability to use a procedure, methods,
and technical equipment in the operational process, especially concerning human work equipment
commonly used in completing a job.
4. Ability Administrative (Administrative Skills)
Having the ability which includes planning, organizing, preparation of personnel and the supervision of all
matters relating to the administration system. Based indicators of managerial ability of the MFI, then all
aspects of managing the business start in terms of understanding, conceptual knowledge of the MFIs, in
terms of ability in technical terms, in terms of administrative capacity, in terms of the ability to motivate
members, as well as personal characteristics are a must-have MFI board.
Conclusion
1. Based on the above discussion, it can be concluded that the contribution of MFIs in poverty
reduction is actually quite significant. Only the frequency of bad loans, because due to the
managerial ability of the MFI board is still limited. This is understandable because the average
HR rural areas are still low. Only a high willingness only people willing to take care of the MFI.
For that there needs to be a recommendation for the board to strengthen the capacity of MFIs to
improve the ability of management or managerial.
2. The high chance of bad loans in the MFI as well as due to the lending that is not as intended. In
other words MFIs lack the ability in selecting potential creditors. To that recommendation, the
authors suggest there is assistance when the loan has been disbursed. Or alternatively by means
of an MFI board selects from the personality of the borrower.
3. One of the factors that determine the success of an MFI is the participation of its members, and if
the MFIs have a situation where members feel the absence of benefits and added value that can
be obtained by joining the agency. It may be because may be the result of poor performance and
managerial services. These conditions make the participation of the members will be lower. That
must be addressed immediately is the reorientation and re-orientation and re-organization as a
wake professional company.
References
Ashari. 2006. Potential of Micro Finance Institutions (MFIs) in Economic Development and Rural
Development Policy. Agricultural Policy Analysis, Volume 4 No. 2, June 2006. Social Analysis
Center of Economic and Agricultural Policy, Bogor.
Esty, K. 2011 Lessons from Muhammad Yunus and the Grameen Bank. OD Practitioner Vol. 43 No. 1,
2011.

Proceedings of The 1th Almuslim International Conference on Science, Technology and Society (AICSTS) 2015
November 7-8, 2015, Bireuen, Indonesia
286
http://dryanplace.blogspot.co.id/2009/12/bab-i-pendahuluan-1.html
Manullang, M. 1994. Personal Management, Jakarta: Ghalia Indonesia.
Winardi.1995. Management Information Systems. Bandung: Publisher NOVA.
Proceedings of The 1th Almuslim International Conference on Science, Technology and Society (AICSTS) 2015
November 7-8, 2015, Bireuen, Indonesia
287
Human Resources Management Function in Developing the
Discipline Reform in Office of Education, Youth and Sports
Lhokseumawe
Ridwan
Abstract
Civil Service is in charge of human resources to provide public services in a professional,
fair and equitable in the state administration, governance and development with based on
loyalty and obedience to Pancasila and the Constitution of 1945. The function of the
management of personnel in enhancing the discipline apparatus holds an important role
in the execution of its duties and obligations as an employee. As for the formulation of the
problem in this research is how the functions of personnel management in improving the
discipline of personnel, what are the factors that influence it. This study aimed to
determine the function of the management of personnel in enhancing the discipline
apparatus, to describe the factors that affect the functioning of the management of
personnel in enhancing the discipline of personnel as well as to analyze the efforts made
leadership in improving the discipline of personnel at the Dinas Pendidikan, Pemuda dan
Olah Raga Lhokseumawe. In carrying out this study the authors used a qualitative
approach and descriptive method of analysis that outlines the data obtained in the field to
describe the issues to be discussed. Data collection techniques that use in this research
were direct observation, namely data collection techniques by observing directly to a
location that made the object of research. Interviews are held a question and answer
directly to the sources that serve as informants and documentation is to collect all the
data that has to do with research and to collect documents related to this research.
Keywords: Management, Employee Discipline Apparatus
Introduction
The existence of human resources is one of the main factors that are very important in an organization.
Utilization of human resources is effectively a way for an organization to maintain the survival and growth
in the future. In other words, the success or decline of an organization depends on the expertise and skills
of their employees who work in the organization.
Proceedings of The 1th Almuslim International Conference on Science, Technology and Society (AICSTS) 2015
November 7-8, 2015, Bireuen, Indonesia
288
Civil Service is in charge of human resources to provide public services in a professional, fair and
equitable in the administration of state duties, governance and development with based on loyalty and
obedience to Pancasila and the Constitution of 1945. The position and role is very important causes Civil
Servants always required in order to have full loyalty and devotion in carrying out his duties and focus all
the attention and mobilize all the power and energy are efficient and effective.
Personnel management functions in improving discipline apparatus holds a very important role in the
execution of its duties and obligations as an employee. An employee who has a high level of discipline
will continue to work well even without supervised by superiors. Discipline an employee who will not steal
work time to do other things that have nothing to do with work. Similarly, employees who have the
discipline will obey the rules that exist in the work environment with a high awareness without any
compulsion.
An employee who has a high level of discipline will have a good performance, if the working time can be
exploited as best as possible to carry out the work in accordance with the set targets. The enactment of
regulations on discipline for the Civil Service is an attempt to ensure the implementation of the order and
the smooth execution of official duties entrusted to them. Discipline is the key factor or a pre-requisite for
the successful implementation of tasks within an organization.
Therefore, the existence of a good coaching system discipline is very important and influential in the
process of implementation of activities within the organization. Implementation of the regulations on
discipline is indeed a very big influence in the implementation of the tasks and duties of the officers
among the Dinas Pendidikan, Pemuda dan Olah Raga Lhokseumawe.
According to the writer's observation during this time, the level of discipline at the Dinas Pendidikan,
Pemuda dan Olah Raga Kota Lhokseumawe not been in line with expectations, this case concerns the
conditions of labor discipline employees of the need for change in the future either seen from the fact that
there is a list of present there are still employees who are lazy come to work. While based on the
assessment of people who become inputs for authors that are often encountered by people during
working hours, there are employees that fun shopping in the market (especially for women) as well as for
male employees who often relaxed just spend time working at a coffee shop.
Based on the above phenomenon, according to the author's view, a sense of responsibility and discipline
of civil servants in the Dinas Pendidikan, Pemuda dan Olah Raga Kota Lhokseumawe is still very low.
This will affect the level of achievement of specified performance targets are not achieved. Discipline an
employee would not have been possible without the good leadership, because with good leadership will
change the perception of an employee to work in a disciplined manner. In other words, the example of a
leader is the key to the implementation of change strategies.
Its therefore requires good discipline development efforts as a government policy to all Civil Servants
(PNS) based career system that is clear, consistent and system performance. One aspect of the
government apparatus that supports the development of coaching is coaching discipline. So that

Proceedings of The 1th Almuslim International Conference on Science, Technology and Society (AICSTS) 2015
November 7-8, 2015, Bireuen, Indonesia
289
discipline can be done well then discipline should be able to support the purposes and in accordance with
the abilities of the employees, because the enforcement of labor discipline of employees led to the
implementation of the performance of the institution or organization more effectively and efficiently and
facilitate the achievement of the desired objectives. Departing from the issues, the authors are interested
and willing to conduct a study with the title "Human Resources Management Function in Developing the
Discipline Reform In servants in Dinas Pendidikan, Pemuda dan Olah Raga Kota Lhokseumawe".
Literature Review
Definition of Management
According to Susanto (2001), a term derived from English management is to management that generally
means care. In a special sense of management used for someone in charge of an organization called the
leadership that the people conducting the lead. Furthermore, Henry, (2000), suggests that management
is a process that involves all activities related to decision making, leadership and achieving goals for the
common good. Management functions to efficiently utilize resources such as raw materials, money,
methods, equipment, machinery and spirit of employees to develop and achieve the goals of an
organization or a company.
Management has an important role in an institution because it can regulate all activities in it properly, if
the organization is not there a good and effective management. Then any activity on that agency will not
run smoothly, there is no unity of command which in this case will lead to losses for the institution
(Gordon, 2000). In this case, Moekijat (2002) states "management can be formulated as organizing an
office to achieve a certain goal and to utilize employees as well as possible and use the machines and
equipment that is most suitable, the methods most well and by providing the most appropriate
environment".
Management is the process of the activities of a leader (manager) should be done by using the methods
of ownership of both scientific and practical to achieve the goals that have been established through
cooperation with others as a source of labor as well as utilizing other sources and the time available for it
and in a way that is rigorous. Meanwhile, Manila (2000) argues that professional management means that
public services are sought after by the lack of accountability of service providers (government officials).
Effectively prioritize what the goals and objectives, simple means the procedure or procedures of
organized services easily and quickly. The Government is essentially a service to the public not to serve
themselves but to serve the community develop the skills and creativity to achieve common goals.
Furthermore, Winardi, (2001) says that the number of possible absence of adequate services for:
1. Lack of awareness of the duties or obligations which have been assumed by each apparatus.
2. System processes and working methods were inadequate resulting in overlap.
3. Organizing the ministry mismatched, causing confusing in the handling of duties.
4. Ability inadequate employee tasks assigned to them, consequently the result of the work does not
meet the standards that have been determined.
Proceedings of The 1th Almuslim International Conference on Science, Technology and Society (AICSTS) 2015
November 7-8, 2015, Bireuen, Indonesia
290
5. Unavailability of adequate care facilities so that work becomes slow, a lot of wasted time and the
slow resolution.
It can be understood that the elements contained in the management of coordination must have the
nature and character of that adjustment, operation, use a suitable time with the best possible and most
donations or input from other parties as well as the results obtained.
Staffing
According Widjaja, (2006) argues that "employees are human labor physical and spiritual (mental and
mind) are always needed and therefore became one of the principal capital in an effort to work together to
achieve certain goals (organization). Servants are people who worked in a particular agency, both in
government institutions and in enterprises. This is in accordance with the opinion of Musanef (2001),
which says that "employees are the ones who do the work to get a fee in the form of salaries and
allowances from the government or private agencies. Those who are directly driven by a manager to act
as an executor who will carry out the work so as to produce works that are expected in achieving
organizational goals that have been set".
From the above definition can be concluded that the employees as the workforce or who hold jobs need
to be moved so that they have the skills and ability to work that will ultimately be able to produce works
that are useful to the achievement of organizational goals. Because of without the ability and skills of
employees as the executor of the work the tools in the organization will be an inanimate object and the
time used to be wasted by useless so the work is not effective.
From the definition of employees that have been suggested by experts of the above, it can be concluded
that the term implies the following employees:
1. Being a member of business cooperation (organization) with a view to obtaining remuneration or
compensation in exchange for services rendered.
2. Employees in the system of cooperation that are grumpy.
3. Domiciled as recipients of working and dealing with the employer (the employer).
4. Position as the recipient of the work was obtained after the admission process.
5. Will be given the dismissal (termination of employment between the employer and the recipient of
the work).
Discipline
According Ghozali (2001), said "discipline is the attitude and willingness of a person's willingness to
adhere to and comply with all the norms prevailing around it". Meanwhile, according to Maxwell, (2000:
115), "discipline is the attitude of the obligations of a person or group of people are always willing to follow
or understand all the rules / decisions that have been established". Furthermore, Siagian (2002), "work
discipline is must follow rules that include methods of workmanship, working procedures, time and
number of units and established quality". Meanwhile, Malayu, (2001) says "that the nature of the

Proceedings of The 1th Almuslim International Conference on Science, Technology and Society (AICSTS) 2015
November 7-8, 2015, Bireuen, Indonesia
291
discipline itself is obedience, sincerity, strength or skill, attitude and behavior and respect to all terms of
the agreement or an agreement between the organization and its employees".
In the discipline is orderly attitude of someone who shows obedience or adherence to rules or provisions
that have been there with a bunch of heart, meaning without coercion. To establish and maintain
discipline there is need for regulation or the provisions made in advance. However, that does not mean
the regulations and rules are meant to force people to be disciplined, but is intended as a guideline or a
reference in the act, behave or act which is expected to become a habit or something that is fair gladly.
Discipline desires not only arise because of awareness but also because of coercion. Discipline arises
because of consciousness caused by factors a person to realize that only the discipline will get success in
all respects, regularity in life and can eliminate the disappointment of others and others will admire.
Disciplined because coercion is usually done with forced similarly, the compulsion for fear of legal
sanction as a result of violation of the rules. There supervision of officers (leaders) discipline will arise but
if there is no supervisor, the violation was committed. Further Sardiman, (2004), says that "in the
discipline does not always have to involve other people but engage themselves more importantly, for the
enforcement of discipline because it involves self-discipline meant that arises is because consciousness".
So we can conclude that the people who succeed in work and work because they always put discipline in
all actions and deeds. All planned work schedules and arranged to be obeyed with a sincere they carry
out with full responsibility and eager, willing to sacrifice anything for the sake of the struggle to enforce
discipline.
Research Methods
In carrying out this study the authors used a qualitative approach and descriptive method of analysis that
outlines the data obtained in the field to describe the issues to be discussed. According to Arikunto (2002)
defines qualitative is a research procedure that produces descriptive data in the form of words written or
spoken of people and behaviors that can be observed.
Descriptive analysis method which is supported by data obtained through the research library (Library
Research) and field (Field Research). The research library (Library Research) is to examine, review and
study the literature (reference) is closely related to the issues to be discussed. Research field (Field
Research), the authors observed directly to the in Dinas Pendidikan, Pemuda dan Olah Raga Kota
Lhokseumawe by observation, interviews and documentation, in order to obtain a clear and
representative data.
In the discussion the authors describe with accurate sentences and going about personnel management
functions in improving the discipline of personnel at the in Dinas Pendidikan, Pemuda dan Olah Raga
Kota Lhokseumawe.

Proceedings of The 1th Almuslim International Conference on Science, Technology and Society (AICSTS) 2015
November 7-8, 2015, Bireuen, Indonesia
292
Result and Discussion
Personnel Management Function in Developing Discipline Apparatus in Dinas Pendidikan, Pemuda dan
Olah Raga Kota Lhokseumawe.
Implementation of working hours as a work discipline Civil Servants (PNS) at the Dinas Pendidikan,
Pemuda dan Olah Raga Kota Lhokseumawe can be defined as a state of order, which start from the
boss, the head of the section to employees, staff incorporated in it are subject to regulation has been
established. The implementation of hours of work at the Dinas Pendidikan, Pemuda dan Olah Raga Kota
Lhokseumawe is as follows:
Table 1. Implementation of the Working Hours in Dinas Pendidikan, Pemuda dan Olah Raga Kota
Lhokseumawe
No Working days Sign Working Hours
(Morning parade)
Hours Lunch Break Hours Home Work (apple
Afternoon )
1
2
3
4
5
Monday
Tuesday
Wednesday
Thursday
Friday
07.45 Wib
07.45 Wib
07.45 Wib
07.45 Wib
07.45 Wib
12.00 Wib
12.00 Wib
12.00 Wib
12.00 Wib
11.30 Wib
16.45 Wib
16.45 Wib
16.45 Wib
16.45 Wib
16.00 Wib
Source : Dinas Pendidikan, Pemuda dan Olah Raga Lhokseumawe, 2014
From the table above it can be seen that the working time applicable in the Office of Dinas Pendidikan,
Pemuda dan Olah Raga Kota Lhokseumawe is 5 working days, ie Monday to Friday except red dates
(days off), because the government agencies, the policy system works only five day. For further assess,
in this case on the implementation of labor discipline Civil Servants (PNS). The author conducted
interviews that serve as informants in this study. According to the Drs. Rusli, MM (Head of Dinas
Pendidikan, Pemuda dan Olah Raga Kota Lhokseumawe).
"Discipline is an integral part of the entire administrative process aimed primarily to develop the
effectiveness of employee performance related to the key tasks that have been entrusted, but the
emphasis on the improvement of the discipline is the improvement and development of
performance, expected business coaching, teaching and training employees can also develop
and direct also can improve the effectiveness of employee performance (Interview, March 25,
2014)".
According to the Drs. A. Madjid (Secretary of Dinas Pendidikan, Pemuda dan Olah Raga Kota
Lhokseumawe) found:
"During the implementation of the working hours has been applied in accordance with
government policy as applicable procedures, but still the employees who do not care in

Proceedings of The 1th Almuslim International Conference on Science, Technology and Society (AICSTS) 2015
November 7-8, 2015, Bireuen, Indonesia
293
accordance with the provisions in force as to come to work not in accordance with the appointed
hour as well as time to go home, by providing a variety of reasons (interview, March 28, 2014) ".
The discipline aims to help control the self finds himself and overcome and prevent problems-problems of
unwanted and try to create a pleasant situation for work activities or tasks entrusted respectively so that
they comply with all the rules that have been established.
Meanwhile, according to Drs. M. Nazar (Head of Public and Civil Service) found:
"Implementation of the discipline at the Dinas Pendidikan, Pemuda dan Olah Raga Kota
Lhokseumawe actually been going well, but indeed there are some employees who sometimes
ignore it either in the schedule of work, home and so do not follow the rules that have been
determined. This we do when there is an urgent need (Interview, March 25, 2014)".
Further according Tgk Jailani, as community leaders Lhokseumawe also revealed that:
"What I know so far the implementation of discipline, especially the working hours at the Dinas
Pendidikan, Pemuda dan Olah Raga Kota Lhokseumawe been implemented as regulations, but
there is one person two employees needed services by the public is not in place due to come out
by the time clock there may work in the office for official purposes Regent etc. so that people
have to wait the next day to come again. Perhaps therein can be assessed employees not
disciplined” (Interview, March 27, 2014).
The author also conducted interviews with the Head of the Regional Education Council (MPD)
Lhokseumawe, Mr. Ir. H. Azhari Ali found:
"Discipline for any government apparatus is to be aware and very important to be implemented in
accordance with the rules that have been established over the years, so that the service provided
to the public run in accordance with the purpose (Interview, March 25, 2014)".
Discipline is an integral part of the entire administrative process aimed primarily to develop the
effectiveness of employee performance related to the key tasks that have been entrusted. But the center
of gravity of the increase in these disciplines is the improvement and development of performance,
expected business coaching, teaching training and changes in mental attitude continued employees can
also develop and direct can improve the effectiveness of employee performance.
Factors Affecting Implementation of Administrative Discipline in Dinas Pendidikan, Pemuda dan Olah
Raga Kota Lhokseumawe.
Position and role of the Civil Service in Indonesia felt increasingly important to organize the administration
and development in order to achieve the national goal is to create a society that is civil to obey the law,
civilized modern, democratic, prosperous, fair and moral obligation that must be obeyed and the
prohibition that is not be violated by any Civil Servant who commit disciplinary offenses.
The factors that affect the discipline in the opinion of Drs. Rusli, MM (Dinas Pendidikan, Pemuda dan
Olah Raga Kota Lhokseumawe) found:

Proceedings of The 1th Almuslim International Conference on Science, Technology and Society (AICSTS) 2015
November 7-8, 2015, Bireuen, Indonesia
294
"Motivation is the driving force or pull that causes the behavior toward a specific goal, because
motivation is a very important part of the institution. The employees will work in earnest when
motivated by obeying all the rules that have been set, and vice versa if there is no motivation then
it will ignore every work (Interview, March 25, 2014)".
Without motivation, an employee can not fulfill their duties according to standards or even surpass the
standard for what the motive and motivation to work is not met. Even if an employee has a good
operational capability, if it does not have the motivation to work the end result of his work will not be
satisfactory. In other words, will do all the work properly if there is a driving factor, especially from a
leader.
Meanwhile, according to the explanation Drs. A. Madjid (Sekretaris Dinas Pendidikan, Pemuda dan Olah
Raga Kota Lhokseumawe) found:
"In an apparatus working as civil servants have to follow all the rules for the implementation of the
objectives of the institution where the work, lack of motivation at work will cause all the work is
neglected. Given the tremendous role that employees should have a good motivation in carrying
out their duties in order to implemented smoothly as expected goals (Interview, March 26, 2014)”.
Meanwhile, according to Mrs. Darmiah (Staf Umum dan Kepegawaian Dinas Pendidikan, Pemuda dan
Olah Raga Kota Lhokseumawe) found:
"During this time I often do not come to work because they have other jobs in addition to the
salaries have been deducted by the bank for credit and Tunjangan Prestasi Kerja (TPK) has been
reduced by the local government. In this case the motivation to work less well (Interview, March
26, 2014)".
Based on the results of these interviews can be concluded that given the importance of motivation, it is a
form of attention of the leadership on the issue of employee motivation in the work is to conduct the
business of motivation fostering mental, spiritual, provision of incentives to note the activities as well as
the evaluation of work discipline through a series of specific business in accordance with policy
government, so that the work will remain intact, the importance of monitoring the implementation of the
work will be done to improve discipline. Thus the absence of a limiting factor in the application of
discipline for employees within the Dinas Pendidikan, Pemuda dan Olah Raga Kota Lhokseumawe Kota
Lhokseumawe.
Conclusions
Based on the results of the discussion that has been described in the previous chapter, the writer can
draw some conclusions as follows:
1. The function of the management of personnel in enhancing the discipline of personnel at the
Dinas Pendidikan, Pemuda dan Olah Raga Kota Lhokseumawe Kota Lhokseumawe have been
applied properly in accordance with applicable government regulations. Obedience employee in
Proceedings of The 1th Almuslim International Conference on Science, Technology and Society (AICSTS) 2015
November 7-8, 2015, Bireuen, Indonesia
295
the office of Dinas Pendidikan, Pemuda dan Olah Raga Kota Lhokseumawe Kota Lhokseumawe
so far has been good, especially in providing services to the community
2. Factors that affect the functioning of the management of personnel in enhancing the discipline of
personnel, among others, one of the factors that greatly affect the functioning of the management
of personnel in enhancing the discipline of personnel among others, the regulations or the rules
that govern the things that are required and restrictions are to be abandoned, the factor of
leadership and good coaching and effective supervision would help establish good government
apparatus and authoritative.
References
Alfred. 2001. Teknik Memimpin dan Pekerja, Jakarta, Akaseva Baru
Arikunto. 2002. Prosedur Penelitian Suatu Pendekatan Praktek, Jakarta, Rineka Cipta
Gouzaly. 2001. Manajemen Sumber Daya Manusia, Jakarta, Gunung Agung
Handoko. 2001. Manajemen Personalia dan Sumber Daya Manusia, Yogyakarta, BPFE
Huberman. 2004. Analisis Data Penelitian Kualitatif, Jakarta, UI Press
Indriantoro. 2002. Prosedur Penelitian, Jakarta, Rineka Cipta
Murdick. 2001. Manajemen Personalia Kepegawaian, Bandung, Tiga Serangkai
Malayu. 2001. Manajemen Sumber Daya Manusia, Jakarta, Bumi Aksara
Manila. 2000. Manajemen Pemerintah Dalam Negeri, Jakarta, Gramedia Pustaka Utama
Musanef. 2001. Manajemen Kepegawaian di Indonesia, Jakarta, Gunung Agung
Soedjono. 2000. Disiplin Kiat Menuju Sukses, Bandung, Pradnya Paramita
Stephen. 2001. Fungsi Administrasi Negara, Jakarta, Gramedia Pustaka Utama
Simamora. 2005. Manajemen Sumber Daya Manusia, Yogyakarta, STIE YKPN
Soewarno. 2000. Administrasi Pemerintahan Dalam Pembangunan Nasional, Jakarta, Gunung Agung
Siagian. 2000. Organisasi Kepemimpinan dan Prilaku Organisasi, Jakarta, Gunung Agung
Sugiyono, 2005, Memahami Penelitian Kualitatif. Bandung, Alfabeta
Suradji. 2006. Manajemen Kepegawaian Negara, (Modul Diklat Prajabatan Golongan I dan II), Jakarta,
Lembaga Administrasi Negara
Taylor. 2002. Konsep Manajemen Indonesia, Jakarta, PPM
Winardi. 2001. Manajemen Pelayanan Umum di Indonesia, Jakarta, Bumi Aksara
Widjaja. 2006. Administraasi Kepegawaian, Jakarta, Rajawali

Proceedings of The 1th Almuslim International Conference on Science, Technology and Society (AICSTS) 2015
November 7-8, 2015, Bireuen, Indonesia
296
The Role of Gross Regional Domestic Product (GDP) against
Poverty in Bireuen
Hakim Mutaqim
Economic Department, Faculty of Economic Almuslim University, Aceh, Indonesia
Corresponding Author: [email protected]
Abstract
The purpose of this study is to know the role of the Gross Domestic Product (GDP)
Against Poverty in Bireuen. This type of research is qualitative research with descriptive
analysis, in obtaining and interpreting the data is done with the aim to create a picture of
a situation objectively. Subjects in this study is the Central Statistics Agency (BPS)
Bireuen. While the object of this research is data Gross Regional Domestic Product
(GDP) and Poverty released by the Central Statistics Agency (BPS) Bireuen. The results
obtained acceptance Gross Regional Domestic Product (GDP) and poverty in Bireuen
has a unidirectional relationship and in accordance with the expectations of the
government. This means that the increase in revenues Gross Regional Domestic Product
(GDP) also have an impact on the decrease in the number of poor people in Bireuen.
During this period spending and government funding Bireuen not only from the Gross
Regional Domestic Product (GDP) but also supported by various foreign aid. From 2010
to 2012 the increase in Gross Domestic Product (GDP) has no efficacy in reducing the
number of poor people due to economic growth is not focused on the development of the
leading sectors were able to improve the regional economy.
Keywords: Gross Regional Domestic Product (GDP) and Poverty
Introduction
Poverty is one issue that is always faced by humans, and the implications of the problem can involve all
aspects of human life, although often not recognized as a problem by the human presence is concerned.
For residents who are poor, poverty is something real in their daily lives, because they feel and live for
themselves how they live in poverty. Poverty in Bireuen district can be considered as a standard of living
lower level, namely the existence of a level of material deprivation in a number or group of people
compared to the general standard of living and prevailing in the society concerned.
Based on the table above can be explained that the level of poverty in Bireuen from 2003 until 2012
always shows the rate of decline, in this case shows that the various programs planned by the

Proceedings of The 1th Almuslim International Conference on Science, Technology and Society (AICSTS) 2015
November 7-8, 2015, Bireuen, Indonesia
297
government to tackle the problem of poverty has to be taken seriously and appropriate to the intended
target. In 2007 the level of poverty in the population Bireuen by 6.44% compared with 2006 and a few
years earlier. A decrease in the level of poverty in Bireuen enormous during the last ten years based on
data from the central body of statistics that occurred in 2008 that the rate of decline reached 14.39%.
Decreasing the level of poverty is caused by increase of economic growth rate from year to year which
was marked by the government's ability to boost growth Bireuen Domestic Gross Regional Product (GDP)
of the various sectors and the potential of the area.
Table 1. Bireuen Poverty Level in Years 2003-2012
No. Year Poverty Rate
(%)
Change
(%)
1 200 3 30.00 -
2 200 4 29.25 - 2.5
3 200 5 29.09 -0.55
4 20 06 29.05 -0.14
5 20 07 27.18 -6.44
6 20 08 23.27 -14.39
7 2009 21.65 -6.96
8 2010 19.51 -9.88
9 2011 19.06 -2.31
10 2012 18.21 -4.50
Source: BPS Bireuen (2013)
Table 2. Gross Regional Domestic Product (GRDP) Bireuen Current Market Prices of The Year 2003-
2012
No. Year Gross Regional Domestic Product (GDP /
USD)
Change
(%)
1 2003 2159048, 52 -
2 2004 2,533,520.87 17.34
3 2005 2,902,494.36 14.56
4 2006 3321234, 49 14.43
5 2007 3,670,898.27 10.53
6 2008 4,166,036.13 13.49
7 2009 5,240,775.84 25.80
8 2010 6,028,941.68 15.04
9 2011 6608. 346.14 9.61
10 2012 7,158,482.96 8.32
Source: BPS (2013)
Proceedings of The 1th Almuslim International Conference on Science, Technology and Society (AICSTS) 2015
November 7-8, 2015, Bireuen, Indonesia
298
Based on the table above can be explained that the amount of Gross Domestic Product (GDP) in Bireuen
from 2003 until 2012 always increase, it is due to growth and increased contribution from each business
field that could encourage the growth of regional income and rate economic growth. Increased Gross
Regional Domestic Product (GDP) in Bireuen each year on average to grow above 5%. In 2009 there was
an increase Gross Regional Domestic Product (GDP) in Bireuen very high, reaching 25.80%. The growth
is due to the growth of anincreasingly productive agricultural sector with the highest contribution to the
Gross Regional Domestic Product. The amount of the contribution which comes from the agricultural
sector to the regional income, then the sector is considered to be the leading sectors (leading sector) in
the structure of the economy in Bireuen.
Theoretical Basis
Gross Regional Domestic Product (GRDP)
Gross Regional Domestic Product (GDP) is the total value of goods and services produced by factors of
production in an area well outside the region of production factors are calculated at the end of the period
or for a year without deducting the production of goods and services produced outside the region of
production factors. According Nacharowi (2005) Gross Domestic Product (GDP) are all goods and
services as a result of the economic activity that operates in the region domestic, regardless of whether
the factors of production derived from or owned by a resident of the area who is a domestic product of the
region concerned. Revenue arising because of the production activity is domestic income. Meanwhile,
according to Usman (2005) Gross Domestic Product (GDP) is a domestic product plus income received
from outside the area which is reduced by the revenue paid out of the area.
Furthermore, according to Hardius (2005) fact indicates that most of the factors of production used in the
production activity in a region came from other regions or abroad, otherwise factors of production are
owned by residents of the area can participate in the process of production in other regions or abroad.
Further Hardius (2005) explained that there are several ways to obtain domestically Gross Regional
Product (GDP) is as follows:
1. Gross Regional Domestic Product (GDP) at market prices
Figures regional gross domestic product at market prices can be obtained by summing the gross
value added arising from all economic sectors in the region, which arise after going through a process
of production or the production value reduced by the costs.
2. Net Regional Domestic Product (PDRN) Based On Market Prices
Net regional domestic product (PDRN) on the basis of the market price less depreciation regional will
obtain net domestic product at market prices. Depreciation in question is the value of capital goods
shrinkage that occurs during such goods participates in the production process.
3. Net Regional Domestic Product (PDRN) Based On Price Factor
The difference between the concepts of factor price to the market price is due to indirect taxes levied
by the government and subsidies granted by the GOI to the production unit.
Proceedings of The 1th Almuslim International Conference on Science, Technology and Society (AICSTS) 2015
November 7-8, 2015, Bireuen, Indonesia
299
Poverty
Chriswardani (2005) poverty is divided into four forms, namely:
a. Absolute poverty, a condition where a person has income below the poverty line or are not
sufficient to meet the needs of food, clothing, shelter, health, housing, and education needed to
be able to live and work.
b. Relative poverty, poor condition because of the influence of development policies that have not
reached all of society, resulting in inequality in income.
c. Cultural poverty, referring to the question of the attitude of a person or society caused by cultural
factors, such as unwilling trying to improve the standard of living, lazy, spendthrift, not creative
even though no outside assistance.
d. Structural poverty, poor situation caused by lack of access to resources that occur in a social
system and the socio-political culture that does not support the liberation of poverty, but often
lead to the proliferation of poverty.
Based on the above opinion can be concluded that poverty can be measured from the income below the
poverty line or are not sufficient to meet the needs of food, clothing, shelter, health, housing, and
education. Poverty also refers to the problems caused by the attitude of a person or society caused by
cultural factors, such as unwilling trying to improve the standard of living, lazy, spendthrift, not creative
even though no outside assistance.
Poverty can also be divided into two types:
a. Poverty naturally, related to the scarcity of natural resources and public infrastructure, as well as
the state of uninhabited land.
b. Artificial poverty, more due to the modernization or development system that makes people not
get control of the resources, facilities, and the existing economic facilities evenly.
According Nasikun in Chriswardani (2005), multiple sources and the causes of poverty, namely:
1) Policy induces processes, namely the processes of poverty conserved, reproduced through
the implementation of a policy, such as anti-poverty policies, but instead preserve relitanya.
2) Socio-economic dualism, the former colonies experience poverty because poal colonial
production, the farmers have become marginal because of the fertile lands controlled by
large-scale farmers and export oriented.
3) Population growth, perspective based on the theory of Malthus, that population growth as
the increase geometrically while food like deraet count.
4) Resaurces management and the environment, is an element of mismanagement of natural
resources and the environment, such as farm management slash origin will reduce
productivity.
5) Natural cycles and processes, poverty occurs due to natural cycles. Eg live dilahan critical,
where the land if it rains flooding will occur, but if the dry season water shortage, thus not
allowing maximum productivity and continuously.

Proceedings of The 1th Almuslim International Conference on Science, Technology and Society (AICSTS) 2015
November 7-8, 2015, Bireuen, Indonesia
300
6) The marginalization of woman, the marginalization of women because it is still regarded as
second-class group, so access and respect the work that is lower than men.
7) Cultural and ethnic factors, the operation of cultural and ethnic factors that maintain
poverty. For example in consumptive pattern pda farmers and fishermen when panenj
highways, as well as customs consumptive current or religious ceremonies.
8) Exploatif in t e rmediation, where helper be mugger, such as moneylenders.
9) In t e rnal political fragmentation and civil stratfe, a policy that is applied to an area of
strong political fragmentation, can be a cause of poverty.
10) Intern ational processe, the workings of the international system (colonialism and
capitalism) makes a lot of countries to be poor.
Poverty size
According Sayogyo (2008) the poverty rate based rupiah amount of household expenditure that is
equivalent to the number of kilograms of rice consumption per person per year and divided rural and
urban areas (Chriswardani, 2005). Furthermore, according to Chriswardani (2005) the size of the poverty
population of rural areas can be categorized as follows:
a. Poor, if family expenditure is smaller than 320 kg of rice per person per year rate.
b. Poor once, when family expenditure is smaller than 240 kg of rice per person per year rate.
c. The poorest, if family expenditure is smaller than the exchange rate of 180 kg of rice per person
per year.
The urban area poverty measure can be categorized as follows:
a. Poor, if family expenditure is smaller than 480 kg of the exchange rate of rice per person per
year.
b. Poor once: when the family expenses less than 380 kg of the exchange rate of rice per person
per year.
c. The poorest, if family expenditure is smaller than 270 kg of the exchange rate of rice per person
per year.
Research Methods
This type of research is qualitative research with descriptive analysis, in obtaining and interpreting the
data is done with the aim to create a picture of a situation objectively (Arikunto, 2008).
Discussion
The main requirement for the creation of a permanent reduction in poverty is economic growth. Economic
growth is not enough to reduce poverty but are usually economic growth is something that is needed,
nevertheless, rapid economic growth will be meaningful for the poor if not accompanied by a sharp
decline in the distribution. One of the root causes of poverty in Bireuen is the high disparity between
regions due to the uneven distribution of income, so that the gap between the rich and the poor widened.
Various strategies that have been taken by the government to alleviate poverty does deserve a serious
Proceedings of The 1th Almuslim International Conference on Science, Technology and Society (AICSTS) 2015
November 7-8, 2015, Bireuen, Indonesia
301
response, such as triggering the growth of national economy and regions, providing credit facilities for
coating is poor, build rural infrastructure, in this regard, the development of agriculture, regional
development / regional protectionism Instruction Villages (IDT) and others. The causes of poverty in
terms of the economy is the result of low quality Source Human Resources (HR). The low quality of
Human Resources (HR) is caused by lack of education, quality of Human Resources (HR) means low
productivity is also low, which in turn wages are too low. On the other hand the poverty condition can be
caused by a low level of health. Health and nutrition level low causing low physical endurance, intellect
and initiative.
Poverty reduction efforts undertaken by the government Bireuen until now still not produce satisfactory
results. Many of the residents Bireuen both in villages and cities are still living under poverty. The failure
stems from the way of understanding and poverty reduction is always interpreted as a purely economic
conditions. On the other hand, also the notion that poverty is sourced from a particular culture that
resulted to be not working. As a result of that view, poverty reduction or empowerment bottom layer was
limited to efforts to improve economic conditions (increased revenue) and cultural changes through
vocational training projects for the poor in order to increase productivity. The issue of poverty is
multidimensional, then mitigation strategies should not merely economic nature so that when the
economy needs is reached as if the poverty reduction project was also completed. This means
submerging the problems of poverty are not economic dimension as structural or political poverty. When
politics fails, the formulation of development only reflects the personal or group interests, but not to the
poor segments of society.
In addressing the phenomenon of poverty in Bireuen, the government sought to reduce the population's
inability to meet the needs of life are considered to meet the standard requirements. The way it can be
reached by improving productivity conditions Human Resources (HR) in the various sectors that are
considered able to provide revenue for the whole society, so that the cycle of poverty can be overcome.
One of the policies that can be taken to reduce the amount of poverty is to improve productivity and
increase the production of agriculture, because agriculture is the main sector that is able to absorb more
labor than other sectors. From this it can create equitable agricultural sector for the whole society,
especially rural communities that concerns the government to overcome the problem of poverty so that
poverty be decreased. In an effort to control poverty, government of Bireuen always strive to maintain a
stable macro-economic conditions, so as to support economic growth in the region. Implementation of
these efforts are aimed at creating well-being and prosperity of society which is evenly through the
development process. Control of poverty in a country having relations with the government's policy in
managing and allocating budgets. Both in managing routine expenditure budget and the Development
spending budget. Another policy that can be taken by the government of a country or region is to allocate
resource expenditures on the development of the productive economic sectors, such as government
spending to achieve growth in the agricultural sector that is able to create a higher contribution to
Proceedings of The 1th Almuslim International Conference on Science, Technology and Society (AICSTS) 2015
November 7-8, 2015, Bireuen, Indonesia
302
economic growth. The government policy to reduce the number of poor budgeting and allocation of
development expenditure by orders efficiently.
Population poverty rate in a region affects the development expenditure in the country or region. The
higher the ratio the number of poor people in a country or region, the lower is also spending on
development activities. It is in because the government tends to be higher allocate revenue sources and
revenue separately tackling the problem of poverty. Poverty reduction is one of them is through the
Human Development Index (HDI). Conversely, if poverty population in an area is low, the government
expenditure for the construction sector can describe the mobilization towards a surplus. This is because
the government has a great opportunity weeks to finance the development of the productive sectors of
the economy and realize the high economic growth. Number of residents in an area of poverty have
relevance and relationship to the development expenditure in an area. Government in addressing poverty
Bireuen always implement and pursue areas of high economic growth through acceptance of Gross
Domestic Product (GDP) for creating the prosperity of society by increasing development expenditure in
various sectors. The steps can be taken by governments Bireuen namely by allocating resources
development spending on productive economic sectors.
Conclusion
As for the conclusion of the authors in this study are as follows:
1. From 2010 to 2012 the increase in Gross Domestic Product (GDP) has no efficacy in reducing
the number of poor people due to economic growth is not focused on the development of the
leading sectors were able to improve the regional economy.
2. Measures to be undertaken Bireuen government in poverty reduction is the empowerment of
communities is a prerequisite for efforts to reduce poverty and realize the formulation of
development by involving poor people in full.
References
Arikunto. Suharsimi. 2008. Education and Social Research. Bandung: Earth Literacy
The Central Statistics Agency (BPS) Bireuen
Chriswardani. Suryawati. 2005. The theory of poverty. Jakarta: Erland
Hardius. 2005. "Popular And Practical Approach To Economic Analysis Econometrics and Finance,
Jakarta. FEUI.
Nachrowi. DN. 2005. "Popular And Practical Approach To Economic Analysis Econometrics and Finance,
Jakarta. FEUI.
Sayogyo. 2008. Economic Development Second Edition. Jakarta: BPFE
Usman. 2005. Theory of Economic Growth. Jakarta: Erland

Proceedings of The 1th Almuslim International Conference on Science, Technology and Society (AICSTS) 2015
November 7-8, 2015, Bireuen, Indonesia
303
Ginie Ratio Analysis
1Ibrahim, 2T. M. Nur
1Head of planning and area development Bireuen district - aceh
2Lecturer of study program agribusiness in agricultural faculty almuslim university
Abstract
District Bireuen is one of the district parts in aceh province. This district formed in the
1999 based on the act no. 48 1999 after it was segregated north aceh district. Until
2014, it has 609 villages, 75 kemukiman and 17 subdistricts, with area 1.796,32 km or
about 179.632 ha is located on 4°54’- 5°21’ LU and 96°20’-97°21’ BT. The total of the
area, 55% of them was farmland, 35% becoming an area of forested country and 5%
used to other. While the use of for settlement at least only about 3 percent of the total
area. A large number of areas in the Bireuen having topography plains area and rippled
particularly in coastal areas which includes 428 north village. While in the south,
topography hilly with a slope between 15 % -30 %. In 2013, the population of 413.817
people, more than 65.3 % are age productiv population. Nevertheless, when viewed
structure of 0-14 year, population in the future will has decreased. While economic
growth aceh tended to although was down several years earlier. Economic growth has
fallen to the lowest level in 2010 of 4.93 %. After that, economic growth Bireuen district
continue to increase until reached 5.65 % in 2012 or a bit higher than 2008. Within
2007-2012, structure the economy of Bireuen district has significant change. In 2007,
the agricultural sector has the biggest contribution to reach 36.07 % of the regional
production
Keywords: Genie ratio, income, distribution and Bireuen district
Introduction
The income distribution is one of the poverty needs to be viewed because the income distribution is size
poverty relative. The distribution of income individual size income is the most commonly used. The
problem generally faced by developing countries including Indonesia is economic gap or inequality in
distribution between community groups high-income and community groups had low incomes as well as
the poverty level or the number of people in poverty line.
Bireuen district is one of areas in Aceh province having areas very large potential areas in, natural
resources, and different economic activities, and have diverse territory topology considerable. This is

Proceedings of The 1th Almuslim International Conference on Science, Technology and Society (AICSTS) 2015
November 7-8, 2015, Bireuen, Indonesia
304
created the difference speed development in each subdistrict.To assess the extent to which the gap
distribution the income of the subdistrict in Bireuen district, the indicators used is Ginie Index and World
Bank criteria. The size of the world bank describe, income villagers based on income group that is 40 %
the low income, 40 % middle income and 20 % the high income. Big or small the income received is very
affect to the life patterns of the community, these matters are very felt by the majority of the population in
Bireuen district which with different things are income levels will be different also the number of
expenditure issued. Finally it would affect the amount of income to each community pattern appropriate
livelihoods classification.
On the grounds that idea was to meet indicators and income inequality class population, the gap well
seen the disparities corporate income and disparities between regions, the government district Bireuen
needs to implement / activities “Analysis of Gini Rasio Bireuen District” in 2014. Indicators will also footing
in considering the gap the income distribution be considered in development strategy and prioritize
poverty reduction policies, and the extent of the level lameness taking place within the households the
village community in Bireuen district.
Research Method
Population and Sample
The population of research it is a whole of people who inhabit administrative territory Bireuen district. Not
included of research is a portion of the people permanently non-resident of Bireuen district, including
those who works in Bireuen district, but inhabits district is in Bireuen districts.
Samples of this research taken with purposive multi-stage sampling method, that is sample chosen were
sample meet a response from purpose and intent research. Therefore, a population of the not included in
the work force (under the age of 15 years) not chosen in the sample. Because Bireuen district having
many district, and professions the have diversity unique, it also will be chosen in a multistage, namely
selected conditions are according to their houses and the (in residence) and business sector
respondents.
The sample of representation population is the number of sample used that must be taken deep an
adequate quantity. For ascertaining the amounts of these samples were enough, so this research takes a
sample with the level of errors in sample (the margin of sampling error small, namely 7.5 percent). The
sample of the taken with the margin of sampling error of 7.5 percent will be determined by using Slovin
formula and gives 207 samples.
Data Analysis
Economists generally distinguish two basic sizes the income distribution used for the purpose of analysis
(Todaro and Smith, 2006). Two sizes that is generally used in analysis distribution the gain is size
distribution of income and functional or factor share distribution of income. Size distribution of income is
directly counting the number of the income received by each individual or household. Based on this size ,
Proceedings of The 1th Almuslim International Conference on Science, Technology and Society (AICSTS) 2015
November 7-8, 2015, Bireuen, Indonesia
305
a way of getting income problematic , what is more attention of this size is how much income someone ,
regardless of get the sources. In addition, the source of income (village or city) and sector or sectors that
is a source of income (agriculture, manufacturing, trade, services) also ignored. While functional or factor
share distribution of income is focusing on the part of the total national income received by each
production factor (the ground, labor, and capital). The theory of national income distribution is essentially
accepted the percentage of income labor overall, not as business units or production factor that separate
individually, and compare it with the percentage of total income dispensed in the form of rent, interest,
and profit (each is income from the ground, capital money, and capital physical). Although particular
individuals maybe just received the results from every the resources, but it is not an attention from
analysis functional this approach.
Discussion
Profile and Characteristic Respondent
Permanen Job Type
The respondents have various permanent jobs. Most respondents work as farmers. About 88
respondents or 42.5 percent work as farmers. Others work as self-employed (32 people or 15.5%), as
civil servant/Troops/Police (16 people or 7.7%), private employees (13 people or 6.3%) and fisherman (7
people or 3.4%). The rest work besides mentioned (51 people or 24.6%).
From 51 the person, 10 people or 4.83% work as driver, 8 people or 3.87 % work as traders, 6 people or
2.90% work as carpenter, and 5 people or 2.42% work as workers. The rest work diverse, start of the,
teachers them, tailor and so on.
Fixed income and a side of family heads
The respondent fixed income has an income were quite diverse. But most respondents own earnings
between Rp.1 million to Rp. 2 million that is about 65 people or 31.40%. A total of 54 people or 26.09%
had earnings between Rp. 2 million – Rp. 3 million and about 37 people or 17.87% had income and Rp.1
million. There are 24 people respondents or 11.59% having fixed income greater than Rp. 5 million. Seen
from a side income, the majority of respondents had a side to Rp.1 million. Some 147 respondents or
71.01% had some the additional contributions. Only three people respondents or 1.45% that has an
additional greater than Rp. 4 million.
Expenditure primary, secondary, and tertiary
In terms of from expenditure primary, about two thirds of respondents own expenditure primary to Rp.1
million. As many as 138 person or 66.67% of respondents spending money to Rp.1 million every month to
the expenditure primary. About 56 people or 27.05% had primary expenditure of around Rp.1 million to
Rp. 2 million. Only one respondent or 0.48% had primary expenditure larger than Rp. 4 million. The
secondary expenditure not much difference with expenditure primary. About 85 people or 41.06% had

Proceedings of The 1th Almuslim International Conference on Science, Technology and Society (AICSTS) 2015
November 7-8, 2015, Bireuen, Indonesia
306
secondary expenditure to Rp.1 million. About 75 people or 36.23% had expenditure between Rp.1 million
to Rp. 2 million, and there are 11 people or 5.31% had the dispensing larger than Rp. 4 million.
Most respondents have expenditure tertiary Rp.1 million. Some 165 respondents or 79.71% have
expenditure tertiary. A total of 29 respondents or 14.01 percent have expenditure tertiary between Rp.1
million to Rp. 2 million, and 9 respondents or 4.35% have expenditure tertiary between Rp. 2 million to
Rp.3 million. There only 2 respondents or 0.97% who have expenditure tertiary between Rp. 3 million to
Rp. 4 million and larger than Rp. 4 million.
The number of respondents by the type of fixed income and job
There are certain kinds of work remain spent by district population Bireuen in economic activity, among
them are; civil servants, national army and police, private employees, self-employed, farmers, fishermen,
and others. Based on some kind of regular work, then population Bireuen district allocate that people who
had income levels Rp.1,000,000 - Rp. 2,000,000 is the most of the Bireuen district, which is 31.40%, and
permanent job as farmers the highest percentage is compared with another jobs, which is 88 people from
270 respondents or 43%.
The highest income (above Rp. 5,000,000) as much as 11.59% are the people that have permanent job
as a civil servant/Indonesian military and police as many as three people were, self-employed 10 people,
farmers 3 people, and other 8 people. While the people that the lowest income (is below Rp.1,000,000)
as much as 37 people or 17.87%.
People with a regular job as a civil servant / Indonesian military and police as many as 10 people who
had income levels Rp. 2,000,000 - Rp. 3,000,000, no one had income levels below Rp.1,000,000 and Rp.
4,000,000 - Rp. 5,000,000 .What this demonstrates that people in Bireuen 8% who also work as a civil
servant / Indonesian military and police in category III. About 6% of respondents have permanent job as
an employee private, with earnings highest worth equal to civil servants / army / police, Rp. 2,000,001 -
Rp. 3,000,000, but no one had income levels below Rp.1,000,000 and above Rp. 5,000,000, this figure
explained that district of Bireuen population who have permanent job as an employee private not
employees that possess the highest position in the company, or it can be said that the company / private
industry are not / industry companies have large revenue and contributes big for income of Bireuen
district.
Entrepreneurs are regular work of the best, because 10 of 24 people who had income levels highest
(above Rp. 5,000,000) derived from entrepreneurs, this suggests that entrepreneurs is the best choice for
Bireuen district in the economy. Farmers who has fixed work the most spent by the only 3 of 88 people
who had income above Rp. 5,000,000 and 40 farmers income Rp.1,000,000 - Rp. 2,000,000, the rate
was the highest income can be obtained farmers, but in category income highest (above Rp. 5,000,000)
only 3 people farmers can find it. This illustrates that farmers in Bireuen district greater use of a traditional
manner or producing lower than using a technique that adopt technology to the production of high.
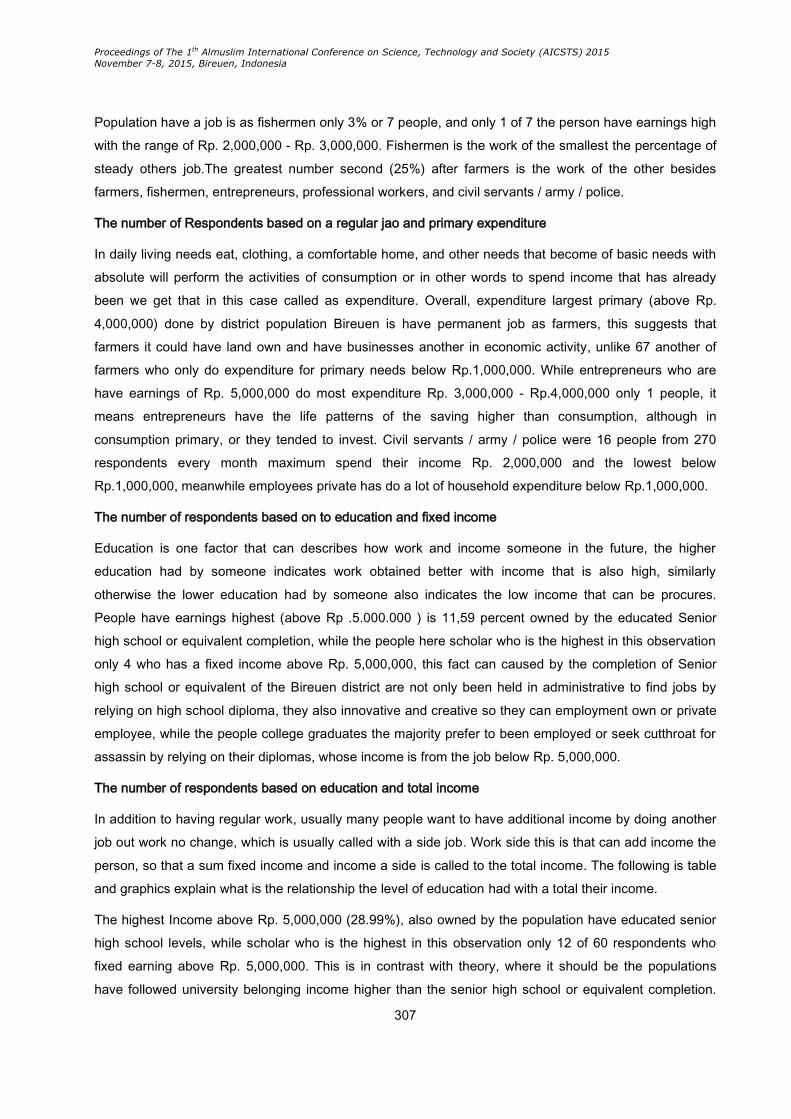
Proceedings of The 1th Almuslim International Conference on Science, Technology and Society (AICSTS) 2015
November 7-8, 2015, Bireuen, Indonesia
307
Population have a job is as fishermen only 3% or 7 people, and only 1 of 7 the person have earnings high
with the range of Rp. 2,000,000 - Rp. 3,000,000. Fishermen is the work of the smallest the percentage of
steady others job.The greatest number second (25%) after farmers is the work of the other besides
farmers, fishermen, entrepreneurs, professional workers, and civil servants / army / police.
The number of Respondents based on a regular jao and primary expenditure
In daily living needs eat, clothing, a comfortable home, and other needs that become of basic needs with
absolute will perform the activities of consumption or in other words to spend income that has already
been we get that in this case called as expenditure. Overall, expenditure largest primary (above Rp.
4,000,000) done by district population Bireuen is have permanent job as farmers, this suggests that
farmers it could have land own and have businesses another in economic activity, unlike 67 another of
farmers who only do expenditure for primary needs below Rp.1,000,000. While entrepreneurs who are
have earnings of Rp. 5,000,000 do most expenditure Rp. 3,000,000 - Rp.4,000,000 only 1 people, it
means entrepreneurs have the life patterns of the saving higher than consumption, although in
consumption primary, or they tended to invest. Civil servants / army / police were 16 people from 270
respondents every month maximum spend their income Rp. 2,000,000 and the lowest below
Rp.1,000,000, meanwhile employees private has do a lot of household expenditure below Rp.1,000,000.
The number of respondents based on to education and fixed income
Education is one factor that can describes how work and income someone in the future, the higher
education had by someone indicates work obtained better with income that is also high, similarly
otherwise the lower education had by someone also indicates the low income that can be procures.
People have earnings highest (above Rp .5.000.000 ) is 11,59 percent owned by the educated Senior
high school or equivalent completion, while the people here scholar who is the highest in this observation
only 4 who has a fixed income above Rp. 5,000,000, this fact can caused by the completion of Senior
high school or equivalent of the Bireuen district are not only been held in administrative to find jobs by
relying on high school diploma, they also innovative and creative so they can employment own or private
employee, while the people college graduates the majority prefer to been employed or seek cutthroat for
assassin by relying on their diplomas, whose income is from the job below Rp. 5,000,000.
The number of respondents based on education and total income
In addition to having regular work, usually many people want to have additional income by doing another
job out work no change, which is usually called with a side job. Work side this is that can add income the
person, so that a sum fixed income and income a side is called to the total income. The following is table
and graphics explain what is the relationship the level of education had with a total their income.
The highest Income above Rp. 5,000,000 (28.99%), also owned by the population have educated senior
high school levels, while scholar who is the highest in this observation only 12 of 60 respondents who
fixed earning above Rp. 5,000,000. This is in contrast with theory, where it should be the populations
have followed university belonging income higher than the senior high school or equivalent completion.

Proceedings of The 1th Almuslim International Conference on Science, Technology and Society (AICSTS) 2015
November 7-8, 2015, Bireuen, Indonesia
308
However, the completion of senior high school or equivalent have businesses stronger in improve the
economic situation and welfare to do some side business or invest which could reach income of higher
income can be obtained by the college graduates, where although the college graduates seen has
increased the number in terms of the total income, but there are still only satisfied and receives income.
In the lowest income (below Rp.1,000,000), the theory prove that there were no people have finished
education on senior high school levels to scholar who have earnings less than Rp.1,000,000, only 2.42
income per cent of people are under Rp.1,000,000 derived from primary and junior high school
graduates. This could happen since residents who have education in senior science that they can be able
to reflect systematic and innovative than people have education under senior high school or equivalent.
The number of respondents based on education and regular works
The level of education is one of the requirements for the recruitment of administration civil servant and
workers in every agency and companies .The higher the level of education that is owned by someone will
support due to increasing the structure of a tenure by which can be obtained, likewise on the contrary, the
low level of education that someone possess will minimize the opportunity is in the granting of the
structure of a high office in the his job.
Population in Bireuen district according to 20 of 270 respondents; that people have been education and
regular work which may be obtained by university graduate, and from 20 people the scholar, no work as
fishermen, 6 people working as a civil servant / army / police, two people as an employee private, six
people as entrepreneurs, four people farmers, and two are employed in other sectors, this rate shows a
balance between scholar who worked as a civil servant / army / police and entrepreneurs, or it can be
said that eight people have university degrees prefer jobs than create jobs.
Farmers are regular work most numerous of the primary and equivalent completion, namely 25 of 39
respondents, 3 employees private, 2 people entrepreneurs, 3 people fishermen, and 6 are employed in
other sectors. This data shows that only 3 people are primary and equivalent to compete in search of
work, but only 2 people are capable of trying to create jobs own.
For people who graduates junior high school from 24 to 39 equivalent of respondents also worked as
farmers, only 4 people who private employee, 2 people fishermen, and another 6 people. There are 10
respondents in Bireuen district work as a civil servant / army / police, where provisions of civil servants
administration / army / police until the end of 2003 still allow applicants wear it senior high school or
equivalent, farmers and work was the most done by the completion of high school or equivalent, which is
34 respondents. A few people educate only up to a diploma, with the allocation of regular work; 1 person
the civil service / army / police, 2 people entrepreneurs, 1 a farmer , and 5 people working in other
sectors.
Proceedings of The 1th Almuslim International Conference on Science, Technology and Society (AICSTS) 2015
November 7-8, 2015, Bireuen, Indonesia
309
The number of respondents based on regular works, Education, and Income
There are third opinions, consist of; permanent job, education, and income mutually related to each other,
with the high level of education that completion by someone will enlarge opportunities to get work remain
good and income also high.
a. Analysis of the gap income
The results of the disparity income in ratio for with the as described in the previous part, the ratio obtained
for to Bireuen districts is 0.4485 with monthly average income Rp. 5,214,581. On developed and used by
BPS (2013), then the disparities described as being the disparities. From the explained, we can conclude
that not with the income inequality at the district level were standings, the district government can do
some effort to reduce income levels by improving the earnings in community groups very low income and
low. At the sub-district level, the gaps in Bireuen district are vary according to sub-district. Most sub
district,12 sub-districts from 17 sub districts to have a low the gap, and 4 of sub districts from has a level
the gap and, and only 1 sub-district, namely Jeumpa sub-district has the highest gap.
To overcome the disparities high incomes in Jeumpa sub-district, the government of Bireuen disrict can
take policies to increase level of income especially income group the lowest and low, that the gap level of
income in Jeumpa subdistrict can improves from the high to low gap. To overcome the disparities was in
4 sub-district (Jeunieb sub-district, Kota Juang sub-district, and Peusangan sub-district) term, intervention
could also be done through improvements to level the income of who had income the lowest disparities.
When analyzed deeper, there are indications that must be alert in district of Juli, Samalanga, Gandapura,
prosperous, Peulimbang, Peudada, South Peusangan, Peusangan Siblah Krueng, especially Simpang
Mamplam not standing the low income inequality, but average income respondents smaller than average
income in the district. This indicates distribution income not see, but the majority of the very low income.
In simple language, “disparities low income for the majority of similarity wih poor community”.Similar
phenomenon can also observed in Jjeunieb and Jangka was having disparities. So although the
disparities low or being, decision makers in Bireuen district need to also noticed level the average income
so that the policy taken is to policy to raise its level the average income evenly that level of income
remained high but not gap.
b. Analysis of Gap Expenditure
In terms of the spending every month, the disparities spending at district is 0.3890, or it can be concluded
that disparities spending a low level with average spending Rp. 3,435,423. This indicates that in
expenditure, disparities expenditure in Bireuen is good or not seem.
At the sub-district level, the majority (14 from 17 subdistrict in Bireuen) having a level the gap low
expenditure. The rest three sub-districts, namely; Kota Juang, Jangka and Jeumpa have the gap
expenditure. From 14 sub-district with the gap level of expenditure of this low, 10 of them were have the
average level of expenditure lower level of district expenditure. This indicates that although the low gap,
Proceedings of The 1th Almuslim International Conference on Science, Technology and Society (AICSTS) 2015
November 7-8, 2015, Bireuen, Indonesia
310
level of expenditure is the community also the average monthly low. So, the disparities low expenditure
happened at the low expenditure. Thus, although the disparities found low, the average expenditure the
community is also low. The rest of four another sub-district, namely sub-district Pandrah, Kuta Blang,
Peudada and Peusangan, the disparities the average expenditure monthly low, but the average level of
expenditure the community in four districts relatively higher than the average expenditure district level.
This conditions relatively more ideal than conditions in 10 another sub-district.
If calculated based on the criteria the world bank, then criteria of disparities spending by using ratio have
been consistent for distribution public expenditure in Bireuen can be described as follows: average
spending 40 percent of poor is Rp.1,516,542 monthly, and average spending 40 percent of the population
second poorest was around Rp.3,111,706 monthly, while 20 percent the average richest issue
Rp.7,975,317 monthly.
The research results show that the average expenditure than 40% people with expenditure the lowest is
17.7%, and 40% people with the middle is 36.32% while 20% of the population at the expense of the
highest is of 45.98%. Thus, concluded that criteria the world bank (the percentage of expenditure 40% of
the population the poorest was 17%) and for ratio (0.3890), them consistent show the gap low
expenditure in Bireuen district.
Conclusion
1. Bireuen district is district in Aceh Province has the economic growth convince. All 5 years,
economy grew consistently and convince.
2. Actors contributor dominate the GDP was the agricultural sector, trade sectors, hotels and
restaurants. This shows that the economy in district of Bireuen no longer dominated by primary
sectors (agriculture) but was offset by secondary sectors (trade).
3. Despite has economic growth level conclusive and the poverty is still better than the average
Aceh Province, district of Bireuen is at number 10 the districts which have the level of poverty low
in Aceh, it was far below Banda Aceh has the lowest poverty in Aceh.
4. Seen from the income, the district has income average levels about Rp. 5.2 million with ratio
monthly for earnings of 0.4485 which means that the income gap in Bireuen district included in
the category of middle.
5. At the sub district level, in several sub-district in Bireuen, although ratio for showing the rate of
the gaps low, but the average income of the monthly also low. This means that the gaps low
occurs because most people income in several sub-district in Bireuen very low, so the level of
gap being low.
6. Looked from the expenditures, mean expenditures community in Bireuen district is Rp. 3.4 million
a month with for ratio an expenditure of about 0,3890 which means that the gap expenditure
community in Bireuen district is low .With use the criteria the world bank , category gap
expenditure in Bireuen is in category low.
Proceedings of The 1th Almuslim International Conference on Science, Technology and Society (AICSTS) 2015
November 7-8, 2015, Bireuen, Indonesia
311
References
Peraturan Daerah Propinsi Daerah Istimewa Aceh, Nomor 21 Tahun 2001, Tentang Susunan Organisasi
Dan Tata Kerja Dinas Pendapatan Propinsi Daerah Istimewa Aceh
Pramutoko B, M. Achmad. 2013. Ekonomi Bisnis Internasional, Jenggala Pustaka Utama – Surabaya,
ISBN.978 – 979 – 3613 – 39 – 0
Maindonald JH. 2001. Using R for Data Analysis and Graphics an Introduction. http://www.r.project.org.
NIST/SEMATECH e-Handbook of Statistical Methods, http://www.itl.nist.gov/div898/handbook/, [Januari
2008]
Sudjana. 1996. Metode Statistika. Tarsito, Bandung.
Tirta, IM.2005. Panduan Program Statistika R. Penerbit Universitas Jember
Tirta IM.2007. R.GUI: Mendesain Paket Analisis dan Media Pembelajaran Statistika. Penerbit Universitas
Jember
Gresti, A. 2002. An Introduction to Categorical Data Analysis, John Wiley and Sons, New York.
Fahrmeir, L. and Tutz, G. 1994. Multivariate Statistical Modelling Based on eneralized Linier Models,
John Wiley and Sons, New York.
Gunawan, B.T. 2009. Analisis Longitudinal Diskrit Dengan Respon Binom Menggunakan
Generalized Linear Mixed Model (GLMMs) (Studi kasus pada RSI Unisma), Skripsi, Universitas
Brawijaya, Malang.
Hedeker, D. and Gibbons, R.D. 2006. Longitudinal Data Analysis, John Wiley and Sons, New York.
Hosmer, D.W. and Lemeshow, S. 2000. Applied Logistic Regression, John Wiley and Sons, New York.
Kleinbaum, D.G. and Klein, M. 2010. Logistic Regression A Self- Learning Text 3 Editions, Springer, New
York.
Twisk, J. 2003. Applied Longitudinal Data Analysis for Epidemilogy, Cambridge University Press, New
York.
Proceedings of The 1th Almuslim International Conference on Science, Technology and Society (AICSTS) 2015
November 7-8, 2015, Bireuen, Indonesia
312
The Application of Criminal Sanctions againts the Perpetrators of
the Domestic Violence Crime
H. A. Lawali Hasibuan
Faculty of Law, University of Medan Area
Corresponding Author:[email protected]
Abstract
The law was created to protect the public interest. One of the prevailing norms in the
society, the rule of law must be fortified by firm sanctions for the perpetrators of
offenders. The law must be enforced, law enforcement can only be done in the form of
application of the law, but can also be carried creation of law. Country through law
enforcement and in particular the application of sanctions for the perpetrators of the
crime of domestic violence, is still far from desirable, because of the many cases, the
sentences given to the perpetrators of the crime of domestic violence, is still in a
minimum standard. Such the sentences, has not spawned a deterrent effect for
offenders and also for the community.
Key Words: Criminal Sanction, Crime, Domestic Violence.
Introduction
Increase cases of domestic violence which makes unrest in society, as in the case Mulberry area that
researchers take as a material to be studied. The law was created to protect the public interest. One of
the prevailing norms in the society, the rule of law must be fortified by firm sanctions for the perpetrators
of offenders. The law must be enforces, law enforcement can only be done in the form of application of
the law, but can also be carried creation of law.
Specialized in the crime of domestic violence, the law enforcement that may be made to the perpetrators,
is the application of Law No. 23 of 2004 on the elimination of domestic violence. The rule of law relating to
the crime of domestic violence, was enacted on 22 September 2004, and found to apply to everyone,
without exception.
The consideration of the issuance of Law No. 23 of 2004 are:
a. That every citizen is entitled to feel safe and free and all forms of violence in accordance with the
philosophy of Pancasila and the laws of the Republic of Indonesia in 1945
b. That all forms of domestic violence, is a violation of human rights and crimes against human
dignity and the forms of discrimination that should be removed.
Proceedings of The 1th Almuslim International Conference on Science, Technology and Society (AICSTS) 2015
November 7-8, 2015, Bireuen, Indonesia
313
c. That victims of domestic violence who are mostly women, should get protection from the state or
community in order to avoid violence, torture or degrading treatment and human dignity.
d. That in fact a case of domestic violence prevalent, while the legal system in Indonesia has not
guaranteed the protection of victims of domestic violence.
Based on the above considerations, it is seen that Indonesian law before the Law No. 23 of 2004 on the
elimination of domestic violence. Weakness owned by the Criminal Code in resolving the cases of
domestic violence, people's expectations that with the Law No. 23 of 2004 on the crime of domestic
violence can to removed, minimally reduced significantly, the Act No. 23 of 2004, concerning crimes of
violence in households still raises a question mark, because until now there are many people who do not
understand the rule of law as stated in Law No. 23, 2004.
Country through law enforcement and in particular the application of sanctions for the perpetrators of the
crime of domestic violence, is still far from desirable, because of the many cases, the sentences given to
the perpetrators of the crime of domestic violence, is still in a minimum standard. Such sentencing, has
not spawned a deterrent effect for offenders and also for the community.
Theoretical Framework
The theoretical framework is a framework or a grain of opinion or theory about a case or problem, which
the researcher becomes a comparative material, which may be of theoretical grip he agrees or not
approved, it is an external input for researchers.
The researchers used the theory of criminal sanctions in particular on the double track system. Double
track system is a two-track system in the application of different types and forms of sanctions in the form
of criminal sanctions and the sanctions act as sub-systems in the criminal system
The process of restorative justice. Basically done via discretion (discretion) and this diversion, a diversion
efforts of the criminal justice process outside the formal process to be resolved amicably. Completion
through deliberation is actually not a new thing for the Indonesian nation. Before the occupation of the
Netherlands, our nation already has its own laws, namely customary law. Customary law does not
distinguish between the completion of the criminal case with the civil cases, all cases can be settled
amicably with the aim to get a balance data state election.
The difference between criminal sanctions and sanctions the action is rooted in the basic idea, in the
sense of criminal sanctions rooted in the basic idea why it held convictions. Criminal sanctions focusing
on sentencing, that the offender not to repeat the same act (deterrent), while the sanctions measures,
oriented so that the perpetrator can change attitudes.
This idea is very appropriate to be applied to the crime of domestic violence, because the criminal act of
domestic violence, punishment for the perpetrator, not only deter the perpetrators are, but also realize
that the act is not exactly justified either in law or national law.

Proceedings of The 1th Almuslim International Conference on Science, Technology and Society (AICSTS) 2015
November 7-8, 2015, Bireuen, Indonesia
314
Regarding violence can be interpreted as an act of deliberate or some form of action or acts that
constitute negligence, which to all is a violation of criminal law, which is carried out without a defence or
justification and sanctioned by the state as a serious criminal acts or acts infringing on the law lightly.
Indonesian dictionary, violence is defined as concerning the nature, characterized by loud, the act of a
person or group of persons who caused the injury or death of another person or cause the damage of
physical or other people's stuff.
Definition of violence not only against the law or the law, but also an act that is contrary to the conduct
norms, that acts contrary to the norms that exist in society even though the action was not incorporated or
organized under the laws.
Criminal Code in its articles no secar firmly set on the definition of violence, but is vague can be seen in
89 penal Code states that "makes people helpless swoon or equated with violence."
Sound Criminal Code Article 89 above do not clearly say what exactly the acts of violence, or in other
words what exactly the actions that can result in the person becomes unconscious and helpless no
explained.
In another article that described in article 285 Criminal Code that "whoever by force or the threat of
violence to force a women have sex with her outside of marriage, threatened for rape with a maximum
imprisonment of twelve years. "Violence referred to in Article 285 Criminal Code clearly above the
determined actions and thus should not be a violent sense of floating."
From the above description it can be said in this section that the kinds of violence that is set in the
criminal Code are: 1) Violence that resulted in someone becomes unconscious and helpless, and 2)
Violence in the case of rape.
If we look at the articles described in Article 351 to Article 355 Criminal Code are articles about the
persecution in accordance with sub-chapter headings, namely Chapter IX of persecution. Definition of
domestic violence in article 1 of Law eraser domestic violence stated that: Any action against someone,
especially women misery or suffering physical, sexual, psychological, and or negligence of household
including threat to commit an act of coercion, or deprivation of independence is against the law in the
domestic sphere.
From the definition above looks for whom this legislation enacted is not solely for the benefit of women,
but for all the people and those who have subordinated in fact, not just women, either adults or children
but men, both adults' and children alike. "
The violence that occurred in the household according to article 5 of the law the elimination of domestic
violence covered: physical violence, psychological violence, abused and neglect household sexual.
Physical violence according to article 6 of the law the elimination of domestic violence is: "the act resulting
in pain, sickness, or serious injury".
Proceedings of The 1th Almuslim International Conference on Science, Technology and Society (AICSTS) 2015
November 7-8, 2015, Bireuen, Indonesia
315
Then what is meant by psychological violence in accordance with article 7 of the law violence deletion in
the household is Acts that lead to fear, loss of confidence, loss of ability to act, a sense of helplessness or
serious psychic suffering on someone"
Then, what is meant by sexual violence according to article 8 of the law elimination of domestic violence
is:
a. Coercion sexual intercourse carried out against an individual living within the scope of the
household.
b. Forcing sexual intercourse against one in the scope of the household for commercial purpose
and / or a specific purpose.
This provision is actually quite important because sexual harassment is an interfere act with a person and
pose a threat to a person because it can lead to sexual violence. Sexual harassment also includes an
unpleasant act that is done in the form of behaviour, such as physical contact and flattery, show of
pornographic images and sexual demands, whether by words or actions, which should be eliminated
because it can cause health and safety problems.
Furthermore, the abandonment of households by Article 9 of the law elimination of domestic violence is:
1. Every person is prohibited displaced people within the scope of the household, whereas
according to the enactment of the law for him or because he is obliged to consent or agreement
proclaim life, maintenance, or maintenance to the person.
2. Negligence referred to in paragraph (1) also applies to any person resulting economic
dependence by restricting and / or banning to work properly inside or outside the home so that
the victim was under the control of the person.
As for example, "including also does not provide for his wife, then let his wife work for the husband
controlled her income, even hired her as his wife and the wife's dependence economically utilize to
control his life."
From the above description, it can be mentioned that to anyone who commits domestic violence, shall be
punished in the form of criminal sanctions. Punishing the perpetrator is a law enforcement in the field of
criminal law.
According to Sudikno Mertokusomo, in the presence of law enforcement, legal eat can be seen in reality.
Furthermore, according to him in law enforcement known as a term "flat justia et pereat mundus", which
means that even though the world is crumbling law must be upheld. What is proposed by Sudikno
Mertokusumo above, conformed to the legal theory developed by Aristotle about justice. Aristotle said
there are two kind of justice, that is: distributive justice and corrective justice. The justice is the first
concerns about the distribution of goods to each person according to his place in society, requires that
people who have the same position to obtain equal treatment before the law anyway. Medium justice the
second, provides a measure for enforcing the law, every day, we have to have a standard that is common
Proceedings of The 1th Almuslim International Conference on Science, Technology and Society (AICSTS) 2015
November 7-8, 2015, Bireuen, Indonesia
316
to fix (recover) the consequences and actions that people do in relation to one another, for example
criminal functioned to repair what has been done by crime. Another example of recovery to repair what
has been done by the crime. Another example of a civil fault repair restoration, carried out by way of
compensation, these standards should be applied regardless of the people and for all of them subject to
an objective standard.
Justice theory developed by Aristotle, both enforcement law on everyone and recovery state due to the
violation, can be implemented as a blade of analysis in this study. The reason the author says so, that the
perpetrators of the crime of domestic violence, should be given appropriate punishment, for what he has
done, but use the legal standards that Act No. 23 of 2004 on the elimination of domestic violence, the
expectation that sentencing will also bring changes to the character or character of person towards better.
Therefore, the criminal policy in cases of domestic violence, should cover two things: the policy of penal
and non-penal policies. This is what is meant by the theory of "double track system"
Conclusion
1) Addressing the crime of domestic violence not create or invent systems and legislation that are
criminal but what about the role of government and the public aware of a couple of ruler and
obligations.
2) Provide sufficient and adequate knowledge of the husband as head of the household so that she
has the ability or skill in terms of employment in accordance with his expertise as a household so
she could afford and be turned on because the family is based on the observation that the
tendency of domestic violence caused by the economic situation,
3) There are several models or trait or habit and character and personality of each couple from the
beginning or by circumstances that the husband has a hard nature, selfish always justify
themselves and vice versa wife have the nature, character and personality same. In this case the
necessary role of psychologist and religious leaders.
Suggestion
1) In order to provide the government and provide a means for the prospective couple who will get
married to provide education for at least one month to provide information so that the prospective
husband and wife understand their rights and obligations due in accordance with the law that
philosophy marriage in Indonesia created a marital relationship that is eternal and eternal
happiness and prosperity in accordance with the will of God Almighty.
2) That there is a special institution that pre marriage to educate the prospective husband and wife
who will hold the role of marriage in which the institution providing religious education, culture,
customs and expertise in accordance with their respective fields candidates for husband and wife
to be able to work.
3) In order for the government to revise the law in domestic violence prevailing today.
Proceedings of The 1th Almuslim International Conference on Science, Technology and Society (AICSTS) 2015
November 7-8, 2015, Bireuen, Indonesia
317
References
Atmasasmita, Romli, 2007, Teori Dan Kapita Selekta Kriminalogi, Penerbit PT. Refika Aditama, Bandung.
---------------, 2008, Bunga Rampai Kebijakan Hukum Pidana, Penerbit Kencana Prenda, Media Group.
Amiruddin Dan Zainal Asikin, 2004, Dalam Pengantar Metode Penelitian Hukum, Penerbit PT. Raja
Grafindo Persada, Jakarta.
Chazawi Adami, 2002, Pelajaran Hukum Pidana, Bagian I, Penerbit PR. Raja Grafindo Persada, Jakarta.
-------------------, 2002, Kejahatan Terhadap Tubuh Dan Nyawa, Penerbit PT. Raja Grafindo Persada,
Jakarta.
Mulyadi Mahmud, 2008, Criminal Policy Pendekatan Integral Penal Policy Dan Non Penal Policy Dalam
Penanggulangan Kejahatan Kekerasan, Penerbit Pustaka Bangsa Press, Jakarta.
Salman Otje Anton F. Susanto, 2008, Teori Hukum Mengingat, Mengumpulkan Dan Membuka Kembali,
Penerbit Reflika Aditama, Jakarta.
Sholehuddin, 2007, Sistem Saksi Dalam Hukum Pidana, Ide Dasar Double Track System Dan
Inmplementasinya, Penerbit PT. Raja Grafindo Persada, Jakarta.
Saraswati Rika, 2006, Perempuan Dan Penyelesaian Kekerasan Dalam Rumah Tangga, Penerbit Citra
Ditya Bhakti, Bandung.
Proceedings of The 1th Almuslim International Conference on Science, Technology and Society (AICSTS) 2015
November 7-8, 2015, Bireuen, Indonesia
318
Influence Awareness Activities Corporate Social
Responsibility and Customer Satisfaction on Purchase Intentions
and its Impact on Customer Loyalty in Customer
PT. Bank Aceh in Banda Aceh
1M. Ridha Siregar, 2Teuku Azmi
Faculty of Economics, Syiah Kuala University
Corressponding Author: [email protected]; [email protected].
Abstract
This research Aimed to measure the effect of awareness of CSR and customer
satisfaction to Purchase Intention and the effect on Customer Loyalty to customers of
PT. Bank Aceh in Banda Aceh city. The sample used in this research are customers of
PT. Bank Aceh roomates totaled 120 respondents. The instrument of collecting the data
in this research is questionnaire. Purposive sampling was used as the sampling
technique. As much of 120 questionnaires distributed and only just 117 questionnaires
could be treated. Hierarchical Linear Model (HLM) was used as a method of analysis to
determine the effect of all variables Involved in this research. The results are follows: 1)
Awareness of CSR Significantly effect to Customer Loyalty of Customers of PT. Bank
Aceh. 2) Customer satisfaction to customer loyalty significantly effect on customers of
PT. Bank Aceh. 3) Awareness of CSR Significantly effect to the customer on purchase
intention of PT. Bank Aceh. 4) Customer satisfaction significantly effect to purchase
intention of customers of PT. Bank Aceh. 5) Purchase Intention Significantly effect on
customer loyalty to customers of PT. Bank Aceh. 6) Purchase intention partially
mediates the effect of awareness of CSR to customer loyalty on the customer of
PT. Bank Aceh. And 7) Purchase intention partially mediates the effect of customer
satisfaction to customer loyalty.
Keywords: Awareness of CSR, Customer Satisfaction, Purchase Intention, and
Customer Loyalty
Background
The banking industry has undergone major changes in recent years. The industry is becoming more
competitive due to the deregulation of the rules. Currently, the bank has flexibility in the services they
offer, the location where they operate, and the rates they pay to depositors. One of the factors that
Proceedings of The 1th Almuslim International Conference on Science, Technology and Society (AICSTS) 2015
November 7-8, 2015, Bireuen, Indonesia
319
influence the success of a banking institution is a customer loyalty towards the banking
company. Customer loyalty is the person who buys, especially the purchase regularly and
repeatedly. Customer is a person who continuously and repeatedly came to a similar place to satisfy his
desire to have a product or obtain a service, and pay for products or services.
Corporate Social Responsibility (CSR) is often referred to as corporate social performance and
sustainability as well as the responsibilities of business, is the focus of management researchers and
business practitioners. CSR is a business organization's configuration of principles of social responsibility,
social responsiveness processes, policies, programs, and outcomes related to social relations firm. This
step is very important to have a corporate sustainability and reputation management.
Basic Theory
Customer loyalty
Boulding (in Ali Hasan, 2008) argues that the consumer brand loyalty due to the influence of satisfaction
and dissatisfaction with the brand accumulated continuously - being in addition to the perception of the
quality of the product. Customer loyalty according to Amin Widjaja Tunggal (2008) is a customer
attachment to a brand, stores, manufacturers, service providers, or other entities based on a favorable
attitude and a good response, such as repeat purchases. Based on these definitions, we can conclude
that there are elements of behavior and attitude in customer loyalty.
Fidelity is buying behavioral responses that can unfold continuously by decision makers to pay attention
to one or more alternative brand of a number of similar brand and is a function of psychological
process. It should be emphasized that it is different from the behavior of repurchase, customer loyalty
include aspects of feeling, does not involve the affective aspect therein (Dharmesta, in Dharmayanti Diah,
2006).
Awareness Activities Corporate Social Responsibility
CSR is a business organization's configuration of principles of social responsibility, social responsiveness
processes, policies, programs, and outcomes related to social relations firm. This step is very important to
have sustainability and corporate reputation management (Wood, 1991). (Mohr, Webb and Harris 2001)
defines CSR as the company's commitment to minimize or eliminate the harmful effects of long-term
beneficial impact on the running of society.
CSR concept first appeared in the official discourse of academic since Howard R Bowen published his
book entitled Social Responsibility of the Businessman in 1953. The basic idea proposed CSR Bowen
refers to the obligation of businesses to conduct its business in line with the values and goals to be
achieved society where the company operates. The term CSR is increasingly popular, especially after the
presence of the book Cannibals with Forks: The Triple Bottom Line of 21st Century Business (1998) by
John Elkington develops three essential components of sustainable development, namely economic
growth, environmental.

Proceedings of The 1th Almuslim International Conference on Science, Technology and Society (AICSTS) 2015
November 7-8, 2015, Bireuen, Indonesia
320
Customer satisfaction
Customer satisfaction or customer related to the quality of the products offered by their. Consumer
satisfaction have this level of each depending on what they earn, Here will describe some definitions of
satisfaction according to them according to Kotler and Keller (2007) which states that "Satisfaction is
feeling happy or upset someone who emerged after comparing the performance (results) products that
are considered to performance (or outcome) was expected ".
Engel, Roger & Miniard (1994) says that satisfaction is the evaluation of post-consumer to choose several
alternatives in order to meet expectations. Nasution (2005) says that satisfaction is achieved when the
quality meets and exceeds the expectations, desires and needs of consumers. Conversely, if the quality
does not meet and exceed the expectations, desires and needs of consumers, the satisfaction is not
achieved.
Purchase intentions
Purchase intent is a process to analyze and predict consumer behavior (Lin and Lin, 2007) pertaining to
their willingness to buy, use, and widespread attention to a particular brand. Ajzen (2005) defines
intention as behavioral tendencies, one does if the time and the right opportunity and will be realized in
the form of action. While Assael (2001) states that the purchase intention is the tendency of consumers to
buy brand or take action related to the purchase of which is measured by how the tendency of consumers
to make purchases. According Zeitham et al. (1996) the intention of customer behavior can be measured
through repeat visits, recommendation to others, positive comments, and repeat purchases.
Awareness of the influence of CSR activities Purchase Intentions
According to Alexandris et al (2002), CSR actions organizations can encourage customer intentions
observed a positive relationship between consumer purchase intentions and retention. This study
assumes that the actions of an organization's CSR will positively affect consumers' purchasing intentions
and will generate favorable purchasing decisions. Moreover, this behavior will also continue in the future
in the form of customer retention. Mohr et al. (2001) also believe that consumers should be aware of CSR
actions in order to have a positive impact on purchase intent, but consumers are usually difficult to obtain
information about corporate CSR actions. McWilliams and Siegel (2000) emphasizes that the level of
consumer awareness is essential in order to expect any positive attitude of consumers. Maignan (2001)
emphasized for research on investigating the extent of awareness of CSR actions.
Customer Satisfaction influence on Purchase Intentions
Consumer satisfaction has a positive influence on consumer purchase. Oliver (1994); Alexandris et
al. (2002) and Harrison (2004) found a positive relationship between customer satisfaction and purchase
intention. The study also assumes a positive relationship between customer satisfaction and customer
purchase intention.

Proceedings of The 1th Almuslim International Conference on Science, Technology and Society (AICSTS) 2015
November 7-8, 2015, Bireuen, Indonesia
321
Awareness of the influence of CSR activities on Customer Loyalty
According to (Han et al., 2011), CSR affects customer loyalty when the company is facing a highly
competitive business environment and customer expectations are increasing, many companies have
difficulty increase their market share because of increased international competition, the growth rate is
slower, decreasing the growth of the population, and oversupply and mature markets (So et al., 2013).
Thus, the companies in this case to be more interested in maintaining and retaining their customers
because of the advantage was evident. On when customers become loyal, they buy more, willing to more
pay and recommend more (Harris and Goode, 2004). Therefore, in their quest to improve their loyal
customers, companies try their best to develop long-term relationships with customers, meet their needs
and desires (Han and Back, 2008).
Effect of Customer Satisfaction to Customer Loyalty
Cronin and Taylor (1992); Oliver (1999); van Riel et al. (2004) and Woodside et al. (1989) reported a
positive relationship between satisfaction and loyalty. Kanji, (1998); Oliver, (1999); Parasuraman and
Grewal, 2000 and Chang (2006) also found that the company can develop customer loyalty by offering
superior value, resulting from the best service and quality products. Chang et al.(2009) found a positive
relationship between service quality, customer satisfaction and customer loyalty. Bolton and Drew
(1991); Parasuraman (1997) and Zeithaml (1988) look at consumer satisfaction and consumer loyalty as
a tool to develop a sustainable competitive advantage. According to Oliver (1980) and Yi (1990),
customer satisfaction is the key determinant of long-term customer retention (Cooil et al, 2007).
Effect of Customer Purchase Intention of Customer Loyalty
In general, consumers are loyal to products bought will be manifested in behavior to consume recycled or
intention to make the purchase and use them again. While the behavior of consumers who are not loyal
to the products purchased will be manifested behavior change (not constant) decision means consumers
switch brands tend to be higher. According to (Barnes, 2003) customer loyalty is an emotional connection
to the company's customers, evidenced by transforming the behavior of repeat purchases. Hesket et al.,
(1994) says, one way to increase customer loyalty is to provide a good quality service, which is expected
to make the customer to re-do the transaction with the vendor. In fact, research on the effects of quality
with loyalty produce different conclusions.
Awareness of the influence of CSR activities towards customer loyalty is mediated by Customer
Purchase Intentions
According to (Wood, 1991), CSR is a business organization's configuration of principles of social
responsibility, social responsiveness processes, policies, programs, and outcomes related to social
relations firm. This step is very important to have sustainability and reputation management company,
which is in line with its goal to increase customer loyalty in an increasingly competitive international
competition (So et al., 2013). Which is connected by a purchase intention which according to (Lin and Lin,

Proceedings of The 1th Almuslim International Conference on Science, Technology and Society (AICSTS) 2015
November 7-8, 2015, Bireuen, Indonesia
322
2007) which is a process to analyze and predict consumer behavior with regard to their willingness to
buy, use, and widespread attention to a particular brand.
Effect of Customer Satisfaction to Customer Loyalty mediated by Consumer Purchase Intentions
Bowen and Chen (2001) expressed satisfaction the consumer closely related to customer loyalty, which
satisfied customers will become loyal customers, and loyal customers will be "marketing personnel
terrible" for the company to provide information and recommendations positively to the prospect of
other, It is driven by the intention of purchase which result from customer satisfaction to a product.
H7: Customer satisfaction effect on customer loyalty mediated by customer purchase intention
Research Methods
Population and Sample
Population is the total number of elements to be studied (Cooper and Schindler, 2006). Population is the
generalization region consisting of the objects / subjects that have certain qualities and characteristics
defined by the researchers to learn and then pull the conclusion (Sugiyono, 2009). Referring to the overall
population groups of people, events, or things of interest that want researcher investigation (have now,
2006). Population to be studied must be clearly defined before the study was conducted (Sugiyono,
2009). The population in this study are customers of PT. Bank B.Aceh Aceh City.
Measurement
In this study, a questionnaire was used as data collection methods to obtain information from some
respondents being sampled. This questionnaire will measure four variables that exist in this research,
customer loyalty, awareness of CSR activities, customer satisfaction, and purchase intention.
The dependent variable in this study is a customer loyalty, to measure the constructs of these variables
have been measured with 5 items in question Timm (2001). The results showed that for the dependent
variable (customer loyalty) of five questions that can engage in research relevant for its fifth
Based on the test results indicate that the 5 items of questions involved in this study had good correlation
constructs that can be precise measurements, it can be seen from the eigenvalues of 2.632 with
a loading factor that has the interval 0.695 to 0.785. Variants that can be described (variance
explained) at a factor of 52.6%. Kaiser-Meiyer value-Olkin Measure of Sampling Adequacy on the
dependent variable of 0.735 and test results Barlet's Test Of Sphericity showed significant is 0.001 (p
<0.01).
The first independent variable in this research is awareness of CSR activities, to measure the constructs
of these variables have been measured with nine items in question Wibisono (2007: 145). The results
showed that for the independent variables (awareness of CSR activities) only 5 items of questions that
can be involved in the study, while 4 other question items can not be excluded because it is not relevant
to the context of this research. It can be seen as 4 item that question does not show a good correlation
Proceedings of The 1th Almuslim International Conference on Science, Technology and Society (AICSTS) 2015
November 7-8, 2015, Bireuen, Indonesia
323
between items other constructs. As to the question "Do you agree that with the Corporate Social
Responsibility program at PT. Aceh Bank will increase the independence of people economically ". The
test results showed that 5 items of questions involved in this study had good correlation constructs that
can be the exact measurements, it is seen from Eigen value of 3.628 with a loading factor that has
intervals of 0.721 up to 0.814. Unexplained variance (variance explained) at a factor of 45%. Value
Kaiser-Meyer-Olkin Measure of Sampling Adequacy on the first $ 0,751 of independent variables and test
results Barlett's Test of Sphericity 0,001 showed significant (p <0.01).
The second independent variable in this study is customer satisfaction, to measure the constructs of
these variables has been measured by 3 items according Admin question (2009). From the results of the
test showed that the three items of questions involved in this study had good correlation constructs that
can be the exact measurements, it is seen from Eigen value of 1.629 with a loading factor which has the
interval 0,812 to 0.919. Unexplained variance (variance explained) at a factor of 20%. Value Kaiser-
Meyer-Olkin Measure of Sampling Adequacy on the first $ 0,751 of independent variables and test results
Barlett's Test of Sphericity 0,001 showed significant (p <0.01).
Mediating variable in this study is the intention of purchase, to measure the constructs of these variables
has been measured by 3 items according Veno questions and Subagio (2013). The results showed that
the three items of questions involved in this study had good correlation constructs that can be precise
measurements, it can be seen from the eigenvalues of 2.885 with a loading factor that has the interval
0.791 to 0.879. Unexplained variance (variance explained) at a factor of 72%. Kaiser-Meiyer- value Olkin
Measure Of Samplig Adequacy in mediating variable of 0.808 and test results Barlet's Test Of
Sphericity showed significant is 0.001 (p <0.01).
Furthermore, to measure whether the instrument (questionnaire) of the study trustworthy / reliable or not
as a result of good research it is necessary to test reliability. A construct or a variable is said to be reliable
if the value of Cronbach alpha> 0.60 according to Malhotra (2003). Here are the results of reliability
testing.
Table 1. Realibility
No. Variables Number
of Items
Cronbach's Alpha Description
Arithmetic Standard
1. Customer loyalty 5 0.763 0.60 Reliable
2. Awareness
of CSRactivities 5 0, 825 0.60 Reliable
3. Customer satisfaction 3 0, 825 0.60 Reliable
4. Purchase intentions 3 0.657 0.60 Reliable
Source: Primary Data (processed), 2015

Proceedings of The 1th Almuslim International Conference on Science, Technology and Society (AICSTS) 2015
November 7-8, 2015, Bireuen, Indonesia
324
Analysis
Results Effect of CSR activities Awareness and Customer Satisfaction against Purchase Intentions can
be seen in the following table 2:
Table 2. Awareness and Customer Satisfaction against Purchase Intentions
Model Unstandardized
Coefficients
Standardized
Coefficients
t Sig.
B Std. Error Beta
1
(Constant) 1,639 0.437 3,755 0,000
Awareness of CSR 0,305 0.080 0.334 3.829 0,000
Customer satisfaction 0.187 0.092 0.177 2,032 0,044
Source: Primary Data (processed), 2015
According to Hair, et al (2006) if the scaling used Likert scale, the regression coefficients used
for standardized coefficients value, where the value of constants do not need to be interpreted. From the
results of the SPSS output can be made line linear equation is as follows:
Z = 1 + 0,177X 0,334X 2
Then from the equation can be explained that the regression coefficient Awareness CSR (X1) is positive
(0.334) means that when the awareness of CSR activities which are owned by the customer increases, it
will increase the purchase intent experienced by customers. Customer satisfaction regression coefficient
(X2) is positive (0.177) means that when customer satisfaction received by customers increased, it will
increase the purchase intent is also to customers of PT. Bank of Aceh.
Influence analysis results CSR Awareness Activity and Customer Satisfaction to Customer Loyalty with
variable Purchase Intentions as can be seen in the table 3 below.
Table 3. Awareness Activity and Customer Satisfaction to Customer Loyalty
Coefficientsa
Model Unstandardized Coefficients Standardized
Coefficients
t Sig.
B Std. Error Beta
1
(Constant) 1,114 0,537 2,073 0,040
Awareness of CSR 0,349 0,098 0,306 3,553 0,001
Customer satisfaction 0,319 0,113 0,244 2,825 0,006
2
(Constant) 0,781 0,564 1,383 0,169
Awareness of CSR 0,287 0,103 0,252 2,775 0,006
Customer satisfaction 0,281 0,114 0,215 2,469 0,015
Purchase intentions 0,203 0,114 0,164 1,781 0,078
Source: Primary Data (processed), 2014
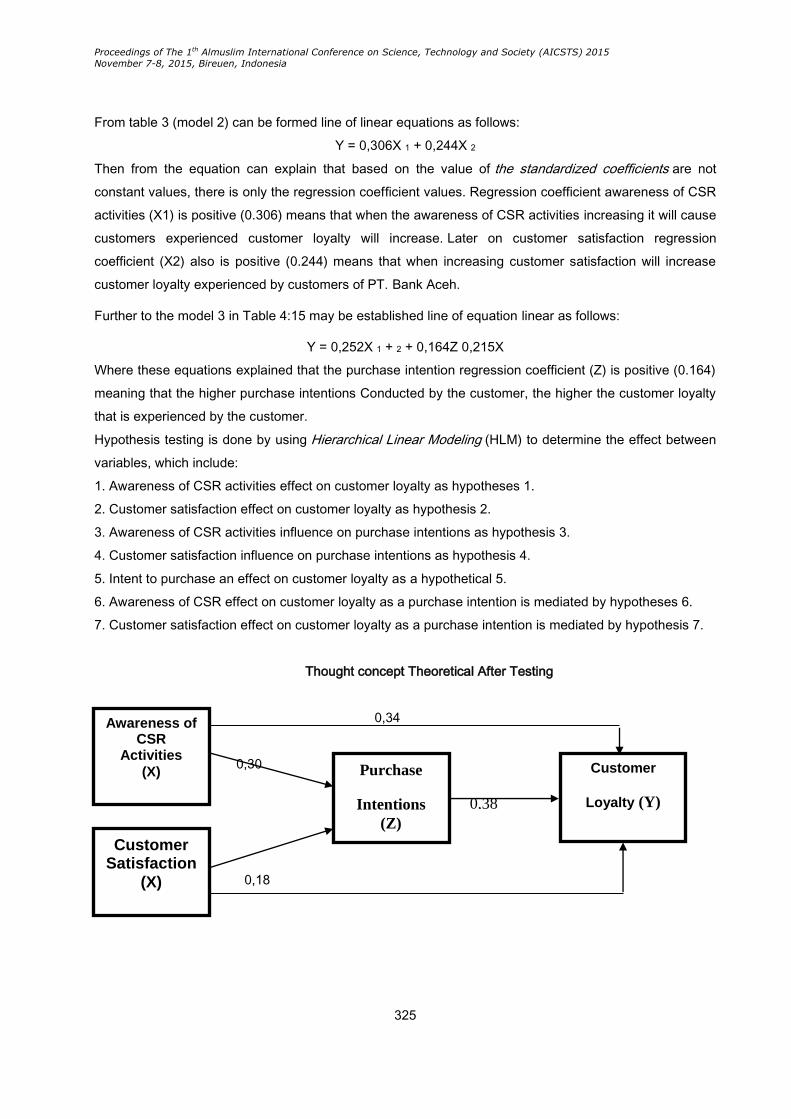
Proceedings of The 1th Almuslim International Conference on Science, Technology and Society (AICSTS) 2015
November 7-8, 2015, Bireuen, Indonesia
325
From table 3 (model 2) can be formed line of linear equations as follows:
Y = 0,306X 1 + 0,244X 2
Then from the equation can explain that based on the value of the standardized coefficients are not
constant values, there is only the regression coefficient values. Regression coefficient awareness of CSR
activities (X1) is positive (0.306) means that when the awareness of CSR activities increasing it will cause
customers experienced customer loyalty will increase. Later on customer satisfaction regression
coefficient (X2) also is positive (0.244) means that when increasing customer satisfaction will increase
customer loyalty experienced by customers of PT. Bank Aceh.
Further to the model 3 in Table 4:15 may be established line of equation linear as follows:
Y = 0,252X 1 + 2 + 0,164Z 0,215X
Where these equations explained that the purchase intention regression coefficient (Z) is positive (0.164)
meaning that the higher purchase intentions Conducted by the customer, the higher the customer loyalty
that is experienced by the customer.
Hypothesis testing is done by using Hierarchical Linear Modeling (HLM) to determine the effect between
variables, which include:
1. Awareness of CSR activities effect on customer loyalty as hypotheses 1.
2. Customer satisfaction effect on customer loyalty as hypothesis 2.
3. Awareness of CSR activities influence on purchase intentions as hypothesis 3.
4. Customer satisfaction influence on purchase intentions as hypothesis 4.
5. Intent to purchase an effect on customer loyalty as a hypothetical 5.
6. Awareness of CSR effect on customer loyalty as a purchase intention is mediated by hypotheses 6.
7. Customer satisfaction effect on customer loyalty as a purchase intention is mediated by hypothesis 7.
Thought concept Theoretical After Testing
0,34
0,30
0,18
0,38
Awareness of CSR
Activities
(X) Customer
Loyalty (Y)
Purchase
Intentions
(Z)
Customer Satisfaction
(X)
Proceedings of The 1th Almuslim International Conference on Science, Technology and Society (AICSTS) 2015
November 7-8, 2015, Bireuen, Indonesia
326
Discussion
The results of the first hypothesis identified that awareness of CSR activities significant effect on
customer loyalty in the customer PT. Bank Aceh this is in accordance with the explanation Wood (1991),
which explained that CSR is a business configuration of organization of the principles of social
responsibility, the process of social responsiveness, and policies, programs, and outcomes related to
social relations of the company, this step is very important to have a corporate sustainability and
reputation management. That is indeed absolutely necessary CSR undertaken by the company to do a
good relationship with the community through social actions with sustainable orientation.
In addition, this study also reinforced by previous studies conducted by the majority of researchers agree
that corporate CSR actions should be carried out, promoted and publicized as the positive impact on
consumer behavior to the company's products. For example, according to Abdeen (1991) states that the
promotion of CSR measures increase consumer loyalty. Daughtery (2001) also suggested that the
company must ensure the visibility of social activities to demonstrate its commitment to the community
and have a favorable and competitive position in the market. Saleh et al. (2007) also found a positive
relationship between disclosure of CSR actions and performance of the company in the short run as well
as its influence on customer loyalty.
Second hypothesis testing showed that customer satisfaction significantly influence customer loyalty in
the customer PT. Bank Aceh. This test is consistent with empirical studies conducted by Cronin and
Taylor (1992); Oliver (1999); van Riel et al. (2004) and Woodside et al. (1989) which states that customer
satisfaction affects the loyalty felt by the customer.
This opinion is also strengthened by a study done by Parasuraman and Grewal (2000) and Chang
(2006); stating that the company will be able to develop customer loyalty by offering superior value, can
be produced from the best service and quality products.
Testing the hypothesis third shows that awareness of CSR activities significantly influence customers'
purchase intention in PT. Bank Aceh. This is according to research conducted by Bandura (1982) which
found self-efficacy as consumer confidence that they can make purchasing decisions based on their
knowledge of CSR undertaken by the company and response-efficacy as a result of their purchasing
decisions, organizations must facilitates consumers to increase customer awareness of CSR actions
taken by the company this may affect their purchase intentions and actions of the organization's CSR can
also encourage customer purchase intention.
The study also was also strengthened by the opinions Alexandris et al. (2002) which states that the
positive relationship observed between consumer purchase intentions and retention. This study assumes
that the actions of an organization's CSR will positively affect consumers' purchasing intentions and will
generate favorable purchasing decisions. Moreover, this behavior will also continue in the future in the
form of customer retention
Proceedings of The 1th Almuslim International Conference on Science, Technology and Society (AICSTS) 2015
November 7-8, 2015, Bireuen, Indonesia
327
For example, when customers of PT. Bank Aceh to know about the social activities of what has been
done by PT. Bank of Aceh that have a direct impact on the social life of people in need, this is certainly a
good image will foster a sense of customer confidence in the PT. Aceh participating banks contribute to
the improvement of social life which will result in increased customer purchase intention.
Fourth hypothesis testing showed that customer satisfaction significantly influence customers' purchase
intention in PT. Bank Aceh. This research is in line with different studies conducted by Oliver
(1994); Alexandris et al. (2002) and Harrison (2004) shows that customer satisfaction has a positive
influence on consumer purchase intention. This study found a positive relationship between customer
satisfaction and purchase intention, this study also assumes a positive relationship between consumer
satisfaction and consumer purchase intentions.
Fifth hypothesis testing showed that the purchase intent effect on customer loyalty in the customer
PT. Bank Aceh. This research is in line with research conducted by Dwiyanto, et al (2008) investigated
the factors that affect interest in buying the product and its impact on consumer loyalty. The study
concludes that the quality of the product, the intensity of the campaign, as well as the perceived price
positive and significant impact on purchase intentions. Purchase intention is also positive and significant
impact on customer loyalty.
Sixth hypothesis testing showed that the purchase intention mediates the influence of awareness of CSR
activities towards customer loyalty in the customer PT. Bank Aceh in Banda Aceh. This is consistent with
research Mohr et al. (2001) said that he also believes that consumers should be aware of CSR actions in
order to have a positive impact on the intention to buy, but consumers are usually difficult to obtain
information about corporate CSR actions. McWilliams and Siegel (2000) emphasizes that the level of
consumer awareness is essential in order to expect any positive attitude of consumers. Maignan (2001)
emphasized for research on investigating the extent of awareness of CSR actions.
Seventh hypothesis testing showed that the purchase intention mediates the influence of customer
satisfaction on customer loyalty in the customer PT. Testing Aceh Bank is reinforced by a study
conducted by Szymanski and Henard (2001) he said customers seemed to enjoy a high level of
satisfaction to continue the relationship with the organization. Research has confirmed a positive
relationship between product / service quality, customer satisfaction and customer retention / loyalty
through the purchase intention. Cronin and Taylor (1992); Oliver (1999); van Riel et al. (2004) and
Woodside et al. (1989) have expressed a positive relationship between satisfaction and loyalty. Kanji,
(1998); Oliver, (1999); Parasuraman and Grewal, 2000 and Chang (2006a); has found that the company
can develop customer loyalty by offering superior value, resulting from the best service and quality
products. Chang et al. (2009) found a positive relationship between service quality, customer satisfaction
and customer loyalty. Bolton and Drew (1991); Parasuraman (1997) and Zeithaml (1988) look at
consumer satisfaction and consumer loyalty as a tool to develop a sustainable competitive
advantage. According to Oliver (1980) and Yi (1990), customer satisfaction is the key determinant of long-
Proceedings of The 1th Almuslim International Conference on Science, Technology and Society (AICSTS) 2015
November 7-8, 2015, Bireuen, Indonesia
328
term customer retention (as cited by Cooil et al., 2007) shows that the impact of customer satisfaction has
a positive influence on customer loyalty through the purchase intention.
Conclusion
Based on the results of the analysis performed in this study, it can be given suggestions as follows:
1. For companies PT. Bank Aceh for more attention to the comfort and satisfaction of loyal
customers of PT. Bank Aceh who tend to feel less satisfied with the care that has been given by
PT. Bank Aceh during this time, customers often complained of the content that is offered by the
company tend to not give maximum satisfaction to customers, because it is based on the results
of the research show that as increasing its customer satisfaction will affect positih on purchase
intentions and customer loyalty itself so necessary the follow-up of the company to continue to
innovate in order to improve satisfaction for our customers. Later in the implementation of
Corporate Social Responsibility in order to carry out social activities are better targeted for the
people who really desperately need eg increase aid appropriate housing for the poor and to
provide scholarships for more children poor to help the economic life as well their education.
2. For the customers to be more aware (conscious) will be the activities of Corporate Social
Responsibility anything done by PT. Bank of Aceh because of the importance of this awareness
to monitor the CSR activities undertaken by PT. Bank Aceh that social activities are right on
target, then it is important to customers so that criticism and suggestions to the company if there
are errors or dissatisfaction of customers with the services provided by the company it is that the
company is able to carry out innovation and improvement so as to provide the best service for our
customers and make PT. Aceh Bank as the best bank and number one in Aceh.
References
Alexandris K, Dimitriadis N, Markata D (2002). Can Predict perceptions of service quality behavioral
intentions? An exploratory study in the hotel sector in Greece. Managing Service Quality. 12 (4):
224-231.
Bolton RN, Drew JH (1991) A multistage models of customers' assessments of service quality
and value, J. Consum Res. 17: 375- 384.
Budimanta, Arif et al. 2004 Corporate Social Responsibility: Answers To The Present Development
Models Indonesia, Jakarta: ICSD
Chang HH, Wang Y, Yang W (2009). The impact of e-service quality, customer satisfaction and loyalty on
e-marketing: Moderating effects of perceived value. Total Quality Manage. 20 (4): 423-443.
Chang HH (2006). Technical and management perceptions of enterprise information systems importance,
implementation and benefits. Inf. Systems J. 16 (3), 236-292.
Proceedings of The 1th Almuslim International Conference on Science, Technology and Society (AICSTS) 2015
November 7-8, 2015, Bireuen, Indonesia
329
Cooil B, Keiningham TL, Aksoy L, Hsu M (2007). A longitudinal analysis of customer satisfaction and
share of wallet: Investigating the moderating effects of customer characteristics. J.Market. 71 (1):
67- 83.
JJ Cronin, Taylor SA (1992). Measuring service quality: A reexaminetion and extension. J. Market. 56 (3):
55-68.
Dwiyanto, A. et al. (2008), Reform Public Bureaucracy in Indonesia (translated as Public Bureaucratic
Reform in Indonesia), Yogyakarta: Gadjah Mada University Press.
Han, H., Back, K., 2008. Relationships Among image congruence, consumption emotions, and customer
loyalty in the lodging industry. Journal of Hospitality and Tourism Research 32 (4), 467-490.
Han, H., Kimb, Y., Kima, E., 2011. Cognitive, affective, conative, and action loyalty: testing the impact
of inertia. International Journal of Hospitality Management 30, 1108-1119.
Harris, L., Goode, M., 2004. The four levels of loyalty and the pivotal role of trust: a study of the online
service dynamics. Journal of Retailing 80, 139-158.
Harrison P, Shaw R (2004). Consumer satisfaction and post-purchase intentions: an exploratory study of
museum visitors. Int. J. Arts Manage. 6 (2): 23-32.
Kotler, Philip and Kevin Lane Keller.2007. Marketing Management. Twelfth Edition. Index: Jakarta
Maignan I (2001). Consumers' perceptions of corporate social responsibilities: a cross-cultural
comparison. J. Bus.Ethics. 30 (1): 57-72.
McWilliams A, Siegel D (2000). Corporate social responsibility and financial performance: Correlation or
misspecification? Strat. Manage. J. 21 (5): 603-609.
LA Mohr, Webb DJ, Harris KE (2001). Do consumers expect companies to be socially responsible? The
impact of corporate social responsibility on buying behavior. J. Consum. Affairs. 35: 45-72.
Oliver RL (1999). WHENCE consumer loyalty? J. Market. 63 (Special Issue): 33-44.
Parasuraman A (1997). Reflections on gaining competitive advantage through customer value. J.
Acad. Market. Sci. 25 (2): 154-161.
A Parasuraman, Grewal D (2000). The impact of technology on the quality-value-loyalty chain: A
research agenda. J. Market. Sci. 28: 168-174.
Salim, Emil et al. Sustainable Future: Promoting Heritage Civilizations For Children Grandchildren
Discourse Regarding Thought, Jakarta: ICSD
Suharti, Gunarto. 2003. In the Banking Business Law perspective. Yogyakarta: Canisius.
Suharto, Edi. 2006. "Social Work Industry, CSR and Community Development". The paper workshop on
Corporate Social Responsibility.
Proceedings of The 1th Almuslim International Conference on Science, Technology and Society (AICSTS) 2015
November 7-8, 2015, Bireuen, Indonesia
330
Suparlan, Parsudi. 2003 "Community Development and Corporate Social Responsibility". Papers in the
Intensive Course for Company Community Development: Concepts, Cases and
Implementation. Held in Jakarta: PUSWIKA UI (17 to 20 March 2003).
Tjiptono, Fandy and Anastasia Diana.2003. Total Quality Management. Revised Edition. Andy:
Yogyakarta
Umar, Husein. 1997. Feasibility Study Business. Third Edition. Gramedia Pustaka Utama: Jakarta
Van Riel ACR, Semijn J, Pauwels P (2004). Online travel service quality: The role of pre-
transaction services. Total Quality Manage. 15 (4): 475-493.
Weeden, Curt. 1998 Corporate Social Investing: The Breakthrough Strategy for Giving and Getting
Corporate Contributions. San Francisco: Berten-Koehler Publishers, Inc.
Woodside AG, Frey LL, Daly RT (1989). Linking service quality, customer satisfaction and
behavioral intentions. J.Health Care Market. 9 (4): 5-17.
Yi Y (1990). Cognitive and affective priming effects of the context for print advertisements. J. Advert. 19:
40-48.
Zeithaml VA (1988). "Consumer perceptions of price, quality and value: A means-end model and
synthesis of evidence". J. Market. 52: 2-22.
Proceedings of The 1th Almuslim International Conference on Science, Technology and Society (AICSTS) 2015
November 7-8, 2015, Bireuen, Indonesia
331
HRM and Change Management in Thai Banking Industry:
Case of Siam Commercial Bank
Boriboon Pinprayong
Adjunct Researcher of Internet Education and Research Laboratory, Asian Institute of Technology,
Thailand
Corresponding Author: [email protected]
Abstract
This paper studies the role of HRM in formulating HRM strategy, HRM policies and
practices which provide crucial support to the changes and business performance of the
Thai commercial banks since the financial crisis in Thailand. This paper takes Siam
Commercial Bank (SCB), one of the largest banks in Thailand as a case study. SCB
implemented HRM to support its business in the high competition in the Thai market
and transformed the deep-rooted culture of the organization. This study conducted both
qualitative research, grounded theory, and quantitative research. The data were
collected through both in-depth interviews and questionnaire survey from 291 SCB
managers. The findings of study are two fold. First, the role of HRM is significant in
supporting the SCB organizational change, and business strategy. In addition, the new
HRM strategy was one factor driving SCB to become a leading commercial bank in
Thailand, and second, the quality of HRM could change the attitude and behavior of
employees leading to increased customer satisfaction.
Keywords: HRM strategy; HRM policy and practices; HRM performance; Organizational
culture; Banking industry; Thailand
Introduction
In developing countries, banking industry is extremely important to their economy. Thus, the stability of
the banking industry is to be achieved and maintained. For Thailand, after the financial crisis in 1997,
many Thai commercial banks went bankrupt and many others came to the verge of bankruptcy which
directly impacted the Thai economy significantly. This paper takes Siam Commercial Bank (SCB), one of
the largest banks in Thailand as a case study. In this paper, I first describe the scenario of the Thai
banking industry since the late 1990s. It then discusses the corporate culture change in the banking
industry and HRM role in the change process. Literature review is provided. Research methodology and
findings are described. Finally, conclusion and managerial implications are given.
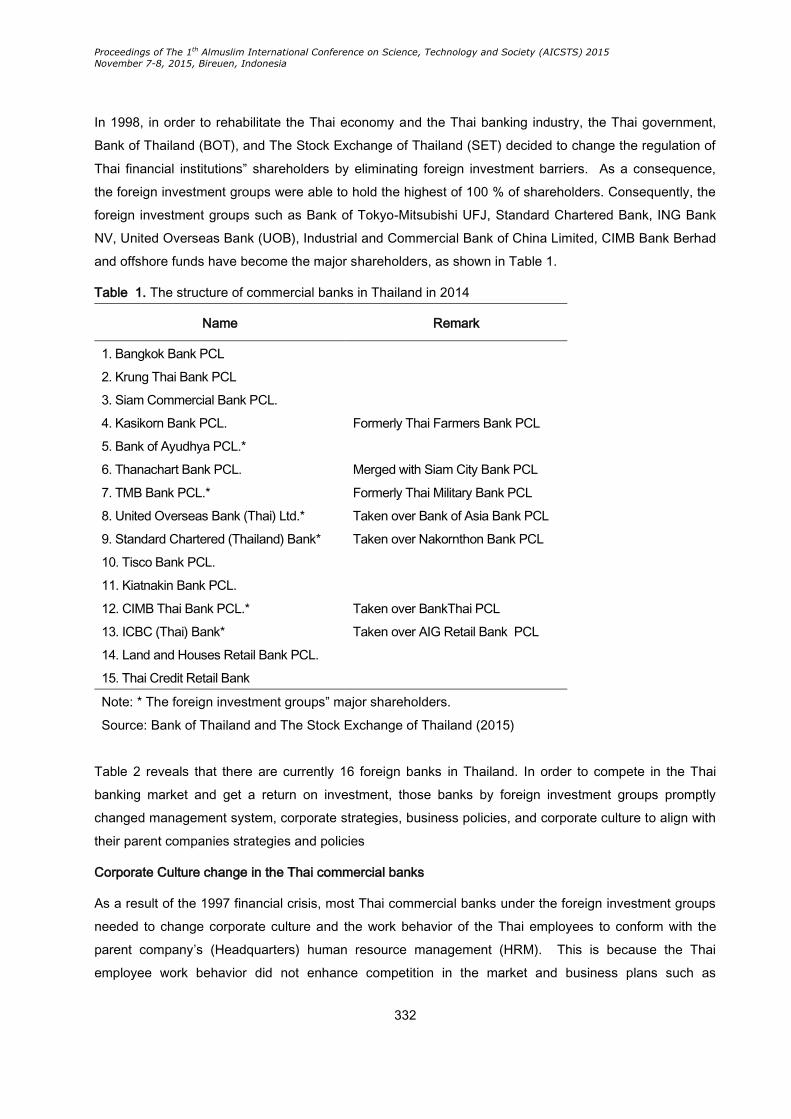
Proceedings of The 1th Almuslim International Conference on Science, Technology and Society (AICSTS) 2015
November 7-8, 2015, Bireuen, Indonesia
332
In 1998, in order to rehabilitate the Thai economy and the Thai banking industry, the Thai government,
Bank of Thailand (BOT), and The Stock Exchange of Thailand (SET) decided to change the regulation of
Thai financial institutions” shareholders by eliminating foreign investment barriers. As a consequence,
the foreign investment groups were able to hold the highest of 100 % of shareholders. Consequently, the
foreign investment groups such as Bank of Tokyo-Mitsubishi UFJ, Standard Chartered Bank, ING Bank
NV, United Overseas Bank (UOB), Industrial and Commercial Bank of China Limited, CIMB Bank Berhad
and offshore funds have become the major shareholders, as shown in Table 1.
Table 1. The structure of commercial banks in Thailand in 2014
Name Remark
1. Bangkok Bank PCL
2. Krung Thai Bank PCL
3. Siam Commercial Bank PCL.
4. Kasikorn Bank PCL. Formerly Thai Farmers Bank PCL
5. Bank of Ayudhya PCL.*
6. Thanachart Bank PCL. Merged with Siam City Bank PCL
7. TMB Bank PCL.* Formerly Thai Military Bank PCL
8. United Overseas Bank (Thai) Ltd.* Taken over Bank of Asia Bank PCL
9. Standard Chartered (Thailand) Bank* Taken over Nakornthon Bank PCL
10. Tisco Bank PCL.
11. Kiatnakin Bank PCL.
12. CIMB Thai Bank PCL.* Taken over BankThai PCL
13. ICBC (Thai) Bank* Taken over AIG Retail Bank PCL
14. Land and Houses Retail Bank PCL.
15. Thai Credit Retail Bank
Note: * The foreign investment groups” major shareholders.
Source: Bank of Thailand and The Stock Exchange of Thailand (2015)
Table 2 reveals that there are currently 16 foreign banks in Thailand. In order to compete in the Thai
banking market and get a return on investment, those banks by foreign investment groups promptly
changed management system, corporate strategies, business policies, and corporate culture to align with
their parent companies strategies and policies
Corporate Culture change in the Thai commercial banks
As a result of the 1997 financial crisis, most Thai commercial banks under the foreign investment groups
needed to change corporate culture and the work behavior of the Thai employees to conform with the
parent company’s (Headquarters) human resource management (HRM). This is because the Thai
employee work behavior did not enhance competition in the market and business plans such as

Proceedings of The 1th Almuslim International Conference on Science, Technology and Society (AICSTS) 2015
November 7-8, 2015, Bireuen, Indonesia
333
international trading expansion, new foreigner customer groups expansion, and insurance products. At
the time, most of the Thai employees were used to their routine day-to-day jobs, and working in office and
branches. Moreover, they lack English proficiency skills and avoided to serve the foreign customers.
According to Hofstede (1980), Thai culture reflects strong collectivism. Furthermore, loyalty in a
collectivist culture is paramount and over-rides most other societal rules and regulations. In addition, Thai
people tend to avoid confrontation and uncertainty. Thus, changes in HRM practices were necessary to
enhance efficiency and effectiveness of the banks in the new competitive market environment.
Table 2: List of Foreign Banks in Thailand in 2015
Name Nationality
1. ANZ Bank Australia
2. Bank of America National Association USA
3. Bank of China China
4. BNP Paribas France
5. City Bank N.V. USA
6. Deutsche Bank AG Germany
7. HSBC Bank UK.
8. Indian Overseas Bank India
9. JP Morgan Chase Bank USA
10. Mizuho Corporate Bank Japan
11. Mega International Commercial Bank China
12. Overseas-Chinese Banking Corporate Ltd. Singapore
13. RHB Bank Berhad Malaysia
14. Sumitomo Mitsui Banking Corporation Japan
15. Sumitomo Mitsui Trust Bank Japan
16. The Royal Bank of Scotland N.V. UK
Source: Bank of Thailand (2015)
In the Thai commercial banks, the old HRM depended on policies and directives of the owner-family of
the banks. Lawler and Siengthai, (1997) affirmed that in some private Thai firms, the family-owned
controlled enterprises and the role of HRM. It tended to emphasise recruitment and salary negotiation for
candidates of high-level positions as well as use basic salary stucture to offer to candidates at the
operational level. In addition, HRM policy aimed to recruit new staffs from the well-known and wealthy
families (who are their customers) and major shareholder families. For employee development, HR
agency was acting like a coordinator for employee training course. Most training programs had been set
by employee agencies. Besides, some agencies had used the concept of “training on the job” by seniors
in their agencies. Furthermore, those companies were likely to develop employees by using informal
training programs which did not use job evaluation, formal performance assesment, and job classification.
Proceedings of The 1th Almuslim International Conference on Science, Technology and Society (AICSTS) 2015
November 7-8, 2015, Bireuen, Indonesia
334
On the other hand, the new HRM has aimed to recruit employees from several sources in Thailand and
other countries, to develop employees by providing internal and external course training programs, and to
motivate employees by offering salary, other benefits and awards based on team and individual
performance.
Due to the competition in the Thai banking market, Thai commercial banks, foreign banks, and non-
banking groups (such as department store credit cards, Thailand Post, the currency exchange business
companies, leasing companies, and outlet-payment service providers) would need to continue improving
their competitiveness in the banking market. As a consequence, all Thai commercial banks had gained
significant competitiveness by recruiting experienced banking specialists from other banks and financial
institutions in Thailand and other countries. They believed that specialists would be able to support their
businesses immediately. Therefore, the tight human resource market for banking and financial specialists
had led to high individual benefits offered by banks in Thailand. Moreover, all Thai commercial banks
appear to experience cross-generation organizational cultures and attitudes between two generations of
employees. The difference in the generations caused internal conflict and job stress in organization. The
old generation employees like to maintain their old way (social norms and practices) of brotherhood and
non-confrontation society. But the new generation employees like or prefer Western culture, because they
believed Western culture can quickly result in the progress of the company.
So, all Thai commercial banks emphasised the role of HRM to reduce all employee issues which had
used HRM into their business strategies and plans as HRM is one of the factors influenced their
businesses success or failure.
How do HRM influence firm performance?
This section discusses relevant literature on the relationship between HRM and some other variables,
namely, organizational change, corporate performance, business strategy and processes.
HRM and organizational change
HRM has a very important role in creating an understanding of organizational change between the
employees and the company in order to minimize possible internal conflicts. In addition, HRM is
responsible to manage the relationship between the number of employees and the change in
organizational structure, and to develop employee efficiency for the implementation of organizational
change.
The role of HRM in setting firm’s HRM strategies, HRM planning, HRM policies and practices related to
organizational change is through its basic activities including recruitment, selection and placement,
evaluation of employee performance, compensation, benefits, services, employee development,
employee disciplines, job assignment, HR safety and health, and labour relations. Walton and Lawrence
(1985) asserted that HRM policy covered four major areas: reward system, employee participation, job
design and work place, and employee selection and development. Evans (1986) asserted that HRM
practices could support organizational culture through functions, namely selection, development, reward,
Proceedings of The 1th Almuslim International Conference on Science, Technology and Society (AICSTS) 2015
November 7-8, 2015, Bireuen, Indonesia
335
and employee retention. Cowling and Newman (1995) and Garavan et al. (1998) asserted that HRM
influence supported the management of employment relationship. Lepak and Snell (1999) asserted that
knowledge-based employment is able to achieve a firm’s strategic objectives because knowledge-based
employment reflects employee value (human capital) in the core of the firms.
Several authors explained and identified the relationship between HRM and organizational change based
on the respondents’ attitudes, experiences, and information. Wong (1997) studied HRM policies in
Japanese companies, in Hong Kong to recruit and select the mid-career based on their experiences and
their personality. Dooreward and Benschop (2003) asserted that HRM has an important role in stimulating
the employee involvement in the change of business process of the organization. Cakar et al. (2003)
proposed that HRM process consists of three sub-processes: 1) make HRM strategy, 2) implement HRM
strategy, and 3) monitor impact on business results. Karami et al. (2004) studied HRM in the British
manufacturing industry and asserted that HRM involves the relationship between management strategy
and employee engagement in the firm. Poblos and Lytras (2008) studied the relationship between HRM,
organizational learning, and human capital by reviewing extensive relevant literature. They asserted that
effective HRM generated a higher level of profitability, less rotation, higher product quality, lower cost in
manufacturing, and a faster acceptation and implementation of the organizational change. Conway and
Monk (2010) studied HRM in the Irish health service in Ireland. They found that the organization
developed its human resource management to cope with organizational change, and defined the role of
HR to respond to its employees through workplace practices, appraisal, training, development,
recruitment, and selection. Moideenkutty et al. (2011) studied HRM in Oman, and found that HRM
practices and policies in term of employee development and behavior were positively related to corporate
performance.
HRM and corporate performance
HRM practices are to set the criteria of evaluation to measure the employee performance. Yang (2006)
categorized HRM practices into the following: human resource planning, recruiting and selecting, work
design and analysis, training and education, job rotation, leadership development, performance appraisal,
incentive compensation, benefits and profit sharing, employee development, employee security and
health, and employee relations. In addition, HRM strategy and policy have emphasised employee
understanding and the enhancement of employee skills and attitudes by offering training courses for
employees of all business groups in order to build competitiveness and business opportunities. Huselid
(1995) explained that HRM practices have influenced corporate performance through the organizational
structure by encouraging employee participation. Delaney and Huselid (1996) asserted that progressive
HRM practices in terms of training, incentive compensation, and selecting in staffing are positively and
significantly associated with corporate performance. Becker and Huselid (1998) insisted that in the new
economic environment, HRM, including HR function and HR system, has been received the opportunity to
integrate a strategic role into firm performance. Poor and Plesoianu (2010) asserted that HRM practices
Proceedings of The 1th Almuslim International Conference on Science, Technology and Society (AICSTS) 2015
November 7-8, 2015, Bireuen, Indonesia
336
improved compensation, recruitment, selection, performance appraisal, rewards, training and
development, employee participation, and HR planning.
HRM and business strategy and business process
HRM has also an influence on the firm’s business strategies and business processes. This is through
activities such as employee development, employment, amount of employees planned, employee time
management, etc. Several authors have studied the relationship between HRM and firm’s business
strategies and business processes. Huselid (1993) assert that HRM practices supported business
strategy by building financial performance, cost reduction, quality, delivery performance, and product
innovation. Kane and Palmer (1995) asserted that business process (technology) change has an effect
on HRM policies and practices by causing changes in the staffing levels, knowledge, skill, and attitudes
needed in the workplace. Wang and Shyu (2008) affirmed that HRM performance could improve and
support employee performance, organization growth and development, and enhance company’s core
competitive advantage. Baptiste (2008) studied the role of HRM, and asserted that HRM could support
corporate restructuring in term of business strategy, improve corporate performance, and build
competitive advantage. HRM in the service sector industries has been associated with the need to
improve quality and efficiency of service provision continually within increasingly competitive conditions.
Trim (2004) asserted that HRM development has a strategic role in the organization that is growing and
hence developing a more complex organizational structure and organizational growth.
To sum up, HRM is found to be positively related to business strategy, organization structure, and
corporate performance dependent on HRM strategy, HRM practices, and HRM policy.
Background of the Siam Commercial Bank (SCB)
The Siam Commercial Bank (SCB) is the large commercial bank in Thailand. In 2014, SCB had 1,197
branches and more than 9,537 ATMs in Thailand, the number of employee had more than 18,000
persons, and 4 overseas branches in Singapore, Hong Kong, Mynmar, and Lao PDR. With the emerging
Asian market opportunities, SCB has invested its money in Asian markets such as in Cambodia under the
name of “Cambodian Commercial Bank” by using owner strategy, in Vietnam under name of “VinaSiam
Bank” by using joint venture strategy and providing banking know-how and capital, and in the People’s
Republic of China by using alliance strategy because this strategy was able to save cost investment.
SCB started in January 1906 as the first local commercial bank in Thailand. In the financial crisis in 1997,
SCB was one of Thai commercial banks which was hit by the financial crisis to put the Bank on the verge
of bankruptcy. Based on SCB’s determination over 100 years, it had emphasised Thai major
shareholders and sustained the Bank’s business.
For business operational change, in 2000, SCB by its board of directors decided to start its organizational
change by changing business strategies and organizational culture. As a result, SCB was able to
compete in the Thai banking market. Thus, during 2001-2014, In order to become a leader in the banking
market, the top management level continually implements SCB’s organizational change in all business
Proceedings of The 1th Almuslim International Conference on Science, Technology and Society (AICSTS) 2015
November 7-8, 2015, Bireuen, Indonesia
337
structures and economic situations, and quickly expands its businesses in other business areas and
customer groups by increasing the number of new branches and launching new banking products.
Consequently, each year, SCB used HRM strategy to recruit a lot of new employees from universities,
other companies and other financial institutions.
The role of HRM is revived, the result of cultural change policy is integrated in organizational structure
according to the executive management’s plans and expectations. As a result, some employee groups
resisted in organizational culture change due to the following: 1) SCB’s old culture had been brotherhood
culture for more than 90 years, 2) SCB had never changed this culture, and 3) SCB was a conservative
bank style to operate business. In addition, SCB continued to select and recruit a lot of employees for
business expansion which led to different cultures and behavior between old employees and new
employees while SCB believed that the achievement of SCB’s business must obtain its organizational
behavior change and employee participation.
The decision to change corporate culture and employee behavior in SCB is an important decision that
might have affected SCB reputation. With this event, the HRM systems used in SCB need to combine
between Thai culture and Western culture which have been accepted both within and outside the
organization because SCB’s major shareholder is the Crown Property of Bureau. SCB has tried to
enhance the role of HRM in business strategy implementation to simultaneously change and develop
business strategies and plans during the volatile economic environment.
Based on the result of the Bank business strategy development and HRM development, SCB flourished
to the highest market capitalization among Thai financial institutions, it became the leading bank in terms
of number of branches, ATMs, market capitalization, and marketshare in the banking market. Moreover,
during 2005 - 2014, SCB has paid a dividend to shareholders.
Research Methodology
This paper uses a two-stage methodology using a qualitative research, grounded theory, and quantitative
research method in data collection to anlyse the SCB efficiency before and after changes in HRM policies
and practices. In-depth interview is used to collect the primary data and then a questionnaire survey is
conducted with the same group of interviewees or respondents. Batiz-Lazo and Wood (2003) studied
banking strategy in European and Mexican banking and proposed their research design based on
qualitative research, and data collection using in-depth interview and open-ended questionnaire.
For questionnaire design, some questions of the in-depth interview and open-ended questionnaire survey
were designed and applied by studying from several previous HRM researches. Before the interviews, the
researcher sent all questions of this research to two hundred and ninety one interviewees so that they
can prepare their responses by registered mail. Furthermore, the respondents were pleased to answer
questions based on their experience working in the position, job responsibility and business target. The
interviews were tape recorded. Each interview session took approximately 45-60 minutes. Besides, some
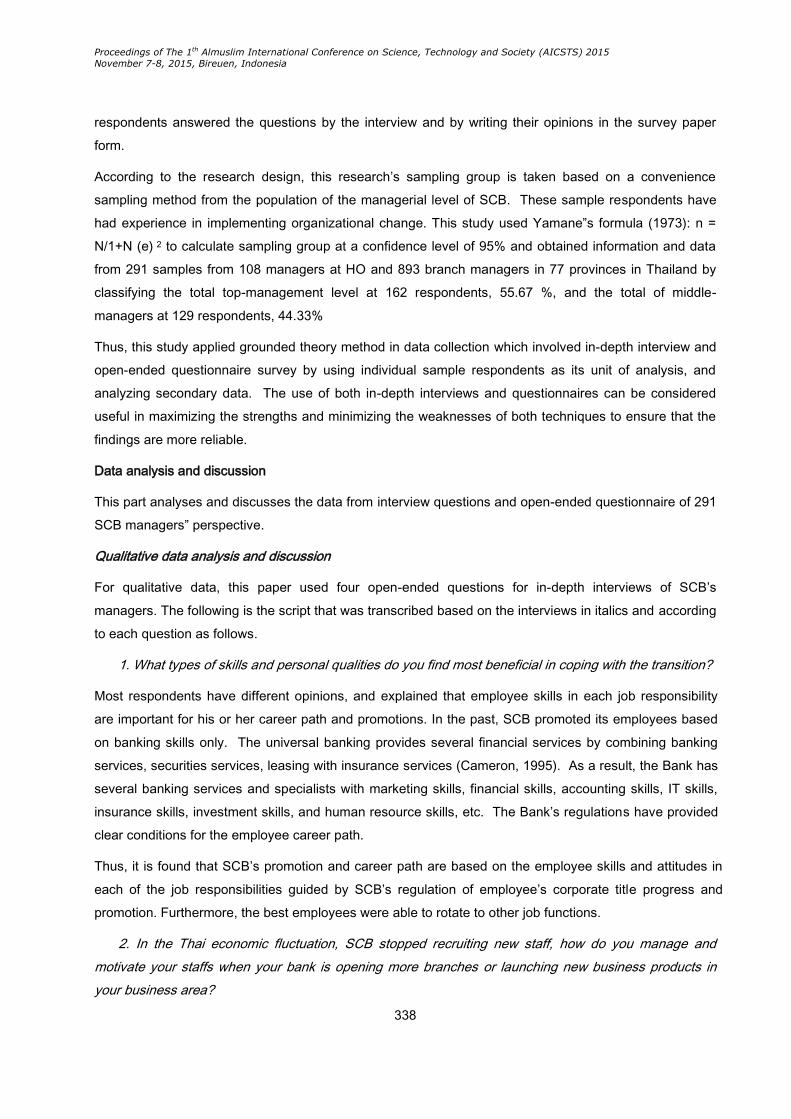
Proceedings of The 1th Almuslim International Conference on Science, Technology and Society (AICSTS) 2015
November 7-8, 2015, Bireuen, Indonesia
338
respondents answered the questions by the interview and by writing their opinions in the survey paper
form.
According to the research design, this research’s sampling group is taken based on a convenience
sampling method from the population of the managerial level of SCB. These sample respondents have
had experience in implementing organizational change. This study used Yamane”s formula (1973): n =
N/1+N (e) 2 to calculate sampling group at a confidence level of 95% and obtained information and data
from 291 samples from 108 managers at HO and 893 branch managers in 77 provinces in Thailand by
classifying the total top-management level at 162 respondents, 55.67 %, and the total of middle-
managers at 129 respondents, 44.33%
Thus, this study applied grounded theory method in data collection which involved in-depth interview and
open-ended questionnaire survey by using individual sample respondents as its unit of analysis, and
analyzing secondary data. The use of both in-depth interviews and questionnaires can be considered
useful in maximizing the strengths and minimizing the weaknesses of both techniques to ensure that the
findings are more reliable.
Data analysis and discussion
This part analyses and discusses the data from interview questions and open-ended questionnaire of 291
SCB managers” perspective.
Qualitative data analysis and discussion
For qualitative data, this paper used four open-ended questions for in-depth interviews of SCB’s
managers. The following is the script that was transcribed based on the interviews in italics and according
to each question as follows.
1. What types of skills and personal qualities do you find most beneficial in coping with the transition?
Most respondents have different opinions, and explained that employee skills in each job responsibility
are important for his or her career path and promotions. In the past, SCB promoted its employees based
on banking skills only. The universal banking provides several financial services by combining banking
services, securities services, leasing with insurance services (Cameron, 1995). As a result, the Bank has
several banking services and specialists with marketing skills, financial skills, accounting skills, IT skills,
insurance skills, investment skills, and human resource skills, etc. The Bank’s regulations have provided
clear conditions for the employee career path.
Thus, it is found that SCB’s promotion and career path are based on the employee skills and attitudes in
each of the job responsibilities guided by SCB’s regulation of employee’s corporate title progress and
promotion. Furthermore, the best employees were able to rotate to other job functions.
2. In the Thai economic fluctuation, SCB stopped recruiting new staff, how do you manage and
motivate your staffs when your bank is opening more branches or launching new business products in
your business area?
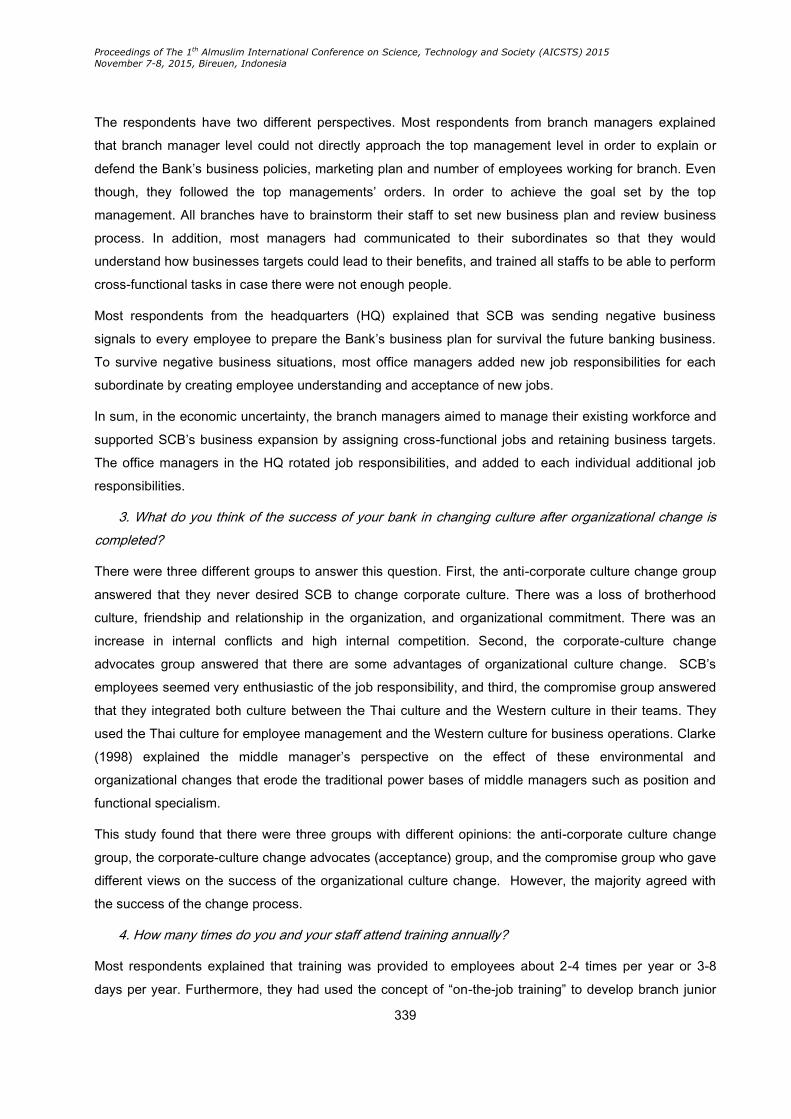
Proceedings of The 1th Almuslim International Conference on Science, Technology and Society (AICSTS) 2015
November 7-8, 2015, Bireuen, Indonesia
339
The respondents have two different perspectives. Most respondents from branch managers explained
that branch manager level could not directly approach the top management level in order to explain or
defend the Bank’s business policies, marketing plan and number of employees working for branch. Even
though, they followed the top managements’ orders. In order to achieve the goal set by the top
management. All branches have to brainstorm their staff to set new business plan and review business
process. In addition, most managers had communicated to their subordinates so that they would
understand how businesses targets could lead to their benefits, and trained all staffs to be able to perform
cross-functional tasks in case there were not enough people.
Most respondents from the headquarters (HQ) explained that SCB was sending negative business
signals to every employee to prepare the Bank’s business plan for survival the future banking business.
To survive negative business situations, most office managers added new job responsibilities for each
subordinate by creating employee understanding and acceptance of new jobs.
In sum, in the economic uncertainty, the branch managers aimed to manage their existing workforce and
supported SCB’s business expansion by assigning cross-functional jobs and retaining business targets.
The office managers in the HQ rotated job responsibilities, and added to each individual additional job
responsibilities.
3. What do you think of the success of your bank in changing culture after organizational change is
completed?
There were three different groups to answer this question. First, the anti-corporate culture change group
answered that they never desired SCB to change corporate culture. There was a loss of brotherhood
culture, friendship and relationship in the organization, and organizational commitment. There was an
increase in internal conflicts and high internal competition. Second, the corporate-culture change
advocates group answered that there are some advantages of organizational culture change. SCB’s
employees seemed very enthusiastic of the job responsibility, and third, the compromise group answered
that they integrated both culture between the Thai culture and the Western culture in their teams. They
used the Thai culture for employee management and the Western culture for business operations. Clarke
(1998) explained the middle manager’s perspective on the effect of these environmental and
organizational changes that erode the traditional power bases of middle managers such as position and
functional specialism.
This study found that there were three groups with different opinions: the anti-corporate culture change
group, the corporate-culture change advocates (acceptance) group, and the compromise group who gave
different views on the success of the organizational culture change. However, the majority agreed with
the success of the change process.
4. How many times do you and your staff attend training annually?
Most respondents explained that training was provided to employees about 2-4 times per year or 3-8
days per year. Furthermore, they had used the concept of “on-the-job training” to develop branch junior

Proceedings of The 1th Almuslim International Conference on Science, Technology and Society (AICSTS) 2015
November 7-8, 2015, Bireuen, Indonesia
340
staffs by senior staffs in the branch. Sometimes, product managers from the HQ trained branch staffs
about their new products specifics.
Quantitative data analysis and discussion
Based on open-ended questionnaire, this paper analyzed respondent perspectives on the relationship
between before and after the SCB’s change in HRM strategy, HRM policies and practices, and HRM
performance by using Wilcoxon rank sum test, two-tailed test with the data obtained from the five-point
scale instrument (1 = strongly disagree: 5 = strongly agree).
The following hypotheses were tested in this research:
H0: There is no difference in SCB’s efficiency level before and after the Bank’s change.
H1: There is a difference between the SCB’s efficiency before and after the Bank’s change.
ρ = < 0.05
In order to prove the internal consistency and reliability of the result of the survey data, this paper used
Cronbach’s alpha coefficient to test all data of the survey. The reliability alpha coefficient of the survey
data indicate an alpha of 0.8532.
Based on the analyses of the perception of the sample respondents, the following are the results
reflecting the impact of HRM on corporate performance.
1. What do you think about the result of HRM strategy change on the organizational change?
Table 3 suggested that there are statistically significant differences between before and after SCB’s HRM
strategy change all variables with ρ < 0.05. Regarding the relationship between HRM strategy and
organizational change, the respondents asserted that all variables of HRM strategy, namely, scope of
work, organizational leader, employee development, employee behavior change, corporate cultural
change, and source of human resource were able to support organizational change. Zucchi and Edwards
(1996) identified human resource to be related to the following organizational components as organization
structure and culture, the role of managers, team working, and reward system.
With respect to the efficiency between before and after HRM strategy change, the respondents agreed
that the efficiency of almost all dimensions after HRM strategy change implemented is more than before
change as indicated by the fact that the score of after change is higher than before change. Moreover, the
respondents strongly agreed that there is a relationship between HRM strategy and SCB’s business
improvement. They asserted that the new HRM strategy was one factor that drove SCB to become a
leader commercial bank in Thailand. Furthermore, some respondents believed that new HRM strategy
could change employee behavior. However, there were some respondents who did not agree that new
HRM strategy was able to change employee behavior. In their view, as new SCB’s HRM strategy needed
to change employee behavior immediately, this had led to some employees’ resistance.

Proceedings of The 1th Almuslim International Conference on Science, Technology and Society (AICSTS) 2015
November 7-8, 2015, Bireuen, Indonesia
341
Table 3. Results of organizational change before and after HRM strategy change
Org. change After-before
HRM strategy change
N Sum of Ranks Z Sig.
Neg Pos NC Neg Pos
Scope of work 175 36 80 18664.00 3702.00 -8.764 .000
Organizational leadership 209 19 63 24081.00 2025.00 -11.669 .000
Employee development 111 65 115 9334.00 6242.00 -2.363 .018
Employee behavior change 104 107 80 9224.00 13142.00 -2.315 .021
Organizational culture change 161 75 52 17444.00 11236.00 -2.957 .003
Relationship between HRM &
Organization change
164 33 94 15708.00 3795.00 -7.745 .000
Source of human resource 119 54 118 9652.50 5398.50 -3.522 .000
Notes: Neg (Negative Ranks): HRM strategy before < HRM strategy after,
Pos (Positive Ranks): HRM strategy before > HRM strategy after,
NC (No change): HRM strategy before = HRM strategy after,
Sig: Asymp. Sig. (2-tailed)
2. What do you think about the result of HRM policies and practices change on organizational
change?
Table 4 suggests that all variables (dimensions) are statistically and significantly different between before
and after SCB’s HRM policies & practices change at the 95% confidence level (ρ < 0.05). Regarding the
relationship between HRM policies & practices and organizational change, the respondents asserted that
all variables of HRM policies & practices, namely, management style, employee attitude, supporting
business competition, customer focus, supporting business growth, customer behavior change, selection &
recruitment, organization responsibility, learning in organization, employee satisfaction, employee
decision making, power, influence, politics in organization reduction, creation productivity, job stress
reduction, employee awards and benefits, and cross-functional jobs were able to affect SCB’s organizational
change. Petrescu and Simmons (2008) asserted that HRM practices consist of work organization,
supervision, employee involvement, recruitment and selection, training and learning, regulation, and pay
practices, including seniority-based pay and performance-related pay.
Based on the efficiency between before and after changes of HRM policies and practices, the
respondents agreed that the efficiency of most variables of after HRM policies and practice change were
higher than before change. In addition, the respondents affirmed that the relationship between the new
HRM policies and practices and SCB organizational change is able to support SCB’s business plan (such as
business competition, customer focus, business growth, customer behavior change). However, the
respondents did not accept the efficiency of after change in term of management style, organizational
responsibility, employee decision making, and reduction of job stress in organization because SCB still
Proceedings of The 1th Almuslim International Conference on Science, Technology and Society (AICSTS) 2015
November 7-8, 2015, Bireuen, Indonesia
342
uses centralized management and authorization by top-management level, and new HRM policies and
practices caused high internal competition by offering individual awards and benefits.
Table 4. Results of organizational change before and after of HRM policies and practices change
Org. Change After –before
HRM policies and practices
change
N Sum of Ranks
Z Sig. Neg Pos NC Neg Pos
Management style 67 161 63 7423.50 18692.50 -5.884 .000
Employee attitude 124 101 66 16643.00 8782.50 -4.194 .000
Supporting business competition 246 12 23 31191.00 2220.00 -12.497 .000
Customer focus 245 12 34 32133.00 1020.00 -13.595 .000
Supporting business growth 246 9 36 31830.50 810.00 -13.805 .000
Customer behavior change 225 9 57 26502.00 993.00 -12.750 .000
Selection & recruitment 90 39 162 6028.50 2356.50 -4.595 .000
Organization responsibility 57 123 111 5410.50 10879.50 -4.041 .000
Learning in organization 168 48 75 17022.00 6414.00 -6.115 .000
Employee satisfaction 117 106 68 10471.50 14504.50 -2.201 .028
Employee Decision making 43 127 121 3125.50 11409.50 -6.604 .000
Power, influence, politics in
organization reduction
122 70 99 11753.00 6775.00 -3.362 .000
Creation productivity 198 30 63 22671.00 3435.00 -10.072 .000
Job stress reduction 29 216 46 2424.00 27711.00 -11.568 .000
Employee rewards and
benefits
186 61 44 22182.00 8446.00 -6.258 .000
Cross job function 152 53 86 15654.00 5461.00 -6.180 .000
Notes: Neg (Negative Ranks): HRM policies & practices before < HRM policies & practices after,
Pos (Positive Ranks): HRM policies & practices before > HRM policies & practices after,
NC (No change): HRM policies & practices before = HRM policies & practices after,
Sig: Asymp. Sig. (2-tailed)
3. What do you think about the effect of HRM change on the business process and performance?
Table 5 suggested that all variables are statistically and significantly different between before and after
SCB’s HRM change at the 95% confidence level (ρ < 0.05). Based on the relationship between HRM
performance and business process and performance, the respondents asserted that most of the variables
of HRM practices were able to support SCB’s business process and performance, namely, management
efficiency, customer satisfaction, employee participation, career path & promotion, attitude to team &
organization, turnover rate reduction, salary (reward) and benefits adjustment, employee skills and
attitudes, organizational commitment, employee conflict reduction, teamwork competency, employee
Proceedings of The 1th Almuslim International Conference on Science, Technology and Society (AICSTS) 2015
November 7-8, 2015, Bireuen, Indonesia
343
loyalty & engagement. Levine (1995) asserted that the enhancement of firm performance has related to
employee participations and skills in determining work achievement and method of works. However, they
did not agree that HRM performance in terms of employee job satisfaction, clear employee job assignment,
and internal communication were able to support SCB’s business process and performance. They
understood team efficiency led to business efficiency.
Table 5. Results of organizational performance before and after of HRM change implementation
Org. Performance After
– Before HRM Change
N Sum of scores Z Sig.
Neg Pos NC Neg Pos
Management efficiency 186 30 75 19927.50 3508.50 -9.295 .000
Employee job satisfaction 117 98 76 12085.00 11135.00 -.545 .586
Customer satisfaction 277 0 14 38503.00 0.00 -14.850 .000
Employee participation 209 9 73 22932.00 939.00 -12.241 .000
Career path & promotion 132 59 100 11820.00 6516.00 -3.680 .000
Attitude to team & organization 167 25 99 16277.50 2250.50 -9.779 .000
Turnover rate reduction 84 145 62 7505.00 18830.00 -5.776 .000
Salary and benefit adjustment 182 36 73 19341.00 4530.00 -8.217 .000
Employee skills and attitudes 138 64 83 12934.00 7569.00 -3.391 .000
Employee job assignment
clear
49 38 204 2332.00 1496.00 -1.867 .062
Internal communication 124 98 69 13993.50 10758.50 -1.761 .078
Organizational commitment 32 187 72 2428.00 21662.00 -10.403 .000
Employee conflict reduction 55 118 118 3682.50 11368.50 -5.967 .000
Teamwork competency 122 62 107 10011.50 7008.50 -2.177 .029
Employee loyalty & engagement 51 129 111 3204.00 13086.00 -7.264 .000
Notes: Neg (Negative Ranks): HRM performance before < HRM performance after,
Pos (Positive Ranks): HRM performance before > HRM performance after,
NC (No change): HRM performance before = HRM performance after,
Sig: Asymp. Sig. (2-tailed)
Regarding the efficiency between before and after HRM performance change, the respondents agreed
that the efficiency of most variables of after HRM performance change were more than before the
change. Moreover, the respondents insisted that the quality of HRM was able to affect customer emotion
(customer satisfaction). However, the respondents did not accept the efficiency of after change in terms
of turnover rate reduction, clear employee job assignment, organizational commitment, employee conflict
reduction, and employee loyalty & engagement. This is because as a result of SCB changed organizational
culture and the fact that other financial institutions were also expanding and recruiting new staffs by offering high
salary and benefits. This has led to the tight banking job market and led to higher turnover rate at SCB. Thus,
Proceedings of The 1th Almuslim International Conference on Science, Technology and Society (AICSTS) 2015
November 7-8, 2015, Bireuen, Indonesia
344
this suggests that SCB will need to continually adjust its HRM policies, strategy and practices to cope with the
employment market conditions as well.
Conclusion
This paper investigates the role of HRM in formulating HRM strategy, HRM policies and practices which
provide crucial support to the Thai commercial banks’ business performance since the financial crisis in
Thailand. It takes Siam Commercial Bank (SCB), one of the largest banks in Thailand as a case study. In
this paper, we first describe the scenario in the Thai banking industry. Then, we discuss the corporate
culture change in the banking industry. Relevant literature is reviewed on the impact of HRM on
corporate performance and hypotheses are formulated. The study uses both qualitative and quantitative
data to examine the impact of HRM on the SCB performance.
Based on the interview data and survey data of SCB sample employees, it is concluded that the role of
HRM is significant in supporting the SCB organizational change, and business strategy. This is
evidenced by the fact that after SCB implemented new HRM strategy, HRM policies and practices, the
employee performance has led to positive internal development that simultaneously enhance the growth
of SCB’s business performance. In addition, SCB achieved the change in organizational culture,
employee skills and attitudes. As a result, SCB could change the attitude and behavior of customers
toward them by showing high score of customer satisfaction.
In sum, SCB need to continuously re-align its human resource strategy, policies and practices as well as
its control and performance measurement to ensure the desirable organizational performance.
References
Bank of Thailand (2015) “Financial Business under the Bank of Thailand’s supervision and examination”,
Thailand.
Baptiste, R.N. (2008) “Tightening the link between employee wellbeing at work and performance”, A new
dimension for HRM and Performance Decision, Vol. 46, No. 2, pp. 286-309.
Becker, B.E. and Huselid, M.A. (1998) “High performance work system and firm performance: A synthesis
of research and managerial implications”, Research in Personnel and Human Resource
Management, Vol. 6, pp. 53-101.
Batiz-Lazo, B. and Wood, D. (2003) “Strategy, competition and diversification in European and Mexican
Banking”, International Journal of Bank Marketing, Vol. 21, No. 4, pp. 202-216.
Cakar, F., Bititci, S.U. and Macbryde, J. (2003) “A business process approach to human resource
management”, Business Process Management Journal, Vol. 9, No. 2, pp. 190-207.
Cameron, W.C. (1995) “Universal banking and US banking in 1990s”, International Journal of Social
Economics, Vol. 22, No. 4, pp. 12-19.
Proceedings of The 1th Almuslim International Conference on Science, Technology and Society (AICSTS) 2015
November 7-8, 2015, Bireuen, Indonesia
345
Clarke, M. (1998) “Can specialists be general managers? Developing paradoxical thinking in middle
managers”, Journal of Management Development, Vol. 17, No 3, pp. 191-206.
Conway, E. and Monk, K. (2010) “The devolution of HRM to middle management in the Irish Health
service”, Personnel Review, Vol. 39, No. 3, pp. 361-374.
Cowling, A. and Newman, K. (1995) “Banking on people TQM, Service quality & human resource”,
Personnel Review, Vol. 24, No. 7, pp. 25-40.
Delaney, J.T. and Huselid, M.A. (1996) “The impact of human resource management practices on
perceptions of organizational performance”, Academy of Management Journal, Vol. 39, No. 4, pp.
949-969.
Dooreward, H. and Benschop, Y. (2003) “HRM and organizational change: an emotional endeavor”,
Journal of Organizational Change Management, Vol. 16, No 3, pp. 272-286.
Evans, P. (1986) “The context of strategic human resource management policy in complex firms”,
Management Forum, Vol. 6, pp. 309-18.
Garavan, T., Morley, M. & Heraty, N. (1998). Managing human resource in a post command economy:
personnel administration or strategic HRM. Personnel Review, 27 (3), 200-212.
Hofstede, H.G. (1980) Culture”s consequences: International different in work-related value, Beverly Hill,
Sage, CA. USA.
Huselid, M. A. (1993) “HR”s contribution to the bottom line”, HR Magazine, Vol. 38, No. 2, pp. 362-3.
Huselid, M. A. (1995) “The impact of human resource practices on turnover, productivity, and corporate
financial performance”, Academy of Management Journal, Vol. 38, No. 3, pp. 635-872.
Kane, B. and Palmer, J. (1995) “Strategic HRM or managing the employment relationship?”, International
Journal of Manpower, Vol. 16, No.5/6, pp. 6-21.
Kaplan, R.S. and Norton, D.P. (1992) The balanced scorecard-measures that drive performance, Harvard
Business Review, January-February, pp. 71-9.
Karami, A., Analoui, F. and Cusworth, J. (2004) “Strategic Human Resource Management and Resource-
based approach: The evidence from the British Manufacturing Industry”, Management Research
News, Vol. 27, No. 6, pp. 50-68.
Lawler, J.J. and Siengthai, S. (1997) “Human resource management and strategy in Thai banking
industry”, Research and Practices Human Resource Management, Vol. 5, No 1, pp. 73-88.
Lepak, D.P. and Snell, S.A. (1999) “The human resource architecture: toward a theory of human capital
allocation and development”, Academy of Management Review, Vol. 24, No. 1, pp. 31-48.
Levine, D.I. (1995) Reinventing the workplac: How business and employees can both win, Brooking
Institution, Washington DC.
Proceedings of The 1th Almuslim International Conference on Science, Technology and Society (AICSTS) 2015
November 7-8, 2015, Bireuen, Indonesia
346
Moideenkutty U., Al-Lamki, A. and Murthy, Y.S.R. (2011) “HRM practice and Organizational Performance
in Oman”, Personal Review, Vol. 40, No. 2, pp. 239-251
Petrescu, I.A. and Simmons, R. (2008) “Human resource management practices and workers” Job
Satisfaction”, International Journal of Manpower, Vol. 29, No. 7, pp. 651-667.
Pinprayong, B. (2011) Corporate strategy, organizational restructuring, and corporate performance: A
case of Siam Commercial Bank, Unpublished Dissertation, School of Management, Asian Institute
of Technology, Bangkok.
Poblos, O.P. and Lytras, D.M. (2008) “Competencies and human resource management: implications for
organizational competitive advantage”, Journal of Knowledge Management, Vol. 12, No. 6, pp. 48-
55.
Poor, J. and Plesoianu, G. (2010) “Human resource management under change in the Romanian civil
service in an international context”, Employee Relations, Vol. 32, No. 3, pp. 281-309.
Siam Commercial Public Bank. (1997-2014) Annual report, Bangkok.
Trim, R.J.P. (2004) “Human Resource Management development and strategic management enhanced
by simulation exercises”, Journal of Management Development, Vol. 23, No. 4, pp. 399-413.
Walton, R.E. and Lawrence, P.R. (1985) Human Resource Management: Trends and Challenges,
Harvard Business School Press, Boston, MA.
Wang, D.S. and Shyu, C.L. (2008) “Will the strategic fit between business and HRM strategy influence
HRM effectiveness and Organizational Performance?”, International Journal of Manpower, Vol. 29,
No. 2, pp. 92-110
Wong, M.L.M. (1997) “Human resource policies in two Japanese retail stores”, International journal of
Manpower, Vol.18, No. 3, pp. 281-295.
Yang, C.C. (2006) “The impact of human resource management practices on the implementation of total
quality management: An empirical study on high-tech firm”, The TQM magazine, Vol.18, No 2, pp.
162-173.
Zucchi, F. and Edwards, S.J. (1999) “Human resource management aspects of business process
reengineering: a survey”, Business Process Management Journal, Vol. 5, No. 4, pp. 325-344.
Proceedings of The 1th Almuslim International Conference on Science, Technology and Society (AICSTS) 2015
November 7-8, 2015, Bireuen, Indonesia
347
Analysis of Leadership Style Effect of Camat toward Job
Performance Employees
1*Chairul Bariah, 2Saudah
1Lecturer at Development Economics Studies Program Faculty of Economics, Almuslim University,
Bireuen, 24261, Indonesia
2Students at Management Program Studies, College of Economics (STIE) Kebangsaan, Bireuen, 24251,
Indonesia
*Corresponding Author: [email protected]
Abstract
This study aims to determine how much influence the sub-district leadership style on job
performance of employees at Camat Pandrah office. Research using survey method
with quantitative approach, to explain the causal relationship between the two variables
through hypothesis testing where sampling using sampling techniques saturate the
entire member population take as many as 32 people to serve as a sample, in which the
data collection using the questionnaire. Data analysis techniques in this study were
simple linear regression, testing the correlation coefficient and the coefficient of
determination, and hypothesis testing. The results showed leadership style significantly
influence employee morale with the acquisition t count (7.786)> t table (2.042) and a
significant value t count smaller than the significance value α (0.000 <0.05), thus reject
Ho and accept Ha. Simple linear regression test results obtained by the regression
equation Y = 12.093 + 0.630, showing the pattern of a positive relationship between
leadership style with employee job performance. The test results showed a correlation
coefficient of leadership style has a very strong correlation with job performance, with a
power level of correlation of 0.818. In addition, variable variation Job Performance at
Camat Pandrah office able to be explained by the variable Leadership Style at 66.9%
and the remaining 33.1% is the influence of other factors not mentioned in this study. So
it can be concluded that leadership style has an important role in improving work
performance of employees.
Keywords: Leadership Style , Employee Job Performance, Camat Office
Introduction
Leadership is one of the factors that influence employee work performance, because it is through the
leadership style applied will affect discipline in the workplace. Job performance can only be achieved if
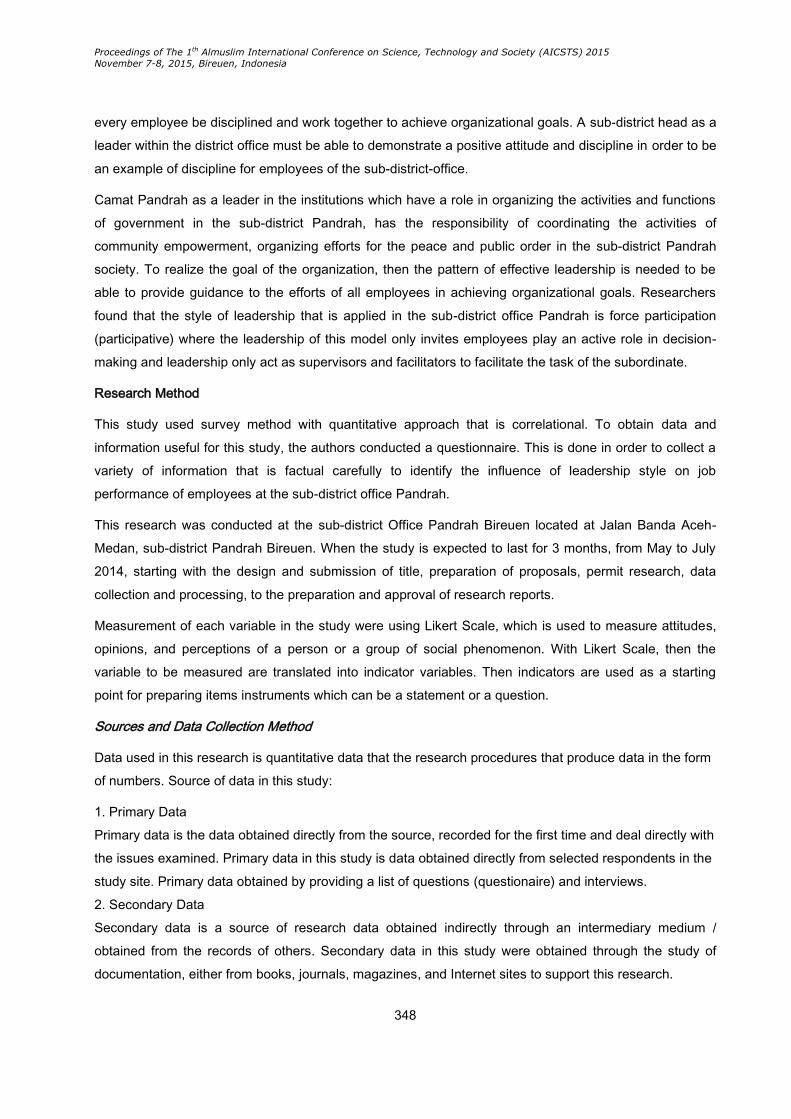
Proceedings of The 1th Almuslim International Conference on Science, Technology and Society (AICSTS) 2015
November 7-8, 2015, Bireuen, Indonesia
348
every employee be disciplined and work together to achieve organizational goals. A sub-district head as a
leader within the district office must be able to demonstrate a positive attitude and discipline in order to be
an example of discipline for employees of the sub-district-office.
Camat Pandrah as a leader in the institutions which have a role in organizing the activities and functions
of government in the sub-district Pandrah, has the responsibility of coordinating the activities of
community empowerment, organizing efforts for the peace and public order in the sub-district Pandrah
society. To realize the goal of the organization, then the pattern of effective leadership is needed to be
able to provide guidance to the efforts of all employees in achieving organizational goals. Researchers
found that the style of leadership that is applied in the sub-district office Pandrah is force participation
(participative) where the leadership of this model only invites employees play an active role in decision-
making and leadership only act as supervisors and facilitators to facilitate the task of the subordinate.
Research Method
This study used survey method with quantitative approach that is correlational. To obtain data and
information useful for this study, the authors conducted a questionnaire. This is done in order to collect a
variety of information that is factual carefully to identify the influence of leadership style on job
performance of employees at the sub-district office Pandrah.
This research was conducted at the sub-district Office Pandrah Bireuen located at Jalan Banda Aceh-
Medan, sub-district Pandrah Bireuen. When the study is expected to last for 3 months, from May to July
2014, starting with the design and submission of title, preparation of proposals, permit research, data
collection and processing, to the preparation and approval of research reports.
Measurement of each variable in the study were using Likert Scale, which is used to measure attitudes,
opinions, and perceptions of a person or a group of social phenomenon. With Likert Scale, then the
variable to be measured are translated into indicator variables. Then indicators are used as a starting
point for preparing items instruments which can be a statement or a question.
Sources and Data Collection Method
Data used in this research is quantitative data that the research procedures that produce data in the form
of numbers. Source of data in this study:
1. Primary Data
Primary data is the data obtained directly from the source, recorded for the first time and deal directly with
the issues examined. Primary data in this study is data obtained directly from selected respondents in the
study site. Primary data obtained by providing a list of questions (questionaire) and interviews.
2. Secondary Data
Secondary data is a source of research data obtained indirectly through an intermediary medium /
obtained from the records of others. Secondary data in this study were obtained through the study of
documentation, either from books, journals, magazines, and Internet sites to support this research.
Proceedings of The 1th Almuslim International Conference on Science, Technology and Society (AICSTS) 2015
November 7-8, 2015, Bireuen, Indonesia
349
Data Collection Method
Population is the generalization region consisting of the object / objects that have certain characteristics
defined by the researchers to be studied and then drawn conclusions. The population in this study was
overall employee at Camat Pandrah office which amounted to 32 people with the details of 23 civil
servants and the remaining 9 are employees are nonpermanent.
Sample a small part of the population, whereas sampling is a method of data collection that covers all the
elements in the sample. The samples in this study using saturated sampling technique. The sampling
technique have been relatively small population size of less than 100 people, so that all members of the
population used as a sample.
Determination Technique Data
Determination engineering data in this study are:
1. The questionnaire is a technique of determining the data by distributing questionnaires to be filled by
officials at the district office Pandrah.
2. Interviewing is a technique of determining data by question and answer to the district head at the
district office Pandrah.
3. Study the documentation is a technique of determining the data by collecting and studying data from
books, journals, magazines and the Internet that have relevance to this study.
Data Analysis and Testing Hypotheses
In analyzing the data, descriptive and analytical framework used inferential. Analysis descriptive analysis
is a way to describe and interpret the data so as to provide a clear picture of the issues. Descriptive
analysis conducted by researchers is to distribute respondents in table form so as to obtain a clear picture
of the distribution of respondents. While inferential analysis or quantitative analysis is used to test the
hypothesis by using statistical calculations. This study was used to test the effect of variable x to y
studied.
Test Validity and Reliability
Validity is the degree of reliability and validity of measuring instruments used. Instrument as valid means
showing a measuring tool that is used to obtain the data is valid or can be used to measure what should
be measured (Sugiyono, 2009: 137). This is done so that the data obtained are valid and reliable. Valid
instrument means the questionnaire used to collect the data was valid. Valid means the instrument can
be used to measure what is to be measured. While the instrument is reliable means instrument when
used several times to measure the same object, will generate the same data. Items questionnaire
considered valid if the value r count > r table in the table Pearson Moment.
Reliability testing instrument aims to show relatively consistent measurement results when the
measurement is done twice or more. In other words, the reliability of the instrument to characterize the
Proceedings of The 1th Almuslim International Conference on Science, Technology and Society (AICSTS) 2015
November 7-8, 2015, Bireuen, Indonesia
350
level of consistency. Reliability test processed using Cronbach Alpha formula. A construct said to be
reliable if the value of Cr on bach Alpha> 0.60.
Hypothesis testing
Testing the hypothesis in this study using t-test. T-test or partial test is used to test whether the
independent variables have a significant influence on the value of the dependent variable with hypothesis
testing formula as follows (Sugiyono, 2009):
tcount = √
√
Based on the statistical tools used and the research hypothesis above, the authors define two hypotheses
used to test the statistical null hypothesis (Ho) is formulated to be rejected and the alternative hypothesis
(Ha) is the hypothesis that the author formulated to be accepted, with the formulation as follows:
Ho: The leadership style (X) has no significant effect on employee job performance (Y) in the sub-district
office Pandrah.
Ha: Leadership style (X) a significant effect on employee job performance (Y) in the sub-district office
Pandrah.
Results and Discussion
Organization of Sub-district Pandrah
The composition of the sub-district Pandrah organization consists of seven sub-areas, and can be
described as follows:
a. camat;
b. Secretary of the sub-district;
c. Section of Government;
d. Peace and Order Section,
e. Community Development Section of the Village / Village
f. Section of Social Welfare;
g. General Section; and
h. Functional Group.
Leadership and Job Performance At Camat Pandrah office
Camat Leadership
Results of the study show Camat Pandrah sub-district office as supreme leader at the sub-district office
Pandrah use patterns of democratic leadership, to always give priority to unity and cooperation where
employees are considered part of the work team. Camat Pandrah saw its role as a coordinator and
integrator of various elements and components of the organization at the sub-district office Pandrah with
future-oriented and do the distribution of roles in accordance with the level of its level by emphasizing

Proceedings of The 1th Almuslim International Conference on Science, Technology and Society (AICSTS) 2015
November 7-8, 2015, Bireuen, Indonesia
351
cooperation teamwork, coordination, and high discipline in order to provide maximum service and for
finish all administrative offices and other administrative smoothly and on time in order to increase the
effectiveness of work. Besides that Camat Pandrah today are always open to suggestions, opinions and
criticism of subordinates.
Employee Job Performance
The results showed job performance of employees at the sub-district office Pandrah can be seen from the
feedback on the performance shown so far, especially with regard to the level of discipline and the
volume of work produced. Achievement by the employees working at the sub-district office Pandrah
include: (1) The majority of employees present on time according to the work schedule has been set,
especially on the part of employees picket; (2) The neatness and precision of execution of work in their
respective fields without limiting the volume of work in doing the work; (3) Creativity in the implementation
of the work, especially with regard to the function of information dissemination and outreach to the
community.
Instrument Testing
Results of testing the validity of the items statement for each independent variable (Leadership Style) as
well as for the question items on the dependent variable (Job Performance) from the results of the
questionnaire can be seen in Table 1 below.
Testing the validity of the questionnaire was done by distributing questionnaires to 32 respondents
specified as a sample. Questionnaire consisted of 20 questions divided pieces over 10 pieces statement
on leadership style variables (independent variables) and 10 pieces of a statement on Employee Job
Performance variable (dependent variable). Assessment is based on a score of answers lowest to the
highest score of the answer, which for the answer choices strongly disagree given a score of 1, the
answers do not agree given a score of 2, answers disagree given a score of 3, answers were scored 4
disagree strongly agree and answers were given a score of 5.
Tabel 1. Validity of Test Results Instrument
Variabel Statement
Point
Correlation
Product
Moment
Rtabel
Standard
Significan/
Probability (2-
tailed)
Criteria
Leadership
Style (X)
1 0,890 0,349 0,000 Valid
2 0,793 0,349 0,000 Valid
3 0,507 0,349 0,003 Valid
4 0,360 0,349 0,043 Valid
5 0,562 0,349 0,001 Valid
6 0,818 0,349 0,000 Valid
7 0,847 0,349 0,000 Valid
8 0,673 0,349 0,000 Valid
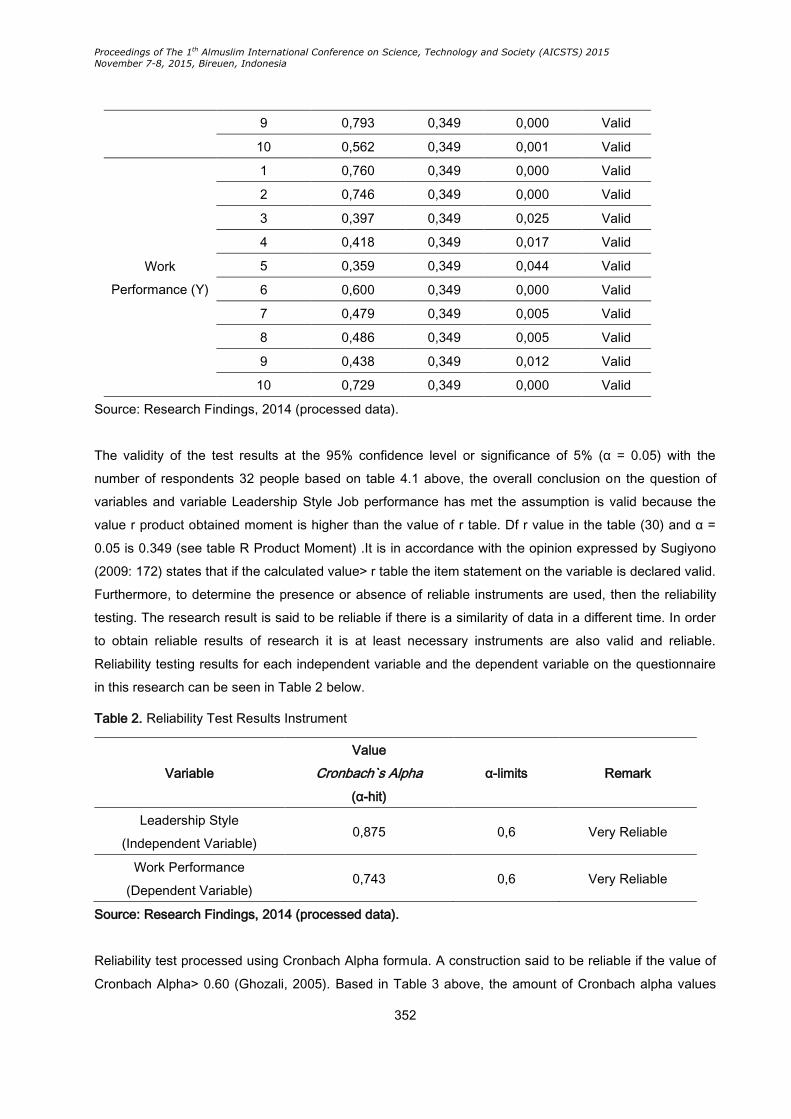
Proceedings of The 1th Almuslim International Conference on Science, Technology and Society (AICSTS) 2015
November 7-8, 2015, Bireuen, Indonesia
352
9 0,793 0,349 0,000 Valid
10 0,562 0,349 0,001 Valid
Work
Performance (Y)
1 0,760 0,349 0,000 Valid
2 0,746 0,349 0,000 Valid
3 0,397 0,349 0,025 Valid
4 0,418 0,349 0,017 Valid
5 0,359 0,349 0,044 Valid
6 0,600 0,349 0,000 Valid
7 0,479 0,349 0,005 Valid
8 0,486 0,349 0,005 Valid
9 0,438 0,349 0,012 Valid
10 0,729 0,349 0,000 Valid
Source: Research Findings, 2014 (processed data).
The validity of the test results at the 95% confidence level or significance of 5% (α = 0.05) with the
number of respondents 32 people based on table 4.1 above, the overall conclusion on the question of
variables and variable Leadership Style Job performance has met the assumption is valid because the
value r product obtained moment is higher than the value of r table. Df r value in the table (30) and α =
0.05 is 0.349 (see table R Product Moment) .It is in accordance with the opinion expressed by Sugiyono
(2009: 172) states that if the calculated value> r table the item statement on the variable is declared valid.
Furthermore, to determine the presence or absence of reliable instruments are used, then the reliability
testing. The research result is said to be reliable if there is a similarity of data in a different time. In order
to obtain reliable results of research it is at least necessary instruments are also valid and reliable.
Reliability testing results for each independent variable and the dependent variable on the questionnaire
in this research can be seen in Table 2 below.
Table 2. Reliability Test Results Instrument
Variable
Value
Cronbach`s Alpha
(α-hit)
α-limits Remark
Leadership Style
(Independent Variable) 0,875 0,6 Very Reliable
Work Performance
(Dependent Variable) 0,743 0,6 Very Reliable
Source: Research Findings, 2014 (processed data).
Reliability test processed using Cronbach Alpha formula. A construction said to be reliable if the value of
Cronbach Alpha> 0.60 (Ghozali, 2005). Based in Table 3 above, the amount of Cronbach alpha values

Proceedings of The 1th Almuslim International Conference on Science, Technology and Society (AICSTS) 2015
November 7-8, 2015, Bireuen, Indonesia
353
for the variables Leadership Style and Job Performance variables respectively 0.875 and 0.733 greater
than 0.6 so that instruments meet the stated assumptions reliable and can be used several times
consistently in measuring the same object.
Characteristics of Respondents
Characteristics of respondents who reported from the data processing is divided into four categories,
including the characteristics of respondents by sex, the characteristics of respondents by age, the
characteristics of respondents by education, and the characteristics of respondents based on the old
work.
Leadership Styles (X)
Results of assessment respondents' attitudes on leadership style variable, based on the descriptive
analysis of variables can be seen in Table 4.
Based on the table above 5 on the distribution of the results of questionnaires distributed to 32 employees
at the sub-district office Pandrah, showed a majority of employees expressing "agree" to the leadership
style that is applied at the sub-district office Pandrah. Assessment that states the overall attitude of
respondents said "agree" is based on the acquisition value of the mean average of 3.59 or in the interval
between 3.41 to score 4,20.Nilai average mean is obtained based on the division between the
accumulated value of the mean total divided by the number of questions on leadership style variables.
Table 4. Descriptive Analysis Of Leadership Styles variable (X)
Questions
Respondent Respons
(Frequency) Mean
SS S KS TS STS
1 Employees did not have any trouble
communicating with the leadership 11 3 13 4 1 3.59
2 Leaders always give commands that are
relevant to the ability of employees 6 10 12 1 3 3.47
3 Any guidance or guidance given leader
devoted to the common interest 5 10 10 6 1 3.38
4
Every decision taken leadership always
consider inputs and suggestions from
employees
22 - 9 1 - 4.34
5 Leadership provides the opportunity for
employees to provide opinions and input 3 9 17 2 1 3.34
6 Leadership provides a good example and
work with the subordinates 10 7 8 6 1 3.59
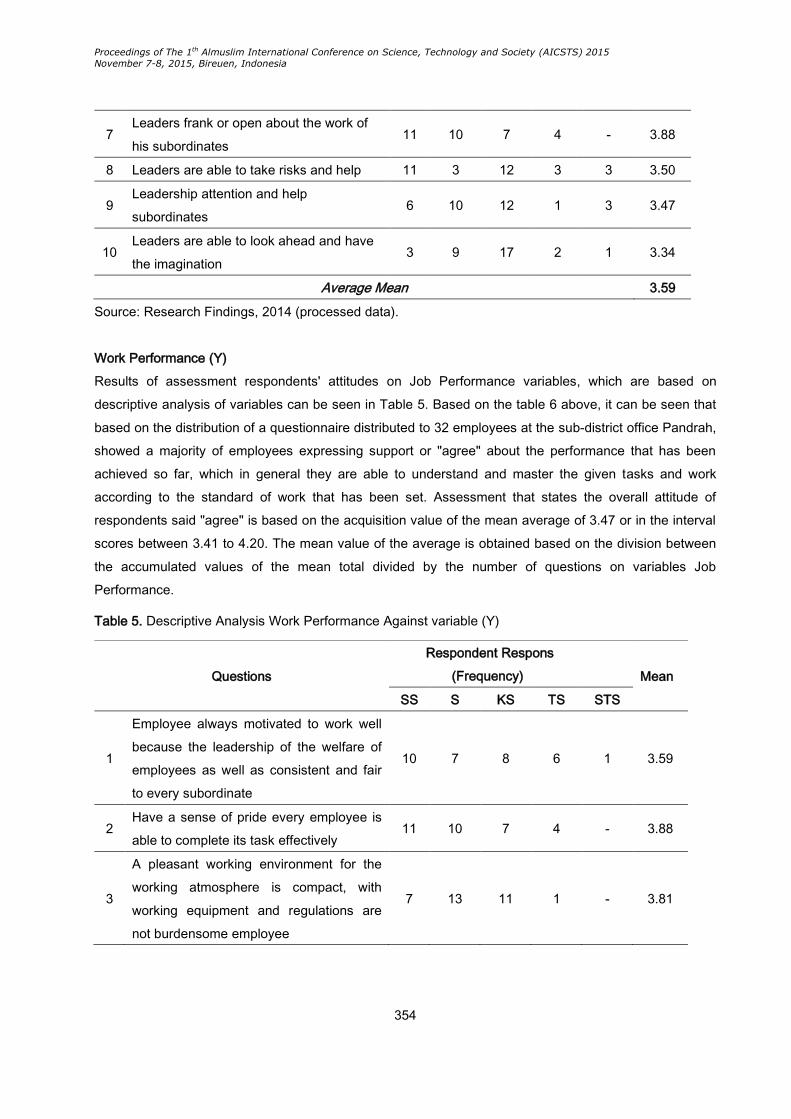
Proceedings of The 1th Almuslim International Conference on Science, Technology and Society (AICSTS) 2015
November 7-8, 2015, Bireuen, Indonesia
354
7 Leaders frank or open about the work of
his subordinates 11 10 7 4 - 3.88
8 Leaders are able to take risks and help 11 3 12 3 3 3.50
9 Leadership attention and help
subordinates 6 10 12 1 3 3.47
10 Leaders are able to look ahead and have
the imagination 3 9 17 2 1 3.34
Average Mean 3.59
Source: Research Findings, 2014 (processed data).
Work Performance (Y)
Results of assessment respondents' attitudes on Job Performance variables, which are based on
descriptive analysis of variables can be seen in Table 5. Based on the table 6 above, it can be seen that
based on the distribution of a questionnaire distributed to 32 employees at the sub-district office Pandrah,
showed a majority of employees expressing support or "agree" about the performance that has been
achieved so far, which in general they are able to understand and master the given tasks and work
according to the standard of work that has been set. Assessment that states the overall attitude of
respondents said "agree" is based on the acquisition value of the mean average of 3.47 or in the interval
scores between 3.41 to 4.20. The mean value of the average is obtained based on the division between
the accumulated values of the mean total divided by the number of questions on variables Job
Performance.
Table 5. Descriptive Analysis Work Performance Against variable (Y)
Questions
Respondent Respons
(Frequency) Mean
SS S KS TS STS
1
Employee always motivated to work well
because the leadership of the welfare of
employees as well as consistent and fair
to every subordinate
10 7 8 6 1 3.59
2 Have a sense of pride every employee is
able to complete its task effectively 11 10 7 4 - 3.88
3
A pleasant working environment for the
working atmosphere is compact, with
working equipment and regulations are
not burdensome employee
7 13 11 1 - 3.81
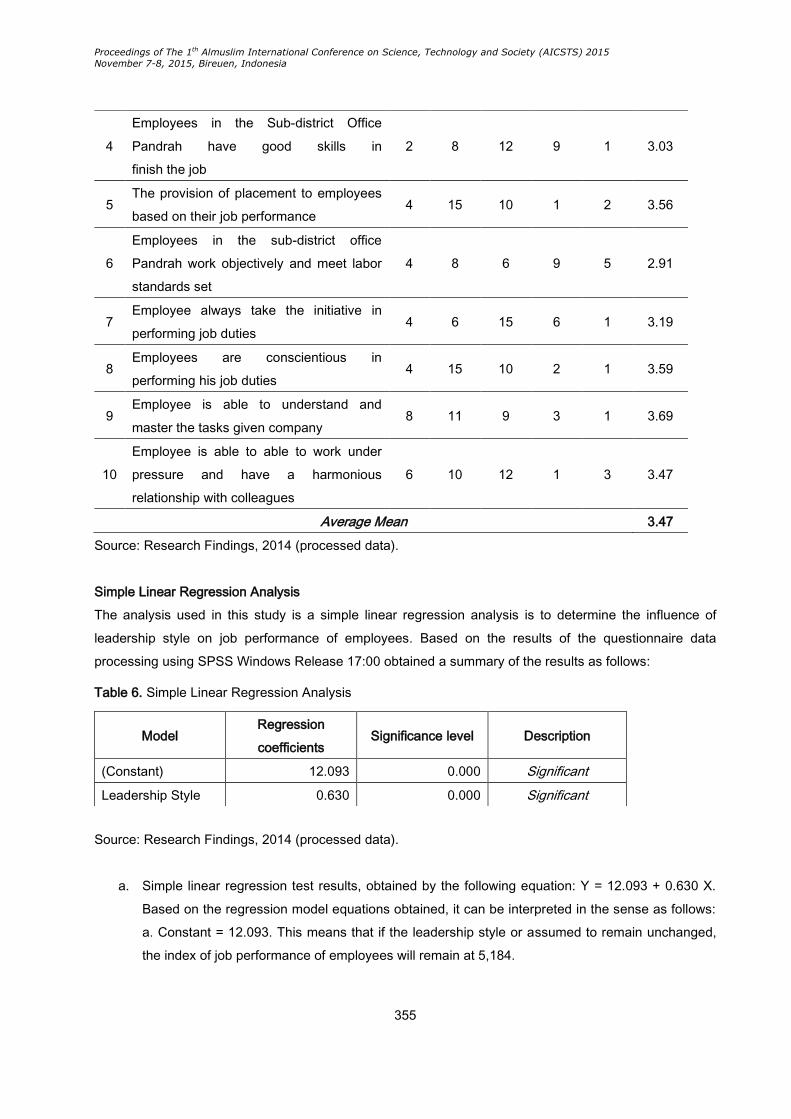
Proceedings of The 1th Almuslim International Conference on Science, Technology and Society (AICSTS) 2015
November 7-8, 2015, Bireuen, Indonesia
355
Source: Research Findings, 2014 (processed data).
Simple Linear Regression Analysis
The analysis used in this study is a simple linear regression analysis is to determine the influence of
leadership style on job performance of employees. Based on the results of the questionnaire data
processing using SPSS Windows Release 17:00 obtained a summary of the results as follows:
Table 6. Simple Linear Regression Analysis
Source: Research Findings, 2014 (processed data).
a. Simple linear regression test results, obtained by the following equation: Y = 12.093 + 0.630 X.
Based on the regression model equations obtained, it can be interpreted in the sense as follows:
a. Constant = 12.093. This means that if the leadership style or assumed to remain unchanged,
the index of job performance of employees will remain at 5,184.
4
Employees in the Sub-district Office
Pandrah have good skills in
finish the job
2 8 12 9 1 3.03
5 The provision of placement to employees
based on their job performance 4 15 10 1 2 3.56
6
Employees in the sub-district office
Pandrah work objectively and meet labor
standards set
4 8 6 9 5 2.91
7 Employee always take the initiative in
performing job duties 4 6 15 6 1 3.19
8 Employees are conscientious in
performing his job duties 4 15 10 2 1 3.59
9 Employee is able to understand and
master the tasks given company 8 11 9 3 1 3.69
10
Employee is able to able to work under
pressure and have a harmonious
relationship with colleagues
6 10 12 1 3 3.47
Average Mean 3.47
Model Regression
coefficients Significance level Description
(Constant) 12.093 0.000 Significant
Leadership Style 0.630 0.000 Significant

Proceedings of The 1th Almuslim International Conference on Science, Technology and Society (AICSTS) 2015
November 7-8, 2015, Bireuen, Indonesia
356
b. Regression coefficient (b) = 0.630. Regression coefficient variable Leadership Style (X) is
positive, indicating the positive influence of leadership style on job performance of employees at
the sub-district office Pandrah, where any increase effectiveness and efficiency in leadership
style that is applied in the sub-district office Pandrah at 100% then it will affect the achievement
employee by 63%.
Test Correlation Coefficient and Coefficient of Determination
Testing the correlation coefficient (r) and coefficient of determination (r2) in this study is intended to test
how strong the correlation between leadership style on job performance of employees at Camat Pandrah
office as well as to test how far the ability of the leadership styles in predicting employee performance
variable variation. The results of testing the correlation coefficient and coefficient of determination are
tabulated in Table 7 below
Tabel 7. Testing Results Correlation Coefficient and Determination
Model
R R Square Adjusted R
Square
Std. Error of the
Estimate
818a 669 658 3.379
a. Predictors: (Constant), Leadership Style
b. Dependent Variable: Work Performance
Source: Research Findings, 2014 (processed data).
Results of testing the correlation coefficient and the coefficient of determination, as shown in table 8
above, showed a very strong correlation between leadership style with performance, with the value of the
closeness of correlation of 0.818. Camat Pandrah able to be explained by the variable Leadership Style,
while the remaining 33.1% are other variables that are not included in this study
Hypothesis testing
Hypothesis testing using t-test in this study is intended to test the significance of the influence of
leadership style variable to variable work performance. Results of hypothesis testing can be seen in Table
9 below.
Tabel 9 Hypothesis Testing Results Test-t
Model Regression
Coefficiant
Standard
Error tCount Sig. (2-tailed)
(Constant) 12.093 2.967 4.076 0.000
Leadership Style 0.630 0.081 7.786 0.000
Source: Research Findings, 2014 (processed data).
Based on the calculation hypotheses shown in Table 9 above, the value t count on the leadership style
variable of 7.786 while the value t table the degrees of freedom (df) = nk = 32-2 = 30, at the 95%
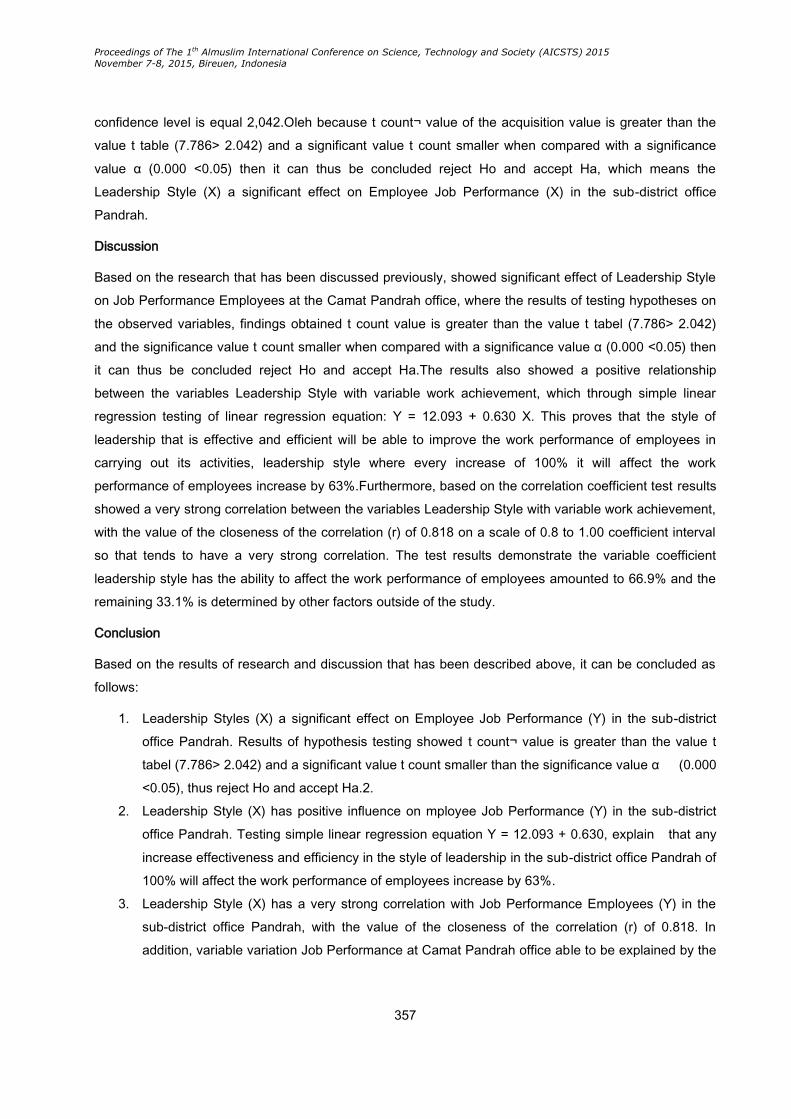
Proceedings of The 1th Almuslim International Conference on Science, Technology and Society (AICSTS) 2015
November 7-8, 2015, Bireuen, Indonesia
357
confidence level is equal 2,042.Oleh because t count¬ value of the acquisition value is greater than the
value t table (7.786> 2.042) and a significant value t count smaller when compared with a significance
value α (0.000 <0.05) then it can thus be concluded reject Ho and accept Ha, which means the
Leadership Style (X) a significant effect on Employee Job Performance (X) in the sub-district office
Pandrah.
Discussion
Based on the research that has been discussed previously, showed significant effect of Leadership Style
on Job Performance Employees at the Camat Pandrah office, where the results of testing hypotheses on
the observed variables, findings obtained t count value is greater than the value t tabel (7.786> 2.042)
and the significance value t count smaller when compared with a significance value α (0.000 <0.05) then
it can thus be concluded reject Ho and accept Ha.The results also showed a positive relationship
between the variables Leadership Style with variable work achievement, which through simple linear
regression testing of linear regression equation: Y = 12.093 + 0.630 X. This proves that the style of
leadership that is effective and efficient will be able to improve the work performance of employees in
carrying out its activities, leadership style where every increase of 100% it will affect the work
performance of employees increase by 63%.Furthermore, based on the correlation coefficient test results
showed a very strong correlation between the variables Leadership Style with variable work achievement,
with the value of the closeness of the correlation (r) of 0.818 on a scale of 0.8 to 1.00 coefficient interval
so that tends to have a very strong correlation. The test results demonstrate the variable coefficient
leadership style has the ability to affect the work performance of employees amounted to 66.9% and the
remaining 33.1% is determined by other factors outside of the study.
Conclusion
Based on the results of research and discussion that has been described above, it can be concluded as
follows:
1. Leadership Styles (X) a significant effect on Employee Job Performance (Y) in the sub-district
office Pandrah. Results of hypothesis testing showed t count¬ value is greater than the value t
tabel (7.786> 2.042) and a significant value t count smaller than the significance value α (0.000
<0.05), thus reject Ho and accept Ha.2.
2. Leadership Style (X) has positive influence on mployee Job Performance (Y) in the sub-district
office Pandrah. Testing simple linear regression equation Y = 12.093 + 0.630, explain that any
increase effectiveness and efficiency in the style of leadership in the sub-district office Pandrah of
100% will affect the work performance of employees increase by 63%.
3. Leadership Style (X) has a very strong correlation with Job Performance Employees (Y) in the
sub-district office Pandrah, with the value of the closeness of the correlation (r) of 0.818. In
addition, variable variation Job Performance at Camat Pandrah office able to be explained by the
Proceedings of The 1th Almuslim International Conference on Science, Technology and Society (AICSTS) 2015
November 7-8, 2015, Bireuen, Indonesia
358
variable Leadership Style at 66.9%, while the remaining 33.1% are other variables that are not
included in this study.
References
Cholifah. (2004). Analisis Pengaruh Perilaku Kepemimpinan Terhadap Kepuasan Kerja Pegawai Pada
Perusahaan Rokok Valas Malang (tidak dipublikasikan). Malang :Unmer.
Heidjrachman dan Suad Husnan. 2005. Manajemen Personalia. Yogyakarta: BPFE.
Kartini. 2006. Pemimpin dan Kepemimpinan. Jakarta: Penerbit PT. Rajagrafindo Persada.
Kurniawan, Albert. 201). SPSS: Serba Serbi Analisis Statistika dengan Cepat dan Mudah. Jakarta:
Jasakom.
Maisardana. (2006). Pengaruh Gaya Kepemimpinan Terhadap Semangat Kerja Pada PT. Bank Sumut
Cabang Stabat (tidak dipublikasikan). Medan :Universitas Sumatera Utara.
Mangkunegara, Anwar. 2005. Sumber Daya Manusia Perusahaan. Bandung: Remaja Rosdakarya.
Nawawi, Hadari. 2008. Manajemen Sumber Daya Manusia Untuk Bisnis Yang Kompetitif. Yogyakarta:
Gadjah Mada Univesity Press.
Prasetyo, Hendra. 2010. Gaya Kepemimpinan Terhadap Prestasi Kerja Karyawan (Studi Pada Karyawan
Asuransi Jiwa Bersama (AJB) Bumiputera 1912 Cabang Wlingi). Skripsi. Program Studi S1
Manajemen Sumber Daya Manusia Fakultas Ekonomi Universitas Negeri Malang
Rivai, Veithzal. 2009. Manajemen Sumber Daya Manusiauntuk Perusahaan, second edition, second
printing. Jakarta :PT Raja Grafindo Persada.
Siagian, Sondang.2008. Manajemen Sumber Daya Manusia, fifteenth printing. Jakarta: Bumi Aksara.
Silalahi, Ulbert. 2007. Studi tentang Ilmu Administrasi Konsep, Teori dan Dimensi. Bandung: Sinar Baru
Algesindo.
Sugandha, Dann. 2009. Kepemimpinan di Dalam Organisasi. Second Printing. Bandung: Sinar Baru.
Sugiyono. 2009. Metode Penelitian Kuantitatif dan Kualitatif. Bandung: CV.Alfabeta.
Thoha, Miftah. 2010. Kepemimpinan Dalam Manajemen. Jakarta Penerbit Rajawali Pers.
Proceedings of The 1th Almuslim International Conference on Science, Technology and Society (AICSTS) 2015
November 7-8, 2015, Bireuen, Indonesia
359
Education Decentralization Policy Implementation In the context
of Aceh Government
Edy Putra Kelana
Faculty of Social and Politic Science, Almuslim University, Aceh, Indonesia
Abstract
Many problems occurred in the implementation of educational decentralization in Aceh,
both the results of the performance achievement of students and teachers and
principals, as well as a form of Islamic education is only limited to Islamic symbols. The
purpose of this study was to analyze the factors that cause the ineffectiveness of
educational decentralization in Aceh from the aspects of policy content and context of
the policy. This study uses post-positivism and qualitative methods. The process of data
collection is done by depth interview, the data documentation and field observations
were then analyzed by using interactive data analysis. The results showed that from the
aspect of the content of the policy, the lack of positive implications for the advancement
of education in Aceh, good views of the achievements of students and teachers
nationally and form of Islamic education, the perceived benefit of this policy is still not
evenly distributed, the minimum service standards (SPM) education to remote areas is
not adequate, as well as the expansion and education for all not touching people in
remote areas, from the aspect, the expected changes with Islamic education was limited
to only Islamic symbols, then the institution has the authority to improve education and
the role of Aceh is not functioning well, the implementers of education such as school
principals, teachers and education authorities are also not perform the role and function
well. Education financing district / city is still dependent on the central and provincial.
From the aspect of the policy context, the existence of attraction between the provincial
and district education offices / town in formulating operationally on Islamic education,
then the existence of certain parties that have affected the implementation of the Aceh
education, low responsiveness and compliance of the executive education in
implementing Islamic education.
Keywords: Policy, policy implementation, Islamic education.
Background
The implementation of the decentralization of education in the province is still facing problems both
conceptual (conceptual problems) as well as factual problems (factual problem). Conceptual issues,
Proceedings of The 1th Almuslim International Conference on Science, Technology and Society (AICSTS) 2015
November 7-8, 2015, Bireuen, Indonesia
360
among others: (1) the concept of Islamic education, as contained in the Qanun No. 5 of 2008, has yet to
have a clear concept, (2) there is no clear relationship between the provincial and district / city, (3) There
is no correlation Hierarchical between the provincial education department and education department
district / city. Factual issues relating to the problems that arise in the implementation of the
decentralization policy of education in the province is not the passage of the programs in accordance with
the mandate of the regulation No. 5 of 2008.
Implementation of the decentralization of education in Aceh had not been effective in accordance with the
mandate of the BAL No. 11 Year 2006 and Qanun No. 5 of 2008, for the study will seek to uncover and
explain the various factors that determine the ineffectiveness of the implementation of the decentralization
of education in Aceh by using the concept of Grindle namely the implementation of a political and
administrative process.
According to Grindle there are six elements of the content of policy: (1) interest affected or the interests
that are affected (by public policy). Which refers to the parties (stakeholders) affected the implementation
of public policies either directly or indirectly; whether the policy of decentralization of education in the
province, beneficial for the people of Aceh or not, (2) Types of benefits or the type of the resulting
benefits. The resulting benefits related to how and to what extent the implementation of the
decentralization policy of education in the province brought function for education in the province, (3) The
extent of change envisioned or breadth of the expected changes to the policy of decentralization of
education in the province, whether after the regulation No. 5 of 2008, education in the province to change
or not. Determination of the breadth of the expected changes, will affect the level of difficulty and length of
time needed for the implementation of the policy implementation, (4) Site of decision making or decision-
making positions. The position of decision making with regard to anyone or any institution that has the
authority to provide to policy makers enter the decentralization of education, so that the policy can be
implemented well, (5) The program implementer or program manager. Executing the program is related to
how much the agency implementing the decentralization policy of education in the province, (6)
Resources committed or resources. Resources include human resources and non-human resources. The
condition of the resources of each agency different application, and this will also lead to differences in the
success rate of implementation of the policy.
The elements are included into the context of policy or elements that are outside the institution concerned
and therefore could not be controlled completely by the institution concerned. Include: (1) Power,
interests, and strategies of actors Involved, How much power, interests, and strategies that are owned by
the actors involved and has a say in the implementation of the decentralization policy of education in the
province, (2) Institution and regime characteristic, characteristic of the institution and the regime is in
power. In this case will be the actors that influence the implementation of the decentralization of
education in Aceh, (3) Compliance and responsiveness. The level of compliance and responsiveness in
implementing and managing education in implementing the decentralization policy of education in the
province.
Proceedings of The 1th Almuslim International Conference on Science, Technology and Society (AICSTS) 2015
November 7-8, 2015, Bireuen, Indonesia
361
Research Issues
Based on the background of the problem, the main problem of this research is "How can Decentralization
Policy Implementation of Education in the Context of the Governing of Aceh". In detail the issues to be
addressed in this study are:
1. How Education Decentralization Policy Implementation in the Context of the Government of
Aceh seen from the content of the policy?
2. How Education Decentralization Policy Implementation in the Context of the Government of Aceh
in view of the context of the policy?
Research methods
Researchers used the approach of post-positivism because this study see the implementation of the
policy of decentralization of education in the province comprehensively, starting from the rules that govern
education in the province, namely the regulation No. 5 of 2008, the actors involved in the preparation and
implementation of education policies, factors the cause has not been effective implementation of the
decentralization policy of education in the province. To see this reality researchers to use the theory
Grindle. This theory is used by researchers as an analytical tool to assess on factors not yet effective
implementation of the decentralization policy of education in the province to look at this aspect of policy
content and context of policy implementation of the decentralization policy of education in the province.
This study analyzes and review of education in the province's decentralization policy with the object of
research:
a) Implementation of the regulation No. 5 of 2008 on the education system in Aceh. Qanun is based
on the law governing Aceh (LOGA) No. 11 of 2006, local government law No. 32 of 2004, and the
national education system No. 20 of 2003. This gave birth to the national education curriculum
plus, in order to realize such an Islamic education contained in the regulation No. 5 of 2008.
b) A place of research, Aceh province amounting to 23 districts / cities, composed of 19 districts and
4 cities. However, because of overextension, this research is not done across the province, but
purposively take 2 cities, Banda Aceh and Sabang City, and 2 districts namely Central Aceh and
West Aceh, the provincial education department and the provincial government of Aceh
c) Periodization of the study visits starting in 2008-2010 for the data in the form of policy, and the
policy outcomes seen from the period of 2008-2013, for example, teacher competency test
results (UKG), the UN, the level of competitiveness of high school students / MA at public
universities, etc.
d) School levels examined in this study is, starting from the primary level, early childhood education
(ECD) to intermediate, middle school / madrasah aliyah, SMA / MA / SMK.

Proceedings of The 1th Almuslim International Conference on Science, Technology and Society (AICSTS) 2015
November 7-8, 2015, Bireuen, Indonesia
362
Discussion
Description of the Strategic Plan (Strategic Plan) District Education Office / City Relation to Qanun No. 5
of 2008
Here is presented the implementation of the decentralization of education in several districts / cities in
Aceh province, namely, district central Aceh, Lhokseumawe city, county western Aceh and the town of
Sabang. Education development program of special autonomy funds and additional sources of funding for
the results (TDBH) its use of oil and gas allocated to finance programs such as early childhood education
(ECD), the nine-year compulsory education, secondary education program, not on target. In the strategic
plan also does not have the submission of special autonomy funds or TDBH gas for financing educational
services widely School (PLS), special education (PLB), and educational services such as improving the
quality of education personnel and apparatus as set out in the strategic plan of education and qanun no 5
2008.
Whereas the target to be achieved from the vision of education in most districts / cities which became the
object of research is to improve the quality of educational services from the level of early childhood
education (ECD), and compulsory primary education of nine years (SD / MI up (SMP / MTs), and level
secondary school (high school / MA / SMK), thus improving the quality of education educational
personnel. Another objective is the improvement of educational services outside the school (PLS), special
education (PLB), and educational services such as improving the quality of education personnel and
apparatus.
From four counties / cities studied obtained the conclusion that the strategic plan (strategic plan)
education that has been prepared well, not right on target because it is not in accordance with the
strategic plan for education authorities, some are in accordance with the strategic planning. The indication
is that there are programs that are run but not in the education strategic plan, otherwise there is a
program that is planned but not realized well. Picture obtained from the strategic plan that Aceh education
policy in some districts / cities, not in accordance with the mandate of the regulation No. 5 of 2008, seen
from the absence of linkages between the vision, mission and educational programs. Education policy
should be related to the translation of the mission of education in achieving certain goals. As said by
Victor K. Fung, William K. Fung and Yoran Wind, when the vision of education include general formulas
and abstract, the mission of education is more focused on achieving the educational goals concrete
(strect goals). In this case the education policy tied to a time-frame agreed.
Based on the implementation model, the content of the policy of implementation of the decentralization
policy of education in the province that were analyzed were:
a) Interested parties affected by the decentralization of education; elaborated on the implementation
of the decentralization policy of education in the province be seen from the opinion of policy
makers, implementers and education observer, whether with the regulation No. 5 of 2008,
Proceedings of The 1th Almuslim International Conference on Science, Technology and Society (AICSTS) 2015
November 7-8, 2015, Bireuen, Indonesia
363
education in the province for the better or not, and whether it is in conformity with the mandate of
the qanun.
b) Kind function will be accepted by the target group, of decentralization of education in Aceh;
function explain what is produced by the policy of education in the province, seen from the
expansion and equitable distribution of learning opportunities in basic education, formal and non-
formal, expanding learning opportunities in secondary education and improving quality and
efficiency.
c) The breadth of the expected changes to the policy of decentralization of education in the
province; elaborated on the impact of the qanun No. 5 of 2008. In this case, whether before the
decentralization policy of education in Aceh, Aceh educational conditions changed for the better
or not.
d) The position of policy-makers, who holds / has the authority to implement public policy; expose
any institution which has the authority to change or improve the decentralization policy of
education in the province.
e) Executing the program is related to how much the policy implementing agencies; explain the
roles, functions and responsibilities of the executive and managers of education in the province.
f) The availability of human resources and non-human resources to implement the decentralization
of education in the province; elaborated on the financing of education in the province, both from
the government, provincial and district / city.
While the context of the policy of decentralization of education policy implementation Aceh analyzed:
a) How much power, interests, and strategies that are owned by the actors involved in the
implementation of the decentralization policy of education in the province viewed from the
institution where the competent authority to issue a decision and implement decentralized
education in the province.
b) Characteristics institutions and regimes that are in power seen from what actors are affecting the
implementation of the decentralization of education in the province.
c) What level of compliance and responsiveness of education decentralization program
implementers Aceh; in this section describes the compliance and response implementers and
managers of education in the province in implementing education policy Aceh.
Conclusion
Research on the implementation of the decentralization policy of education in the province in the context
of the formulation of the government of Aceh raised two issues, namely how the implementation of the
decentralization policy of education in the province viewed from the content of the policy and how the
implementation of the decentralization policy seen from the context of policy. According to the research
objectives that have been set, then there are two conclusions. The first is a conclusion with regard to the
factors have not been effective implementation of decentralization of education in the province seen from

Proceedings of The 1th Almuslim International Conference on Science, Technology and Society (AICSTS) 2015
November 7-8, 2015, Bireuen, Indonesia
364
the content of policy factors and two factors have not been effective implementation of decentralization of
education in the province viewed from the context of policy factors.
1. Factors yet effective implementation of the decentralization policy of education in the province
from the aspects of the content of policy: a) Interests of the parties affected by the policy (Interest
affected accaptance). Islamic education is merely symbols of Islam, then in terms of quality of
education, student achievement national level has not been satisfactory, as well achievement
teacher competency test results (UKG) is still very low; b) Advantages arising from policy (Type
of benefit). The network expansion wandering school / high school one roof in a remote area is
still very limited, the gap between schools in rural areas with the existing urban area. Then the
expansion and equitable distribution of learning opportunities for children of secondary education
(high school / MA / SMK) each regency / municipality is still low; c) The breadth of the expected
changes (Extent of change envisioned). Privileged education was not a significant impact, both to
the advancement of education in general such as achievements of student achievement,
achievement test of teacher competence (UKG), the dropout rate and the repetition rate, and in
sustaining the system of Islamic education that made style education area dubbed the Veranda of
Mecca this. d) Decision-making positions (Site of decision making). Regional Education Council
(MPD) in several districts / cities, yet has offices and the management structure, even though it is
set in the Qanun No. 5 of 2008. The school superintendent whose function is to look at the
course of education in schools also have a role and function well because inspectors only made
as a complement of education managers. Similarly, the existence of school committees only as
an institution whose members are parents, yet function well. e) Executing the program (program
implementers). The implementing programs such as school principals and teachers have not
been going well. The school principal was appointed based on proximity to the ruler, regardless
of the competence of the head of the school, the quality of teachers as well as from the results
obtained, many are not worth teaching. Education department provincial and district / city, along
with the school more to handle projects such as building schools, laboratories, schools etc. fence.
f) Resources (Resources committed). Education budget district / city is very dependent on the
central and provincial government revenues, this has led to high uncertainty in the acceptance
and complicate the planning of education in the district / city.
2. Factors yet effective implementation of the decentralization policy of education in the province
from the aspects context of policy: a) Power, interests, and strategies that are owned (Power,
interest, and strategies of actors Involved). The existence of the pull of authority between
provincial departments and offices district / city, about formulating and issuing instructions on
implementing and technical guidance on the implementation of Islamic education, Islamic
education caused merely symbols of Islam; b) Characteristics institutions and regimes that are in
power (Institution and regime characteristic). There are actors that affect the implementation of
the decentralization policy of education in the province, namely the political system and the

Proceedings of The 1th Almuslim International Conference on Science, Technology and Society (AICSTS) 2015
November 7-8, 2015, Bireuen, Indonesia
365
bureaucratic system as claimed by Grindle (1980). The results showed that there are parties
outside the political system and the bureaucratic system, which also affects the implementation of
education policies Aceh, so that Islamic education has not been effective; c) Compliance and
implementing responses (Compliance and responsiveness). The inability of the operators and
managers of education in education in Aceh in line with the Qanun No. 5 of 2008, due to a lack of
human resources (HR) implementers and managers of education, the ability of government
officials district education offices / city seen from the concept of "translation ability" not quite been
able to translate the concept of Islamic education.
References
A. Soelaiman, Darwis, Masa Depan Pendidikan di Aceh: Upaya Perbaikan Generasi Aceh, Makalah
disampaikan pada Lokakarya Nasional dan Kongres Mahasiswa Pascasarjana Aceh se-
Indonesia di Jakarta, 15 April 2012
Abdul Chakim, 2002. Pendidikan Kecakapan Hidup : Life Skill, dalam Jurnal Ilmiah Tarbiyah STAIN
Tulungagung, Vol. 24, No. 9.
Abdul Wahab, Solichin, 1991. Analisa Kebijaksanaan: Dari Formulasi Ke Implementasi Kebijakan
Negara, Bumi Aksara, Jakarta.
Aceh Local Governance Programme, 2009. Isu Kritis Pendidikan di Aceh” ALGAP, Laporan Penelitian,
ALGAP. Banda Aceh.
Ace Suryadi dan H.A.R. Tilaar, 1994. Analisis Kebijakan Pendidikan Suatu Pengantar, Bandung, P.T.
Remaja Rosdakarya.
AR Mustopadidja 2002. Manajemen Proses Kebijakan Publik: Formulasi, Implementasi dan Evaluasi
Kinerja. Jakarta: Lembaga Administrasi Negara
Baedhowi, 2004, Implementasi Kebijakan Otonomi Daerah Bidang Pendidikan : Studi Kasus di
Kabupaten Kendal dan Kota Surakarta. Disertasi. UI Jakarta
Baun Thoib Soaloon SDR 2009, Arah Pendidikan Aceh. Jurnal Website Aceh Institute.
Bhenyamin Hoessien, 1997. “Implikasi Globalisasi Bagi Kepemerintahan Demokrasi di Tingkat Lokal”,
Teistra Telaahan Strategis Strategic Review 1997, Jakarta, Ikatan Alumni LEMHANAS (IKLAL).
Bhenyamin Hoessien, 1993. Beberapa Faktor Yang Mempengaruhi Besarnya Otonomi Daerah Tingkat
II, Jakarta, Disertasi Doktor, Universitas Indonesia.
Bhenyamin Hossien, 2001. Pembagian Kewenangan Antara Pusat dan Daerah, Makalah, Pusat
Pengembangan Otonomi Daerah, Fakultas Hukum Unibraw, Malang.

Proceedings of The 1th Almuslim International Conference on Science, Technology and Society (AICSTS) 2015
November 7-8, 2015, Bireuen, Indonesia
366
B.C. Smith. (1979). “The measurement of Decentralitation” International Review of Administrative
Science, Vol.XLV
Cheeema, G.S. and Dennis A. Rondenelli (1983). Decentralization and Development : Policy
Implementation in Developing Countries. Beverly Hills, CA: Sage Publications, Inc
Cut Zahri Harun 2007, Pendidikan Nanggroe Aceh Darusallam Masa Depan Menghasilkan SDM yang
berakhlakul Karimah. Jurnal Pendidikan dan Kebudayaan. Balitbang Depdiknas. Jakarta.
Dodi Natika, MS, 2008. Potret dan Prospek Pelaksana Desentralisasi Pendidikan, Seminar, di Bappenas,
Jakarta.
Danim, Sudarwan. 2008 Visi Baru Manajemen Sekolah: Dari Unit Birokrasi ke Lembaga Akademik.
Jakarta: Bumi Aksara.
E.B. Fiske. 1998. Arah Pembangunan Desentralisasi Pengajaran: Politik dan Konsensus, Terj. Basilius
Bengoteku. Jakarta; PT Gramedia Widiasarana Indonesia.
E Koswara, 2001, Otonomi Daerah untuk Demokrasi dan Kemandirian Rakyat, Bandung, Yayasan Pariba
Endraswara. Suwardi. 2006. Metodelogi Penelitian Kebijakan Kebudayaan. Yogyakarta: Gajah Mada
University Press
Fatah, Nanang. 2006. Ekonomi dan Pembiayaan Pendidikan. Bandung : PT Remaja Rosdakarya Offset
Gubernur Nangroe Aceh Darussalam, Keputusan Gubernur Provinsi Naggroe Aceh Darussalam Nomor
23 Th. 2002 Tentang Pembentukan Susunan Organisasi dan Organisasi dan Tata Kerja Majelis
Pendidikan Daerah Provinsi Nangroe Aceh Darussalam
Grindle, Merilee S. (ed.) 1980. Politics and Policy Implementations in the Third World, Princenton
University Press, New Jersey: Princenton Univercity Press
Grindle, Mirilee S dan J.W. Thomas. 1995. Public Choices and Policy Changes: The Political Economiy of
Reform in Developing Countries. Baltimore and London: The Jonn Hopkins University Press
Hamalik, Oemar, 2002. Pendidikan Guru Berdasarkan Pendekatan Kompetensi, Penerbit Bumi Aksara,
Jakarta
Islamy, Irfan, 2003. Prinsip-prinsip Perumusan Kebijaksanaan Negara, Penerbit PT Bumi Aksara, Jakarta
Jerome, S. Arcaro, 2006. Quality in Education: An Implementation Handbook. Peterjemah Yosal Iriantara.
Yogyakarta: Pustaka Pelajar.
Jalal, Fasli & Supriadi, Dedi (editor), 2001. Reformasi Pendidikan Dalam Konteks Otonomi Daerah.
Yogyakarta: Adicita Karya Nusa
H. Muta. 2000. “Deregulation and Decentralization of Education in Japan”. Jurnal of Educational
Administration, Vol, 38
Proceedings of The 1th Almuslim International Conference on Science, Technology and Society (AICSTS) 2015
November 7-8, 2015, Bireuen, Indonesia
367
Role of the Doctor as Expert Witness in Medical Malpractice
Cases
1Muhammad Hatta, 2Tengku Noor Azira Binti Tengku Zainuddin, 3Cut Khairunnisa
1Ph.D Student, Faculty of Law, Universiti Kebangsaan Malaysia & Lecturer at Law Faculty of
Malikussaleh University, Aceh province, Indonesia;
2Lecturer at Faculty of Law, Universiti Kebangsaan Malaysia 43600, UKM Bangi Selangor Darul Ehsan,
Malaysia;
3Ph.D Student, Faculty of Public Health, Universitas Sumatera Utara (USU) and Lecturer at Medical
Faculty of Malikussaleh University, Aceh province, Indonesia,
Correeponding Author: [email protected]; [email protected]; [email protected]
Abstract
In the legal aspect, the position and the role of the doctor as an expert witness is very
important. Their expert testimony even plays major consideration in the decision of the
judges. However, it is not easy to invite doctor as expert witness if the suspects are their
colleagues. In addition, doctor, the expert witness, would give less objective testimony
in court to protect their colleagues. Also, it is very rare that expert witness points out
different medical measures carried out by the suspects. Proof mechanism by using a
doctor as an expert witness is a flaw in law enforcement in cases of medical
malpractice. Globally, there are some countries such as the Netherlands, Belgium,
France and Switzerland that have introduced reversed burden proof systems.
Keywords: Role of Doctor, Expert Witness, Settlement of Medical Malpractice Case
Introduction
Medical malpractice is prevalent in various countries such as in Canada, Japan, and even United States
of America and the United Kingdom. The experienced this crisis in the 1970s and 1980. This is also the
case in Malaysia. Although the cases are not as many in the above scountries, medical malpractices
cases increased each year.
Indonesia also experienced similar issues. Each year, medical malpractice cases continu to rise. Based
on the data from the Jakarta Legal Aid Institute of Health states that from 1998-2004, there are about 405
medical malpractice cases. Based on data from the Indonesian Doctors Association (IDI), there were 306
medical malpractice cases reported from 1998-2004. Chairman of the Indonesian Medical Disciplinary
Council (MKDKI) states that there were 62 medical malpractice cases reported each year.

Proceedings of The 1th Almuslim International Conference on Science, Technology and Society (AICSTS) 2015
November 7-8, 2015, Bireuen, Indonesia
368
The increasing number of medical malpractice cases mentioned above affected on public trust towards
physicians and hospitals in Indonesia. It is widely known that many Indonesian citizens went to various
Asian countries such as China, Singapore, Thaland, and Malaysia just for a medical check up.
One of the causes of the lack of public confidence in the doctors and hospitals in Indonesia is the high
number of medical malpractice cases in Indonesia. Law enforcement in Indonesia is not able to prove the
case because they do not know and understand both the substance and technical of medical science. If
the verification is expected only by the efforts of the patient or the patient's family medical malpractice
cases would not be revealed.
Instrument available today is the process of law enforcement against medical malpractice cases simply
rely on the testimony of a doctor as an expert witness. This is because only the doctors who know and
understand medicine. But this raises a problem because many doctors avoid to become an expert
witness because they colleagues or associates. Testimony from expert doctors are biased and not
objective and tends to protect colleagues. Therefore, this study will look to extent of the role of a doctor in
law enforcement? What causes doctor's testimony as an expert witness not objective in the case of
medical malpractice in the court? and to find out solution to facilitate the enforcement of the law for
medical malpractice cases?
Research Method
This study is a qualitative research using normative juridical approach. This study is legalistic or doctrinal
using analytical techniques substance (content analysis). Content analysis technique is a research
carried out systematically by analyzing a legal document pertaining to cases of medical malpractice. The
aim of the research is legalistic or doctrinal is to find, explain, research, analyze and propose a systematic
way of facts, principles, concepts, theories, certain laws and law enforcement institutions that find
knowledge and new ideas for suggested be a change or renewal.
Doctors as Expert Witnesses
In unveiling truth, verification process that involves a variety of strategies and science (scientific
investigation) are required to achieve justice for all parties. Laws can be enforced not only because the
superiority of law and the ability of law enforcement alone but it takes the role of support from various
disciplines such as forensic science, linguistics, psychology, criminology, victimology and other sciences
that according to the case yag being handled.
The role of expert witnesses in uncovering cases is very crucial. This fact is caused by the development
of crime is always faster than the development of law. Expert witnesses from various disciplines have to
assist law enforcement to take in offenders. This phenomenon is not only happening in Indonesia or
Malaysia, even in developed countries like the United Kingdom and the United States.

Proceedings of The 1th Almuslim International Conference on Science, Technology and Society (AICSTS) 2015
November 7-8, 2015, Bireuen, Indonesia
369
In the judicial process, everyone can be invited to be witnesses and everyone has an obligation to testify
in accordance with the needs of justice. Likewise with the doctor or other health professionals, they also
have the same obligation to testify or give testimony correctly in accordance with their expertise.
Australian Doctor Association states that doctors have the ethical obligation to assist the court in the
process of alternative dispute resolution to testify as an expert witness when necessary. Doctors should
give testimony freely, honestly, objectively and provide his opinion only with respect to expertise alone.
Doctors also have an obligation to protect the privacy of all the evidences he had.
According to the Australian Medical Association (AMA), the expert witness' testimony is supporting
statements from witnesses or other evidence to find the truth. Expert testimony can be in the form of
verbal statement, written (visum et repertum), medical records, information circumstancial evidence and
so forth. The expert testimony should support to uncover the fact that there is a causal link between the
faults someone have done with the impact it caused.
In the process of investigation, the cause of injury, permanent disability or even death in patients is
already known based on the examination conducted by the doctor. Description from forensic doctors in
the form of a post mortem is sufficient to describe the cause of death of the patient, so that the expert
witness testimony in medical malpractice cases not only as supporting information but this information
could ascertain the cause of the crime occurred.
All statements of witnesses, including expert witnesses in the trial correlate one with another. It
complements and perfects each other to unveil truth and justice. To bring in perpertrator of medical
malpractice, expert witness of facts (witness of fact) and expert witness of opinion (witness of opinion) are
needed. They will ascertain whether the operation was executed in accordance with the Standards of
Medical Operations and Profession. In the court process, public prosecutor can present expert witness.
Expert witness can be classified into two; witness of fact and witness of opinion. Based on Ethical
Guidelines for Doctors Acting as Medical Witnesses, expert witness is a doctor directly take care the
patient and his testimony was bsed on facts he encountered when taking care of the patient
The expert witness is a qualified person in terms of knowledge and experience to give an opinion on a
particular issue to the court. Witness testimony is one type of evidence in criminal cases in the form of
witness testimony about a crime he heard, saw, or based on his own experience by stating the reasons of
knowledge. Franklin argued that an expert witness is someone who can conclude based on skill
experience or data about an event. They can find it in person or by others, and are able to deliver their
opinion.
In the legal perspective, every doctor is an expert, either a judicial expert medical science or not.
Therefore all physicians can be approached for their help to enlighten a case and catch the perpetrators.
But in order to obtain a maximal assistance, requests for assistance needs to be submitted to the doctor
who has expertise in accordance with the object to be inspected.

Proceedings of The 1th Almuslim International Conference on Science, Technology and Society (AICSTS) 2015
November 7-8, 2015, Bireuen, Indonesia
370
Australian Medical Association states that doctors have an obligation to assist the courts and alternative
dispute resolution process by providing expert evidence in court when summoned. Physicians must
provide expert evidence to assist the courts that are impartial, honest, objectives and limit their opinion
only within the scope of their expertise. Doctors also have an obligation to protect the privacy and
confidentiality of all relevant evidence he had.
Doctors involved in court cases because of the expertise, knowledge and its specific area to provide
medical evidence. Doctors play an important and integral role in the litigation. Therefore, doctors are
entitled to obtain full information about the case, their roles, and everything related to uncover the case.
Some countries overseas have MDO (Medical Defence Organization), an organization to be asked for
assistance If a lawyer or an investigator has a question or further information and doctors have difficulty in
answering.
In Indonesia, the doctor can consult with the Committee of Medicolegal Doctor Indonesia or can go
directly to the experts of Forensic Medicine If it is necessary to discuss with other independent expert
witness or prepare a report with another expert witness, the physician must give his independent
assessment, identify approved matters, not approved and needs to express the reason. Doctors should
avoid instruction or request for the agreement. Use moderate and objective manner when giving
evidence. Rejects efforts designed to provoke a doctor and avoid debate.
Position and Role of Doctor as Expert Witness on Madical Malpractice Cases
In the verification process, the legal soundness of some family law (family recht) in the world has put the
burden of proof on those who sue or Public Prosecutor. Hayt and Groeschel in their book Law of Hospital,
Physician and Patient mention that in a criminal case, the burden of proof always lies on the prosecutor
and continues to remain up until the inspection took place on the court.
While in the field of civil law, both parties stand in line or fight for their rights or what they believe to be
true. This brings the consequence that in civil cases, in addition to the presumption of innocence, it is also
possible, in special case, to do the transfer of the burden of proof from the plaintiff to the defendant.
One thing to consider is that patient is less knowledgeable, and even the prosecutor who has legal
educational background is not able to prove a case of malpractice. To cover up the ignorance of the
public on legal issues related to the health of the world then this problem, using expert witness, both
general practitioners and specialists in accordance with the needs of the case evidence, can be
implemented.
At this stage of the examination in court, both the public prosecutor and the suspect may present expert
witness under the permission of the court. If their expertise directly related to the case that is being
handled, a doctor may also be presented as a witness.
In the aspect of Indonesian law, expert witness is a qualified person in terms of knowledge and
experience to give an opinion on a particular issue to the court. Witness testimony is one type of evidence
Proceedings of The 1th Almuslim International Conference on Science, Technology and Society (AICSTS) 2015
November 7-8, 2015, Bireuen, Indonesia
371
in criminal cases in the form of witness testimony about a crime he heard him, saw, or experience by
recalling reasons of knowledge (Article 1 of the Criminal Code Clause 27).
Meanwhile, information or expert opinion is the information given by a person who has special expertise
about the necessary things to enlighten a criminal case for the purpose of examination (Article 1 of the
Criminal Code Clause 28). Expert testimony is what an expert has stated in court (Article 186 Criminal
Procedure Code).
Doctor’s obligation to provide expert testimony was provided for in article 133 Criminal Procedure Code.
The expert testimony will be used as legal evidence before the trial court (Article 184 Criminal Procedure
Code) and can be administered orally in front of the court (Article 186 Criminal Procedure Code). When a
doctor or health worker intentionally does not fulfill the obligation when called as a witness a regular or an
expert witness in a case allegedly linked to a crime, then punishable with imprisonment of nine months
and in other case, shall be sentenced to a maximum six months (Article 224 of the Criminal Code). In
Article 170 Criminal Procedure Code stated that a doctor because of work, the dignity or position may
exercise the right to withdraw the request to be exempted from the obligation to give testimony, the
medical secret entrusted to him by giving reason to the judge.
The judge will determine whether or not any valid reason for doctors to resign as an expert witness.
However, Article 179 Criminal Procedure Code has determined that physicians are required to meet the
demand of the court as an expert witness to provide expert explanation or request for information in the
examination at the stage prior to the examination session court, can not be ignored by assuming a doctor
or health worker has the right to withdraw.
The use of expert witness testimony is very essential in court system because it will reveal the truth
pertaining to specific crimes and included as crimes involving profesial group. As a result, sophisticated
approach is required to uncover the evidence. All parties to the dispute may file an expert witness if they
are doubtful about the proposed expert witnesses. The opposing party shall file a rebuttal expert
witnesses to refute the testimony of expert witnesses in advance so that the value of expert witness
testimony is very convincing (persuasive).
The role of the expert witness is to allow law enforcement to catch the doctor who is alleged to have
committed the crime of medical malpractice. According to the Australian Medical Association (AMA),
there are two types of witnesses in medical malpractice cases; they are witnesses of facts and
independent witnesses. Witness of facts is presented by doctor who performed the inspection, maintain,
perform surgery or parties directly involved in the process of medical procedures to patients. The doctor
will be asked by the judge to present medical evidence or anything related to the medical measures.
Later, they will provide factual information about the outcome rather than the medical measures.
In Malaysia's legal system, there are several criteria that serve as a guide for someone who can serve as
an expert witness in court. Article 45 (1) Evidence Act 1950 states that if the court requires the opinion of
the laws of foreign countries or of science or art, or about the identity or genuineness of handwriting or
Proceedings of The 1th Almuslim International Conference on Science, Technology and Society (AICSTS) 2015
November 7-8, 2015, Bireuen, Indonesia
372
fingerprints, it would require the opinions of people who have a particular skill on the case. This regulation
has required that people who have special skills that can be tested in academic or work experience he is
called the expert in the field of so-called expert witnesses to the fact. However, there are several expert
witnesses who are not related directly to the case but can be used as supporting information to
corroborate witness testimony to the fact.
Independent witness or witnesses called is the opinion of an independent expert witnesses were asked to
give an independent opinion based on the facts of the particular case that already exists. In this case the
doctor will give an opinion in accordance with relevant experience and expertise. As a witness of
independent experts, doctors can assist the court in two ways, namely by giving expert opinion based on
their knowledge and experience to the facts and inform the court on matters related to their particular
expertise so before expert doctors testified, physicians need to know in advance the position as a fact
witness or independent witnesses.
In giving testimony, doctors are not angels who know everything. If in the process of verification, there are
things that doctors are not familiar with. Here, doctors can consult with the Committee of Medicolegal
Doctor Indonesia or can go directly to the experts of Forensic Medicine if it is necessary to discuss with
an expert other independent witness or prepare a report with another expert witness, the physician must
provide an independent assessment, identify approved matters, not approved and want to express why.
Doctors should avoid instruction or request for the agreement. Use moderate and objective manner when
giving evidence. Rejects efforts are propokatif and avoid debate.
Typically, solving case of medical negligence requires a very long time because it is not easy to get a
doctor as an expert witness whose expertise is relevant to the case at hand. In addition, many doctors
who do not want to become an expert witness because it will deal with the defendant which the defendant
is in fact one of his professional colleagues in the same hospital. Moreover, it is not easy for the judges to
understand the complex nature of medical science1 such as reading and understanding the patient's
medical records, technical surgery, examination results and other support so that it will take considerable
time and high costs.
Barriers and Challenge
Barriers and challenges in pertaining health law is that health law in Indonesia has just begun to develop
and is still in statu nascendi. To complete and perfect the instrument of the law, we have to study
longstanding and high jurisprudence of overseas literature. Legal considerations that the judge
pronounced in a variety of medical case is what we can earn and received so far it does not conflict with
our own socio-cultural, so that the development of medical law in Indonesia more quickly so that we can
advance faster.
1 M. Stauch, Sourcebook on Medical Law, Cavendish Publishing Limited, London, 1998, page 337.

Proceedings of The 1th Almuslim International Conference on Science, Technology and Society (AICSTS) 2015
November 7-8, 2015, Bireuen, Indonesia
373
It is very difficult to get doctors to provide their objective expert statements based on facts to verify
whether his collegues actions are guilty or not guilty of performing or not performing medical procedures
on patients. Doctors on the subject play a major role in providing proof in court. However, it is not an easy
matter for the public prosecutor to get a doctor who would be an expert witness and is willing to provide
information of their colleagues or associates in his field’s wrongdoing medical malpractice. It is difficult to
maintain the independence when involving colleagues.
According to Giesen, difficult to proof elements in a medical malpractice case is the cause (causation).
Patients should prove there is direct relationship between the causes and the result of the action. If the
patient fails to prove this element, the demands of the patient can be canceled. In the court, the judge has
no choice but to win the defendant if all expert witnesses justify the doctor’s action was in accordance
with the Standards of Medical Operations and Profession.
Moreover, persistant fact in law enforcement on medical malpractice is very strong relationship among
medical professionals. A peer relationship is based is based on the Pledge of Medicine Indonesai and
Code of Ethics Indonesia (KODEKI). KODEKI in Article 14 states that "every doctor treats his colleagues
as he wants to be treated". The provisions of this conduct, but the context of a general nature to treat
colleagues in terms of goodness related to their profession. But in fact found that all doctoral always
maintain good relations with colleagues to avoid conflict of interest with colleagues.
Defending colleagues who are guilty through the testimony of a specialist court is not mentioned in the
regulation. Physicians should provide professional information in accordance with their expertise. Doctors
should look at the case not look at who is doing such errors. When the doctor involves feelings based on
emotional relationships of his colleagues in providing expert testimony in court then the explanation would
be biased and not objective so it will be a lot of allegations that doctors tend to defend his colleagues in
court.
Collegial relationship among doctors based on misleaded understanding of professional relationship,
affect negatively to law enforcement in Indonesia. Law enforcement against the medical profession would
make it difficult for the seeker of justice to prove the guilt of doctors if the doctor as an expert witness has
collaborated with the defendant. This will be a major factor that the patient or the patient's family will not
win a case of medical criminal offense in court.
Very rare that an expert witness who testified in court is different and contrary to the practice of medicine
taken by the suspect. Many, expert witness justify his colleagues, because only the doctor who knows the
surgical techniques or other medical actionr, so when taking this approach, the council of judges will
follow the views of the expert witnesses and will surely win doctor in the case.
Solution and Analysis
In the theory of evidence, there is a principle that says "He who asserts must prove or in Dutch called wie
Stelt, moet zijn kunnen bewijzan recht). In the aspect of civil law, the parties are obliged to prove the guilt
of doctors and patients in the aspect of criminal law and public prosecutor has the authority to prove.

Proceedings of The 1th Almuslim International Conference on Science, Technology and Society (AICSTS) 2015
November 7-8, 2015, Bireuen, Indonesia
374
When applying this authentication system, as has been explained from the beginning, it would be difficult
for patients to prove that doctor is guilty.
Difficulty to prove gguilty doctors was mentioned in the US Department of Health, Education and Welfare
Report which states that one of the most difficult to prove cases are medical malpractice. Weakness
verification system which is the limiting factor medical malpractice case are not up to the court, and so we
need to reform the system in proving especially to cases of medical malpractice.
In a global aspect, current proving system is being neglected. In specific cases especially, proving
principle ‘he who asserts must prove’ which put the burden of proof obligation (burden of proof) to the
patient changed to a system of proof by obliging to the doctor to prove medical malpractice cases.
Reversed evidence against medical malpractice cases has been implemented in various European
countries such as Switzerland, the Netherlands, Belgium and France. All these countries would realize
that it is unfair if the state imposes a burden of proof to patients who do not have a good educational
background as the medical profession itself.
The transfer of the burden of proof on the part of the patient to the doctor or other medical personnels is
believed to bring positive change to medical malpractice cases in litigation. Ideally, the doctor or medical
personnels prove medical malpractice because he knows, understands, authorized and experienced in
the practice.
Shift of the burden to the doctor as mentioned by Lord Justice May in cases Dwyer v. Roderick that in
medical malpractices, the burden of proving of medical malpractices. Lord Justice May said that:
“To shut one’s eyes to the obvious if one denied that the burden of achieving something more than the
mere balance of probabilities was greater when one was investigating the complicated and sophisticated
actions of a qualified and experienced doctor than one was inquiring into the inattention of the driver in a
simple running down action”.
In addition to applying the burden of reversed proof as a solution to resolve medical malpractice cases,
there are several countries have introduced a settlement out of court (non litigation) or in a civil law
aspects of the so-called alternative dispute resolution by using the mediation approach. In Article 29 of
Law No. 36 Year 2009 on Health states that medical malpractice settlement in mediation before the case
is brought to court. Mediation is done when a dispute arises between health workers with patient health
providers as recipients of health services. Mediation is done aims to resolve disputes out of court by a
mediator agreed upon by the parties pursuant to the principle of win-win solution and win-win situation.
Malaysia also provides the option to the doctor and the patient that the medical malpractice case should
be resolved through the courts or out of court. However, judges in Malaysia are given the authority to
advise the disputing parties settle the case through mediation first. Likewise, with Singapore cases of
medical malpractice should first be resolved out of court through mediation approach.

Proceedings of The 1th Almuslim International Conference on Science, Technology and Society (AICSTS) 2015
November 7-8, 2015, Bireuen, Indonesia
375
Conclusion
In a review of Indonesian and Malaysian Law, all give important positions to the doctor as an expert
witness in the process of law enforcement. The only difference is that when a doctor as an expert witness
testifies. In Indonesian, doctors can provide information on the stage of the police investigation until the
proceedings in the Court. Meanwhile, in Malaysia, the doctor as an expert witness testifies only at the
stage of the examination process in any court.
There are some obstacles in getting a doctor's expert witness as many who do not want to become an
expert witness because they will deal with the defendant who is also their colleagues at a hospital. This
may prolong settlement of medical malpractice cases. In addition, it is difficult to find a doctor who
became an expert witness whose expertise is relevant to the case at hand because medical malpractice
cases are complex and different from other cases that not everyone understands the medical action both
methods of treatment and technical operations performed doctor to the patient.
References
Aminuddin Mustaffa dan Siti Nurul Aziera Moharani, Isu Dan Permasalahan Keterangan Kanak-Kanak Di
Bawah Undang-Undang Di Malaysia: Satu Penilaian, Journal Kanun, Edisi Juni 2012 (1), page.
61.http://jurnalkanun.dbp.my/wordpress/wp-content/uploads/2014/08/4-Isu-isu-Permasalahan-
Kanak2.pdf. [11 Mac 2015].
Australian Medical Association (AMA), Ethical Guidelines for Doctors Acting as Medical Witnesses, AMA
Position Statement, 2011,https://ama.com.au/position-statement/ethical-guidelines-doctors-
acting-medical-witnesses-2011.[ 2 March 2015].
Cf. W. Asser, “Stelplicht en Bewijslastverdeling en medische aanspra-kelijk heid in het Nederlandse
recht”, Tijdschrift voor Gezondheidsrecht, 1991, No. 27.
D. Giesen. 1988. International Medical Malpractice Law, Sweet & Maxwel, London.
Dato’ James Foong, 2003, “Medical Neg. Claim: Evidence, Procedure, Trial & Assessment of Damages,
Issues in Medical Law & Ethics, Edited b Puteri Nemie Jahn Kassim, Abu Haniff Mohamad
Abdullah, Medical Law & Ethics Limit, Law Centre, AKOL, IIUM.
Dedi Afandi , 2009, Visum et Repertum pada Korban Hidup, Jurnal Ilmu Kedokteran, Edisi 2009; 3 [2].
__________, Mediasi: Alternatif Penyelesaian Sengketa Medis, Majalah Kedokteran Indonesia, Vol. 59,
No. 5, Mei 2009.
Donald N. Dewees, Michaelj. Trebilcock, & Peter C. C., The Medical Malpractice Crisis: A Comparative
Empirical Perspective, Law & Contemporary Problems, Vol. 54: No. I.
Dwyer V. Roderick [1983] 127 SJ 805 (CA).

Proceedings of The 1th Almuslim International Conference on Science, Technology and Society (AICSTS) 2015
November 7-8, 2015, Bireuen, Indonesia
376
Emanuel Hayt, Lillian R Hayt, August H Groeschel, Law of Hospital, physician and Patient, Publisher:
Berwyn, Ill., Physicians' Record Co, 1972, page. 32.
Herqutanto. 2009. Wahai Dokter Indonesia Berkomunikasilah, Departemen Ilmu Kedokteran Komunitas
Fakultas Kedokteran Universitas Indonesia, Maj Kedokt Indon, Vol. 59, No. 2, Februari 2009.
J. Guandi, Hospital Law (Emerging Doctrine & Jurisprudence), Fakultas Kedokteran Universitas
Indonesia, Jakarta, 2002.
Maanen, J., Reclaiming Qualitative Methods for Organizational Research: Preface, Administrative
Science Quarterly, Vol 24, 1979, page. 520-526. Also can be seen in McCracken, G. D., 1988,
The Long Interview, Sage, London, page. 16
M. Stauch, et.al, 1998, Sourcebook on Medical Law, Cavendish Publishing Limited, London.
Mayeda M, Takase K., 2005, Need for enforcement of ethicolegal education-an analysis of the survey of
postgraduate clinical tarinees, BMC Medical Ethics 2005: 6.
Merdias Almatsier, 2010, Kemitraan Hubungan Dokter-Pasien Bagi Media Massa, Makalah Lokakarya,
Hotel Grand Mahakam, Jakarta.
Lewis CJ, 1995, Medical Negligence: A Practical Guide, Croydon, Tolley Publishing, 3rd edition.
PS Rajan, 2003, Medical Negligence Litigation : Time for Reform, Issues in Medical Law and Ethics,
Medical law and Ethics Unit, Law Centre, AIKOL, IIUM, 2003.
Puteri Nemie bt. Jahn Kassim, 2004, Medical Negligence Litigation in Malaysia: Whither should we
travel?, The Journal of the Malaysian Bar, XXXIII No. 1.
________________________, 2003, Medical Negligence Law In Malaysia, International Law Book Services,
Kuala Lumpur.
Stygall, G. 1994. Trial language: Differential discourse processing and discursive formations. John
Benjamins Publishing Co dan Stygall, Amsterdam.
Stygall, G. 2001. A Different Class Of Witnesses: Experts In The Courtroom dalam Noraini Ibrahim,
Membina Keterangan: Pemeriksaan Utama Sebagai Titik Permulaan, Jurnal e-Bangi: Jurnal
Elektronik Fakulti Sains dan Kemanusiaan, Volume 3, Number 1, 2008, page. 4.
Tay Pek San, See HP & Tan CT, 1998, Medical Negligence Litigation-Call for a Reconsideration, [1998] 3
MLJ.
Syahrul Machmud, 2012, Penegakan Hukum dan Perlindungan Hukum bagi Dokter yang diduga
Melakukan Medikal Malpraktek, Karya Putra Darwati, Bandung.
Proceedings of The 1th Almuslim International Conference on Science, Technology and Society (AICSTS) 2015
November 7-8, 2015, Bireuen, Indonesia
377
Effect Of Regulations, The Availability Of Budget And Work
Motivation Of T Public Service Quality In Office Of Education
Aceh Province
1Amiruddin Idris
1 Almuslim University Peusangan Bireuen - Aceh
Abstract
Development of personnel resources is very important because it can improve the
ability of personnel both professional ability, the ability of insights, leadership abilities
and dedication capability that will ultimately improve the performance of an apparatus.
This study wants to examine and analyze the factors that affect the quality of public
services, in terms of regulation and the availability of budget and personnel work
motivation SKPD (local work unit) education offices in the District and the City, in the
province of Aceh. Widodo (2001) states that public service is defined as any form of
service activities commonly undertaken by Government Agencies in Central and in the
area of Environmental State-Owned Enterprises (BUMN), Regional-Owned Enterprises
(BUMD) in the form of goods and services, both within the framework of efforts to meet
the needs of society, and in order to implement the provisions of legislation. Results of
the study can be described that there is a relationship associative Regulation, with
quality of service apparatus, of 18.4% ,. There is a relationship associative Availability
budget, with quality of service personnel by 22.9%. And there is a relationship
associative work motivation, with quality 28.6% of service personnel. So the three
variables studied, namely regulatory factors, the availability of budget and work
motivation of personnel department of education contributes to improving the quality of
public services amounted to 69.9%.
Key Words: Regulations, Budget availability, Motivation, Government officer service
Introduction
The era of globalization has entered into all aspects of work and business, including the service (service)
shown by the needs of modern man, rivalry or competition, and increased public expectations are high.
Therefore, the government are required to be taking the initiative in increasing its role in the
implementation of development and providing services to the public better, so as to address issues of
development, particularly the field of human and economic development, such as; job creation and

Proceedings of The 1th Almuslim International Conference on Science, Technology and Society (AICSTS) 2015
November 7-8, 2015, Bireuen, Indonesia
378
unemployment reduction, improvement of people's purchasing power, and increasing public satisfaction
with the services through excellent services. In the optimization of the construction activity, an agency or
organization, we need a system that can carry out the development activities and support services to the
community. Each organization operates by using all its resources to produce better goods / services that
can be marketed. So the management of available resources both in terms of financial resources,
physical, Human Resources (HR), and the ability of the technology and systems (Simamora, 2004).
Because resources are so limited that owned the organization / institution or company is required is able
to empower and optimize their use to maintain its existence and even survival of the organization.
From various resources owned by government agencies, HR has a strategic position among other
resources. Without human resources, other resources cannot be used, let alone managed to produce a
product and services. But infact, many felt or heard, the leaders of agencies / institutions/agencies in the
government who are still un aware of the importance of human resources for the survival of the system
work and efforts to achieve the goals of the organization or institution. Though we realize true HR is the
asset of the organization, institution or enterprise, for moving the human resources and making other
resources work.
The survey results while in the office of education of each district / city in the province of Aceh, there are
still some problems, among others; 1) Implementation of the development of education in the province of
Aceh has not run optimally; 2) Still weak competitiveness of education in the province of Aceh nationally,
is still in the order of over 30 national, 3) Institutional governance (good governance) has not worked as it
should, 4) The existence of the Regulation, the level of understanding and implementation of the
regulation is still very limited, 5) The quality and motivation of personnel in district offices of education in
Aceh still not optimal, 6) The process of improving the human resources employees in government
agencies, particularly the education offices in the province of Aceh has not gone well, and 7) Apparatus
work ethic both individuals and groups are still very limited.
This study wants to examine and analyze the factors that affect the quality of public services, in terms of
regulation and the availability of budget and personnel work motivation SKPD (Local Work Unit)
education offices in the District andt he City, in the province of Aceh.
Research Method
Research samples
Research conducted on regular employees who carry out the public service, in this case wanted to
measure the quality of service at SKPD on all Department of Education in the province. Therefore, the
members of the population are all employees of the SKPD that many perform service functions to the
public at the Office of Education (Education Department) or the Department of Education sports (Dispora)
or the Department of education and culture (Disdikbud). Sampling method used is Proporsionale
stratistified random sampling method. The sample set by the researchers, first compiled based eselonsi /
rank by area / region in the province.

Proceedings of The 1th Almuslim International Conference on Science, Technology and Society (AICSTS) 2015
November 7-8, 2015, Bireuen, Indonesia
379
Researchers set the number of respondents who were 120 respondents. The determination of these
respondents, consisting of level Chief, Head Level, and Level Head of Section, as well as staff.
Method
The method used in this study using survey method explanation (explanatory survey method), the survey
tried to link the variables and test variables studied. Application of survey research methods in operations,
required an appropriate research design conditions of the depth of research that will be done. In addition,
to determine the variables that affect the performance of services on education officers at the Office of
Education in the province of Aceh, this study uses a quantitative approach. The data is analyzed data
from questionnaires filled out by the public as a recipient of the service which is the subject SKPD. Quality
of service is only viewed based on employee perceptions.
Variables and Research Model
This research determine the effect of regulation and budget availability and motivation to work with public
services. By the definition of variables as follows:
1) The variables of this study consisted of independent variables: Regulation (X1), availability of
budget (X2), and work motivation (X3).
2) Dependent variables: aperture on public services (Z)
3) Based on theoretical concepts, results of previous studies, and the applicable regulations, the
regulations set out in four dimensions, namely:
4) The process of preparing regulation, with indicators: Availability regulation, involvement in the
process, dissemination and understanding.
5) Application of regulation, with the indicator: Konsis-tension execution, Ease of implementation,
and response to regulation.
6) Linkages between regulation, with indicators; Availability of support for regulation of the central
regulations, the regulatory linkages with other regulations
7) Evaluation, with the indicator; the evaluation process and regulatory changes
Data Analysis
Based paradigm and the research hypotheses that have been presented in previous chapters, the
methods of data analysis used to test the hypothesis is path analysis (path analysis).
Suitable path analysis is used to analyze the relationship between cause and effect, good to know the
effect of directly or indirectly cause a set of variables (exogenous) to set a variable result (endogenous),
either simultaneously or partially. Path analysis is also suitable for samples that exceed or above 100
respondents and the processed data are exploratory and data can be observed directly in the field
(Sitepu, 1994; Kusnendi, 2005; Jonathan Sarwono, 2007).

Proceedings of The 1th Almuslim International Conference on Science, Technology and Society (AICSTS) 2015
November 7-8, 2015, Bireuen, Indonesia
380
X1
X2
X3
Y
Analysis of this path follows the pattern of a structural or so called structural models (Kusnendi, 2005).
Structural model with the following equation:
Y1 = f (X1, X2, X3).
Figure 1. Analysis Variable lines of research
Discussion and Analysis
Based on the answers to each variable question of 120 respondents, with a weighting scale of 1 to 4,
then processed the data revealed a relationship correlational variables Regulation (X1), the availability of
budget (X2) and motivation (X3) values obtained correlation coefficient respectively are: rx1x2 = 0.391,
rx2x3 = 0323, rx1x3 = 0.317. Statistical test results support the existence of a positive relationship with
the criteria of the relationship moderate to low. So that the analysis of the considered problem needs to
be done with the approach path analysis.
Statistically, the variable path analysis Regulation (X1), availability of budget (X2) and Motivation (X3) on
the quality of service of personnel in the office of the Department of Education in the province. can be
explained in Figure 2 below
Effect of regulation, availability of budget and work motivation on the Quality of service personnel in the
Office of education throughout Aceh.
Pictured above, stated equation pathways, the form Y = 0,311X1 + 0,365X2 + 0,437X3 + 0.204
From the equation above can be interpreted that:
1) There is a relationship associative Regulation, with quality service of apparatus that magnitude,
amounting to 0,311 (ρ YX1)
2) There is a relationship associative Availability budget, with quality service apparatus of 0,365
(ρYX2)
X1
X2
X3
Y
r=0,391
r=0,323
r=0,317
ρ=0,311
ρ=0,365
ρ=0,437 e=0,204

Proceedings of The 1th Almuslim International Conference on Science, Technology and Society (AICSTS) 2015
November 7-8, 2015, Bireuen, Indonesia
381
3) There is a relationship associative work motivation, with quality service apparatus of 0.437
(ρYX3)
Table 1. Effect of Variable X1 X2 and X3 on Y
Variable Direct
Impact
Indirect Impact Total
Impact X1 X2 X3
X1 0.097 0.044 0.043 0.184
X2 0.133 0.044 0.051 0.229
X3 0.191 0.051 0.043 0.286
Total Impact = 0.699
Based on Table-1 above, may explain that the magnitude of the effect of each variable Regulation (X1),
the availability of budget (X2), and work motivation (X3), as follows:
1) The amount of the partial effect of variable regulation, (X1) on the quality of service personnel (Y)
either direct or indirect effect of 18.4%.
2) The amount of the partial effect of variable budget Kersediaan (X2), the quality of service
personnel (Y), good effect a direct or indirect of 22.9%.
3) And the partial effect of work motivation variable (X3), the quality of service personnel (Y), either
direct or indirect effect of 28.6%.
4) So the influence of regulation, Kersediaan budget, and Motivation to quality of service personnel
by 69.9%.
Discussion
The test results show that the model feasibility research model has met the goodness of an econometric
model or characteristics that can be expected.
Theoretical plausibility: The model of this study showed that the test results in accordance with
expectations and management theory, organizational behavior, performance and public services into its
rationale.
Accuracy of the estimates of the parameters. This research models produce accurate estimator path
coefficients and significant bias or not. Assumptions are met analysis and statistics of the model error
probability is very low or p-value <5% (p-value = 0.000).
Explanatory ability. The research model has a high ability in explaining the relationship between
management variables studied phenomenon. Standard Error (SE) is smaller than ½ times the absolute
value of the coefficient of the track (SE <½ ρ i)

Proceedings of The 1th Almuslim International Conference on Science, Technology and Society (AICSTS) 2015
November 7-8, 2015, Bireuen, Indonesia
382
Forecasting Ability. The research model has sufficient predictive ability over the behavior of the
dependent variable, as shown by the high coefficient of determination models that exceed 1/3 of the total
effect, with the following details:
a) The magnitude of the effect of regulation variables, availability of budget and the motivation to
work towards quality of service personnel in the education offices throughout the province.
amounted to 69.9%.
b) The influence of other variables on the quality of public services at 30.1%.
Conclusion
Based on statistical analysis of lane describe improvements in the existing regulations, the quality of
service personnel in Aceh province will increase. It if it will impact on a significant contribution to the
performance of the service personnel. However, of the magnitude of the effect, indicating that the
existence and implementation of regulations developed has not been optimal, in the sense that they need
efforts to increase, so that the regulation would be more effective to increase the performance of the
service personnel education offices in the province of Aceh.
While on the availability of budget, the good availability of the existing budget and the growing availability
of budget implementation in the public service, it will contribute significantly to the quality of service
personnel. However, of the magnitude of the effect, indicating that the availability of the existing budget
has not been optimal, need Adaiah efforts to increase, so the availability of the budget will be greater and
adequate for performance improvement of service personnel in the office of the Department of Education
throughout the Aceh province. Therefore the whole dimension of the availability of the existing budget,
both at the provincial and city / district must continually improved. Likewise, as expected theory that
motivation contributes greatly to the quality of services provided as an obligation to the public. The
statistical results also show the same thing. Of the three variables analyzed, motivation have the greatest
effect.
References
Ariadi, Dani. 2006. Pengaruh Anggaran Partisi-patif Melalui Budaya Organisasi, Gaya Manajemen, dan
Motivasi Kerja Sebagai Variabel Intervening Terhadap Kinerja Manajerial dan Kepuasan
Anggaran Pada PT. Socfin Indonesia.Tesis; USU Medan.
Indriantoro, N. dan B. Supomo. 2000. Metodologi Penelitian Bisnis Untuk Akuntansi dan Manajemen.
Yogyakarta: BPFE
Lawrence, S. 1989. Voice of Human Resources Experience. Personnel Journal. April:61-75.
Mangkunegara, A.A. Anwar Prabu. 2006. Perencanaan dan Pengembangan Sumber Daya Manusia,
Cetakan Kedua, Bandung: Penerbit PT. Refika Aditama

Proceedings of The 1th Almuslim International Conference on Science, Technology and Society (AICSTS) 2015
November 7-8, 2015, Bireuen, Indonesia
383
Notoatmojo, Soekidjo. 2003. Pengembangan Sumber Daya Manusia, Edisi Revisi, jakarta: Penerbit
Rineka Cipta
Nursidin, M., 2008. Pengaruh Anggaran Partisipatif Terhadap Kinerja Manajerial Melalui Kesenjangan
Anggaran Dan Motivasi Kerja Pada PT. (PERSERO) Pelabuhan Indonesia – I Medan, Tesis.
Sekolah Pascasarjana USU Medan.
Ohmae, K. 1995. The End of the Nation State: The Rise of Regional Economies. New York: The Free
Press.
Rahayu, Sri, Unti Ludigdo, Didied Affandy. 2007. “Studi Fenomenologis Terhadap Proses Penyusunan
Anggaran Daerah Bukti Empiris dari Satu Satuan Kerja Perangka Daerah di Provinsi Jambi”.
Makasar: Seminar Nasional Akuntansi X
Schuller, R.S.1990. Repotitioning The Human Resources Function: Transforming or Demise, Academy
Management Excecutive, 4(3) : 49-59.
Simamora, Henry. 2004. Manajemen Sumber Daya Manusia, Edisi Ketiga, Cetakan-I, Yogyakarta:
Penerbit STIE YKPN
Skelcher, Chris, 1992, Managing for Service Quality, London: Longman Group, U.K.Lpd.
UU Nomor 32 Tahun 2004 tentang Pemerintahan Daerah, Jakarta, Sinar Grafika, 2005.
UU Nomor 11 Tahun 2006 tentang Pemerintahan Aceh, Jakarta , Sinar Grafika, 2005.
UU Nomor 43 Tahun 1999 tentang Pokok-Pokok Kepegawaian, Jakarta, Sinar Grafika, 2000.
UU No 25 Tahun 2009 tentang Pelayanan Publik, Jakarta: Sinar Grafika

Proceedings of The 1th Almuslim International Conference on Science, Technology and Society (AICSTS) 2015
November 7-8, 2015, Bireuen, Indonesia
384
Local-Wisdom-Based Conflict Resolution In Aceh: (The Study of
the Role of Customary Institution for Building Peace in
Lhokseumawe, Aceh, Indonesia)
1Fajri M Kasim, 2Abidin Nurdin
Department of Sociology, Universitas Malikussaleh, Aceh
Corresponding Author: [email protected]; [email protected]
Abstract
This study examines the conflict resolution based on local wisdom in Aceh focused on
the existence and role of traditional institutions in building peace in the city of
Lhokseumawe. The urgency of these studies refer to the main argument put forward
that local knowledge can be a resolution of the conflict in society on the one hand, and
bring better impact on the formal justice on the other hand. This study is important
because it emphasizes that local knowledge can be use as a frame of reference in
solving conflict in Acehnese society. The local wisdomis full of religious values that
become a way of life of the people of Aceh. As mentioned in hadih Majah (Aceh
proverb): “hukum ngon adat lagee zat ngon sifeut” [religion and customs are like
substance and nature that can not be separated]. This tradition is a very democratic
conflict resolution without bloodshed and rancor between the two sides of the conflict,
both vertically and horizontally. This research was conducted in the City Lhoksumawe
by using a qualitative approach. While the method of data collection; depth interviews,
focus group discussions, and study the document. The results showed that local
knowledge still exist to resolve conflicts or disputes in society, for example, a fight
between residents, minor theft or defilement and disputes concerning land boundaries.
While the role of traditional institutions in resolving conflicts or disputes fairly significant,
traditional institutions, among others; keuchik, tuha peut, imum meunasah and other
public figures.
Keywords: Conflict resolution, local wisdom, customary institution, Aceh, MAA
Introduction
Local wisdom (local wisdom) can be interpreted as a whole view of life or teachings, advices, proverbs,
and the values of life and honored tradition, practiced by both communities who have customary

Proceedings of The 1th Almuslim International Conference on Science, Technology and Society (AICSTS) 2015
November 7-8, 2015, Bireuen, Indonesia
385
sanctions or who do not have the sanction (Sanusi, 2005).Local wisdom that can be used as a socio-
cultural mechanisms contained in the Indonesian tradition. The tradition is believed and has been proven
to be a powerful tool to raise brotherhood and solidarity between people who have been institutionalized
and crystallized in the social order and culture.
The Moluccas are local wisdom called pela, and gandong. Pela is based upon an agreement of friendship
and brotherhood ties two or more villages, and gandong implies friendship formed because of the
awareness geneologis (Aditjondro, 2007). In addition, among the local wisdom that has existed since the
first, and still maintained until now, among others; adat beramaibaakuran (South Kalimantan).
karapatankaum (West Sumatra), muakhi (Lampung), setungkutigabatu (Papua) (Alamsyah, 2012);
DalihanNatolu (Tapanuli, North Sumatra), betang (Central Kalimantan), menyama Braya (Bali), saling Jot
and saling pelarangan (NTB), siroingsunyo, yoingsunsiro (East Java), alon-alonasalkelakon (Java Central
and Yogyakarta), and basusunsirih (Malay / Sumatra). Local wisdom that still exists and prevails in
society, has the potential to be able to encourage the desire to live in harmony and peace. That's
because local knowledge is essentially teaches peace with each other, the environment, and the Lord
(Sriyanto, 2007).
Meanwhile, in Acehnese society known as di'iet, Sayam, suloh, peusijukand peumatjaroe have long
entrenched and practiced to this day. Local wisdom also try to be preserved include resolving conflicts
that occur in the community also uses the mechanisms of local knowledge. For example, a conflict
resolution process that develops within the community settled in a custom frame laden with religious
values. This tradition is a process of very democratic conflict resolution without bloodshed and rancor
between the two sides of the conflict, both vertically and horizontally.
If analyzed in depth local knowledge that grows in Acehnese society is the result of a dialectic with the
values of Islam which has been strongly embraced. So that Islam becomes the very foundations of
culture that have a power struggle to reach the future. As is often referenced contained in hadihmaja
(proverb) namely; adat bapoeTeumeureuhom, Hukom bak Syiah Kuala, Qanun bak Putroe Phang,
reusam bak Lakseumana. It can be interpreted, poeteumeurehom (executive power-sultan), Syiah Kuala
(judicial-ulama), Putroe Phang (legislative), Laksamana (defense-army). Also “Hukom ngon adat lagee
zat ngon sipheut"(Islamic law and customs like substance and nature, can’t be separated) (Hussein,
1970).
Conflict resolution by using local customary or local knowledge as long as this is already entrenched in
the community is the right step. Local wisdom is something that is already rooted and usually not just a
mere profane oriented, but also the sacred oriented so that its implementation can be quickly and easily
accepted by the public. With local customary conflict resolution is expected to be quickly realized, could
be acceptable to all groups so that no hidden latent conflicts in the community (Sriyanto, 2007).
On the other hand the government continues to make the revitalization of local wisdom through legislation
which is then accommodated in Law No. 44 1999 article 3 paragraph 2 mentioned that the province has

Proceedings of The 1th Almuslim International Conference on Science, Technology and Society (AICSTS) 2015
November 7-8, 2015, Bireuen, Indonesia
386
the authority to regulate; 1) the organization of religious life; 2) implementation of customary life; 3)
provision of education and the role of scholars in setting regional policy. Efforts to revive the local wisdom
is being conducted with the enactment of: Perda No. 7 Tahun 2000 (Penyelenggaran Kehidupan Adat);
Qanun No. 4 Tahun 2003 (Pemerintahan Mukim); Qanun No. 5 Tahun 2003 (the Gampong
administration); UURI No. 11 Tahun 2006 (Pemerintahan Aceh); Qanun (Local Regulations) No. 9 Tahun
2008 (on Customary life and law); Qanun No. 10 Tahun 2008 (customary institution); Governorial
regulation or Pergub No. 60 Tahun 2013 (on Implementation of Resolution / Dispute Customary and
Customs.
In UUPA 11 of 2006 mentioned about Customary Institute includes 13 traditional institutions, among
others, a) Majelis Adat Aceh; b) Imeum Mukim ; c) Imuem chik ; d) Keuchik ; e) Tuha Peut ; f) Tuha
Lapan ; g) Imuem Meunasah (according to UUPA, 2006).
The role of traditional institutions and culture of Aceh as a conflict resolution as mentioned in Qanun No. 9
of 2008 concerning Customary Life and Customs. In this Qanun Adat has the authority to settle 18 cases
at the village level; 1) disputes in the household; 2) inter-family disputes related to inheritance; 3) disputes
between citizens; 4) Seclusion or obscene; 5) Disputes about property rights; 6) The dispute in the family;
7) Dispute treasure seuharkat (Gonogini); 8) Theft of light; 9) stealing of domesticated cattle; 10)
Violations of customary livestock, agricultural and forest; 11) Disputes at sea; 12) Dispute on the market;
13) Persecution light; 14) The burning of forests; 15) Harassment, defamation, hasut and defamation; 16)
defilement environment; 17) Threatens threatening; 18) Disputes in violation of customs.
Departing from this background, this study will focus on the resolution of conflicting views of the existence
of local knowledge, the role of institutions, settlement patterns and the impact on society. The study of
local wisdom becomes attractive in an era of globalization that continues to penetrate into the social
system and culture of Aceh. Therefore, the main problem will be answered in this paper is; How the
existence of local wisdom in resolving the conflict in Aceh society? And what is the role of traditional
institutions in the process of conflict resolution in Aceh society?
The Existence of Local Wisdom in Resolving Conflict
Local wisdom in Acehnese society still existed nowadays. Despite never experience the ups and downs
due to various factors, including political impartiality of government policy to local wisdom in Indonesian
society, includings in Aceh. For example, political and social changes that occurred after the formation of
the State of Indonesia resulted in the existence of traditional institutions have gradually started excluded.
It begins with the New Order authoritarian politics that issued Law No. 5 1979 Village Government which
eliminate all forms of customary law in Indonesia (Research Team PKPM, 2007).
However, in line with the spirit of reform and regional autonomy expression changes and democratization
continues to grow in Indonesia. Including the administration of privilege of Aceh in the Law 44 of 1999 as
mentioned that the province has the authority to regulate; 1) the organization of religious life; 2)
implementation of customary life; 3) provision of education and the role of scholars in setting regional

Proceedings of The 1th Almuslim International Conference on Science, Technology and Society (AICSTS) 2015
November 7-8, 2015, Bireuen, Indonesia
387
policy (Act No. 44 of 1999 article 3 paragraph 2).Efforts to revive the local wisdom is continuing this
proven with the stipulation. This is in line with the views expressed by Usman Budiman, public figures
who had served as Chairman of MAA Lhokseumawe for 11 years. He said in a Focus Group Discussion
(FGD):
"Actually MoU and IkrarLamteh (peace agreement between DI / TII and the Government of
Indonesia) is clearly based on local wisdom. Local wisdom in Aceh becomes the rule in the
community prior to the Islamic law and national law. This local knowledge continues to appear
with the enactment of Law No. 44 of 1999 then in Aceh are within the customary privileges,
scholars, education; then strengthened by Law No. 11 on Governing Aceh in 2006 thus
QanunAdat institutions of authority Customaryinstitution, the local wisdom existence is getting
stronger. Since 2010 gives intensive Rp. 200-300 for the settlement of the dispute. In 2013 I
(Usman BudimanLhokseumawe Chairman MAA) was invited to Bappenas, Jakarta facilitated by
UNDP and IOM. In Jakarta I explain the existence of local kearipan in resolving conflicts in
society, which was attended by representatives from Papua, Kalimantan, Java and other
provinces. "(FGD, June 11, 2015).
The existence of local knowledge, particularly related to the revitalization of traditional institutions
continue to experience the post-reform, especially in 1999 and continued to strengthen in 2006. Local
knowledge can’t be separated by customary institutions as the actor who played the role to preserve it,
meaning that when the traditional institutions of this new order of government abolished (1979), then the
local knowledge also relegated its role in society. Therefore, the government of Aceh and all elements of
society aware of the importance of such wisdom. Correspondingly, Badruzzaman Ismail, Chairman of
MAA of Aceh province strengthened the above mentioned view:
"The existence of local wisdom can be seen in the peace process DI / TII with the Government of
the Republic of Indonesia. Then the peace process conducted in the Blang Padang with kendhuri
and peusijuk. Similarly, the Uleebalang properties that many left during the Cumbok Affair solved
by consultation with local wisdom approach. The use of local knowledge re-use at the time of the
Helsinki MoU peace in 2015, former GAM combatants, widows, orphans are given compensation
in the Acehnese language is called diyat. Diyat is the form of payment of money, venture capital,
replacing damaged homes, the cost of treatment for the sick or handicapped. "(Interview, June
24, 2015).
However in the process of revitalization of local wisdom is not as easy as turning the palm of the hand.
The issuance of Law No. 30 of the village government in 1979, conflict in Aceh for more than 30 years,
the earthquake and tsunami influence such wisdom as confirmed by Tengku Yusdedi, head of MAA of
Lhokseumawe:

Proceedings of The 1th Almuslim International Conference on Science, Technology and Society (AICSTS) 2015
November 7-8, 2015, Bireuen, Indonesia
388
"There are still local wisdom and still running, although not optimal and institutions still run local
wisdom. However, compared with the previous period seems no progress. There are some who
go there are some also who is not running. Currently the problem in the village is the village
leaders are now less aware of local wisdom, as well as the laws and rules that apply in the
village. Aceh the waning identity is religion so that communities are not informed about the
obligations and the identity of the people of Aceh so that local knowledge existing in the lower of
the ancestors of the people of Aceh had faded. In fact it can be said that the first customs of the
religion, when religion comes immediately greeted by custom. "(FGD, June 11, 2015).
The existence of local wisdom to resolve conflicts and disputes in society intensified when a decision
signed jointly; Aceh Governor and the Regional Police Chief Customary Courts of Aceh on the
Implementation of the Village and Mukim in Aceh in 2011. The joint decision of the joint; 1) disputes /
disputes at village level and mukim were mild as the qanun No. 9 Thaun 2008 on the Development of
Customary Life and Customs shall be settled in advance through the Customary judicial of Gampong and
Mukim in Aceh; 2) The police officer gives a chance that any dispute / dispute as meant in the first dictum
to be resolved first through the Gampong and Mukim Customary Justice; 3) all parties shall respect the
Customary Courts Implementation of the Gampong and Mukim; 4) ruling Justice and Mukim Gampong
customs or other names in Aceh are final and binding and can not be filed again at a general court or
other judicial.
Local wisdom can exist in a traditional Acehnese society and culture still survived in spite of the various
factors involved degrade even eliminate it as already mentioned. Customs and culture remains
sustainable in line with the times and changing times. Pharmaceutics customs and cultural foundations
caused by factors that strengthen customary religion. Like the philosophy of Aceh; hukum custom
ngonlageengon substances sifeut (religion and customs like substance and nature [inseparable]. This
philosophy became the identity, character and characteristic of the Acehnese people who uphold their
customs and culture as high honor of religion. It is recognized by TGK. Abdurrahman Kaoy, Vice
Chairman of MAA Aceh province, he asserts that;
"Local knowledge still exist as a community conflict resolution in Aceh until now due in
accordance with the way of life, characteristics and identity of Acehnese people that harmony
between religions and customs. Islamic religious promoting the values of peace and eliminate
rancor, these values then affect the customs and culture of Aceh. Similarly, customs before Islam
came adopted as customary Aceh, for example, peusijuk which is then used as a Hindu influence
the local wisdom in Aceh even one of the peace process between the parties to the dispute
ended with peusijuk ". (Interview, June 24, 2015).
If related structural-functional theory proposed Parsons (in Ritzer and Goodman, 2005: 12) that in a
society which has a structure and system will appear each function. Parsons mentions four structural

Proceedings of The 1th Almuslim International Conference on Science, Technology and Society (AICSTS) 2015
November 7-8, 2015, Bireuen, Indonesia
389
components of the social system; value, norms, roles and the collectivity (Ali and Heryani, 2013: 103).
Soekanto (1983: 113) says that the social structure is a network of social elements are a staple in the
community. The elements of the basic social cover; social groups; culture, social institutions, social
stratification, power and authority. The social structure of the people of Aceh are still maintained and
sustainable despite the inevitable changes, for example, cultural and social stratification.
The Role of Traditional Institutions in Conflict Settlement
Role of Traditional Institutions bounce back after the reform with the enactment of Law No. 44 Year 1999.
Already there Customary Institute and culture Aceh (LAKA) later in 2004 turned into Aceh Customary
Council (MAA). 2005 formed MAA district level which oversees 13 institutions Customary; for example,
Keuchik, TuhaPeut, TuhaLapan, Keujruen Blang, Panglima Laot, Haria Pekan and Pawang Uteuen or
Pawang Glee.
Related to the role of institutions respectively, Usman Budiman, former Chairman of MAA explained that:
"Each of these traditional institutions has a role and authority in finish disputes and conflicts in
their respective areas. Traditional institutions in conducting judicial proceedings related
customary issues during the trial there were seven people involved, in the judicial process,
including keuchik village who acts as a judge, Tuha Peut as a judge of other members as panitra.
Traditional institutions have a role in resolving the dispute 18 proceedings under the Qanun Adat
Court in 2008; for example, a fight, inheritance disputes, minor theft etc. In fact there is anMoU
between Aceh police, MAA and the Governor related to the dispute with the village customary
justice. "(FGD, June 11, 2015).
The explanation above shows that the role of traditional institutions in Acehnese society is currently
experiencing post-reform developments. Customary institutions or device has the authority to resolve
disputes recognized by the Aceh government also issued Qanun 9 of 2008 concerning Customary
Development Life and Customs. This Qanun explained that the traditional authorities and the government
have the authority to settle cases as elaborated before.
If traced in documents peace treaty resolving conflicts or Seketa on two village in the city of
Lhokseumawe, namely, Gampong AlueAwee and Gampong Paya Punteeut also found quite a role of
customary institutions. Gampong Alue Awee Kecataman Muara Dua on 26 February 2010 traditional
institutions managed to reconcile fights between residents. Traditional institutions are present in the
peace process is Keuchik; ImumGampong, Tuha Peut, Secretary of the village, and a few head of Hamlet
(Document Gampong Justice, No. 460/120/2010).
Concluding Remarks
Local wisdom in Acehnese society still exist to this day. Despite never experiencing the ups and downs
due to various factors, including political impartiality of government policies to local wisdom in Indonesian

Proceedings of The 1th Almuslim International Conference on Science, Technology and Society (AICSTS) 2015
November 7-8, 2015, Bireuen, Indonesia
390
society, including in Aceh. Partly due to the New Order authoritarian politics that issued Law No. 5 1979
Village Government which eliminate all forms of customary law in Indonesia. The existence of local
wisdom in Aceh continues to increase along with the spirit of reform and regional autonomy expression
changes and democratization continues to grow in Indonesia. Including the implementation of Law No.
44 of 1999 on privilege rights of Acehas mentioned that the province has the authority to regulate; 1) the
organization of religious life; 2) implementation of customary life; 3) provision of education and the role of
scholars in setting regional policy.
The role of traditional institutions until now quite instrumental resolution of conflicts and disputes in
Acehnese society. Traditional institutions which numbered 13 as mentioned in the regulation and law, for
example: keuchik, tuhapeut, imum village, keujrunblang, has the authority to resolve conflicts and
disputes in 18 forms, among others; fights, the division of the estate, lightweight theft, land boundaries,
slander, minor traffic accidents as stipulated in the regulation and Decree with the Governor of Aceh,
Aceh police and the Aceh Adat Council in 2011. Traditional institutions in which there is the adat
(traditional leaders) has the authority to resolve disputes and conflicts in society. Customary stakeholders
function as a mediator, facilitator, negotiator and arbitrator in resolving disputes. Adat is meant here is
keuchik, priests meunasah and customary stakeholders village. As evidence in the documents conflict
resolution or peace agreement Seketa on two villages in the city of Lhokseumawe, namely, Gampong
Alue Awee 2010 and Gampong Paya Punteeut 2011 act fairly traditional institutions and managed to
reconcile fights between residents. This shows that local knowledge is still showing its existence and
customary institutions also have a significant role in reconciling conflicts or disputes that occur in the
community, so that people feel the need for peace.
References
Aditjondro, Goerge Junus. MotumboTana: Pranata Resolusi Konflik atau Landasan Pelebaran Konflik?
dalam Alpha Amirrachman (et al.), Revitalisasi Kearifan Lokal: Studi Resolusi Konflik di
Kalimantan Barat, Maluku danPoso, Jakarta: ICIP. 2007, 310-311
Alamsyah, Resolusi Konflik Keluarga Berbasis Kearifan Lokal Islam di Nusantara, Jurnal Analisis, Volume
XII, Nomor 2 Desember. 2012, 291- 403
Ali, Ahmad and Wiwie Heryani, 2012. Sosiologi Hukum: Kajian Empiris terhadap Pengadilan, Jakarta:
Kencana. 2012, 103
Amirrachman, Alpha et al., 2007. Revitalisasi Kearifan Lokal: Studi Resolusi Konflik di Kalimantan Barat,
Maluku dan Poso, Jakarta: ICIP.
Arikunto, Suharsimi. 2010. Prosedur Penelitian: Pendekatakan Praktek, Jakarta: RinekaCipta.
Denzin, Norman K. dan Yvonna S. Lincoln. 2009. Handbook of Qualitatif Research, Yogyakarta: Pustaka
Pelajar.

Proceedings of The 1th Almuslim International Conference on Science, Technology and Society (AICSTS) 2015
November 7-8, 2015, Bireuen, Indonesia
391
Husein, Moehammad. 1970. Adat Atjeh, Banda Aceh: Dinas Kebudayaan Provinsi Daerah Istimewa
Aceh.
Ismail, Badruzzaman. 2006. Pola-Pola Penyelesaian Pelanggaran HAM: Pendekatan Adat Sebagai
Aspek Kearifan Lokal, Makalah Disampaikan pada Workshop Strategic Planning Penyelesaian
Pelanggaran HAM Masa lalu di Aceh, di selenggarakan di Sabang tanggal 22 – 23 Mei, oleh
Aceh Judicial Monitoring Institute (AJMI).
Ismail, Badruzzaman. 2014. Pedoman Peradilan Adat: Sisi-sisi Keterkaitan Kawasan Adat Mukim dan
Gampong di Aceh, Banda Aceh: Majelis Adat Aceh.
Keputusan Bersama Gubernur Aceh, Kepolisian Daerah Aceh dan Ketua Majelis Adat Aceh, 2011.
Tentang Penyelenggaraan Pelanggaran Peradilan Adat Gampong dan Mukim atau Nama
Lainnya.
MajelisAdat Aceh. 2008. Pedoman Peradilan Adat di Aceh: Untuk Peradilan Adat yang Adil dan
Akuntabel, Banda Aceh: MAA, Bappenas, European Union, APPS dan UNDP.
Miles, Matthew B. dan A.Michael Huberman.1984. Qualitative Data Analysis: A Source Book of New
Methods, Newbury Park: Sage Publications.
Moleong, Lexy.1997. Metodologi Penelitian Kualilatif, Bandung: Rosda Karya.
Nazir, Moh. 1985. Metode Penelitian, Jakarta: Ghalia Indonesia.
Parsons, Talcott and Robert Bales (eds). 1995. Family, Socialization and Interaction Process, Glenceo, II:
The Free Press.
Peraturan Gubernur Aceh No. 60 Tahun 2013 Tentang Pelaksanaan Penyelesaian/Sengketa Adat dan
Adat Istiadat.
Qanun Aceh No. 9 Tahun 2008. Tentang Pembinaan Kehidupan Adat dan Istiadat.
Qanun Aceh No. 10 Tahun 2008. TentangLembaga Adat.
Salim, Arskal. 2015. Comtemporary Islamic Law in Indonesia: Sharia and Legal Pluralism, United
Kindom: Edinburgh University Press.
Rahardjo, Satjipto. 1980. Hukum dan Masyarakat, Bandung: Angkasa.
Rosdiawan, Ridwan et al., 2007. Merajut Perdamaian di Kalimantan Barat dalam Alpha Amirrachman
(editor), Revitalisasi Kearifan Lokal: Studi Resolusi Konflik di Kalimantan Barat, Maluku dan
Poso, Jakarta: ICIP.
Ritzer, George dan Doglas J. Goodman. 2005, Teori Sosiologi Modern, Edisi Keenam, Jakarta: Kencana.
Sanusi. 2005. Kearifan Lokal dan Peranan Panglima Laot dalam Proses Pemukiman dan Penataan
Kembali Kawasan Pesisir Aceh Pasca Tsunami, LaporanPenelitian, Banda Aceh: Pusat
Penelitian Ilmu Sosial dan Budaya Universitas Syiah Kuala.
Proceedings of The 1th Almuslim International Conference on Science, Technology and Society (AICSTS) 2015
November 7-8, 2015, Bireuen, Indonesia
392
Soekanto, Soerjono. 2005. Sosiologi: Suatu Pengantar, Jakarta: Rajawali Press.
Soekanto, Soerjono. 1983. Penegakan Hukum, Jakarta: Bina Cipta.
Sriyanto, Agus.2007. Penyelesaian Konflik Berbasis Budaya Lokal, Ibda`: Jurnal Studi Islam dan Budaya,
Vol. 5, No. 2 , Jul-Des.
Supranto, J. 1997.Metode Riset, Jakarta: Rineka Cipta.
Tim Peneliti PKPM. 2007. Penerapan Alternatif Dispute Resolution Berbasis Hukum Adat Pada Lembaga
Keujreun Blang di Kabupaten Aceh Besar, Banda Aceh: BRR Sarpras Hukum dengan PKPM.
Undang-Undang Republik Indonesia Tentang Pemerintahan Aceh Nomor 11 Tahun 2006, Banda Aceh:
Dinas Informasi dan Komunikasi Provinsi Nanggroe Aceh Darussalam.
Yuhassarie, Emmy dan Tri Harnomo (Editor). 2004. Mediasi dan Court Annexed Mediation: Prosiding
Rangkaian Lokakarya Terbatas Masalah-Masalah Kepailitan dan Wawasan Hukum Bisnis
Lainnya Tahun 2004, Jakarta 17-18 Februari 2004, Jakarta: Pusat Pengkajian Hukum.

Proceedings of The 1th Almuslim International Conference on Science, Technology and Society (AICSTS) 2015
November 7-8, 2015, Bireuen, Indonesia
393
Human rights in Indonesia: An analysis of The Effects of Regime
Change and Ongoing Economic development on Human Rights
Violations in Indonesia
Roza Espandeary Rosman
Texas A&M University at Qatar
Abstract
An analysis of whether the change in regime of Indonesian government and economic
development has had an effect on reducing human rights violations was performed. A
plan of action to be implemented by the Indonesian government to improve the process
of handling human rights violations was also suggested. The extent to which corruption
and the lack of government involvement influence violations of human rights in
Indonesia was examined by comparing the frequency of human rights abuses with
corruption; and with the growth in GDP from 1980 to 2010. Indonesia was ruled under
authoritarian leadership for half a century and is now in a transition state between
autocracy and democracy. The spotlight on violation of human rights in Indonesia have
increased, but with little improvements. Separatist movements, ethnic and religious
discrimination, have contributed to human rights violations in Indonesia; especially in
Aceh and Papua. From analyzing human rights data and Indonesia’s GDP, it was found
that economic development has no direct correlation to human rights violations. Thus, a
lack of resources is not a contributing factor to government’s lack of involvement in
reinforcing basic human rights law. Conversely, a change in regime showed a reduction
in cases where human rights were abused. The neglect of human rights presented in
this paper gives an insight to how Indonesia, a country based on democracy, infringes
its constitution and the international treaties it has ratified.
Keywords: Indonesia, human rights, Aceh, democracy and human rights, human rights
violations, Papua, government involvement
Introduction
This paper looks to analyze whether or not the change in regime of the government of Indonesia and
economic development have had an effect on reducing human rights violations, as well as to suggest a
plan of action for the government to be more involved and improving the process of dealing with human
rights violations.
Proceedings of The 1th Almuslim International Conference on Science, Technology and Society (AICSTS) 2015
November 7-8, 2015, Bireuen, Indonesia
394
Human rights are defined as the fundamental or natural rights individuals have since birth. These
undeniable rights are iterated in the 1948 Universal Declaration of Human Rights (UDHR), a document
that ensures international rights of freedom and equality (Encyclopedia Britannica, Mark 2001, Youth for
Human Rights 2002 – 2012). Some examples of the rights include: being born free and equal in dignity
and rights; having the right to life, liberty and security; the right to not being subjected to torture or to
cruel, inhuman or degrading treatment or punishment; and lastly, having the right to freedom of religion
and expression (United for Human Rights). The violation of human rights is then simply when individuals
are deprived of these fundamental rights and other rights enumerated in the country’s constitution.
Indonesia has had a change in regime ever since its independence in 1945. It was under authoritarian
leadership for half a century, under Sukarno and Suharto, and now it is slowly experiencing
democratization ever since Suharto stepped down from office in 1998 after 32 years of ruling (Luebke,
2009). Throughout the last decade, the spotlight on violation of human rights in Indonesia have increased
but with little improvements (Human Rights Watch 2011, Indonesia 2009, Asian Human Rights
Commission 2006).
Theory and Hypothesis
From the previously mentioned human rights violations cases and the ratifications of International
treaties, it is observed that Indonesia is in a transition state between an autocratic and a democratic state.
Researchers have argued that in a democratic country, human rights are perceived as a significant
element in a democratic country and hence violations of said rights are less likely (Kimura 2011,
Hathaway 2007 & Eldridge 2002). The protection of human rights in a democratic country can also be due
to the fact that it is based on public support and public opinion, without which the government would not
serve its true purpose of serving and protecting the people. Conversely, the need for public support in an
authoritarian regime is non-existent.
The fact that the government has the luxury to neglect human rights violations in Indonesia could be due
to lack of resources to reinforce and implement the international treaties and basic human rights law.
Since Indonesia is a growing country, the instability in the economy as well as corruption in the system
may also undermine government support and interventions (Hathaway 2007 & Eldridge 2002). The lack
of government intervention and participation could also be due to factors such as: lack of political
participation and political will, people’s distrust in the government, traditional norms and corruption. The
extent to which lack of political participation and corruption influence violations of human rights in
Indonesia can be examined and studied further to see how they interrelate.
Data comparing the number of frequency of human rights abuses with corruption as well as growth in
Gross domestic Product (GDP) from the year 1980 to 2010 will be analyzed. This is done confirm whether
or not the hypothesis of Indonesia’s change in regime, economic development and corruption have an
effect on human rights violations.

Proceedings of The 1th Almuslim International Conference on Science, Technology and Society (AICSTS) 2015
November 7-8, 2015, Bireuen, Indonesia
395
Indonesia is suitable for examining this issue because it has had a lot of undisputed human rights
violations since 1945, with major changes in its regime. Moreover, the issue still exists today with the lack
of government intervention. The Republic of Indonesia has a long and complex history of human rights
violations; and most of the incidents that occur are usually accompanied by religious issues brought up by
differences in opinion among citizens and the government. The shocking prevalence of human rights
violations and their occasional connection to religion lead one to question whether or not the government
is involved or concerned about these incidents.
Data Analysis
The graphs were generated using data from World Bank and CIRI (cite). All six graphs show the
relationship between Indonesia’s GDP and Physical Integrity Rights Index (PIRI) as well as with five
human rights indicators: disappearances, extrajudicial killings, political imprisonment, torture and freedom
of speech.
Figure 1, shows the relationship between Indonesia’s GDP and PIRI. PIRI is an additive index that
measures government respect towards torture, extrajudicial killings, political imprisonment and
disappearance (CIRI). The lowest score is zero, which indicates the government has no respect for the
four rights, and the highest is eight, which indicates the government fully respects and is aware of those
rights. Government respect is one of the categories and dimension of human rights for the development
of indicators. It is defined as the absence of interference in the exercise of the four aforementioned rights.
It measures the degree to which the country is responsible for human rights violations, for example,
measures how frequently torture or disappearances occur (UNDP, 2006).
As clearly shown by the graph, there is no definite correlation between the two variables. This suggests
that improvement in the Indonesian economy has no effect on government respect for full human rights.
Furthermore, it also implies that lack of resources is not a factor for the lack of government intervention
and involvement. This leads one to question the integrity of the government’s will to protect the people’s
rights.
The graph also shows that regime change from Suharto to present time government respect has
improved slightly. During Suharto’s reign in power, government respect fluctuates and eventually plateaus
at zero towards the end of his resignation in 1998, after which it continues to increases before decreasing
to another plateau at 3 from 2006 onwards (Berger, 2008).
The remaining six graphs, Figures 2-7, show the relationship of GDP with five human rights indicators;
disappearances, extrajudicial killings, political imprisonment, torture, freedom of religion and freedom of
speech. The measurement of the indicators is in terms of frequency, with zero indicating that cases occur
frequently and a 2 indicating no occurrence.

Proceedings of The 1th Almuslim International Conference on Science, Technology and Society (AICSTS) 2015
November 7-8, 2015, Bireuen, Indonesia
396
Figure 1. Graph of GDP vs PIRI
Figure 2. Graph of GDP vs. Frequency of Disappearances
Disappearances cases include those in which people have disappeared and not been found.
Disappearances occur without public knowledge, and there is no information on who took them and why;
however it is common that political reasoning may be the reason behind it. A score of zero indicates these
0
1
2
3
4
5
6
0
500
1000
1500
2000
2500
3000
3500
1981 1986 1991 1996 2001 2006
PIR
I
GD
P P
er
Cap
ita
(cu
rre
nt
US
$)
Time (years)
GDP vs. Physical Integrity Rights Index (PIRI)
Government Respect for Full Rights GDP per Capita (current US $)
0
0.5
1
1.5
2
2.5
0
500
1000
1500
2000
2500
3000
3500
1981 1986 1991 1996 2001 2006
Fre
qu
en
cy o
f D
isap
pe
ran
ces
GD
P P
er
Cap
ita
(cu
rre
nt
US
$)
Time (years)
GDP vs. Frequency of Disappearances
Disappearances
GDP per Capita(current US $)

Proceedings of The 1th Almuslim International Conference on Science, Technology and Society (AICSTS) 2015
November 7-8, 2015, Bireuen, Indonesia
397
cases have occurred frequently in the given year, 1 indicated occasional occurrences and a 2 indicates
no occurrence.
The graph shows no correlation between GDP and frequency of disappearances. However, it should be
noted that from the 2005 onwards, an increase in GDP shows a reduction in disappearance occurrences
from frequent to non-existent. This observation can be supported by the fact that Aceh and the central
government signed the Helsinki Agreement, Memorandum of Understanding, in 2005 to end the conflict in
Aceh. It is worth mentioning that the conflict between Aceh separatist movement and Indonesia’s central
government had been going on since 1976, during which a lot of killings and abductions of males
occurred. Abductions of fathers, husbands and brothers were based on the government’s suspicion that
they were personnel of GAM, the free Aceh movement organization (Human Rights Center, 2005).
It should also be noted that in 2004, there were 779 reported cases of Human Rights violation in Aceh
alone. Out of 779, 72 were civilian abduction cases, which is about 10%. Moreover, fifty and 20 percent of
the 779 cases were killing and torture respectively (Human Rights Center, 2005).
Figure 3. GDP vs. Frequency of Extrajudicial Killings
Extrajudicial killing is defined as killings by government officials without due process of law, which may
result from deliberately and illegally using police force against criminal suspects or prisoners. A score of 0
indicates that extrajudicial killings were practiced frequently in a given year, 1 indicates it was practiced
occasionally, and a 2 indicates no occurrence of such killings.
The graph shows no correlation between both GDP and regime change with frequency of extrajudicial
killings. However there is a reduction in numbers of cases after Suharto’s resignation. It was expected
that there would be more occurrences of extrajudicial killing during his reign of power, but the data shows
otherwise. One of the reasons could be because Indonesia was trying to attain a peaceful transition from
0
0.5
1
1.5
2
2.5
0
500
1000
1500
2000
2500
3000
3500
1981 1986 1991 1996 2001 2006
Fre
qu
en
cy o
f Ex
traj
ud
icia
l Kill
ings
GD
P P
er C
apit
a (c
urr
ent
US
$)
Time (years)
GDP vs. Frequency of Extrajudicial Killings
ExtrajudicialKillings
GDP perCapita(current US $)

Proceedings of The 1th Almuslim International Conference on Science, Technology and Society (AICSTS) 2015
November 7-8, 2015, Bireuen, Indonesia
398
an authoritarian regime to a democracy. Another reason could be the development of a peace settlement
between the Free Aceh Movement and the government (Freedom House 2006).
Figure 4. GDP vs. Frequency of Political Imprisonment
There is no direct correlation between political imprisonment and GDP, or between the former and regime
change.
Torture is not limited to the deliberate infliction of pain, mentally or physically, by government officials. It
also includes cruel and degrading treatment of an individual as well as deaths in custody cause by
government negligence. A score of 0 indicates that torture was practiced frequently in a given year, 1
indicates occasional occurrence, and a 2 indicates no occurrence.
It is interesting to see that the occurrence of torture has remained constant for the last twenty years. It
provokes one to wonder if the right to protection against torture, which is protected under international
law, is not employed in Indonesia. The reason behind the high occurrence of torture could be due to the
separatist movement (war) that went on in Aceh and East Timor, as well as the ongoing war in Papua.
0
0.2
0.4
0.6
0.8
1
1.2
0
500
1000
1500
2000
2500
3000
3500
1981 1986 1991 1996 2001 2006
Fre
qu
en
cy o
f
Po
litic
al I
mp
riso
nm
en
t
GD
P P
er
Cap
ita
(cu
rre
nt
US
$)
Time (years)
GDP vs. Frequency of Political Imprisonment
PoliticalImprisonment

Proceedings of The 1th Almuslim International Conference on Science, Technology and Society (AICSTS) 2015
November 7-8, 2015, Bireuen, Indonesia
399
Figure 5. GDP vs. Torture
Figure 6. GDP vs. Freedom of Speech
Freedom of speech measures how government censorship and ownership of media outlets affect
freedoms of speech and press. A zero indicates complete censorship, a 1 indicates some and a 2
0
0.2
0.4
0.6
0.8
1
1.2
0
500
1000
1500
2000
2500
3000
3500
1981 1986 1991 1996 2001 2006
Fre
qu
en
cy o
f To
rtu
re C
ase
s
GD
P P
er
Cap
ita
(cu
rre
nt
US
$)
Time (years)
GDP vs. Frequency of Torture Cases
Torture
GDP per Capita(current US $)
0
0.2
0.4
0.6
0.8
1
1.2
0
500
1000
1500
2000
2500
3000
3500
1981 1986 1991 1996 2001 2006
Leve
l of
Go
vern
me
nt
Ce
nso
rsh
ip in
Me
dia
GD
P P
er
Cap
ita
(cu
rre
nt
US
$)
Time (years)
GDP vs. Level of Restriction in Media
Freedom ofSpeech
GDP per Capita(current US $)

Proceedings of The 1th Almuslim International Conference on Science, Technology and Society (AICSTS) 2015
November 7-8, 2015, Bireuen, Indonesia
400
indicates no government censorship during a given year. It is seen from the graph that freedom of speech
has improved ever since Suharto’s ruling. Indonesia has been labeled as partly free in terms of internet
and press (Freedom House 2012).
Figure 7. Freedom of Religion
This variable indicates the level of government restriction on religious practices. A score of 0 indicates
severe and widespread government restrictions on religious practices by citizens, a 1 indicates moderate
restrictions, and a 2 indicates absence of such religious practices. There has not been any improvement
on freedom of religion with change in regime and improved economy; there were 216 and 184 cases of
religious attacks in 2010 and 2011 respectively (Human Rights Watch, 2012). Despite its secular identity,
it is unnerving to see that the government still puts restriction on freedom of religion, which is a right
protected under International law (UNDP 2006, Human Rights Watch 2012).
Conclusion
From the data analysis it was observed that economic development has no direct correlation to cases of
human rights violations. This suggests that lack of resources is not a contributing factor to government’s
lack of involvement. On the other hand, there were cases where a change in regime showed a positive
improvement in human rights abuses. For example, violations of freedom of speech cases have reduced
since Suharto resigned. The fact that the number of cases related to torture has not improved since 1991
and the fact that it has worsen since Suharto’s regime is of importance. This result should be scrutinized
further in terms of possible reasons that contribute to this stagnant effect.
It should be taken into consideration that the requirement to fulfill complete commitment to international
treaties that Indonesia has adopted since Soeharto’s resignation would take some time. It is difficult for a
0
0.5
1
1.5
2
2.5
0
500
1000
1500
2000
2500
3000
3500
1981 1986 1991 1996 2001 2006
Leve
l of
Go
vern
me
nt
Re
stri
ctio
n o
n
Re
ligio
us
Pra
ctic
es
GD
P p
er
Cap
ita
(cu
rre
nt
US
$)
Time (years)
GDP vs. Level of Restriction on Religious Practices
Freedom ofReligion
GDP perCapita(current US$)
Proceedings of The 1th Almuslim International Conference on Science, Technology and Society (AICSTS) 2015
November 7-8, 2015, Bireuen, Indonesia
401
country to change and neglect its traditions and old practices to conform to a new regime after thirty two
years of being under an authoritarian ruler. The level of trust of the people on the government is also not
something that can be achieved easily. Both the government and the people require time to internalize
the changes that have been made.
To make the transition easier, the government should increase public awareness about human rights
violations, by conducting educational and awareness programs in school, in the workplace and in the
country in general. The promulgation of awareness programs will gain public support, as the public will
feel that they are part of the policy-making process.
The neglect of human rights present in this paper gives an insight to how the Republic of Indonesia, a
Muslim country based on democracy, infringes the international treaties it has ratified and its own
constitution (UUD 45) – where more than one article enumerates and iterates the rights of the people.
“Indonesia is pushing for the inclusion of the promotion and protection of human rights”, however, from
the aforementioned cases it is conveyed that this statement falls short of accomplishment (Anwar, 2008).
Indonesia has ratified the entire seven “core” United Nations International Human Rights Treaties;
however it has yet to implement and abide by these international treaties and obligations it is a part of
(Human Rights Watch, Asian Human Rights Commission 2006, Indonesia 2009). Along with these seven
core treaties; ICCPR, ICESCR, CERD, CEDAW, CAT and CRC, Indonesia has also taken part in
numerous international conventions and covenants formed by the United Nations (Who Signed What).
It is worth mentioning that despite the state’s attempts to tend to human rights violations cases by
establishing the National Human Rights Commission (KOMNAS HAM) along with passing the Indonesian
government’s Plan of Action 2004-2009, these efforts are still insufficient. Indonesia thus far, has no law
that punishes human rights violators and KOMNAS HAM has no jurisdiction over a case unless the
government states explicitly that it is a case of human rights abuse. Crimes pertaining to human rights
violations are treated as ordinary crimes (Maag, 2005). Indonesia should create a new judiciary system
that will hear, evaluate and punish human rights violations cases. The judiciary system should be
prepared to listen to any possible cases of human rights violations and should be independent of the
central government. Independence is important because the government will have no say whether or not
the case classifies under human rights violations. In addition to this, KOMNAS HAM should meet
regularly, every year with a representative from the UN Treaty bodies to discuss ways of implementing
human rights laws and evaluate the progress Indonesia has made in terms of implementation. The
ratification of international treaties means nothing without implementation. The implementations of any of
these changes will take time, and so will the development. Implementation processes would inevitably
face difficulties; however, considering the numerous human rights violations that go unreported, it is
crucial for Indonesia to start now.
Proceedings of The 1th Almuslim International Conference on Science, Technology and Society (AICSTS) 2015
November 7-8, 2015, Bireuen, Indonesia
402
References
Anwar, D. F. (2008). Chapter 8: Indonesia and the Bandung Conference - then and now. In S. S. Tan, &
A. Acharya, Bandung Revisited, The Legacy of the 1955 Asian-African Conference for
International Order (p. 190). NUS Press.
Berger, M. (2008, January 28). Suharto Dies at 86; Indonesian Dictator Brought Order and Bloodshed.
Retrieved April 29, 2012, from
http://www.nytimes.com/2008/01/28/world/asia/28suharto.html?_r=2&pagewanted=all
Charlton, S. E. (2010). Comparing Asian Politics: India, China and Japan (Vol. Third). USA: Westview
Press.
Drexler, E. F. (2008). Aceh, Indonesia. University of Pennsylvania Press.
Eldridge, P. (2002). Human Rights in Post-Suharto Indonesia. The Brown Journal of World Affairs, Vol 9,
No.1, 127-139 from: http://www.watsoninstitute.org/bjwa/archive/9.1/Indonesia/Eldridge.pdf
Encyclopedia Britannica. (2012). Human Rights. Retrieved March 2012, from Britannica Academic
Edition: http://www.britannica.com/EBchecked/topic/275840/human-rights
Hariadi, M. (2011). Religious tolerance bill creates news problems in Indonesia. Retrieved March 2012,
from Asianews: http://www.asianews.it/news-en/Religious-tolerance-bill-creates-news-problems-
in-Indonesia-23035.html
Hariyadi, M. (2011, October 28). Religious tolerance bill creates news problems in Indonesia. Retrieved
March 2012, from AsiaNews: http://www.asianews.it/news-en/Religious-tolerance-bill-creates-
news-problems-in-Indonesia-23035.html
Hathaway, O. A. (2007). Why Do Countries Commit to Human Rights Treaties? The Journal of Conflict
Resolution, Vol 51, No. 4 , 593-594.
Human Rights Center. (2005). After the Tsunami: Human Rights of Vulnerable Populations. California:
Human Rights Center, University of California, Berkeley.
Human Rights Watch. (2004, September 27). Aceh at War: Torture, Ill-Treatment, and Unfair Trials.
Retrieved March 2012, from Human Rights Watch: http://www.hrw.org/node/11979/section/5
Human Rights Watch. (2010, December 1). Policing Morality. Retrieved March 2012, from Human Rights
Watch: http://www.hrw.org/node/94454/section/6
Human Rights Watch. (2012). World Report 2012: Indonesia, Events of 2011. Retrieved March 2012,
from Human Rights Watch: http://www.hrw.org/world-report-2012/world-report-2012-indonesia
Human Rights Watch, Asian Human Rights Commission 2006, Indonesia 2009. (n.d.). Who Signed What.
Retrieved March 16, 2012, from Islam, Human Rights and Displacement:
http://www.fmreview.org/FMRpdfs/Human-Rights/6.pdf

Proceedings of The 1th Almuslim International Conference on Science, Technology and Society (AICSTS) 2015
November 7-8, 2015, Bireuen, Indonesia
403
Indonesia: President's New Term Should Focus on Human Rights. (2009, August 6). Retrieved March
2012, from Refworld:
http://www.unhcr.org/refworld/topic,4565c225b,4565c25f13d,4a8126e91e,0,,,IDN.html
Kimura, E. (2011). Indonesia in 2010. Asian Survey, Vol. 51, No.1 , 186, 189-190.
Luebke, C. v. (2009, Fall). Post-Suharto Indonesia: Democratic consolidatioin and Continuing Challenges.
Retrieved April 2012, from SPICE Stanford: iis-db.stanford.edu/docs/381/Post-Suharto.pdf
Maag, I. (2005). Strengthening Human Rights in Indonesia. Geneva: Friedrich Ebert Stiftung.
Nelson, S., Guthrie, J., & Coffey, P. S. (2004). Literature Review and Analysis Related to Human
Trafficking in Post-Conflict Situations.
Ramage, D. E. (1995). Interpretation of New Order's Pancasila. In D. E. Ramage, Politics in Indonesia;
Democracy, Islam, and the Ideology of Tolerance (p. 12).
The Telegraph. (2011, July). Indonesia's human rights violations deeply entrenched. Retrieved March
2012, from The Telegraph:
http://www.telegraph.co.uk/news/worldnews/asia/indonesia/8630800/Indonesias-human-rights-
violations-deeply-entrenched.html
UNDP. (2006, March). Indicators for Human Rights Based Approaches to Development in UNDP
Programmin: A User's Guide. Retrieved April 27, 2012, from United Nations Development
Program: http://web.undp.org/oslocentre/docs06/HRBA%20indicators%20guide.pdf
United for Human Rights. (n.d.). Universal Declaration of Human Rights, Official document. Retrieved
March 2012, from United for Human Rights: http://www.humanrights.com/what-are-human-
rights/universal-declaration-of-human-rights/articles-21-30.html
Vaswani, K. (2011, December 14). Indonesia's Aceh punks shaved for 're-education'. Retrieved March
2012, from BBC News Asia: http://www.bbc.co.uk/news/world-asia-16176410
Who Signed What. (n.d.). Retrieved March 16, 2012, from Islam, Human Rights and Displacement:
http://www.fmreview.org/FMRpdfs/Human-Rights/6.pdf
Youth for Human Rights. (n.d.). What are human rights? Human Rights Defined. Retrieved March 2012,
from Youth for Human Rights: http://www.youthforhumanrights.org/what-are-human-rights.html
Freedom House. (2012). Freedom in the World 2012. Retrieved April 2012, from Freedom House:
http://www.freedomhouse.org/country/indonesia
Proceedings of The 1th Almuslim International Conference on Science, Technology and Society (AICSTS) 2015
November 7-8, 2015, Bireuen, Indonesia
404
How to Find Work Crazy
Syamsuddin Lubis
AMIK INTeL Com GLOBAL INDO
Abstract
Human capital is a powerful predictor of a person’s propensity to establish a new
venture. Consequently, current understanding of the impact of human capital on
entrepreneurial potential is limited. In this study we take advantage of a more fine-
grained description of the entrepreneur’s human capital characteristics than cross-
sectional surveys generally used in entrepreneurship studies. This longitudinal study
provides prospective data taken at the age of 7, 11, 16, 23 and 33 for over 900
entrepreneurs age 33 years in 1991. NCDS provides biographical information that
encompass theoretically important human capital measures both at the individual
and family levels. The estimation follows logit modelling to predict
entrepreneurship from childhood, adolescent and early adulthood human capital
predictors. Human capital predictors of entrepreneurship extend to early childhood,
years before they enter the work-force. After controlling for some personal and
selective effects, cognitive ability, parental support and supportive family structure in
childhood, opportunities for spare time work and family business exposure during
adolescence and low credentials, taking on an apprentice and business experience
from first job in young adulthood increases the likelihood of being an entrepreneur
as an adult. Although weak, socio economic status in childhood (rather than
adulthood) is a moderator to the human capital entrepreneurship relationship. This
research highlights the importance of studying human capital as a resource that begins
in childhood. From a policy perspective, this paper emphasises the idea that children’s
education will have far- reaching effects which become manifest in career paths related
to entrepreneurship.
Key Words: Entrepreneurship, human capital, childhood, longitudinal data
Introduction
At a country that is growing, the role of the entrepreneur can’t be ignored, especially in carrying out
development. They can create and innovate optimally to realize new ideas into practical actions in every
business so that the nation will grow faster. Indonesia as a big country that has a population of about 230
million is still very minimal to have entrepreneurs. Based on the data, only about 0.18% of Indonesian
populations whose are entrepreneurs. Though the consensus, a country in order to get ahead,
entrepreneurs must have a minimum of at least 2% of the total population (Hendro, 2011). Opportunities
Proceedings of The 1th Almuslim International Conference on Science, Technology and Society (AICSTS) 2015
November 7-8, 2015, Bireuen, Indonesia
405
for growth entrepreneurs in this country is actually quite large, but strangely unemployment over time
actually increased. One major contributor to unemployment and continued to increase from time to time
are those with the status of scholars. Entrepreneurial world of choice to 2 after an employee, be it
employees, civil servants or private.
Who Said Easy To Find Work?
LIPI noted, the level of citizens who belong to the category of underemployment continue to increase in
the last five years. Of the 29.64 million people in 2005 to 32.8 million in 2010. It is estimated that in 2011,
the number of categories of underemployment is projected to increase to 34.32 million people. Looking at
the phenomenon described above, entrepreneurial education can be done early in children is the
introduction stage, not as perpetrators. Entrepreneurship education for children is a mental formation of
entrepreneur. Because in entrepreneurship education do not just teach children about how to do
business.
Moreover, children are trained to have the mental and the characters themselves are solid. Children are
taught to identify themselves, to control emotions and stress, manage time, communicative and flexible
with a variety of situations, as well as being able to choose and make decisions. Build entrepreneurship in
early childhood is more to how to establish the nature and character of independent, responsible through
entrepreneurship education theoretically and practically, as well as concrete examples, because the
mental formation requires time and a long
Child character is built through what is heard, what is seen and what is felt. Hearing and vision is the
entrance lessons before entering forge conscience. Through all the senses that humans have here, will
appear strongly learning associated with anything that is received by the senses. When children are
familiar with the world of entrepreneurship from childhood, then this character will appear later when adult
children. Learning entrepreneurship (entrepreneurship) is more directed at mental changes. Being an
entrepreneur takes a reliable covering of superior character; introduction of yourself, creative, able to
think critically, is able to solve problems, communicate, able to carry themselves in various environments,
appreciate the time, was able to share with others, are able to cope with stress, can control your emotions
and be able to make a decision.
In facing the MEA program (Asean Economic Community) the person to achieve a successful future in a
career to be able to make the strategy, that is: 1) Opportunities, 2) Competition, 3) Challenges
meanwhile, a person must have 7 B mentioned keys to success: 1) Dreaming / Vision, 2) Learning/
Knowledge, 3) Work Hard, 4) Communicate, 5) Innovating, 6) Belief self, 7) Pray.
Becoming an Entrepreneur
Could it be that some people are born with the talent of a businessman. Is it talent or training
entrepreneurs? To be an entrepreneur you have to understand and learn about the skills required of a
successful entrepreneur. Ever hear the term Bottle (Brave Optimistic Other People Power) or windfall
(Brave Optimistic Other People's Money)? Is said to be a successful entrepreneur you are only applying

Proceedings of The 1th Almuslim International Conference on Science, Technology and Society (AICSTS) 2015
November 7-8, 2015, Bireuen, Indonesia
406
the strategy at the same motto Bottle and this windfall. To be a successful entrepreneur you just need to
be brave and optimistic capital or fancy term "knee capital" But the practice did not seem so easy. Bold
and optimistic can become Dodo (Dungu Optimistic crushed others). Bold and optimistic just is not
enough! Money and power who wants to be used by prospective employers who do not have the finesse
and his brain were placed in knee? Unless capital courage and optimism is certainly an entrepreneur
needs to be armed with skill.
Skills to Become Entrepreneurs.
Is it talent or training entrepreneurs, it is not so important. If a talented but never learn and try to do it,
then he would not be proficient. Take a look machete from young coconut seller, machete was made of
iron cheap but because it often sharpened and used every day, it was so sharp machete. Maybe some
people are born with the talent of a businessman! But more and more people are successful as an
entrepreneur because they understand and learn about the skills required of a successful entrepreneur.
To succeed as an entrepreneur, you need to have the ability to think, the ability to interact,
communication skills, technical skills as basic capital.
This basic capabilities consist of:
1) Responsible: the ability to ensure the work is done properly and thoroughly.
2) Resilient and consistent: a desire to see the work completed.
3) Health: has a strong stamina both physically and mentally.
4) Initiative: ability to take over when needed and start acting.
5) Determination: have a limitless need to succeed
6) Original and creative: the ability to create new ideas and new ways to generate something new.
The ability to think consists of:
1) Critical: the ability to conduct a proper comparison and give appropriate advice.
2) Troubleshooter: the ability to analyze in theory, the particle and abstracts.
3) Be careful: the ability to evaluate before taking the risk. Ability to interact consists of:
a. Social: the ability to maintain good relations with others.
b. Cooperative: the ability to understand the needs and desires of the other JV and work
together in a positive way.
c. Politic: the ability to dampen discomfort.
d. Have fun: the ability to keep smiling and laughing in critical.
e. Consideration: the ability to appreciate others.
f. Objective: ability to act with logic and wise without involving ego.
g. Emotions: the ability to act mature and face problems.
Trust and togetherness
Organizational culture must include a 'growth' mutual trust between individuals in it. In the organization
based on a relationship, people are not regulated, but they are treated as individuals worthy of trust who
Proceedings of The 1th Almuslim International Conference on Science, Technology and Society (AICSTS) 2015
November 7-8, 2015, Bireuen, Indonesia
407
wish to devote their time and energy on what "they want to do" and "what they should do", because they
understand there is no separation between the two. Clearly, there must be spirit of joint ownership in an
organization, which makes individuals in committed optimize the work. Such commitments are good
conditions to start investing in the business, as well appreciate an entrepreneurial spirit that emerged in
the midst of society
Learning entrepreneurial leadership
There are haunted by a sense of weight, that diversity is very difficult to operate in implementing the
strategy agreed in principal. In our opinion, what is needed is the ability to agree to utilize all the power,
complement each other in an endeavor unity of purpose. With this kind of leadership success is clear
focus. Without it, the diversity has become a "ghost" obstacle to achieve the goal. Says he concluded, no
other: The diversity of the reach agreement round, complementing the power of leaders to achieve the
goal that unites.
Mutual chock Entrepreneurial Initiative Most well established organization operating under a centralized
leadership. Decentralized business spawned separate units, built under the direction chosen support and
willing to it these initiatives. This support, of course, must come from the highest level with full decision-
making capabilities. Advisory assistance activities, support and empowerment is important in supporting
entrepreneurs in the new business unit. The support, providing sources and channels for the
development of entrepreneurship and learning, as well as consistently applied
Respect Entrepreneurial Behavior our society often booed when there who work as entrepreneurs,
especially when he was well educated, especially S3 S2. This is not too surprising because of the stigma
think our society has become a pattern: "After graduating from school and work!" Very rarely are thinking,
after graduating creates jobs. Humans in this category often say crazy, not insane, stupid and a host of
other criticism. Only after successful, everyone will be approached. Is not all the efforts made
entrepreneurs succeed at first thought insane until he succeeded? Therefore take every opportunity to
show to colleagues, associates and your team that you trust them and have confidence in their abilities.
Remain in the company and remain in control if you like, but conducts as a leader who helped in
partnerships. Respect your colleagues and the company's own shares.
What Needed To Facing Failure
Prospective entrepreneurs should be prepared to fail, be understood meaning of failure. Without
understand it, do not think will take the road to become entrepreneurs. The reason is, there are
successful in their efforts, it has not been successful. Employers know that "failure" is not the end of the
game and should not be afraid to experience it. He realized with courage that could cope with something
that is unlikely to succeed. At risk, is a combination of hard work, ingenuity, prudence, accuracy reading
opportunities and readiness to face failure and success.
Happy ending an endeavor is successful. This is achieved, of course after passing a small success, like
the success of getting rid of difficulties and dangers. This process is built on the seriousness of childbirth

Proceedings of The 1th Almuslim International Conference on Science, Technology and Society (AICSTS) 2015
November 7-8, 2015, Bireuen, Indonesia
408
all potential entrepreneurs. By doing so, he changed the "defeat into victory", a process that is little
chance of achieving it without mental readiness to face failure. If you include that are not ready to fail, it is
better not to pursue this path. In fact, the dream of courses, do not! Every failure is a lesson that
encourages employers to try a new approach that has not been tried before it. To true entrepreneur,
"Dare to Fails" means "Courageous Learning".
By failing and to learn, entrepreneurs grow into a better person and learn how to create true wealth.
Although the entrepreneur loses material wealth they have acquired, they know how to create all the
wealth it again. The lesson is never lost. Conversely, those who have never experienced a difficult
journey and discover the wealth with easy, will not know how to create wealth when they lose. In other
words, those who do not fail will not know the true riches. Sparkling materials, community-paced social
life even objects (materialistic), more gain high ratings. Instead, whoever fails, it can stamp for humans
who have lost social price.
The looser in the business, often figures that is facing a turning point toward social attitudes. In the past,
when he was victorious, he had many friends and colleagues who had supported it, a faint smile
courteously, even invite partner, is lost! Due to the current perspective, many entrepreneurs are traumatic
to failure. This "Early death" seeds of entrepreneurship. All parties must change his attitude: push society
into those who helped build the courage people to respect the efforts of people to achieve success in
business. Fail or success, not be the only reason to appreciate or belittle entrepreneurs. Of course, while
still transfer wise attitudes, that in every failure there is always a valuable lesson. A wise man said,
success is just the last foothold on the ladder of failure". We need to encourage people to take risks. It
requires a very different mindset. For us, it means ignoring the regulations that have been enacted well
for 30 years (Lee kuan yew, former Prime Minister of Singapore)
Required To Facing Failure
There is a lot of discussion about the tips facing success. But for us, just as important, to prepare a
number of things to deal with failure! Billy P.S. Lim, world-class motivator based in Malaysia, once asked
his training participants on an interesting problem. "Why would people drowned when falling into the
water"?. Various answers were given, but most often is, "He can’t swim". Present surprised, because Lim
blame that answer. Present thought, Lim joked. To convince them, Lim gave examples of incidents of
people drowning in water as deep as three inches. Finally, he told the answer he would give to you now.
We quote the opinion Lim. "People sink since he settled there and do not move him somewhere else."
So? How many times people fall does not matter. The important thing is the ability to bounce back every
time falls.
Size, Rise Again
Do not measure someone by counting the number of times he fell, measure it by the number of times he
was able to bounce back. Someone who is able to bounce back after a fall, it will not despair. Sadly,
many people like to hear them, after once or twice fail, fell, and not rise again. What qualities will help us
Proceedings of The 1th Almuslim International Conference on Science, Technology and Society (AICSTS) 2015
November 7-8, 2015, Bireuen, Indonesia
409
bounce back after a fall? Quality of your self is something that should be mentioned, because otherwise,
the meaning of this book is not perfect. "Nothing in this world that can replace it. Not a talent, even
though; a lot of talented people who are not successful. Not a genius, even though; Unsuccessful genius
has almost become a mockery. Education not; This world is full of educated people. Only the will and
fortitude are the most powerful. "Yes, grit: the ability to bounce back for the umpteenth time after a crash.
In the clash between the stream and the rock, river water always wins not by force but with fortitude. How
far you fall is not a problem, but the important thing some often you bounce back. If you can keep trying
after three failures, you can consider yourself to be a leader in your current job. If you keep trying after a
dozen failures, this means a seed of genius is growing inside you. Such as Thomas Edison, when asked
how he could survive after thousands of unsuccessful attempts? The inventor of the light bulb and the
founder of a world-class company, General Electric is answered. "I did not fail, but found 9994 ways that
one and only one way that I work will succeed because it has run out of a failed experiment." The
Colorado River flow doggedly persistent, childbirth Green Canyon.
When Fall, Rise Quickly
In the world of work, which is called the real problem is an opportunity waiting, levied. (Henry J. Caesar)
"For me personally, the Asian crisis has ended at the commencement of competition to get Hotel Regent
Bangkok in March 1999 after going through hard times during the two previous years, suddenly I decided
to follow the race Ferrari in France and compete in the ring with Goldman Sachs Co., one of the world's
largest investment bank. "William E. Heinecke, Thailand conglomerate While many conglomerates went
bankrupt and banks have failed in Thailand, seven hotels owned Heinecke, fast-food restaurants and
other companies continue to strive out of the crisis as well as trying to gain profit in 1998, although many
analysts has to predict about economic growth in 1999 and tested Bath Thailand, not many companies
that can match workability
Heinceke business group. Fantastic hotel Hainecke increased 24%, 246 restaurant business groups
attracted over no less than five million customers! In 1997 a group of companies Heinecke lose 1 billion
Bath Thailand, but a year later three companies that have gone public, earning a net profit of 500 million
baht, in the first quarter of 1999, profits more. Not sure yet, failure, just a sharp turn demanded "vehicle"
effort, a little bit slowed, then in the future, so look "smooth road of opportunity", you can redeem it at a
higher speed. Heinecke business in Thailand, this time really has recovered. Regent Bangkok, one of
Asia's largest hotels, the occupancy rate remained high at the time, Regent under the control of several
companies that are experiencing financial difficulties and managerial as well as other companies in
Thailand so they are trying to sell shares Regent. Regent Rajadamri Hotel Company is owned by the then
32% owned by a Japanese company that has gone bankrupt which is represented by a Japanese bank
that is big enough. There's more other factors are more important. Rajadamri Hotel Company also has a
26% stake owned Heinecke five-star hotels, in northern Thailand, Chiang Mai Regent.
Hainecke reluctant to sell to a stranger because he did not want any foreigners to master the sacred land.
For Heinecke, took part in the ownership of shares of Regent Bangkok were sold at the beginning of

Proceedings of The 1th Almuslim International Conference on Science, Technology and Society (AICSTS) 2015
November 7-8, 2015, Bireuen, Indonesia
410
Heinecke, took part in the shareholding Regent Bangkok were sold in early 1999 is the appropriate
action, after previously he already has a nearly 29% stake Regent. What Heinecke said crossing his
business full of twists in this crisis period? "It is compete where I have to pull out all the strategies and
skills that I have learned: to trust intuition, using a network of contract established, using a number of
experts and planning strategies to changing circumstances quickly, if observed, this competition is a
microcosm of all strategies , I tried to test my skills with opponents who really tough. Goldman Sachs, one
of the strongest investment groups in the world, is the largest individual shareholder of Regent Bangkok,
but that does not mean that they could do as he pleased. I think for someone who did not graduate
college, this result is quite satisfactory.
References
Abla Bassat Gomma, 2012, Membentuk Kepribadian Anak Sejak Dini, Samudera, Solo
Anonim, 2006. Pedoman Administrasi Perlengkapan/Barang Taman Kanak-kanak. Jakarta.
Anwar, A. dan Arsyad, 2007. Pendidikan Anak Dini Usia. Bandung: Alfabeta.
Anwar, H. Arsyad Ahmad, Pendidikan Anak Usia Dini, Alfabeta CV, Bandung
Berkowitz, M. & Bier, M. (2004). What works in character education: A research driven guide for teachers.
Washington DC: Character Education Partnership
Boyatzis, R.E; Cowen, S.S; Kolb, D.A; and Associates; 1995, Innovation in
Professional Education: Step on a Journey from Teaching to Learning; San Fransisco : Jossey-
Bass Publishers Erickson, E.H. (1968). Identity: Youth and Crisis. New York: Norton.
Buchari Alma. 2003. Kewirausahaan. Bandung: Alfabeta.
Cheppy Haricahyono. 1995. Dimensi-dimensi pendidikan moral. Semarang: IKIP Press.
Conny R. Semiawan, 2002, Belajar dan Pembelajaran Dalam Taraf Usia Dini, PT Prenhallindo, Jakarta
Conny R. Semiawan, Djeniah Alim, 2004, Petunjuk Layanan dan Pembinaan Kecerdasan Anak, PT
Remaja Rosdakarya, Bandung
Daft, Richard L. (2000). Management. 5th Ed. Dryden: The Dryden Press, Harcourt College Publishers.
Dariyo, Agus. 2004. Macam-Macam Pola Asuh Orang Tua. http://www.google.com (tanggalakses: 24
Juni 2010).
Darmiyati Zuchdi. 2003. Humanisasi pendidikan (kumpulan makalah dan artikel tentang pendidikan
nilai). Yogyakarta: Program Pascasarjana UNY.
Depdiknas, 2007. Menuju Pendidikan yang Bermutu dan Merata. Jakarta: Balai Pustaka.
Depdiknas. 2003. Standar kompetensi pendidikan anak usia dini taman kanak- kanak dan raudhatul
Proceedings of The 1th Almuslim International Conference on Science, Technology and Society (AICSTS) 2015
November 7-8, 2015, Bireuen, Indonesia
411
athfal. Jakarta: Depdiknas.
Dessler Garry. 2000. Human Resource Management, 8th ed., Prentice Hall. Inc. Upper Saddle River New
Jersey.
Drucker Peter, 1995, The Information Executives Trully Need, Harvard Business Review
Drucker, PF. 1991. Inovasi dan Kewiraswastaan, Praktek dan Dasar-desa, Erlangga, Jakarta.
Emzir, 2008. Metodologi Penelitian Pendidikan; Kuantitatis dan Kualitatif. Jakarta: Rajagafindo
Persada.
Engkoswara, 2007. Dasar-dasar Administrasi Pendidikan. Jakarta: Depdikbud.
Fattah, N., 2006. Landasan Manajemen Pendidikan. Bandung: Rosdakarya.
Gibb, A.A. 1997. Small firms’ training and competitiveness. Building on the small business. International
Small Business Journal. Vol. 15 (3): 13-29.
H. Isjoni, 2011, Model Pembelajaran Anak Usia Dini, Alfabeta, Bandung
H.E. Mulyasa, 2012, Manajemen PAUD, PT Remaja Rosdakarya, Bandung
Hamka Abdul Aziz, 2012, Pendidikan Karakter Berpusat pada Hati, Al-Mawardi Prima, Jakarta Selatan
Harun, C., 2004. Fungsi-fungsi Manajemen. Banda Aceh: Diktat Mata Kuliah Manajemen
Pendidikan.

Proceedings of The 1th Almuslim International Conference on Science, Technology and Society (AICSTS) 2015
November 7-8, 2015, Bireuen, Indonesia
412
Gold Mines in Four Districts as Economic Sector, and Become
Dilemma for Community in Aceh
*Khairul Hasni
Directore of Jari Aceh and Lecturer at Departement of Science Education of Geography, Faculty of
Teacher Training and Education, Almuslim University, Bireuen
*Corresponding Authorr: [email protected]
Abstract
Developing countries have a majority of the environmental problems. Indonesia has
become country a daunting lesson, some of the problem in North Aceh, Aceh Jaya and
South Aceh, Aceh Pidie related of pollution. Every human being has the right a healthy
has benefits over regarding the future of the universal right and the Minamata
Conventional on Mercury. Environment has an important role that is closely related to
human, when contamination has the problem in the community, the government should
be give the response and special attention to resolve the cases. The resource of Aceh
has led people to take the wealth illegally, one of several resources that through gold
mining undertaken by the community then mercury become the International business,
one of the economic improvement to community. However, now a wretched cases of
mercury found in the district in North Aceh, South Aceh, Aceh Jaya and Aceh Pidie was
the focus of this research. Mercury of gold mining has been the impact of the river and
in the sea, peoples throw directly into the small ditch that flows into rivers and the sea.
Gold Mining without permits have become activities of community since 2008 in several
district and gold mining situation increasingly widespread due to the omission of
goverment lack of control the illegal industry. In this study will answer, how the dilemma
of society on the environment from gold mining? And what efforts were made by the
government in tackling the problem of pollution? Gold Mining has been running after the
conflict, and opened a new land and be a benefit to society. However, it can also harm
society in terms of environmental pollution in area has contaminated by mercury.
Key words: Enviroment, Mercury, Economic and Society
Introduction
Prolonged conflicts and the earthquake and tsunami in Aceh on 26 December 2004 has led Aceh
dropping/suffering conditions. Due to the conflict was put Aceh on the economic situation problem in
Proceedings of The 1th Almuslim International Conference on Science, Technology and Society (AICSTS) 2015
November 7-8, 2015, Bireuen, Indonesia
413
Aceh, and being the province in Indonesia that is constantly experiencing low growth rate. The
occurrence of natural disasters have caused loss of life, in addition to damage the physical infrastructure,
economic and social at high scale in several Coastal areas of South Aceh District, Aceh Jaya and Aceh
Pidie.
Social welfare problems is a very complex problem, which is caused by various factors. The problem of
poverty today is not only a problem facing the Government of Aceh, but has become a problem Nation
Indonesia and other countries. Problem of poverty facing the people of Aceh, in addition to negative
effects caused by the construction and prolonged social conflict, also caused by factors frequent natural
disasters in the province of Aceh.
Aceh has 119 islands, 35 of the mountain, 73 major rivers and 2 lakes. The second largest land use small
and large estates reached 691 102 hectares or 12.06 percent of the total area of Aceh. Agricultural land
area of 311 872 hectares of rice fields or 5.43 percent and dry land farming season reach 137 672 ha, or
2.4 percent, and the remaining land mines, industry, settlements, inland waters, land clearing and other
natural reserves under 5.99 percent. Besides, the management of natural resources is an integral part of
the culture of Aceh. This is illustrated by the several cultural institutions are rooted in the economic life of
the people of Aceh "Panglima Uteun or Commander of Forest” ulating forest resources, Keujruen Blang
governing irrigation and agriculture as well as other local wisdom. These of indigenous cultures is also
regulated in the Law of the Republic of Indonesia Number 11 Year 2006 concerning of Aceh Government.
Behind poor of skill and delivering quality communities of poverty. Aceh has natural resources is
enormous gold contained in the South Aceh and Aceh Jaya, and Aceh Pidie a traditional mining
processing done by the community (traditional gold miners) with no license has become a new problem of
environmental damage society in the use of mercury in the West - South Aceh. The results of gold mining
will generate waste containing mercury. The end result was dumped directly into river, and fish or
shellfish to be contaminated by mercury and subsequently consumed by humans. Have a negative
impact on human health over the next 10 or 20 years in the future.
Research Methods
This research was conducted from June - November 2015 to analyze the extent to which the impact of
mining on the lives of people around the scene of the waste disposal in South Aceh, Aceh Pidie, Aceh
Jaya around the community that flows into rivers and out to the sea. Approach through interviews, case
studies, events resulting pollution damage to the environment and public health. This approach was
chosen for the flow and understanding in analyzing waste pollution mecury evolving and can be harmful
in the community in Aceh.
Gold Mining And The Use of Mercury
The high on mining issues which cause damage to the environment due to the discharge of mercury into
the river in three districts of Pidie, Aceh Jaya, and Aceh Selatan. Mining in the three districts are the
Proceedings of The 1th Almuslim International Conference on Science, Technology and Society (AICSTS) 2015
November 7-8, 2015, Bireuen, Indonesia
414
economic income of the community has become a place of economic dependence which is very difficult
for them to leave, because revenue in gold mining has a high purchasing power who can benefit
Illegal gold mining activities that have been operating in Aceh since 2000, and has serious impacts. Small
scale gold mining in 9 districts in Aceh, which produces 10 tons of gold per year. Illegal gold mining
community managed in Aceh scattered in Aceh Jaya (Gunong Ujeun, District of Krueng Sabee, Krueng
Sabee, inland Teunom, Sarah Kingdom, Mount Uteun Ujeun); South Aceh District (Panton Luas Sawang
subdistrict, Pasie King, Labuhan Haji and Manggamat); Aceh Besar (Krueng Gentot and Breuh Island);
Central Aceh district (Payakolak, District Ketol and Linge); Pidie district (Krueng Tangse, Krueng Sikolen,
Krueng Geumpang, Mount Miwah, Gampong Bangkeh); Subulussalam; Nagan Raya (Pisang Mas in
Beutong, Krueng Tripa and Krueng Seunagan); Southwest Aceh district (village and sub-district
Sukadamai Valley Sabil); Gayo Lues district (Tenkereng and District Pantan weather); as well as the
West Aceh district (Tutut, Sungai Mas and Krueng Meureubo).
Illegal trade in mercury-free is done in mining areas. Mercury received distribution from Singapore,
China, and Malaysia. Of note Zionet.org site database that monitors global mercury trade, in 2010 the
notification of Singapore's imports about 280 tons of mercury have been sent to Indonesia, but Indonesia
was recorded in just two tonnes. In 2013 mercury into Indonesia of more than 400 tonnes, while that
recorded in the Ministry of Trade is only 540 kilograms. An indication of the illicit business is done by
people who want to get big gains in Indonesia, this business without a letter of certification and strict
supervision of the government. Society took the wealth of resources to meet the needs of the economy,
and this should be a government responsibility in addressing this serious problem. Based on the Ministry
of Industry and Trade No. 30 / MPP / Kep / 7/1997 on the marketing of goods subject to import,
distribution, sale and purchase of mercury must be registered and through regional head license with the
requirements of strict environmental feasibility. The local government has a responsibility to curb the
circulation of mercury were highest rampant illegal production occurred in three districts. This case
continue neglected the mercury waste pollution in the districts uncontrolled and numbers of environmental
pollution will increase.
Small-scale mining and the use of mercury to separate the gold seeds with soil, the use of mercury-free
and without the supervision of the authorities, can cause pollution of river water and groundwater. And the
location of logs (gold rock processing centers) adjacent to residential areas in three districts in Aceh. In
the process of separating most of the use of mercury and cyanide. When viewed in terms of environment,
mining activities in protected forest has caused the destruction of forests in Aceh. Besides the most
frightening today is no indication of the public health problems as a result of toxic mercury and cyanide
continues to increase the level of mercury levels in the watershed areas. Conditions that occur at this
time, at the peak of the gold processing work in the engine logs of the few places close to the river and
residential areas are found high mercury levels in the river water. If this condition is allowed to proceed
worry watershed area (DAS) DAS Krueng Sabee and others connected with other parts of the landscape
can be contaminated with other regions.
Proceedings of The 1th Almuslim International Conference on Science, Technology and Society (AICSTS) 2015
November 7-8, 2015, Bireuen, Indonesia
415
Based on data and records GeRAK (Movement Against Corruption, Aceh), there are 134 mining permits
that have been issued by the local government in Aceh. Such permission is not all conduct production
operations in the field. Most permits are issued only to conduct research or exploration. However, the
holder of an exploration permit even have mining or exploitation.
Of mining production for six years in four districts around 22 people died from workplace accidents such
as buried by landslides or suffocated in the pits. However, this does not include experiencing the direct
impact of the disposal processing mining into the river. Currently estimated number of workers in the
mining sector 3,529 people in 10 counties and cities. All scattered in Aceh Besar, Pidie, Aceh Tengah,
Gayo Lues, Aceh Jaya, West Aceh, Nagan Raya, Southwest Aceh, South Aceh and Regency
Subulussalam. It is estimated that there are tens of thousands of people who will be exposed to mercury
directly and indirectly in Aceh in four districts in Aceh, Aceh Jaya, West Aceh, South Aceh and Pidie,
there are 1,500 people every day in direct contact with dangerous heavy metals.
Small-scale mining and the use of mercury to separate the gold seeds with soil, the use of mercury-free
and without the supervision of the authorities, can cause pollution of river water and groundwater. And the
location of gold processing centers adjacent to residential areas in four districts in Aceh. In the process of
separating most of the use of mercury and cyanide. When viewed in terms of environment, mining
activities in protected forest has caused the destruction of forests in Aceh. Besides the most frightening
today is not have indication of the public health problems as a result of toxic mercury and cyanide
continues to increase the level of mercury levels in the watershed areas. Conditions that occur at this
time, at the peak of the gold processing work in the engine logs of the few places close to the river and
residential areas are found high mercury levels in the river water. If this condition is allowed to proceed
worry watershed area (DAS) Krueng Sabee.
The case of Study
Gold mining community in Geumpang, Pidie, occurred on July 26, 2014 keureuling fish deaths in Krueng
Meuriam local districts and in teunom, due to the chemical liquid mercury.
Faculty of Veterinary Pathology Laboratory test results Unsyiah dated August 8, 2014 in a document
signed by the Head of the Laboratory of Pathology, Faculty of Veterinary Medicine Unsyiah. Was found to
damage the liver, kidneys, and intestines at thousands of dead fish were found floating in Krueng (River)
Geumpang and Tangse, Pidie, it was all positive because of poisoning by mercury (Hg). Heavy metals
are classified as hazardous and toxic materials (B3) is not only contaminate the water, but also mud and
moss found in rivers connected with Krueng Teunom in Aceh Jaya. One of the characteristics, the organ
was found dissociation fish liver hepatocytes, infiltrasileukosit (lymphocytes) which are numerous, and
severe necrotic hepatocytes.
On August 16, 2014, the officials issued instructions Aceh together to cover all mining activity was
illegal. And on August 25, the governor of Aceh Tgk Zaini asked the police chief to deploy its personnel
in order to curb all mining activity. However. This traditional mining termination action angered residents
Proceedings of The 1th Almuslim International Conference on Science, Technology and Society (AICSTS) 2015
November 7-8, 2015, Bireuen, Indonesia
416
Geumpang. They demanded the governor and the officials of Aceh to revoke the appeal of traditional
mine closures in Aceh. Most of the approximately 5,000 inhabitants-Guempang Mane community and
surrounding areas, including those who used to be the victims of conflict, livelihood from the mine, and
generally the former of the Free Aceh Movement. They tried to change the lives of the economic
downturn due to the conflict in Aceh for three decades.
Mining in Aceh Jaya, has been through the inspection process by the security forces (police) against
mining case illegal done by the community. But in reality see immediately and go directly to the location,
there are people doing the production mining activities. Making the stone had been closed by the
government not have monitoring and firmness of local government, then the area was still activity.
The river was for many years used by the community as a source of clean water, and sources of income
of gleaming fish catches. an gleaming only live in freshwater rivers are swift in Indonesian called “jurung
fish”. Cases of poisoning after eating fish gleaming citizens catches in Krueng Teunom it has now
impacted communities cessation of activity on the river.
The Future of Community for the Environment Gold Mine
Mercury contamination events are not only carried out by large companies in Aceh and gold mine owned
by individuals are also involved in mercury pollution. In 2008 in five districts in the mountain discovered
gold. Traditional processing businesses do not have permission to produce gold. Equipment used
inadequate, so ignore the safety of the environment. Ironically, Germany, Spayol, and the United States
are some of the country known as the producer of mercury. However, mercury black market has
expanded to the province as the number of illegal gold mining. The fact is the case today, Sawang
subdistrict, South Aceh district, mountainous village of Panton Luas, individual businesses mine gold. In
several distircts Sawang and Simpang Tiga Manggamat, District Middle Kluet, South Aceh district,
entrepreneurs have used logs without permission of the assets for the benefit of individual economic
improvement. South Aceh and Bapeldalda (Government of Environment) Mr Ir. Jo.han added bobbin
settlement blender and it also continues to rise illegally without a license in Aceh.
Regarding od cases arising in the river Krueng Sabee watershed area (DAS) that have been
contaminated by waste which contains mercury. Head of Environment, Parks and Fire (KLH2PK) Aceh
Jaya, gave the revelation in the foyer daily, said the amount of grinding machines (spindle) gold in Aceh
Jaya district as many as 255 units grinding machine (spindle). However, as many as 211 units were still in
active use. Krueng Sabe surrounded by 14 villages were also using Krueng Sabe water washing and
bathing needs, and residents also eat fish from the river Krueng Sabe. State-owned citizen boreholes
have also been contaminated with 62% of the study in 2013 by the Department of Health (health) Aceh
Jaya.
The local government has issued a command Leader of Aceh Jaya on May 12, 2009, No. 540/408/2009
on Mining and Machine Control rocks Containing Gold Ore Processing. However, the ban has not been
effective, because there are many people to mine gold ore until 2014. And there are those who want to

Proceedings of The 1th Almuslim International Conference on Science, Technology and Society (AICSTS) 2015
November 7-8, 2015, Bireuen, Indonesia
417
develop this business to earn huge profits, so they bring mercury from Germany for sale in Aceh. Gold
mine in Gunong Ujuen reach 600 kilograms per day. That number by looking at the estimated needs of all
milling requires 0.7 kg. When the milling is done 8 times, so that the needs of mercury 6 kg multiplied by
the number of 100 times a milling will produce 600 kg of mercury per day. And estimates can generate as
much as 21.9 per ton of mercury.
WALHI Aceh has made an approach to the program on the dangers in the use of mercury, but people do
not care because the river has an active production sector for the community around the river. Some
residents also unhappy question mercury area in watersheds. Jari Aceh watchlist, the fall of the gold
content of the mountain Ujuen (Gunong Ujuen). And people who are less concerned with the health still
use the river for economic resources. Income and the desire of citizens getting smaller in processing the
gold. Currently, the number of workers in the mining sector 3,529 people in 10 counties and cities. Spread
in Aceh Besar, Pidie, Aceh Tengah, Gayo Lues, Aceh Jaya, West Aceh, Nagan Raya, Southwest Aceh,
South Aceh and Regency Subulussalam. Victims of mercury process has given birth to a new
catastrophe for humans in the coastal area of the watershed, one of the residents Keude Panga Panga
District of Aceh Jaya, daughter Aulia was 9 years old, according to estimates physicians have become
victims of mercury Gunong Ujuen. And according local health of the goverment Aceh Jaya, the death of a
baby from the District Panga, Tuenom, Krueng Sabee, Aceh Jaya have increased as much as 13 infants
in 2013.
Conclusion
Gold mining is growing after the tsunami in 2005 has grown in 2008 in the region of Aceh Pidie, Aceh
Jaya and South Aceh. People who do not have a mining license has been indicated to the pollution of the
river at several locations in the respective sites of gold mining. River who have experienced the death of
fish in rivers such as Aceh Pidie Tangse, Tunom river Calang in Aceh Jaya and South Aceh Krasian and
Gelumbuk river. However, the data in this study from the laboratory examination has been no accurate
indication of mercury. In the environmental conditions at the site that have been visited most logs gold
mining production has discarded the results of waste into the ditch which flows directly into the river who
presumably already contains mercury.
The resulting data Sawang subdistrict health center clinic, high disease experienced by the people who
visit mostly a disease of malaria. Within seven years there has been no indication that leads to the
disease due to mercury. Although the gold mining activities cause a lot of accidents because of landslides
and the number of workers in the mining sector 3,529 people in 10 counties and cities. Spread in Aceh
Besar, Pidie, Aceh Tengah, Gayo Lues, Aceh Jaya, West Aceh, Nagan Raya, Southwest Aceh, South
Aceh and Regency Subulussalam.
Aceh must learn from many national and international cases of Minamata local Governments should be
able to take a stand and monitor mercury pollution process very distrub environmental ecosystem
conditions and life-threatening danger for humans. See cases in North Aceh and West - South Aceh,

Proceedings of The 1th Almuslim International Conference on Science, Technology and Society (AICSTS) 2015
November 7-8, 2015, Bireuen, Indonesia
418
people still do not know about the dangers of mercury to the body so public use / eat marine and river
resources.
“The Minamata Conventional on Mercury ", the agreement was discussed about trade and industrial
processes, management of mercury in gold mining small scale, control emissions and releases of
mercury into the air, water and soil, management of waste containing mercury and storage of mercury
supplies, clean of pollution, and the planned implementation of the National and other activities
supporting the implementation of mercury.
References
BPS. 2011. Statistic Daerah Kabupaten Aceh Utara 2011. Banda Aceh : Bps
BPS dan Bappeda Kab.Aceh Utara. Indikator Ekonomi Kabupaten Aceh Utara Tahun 2011. Banda Aceh
Sebuah Pelajaran Dari Tragedi Minamata (水俣病, Minamata Byō), December 21, 2012,
http://theknightman.wordpress.com/2012/12/21/sebuah-pelajaran-dari-tragedi-minamata-
%E6%B0%B4%E4%BF%A3%E7%97%85-minama-byo/
Krueng Sabe Tercemar Mercury, Aceh Kita. http://www.acehkita.com/berita/krueng-sabe-tercemar-mercury/
Limbah Mercury Berselemak Di Jalan Negara Dan Permukaan Laut September 12, 2011,
Http://Beritasore.Com/2011/09/12/Limbah-Mercury-Berselemak-Di-Jalan-Negara-Dan-
Permukaan-Laut/
Penjerapan Merkuri Pada Limbah Cair Dengan Zeolit Alam Dan Arang Tempurung Kelapa Secara
Bergantian Dengan Cara Catu Supardi, Busron Masduki, Herry Poernomo Dan Paul
Pujiono,Puslitbang Teknologi Maju Batan, Yogyakarta
Perjanjian Baru tentang Mercury Ditandatangani Minggu ini, Dapatkan mencegah terulangnya Tragedi
Minamata di tempat lain?, Published October 9, 2013,
http://balifokus.asia/balifokus/blog/perjanjian-baru-tentang-merkuri-ditandatangani-minggu-ini-
dapatkah-mencegah-terulangnya-tragedi-minamata-di-tempat-lain.html
Pengguna Merkuri Masih Menjamur di Aceh Jaya Selasa, 20 Mei 2014 serambi Indonesia Penyelesaian
Kasus Buyat, http://setaaja.blogspot.com/2012/03/penyelesaian-kasus-buyat.html
Seminar Research Publication by Jari Aceh, The Marginalized Community in the Environment Corporate
Exxon Mobil in North Aceh In Lhokseumawe, 13 September 2012
Panduan Singkat Perjanjian Baru Tentang Mercury, IPEN Heavy Metals Working Group, April 2013.
Mercury (Hg) Exposure The Community In Distric Poboya Of Palu Central Sulawesi, Muhamad Ikhsan
Albasar, SKM, Makassar. 2013
Interview of Communtiy Around Gold Mine.

Copyright © 2022 FDOKUMEN