CHAPTER – II REVIEW OF LITERATURE
44
Review of Literature 17 CHAPTER – II REVIEW OF LITERATURE A survey of literature was undertaken to be familiar with the subject matter concerned with the present research problem, which proved helpful in planning and execution of the study. The review of literature is a condensed version of an exhaustive literature survey (Kamath & Udipi, 2010). The reviewed literature provides the basis to understand the importance of undertaking research in the chosen area to obtain knowledge on the methodology used in past researches and to identify the need for future research (Kothari, 2012). The major sources of review of the present study were the surveys, scholarly articles, books and other sources. The researcher also accessed the other sources like sources relevant to particular issues, area of research, or theory, providing a description, summary and critical evolution of each work are presented here. In order to make the review clear and understanding, the present chapter was divided into the following section: 2.1 Theoretical Orientation 2.1.1. Classification of Marble 2.1.2. Processing of Marble in India 2.1.3. Production of Marble – World 2.1.4. Production of Marble- India 2.2 Empirical Studies 2.2.1. Working Condition of the Workplace 2.2.2. Musculoskeletal Discomfort/Disorders experienced 2.2.3. Postural Discomfort 2.2.4. Vibration at Workplace 2.2.5. Noise at Workplace 2.2.6. Light at Workplace 2.2.7. Temperature at Workplace 2.2.8. Physiological Cost of Work 2.2.9. Fatigue experienced 2.2.10. Studies on Marble Industry
-
Upload
khangminh22 -
Category
Documents
-
view
0 -
download
0
Transcript of CHAPTER – II REVIEW OF LITERATURE
Review of Literature 17
CHAPTER – II
REVIEW OF LITERATURE
A survey of literature was undertaken to be familiar with the subject matter
concerned with the present research problem, which proved helpful in
planning and execution of the study. The review of literature is a condensed
version of an exhaustive literature survey (Kamath & Udipi, 2010). The
reviewed literature provides the basis to understand the importance of
undertaking research in the chosen area to obtain knowledge on the
methodology used in past researches and to identify the need for future
research (Kothari, 2012). The major sources of review of the present study
were the surveys, scholarly articles, books and other sources. The researcher
also accessed the other sources like sources relevant to particular issues,
area of research, or theory, providing a description, summary and critical
evolution of each work are presented here. In order to make the review clear
and understanding, the present chapter was divided into the following section:
2.1 Theoretical Orientation
2.1.1. Classification of Marble
2.1.2. Processing of Marble in India
2.1.3. Production of Marble – World
2.1.4. Production of Marble- India
2.2 Empirical Studies
2.2.1. Working Condition of the Workplace
2.2.2. Musculoskeletal Discomfort/Disorders experienced
2.2.3. Postural Discomfort
2.2.4. Vibration at Workplace
2.2.5. Noise at Workplace
2.2.6. Light at Workplace
2.2.7. Temperature at Workplace
2.2.8. Physiological Cost of Work
2.2.9. Fatigue experienced
2.2.10. Studies on Marble Industry
Review of Literature 18
2.1 Theoretical Orientation
This section describes the theories related to Marble, processing of Marble.
2.1. Classification of Marble
The term "Marble" is derived from Latin word "Marmor" which itself comes
from the Greek root "Marmaros" meaning thereby a shining stone. Technically
marble is a recrystallised, compact variety of metamorphosed limetone
capable of taking polish. Commercially, marble is any crystalline rock
composed predominantly of calcite, dolomite or serpentine, having 3-4
hardness, which can be excavated as blocks and can be sawed and takes
good polish11.
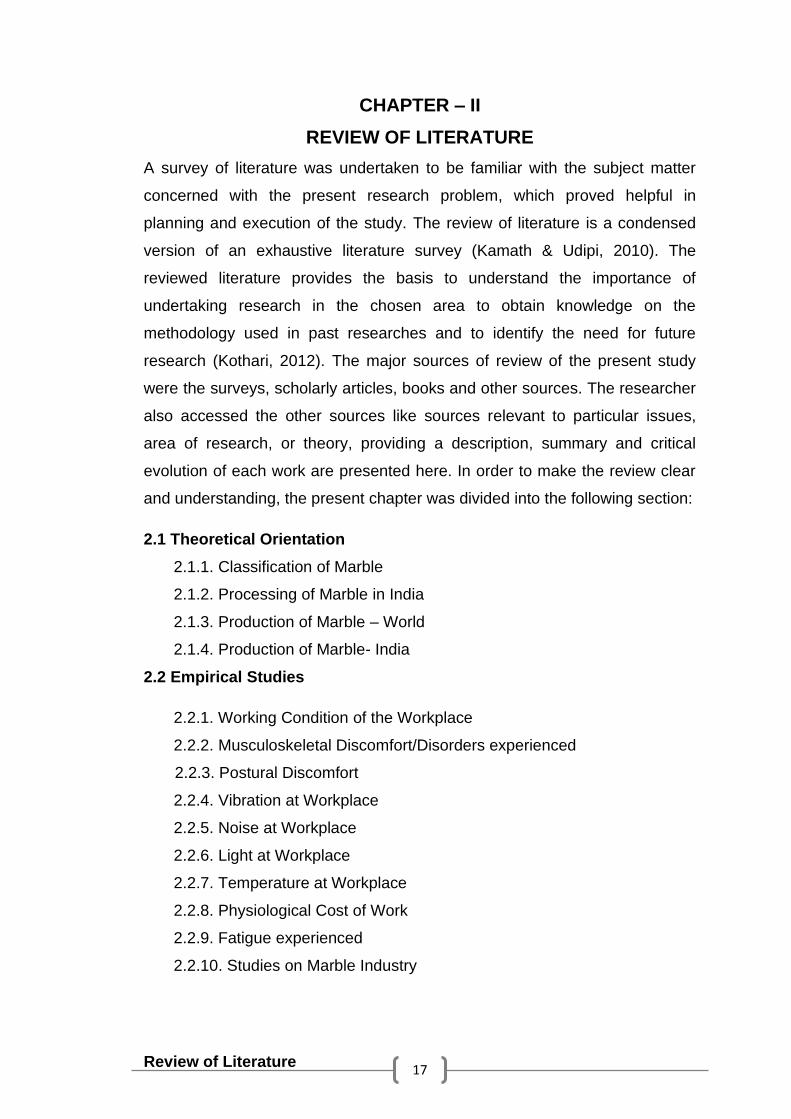
Marble has been classified into 10 groups by Bureau of Indian Standards
(Indian Standard Institute i.e. ISI) (IS 1130-1969) on the basis of colour,
shade and pattern. Rajasthan is the most fortunate state where all the 10
groups are available
1. Plain White Marble 2. Panther Marble
3. White Veined Marble 4. Plain Black Marble
5. Black Zebra Marble 6. Green Marble
7. Pink Adanga Marble 8. Pink Marble
9. Grey Marble 10. Brown Marble
Figure 1: Types of Marbles as per BIS Classification
Plain White Marble Panther Marble White Veined Marble Plain Black Marble
Review of Literature 19
Black Zebra
Marble Green Marble Pink Adanga Marble Pink Marble
Grey Marble Brown Marble
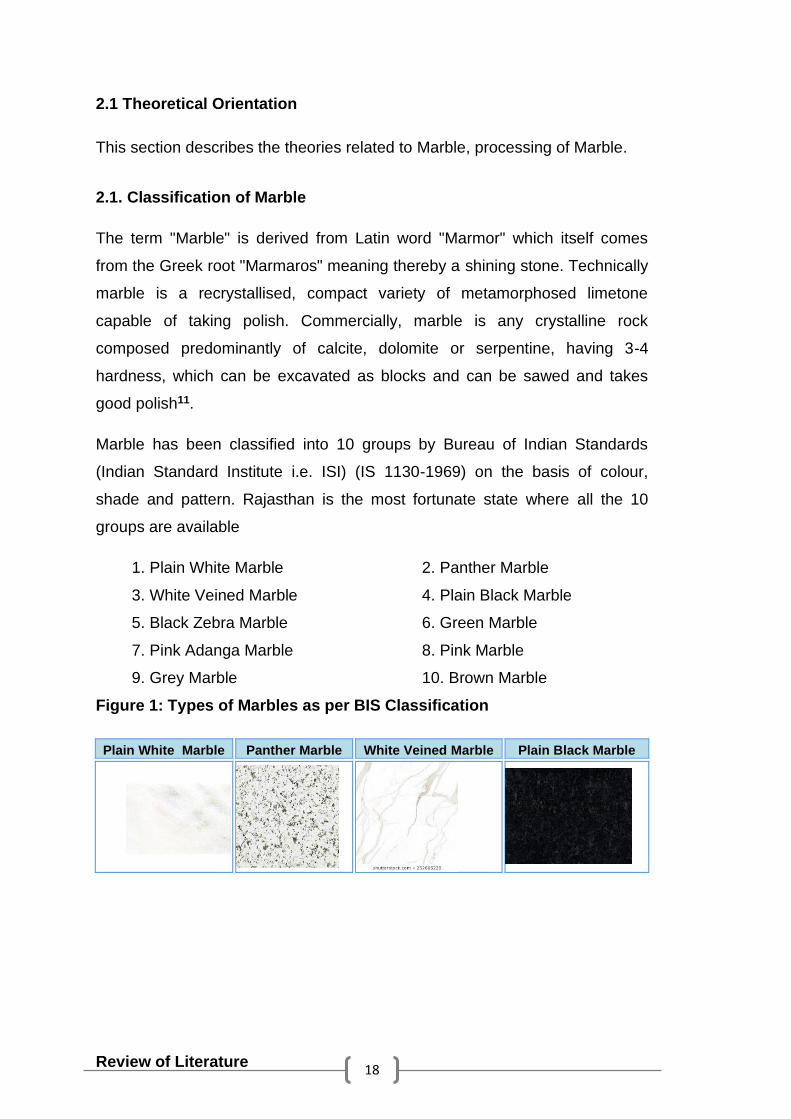
In addition, many new varieties of marble have been brought into the folds of
classification especially after opening of new mining areas.
Figure 2: Other Types of Marbles available in Rajasthan
Makarana Kumari Fancy Brown Churu Andhi Indo Andhi Modern Art
Jaisalmer Yellow Jaisalmer Yellow Bhainslana Black Jhiri Onyx
Rampura Black Fancy Green Bidasar Keshariyaji Sea Green Olive Keshariyaji
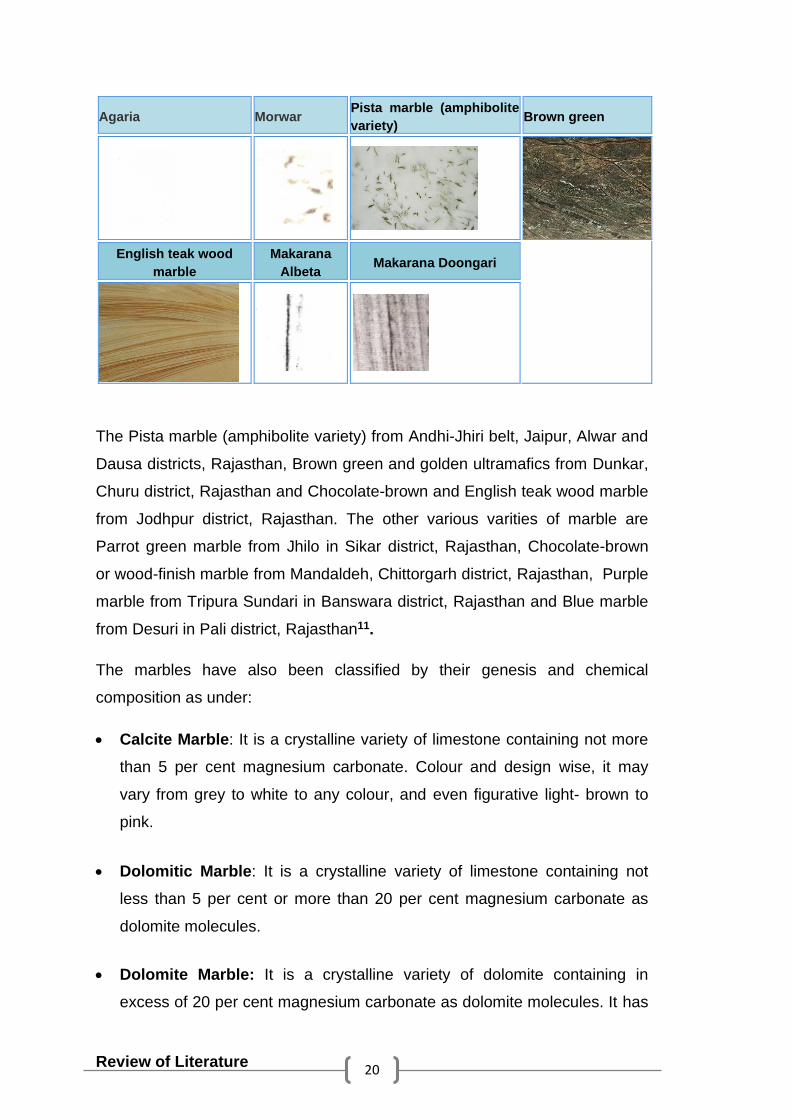
Review of Literature 20
Agaria Morwar Pista marble (amphibolite
variety) Brown green
English teak wood
marble
Makarana
Albeta Makarana Doongari
The Pista marble (amphibolite variety) from Andhi-Jhiri belt, Jaipur, Alwar and
Dausa districts, Rajasthan, Brown green and golden ultramafics from Dunkar,
Churu district, Rajasthan and Chocolate-brown and English teak wood marble
from Jodhpur district, Rajasthan. The other various varities of marble are
Parrot green marble from Jhilo in Sikar district, Rajasthan, Chocolate-brown
or wood-finish marble from Mandaldeh, Chittorgarh district, Rajasthan, Purple
marble from Tripura Sundari in Banswara district, Rajasthan and Blue marble
from Desuri in Pali district, Rajasthan11.
The marbles have also been classified by their genesis and chemical
composition as under:
• Calcite Marble: It is a crystalline variety of limestone containing not more
than 5 per cent magnesium carbonate. Colour and design wise, it may
vary from grey to white to any colour, and even figurative light- brown to
pink.
• Dolomitic Marble: It is a crystalline variety of limestone containing not
less than 5 per cent or more than 20 per cent magnesium carbonate as
dolomite molecules.
• Dolomite Marble: It is a crystalline variety of dolomite containing in
excess of 20 per cent magnesium carbonate as dolomite molecules. It has
Review of Literature 21
variegated colours and textures. As the whiteness increases, the luster
and translucency increases to an extent that it starts resembling with onyx.
The main advantage of this marble is availability of exotic colours and
patterns and its low maintenance cost. Marbles of Banswara in Rajasthan
and Chhota Udaipur in Gujarat belong to this category.
• Siliceous Limestone: It is a limestone containing high silica with smooth
appearance due to fine-grained texture. It is difficult to cut and polish this
type of marble but once polished, it gives a pleasant look. It is available in
several colours and designs. The pink marble of Babarmal and Indo-Italian
variety from Alwar belongs to this category.
• Limestone: Several varieties of limestone are being used as marble. The
Oolitic limestone of UK, Black Marble of Bhainslana, Katra & Sirohi and
Golden-yellow Marble of Jaisalmer belong to this category. This type
requires frequent maintenance in the form of polishing as they are non-
metamorphosed and hence are softer in nature.
• Serpentine or Green Marble: This marble is characterised mainly by the
presence of a large amount of serpentine mineral. It has various shades of
green varying from parrot-green to dark-green and is known for having
varying degrees of veinlet intensities of other minerals, chiefly carbonate of
calcium and magnesium. Most of the green marbles from Gogunda,
Rikhabdeo, Kesariyaji and Dungarpur belong to this category. This marble
is mostly used for panelling. The darker variety of this marble, which is so
dark-green that it looks like black, has been termed as Verde Antique.
• Onyx: It is a dense crystalline form of lime carbonate deposited usually
from cold water solutions. It is generally transparent to translucent and
shows a characteristic variegated colour layering due to mode of
deposition. Such type of marble is found in Kupwara district in Jammu and
Kashmir. It is used for making decorative articles.
• Travertine Marbles: It is a variety of lime- stone regarded as a product of
chemical precipitation from hot springs. The depositional history has left
Review of Literature 22
exotic patterns, when this is cut into thin slabs and polished it become
translucent. (Indian Minerals Yearbook, 2018)
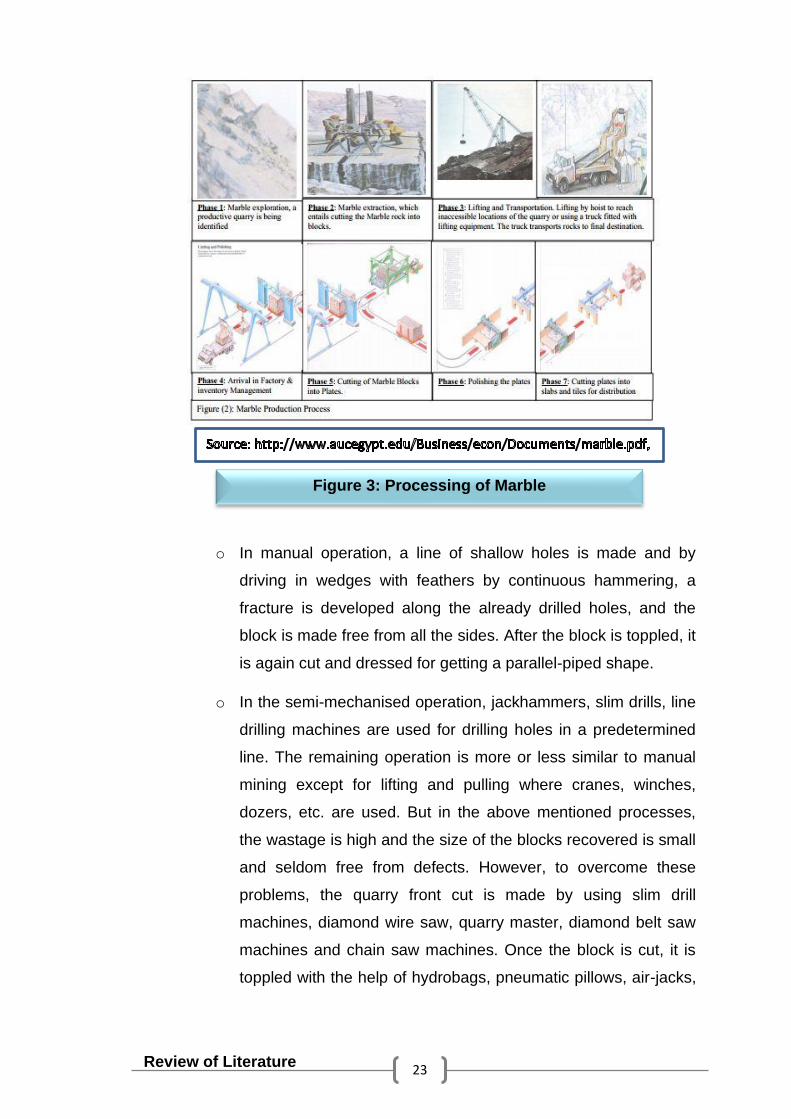
2.1.2. Processing of Marble in India
The production of marble passes through several stages. The main stages
are demonstrated in Figure 1.
2.1.2.1. Mining and Processing of Marble
• Extraction: There are about 4000 marble mines in Rajasthan state
alone. Querries of size of less than 1 hectare and large open-cast
mines(maximum allowed area 50 hectares) are in operation at
various regions of Makrana (Nagaur), Morwad area, Rajnagar
(Rajsamand), Andhi(Jaipur), Salumbar, Jaisalmer, Bidasar (Churu)
etc.
Presently, mining of marble is done by manual, semi-mechanised
and mechanised means. But in general, majority of mines adopt the
semi-mechanised method of mining. The various stages in mining
marbles are as follows:
o The removal of overburden is generally carried out with heavy
earth-moving machinery. In some cases, the weathered zone is
removed by drilling holes by jackhammers and slim drill
machines. These holes are charged with explosives and under
controlled blasting methods, the overburden material is
loosened out. It is then removed using heavy earth-moving
machinery.
o After studying the topography and keeping in view the further
development of quarry, a key block is marked for removal from
the quarry. At this stage, it is necessary to study the joint or
fracture pattern in order to ascertain recovery of large-size
block.
Review of Literature 23
o In manual operation, a line of shallow holes is made and by
driving in wedges with feathers by continuous hammering, a
fracture is developed along the already drilled holes, and the
block is made free from all the sides. After the block is toppled, it
is again cut and dressed for getting a parallel-piped shape.
o In the semi-mechanised operation, jackhammers, slim drills, line
drilling machines are used for drilling holes in a predetermined
line. The remaining operation is more or less similar to manual
mining except for lifting and pulling where cranes, winches,
dozers, etc. are used. But in the above mentioned processes,
the wastage is high and the size of the blocks recovered is small
and seldom free from defects. However, to overcome these
problems, the quarry front cut is made by using slim drill
machines, diamond wire saw, quarry master, diamond belt saw
machines and chain saw machines. Once the block is cut, it is
toppled with the help of hydrobags, pneumatic pillows, air-jacks,
Figure 3: Processing of Marble
Review of Literature 24
etc. The lifting and loading of blocks are done by Derrick cranes
and using various types of loaders.
2.1.2.2. Lifting and Transportation: After cutting the rocks of marble,
marble blocks need to be lifted to a truck for transportation to the
factories. Lifting happens either by using a hoist which lifts the cut
blocks from inaccessible parts of the quarry to where they can be
loaded to the truck, or by using a truck fitted with lifting equipment
which lifts the blocks of stone from where they are to the truck.
2.1.2.3. Inventory Management: The Inventory of raw stone blocks is very
bulky and requires a very spacious area. An "inventory room"
usually occupies the backyard of a typical marble factory. One of
the characteristics of the marble stone is its durability which allows
its storage as inventory in the open air with no special maintenance
or security measures. Nevertheless, the raw stone block is very
heavy and this needs special skills and experience in storing the
blocks: first, to take the least possible space and second, to allow
the accessibility of all types of stored marble or granite and third, to
insure safety of the personnel working in the factory and safety of
the blocks from any damage. Once the raw blocks of stone arrive at
the factory, they are loaded from the trucks with the crane in the
backyard of the factory, where usually the storage area for the raw
material is located. Usually the backyard space is divided into
vertical lanes to store the different types of rocks and make them
accessible when these are needed for processing. The raw blocks
of marble are usually placed one block on top of each other,
separated by a wooden "chair", with a maximum of three blocks
feasibly placed on top of each other. Inventory management is done
through manual bookkeeping. Inventory bookkeeping registers the
date, the number and dimensions of the blocks, and the quality of
marble received. Only very few factories have a computerized
inventory management system. Deciding on the inventory to be
stored depends on contracted client demand. If an agreement is
signed between the factory and a client, the factory tries to store as

Review of Literature 25
much of the required blocks as inventory to secure the order and
hedge against possible risks. The order is then processed in due
time. Marble types that enjoy a high demand in the market are kept
in special inventory stakes.
2.1.2.4. Stone Cutting: When a certain order is placed, the raw stone block
is transported to the factory to be cut as demanded either into tiles
or slabs of various thickness (usually 2 cm or 4 cm). Stone-cutting
is a lengthy process that can take more than a continuous 12-16
hours of operation, depending on the model of the cutting machine
as well as the status of its diamond wire or diamond blades. Though
less expensive than imported machinery, locally manufactured
cutting machines have only 40-45 blades which are usually not very
accurate and produce inconsistent thickness, particularly of marble
tiles which fail to measure up to international standards.
Processing of marble is done in two stages. The first stage of
processing involves cutting the blocks into 2 to 3 cm thick slabs by
using gang saws, wire saws and circular saws. In marble tile plant,
the required thickness of tiles is 10 or 12 mm. For cutting, circular
saws are used. To polish the tiles polishers, trimmer machines are
used before being sold.
On one gang saw on an average 20-40 tonnes of marble is
processed daily. During operation water is continuously sprinkled
on the block to reduce the heat generation. The water requirement
is fulfilled by processors through water tankers. Average water loss
per day is 1000 liters. The marble blocks processed on gang saw
results in 30 per cent waste generation.
• Processing Centres in India
Rajasthan has more than 95 per cent marble processors.
Important processing centres in the State are Makrana, Jaipur,
Alwar, Ajmer, Udaipur, Nathdwara, Rajsamand, Abu Road
Banswara, Chittorgarh and Kishangarh.
Review of Literature 26
Rajnagar is the world's largest marble producing area, large
number of gangsaw units are located in the nearby town of
Kishangarh to process the produced materials.
In Gujarat, processing units are located at Ahmedabad, Ambaji
and Vadodara. India has a rich tradition of processing stones
and carving jalis, pillars, garden furniture, floral and other design
by expert craftsmen.
Principal marble producing & processing companies in India are:
R. K. Marble Ltd, a world's largest marble miner having its
processing unit at Kishangarh in Ajmer district; Bhandari Marble
Group; Classic Marble company have four processing plants at
Silvasa in Dadra & Nagar Haveli; Anil Marble & Granite Exports
is also a leading manufacturer and exporter of wide range of
marble. Other prominent producers in Udaipur district are Arti
Marble & Granite Pvt. Ltd, Mumal Marbles Ltd, Madhusudan
Marble Pvt. Ltd, Arihant Marbles, Khetan Marbles, etc (Mineral
Yearbook 2018).
2.1.2.5. Polishing: After the stone has been cut to the specific dimensions,
there are different techniques towards reaching a “finished” product.
The most known of these techniques is
(a) Polishing and (b) Tumbling.
The polishing operation is fully automated with the use of powdered
abrasives that keeps on scrubbing the surface of the marble until it
becomes smooth and shiny. The smoother the abrasive used, the
shiner and smoother is the surface of the marble. Here, water
showers are essential to prevent overheating. The process of
polishing allows the full color, depth and crystal structure of the
stone to be visible which reflects the beauty of the stone. Tumbling
creates a rough finish to the surface of the stone. This is achieved
by turning the stone at slow speed, in a rotating barrel with
abrasives and water for extended hours. Then, sometimes, a
thermal or a flame finish is given to the marble by applying a high
Review of Literature 27
temperature flame to the surface of the stone. The flame fractures
crystals on the top, leaving a rough-textured finish. A rotating saw is
used to trim the edges of each polished slab. After that, the finished
product is ready for transportation and delivery to the end user.
2.1.2.6. Distribution: The distribution channels depend on the end product
produced by the factory. If the factory produces finished tiles and
slabs, then this is a finished order, processed according to the
customer requirements and a customer delivery takes place. The
final product is delivered to the customer according to an agreed
upon time and place. As finished marble product is very fragile and
needs special care in handling, it is usually packaged, loaded on a
truck and delivered to the client. The same factory could be
producing marble plates. These require distribution efforts.
Distribution often goes to workshops which are usually the
middleman between the supplier and the end user. These
workshops receive the cut plates of marble and store them in their
shops for the end user to choose from. There are marble
showrooms where they display a wide choice of colors and types of
marble to the end user. These smaller workshops constitute a good
percentage of the clientele base for the bigger factories. Factories
that are involved in cutting the plates of marble into tiles and slabs
usually deal with bigger orders where the marble is required for a
whole building and a contract is signed between the marble supplier
and the building contractor for the quantity supplied. Hence,
distribution is directly related to the scale of client demand (Kandil
and Selim, 2015).
• Specification for Marble Production
Indian standards for marbles (blocks, slabs and tiles) IS:1130-1969
(reaffirmed in 2008) are summarised as under:
▪ Classification: Marble shall be classified as white and
coloured categories.
Review of Literature 28
▪ General requirements: Marble shall be free from foreign
inclusions and prominent cracks.
▪ Sizes: Marble blocks shall be supplied in lengths ranging from
30 to 250 cm, widths 30 to 100 cm and thicknesses 30 to 100
cm. The slabs shall be supplied in lengths ranging from 70 to
250 cm, widths 30 to 100 cm and thicknesses from 20 to 150
mm. The tiles shall be supplied preferably in sizes of 10 x 10
cm, 20 x 20 cm, 30 x 30 cm, 40 x 40 cm, 50 x 50 cm and 60 x
60 cm with thickness ranging from 18 to 24 mm in the same
piece. Other sizes as agreed upon by supplier and purchaser
may also be supplied.
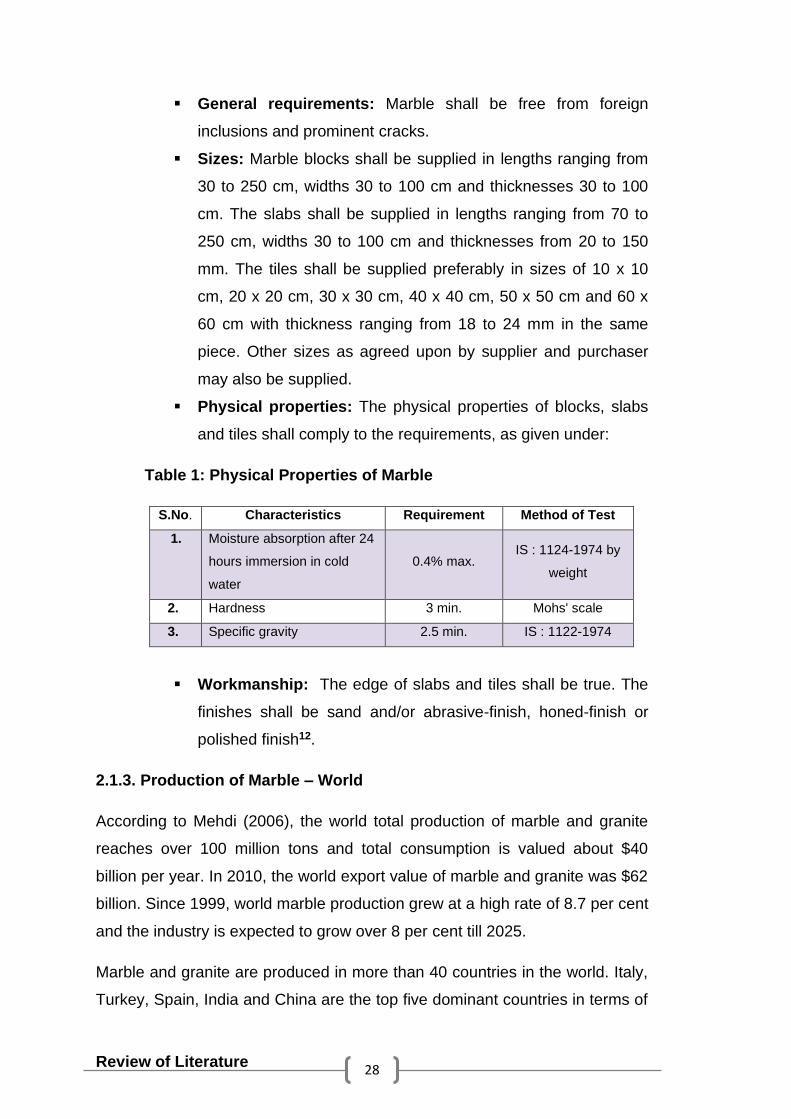
▪ Physical properties: The physical properties of blocks, slabs
and tiles shall comply to the requirements, as given under:
Table 1: Physical Properties of Marble
S.No. Characteristics Requirement Method of Test
1. Moisture absorption after 24
hours immersion in cold
water
0.4% max. IS : 1124-1974 by
weight
2. Hardness 3 min. Mohs' scale
3. Specific gravity 2.5 min. IS : 1122-1974
▪ Workmanship: The edge of slabs and tiles shall be true. The
finishes shall be sand and/or abrasive-finish, honed-finish or
polished finish12.
2.1.3. Production of Marble – World
According to Mehdi (2006), the world total production of marble and granite
reaches over 100 million tons and total consumption is valued about $40
billion per year. In 2010, the world export value of marble and granite was $62
billion. Since 1999, world marble production grew at a high rate of 8.7 per cent
and the industry is expected to grow over 8 per cent till 2025.
Marble and granite are produced in more than 40 countries in the world. Italy,
Turkey, Spain, India and China are the top five dominant countries in terms of
Review of Literature 29
marble production. These countries control over half of the world market –
only Italy produces over 17 per cent of world marble. A major part of
production is consumed locally by producing countries, and only a small
percentage of total production is exported. This fact indicates that local supply
of marble remains less costly, while the transportation cost increases the price
of exported marble products13.
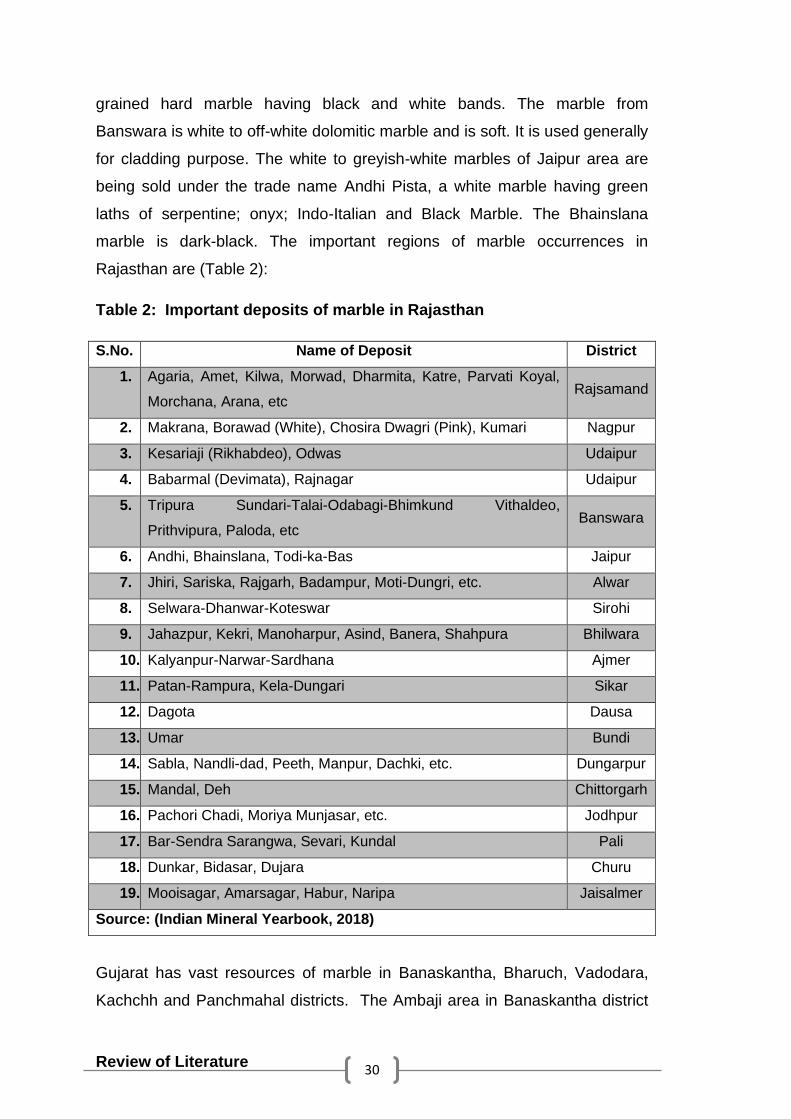
2.1.4. PRODUCTION OF MARBLE- INDIA
India possesses a wide spectrum of stones ~ granite, marble, sandstone,
limestone, slate, and quartzite. It is amongst the largest producer of raw stone
material. The occurrences of marble have been reported from many states,
viz, Rajasthan, Gujarat, Haryana, Andhra Pradesh, Madhya Pradesh, Jammu
& Kashmir, Maharashtra, Sikkim, Uttar Pradesh and West Bengal. Among the
above states, marble deposits of economic importance are localized in
Rajasthan, Gujarat, Haryana, Andhra Pradesh and Madhya Pradesh.
Rajasthan has the distinction of having the best among Indian resources of
good quality marble. Out of 32 districts, 20 districts have marble in one or the
other form.
• Udaipur - Rajsamand - Chittorgarh region;
• Makrana - Kishangarh region;
• Banswara - Dungarpur region;
• Andhi (Jaipur) - Jhiri (Alwar) region; and
• Jaisalmer region.
The marbles of Rajasthan are in various colours and shades. The Makrana
area is famous for pure white crystalline marble. Other varieties found in
Makrana area are Albeta, Adanga, Dongri Pink. The marble from Rajsamand
area is mined extensively. It is off-white and greyish-white. The internationally
acclaimed variety of green marble comes from Rikhabdeo-Kesariaji area, 60
km away from Udaipur. The green marble has various shades of green with
white and black network and patches. The marble from Babarmal is pink and
is marketed as Indian Pink. It is a fine-grained hard marble having black and
white bands. The marble from Bhilwara is white to off-white, fine to medium-
Review of Literature 30
grained hard marble having black and white bands. The marble from
Banswara is white to off-white dolomitic marble and is soft. It is used generally
for cladding purpose. The white to greyish-white marbles of Jaipur area are
being sold under the trade name Andhi Pista, a white marble having green
laths of serpentine; onyx; Indo-Italian and Black Marble. The Bhainslana
marble is dark-black. The important regions of marble occurrences in
Rajasthan are (Table 2):
Table 2: Important deposits of marble in Rajasthan
S.No. Name of Deposit District
1. Agaria, Amet, Kilwa, Morwad, Dharmita, Katre, Parvati Koyal,
Morchana, Arana, etc Rajsamand
2. Makrana, Borawad (White), Chosira Dwagri (Pink), Kumari Nagpur
3. Kesariaji (Rikhabdeo), Odwas Udaipur
4. Babarmal (Devimata), Rajnagar Udaipur
5. Tripura Sundari-Talai-Odabagi-Bhimkund Vithaldeo,
Prithvipura, Paloda, etc Banswara
6. Andhi, Bhainslana, Todi-ka-Bas Jaipur
7. Jhiri, Sariska, Rajgarh, Badampur, Moti-Dungri, etc. Alwar
8. Selwara-Dhanwar-Koteswar Sirohi
9. Jahazpur, Kekri, Manoharpur, Asind, Banera, Shahpura Bhilwara
10. Kalyanpur-Narwar-Sardhana Ajmer
11. Patan-Rampura, Kela-Dungari Sikar
12. Dagota Dausa
13. Umar Bundi
14. Sabla, Nandli-dad, Peeth, Manpur, Dachki, etc. Dungarpur
15. Mandal, Deh Chittorgarh
16. Pachori Chadi, Moriya Munjasar, etc. Jodhpur
17. Bar-Sendra Sarangwa, Sevari, Kundal Pali
18. Dunkar, Bidasar, Dujara Churu
19. Mooisagar, Amarsagar, Habur, Naripa Jaisalmer
Source: (Indian Mineral Yearbook, 2018)
Gujarat has vast resources of marble in Banaskantha, Bharuch, Vadodara,
Kachchh and Panchmahal districts. The Ambaji area in Banaskantha district
Review of Literature 31
and Chinchpura area in Vadodara district are the main producing centres. The
white marble of Ambaji is known for its amenability to carving. Other deposits
in Banaskantha district are Jarivav, Kumbharia, Kateswar, Bheroj and Khikla.
Marble of Vadodara district occurs in various shades, viz, green, white, pink
and cream. Marble of Bharuch varies in colour from black to green and red.
The yellow marble of Kachchh is thin-bedded, sometimes fossiliferous and
blockable deposits occur at Bhulawara-Chinchpura belt (Indian Minerals
Yearbook,2016 & 2018).
In Haryana, marble deposits are located in the district of Mahendragarh. Most
important localities are Antri-Beharipur, Zainpur, Chappra Bibipur, Nangaldur
gu, Islampur and DhanotaDhancholi. Marble of this area occurs in variegated
colours and banded forms. It enjoys the reputation as 'Patiala Marble' with
black and white bands. Of late, the world-famous marble rocks 'Bhedaghat'
near Jabalpur in Madhya Pradesh have attracted entrepreneurs from
Rajasthan. The extension of these rocks located in between Jabalpur and
Katni is being quarried. The marble from these areas is exploited for its off-
white, fine-grained, banded attributes. A number of quarries are under
operation (Indian Minerals Yearbook,2016 & 2018).
Marble deposits of Maharashtra are of calcitic and dolomitic type which are
located in the areas of Katta-Hiwara, Kadbikhera, Sakaritola, Pauni,
Chorbaoli, Deolapar, Mansar, Kandri, Chargaon, Junewani villages in Nagpur
district. In KattaHiwara, the marble is light-pink to grey in colour. The marble
of Kadbikhera-Sakaritola is pink calcitic marble while the marble deposits of
Mansar and Kandri areas are dolomitic type (Indian Minerals Yearbook,2016
& 2018).
In Uttarakhand, thick impersistent bands of white marble occur in massive
limestone in Pithoragarh district (Indian Minerals Yearbook, 2016 & 2018).
In Mirzapur district of Uttar Pradesh, two marble deposits at Hingha and Geria
are of good quality and can yield blocks for limited requirement (Indian
Minerals Yearbook,2016 & 2018).
Review of Literature 32
In Jharkhand, huge deposits of marble are available in Semra-Salatua and
adjoining areas of Palamau. Pink marble occurrences are reported from
Hesadih area, Singhbhum district (Indian Minerals Yearbook,2016 & 2018).
According to Indian Minerals Yearbook (2016 & 2018), the marbles of
Khammam area Andhra Pradesh are white and green. Occurrences of pink,
purple, yellow and variegated marbles are reported in Cuddapah, Kurnool and
Anantapur districts. The dolomitic marble of Cuddapah, Kurnool and
Anantapur districts is other upcoming resource centre for off-white, coloured,
greyish-black marbles which take good polish and are being exploited by
private entrepreneurs.
The total resources of all grades of marble have been estimated at 1,945
million tonnes. Of these, only about 4.5 million tonnes (0.23 per cent) fall
under 'reserves' category and about 1941.3 million tonnes (99.77 per cent)
under 'remaining resources' category. Gradewise, about 27 per cent
resources fall under unclassified and not-known grades, 55 per cent under off-
colour grade and 17 per cent under white colour grade. The available data on
marble resources reveal that about 63 per cent resources are in Rajasthan,
21 per cent in Jammu & Kashmir, Gujarat 6 per cent and Chhattisgarh 4 per
cent. The remaining resources are distributed mainly in Maharashtra,
Haryana, Uttarakhand and Sikkim in descending order (Indian Minerals
Yearbook, 2016 & 2018).
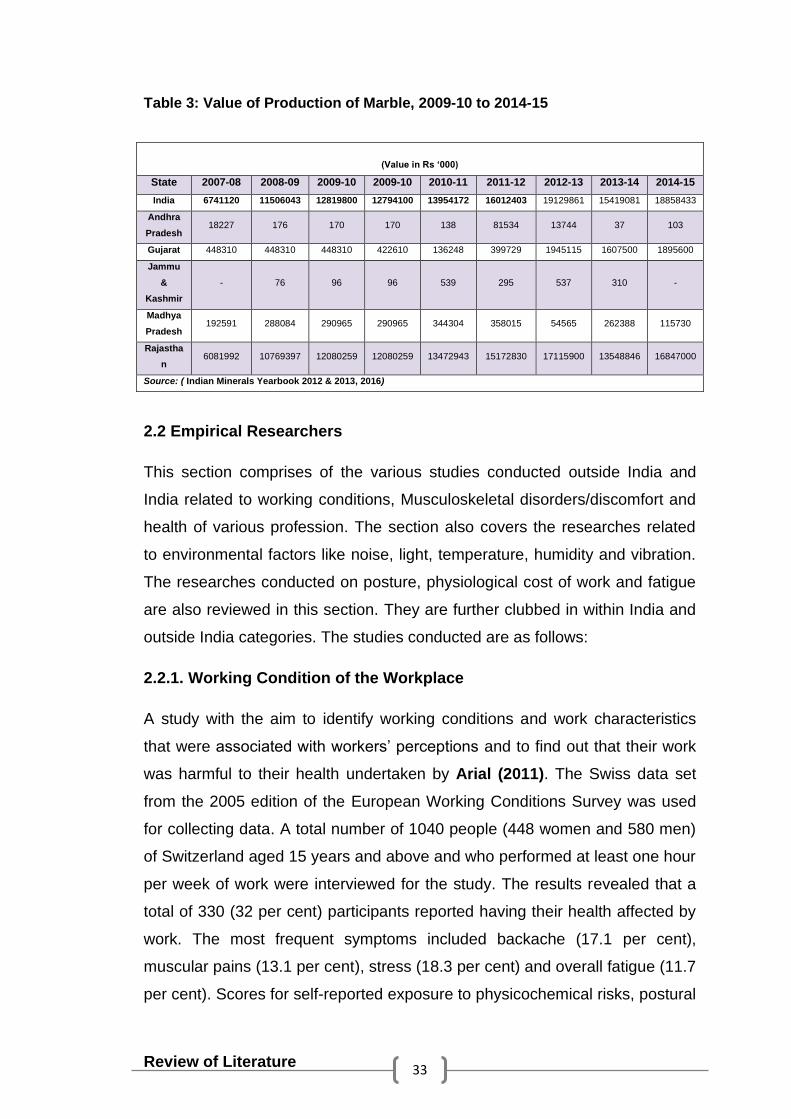
According to Indian Minerals Yearbook (2016 & 2018),the total production
value of marble increased to 1885.84 crore in 2014-15 from `1541.91 crore in
2013-14. Rajasthan alone accounted for about 89 per cent output value
followed by Gujarat (10 per cent) and nominal 1 per cent shared by Madhya
Pradesh, &Andhra Pradesh (Table - 3).
Review of Literature 33
Table 3: Value of Production of Marble, 2009-10 to 2014-15
2.2 Empirical Researchers
This section comprises of the various studies conducted outside India and
India related to working conditions, Musculoskeletal disorders/discomfort and
health of various profession. The section also covers the researches related
to environmental factors like noise, light, temperature, humidity and vibration.
The researches conducted on posture, physiological cost of work and fatigue
are also reviewed in this section. They are further clubbed in within India and
outside India categories. The studies conducted are as follows:
2.2.1. Working Condition of the Workplace
A study with the aim to identify working conditions and work characteristics
that were associated with workers’ perceptions and to find out that their work
was harmful to their health undertaken by Arial (2011). The Swiss data set
from the 2005 edition of the European Working Conditions Survey was used
for collecting data. A total number of 1040 people (448 women and 580 men)
of Switzerland aged 15 years and above and who performed at least one hour
per week of work were interviewed for the study. The results revealed that a
total of 330 (32 per cent) participants reported having their health affected by
work. The most frequent symptoms included backache (17.1 per cent),
muscular pains (13.1 per cent), stress (18.3 per cent) and overall fatigue (11.7
per cent). Scores for self-reported exposure to physicochemical risks, postural
(Value in Rs ‘000)
State 2007-08 2008-09 2009-10 2009-10 2010-11 2011-12 2012-13 2013-14 2014-15
India 6741120 11506043 12819800 12794100 13954172 16012403 19129861 15419081 18858433
Andhra
Pradesh 18227 176 170 170 138 81534 13744 37 103
Gujarat 448310 448310 448310 422610 136248 399729 1945115 1607500 1895600
Jammu
&
Kashmir
- 76 96 96 539 295 537 310 -
Madhya
Pradesh 192591 288084 290965 290965 344304 358015 54565 262388 115730
Rajastha
n 6081992 10769397 12080259 12080259 13472943 15172830 17115900 13548846 16847000
Source: ( Indian Minerals Yearbook 2012 & 2013, 2016)
Review of Literature 34
and physical risks, high work demand, and low social support were all
significantly associated with workers’ perceptions that their work is harmful to
their health, regardless of gender or age. The study concluded that compared
to participants with a low level of education, participants with a high
educational level were more likely to report that their health was affected by
their work.
2.2.2. Musculoskeletal Discomfort/Disorders experienced
Sarkar et.al. (2016) conducted a study which was carried on the workers of a
central market area in Kolkata to find out the prevalence of the
Musculoskeletal Disorders. 210 male Manual Material Handling workers were
randomly selected. Standardized Nordic Musculoskeletal questionnaire was
used to assess the prevalence of MSD. Working posture was analyzed by
Ovako working posture analysis system (OWAS). SF12 questionnaire was
used to assess the physical and mental health status. The results revealed
that Lower back was found to be worst affected body part (68 per cent)
followed by Knee (63 per cent), Neck (56 per cent) and Shoulder (41 per
cent). The Physical composite score (PCS) and Mental composite score
(MCS) were found to be 39.7 ± 9.11 and 46.0 ± 9.17 respectively. PCS, MCS
and Frequency of lifting were found to be significant predictors of pain
intensity rating. The regression model predicted 22.7 per cent of the variability
in the scores of the pain intensity rating. It was concluded awkward postures
along with the heavy load lead to the development of musculoskeletal
disorders.
A study was undertaken by Dasgupta et.al. (2014) to assess the ergonomic
exposures to risk factors of drywall workers which lead to musculoskeletal
injuries (especially back, neck and wrist injuries). The study took place at
three construction sites in the greater metropolitan area of Boston,
Massachusetts wherein the samples were selected by convenience method.
PATH (Posture, Activities, Tools, and Handling) an observational work
sampling-based analysis method developed for non-routinized and irregular
cycle jobs (Buchholz et al., 1996) was used to collect quantitative ergonomic
exposure data during 28 days of observing interior wall systems installation.
Review of Literature 35
Data on working postures were collected for three main body parts: legs, arms
and trunk. The study identified several ergonomic exposures in interior
systems construction. Several risk factors were found among the respondents
like awkward body postures such as overhead arm posture, trunk flexion, and
handling of heavy drywall panels. The results also revealed that the drywall
panel installation task consists of exposures related to risk factors to the back,
arms and shoulders as well as the potential risk of falls from ladders. In
addition, a safety hazard frequently resulted when a worker’s foot was poorly
supported on a ladder while lifting heavy drywall panels to hang them on the
ceiling or upper wall.
A study was carried by Ahmed (2012) to observe 550 women construction
workers of Coimbatore City in their occupational settings for modalities of
performance in the job, study the work environmental impact for sources of
work-related hazards and on their health status. The study also focused on
examining their socio – economic status, knowledge on occupational health
hazards, work-related health disorders and access to social security systems
and Ergonomically relate the impact of repetitive actions and the postures
adopted with objective/ subjective feelings of pain and perceived discomforts
during performance. The 500 women construction workers (convenience
sampling) for the empirical study and 50 women workers (purposive sampling)
were selected for the action research. Semi- structured Interview schedule,
check list, test-batteries and action programme were used as tools for eliciting
data with interview and observation as effective methods. The findings of the
study revealed that the activities performed by the respondents were carrying
loads of different building materials in the same floor or up floors, passing
bricks manually, sieving sand, shovelling, filling mud in foundations and
sweeping, using crude tools and accessories, the use of which impacted their
upper extremities. Many of them were worn out and hence were not user-
friendly, causing minor injuries and bruises. Work place related health
disorders like pain in the shoulder, neck, back; knees, hands and wrists were
reported by all the respondents. Exposure to noise, dirt, work over load, paint
smell, and the like in the work spot had manifested in the form of various
health problems. The findings on the Heart rate revealed carrying load up
Review of Literature 36
floors to fall under very heavy to extremely heavy, and carrying load in the
same floor as very heavy.
Jansen et.al. (2012), undertook a study to analyze subjective self-evaluation
of musculoskeletal discomfort conducted by female production assembly
workers in Tartu, Estonia. Thirty-seven female assembly workers aged 20–54
years participated in this study. 35 females of 37 respondents were right-
handed. Discomfort in neck, shoulder, upper back, upper arm, low back,
forearm, wrist, hips, thigh, knees, lower legs and heels was subjectively
evaluated by Cornell Musculoskeletal Discomfort Questionnaire. The results
indicated that female assembly workers felt most work-related discomfort in
the neck (44 per cent), lower back (19.7 per cent) and in the right wrist (15 per
cent). Discomfort was less pronounced in the right knee (0.01 per cent), left
upper arm (0.04 per cent) and left hip buttocks (0.1 per cent). In conclusion,
this study indicated that subjective discomfort sensed by female production
assembly workers was higher in the neck, lower back, right shoulder and the
right wrist.
El-Gammal et.al. (2011) undertook a study to evaluate the health risk
assessment that might generate from marble manufactures in Damietta
City. The study also aimed to investigate the effect of marble dust exposure
on lungs of rats. The rats exposed to inhalation of dust induced pathological
changes in their lungs which involved the different tissue constituents. The
degree of these pathological changes was proportional to the duration of
exposure. This study revealed a positive relationships between respiratory
lesions and marble dust. The mean concentrations of inhalable dust in
marble workshops (A,B,C) were 30.44, 60.41, 68.73 mg/m3 respectively,
whereas the mean concentrations of personal respirable dust in marble
workshops (A ,B and C) were 6.10, 6.92, 7.15 mg/m3 respectively. Most
of these measurements were exceeded the permissible exposure
limit.Moreover, the data of the present study demonstrated that long period of
chronic exposure to dust induced progressive atrophic changes in the alveoli
of rats. Therefore, there are some potential risk of such industry lying on the
environmental, which requires attention, mitigations, and management to
protect the existing human and animal health.
Review of Literature 37
Johnson et.al. (2011) undertook a study to evaluate the prevalence of
Musculoskeletal Discomfort in industrial workers of Tamil Nadu, to identify the
location specific Musculoskeletal Discomfort, to generate guidelines to
optimize the work, to minimize the risk of injury development and to
maximize the output quality. The study was a cross sectional pilot study
which included 219 subjects of age groups ranging from 18 to 55 years,
from three different industries. The questionnaires were administered to
assess the work exposure and health. The range of movement of the joints
was calculated by using a Goniometer. The postural workload was assessed
by using a RULA work sheet. A clinical examination was done to diagnose
Musculoskeletal Discomfort. The results revealed that 32.6 per cent of the
subjects suffered from Musculoskeletal Discomfort. The highest prevalence of
Musculoskeletal Discomfort was seen among pyrotechnics (44.4 per cent),
followed by match makers (32.7 per cent) and litho offset printers (19.2 per
cent). An increased prevalence of symptom severity was observed in women
(36.1 per cent) and in individuals who performed moderately strenuous
tasks (52.8 per cent).
Caban-Martinez, (2011) conducted a study using the 1997-2008 National
Health Interview Survey (NHIS) Study Database and the 2001-2003 Medical
Expenditure Panel Survey (MEPS), wherein they examined the
musculoskeletal disorders in the US workforce, focusing on the under-
explored associations between US worker occupation, health behaviors
(physical activity patterns, obesity, and cigarette smoking), geographical
location, and health-related quality of life impact of musculoskeletal disorders.
The overall prevalence of arthritis was 21.7 per cent with 14.2 per cent for
employed adults and variation in rates by occupation type (e.g.,
Computer/Mathematical occupations (11.2 per cent) versus Healthcare
support occupations (17.5 per cent). Overall rates of specific arthritis
conditions, which also varied by occupation included: arthritis (19.3 per cent),
rheumatoid arthritis (2.3 per cent), gout (1.4 per cent), lupus (0.3 per cent),
and fibromyalgia (1.2 per cent). Health behaviors mediated the relationship
between occupation and both motor functional limitations. Workers with
arthritis that were current smokers and did not engage in physical activity
Review of Literature 38
reported significantly greater levels of both types of motor functional
limitations. Health behaviors appeared to partially mediate the relationship
between musculoskeletal conditions and functional limitations.
Yiin et. al. (2011) assessed occupational exposure and health threats for
current stone workers of Taiwan. Six stone industrial factories were selected
with governmental assistance. The possible agents that affected health in the
work places, such as dust, noise and hand-arm vibration were measured. The
data was also collected with the help of self-reported questionnaire survey to
discover the health statuses of the workers, and attempted to find the
associations between exposure and health. The dust sampling included
sampling of total and respirable dust. All airborne dust levels, if categorized as
Class 4, were complied with the regulations. However, some of the levels
exceeded the standards, if categorized as Class 1 or 2. Dry sanding did not
significantly generate more dust than the wet method, suggesting the
effectiveness of using ventilation equipment. Noise and hand-arm vibration,
however, were equal to or above the standards, and hand held dry sanding
machine produced the largest acceleration (7.02 m/s2, X axis). The spectrum
analysis indicated that the peak values of noise occurred between 1 k – 4
kHz, which had the most impact on the hearing ability; either dry or wet
sanding could produce the harmful frequencies (8 – 16 Hz) of vibration. The
survey via questionnaire revealed that more than 30 of stone workers thought
they had problems with hearing, and one-third felt they had nerve impairment
of their fingers. The odd ratio for hand-arm vibration in relation to finger
numbness is 6.75 with 95 per cent CI of (1.32, 34.6).
A study was undertaken by Najenson et. al. (2010) to assess the prevalence
of low back pain among 384 Male full time Israeli professional urban bus
drivers, to evaluate the association between low back pain (LBP) in drivers
and work-related psychosocial and ergonomic risk factors. Information on
regular physical activity and work-related ergonomic and psychosocial
stressing factors was collected during face-to-face interviews. The prevalence
of Low Back Pain was assessed using the Standardized Nordic
Questionnaire. The results indicated that 164 bus drivers (45.4 per cent)
reported experiencing Low Back Pain in the previous 12 months. Ergonomic

Review of Literature 39
factors associated with Low Back Pain were uncomfortable seat (odds ratio
2.6, 95 per cent confidence interval 1.4–5.0) and an uncomfortable back
support (OR 2.5, 95 per cent CI 1.4–4.5). In the group of drivers with LBP,
48.5 per cent reported participation in regular physical activities vs. 67.3 per
cent in the group without LBP (P < 0.01). The following psychosocial stressing
factors showed significant association with LBP: “limited rest period during a
working day” (1.6, 1.0–2.6), “traffic congestion on the bus route” (1.8, 1.2–
2.7), “lack of accessibility to the bus stop for the descending and ascending of
passengers” (1.5, 1.0–1.5), and “passengers' hostility” (1.8, 1.1–2.9). The
researcher concluded that work-related ergonomic and psychosocial factors
showed a significant association with LBP in Israeli professional urban bus
drivers.
Gangopadhyay et. al. (2010) conducted a study to assess occupational
related disorders and to conduct ergonomics assessment among stonecutters
in West Bengal. The study focused on the duration of work per day, the
working environment and working activities and the feeling of discomfort in
different parts of the body. A detailed posture analysis was performed
with the Ovako working posture analysis system (OWAS). It was observed
that stonecutters worked continuously in awkward postures during
stonecutting and setting. Consequently, they suffered from discomfort in
different parts of their body, specifically in the lower back, knees and
shoulders, which mainly prevented them from continuing their work. This
study also revealed that stonecutters had to work in congested work areas
with a poor level of illumination.
An investigation was undertaken by Gangopadhyay et. al. (2007) to establish
the prevalence of upper limb MSD among the brass metal workers and
to identify the causative factors behind its development in West Bengal,
India. In this study, 50 male brass metal workers (Experimental Group)
and 50 male office workers (Comparison Group) were selected. For the
symptom survey, a questionnaire on discomfort symptoms was performed.
The repetitiveness of work and Hand Grip Strength of both the groups were
measured. It was revealed that upper limb MSD was a major problem among
brass metal workers, primarily involving the hand, wrist, fingers and shoulder.
Review of Literature 40
Among the workers reporting subjective discomfort, most of them felt pain,
followed by tingling and numbness in their hands. The respondents
complained of swelling, warmth and tenderness in their wrists. Their activities
were highly repetitive and the handgrip strength of these workers was
significantly less than that of the comparison group. It was concluded
that high repetitiveness, prolonged work activity (10.5 hour of work per
day with 8.4 hours spent on hammering) and decreased handgrip
strength could be causative factors in the occurrence of upper limb MSD
among brass metal workers in West Bengal, India.
A research on work related Musculoskeletal Disorders and The Crab
Processing Industry was undertaken by Barron (2007). The study surveyed
the gender differences and the prevalence, type, and symptoms of work-
related musculoskeletal disorders (WMSDs) resulting in disability among the
sample of 107 crab plant workers in Newfoundland, Canada. An analysis
comparing the survey responses of women (n=74) and men (n=33) revealed
few differences in the prevalence, type or symptoms of WMSDs and resulting
disabilities by gender. Some of these differences included that female
workers were more likely to experience a neck injury than males and that
males were more likely to have injuries to their arms than females. Pain was
the predominant symptom experienced. Disability scores were high for men
and women, but no significant differences. The second purpose was to
assess what role physical risk factors plays in the presence of WMSDs.
Overall, the results suggested that jobs in which employees engage in
repetitive motion, work at high speeds and use precise movements of the
hands and finger are associated with increased evidence of WMSDs.
However, no significant relationship was found for gender differences on
these physical risk factors.
Sobeih (2006) conducted a study on One hundred and forty seven
construction workers (representing 3 trades namely carpenters, electricians,
and plumbers) from Greater Cincinnati area, Ohio. The purpose of the
research was to assess the prevalence of Musculoskeletal Disorders among
construction workers and identify the psychosocial and physical risk factors
associated with their occurrence using an onsite survey instrument. Data were
Review of Literature 41
collected by means of a questionnaire that was handed out to subjects during
the data collection visits. The questionnaire consisted of 4 parts: personal
information, musculoskeletal disorders, stress symptoms, and psychosocial
factors. The results revealed that 1-year prevalence of Musculoskeletal
Disorders was high with 61.2 per cent reporting severe symptoms and 39.7
per cent having some functional impairment due to Musculoskeletal
Disorders. Lower back and knee symptoms were the most prevalent disorders
among the different trades. Physical task requirement was the most important
factor associated with Musculoskeletal Disorders reflecting the physical nature
of construction work. After controlling the physical requirement of work and
the personal characteristics of subjects, psychosocial factors were
significantly associated with Musculoskeletal Disorders. Economic and
performance factors were the most stressful psychosocial factors reported
and significantly increased the risk of Musculoskeletal Disorders.
Organizational, mental, and individual growth factors were also significantly
associated with increased risk of Musculoskeletal Disorders however; some
demonstrated an additional protective effect where they were associated with
decreased risk of Musculoskeletal Disorders.
A study was undertaken to assess the contribution of work-organizational
factors, including ergonomics and psychosocial factors, to the prevalence of
WMSDs among sewing machine operators in Los Angeles, California by
Wang, (2005). 520 immigrant workers were recruited from 13 garment
industry sewing shops between October 2003 and March 2005 and
considered for enrollment in an ergonomic intervention study. The information
about individual characteristics and work organization, including ergonomic
and psychosocial factors was collected in a face-to-face standardized
interview conducted in the language of the employee. Logistic regression
modeling was performed for two models with different covariate adjustments:
adjusting for age, gender, and ethnicity, and another adjusting in addition to
smoking, body mass index (BMI), medical history related to musculoskeletal
disorders, and shop size. The results revealed that the majority of the study
population were females (64.4 per cent) and Hispanic or Asian (67.1 per cent
and 28.3 per cent respectively), with a mean age of 38 years (range 18-65
Review of Literature 42
years). Of all, 32 per cent met the criteria of suffering from an upper body
disorder. For these sewing machine operators, several individual factors,
including age, gender, ethnicity, marital status, smoking behaviors, and
medical history of musculoskeletal disorders or systemic illness, were
associated with an upper body disorder. In addition, several ergonomic
factors, such as repetitive movements, non-flexible work schedules in large
shops, working on a schedule with a maximum work cycle of more than 2.75
hours, less than two rests in a workday, short total rest periods, a work-rest
ratio over 8.7, and psychosocial factors, including high psychological job
demands, job dissatisfaction, and perceived high physical exertion, were
associated with an elevated prevalence of upper body disorders.
Shikdar (2004), conducted a study with main objective to conduct an
assessment of ergonomic-related problems in oilrigs in a desert environment
of Oman. A checklist, physical audit and medical records were used in the
investigation. The samples of the study were 32 employees. Two types of
instruments were developed for data collection in the rig: checklists distributed
to workers and team leaders, and physical measurement of environmental
attributes. The questions included in the checklists were related to ergonomic
problems, such as worker health issues, work, environment and worker
satisfaction. The categories of questions in employee checklist were
demography, work, health issues, environment, and satisfaction. To examine
how the temperature varied during the day and night in the oilrig during mid-
summer, measurement of temperature and humidity was conducted every 2
hrs for 2 days in July. The results revealed that the peak temperature of 46 ºC
was approached at about 2 p.m. The air temperature remained above 30 ºC
for about 14 hrs. Noise on the rig floor was measured at various points, at ear
height of the crew. It was observed that the level was above 80 dBA on the rig
throughout the day. High noise of 95 dBA was observed around the center of
the rig where the power station was located. The results also showed
significant health, environment and work-related problems that could be
attributed to ergonomic deficiencies in the work system of the oilrig. Some
major ergonomic issues identified were hard physical work, back pain,
discomfort, hot environment, long shift, and diverse schedule. Ninety-four per
Review of Literature 43
cent of the employees perceived the workday as very long, 79 per cent were
dissatisfied with the work schedule, while 61 per cent of the employees
perceived the summer work environment as extremely hot.
Joshi et.al. (2001) undertook a study to gain an insight regarding
musculoskeletal disorders in industrial workers in Delhi, 631 workers
from 60 factories representing small and medium-sized enterprises
located in Delhi were interviewed. Majority (59.4 per cent) of the workers
had musculoskeletal disorders. The tailors, workers working near
furnaces, cooks, workers in buffing, checking and assembly work, and
those working with chemicals had the most joint complaints. Cervical pain
was more frequent in tailoring and packing work. Lumbar pain was more
common in buffing, operators working on presses, workers using hand and
power tools, and the workers who lifted heavy manual loads. Contract
workers had less musculoskeletal morbidity than regular and temporary
workers. Skilled workers also had less morbidity. The findings also revealed
that workers experiencing more job satisfaction reported fewer
musculoskeletal disorders.
Nursalim (2000) undertook a study to determine the prevalence of Upper
Extremity Work-related Musculoskeletal Disorders (UEWMSDs) among
Textile Industry workers in West Java province of Indonesia and explore the
association between Rapid Upper Limb Assessment (RULA) score and the
prevalence of UEWMSDs. A cross-sectional study was conducted wherein
596 textile workers completed a combination of the NIOSH’s Symptom Survey
and the standardized Nordic Musculo-skeletal Questionnaire. Out of 596
workers, 391 workers (65 per cent) had upper extremity complaints. Among
these, 205 workers (52.4 per cent) met symptomatic UEWMSDs criteria and
were then examined by orthopedic specialists and diagnosed for the presence
of UEWMSDs. Of these 205 workers, 132 workers (64.4 per cent) examined,
and were assigned an UEWMSDs diagnosis. Of these 132 workers with
UEWMSDs, the diagnoses and the prevalence were: Bicipital Tendinitis (25
per cent) Impingement Syndrome (14.6 per cent), Carpal Tunnel Syndrome
(8.3 per cent), Medial Epicondylitis (6.8 per cent), DeQuervains' Syndrome
(5.9 per cent), Supraspinatus Tendinitis (5.4 per cent), Lateral Epicondylitis

Review of Literature 44
(4.4 per cent), Ganglion (2.0 per cent), and Trigger Finger (1.5 per cent).
Upper limb assessment for work-related musculoskeletal disorders was
performed on 497 workers; using video recording of their jobs, the RULA
scores were then calculated. Chi-square analyses determined the significant
association between RULA score and UEWMSDs (p = 0.00 1). In multivariate
logistic regression analysis, work for 10 years or more on the job, RULA
score, physical fatigue, house chores performed more than four hours per
day, gender and smoking proved to be significant predictors for UEWMSDs.
2.2.3. Postural Discomfort
Ahmedi et.al. (2015) conducted a cross-sectional study on 66 workers of
porcelain industry of Rasht, Iran active in different factory units were chosen
through stratified random sampling. The aim was to determine the frequency
of MSDs symptoms in different body parts of the workers, the Nordic
Musculoskeletal Questionnaire (NMQ) and Job Content Questionnaire (JCQ)
were used. Rapid Entire Body Assessment (REBA) method was utilized to
identify the risk of MSDs. The results revealed that based on the data
obtained through the questionnaires, 36 per cent of the studied population
had experienced pain at least in one body part in the last 12 months. The
frequency of pain in the waist, hand and wrists, and neck was the most.
According to the data collected through JCQ, the total score of job content
had a statistically significant relationship with subjects’ age and their
occupational background (P < 0.001, r = -0.549, and r = -0.704, respectively).
Mean REBA scores of workers suggested that printing, carpentry,
engineering, and material supplement units (scores: 6-6.5) were the most
dangerous units, and the enameling unit (score: 4) had the least amount of
risk in the porcelain industry.
Ansari & Sheikh (2014) undertook a study on 15 workers engaged in small
scale industry situated at MIDC Wardha (Maharashtra, India). A video tape on
different activities of the workers was prepared and then images were
cropped from it for the analysis for assessment of work posture. Evaluation of
posture was carried out using RULA and REBA. The RULA method
determined that the majority of the workers were under high risk levels and
Review of Literature 45
required immediate change. The REBA method determined that some of the
workers were under lower levels and majority at high risk levels. The workers
were under moderate to high risk of musculoskeletal disorders. The results
also revealed that there was a lack of ergonomics awareness and
understanding in small scale industries.
In a study by Gangopadhyay et. al. (2010) an attempt was made to identify
the work related musculoskeletal disorders among the sand core-making
workers. Fifty male workers engaged in carbon dioxide and chemical core
making work at an unorganized sector at Baruipur, Calcutta were randomly
selected for this study. A detailed modified Nordic questionnaire study on
discomfort feeling was performed among the core making workers. REBA
method was applied to analyze the working posture. Finally, discomfort level
and risk level of the individual working postures were calculated by the use
of risk level and discomfort level scale. From the questionnaire study it
was revealed that most of the core making workers grind in awkward postures
often. The workers were affected by musculoskeletal disorders like pain at
low back (100 per cent), hand (40 per cent), shoulder (30 per cent), wrist
(20 per cent) and neck (20 per cent). There existed a significant (p < 0.05)
correlation between discomfort level and risk level of the individual working
postures of the workers.
Twenty-five stone carving male workers were selected at Jaipur in
Rajasthan from each of the three sections of a stone-carving unit. The
focus was to identify different ergonomic risk factors associated in this
profession from the field. Still photography and video photography was used
to record different activities. Different types of non-invasive tools like
Rapid Entire Body Assessment (REBA), Rapid Upper Limb Assessment
(RULA), Occupational Repetitive Action Index (OCRA) were used.
Psychophysical measures were investigated by Body part discomfort map,
rated perceived exertion scale and visual analogue scale. Objective
measurements (heart rate and skin temperature) were recorded with stop
watch and digital thermometer. The working heart rate after 30 minutes of
work was 112.4 beats per minute categorizing the work as moderately heavy.
Postural analysis by REBA indicated high score (13/13). Similarly postural
Review of Literature 46
analysis by RULA showed high score (7/7). The study indicated that majority
of the activities were in the high risk category (Mukhopadhyay and
Srivastava, 2010).
2.2.4. Vibration at Workplace
Filho (2002) undertook a study with a purpose to investigate the perceived
physical demand in a simulated industrial task, where subjects were primarily
exposed to hand-transmitted vibration generated by a simulated power hand
tool. The dominant frequencies evaluated were 16, 31.5, 63, and 125 Hz, and
the accelerations were 3 m/s2 and 5 m/s2 as defined in ISO 5349, 2001.
Through a psychophysical methodology extensively used in Ergonomics, the
individual’s perception of the physical stress associated with the intermittent
operation of a simulated power hand tool was measured in a laboratory
setting. The researchers conducted eight 40-minute trials (8 treatments = 4
vibration frequencies x 2 vibration accelerations) on sixteen subjects from
Morgantown, West Virginia who were instructed to adjust the duration of
intermittent rest periods in a simulated industrial task in order to find the
maximum acceptable pace at which they estimated to be able to work for a
normal 8-hour shift, without feeling sore, aching, with uncomfortable
numbness in their hands and arms, or unduly fatigued. In addition to the
subjects’ adjustment of rest time, their fingertip vibrotactile threshold shift,
their maximum isometric grip force shift, and the absorbed power in their
fingers were measured in all eight experimental trials. It was indicated that
vector sum acceleration had significant effects on selected rest time and
digital absorbed power; and that vibration dominant frequency had significant
effects on selected rest time, fingertip vibrotactile threshold shift and digital
absorbed power. Finally, the dominant frequency of 31.5 Hz appeared to
consistently represent the less stressful level for the vibration dominant
frequency in this research study.
Gold, (2002) aimed to examine two potential indicators of Upper Extremity
Work-related Musculoskeletal Disorders (UEMSDs) - digital vibration
threshold testing (VTT) and infrared thermographic imaging in USA. Upper
Extremity Work-related Musculoskeletal Disorders (UEMSD) signs and
Review of Literature 47
symptoms in automobile manufacturing workers (n = 1187) were examined for
their association with vibration thresholds (VTs) in cross-sectional analysis,
and one year following such testing. Psychophysical questionnaires were
used to assess ergonomic stressors. Using a Borg CR-10 scale, workers
rated their exposures to the following stressors: repetition, grip force, awkward
neck/shoulder, arm, and wrist/hand postures, whole body effort, contact
stress, machine pace, segmental and whole body vibration factors.
Associations with workers’ estimates of ergonomic stressors were also
examined. Three groups of office workers (n = 29) underwent dorsal hand
thermographic imaging before and after typing for nine minutes. Changes in
mean dorsum temperature through several imaging periods were determined
for controls and for subjects with distal UEMSDs, with and without subjectively
cold hands exacerbated by keyboard usage. VTs were associated with
greater hand/arm numbness frequency in cross-sectional analysis, and also
with its persistence one year after VTT. VTs were also associated with de
Quervain’s disease and extensor and flexor compartment disorders, in cross-
sectional analysis and in follow-on incident cases. Associations were found
with hand force, vibration intensity as felt through the floor, and a sum of
exposures. Three distinct blood flow patterns in response to a typing
challenge were seen in the three office worker groups. Warm cases and
controls both increased mean dorsum temperature after typing, while cold
cases decreased. An ambient temperature effect was seen in both cold cases
and controls.
2.2.5. Noise at Workplace
A study aimed at quantifying noise pollution from industrial noise (machine
and human generated) at two selected processing and manufacturing
industries namely: Denki Wire and Cable Nigeria Limited and Wanwood
Nigeria Limited, in Akure and Ondo State, Nigeria was undertaken by
Anjorin, et.al. (2015). Data collection was done through the use of one
hundred and twenty (120) structured questionnaires were administered out of
which one hundred and two (102) were received. The questionnaire
comprised of personal information of employee, noise exposure records and
site information (history of machines).The experimental apparatus employed
Review of Literature 48
in the recording of noise levels consist of a precision grade sound level meter
inch condenser microphone and with frequency range and measuring level
range of 31.5Hz to 8KHz and 35 to 130 dB(A) respectively. The machines
used for processing and production in these two industries were considered
for the research study as well as their operators and workers. The average
noise equivalent level (LAeq) was studied to identify the noisy machines and to
generate baseline data. A precision grade sound level meter was used to
determine the various pressure levels of sound at thirty minutes interval for
five days. The average noise exposure level (LAeq) in both industries was
found to be above 85 dB(A) and that is well above the healthy noise level of
85 dB(A) recommended by World Health Organization (WHO). The workers in
the industries were at high risk of developing noise induced hearing loss
(NIHL) and other associated ailments due to excessive exposure to industrial
noise.
Manna & Basu (2011) undertook an observational, cross-sectional study in a
heavy engineering industry in Kolkata, India to find out the prevalence of
occupational deafness and the association between occupational noise
exposures, socio-demographic and other risk factors with deafness of the
employees. Among a total of 278 employees under this study, 235 employees
were exposed to more than the permissible occupational noise level (90dB),
out of whom 82 (34.90 per cent) employees were deaf; which was significantly
(χ2 = 17.97, df = 2, p = 0.0001) much more than deafness among the non-
exposed workers who were 3 (6.98 per cent). Hearing impairment increased
as exposure level increased and this trend was statistically significant (χ2 =
17.97, df = 2, p = 0.0001). Hearing impairment also increased as duration of
exposure to occupational noise increased and the relationship was found to
be statistically significant (χ2 = 7.12, df = 2, p = 0.0284). Pre-placement &
periodic medical examination is vital before putting up any employee in an
industry with high noise exposure. Regular use of personal protective devices
by the employees is to be ensured.
Singh et.al. (2009) carried a study in 5 small scale hand tool forging units
(SSI) of different sizes in Northern Indian Punjab. The noise levels at various
sections were measured. Equivalent sound pressure level (Leq) had been
Review of Literature 49
measured in various sections of these plants. Noise at various sections like
hammer section, cutting presses, punching, grinding and barrelling process
was found to be >90 dB (A), which was greater than OSHA norms. A cross-
sectional study on the basis of questionnaire was carried out. 451 randomly
selected male workers for the survey. The results of the study revealed that
68 per cent of the workers were not wearing ear protective equipments out of
these 50 per cent were not provided with personal protective equipment’s
(PPE) by the company. There was no isolation among different sections e.g.
hammer section and other sections like punching, barrelling, and grinding etc.
Majority of the workers (95 per cent) were suffering speech interference
though high noise annoyance was reported by only 20 per cent. More than 90
per cent workers were working 12 to 24 h over time per week which lead to
very high noise exposure i.e. 50 to 80 per cent per week higher than exposure
time/week in USA or European countries.
Mokhtar et.al. (2007) undertook a study which involved the noise
measurement method and a questionnaire based survey. 120 subjects for the
study were chosen at random among industrial workers from several
organizations located in the north of Malaysia. The organizations were the
rubber product manufacturing, metal stamping and publication and printing
companies. The research covered the physiological and psychological effects
of noise and the auditory, hearing loss and sleep disturbance experience
among subjects. The noise measurement method used a logging dose meter
(type 443; make: Bruel & Kjaer, Denmark) to assess the noise level exposure
among workers. The visits to industries were made and the noise levels were
measured and recorded for different sections of the factories. The
questionnaire for the survey comprised of 37 questions on different effects of
noise on workers. Each question was provided with three choices of
responses being yes, no, and unsure. The majority of the respondents in all
industries indicated that they did not feel any physiological effect of noise.
With respect to hearing loss, maximum percentage of workers indicated that
noise did not produce any hearing loss effect. Similarly, for auditory,
psychological, and sleep disturbance effects of noise, percentage of workers
indicating presence of the effect, no effect, and no response from the workers.
Review of Literature 50
The primary data, thus collected, was analyzed using Chi-square statistical
technique and it was found that except psychological behavior, the
physiology, hearing capability, auditory communication and sleep of the
industrial workers were significantly affected by the existing noise levels.
Atmaca et.al. (2005) conducted a study to gain an insight of the problem of
noise in the industries around Sivas, Turkey. The survey was carried out at
concrete traverse, cement, iron and steel and textile factories located in this
region. A questionnaire was completed by 256 workers during this study in
order to determine the physical, physiological, and psycho-social impacts of
the noise on humans and to specify what kind of measurements were taken
both by the employers and workers for protection from the effects of noise. It
was specified, during the surveys, that the noise levels detected in all the
industries are much above the 80 dBA that was specified in the regulations:
73.83 per cent of the workers in these industries were disturbed from the
noise in their workplaces, 60.96 per cent of them had complaints about their
nervous situations, 30.96 per cent of these workers were suffering hearing
problems although they had not had any periodical hearing tests and they
were not using ear protection equipment.
Harger and Barbosa (2004), undertook a study to evaluate the prevalence of
hearing loss, its degree and type, among workers in the marble industry in the
Brazilian Federal District (FD). The workers from eight marble industries in the
FD were evaluated by means of a cross sectional epidemiological study. An
audiometry screening test (air conduction) was performed. Workers with
hearing loss were submitted to liminal tonal audiometry air and bone
conduction and speech audiometry tests using an audiometer AD-28 (Inter
acoustics). All subjects studied were submitted to a visual inspection of the
external acoustic meatus. One hundred and fifty two workers were examined.
The mean age of the respondents was 32 years (SD = 8.6); average
occupational noise exposure was of 8.3 years (SD = 6.8). The audiometries
demonstrated that 48.0 per cent (n = 73) had some type of hearing loss.
Among the workers with hearing loss, 50.0 per cent had results compatible
with noise-induced hearing loss (NIHL); 41.0 per cent with incipient noise
induced hearing loss, 5.0 per cent with sensorineural hearing loss (all except
Review of Literature 51
NIHL) and 4.0 per cent with conductive and mixed hearing losses. Among
workers with Noise induced hearing loss (NIHL), 57.1 per cent had bilateral
involvement, 17.1 per cent in the right ear and 25.7 per cent in the left ear.
Among those with incipient NIHL, 13.9 per cent were bilateral, 19.4 per cent
were only in the right ear and 66.7 per cent were only in the left ear. The study
also revealed that abnormal audiograms were found in 48.0 per cent of the
sample. Among those with hearing loss, the predominant cause was NIHL,
followed by those classified as having incipient noise induced hearing loss.
Hearing loss usually started at 6 kHz, frequently in the left ear.
2.2.6. Light at Workplace
Katabaro and Yan (2019) conducted a study to analyze the effects of the
lighting quality on working efficiency of workers in Tanzania. Four
representative offices from the administration building at Mbeya University of
Science and Technology were investigated from June to September 2018.
The customized questionnaire survey tool was administered to the randomly
selected occupants to survey their perceptions about the quality of lighting in
their workplace and its influence on their health and work efficiency. Physical
observation and illuminance distribution measurements were also conducted.
The statistical analysis indicated that the majority of the occupants were less
satisfied with the lighting quality in their working environment, and some
respondents reported that it significantly affected their work efficiency and
wellbeing. The average desk illuminance and uniformity level were found to
be below the recommended values of the Chartered Institution of Building
Services Engineers (CIBSE) and the International Commission on lighting
(CIE).
Chattomba, (2010), conducted a study on Illumination and Noise Survey in
Mines. The study was undertaken to measure illuminance level of luminaries
using a digital lux meter in surface and underground coal/non-coal mines,
conduct noise survey in few opencast and underground coal/non-coal mines
and to assess the adequacy of illumination and noise levels in mines vis-à-vis
Indian standards. The illumination survey was carried out at opencast mine of
BSL Birmitrapur & Underground Coal Mines of MCL in Orissa, using Digital
Review of Literature 52
Lux meter (Metravi1332). Similarly, noise survey was carried out in opencast
mine of BSL Birmitrapur & Underground Coal Mines of MCL in Orissa, using
Sound level meter (CEL 283). The results of studies were compared with the
existing standards and due inferences were obtained. The results obtained
from illumination survey in mechanized unit of pathpahar mines of BSL
revealed that at loading points, near crushers, mini crushers & dumping yards
were adequate and are within the limits of Indian standards whereas
illuminance levels in electrical substation, store room, rest rooms and
electrical control rooms were inadequate. The results obtained indicated that
the sound pressure levels of various machineries used in Pathpahar mines of
BSL, & underground coal mines of MCL were higher than the acceptable
limits (>90dB (A). In the mines under study, most of the mine workers were
exposed to SPL (sound pressure level) beyond TLV (90dB A) due to
machinery noise.
Juslén (2007), conducted a study on Lighting, productivity and preferred
illuminances – field studies in the industrial environment. The main objectives
were to study which task illuminances industrial workers prefer and to find out
if increasing the task illuminance from the levels given in the relevant Norms
(CIE S 008/E-2001, EN 12464-1) can increase their productivity, and if so, to
understand the possible reasons for the productivity increase when the
lighting is changed. Six case studies were conducted in real industrial
environments of luminaire factories in Finland. The preferred illuminances of
the industrial workers covered a wide range of values. The results from the
productivity-related field studies showed that increasing task illuminance
above the minimum level given in norms increased productivity even though
the effect was influenced by the starting conditions, tasks and subjects.
Productivity increase in the field tests were found between zero and 7.7 per
cent. Additionally, two field studies where absenteeism was measured
showed a decrease in absenteeism when the illuminance was increased. One
study also showed that increasing the task illuminance was achieved without
increasing the energy consumption.
Ismail et. al. (2007) undertook a study with an objective to determine the
effects of lighting on the operators’ productivity at Malaysian electronic
Review of Literature 53
industry. The subjects were workers at the assembly section of the factory.
The environment examined was the Illuminance (lux) of the surrounding
workstation area. Two sets of representative data, the illuminance level and
production rate were collected during the study. The production rate data
were collected through observations and survey questionnaires while the
illuminance level was measured using photometer model RS 180-7133.The
correlation and linear regression analysis were conducted in order to obtain
the relationship between the effects of level Illuminance (lux) and the worker
productivity. The results from the correlation analysis revealed that there was
a linear relationship between the Illuminance level and the productivity of the
workers. The linear regression analysis further revealed that there was a
linear equation model with positive slope to describe the relationship of
Illuminance level and workers productivity for the assembly section involved.
The linear regression line obtained was Y = 0.5634X – 158.16.
2.2.7. Temperature at Workplace
Ruslan et. al. (2014) undertook a study to determine the effects of air
temperature, humidity and lighting between genders and ages among workers
working in Call centres of Malaysia. These data were combined to estimate
the exposure level by using statistical analysis. 30 measurements were taken
at 10 different locations during 9.00 a.m., 12.00 p.m. and 5.00 p.m. 40
respondents participated in the survey conducted to identify the exposure and
symptoms or other health related problems among the workers. The study
indicated that the mean value recorded for temperature at 9.00 a.m. was
25.4oC, for temperature at 12.00 p.m. was 23.8o C and mean for temperature
at 5.00 p.m. was 23.4o C. While for humidity, the mean value for humidity at
9.00 a.m. is 58.98 (RH %), at 12.00 p.m. is 57.84 (RH %) and the last reading
which is for humidity at 5 pm is 60.20 (RH %). The mean value for the lighting
was 278.9 lux during 9.00 a.m. and 282.7 lux for the mean at 12.00 p.m. and
mean results during 5.00 p.m. shows 280.4 lux. The findings indicated that
there is no significant difference between gender and ages towards the effect
of the temperature, humidity and lighting on the workers’ health.
Review of Literature 54
A study was undertaken to investigate standard illumination levels and
conditions for optimum visual comfort of the Ready Made Garments workers
in the production spaces and to generate recommended illumination
conditions for the production spaces that would be useful to have maximum
work efficiency in context of Dhaka region. Field surveys were conducted with
detailed experimental study of the selected RMG production spaces on
illumination conditions and feedback of the workers. A sample of 60 workers
was chosen from each of three production spaces for detail questionnaire
study as well as statistical analysis. It was observed that the illumination level
in production space type-3 was a bit higher than the other spaces. Among the
samples, majority of them expressed that the adequacy of lighting condition is
proper to do their sewing related works at their workstation, especially in
production space-1 (73 per cent). Among the samples, majority of them said
that the there was no contrast between the immediate surroundings and at
their work station, especially in production space 1 and 2 (83 per cent and 75
per cent respectively). On the other hand, while asking about the Glare,
majority of them said that there was no glare at their work station, especially
in production space 1and 3 (93 per cent and 82 per cent respectively). The
overall feedback from the respondents revealed that more than 50 per cent of
workers were comfortable with the illumination condition at their work station.
While focusing on only the illumination level coefficients showed that workers
feedback about the brightness and adequacy increased with increasing the
illumination level. Considering the mean values and standard deviation from
the mean values, it was concluded that the desired illumination level at the
work station of the worker in production spaces to achieve workers comfort
should be around 700 lux (within range of 601~800 lux) (Hossain and
Ahmed, 2013).
The effect of indoor air temperature (17o C, 21o C, and 28o C) on productivity
was investigated with 21 volunteered participants from China in the laboratory
experiment. Participants performed computerized neurobehavioral tests
during exposure in the lab; their physiological parameters including heart rate
variation (HRV) and electroencephalograph (EEG) were also measured.
Several subjective rating scales were used to tap participant’s emotion, well-
Review of Literature 55
being, motivation and the workload imposed by tasks. It was found that the
warm discomfort negatively affected participants’ well-being and increased the
ratio of low frequency (LF) to high frequency (HF) of HRV. In the moderately
uncomfortable environment, the workload imposed by tasks increased and
participants had to exert more effort to maintain their performance and they
also had lower motivation to do work. The results indicated that thermal
discomfort caused by high or low air temperature had negative influence on
office workers’ productivity and the subjective rating scales were useful
supplements of neurobehavioral performance measures when evaluating the
effects of IEQ on productivity (Lin et. al., 2011).
Sepannen et.al. (2006) conducted a review study wherein 24 relevant studies
were studied which focused on the effects of temperature on performance at
office work. The studies that had used objective indicators of performance that
were likely to be relevant in office type work, such as text processing, simple
calculations (addition, multiplication), length of telephone customer service
time, and total handling time per customer for call-center workers were
included. The percentage of performance change per degree increase in
temperature, positive values indicating increases in performance with
increasing temperature, and negative values indicating decreases in
performance with increasing temperature was calculated from all studies. The
results revealed that performance increases with temperature up to 21-22o C,
and decreases with temperature above 23-24o C. The highest productivity is
at temperature of around 22oC. For example, at the temperature of 30oC the
performance is only 91.1 per cent of the maximum i.e. the reduction in
performance is 8.9 per cent.
2.2.4. Physiological Cost of Work
Devi and Vats (2019) conducted a study on forty Indian women tea factory
workers, aged between 30 - 60 years were investigated in the factories during
eleven selected activities such as Lifting bags, Lifting tubs, Handling of bags,
Stacking of bags, Filling tea powder in bags etc. purposive random sampling
method was used to select the respondent. The physiological cost of work
calculated in terms of heart rate and total cardiac cost. On the basis of heart
Review of Literature 56
rate it was concluded that the blending, loading wheelbarrow and wheeling
was more strenuous than lifting bag, filling tea powder in bag, loading tea
powder in sifting machine. On the basis of TCCW loading wheelbarrow was a
most strenuous activity and followed wheeling and least exhaustive activity
were lifting bag and packing.
Mehta et.al. (2017) conducted a study to measure and correlate the
relationship of energy expenditure of a normal healthy individual with different
body mass index (BMI) and age. A total of 115 participants (59 males and 56
females) of Anand, Gujarat were included in this study. Each participant was
given rest for 5 min and recorded resting Heart Rate. Participants were asked
to walk on 30 m straight floor track for 6-min walk test (6 MWT) at the normal
speed. Pre-and post-walked vitals were taken, and Physiological Cost Index
was calculated by formula. The results revealed that there was highly
statistically significant relation with age and Physiological Cost Index (P <
0.05) as age (40.86 ± 15.56) increased, PCI (0.26 ± 0.11) value was
increased. It was also found out that the adult age group covered more
distance than the older age group. The present study concluded that as the
age and BMI increases the Physiological Cost Index increases, suggestive of
more energy expenditure. The difference between resting HR and immediate
post-test HR was directly proportional to Physiological Cost Index.
Saha et. al. (2008) undertook a study to compare physiological strain of
carriers in underground manual coal mines in India. For the study, thirty-nine
healthy carriers (23-57 years of age) were investigated in underground
manual coal mines in West Bengal, India during two different work spells
of a single work shift. The researchers compared physiological strain of
workers <40 and > or =40 years of age. For both groups, mean heart rate was
124-133 beats/min, with a mean corresponding relative cardiac cost of 50-66
per cent. Maximum aerobic capacities were estimated indirectly, following a
standard step test protocol. Average oxygen consumption was 1.07-1.1 l/min,
with an energy expenditure of 5.35-5.5 kcal/min among both age groups.
Acceptable levels of physiological strain were well encroached, and older
workers faced the maximum burden. The tasks studied were heavy to very
heavy in nature.
Review of Literature 57
2.2.9. Fatigue experienced
Salve (2017) conducted a study to establish the relationship between the
duration of work exposure and feeling of subjective fatigue. For the purpose of
the study twenty-one jewelry manufacturing workers of India as study group
and 27 students as control group participated with their signed informed
consent. The daily diary method and feeling of subjective fatigue evaluation
questionnaire were used as a tool in this study. Three categories of feeling of
subjective fatigue were considered in this study. The study was conducted
mainly in the middle of the week. The data regarding feeling of subjective
fatigue were collected before starting of work and after completion of the work
day. The results showed that the time spent on the job by the workers
engaged in jewelry manufacturing was 670 minutes and were in four slots with
the longest work period being 240 minutes. Sleeping time was found to be
around 480 minutes. The study revealed that all three dimensions (general,
mental, and physical) were affected by the whole day work exposure. Among
three types of fatigues, general fatigue was observed at the beginning and
end of the work shift.
Zhang et.al. (2015) conducted a study to assess the association between
construction workers’ reported fatigue and their perceived difficulties with
physical and cognitive functions. The data was collected from a convenience
sample of US construction workers participating in the 2010–11. National
Health Interview Survey two multivariate weighted logistic regression models
were built to predict difficulty with physical and with cognitive functions
associated with workers’ reported fatigue, while controlling for age, smoking
status, alcohol consumption status, sleep hygiene, psychological distress and
arthritis status. The findings revealed that of 606 construction workers
surveyed, 49 per cent reported being ‘tired some days’ in the past 3 months
and 10 per cent reported ‘tired most days or every day’. Compared with those
feeling ‘never tired’, workers who felt ‘tired some days’ were significantly more
likely to report difficulty with physical function (adjusted odds ratio
[AOR] = 2.03; 95% confidence interval [CI] 1.17–3.51) and cognitive function
(AOR = 2.27; 95% Confidence Interval 1.06–4.88) after controlling for
potential confounders. The study concluded that there is an association
Review of Literature 58
between reported fatigue and experiencing difficulties with physical and
cognitive functions in construction workers.
Lin et.al. (2015) undertook a study with a purpose to explore the prevalence
of fatigue and identify the risk factors of fatigue among men aged 45 and older
in China. The study was part of a cross-sectional study on community health
in Shunde (Guangdong Province, China). A total sample of 1158 men aged
45 and older were included. Sociodemographic characteristics, health and
lifestyle factors were measured by structured questionnaires through face-to-
face interviews. The Chalder Fatigue Scale was used to measure fatigue.
Multivariate logistic regression was applied to determine the risk factors of
fatigue. The findings revealed that approximately 30 per cent of participants
experienced fatigue. Older age (≥75 years: adjusted OR 3.88, 95%
Confidence Interval 2.09–7.18), single marital status (1.94, 1.04–3.62),
unemployed status (1.68, 1.16–2.43), number of self-reported chronic
diseases (≥2 chronic diseases: 2.83, 1.86–4.31), number of individuals’
children (≥4 children: 2.35, 1.33–4.15), hospitalization in the last year (1.61,
1.03–2.52) were all significantly associated with increased risk of fatigue,
while regular exercise (0.46, 0.32–0.65) was a protective factor against
fatigue. The study concluded that fatigue was usual in males and several
factors were associated with the fatigue.
2.2.10. Studies on Marble Industry
Aukor and Al-Qinna (2008) undertook a study to conduct a preliminary
environmental impact assessment at eight marble manufacturing enterprises
distributed in Zarqa Governorate at North-West of the capital city Amman. The
assessment included testing of major chemical and physical environmental
resources, products and byproducts generated from each establishment
according to the production stages and in accordance to the Jordanian
environmental regulations and legislations in force. The results indicated that
noise levels were above the International Standards. The findings on water
and land resources, ornamental waste products; estimated to be around 10
per cent of the prime material consumed; which form a source of

Review of Literature 59
contamination through the unsuitable solid and liquid waste disposal
strategies adopted by the inspected manufacturers.
Conclusion
The review of literature revealed that much efforts has been made to research
area of Musculoskeletal Problems faced by workers in various fields namely
manual material handling, dry wall workers, women construction workers,
brass metal workers within India. The MSD studies conducted outside India
focused on female production assembly workers, bus drivers, crab processing
industry, construction workers, sewing machine workers, oilrigs workers,
textile industry workers.
The researches conducted on postural discomfort experienced focused on
Small scale Industry, sand core making, stone carving workers, In india and
outside India. The researcher while reviewing found related reviews on
postural assessment of stone cutters, health risk assessment of marble
manufacturers and health threats in stone cutters. A number of studies were
also found on the environment of the workplace namely light, noise,
temperature & humidity and vibration. Related review was also found
conducted on Physiological Cost of Work and Perceived Fatigue.
An overview of the researches highlighted that a dearth of researches
conducted on Marble cutting workers focusing on Musculoskeletal Pain and
Postural Discomfort. The environment of the workplace namely workplace
conditions, light, noise, temperature and humidity and vibration need to be
assessed in Indian context. Hence, the researcher was interested in carrying
out an investigation on the topic undertaken.

Review of Literature 60