Chapter 9 - Data Requirements Analysis
19
9 DATA REQUIREMENTS ANALYSIS CHAPTER OUTLINE 9.1 Business Uses of Information and Business Analytics 148 9.2 Business Drivers and Data Dependencies 151 9.3 What Is Data Requirements Analysis? 152 9.4 The Data Requirements Analysis Process 154 9.5 Defining Data Quality Rules 160 9.6 Summary 164 It would be a disservice to discuss organizational data quality management without considering ways of identifying, clarifying, and documenting the collected data requirements from across the application landscape. This need is compounded as there is increased data centralization (such as master data mana- gement, discussed in chapter 19), governance (discussed in chapter 7), and growing organizational data reuse. The last item may be the most complex nut to crack. Since the mid 1990s, when decision support processing and data warehousing activities began to collect and restructure data for new purposes, there has been a burning question: Who is responsible and accountable for ensuring that the quality cha- racteristics expected by all data consumers are met? One approach is that the requirements, which often are trans- lated into availability, data validation, or data cleansing rules, are to be applied by the data consumer. However, in this case, once the data is “corrected” or “cleansed,” it is changed from the orig- inal source and is no longer consistent with that original source. This inconsistency has become the plague of business reporting and analytics, requiring numerous hours spent in reconciling reports from various sources. The alternate approach is to sug- gest that the business process creating the data must apply all the data quality rules. However, this can become a political hot # 2011 Elsevier Inc. All rights reserved. Doi: 10.1016/B978-0-12-373717-5.00009-9 147
-
Upload
independent -
Category
Documents
-
view
2 -
download
0
Transcript of Chapter 9 - Data Requirements Analysis
9
DATA REQUIREMENTSANALYSISCHAPTER OUTLINE9.1 Business Uses of Information and Business Analytics 1489.2 Business Drivers and Data Dependencies 1519.3 What Is Data Requirements Analysis? 1529.4 The Data Requirements Analysis Process 1549.5 Defining Data Quality Rules 1609.6 Summary 164
It would be a disservice to discuss organizational data qualitymanagement without considering ways of identifying, clarifying,and documenting the collected data requirements from acrossthe application landscape. This need is compounded as thereis increased data centralization (such as master data mana-gement, discussed in chapter 19), governance (discussed inchapter 7), and growing organizational data reuse.
The last item may be the most complex nut to crack. Sincethe mid 1990s, when decision support processing and datawarehousing activities began to collect and restructure data fornew purposes, there has been a burning question: Who isresponsible and accountable for ensuring that the quality cha-racteristics expected by all data consumers are met?
One approach is that the requirements, which often are trans-lated into availability, data validation, or data cleansing rules, areto be applied by the data consumer. However, in this case, oncethe data is “corrected” or “cleansed,” it is changed from the orig-inal source and is no longer consistent with that original source.This inconsistency has become the plague of business reportingand analytics, requiring numerous hours spent in reconcilingreports from various sources. The alternate approach is to sug-gest that the business process creating the data must apply allthe data quality rules. However, this can become a political hot
# 2011 Elsevier Inc. All rights reserved.
Doi: 10.1016/B978-0-12-373717-5.00009-9 147
148 Chapter 9 DATA REQUIREMENTS ANALYSIS
potato, because it implies that additional work is to be per-formed by one application team even though the results do notbenefit that team’s direct customers.
That is where data requirements analysis comes into play.Demonstrating that all applications are accountable for makingthe best effort for ensuring the quality of data for all downstreampurposes, and that the organization benefits as a whole whenensuring that those requirements are met, will encourage betteradherence to the types of processes described in this chapter.
The chapter first looks at yet another virtuous cycle, in whichoperational and transactional data is used for business analytics,whose results are streamed back into those same operationalsystems to improve the business processes. The chapter thenprovides an introduction to data requirements analysis andfollows up by walking through a process that can be used toevaluate how downstream analytics applications use data andhow their requirements can be identified and shared withupstream-producing applications. The chapter finishes byreviewing data quality rules defined within the context of thedimensions of data quality described in chapter 8.
9.1 Business Uses of Information andBusiness Analytics
Business intelligence and downstream reporting and analyt-ics center on the collection of operational and transactional dataand its reorganization and aggregation to support reporting andanalyses. Examples are operational reporting, planning and fore-casting, scorecarding and dashboards presenting KPIs, andexploratory analyses seeking new business opportunities. And ifthe objective of these analyses is to optimize aspects of the busi-ness to meet performance targets, the process will need high-quality data and production-ready information flows that pre-serve information semantics even as data is profiled, cleansed,transformed, aggregated, reorganized, and so on. To best benefitfrom a business intelligence and analysis activity, the analystsmust be able to answer these types of questions:• What business process can be improved?• What is the existing baseline for performance?• What are the performance targets?• How must the business process change?• How do people need to change?• How will individuals be incentivized to make those changes?• How will any improvement be measured and reported?
Chapter 9 DATA REQUIREMENTS ANALYSIS 149
• What resources are necessary to support those changes?• What information is needed for these analyses?• Is that information available?• Is the information of suitable quality?
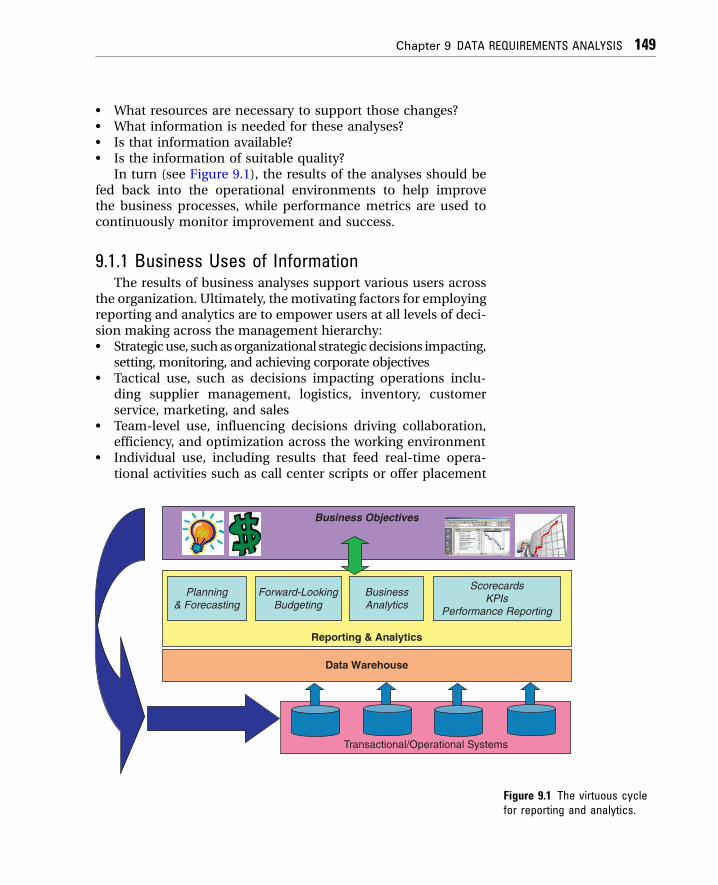
In turn (see Figure 9.1), the results of the analyses should befed back into the operational environments to help improvethe business processes, while performance metrics are used tocontinuously monitor improvement and success.
9.1.1 Business Uses of InformationThe results of business analyses support various users across
the organization. Ultimately, the motivating factors for employingreporting and analytics are to empower users at all levels of deci-sion making across the management hierarchy:• Strategicuse, suchasorganizational strategicdecisions impacting,
setting, monitoring, and achieving corporate objectives• Tactical use, such as decisions impacting operations inclu-
ding supplier management, logistics, inventory, customerservice, marketing, and sales
• Team-level use, influencing decisions driving collaboration,efficiency, and optimization across the working environment
• Individual use, including results that feed real-time opera-tional activities such as call center scripts or offer placement
Reporting & Analytics
Planning& Forecasting
Forward-LookingBudgeting
ScorecardsKPIs
Performance Reporting
BusinessAnalytics
Data Warehouse
Transactional/Operational Systems
Business Objectives
Figure 9.1 The virtuous cyclefor reporting and analytics.
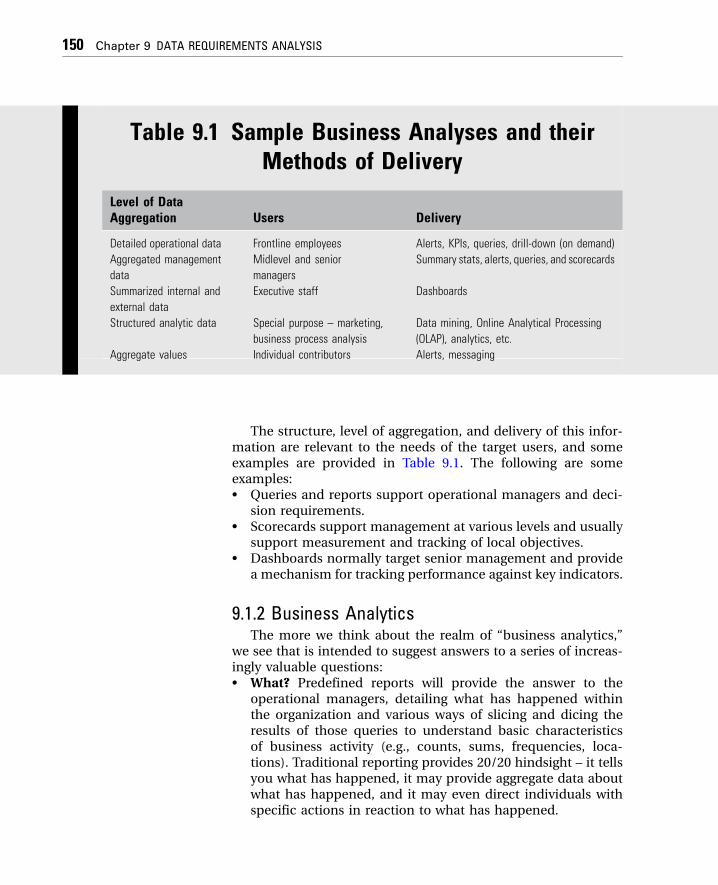
Table 9.1 Sample Business Analyses and theirMethods of Delivery
Level of DataAggregation Users Delivery
Detailed operational data Frontline employees Alerts, KPIs, queries, drill-down (on demand)
Aggregated management
data
Midlevel and senior
managers
Summary stats, alerts, queries, and scorecards
Summarized internal and
external data
Executive staff Dashboards
Structured analytic data Special purpose – marketing,
business process analysis
Data mining, Online Analytical Processing
(OLAP), analytics, etc.
Aggregate values Individual contributors Alerts, messaging
150 Chapter 9 DATA REQUIREMENTS ANALYSIS
The structure, level of aggregation, and delivery of this infor-mation are relevant to the needs of the target users, and someexamples are provided in Table 9.1. The following are someexamples:• Queries and reports support operational managers and deci-
sion requirements.• Scorecards support management at various levels and usually
support measurement and tracking of local objectives.• Dashboards normally target senior management and provide
a mechanism for tracking performance against key indicators.
9.1.2 Business AnalyticsThe more we think about the realm of “business analytics,”
we see that is intended to suggest answers to a series of increas-ingly valuable questions:• What? Predefined reports will provide the answer to the
operational managers, detailing what has happened withinthe organization and various ways of slicing and dicing theresults of those queries to understand basic characteristicsof business activity (e.g., counts, sums, frequencies, loca-tions). Traditional reporting provides 20/20 hindsight – it tellsyou what has happened, it may provide aggregate data aboutwhat has happened, and it may even direct individuals withspecific actions in reaction to what has happened.
Chapter 9 DATA REQUIREMENTS ANALYSIS 151
• Why? More comprehensive ad hoc querying coupled withreview of measurements and metrics within a time seriesenables more focused review. Drilling down through reporteddimensions lets the business client get answers to morepointed questions, such as finding the sources of anyreported issues, or comparing specific performance acrossrelevant dimensions.
• What if? More advanced statistical analysis, data miningmodels, and forecasting models allow business analysts toconsider how different actions and decisions might haveimpacted the results, enabling new ideas for improving thebusiness.
• What next? By evaluating the different options within fore-casting, planning, and predictive models, senior strategistscan weigh the possibilities and make strategic decisions.
• How? By considering approaches to organizational perfor-mance optimization, the C-level managers can adapt busi-ness strategies that change the way the organization doesbusiness.Answering these questions effectively helps determine if
opportunities exist, what information is necessary to exploitthose opportunities, if that information is available and suitable,and most importantly, whether the organization can take advan-tage of those opportunities.
9.2 Business Drivers and Data DependenciesAny reporting, analysis, or other type of business intelligence
activity should be driven from the perspective of adding value tocore areas of business success, and it is worthwhile considering acontext for defining dimensions of value to ensure that the activ-ity is engineered to properly support the business needs. We canconsider these general areas for optimization:• Revenues: identifying new opportunities for growing revenues,
new customer acquisition, increased same-customer sales,and generally increasing profitability
• Cost management: managing expenses and the ways thatindividuals within the organization acquire and utilize corpo-rate resources and assets
• Productivity: maximizing productivity to best match andmeet customer needs and expectations
• Risk and compliance: compliance with governmental, indus-try, or even self-defined standards in a transparent and audit-able manner
152 Chapter 9 DATA REQUIREMENTS ANALYSIS
Organizations seek improvement across these dimensions asa way to maximize profitability, value, and respect in the market.Although there are specific industry examples for exploiting data,there are a number of areas of focus that are common acrossmanydifferent types of businesses, and these “horizontal” analysisapplications suggest opportunities for improvements that can beapplied across the board. For example, all businesses must satisfythe needs of a constituent or customer community, as well assupport internal activities associated with staff management andproductivity, spend analysis, asset management, project mana-gement, and so on. The following are some examples used foranalytics:• Business productivity represents awide array of applications that
focus on resource planning, management, and performance.• Customer analysis applications focus on customer profiling
and segmentation to support targeted marketing efforts.• Vendor analysis applications support supply chainmanagement.• Staff productivity applications focus on tracking and moni-
toring operational performance.• Behavior analysis applications focus on analyzing andmodeling
customer activity and behavior to support fraud detection,customer requirements, product design and delivery, and so on.
9.3 What Is Data Requirements Analysis?Though traditional requirements analysis centers on func-
tional needs, data requirements analysis complements the func-tional requirements process and focuses on the informationneeds, providing a standard set of procedures for identifying,analyzing, and validating data requirements and quality fordata-consuming applications. Data requirements analysis is asignificant part of an enterprise data management program thatis intended to help in:• Articulating a clear understanding of data needs of all con-
suming business processes,• Identifying relevant data quality dimensions associated with
those data needs,• Assessing the quality and suitability of candidate data
sources,• Aligning and standardizing the exchange of data across
systems,• Implementing production procedures for monitoring the
conformance to expectations and correcting data as early aspossible in the production flow, and
Chapter 9 DATA REQUIREMENTS ANALYSIS 153
• Continually reviewing to identify improvement opportunitiesin relation to downstream data needs.During this process, the data quality analyst needs to focus
on identifying and capturing more than just a list of businessquestions that need to be answered. Analysis of system goalsand objectives, along with the results of stakeholder interviews,should enable the analyst to also capture important businessinformation characteristics that will help drive subsequent anal-ysis and design activities: data and information requirementsmust be relevant, must add value, and must be subject toavailability.
9.3.1 RelevanceRelevance is understood in terms of the degree to which the
requirements address one or more business process expectations.For example, data requirements are relevant in support of busi-ness processes when they address a need for conducting normalbusiness transactions and also when they refer to reported per-formance indicators necessary to manage business operationsand performance. Alternatively, data requirements are relevant ifthey answer business questions – data and information thatprovide managers what they need to make operational, tactical,and strategic decisions. In addition, relevance may be reflectedin relation to real-time windows for decision making, leading toreal-time requirements for data provisioning.
9.3.2 Added ValueData requirements reflect added value when they can trace
directly to improvements associated with our business drivers.For example, enabling better visibility of transaction processingand workflow processes helps in monitoring performancemeasures. In turn, ensuring the quality of data that capturestransaction volume and duration can be used to evaluate pro-cesses and identify opportunities for operational efficiencies,whereas data details that feed analysis and reporting used toidentify trends, patterns, and behavior can improve decisionmaking.
9.3.3 AvailabilityEven with well-defined expectations for data requirements,
their utility is limited if the required data is not captured inany available source systems, or if those source systems are not

154 Chapter 9 DATA REQUIREMENTS ANALYSIS
updated and available in time to meet business information anddecision-making requirements. Also, in order to meet the avail-ability expectations, one must be assured that the data can bestructured to support the business information needs.
9.4 The Data Requirements Analysis ProcessThe data requirements analysis process employs a top-down
approach that emphasizes business-driven needs, so the analysisis conducted to ensure the identified requirements are relevantand feasible. The process incorporates data discovery andassessment in the context of explicitly qualified business dataconsumer needs. Having identified the data requirements, can-didate data sources are determined and their quality is assessedusing the data quality assessment process described in chapter11. Any inherent issues that can be resolved immediately areaddressed using the approaches described in chapter 12, andthose requirements can be used for instituting data qualitycontrol, as described in chapter 13.
The data requirements analysis process consists of thesephases:1. Identifying the business contexts2. Conducting stakeholder interviews3. Synthesizing expectations and requirements4. Developing source-to-target mappings
Once these steps are completed, the resulting artifacts arereviewed to define data quality rules in relation to the dimensionsof data quality described in chapter 8.
9.4.1 Identifying the Business ContextsThe business contexts associated with data consumption
and reuse provide the scope for the determination of datarequirements. Conferring with enterprise architects to under-stand where system boundaries intersect with lines of businesswill provide a good starting point for determining how (andunder what circumstances) data sets are used.
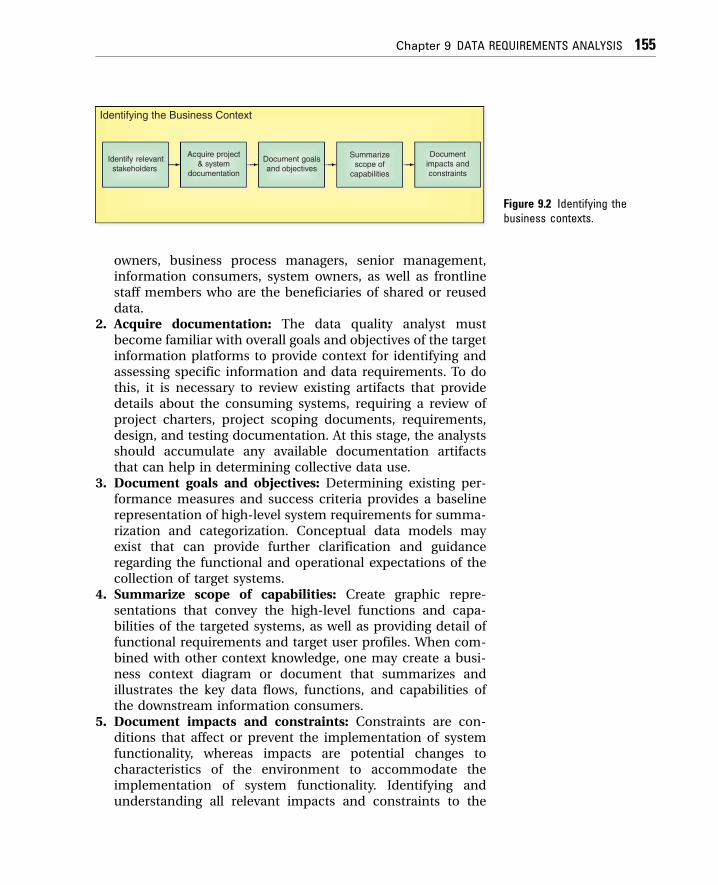
Figure 9.2 shows the steps in this phase of the process:1. Identify relevant stakeholders: Stakeholders may be iden-
tified through a review of existing system documentation ormay be identified by the data quality team throughdiscussions with business analysts, enterprise analysts, andenterprise architects. The pool of relevant stakeholders mayinclude business program sponsors, business application
Identifying the Business Context
Identify relevantstakeholders
Document goalsand objectives
Summarizescope of
capabilities
Documentimpacts andconstraints
Acquire project& system
documentation
Figure 9.2 Identifying thebusiness contexts.
Chapter 9 DATA REQUIREMENTS ANALYSIS 155
owners, business process managers, senior management,information consumers, system owners, as well as frontlinestaff members who are the beneficiaries of shared or reuseddata.
2. Acquire documentation: The data quality analyst mustbecome familiar with overall goals and objectives of the targetinformation platforms to provide context for identifying andassessing specific information and data requirements. To dothis, it is necessary to review existing artifacts that providedetails about the consuming systems, requiring a review ofproject charters, project scoping documents, requirements,design, and testing documentation. At this stage, the analystsshould accumulate any available documentation artifactsthat can help in determining collective data use.
3. Document goals and objectives: Determining existing per-formance measures and success criteria provides a baselinerepresentation of high-level system requirements for summa-rization and categorization. Conceptual data models mayexist that can provide further clarification and guidanceregarding the functional and operational expectations of thecollection of target systems.
4. Summarize scope of capabilities: Create graphic repre-sentations that convey the high-level functions and capa-bilities of the targeted systems, as well as providing detail offunctional requirements and target user profiles. When com-bined with other context knowledge, one may create a busi-ness context diagram or document that summarizes andillustrates the key data flows, functions, and capabilities ofthe downstream information consumers.
5. Document impacts and constraints: Constraints are con-ditions that affect or prevent the implementation of systemfunctionality, whereas impacts are potential changes tocharacteristics of the environment to accommodate theimplementation of system functionality. Identifying andunderstanding all relevant impacts and constraints to the

Cond
care
Figure 9.3 Conductingstakeholder interviews.
156 Chapter 9 DATA REQUIREMENTS ANALYSIS
target systems are critical, because the impacts and con-straints often define, limit, and frame the data controls andrules that will be managed as part of the data quality environ-ment. Not only that, source-to-target mappings may beimpacted by constraints or dependencies associated withthe selection of candidate data sources.The resulting artifacts describe the high-level functions of
downstream systems, and how organizational data is expected tomeet those systems’ needs. Any identified impacts or constraintsof the targeted systems, such as legacy system dependencies,global reference tables, existing standards and definitions, anddata retention policies, will be documented. In addition, thisphase will provide a preliminary view of global reference datarequirements that may impact source data element selectionand transformation rules. Time stamps and organization stan-dards for time, geography, availability and capacity of potentialdata sources, frequency and approaches for data extractions, andtransformations are additional data points for identifying poten-tial impacts and requirements.
9.4.2 Conduct Stakeholder InterviewsReviewing existing documentation only provides a static snap-
shot of what may (or may not) be true about the state of the dataenvironment. A more complete picture can be assembled bycollecting what might be deemed “hard evidence” from the keyindividuals associated with the business processes that use data.Therefore, our next phase (shown in Figure 9.3) is to conduct con-versations with the previously identified key stakeholders, notetheir critical areas of concern, and summarize those concerns asa way to identify gaps to be filled in the form of data requirements.
This phase of the process consists of these five steps:1. Identify candidates and review roles: Review the general
roles and responsibilities of the interview candidates to guideand focus the interview questions within their specific busi-ness process (and associated application) contexts.
uct Stakeholder Interviews
Developinterviewquestions
Schedule &conduct
interviews
Summarize &identify gaps
Resolve gaps &finalize results
Identifyndidates &view roles
Chapter 9 DATA REQUIREMENTS ANALYSIS 157
2. Develop interview questions: The next step in interviewpreparation is to create a set of questions designed to elicitthe business information requirements. The formulation ofquestions can be driven by the context information collectedduring the initial phase of the process. There are two broadcategories of questions – directed questions, which are spe-cific and aimed at gathering details about the functions andprocesses within a department or area, and open-endedquestions, which are less specific and often lead to dialogueand conversation. They are more focused on trying to under-stand the information requirements for operational manage-ment and decision making.
3. Schedule and conduct interviews: Interviews with executivestakeholders should be scheduled earlier, because their timeis difficult to secure. Information obtained during executivestakeholder interviews provides additional clarity regardingoverall goals and objectives and may result in refinement ofsubsequent interviews. Interviews should be scheduled at alocation where the participants will not be interrupted.
4. Summarize and identify gaps: Review and organize the notesfrom the interviews, including the attendees list, generalnotes, and answers to the specific questions. By consideringthe business definitions that were clarified related to variousaspects of the business (especially in relation to knownreference data dimensions, such as time, geography, and reg-ulatory issues), one continues to formulate a fuller determi-nation of system constraints and data dependencies.
5. Resolve gaps and finalize results: Completion of the initialinterview summaries will identify additional questions orclarifications required from the interview candidates. At thatpoint the data quality practitioner can cycle back with theinterviewee to resolve outstanding issues.Once any outstanding questions have been answered, the inter-
view results can be combined with the business context informa-tion (as described in section 9.4.1) to enable the data qualityanalyst to define specific steps and processes for the request forand documentation of business information requirements.
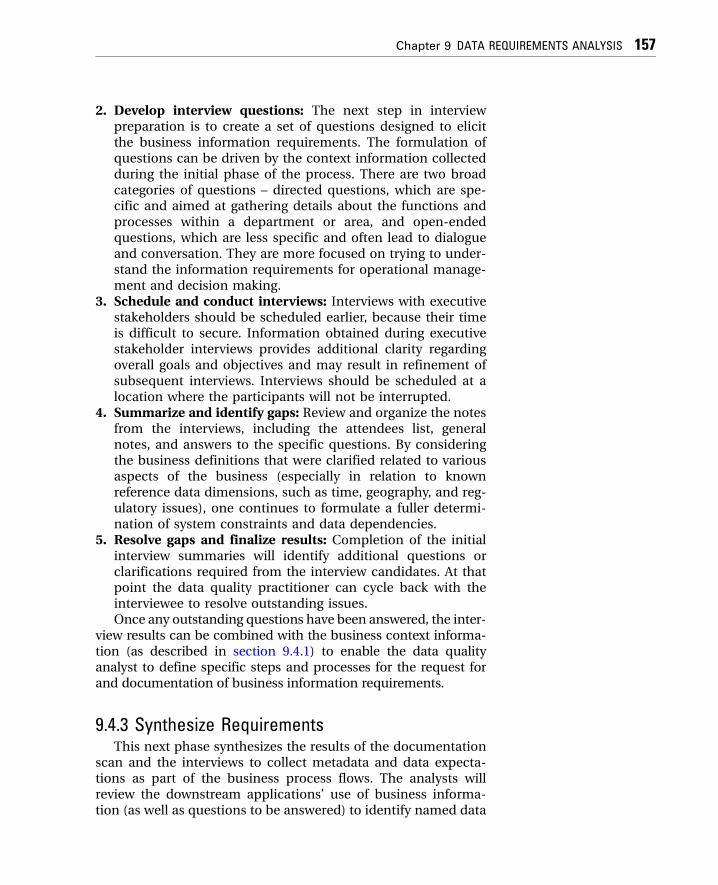
9.4.3 Synthesize RequirementsThis next phase synthesizes the results of the documentation
scan and the interviews to collect metadata and data expecta-tions as part of the business process flows. The analysts willreview the downstream applications’ use of business informa-tion (as well as questions to be answered) to identify named data
Synthesize requirements
Identify requireddata elements
Specify requireddata “facts”
Harmonize dataelement
semantics
Documentinformationworkflow
Figure 9.4 Synthesizing theresults.
158 Chapter 9 DATA REQUIREMENTS ANALYSIS
concepts and types of aggregates, and associated data elementcharacteristics.
Figure 9.4 shows the sequence of these steps:1. Document information workflow: Create an information
flow model that depicts the sequence, hierarchy, and timingof process activities. The goal is to use this workflow to iden-tify locations within the business processes where data qual-ity controls can be introduced for continuous monitoring andmeasurement.
2. Identify required data elements: Reviewing the businessquestions will help segregate the required (or commonlyused) data concepts (party, product, agreement, etc.) fromthe characterizations or aggregation categories (e.g., groupedby geographic region). This drives the determination ofrequired reference data and potential master data items.
3. Specify required facts: These facts represent specific piecesof business information that are tracked, managed, used,shared, or forwarded to a reporting and analytics facility inwhich they are counted or measured (such as quantity or vol-ume). In addition, the data quality analyst must documentany qualifying characteristics of the data that representconditions or dimensions that are used to filter or organizeyour facts (such as time or location). The metadata for thesedata concepts and facts will be captured within a metadatarepository for further analysis and resolution.
4. Harmonize data element semantics: A metadata glossarycaptures all the business terms associated with the businessworkflows, and classifies the hierarchical composition ofany aggregated or analyzed data concepts. Most glossariesmay contain a core set of terms across similar projects alongwith additional project specific terms. When possible, useexisting metadata repositories to capture the approvedorganization definition.The use of common terms becomes a challenge in data
requirements analysis, particularly when common use precludesthe existence of agreed-to definitions. These issues become
Chapter 9 DATA REQUIREMENTS ANALYSIS 159
acute when aggregations are applied to counts of objects thatmay share the same name but don’t really share the same mean-ing. This situation will lead to inconsistencies in reporting, anal-yses, and operational activities, which in turn will lead to lossof trust in data. Harmonization and metadata resolution arediscussed in greater detail in chapter 10.
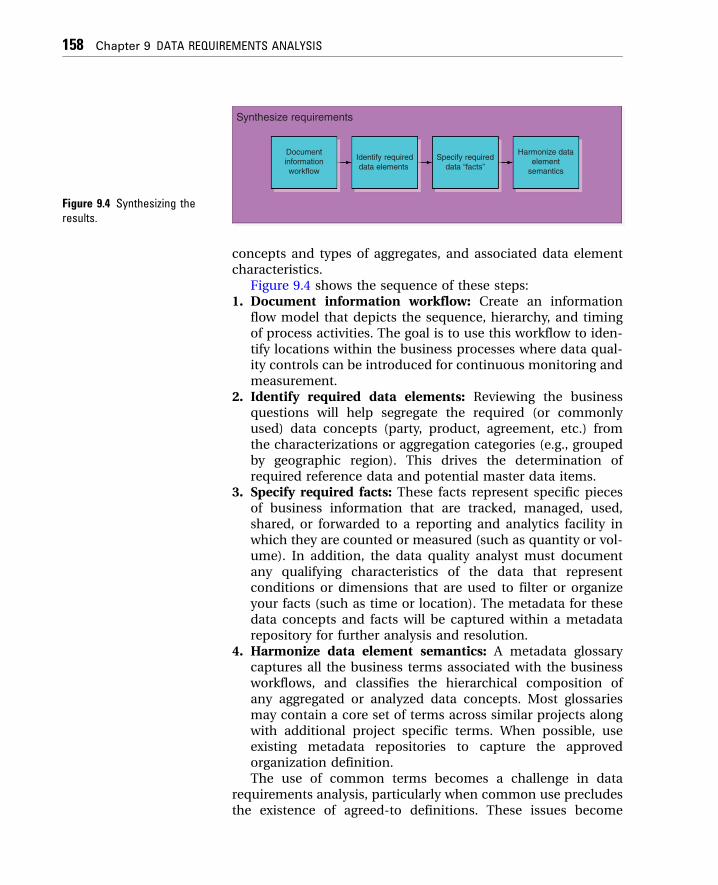
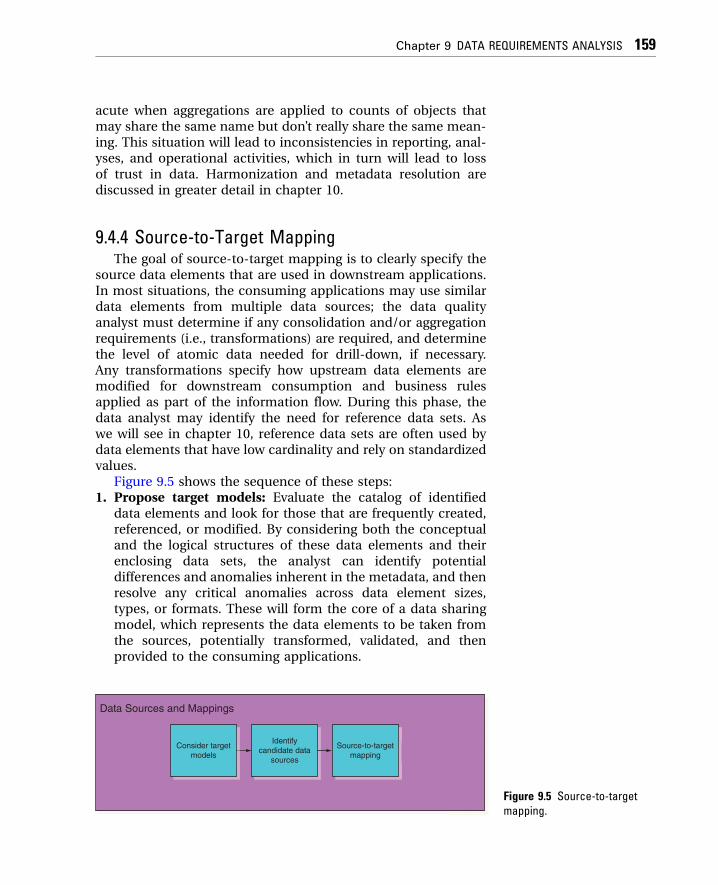
9.4.4 Source-to-Target MappingThe goal of source-to-target mapping is to clearly specify the
source data elements that are used in downstream applications.In most situations, the consuming applications may use similardata elements from multiple data sources; the data qualityanalyst must determine if any consolidation and/or aggregationrequirements (i.e., transformations) are required, and determinethe level of atomic data needed for drill-down, if necessary.Any transformations specify how upstream data elements aremodified for downstream consumption and business rulesapplied as part of the information flow. During this phase, thedata analyst may identify the need for reference data sets. Aswe will see in chapter 10, reference data sets are often used bydata elements that have low cardinality and rely on standardizedvalues.
Figure 9.5 shows the sequence of these steps:1. Propose target models: Evaluate the catalog of identified
data elements and look for those that are frequently created,referenced, or modified. By considering both the conceptualand the logical structures of these data elements and theirenclosing data sets, the analyst can identify potentialdifferences and anomalies inherent in the metadata, and thenresolve any critical anomalies across data element sizes,types, or formats. These will form the core of a data sharingmodel, which represents the data elements to be taken fromthe sources, potentially transformed, validated, and thenprovided to the consuming applications.
Data Sources and Mappings
Identifycandidate data
sources
Source-to-targetmapping
Consider targetmodels
Figure 9.5 Source-to-targetmapping.
160 Chapter 9 DATA REQUIREMENTS ANALYSIS
2. Identify candidate data sources: Consult the data manage-ment teams to review the candidate data sources containingthe identified data elements, and review the collection of datafacts needed by the consuming applications. For each fact,determine whether it corresponds to a defined data conceptor data element, exists in any data sets in the organization,or is a computed value (and if so, what are the data elementsthat are used to compute that value), and then documenteach potential data source.
3. Develop source-to-target mappings: Because this analysisshould provide enough input to specify which candidate datasources can be extracted, the next step is to consider how thatdata is to be transformed into a common representationthat is then normalized in preparation for consolidation.The consolidation processes collect the sets of objects andprepare them for populating the consuming applications.During this step, the analysts enumerate which source dataelements contribute to target data elements, specify thetransformations to be applied, and note where it relies onstandardizations and normalizations revealed during earlierstages of the process.
9.5 Defining Data Quality RulesFinally, given these artifacts:
• Candidate source system list, including overview, contactinformation, and notes;
• Business questions and answers from stakeholder interviews;• Consolidated list of business facts consumed by downstream
applications;• Metadata and reference data details;• Source-to-extract mapping with relevant rules; and• Data quality assessment results,
the data quality analyst is ready to employ the results of thisdata requirements analysis to define data quality rules.
9.5.1 Data Quality AssessmentAs has been presented in a number of ways so far, recall that
to effectively and ultimately address data quality, we must beable to manage the following:• Identify business client data quality expectations• Define contextual metrics• Assess levels of data quality• Track issues for process management
Chapter 9 DATA REQUIREMENTS ANALYSIS 161
• Determine best opportunities for improvement• Eliminate the sources of problems• Continuously measure improvement against baseline
This process is the next step of data requirements analysis,which concentrates on defining rules for validating the qualityof the potential source systems and determines their degree ofsuitability to meet the business needs.
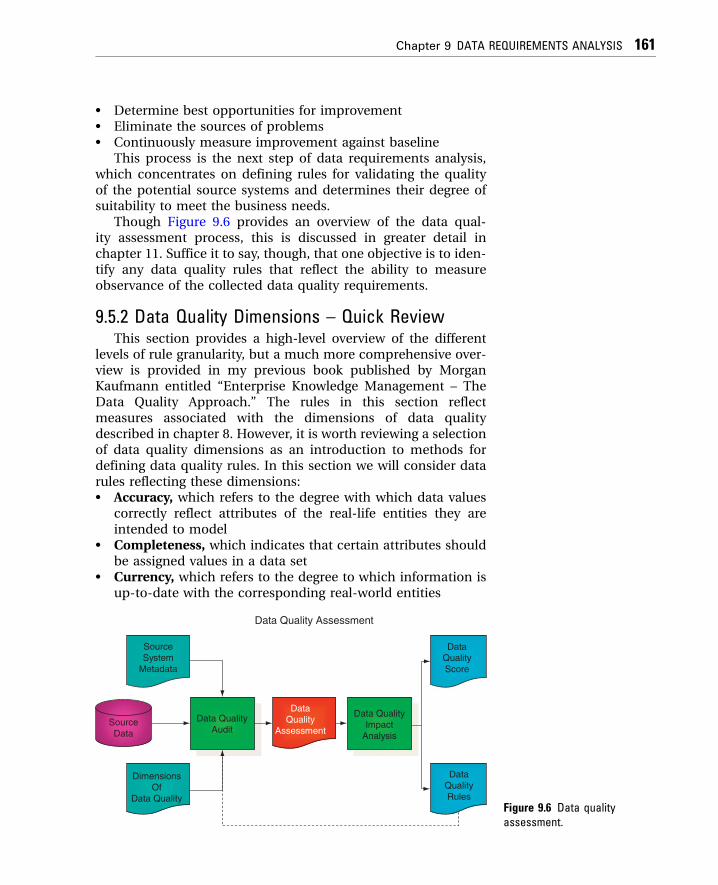
Though Figure 9.6 provides an overview of the data qual-ity assessment process, this is discussed in greater detail inchapter 11. Suffice it to say, though, that one objective is to iden-tify any data quality rules that reflect the ability to measureobservance of the collected data quality requirements.
9.5.2 Data Quality Dimensions – Quick ReviewThis section provides a high-level overview of the different
levels of rule granularity, but a much more comprehensive over-view is provided in my previous book published by MorganKaufmann entitled “Enterprise Knowledge Management – TheData Quality Approach.” The rules in this section reflectmeasures associated with the dimensions of data qualitydescribed in chapter 8. However, it is worth reviewing a selectionof data quality dimensions as an introduction to methods fordefining data quality rules. In this section we will consider datarules reflecting these dimensions:• Accuracy, which refers to the degree with which data values
correctly reflect attributes of the real-life entities they areintended to model
• Completeness, which indicates that certain attributes shouldbe assigned values in a data set
• Currency, which refers to the degree to which information isup-to-date with the corresponding real-world entities
Data Quality Assessment
SourceSystem
Metadata
DimensionsOf
Data Quality
Data QualityImpact
Analysis
DataQuality
AssessmentData Quality
Audit
DataQualityRules
DataQualityScore
SourceData
Figure 9.6 Data qualityassessment.
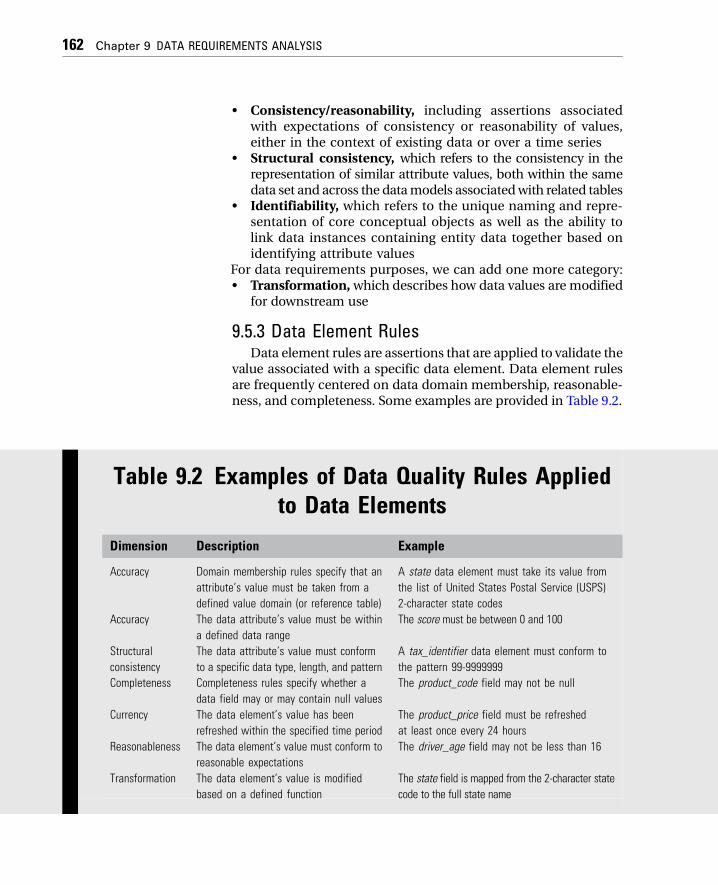
Table 9.2 Ex
Dimension Descri
Accuracy Domain
attribute
defined
Accuracy The dat
a define
Structural
consistency
The dat
to a spe
Completeness Comple
data fie
Currency The dat
refreshe
Reasonableness The dat
reasona
Transformation The dat
based o
162 Chapter 9 DATA REQUIREMENTS ANALYSIS
• Consistency/reasonability, including assertions associatedwith expectations of consistency or reasonability of values,either in the context of existing data or over a time series
• Structural consistency, which refers to the consistency in therepresentation of similar attribute values, both within the samedata set and across the datamodels associatedwith related tables
• Identifiability, which refers to the unique naming and repre-sentation of core conceptual objects as well as the ability tolink data instances containing entity data together based onidentifying attribute values
For data requirements purposes, we can add one more category:• Transformation,which describes how data values are modified
for downstream use
9.5.3 Data Element RulesData element rules are assertions that are applied to validate the
value associated with a specific data element. Data element rulesare frequently centered on data domain membership, reasonable-ness, and completeness. Some examples are provided in Table 9.2.
amples of Data Quality Rules Appliedto Data Elements
ption Example
membership rules specify that an
’s value must be taken from a
value domain (or reference table)
A state data element must take its value from
the list of United States Postal Service (USPS)
2-character state codes
a attribute’s value must be within
d data range
The score must be between 0 and 100
a attribute’s value must conform
cific data type, length, and pattern
A tax_identifier data element must conform to
the pattern 99-9999999
teness rules specify whether a
ld may or may contain null values
The product_code field may not be null
a element’s value has been
d within the specified time period
The product_price field must be refreshed
at least once every 24 hours
a element’s value must conform to
ble expectations
The driver_age field may not be less than 16
a element’s value is modified
n a defined function
The state field is mapped from the 2-character state
code to the full state name
Chapter 9 DATA REQUIREMENTS ANALYSIS 163
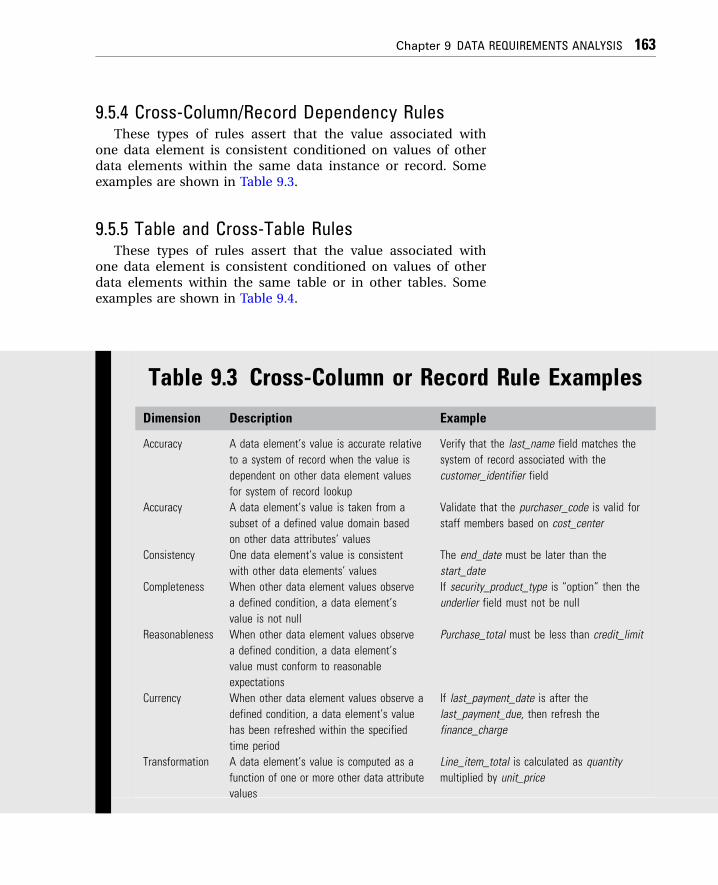
9.5.4 Cross-Column/Record Dependency RulesThese types of rules assert that the value associated with
one data element is consistent conditioned on values of otherdata elements within the same data instance or record. Someexamples are shown in Table 9.3.
9.5.5 Table and Cross-Table RulesThese types of rules assert that the value associated with
one data element is consistent conditioned on values of otherdata elements within the same table or in other tables. Someexamples are shown in Table 9.4.
Table 9.3 Cross-Column or Record Rule Examples
Dimension Description Example
Accuracy A data element’s value is accurate relative
to a system of record when the value is
dependent on other data element values
for system of record lookup
Verify that the last_name field matches the
system of record associated with the
customer_identifier field
Accuracy A data element’s value is taken from a
subset of a defined value domain based
on other data attributes’ values
Validate that the purchaser_code is valid for
staff members based on cost_center
Consistency One data element’s value is consistent
with other data elements’ values
The end_date must be later than the
start_date
Completeness When other data element values observe
a defined condition, a data element’s
value is not null
If security_product_type is “option” then the
underlier field must not be null
Reasonableness When other data element values observe
a defined condition, a data element’s
value must conform to reasonable
expectations
Purchase_total must be less than credit_limit
Currency When other data element values observe a
defined condition, a data element’s value
has been refreshed within the specified
time period
If last_payment_date is after the
last_payment_due, then refresh the
finance_charge
Transformation A data element’s value is computed as a
function of one or more other data attribute
values
Line_item_total is calculated as quantity
multiplied by unit_price
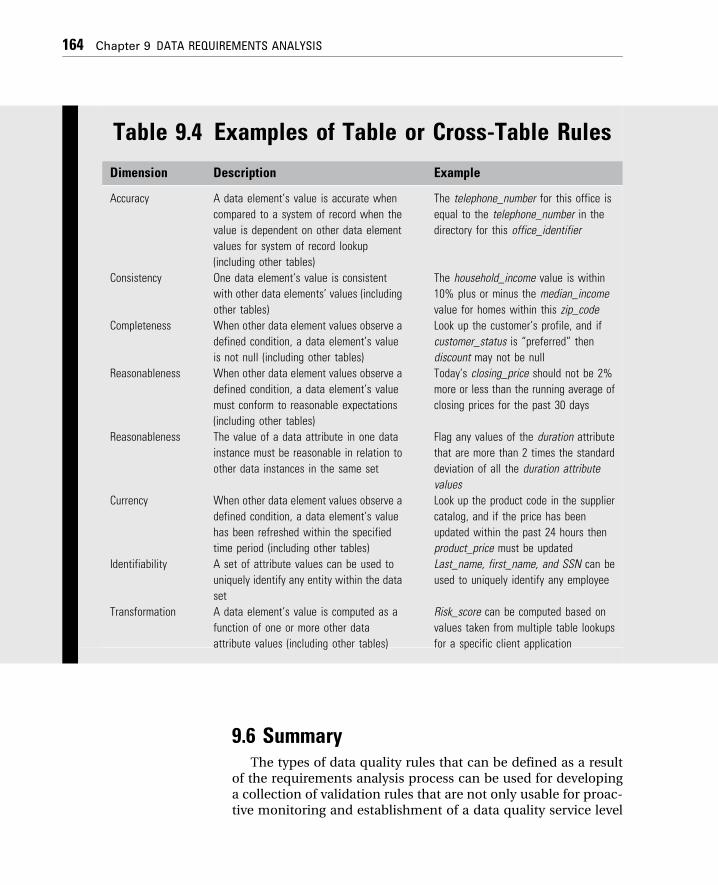
Table 9.4 Examples of Table or Cross-Table Rules
Dimension Description Example
Accuracy A data element’s value is accurate when
compared to a system of record when the
value is dependent on other data element
values for system of record lookup
(including other tables)
The telephone_number for this office is
equal to the telephone_number in the
directory for this office_identifier
Consistency One data element’s value is consistent
with other data elements’ values (including
other tables)
The household_income value is within
10% plus or minus the median_income
value for homes within this zip_code
Completeness When other data element values observe a
defined condition, a data element’s value
is not null (including other tables)
Look up the customer’s profile, and if
customer_status is “preferred” then
discount may not be null
Reasonableness When other data element values observe a
defined condition, a data element’s value
must conform to reasonable expectations
(including other tables)
Today’s closing_price should not be 2%
more or less than the running average of
closing prices for the past 30 days
Reasonableness The value of a data attribute in one data
instance must be reasonable in relation to
other data instances in the same set
Flag any values of the duration attribute
that are more than 2 times the standard
deviation of all the duration attribute
values
Currency When other data element values observe a
defined condition, a data element’s value
has been refreshed within the specified
time period (including other tables)
Look up the product code in the supplier
catalog, and if the price has been
updated within the past 24 hours then
product_price must be updated
Identifiability A set of attribute values can be used to
uniquely identify any entity within the data
set
Last_name, first_name, and SSN can be
used to uniquely identify any employee
Transformation A data element’s value is computed as a
function of one or more other data
attribute values (including other tables)
Risk_score can be computed based on
values taken from multiple table lookups
for a specific client application
164 Chapter 9 DATA REQUIREMENTS ANALYSIS
9.6 SummaryThe types of data quality rules that can be defined as a result
of the requirements analysis process can be used for developinga collection of validation rules that are not only usable for proac-tive monitoring and establishment of a data quality service level
Chapter 9 DATA REQUIREMENTS ANALYSIS 165
agreement (as is discussed in chapter 13), but can also beintegrated directly into any newly developed applications whenthere is an expectation that application will be used down-stream. Integrating this data requirements analysis practice intothe organization’s system development life cycle (SDLC) will leadto improved control over the utility and quality of enterprisedata assets.