Chapter 6: Ecology of the Everglades Protection Area
57
2007 South Florida Environmental Report Chapter 6 Chapter 6: Ecology of the Everglades Protection Area Fred Sklar, Pinar Balci, Eric Cline, Mark Cook, Bill Cooper, Carlos Coronado, Chris Edelstein, Michelle Ferree, Carl Fitz, Mary Ann Furedi, Brian Garrett, Dale Gawlik, Ben Gu, Scot Hagerthey, Mac Kobza, ShiLi Miao, Sue Newman, Bill Orem, Janise Palmer, Ken Rutchey, Erik Sindhoj, Cassondra Thomas, John Volin and Naiming Wang SUMMARY The studies and findings discussed in this chapter of the 2007 South Florida Environmental Report – Volume I are presented within four main fields: (1) wildlife ecology, (2) plant ecology, (3) ecosystem ecology, and (4) landscape ecology. Table 6-1 provides a summary of current Everglades research in relation to objectives, operational mandates, and restoration performance measures. Programs of study were based on the short-term operational needs and long-term restoration goals of the South Florida Water Management District (SFWMD or District) including large-scale and regional hydrologic needs in relation to regulation schedules, permitting, the Everglades Forever Act mandates, and the Comprehensive Everglades Restoration Plan. Wildlife Ecology Monitoring of wading bird nesting success is a coordinated effort among the District, Everglades National Park, Florida Fish and Wildlife Conservation Commission, University of Florida, Florida Atlantic University, Florida Department of Environmental Protection, Solid Waste Authority of Palm Beach County, National Audubon Society, and U.S. Fish and Wildlife Service. Each year, this coordination results in the production of the Annual Wading Bird Report. In the report, the number of wading bird nests in South Florida in Water Year 2006 (WY 2006) (May 1, 2005 through April 30, 2006), was conservatively estimated at 54,634. This number represented a 71 percent increase in wading bird nests from the WY2005 season and a 20 percent decrease from WY2002, which was the best nesting year on record in South Florida since the 1940s. The WY2006 estimate is relatively high compared to the average of recent decades, and is in accord with the generally rising trend in annual numbers of wading bird nests recorded since WY1999. High nesting success was attributed to excellent hydrology, as 0.1 foot per week recession rates were maintained for long periods of time over large areas. In WY2006, a three-year experiment was begun to evaluate how supplementary feeding of white ibis (Eudocimus albus) nestlings can affect nestling fitness, behavior, and parental provisioning responses and to test hypotheses associated with the direct impacts of a limited food supply on wading bird population restoration and sustainability. This observational approach will establish a causal relationship between hydrology, food supply, and breeding success. 6-1
-
Upload
independent -
Category
Documents
-
view
0 -
download
0
Transcript of Chapter 6: Ecology of the Everglades Protection Area

2007 South Florida Environmental Report Chapter 6
Chapter 6: Ecology of the Everglades Protection Area
Fred Sklar, Pinar Balci, Eric Cline, Mark Cook, Bill Cooper, Carlos Coronado, Chris Edelstein, Michelle Ferree, Carl Fitz,
Mary Ann Furedi, Brian Garrett, Dale Gawlik, Ben Gu, Scot Hagerthey, Mac Kobza, ShiLi Miao, Sue Newman, Bill Orem, Janise Palmer, Ken Rutchey, Erik Sindhoj, Cassondra Thomas, John Volin and Naiming Wang
SUMMARY
The studies and findings discussed in this chapter of the 2007 South Florida Environmental Report – Volume I are presented within four main fields: (1) wildlife ecology, (2) plant ecology, (3) ecosystem ecology, and (4) landscape ecology. Table 6-1 provides a summary of current Everglades research in relation to objectives, operational mandates, and restoration performance measures. Programs of study were based on the short-term operational needs and long-term restoration goals of the South Florida Water Management District (SFWMD or District) including large-scale and regional hydrologic needs in relation to regulation schedules, permitting, the Everglades Forever Act mandates, and the Comprehensive Everglades Restoration Plan.
Wildlife Ecology
Monitoring of wading bird nesting success is a coordinated effort among the District, Everglades National Park, Florida Fish and Wildlife Conservation Commission, University of Florida, Florida Atlantic University, Florida Department of Environmental Protection, Solid Waste Authority of Palm Beach County, National Audubon Society, and U.S. Fish and Wildlife Service. Each year, this coordination results in the production of the Annual Wading Bird Report. In the report, the number of wading bird nests in South Florida in Water Year 2006 (WY 2006) (May 1, 2005 through April 30, 2006), was conservatively estimated at 54,634. This number represented a 71 percent increase in wading bird nests from the WY2005 season and a 20 percent decrease from WY2002, which was the best nesting year on record in South Florida since the 1940s. The WY2006 estimate is relatively high compared to the average of recent decades, and is in accord with the generally rising trend in annual numbers of wading bird nests recorded since WY1999. High nesting success was attributed to excellent hydrology, as 0.1 foot per week recession rates were maintained for long periods of time over large areas.
In WY2006, a three-year experiment was begun to evaluate how supplementary feeding of white ibis (Eudocimus albus) nestlings can affect nestling fitness, behavior, and parental provisioning responses and to test hypotheses associated with the direct impacts of a limited food supply on wading bird population restoration and sustainability. This observational approach will establish a causal relationship between hydrology, food supply, and breeding success.
6-1

Chapter 6 Volume I: The South Florida Environment
WY2006 also brought the initiation of a pilot isotope study to follow carbon and nitrogen through the periphyton food web, toward determining why the Everglades’ stock of invertebrates and fish is surprisingly low despite a relatively high periphyton standing crop. Common methods used to establish linkages within or to trace carbon flow through the Everglades food web have proven to be difficult and often yield contradictory or ambiguous results. This pilot study, testing a new pulse-chase approach, accurately measured high nutrient turnover rates that were regulated by the plant and periphyton community to a large degree.
Plant Ecology
Previous Everglades Consolidated Reports discussed how plants allocate biomass, hydrologic tolerances, competition for nutrients, and physiological mechanisms under various soil and water conditions. The District is beginning to use this better understanding of plant processes and tolerances at its weekly operational meetings where issues of water supply, flood control, and environmental restoration are discussed. Consequently, the final results of a seedling experiment at the Loxahatchee Impoundment Landscape Assessment (LILA) may be critical for restoration of tree islands because it indicated that drought is more harmful than flooding and that only three species of trees – pond apple (Annona glabra), dahoon holly (Ilex cassine), and willow (Salix caroliniana) – are resistant to both perturbations.
To assess the effects of Hurricane Wilma on the District’s five long-term study islands located in WCA-3A, several aboveground biological parameters were measured in 2002 and, again, six months after Hurricane Wilma within permanent 10 m by 10 m vegetation plots. After the hurricane the basal area and density decreased on the head of tree islands that were dominated by hammock species, such as Bursera simaruba, I. cassine, Myrica cerifera, and Chrysobalanus icaco. The largest difference between pre- and post- average basal area (44 percent) occurred in the head of 3AS4, which also experienced a complete loss of two out of five species (Persea borbonia and B. simaruba) and a decrease in basal area by all but one species (S. caroliniana).
A new program to better understand invasive and exotic species is in its second year of development. To understand better the ecology and spread of Lygodium microphyllum across South Florida’s landscape, two projects were initiated in 2005 in collaboration with Florida Atlantic University. The first project, Detailed Lygodium microphyllum Assessment in the Everglades Protection Area, has the objective of determining the distribution of Lygodium microphyllum on tree islands in central and southern Water Conservation Area 3A (WCA-3A). The second project, Lygodium microphyllum: Functional Basis for Geographical Variation, investigates the environmental factors that affect the growth and spread of Lygodium in both its native range and its invaded Florida habitats. In terms of invasive cattail, recent genetic research (i.e., DNA sequences of protein-coding genes) by the District, in collaboration with Florida Atlantic University, examined the intraspecific genetic variations (i.e., DNA polymorphism) of Typha domingensis and compared its differences with published sequences for other Typha species including T. latifolia to identify possible presence of hybrid cattail plants. One unique population of T. domingensis was identified as having nuclear genes polymorphic to both T. latifolia and all other populations of T. domingensis studied, raising the possibility that these plants might be a hybrid of unknown origins.
6-2

2007 South Florida Environmental Report Chapter 6
Ecosystem Ecology
Previous consolidated reports have indicated that the downstream impacts of Stormwater Treatment Areas 2 and 5 have increased hydroperiods, water depths, and more desirable plant species. This trend has continued, doubling the mean water depth from 0.4 to 0.8 foot due to inflow restoration and better management of the G-402 outflow structure in the Rotenberger Wildlife Management Area. However, further operational guidelines will be needed for the SFWMD to prevent the large-scale peat fires that occurred this past dry season in this management area.
The first year of a two-year study to develop an approach to measure floc transport was completed. Floc is an easily resuspended, very low density, unconsolidated, almost purely organic material that is composed of living and dead algal material, as well as bacteria and decaying plant matter. An understanding of the fate and distribution of floc is essential for restoring and maintaining an appropriate flow velocity in the Everglades. Results indicated that floc transport dynamics could be studied with a benthic annular flume and tracers that are hydraulically matched to Everglades floc.
Also, this past water year, a collaboration with the U.S. Geological Survey and Florida State University to analyze tree island cores for evidence of significant nutrient inputs from wading birds produced some encouraging results. The results suggested that some organic compounds are relatively stable in Everglades sediments and can serve as biomarkers to indicate the historic distribution of wading bird populations.
Finally, two new large-scale manipulations of the cattail communities in the impacted regions of WCA-2A began in WY2006: the Fire Project and the Cattail Habitat Improvement Project. Both will be reported in this chapter and in consolidated reports for the next three years. The Fire Project uses controlled burns to remove cattails. The project uses herbicides to maintain slough-like openings to increase wildlife utilization.
Landscape Ecology
The District is continuing to observe the total hydro-biogeochemical system of the Everglades Protection Area. For WY2005, the District updated the spatial analysis of the upper 30 centimeters of soil across the entire Everglades, presented a grid-based vegetation mapping project for WCA-2A, and completed construction of 31 new Class B benchmarks in the interior of WCA-3. During WY2006, those benchmarks were used to estimate tree island elevations and are presented for the first time on decadal scale landscape changes.
6-3

Chapter 6 Volume I: The South Florida Environment
Table 6-1. Summary of current Everglades research in relation to objectives, operational mandates, and restoration performance measures (2004 Consolidated
Everglades Restoration Plan Monitoring and Assessment Plan: Part 1).
Project Objectives Operational Mandates
Restoration Performance
Measures
Wildlife Ecology Wading Bird Monitoring
Assess recovery of pre-drainage wading bird nesting patterns
Support of regulation schedules, hydrologic criteria, and Minimum Flows and Levels (MFLs)
Timing of breeding, number of nests, and location of nesting colonies within the Everglades
Food Limitation on Wading Bird Reproductive Success
Define food supply limits and determine food limitation as a function of hydrology
Support of regulation schedules, hydrologic criteria, and MFLs
Nesting success
Stable Isotope Pulse Chase Experiment
Investigate novel approach to determine carbon flow and test assumption that periphyton is the base of the food web
Effects of nutrient imbalance on food webs and support of Everglades Forever Act (EFA)
Trophic relationships: periphyton production and composition
Plant Ecology LILA Tree Seedlings
Assess hydrologic requirements for recruitment of tree island species
Support of regulation schedules, hydrologic criteria, and MFLs
Ridge and slough sustainability
Tree Island Structure
Assess the effects of Hurricane Wilma on tree island composition.
Effects of disturbance combined with regulation schedules
Ridge and slough sustainability
Invasive Exotics Baseline characterization of spreading mechanisms
Vegetation management
Preserve and restore natural wetland vegetation mosaics
Ecosystem Ecology Sediment Flux Quantification of threshold
hydrologic velocities that cause particulate transport.
Support of regulation schedules, hydrologic criteria, and MFLs
Ridge and slough sustainability and peat accretion
Wading Bird Biomarkers on Tree Islands
Find a wading bird chemical signature that can be used to track historical distributions and refine distribution targets.
Tree island sustainability and wading bird nesting patterns
Restoration Downstream of Stormwater Treatment Areas (STAs)
Monitor vegetation responses over time in relation to soil and water quality
EFA Permits No. 0126704 and No. 0131842
Preserve and restore natural wetland vegetation mosaics and maintain low total phosphorus (TP) concentrations
6-4

2007 South Florida Environmental Report Chapter 6
Table 6-1. Continued.
Project Objectives Operational Mandates
Restoration Performance
Measures
Ecosystem Ecology (continued) Accelerated Recovery of Impacted Wetlands in Water Conservation Area 2A (WCA-2A)
CHIP Experiment: Assess the sustainability of created openings on the development of desirable slough habitat, increased use by wading birds, and a return to low nutrient conditions FIRE Experiment: Assess the sustainability of multiple fires to convert cattail habitat into sawgrass habitat and return to low nutrient conditions
The EFA: Long-Term Plan
Preserve and restore natural wetland vegetation mosaics, and minimize TP flux
Landscape Ecology Tree Island Elevations
Create a map of tree island elevations in terms of both absolute height above sea level and relative height above the surrounding marshes
Support of regulation schedules, hydrologic criteria, and MFLs
Tree island sustainability and peat accretion
Historic Tree Island Changes
Assess structural and operational influences on tree island degradation patterns
Support of regulation schedules, hydrologic criteria, and MFLs
Tree island sustainability and restoration
6-5

Chapter 6 Volume I: The South Florida Environment
INTRODUCTION
Drainage of the Everglades changed South Florida from a subtropical wetland to a human-dominated landscape with a strong retirement, tourism, and agricultural economy. As a result, the Everglades is half its original size, water tables have dropped, hydroperiods have been altered, flows have been diverted, wetlands have been impounded, wildlife has been reduced, water quality has been degraded, and habitats have been invaded by nonindigenous plants and animals. All of these impacts were caused directly or indirectly by an altered hydrology. Previous reviews of the ecological impacts of altered hydrology in the Everglades have greatly increased public and scientific awareness of problems associated with altered hydrologic regimes and drainage. This chapter will update this natural history by highlighting some of the recent research findings and experimental programs sponsored by the South Florida Water Management District (SFWMD or District) in collaboration with the following universities, corporations and agencies: Florida Atlantic University (FAU), Florida International University (FIU), Florida State University (FSU), University of Florida (UF), Solid Waste Authority of Palm Beach County. the Florida Department of Environmental Protection (FDEP), Everglades National Park (ENP or Park), Florida Fish and Wildlife Conservation Commission (FWC), U.S. Fish and Wildlife Service (USFWS), U.S. Geological Survey (USGS), Partrac Ltd., and the National Audubon Society.
Direct cause and effect relationships between altered drainage and ecosystem disturbance are not always easily identified. It is difficult because a long period of record is needed to filter changes due to climatic variability, and many factors are associated with an altered hydrologic regime. Wetland ecologists globally recognized that source, timing, duration, and depth of water influence biogeochemical processes in soils and water, physiological processes of plant growth and decomposition, and reproduction and migration of fauna. In turn, soils, plants, and animals affect the hydrology. These ecological feedbacks allow for self-organization and succession. The decreased extent of the Everglades and surrounding uplands, changes in the soil and topography, presence of exotic species, and the current system of canals and levees all constitute as constraints on restoration. The challenge facing science and society is to determine how to manage the hydrology and land-use runoff to restore key ecological driving forces. Through biological monitoring and research, the District’s Everglades Division is actively developing and evaluating bioindicators to characterize the current status of the Everglades and to allow for tracking and predicting significant changes that may result with respect to ecosystem management or restoration. The ultimate goal is to convey biologically derived information that can be used for environmental decision making.
HYDROLOGIC PATTERNS FOR WATER YEAR 2006
The amount of rain in Water Year 2006 (WY2006) (May 1, 2005 through April 30, 2006) was 11–12 inches greater than last year. The rainfall and associated stage readings for WY2006 are shown in Table 6-2. Most of the rain fell during June 2005, ranging from 11 to 16 inches in Water Conservation Area 1 and 3A (WCA-1 and WCA-3A), respectively. For the rest of the water year, rainfall patterns were consistent across the Everglades Protection Area (EPA). That is, about 6 inches of rain per month from July 2005 through November 2005, and 1 to 2 inches of rain per month from November 2005 through July 2006. Rainfall was slightly below average in the northern part of the Everglades and slightly above average in the southern part of the system. Like an average rainfall water year, the 2006 hydrologic stage conditions were also average throughout most of the system. Climatic events that had the potential to affect wading birds and/or their prey included Tropical Storm Katrina on August 25, followed by Hurricane Wilma
6-6

2007 South Florida Environmental Report Chapter 6
(Category 3) on October 25. However, neither were major rainmakers and as a result, none of the EPA hydrographs indicate any stage impacts.
Table 6-2. Average, minimum, and maximum stage (feet National Geodetic Vertical Datum 1929) and total annual rainfall (inches) for Water Year 2006
(WY2006) in comparison to historical stage and rainfall.1 (Note: Average depths calculated by subtracting elevation from stage.)
Area WY2006 Rainfall
Historic Rainfall
WY2006 Stage Mean
(min; max)
Historic Stage Mean
(min; max) Elevation
WCA-1 47.96 51.96 16.18 (15.17; 16.87) 15.58 (10.0; 18.38) 15.1
WCA-2 47.96 51.96 12.62 (10.84; 14.27) 12.57 (9.33; 15.64) 11.2
WCA-3 53.39 51.37 10.58 (8.95; 11.72) 9.54 (4.78; 12.79) 8.2
ENP 57.27 55.22 6.65 (5.47; 7.59) 5.96 (2.01; 8.08) 5.1
1 See Chapter 2 of this volume for a more detailed description of rain, stage, inflows, outflows, and historical data.
The following hydropattern figures highlight the average stage changes in each of the WCAs for the last 1.5 years in relation to the regulation schedule, flooding tolerances for tree islands, drought tolerances for wetland peat, and recession rates and depths that support both nesting initiation and foraging success by wading birds. These indices were used by the District to facilitate weekly operational discussions and decisions. Tree island flooding tolerances are considered exceeded when depths on the islands are greater than 1 foot for more than 120 days (Wu and Sklar, 2002). Drought tolerances are considered exceeded when water levels are greater than 1 foot below ground for more than 30 days, i.e., the criteria for Minimum Flows and Levels in the Everglades (SFWMD, 2000). Figures 6-1 through 6-4 show the ground elevations in the WCAs as the threshold for peat conservation. The wading bird nesting period is divided into three simple categories (red, yellow, and green) based upon foraging observations in the Everglades (Gawlik, 2002). A red label indicates poor conditions due to recession rates that are too fast (greater than 0.6 ft/wk) or too slow (less than 0.04 foot for more than two weeks). A red label is also given when the average depth change for the week is positive rather than negative. A yellow label indicates fair conditions due to a slow recession rate of 0.04 foot for a week or a rapid recession between 0.17 and 0.6 ft/wk. A green label indicates good conditions and is assigned when water depth decreased between 0.05 and 0.16 ft/wk. Although these labels are not indicative of an appropriate depth for foraging, they have been useful during high water conditions to highlight recession rates that can lead to good foraging depths toward the end of the dry season (i.e., April and May).
6-7

Chapter 6 Volume I: The South Florida Environment
Water Conservation Area 1
In WY2005, during the critical wading bird foraging and nesting period from March through April, dramatic reversals occurred and rainfall increased depths up to 1.5 feet (Figure 6-1). Despite the March 2005 reversals, WCA-1 had the longest duration of good nesting and foraging periods of any region in the EPA during the WY2005 dry season. During WY2006, good nesting and foraging periods were substantially improved due to favorable hydrologic conditions. Water levels in WCA-1 were below the established regulation schedule during most of WY2006. As a result, upper tolerances levels were never reached, recession rates were steady, and minor reversals occurred only twice during the entire nesting season.
Figure 6-1. Hydrology in Water Conservation Area 1 (WCA-1) in relation to the regulation schedule and indices for tree islands, peat conservation, and
wading bird foraging. “Good” indicates a spring-time hydrologic recession most conducive for wading bird foraging (between 0.05 ft and 0.16 ft/wk); “Fair” indicates a recession between 0.17 ft and 0.6 ft/wk; and “Bad” indicates a
recession rate of >0.6 ft/wk or <0.04 ft/wk.
6-8
2007 South Florida Environmental Report Chapter 6
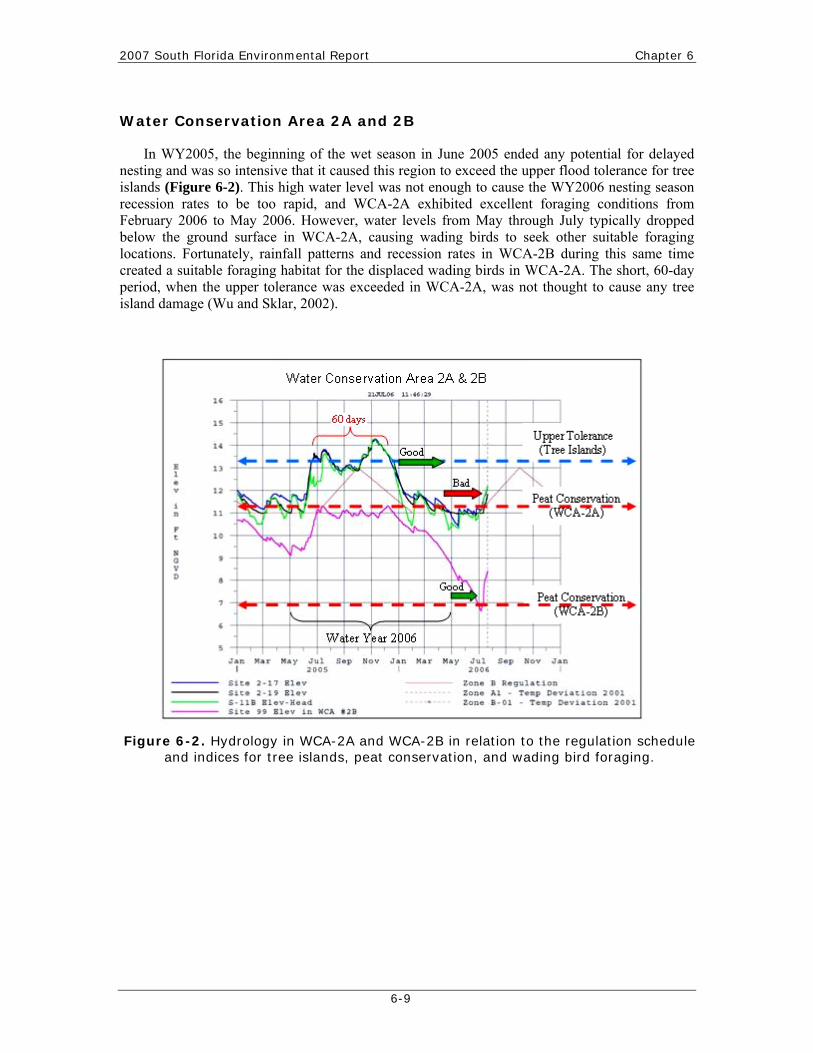
Water Conservation Area 2A and 2B
In WY2005, the beginning of the wet season in June 2005 ended any potential for delayed nesting and was so intensive that it caused this region to exceed the upper flood tolerance for tree islands (Figure 6-2). This high water level was not enough to cause the WY2006 nesting season recession rates to be too rapid, and WCA-2A exhibited excellent foraging conditions from February 2006 to May 2006. However, water levels from May through July typically dropped below the ground surface in WCA-2A, causing wading birds to seek other suitable foraging locations. Fortunately, rainfall patterns and recession rates in WCA-2B during this same time created a suitable foraging habitat for the displaced wading birds in WCA-2A. The short, 60-day period, when the upper tolerance was exceeded in WCA-2A, was not thought to cause any tree island damage (Wu and Sklar, 2002).
Figure 6-2. Hydrology in WCA-2A and WCA-2B in relation to the regulation schedule and indices for tree islands, peat conservation, and wading bird foraging.
6-9

Chapter 6 Volume I: The South Florida Environment
Water Conservation Area 3A and 3B
On average during WY2006, WCA-3A had good recession rates for the entire nesting season and better foraging conditions (in terms of hydrology) than WY2005 (Figure 6-3). A minor reversal during February 2006 was a greater concern in the canals than the marsh. Starting in March 2006, wading birds were able to find good foraging habitats in WCA-3A. This was not the case in WCA-3B; despite good recession rates during the entire nesting season, the water depths did not go below 0.5 foot (i.e., optimum foraging depth) until May 2006. Nevertheless, the two months of good foraging in WCA-3B in WY2006 was a significant improvement over WY2005 when numerous reversals in March, April, and May caused foraging conditions to range from poor to fair.
Figure 6-3. Hydrology in WCA-3A (the average of three stations) and WCA-3B in relation to the regulation schedule and indices for tree islands, peat
conservation, and wading bird foraging.
6-10

2007 South Florida Environmental Report Chapter 6
Northeast Shark River Slough
During WY2005, the Northeast Shark Slough experienced significant rainfall in March, April, and May, causing numerous reversals and making this region marginally effective for foraging. During WY2006, recession rates were good for the entire nesting season and optimum depths were likely to be found by wading birds in the region beginning in March (Figure 6-4). There was a short period in May when a significant reversal occurred but was followed by near optimum depths and recessions for another month.
Figure 6-4. Hydrology in the Northeast Shark River Slough in relation to peat conservation and wading bird foraging. There is no regulation schedule in this area. Upper tolerance levels for tree islands are not shown, as they are not
well established for the Northeast Shark River Slough.
6-11

Chapter 6 Volume I: The South Florida Environment
WILDLIFE ECOLOGY
Previous research has shown that the distribution of wildlife in the Everglades is a function of water quality, hydrology, climate, and habitat conditions. Wildlife within this context includes invertebrates, fish, amphibians, and birds. Most wildlife studies in the Everglades have been conducted by staff of the USFWS, ENP, FWC, and universities throughout Florida. The District focuses on wading birds, their prey, and non-indigenous species as part of a long-term goal to restore historical wildlife populations and a short-term goal to prevent further environmental degradation.
The Wildlife Ecology section of this chapter in the 2006 South Florida Environmental Report – Volume I (2006 SFER – Volume I) examined wading birds as indicators of the overall health of the system, and reported a study aimed at elucidating wading bird population responses to the ecology of their prey, and a study of non-indigenous fish invasion. For this year’s section, the District continues to report wading bird nesting effort and success and will summarize further studies designed to examine the relationship between wading birds and their prey.
In an effort to examine the factors limiting wading bird populations in the Everglades, the preliminary results from a three-year experimental study designed to examine the role of food availability and hydrologic conditions on wading bird breeding success are summarized. Prey availability during the breeding season, which can vary as a function of hydrologic conditions (Gawlik, 2002), is considered a primary determinant of reproductive success. However, studies to date have been observational in approach and have not established a causal relationship between hydrology, food supply, and breeding success. Thus, understanding the specific mechanisms and pathways responsible for the population declines remain limited.
WADING BIRD MONITORING
Because wading birds are excellent indicators of wetland ecosystem health, they have a central role in the Comprehensive Everglades Restoration Plan (CERP). Nesting figures for CERP performance measures are restricted to five species – great egret (Casmerodius albus), snowy egret (Egretta thula), tricolored heron (E. tricolor), white ibis (Eudocimus albus), and wood stork (Mycteria americana) – from nesting colonies in the Greater Everglades Region, i.e., the WCAs and ENP. The timing of breeding, number of nests, and location of nesting colonies within the Everglades are used as CERP targets to evaluate the progress of the Everglades restoration effort. In addition to CERP, wading birds are of special interest to the public and play a prominent role in adaptive protocols, Minimum Flows and Levels (MFLs), and daily operations of the District. Recovery of pre-drainage wading bird nesting patterns will be measured using four parameters: (1) number of nesting pairs for the five species, as shown by three year running averages of nesting numbers, (2) a recovery of nesting in the region in the traditional “rookeries” in the southern, mainland estuaries downstream from Shark Slough, (3) a return to early (December to January) dry season nesting by wood storks, and (4) an increase in the frequency of supra-normal nesting events. The information reported in this chapter represents a compilation of data collected by a variety of institutions that monitor wading bird breeding parameters in South Florida. These include FAU, FIU, UF, USFWS, USGS, and the National Audubon Society. The data counts include all wading bird species [except cattle egret (Bubulcus ibis)] nesting throughout the South Florida region (Cook and Call, 2006). The period covered in this report is the nesting season from February through June 2006.
6-12
2007 South Florida Environmental Report Chapter 6
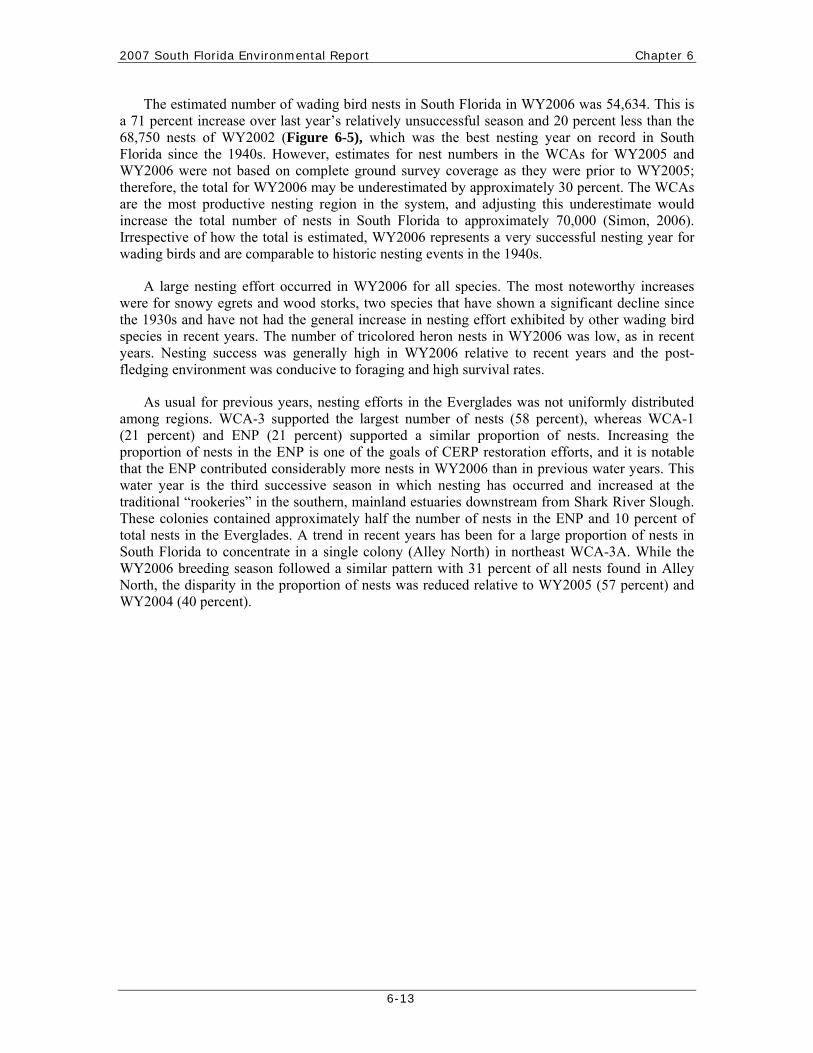
The estimated number of wading bird nests in South Florida in WY2006 was 54,634. This is a 71 percent increase over last year’s relatively unsuccessful season and 20 percent less than the 68,750 nests of WY2002 (Figure 6-5), which was the best nesting year on record in South Florida since the 1940s. However, estimates for nest numbers in the WCAs for WY2005 and WY2006 were not based on complete ground survey coverage as they were prior to WY2005; therefore, the total for WY2006 may be underestimated by approximately 30 percent. The WCAs are the most productive nesting region in the system, and adjusting this underestimate would increase the total number of nests in South Florida to approximately 70,000 (Simon, 2006). Irrespective of how the total is estimated, WY2006 represents a very successful nesting year for wading birds and are comparable to historic nesting events in the 1940s.
A large nesting effort occurred in WY2006 for all species. The most noteworthy increases were for snowy egrets and wood storks, two species that have shown a significant decline since the 1930s and have not had the general increase in nesting effort exhibited by other wading bird species in recent years. The number of tricolored heron nests in WY2006 was low, as in recent years. Nesting success was generally high in WY2006 relative to recent years and the post-fledging environment was conducive to foraging and high survival rates.
As usual for previous years, nesting efforts in the Everglades was not uniformly distributed among regions. WCA-3 supported the largest number of nests (58 percent), whereas WCA-1 (21 percent) and ENP (21 percent) supported a similar proportion of nests. Increasing the proportion of nests in the ENP is one of the goals of CERP restoration efforts, and it is notable that the ENP contributed considerably more nests in WY2006 than in previous water years. This water year is the third successive season in which nesting has occurred and increased at the traditional “rookeries” in the southern, mainland estuaries downstream from Shark River Slough. These colonies contained approximately half the number of nests in the ENP and 10 percent of total nests in the Everglades. A trend in recent years has been for a large proportion of nests in South Florida to concentrate in a single colony (Alley North) in northeast WCA-3A. While the WY2006 breeding season followed a similar pattern with 31 percent of all nests found in Alley North, the disparity in the proportion of nests was reduced relative to WY2005 (57 percent) and WY2004 (40 percent).
6-13

Chapter 6 Volume I: The South Florida Environment
0
5000
10000
15000
20000
25000
30000
35000
1997 1998 1999 2000 2001 2002 2003 2004 2005 2006
Num
ber o
f nes
ts
Great Egret
White Ibis
Snowy Egret
0
500
1000
1500
2000
2500
3000
3500
4000
1997 1998 1999 2000 2001 2002 2003 2004 2005 2006
Num
ber o
f nes
ts
Wood Stork
TricoloredHeron
Figure 6-5. Historical wading bird nesting numbers in the Everglades for individual species since 1997.
The response of wading birds provides an annual understanding of how the Everglades ecosystem functions. This year, much of the increased nesting effort and success may be attributed to favorable hydrologic and climatic conditions. Water depths and recession rates were largely classified as “good” (see earlier section on Hydrologic Patterns for Water Year 2006) and provided suitable foraging conditions throughout the system for the duration of the breeding season. Rainfall and reversal events were limited in frequency and magnitude, and induced minimum nest failure. This pattern of events contrasts that of WY2005, when multiple heavy rain events through March and April resulted in a succession of reversals that left protracted high water levels, and, thus, poor foraging condition over much of the system. However, hydrologic conditions do not fully explain foraging and nesting patterns. The hydrologic conditions in
6-14

2007 South Florida Environmental Report Chapter 6
February 2006 were similar to those in WY2005, yet the number of foraging wading birds in the system were only half those reported for WY2005. This suggests that factors independent of recession rates and water depth such as the total amount of prey available or foraging conditions outside the Everglades may also play a significant role in wading bird foraging decisions in South Florida. This observation also begs the question as to why numbers of pre-breeding foraging individuals do not relate directly to number of nests. The relatively low breeding effort in WY2005 may partly be explained by the reversal events in March 2005, which undoubtedly limited the number of nests of later breeding species such as ibis, which do not start to breed until late March. However, it does not explain why the number of nests of earlier nesting species, such as wood stork and great egret, were lower in WY2005 than in WY2006. Determining causation will require the continuation of long-term system wide monitoring and shorter-term experiments and modeling.
Two of the four species-groups met the numeric nesting targets proposed by the South Florida Ecosystem Restoration Task Force: great egret and white ibis (Table 6-3). Two other targets for Everglades restoration are an increase in the number of nesting wading birds in the coastal Everglades and a shift in the timing of wood stork nesting to earlier in the breeding season (Ogden, 1994). The WY2006 nesting year showed no improvement in the timing of wood stork nesting, but there was a general shift of colony locations.
Table 6-3. Numbers of wading bird nests in the WCAs and Everglades National Park (ENP) compared to Comprehensive Everglades Restoration Plan
(CERP) targets and historical ranges. Target numbers are based on known numbers of nests for each species during the pre-drainage period 1930–1940, and which were
summarized by Ogden (1994).
Species Base low/ high
1997–1999
1998–2000
1999–2001
2000–2002
2001–2003
2002–2004
2003– 2005
2004–2006 Target
Great Egret 1,163/ 3,843 5,084 5,544 5,996 7,276 8,535 9,656 7,267 7,796 4,000
Snowy Egret/ Tricolored
Heron
903/ 2,939 1,862 2,788 4,269 8,614 8,089 8,079 3,783 6,478 10,000–
20,000
White Ibis 2,107/ 8,020 5,100 11,270 16,555 23,983 20,725 24,947 19,896 24,242 10,000–
25,000
Wood Stork 130/ 294 279 863 1,538 1,868 1,554 1,191 762 807 1,500–
2,500
6-15

Chapter 6 Volume I: The South Florida Environment
FOOD LIMITATION ON WADING BIRD REPRODUCTIVE SUCCESS: YEAR 1
Food supply can limit the number of breeding individuals and influence individual reproductive success and survival (for review, see Martin, 1997). This assertion is clearly demonstrated by the consistent increase in size and survival prospects of young when brood size is reduced or food supply is increased. For wading birds, prey availability during the breeding season, which can vary as a function of hydrologic conditions (Gawlik, 2002), is considered the single most important factor limiting distribution and nesting success. This prey availability may be particularly relevant in the oligotrophic Everglades system (Hoffman et al., 1994). However, considerable gaps remain in understanding the role of food limitation in shaping wading bird reproductive dynamics.
The number of wading bird nests in the Everglades has decreased by approximately 70 percent since the 1930s (Crozier and Gawlik, 2003), and those individuals that do nest often experience reduced reproductive output. A reduction in prey availability because of water management activities is the most important factor responsible for these declines. This view is supported by studies showing correlations between hydrologic variables and wading bird reproductive effort and success (Kushlan et al., 1975; Frederick and Collopy, 1989; Ogden, 1994). An observational approach, however, does not verify a causal relationship among hydrology, food supply, and breeding success, and understanding the specific mechanisms and pathways responsible for the population declines remains limited. Empirical studies that manipulate food supplies and control naturally correlated variables that also affect nesting success are needed.
The primary objectives of the current study are to determine experimentally (1) whether food supply limits white ibis (E. albus) nesting success and (2) whether food limitation is a function of hydrologic conditions. The study will use a supplementary feeding experiment in which a group of ibis nestlings will be fed with locally collected aquatic prey. The effects of food supplementation on nestling fitness (growth, survival, and physiological responses), nestling behavior, and parental provisioning responses will be quantified and compared to a control group. White ibis nestlings leave the natal nest and form crèches at approximately 25 days (25d) post-hatching but remain reliant on parental provisioning until attaining independence at approximately 40d–60d post-hatching whence they depart the colony. For the study, food was supplemented only during the nestling stage, but its effects on offspring fitness and behavior were measured from the early nestling stage, through the crèche period, and into the initial natal dispersal period (i.e., from 5d to 60d–80d post-hatching). The study will be repeated in three consecutive breeding seasons to examine the effects of hydrologic conditions on food limitation. The hypothesis is that (1) the success of chicks from food-supplemented nests should be greater than those of control nests and (2) the magnitude of the difference between treatments should be greatest during breeding seasons when hydrologic conditions are poor. The preliminary results from the first field season are presented in this chapter.
Study Data
The study was conducted at a tree island colony with approximately 8,000 breeding white ibis (26º 32’ N, 80º 17’ E) in the Arthur R. Marshall Loxahatchee National Wildlife Refuge (hereafter Refuge) between April 2006 and July 2006. Nestling behavior and the number of parental food loads delivered to chicks in experimental and control groups were recorded directly from the two observation hides using spotting scopes. Data were collected from 36 randomly sampled nests
6-16

2007 South Florida Environmental Report Chapter 6
situated approximately 50 meters (m) from the two temporary raised blinds. Every nest was numbered and visible from at least one blind. Nests with chicks of similar age were matched (to control for possible differences in breeding performance of adults related to hatching date) and assigned to either a supplementary feeding group or control group (n = 18 nests in each group). Chicks in the supplemented group were hand fed every 1.4 days 15 grams (g) of fresh, locally caught fish. This provided sufficient energy to have a potential affect on growth/survival but not so much that the parents would lose their provisioning response. Supplementary feeding began when chicks were 6d old and continued until nest departure at about 25d post-hatching. Growth of all chicks was measured at ages 5d (one day prior to supplementation), 15d, and 25d post-hatch. On each occasion, body mass, bill length, and right tarsus length was measured, and the survival status of each chick was recorded. The District collaborated with FAU to measure physiological parameters (e.g., triglycerides, glycerol, and fecal corticosterone) from blood and fecal samples taken at ages 10d and 20d. All nestlings were banded with a BBL aluminum band and a combination of unique color bands to identify the individuals after nest departure. At 20d, each chick was captured and fitted with a radio transmitter and tracked daily by airboat or helicopter until departure from the Refuge.
Hydrologic variables and prey density were measured once per week at 10 randomly positioned sloughs within a 5 kilometer (km) radius of the colony. Prey density was quantified using standard methods (1-square-meter throw trap).
Results and Discussion
Data collection from the first field season is nearing completion. To date, only the survival and the mass growth data have been analyzed; there are no data for non-optimal food years. The point of this multiyear study was to make comparisons between good and bad years. The predicted 2007 wet winter as a result of the current El Niño is likely to reduce food availability for next year’s breeding season and induce relatively poor breeding. To understand possible co-variance associated with contamination, the physiology component of the experiment is a collaboration with FAU to examine collected feather samples from nestlings. In addition, the District is in consultation with Dr. Peter Frederick (of UF), who currently manages an aviary experiment examining the effect of mercury on ibis breeding success.
The provision of extra food did not appear to increase mass growth of nestlings; there were no clear differences in body mass at ages 5d, 15d, or 25d post-hatching between supplemented and control nests for either A- or B-chicks (Figure 6-6). Moreover, supplementary feeding did not affect nestling survival. The proportion of nestlings surviving to independence was very high and did not differ between supplemented (97 percent survival, n = 31) and control nests (100 percent survival, n = 33; Mann-Whitney U test, U = 528, P = 0.3).
These preliminary analyses do not support the contention that nestlings were food limited. However, these results indicate that local hydrologic conditions and prey availability were optimal for wading bird reproduction, as noted elsewhere in this chapter (see Hydrologic Patterns for Water Year 2006 and Wading Bird Monitoring sections) and that other factors known to affect nesting success (e.g., mercury contamination) had little effect. However, it must be stressed that this year’s hydrologic and climatic conditions were exceptional, and food limitation is likely a potential constraint on wading bird nesting success during years when hydrologic conditions are less favorable. Nonetheless, the findings suggest that restoring wading bird populations to historical levels is a viable proposition if suitable hydrologic conditions in the Everglades can be reestablished. Further analyses and data from future breeding seasons will permit a more precise characterization of the roles of food limitation and hydrology on nesting success.
6-17

Chapter 6 Volume I: The South Florida Environment
6-18
Figure 6-6. Mean nestling mass (±1 SE) at ages 5d, 15d, and 25d post-hatch for A- and B-chicks in food supplemented and control nests. N = 18 except
where noted beside error bar.
2007 South Florida Environmental Report Chapter 6
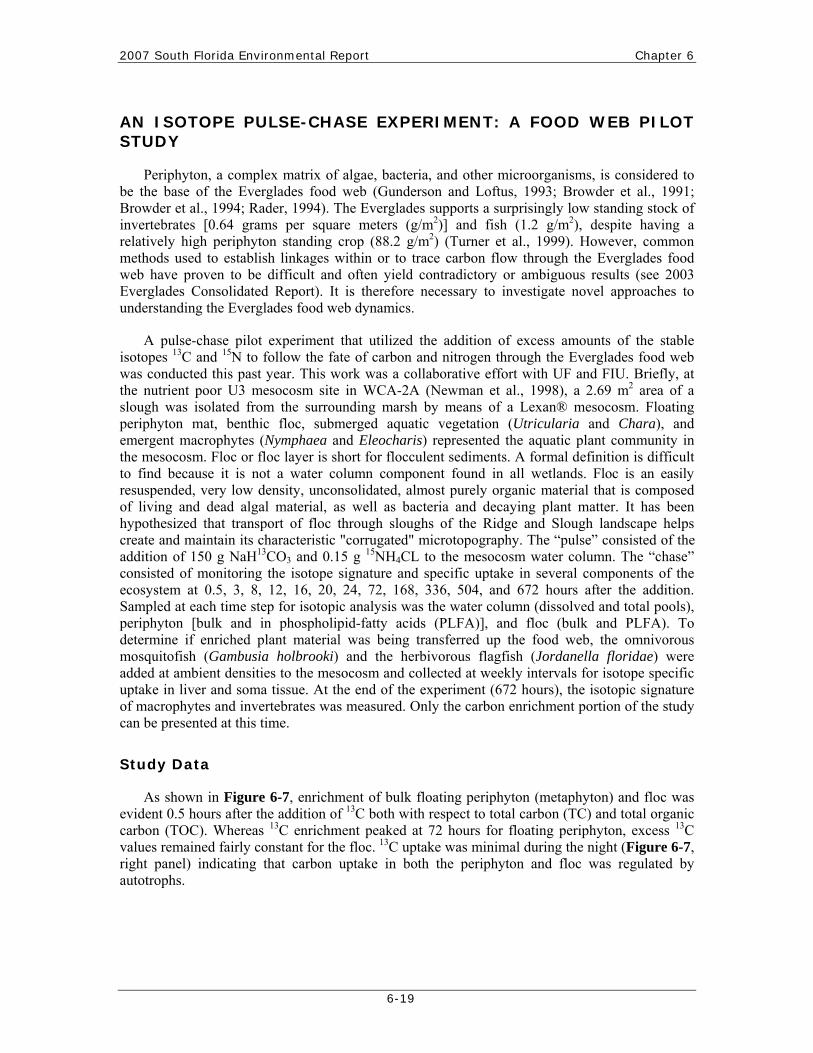
AN ISOTOPE PULSE-CHASE EXPERIMENT: A FOOD WEB PILOT STUDY
Periphyton, a complex matrix of algae, bacteria, and other microorganisms, is considered to be the base of the Everglades food web (Gunderson and Loftus, 1993; Browder et al., 1991; Browder et al., 1994; Rader, 1994). The Everglades supports a surprisingly low standing stock of invertebrates [0.64 grams per square meters (g/m2)] and fish (1.2 g/m2), despite having a relatively high periphyton standing crop (88.2 g/m2) (Turner et al., 1999). However, common methods used to establish linkages within or to trace carbon flow through the Everglades food web have proven to be difficult and often yield contradictory or ambiguous results (see 2003 Everglades Consolidated Report). It is therefore necessary to investigate novel approaches to understanding the Everglades food web dynamics.
A pulse-chase pilot experiment that utilized the addition of excess amounts of the stable isotopes 13C and 15N to follow the fate of carbon and nitrogen through the Everglades food web was conducted this past year. This work was a collaborative effort with UF and FIU. Briefly, at the nutrient poor U3 mesocosm site in WCA-2A (Newman et al., 1998), a 2.69 m2 area of a slough was isolated from the surrounding marsh by means of a Lexan® mesocosm. Floating periphyton mat, benthic floc, submerged aquatic vegetation (Utricularia and Chara), and emergent macrophytes (Nymphaea and Eleocharis) represented the aquatic plant community in the mesocosm. Floc or floc layer is short for flocculent sediments. A formal definition is difficult to find because it is not a water column component found in all wetlands. Floc is an easily resuspended, very low density, unconsolidated, almost purely organic material that is composed of living and dead algal material, as well as bacteria and decaying plant matter. It has been hypothesized that transport of floc through sloughs of the Ridge and Slough landscape helps create and maintain its characteristic "corrugated" microtopography. The “pulse” consisted of the addition of 150 g NaH13CO3 and 0.15 g 15NH4CL to the mesocosm water column. The “chase” consisted of monitoring the isotope signature and specific uptake in several components of the ecosystem at 0.5, 3, 8, 12, 16, 20, 24, 72, 168, 336, 504, and 672 hours after the addition. Sampled at each time step for isotopic analysis was the water column (dissolved and total pools), periphyton [bulk and in phospholipid-fatty acids (PLFA)], and floc (bulk and PLFA). To determine if enriched plant material was being transferred up the food web, the omnivorous mosquitofish (Gambusia holbrooki) and the herbivorous flagfish (Jordanella floridae) were added at ambient densities to the mesocosm and collected at weekly intervals for isotope specific uptake in liver and soma tissue. At the end of the experiment (672 hours), the isotopic signature of macrophytes and invertebrates was measured. Only the carbon enrichment portion of the study can be presented at this time.
Study Data
As shown in Figure 6-7, enrichment of bulk floating periphyton (metaphyton) and floc was evident 0.5 hours after the addition of 13C both with respect to total carbon (TC) and total organic carbon (TOC). Whereas 13C enrichment peaked at 72 hours for floating periphyton, excess 13C values remained fairly constant for the floc. 13C uptake was minimal during the night (Figure 6-7, right panel) indicating that carbon uptake in both the periphyton and floc was regulated by autotrophs.
6-19

Chapter 6 Volume I: The South Florida Environment
As noted earlier, periphyton and floc are a complex matrix of algae and bacteria. Measuring the isotopic composition of the material helps to discern the biochemical cycling within periphyton mats or floc. In other words, bulk measurements can reveal the isotope type but does not reveal whether it is in the autotrophic (algae) or heterotrophic (bacteria) pool. Utilizing an approach similar to that used by Middelburg et al. (2000), the PLFA composition of both the floating periphyton and floc was measured. PLFA can be used as biomarkers to detect the presence of different microbial groups and algae. The resulting PLFA composition of floating periphyton and floc was remarkable similar. Polyunsaturated fatty acids indicative of algae and protozoa were detected in both pools, signifying a potential for the photosynthetic fixation of carbon. PLFA associated with higher plants were not detected. After it was determined which of the PLFA were enriched with 13C, the isotopic mass for PLFAs indicative of autotrophs and heterotrophs was summed. Compared to heterotrophs, autotrophs within floating periphyton mats, and to a lesser extent in floc, became rapidly enriched with 13C. It appears that the overall enrichment of the heterotrophs lags behind the autotrophs to indicate that bacteria carbon cycling within the mat is regulated to some extent by autotrophic carbon fixation. Also, the fixed carbon is utilized or available for heterotrophic consumption within 8 to 12 hours after fixation, indicating high carbon turnover rates.
Both the herbivorous and omnivorous fish were enriched with 13C by the first sampling period (one week), and the highest enrichment was observed at the second week. Peak specific uptake was significantly greater in the liver of the herbivorous fish [1,100 change in isotope 13C per mille (∆δ 13C ‰)] than in the omnivore (400 ∆δ 13C ‰). Similar results were observed for the soma (herbivorous fish equivalent to 400 ∆δ 13C ‰) but not in the omnivore (equivalent to 200 ∆δ 13C ‰). These results suggest greater usage of fixed carbon in periphyton and floc by the herbivore than the omnivore. At the end of the experiment, the submerged macrophyte Utricularia had the greatest excess amount of 13C [277 micromoles 13C per gram (μmol 13C g-1)] compared to the macroalgae Chara (121 μmol 13C g-1) and the emergent macrophytes Eleocharis (54 μmol 13C g-1) and Nymphaea (26 μmol 13C g-1). Not surprisingly, these results demonstrate
Time (hours)0 168 336 504 672
Exc
ess μ m
ol 13
C g
-1
0
100
200
300
400
500Metaphyton TCMetaphyton TOCFloc TCFloc TOC
Time (hours)
Day Night
0
20
40
60
80
100
120
140
0 3 6 9 12 15 18 21 24
Figure 6-7. Time series of 13C uptake in total carbon (TC) and total organic carbon (TOC) pools of metaphyton and floc over a 672-hour
period (left panel) and the first 24 hours (right panel).
6-20

2007 South Florida Environmental Report Chapter 6
that the submerged aquatic vegetation (SAV) utilize the water column as the primary carbon source whereas the emergent macrophytes derive the majority of their carbon from the atmosphere but actually utilize carbon from the water column. The pathway by which this occurs remains unclear.
The Implications
This pilot study demonstrated that carbon turnover rates were very rapid, fish were consuming periphyton, and most importantly, that microbial processes and, hence, nutrient concentrations, are regulated to some extent by plant productivity (both submerged and emergentvegetation). Therefore, water management is very important to prevent dry-downs, high nutrient inputs, and shifts in vegetation composition in the Everglades. This study demonstrated that stable isotope enrichment experiments can be a very useful tool to understanding Everglades biogeochemical cycling and food web dynamics. With these promising results, the District is planning to conduct a series of experiments utilizing these methods. The focus of future pulse-chase experiments will be to provide detailed knowledge of carbon and nitrogen cycling in regions of the Everglades that are being restored and how cycling differs between softwater and hardwater portions of the Everglades.
6-21

Chapter 6 Volume I: The South Florida Environment
PLANT ECOLOGY
The major research objective of the plant ecology studies is to understand vegetation dynamics in relation to water management. This objective requires that the physiological and biological processes that cause vegetation replacement, degradation, and premature death be examined in relation to environmental disturbances, such as phosphorus (P) enrichment and altered hydrologic regimes that cause peat fires or stress. Previous consolidated reports have shown how P enrichment contributes to cattail expansion and the disappearance of ridge/slough communities. However, the life history characteristics of cattail and sawgrass were found to be significantly different. Processes of root oxygenation during extreme hydrologic events favor cattail growth when P concentrations in the soil and water are high. In this section, an update will be given of the tree stress studies out at the Loxahatchee Impoundment Landscape Assessment (LILA), tree growth dynamics in WCA-3, and plans for Lygodium research. The District’s Everglades Division is collaborating with the District’s Vegetation Management Division, U.S. Army Corps of Engineers, U.S. Department of Interior, ENP, the Nature Conservancy, and other stakeholders to develop a comprehensive research plan for exotic invasive species. A literature survey was completed and will be combined with Conceptual Ecological Models to determine research gaps and actions. The general outline of a research plan was presented at the third annual Everglades Invasive Species Summit in July 2006 (see Chapter 9 of this volume).
LILA TREE SEEDLING EXPERIMENT
Tree islands are an important component of the Everglades and many other wetlands around the world (Wetzel, 2002a). In the Everglades, the vegetation found on tree islands, which are only slightly higher in elevation than the surrounding habitat, contains a number tree, shrub, and herb species that unique to this region (Davis, 1943; Loveless, 1959; Armentano et al., 2002; Heisler et al., 2002). In the last 60 years, there have been significant losses of tree islands in many parts of the Everglades (Sklar and van der Valk, 2002; Wetzel et al., 2005). To reverse this loss of tree islands, the feasibility of restoring tree islands is being investigated. A potential tree island restoration strategy may include cultivating stands of trees on constructed or rehabilitated tree islands. However, choosing the most appropriate species and (or favorable) planting location has been difficult to determine because of the seasonal and geographic variability of water levels across the Everglades.
This study was designed to test the hypotheses that tree seedling survival and growth is affected by seasonal periods of flooding and drought. This research was conducted as part of the LILA project. LILA is an experimental complex built in 2003 at the Refuge. LILA consists of four 15-acre macrocosms, each containing two constructed prototype tree islands.
For this study, 10 individuals from each of seven tree species were planted 1.75 m apart along transects perpendicular to the central axis of each island that followed down the slope (Figure 6-8). Five randomly selected transects were planted with each species on each island (i.e., 50 individuals of each species per island) for a total of 2,800 seedlings. The elevations on either side of the islands decreased a total of 0.5 m from transect positions 4 to 10, a 4.7 percent slope. Thus, from transect position 4 to the end of transect position 10, each seedling was placed approximately eight centimeters (cm) lower than the one previous. Seedlings of three species, I. cassine, A. glabra, and C. icaco were harvested at the end of the study.
6-22

2007 South Florida Environmental Report Chapter 6
As reported in the 2006 SFER – Volume I, Chapter 6, between 40 and 85 percent of tree seedlings suffered mortality during the first 120 days of the study. I. cassine, C. icaco, and S. caroliniana had the greatest number of surviving individuals, while Magnolia virginiana, Myrica cerifera, and Acer rubrum had the lowest. Seedling survivorship patterns shifted when stress moved to flooding. During the days of drought stress, the mean survival rate was 23, 38, and 50 percent in the high, intermediate, and low elevation classes, respectively. During the days of flood stress, seedling survival was 50, 24, and 5 percent in the high, intermediate, and low elevation classes, respectively.
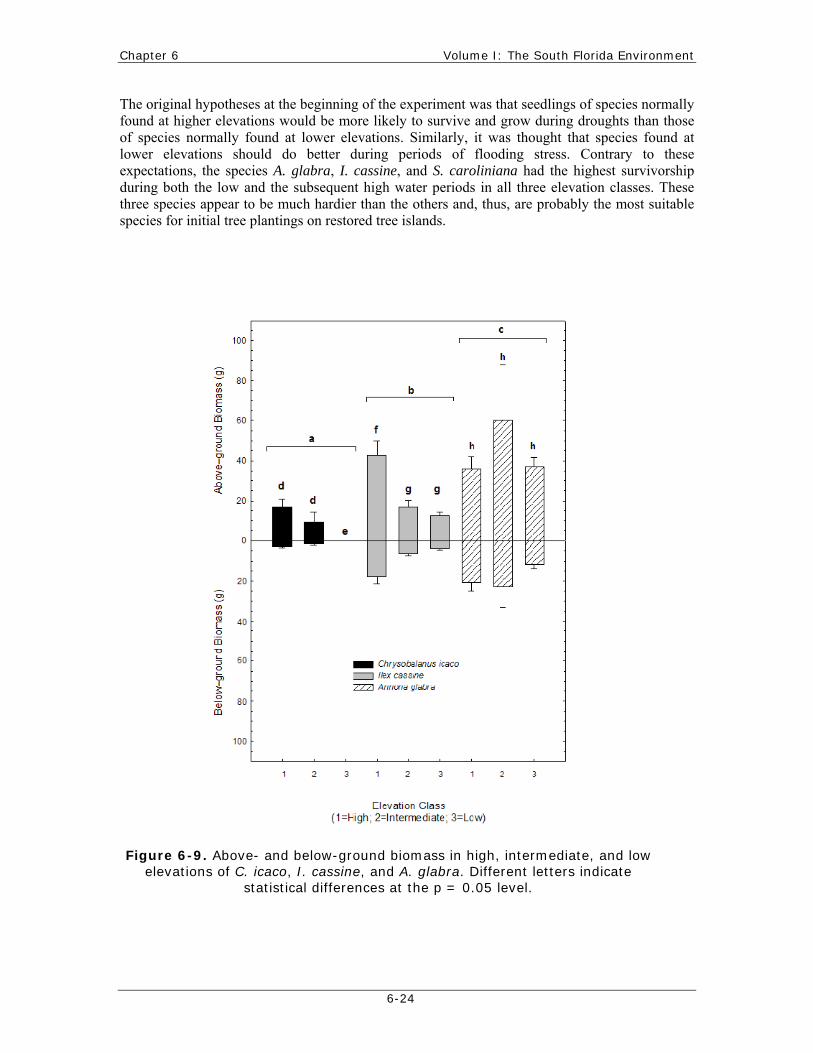
New analysis of the harvested plants that survived both drought and flooding stress (total of 552 days) indicated that C. icaco had the lowest mean biomass and height, while A. glabra had the highest (Figure 6-9). A. glabra seedlings had similar biomass in all three elevation classes. C. icaco and I. cassine had the greatest mean biomass in the high elevation class and generally the lowest biomass in the low elevation class, respectively.
Figure 6-8. Cross section of LILA tree islands showing the 10 elevations at which seedlings were planted along transects; transects cross both sides of an island.
6-23
Chapter 6 Volume I: The South Florida Environment
The original hypotheses at the beginning of the experiment was that seedlings of species normally found at higher elevations would be more likely to survive and grow during droughts than those of species normally found at lower elevations. Similarly, it was thought that species found at lower elevations should do better during periods of flooding stress. Contrary to these expectations, the species A. glabra, I. cassine, and S. caroliniana had the highest survivorship during both the low and the subsequent high water periods in all three elevation classes. These three species appear to be much hardier than the others and, thus, are probably the most suitable species for initial tree plantings on restored tree islands.
Figure 6-9. Above- and below-ground biomass in high, intermediate, and low elevations of C. icaco, I. cassine, and A. glabra. Different letters indicate
statistical differences at the p = 0.05 level.
6-24

2007 South Florida Environmental Report Chapter 6
TREE ISLANDS
The main objective of the tree island program is to assess changes in forest structure and ecosystem function in response to changes in water levels, hydroperiods, and the timing and frequency of inundation to restore and preserve these biodiversity hotspots. A secondary objective is to understand tree island origins by relating tree island nutrient and biogeochemical cycling to island productivity and health. The particular objective of this 2006 SFER tree island update was to assess the effects of Hurricane Wilma on tree island health and resiliency as a function of hydrology and water management. Previous consolidated reports have characterized existing vegetation, created a baseline data set, described patterns of distribution and abundance of aboveground biomass, and related forest structure to hydrology.
Natural disturbances, such as hurricanes, are important in many tropical forests often by defining forest structure and function. For instance, hurricanes can lead to defoliation that increases nutrient inputs to the forest floor, decreases forest biomass, and increases tree mortality (Oestertag et al., 2005). To assess the effects of Hurricane Wilma on the District’s five long-term study islands located in WCA-3A, several aboveground biological parameters were measured in 2002 and, again, six months after Hurricane Wilma within permanent, 10 m by 10 m vegetation plots (described in previous consolidated reports). Furthermore, to estimate better the effects of Hurricane Wilma, the head and near tail of each tree island were categorized into two distinct hydrologic environments: short and long hydroperiods. Tree islands characterized by a short hydroperiod were inundated for less than six months per year and had an average annual water depth of less than 20 cm. In contrast, long hydroperiod islands were those with more than 20 cm of standing water for 7 to 12 months per year.
The heads of tree islands 3AS1, 3AS2, 3AS3, and 3AS4 were classified as short hydroperiod environments. In contrast, the near tail of these same tree islands were all classified as long hydroperiod environments. Only tree island 3AS5 had the highest average annual water depth (30.8–31.4 cm) and was inundated for 11 months per year in both the head and near tail regions, indicating that the whole tree island can be classified as a long hydroperiod environment.
In general, as reported previously, species diversity and forest structure were lowest on tree islands with long hydroperiod when compared to those with short hydroperiod. For instance, the complexity index (CI), which takes into consideration basal area, stem density, canopy height, as well as number of species, was lower for long hydroperiod environments than for short hydroperiod environments (Table 6-4). (Note: Individual islands should not be compared to one another due to the inherent differences in environmental conditions, such as soil nutrients, hydrology, and effect of natural disturbances.)
Preliminary vegetation data indicates a significant impact from Hurricane Wilma in the central Everglades (Table 6-4). After the hurricane, the basal area and density decreased on the heads of tree islands dominated by hammock species, such as B. simaruba, I. cassine, M. cerifera, and Chrysobalanus icaco. The basal area and complexity index on the heads of tree islands 3AS1, 3AS2, 3AS3, and 3AS4 decreased due to high mortality. The largest difference between pre- and post-average basal area (44 percent) occurred on the head of tree island 3AS4, which also experienced a complete loss of two out of five species (P. borbonia and B. simaruba) and a decrease in basal area by all but one species (S. caroliniana). In contrast, the forest structure on the near tail of the same tree island was affected little by the hurricane. Basal area and complexity index did not decrease; on some tree islands, they increased. The reason for this increase was due specifically to the highly resilient nature of S. caroliniana and its ability to rapidly sprout new woody biomass.
6-25

Chapter 6 Volume I: The South Florida Environment
Natural disturbances present a unique opportunity to investigate the effect of restoring a human-altered ecosystem. In particular, hurricanes provide an opportunity to examine natural recover and recruitment patterns on tree islands that have been subjected to changes in their natural hydropattern.
Table 6-4. Tree island vegetation survey data before and after Hurricane Wilma.
Data is reported for the heads and near tails (NT) of five long-term study tree islands with either long or short hydroperiods. Collected data included average total density,
average total basal area, average canopy height, and a complexity index (CI).
Tree Island
Area and Hydro-period
Density (ind/ha)
Pre-Hurricane
Density (ind/ha) Post-
Hurricane
Basal Area (m2/ha)
Pre-Hurricane
Basal Area (m2/ha) Post-
Hurricane
CI Pre-
Hurricane
CI Post-
Hurricane
3AS1 Head – Short 3,350 2,550 14.7 14.4 78 53
NT – Long 6,100 5,000 14.1 16.7 143 117
3AS2 Head – Short 4,950 3,750 16.1 14.4 199 97
NT – Long 4,650 4,200 12.3 19.4 128 204
3AS3 Head – Short 3,750 2,050 16.6 12.4 76 14
NT – Long 3,550 4,100 9.2 10.9 72 105
3AS4 Head – Short 4,550 1,650 22.9 12.7 192 18
NT – Long 5,300 3,950 18.1 14.4 199 96
3AS5 Head – Long 6,600 7,000 10.7 17.9 147 257
NT – Long 5,350 4,650 6.2 7.2 64 48
INVASIVE EXOTIC SPECIES RESEARCH
In South Florida, L. microphyllum successfully invaded moist habitats and quickly became a dominant component of the vegetation, thereby displacing native species and altering ecosystem processes and disturbance regimes. To gain a better understanding of L. microphyllum’s spread across South Florida’s landscape as well as its ecology, two projects and a workshop were initiated in WY2006. The projects were in collaboration with FAU. The first project, Detailed Lygodium microphyllum Assessment in the Everglades Protection Area, had the objective of determining the distribution of L. microphyllum on tree islands in central and southern WCA-3A. The second project, Lygodium microphyllum: Functional Basis for Geographical Variation, investigated the environmental factors that affect the growth and spread of Lygodium in both its native range and its invaded Florida habitats, with the ultimate goal of finding effective ways to control its spread in the Florida peninsula. More details on these projects can be found in Chapter 9 of this volume.
6-26

2007 South Florida Environmental Report Chapter 6
The third annual Everglades Invasive Species Summit was held at Big Cypress National Preserve in July 2006. The primary goal of the summit was to improve cross agency communication and develop an effective, coordinated invasive species control strategy for the Everglades region. A steering committee was formed to provide guidance and to integrate resources among governmental agencies, tribes, and other stakeholders. The summit produced an outline for a comprehensive research plan for invasive exotic species. The objective of the research plan will be first to identify the needs and gaps in exotic invasive species research and, second, to provide recommendations and actions for future studies.
Cattail spread and invasion across the Everglades has also been widely reported (Rutchey et al., 2005; Ferriter et al., 2006; Rutchey et al., in prep). Although important questions, such as what is the genetic structure of the “variety” of cattails invading the Everglades and where do these invasive cattails come from, have been asked for the last 10 years, there have been no studies on these topics until now. This is exploratory research based upon the finding that cattail invasions in three national parks of the Great Lakes region was largely due to the hybridization of an European invader and native cattail species (Marburger et al., 2005). If District scientists can understand the origins of invasive cattails in the Everglades, their genetic background, and their genetic expression along a nutrient gradient, then the District might be able to develop adaptive management strategies based on the molecular information Two cattail species, Typha domingensis Pers. and T. latifolia L., are reported in the South Florida Everglades, with T. domingensis being the predominant plant that invades and colonizes much of the native wetland habitats. Mounting evidence suggests that a European invader is hybridizing with native cattail in three national parks in the Great Lakes region (Marburger et al., 2005). Recent genetic research (i.e., DNA sequences of protein-coding genes) by the District, in collaboration with FAU, examined the intraspecific genetic variations (DNA polymorphism) of T. domingensis compared with published sequences for other Typha species, including T. latifolia, to identify a possible presence of hybrid cattail plants. Five protein-coding genes and a pseudogene of either the nuclear or organelle genomes from 20 T. domingensis populations of different geological distances and anthropogenic conditions were cloned and sequenced. The results revealed extensive differences between T. domingensis and T. latifolia in both coding regions and introns, thus, providing reliable molecular markers to distinguish these two species. Based on current examination of nuclear genes (biparental inheritance) and chloroplast genes (maternal inheritance), the presence of any hybrid progeny of T. domingensis and T. latifolia in the samples tested could not be confirmed. However, one unique population of T. domingensis was identified with nuclear genes that are polymorphic to both T. latifolia and all other populations of T. domingensis studied, raising the possibility that these plants might be a hybrid of unknown origins. Thus, further studies must be conducted to detect genetic variations among natural populations and confirm the hybridization issue, which will provide scientific bases for cattail management strategies in the Everglades.
6-27

Chapter 6 Volume I: The South Florida Environment
ECOSYSTEM ECOLOGY
While the Everglades is often called the “River of Grass,” it is it actually a mosaic of ecosystems, each with a range of chemical, biological, and physical characteristics. The goal of ecosystem research is to identify ecotypes of special concern in Everglades restoration and focus research in that direction. Three issues highlighted this year are (1) flume studies on sediment movement, (2) Everglades Forever Act (EFA) funded projects to reduce nutrient loading to the Everglades and monitor downstream effects of Stormwater Treatment Areas (STAs), and (3) designs for projects to accelerate the natural recovery of cattail impacted habitats in WCA-2A.
SEDIMENT FLUX
To date, there is limited information on how flow and the physical transport of particulate matter interact, both in terms of nutrient fluxes and as a force capable of shaping the landscape. A study of sediment flux fills a critical information gap by addressing the issue of floc resuspension and distribution as a function of threshold velocities. Understanding nutrient and carbon transport may be the key to Everglades restoration and rehabilitation in regions where the slough communities are disappearing. Restoring P impacted areas of the EPA depends, in part, on being able to quantify how P is transported through the system. P transport through the Everglades occurs through physical, chemical, and biological pathways of which the physical transport mechanisms are the least understood. P can be physically transported in dissolved, colloidal, or particulate forms. Particulate transport may occur through the entrainment of flocculent detrital matter into the flow field when a critical velocity is met or exceeded. Thus, measuring particle dynamics and its relationship to flow is important to understanding P movement. In addition, understanding the link between flow and particle transport is essential prior to the implementation of the CERP DECOMP Project, which will decompartmentalize WCA-3 (see Chapters 7A and 7B of this volume). CERP aims to restore the unabated flow of water through what is now a compartmentalized Everglades ecosystem. This historic flow is thought to have shaped portions of the pre-drainage Everglades landscape, which consisted of sawgrass ridges, open-water sloughs, and tree islands oriented in the prevailing direction of flow. This landscape pattern was lost in areas where flow had been restricted or removed due to the construction of canals and/or levees. This observation has led to the conclusion that restoring flow will restore the pre-drainage pattern.
Two pilot studies were conducted to evaluate whether methods commonly used to measure the dynamics of sediment transport in marine and estuarine environments could be adapted for use in the Everglades. The ultimate goal of both of these studies is to quantify the physics of erosion and sediment transport in the Everglades using a sedimentological approach. These studies were conducted in collaboration with PARTRAC, a company specializing in particle transport, to develop the change-point detection. The first project centered on using an in situ annular flume to calculate the critical entrainment velocity (CEV) of floc in different WCAs of the Everglades. CEV is the lowest velocity at 5 cm above the bed surface (floc) at which particles on the surface become entrained within the flow field. This number provides the lowest velocity required for sediment transport to occur. The second project tested the feasibility of using a tracer that was hydraulically matched to native Everglades floc in order to follow “floc” transport under a variety of hydrodynamic situations.
6-28

2007 South Florida Environmental Report Chapter 6
For the first pilot study, PARTRAC custom built a field-portable annular benthic flume to measure the in situ CEV in the Everglades (Figure 6-10). The flume is used to apply a controlled flow stress (velocity) onto the surface of submerged sediments to detect the entrainment of particles from the sediments into the flow-field using an optical backscatter sensor (OBS). The flume consists of two concentrically fixed Perspex™ cylinders that create a 0.12 m wide channel to enclose a bed area of 0.14 m2. A rotating lid with four shallow paddles is powered by a submersible electric motor. The rotation speed of the lid is controlled via computer program capable of generating a variety of flow conditions ranging from 0.5 centimeter per second (cm/sec) to more than 20 cm/sec.
Figure 6-10. Benthic annular flume constructed by PARTRAC to determine the critical entrainment velocity of Everglades sediments. Flow is induced by
paddles at a set velocity, and turbidity is measured by the optical backscatter sensor. (Photo by SFWMD.)
A single deployment typically consisted of increasing the velocity of lid rotation in 0.5 cm/sec intervals from 0 to 10 cm/sec. Each velocity step was maintained for five minutes and was then followed by a 30-second period during which the lid rotation was advanced to the next higher interval. Turbidity (optical backscatter) was measured every 10 seconds for the deployment duration. The OBS values were converted to suspended sediment concentration [in milligrams per liter (mg/L)] by removing a volume of water from a sapling port within the flume at discrete time intervals during the test. A two regression curve analysis was used to attain the change point.
6-29
Chapter 6 Volume I: The South Florida Environment
A total of four deployments were conducted in LILA, three in WCA-2A, and two in WCA-3A in July and August 2005. For the pilot study, measurements were made in areas where vegetation was limited or non-existent such that only floc transport was being measured. The range of CEVs measured for LILA, WCA-2A, and WCA-3A were mostly between 1.6 and 2.1 cm/sec, suggesting that velocities between 1.5 and 2.0 cm/sec may be sufficient to physically transport floc particles. However, more studies are required to verify how the ranges vary as a function of sediment type and vegetation.
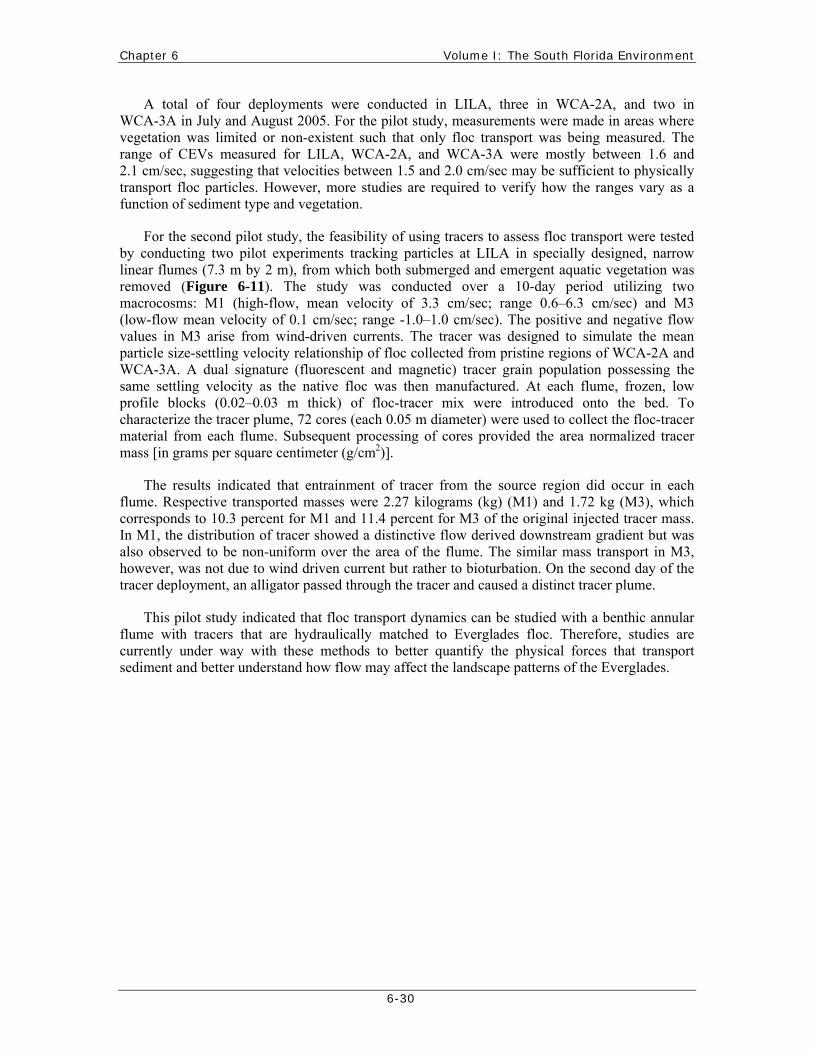
For the second pilot study, the feasibility of using tracers to assess floc transport were tested by conducting two pilot experiments tracking particles at LILA in specially designed, narrow linear flumes (7.3 m by 2 m), from which both submerged and emergent aquatic vegetation was removed (Figure 6-11). The study was conducted over a 10-day period utilizing two macrocosms: M1 (high-flow, mean velocity of 3.3 cm/sec; range 0.6–6.3 cm/sec) and M3 (low-flow mean velocity of 0.1 cm/sec; range -1.0–1.0 cm/sec). The positive and negative flow values in M3 arise from wind-driven currents. The tracer was designed to simulate the mean particle size-settling velocity relationship of floc collected from pristine regions of WCA-2A and WCA-3A. A dual signature (fluorescent and magnetic) tracer grain population possessing the same settling velocity as the native floc was then manufactured. At each flume, frozen, low profile blocks (0.02–0.03 m thick) of floc-tracer mix were introduced onto the bed. To characterize the tracer plume, 72 cores (each 0.05 m diameter) were used to collect the floc-tracer material from each flume. Subsequent processing of cores provided the area normalized tracer mass [in grams per square centimeter (g/cm2)].
The results indicated that entrainment of tracer from the source region did occur in each flume. Respective transported masses were 2.27 kilograms (kg) (M1) and 1.72 kg (M3), which corresponds to 10.3 percent for M1 and 11.4 percent for M3 of the original injected tracer mass. In M1, the distribution of tracer showed a distinctive flow derived downstream gradient but was also observed to be non-uniform over the area of the flume. The similar mass transport in M3, however, was not due to wind driven current but rather to bioturbation. On the second day of the tracer deployment, an alligator passed through the tracer and caused a distinct tracer plume.
This pilot study indicated that floc transport dynamics can be studied with a benthic annular flume with tracers that are hydraulically matched to Everglades floc. Therefore, studies are currently under way with these methods to better quantify the physical forces that transport sediment and better understand how flow may affect the landscape patterns of the Everglades.
6-30

2007 South Florida Environmental Report Chapter 6
Figure 6-11. M1 flume at LILA used for tracer study. (Photo by SFWMD.) Orange caps indicate sampling locations. The Acoustic Doppler Velocity meter is located on
the central PVC post. The tracer blocks (top of picture) were also added.
BIOMARKERS ON TREE ISLANDS
Previous reports have shown that tree island soils contain high levels of P and may represent the largest sink of P in the unaltered parts of the Everglades. These high concentrations are hypothesized to originate from wading bird guano (Orem et al., 2002; Wetzel et al., 2005). Understanding the sources and cycling of this P is, therefore, important for determining how the natural ecosystem manages this generally limiting nutrient. Recently, the redistribution of P from the marsh to tree islands was hypothesized to be necessary not only for tree island growth and expansion but also for maintaining oligotrophic conditions in the adjacent marsh (Wetzel et al., 2005). In order to test this potential redistribution, the District is working on determining the concentrations and variability of soil total phosphorus (TP) and organic geochemical indicators, i.e., wading bird biomarkers, on tree islands that support active wading bird colonies. In addition to assessing the transport of P in the ecosystem, the development of organic biomarkers of wading bird guano may provide a suitable method for establishing the presence and numbers of wading birds on tree islands, both in the present and historically. To be clear, this technique is in development phase, so biomarkers may not be used. It has been hypothesized that the large colonies that currently exist in the interior of the Everglades is a recent phenomenon, and CERP
6-31
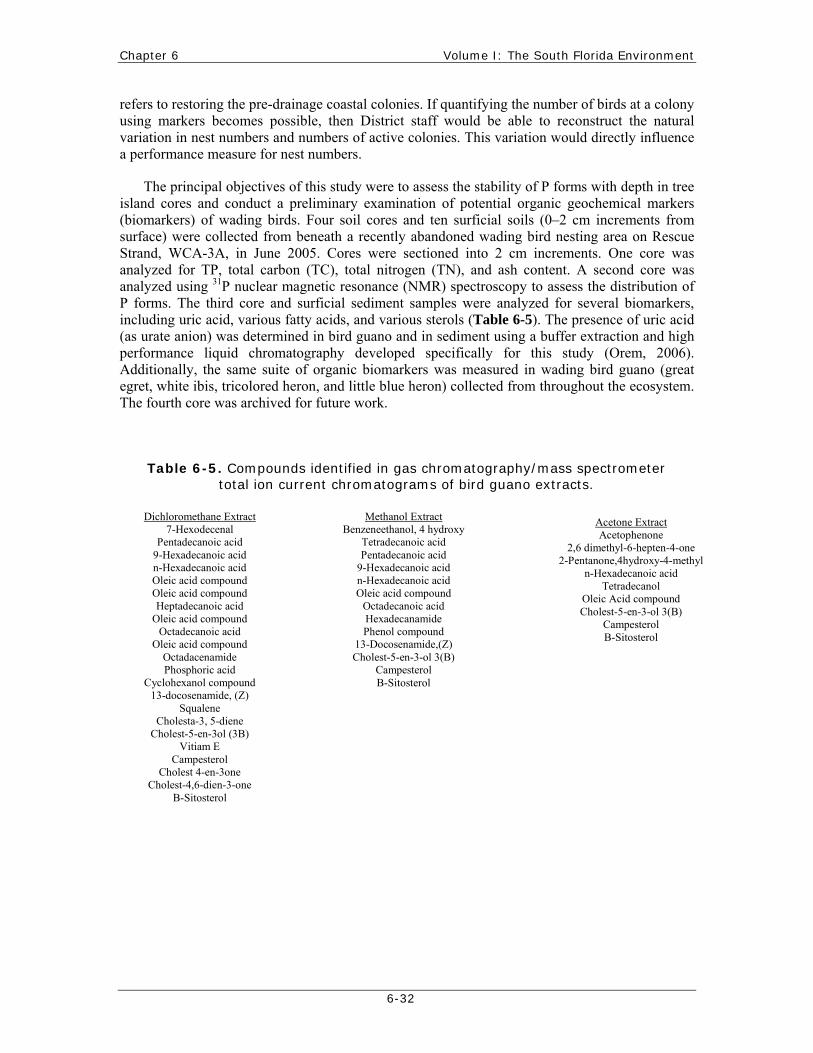
Chapter 6 Volume I: The South Florida Environment
refers to restoring the pre-drainage coastal colonies. If quantifying the number of birds at a colony using markers becomes possible, then District staff would be able to reconstruct the natural variation in nest numbers and numbers of active colonies. This variation would directly influence a performance measure for nest numbers.
The principal objectives of this study were to assess the stability of P forms with depth in tree island cores and conduct a preliminary examination of potential organic geochemical markers (biomarkers) of wading birds. Four soil cores and ten surficial soils (0–2 cm increments from surface) were collected from beneath a recently abandoned wading bird nesting area on Rescue Strand, WCA-3A, in June 2005. Cores were sectioned into 2 cm increments. One core was analyzed for TP, total carbon (TC), total nitrogen (TN), and ash content. A second core was analyzed using 31P nuclear magnetic resonance (NMR) spectroscopy to assess the distribution of P forms. The third core and surficial sediment samples were analyzed for several biomarkers, including uric acid, various fatty acids, and various sterols (Table 6-5). The presence of uric acid (as urate anion) was determined in bird guano and in sediment using a buffer extraction and high performance liquid chromatography developed specifically for this study (Orem, 2006). Additionally, the same suite of organic biomarkers was measured in wading bird guano (great egret, white ibis, tricolored heron, and little blue heron) collected from throughout the ecosystem. The fourth core was archived for future work.
Table 6-5. Compounds identified in gas chromatography/mass spectrometer total ion current chromatograms of bird guano extracts.
Dichloromethane Extract 7-Hexodecenal
Pentadecanoic acid 9-Hexadecanoic acid n-Hexadecanoic acid Oleic acid compound Oleic acid compound Heptadecanoic acid
Oleic acid compound Octadecanoic acid
Oleic acid compound Octadacenamide Phosphoric acid
Cyclohexanol compound 13-docosenamide, (Z)
Squalene Cholesta-3, 5-diene
Cholest-5-en-3ol (3B) Vitiam E
Campesterol Cholest 4-en-3one
Cholest-4,6-dien-3-one B-Sitosterol
Methanol Extract Benzeneethanol, 4 hydroxy
Tetradecanoic acid Pentadecanoic acid
9-Hexadecanoic acid n-Hexadecanoic acid Oleic acid compound
Octadecanoic acid Hexadecanamide Phenol compound
13-Docosenamide,(Z) Cholest-5-en-3-ol 3(B)
Campesterol B-Sitosterol
Acetone Extract Acetophenone
2,6 dimethyl-6-hepten-4-one 2-Pentanone,4hydroxy-4-methyl
n-Hexadecanoic acid Tetradecanol
Oleic Acid compound Cholest-5-en-3-ol 3(B)
Campesterol B-Sitosterol
6-32
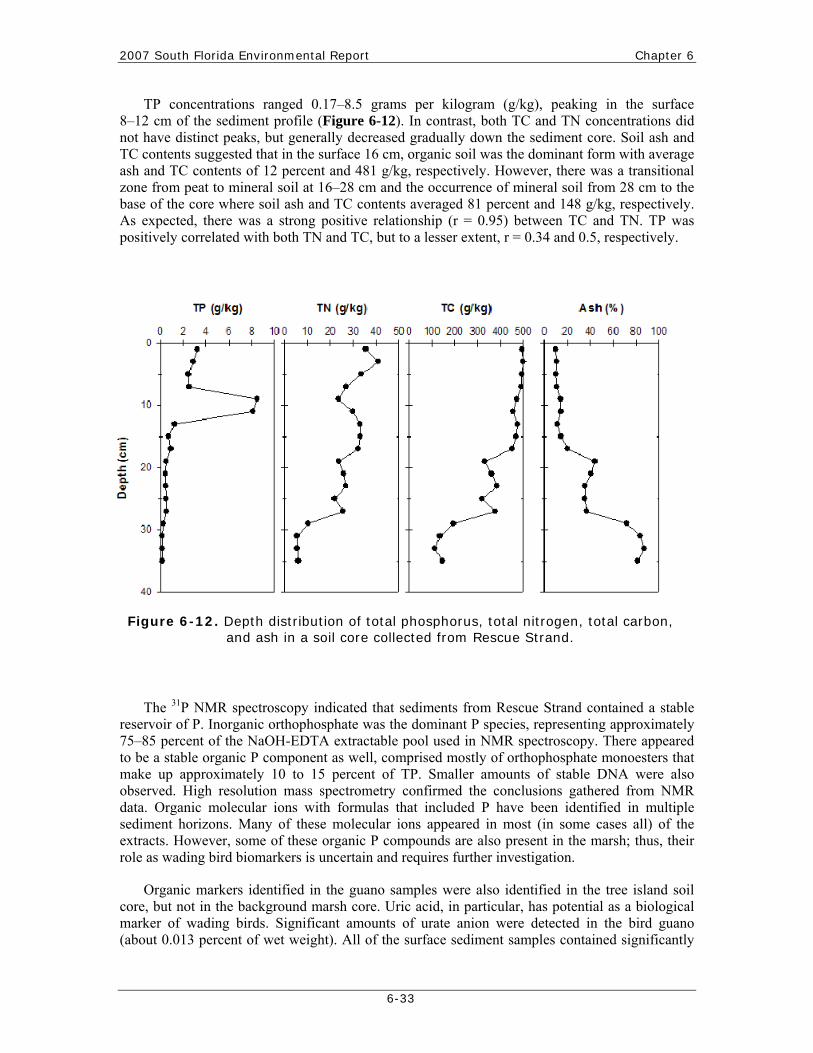
2007 South Florida Environmental Report Chapter 6
TP concentrations ranged 0.17–8.5 grams per kilogram (g/kg), peaking in the surface 8–12 cm of the sediment profile (Figure 6-12). In contrast, both TC and TN concentrations did not have distinct peaks, but generally decreased gradually down the sediment core. Soil ash and TC contents suggested that in the surface 16 cm, organic soil was the dominant form with average ash and TC contents of 12 percent and 481 g/kg, respectively. However, there was a transitional zone from peat to mineral soil at 16–28 cm and the occurrence of mineral soil from 28 cm to the base of the core where soil ash and TC contents averaged 81 percent and 148 g/kg, respectively. As expected, there was a strong positive relationship (r = 0.95) between TC and TN. TP was positively correlated with both TN and TC, but to a lesser extent, r = 0.34 and 0.5, respectively.
Figure 6-12. Depth distribution of total phosphorus, total nitrogen, total carbon, and ash in a soil core collected from Rescue Strand.
The 31P NMR spectroscopy indicated that sediments from Rescue Strand contained a stable reservoir of P. Inorganic orthophosphate was the dominant P species, representing approximately 75–85 percent of the NaOH-EDTA extractable pool used in NMR spectroscopy. There appeared to be a stable organic P component as well, comprised mostly of orthophosphate monoesters that make up approximately 10 to 15 percent of TP. Smaller amounts of stable DNA were also observed. High resolution mass spectrometry confirmed the conclusions gathered from NMR data. Organic molecular ions with formulas that included P have been identified in multiple sediment horizons. Many of these molecular ions appeared in most (in some cases all) of the extracts. However, some of these organic P compounds are also present in the marsh; thus, their role as wading bird biomarkers is uncertain and requires further investigation.
Organic markers identified in the guano samples were also identified in the tree island soil core, but not in the background marsh core. Uric acid, in particular, has potential as a biological marker of wading birds. Significant amounts of urate anion were detected in the bird guano (about 0.013 percent of wet weight). All of the surface sediment samples contained significantly
6-33

Chapter 6 Volume I: The South Florida Environment
more uric acid than any of the core sediment sections (Figure 6-13). The core sediment sections contained relatively higher uric acid concentrations in the topmost sections. Uric acid contents dropped sharply below 8 cm depth and then gradually declined down to a depth of 26 cm. No uric acid was detected in sediment sections between 26 cm and 34 cm depth. Uric acid was not detectable in a control sample from the topmost section of a core collected in a marsh area west of Gumbo Limbo Tree Island. Bird droppings contained at least 30 times greater concentration of uric acid than any of the sediment samples. The control sediment and bird guano samples can be considered the lowest and highest values, respectively.
A control tree island was part of the original sampling strategy, but there was difficulty in determining which tree islands had never been used as colony sites. Eventually, a small tree island without a known wading bird colony history was originally selected as a “control.” However, upon visitation it was observed to be covered with bird guano, which appeared to be from the two-three pairs of great blue herons that were nesting there. Thus, further search for an island that does not have any history of wading bird use is under way; in the interim, the marsh was used as an indicator of unimpacted soil conditions. Interestingly, because the hypothesis in Wetzel et al. (2005) is that the growth and sustainability of an Everglades tree island may be dependent on nutrient inputs from wading birds, it may not be possible to find a tree island that meets the criteria of never having wading bird nutrient input. Rather, the biomarkers, when linked with dating, may show the degree and timing of use.
While there was no exact depth correlation of peak TP and peak biomarkers determined, it was likely due to uneven terrain of tree island soil surface, creating few centimeter distinction. In future sampling events, this distinction will be addressed by splitting the samples differently. Preliminary results do suggest that some organic P compounds are stable in Everglades sediments and can serve as biomarkers to indicate historical changes in bird populations. If upon refinement of this pilot study it is found that tree island biomarkers can be linked to historic wading bird distributions and abundance, then future linkages with historic mercury accumulation and distribution will be considered.
6-34

2007 South Florida Environmental Report Chapter 6
Uric Acid Surface Soil (ug/g dry wt.)
7.9 3.2 1.2 0.5 5.0 0.5 0.7 0.8
Uric Acid Bird Guano
(ug/g dry wt.) 316 (avg.)
Uric Acid Everglades Marsh Peat
(ug/g dry wt.) Not detectable
(<0.01)
Uric Acid in Soils from Rescue Strand
Figure 6-13. Distribution of uric acid downcore in surficial soil and bird guano samples from Rescue Strand.
6-35
Chapter 6 Volume I: The South Florida Environment
CATTAIL HABITAT IMPROVEMENT PROJECT
The Everglades developed as an oligotrophic P-limited ecosystem with rainfall providing the primary nutrient source. However, four decades of anthropogenic nutrient inputs have caused extensive changes in the structure and function of these wetlands. While restoration efforts have focused on reducing concentrations and loads to the region via the implementation of stormwater treatment areas and on-farm management techniques, a significant portion of the Everglades ecosystem remains impacted with high levels of phosphorus. Phosphorus-enriched areas are readily evidenced by over 11,000 hectares (ha) of monotypic cattail (Typha spp.) stands that have replaced the original sawgrass and slough mosaic. This has resulted in considerable attention on removing cattail as a restoration approach, despite the recognition that cattail removal is addressing the symptom as opposed to solving the problem. Additionally, large-scale cattail removal may be detrimental because the dense cattail areas adjacent to inflow points currently serve an important ecosystem function, protecting downstream pristine areas through their rapid growth and P removal. Alternatively, intensive large-scale restorations efforts (e.g., peat removal or addition of chemical amendments) will likely be more disruptive and harmful to the Everglades ecosystem than allowing the ecosystem to recover naturally. However, ecosystem function could be enhanced by recognizing the constraints inherent in a monotypic cattail community. That is, there may be some active management strategies that can be implemented in conjunction with a “natural recovery strategy” that may improve ecological function, and thereby contribute to the overall intent of Everglades restoration. A key restraint is the density of the vegetation resulting in net heterotrophic production and limited access by wildlife. Therefore, the first objective in this research project is to assess whether creating openings in dense cattail areas would sufficiently alter trophic dynamics to increase wildlife diversity and abundance. As the goal of restoration is to return the Everglades to pre-drainage conditions as much as possible, the second objective becomes determining to what extent the structure and function of these created open areas compare with those of the natural Everglades. Combining the responses of these two objectives will allow the District to make recommendations on this active management strategy as a means to accelerate ecosystem recovery. Thus, a large-scale, in situ study, the Cattail Habitat Improvement Project (CHIP), consisting of 15 plots each measuring 250 by 250 m in a replicated factorial design, was designed to test the District’s ability to rehabilitate cattail areas. This study was externally peer reviewed and approved in March 2005. Plots were created using a combination of herbicides and fire. The plots were burned in July 2006, and water quality sampling was subsequently initiated.
The fundamental CHIP hypothesis is that creating openings in P impacted landscapes will cause a shift from the emergent macrophyte-detrital system to one dominated by algae or SAV. In doing so, changes in critical ecosystem processes and food web dynamics will occur. Measures of ecosystem structure (e.g., periphyton composition, plant community composition, soil and water physicochemical characterization, fish community structure, wading bird and secretive bird species composition), ecosystem function (e.g., primary productivity, secondary productivity, heterotrophic respiration, N and P mineralization rates, plant decomposition), and ecosystem stoichiometry (e.g., C:N:P ratios of floc, soil, periphyton, plants, fish) will be simultaneously made within each CHIP plot to discern the food web dynamics and compare among treatments (Figure 6-14). Because of the interdependency of community structure and ecosystem function, it is important to link the nutrient supply and food web structure together. Using a stoichiometric approach for food-web dynamics, traditional methods of assessing the food web (species composition and density) will be coupled with the nutrient status and elemental composition of various components of the ecosystem. Results from this study will foster recommendations on an approach to accelerate ecosystem recovery. If these managed plots are sustainable after three
6-36

2007 South Florida Environmental Report Chapter 6
years, then further studies, such as the interaction of vegetation mosaics, can be explored in subsequent years.
Figure 6-14. Conceptual model of hypotheses being tested in the Cattail Habitat Improvement Project (CHIP).
THE LONG-TERM PLAN
Hydropattern Restoration Downstream of STAs
Water Conservation Area 2A
In accordance with EFA Permit No. 0126704, the District began operating STA-2 in July 2001, and monitoring the hydropattern and ecological response in the northwestern portion of WCA-2A. A historical record of this monitoring can be found within the 2006 SFER – Volume I, Chapter 6. STA-2 primarily discharges into WCA-2A through six culverts (the G-336A through G-336F structures) (Figure 6-15). Additional STA-2 effluent is discharged via the G-336G structure into a discharge canal south of STA-2. Approximately 1 kilometer northeast of the S-7 pump station, the levee separating this discharge canal from WCA-2A is degraded; this allows passive discharge to enter WCA-2A from the G-336G structure. In 2005, a new transect (FS-transect) was established to monitor this additional STA-2 discharge.
6-37

Chapter 6 Volume I: The South Florida Environment
Figure 6-15. Map of the WCA-2A STA-2 discharge area. Map includes sampling stations (solid circles), STA-2 inflow locations (solid squares), and
adjacent pump stations (gray squares).
Changes within the macrophyte community downstream of STA-2 discharge were monitored with a line-intercept survey technique and permanent transects at every station throughout the WCA-2A monitoring area. Only the WY2005 data are available for this report and are presented in association with the WY2005 mean surface water TP concentrations, mean soil TP concentrations, and WY2005 relative water depths (Figure 6-16). The gradient of cattail densities across the discharge area indicates that stations closest to the L-6 levee have higher densities while those stations farthest from the L-6 levee display very little to no cattail. The soil data at the 2 km station suggest that the processes of TP accumulation precedes the occurrence of cattail invasion.
6-38

2007 South Florida Environmental Report Chapter 6
Figure 6-16. Bar graph displaying the WY2005 WCA-2A macrophyte line-intercept survey data for cattail plants only. Each bar represents a group of stations that are the
same distance from the L-6 levee (the FS3.0 station was included with the 4 km stations; refer to Figure 6-15). The bars show the mean percentage of points (with
standard error) along the transects that are touching cattail plants. The table imbedded within the bar graph displays associated WY2005 mean surface water total phosphorus concentrations (mg/L), mean total phosphorus concentrations for the 0–10 cm layer of soil (mg/kg) and mean water depths (m) measured when water was collected from that
group of stations. The number of samples collected is also included in the imbedded table. Surface water samples were not collected at the 0.5 km stations.
2005 Cattail Coverage Across Northwestern WCA-2A 90%
100%
56%
27%
14%
0% 0%0%
10%
20%
30%
40%
50%
60%
70%
80%
0.25 km 0.5 km 1.0 km 2.0 km 3.0/4.0 km
Distance From the L-6 Levee
Mea
n Pe
rcen
tage
of P
oint
s To
uchi
ng C
atta
il Pl
ants
2005 Mean Surface Water Total Phosphorus & Water Depth including Standard Error
Distance from L-6 Mean SW TP (mg/L) N Mean Depth (m) N
0.25 km 0.016 ± 0.001 40 0.66 ± 0.03 41 1.0 km 0.013 ± 0.001 39 0.56 ± 0.04 42 2.0 km 0.009 ± 0.001 40 0.44 ± 0.04 46 3.0/4.0 km 0.007 ± 0.001 42 0.42 ± 0.03 47
Distance from L-6 Mean Soil TP (mg/kg) N
0.25 km 698 ± 62 12 0.5 km 601 ± 36 9 1.0 km 593 ± 59 12 2.0 km 608 ± 37 12 4.0 km 467 ± 19 12
6-39

Chapter 6 Volume I: The South Florida Environment
Rotenberger Wildlife Management Area
The Rotenberger Wildlife Management Area (RWMA), located in the northern Everglades, is an 11,784 ha marsh undergoing hydropattern restoration via inflows from STA-5 in accordance with EFA Permit No. 0131842. Historical records of the RWMA monitoring were noted within the 2004 Everglades Consolidated Report and the 2006 South Florida Environmental Report – Volume I. Changes within the RWMA macrophyte community were monitored employing the same line-intercept survey technique utilized for WCA-2A. Only the WY2005 data were available for this report and are presented in association with the 2005 mean surface water TP concentrations, mean soil TP concentrations, and relative mean water depths (Figure 6-17). The mean soil TP exceeded 650 mg/kg within the Group 4 stations only (RA4, RB4, RC4, and RD4). These are the stations closest to the G-402 outflow structures. The limited amount of cattail at these sites is likely explained by the fact that this group of stations is very dry within the RWMA. This detail seems to validate the hypotheses that both high soil TP concentrations (greater than 650 mg/kg) and deeper water depths together increase the likelihood of cattail expansion within the northern Everglades marsh environment (Wu et al., 1997; Newman et al., 1998).
6-40

2007 South Florida Environmental Report Chapter 6
2005 Cattail Coverage Across the Rotenberger Wildlife Management Area
90%
100%
s
46%
62%
9%12%
0%
10%
20%
30%
40%
50%
60%
70%
80%
Mea
n Pe
rcen
tage
of P
oint
s To
uchi
ng C
atta
il Pl
ant
Group 1RA1*, RB1, RC1*, RD1, & RE1
Group 2RA2*, RB2, RC2*, RD2, & RE2
Group 3RA3*, RB3, RC3*, RD3, & RE3
Group 4RA4*, RB4, RC4*, RD4, & RE4
*2005 Mean Surface Water Total Phosphorus & Water Depth including Standard Error
Station Group Mean SW TP (mg/L) Mean Depth (m) N
1- RA1 & RC1 0.112 ± 0.023 0.35 ± 0.03 14 2- RA2 & RC2 0.018 ± 0.002 0.30 ± 0.02 14 3- RA3 & RC3 0.018 ± 0.002 0.27 ± 0.02 13 4- RA4 & RC4 0.015 ± 0.001 0.25 ± 0.02 14
Station Group Mean Soil TP (mg/kg) N 1-RA1, RB1, RC1 & RD1 458 ± 21 12 2-RA2, RB2, RC2 & RD2 480 ± 38 12 3-RA3, RB3, RC3 & RD3 432 ± 33 12 4-RA4, RB4, RC4 & RD4 686 ± 65 12
Figure 6-17. Bar graph displaying the WY2005 Rotenberger Wildlife Management Area (RWMA) macrophyte line-intercept survey data for cattail plants only. Each bar represents a group of stations that have a similar proximity from the G-410 pump station (Group 1 being the closest and Group 4 being the furthest). The bars show the mean percentage of points
(with standard error) along the transects that are touching cattail plants. The table imbedded within the bar graph displays associated mean WY2005 surface water TP concentrations (mg/L), mean 2005 TP concentrations for the 0–10 cm layer of soil (mg/kg), and mean
water depths (m) measured when water was collected from that group of stations. Surface water was only sampled at the RA and RC transects and soil samples were collected from the
RA, RB, RC, and RD transects.
6-41

Chapter 6 Volume I: The South Florida Environment
As noted in the 2006 SFER – Volume I, Chapter 6, the District initiated a temporary change in the operation of the G-402A through G-402D structures in an effort to more fully hydrate the RWMA and achieve stage targets as modeled by the Natural Systems Model (NSM). Monitoring of internal stages indicated that the hydropattern restoration goal was generally achieved for 2005 calendar year even though the stages fell short of the NSM target during the height of the wet season (Figure 6-18). However, during the first five months of calendar year 2006, rainfall was very limited, and the stage fell well below the NSM goal. In May 2006, at the peak of a very dry, dry-season, a severe fire occurred within the RWMA and burned approximately 95 percent of the tract. This included peat fires throughout much of the northern section of the RWMA. The District is currently evaluating any long- and/or short-term effects from this fire, including the soil nutrient flux after rehydration within both peat and surface burned areas of the marsh as well as documenting the post-burn recovery of vegetation (especially cattail) across the tract.
11
11.5
12
12.5
13
13.5
14
Jan Feb Mar Apr May Jun Jul Aug Sep Oct Nov Dec
Month
Stag
e N
GVD
(ft)
2005 Stage2006 StageInterim Ops Target95% conf upper95% conf lower
Figure 6-18. Hydrograph displaying the monthly mean stage target elevations with 95 percent confidence intervals determined by the Natural Systems Model (NSM) for the RWMA including a 0.25 foot offset. Also displayed are the mean stages within the RWMA for each month from January 2005 through May 2006.
ACCELERATING RECOVERY OF IMPACTED AREAS
The goals of the overall Accelerating Recovery project of the Long-Term Plan involve the scientific evaluation of methods to accelerate the recovery of areas that are currently eutrophic. “Natural” recovery processes are estimated to take decades to achieve some level of recovery of the structure and function of the ecosystems within the landscape. In addition to natural recovery, there is the question of whether there are other potentially effective options of managing the water and nutrient flows in the Everglades in order to more rapidly restore nutrient impacted areas. Modeling and long-term, large-scale field experiments are being implemented to better understand the ecosystem processes and habitat responses to active management.
6-42

2007 South Florida Environmental Report Chapter 6
Recovery Model Development and Calibration
The objective of this project is to develop and calibrate models capable of predicting the response of impacted ecosystems in the EPA to improved water quality. The primary need for these models is to evaluate the spatial extent and temporal distribution of recovery in the EPA. Currently, two environmental models are supported by the District’s Hydrologic & Environmental Systems Modeling Department to meet these needs: the Everglades Landscape Model (ELM) and the Regional Simulation Model with Water Quality (RSM-WQ). The ELM has been developed to integrate and evaluate the impact of hydrology, vegetation, and changing P loads on surface water P concentrations in the greater Everglades. The RSM-WQ was initiated to add water quality and ecological components to the advanced hydrologic simulation engine of RSM. Both models are designed as integrated environmental system models capable of simulating nutrient transport and transformations as well as vegetation, periphyton, and soil processes.
Everglades Landscape Model
The goal of this project is to refine and calibrate the ELM in a collaborative research and modeling effort. The regional application of this ecological model uses a model grid with 1 km2 resolution that encompasses more than 10,000 km2 of the greater Everglades system. This model (ELM v2.5) and its application were independently reviewed by a panel of experts, and the Final Report by the review panel was due in January 2007. The regional ELM v2.5 is fully documented on the District’s web site at www.sfwmd.gov under the What We Do, Simulation Modeling section.
Most of the field research in this Accelerated Recovery project is being conducted in WCA-2A. The Model Performance Chapter of the regional ELM documentation summarized the observed and simulated data along the WCA-2A eutrophication gradient, including comparisons of variables such as water column P concentration, net P accumulation in the ecosystem, soil peat accretion, and cattail succession. Based on observed data from 78 monitoring locations distributed throughout the greater Everglades, the ELM v2.5 exhibited a median bias of 2 µg/L (ppb) in predicting P concentrations in marsh surface waters.
Using the same model code and parameters as the regional ELM, finer-scaled ELM applications (with 100–500 m grids) in WCA-2A are the current test beds for assimilating advances in the process-oriented ecological research being conducted for the Accelerated Recovery project. Comprehensive field efforts (in the Fire Project and CHIP) are targeting some of the uncertainties associated with the recovery of previously impacted areas. An enhanced understanding of the effects of fire on soil and vegetation processes will be reflected in future refined model performance. Hierarchical sensitivity analyses (the Uncertainty Chapter of the ELM documentation) have highlighted the importance of the rate processes associated with soils, including the contributions from the overlying floc layer and live plant/periphyton material. Continued advancements in understanding these interactions, in combination with understanding the effects of flow on these components, will provide the scientific insight into restoration potentials that can be extrapolated across larger spatiotemporal scales via simulation.
Water Quality Module for Regional Simulation Model
A water quality module (RSM-WQ) for the South Florida region has been developed under a USGS, and SFWMD cooperative agreement with UF. Currently, the water quality transport module is implemented as a series of libraries that enables the Regional Simulated Model to
6-43

Chapter 6 Volume I: The South Florida Environment
numerically approximate the solution of the advection-dispersion-reaction equation. Presently a limited number of mobile and non-mobile water quality components along with their interactions and associated parameters are included to be flexibly defined through standardized XML input files.
Since WY2005, a simple water quality module with surface water transport has been coded and tested on a hierarchy of benchmarks. The basic functionality has been verified against a set of exact solutions for transport in this benchmark setting. A series of wetland P cycling algorithms with increasing levels of complexity has been constructed, and sensitivity analyses have been completed on these implementations. A P model with a simple uptake and release mechanism has been developed, tested, and calibrated in Cell 4 of STA-1W. A subregional implementation has been constructed for the WCA-2A to further develop and refine the water quality modules in natural areas.
The RSM-WQ modules are to be enhanced with additional functionality. Features such as transport for groundwater, canals, and their interaction with surface water are to be developed in FY2007. The RSM-WQ model will be verified for hydrology, transport of a conservative solute, and transport of non-conservative element such as TP using several P models as well as a comprehensive nutrient-cycling model.
The Fire Project: Assessing Long-Term Ecological Effects of Fire
Decades of P loading from agricultural runoff into the northern Everglades have significantly changed the structure and function of this region. Thousands of hectares of historically oligotrophic areas, characterized by open sloughs and sawgrass (C. jamaicense) dominated ridges, have responded to the nutrient loading by shifting towards dense monotypic stands of cattail (T. domingensis). So far, restoration efforts of the Long-Term Plan have focused on reducing or eliminating the nutrient load to the WCAs by creating a series of stormwater treatment areas, best management agriculture practices, and other advanced treatment technologies. With the elimination of nutrient loading into the WCAs, natural recovery of the eutrophied areas is anticipated; however, this process is estimated to take decades and therefore methods for accelerating the recovery process under the Long-Term Plan are required (see also Chapter 8 of this volume). One option under the Long-Term Plan for accelerated recovery of the impacted areas is the use of prescribed fire.
Historically, fire was a common occurrence in the Everglades. Fires ignited by lightning storms burned until they encountered a slough, some other barrier, or were extinguished by rain. These fires burned irregularly, leaving a mosaic of burned and unburned vegetation in their path that may have contributed to the creation and maintenance of the ridge and slough topography typical in the Everglades. Fire clears dead and decaying vegetation and releases nutrients critical for the growth of new vegetation. Sawgrass and its dominated communities in the Everglades have been suggested to tolerate or even require occasional burning (Wade et al., 1980; Lockwood et al., 2003). However, natural fire frequencies in the Everglades were altered as a consequence of anthropogenic impacts such as altered hydrology, compartmentalization, and loss of habitat (Taylor, 1980 and 1981; Beckage et al., 2003; Liu et al., 2003).
Although prescribed fire is a common tool for vegetation management in the Everglades, there are a number of fire-related processes that are not well understood. There are few scientifically sound studies that quantify fire’s temporal, seasonal, and spatial effects particularly in the northern Everglades. Many aspects of fire ecology in the Everglades have yet to be studied. The Fire Project was designed to help fill some of those gaps by focusing largely on spatial and
6-44

2007 South Florida Environmental Report Chapter 6
temporal effects. Naturally-induced fires (i.e., lightning strikes) are most common during the summer wet season; however, it has been found that prescribed burning before the growing season when water levels are low (March–May) provided greater benefit to sawgrass growth than burning from October through December (Forthman, 1973). Forthman also found that two years of burning did not diminish the ability of sawgrass to regenerate. Ponzio et al. (2004) noticed that after a single summer burn that both sawgrass and cattail initially increase in density but returned to pre-burn levels within three to four years.
This Fire Project was initiated to assess whether repeated prescribed fire can be used as an effective management tool to reduce cattail expansion and accelerate the recovery of sawgrass communities in a P-enriched area. There are two main questions driving the Fire Project study: (1) whether multiple fires cause a shift in the dominant vegetation from cattail to native vegetation, such as sawgrass, and (2) whether multiple fires increase soil P sequestration. The first question addresses the hypothesis that multiple fires will cause cattail to decline since it is less fire adapted than sawgrass. To date, most studies have only focused on the effects of a single fire, leaving the effects of multiple fires uncertain. The second question addresses the hypothesis that as P loading to the area is reduced, newly generated low P-content peat will accumulate on top and eventually bury the high P-content peat below the active root zone, thereby sequestering the P.
Six experimental plots were used in a Before-After Control-Impact Paired Series design, with paired plots established along pre-existing transects that follow the soil P gradient in northern WCA-2A (Figure 6-19). Treatment sites (E transect) are paired with control sites (F transect) in the highly-enriched areas (cattail dominated, soil P between 1,000 and 1,200 mg/kg) and moderately-enriched sites (cattail/sawgrass mix, soil P between 600 and 1,000 mg/kg). The treatment plots will be burned periodically while the control sites will remain untouched. In addition, there are two reference sites in the unenriched area (soil P less than 500 mg/kg): one dominated by sawgrass, and the other a mix of sawgrass and cattail. Each plot measures 300 m by 300 m and has six sampling locations: one upstream, three within the plot, and two downstream (Figure 6-20). At least four annual prescribed burns are planned between WY2006 and WY2009. Burns are planned for the winter when plant growth rates are at their lowest.
6-45

Chapter 6 Volume I: The South Florida Environment
Figure 6-19. WCA-2A with six experimental plots. H1 – highly enriched/unburned; H2 – highly enriched/burned; M1 – moderately
enriched/unburned; M2 – moderately enriched/burned; RC – reference cattail; RS – reference sawgrass. E, F, and U transects represent long-term water
quality monitoring sites.
6-46

2007 South Florida Environmental Report Chapter 6
Figure 6-20. Plot design of each of the six sites within WCA-2A.
Sawgrass Reference Site
Highly Impacted Control Site Highly Impacted Treatment Site
Moderately Impacted Control Site Moderately Impacted Treatment Site
Cattail Reference Site
Several substudies have been initiated under the Fire Project to capture the many ecosystem processes that may be impacted by fire (Figure 6-21). These processes include water quality, soil and vegetation nutrient biogeochemistry, biomass production and storage, and species dynamics. All the plots have been established, and infrastructures such as boardwalks and sampling stations have been installed. Sampling for each of the substudies began in summer 2005. The first prescribed fire was conducted in July 2006 at the highly enriched treatment plot. In order to minimize the labor intensive plant biomass sampling, an allometric substudy is being conducted to establish relationships between plant measurements and plant biomass. Permanent quadrats have also been established to follow new growth, leaf turnover, plant turnover, and species density.
6-47

Chapter 6 Volume I: The South Florida Environment
Figure 6-21. Major ecosystem processes assessed by the Fire Project.
Pre- and post-fire data collection occurred in July 2006 for the highly and moderately enriched plots. Control and reference data have been collected from the remaining plots. An initial seed bank substudy, which determines what viable seeds are available for recruitment after fire, indicates that the seed bank varies along the P gradients with the highest species diversity in the highly enriched areas. Community carbon production was measured in the moderately enriched treatment site in February 2006 as the changes in dissolved oxygen concentration of the wildfire burned areas showed a slightly increased trend. This periphyton production increase was probably due to the rainy season rise in water levels and the reduced canopy cover associated with the prescribed burn, allowing more light to penetrate the surface water. This hypothesis was supported by the increases in periphyton biomass observed after the first prescribed fire at the highly enriched plot, when water levels were higher.
Soil samples have been collected quarterly since July 2005 as part of a soil biogeochemistry substudy to determine if the highly P-enriched peat is being buried by newly accreted, relatively lower P-content peat. These data indicate a P gradient in the upper layers of soil while there is little difference in P content below 20 cm down core (Figure 6-22). Surface and pore water samples have been collected on a monthly basis since September 2005.
Physical parameters within these plots have also been monitored, including temperature, light attenuation, and redox. One result from the light attenuation substudy is that attenuation continues to increase for several weeks after the fire because not all biomass was incinerated and several weeks pass before much of it reaches the ground. Aerial photographs taken of the sites are being analyzed using a Geographic Information System (GIS) to map and track the extent of cattail and sawgrass coverage.
6-48
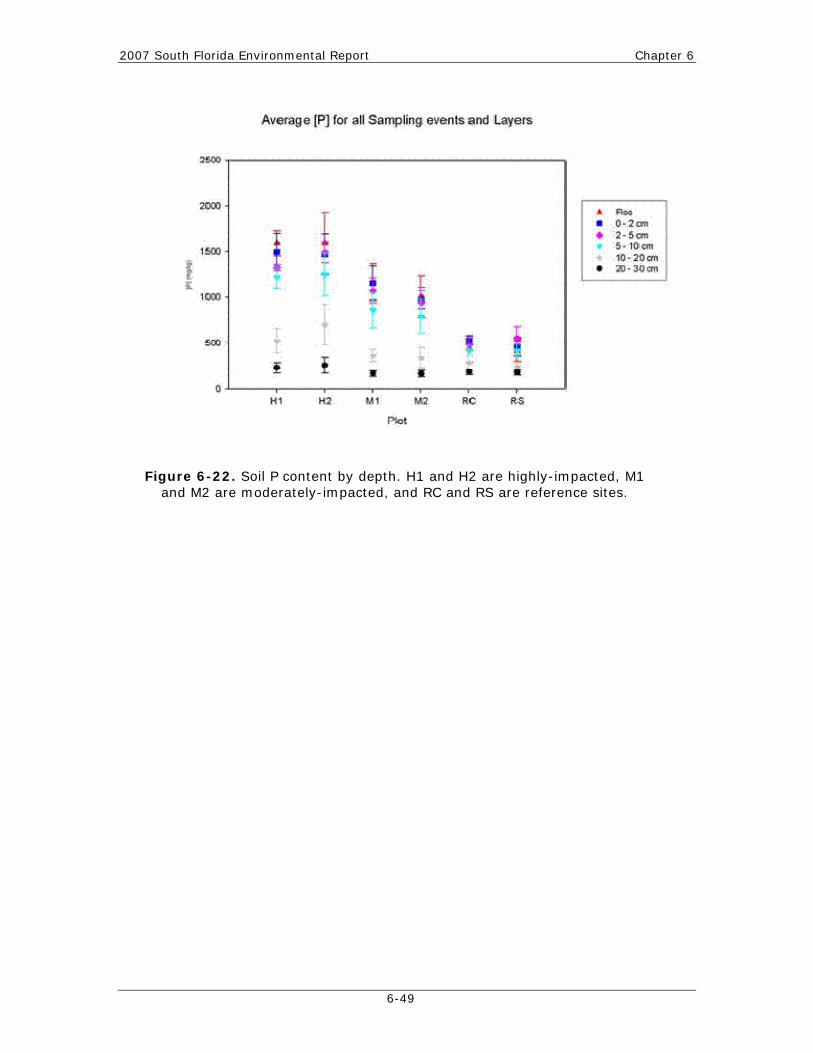
2007 South Florida Environmental Report Chapter 6
Figure 6-22. Soil P content by depth. H1 and H2 are highly-impacted, M1 and M2 are moderately-impacted, and RC and RS are reference sites.
6-49

Chapter 6 Volume I: The South Florida Environment
LANDSCAPE ECOLOGY
The District is continuing to observe the total hydro-biogeochemical system of the EPA. During the previous water year, the District updated the spatial analysis of the upper 30 cm of soil across the entire Everglades, presented a grid-based vegetation mapping project for WCA-2A, and completed construction of 31 new Class B benchmarks in the interior of WCA-3. This water year, those benchmarks were used to estimate tree island elevations, and data on decadal scale landscape changes to tree islands are presented here for the first time.
TREE ISLAND ELEVATIONS
Current restoration plans predict dramatic changes in water depth patterns over portions of the ridge and slough landscape, including a large numbers of tree islands. Thus, reliable data on the topographic elevation of tree islands is needed to forecast the effects of predicted hydrologic changes on tree islands that may affect their current community structure and spatial extent. Predicting the effects of changes in water depths and hydroperiods on tree islands, or managing water to restore tree islands, cannot be accomplished until the elevation and spatial distribution of the different types and sizes of islands are better known. Therefore, a new initiative to obtain reliable elevation measurements for tree islands was begun in WY2005.
Hydrological data from 133 tree islands visited over nine months (August 2005 through April 2006) were calculated from benchmarks established in collaboration with the FDEP (see 2006 SFER – Volume I, Chapter 6). The locations of tree islands in relation to these new benchmarks were determined using georectified aerial photographs. Tree islands were classified based on a polygon area and determined using ArcView GIS software into three different size classes representing small (0.8–4.0 ha), medium (greater than 4.0–8.0 ha), and large (greater than 8.0 ha). Hydrological data was not gathered for tree islands with areas of less than 0.8 ha.
The collection of hydrological data necessary for determining future tree island elevations required a three-step procedure. First, the benchmark associated with the tree island of interest was located, and the distance from the benchmark to the water surface was measured to the nearest millimeter. Second, a water depth measurement (also measured to the nearest millimeter) was taken at a temporary benchmark established at the edge of the tree island adjacent to the island head. The edge of a tree island was defined as the transition area between a S. caroliniana and C. occidentalis dominated community and a C. jamaicense dominated community. Finally, the Global Positioning System location of each sampled tree island was recorded at the time of measurement. Once the benchmark measurements (permanent and temporary) were recorded, a total of nine measurements of surface water or groundwater were taken at the head of the tree island.
Based on the data collected, the mean elevation of all 133 tree islands ranged from 2.4 m to 3.2 m North American Vertical Datum 1988. However, the more important measure (in terms of restoring microtopography) was the elevation of each tree island relative to the surrounding marsh. Therefore, when compared to the soil elevations of the marshes surrounding each benchmarks, the average elevation of the tree islands, relative to the sloughs in the region, ranged from 0.1 m to approximately 0.8 m (Figure 6-23). This relative tree island elevation varied from region to region. The highest average relative tree island elevations were found in the northern region of WCA-3A (mean = 0.41 m) and the lowest were found in the southern region of WCA-3B (mean = 0.32 m).
6-50

2007 South Florida Environmental Report Chapter 6
This baseline sampling will not be completed until all 600 islands in WCA-3 have been measured in 2008. The goal is to produce a map that shows the tree island elevations in terms of both absolute height above sea level and relative height above the surrounding marshes. These figures are needed for regional water management and to better predict tree island population response to CERP restoration plans. A fuller description of these results will appear in the 2009 SFER.
Figure 6-23. Four categories of average elevations measured on 133 tree islands in WCA-3A and WCA-3B from August 2005 to May 2006
relative to the surrounding marsh.
Relative Elevation0.1 – 0.3 m0.2 – 0.5 m0.3 – 0.7 m0.4 – 0.8 m
Relative Elevation0.1 – 0.3 m0.2 – 0.5 m0.3 – 0.7 m0.4 – 0.8 m
Relative Elevation0.1 – 0.3 m0.2 – 0.5 m0.3 – 0.7 m0.4 – 0.8 m
0.32 m
0.41 m
0.25 m
6-51

Chapter 6 Volume I: The South Florida Environment
6-52
HISTORICAL TREE ISLAND CHANGES
Flood control and water management measures implemented by the Central and Southern Florida Project in the late 1940s altered historic water flows and hydroperiods within the WCAs. This disrupted the entire matrix of wetland types that make up the greater Everglades, including the small topographic highs (i.e., tree islands), which historically provided suitable habitat for a wide variety of terrestrial plants and animals. Losses of tree islands have been noted in WCA-2 and WCA-3 in previous consolidated reports, but the extent of those losses has never been adequately documented.
The objective for mapping tree island changes is to gain a better understanding of the physical changes that have occurred to the tree islands of WCA-3, a 234,913 ha impoundment located in western Broward and Miami-Dade counties, during the 55 year time period between 1940 and 1995. This project is part of a larger tree island program to understand how to prevent hydrologic stress to tree island communities and manage water to restore tree islands that have disappeared.
Tree islands located in WCA-3 can be highly variable in their physical shape, size, and vegetative makeup. Typical tree and shrub species found on tree islands can include, but are not limited to, willow, wax myrtle, cypress, maple, pond apple, red bay, swamp bay, strangler fig, various tropicals, and/or exotics. Mapping conventions for this project describe tree islands as distinct groupings of trees and/or shrubs that are larger than a 1 ha minimum mapping unit. These distinct groupings were mapped from 1940s, 1950s, 1970s, 1980s, and 1990s aerial photos. The outer boundary of a tree island was defined as the outermost extent of continuous trees and/or shrubs with at least 5 percent ground coverage. The resultant GIS data show the outside boundaries of tree islands (Figure 6-24) and a decline in the number (54 percent) and hectares (65 percent) of tree islands during this overall time period. The general trend of tree island gain and loss, depicted by the map trends shown in Figure 6-24 and the time series shown in Figure 6-25, is one of dramatic declines between 1950 and 1970, right after what was a significant increase between 1940 and 1950. The increase in islands appears to come at a time before it was realized that levees were needed to conserve water during the dry season. The original drainage canals appear to be turning marsh into dry land, and the total area of islands increased from 10,000 to almost 12,000 ha. By the 1970s, all of WCA-3 had been enclosed for at least five years, and a combination of (relatively) deep, standing water combined with decades of soil oxidation caused a 50–60 percent decline in the number and extent of tree islands. The continued tree island decline between the 1970s and 1990s was probably related to the compartmentalization of WCA-3 into A and B compartments and the need to conserve water. Detailed hindcasting studies to better understand these potential cause and effect relationships are proposed for FY2007 in collaboration with the USFWS and the USGS.

outh Florida Environmental Report Chapter 6
6-53
Figure 6-24. Tree island coverage for each time period mapped from aerial photos and using a 1 ha (minimum) mapping unit. Note that canals and levees shown were in existence at each time period. In 1945,
there were some 1,200 tree islands. In 1995, the total number of islands was approximately 600.
2007 S

Chapter 6 Volume I: The South Florida Environment
Figure 6-25. Summary time-series of the tree island coverage (hectares and number of islands) for each time period mapped from aerial photos, using a 1
hectare minimum mapping unit, as shown in Figure 6-24.
6-54

2007 South Florida Environmental Report Chapter 6
LITERATURE CITED
Armentano, T.V., D.T. Jones, M.S. Ross and B.W. Gamble. 2002. Vegetation Pattern and Process in Tree Islands of the Southern Everglades and Adjacent Area. pp. 225–281. F.H. Sklar and A.G. van der Valk, eds. In: Tree Islands of the Everglades, Kluwer Publishers, Dordrecht, The Netherlands.
Beckage, B., W.J. Platt, M.G. Slocum and B. Panko. 2003. Influence of the El Niño-Southern Oscillation on Fire Regimes in the Florida Everglades. Ecology, 84: 3124–3130.
Browder, J.A., P.J. Gleason and D.R. Swift. 1994. Periphyton in the Everglades: Spatial Variation, Environmental Correlates, and Ecological Implications. pp. 379–418. S.M. Davis and J.C. Ogden, eds. In: Everglades: The Ecosystem and its Restoration, St. Lucie Press, Delray Beach, FL.
Browder, J.A., R.L. Pope and P.B. Schroeder. 1991. Quantitative Comparison of Periphyton as Food for Aquatic Animals in the Southern Everglades. Contribution No. MIA-90/91-53, Southeast Fisheries Center, National Marine Fisheries Service, Miami, FL.
Cook, M.I. and E.C. Call. 2006. System-wide Summary. M.I. Cook and E.C. Call, eds. In: South Florida Wading Bird Report. Vol. 12, South Florida Water Management District, West Palm Beach, FL.
Crozier, G.E. and D.E. Gawlik. 2003. Wading Bird Nesting Effort as an Index to Wetland Ecosystem Integrity. Waterbirds, 26: 303–324.
Davis, J.H. 1943. The Natural Features of Southern Florida. Florida Geological Bulletin #25. Florida Department of Conservation, Florida Geological Survey, Tallahassee, FL.
Ferriter, A., B. Doren, C. Goodyear, D. Thayer, J. Burch, L. Toth, M. Bodle, J. Lane, D. Schmitz, P. Pratt, S. Snow and K. Langeland. 2006. Chapter 9: The Status of Nonindigenous Species in the South Florida Environment. In: 2006 South Florida Environmental Report – Volume I, South Florida Water Management District, West Palm Beach, FL.
Frederick, P.C. and M.W. Collopy. 1989. Nesting Success of Five Ciconiiform Species in Elation to Water Conditions in the Florida Everglades. Auk., 106: 625–634.
Forthman, C.A. 1973. The effects of prescribed burning on sawgrass, Cladium jamaicense Crantz, in South Florida [M.S. Thesis]: University of Miami.
Gawlik, D.E. 2002. The Effects of Prey Availability on the Numerical Response of Wading Birds. Ecological Monographs, 72: 329–346.
Gunderson, L.H. and W.F. Loftus. 1993. The Everglades. pp. 199–255. In: Biodiversity of the Southern United States, John Wiley & Sons, Inc., New York, NY.
Heisler, I.L., D.T. Towles, L.A. Brandt and R.T. Pace. 2002. Tree Island Vegetation and Water Management in the Central Everglades. pp. 283–309. F.H. Sklar and A.G. van der Valk, eds. In: Tree Islands of the Everglades, Kluwer Publishers, Dordrecht, The Netherlands.
Hoffman, W., G.T. Bancroft and R.W. Sawicki. 1994. Foraging Habitat of Wading Birds in the Water Conservation Areas of the Everglades. pp. 585–614. S.M. Davis and J.C. Ogden, eds. In: Everglades: The Ecosystem and its Restoration. St. Lucie Press, Delray Beach, FL.
6-55

Chapter 6 Volume I: The South Florida Environment
Kushlan, J.A., J.C. Ogden and A.L. Higer. 1975. Relation of Water Level and Fish Availability to Wood Stork Reproduction in the Southern Everglades. U.S. Geological Survey Open-File Report, Tallahassee, FL.
Liu, H., E.S. Menge and P.F. Quintana-Ascencio. 2003. Population Viability Analyses of Chamaecrista keyensis: Effects of Fire Season and Frequency. Ecological Applications, 15: 210–221.
Lockwood, J.L., M.S. Ross, and J.P. Sah. 2003. Smoke on the Water: Interplay of Fire and Water Flow on Everglades restoration. Frontiers in Ecology and the Environment, 1: 462–468.
Loveless, C.M. 1959. A Study of the Vegetation in the Florida Everglades. Ecology, 40: 1–9.
Marburger J., S. Travis and S. Windels. 2005. Cattail Sleuths Use Forensic Science to Better Understand Spread of an Invasive Species. NPS Natural Resource Year in Review, pp.75–76.
Martin, T.E. 1997. Food as a Limit on Breeding Birds: A Life History Perspective. Annual Review of Ecology and Systematics, 18: 453–487.
Middelburg, J.J., C. Barranguet, H.T.S. Boschker, P.M.J. Herman, T. Moens and C.H.R. Heip. 2000. The Fate of Intertidal Microphytobenthos Carbon: An In Situ 13C-Labeling Study. Limnology and Oceanography, 45: 1224–1234.
Newman, S., J. Schuette, J.B. Grace, K.R. Rutchey, T. Fontaine, K.R. Reddy and M. Pietrucha. 1998. Factors Influencing Cattail Abundance in the Northern Everglades. Aquatic Botany, 60: 265–280.
Oestertag, R., W.L. Silver. and A.E. Lugo. 2005. Factors affecting mortality and resistance to damage following hurricanes in a rehabilitated subtropical mosit forest. Biotropica, 37 (1): 16–24.
Ogden, J.C. 1994. Status of Wading Bird Recovery – 1997. D.E. Gawlik, ed. In: South Florida Wading Bird Report. Vol. 3, South Florida Water Management District, West Palm Beach, FL.
Orem W.H. 2006. Tree Island Wading Bird Biomarker Study. Final Report to South Florida Water Management District for # PC P501993, 38 pp.
Orem W.H., D.A. Willard, H.E. Lerch, A.L. Bates, A. Boylan and M. Corum. 2002. Chapter 5: Nutrient Geochemistry of Sediments from Two Tree Islands in Water Conservation 3B, the Everglades, Florida. pp. 153–186. A. van der Valk and F. Sklar, eds. In: Tree Islands of the Everglades, Kluwer Publishers, Dordrecht, The Netherlands.
Ponzio, K.J., S.J. Miller and M.A. Lee. 2004. Long-term effects of prescribed fire on cladium jamaicense crantz and typha domingensis pers. densities. Wetlands Ecology and Management, 12:123–133.
Rader, R.B. 1994. Macroinvertebrates of the Northern Everglades: Species Composition and Trophic Structure. Florida Scientist, 57: 22–33.
Rutchey, K., L. Vilchek and M. Love. 2005. Development of a Vegetation Map for Water Conservation Area 3. Technical Publication #ERA 421. South Florida Water Management District, West Palm Beach, FL.
6-56

2007 South Florida Environmental Report Chapter 6
Rutchey, K., T. Schall and F. Sklar. In prep. Development of Water Conservation Area-2A Vegetation Map for Everglades Restoration. South Florida Water Management District, West Palm Beach, FL.
Simon, J. 2006. Water Conservation Areas of the Everglades – 2006. M.I. Cook and E.C. Call, eds. In: South Florida Wading Bird Report, Vol. 12. South Florida Water Management District, West Palm Beach, FL.
Sklar, F.H. and A.G. van der Valk. 2002. Tree Islands of the Everglades: An overview. pp. 1–18. F.H. Sklar and A.G. van der Valk, eds. In: Tree Islands of the Everglades, Kluwer Academic Publishers, Dordrecht, The Netherlands.
SFWMD. 2000. Minimum Flows and Levels for Lake Okeechobee, the Everglades, and the Biscayne Aquifer. Draft, February 28, 2000. Water Supply Department, South Florida Water Management District, West Palm Beach, FL. 149 pp.
Taylor, D.L. 1980. Fire History and Man-induced Fire Problems in Subtropical South Florida. MA. Stokes and J.H. Dieterich, technical coordinators. In: Proceedings of the Fire History Workshop, October 20–24, 1980, Tucson, AZ. Gen. Tech. Rep. RM-81. Fort Collins, CO: U.S. Department of Agriculture, Forest Service, Rocky Mountain Forest and Range Experiment Station: 63–68.
Taylor, D.L. 1981. Fire History and Fire Records for the Everglades National Park 1948–1979. Rep. T-619. Homestead, FL. US Department of the Interior, National Park Service, Everglades National Park, South Florida Research Center. 121 p.
Turner, A.M., J.C. Trexler, C.F. Jordan, S.J. Slack, P. Geddes, J.H. Chick and W.F. Loftus. 1999. Targeting Ecosystem Features for Conservation: Standing Crops in the Florida Everglades. Conservation Biology, 13(4): 898–911.
Wade, D.D., J. Ewel and R. Hofstetter. 1980. Fire in South Florida Ecosystems. General Technical Report SE-17. Southeastern Forest Experiment Station, U.S. Forest Service, U.S. Department of Agriculture, Asheville, NC.
Wetzel, P.R. 2002a. Tree island ecosystems of the world. pp. 19–69. F.H. Sklar and A.G. van der Valk, eds. In: Tree Islands of the Everglades, Kluwer Publishers, Dordrecht, The Netherlands.
Wetzel, P.R., A.G. van der Valk, S. Newman, D.E. Gawlik, T. Troxler Gann, C. Coronado-Molina, D.L. Childers and F.H. Sklar. 2005. Maintaining Tree Islands in the Florida Everglades: Nutrient Redistribution is the Key. Frontiers in Ecology and the Environment, 7: 370–376.
Wu, Y. and F.H. Sklar. 2002. Evaluating hydrologic impacts on tree islands using an Everglades landscape vegetation model. pp. 469–498, Sklar and van der Valk. (eds.). In: Tree Islands of the Everglades. Kluwer Academic. Dordrecht, The Netherlands.
Wu, Y., F.H. Sklar and K.R. Rutchey. 1997. Analysis and Simulations of Fragmentation Patterns in the Everglades. Ecol. Appl., 7: 268–276.
6-57