Changing routine activities and the decline of youth crime
36
Received: 6 February 2020 Revised: 11 February 2021 Accepted: 17 February 2021 DOI: 10.1111/1745-9125.12273 ARTICLE Changing routine activities and the decline of youth crime: A repeated cross-sectional analysis of self-reported delinquency in Sweden, 1999–2017 * Robert Svensson 1 Dietrich Oberwittler 2 1 Malmö University 2 Max Planck Institute for the Study of Crime, Security and Law Correspondence Robert Svensson, Department of Criminol- ogy, Malmö University, SE-205 06 Malmö, Sweden. Email: [email protected] *Additional supporting information can be found in the full text tab for this article in the Wiley Online Library at http:// onlinelibrary.wiley.com/doi/10.1111/crim. 2021.59.issue-2/issuetoc *The authors would like to thank Co- Editor Charis E. Kubrin and the anony- mous reviewers for their useful comments. The authors would also like to thank Frank Weerman for valuable feedback on an earlier version of this article and Mal- colm Fairbrother for discussing modeling options. This article was initiated when Robert Svensson visited the Max-Planck- Institute for Foreign and International Criminal Law, Department of Criminol- ogy, Freiburg, in May 2019. A draft version was presented at the 2019 European Society of Criminology (ESC) Annual Conference held in Ghent, Belgium. Abstract This study examines the declining crime trend among Swedish adolescents between 1999 and 2017 using data from eight repeated cross-sectional waves of a nationally representative school survey (N = ca. 49,000). We exam- ined to what extent changes in parental monitoring, school bonds, attitudes toward crime, routine activities, and binge drinking were related to the noticeable decline in youth crime. Multilevel modeling was employed for the analysis of temporal trends. We found strong empir- ical support for our hypotheses, that is, that changes in social bonds, attitudes toward crime, and routine activi- ties were all associated with the decline in youth crime. Routine activities had the strongest explanatory power, and all predictors combined accounted for most of the variance attributed to the decline in youth crime. This study moves research on the crime drop closer to the analysis of social mechanisms by demonstrating that micro-level associations between theoretically relevant, proximal variables, and delinquency account for macro- level change. This is an open access article under the terms of the Creative Commons Attribution License, which permits use, distribution and reproduc- tion in any medium, provided the original work is properly cited. © 2021 The Authors. Criminology published by Wiley Periodicals LLC on behalf of American Society of Criminology Criminology. 2021;1–36. wileyonlinelibrary.com/journal/crim 1
-
Upload
khangminh22 -
Category
Documents
-
view
1 -
download
0
Transcript of Changing routine activities and the decline of youth crime
Received: 6 February 2020 Revised: 11 February 2021 Accepted: 17 February 2021
DOI: 10.1111/1745-9125.12273
ARTICLE
Changing routine activities and the decline ofyouth crime: A repeated cross-sectional analysisof self-reported delinquency in Sweden,1999–2017*
Robert Svensson1 Dietrich Oberwittler2
1 Malmö University2 Max Planck Institute for the Study ofCrime, Security and Law
CorrespondenceRobert Svensson,Department ofCriminol-ogy,MalmöUniversity, SE-205 06Malmö,Sweden.Email: [email protected]
*Additional supporting information canbe found in the full text tab for this articlein theWileyOnlineLibrary at http://onlinelibrary.wiley.com/doi/10.1111/crim.2021.59.issue-2/issuetoc
*The authorswould like to thankCo-EditorCharisE.Kubrin and the anony-mous reviewers for their useful comments.The authorswould also like to thankFrankWeerman for valuable feedbackonanearlier versionof this article andMal-colmFairbrother for discussingmodelingoptions. This articlewas initiatedwhenRobert Svenssonvisited theMax-Planck-Institute for Foreign and InternationalCriminal Law,Department ofCriminol-ogy, Freiburg, inMay 2019.Adraft versionwaspresented at the 2019EuropeanSocietyofCriminology (ESC)AnnualConferenceheld inGhent, Belgium.
AbstractThis study examines the declining crime trend amongSwedish adolescents between 1999 and 2017 using datafrom eight repeated cross-sectional waves of a nationallyrepresentative school survey (N= ca. 49,000). We exam-ined to what extent changes in parental monitoring,school bonds, attitudes toward crime, routine activities,and binge drinkingwere related to the noticeable declinein youth crime. Multilevel modeling was employed forthe analysis of temporal trends. We found strong empir-ical support for our hypotheses, that is, that changes insocial bonds, attitudes toward crime, and routine activi-ties were all associated with the decline in youth crime.Routine activities had the strongest explanatory power,and all predictors combined accounted for most of thevariance attributed to the decline in youth crime. Thisstudy moves research on the crime drop closer to theanalysis of social mechanisms by demonstrating thatmicro-level associations between theoretically relevant,proximal variables, and delinquency account for macro-level change.
This is an open access article under the terms of the Creative Commons Attribution License, which permits use, distribution and reproduc-tion in any medium, provided the original work is properly cited.© 2021 The Authors. Criminology published by Wiley Periodicals LLC on behalf of American Society of Criminology
Criminology. 2021;1–36. wileyonlinelibrary.com/journal/crim 1
2 SVENSSON and OBERWITTLER
KEYWORDSadolescents, attitudes toward crime, crime drop, routine activities,self-reported delinquency, social bonds
1 INTRODUCTION
In many, particularly Western, countries, crime rates have been falling since the early 1990s(Baumer et al., 2018; Farrell et al., 2011; Tcherni-Buzzeo, 2019; Tonry, 2014; Tseloni et al., 2010;van Dijk & Tseloni, 2012; Zimring, 2006). The crime drop has rightly been recognized as a majorinternational phenomenon, and it has stimulated manifold research (Baumer et al., 2018; Far-rell et al., 2011; Tcherni-Buzzeo, 2019; Tseloni et al., 2010; van Dijk et al., 2012; Zimring, 2006).According to Farrell et al. (2014, p. 421), the crime drop is the “most important criminologicalphenomenon of modern times.”More recently, research on the crime drop has extended to youth crime, which is the focus of
this article. Declining trends in youth crime have been found in several countries, such as Spain(Fernández-Molina & Bartolomé Gutiérrez, 2020), Finland (Elonheimo, 2014; Salmi, 2009), Den-mark (Balvig, 2011), Sweden (Estrada, 2019; Sivertsson et al., 2019; Svensson & Ring, 2007; Vasil-jevic et al., 2020), the United States (Arnett, 2018; Baumer et al., 2018; Grucza et al., 2018; Keyeset al., 2018; Moss et al., 2019), England and Wales (Griffiths & Norris, 2020), Scotland (Matthews&Minton, 2018), and the Netherlands (Berghuis & deWaard, 2017; van der Laan et al., 2019). Thedecline has been found in both self-report studies and police-recorded data, and it applies to differ-ent crime types, such as property crimes, violence, and vandalism (e.g., Arnett, 2018; Moss et al.,2019). Some studies, though, showed the decline to be more pronounced for property crimes thanfor violence (e.g., Fernández-Molina & Bartolomé Gutiérrez, 2020; Salmi, 2009; Sivertsson et al.,2019) and for boys than for girls (Estrada et al., 2016; Keyes et al., 2018).When youth crime started to decline is not entirely clear: Self-report data from several coun-
tries such as the United States, Spain, and the Nordic countries hint at a decline since the mid-1990s (Arnett, 2018; Balvig, 2011; Elonheimo, 2014; Estrada, 2019; Fernández-Molina & BartoloméGutiérrez, 2020) or even earlier (Kivivuori & Bernburg, 2011), whereas in other countries suchas Germany and the Netherlands where police-recorded data have been examined, the declineseems to have started around 2007 (Baier, 2018; Berghuis & de Waard, 2017; van der Laan et al.,2019). Despite some gaps in these data series, there is enough evidence to conclude that the declinein youth crime is a common experience in Western developed societies. Additionally, it is worthmentioning that other forms of problem or risk behavior such as marijuana use and binge drink-ing also showed a decline in many countries (Moss et al., 2019; Pape et al., 2018; Pennay et al.,2018).How can we explain this decline in youth crime? For the general crime drop, various explana-
tory factors have been put forward, including socioeconomic development, cohort sizes, chang-ing drug markets, improved security technologies, reductions in child maltreatment and leadpoisoning, and the rise of the Internet (Farrell et al., 2014; Rennó Santos et al., 2019; Tcherni-Buzzeo, 2019; van Dijk et al., 2012; Vogel et al., 2020). Some of these attempts to explain the gen-eral crime drop were implicitly or explicitly targeted at criminal behavior in young age groupsor at causal mechanisms that impact child and adolescent development, such as lead poisoningor cohort size. In addition, and specifically addressing the decline in youth crime, it has beenargued that it may be a consequence of changes in parental monitoring (Arnett, 2018), changes in
SVENSSON and OBERWITTLER 3
young people’s future orientation and attitudes toward school (Balvig, 2011), and more negativeattitudes toward crime (Griffiths &Norris, 2020; Pape et al., 2018). Several scholars have discussedchanges in daily routines as explanation for the decline in youth crime, in particular, an increasein time spent online and a corresponding decrease of offline activities (Arnett, 2018; Berghuis&DeWaard, 2017; Moss et al., 2019; Twenge & Park, 2019; Twenge & Spitzberg, 2020; Weerman, 2017).And some have argued that the spread of more effective technologies preventing car thefts andburglaries has reduced opportunities for adolescents for initial crimes and to embark on criminalpathways beyond them (the “debut crime” hypothesis; see Farrell et al., 2014, 2015).Few of these leads have received convincing empirical support. Many studies based on self-
report survey datawere of a descriptive nature and discussed but did not test possible explanations(e.g., Arnett, 2018; Elonheimo, 2014; Fernández-Molina & Bartolomé Gutiérrez, 2020; Svensson &Ring, 2007; Vasiljevic et al., 2020).Many attempts focused on single causes were loosely connectedwith the theoretical literature on crime causation or hard to test empirically, in particular, con-cerning the linkage ofmacro-level, societal developments to individual criminal behavior. In theirrecent review of research, Baumer et al. (2018) lamented the rudimentary and fragmented stateof research into the causes of the international crime drop, and this can be extended to researchinto the causes of the decline in youth crime.One major reason for this is that aggregate-level statistics of recorded crime or repeated vic-
timization surveys may be important to measure national or regional crime trends and to iden-tify associated macro-societal processes but do not allow for an analysis of proximate influenceson criminal behavior commonly discussed in research on the etiology of crime, such as socialcontrol or routine activities (Baumer et al., 2018, p. 51). Research on the causes of the decline inyouth crime, even if informed by macro-level theories of social or technological change, shouldencompass analyses of individual-level influences on delinquent behavior over time to provide amicro-foundation for the explanation of social change and to avoid “black boxes” (Hedström &Ylikoski, 2010).To follow this route, repeated cross-sectional or longitudinal survey data focusing on the etiol-
ogy of adolescent offending are needed but are rarely available over longer time periods. To ourknowledge, three previous studies have used repeated cross-sectional survey data for analyses ofindividual-level influences on delinquency trends. First, using three cohorts (2005, 2010, and 2015)of the Dutch Youth Delinquency Survey, van der Laan et al. (2019) examined the effects of severalindividual-level risk and protective factors on youth crime over time. They found that the 2015cohort was less exposed to risk factors (e.g., alcohol use and delinquent peers) and more exposedto protective factors (e.g., parental emotional support and monitoring) compared with previouscohorts, potentially accounting for the decrease in self-reported offending. Second, Keyes et al.(2018) used the extensive annual Monitoring the Future (MTF) data spanning the period of 1991to 2015 and applied age–period–cohort modeling.1 They reported strong period effects of declin-ing problem behaviors mainly of boys and especially after 2008, and they found evidence for aparallel decline in unsupervised time with peers during evening hours, but they stopped short oftesting the impact of this behavioral change on delinquency in individual-level models, nor didthey consider other potential influences. Third, Baumer et al. (2021), using the same MTF dataas Keyes et al. (2018), employed hierarchical modeling to examine whether declining prevalencerates of youth crime were a consequence of changes in adolescents’ family and school relationsand routine activities. They found no impact of changes in family and school relations, whereaschanges in unstructured socializing and alcohol consumption showed a considerable explanatory
1 In may be relevant to note that they followed Yang et al.’s (2008) approach of age–period–cohort analysis that has notgone uncontested (Bell, 2020).
4 SVENSSON and OBERWITTLER
power for the declining trend. Baumer et al.’s (2021) study marks the first elaborated analysis oflong-termadolescent crime trends in relation to shifts in social behaviors based on individual-levelsurvey data and proves the value of this approach. Yet, as still little is known about the impact ofvarious individual-level factors on the decline in youth crime, we agree with Baumer et al. (2018,p. 46) that more studies “evaluating the merits of a set of well-established causal processes shownto be important for understanding variation in criminal activity” are needed.The current study extends previous research and examines whether changes in parental mon-
itoring, school bonds, attitudes toward crime, as well as changes in daily routine activities andalcohol intoxication are associated with the decline in youth crime over a period of nearly twodecades. We use self-report data from eight sweeps of a nationally representative school surveyfrom Sweden conducted by the National Council for Crime Prevention between 1999 and 2017 andapply hierarchical linear and nonlinear modeling to capture temporal changes.
2 THEORETICAL FRAMEWORK
In this study we will focus on three domains of theoretical explanations of the decline of youthcrime geared at proximal influences on individual behavior. The first domain covers parentingand relations to school, the second domain attitudes toward crime, and the third routine activi-ties including alcohol consumption. All three domains have been discussed as possible drivers ofthe decline in youth crime (e.g., Arnett, 2018; Elonheimo, 2014; Kivivuori & Bernburg, 2011; Keyeset al., 2018; Vasiljevic et al., 2020). Other important domains, such as strain or self-control, andspecific aspects such as online activities have been omitted in the present study, all for a simplereason: They were not included in the instruments of the Swedish national survey program thatoriginated in the early 1990s, or they have been adopted only in the most recent waves, a typi-cal situation in the case of long-running surveys that must prioritize continuity over innovation.Despite these restrictions, the domains under investigation align well with the three basic dimen-sions of the etiology of criminal behavior listed by Baumer et al. (2018, p. 50): social controls,propensities and motivations for crime, and exposure to criminogenic settings. We will investi-gate whether and to what extent variables in these three domains have changed over time andthus help to explain the decline in youth crime. Therefore, we focus on the micro-foundation ofindividual-level correlates of delinquency to improve the understanding of macro-level changesin crime rates.More specifically, we are interested in whether level differences in several predictors contribute
to the explanation of changing likelihoods of delinquent behavior. We do not investigate poten-tial slope differences over time, which would indicate that the effects of predictors on delinquencybecameweaker (or stronger) over time (cf. Firebaugh, 1997). The reason for this is that we focus onproximal influences on delinquency forwhich extant research does not offer strong clues that theirrelevance may have changed over time. For example, if social bonds to parents and schools con-tributed to the crime drop, we hypothesize that this was because adolescents developed strongerbonds, not because the effects of these bonds on crime became stronger (see “Sensitivity Anal-yses” section for some checks of this assumption).2 The latter perspective seems more relevantfor research on the changing roles of demographic (and, hence, more distal) factors such as gen-der and race/ethnicity in delinquent behavior or discriminatory treatment by the criminal jus-tice system (e.g., Keyes et al., 2018; Weaver et al., 2019; cf. DiPetre & Grusky, 1990, for stratifica-tion research). In the following section, we will discuss the relation of these predictors to centraltheoretical perspectives in the etiology of youth crime.2We thank an anonymous reviewer for raising this issue.
SVENSSON and OBERWITTLER 5
2.1 Changes in parenting and relations to school
Adolescents’ relations to parents and school as two major agents of socialization take a key posi-tion in criminological theories (e.g., Fagan & Bendini, 2019; Hirschi, 1969; Payne & Welch, 2013;Stattin &Kerr, 2000). Social control theories assume that social bonds to conventional institutionshelp to suppress deviant impulses, as does surveillance by parents. The association between familyprocesses and involvement in crime is well established, indicating that poor relations with par-ents is related to more adolescent crime (e.g., Hoeve et al., 2009; Oleson & Costello, 2019; Stattin& Kerr, 2000).One possible explanation of the crime drop is that parents as a central agent of socialization
may have had a changed influence over their children, and that social control by parents and/orsocial bonds between parents and children have intensified over time. In the following discus-sion, we concentrate on the monitoring dimension. Some scholars have argued that children aremore strongly monitored by their parents (andmore closely bonded to them) than some years ago(Clark et al., 2013; Kristjansson et al., 2010, 2016). In Sweden as well as in neighboringNorway andFinland, the share of adolescents who state that their parents know where they spend their Fri-day and Saturday nights has increased considerably between 1999 and 2015 (Raitasalo et al., 2018,2021). Swedish studies have shown that the majority of 15-year-old adolescents have had goodcommunication with their parents since the mid-1980s, and that their communication with theirfathers has improved in recent years (Public Health Agency of Education, 2018). In addition, pre-vious research has shown that strong bonds to the parents is associated with an increased level ofparental monitoring (Stattin & Kerr, 2000).Time-use studies from industrialized nations showed an increase over the last decades of time
that parents spend with their children, and “helicopter parenting” has become a widely discussedbut empirically vague phenomenon (Doepke et al., 2019). On the other hand, Arnett (2018) dis-puted the empirical evidence for increased parentalmonitoring. Yet, theremay have been changesin the modalities of parental monitoring resulting from technological change: Today it is possiblefor parents to have remote contact with their children via cell- or smartphones, which was notpossible 20 years ago. Frequent contact via mobile phones and social media gives parents oppor-tunities to be kept informed about their whereabouts and activities. Thus, Arnett (2018) arguedthat even though traditional parental monitoring has decreased, there has been a rise of electronicmonitoring. Online communication is also a relevant feature of adolescents’ routine activities,which we will discuss below.Another possible explanation within social control theory is that the attitudes toward school
may have changed over time. Schools function as an important agent of socialization as this isthe place where children learn skills and attitudes that enable them to integrate into society (e.g.,Wentzel & Looney, 2007).Many studies showed associations between various indicators of attach-ment to school and offending (e.g., Gottfredson, 2001; Hart & Mueller, 2013; Peppler, 2019), sug-gesting that the more strongly an individual is bonded to school, the lower the probability thatthe individual will engage in offending.It has been claimed that children’s and adolescents’ attitudes toward school have changed
over time, and that schools have become more important. For example, Curran and Hill (2019)reported a long-term increase of “socially prescribed perfectionism” among U.S. college studentsthat they attributed to an increasing pressure on academic achievement in a meritocratic society.This may increase the number of young people who refrain from skipping school and committingcrimes because they do not want to risk their future (Balvig, 2011; Clark et al., 2013; Kivivuori &Bernburg, 2011; Raitasalo et al., 2018). Swedish survey data showed that the proportion of
6 SVENSSON and OBERWITTLER
15-year-olds who like school has remained at a stable level since the mid-1980s, with a slightdecline between 2013 and 2017. The data also indicate a stable level of trust to teachers,whereas school-related stress has increased in recent years (Public Health Agency of Educa-tion, 2018). Taken together, time trends in students’ bonds to school or “school belonging”remain a neglected research topic despite abundant large-scale international survey programs,and the existing research does not seem to show clear trends (Allen et al., 2018; Wilhelmsen,2017).
2.2 Changes in attitudes toward crime
Another possible explanation that does not rank prominently in the discourse about the crimedecline are changes in themoral climate and the attitudes toward crime in society. Seminal workson the topic such as Blumstein and Wallman (2006), Zimring (2006), and van Dijk et al. (2012)did not consider attitudinal changes as major drivers of falling crime rates, whereas Baumer et al.(2018) discussed specific facets of motivations for crime as self-control, frustration, and institu-tional legitimacy. Taking the long view since the middle of the twentieth century and before, Eis-ner (2014) found negative time series correlations between crime rates and indicators of culturalnorms favoring morality, civility, and self-control in the Western world. Few empirical studieshave examined whether youths’ attitudes toward crime have changed over time. Using surveydata from Finland, Salmi (2009) reported a trend toward more negative attitudes to crime during1995 to 2001, as well as a more stable trend thereafter. Summarizing the research on adolescentdelinquency in the Nordic countries, Kivivuori and Bernburg (2011, p. 419) claimed that “youngpeople increasingly condemn criminal activity. It is no longer regarded as a normal part or mani-festation of adolescence.” In the Netherlands, it has been pointed out that a rise in disapprovingattitudes toward crime has had an inhibiting effect on the propensity to commit crime (Berghuis& deWaard, 2017). Pape et al. (2018) reviewed the existing evidence for changing attitudes of ado-lescents toward alcohol consumption that is seen as an explanation of reductions in actual con-sumption patterns (see also below).Attitudes toward social norms are often addressed asmorality, a set of convictions about right or
wrong behavior.Moral values have for a long timeplayed a cardinal role in criminological theories.Both Sutherland (1947) and Hirschi (1969) regarded moral values and attitudes as key processescausing people to commit crime, or preventing them from doing so. More recently, situationalaction theory and rational choice-based theories assume that individuals vary in their levels ofmorality, and that strong conventional moral values override other potential influences on crim-inal behaviour, such as situational inducements or deterrence (Kroneberg et al., 2010; Wikströmet al., 2012).Many empirical studies have shown that attitudes toward crime—applying different definitions
andmeasurements—were associatedwith actual offending (e.g., Antonaccio&Tittle, 2008; Chap-ple et al., 2005; Stams et al., 2006; Svensson et al., 2010, 2013; Wikström et al., 2012), in support ofgeneral concepts of human behavior that assume a causal cascade from attitudes and beliefs viaintentions to behavior (Ajzen et al., 2019; Stets & Carter, 2012). These findings show that individu-als who do not think it is wrong to commit crime are more likely to commit crime. Yet, the causaldirection of this relation between attitudes and behavior is more difficult to ascertain. Panel stud-ies found evidence for bidirectional influences between attitudes and behaviors on the individuallevel (Boers et al., 2010; Thornberry, 1987; Thornberry et al., 1994; Zhang et al., 1997).
SVENSSON and OBERWITTLER 7
Macro-level, societal change of attitudes occurs in relation to cultural, socio-political, and eco-nomic developments and events (Albarracin&Shavitt, 2018). Eisner (2014) discussed shifts in soci-etal norms potentially guiding parents’ child-rearing practices, whichmay contribute to changingadolescents’ mindsets, and Kivivuori and Bernburg (2011) discussed potential economic, cultural,andmedia influences on the collective attitude change among adolescents concerning delinquentbehavior in the Nordic countries. An example from Sweden of how legal changes subsequentlyinduced or accelerated changes in collective moral attitudes is the ban on child maltreatment in1979 (Gilbert et al., 2012).
2.3 Changes in routine activities and alcohol consumption
A prominent explanation of the crime drop is the digital revolution and its impact on young peo-ple’s routine activities and lifestyles (Berghuis & DeWard, 2017; Pape et al., 2018; Weerman, 2017).Since the digital revolution and the large-scale spread of broadband Internet that took off at thebeginning of the 2000s, which then jumped to another level with the emergence of smartphonesaround 2007/2008 and affordable mobile Internet more recently, young people spend more andmore time online using digital devices such as computers and smartphones. In Sweden alreadyin 2012, 89 percent of 15-year-old adolescents used smartphones, and almost everybody (98 per-cent) used smartphones in 2018 (Swedish Media Council, 2019). A large-scale survey in Swedenshowed that the share of 15-year-old adolescents who spent four or more hours during weekdaysin front of a computer or using a smartphone rose from 11 percent in 2001/2002 to 42 percent in2013/2014 (Public Health Agency of Education, 2015). In the United States, the average daily timespent online increased from around one hour in 2006 to 1.7 hours for eighth graders in 2016 andto 2.2 hours for twelfth graders in 2016. Although half of adolescents used social media on a dailybasis in 2006, the share has risen to ca. 80 percent in 2016 (Twenge et al., 2019).Importantly for adolescents’ routine activities, more online time could mean less time away
from home and in real-life interaction with peers (Arnett, 2018; Pape et al., 2018). Using data fromthe Monitoring the Future study, Twenge and Park (2019, cf. Kim & McCarthy, 2018) found amarked decrease of time adolescents have been going out without their parents since 1996 foreighth and tenth graders and since 2002 for twelfth graders in the United States. Other out-of-home activities as paid work, dating, and getting a drivers’ license also decreased. An analysisof Swedish time use data between 1990 and 2010 revealed that for the age group 20 to 29 years,daily free time spent with digital devices increased from almost 0 to 50 minutes, whereas nondig-ital free time decreased by 37 minutes, with social activities such as out-of-home trips and socialvisits particularly affected (Susilo et al., 2019; Vilhelmson et al., 2018). Yet, the effects of onlinecommunication on routine activities may not be straightforward as studies also found a positiveindividual-level correlation between online and offline social interaction (Twenge et al., 2018). Astudy based on a small school survey conducted in 2008 found that “virtual” time with peers wasassociated with higher rates of delinquency, partly superseding the effect of traditional time withpeers (with which it was positively correlated; Meldrum & Clark, 2015; but see Weerman et al.,2015). Thismay guard against the danger of ecological fallacies concerning the causalmechanismsof crime trends: Factors that seem to be positively correlated with the crime drop on the aggregatelevel of national time series may not necessarily be associated correspondingly with crime on theperson level, and vice versa. A causal influence of the digital revolution on adolescent routineactivities has yet to be shown convincingly. Also, if a decreasing trend of adolescents’ real-worldsocial activities exists, it seems to have started earlier than the advent of social media. Because
8 SVENSSON and OBERWITTLER
of data limitations, we cannot empirically test hypotheses about the effects of online time in thisstudy.These unsolved questions about the consequences of the digital revolution notwithstanding,
the assumption that a decrease of free time spent away from home and with peers could result infewer opportunities to commit crimes is less contentious. Routine activities have long been viewedas a causal influence on adolescent offending (e.g., Cohen & Felson, 1979; Osgood et al., 1996).Three aspects of young people’s daily routines are important in relation to offending. First, rou-tine activity theory stresses that spending time in unstructured routine activities in the absence ofauthority figures, that is, without social control, increases the risk of offending (Agnew&Petersen,1989; Bernasco et al., 2013; Cohen & Felson, 1979; Felson, 1994; Hoeben et al., 2016; Osgood &Anderson, 2004; Osgood et al., 1996). Not being supervised by adults in the company of peers andnot doing anything particular (as, e.g., hobbies or sports) exposes adolescents to different types ofsettings that in turn produce different types of situations that increase the risk of offending (e.g.,Osgood et al., 1996; Wikström & Sampson, 2003). Second, it is also well known that young peoplewho spend a lot of time with their friends commit more crimes than those who do not (Osgoodet al., 1996; Warr, 2002; Weerman et al., 2015). In addition, unsupervised time spent with friendsduring evening hours is more criminogenic than during daytime hours (Wikström et al., 2012,p. 340). Thus, some psychologists judge the shift from “nondigital” to digital social interactionamong adolescents as potentially detrimental for well-being (Twenge et al., 2018).Finally, it is well known that alcohol use is significantly associated with offending, in particular
violent offending, with strong hints at a causal influence (Brown & Leonard, 2017; Felson et al.,2008). In an analysis of situational influences, alcohol but not cannabis consumption increasedthe likelihood of adolescents’ offending (Bernasco et al., 2013).Adolescents’ drinking habits have been closely monitored in many countries for many years,
and the evidence for a long-term declining trend is unequivocal (Grucza et al., 2018; Inchley et al.,2018; Kraus et al., 2018; Moss et al., 2019; Pape et al., 2018; Pennay et al., 2018; Raitasalo et al.,2021). Thus, the declining trend in alcohol consumption clearly is a potential factor in the declineof delinquency if one accepts its causal role. Onemay argue whether alcohol consumption shouldbe seen as an explanatory variable of delinquency or rather as a facet of delinquency as it is a sta-tus offense for adolescents in some countries (e.g., Boisvert et al., 2019; Franken et al., 2016). InSweden, alcohol consumption is prohibited for adolescents but not sanctioned. Analyzing thedeclining trend of youth delinquency in the United States and applying item response theory,Grucza et al. (2018) found evidence for a “single-factor externalizing model” including both crim-inal offending and substance abuse or dependency according to DSM-IV. Although both theoret-ical angles may have some merits (and more sophisticated data would be needed to advance thisissue), we will treat alcohol consumption as part of the situational influences and as an explana-tory variable, in line with the reasoning by Apel and Horney (2017) and Baumer et al. (2021), butwill test its relevance in a separate model step.Recent research has increasingly acknowledged that routine activities as unstructured social-
izing do not have unconditional effects on adolescent offending. Many studies have examinedwhether there is an interaction between the individual propensity of adolescents (operationalizedas morality and self-control) and their criminogenic exposure (operationalized as lifestyle risk orunstructured routine activities) in the explanation of adolescent offending. In linewith situationalaction theory, it has been assumed that risky routines will have a differential impact on individ-uals’ involvement in crime depending on their level of individual propensity to offend, that is,their attitudes toward crime. Several studies have found empirical evidence for this interaction,indicating that risky routine activities will have a stronger effect on offending for those individuals
SVENSSON and OBERWITTLER 9
with attitudes condoning crime, whereas for individuals with attitudes unfavorable to crime, riskyroutine activities will not, or only marginally, influence their involvement in offending (Gerstner& Oberwittler, 2018; Pauwels et al., 2018; Svensson & Pauwels, 2010; Wikström et al., 2012).
2.4 Sweden as an example
Sweden, a Scandinavian country of approximately 10 million inhabitants, serves as an exampleof a highly developed and wealthy Western society. Sweden has a long tradition of egalitarian,social democratic policies and is characterized by a strong welfare state and low levels of socialinequality, while enjoying one of the highest per-capita GDPs in the world (Schröder, 2013). Interms of social and technological trends, Sweden is one of the most advanced societies, indicatedby high levels of gender equality and high self-expression values, as well as by an early adoptionof Internet and mobile communication. During the 1990s, Sweden has gone through a periodof economic slump, deregulations, and high unemployment, in particular youth unemployment,which rose to 25 percent in 2010 and has remained close to 20 percent thereafter (OECD, 2020). Asa result of a liberal immigration policy, the share of foreign-born inhabitants, many of them fromnon-European backgrounds, has risen from 10 percent in 1995 to 16 percent in 2015, which putsSweden 3 percentage points above theUnited States. Thus, despite being rooted in a strongwelfarestate tradition, Swedish society has experienced considerable socioeconomic challenges and hassuffered blows to its generous social policies during recent decades. In sum, Sweden shares manycharacteristics and experiences of highly developed nations, and in some respects, social trendshave occurred earlier or are more pronounced in Sweden than in many other Western countries.Sweden’s crime levels and trends, too, have been similar to those of otherWest European coun-
tries (e.g., Estrada, 2019; von Hofer & Lappi-Seppälä, 2014; von Hofer et al., 2012). The homiciderate was ∼1.0 during the 2000s, which was similar to many other European countries (UnitedNations Office on Drugs & Crime, 2014). The levels of adolescent delinquency in Sweden haveappeared comparable with other European countries in the International Self Report Studies(Junger-Tas, 2012;Kivivuori, 2007). Police statistics have shownadrop in property crimes,whereasrecorded violence, particularly among young people, has been more stable (Estrada, 2019). Bothhospital data on injuries and homicide statistics, however, indicate that serious violence reachedits highest point in Sweden in the early 1990s (1993 in the vital statistics) and has declined sincethen, as in most Western countries (LaFree et al., 2015; von Hofer et al., 2012). These divergenttrends of violence could hint at a rising proportion of minor cases of violence reported to andrecorded by the police (von Hofer et al. 2012; cf. Baumer & Lauritsen, 2010; Weaver et al., 2019)and reflect increasing cultural sensitivities toward violence among the population (Kivivuori,2014; Tonry, 2014). If true, increasing sensitivities and formal social control that lead to short-term increases in recorded violence could also be a potential explanatory factor in the long-termdecline of adolescent violence that we see in in self-report and victimization surveys.In sum, as crime trends in Sweden have closely mirrored those of many other developed coun-
tries, our findings about the possible drivers of the adolescent crime drop can also be deemedrelevant beyond Sweden.
2.5 Aim and hypotheses
The aim of this study is to explore explanations of the Swedish crime trend among young peoplebetween 1999 and 2017.Wewill extend previous research by using a unique data set of eight sweeps
10 SVENSSON and OBERWITTLER
of a nationally representative youth survey from Sweden and examine to what extent changes inpredictors relating to the theoretical domains of 1) social bonds, 2) attitudes toward crime, and3) routine activities can explain the decline in youth crime. We test the following three mainhypotheses:
Hypothesis 1: An increase of parental monitoring and school bonds is associated with a decline incrime.
Hypothesis 2: An increase of negative attitudes toward crime is associated with a decline in crime.Hypothesis 3: A decrease of time spent in unstructured routine activities and with friends during
evenings, as well as of alcohol intoxication, are associated with a decline in crime.
3 DATA ANDMETHOD
3.1 Sample
This study is based on eight sweeps of a nationally representative school survey in Sweden ofninth-grade students whowere on average 15 years old, conducted by the Swedish National Coun-cil for Crime Prevention between 1999 and 2017 (Brå, 2013, 2018). The survey was conducted everysecond year between 1999 and 2005, and thereafter every third or fourth year. All surveys arebased on random samples (within Sweden’s 21 regions) of schools with year-nine classes.3 Thedata have primarily been collected between November and January. Students completed the self-administered paper questionnaires during lesson time in the presence of the teacher. The samplesizes were between ca. 6.000 and 8.000 from 1999 to 2011 and ca. 4.500 in 2015 and 2017 (see theappendix, table A1, at the end of the article). The nonresponse rates within participating schoolswere between 13.1 percent and 18.6 percent from 1999 until 2015 and 31.4 percent in 2017 (see theappendix, tableA1). In total, 50,657 adolescents participated in these eight survey sweeps. After theexclusion of ca. 4 percent missing values, the sample size inmultivariate models is between 48,715and 48,776 cases depending on the delinquency outcome. Survey weights, which compensate foruneven sampling and nonresponse in regions were available only for the two last sweeps in 2015and 2017 (Brå, 2018). We decided not to use them as the first six sweeps did not have any weights,as well as because weights are less relevant in the analysis of associations compared with descrip-tive frequencies. We repeated our analysis without the last two waves, however (see “SensitivityAnalyses” section).
3.2 Measures
All survey items were identical across the first six sweeps during the period 1999−2011. The word-ing of some items or answer categories were slightly changed for the last two sweeps (2015 and2017). For a detailed description of the items included in the scales and changes in question word-ings, see the appendix, table A2. To check the robustness of our findings also in the light of thesechanges, as just mentioned, we repeated all models without the last two waves (see “SensitivityAnalyses” section).
3 For the two surveys 2015 and 2017, there were also a systematic sample of one school class to participate within the study.
SVENSSON and OBERWITTLER 11
3.2.1 Dependent variable
Self-reported delinquency is measured by three constructs. The self-reported delinquency scaleconsisted of 19 items on criminal offending during the past 12 months, covering vandalism, minortheft, serious theft, fraud, and violence. The four answer categories were as follows: “0 times”,“1 to 2 times”, “3 to 5 times”, “6 to 10 times”, and “more than 10 times”. These responses werecoded between 0 and 4, respectively. We computed additive scales that reflect the frequency ofoffending. A respondent who did not report any offense would score 0, whereas respondents whoeither reported to have committed “1 to 2″ offenses in four different offense categories as wellsomebody who reported “more than 10 times” in just one offense category would both score 4,and the theoretically possible maximum score would be 76 (19 × 4) for the overall delinquencyscale. Yet, considering the ordinal categories are compressed at the upper end of the distribution,the scale does not represent true counts. Cronbach’s alpha for the overall delinquency scale variesbetween .86 and .90 in the eight sweeps. The scale serious property offending consists of six itemsabout theft of or from motor vehicles, stealing of bags, burglary, and selling stolen goods (Cron-bach’s alpha between .72 and .85). The scale violent offending consists of four items about robberyand assault that resulted in serious bodily harm (Cronbach’s alpha between .53 and .85). Only fordescriptive purposes, we also constructed a scale minor offending that includes nine items aboutvandalism, fraud, and theft (Cronbach’s alpha between .81 and .84). The delinquency scales werelog-transformed to reduce skewness.
3.2.2 Independent variables
Social bondsParental monitoring is an additive index based on two items measuring parents’ knowledge aboutwhere andwithwhom their child spends time during evening hours. Spearman’s coefficient of thetwo items varies between .59 and .65 in the eight sweeps. High scores indicate that respondents arestrongly supervised by their parents. Considering research by Stattin and Kerr (2000), we assumethat this index is likely to reflect disclosure by children as much as parents’ active monitoringefforts. School bonds is an additive index based on two questions about whether respondents likeschool and value their teachers. Spearman’s coefficient of these two items varies between .34 and.40 in the eight sweeps, which is less than optimal. One may assume that many students likeschool yet are critical of their teachers, which is indicated by lower approval rates for this item.High scores indicate that the respondents are strongly bonded to school.
Attitudes toward crimeAttitudes toward crime is represented by an additive index based on four itemsmeasuring whetherthe respondents consider it to be acceptable if their friends committed different criminal acts(shoplifting, car theft, graffiti spraying, and cannabis use). Different question wordings have beenused in self-report surveys to capture delinquent attitudes, referring to different hypotheticalactors such as the respondents themselves (e.g., Antonoccio & Tittle, 2008) or more generallyto “someone of your age” (Wikström et al., 2012, p. 134). Considering the role of peers in influ-encing norms and actual behavior among adolescents, attitudes about friends’ actions are highlyrelevant for respondents’ own behavioral preferences (Megens & Weerman, 2012). We assumethat the moral evaluations of friends’ actions mirror shared norms among adolescents that may

12 SVENSSON and OBERWITTLER
contribute to their proneness to offend. Cronbach’s alpha for this scale varies between .85 and .88in the eight sweeps. High scores indicate more delinquent attitudes.
Routine activitiesUnstructured activities are measured using an additive index of four items from a longer list ofitems about places or facilities that the respondents visit during their free time at least a few timesin amonth: a youth club, a skateboard ramp, a disco, and an amusement arcade/placewith pinballmachines or billiard tables. These four items loaded on a common dimension in exploratory factoranalyses. We recoded the additive index to three ordinal categories “none”, “some” (if one of thefour items was ticked), and “intense” (if two or more items were ticked). The selection of placesand activities connected with these places may not be perfectly suited for monitoring long-termtrends in adolescents’ leisure time preferences. For example, playing pinball and billiards probablywent out of fashion and was replaced by technologically advanced alternatives such as computergaming (which however was not included in the item list). An item about one important form ofunstructured socializing that has been used in other studies, namely hanging out with peers inopen spaces or in shopping malls without doing anything particular (e.g., Bernasco et al., 2013;Gerstner & Oberwittler, 2018), has been adopted to the Swedish survey only in the most recentsweeps, and it could not be used for our analysis.Evenings with friends is measured by a single item asking how many evenings in a week the
respondents usually spend with friends, with ordinal categories ranging from none to more thanfour evenings.Alcohol intoxication is based on a single item asking for the number of times the respondents
had drunk alcohol during the last year so that they felt intoxicated, with ordinal categories rangingfrom none to more than 10 times.
Demographic variablesWecontrol for sex and immigrant background, which is based on the country of birth of the respon-dents and their parents. We do not use age since the survey samples were restricted to a singleschool grade. The survey data lacks information on parental socioeconomic status. The descrip-tive statistics of all variables are documented in the appendix (table A3).
3.3 Analytical strategy
There are two basic approaches to model temporal trends in self-reported delinquency and asso-ciated behaviors and attitudes when using repeated cross-sectional survey data: fixed-effects andrandom-effects models. In both cases, a set of individual-level predictors is used to account forthe part of variance in the dependent variable that is attributable to differences between surveywaves. In a fixed-effects regression model, the survey waves are represented by a set of dummyvariables or a (curve-)linear time trend,whereas in a random-effectsmodel, they constitute groupsin which the respondents are clustered, leading to more appropriate estimates of standard errors(Fairbrother, 2014). Random-effects models have become increasingly popular for this reason inthe analyses of large survey programs as the European Social Survey or the General Social Sur-vey (Pittau et al., 2016; Schmidt-Catran & Fairbrother, 2016), they have recently been used byBaumer et al. (2021) analyzing delinquency trends in the Monitoring the Future survey, and weemploy this approach here as well (see the “Sensitivity Analyses” section for a comparison withfixed-effects models). If a trend of youth offending over time exists, it will show as a significant
SVENSSON and OBERWITTLER 13
group-level variance component. To put our strategy in a nontechnical way, the aim of our anal-ysis is first to identify the time trend in youth offending and then to “explain it away” with thehelp of respondent-level variables representing social bonds, attitudes toward crime, and routineactivities. Even repeated cross-sectional survey waves, however, do not allow for a causal inter-pretation of findings as a result of a lack of clear time order of variables and potential omittedvariable bias.It is also worth considering that repeated cross-sectional surveys of a narrow age range of ado-
lescents (or in our case, even a single school grade) are ill suited to distinguish between cohort andperiod effects that refer to potentially different causalmechanisms of a crime decline. As hypothet-ical examples, the “iPhone effect,” which assumes that adolescents quickly changed their socialbehavior following the diffusion of a technological innovation, (Twenge et al., 2018) would con-stitute a pure period effect, whereas the toxicological consequences of lead poisoning in infancyfor behavior later in life (Sampson & Winter, 2018) would mark a pure cohort effect. Althoughour models likely reflect a mixture of cohort and period effects and we cannot distinguish theirrelative importance, it is still worth considering their potential bearing on the crime decline infuture research.A formal description of our analytical approach is given in the following equation:
𝑦𝑖𝑡 = 𝑦00 + 𝑦10−𝑘0 X𝑖𝑗 + 𝑈0t + 𝑅𝑖𝑡 (1)
where the outcome 𝑦𝑖𝑡 is self-reported offending of individual i in survey year t. The random inter-cept model partitions the variance of 𝑦𝑖𝑗 into a component that is shared by respondents in thesame survey year (𝑈0t), and the residual variance 𝑅𝑖𝑡. The model includes a vector of individual-level predictors 𝑦10−𝑘0 X𝑖𝑗 , which will be introduced block-wise. We do not model a time trendusing a level-2 predictor but prefer to analyze the reduction of level-2 variance as described inthe following paragraph. Yet, we successfully tested alternative models including a significantlevel-2 time trend (see the “Sensitivity Analyses” section). We can estimate the random interceptsthat represent the model-based means of youth offending in each survey year by combining thegrand mean 𝑦00 with the year-specific deviation of the group means expressed in 𝑈0t. Using lin-ear hierarchical modeling, these are best linear unbiased predictions of the random effects (StataCorp., 2015, p. 425). In the null model without predictors, the predicted random effects equal therawmeans of the dependent variable for each survey year. Introducing individual-level predictorswill reduce the residual, unexplained variance 𝑅𝑖𝑡 to the degree that they share variance with theoutcome. In addition, to the extent that these predictors also share group-level variance with theoutcome, the variance component𝑈0t will also be reduced. This reduction will be ourmain focus.It is crucial that respondent-level predictors are not group-mean-centered but remain uncenteredor are grand-mean-centered for this variance reduction on the group level to happen (Rauden-bush & Bryk, 2002, p. 142). Consequently, the predictions of delinquent behavior will be adjustedfor all effects represented in a model. We can estimate the share of explained variance on bothlevels by computing the proportional reductions in the two variance components 𝑅𝑖𝑡 and 𝑈0t,comparing models before and after including specific predictors. Thus, in effect, the proportionalreduction of the year-level variance reflects the explanatory power of the individual-level pre-dictors on the declining trend of youth crime over eight survey sweeps. If most of the year-levelvariance is explained and 𝑈0t. is reduced accordingly, then the random intercepts will be closeto the grand mean, and thus, the time trend will be successfully “explained away.” We illustratethese changing predictions over consecutive models by plotting the random intercepts from eachmodel in figure 3a.
14 SVENSSON and OBERWITTLER
As computing variance components and reductions in variance is not straightforward innonlinear hierarchical modeling, we decided to run linear hierarchical regression modelswith log-transformed dependent variables to reduce skewness. To check the robustness ofresults, all models were also run as negative binomial multilevel models, and those showed nosubstantial differences to the reported models (see the “Sensitivity Analyses” section and theresults presented online as supporting information4). Just eight survey waves represent a smallnumber of clusters for hierarchical modeling and call for a cautious interpretation of results, asthe estimation of variance components may be less robust. To address this issue, we employedrestricted maximum likelihood estimation. Elff et al. (2021) showed in a simulation study thatthis method leads to unbiased estimates even with a few groups (and that estimates of group-levelvariances were biased downward using standard maximum likelihood). We also compare therandom intercept models with the fixed-effects models in the “Sensitivity Analyses” section.We used Stata 15 (mixed, menbreg) for all statistical analyses. Interval-scaled predictors werestandardized.
4 RESULTS
4.1 Descriptive statistics
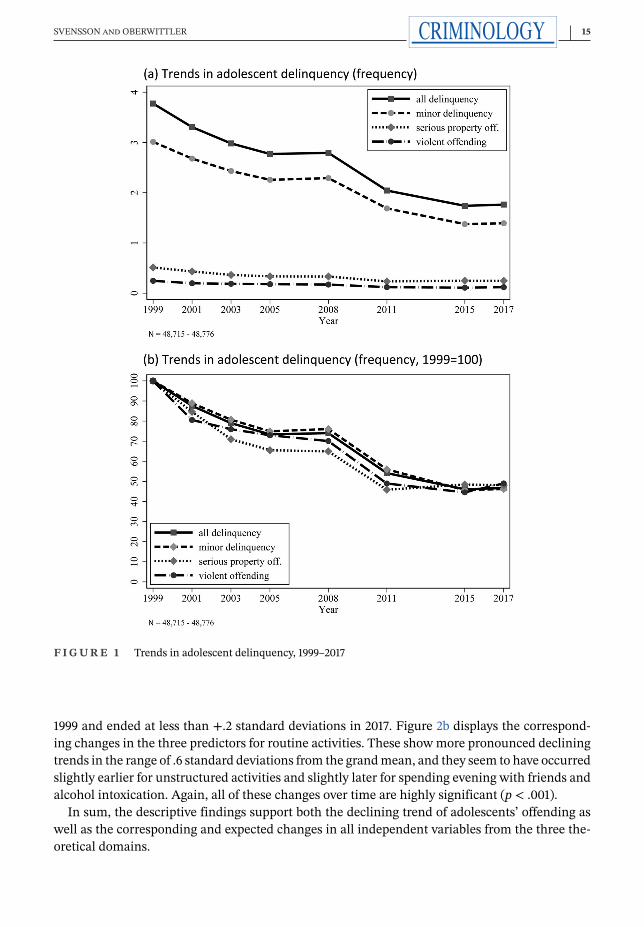
Initially we present descriptive evidence for a declining trend in youth crime in Sweden. All of thefollowing mean differences are highly significant (p < .001).5 Figure 1a shows a drop in the fre-quency scales for overall offending as well as for minor delinquency, serious property, and violentoffending. A value of around 4 for overall offending in 1999 represents the arithmetic mean of allrespondents who either did not offend at all or offended in varying degrees of frequencies. As thistrend is difficult to spot for the less frequent types of offending, figure 1b displays the same timeseries indexed to 100 for 1999. All types of offending have decreased in frequency by ca. 50 per-cent between 1999 and 2017. The decline seems to have been somewhat steeper between 1999 and2011 for serious property and violence offenses, which remained stable after 2011, whereas overalloffending (which is largely driven by the more frequent forms of minor offenses) continued todecline after 2011.6Next, we present a descriptive overview on the development over time of the explanatory vari-
ables. For the comparability of these predictors, all were standardized around the grand mean ofthe pooled sample of eight survey sweeps. Figure 2a shows that parental monitoring and bondsto schools became stronger over time and that attitudes toward crime became less approving. Yet,with a range of less than .4 standard deviations, these changes were not pronounced. For exam-ple, school bonds started at –.2 standard deviations below the grand mean of all survey sweeps in
4 Additional supporting information can be found in the full text tab for this article in the Wiley Online Library athttp://onlinelibrary.wiley.com/doi/10.1111/crim.2021.59.issue-2/issuetoc.5 These and the following significance tests reported in this section are based on analysis of variance with survey years asgroups.6 Although the issue of prevalence versus frequency of offending is not a focus of the present analysis, we comparedthe changes in offending frequencies with the changes in prevalence rates. The prevalence rates for overall and minordelinquency (which stood at ca. 60 percent in 1999) showed a proportional decrease by around 40 percent. The prevalencerate of violent offending dropped more strongly by 60 percent.
SVENSSON and OBERWITTLER 15
F IGURE 1 Trends in adolescent delinquency, 1999–2017
1999 and ended at less than +.2 standard deviations in 2017. Figure 2b displays the correspond-ing changes in the three predictors for routine activities. These showmore pronounced decliningtrends in the range of .6 standard deviations from the grandmean, and they seem to have occurredslightly earlier for unstructured activities and slightly later for spending evening with friends andalcohol intoxication. Again, all of these changes over time are highly significant (p < .001).In sum, the descriptive findings support both the declining trend of adolescents’ offending as
well as the corresponding and expected changes in all independent variables from the three the-oretical domains.

16 SVENSSON and OBERWITTLER
F IGURE 2 Trends in predictor variables, 1999–2017
4.2 Multivariate analysis
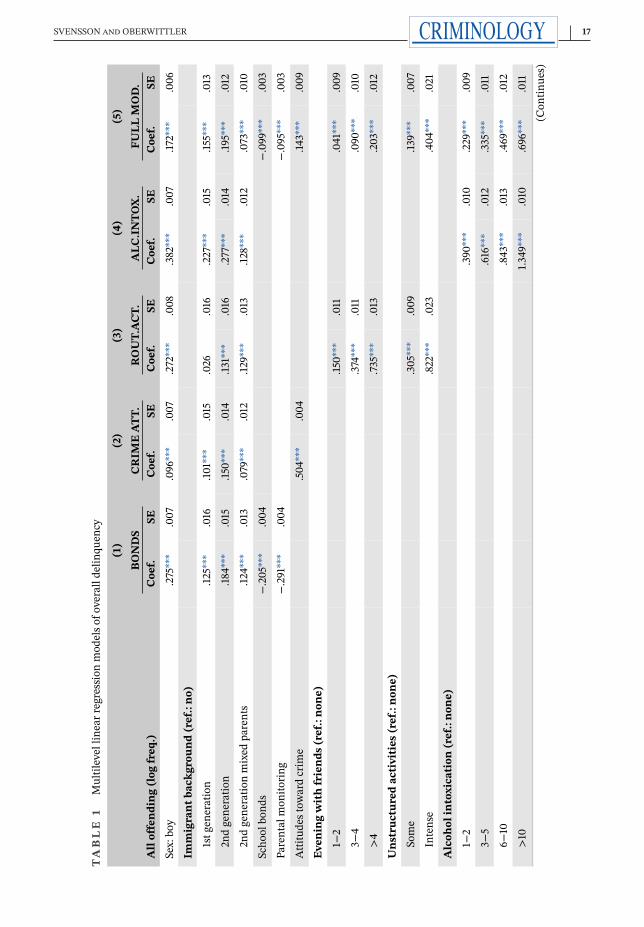
We now turn to the results of multilevel regression analyses. The central research question is asfollows: To what extent can the individual-level predictors of three theoretical domains accountfor the declining trend of youth crime that is modeled on the group level? These predictors areentered block-wise according to these domains into the regression. Because the effect of alcoholintoxication was particularly strong, we decided to keep this predictor in a separate block beforethe final model, which includes all predictors.The model results for overall delinquency can be found in table 1. We support the interpreta-
tion of these models with figure 3a, which graphically displays the estimated random interceptscentered around a grand mean of 0 of the eight survey sweeps for each model, and with figure 3b,
SVENSSON and OBERWITTLER 17
TABLE
1Multilevellinearregressionmodelsofoveralldelinquency
(1)
(2)
(3)
(4)
(5)
BONDS
CRIM
EATT
.ROUT.ACT.
ALC
.INTO
X.
FULL
MOD.
Alloffend
ing(log
freq.)
Coef.
SECoef.
SECoef.
SECoef.
SECoef.
SESex:boy
.275***
.007
.096***
.007
.272***
.008
.382***
.007
.172***
.006
Immigrant
background
(ref.:no)
1stgeneration
.125***
.016
.101***
.015
.026
.016
.227***
.015
.155***
.013
2ndgeneration
.184***
.015
.150***
.014
.131***
.016
.277***
.014
.195***
.012
2ndgenerationmixed
parents
.124***
.013
.079***
.012
.129***
.013
.128***
.012
.073***
.010
Schoolbonds
−.205***
.004
−.099***
.003
Parentalmonitorin
g−.291***
.004
−.095***
.003
Attitudestow
ardcrime
.504***
.004
.143***
.009
Eveningwithfriend
s(ref.:none)
1−2
.150***
.011
.041***
.009
3−4
.374***
.011
.090***
.010
>4
.735***
.013
.203***
.012
Unstructuredactivities(ref.:none)
Some
.305***
.009
.139***
.007
Intense
.822***
.023
.404***
.021
Alcoholintoxication
(ref.:none)
1−2
.390***
.010
.229***
.009
3−5
.616***
.012
.335***
.011
6−10
.843***
.013
.469***
.012
>10
1.349***
.010
.696***
.011
(Continues)
18 SVENSSON and OBERWITTLER
TABLE
1(Continued)
(1)
(2)
(3)
(4)
(5)
BONDS
CRIM
EATT
.ROUT.ACT.
ALC
.INTO
X.
FULL
MOD.
Alloffend
ing(log
freq.)
Coef.
SECoef.
SECoef.
SECoef.
SECoef.
SEInteractionXAttitud
estowardcrim
eEveningwith
friends=
1−2
.027**
.010
Eveningwith
friends=
3−4
.069***
.010
Eveningwith
friends=
>4
.084***
.011
Unstructuredactivities=some
.046***
.007
Unstructuredactivities=intense
.066***
.015
Alcoholintoxication1−2
.105***
.010
Alcoholintoxication3−5
.113***
.011
Alcoholintoxication6−10
.125***
.012
Alcoholintoxication>10
.159***
.009
Constant
.575***
.050
.677***
.043
.175***
.036
.105***
.024
.255***
.018
Variance
components
L2(year)
.020***
.005
.014***
.004
.009***
.003
.004***
.001
.002***
.001
L1(respondent)
.649***
.002
.569***
.002
.693***
.002
.579***
.002
.437***
.001
L2var.reductionvs.M
cond.a(%)
40.2
56.9
71.7
87.7
94.5
L1var.reductionvs.M
conc.a(%)
19.1
29.2
13.7
27.9
45.6
AIC
117,303.700
110,848.503
120,494.684
111,761.504
98,219.831
Notes.N
=48,715in8waves;ICC
inconditionalmodel:4.0%;residualcategoriesN
/Aincluded
butnotreported.
a Mcond:conditionalm
odel.
*p<0.05;**p<0.01;***p<0.001.

SVENSSON and OBERWITTLER 19
F IGURE 3 Random effects and proportional reduction of variance in blockwise linear multilevel models(overall delinquency)
which graphically displays the proportional reduction in variance on level 1 (respondent level)and on level 2 (year level).In the conditional model (not reported in table 1), which controls for sex and immigrant
background, the intraclass correlation coefficient indicates that 4 percent of the total varianceis between the survey sweeps. Although this proportion seems low, it is typical for behavioraloutcomeswheremost of the variation lies between the individuals (Duncan&Raudenbush, 1999).In figure 3a, the line labeled “socio-dem.” displays the random intercepts of the conditionalmodel,which clearly reflect the declining time trend familiar from the descriptive plot in figure 1a. Boysreport significantly more offenses, as do adolescents with immigrant backgrounds (in particularsecond generation).
20 SVENSSON and OBERWITTLER
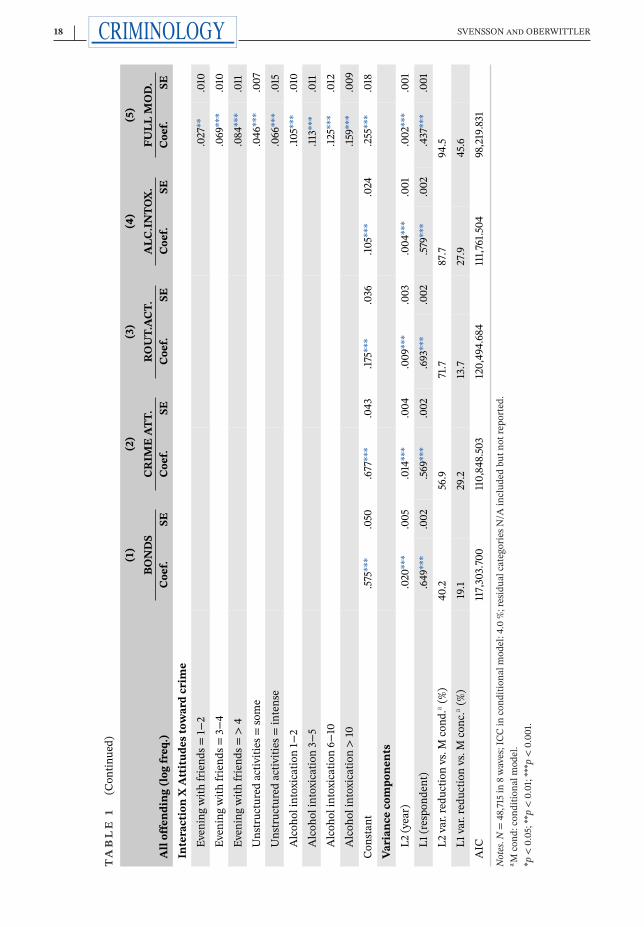
The first model reported in table 1 looks at the effects of parental monitoring and school bonds.The unstandardized coefficients show that both predictors are negatively associated with offend-ing. As the dependent variable is log-transformed, their numeric values do not revealmuch exceptthe direction and relative strength of effects. The year-level variance—the main focus of ourinterest—is reduced by 40 percent, whereas the respondent-level variation is reduced by 19 per-cent (these and the following percentages are rounded; please refer to table 1 and figure 3b forexact results). It should be noted that the proportional reduction of variance in multilevel mod-els is often higher at the group level, which however represents only a small portion of the totalvariance, than at the individual level, and considering the low number of groups, we prefer tointerpret this and the following results cautiously.7The reduction in year-level variance leads to a partial reduction in the random intercepts plot-
ted in figure 3a (line labeled “bonds”). The next model 2 alternatively includes the predictor“attitudes toward crime” which is strongly associated with delinquency. The proportional reduc-tion of variance is stronger compared with the previous model (57 percent of year-level, 29 per-cent of respondent-level variance), and the plotted line of random intercepts in figure 3a (labeled“crim.att.”) is slightly less steep than the line of the previous model. Model 3 estimates the effectsof two predictors representing routine activities that both are significant and provide a strongerreduction of variance between the survey sweeps (72 percent) but a lesser reduction of varianceon the respondent level (14 percent). Spending more than four evenings with friends (B = .735)and “intense” unstructured activities (two or more types of activities, B = .822) are more stronglyassociated with delinquency than having a 1 standard deviation higher score on the scale attitudestoward crime in the previous model (B = .504). More frequent incidences of alcohol intoxicationare even more strongly associated with delinquency (B = .843 for “6 to 10 times”, B = 1.349 for“more than 10 times”) than the previous variables of routine activities indicating a close asso-ciation between heavy alcohol consumption and delinquency. Note as these models look at theeffects of predictors separately they do not consider possible interactions with delinquent atti-tudes yet. Model 4 looks at the effects of alcohol intoxication separately. Almost 90 percent of theyear-level variance is explained by alcohol intoxication alone. Accordingly, the line of predictedrandom intercepts for this model (line “alc.intox.” in figure 3a) is now almost flat. Thus, whereasthe previous models covering the effects of social bonds and attitudes reduced the declining trendin offending only partially (with up to 57 percent of the year differences explained), the twomodelsusing routine activity predictors provide stronger reductions in year-level variance (72 percent to88 percent), whereas the variance reduction on the level of individual respondents is not strongerthan in the first two models (14 percent to 28 percent). These results are in line with Baumer et al.(2021) who also found that changes in unstructured socializing and alcohol contributed more tothe explanation of the crime decline than relations to parents and school.The last model (table 1, model 5) includes all predictors from previous models plus the inter-
actions between attitudes toward crime and all three predictors of routine activities includingalcohol intoxication.8 Confirming our assumptions, these interactions are strongly significant,
7 The proportions of explained variance at the group level may often be larger because this variance component is strippedoff the individual-level random variation. (See examples in Snijders & Boskers, 2012, p. 35; Raudenbush & Bryk, 2002, p.74; cf. for geographic units at different levels of aggregation, Oberwittler & Wikström, 2009.)8We acknowledge that the use of multiplicative terms in linear regression models with log-transformed dependent vari-ables may not be an adequate strategy in many cases because of the nonlinear properties of the function. In this case, theinteraction is sufficiently robust to produce significant interaction terms. See Hannon and Knapp (2003) and Svenssonand Oberwittler (2010).
SVENSSON and OBERWITTLER 21
and routine activities lose most of their influence on offending if adolescents disapprove of crimi-nal behaviors, in support of situational action theory (Wikström et al., 2012). In this fullmodel, theproportional reduction of respondent-level variance increases to 46 percent, whereas the reduc-tion of year-level variance is now almost complete (95 percent). Looking again at the plotted ran-dom intercepts in figure 3a, the line of the full model (line “full model”) is almost flat, with onlyminor fluctuations around the grand mean left.In sum, the multilevel models indicate that the variance component representing the declining
trend in delinquency can be almost completely explained by changes in social bonds, attitudestoward crime, and routine activities. Routine activities and heavy alcohol consumption show aparticularly strong association with the decline in crime when compared with social bonds andattitudes toward crime. It is intriguing that the same finding has been reported by Baumer et al.(2021) based on independent data from a different country. The three explanatory variables mea-suring routine activities and alcohol consumption together account for as much of the year-levelvariance as the all predictors in the full model (model not reported). It is particularly noteworthythat even though attitudes toward crime and alcohol intoxication both explain almost the sameportion of respondent-level variance (29 percent vs. 28 percent); the former can only explain 57percent and the latter 88 percent of the year-level variance. This difference corresponds with theweaker declining time trend for attitudes toward crime compared with a stronger declining trendof alcohol intoxication (see figure 2a, 2b).We repeated the same series of multilevel models using violent and serious property offenses as
dependent variables (see online tables 1a-b and online figures 1a-b in the supporting information).These analyses show identical patterns compared with the analysis of overall offending and con-firm that changes in routine activities and alcohol consumption were decisive for the decliningtrend also in more serious forms of adolescent crime.
4.2.1 Sensitivity analyses
We ran several alternative models to test the robustness of our findings. First, we repeated ourseries of models using nonlinear, negative binomial multilevel regression analysis that is suitedto the highly skewed dependent variable. Although it is not straightforward to compute the pro-portional reduction of variance in nonlinear models, we can at least predict and plot the randomintercepts of all models in the same way as we did in the main analyses using linear regression.The results confirm our central finding that the predictors representing routine activities and par-ticularly alcohol intoxication account for most of the declining crime trend, whereas the predic-tors representing social bonds and attitudes for crime do so only partially. All predictors combinedalmost completely account for the decline of youth crime, as in the linear models (see online table2 and figure 2 in the supporting information).Second, we ran negative binomial regression models including a time trend as a group-level
predictor (see online table 3 in the supporting information). Considering the inherent nonlinearnature of the log link function, the simple time predictor translates into a nonlinear decliningtrend that slightly abates over subsequent survey waves. Importantly, the trend coefficient wasrendered smaller and smaller in subsequent regression models as more and more of the year-level variance was explained by respondent-level predictors (see online figure 3 in the supportinginformation). Comparing the final model with the conditional model, the time trend coefficientwas reduced by 83 percent for overall offending.
22 SVENSSON and OBERWITTLER
Third, considering that eight survey waves are very few groups for a multilevel approach, weran fixed-effects models with dummy variables representing the survey waves instead of hierar-chical random-effects models (see online table 4 and figure 4 in the supporting information). Ifourmultilevel model results were tainted by biased estimates of variance components, then fixed-effects models would offer a more robust alternative approach. Yet, comparing the coefficients ofthe wave dummies in the start model without substantial predictors with the full model with allsubstantial predictors, again these coefficients were reduced close to zero. In online table 4, thedummy predictor for year 2017, which represents the crime drop since 1999, is attenuated by 84percent (from –.480 to –.078). This reduction is considerably stronger than the 35 percent reduc-tion of the crime decline in the explanatory models reported by Baumer et al. (2021, p. 15), butit matches the estimated reduction of the time trend coefficient in the random intercept modelreported above (online table 3 in the supporting information).In addition to comparing alternative model approaches, we also looked for changes in the rel-
evance of individual-level predictors but found little evidence for variability of coefficients overtime, apart from a weakening of the effects of parental monitoring and attitudes toward crime(see online figures 5a–f in the supporting information).9 Although not a focus of our analysis, thissuggests that the relevance of predictors for the explanation of individual criminal behavior didnot substantially change during the two decades (cf. van der Laan et al., 2019).Finally, we repeated all linear hierarchical models using only the first six survey sweeps cover-
ing the period 1999 to 2011 to avoid problems arising from both different wordings of the surveyquestions and differences in the sampling design and nonresponse in the last two sweeps (2015and 2017; see online tables 6 and online figures 6a–b in the supporting information). Thesemodelsshow essentially the same picture and confirm our main findings.
5 DISCUSSION AND CONCLUSION
This article contributes to understanding the causes of the decline in youth crime in recentdecades. Looking at the micro-foundation of individual-level correlates of adolescent offending,we argued that changes in social bonds, attitudes toward crime, and daily routine activities allhave contributed to the decline in youth crime. We investigated this using a series of eight sweepsof a nationally representative school survey from Sweden, covering a period of 18 years between1999 and 2017. The self-report data from these sweeps confirm that youth crime declined consid-erably in Sweden over this time period for different crime types, which is in line with the trendsin youth crime in many other societies across West Europe and North America.
5.1 Summary of results
Using multilevel models with survey year as the group level, and entering explanatory variableson the individual respondent level, we found that 95 percent of the between-year variance of
9 In assessing these slope differences, the conditional nature of the effect of crime attitudes must be considered. As wefound very substantial interaction effect between crime attitudes and routine activities, the slope of ‘crime attitude’ basedon more simple regression model reported in these sensitivity tests does reflect the strength of the effect at an averagevalue of the respective values of routine activity variables. More in-depth analyses including the interaction terms wouldbe necessary to ascertain the character of these changes.
SVENSSON and OBERWITTLER 23
delinquencywas accounted for by changes in adolescents’ attitudes and behavior.We regard theseand the following numeric results representing proportional reductions in variance as indicativefor the substantive relevance of model results but apply caution because of the small number ofsurvey waves. Alternative fixed effects models led to similar results—a reduction of the decliningcrime trend by 84 percent after controlling for all explanatory variables. Overall, our analyses showthat the investigated factors—indicators of parental monitoring, school bonds, attitudes towardcrime, and routine activities including alcohol intoxication—account for the largest portion of thedecline of delinquency over two decades and eight waves of survey data.Confirming our first hypothesis, we found that an increase in parental monitoring and school
bonds partially accounts for the decline in delinquency, explaining 40 percent of its year-levelvariance. Relations to parents and school bonds tap into core elements of social control theory,and recent research from various countries supports the notion that both have grown stronger inrecent decades (Clark et al., 2013; Curran &Hill, 2019; Kivivuori & Bernburg, 2011; Raitasalo et al.,2018).In line with our second hypothesis we found that an increase of negative attitudes toward crime
explained 57 percent of the decline in delinquency. Shifts in themoral climate have been discussedby some scholars in relation to the decline of delinquency (Berghuis & DeWaard, 2017; Kivivuori& Bernburg, 2011) but seem to have been underrated in the main body of research on the crimedrop (Tcherni-Buzzeo, 2019; Tonry, 2014).Our third hypothesis dealt with the role of adolescent routine activities and alcohol consump-
tion. Our analyses found that changes in daily routine activities accounted for a larger part of thecrime decline than changes in social bonds and attitudes toward crime. Two indicators of routineactivities (evenings with friends and unstructured activities) explained 72 percent of the decline inoverall offending, whereas alcohol intoxication explained an even larger share of this decline (88percent). Thus, unstructured routine activities which foster situational inducements and opportu-nities to commit crimes provedmore relevant for the decline in crime than parental control, bondsto school, and attitudes toward crime, even though their explanatory power was much weaker onthe individual level. Although all of the explanatory variables used in our models showed tem-poral trends in accordance with the declining crime trend, the changes in routine activities andalcohol consumption were stronger than the changes in social bonds and attitudes toward crimethat correspond with their stronger effect on the changes in youth crime (cf. Baumer et al., 2021).
5.2 Contribution to research on the crime drop
Taken together, our findings underline the relevance of long-term changes in adolescent socialrelations and daily routine activities for the explanation of the downward trend in delinquency.They support claims that the decline in peer-oriented “nondigital” activities in particular consti-tutes a major behavioral shift in adolescence with consequences for receding delinquency. Thisstudy is not the first to observe these connections. Yet, most previous research has looked at theseaspects of adolescent social behaviors separately, was mainly descriptive or correlational, anddid not analyze the interrelations between behavioral domains (e.g., Arnett, 2018; Balvig, 2011;Berghuis & De Waard, 2017; Keyes et al., 2018; Moss et al., 2019; Twenge & Park, 2019). The cur-rent study adds substantially to the understanding of the crime decline because it models long-term changes in criminal behavior as an outcome of long-term changes in relevant aspects of ado-lescents’ lives that correspond to proximate influences on delinquency. Also, it does so not on anational, aggregate level of correlated time series but on the individual level, employingmultilevel
24 SVENSSON and OBERWITTLER
modeling with time as a higher level. Compared with merely suggesting a correlation betweentwo parallel trends of national aggregate time series, the proof that such associations exist on themicro-level of individual adolescents is important and marks a step toward exploring the causalmechanisms of long-term changes in criminal behavior. Based on repeated cross-sectional data,however, the study cannot claim causality. In addition, identifying potential mechanism of thecrime decline on the micro-level does not make the search for macro-level factors that may haveinfluenced the observed changes less important.Our study joins a small, emerging field of research based on repeated cross-sectional survey
data which help to move the analysis of adolescent crime trends closer to “the contours of exist-ing etiological research on crime” (Baumer et al., 2018, p. 56). Some previous studies, however,were limited by a small number of time points and/or a narrow range of facets of adolescent lives(Keyes et al., 2018; van der Laan et al., 2019). The recent study by Baumer and colleagues (2021)expanded this research by exploiting 25 waves of Monitoring the Future data and considering alarger set of predictors simultaneously in multilevel models. Looking at delinquency prevalence,they found that unstructured socializing and alcohol use were the major factors associated withthe crime decline, whereas relations to parents and school bonds remained stable and did notcontribute to its explanation. The present study that analyzed delinquency frequencies using sur-vey data from Sweden confirms these findings from the United States: Changes in unstructuredactivities and alcohol use were the most important factors connected with the crime decline. It isintriguing that this main finding is identical in two independent studies from different nationalcontexts. Yet, other than Baumer et al. (2021), we did find some additional if minor effects ofschool and parental bonds as well as attitudes to crime that also showed long-term trends in theexpected direction.Whether this reflects cross-national differences or is a result of surveymethod-ology remains unclear. Also, there is no apparent explanation why we can account for most of thedeclining trend in Sweden, whereas Baumer et al. (2021) accounted for approximately a third ofthe trend. Future analyses should compare the temporal trends of crime frequency (our depen-dent variable) with those of crime prevalence (Baumer et al.’s dependent variable; Berg et al.,2016; Sivertsen et al., 2019). Also, more studies from other countries may help to shed light onthese discrepancies.Both the present study and the study by Baumer et al. (2021) underline the value of using
repeated cross-sectional survey data and applying sophisticated statistical approaches such asmultilevel modeling that partitions the variability into its individual and temporal componentsand elegantly helps to gauge the explanatory power of micro-level predictors on national crimetrends.The present study adds a specific perspective to a diverse andheterogenous research field.Much
of the crime drop literature has focused on serious forms of crime such as homicide and onmacro-level influences such as crime policies, security measures, or changing drug markets (Baumeret al., 2018; van Dijk et al., 2012). Using adolescents’ self-report data, the present study insteadoffers a micro-level, etiological analysis of criminal behavior at the lower, less serious end of thescale. This focus on proximate influences on delinquency has both advantages and disadvantages.The results lend empirical support to several hypotheses that have been prominent in the recentliterature on the crime drop among adolescents (e.g., Arnett, 2018; Balvig, 2011; Baumer et al.,2021; Berghuis & De Waard, 2017; Moss et al., 2019; Pape et al., 2018; Twenge & Park, 2019). Onthe other hand, it inevitably leaves questions about the “causes of the causes” (Wikström, 2007)unanswered. Even if the micro-level analysis considerably contributes to the understanding ofthe long-term decline of youth crime, distal factors potentially situated at societal macro-levelscan still be assumed to exert important effects in the background. Yet, these distal factors and
SVENSSON and OBERWITTLER 25
the mechanisms of translating them into individual behavior seem less accessible to empiricalanalysis. Although we can observe changes in parent–child relations or adolescents’ attitudestoward school or criminal behavior, it is more difficult, and beyond the scope of this study, toascertain the drivers of these long-term societal trends and cultural shifts (e.g., Eisner, 2014), suchas the assumption that changes in the labor market force adolescents to be more future oriented(Balvig, 2011), or that outlawing spanking by parents improves parent–child relations and reducesdelinquency (Lansford et al., 2017). Both a long-term trend toward more careful and protectivechild-rearing practices and, more recently, toward online activities are two elements of societalchanges that are plausibly being connected with the adolescent crime decline. To identify theeffects of such macro-level changes on adolescents’ attitudes and behaviors, cross-cultural sam-ples and societal-level variability in the relevant phenomena are needed (e.g., Deater-Deckardet al., 2018; Inglehart & Welzel, 2005).Still, we would claim that the results of this study can contribute also to discussions about
macro-level influences on the crime drop. Our findings question the validity of the security or“debut crime” hypothesis that sees technological innovations, essentially the target hardening ofobjects that could be stolen, as the prime cause of the adolescent crime drop (Farrell et al., 2015).In light of the strong association between the decline in unstructured out-of-home activities andthe decline in various types of delinquency, we find it inconceivable that the improved securityof cars or dwellings against property crimes induced adolescents to become less delinquent thanprevious cohorts (cf. Tonry, 2014, p. 5). Stronger security may have curtailed opportunities forcrime and contributed to influenced adolescents’ normative beliefs about right and wrong behav-ior or intensified a cultural shift toward social control (Eisner, 2014, p. 123), but it is unlikely that itbrought about the broader social change in adolescent social relations and daily routine activitiesthat we observed in the current study, and that can plausibly be associated with the decline inyouth crime. To put it more plainly, why should improved car security or technical surveillanceinduce a generation of adolescents to spend less time with their friends during evening hours?Although our results also point at the strong effects of changing routine activities, they guard
against a reductionist understanding of routine activities as merely the technical opportunity tocommit property crimes. We prefer a more comprehensive understanding of adolescent routineactivities that encompasses behavioral preferences, lifestyles, and youth cultures (Hoeben et al.,2016; Osgood et al., 1996) and does not neglect the conditionality of the criminogenic effects ofroutine activities on adolescents’ delinquent propensities (e.g., Gerstner &Oberwittler, 2018;Wik-ström et al., 2018). This conditionality has once more been confirmed by significant interactioneffects between routine activities and delinquent attitudes in our models.
5.3 Limitations
Apart from the general consequences of themicro-level approach and its focus on proximate influ-ences ondelinquency discussed in the previous section, this studyhas several limitations that needto be addressed.First, several potentially relevant indicators are omitted from our analysis. Apart from psycho-
logical concepts such as self-control or sensation seeking, which has been discussed as a possibleexplanation of the decline in crime (Baumer et al., 2018, 2021), van der Laan et al. (2019) alsoincluded individual factors such as hyperactivity in their study.Second, one particularly unfortunate omission from our analysis is the role of digital media
and online activities in adolescents’ daily lives. These aspects were also not addressed in the
26 SVENSSON and OBERWITTLER
survey. That the decline in youth crime has been caused by the digital revolution is a widely dis-cussed assumption (Arnett, 2018; Weerman, 2017). As time budget studies have revealed a shiftfrom offline to online activities and a decline of time spent out-of-house with peers, our findingthat a decline in unstructured socializing and alcohol consumption had the strongest effect on thedecline of youth crime could be seen as an indirect support of this assumption. Twenge and Park(2019, p. 647) claimed, however, that the decline of some routine activities started before Internetuse becamemore widespread among adolescents, and therefore, the Internet can only be a partialexplanation of the changes in daily routines.Third, we are also not able to contribute to the discussion about a possible shift from tradi-
tional crime to cybercrime (e.g., Weerman, 2017). Among adolescents specifically, cyberbullyinghas grown into a prevalent form of relational aggression that partly may replace physical violence(Brochado et al., 2017). Again, some scholars have argued that the decline in crime started beforethe spread of cybercrime (Farrell &Birks, 2018). Thismeans thatmore research is needed to clarifywhether or to what extent traditional “offline” crimes have been replaced by cybercrimes amongadolescents.Fourth, there are some methodological limitations. Although the repeated national-
representative surveys are suitable for trend analyses, the data remains cross-sectional, whichprecludes causal claims. For example, the contemporaneous measurement of crime attitudes anddelinquent behavior surely overestimates the “true” association of the two variables, and we can-not be certain whether a shift in attitudes influences behavior or vice versa.Although we are covering a period of 18 years, we only have eight measuring points. For com-
parison, van der Laan et al. (2019) used threemeasurement points, whereas Keyes et al. (2018) andBaumer et al. (2021) were able to use more than twenty. Nevertheless, considering the stable long-term trends in the survey data, the use of REML estimators and the results of sensitivity analyses(i.e., fixed-effects models), we regard our findings as robust.Despite these limitations, this study showed that a focus on the micro-level of individual
explanatory factors of youth crime advances the understanding of the long-term decline in youthcrime. The study adds to the literature by putting theoretically relevant factors to an empirical testusing a unique multiwave data set. The results show that factors linked to routine activity theoryare most strongly associated with the decline in youth crime during the last two decades.
ORCIDRobert Svensson https://orcid.org/0000-0002-6080-2780DietrichOberwittler https://orcid.org/0000-0003-2235-3483
REFERENCESAjzen, I., Fishbein, M., Lohmann, S., & Albarracín, D. (2019). The influence of attitudes on behavior. In D. Albar-racín & B. Johnson (Eds.), The handbook of attitudes: Volume 1: Basic principles (2nd ed., pp. 197–255). Routledge.
Albarracin, D., & Shavitt, S. (2018). Attitudes and attitude change. Annual Review of Psychology, 69, 299–327.Agnew, R., & Petersen, D. M. (1989). Leisure and delinquency. Social Problems, 36(4), 332–350. https://doi.org/10.2307/800819
Allen, K., Kern, M. L., Vella-Brodrick, D., Hattie, J., &Waters, L. (2018). What schools need to know about fosteringschool belonging: A meta-analysis. Educational Psychology Review, 30(1), 1–34.
Antonaccio, O., & Tittle, C. R. (2008). Morality, self-control, and crime. Criminology, 46(2), 479–510. https://doi.org/10.1111/j.1745-9125.2008.00116.x
Apel, R., & Horney, J. (2017). How and why does work matter? Employment conditions, routine activities, andcrime among adult male offenders. Criminology, 55(2), 307–343. https://doi.org/10.1111/1745-9125.12134
SVENSSON and OBERWITTLER 27
Arnett, J. J. (2018). Getting better all the time: Trends in risk behavior among American adolescents since 1990.Archives of Scientific Psychology, 6(1), 87–95. http://doi.org/10.1037/arc0000046
Baier, D. (2018). Violence and radicalism—State of research and prevention perspectives. In H.-J. Kerner & E.Marks (Eds.), Internet documentation of the German Congress on Crime Prevention (www.praeventionstag.de/dokumentation.cms/4094). Deutscher Präventionstag.
Balvig, F. (2011). Lovlydig ungdom. Det Kriminalpræventive Råd.Baumer, E. P., Cundiff, K., & Luo, L. (2021). The contemporary transformation of American youth: An analy-sis of change in the prevalence of delinquency, 1991–2015. Criminology, 59(1), 109–136. https://doi.org/10.1111/1745-9125.12264
Baumer, E. P., & Lauritsen, J. L. (2010). Reporting crime to the police, 1973–2005: A multivariate analysis of long-term trends in theNational Crime Survey (NCS) andNational CrimeVictimization Survey (NCVS).Criminology,48(1), 131–185. https://doi.org/10.1111/j.1745-9125.2010.00182.x
Baumer, E. P., Vélez, M. B., & Rosenfeld, R. (2018). Bringing crime trends back into criminology: A criticalassessment of the literature and a blueprint for future inquiry. Annual Review of Criminology, 1, 39–61. https://doi.org/10.1146/annurev-criminol032317-092339
Bell, A. (2020). Age period cohort analysis: A review of what we should and shouldn’t do.Annals of HumanBiology,47(2), 208–217. https://doi.org/10.1080/03014460.2019.1707872
Berg, M. T., Baumer, E., Rosenfeld, R., & Loeber, R. (2016). Dissecting the prevalence and incidence of offendingduring the crime drop of the 1990s. Journal of Quantitative Criminology, 32(3), 377–396. https://doi.org/10.1007/s10940-016-9289-6
Berghuis, B., & Waard, J. D. (2017). Verdampende jeugdcriminaliteit: Verklaringen van deinternationale daling.Justitiële Verkenningen, 43, 10–27.
Bernasco, W., Ruiter, S., Bruinsma, G. J., Pauwels, L. J., & Weerman, F. M. (2013). Situational causes of offending:A fixed-effects analysis of space–time budget data. Criminology, 51(4), 895–926. https://doi.org/10.1111/1745-9125.12023
Blumstein, A., & Wallman, J. (Eds.) (2006). The crime drop in America (2nd ed.). Cambridge University Press.Boers, K., Reinecke, J., Mariotti, L., & Seddig, D. (2010). Explaining the development of adolescent violent delin-quency. European Journal of Criminology, 7(6), 499–520. https://doi.org/10.1177/1477370810376572
Boisvert, D. L., Connolly, E. J., Vasek, J. C., Armstrong, T. A., & Boutwell, B. B. (2019). Genetic and environmentaloverlap between substance use and delinquency in adolescence: An analysis by same-sex twins. Youth Violenceand Juvenile Justice, 17(2), 154–173.
Brochado, S., Soares, S., & Fraga, S. (2017). A scoping review on studies of cyberbullying prevalence among adoles-cents. Trauma, Violence, & Abuse, 18(5), 523–531. https://doi.org/10.1177/1524838016641668
Brown, W., & Leonard, K. E. (2017). Does alcohol cause violence and aggression? In P. Sturmey (Ed.), The Wileyhandbook of violence and aggression. John Wiley & Sons. https://doi.org/10.1002/9781119057574
Brå. (2013). Brott bland ungdomar i årskurs nio. Resultat från Skolundersökningen om brottåren 1995–2011. Brå-rapport 2013:3. Brottsförebyggande rådet.
Brå. (2018). Skolundersökningen om brott 2017. Om utsatthet och delaktighet i brott. Brårapport 2018:15. Brottsföre-byggande rådet.
Chapple, C. L., McQuillan, J. A., & Berdahl, T. A. (2005). Gender, social bonds, and delinquency: A comparison ofboys’ and girls’ models. Social Science Research, 34(2), 357–383. https://doi.org/10.1016/j.ssresearch.2004.04.003
Clark, T., Fleming, T., Bullen, P., Crengle, S., Denny, S., Dyson, B., . . . Teevale, T. (2013). Health and well-beingof secondary school students in New Zealand: Trends between 2001, 2007 and 2012. Journal of Paediatrics andChild Health, 49(11), 925–934. https://doi.org/10.1111/jpc.12427
Cohen, L. E., & Felson, M. (1979). Social change and crime rate trends: A routine activity approach. AmericanSociological Review, 44(4), 588–608. https://doi.org/10.2307/2094589
Curran, T., & Hill, A. P. (2019). Perfectionism is increasing over time: A meta-analysis of birth cohort differencesfrom 1989 to 2016. Psychological Bulletin, 145(4), 410–429. https://doi.org/10.1037/bul0000138
Deater-Deckard, K., Godwin, J., Lansford, J. E., Bacchini, D., Bombi, A. S., Bornstein, M. H., & Al-Hassan, S. M.(2018). Within- and between-person and group variance in behavior and beliefs in cross-cultural longitudinaldata. Journal of Adolescence, 62, 207–217. https://doi.org/10.1016/j.adolescence.2017.06.002
DiPrete, T. A., & Grusky, D. B. (1990). The multilevel analysis of trends with repeated cross-sectional data. Socio-logical Methodology, 20, 337–368.
28 SVENSSON and OBERWITTLER
Doepke, M., Sorrenti, G., & Zilibotti, F. (2019). The economics of parenting. Annual Review of Economics, 11, 55–84.https://doi.org/10.1146/annurev-economics-080218-030156
Duncan, G. J., & Raudenbush, S. W. (1999). Assessing the effects of context in studies of child and youth develop-ment. Educational Psychologist, 34(1), 29–41.
Eisner, M. (2014). From swords to words: Does macro-level change in self-control predict long-term variation inlevels of homicide? Crime and Justice, 43, 65–134. https://doi.org/10.1086/677662
Elff,M.,Heisig, J. P., Schaeffer,M., & Shikano, S. (2021).Multilevel analysiswith few clusters: Improving likelihood-based methods to provide unbiased estimates and accurate inference. British Journal of Political Science, 51(1),412–426. https://doi.org/10.1017/S0007123419000097
Elonheimo, H. (2014). Evidence for the crime drop: Survey findings from two Finnish cities between 1992 and 2013.Journal of Scandinavian Studies in Criminology and Crime Prevention, 15(2), 209–217. http://doi.org/10.1080/14043858.2014.939458
Estrada, F. (2019). Youth and crime in a welfare state. Trends, inequalities and societal response. In J. LunnebladEd.), Policing schools: School violence and the juridification of youth (pp. 33–51). Springer.
Estrada, F., Bäckman, O., & Nilsson, A. (2016). The darker side of equality? The declining gender gap in crime:Historical trends and an enhanced analysis of staggered birth cohorts. British Journal of Criminology, 56(6),1272–1290. https://doi.org/10.1093/bjc/azv114
Fairbrother, M. (2014). Two multilevel modeling techniques for analyzing comparative longitudinal surveydatasets. Political Science Research and Methods, 2(1), 119–140.
Fagan, A. A., & Bendini, K. M. (2019). Family influences on youth offending. In D. P. Farrington, L. Kazemian, &A. R. Piquero (Eds.), The Oxford handbook of developmental and life-course criminology (pp. 379–404). OxfordUniversity Press.
Farrell, G., & Birks, D. (2018). Did cybercrime cause the crime drop? Crime Science, 7, 8. https://doi.org/10.1186/s40163-018-0082-8
Farrell, G., Laycock, G., & Tilley, N. (2015). Debuts and legacies: The crime drop and the role of adolescence-limitedand persistent offending. Crime Science, 4, 1–10. https://doi.org/10.1186/s40163-015-0028-3
Farrell, G., Tilley, N., & Tseloni, A. (2014). Why the crime drop? In M. Tonry (Ed.), Why crime rates fall and whythey don’t, volume 43 of crime and justice: A review of research (pp. 421–490). University of Chicago Press.
Farrell, G., Tseloni, A., Mailley, J., & Tilley, N. (2011). The crime drop and the security hypothesis. Journal ofResearch in Crime and Delinquency, 48(2), 147–175. https://doi.org/10.1177/0022427810391539
Felson, M. (1994). Crime and everyday life. Pine Forge Press.Felson, R., Savolainen, J., Aaltonen, M., &Moustgaard, H. (2008). Is the association between alcohol use and delin-quency causal or spurious? Criminology, 46(3), 785–808. https://doi.org/10.1111/j.1745-9125.2008.00120.x
Fernández-Molina, E., & Bartolomé Gutiérrez, R. (2020). Juvenile crime drop: What is happening with youth inSpain and why? European Journal of Criminology, 17(3), 306–331. https://doi.org/10.1177/1477370818792383
Firebaugh, G. (1997). Analyzing repeated surveys (No. 115). Sage.Franken, A., Harakeh, Z., Veenstra, R., Vollebergh, W., & Dijkstra, J. K. (2016). Social status of adolescents withan early onset of externalizing behavior: The SNARE study. The Journal of Early Adolescence, 37(8), 1037–1053.https://doi.org/10.1177/0272431616636478
Gerstner, D., & Oberwittler, D. (2018). Who’s hanging out and what’s happening? A look at the interplay betweenunstructured socializing, crime propensity and delinquent peers using social network data. European Journalof Criminology, 15(1), 111–129. https://doi.org/10.1177/1477370817732194
Gilbert, R., Fluke, J., O’Donnell, M., Gonzalez-Izquierdo, A., Brownell, M., Gulliver, P., . . . Sidebotham, P. (2012).Child maltreatment: Variation in trends and policies in six development countries. Lancet, 9817, 758–772. https://doi.org/10.1016/S0140-6736(11)61087-8
Gottfredson, D. C. (2001). Schools and delinquency. Cambridge University Press.Griffiths, G., & Norris, G. (2020). Explaining the crime drop: Contributions to declining crime rates from youthcohorts since 2005. Crime, Law and Social Change, 73, 25–53. https://doi.org/10.1007/s10611-019-09846-5
Grucza, R. A., Krueger, R. F., Agrawal, A., Plunk, A. D., Krauss, M. J., Bongu, J., . . . Bierut, L. J. (2018). Declinesin prevalence of adolescent substance use disorders and delinquent behaviors in the USA: A unitary trend?Psychological Medicine, 48(9), 1494–1503 https://doi.org/10.1017/S0033291717002999
SVENSSON and OBERWITTLER 29
Hannon, L., & Knapp, P. (2003). Reassessing nonlinearity in the urban disadvantage/violent crime relationship:An example of methodological bias from log transformation. Criminology, 41(4), 1427–1448. https://doi.org/10.1111/j.1745-9125.2003.tb01026.x
Hart, C. O., & Mueller, C. E. (2013). School delinquency and social bond factors: Exploring gender differencesamong a national sample of 10th graders. Psychology in the Schools, 50(2), 116–133. https://doi.org/10.1002/pits.21662
Hedström, P., &Ylikoski, P. (2010). Causalmechanisms in the social sciences.Annual Review of Sociology, 36, 49–67.Hirschi, T. (1969). Causes of delinquency. University of California Press.Hoeben, E. M., Meldrum, R. C., Walker, D. A., & Young, J. T. (2016). The role of peer delinquency and unstructuredsocializing in explaining delinquency and substance use: A state-of-the-art review. Journal of Criminal Justice,47, 108–122. https://doi.org/10.1016/j.jcrimjus.2016.08.001
Hoeve,M., Dubas, J. S., Eichelsheim, V. I., van der Laan, P. H., Smeek,W., &Gerris, J. R.M. (2009). The relationshipbetween parenting and delinquency: A meta-analysis. Journal of Abnormal Child Psychology, 37(6), 749–775.https://doi.org/10.1007/s10802-009-9310-8
Inchley, J., Currie, D., Viono, A., Torsheim, T., Ferreira-Borges, C., Weber, M. W., . . . Breda, J. (Eds.) (2018). Ado-lescent alcohol-related behaviours: Trends and inequalities in the WHO European Region, 2002–2014. Observa-tions from the Health Behaviour in School-aged Children (HBSC) WHO collaborative cross-national study. WHORegional Office for Europe.
Inglehart, R., & Welzel, C. (2005). Modernization, cultural change, and democracy. The human developmentsequence. Cambridge University Press.
Junger-Tas, J. (2012). Delinquent behaviour in 30 countries. In Junger-Tas J., Marshall, H., Enzmann, D., Killias,M., & Steketee, M. (Eds.), The many faces of youth crime (pp. 69–93). Springer.
Keyes, K. M., Gary, D. S., Beardslee, J., Prins, S. J., O’Malley, P. M., Rutherford, C., & Schulenberg, J. (2018). Jointeffects of age, period, and cohort on conduct problems among American adolescents from 1991 through 2015.American Journal of Epidemiology, 187(3), 548–557. https://doi.org/10.1093/aje/kwx268
Kim, H. W., & McCarthy, J. D. (2018). Accounting for the decreasing willingness of U.S. high school seniors toprotest, 1976–2015. Social Currents, 5(6), 531–549. https://doi.org/10.1177/2329496518759078
Kivivuori, J. (2007). Delinquent behaviour in nordic capital cities (Publication no. 227). Scandinavian ResearchCouncil for Criminology and National Research Institute of Legal Policy.
Kivivuori, J. (2014). Understanding trends in personal violence: Does cultural sensitivity matter?Crime and Justice,43, 289–340.
Kivivuori, J., & Bernburg, J. G. (2011). Delinquency research in the Nordic countries.Crime and Justice, 40, 405–477.Kraus, L., Seitz, N.-N., Piontek, D., Molinaro, S., Siciliano, V., Guttormsson, U., . . . Hibell, B. (2018). Are the timesa-changin?” Trends in adolescent substance use in Europe. Addiction, 113(7), 1317–1332. https://doi.org/10.1111/add.14201
Kristjansson, A. L., James, J. E., Allegrante, J. P., Sigfusdottir, I. D., & Helgason, A. R. (2010). Adolescent substanceuse, parental monitoring, and leisure-time activities: 12-year outcomes of primary prevention in Iceland. Pre-ventive medicine, 51(2), 168–171. https://doi.org/10.1016/j.ypmed.2010.05.001
Kristjansson, A. L., Sigfusdottir, I. D., Thorlindsson, T., Mann, M. J., Sigfusson, J., & Allegrante, J. P. (2016). Popula-tion trends in smoking, alcohol use and primary prevention variables among adolescents in Iceland, 1997–2014.Addiction, 111(4), 645–652. https://doi.org/10.1111/add.13248
Kroneberg, C., Heintze, I., & Mehlkop, G. (2010). The interplay of moral norms and instrumental incentives incrime causation. Criminology, 48(1), 259–294. https://doi.org/10.1111/j.1745-9125.2010.00187.x
LaFree, G., Curtis, K., & McDowall, D. (2015). How effective are our “better angels”? Assessing country-leveldeclines in homicide since 1950. European Journal of Criminology, 12(4), 482–504. https://doi.org/10.1177/1477370815584261
Lansford, J. E., Cappa, C., Putnick, D. L., Bornstein, M. H., Deater-Deckard, K., & Bradley, R. H. (2017). Changeover time in parents’ beliefs about and reported use of corporal punishment in eight countries with and withoutlegal bans. Child Abuse & Neglect, 71, 44–55. https://doi.org/10.1016/j.chiabu.2016.10.016
Matthews, B., &Minton, J. (2018). Rethinking one of criminology’s “brute facts”: The age crime curve and the crimedrop in Scotland. European Journal of Criminology, 15, 296–320. https://doi.org/10.1177/1477370817731706
30 SVENSSON and OBERWITTLER
Megens, K. C. I. M., & Weerman, F. M. (2012). The social transmission of delinquent effects of peer attitudesand behavior revisited. Journal of Research in Crime and Delinquency, 49(3), 420–443. https://doi.org/10.1177/0022427811408432
Meldrum, R. C., & Clark, J. (2015). Adolescent virtual time spent socializing with peers, substance use, and delin-quency. Crime & Delinquency, 61(8), 1104–1125. https://doi.org/10.1177/0011128713492499
Moss, S. L., Santaella-Tenorio, J.,Mauro, P.M., Keyes, K.M., &Martins, S. S. (2019). Changes over time inmarijuanause, deviant behavior and preference for risky behavior among US adolescents from 2002 to 2014: Testing themoderating effect of gender and age. Addiction, 114(4), 674–686. https://doi.org/10.1111/add.14506
Oberwittler, D., & Wikström, P.-O. H. (2009). Why small is better: Advancing the study of the role of behavioralcontext in crime causation. In D. Weisburd, W. Bernasco, & G. J. N. Bruinsma (Eds.), Putting crime in its place:Units of analysis in geographic criminology (pp. 35–59). Springer.
OECD. (2020). OECD data. https://data.oecd.org/Oleson, J., & Costello, B. J. (Eds.) (2019). Fifty years of causes of delinquency. The criminology of Travis Hirschi.Routledge.
Osgood, D. W., & Anderson, A. L. (2004). Unstructured socializing and rates of delinquency. Criminology, 42(3),519–550. https://doi.org/10.1111/j.1745-9125.2004.tb00528.x
Osgood, D. W., Wilson, J. K., O’Malley, P. M., Bachman, J. G., & Johnston, L. D. (1996). Routine activities andindividual deviant behavior. American Sociological Review, 61(4), 635–655. https://doi.org/10.2307/2096397
Pape, H., Rossow, I., & Brunborg, G. S. (2018). Adolescents drink less: How, who and why? A review of the recentresearch literature. Drug and Alcohol Review, 37, S98–S114. https://doi.org/10.1111/dar.12695
Payne, A. A., & Welch, K. (2013). The impact of schools and education on antisocial behavior over the lifecourse.In C. L. Gibson & M. D. Krohn (Eds.), Handbook of life-course criminology. Emerging trends and directions forfuture research (pp. 93–109). Springer.
Pauwels, L. J. R., Svensson, R., & Hirtenlehner, H. (2018). Testing situational action theory: A narrative review ofpublished studies between 2006 and 2015. European Journal of Criminology, 15(1), 32–55. https://doi.org/10.1177/1477370817732185
Pennay, A., Holmes, J., Törrönen, J., Livingston, M., Kraus, L., & Room, R. (2018). Researching the decline inadolescent drinking: The need for a global and generational approach. Drug and Alcohol Review, 37, S115–S119.https://doi.org/10.1111/dar.12664
Peppler, D. J. (2019). Schools and the pathway to crime. In D. P. Farrington, L. Kazemian, & A. R. Piquero (Eds.),The Oxford handbook of developmental and life-course criminology (pp. 433–454). Oxford University Press.
Pittau, M. G., Farcomeni, A., & Zelli, R. (2016). Has the attitude of US citizens towards redistribution changed overtime? Economic Modelling, 52, 714–724. https://doi.org/10.1016/j.econmod.2015.09.039
Public HealthAgency of Education. (2015).Medieanvänding och psykisk ohälsa bland tonåringar. Health Behaviourin School-Aged Children (HBSC), 2013/14 WHO study.
Public Health Agency of Education. (2018). Skolbarns hälsovanor i Sverige 2017/18.Raitasalo, K., Kraus, L., Bye, E. K., Karlsson, P., Tigerstedt, C., Törrönen, J., & Raninen, J. (2021). Similar countries,similar factors? Studying the decline of heavy episodic drinking in adolescents in Finland, Norway and Sweden.Addiction, 116(1), 62–71. https://doi.org/10.1111/add.15089
Raitasalo, K., Simonen, J., Tigerstedt, C., Mäkelä, P., & Tapanainen, H. (2018). What is going on in underage drink-ing? Reflections on Finnish European school survey project on alcohol and other drugs data 1999–2015. Drugand Alcohol Review, 37, 76–84. https://doi.org/10.1111/dar.12697
Raudenbush, S., & Bryk, A. (2002). Hierarchical linear models: Applications and data analysis methods (2nd ed.).Sage.
Rennó Santos,M., Testa, A., Porter, L. C., & Lynch, J. P. (2019). The contribution of age structure to the internationalhomicide decline. Plos One, 14, e0222996. https://doi.org/10.1371/journal.pone.0222996
Salmi, V. (2009). Self-reported juvenile delinquency in Finland 1995–2008 (English Summary. Research Report No.246). National Research Institute of Legal Policy.
Sampson, R. J., &Winter, A. S. (2018). Poisoned development: Assessing childhood lead exposure as a cause of crimein a birth cohort followed through adolescence. Criminology, 56(2), 269–301. https://doi.org/10.1111/1745-9125.12171
Schmidt-Catran, A. W., & Fairbrother, M. (2016). The random effects in multilevel models: Getting them wrongand getting them right. European Sociological Review, 32(1), 23–38. https://doi.org/10.1093/esr/jcv090
SVENSSON and OBERWITTLER 31
Schröder, M. (2013). Integrating varieties of capitalism and welfare state research. A unified typology of capitalisms.Palgrave Macmillan.
Sivertsson, F., Nilsson, A., & Bäckman, O. (2019). Participation and frequency in criminal convictions across 25successive birth cohorts: Collectivity, polarization, or convergence? Justice Quarterly, https://doi.org/10.1080/07418825.2019.1699941
Snijders, T. A. B., & Bosker, R. J. (2012).Multilevel analysis: An introduction to basic and advanced multilevel mod-eling (2nd ed.). Sage.
Stams, G. J., Brugman, D., Deković, M., Van Rosmalen, L., Van Der Laan, P., & Gibbs, J. C. (2006). The moraljudgment of juvenile delinquents: A meta-analysis. Journal of Abnormal Child Psychology, 34(5), 697–713.https://doi.org/10.1007/s10802-006-9056-5
Stata Corp. (2015). Stata multilevel mixed-effects reference manual, Release 14. Stata Press.Stattin, H., & Kerr, M. (2000). Parental monitoring: A reinterpretation. Child Development, 71(4), 1072–1085. https://doi.org/10.1111/1467-8624.00210
Stets, J. E., & Carter, M. J. (2012). A theory of the self for the sociology of morality. American Sociological Review,77(1), 120–140. https://doi.org/10.1177/0003122411433762
Susilo, Y. O., Liu, C., & Börjesson, M. (2019). The changes of activity-travel participation across gender, life-cycle,and generations in Sweden over 30 years. Transportation, 46, 793–818. https://doi.org/10.1007/s11116-018-9868-5
Sutherland, E. H. (1947). Principles of criminology. J.B. Lippincott.Svensson, R., & Oberwittler, D. (2010). It’s not the time they spend, it’s what they do: The interaction betweendelinquent friends and unstructured routine activity on delinquency. Findings from two countries. Journal ofCriminal Justice, 38(5), 1006–1014. https://doi.org/10.1016/j.jcrimjus.2010.07.002
Svensson, R., & Pauwels, L. (2010). Is a risky lifestyle always “risky”? The interaction between individual propensityand lifestyle risk in adolescent offending: A test in two urban samples. Crime & Delinquency, 56(4), 608–626.https://doi.org/10.1177/0011128708324290
Svensson, R., Pauwels, L., &Weerman, F. M. (2010). Does the effect of self-control on adolescent offending vary bythe level of morality? A test in three countries. Criminal Justice and Behavior, 37(6), 732–743. https://doi.org/10.1177/0093854810366542
Svensson, R., & Ring, J. (2007). Trends in self-reported youth crime and victimisation in Sweden, 1995–2005.Journal of Scandinavian Studies in Criminology and Crime Prevention, 8(2), 153–177. https://doi.org/10.1080/14043850701517805
Svensson, R.,Weerman, F.M., Pauwels, L. J., Bruinsma, G. J., & Bernasco,W. (2013).Moral emotions and offending:Do feelings of anticipated shame and guilt mediate the effect of socialization on offending?. European Journalof Criminology, 10(1), 22–39. https://doi.org/10.1177/1477370812454393
Swedish Media Council. (2019). Ungar & medier 2019.Tcherni-Buzzeo, M. (2019). The “Great American Crime Decline”: Possible explanations. InM. D. Krohn, Hendrix,N., Hall, G. P., & Lizotte, A. J. (Eds.), Handbook on crime and deviance (2nd ed.). Springer.
Thornberry, T. P. (1987). Toward an interactional theory of delinquency. Criminology, 25(4), 863–892. https://doi.org/10.1111/j.1745-9125.1987.tb00823.x
Thornberry, T. P., Lizotte, A. J., Krohn, M. D., Farnworth, M., & Jang, S. J. (1994). Delinquent peers, beliefs, anddelinquent behaviour: A longitudinal test of interactional theory. Criminology, 32(1), 17–40. https://doi.org/10.1111/j.1745-9125.1994.tb01146.x
Tonry, M. (2014). Why crime rates are falling throughout the Western World. Crime and Justice, 43, 1–63.Tseloni, A., Mailley, J., Farrell, G., & Tilley, N. (2010). Exploring the international decline in crime rates. EuropeanJournal of Criminology, 7(5), 375–394. https://doi.org/10.1177/1477370810367014
Twenge, J. M., Martin, G. N., & Campbell, W. K. (2018). Decreases in psychological well being among Americanadolescents after 2012 and links to screen time during the rise of smartphone technology. Emotion (Washington,D.C.), 18(6), 765–780. https://doi.org/10.1037/emo0000403
Twenge, J. M., Martin, G. N., & Spitzberg, B. H. (2019). Trends in U.S. adolescents’ media use, 1976–2016: The riseof digital media, the decline of TV, and the (near) demise of print. Psychology of Popular Media Culture, 8(4),329–345. https://doi.org/10.1037/ppm0000203
Twenge, J. M., & Park, H. (2019). The decline in adult activities among U.S. adolescents, 1976–2016. Child Develop-ment, 90(2), 638–654. https://doi.org/10.1111/cdev.12930
32 SVENSSON and OBERWITTLER
Twenge, J. M., & Spitzberg, B. H. (2020). Declines in non-digital social interaction among Americans, 2003–2017.Journal of Applied Social Psychology, 50(6), 363–367. https://doi.org/10.1111/jasp.12665
United Nations Office on Drugs and Crime. (2014). Global study on homicide 2013. Trends, contexts, data.van der Laan, A. M., Rokven, J., Weijters, G., & Beerthuizen, M. G. (2019). The drop in juvenile delinquency inthe Netherlands: Changes in exposure to risk and protection. Justice Quarterly, 1–21. https://doi.org/10.1080/07418825.2019.1656762
van Dijk, J., & Tseloni, A. (2012). Global overview: International trends in victimization and recorded crime. In J.van Dijk et al. (Eds.), The international crime drop (pp. 11–36). Palgrave McMillan.
van Dijk, J., Tseloni, A., & Farrell, G. (2012). The international crime drop. Palgrave McMillan.Vasiljevic, Z., Svensson, R., & Shannon, D. (2020). Immigration and crime: A time-trend analysis of self-reportedcrime in Sweden, 1999–2017. Nordic Journal of Criminology, 21(1), 1–10. https://doi.org/10.1080/2578983X.2019.1688955
Vilhelmson, B., Ellder, E., & Thulin, E. (2018). What did we do when the Internet wasn’t around? Variation infree-time activities among three young-adult cohorts from 1990/1991, 2000/2001, and 2010/2011. New Media &Society, 20(8), 2898–2916. https://doi.org/10.1177/1461444817737296
Vogel, M., Thompson, K. J., & Messner, S. F. (2020). The enduring influence of cohort characteristics on race-specific homicide rates. Social Forces, 99(1), 1–30. https://doi.org/10.1093/sf/soz127
von Hofer, H., Lappi-Seppälä, T., & Westfelt, L. (2012). Nordic Criminal Statistics 1950 2010: Summary of a Report.Stockholm University Press.
von Hofer, H., & Lappi-Seppälä, T. (2014). The development of crime in light of Finnish and Swedish crimi-nal justice statistics, circa 1750–2010. European Journal of Criminology, 11(2), 169–194. https://doi.org/10.1177/1477370813494976
Warr, M. (2002). Companions in crime: The social aspects of criminal conduct. Cambridge University Press.Weaver, V. M., Papachristos, A., & Zanger-Tishler, M. (2019). The great decoupling: The disconnection betweencriminal offending and experience of arrest across two cohorts. RSF: The Russell Sage Foundation Journal of theSocial Sciences, 5, 89.
Weerman, F. M. (2017). Social media en smartphones als verklaring voor de daling in jeugdcriminaliteit. JustitiëleVerkenningen, 43, 71–87.
Weerman, F. M., Bernasco, W., Bruinsma, G., & Pauwels, L. (2015). When is spending time with peers relatedto delinquency? The importance of where, what, and with whom. Crime & Delinquency, 61(10), 1368–1413.https://doi.org/10.1177/0011128713478129
Wentzel, K. R., & Looney, L. (2007). Socialization in school settings. In J. E. Grusec & P. D. Hastings (Eds.), Hand-book of socialization: Theory and research (pp. 382–403). Guilford Press.
Wikström, P.-O. H. (2007). In search of causes and explanations of crime. In R. King & E. Wincup (Eds.), Doingresearch on crime and justice (2nd ed., pp. 117–140). Oxford University Press.
Wikström, P.-O. H., Mann, R., & Hardie, B. (2018). Young people’s differential vulnerability to criminogenic expo-sure: Bridging the gap between people- and place-oriented approaches in the study of crime causation.EuropeanJournal of Criminology, 15(1), 10–31. https://doi.org/10.1177/1477370817732477
Wikström, P. O. H., Oberwittler, D., Treiber, K., & Hardie, B. (2012). Breaking rules: The social and situationaldynamics of young people’s urban crime. Oxford University Press.
Wikström, P.-O. H., & Sampson, R. J. (2003). Social mechanisms of community influences on crime and pathwaysin criminality. In B. B. Lahey, T. E.Moffitt, &A. Caspi (Eds.),Causes of conduct disorder and juvenile delinquency.Guilford Press.
Wilhelmsen, T. (2017). Time trends in school well-being among adolescents in Oslo. Can trends be explained by socialrelationships? (Master thesis). University of Oslo.
Yang, Y., Schulhofer-Wohl, S., Fu,W. J., & Land, K. C. (2008). The intrinsic estimator for age-period-cohort analysis:what it is and how to use it. American Journal of Sociology, 113(6), 1697–1736. https://doi.org/10.1086/587154
Zhang, Q., Loeber, R., & Stouthamer-Loeber, M. (1997). Developmental trends of delinquent attitudes and behav-iors: Replications and synthesis across domains, time, and samples. Journal of Quantitative Criminology, 13(2),181–215. https://doi.org/10.1007/BF02221307
Zimring, F. (2006). The great American crime decline. Oxford University Press.

SVENSSON and OBERWITTLER 33
AUTH OR BIOGRAPH IES
Robert Svensson is a professor in the Department of Criminology at Malmö University, Swe-den. He received his PhD in sociology from Stockholm University. His research interests spana range of topics in the field of crime and deviance, with a special focus on crime and devianceamong adolescents.
Dietrich Oberwittler is the leader of the independent research group “Space, Contexts, andCrime” in the Department of Criminology, Max Planck Institute for the Study of Crime, Secu-rity, and Law, and extracurricular professor of sociology at University of Freiburg. His researchinterests are in the fields of juvenile delinquency, social ecology of crime, urban sociology, andquantitative methodology.
SUPPORT ING INFORMATIONAdditional supporting information may be found online in the Supporting Information section atthe end of the article.
How to cite this article: Svensson R, Oberwittler D. Changing routine activities and thedecline of youth crime: A repeated cross-sectional analysis of self-reported delinquency inSweden, 1999−2017. Criminology. 2021;1–36. https://doi.org/10.1111/1745-9125.12273
APPENDIX
TABLE A1 Sample sizes and nonresponse rates by survey year
Year of study Participants Nonresponse rate (%)*1999 6,003 13.52001 8,203 13.12003 6,692 14.02005 7,449 13.72008 6,893 18.62011 6,490 14.52015 4,659 16.22017 4,268 31.4
*Within participating classes.
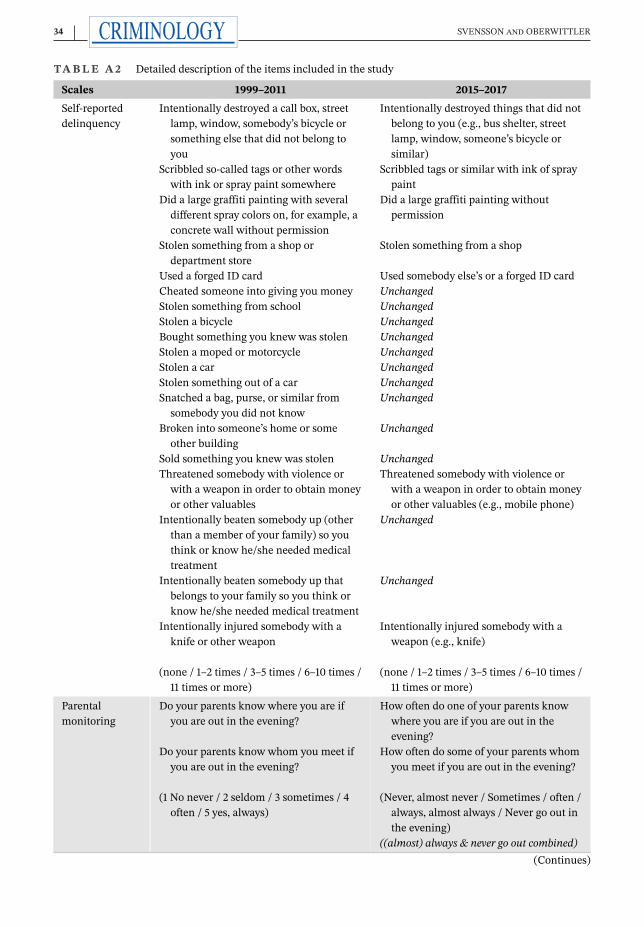
34 SVENSSON and OBERWITTLER
TABLE A2 Detailed description of the items included in the study
Scales 1999–2011 2015–2017Self-reporteddelinquency
Intentionally destroyed a call box, streetlamp, window, somebody’s bicycle orsomething else that did not belong toyou
Scribbled so-called tags or other wordswith ink or spray paint somewhere
Did a large graffiti painting with severaldifferent spray colors on, for example, aconcrete wall without permission
Stolen something from a shop ordepartment store
Used a forged ID cardCheated someone into giving you moneyStolen something from schoolStolen a bicycleBought something you knew was stolenStolen a moped or motorcycleStolen a carStolen something out of a carSnatched a bag, purse, or similar fromsomebody you did not know
Broken into someone’s home or someother building
Sold something you knew was stolenThreatened somebody with violence orwith a weapon in order to obtain moneyor other valuables
Intentionally beaten somebody up (otherthan a member of your family) so youthink or know he/she needed medicaltreatment
Intentionally beaten somebody up thatbelongs to your family so you think orknow he/she needed medical treatment
Intentionally injured somebody with aknife or other weapon
(none / 1–2 times / 3–5 times / 6–10 times /11 times or more)
Intentionally destroyed things that did notbelong to you (e.g., bus shelter, streetlamp, window, someone’s bicycle orsimilar)
Scribbled tags or similar with ink of spraypaint
Did a large graffiti painting withoutpermission
Stolen something from a shop
Used somebody else’s or a forged ID cardUnchangedUnchangedUnchangedUnchangedUnchangedUnchangedUnchangedUnchanged
Unchanged
UnchangedThreatened somebody with violence orwith a weapon in order to obtain moneyor other valuables (e.g., mobile phone)
Unchanged
Unchanged
Intentionally injured somebody with aweapon (e.g., knife)
(none / 1–2 times / 3–5 times / 6–10 times /11 times or more)
Parentalmonitoring
Do your parents know where you are ifyou are out in the evening?
Do your parents know whom you meet ifyou are out in the evening?
(1 No never / 2 seldom / 3 sometimes / 4often / 5 yes, always)
How often do one of your parents knowwhere you are if you are out in theevening?
How often do some of your parents whomyou meet if you are out in the evening?
(Never, almost never / Sometimes / often /always, almost always / Never go out inthe evening)
((almost) always & never go out combined)(Continues)
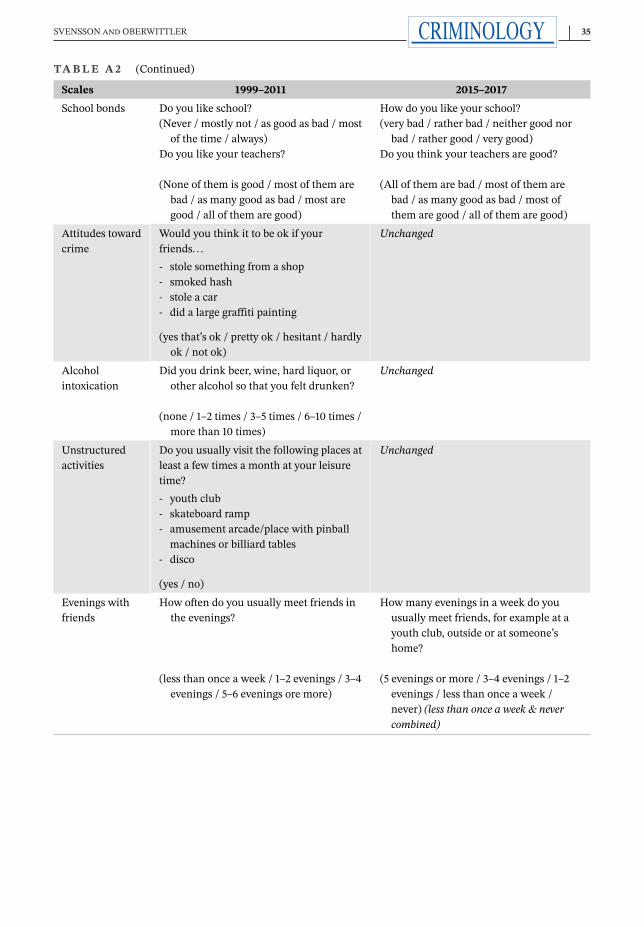
SVENSSON and OBERWITTLER 35
TABLE A2 (Continued)
Scales 1999–2011 2015–2017School bonds Do you like school?
(Never / mostly not / as good as bad / mostof the time / always)
Do you like your teachers?
(None of them is good / most of them arebad / as many good as bad / most aregood / all of them are good)
How do you like your school?(very bad / rather bad / neither good norbad / rather good / very good)
Do you think your teachers are good?
(All of them are bad / most of them arebad / as many good as bad / most ofthem are good / all of them are good)
Attitudes towardcrime
Would you think it to be ok if yourfriends. . .- stole something from a shop- smoked hash- stole a car- did a large graffiti painting
(yes that’s ok / pretty ok / hesitant / hardlyok / not ok)
Unchanged
Alcoholintoxication
Did you drink beer, wine, hard liquor, orother alcohol so that you felt drunken?
(none / 1–2 times / 3–5 times / 6–10 times /more than 10 times)
Unchanged
Unstructuredactivities
Do you usually visit the following places atleast a few times a month at your leisuretime?- youth club- skateboard ramp- amusement arcade/place with pinballmachines or billiard tables
- disco
(yes / no)
Unchanged
Evenings withfriends
How often do you usually meet friends inthe evenings?
(less than once a week / 1–2 evenings / 3–4evenings / 5–6 evenings ore more)
How many evenings in a week do youusually meet friends, for example at ayouth club, outside or at someone’shome?
(5 evenings or more / 3–4 evenings / 1–2evenings / less than once a week /never) (less than once a week & nevercombined)
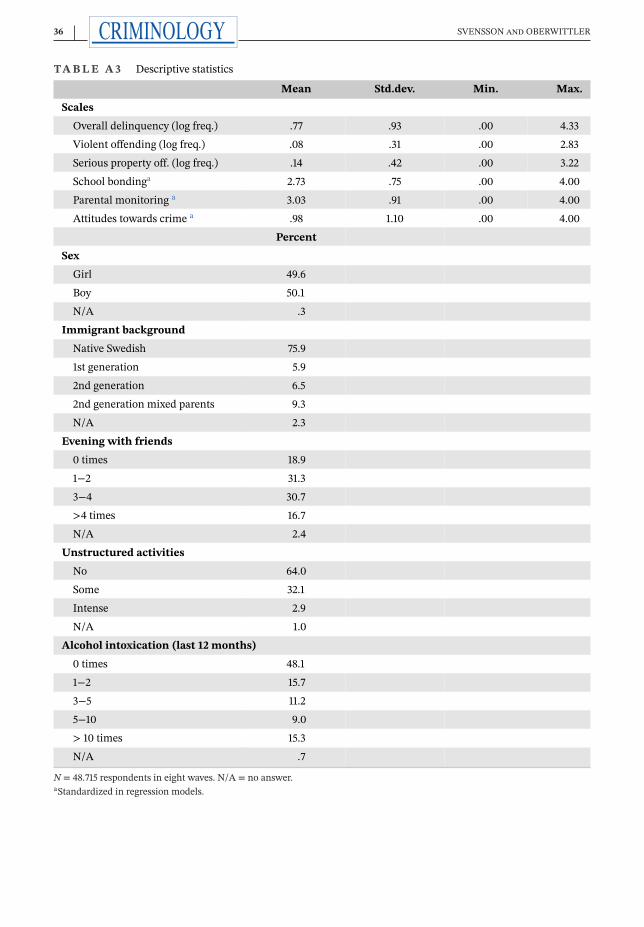
36 SVENSSON and OBERWITTLER
TABLE A3 Descriptive statistics
Mean Std.dev. Min. Max.ScalesOverall delinquency (log freq.) .77 .93 .00 4.33Violent offending (log freq.) .08 .31 .00 2.83Serious property off. (log freq.) .14 .42 .00 3.22School bondinga 2.73 .75 .00 4.00Parental monitoring a 3.03 .91 .00 4.00Attitudes towards crime a .98 1.10 .00 4.00
PercentSexGirl 49.6Boy 50.1N/A .3
Immigrant backgroundNative Swedish 75.91st generation 5.92nd generation 6.52nd generation mixed parents 9.3N/A 2.3
Evening with friends0 times 18.91−2 31.33−4 30.7>4 times 16.7N/A 2.4
Unstructured activitiesNo 64.0Some 32.1Intense 2.9N/A 1.0
Alcohol intoxication (last 12 months)0 times 48.11−2 15.73−5 11.25−10 9.0> 10 times 15.3N/A .7
N = 48.715 respondents in eight waves. N/A = no answer.aStandardized in regression models.