Changes in Foodways at the Parkin Site (3cs29), Arkansas, USA.
15
CHANGES IN FOODWAYS AT THE PARKIN SITE, ARKANSAS C. Margaret Scarry and Elizabeth J. Reitz Parkin is a Mississippian site on the banks of the St. Francis River in Arkansas. Analyses of food remains from two temporally distinct loci reveal unexpected and intriguing patterns. In Locus 1 (3CS256), occupied in the fourteenth century, terrestrial z^ertehrates comprise 52 percent of the noncommensat individuals. In Locus 4 (3CS29), occupied primarily during the fifteenth and sixteenth centuries, terrestrial vertebrates comprise only 40 percent of the noneommensal individuals. Over this same time, white-tailed deer individuals decline, as does the amount of biomass contributed by deer. Likeunse, maize cultivation decreases and harvesting of native grains increases. These changes in hunting, fishing, and farming coincide to some extent with social unrest associated with the de Soto entrada. We argue, hozvever, that they may best be explained as responses to prolonged drought. In the mid-sixteenth century A.D., native communi- ties received double blows when a prolonged drought followed hard on the heels of the first Spanish expeditions to the interior Southeast. Between 1539 and 1543, Hernando de Soto and his army moved from one town to the next, appropriating food stores, com- mandeering native bearers, and leaving disease and death in their wake. Tree-ring data indicate that the de Soto entradn coincided with the onset of "the most severe prolonged drought over much of North America for at least the last 500 years" (Stahle et al. 2000:121). Archaeologists and ethnohistorians often attribute the late-sixteenth-century demise of many native polities to disease and social disruption wrought by the Spanish intrusion (Dobyns 1983; Ramenofsky 1991; Smith 1987). Few researchers have considered the impact of a drought that exceeded the severity of the dust bowl of the twentieth century (but see Anderson, Stahle, and Cleveland 1995; Burnett and Murray 1993). In this article, we examine changes in subsistence practices at Parkin, a community whose residents coped with both Spaniards and drought. Parkin (3CS29 and 3CS256) is located on the banks of the St. Francis River in eastern Cross County, Arkansas. The site is thought to be the village of Casqui visited by de Soto and his entourage in 1541 (Mitchem 1996a; Morse 1993; Morse and Morse 1983). The accounts of the expedition attest that people in the region were stressed by the combined effects of warfare and drought, both of which had lasted for some time (Clayton, Knight, and Moore 1993:391- 394). Whether or not Parkin is Casqui, the villagers certainly had to adjust to the upheavals caused by the Spanish presence in the region and the impact of the drought on their crops and game. In the 1990s, the Arkansas Archeological Survey, under the direction of Jeffrey M. Mitchem, conducted excavations to improve our understanding of life at Parkin and to provide a basis for interpreting the site to people visiting Parkin Archeological State Park (Mitchem 1996b). Radiocarbon dates indicate the site was occupied as early as A.D. 1000-1250, but data from the earhest occupation have not been studied. Mitchem's excavations also demonstrate that the most intensive occupation of the site dates to the fourteenth through the seventeenth centuries and document the presence of sixteenth-century European artifacts at Parkin, if not the actual presence of de Soto's expedition. Foodways are a fundamental part of village life; thus Mitchem systematically collected plant and vertebrate remains to provide a basis for interpreting the sub- sistence practices of Parkin's residents. Our analyses of these biological remains were directed toward two basic questions. First, what was the nature of the subsistence economy at Parkin? Second, does the evidence suggest continuity or change in foodways during the centuries (ca. A.D. 1300-1600) prior to and including the 1541 de Soto entrada? Farlier work at Parkin and sites in the surrounding region assumed that precontact subsistence strategies conformed to a common Mississippian model. Accord- ing to this standard model, maize was the primary source of carbohydrates and the production of n:iaize and dependence upon this crop increased through time. The model further presumed that protein acquisition focused almost exclusively upon terrestrial game, particularly white-tailed deer. Over the past several decades, however, data accumulated from detailed analyses have demonstrated considerable spatial and temporal variability in precontact subsistence practices (Fritz 1993, 2000; Gremillion and Sobolik 1996; Jefferies et al. 1996; Johannessen 1993; Hutchinson et al. 1998; Reitz 1988; Scarry 1993, 2003; Yerkes 2005). While Mississippian economies may still be glossed as "maize-based," it is now evident that we must consider the specific mix and proportions of foods used in the context of local ecological settings and cultural events. The Parkin plant and vertebrate remains are no exception. Our analyses show that maize was indeed the primary crop, but its use decreased through time. Moreover, vertebrate use never focused exclusively on 107
Transcript of Changes in Foodways at the Parkin Site (3cs29), Arkansas, USA.
CHANGES IN FOODWAYS AT THE PARKIN SITE, ARKANSAS
C. Margaret Scarry and Elizabeth J. Reitz
Parkin is a Mississippian site on the banks of the St. FrancisRiver in Arkansas. Analyses of food remains from twotemporally distinct loci reveal unexpected and intriguingpatterns. In Locus 1 (3CS256), occupied in the fourteenthcentury, terrestrial z^ertehrates comprise 52 percent of thenoncommensat individuals. In Locus 4 (3CS29), occupiedprimarily during the fifteenth and sixteenth centuries,terrestrial vertebrates comprise only 40 percent of thenoneommensal individuals. Over this same time, white-taileddeer individuals decline, as does the amount of biomasscontributed by deer. Likeunse, maize cultivation decreases andharvesting of native grains increases. These changes inhunting, fishing, and farming coincide to some extent withsocial unrest associated with the de Soto entrada. We argue,hozvever, that they may best be explained as responses toprolonged drought.
In the mid-sixteenth century A.D., native communi-ties received double blows when a prolonged droughtfollowed hard on the heels of the first Spanishexpeditions to the interior Southeast. Between 1539and 1543, Hernando de Soto and his army moved fromone town to the next, appropriating food stores, com-mandeering native bearers, and leaving disease anddeath in their wake. Tree-ring data indicate that the deSoto entradn coincided with the onset of "the mostsevere prolonged drought over much of North Americafor at least the last 500 years" (Stahle et al. 2000:121).Archaeologists and ethnohistorians often attribute thelate-sixteenth-century demise of many native polities todisease and social disruption wrought by the Spanishintrusion (Dobyns 1983; Ramenofsky 1991; Smith 1987).Few researchers have considered the impact of a droughtthat exceeded the severity of the dust bowl of thetwentieth century (but see Anderson, Stahle, andCleveland 1995; Burnett and Murray 1993).
In this article, we examine changes in subsistencepractices at Parkin, a community whose residents copedwith both Spaniards and drought. Parkin (3CS29 and3CS256) is located on the banks of the St. Francis Riverin eastern Cross County, Arkansas. The site is thought tobe the village of Casqui visited by de Soto and hisentourage in 1541 (Mitchem 1996a; Morse 1993; Morseand Morse 1983). The accounts of the expedition attestthat people in the region were stressed by the combinedeffects of warfare and drought, both of which had lasted
for some time (Clayton, Knight, and Moore 1993:391-394). Whether or not Parkin is Casqui, the villagerscertainly had to adjust to the upheavals caused by theSpanish presence in the region and the impact of thedrought on their crops and game.
In the 1990s, the Arkansas Archeological Survey,under the direction of Jeffrey M. Mitchem, conductedexcavations to improve our understanding of life atParkin and to provide a basis for interpreting the siteto people visiting Parkin Archeological State Park(Mitchem 1996b). Radiocarbon dates indicate the sitewas occupied as early as A.D. 1000-1250, but data fromthe earhest occupation have not been studied. Mitchem'sexcavations also demonstrate that the most intensiveoccupation of the site dates to the fourteenth through theseventeenth centuries and document the presence ofsixteenth-century European artifacts at Parkin, if not theactual presence of de Soto's expedition.
Foodways are a fundamental part of village life; thusMitchem systematically collected plant and vertebrateremains to provide a basis for interpreting the sub-sistence practices of Parkin's residents. Our analyses ofthese biological remains were directed toward two basicquestions. First, what was the nature of the subsistenceeconomy at Parkin? Second, does the evidence suggestcontinuity or change in foodways during the centuries(ca. A.D. 1300-1600) prior to and including the 1541 deSoto entrada?
Farlier work at Parkin and sites in the surroundingregion assumed that precontact subsistence strategiesconformed to a common Mississippian model. Accord-ing to this standard model, maize was the primarysource of carbohydrates and the production of n:iaizeand dependence upon this crop increased through time.The model further presumed that protein acquisitionfocused almost exclusively upon terrestrial game,particularly white-tailed deer. Over the past severaldecades, however, data accumulated from detailedanalyses have demonstrated considerable spatial andtemporal variability in precontact subsistence practices(Fritz 1993, 2000; Gremillion and Sobolik 1996; Jefferieset al. 1996; Johannessen 1993; Hutchinson et al. 1998;Reitz 1988; Scarry 1993, 2003; Yerkes 2005). WhileMississippian economies may still be glossed as"maize-based," it is now evident that we must considerthe specific mix and proportions of foods used in thecontext of local ecological settings and cultural events.The Parkin plant and vertebrate remains are noexception. Our analyses show that maize was indeedthe primary crop, but its use decreased through time.Moreover, vertebrate use never focused exclusively on
107

SOUTHEASTERN ARCHAEOLOGY 24(2) WINTER 2005
deer, and the use of deer also declined between thethirteenth and sixteenth centuries.
In the following pages, we discuss plant and verte-brate data from two loci at Parkin. We begin with a briefreview of Mitchem's excavations at Parkin, focusing onthose contexts that yielded high-quality plant andvertebrate data. Next, we summarize the patterns foundin the plant and vertebrate data. After describing thesedata separately, we compare the combined trends inhunting, fishing, and crop production strategies andoffer an interpretation that may account for the changesin the use of both plants and vertebrates by the residentsof Parkin.
Our goal is to interpret the Parkin plant and verte-brate data focusing on variability between contexts. Weexamine social and environmental contexts of the four-teenth through sixteenth centuries to identify the factorsthat might account for differences. At the same time, weargue by example for the value of integrative sub-sistence analyses. After years of close collaboration onother projects (e.g., Reitz and Scarry 1985), we initiallyprepared our Parkin reports without much interaction.When we finally synthesized our results, we found thatthe combined plant and vertebrate data suggest aninterpretation that is far more provocative than isapparent when the two data sets are consideredseparately. Finally, our interpretations of the trends area reminder that a preference for social explanationsshould not preclude entertaining the possibility thatenvironmental factors played a significant role insubsistence and other cultural changes.
Excavations at Parkin and Study Methods
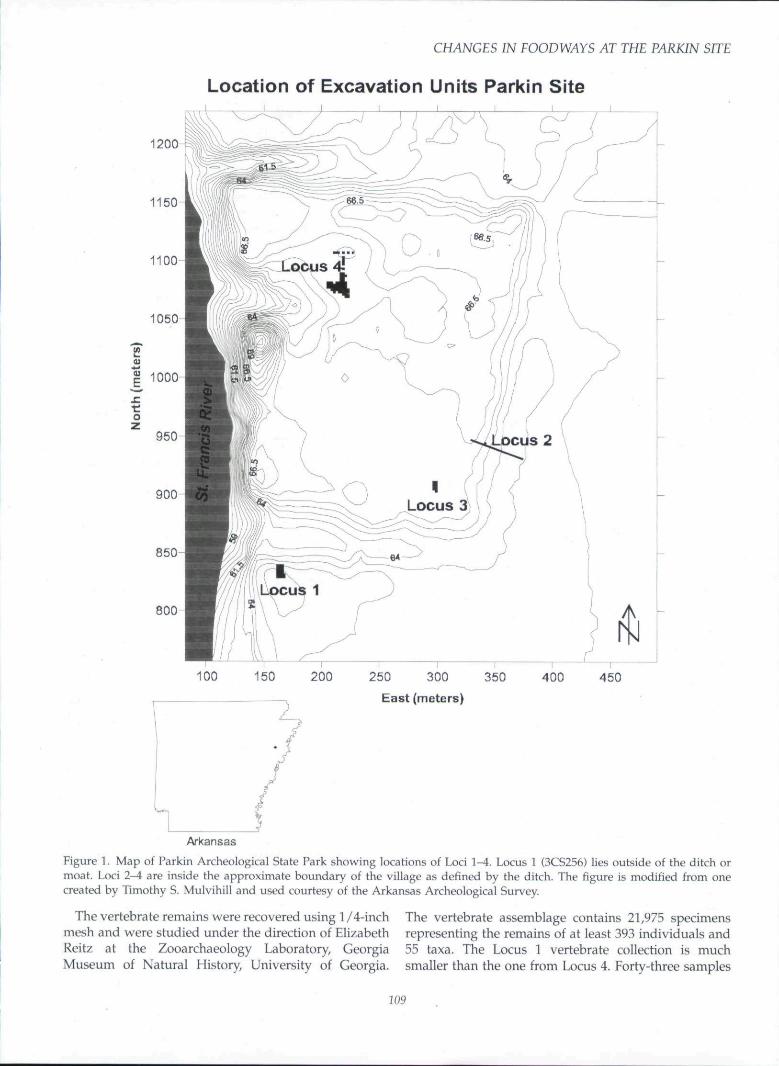
Parkin is a 6.9-ha mound and village complex thatwas surrounded by a moat or defensive ditch for at leastpart of its occupation (Figure 1). Radiocarbon dates ona house floor at the bottom of the deposits in oneexcavation (Locus 2) indicate the site was occupied asearly as A.D. 1000-1250, though the most intensiveoccupation is post-1300. Locus 1, which is outside themoat, bears the site number 3CS256, and Loci 2, 3, and4, all of which are inside the moat, are identified by thesite number 3CS29.
Between 1990 and 1999, Mitchem directed excavationsat the four loci. Locus 1 is a residential area on thesouthern edge of the main village, but outside of thedefensive ditch or moat. The excavations in Locus 1revealed a structure (Structure 4) and associatedfeatures, including hearths, pits, and smudge pits.Radiocarbon assays on materials from Locus 1 indicatethat the occupation in this area dates to the fourteenthcentury (Keck 1997:32-33; Mitchem 1996b). Locus 1most likely was part of a linear community strung outalong the river probably occupied before the ditch
around the village was constructed. Locus 2 is the des-ignation for an archaeological trench excavated acrossthe defensive ditch. Locus 3 is on the southeast edge ofthe main village within the area circumscribed by theditch. The excavations here uncovered burials, multiplestructures, and features associated with the structures.Radiocarbon assays on n:\aterials from Locus 3 place itsoccupation in the fourteenth and fifteenth centuries(Mitchem 1996b). The structures in this area appear tohave been part of a dense occupation with hundreds ofstructures. Locus 4 is in the northwest portion of themain village, where early maps indicate a mound(Phillips, Ford, and Griffin 1951:Figure 63). The ex-cavations in Locus 4 revealed numerous superimposedstructures, hearths, smudge pits, and refuse depositswhich date to the fifteenth and sixteenth centuries.
Our understanding of the occupational sequence inLocus 4 is frustrating because many of the studiedsamples appear to have been deposited before 1541, buta few may have been deposited immediately thereafter.Certainly, the presence of European artifacts indicatesthat at least a portion of Locus 4 was occupied after1541. If the site is indeed Casqui, it would be extremelyuseful to distinguish between samples clearly depositedbefore or after de Soto's visit. Unfortunately, we cannotdistinguish unequivocally between deposits from im-mediately before and after such an ephemeral eventbecause of the vagaries of site formation processes (Keck1997:33; Mitchem 1996b). Although a small vertebratesample has been studied from a definitively post-1541refuse pit in Locus 4 (Feature 137, NISP tnumber ofidentifiable specimens] — 635 vertebrate specimens;Keck 1997:203-205), similar data are not presentlyavailable for plant remains. We have no doubt thatadditional work at Parkin will make it possible to studydefinitively post-1541 plant and animal remains, but wecannot do so at the present time. The single exceptionoccurs in the deer measurement part of this study.Because it was possible to expand the deer measure-ments to include limited data from post-1541 Feature137, we chose to do so.
Investigating continuity and change in foodways is anintegral part of the research and interpretation plan atParkin. Plant and vertebrate remains were routinelycollected from general levels, features, and floors. In thisarticle, we focus on materials from Loci 1 and 4 becausethese yielded the largest combined plant and vertebrateassemblages. These collections allow us to compare sub-sistence patterns during the early part of the Parkin oc-cupational sequence with the later part of that sequence.It should be noted that Michelle Williams (1993)analyzed plant remains from Locus 3 for her master'sthesis. Williams's data are not included in our discus-sion, however, because of some methodological differ-ences in the way they were analyzed and because we donot have adequate vertebrate remains from Locus 3.
108.
CHANGES IN FOODWAYS AT THE PARKIN STFE
Location of Excavation Units Parkin Site
1200-
1150
800
100 150 200 250 300 350East (meters)
400 450
Arkansas
Figure 1. Map of Parkin Archeological State Park showing locations of Loci 1^ . Locus 1 {3CS256) lies outside of the ditch ormoat. Loci 2-4 are inside the approximate boundary of the village as defined by the ditch. The figure is modified from onecreated by Timothy S. Mulvihill and used courtesy of the Arkansas Archeological Survey.
The vertebrate remains were recovered using 1 /4-inchmesh ar\d were studied under the direction of ElizabethReitz at the Zooarchaeology Laboratory, GeorgiaMuseum of Natural History, University of Georgia.
The vertebrate assemblage contains 21,975 specimensrepresenting the remains of at least 393 individuals and55 taxa. The Locus 1 vertebrate collection is muchsmaller than the one from Locus 4. Forty-three samples
109

SOUTHEASTERN ARCHAEOLOGY 24(2) WINTER 2005
Table 1. Parkin Plant Remains: Locus 1.
Common Name
Crops
BeanBean ci.Maize cobMaize cupuleMaize kernel
Small grains and oil seedsCucurbit rindSquash/gourdChenopod
AmaranthCheno/amKnotweedMay grassSumpweedSunflowerSumpweed /sunflower
NutsHickoryi'ecanWalnutWalnut family meatAcomAcorn meat
Fruits
Blackberry / ra spberrvMajT^opPersimmonSumacUnidentified fruit
Miscellaneous
Wild beanBean familySpurge familyEuphorbiaSidaMallow familyPokeweedPurslaneSmart weed
VerbenaCompxjsite familyGrass familyUnidentifiable
TaxtmomicName
Phaseolus vulgans
Zea mays
CucurbitaceaeCucurhita sp.Cheiiopoiiium
herlatidieriAmaranthus sp.
Polygotium sp.Phalaris caraliniafjaIva aunuaHeliaiilhus annuu!^
Carya sp.Can/a illinoensisjuglans sp.JuglandaceaeQiierciis sp.
Rubus sp.Passiflora incamataDiospyriK virginiaiiaRhus sp.
Strophostyles sp.FabaceaeEuphorbiaceaeEuphorbia sp.Sida sp.MalvaceaePhiitoiacca americaiiaPartiilaca sp.Polygon um
pennslyvanicuinVerbena sp.Compos itaePoaceae
TotalCount
(N = 28)
1021
1,502993
12
26
44125
54331
805926
22
1806
21
80
4
1212311
1316
1I
30367
AverageCount
(N = 28)
0.350.070.04
53.6435.46
0.040,070.92
1.570.420.171.930.040.040.04
28.7533.07
0.070,046.420,21
0.070.042.860.170,04
0.040.070.040.07
o.n0.040.040.460,57
0.040.041.07—
AverageStandard
Count(N = 28)
1.140.670.28
21.2816-73
0.251,410.85
2.571.450.413,330-840,250.63
13.2215,980.320-433.800-92
0-490-673,990.880-44
0.550.490-700,350.411,330.261.050,71
0.481.121,33—
Smirce: Data from Scarry 1998.
Niife: "Average Count" is the average count of a taxon in the contexts analyzed;"Average Standard Count" is calculated as count/gram of plant weight in thecontexts analyzed.
w ere studied from Locus 1 and 160 were studied fromLocus 4.
Plant remains were recovered using a SMAP-typeflotation system (Watson 1976).' Analysis of the plantremains from Loci 1 and 4 was begun under thedirection of C. Margaret Scarry at the Program forCultural Resource Assessment laboratories at theUniversity of Kentucky. After Scarry relocated, furtheranalyses of the plant remains were conducted at theResearch Laboratories of Archaeology at the Universityof North Carolina, Chapel Hill. Remains from both thelight and heavy fractions were examined for all samples.Excluding wood, the assemblage contains over 34,000specimens representing at least 53 plant taxa. These are
derived from 72 flotation samples from 57 distinctcontexts. Thirty-five of the contexts are in Locus 1; 37 arein Locus 4. Because we are interested in changes infoodways, only samples from contexts (e.g., refuse-filledpits, ash lenses, and structure floors) containinggeneralized food debris are included in the quantitativedata presented here. Seven cob-filled pits from Locus 1and eight cob-filled pits from Locus 4 are not includedbecause of their presumed special functions—smudgepits. It is worth noting, however, that such pits con-stitute equal proportions of the contexts from both loci.
Trends in Plant Use at Parkin
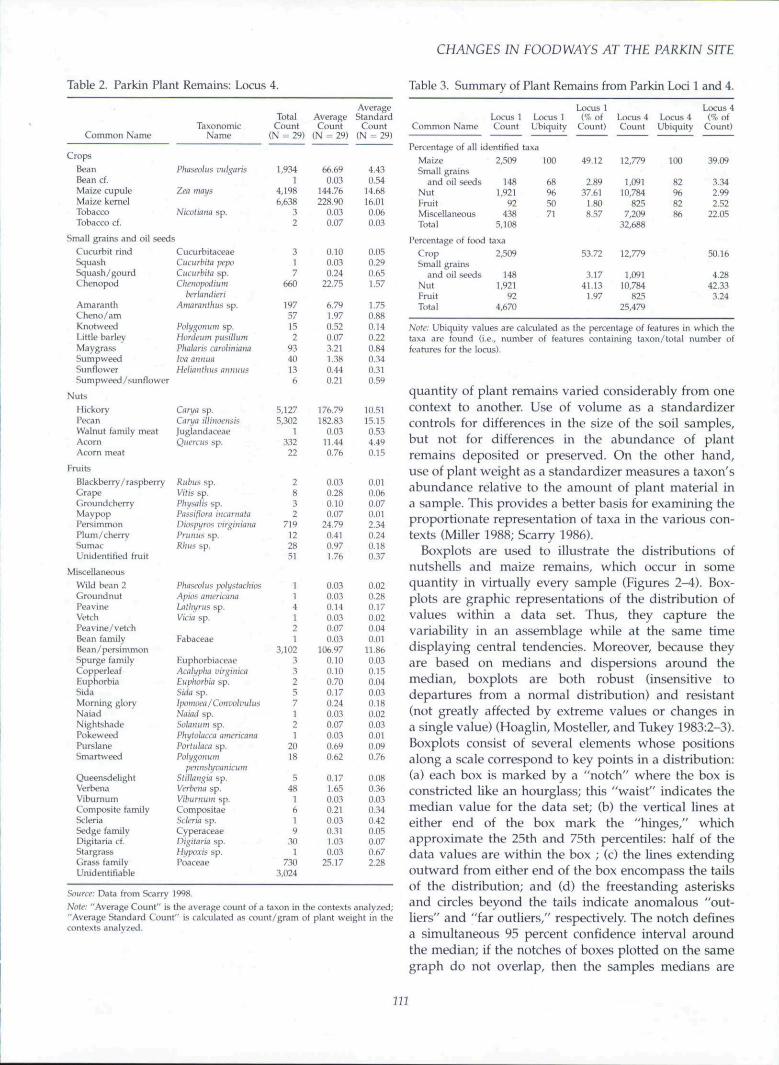
At first glance, the plant assemblage from Parkinconforms to what we would expect to find ata Mississippian site in the central Mississippi RiverValley (Tables 1-3; Scarry 1998). The people who lived atParkin were farmers who gathered a variety of v/ildplant foods to supplement their harvests. Maize isubiquitous and numerically dominates the samplesfrom both loci, indicating the degree to which maizewas a major crop and dietary staple. Modest quantitiesof chenopod, maygrass, erect knotweed, sunflower, andsumpweed are also present in the assemblage. Togetherthese small grains and oil seeds occur in 68 percent ofthe samples from Locus 1 and account for 3.2 percent ofthe food remains (excluding those from cob pits). InLocus 4, small grains and seeds occur in 82 percent ofthe samples and account for 4.3 percent of the foodremains (see Table 3). The presence of domesticated andwild forms of these small grains and oil seeds suggeststhat people both grew and gathered these plants. Nutscollected from nearby woodlands were probably themost important wild plant foods for the residents ofParkin. Hickory and pecan nutshells are abundant andubiquitous; the meats of these nuts provided peoplewith a rich source of oil and protein. The villagers alsogathered acorns, which are primarily a source ofcarbohydrates. Fruits collected from field and forestedges, such as persimmon, grape, and plum, addedvariety and vitamins to the diet.
While both loci are dominated by maize, closerinspection using quantitative comparisons reveal someintriguing differences. For these purposes, the raw datafrom each context are standardized by calculating eachtaxon's abundance relative to the weight of all plantremains in a sample. Thus, for each taxon in a samplethe following ratio is calculated:
standardized count = taxon count/gram weight ofplant remains in the sample
Plant weight is used as the standardizer rather thanthe more commonly used sample volume because the
110
CHANGES IN FOODWAYS AT THE PARKIN SFTE
Table 2. Parkin Plant Remains: Locus 4. Table 3, Summary of Plant Remains from Parkin Loci 1 and 4,
Common Name
AverageTotal Average Standard
Taxonomic Count Count CountName (N = 29) (N = 29) (N = 29)
Common NameLocus 1Count
Locus 1Locus 1 (% of
Ubiquity Count)
CropsBeanBean d.Maize cupuleMaize kernelTobaccoTobacco cf.
Small grains and oil seedsCucurbit rindSquashSquash/gourdChenopod
AmaranthCheno/amKnotweedLittle barleyMay grassSump weedSunflowerSumpweed/sunflower
NutsHickoryPecanWalnut family meatAcornAcorn meat
Fruits
Blackberry/raspberryGrapeGround cherryMaypopPersimmonPlum/cberrySumacUnidentified fruit
MiscellaneousWild bean 2GroundnutPeavineVetch
Pea vine/vetchBean familyBean/persimmonSpurge familyCopperleafEuphorbiaSidaMorning gloryNaiadNightshadePokeweedPurslaneSmartweed
Queensde lightVerbenaViburnumComposite familyScleriaSedge familyDigitaria cf,StargrassGrass familyL'nidentitiable
Phaseoluf vulgaris
Zea mays,
Nicotiana sp.
CucurbitaceaeCucurbila pepoCucurhita sp.Cheiwpodium
hfrlandieriAmaraiilhus sp,
Polygomim sp,Hordeiim pusillumPhalarif! carolinianaIva annuaHeliimlhus aiimiiis
Carya sp.Can/a illinoensisJuglandaceaeQiwrcus sp.
Rubus sp.Vitis sp,Physalis sp,Passiflora incarnataDiospyros virginiaiiaPrutius sp.Rims sp.
Phaseolus polyflachiusApios americaiiaLathyrus sp.Vkia sp.
Fabaceae
Euphorbia ceaeAcaiypha virginkaEuphorbia sp.Sida sp,ipomoea / ConvolvulusNaiad sp,Solamim sp,Phytoiacca americanaPortulaca sp.Palygim urn
peniislyvanicumStilliingia sp.Verbena sp.Viburnum sp,CompositaeScleria sp,CyperaceaeDigitaria sp,Hypoxis sp,Poaceae
1,9341
4,1986,638
32
317
660
19757152
9340136
5.1275,302
1332
22
32
719122851
114121
3,10233257121
2018
548
1619
301
7303,024
66,690-03
144.76228,90
0.030.07
0.100.030,24
22,75
6,791.970.520.073.211.380.440,21
176.79182.83
0.0311,440,76
0.030,28O.UI0.07
24,790.410.971.76
0.030.030,140.030.070.03
106.970.100.100.700.170.240.030,070.030.690.62
0.171.650.030.210,030,311,030,03
25.17
4,430,54
14,6816,010,060,03
0,050,290,651,57
1,750,880,140,220,840,340.310,59
10.5115,150,534,490,15
0,010,060,070,012,340,240,180,37
0,020,280,170,020,040,01
11,860,030,150,040,030,180,020,030.010,090,76
0,080,360,030,340,420,050.070,672,28
Source: Data from Scarry 1998,
Note: "Average Count" is the average count of a taxon in the contexts analyzed;"Average Standard Count" is calculated as count/gram of plant weight in thecontexts analyzed.
Locus 4Locus 4 Locus 4 (% ofCount Ubiquity Count)
Percentage of all identified laxa
MaizeSmall grains
and oil seedsNutFruitMiscellaneousTotal
2,509
1481,921
92438
5,108
100
965071
49.12 12,779
2.8937.61
LSO8,57
1,09110,784
8257,209
32,688
100
82968286
Percentage of food taxa
CropSmall grains
and oil seedsNutFruitTotal
2,509
1481,921
924,670
53.72 12,779
3,1741,13
1.97
!,09110,784
82525,479
39.09
3.342.992.52
22,05
50,16
4,2842.33
3-24
Note: Ubiquity values are calculated as the percentage of features in which thetaxa are found (i,e,, number of features containing taxon/total number offeatures for the locus).
quantity of plant remains varied considerably from onecontext to another. Use of volume as a standardizercontrols for differences in the size of the soil samples,but not for differences in the abundance of plantremains deposited or preserved. On the other hand,use of plant weight as a standardizer measures a taxon'sabundance relative to the amount of plant material ina sample. This provides a better basis for examining theproportionate representation of taxa in the various con-texts (Miller 1988; Scarry 1986).
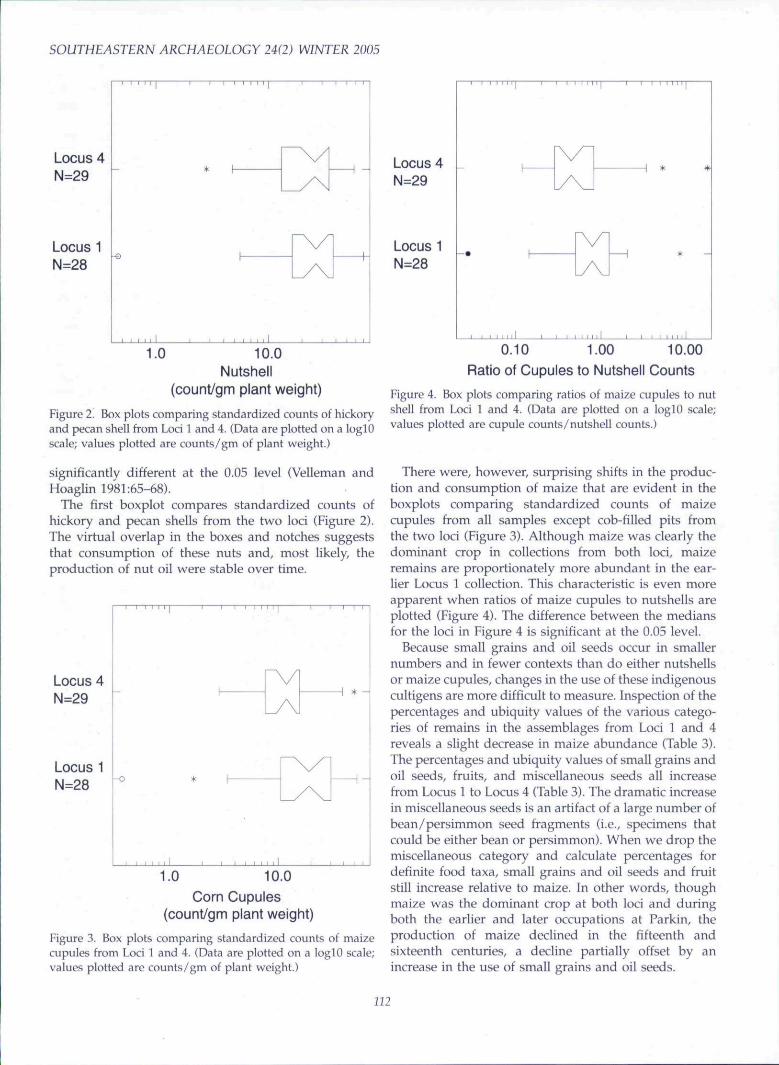
Boxplots are used to illustrate the distributions ofnutshells and maize remains, which occur in somequantity in virtually every sample (Figures 2-4). Box-plots are graphic representations of the distribution ofvalues within a data set. Thus, they capture thevariability in an assemblage while at the same timedisplaying central tendencies. Moreover, because theyare based on medians and dispersions around themedian, boxplots are both robust (insensitive todepartures from a normal distribution) and resistant(not greatly affected by extreme values or changes ina single value) {Hoaglin, Mosteller, and Tukey 1983:2-3).Boxplots consist of several elements whose positionsalong a scale correspond to key points in a distribution:(a) each box is marked by a "notch" where the box isconstricted like an hourglass; this "waist" indicates themedian value for the data set; (b) the vertical lines ateither end of the box mark the "hinges," whichapproximate the 25th and 75th percentiles: half of thedata values are within the box ; (c) the lines extendingoutward from either end of the box encompass the tailsof the distribution; and (d) the freestanding asterisksand circles beyond the tails indicate anomalous "out-liers" and "far outliers," respectively. The notch definesa simultaneous 95 percent confidence interval aroundthe median; if the notches of boxes plotted on the samegraph do not overlap, then the samples medians are
111
SOUTHEASTERN ARCHAEOLOGY 24(2) WINTER 2005
Locus 4N=29
Locus 1N=28
10.0Nutshell
(count/gm plant weight)
Figure 2. Box plots comparing standardized counts of hickoryand pecan shell from Loci 1 and 4. {Data are plotted on a loglOscale; values plotted are counts/gm of plant weight.)
significantly different at the 0.05 level (Velleman andHoaglin 1981:65-68).
The first boxplot compares standardized counts ofhickory and pecan shells from the two loci (Figure 2).The virtual overlap in the boxes and notches suggeststhat consumption of these nuts and, most likely, theproduction of nut oil were stable over time.
Locus 4
Locus 1N=28
1.0 10.0Corn Cupules
(count/gm plant weight)
Figure 3. Box plots comparing standardized counts of maizecupules from Loci 1 and 4. (Data are plotted on a loglO scale;values plotted are counts/gm of plant weight.)
Locus 4N=29
Locus 1N=28
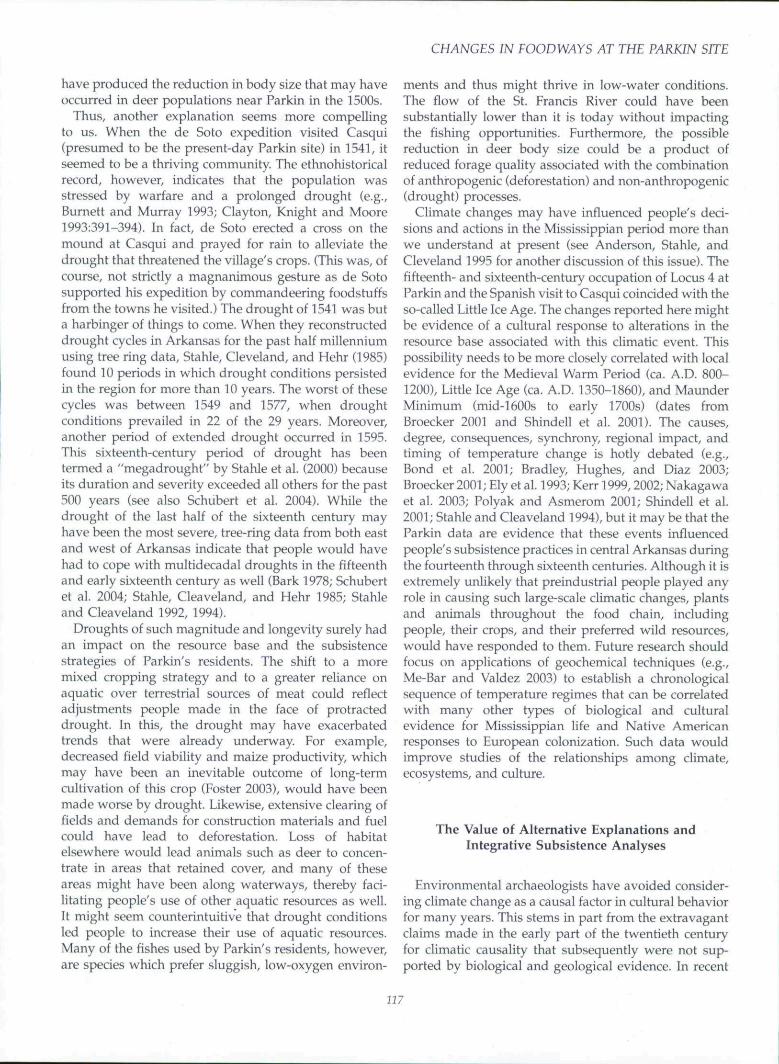
0.10 1.00 10.00Ratio of Cupules to Nutshell Counts
Figure 4. Box plots comparing ratios of maize cupules to nutshell from Loci 1 and 4. {Data are plotted on a loglO scale;values plotted are cupule counts/nutshell counts.)
There were, however, surprising shifts in the produc-tion and consumption of maize that are evident in theboxplots coniparing standardized counts of maizecupules from all samples except cob-filled pits fromthe two loci (Figure 3). Although maize was clearly thedominant crop in collections from both loci, maizeremains are proportionately more abundant in the ear-lier Locus 1 collection. This characteristic is even moreapparent when ratios of maize cupules to nutshells areplotted (Figure 4). The difference between the mediansfor the loci in Figure 4 is significant at the 0.05 level.
Because small grains and oil seeds occur in smallernumbers and in fewer contexts than do either nutshellsor maize cupules, changes in the use of these indigenouscultigens are more difficult to measure. Inspection of thepercentages and ubiquity values of the various catego-ries of remains in the assemblages from Loci 1 and 4reveals a slight decrease in maize abundance (Table 3).The percentages and ubiquity values of small grains andoil seeds, fruits, and miscellaneous seeds all increasefrom Locus 1 to Locus 4 (Table 3). The dramatic increasein miscellaneous seeds is an artifact of a large number ofbean/persimmon seed fragments (i.e., specimens thatcould be either bean or persimmon). When we drop themiscellaneous category and calculate percentages fordefinite food taxa, small grains and oil seeds and fruitstill increase relative to maize. In other words, thoughmaize was the dominant crop at both loci and duringboth the earlier and later occupations at Parkin, theproduction of maize declined in the fifteenth andsixteenth centuries, a decline partially offset by anincrease in the use of small grains and oil seeds.
112

CHANGES IN FOODWAYS AT THE PARKIN SFTE
Table 4, Parkin Vertebrate Remains: Locus 1,
Common Name
Unidentified mammalOpossumRabbitSwamp rabbitUnidentified rodentSquirrelChipmunkNew World miceGolden mouseMuskratMouseHispid cotton ratDog familyDog/coyoteCray fox
RaccoonMinkBobcatEven-toed ungulateWhite-tailed deerUnidentified birdDuck familyMallardCanada gooseSwanTurkeyOwl familyUnidentified turtleMud/Musk turtle
familyBox/water turtle
familyMap turtleRiver cooterSoftshell turtleUID frog/toadUID fishGarBowfinHerring familySucker fa mil vSpotted suckerBullhead catfish
familyBluegillLargemouth bassFreshwater drumUID vertebrateTotal
Taxonomic Name
Didelphis virginiaiiaSylvilagus spp.Syb'itagus aquaticus
Sciurus spp.Tamias striatusCricetinaeOchrotoniys nuttaliiOndatra zihetbicusPeromvscus spp.Sigmodon hispidtisCanidaeCanis spp.Urocyon
cinereoargenteusProcyon lotorMuslela visnnFelis rufiisUID ArtiodactylaOdocoileus virginianus
AnatidaeAnas ptatyrhynchosBrant a canadensisCygnus sp.Meleagris gallopavoStrigldae
Kinostemidae
Emydidae
Craptemys sp.Pseudemys sp.Apalone sp.
Lepisasteiis spp.Ainia calvaClupeidaeCatOhtomidaeMiniflrcnia melanopslctaluridae
Lepomis macrochiyuf:Microplenis satmoidesAplodinotus griinniens
NISP
7123
352
1916111182132
25321
2223610331
201
4829
23
1114
535368
446422
14
274
—2,283
MNI(no,)
_
13
(1)—
21
—1131
—t1
321
—5
——
1I14I
—1
—
1112
—212
—12
111
—51
MNI{%)
_
2,05,9——3.92.0—2,02,05,92,0—2,02.0
5,93,92,0—9,8
—2,02,02,07,82,0—2,0
—
2.02,02,03,9—3.92,03,9—2,03,9
2,02,02,0—
Weight(gm)
1162-803,13
18,224.510.666,050-020.050.020,990,130.010,92
18.341-72
24,641,280,490,69
2121,6721,72
9,760,82
14,991,35
49,810.45
14,426,18
28,55
3.540.94
12.570.05
39.1465,25
3,460,380,86
o.n6,55
0.031-381.46
354.10
4004,21
Bioniass(kg)
15,100.070,360,100.020.130-0010.0020-0010,030.0040.00040-020.360,04
0,470,030.010.02
25,940.340.160,020.240.030.720.0 i0,190.11
0.30
0,070.030-17
—0.581.260.080.010.030,010.12
0,0010,020.05
—
47.2594
Source: Modified from Keck 1997:184-187.
Notf. MNI is estimated based on symmclry and age. In estimating MNI, allvertebrate remains from the Locus 1 collection were aggregated into a singleanalytical unit. In most cases, MNI is esfimatcd for the lowest taxonomic levelpossible in each taxonomic category. Occasionally a higher MNI estimate w isfound at a higher taxonomic level For example, more individuals might beestimated if all materials identified as Sifhilagus spp, were examined togetherrather than considering only those specimens identified as Si/hilagus aquahcus.When a higher taxonomic level is used, the estimate of MNI for lower taxonomiclevel is included here in parentheses, but is not included in the total for the locusor in the subsequent calculations- Biomass is estimated using allonietricformulae. See Johnson and Reitz (1993). Keck (1997), and Reitz and Wing(1999) for a more extensive description of Locus 1 and of these methods.
Trends in Vertebrate Use at Parkin
A decrease in the use of a dominant resource is alsofound in the vertebrate remains (Tables 4-6; Johnson andReitz 1993; Keck 1997; Reitz, Lynch, and Weinand 1997;Weinand and Reitz 1994). Parkin residents used a widevariety of wild vertebrates in addition lo deer; in fact,deer are only one of 55 taxa for which the minimum
number of individuals (MNI) is estimated (Reitz andWing 1999:194-99). Deer contribute only 8 percent of theindividuals in the Parkin assemblage reported here,though venison contributes 73 percent of the meatestimated allometrically (Table 6; see Reitz and Wing1999:221-231 for a discussion of allometry). In contrast,other mammals, birds, and turtles contribute 92 percentof the individuals and 27 percent of the biomass. Overhalf of the individuals are vertebrates associated with theriver or wet bottomlands; a third of the individuals arefishes. This indicates the degree to which the residents ofParkin targeted vertebrate resources in and near theSt. Francis River for protein and fat-soluble vitamins.
As with the plant remains, differences in vertebrateuse are reflected in the fourteenth-century collectionfrom Locus 1 and the fifteenth- and sixteenth-centurycollection from Locus 4 (Tables 6 and 7). The differencescan be summarized as a decrease in the use of terrestrialvertebrates and an increase in the use of aquaticvertebrates within a broadening resource base. An indi-cation of the broader resource base is the increase inrichness from 32 taxa in the Locus 1 species list to48 taxa in the Locus 4 species list.
To highlight this shift, commensal individuals areremoved from the data used in Table 7. In the collectionfrom Locus 1, the fourteenth-century occupation, abouthalf of the subsistence effort was focused on deer andother terrestrial mammals (52 percent of the individuals)and about half was focused on the St. Francis River andadjacent wetlands (48 percent). During the later occu-pation at Locus 4, people focused more of their subsis-tence efforts on aquatic habitats (60 percent of the MNI).Deer MNI declines from 12 percent of the noncom-mensal individuals in Locus 1 to 9 percent in Locus 4,Biomass estimated for deer declines from 85 percent ofthe noncommensal biomass in Locus 1 to 70 percent inLocus 4. The increase in aquatic vertebrates is almostentirely due to an increase in the consumption of turtlesand fish.
Diversity and equitability indices also indicate thatcompared to the residents of Locus 1, the residents ofLocus 4 obtained resources from a larger variety ofresources. MNI diversity measured using the Shannon-Weaver Diversity Index (Shannon and Weaver 1949;Reitz and Wing 1999:233-235) is very similar in the twocollections (Locus 1 H' = 3.3083 and Locus 4 H' =3.3751); but the biomass diversity of Locus 1 (H' =0.7709) is half that of Locus 4 (H' = 1.3906), probablybecause of the reduction in venison and an increase inalternative sources of meat in Locus 4. This samerelationship is observed in equitability, measured usingthe Sheldon formula (Sheldon 1969; Reitz and Wing1999:233-235). MNI equitability values for the two lociare very similar (Locus 1 V = 0,9546 and Locus 4 V =0.8718); but the biomass equitability of Locus 4 (V —0.3612) is higher than that of Locus 1 (V = 0.2245), once
113

SOUTHEASTERN ARCHAEOLOGY 24(2) WINTER 2005
Table 5. Parkin Vertebrate Remains: Pre-1541 Locus 4.
MNl MNI Weight BiomassCommon Name Taxonomic Name NISP (no.) (%) (kg) (%)
Table 5. Parkin Vertebrate Remains: Pre-1541 Locus 4.(continued).
UID MammalOpossumPossible hareRabhitPossible
swamp rabbitSwamp rabbitPossible
cottontail rabbitCottontail rabbitUID rodentSquirrel familySquirre!Eastern gray
squirrelPossible fox
squirrelFox squirrelChipmunkBeaverNew World miceGolden mouseMuskratRice ratPossible mouseMouseHispid cotton ratUID carnivoreDog familyDog/coyoteDogGray foxBlack bearRaccoonStriped skunkMinkPossible cat familyBobcatEven-toed ungulateWhite-tailed deer
Ruminant familyBisonUID birdHeron familyGreat blue heronDuck familyWood duckCanada gooseRed-tailed hawkTurkeyCranePassenger pigeonBarred owlPerching birdsCrowCommon crow
UID turtleSnapping
turtle familySnapping turtleMud/Musk
turtle fam.ilyMud turtle
Possible muskturtle
Musk turtleBox/water
turtle familyChicken turtleMap turtleBarbour's map
turtleMap turtleFalse map turtleRiver coo ter
Didelphis virginianacf. Lepus spp.Syh'ila^us spp.Sylvikgus
cf, aijualicusSi/ii'itagua aqiialicusSyhniagus
cf. floridanusSylvilagus fioridanus
SciuridaeSciurus spp.Sciurus carolinensis
Sciurus cf. niger
Sciurus nigerTamias striatusCastor canadensisCricetinaeOchrotomys mtltalliOndatra zibcthicusOyzomys paiustriscf. Peromyscus sp.Peromyscus spp.Signiodon hispidus
CanidaeCanis spp.Canis familiarisUracyon cinereoargenicusUrsus americanusProcyon hforMephitis mephitisMusteia visoncf, Felidaef('/(> rufusUID ArtiodactylaOdocoileus
virginianusBovidaeBos bison
ArdeidaeArdea herodiasAnatidaeAix sponsaBrattta canadensisButeo jamaicensisMeleagris gallopavoGrus sp.Ecfiif/ste migraloriiisSlrix variaPassed formesConnis sp.Conms
brachyrhynchos
Chelydridae
Chelydra serpent inaKinostemidae
Kinosternonsubriibrum
ci. Stcrnotherus sp.
Sternofherus sp.Emydidae
Deirochclyfi retkulariaGraptemys spp.Graptemys barbouri
Graptemys geographicaG. pS'eudogeographicaPscudemy^ spp.
5,736 —9 42 1
269 1724 —
.-i (3)3 —
1 (1)42 —
1 —139 17
6 (5)
4 (3)1 1
23 522 —5 3
19 669 23
1 —9 5
16 53 —7 —
t9 519 (3)t 11 1
189 201 1
n 51 —2 1
68 —1,202 27
1 —5 2
554 —2 21 (I)
79 151 U)7 (5)1 1
103 101 1
— 7,755.660 92-871)1.17 16.060 0.3430.29 0.670 0,0204.97 146.710 2-600— 20.410 0-400
— 3.060 0.080— 6.210 0,140
— 0.450— 2.190— 0.200
4.97 52.070— 1.490
0.0100,0600-0101,0200,040
2 — — 0.450 0.010
1 —2 2
707 —51 5
15 (2)
145 6
15 (3)
1 —
1 (1)148 —
1 13 62 (1)
8 (2)2 (2)
14 S
0.291.46
0.881.756.73
1.461.46
1.46
1.6400.080
90.6802.0600.310
14.2006,4900.1100.3902.0401,230
11.02031.790
— 61.4400-29 0.5000.29 2-2605.85 258.4900.29 0.5901-46 4-940— 0,570
0.29 0-940— 227-080
7.89 8,426-620
0,58
0.58
4,39
0.292.920.290.290.290.29
0.58
— 256.4201.46 96.190
0,0400.0031,6600,0500,0010,3200,1500.11040.1)120,0500.0300.2400.6601.1800.0100,0504.3300.0200.1200.0200.0203.470
99,360
0.990291-720282.490
3,0400.420
56-7700-360
12-1500.390
225.8300.3500.410o.no0.9400.7200,460
0.0304.3503.8000.0600.0100.8800,0100.2100.0103.1200.0100,0100.0030.0200.0200.013
1.75
0.291,75
1,46
35.59041.050
7.590
0.890
0.580202.450
3.9903.9702.890
25.8004,590
44.600
l,8in0-970
0-3500.520
0,150
0,030
0.0201.560
0,0800,1000,060
0.2800,0900.520
Common NameMNI MNI Weight Biomass
Taxonomic Name NISP (no.) (%) (kg) (kg)
Eastern boxturtle
Yellow-belliedturtle
Softshell turtleUID snakeNon poisonous
snakesUID frog/toadBullfrogEastern
spadefoot toadToadUID fishCarLongnose garAlligator garBowfinCarps and
suckersSucker familyKiver carpsuckerBuffalo suckerSmallmouth
buffaloBig mouth buffaloBlack buffaloSpotted suckerBullhead
catfish familyBullhead catfishBullhead catfish
CatfishPossible
channel catfishFlathead catfishPerciform fishesStripped bassSun fish familyPossible sun fishSunfishBassLargemouth bassWhite crappieFreshwater drumUID vertebrateTotal
Tcrrapene Carolina
Trachemys script a
Apahnc spp.
Colubridae
Rana catesbeianaScapbiopus holbrookii
Bufo spp-
Lepisosleus spp.Ijrpisosteus osseusLepisosteus spatulaAmia calvaCyprini formes
CatostomidaeCarpiodes carpioIctiobus spp,ictiobus bubal us
Ictiobus cyprinellusIctiobus nigerMinytrema tnelarwpsI eta lurid ae
Amenirus spp.Ainciiirus ci.
platycepbalusJctalurus sp.Jctalurus cf. puyictatus
Pylodictis olivarisPerci formesMorone saxalilisCentra rchidaecf. Lepomis spp.Lepomis spp,Micropterus spp.Micropterus salmoidesPornoxis annularisAplodiiiotus grunniens
21 4 1,17 24.720 0.310
8 6 1.75 31.920 0.410
120 6 1.75 100.870 0.9703 3 0.88 0.500 0.0036 (2) — 0.930 0.007
3 5 1,46 0.230 —1 (1) — 0.400 —1 (1) — 0.-300
25,359 —2,780 9
1 (1)1 (1)
940 1812 —
112 201 (1)
(2) — 0.700 —— — 768.100 7-900
2.63 710.540 11.470— 4-840 0-130— 0.370 0.010
5,26 203.410 2.420— 6.050 0.130
5-85
3 (2) —
35.040 0.5800.823 0.0309.060 0.1903.010 0-080
2 (1) — 1.150 0-0302 (1) — 1.090 0-0301 (1) — 0.070 0.004
313 30 8.77 154.650 2.520
3 (1)1 —
2 (1) -
0.7900-850
0.0200,020
3.060 0,0600.880 0.020
12 (3)1 —2 2
17 —2 —7 32 —8 41 1
125 24
19,692 342
— 20.290 0.360— 0.220 0.010
0.58 0.430 0.010— 2.350 0.050— 0.100 0.003
0.88 0.420 0.012— 0,730 0.010
1.17 2.930 0.0540.29 0.170 0.0047.02 87.170 1.360— 5,071,230 —
26,005.243 257.716
Source: Modified from Johnson and Reitz 1993, Reitz, Lynch, and Weinand 1997,and Weinand and Reitz 1994,
Note: Excludes data from post-1541 contexts in Locus 4 (Feature 137; Keck1997:203-205), In estimating MNI, all vertebrate materials from Locus 4 wereaggregated into a single analytical unit. See Table 5 for methodological notes andJohnston and Reitz 1993, Reitz, Lynch, and Weinand 1997, Weinand and Reitz1994, and Reitz and Wing 1999 for a more extensive description of Locus 4 andof these methods.
again probably because people obtained meat froma larger number of sources. It cannot be said there isa major change in the species of vertebrates that peopleused between the earlier and later occupations, butthere was a change in emphasis within the overall hunt-ing and fishing strategy.
Deer, turtles, and fishes were ubiquitous in samplesfrom Loci 1 and 4. Deer are present in 58 percent (n —25) of the 43 samples from Locus 1, turtles in 33 percent(n = 14), and fishes in 56 percent (n = 24). All three ofthese taxa are present in 28 percent (n = 12) of the
114

CHANGES IN FOODWAYS AT THE PARKIN SITE
Table 6. Summary of Vertebrate Remains frotn Parkin Loci 1and 4.
Table 8. Average Measurement (NISP; Range) for SelectedDeer Elements (in mm).
Percentage of MNI
DeerOther mammalsWild birdsTurtlesFishesCommensal taxa
Percentage of biomassDeerOther mammalsWild birdsTurtlesFishesCommensal taxa
Total MNITotal biomass (kg)
Locus J
9.831-415.77.8
21,613.7
85.34.93.41.35.10.02
5130.40
Locus 4
7.925.4
9.911.432.512.9
70.2
n.o2.92,7
13.00.2
342141.34
Loci Combined
8.126.2in.710.931.013.0
72.99.93.02.5
11.60.1
393171.94
Note: Golden mouse iOchrotoinijs niittnlli). rice rat (Oryzomi/s paluslrh), mouse(Pcromi/scus spp.), Hispid cotton r.it ISigmiHion hispidus), UID snake, and UIDfrogs/toads are interpreted as commensal animals. Commensal taxa may havebeen consumed but are also commonly associated with human-built environ-ments and stored foods.
samples; all three are absent from 30 percent (n = 13) ofthe samples. Thus, it appears that the vertebratematerials included in the Locus 1 species list are notbiased toward unique activities or deposits but insteadrepresent relatively common behavior. Deer are presentin 76 percent (n = 122) of the 160 samples from Locus 4,turtles in 75 percent (n = 120), and fishes in 95 percent(n — 152). All three of these taxa are present in 66percent (n = 106) of the samples; all three are absentfrom only 3 percent (n ^ 5) of the samples. Again, itwould appear that the subsistence effort reflected in theLocus 4 species list was also widespread throughoutthe area represented by these materials and not just theproduct of unique events. The higher ubiquity of thesethree taxa in Locus 4 compared to Locus 1 furthersupports the interpretation that the subsistence effortwas more diverse and more equitable in Locus 4.
Limited data for the age and sex of deer are availablefor both loci. Age is estimated using epiphyseal fusion(no mandibular sequences could be aged), and sex isinterpreted from the presence or absence of a pedicle on
Table 7. Summary of Non-Commensal Aquatic and TerrestrialVertebrates from Parkin Loci 1 and 4.
Percentage of MNI
Aquatic vertebratesTerrestrial vertebrates
Percentage of biomass
Aquatic vertebratesTerrestrial vertebrates
Locus 1
47.732.3
7.592.5
Lticus 4
60,139.9
17.782.3
Lnci Combined
58.541.5
15-984.1
Note: Aquatic vertebrates arc beaver (Castor canadi'mis), muskrat {Oiuiiitnizihetliiiuf), mink (Miistela visoii), ali members of the heron family (Ardeidae), allmembers of the duck family (Anatidae), turtles (except for the box turtle,Terrapme caraliim), and fishes. Many of the terrestrial vertebrates also commonlyare associated with wetlands and near-shore settings, and some of these aquaticvertebrates maybe found on land, at least occasionally.
Element(Dimension) Locus 1
Locus 4(pre-ca. 1541)
Locus 4(post-1541)
Astragalus (Bd) 21.4 (1) 25.4 (4; 23.5-27.8) 25.8 (3; 24.4-26.6)Humems(Bd) 42,4 (2; 39.6-45.1) 42-1 (4; 39.2-44.85) 39.4 (3; 38.4-40.2)Metacarpus (Bp) 33.D (2; 31.4-34.5) 30-1 (5; 27.33-32.69) —Metatarsus (Bd) 32-6 (3; 30.3-35.2) 32-5 (2; 31.4-33.5) —Ubia (Bd) 37.2 (4; 34.5-39.7) 36.3 (8; 30.6-40,34) 35.6 (1)
Source: Dimensions foHow Driesch 1976; Locus 4 (1500s) measurements are fromKeck 1997.
Note: Bd = distal breadth; Bp - proximal breadth.
the few frontal fragments recovered. These methods aredescribed in more detail in the site reports (Johnston andReitz 1993; Keck 1997; Reitz, Lynch, and Weinand 1997;Weinand and Reitz 1994) and critiqued elsewhere(Reitz and Wing 1999:159-168). The number of unfusedspecimens increases from 32 percent of the specimens(total NISP = 50) in Locus 1 to 37 percent of thespecimens which could be aged in Locus 4 (NISP ^ 252).This slight increase in specimens from younger deer isreflected in the estimates of MNI. Juvenile and subadultindividuals (animals generally less than 26-29 monthsof age following Purdue [1983]) increase from 60 percentof the individuals in Locus 1 to 68 percent of theindividuals in Locus 4. Two of the deer in Locus 1 weremale, and two in Locus 4 were male; no evidence forfemales was observed. This slight increase in juvenileand subadult individuals may be evidence of over-hunting; however, young deer were the preferred targetthroughout the occupational sequence. Clearly thesetrends should be viewed with caution considering thesmall samples involved.
Associated with this decline in the contribution ofdeer is a possible decline in deer body size (Keck 1997;Purdue 1986, 1991; Reitz, Lynch, and Weinand 1997;Reitz and Weinand 1996). Measurements of deer speci-mens from fourteenth-century context in Locus 1 (Keck1997:246) are compared with measurements from pre-ca. 1541 contexts in Locus 4 (Keck 1997:248-249; Reitzand Weinand 1996) and post-1541 Feature 137 in Locus4 (Keck 1997:250; Table 8). The three dimensions are thedistal breadth of the humerus (Bd), the distal breadth ofthe tibia (Bd), and the distal breadth of the astragalus(Bd). The dimensions and abbreviations are defined byDriesch (1976). All dimensions are of fused specimensonly. Three dimensions are included in this preliminarystudy. These dimensions are used because they are theonly ones for which at least one measurement isavailable in all three temporal contexts: fourteenthcentury (Locus 1), fifteenth/sixteenth century (pre-ca.1541 Locus 4), and contexts with European materialsprobably deposited after 1541 (Locus 4, Feature 137;Keck 1997:33, 247-250). These may not be the mostsuitable dimensions for this type of study, however, theyare the only ones available at the present time. Future
115

SOUTHEASTERN ARCHAEOLOGY 24(2) WINTER 2005
research should be designed to expand the data avail-able for similar studies.
In two of the three cases, means for post-1541 Locus 4dimensions are smaller than those for the fourteenthcentury (Locus 1) and pre-ca. 1541 Locus 4. The hu-merus and tibia ranges overlap, but the mean of eachdimension declines slightly between the fourteenth-century Locus 1 and the pre-ca. 1541 Locus 4 andcontinues to decline into the post-1541 Feature 137. Thisis consistent with a more pronounced decrease in deerbody size reported from localities as distant as Illinoisand Georgia that continued into the twentieth century(Purdue 1986, 1991; Purdue and Reitz 1993). Theastragalus dimension follows a reverse trend.
These minor change in skeletal dimensions at Parkinmay be part of a trend throughout the southeasternregion in which deer body size declined over the past500 years (Purdue 1991). Deer body size is plastic andresponds to a number of factors, but fluctuations in theavailability of high-quality forage related to warm-season climate at critical points during juvenile andsubadult growth is a primary variable (Purdue 1986,1991). The hypothesis that this reduction in body sizemight be related to overhunting rather than to droughtand nutritional stress should be revisited when moredata are available. Some might argue, in fact, that over-hunting could result in larger body size because morefood and other resources would be available to feweranimals experiencing less competition and crowding.An increase in deer body size and an increase in the useof young animals by people who had previously usedolder animals would be a more substantial combina-tion favoring overhunting as an explanation.
The possibility that deer body size declined at Parkinin the 1500s suggests a biological response to a wide-spread phenomenon having an impact on growth indeer populations before the European-sponsored tradein deer hides began. This change may be independent ofother aspects of human behavior that might impact deerbody size, such as maize cultivation, hunting strategiestargeting a specific age cohort or sex, or over hunting.Clearly this aspect needs to be more carefully examinedwith much larger samples.
Interpreting the Evidence
Our data suggest broad similarities but differences inemphasis in the subsistence practices of the residents ofLoci 1 and 4 at Parkin. People used the same suite of re-sources; maize and deer were their dominant resourcesin both areas. The residents of the later household(s) inLocus 4, however, relied more on aquatic resources,particularly fishes but also turtles. They also seem tohave relied somewhat less on maize and more on thecultivation and/or gathering of native small grains and
oil seeds than did the household(s) in Locus 1. Severalinterpretations may individually or in tandem explainthe differences in subsistence strategies between thehouseholds in the two loci.
Before considering community-wide explanations forthe observed patterns, we should recall that these dataare primarily from two structures and associated fea-tures. Thus, the differences could indicate household-level variations in food preferences, farming practices,access to ehte foods, consumption practices, discardpractices, and a host of other outcomes broadly asso-ciated with site formation processes in a cultural con-text. Moreover, the age-structure, gender-balance, andratio of dependents to providers within a householdundoubtedly changed over time as members wereborn, married, and died. Individual households likelyaltered the focus of their activities as the needs of theirmembers and the labor available to them changed. Untilsubsistence data from multiple households from theseveral loci are available from Parkin, the possibilitythat the differences reported here are products of suchhousehold-level variations rather than community-widevariation cannot be dismissed.
Another possible cause for the differences betweenLoci 1 and 4 might be increased warfare during thesecenturies. Warfare might very well encourage people tofarm, fish, hunt, and gather as close to the safety ofParkin's fortification as possible (Clayton, Knight, andMoore 1993:391-394). Thus, many aspects of the changesin subsistence effort could be in response to this hazard.
The above paragraphs cover several of the explan-ations we had made individually in our separatereports. While we cannot reject the possibility that thesedifferences are the product of multiple, perhaps evenrandom, cultural factors, when we compared our datawe realized another explanation should be considered.In order to do so, let us assume that the differencesbetween Loci 1 and 4 indicate community-wide changesin subsistence practices. What explanation might en-compass community-wide adjustments in farming,fishing, and hunting practices? How do we accountfor these changes?
It is tempting to attribute the changes to social unrestand depopulation that followed the Spanish entrada ofthe middle sixteenth century. De Soto and his mentraveled through a heavily populated Arkansas foralmost two years. Yet French expeditions encounteredfew people when they explored the same area a centurylater. The changes in crop production and the increaseddependence on fishes evident in the Parkin assemblagescould be early evidence of subsequent dramatic shiftsinitiated by the European legacy of social disruptionand disease. But our Locus 4 data derive primarily frombefore, but also during and after, the arrival of de Soto.Moreover, it is difficult to see how European explora-tion, which occurred prior to the deerhide trade, could
116
CHANGES IN FOODWAYS AT THE PARKIN SITE
have produced the reduction in body size that may haveoccurred in deer populations near Parkin in the i500s.
Thus, another explanation seems more compellingto us. When the de Soto expedition visited Casqui(presumed to be the present-day Parkin site) in 1541, itseemed to be a thriving community. The ethnohistoricalrecord, however, indicates that the population vv asstressed by warfare and a prolonged drought (e.g.,Burnett and Murray 1993; Clayton, Knight and Moore1993:391-394). In fact, de Soto erected a cross on themound at Casqui and prayed for rain to alleviate thedrought that threatened the village's crops. (This was, ofcourse, not strictly a magnanimous gesture as de Sotosupported his expedition by commandeering foodstuffsfrom the towns he visited.) The drought of 1541 was buta harbinger of things to come. When they reconstructeddrought cycles in Arkansas for the past half millenniumusing tree ring data, Stahle, Cleveland, and Hehr (1985)found 10 periods in which drought conditions persistedin the region for more than 10 years. The worst of thesecycles was between 1549 and 1577, when droughtconditions prevailed in 22 of the 29 years. Moreover,another period of extended drought occurred in 1595.This sixteenth-century period of drought has beentermed a "megadrought" by Stahle et al. (2000) becauseits duration and severity exceeded all others for the past500 years (see also Schubert et al. 2004). While thedrought of the last half of the sixteenth century mayhave been the most severe, tree-ring data from both eastand west of Arkansas indicate that people would havehad to cope with multidecadal droughts in the fifteenthand early sixteenth century as well (Bark 1978; Schubertet al. 2004; Stahle, Cleaveland, and Hehr 1985; Stahleand Cleaveland 1992, 1994).
Droughts of such magnitude and longevity surely hadan impact on the resource base and the subsistencestrategies of Parkin's residents. The shift to a moremixed cropping strategy and to a greater reliance onaquatic over terrestrial sources of meat could reflectadjustments people made in the face of protracteddrought. In this, the drought may have exacerbatedtrends that were already underway. For example,decreased field viability and maize productivity, whichmay have been an inevitable outcome of long-termcultivation of this crop (Foster 2003), would have beenmade worse by drought. Likewise, extensive clearing offields and demands for construction materials and fuelcould have lead to deforestation. Loss of habitatelsewhere would lead animals such as deer to concen-trate in areas that retained cover, and many of theseareas might have been along waterways, thereby faci-litating people's use of other aquatic resources as well.It might seem counterintuitive that drought conditionsled people to increase their use of aquatic resources.Many of the fishes used by Parkin's residents, however,are species which prefer sluggish, low-oxygen environ-
ments and thus might thrive in low-water conditions.The flow of the St. Francis River could have beensubstantially lower than it is today without impactingthe fishing opportunities. Furthermore, the possiblereduction in deer body size could be a product ofreduced forage quality associated with the combinationof anthropogenic (deforestation) and non-anthropogenic(drought) processes.
Climate changes may have influenced people's deci-sions and actions in the Mississippian period more thanwe understand at present (see Anderson, Stahle, andCleveland 1995 for another discussion of this issue). Thefifteenth- and sixteenth-century occupation of Locus 4 atParkin and the Spanish visit to Casqui coincided with theso-called Little Ice Age. The changes reported here mightbe evidence of a cultural response to alterations in theresource base associated with this climatic event. Thispossibility needs to be more closely correlated with localevidence for the Medieval Warm Period (ca. A.D. 800-1200), Little Ice Age (ca. A.D. 1350-1860), and MaunderMinimum (mid-1600s to early 1700s) (dates fromBroecker 2001 and Shindell et al. 2001). The causes,degree, consequences, synchrony, regional impact, andtiming of temperature change is hotly debated (e.g..Bond et al. 2001; Bradley, Hughes, and Diaz 2003;Broecker 2001; Ely et al. 1993; Kerr 1999,2002; Nakagawaet al. 2003; Polyak and Asmerom 2001; Shindell et al.2001; Stahle and Cleaveland 1994), but it may be that theParkin data are evidence that these events influencedpeople's subsistence practices in central Arkansas duringthe fourteenth through sixteenth centuries. Although it isextremely unlikely that preindustrial people played anyrole in causing such large-scale climatic changes, plantsand animals throughout the food chain, includingpeople, their crops, and their preferred wild resources,would have responded to them. Future research shouldfocus on applications of geochemical techniques (e.g.,Me-Bar and Valdez 2003) to establish a chronologicalsequence of temperature regimes that can be correlatedwith many other types of biological and culturalevidence for Mississippian life and Native Americanresponses to European colonization. Such data wouldimprove studies of the relationships among climate,ecosystems, and culture.
The Value of Alternative Explanations andIntegrative Subsistence Analyses
Environmental archaeologists have avoided consider-ing climate change as a causal factor in cultural behaviorfor many years. This stems in part from the extravagantclaims made in the early part of the twentieth centuryfor climatic causality that subsequently were not sup-ported by biological and geological evidence. In recent
117

SOUTHEASTERN ARCHAEOLOGY 24(2) WINTER 2005
years, environmental archaeologists have learned moreabout the factors that influence their data and are moreskilled in interpretation. We have a greater appreciationfor the flexibility of human creativity in responding toenvironmental change and we are more aware thatarchaeological sites are not faithful mirrors of environ-mental conditions or of the ways in which people usedthe resources available to them. Biological remainsrecovered from archaeological sites are subject toa number of postdepositional, excavation, and ana-lytical processes as well as being the products of socialbehavior.
In our efforts to avoid environmental determinism, wemay have ignored an important ingredient in culturalchange. Foodways are said to be highly conservativeand to change slowly. But there may well be circum-stances under which people adjust their foodwaysrapidly—at least on an archaeological time scale.Fundamentally, the debris of economic decisions, whicheventually becomes the archaeological record of food-ways, reflects, albeit with some distortion, the environ-ment from which it was derived. At a general level, theplants and animals recovered from a site reflect theresource base available to people living there. At a moredetailed level, the relics of plant and animal use recordfeatures of the environment such as near-recent climatechange, ecosystem health, and extinction rates. Whenevidence is found for changes in the types of plants andanimals used, the possibility that people's adjustmentsto their subsistence practices are responses to changes inthe natural environment ns well as changes in theircultural milieu must be examined.
In the case of Parkin, at first social disruption in thewake of the De Soto expedition seemed the obviousanswer to the alterations observed in people's food-ways. On closer inspection and in the face of refineddates for Locus 4, it appears that the subtle shifts inemphasis within the overall resource base may be betterexplained as responses to prolonged drought and nativewarfare than to a "clash of cultures."
It is doubtful that either of us would have been asconfident of this claim without the support of theother's data. Thus the Parkin study serves as an objectlesson that, in spite of the impediments distinct tax-onomic groups present to collaboration, interestingresults are more likely to be obtained from interdisci-plinary studies than they are from a single-mindedfocus on a single data class. We should expand South-eastern studies to routinely include invertebrates, otherbotanical and vertebrate evidence, soils, and geochem-ical applications related to landscapes and climatechange. We should also make the extra effort to ensurethat the potential of these data is achieved throughcollaborative syntheses. The results presented here needto be tested with expanded sample sizes from additional
well-dated contexts from Parkin and elsewhere, butthey suggest that this effort will be rewarded.
Conclusions
Analysis of plant and vertebrate remains from twotemporally distinct loci at the Parkin site revealsunexpected and intriguing patterns. Use of terrestrialvertebrates, including deer, declines from the fourteenthcentury to the sixteenth century. Over this same time,white-tailed deer individuals decline, as does theamount of meat contributed by them. Likewise, maizecultivation decreases and production of local cultigensincreases. These changes in hunting, fishing, and cropproduction may be associated with social unrestreported for this time period or with a Late Mississip-pian drought associated with a broader climate pattern.The possibility that climate change had a more signif-icant impact on human life in the Southeast than hadheretofore been anticipated suggests that renewedefforts to synthesize geological, biological, and culturaldata from the Southeast would be productive.
Notes
Acknoivledgments. We wish to thank Jeffrey M. Mitchem(Arkansas Archeological Survey) for the opportunity toexamine these materials. We also thank Lilja V. Agness,C. Fred T Andrus, Jennifer A. Freer, Bethany Hill, Valerie A.Johnston, E. Michael Jordan, Charlene A. Keck, Alana A.Lynch, Robin Moore, Kitty Rainey, Kitty Roberts, RhondaSmith, Jennifer Webber, Daniel C. Weinand, Greg Wilson, andthe University of Georgia Zooarchaeology classes of 1992,1993, 1994, and 1995 for their assistance with this study Boththe zooarchaeological and archaeobotanical analyses werefunded in part by grants from the Arkansas ArcheologicalSurvey. Additional funds were provided by grants to JeffreyM. Mitchem from the Arkansas Natural and CulturalResources Commission (Grant Numbers 96-014 and 97-001).Earlier versions of this paper were presented at the 57thannual meeting of the Southeastern Archaeological Confer-ence, Macon, and the 65th annual meeting of the Society forAmerican Archaeology, Philadelphia. We are grateful to thereviewers whose comments stimulated us to improve themanuscript, particularly to the reviewer known only to us as2004-15.3, who suggested many of the changes incorporated inour discussion.
Collections. The Parkin materials are curated at the ParkinArcheological State Park, Parkin, Arkansas.
References Cited
Anderson, David G., David W. Stahle, and Malcolm K.Cleaveland1995 Paleoclimate and the Potential Food Reserves of
Mississippian Societies: A Case Study from the SavannahRiver Valley. American Antiquity 60:258-286.
118

CHANGES IN FOODWAYS AT THE PARKIN SITE
Bark, L. Dean1978 History of American Droughts. In North American
Droughts, edited by Norman J. Rosenberg, pp. 9-23.Westview Press, Boulder, CO.
Bond, Gerard, Bemd Kromer, Juerg Beer, Raimund Muscheler,Michael N, Evans, William Showers, Sharon Hoffmann, RustyLotti-Bond, Irka Hajdas, and Georges Bonani2001 Persistent Solar Influence on North Atlantic Glimate
During the Holocene. Science 294:2130-2136.Bradley, Raymond S., Malcolm K, Hughes, and Henry F, Diaz2003 Climate in Medieval Time, Science 302:404^05.Broecker, Wallace S.2001 Was the Medieval Warm Period Global? Science
291:1497-1499.Burnett, Barbara A., and Katherine A, Murray1993 Death, Drought, and de Soto: The Bioarchaeology of
Depopulation, In The Expedition of Hernando de Soto West ofthe Mississippi, 1541-1543. edited by G. A, Young and M, P.Hoffman, pp. 227-236. University of Arkansas Press,Fayetteville.
Clayton, Lawrence A,, Vernon James Knight, Jr, and EdwardC, Moore (editors)1993 The De Soto Chronicles: The Expedition of Hernando de
Soto to North America in 7539-1543. Vol. 1. University ofAlabama Press, Tuscaloosa,
Dobyns, Henry F.1983 Their Number Become Thinned: Native American Population
Dynamics in Eastern North America. University of TennesseePress, Knoxville.
Driesch, Angela von den1976 A Guide to the Measurements of Animal Bones from
Archaeological Sites. Peabody Museum of Archaeology andEthnology Bulletin No. 1, Harvard University, Cambridge.
Ely, Lisa L., Yehouda Enzel, Victor R, Baker, and Daniel R,Cayan1993 A 5000-Year Record of Extreme Floods and Climate
Change in the Southwestem United States. Science 262:410-412.
Foster, H, Thomas, II2003 Dynamic Optimization of Horticulture among the
Muscogee Creek Indians of the Southeastern UnitedStates. Journal of Anthropological Archaeology 22:411-424.
Fritz, Gayle J.1993 Early and Middle Woodland Period Pateoethnobotany,
In Foraging and Farming in the Eastern Woodlands, edited byC. M. Scarry, pp, 39-56. University Press of Florida,Gainesville.
2000 Levels of Native Biodiversity in Eastern North America,In Biodiversity and Native America, edited by P. Minnis andW, Eiisens, pp. 223-247. University of Oklahoma Press,Norman.
Gremillion, Kristen J,, and Kristin D. Sobolik1996 Dietary Variability among Prehistoric Forager-farmers
of Eastern North America. Current Anthropologi/ 37(3):529-539.
Hoaglin, David C, Frederick Mosteller, and John W. Tukey1983 Understanding Robust and Exploratory Data Anal\/sis. John
Wiley & Sons, New York.Hutchinson, Dale L., Clark Spencer Larsen, Margaret J.Schoeninger, and Lynette Norr
1998 Regional Variation in the Pattern of Maize Adoption andUse in Florida and Georgia, American Antiquity 63:397^16.
Jefferies, Richard W., Emanuel Breitburg, Jennifer Flood, andC. Margaret Scarry1996 Mississippian Adaptation on the Northern Periphery:
Settlement, Subsistence and Interaction in the CumberlandValley of Southeastern Kentucky. Southeastern Archaeology
Johannessen, Sissel1993 Farmers of the Late Woodland, In Foraging and Farming
in the Eastern Woodlands, edited by C. M. Scarry, pp, 57-77.University Press of Florida, Gainesville.
Johnston, Valerie A., and Elizabeth J. Reitz1993 Progress Report of Fauna from Locus 1 and Locus 4, the
Parkin Archeological State Park, Arkansas, MS on file,Zooarchaeology Laboratory, Georgia Museum of NaturalHistory, University of Georgia, Athens.
Keck, Charlene Anne1997 Nutrition During the Late Mississippian/Early Historic
Transition at the Parkin Site, Arkansas. Master's thesis.Department of Anthropology, University of Georgia,Athens.
Kerr, Richard A,1999 The Little Ice Age—Only the Latest Big Chill. Science
284:2069.2002 Big Chill from Sun and Volcano. Science 296:1963.Me-Bar, Yoav, and Fred Valdez, Jr.2003 Droughts as Random Events in the Maya Lowlands,
journal of Archaeological Science 30:1599-1606.Miller, Naomi F.1988 Ratios in Paleoethnobotanical Analysis. In Current
Paleoethnobotany, edited by C. Hastorf and V. Popper,pp. 72-85. University of Chicago Press, Chicago.
Mitchem, Jeffrey M,1996a Investigations of the Possible Remains of de Soto's
Cross at Parkin. Arhinsas Archeologist 35:87-95.1996b Mississippian Research at Parkin Archeological State
Park. In Proceedings of the 14th Midsouth ArchaeologicalConference, edited by R. Walling, C. Wharey, and C,Stanley, pp, 25-39. Special Publication No. 1, PanamericanConsultants, Memphis,
Morse, Phyllis A.1993 The Parkin Archeological Site and Its Role in De-
termining the Route of the de Soto Expedition. In TheExpedition of Hernando de Soto West of the Mississippi, 1541-1543, edited by G. Young and M. Hoffman, pp. 58-67.University of Arkansas Press, Fayetteville,
Morse, Dan F., and Phyllis A. Morse1983 Archaeology of the Central Mississippi Valley. Academic
Press, New York.Nakagawa, Tekeshi, Hiroyuki Kitagawa, Yoshinori Yasuda,Pavel E. Tarasov, Kotoba Nishida, Katsuya Gotanda, and YukiSawai, Yangtze River Civilization Program Members2003 Asynchronous Climate Changes in the North Atlantic
and Japan During the Last Termination. Science 299:688-691,Phillips, Philip, James A Ford, and James B. Griffin1951 Archaeological Survey in the Lower Mississippi Alluvial
Valley, 1940-1947. Papers of the Peabody Museum ofAmerican Archaeology and Ethnology No. 25, HarvardUniversity, Cambridge.
229

SOUTHEASTERN ARCHAEOLOGY 24(2) WINTER 2005
Polyak, Victor J., and Yemane Asmerom2001 Late Holocene Climate and Cultural Changes in South-
western United States. Science 294:148-151.Purdue, James R.1983 Epiphyseai Closure in White-tailed Deer. Journal of
Wildhfe Management 47(4): 1207-1213.1986 The Size of White-tailed Deer (Odocoileus virginianus)
During the Archaic Period in Central Illinois. In Foraging.Collecting, and Harvesting: Archaic Period Subsistence andSettlement in the Eastern Woodlands, edited by S. W.Neusius, pp. 65-95. Southern Illinois University Centerfor Archaeological Investigations Occasional Paper No. 6.Carbondale.
1991 Dynamism in the Body Size of White-Tailed Deer(Odocoiieus virginianus) from Southern Illinois. In Beamers,Bobwhites, and Blue-Points, edited by J. R. Purdue, W. E.Klippel, and B. W. Styles, pp. 277-284. Illinois StateMuseum Scientific Papers No. 23. Springfield.
Purdue, James R., and Elizabeth J. Reitz1993 Decrease in Body Size of White-tailed Deer (Odocoileus
virginianus) During the Late Holocene of South Carolinaand Georgia. In Morphological Change in QuaternaryMammals of North America, edited by R. A. Martin andA. D. Barnosky, pp. 281-298. Cambridge University Press,Cambridge.
Ramenofsky, Ann R1991 Vectors of Death: The Archaeology of European Contact.
University of New Mexico Press, Albuquerque.Reitz, Elizabeth J.1988 Evidence for Coastal Adaptations in Georgia and South
Carolina. Archaeolog}/ of Eastern North America 16:137-158.Reitz, Elizabeth J., Aiana A. Lynch, and Daniel C. Weinand1997 Vertebrate Fauna from Locus 4(97), Parkin Archeolog-
ical State Park, Arkansas (3Cs29). Manuscript on file,Zooarchaeology Laboratory, Georgia Museum of NaturalHistory, University of Georgia, Athens.
Reitz, Elizabeth J., and C. Margaret Scarry1985 Reconstructing Historic Subsistence with an Example from
Sixteenth-Century Spanish Florida. Society for HistoricalArchaeology Special Publication No. 3.
Reitz, Elizabeth J., and Daniel C. Weinand1996 The Size of White-tailed Deer (Odocoileus virginianus) at
the Parkin Archeological State Park During the Mississip-pian and Protohistoric Periods. MS on file, Zooarchaeol-ogy Laboratory, Georgia Museum of Natural History,University of Georgia, Athens.
Reitz, Elizabeth J., and Elizabeth S. Wing1999 Zooarchaeology. Cambridge University Press, Cam-
bridge.Scarry, C. Margaret1986 Change in Plant Procurement and Production during
the Emergence of the Moundville Chiefdom. Ph.D. diss..Department of Anthropology, University of Michigan.University Microfilms, Ann Arbor.
1993 Variability in Mississippian Crop Production Strategies.In Foraging and Farming in the Eastern Woodlands, edited byC. M. Scarry, pp. 78-90. University Press of Elorida,Gainesville.
1998 Plant Remains from Loci 1 and 4 at Parkin Archeo-logical State Park, Arkansas. MS on file. Research
Laboratories of Archaeology, University of North Caro-lina, Chapel Hill.
2003 Patterns of Wild Plant Utilization in the PrehistoricEastern Woodlands. In People and Plants in Ancient EasternNorth America, edited by P. Minnis, pp. 50-104. Smithso-nian Institution Press, Washington, D.C.
Schubert, Siegfried, Max J. Suarez, Philip J. Pegion, Randal D.Koster, and Julio T. Bacmeister2004 On the Cause of the 1930s Dust Bowl. Science 303:
1855-1859.Shannon, Claude E., and Warren Weaver1949 The Mathematical Theory of Communication. University of
Illinois Press, Urbana.Sheldon, Andrew L.1969 Equitability Indices: Dependence on the Species Count.
Ecology 50:46f^^67.Shindell, Drew T., Gavin A. Schmidt, Michael E. Mann, DavidRind, and Anne Waple2001 Solar Eordng of Regional Climate Change during the
Maunder Minimum. Science 294:2149-2152.Smith, Marvin T.1987 Archaeology of Aboriginal Culture Change in the Interior
Southeast: Depopulation during the Early Historic Period.University Presses of Florida, Gainesville.
Stahle, David W., and Malcolm K. Cleaveland1992 Reconstruction and Analysis of Spring Rainfall over the
Southeastern U.S. for the Past 1000 Years. Bulletin of theAmerican Meteorological Society 73(12):1947-1961.
1994 Tree-Ring Reconstructed Rainfall over the SoutheasternU.S.A. during the Medieval Warm Period and Little IceAge. Climatic Change 26:199-212.
Stahle, David W., Malcolm K. Cleaveland, and John G. Hehr1985 A 450-year Drought Reconstruction for Arkansas,
United States. Nature 316:530-532.Stahle, David W., Edward R. Cook, Malcolm K. Cleaveland,Matthew D. Therrell, David M. Meko, Henri D. Grissino-Mayer, Emma Watson, and Brian Luckman2000 Tree-Ring Data Document 16th Century Megadrought
Over North America. Eos 18(12):121-123.Velleman, Paul, and David Hoaglin1981 Applications, Basics, and Computing Exploratory Data
Analysis. Duxbury Press, Boston.Watson, Patty Jo1976 In Pursuit of Prehistoric Subsistence: A Comparative
Account of Some Contemporary Flotation Techniques.Midcontinental journal of Archaeology 1:88-100.
Weinand, Daniel C, and Elizabeth J. Reitz1994 Vertebrate Fauna from the 1992 Excavation of Locus 4,
Parkin Archeological State Park, Arkansas. MS on file,Zooarchacology Laboratory, University of Georgia.
Williams, Michele Lea1993 Plant Remains from the Parkin {3CS29) Archeologi-
cal Site. Master's thesis. Department of Anthropology,Washington University, St. Louis, MO.
Yerkes, Richard W.2005 Bone Chemistry, Body Parts, and Growth Marks:
Evaluating Ohio Hopewell and Cahokia MississippianSeasonality, Subsistence, Ritual, and Ecasting. AmericanAntiquity 70:241-265.
120