Changes in fishing power and fishing strategies driven by new technologies: The case of tropical...
10
Fisheries Research 155 (2014) 10–19 Contents lists available at ScienceDirect Fisheries Research j ourna l ho me pa ge: www.elsevier.com/locate/fishres Changes in fishing power and fishing strategies driven by new technologies: The case of tropical tuna purse seiners in the eastern Atlantic Ocean Edgar Torres-Irineo a,∗ , Daniel Gaertner a , Emmanuel Chassot b , Michel Dreyfus-León c,1 a IRD, UMR 212 EME (IRD/Ifremer/Université de Montpellier 2), Centre de Recherche Halieutique Méditerranéenne et Tropicale, Avenue Jean Monnet, BP 171, 34200 Sète, France b IRD, UMR 212 EME, (IRD/SFA), BP 570, Victoria, Seychelles c Instituto Nacional de la Pesca, Facultad de Ciencias Marinas, UABC, Mexico a r t i c l e i n f o Article history: Received 13 February 2013 Received in revised form 11 February 2014 Accepted 14 February 2014 Handling Editor P. He Keywords: CPUE standardization Fishing power Fishing strategies Purse seine fishery Technological development Tropical tuna a b s t r a c t Technological advancements can influence both the fishing power of a fleet and the fishing strategies it employs. To investigate these potential linkages, we examined almost three decades of data (1981–2008) from French tropical tuna purse seiners operating in the eastern Atlantic Ocean. Applying a sequence of statistical methods at different temporal and spatial scales, we analyzed two indicators of fishing power (sets per boat-day on fish aggregating devices (FADs) and sets per boat-day on free-swimming schools) each of which represent a distinct fishing mode. Our results show that the increasing modernization of this fleet has led to increases in both fishing power and the available number of fishing strategies to choose from. A key output of this analysis was the breakdown of fishing power time series (for each fishing mode) into separate periods of continuous years during which catchability was assumed to be constant, thus identifying regime shifts. This partitioning allowed us to identify when key changes occurred in the fishery. Changes in FAD-associated fishing were mostly driven by the introduction of radio beacons (early 1990s) which lead to an increase in fishing effort and an expansion of fishing grounds (direct effect) and the implementation of time-area management measures which resulted in a fragmentation of the traditional fishing grounds in the 2000s (indirect effect). During the same period, fishing on free- swimming schools also increased despite the biomass of stocks decreasing and fishing grounds remaining unchanged. This suggests these increases were driven by improvements in fish detection technology (e.g., bird radars, sonar). These identified increases are not entirely unexpected: indeed it is widely recognized that fishing power in the purse seine tuna fishery has increased over time. However, these increases do not necessarily occur linearly. Thus, understanding how fishing power is changing over time (such as determining when regime shifts occur) is critical to improving the CPUE standardization procedure in tropical tuna purse seine fisheries. © 2014 Elsevier B.V. All rights reserved. ∗ Corresponding author. Present address: Centro de Investigación y de Estudios Avanzados del Instituto Politécnico Nacional, Unidad Mérida. Km 6 Antigua Car- retera a Progreso, Cordemex, CP 97310 Mérida, Yucatán, México. Tel.: +52 99 91 24 21 00x2526; fax: +52 99 99 81 29 23. E-mail addresses: [email protected], [email protected] (E. Torres-Irineo), [email protected] (D. Gaertner), [email protected] (E. Chassot), [email protected] (M. Dreyfus-León). 1 Postal address: 511 East San Ysidro Boulevard 2430, San Ysidro, CA 92173-3150, USA. 1. Introduction An integral part of fleet dynamics is the acquisition of new vessels and/or new technology for the purpose of improving the effectiveness or outcomes of a fishery (Hilborn and Walters, 1992). Such investments generally result in increased capacity or effi- ciency (e.g., better accessibility to current fishing grounds) and an extension to existing fishing strategies (e.g., access to new fishing grounds and/or target species). Thus, these investments commonly result in improved catchability and are considered mechanisms of fishing power creeping (Eigaard and Munch-Petersen, 2011; Eigaard, 2009; Gascuel et al., 1993; Marchal et al., 2007; Millischer et al., 1999). Stock assessments that rely on time series of http://dx.doi.org/10.1016/j.fishres.2014.02.017 0165-7836/© 2014 Elsevier B.V. All rights reserved.
-
Upload
independent -
Category
Documents
-
view
1 -
download
0
Transcript of Changes in fishing power and fishing strategies driven by new technologies: The case of tropical...
CtA
Ea
Bb
c
a
ARRAH
KCFFPTT
ArT
((
U
h0
Fisheries Research 155 (2014) 10–19
Contents lists available at ScienceDirect
Fisheries Research
j ourna l ho me pa ge: www.elsev ier .com/ locate / f i shres
hanges in fishing power and fishing strategies driven by newechnologies: The case of tropical tuna purse seiners in the easterntlantic Ocean
dgar Torres-Irineoa,∗, Daniel Gaertnera, Emmanuel Chassotb, Michel Dreyfus-Leónc,1
IRD, UMR 212 EME (IRD/Ifremer/Université de Montpellier 2), Centre de Recherche Halieutique Méditerranéenne et Tropicale, Avenue Jean Monnet,P 171, 34200 Sète, FranceIRD, UMR 212 EME, (IRD/SFA), BP 570, Victoria, SeychellesInstituto Nacional de la Pesca, Facultad de Ciencias Marinas, UABC, Mexico
r t i c l e i n f o
rticle history:eceived 13 February 2013eceived in revised form 11 February 2014ccepted 14 February 2014andling Editor P. He
eywords:PUE standardizationishing powerishing strategiesurse seine fisheryechnological developmentropical tuna
a b s t r a c t
Technological advancements can influence both the fishing power of a fleet and the fishing strategies itemploys. To investigate these potential linkages, we examined almost three decades of data (1981–2008)from French tropical tuna purse seiners operating in the eastern Atlantic Ocean. Applying a sequence ofstatistical methods at different temporal and spatial scales, we analyzed two indicators of fishing power(sets per boat-day on fish aggregating devices (FADs) and sets per boat-day on free-swimming schools)each of which represent a distinct fishing mode. Our results show that the increasing modernizationof this fleet has led to increases in both fishing power and the available number of fishing strategies tochoose from. A key output of this analysis was the breakdown of fishing power time series (for each fishingmode) into separate periods of continuous years during which catchability was assumed to be constant,thus identifying regime shifts. This partitioning allowed us to identify when key changes occurred inthe fishery. Changes in FAD-associated fishing were mostly driven by the introduction of radio beacons(early 1990s) which lead to an increase in fishing effort and an expansion of fishing grounds (directeffect) and the implementation of time-area management measures which resulted in a fragmentationof the traditional fishing grounds in the 2000s (indirect effect). During the same period, fishing on free-swimming schools also increased despite the biomass of stocks decreasing and fishing grounds remainingunchanged. This suggests these increases were driven by improvements in fish detection technology (e.g.,
bird radars, sonar). These identified increases are not entirely unexpected: indeed it is widely recognizedthat fishing power in the purse seine tuna fishery has increased over time. However, these increases donot necessarily occur linearly. Thus, understanding how fishing power is changing over time (such asdetermining when regime shifts occur) is critical to improving the CPUE standardization procedure intropical tuna purse seine fisheries.© 2014 Elsevier B.V. All rights reserved.
∗ Corresponding author. Present address: Centro de Investigación y de Estudiosvanzados del Instituto Politécnico Nacional, Unidad Mérida. Km 6 Antigua Car-etera a Progreso, Cordemex, CP 97310 Mérida, Yucatán, México.el.: +52 99 91 24 21 00x2526; fax: +52 99 99 81 29 23.
E-mail addresses: [email protected], [email protected]. Torres-Irineo), [email protected] (D. Gaertner), [email protected]. Chassot), [email protected] (M. Dreyfus-León).
1 Postal address: 511 East San Ysidro Boulevard 2430, San Ysidro, CA 92173-3150,SA.
ttp://dx.doi.org/10.1016/j.fishres.2014.02.017165-7836/© 2014 Elsevier B.V. All rights reserved.
1. Introduction
An integral part of fleet dynamics is the acquisition of newvessels and/or new technology for the purpose of improving theeffectiveness or outcomes of a fishery (Hilborn and Walters, 1992).Such investments generally result in increased capacity or effi-ciency (e.g., better accessibility to current fishing grounds) and anextension to existing fishing strategies (e.g., access to new fishinggrounds and/or target species). Thus, these investments commonly
result in improved catchability and are considered mechanismsof fishing power creeping (Eigaard and Munch-Petersen, 2011;Eigaard, 2009; Gascuel et al., 1993; Marchal et al., 2007; Millischeret al., 1999). Stock assessments that rely on time series of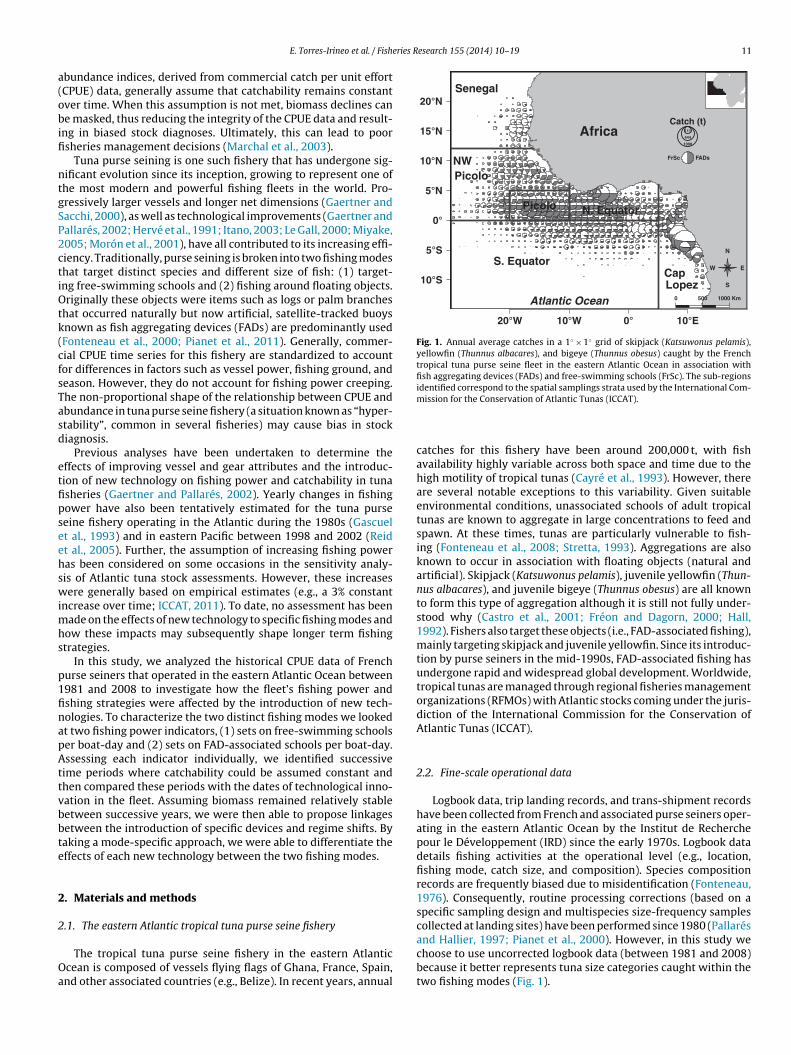
eries Research 155 (2014) 10–19 11
a(obifi
ntgSP2ctiOtk(cfsTasd
etfipseehswimhs
p1finapAttvbbte
2
2
Oa
Fig. 1. Annual average catches in a 1◦ × 1◦ grid of skipjack (Katsuwonus pelamis),yellowfin (Thunnus albacares), and bigeye (Thunnus obesus) caught by the Frenchtropical tuna purse seine fleet in the eastern Atlantic Ocean in association withfish aggregating devices (FADs) and free-swimming schools (FrSc). The sub-regionsidentified correspond to the spatial samplings strata used by the International Com-
collected at landing sites) have been performed since 1980 (Pallarés
E. Torres-Irineo et al. / Fish
bundance indices, derived from commercial catch per unit effortCPUE) data, generally assume that catchability remains constantver time. When this assumption is not met, biomass declines cane masked, thus reducing the integrity of the CPUE data and result-
ng in biased stock diagnoses. Ultimately, this can lead to poorsheries management decisions (Marchal et al., 2003).
Tuna purse seining is one such fishery that has undergone sig-ificant evolution since its inception, growing to represent one ofhe most modern and powerful fishing fleets in the world. Pro-ressively larger vessels and longer net dimensions (Gaertner andacchi, 2000), as well as technological improvements (Gaertner andallarés, 2002; Hervé et al., 1991; Itano, 2003; Le Gall, 2000; Miyake,005; Morón et al., 2001), have all contributed to its increasing effi-iency. Traditionally, purse seining is broken into two fishing modeshat target distinct species and different size of fish: (1) target-ng free-swimming schools and (2) fishing around floating objects.riginally these objects were items such as logs or palm branches
hat occurred naturally but now artificial, satellite-tracked buoysnown as fish aggregating devices (FADs) are predominantly usedFonteneau et al., 2000; Pianet et al., 2011). Generally, commer-ial CPUE time series for this fishery are standardized to accountor differences in factors such as vessel power, fishing ground, andeason. However, they do not account for fishing power creeping.he non-proportional shape of the relationship between CPUE andbundance in tuna purse seine fishery (a situation known as “hyper-tability”, common in several fisheries) may cause bias in stockiagnosis.
Previous analyses have been undertaken to determine theffects of improving vessel and gear attributes and the introduc-ion of new technology on fishing power and catchability in tunasheries (Gaertner and Pallarés, 2002). Yearly changes in fishingower have also been tentatively estimated for the tuna purseeine fishery operating in the Atlantic during the 1980s (Gascuelt al., 1993) and in eastern Pacific between 1998 and 2002 (Reidt al., 2005). Further, the assumption of increasing fishing poweras been considered on some occasions in the sensitivity analy-is of Atlantic tuna stock assessments. However, these increasesere generally based on empirical estimates (e.g., a 3% constant
ncrease over time; ICCAT, 2011). To date, no assessment has beenade on the effects of new technology to specific fishing modes and
ow these impacts may subsequently shape longer term fishingtrategies.
In this study, we analyzed the historical CPUE data of Frenchurse seiners that operated in the eastern Atlantic Ocean between981 and 2008 to investigate how the fleet’s fishing power andshing strategies were affected by the introduction of new tech-ologies. To characterize the two distinct fishing modes we lookedt two fishing power indicators, (1) sets on free-swimming schoolser boat-day and (2) sets on FAD-associated schools per boat-day.ssessing each indicator individually, we identified successive
ime periods where catchability could be assumed constant andhen compared these periods with the dates of technological inno-ation in the fleet. Assuming biomass remained relatively stableetween successive years, we were then able to propose linkagesetween the introduction of specific devices and regime shifts. Byaking a mode-specific approach, we were able to differentiate theffects of each new technology between the two fishing modes.
. Materials and methods
.1. The eastern Atlantic tropical tuna purse seine fishery
The tropical tuna purse seine fishery in the eastern Atlanticcean is composed of vessels flying flags of Ghana, France, Spain,nd other associated countries (e.g., Belize). In recent years, annual
mission for the Conservation of Atlantic Tunas (ICCAT).
catches for this fishery have been around 200,000 t, with fishavailability highly variable across both space and time due to thehigh motility of tropical tunas (Cayré et al., 1993). However, thereare several notable exceptions to this variability. Given suitableenvironmental conditions, unassociated schools of adult tropicaltunas are known to aggregate in large concentrations to feed andspawn. At these times, tunas are particularly vulnerable to fish-ing (Fonteneau et al., 2008; Stretta, 1993). Aggregations are alsoknown to occur in association with floating objects (natural andartificial). Skipjack (Katsuwonus pelamis), juvenile yellowfin (Thun-nus albacares), and juvenile bigeye (Thunnus obesus) are all knownto form this type of aggregation although it is still not fully under-stood why (Castro et al., 2001; Fréon and Dagorn, 2000; Hall,1992). Fishers also target these objects (i.e., FAD-associated fishing),mainly targeting skipjack and juvenile yellowfin. Since its introduc-tion by purse seiners in the mid-1990s, FAD-associated fishing hasundergone rapid and widespread global development. Worldwide,tropical tunas are managed through regional fisheries managementorganizations (RFMOs) with Atlantic stocks coming under the juris-diction of the International Commission for the Conservation ofAtlantic Tunas (ICCAT).
2.2. Fine-scale operational data
Logbook data, trip landing records, and trans-shipment recordshave been collected from French and associated purse seiners oper-ating in the eastern Atlantic Ocean by the Institut de Recherchepour le Développement (IRD) since the early 1970s. Logbook datadetails fishing activities at the operational level (e.g., location,fishing mode, catch size, and composition). Species compositionrecords are frequently biased due to misidentification (Fonteneau,1976). Consequently, routine processing corrections (based on aspecific sampling design and multispecies size-frequency samples
and Hallier, 1997; Pianet et al., 2000). However, in this study wechoose to use uncorrected logbook data (between 1981 and 2008)because it better represents tuna size categories caught within thetwo fishing modes (Fig. 1).
12 E. Torres-Irineo et al. / Fisheries Research 155 (2014) 10–19
10 Kw30 Kw60 Kw65 KwARPA
Coded antenna
GonioGPS
Radar 50 Kw
Satellite
Current meter
GPS
1500 m x 200 m
1500 m x 210 m1500 m x 240 m
Opening Roller purse ring
Complete mapsFirst maps
First sonar
Low frequen cy
Scanning 360°
Tra cking Sonar
Side Sounder
Split beam e cho sounder
Suppply Vessels
Bird Radar
Buoys
Current meter
Positioning
Purse seine
Ring bolt
Satellite maps
Sonar
Sounder
Supply vessels
1985 1990 1995 2000 2005
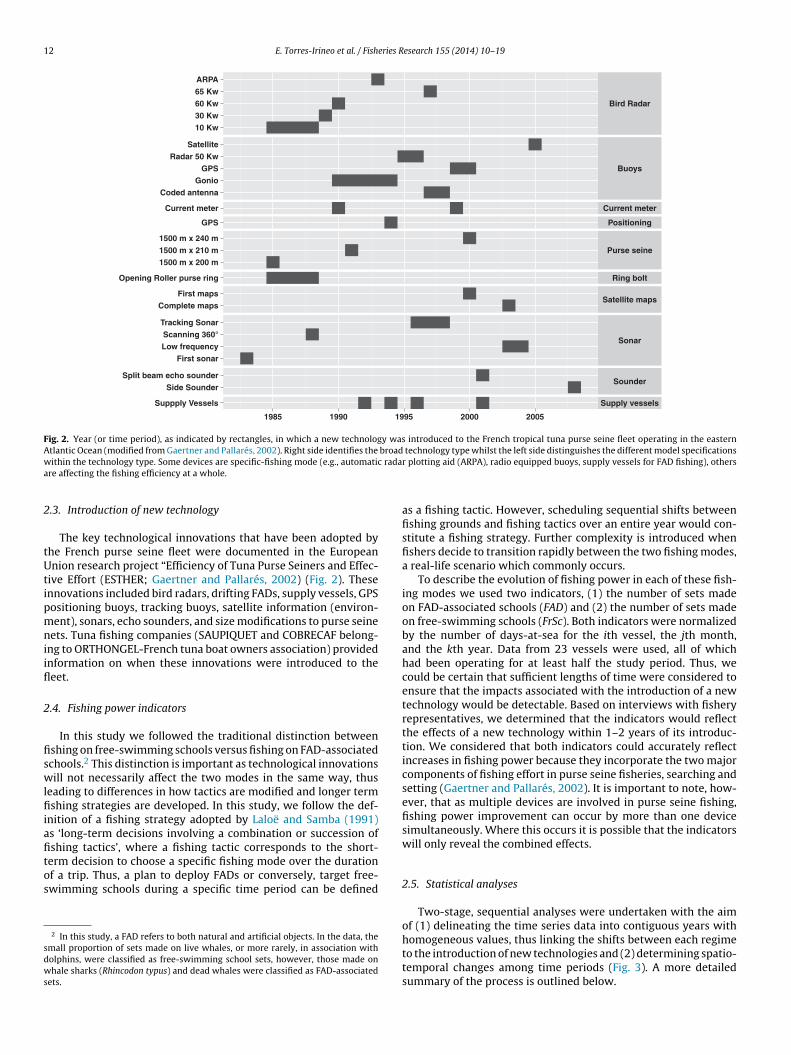
Fig. 2. Year (or time period), as indicated by rectangles, in which a new technology was introduced to the French tropical tuna purse seine fleet operating in the easternAtlantic Ocean (modified from Gaertner and Pallarés, 2002). Right side identifies the broad technology type whilst the left side distinguishes the different model specificationsw radaa
2
tUtipmniifl
2
fiswlfiiafitos
sdws
ithin the technology type. Some devices are specific-fishing mode (e.g., automaticre affecting the fishing efficiency at a whole.
.3. Introduction of new technology
The key technological innovations that have been adopted byhe French purse seine fleet were documented in the Europeannion research project “Efficiency of Tuna Purse Seiners and Effec-
ive Effort (ESTHER; Gaertner and Pallarés, 2002) (Fig. 2). Thesennovations included bird radars, drifting FADs, supply vessels, GPSositioning buoys, tracking buoys, satellite information (environ-ent), sonars, echo sounders, and size modifications to purse seine
ets. Tuna fishing companies (SAUPIQUET and COBRECAF belong-ng to ORTHONGEL-French tuna boat owners association) providednformation on when these innovations were introduced to theeet.
.4. Fishing power indicators
In this study we followed the traditional distinction betweenshing on free-swimming schools versus fishing on FAD-associatedchools.2 This distinction is important as technological innovationsill not necessarily affect the two modes in the same way, thus
eading to differences in how tactics are modified and longer termshing strategies are developed. In this study, we follow the def-
nition of a fishing strategy adopted by Laloë and Samba (1991)s ‘long-term decisions involving a combination or succession ofshing tactics’, where a fishing tactic corresponds to the short-
erm decision to choose a specific fishing mode over the durationf a trip. Thus, a plan to deploy FADs or conversely, target free-wimming schools during a specific time period can be defined2 In this study, a FAD refers to both natural and artificial objects. In the data, themall proportion of sets made on live whales, or more rarely, in association witholphins, were classified as free-swimming school sets, however, those made onhale sharks (Rhincodon typus) and dead whales were classified as FAD-associated
ets.
r plotting aid (ARPA), radio equipped buoys, supply vessels for FAD fishing), others
as a fishing tactic. However, scheduling sequential shifts betweenfishing grounds and fishing tactics over an entire year would con-stitute a fishing strategy. Further complexity is introduced whenfishers decide to transition rapidly between the two fishing modes,a real-life scenario which commonly occurs.
To describe the evolution of fishing power in each of these fish-ing modes we used two indicators, (1) the number of sets madeon FAD-associated schools (FAD) and (2) the number of sets madeon free-swimming schools (FrSc). Both indicators were normalizedby the number of days-at-sea for the ith vessel, the jth month,and the kth year. Data from 23 vessels were used, all of whichhad been operating for at least half the study period. Thus, wecould be certain that sufficient lengths of time were considered toensure that the impacts associated with the introduction of a newtechnology would be detectable. Based on interviews with fisheryrepresentatives, we determined that the indicators would reflectthe effects of a new technology within 1–2 years of its introduc-tion. We considered that both indicators could accurately reflectincreases in fishing power because they incorporate the two majorcomponents of fishing effort in purse seine fisheries, searching andsetting (Gaertner and Pallarés, 2002). It is important to note, how-ever, that as multiple devices are involved in purse seine fishing,fishing power improvement can occur by more than one devicesimultaneously. Where this occurs it is possible that the indicatorswill only reveal the combined effects.
2.5. Statistical analyses
Two-stage, sequential analyses were undertaken with the aim
of (1) delineating the time series data into contiguous years withhomogeneous values, thus linking the shifts between each regimeto the introduction of new technologies and (2) determining spatio-temporal changes among time periods (Fig. 3). A more detailedsummary of the process is outlined below.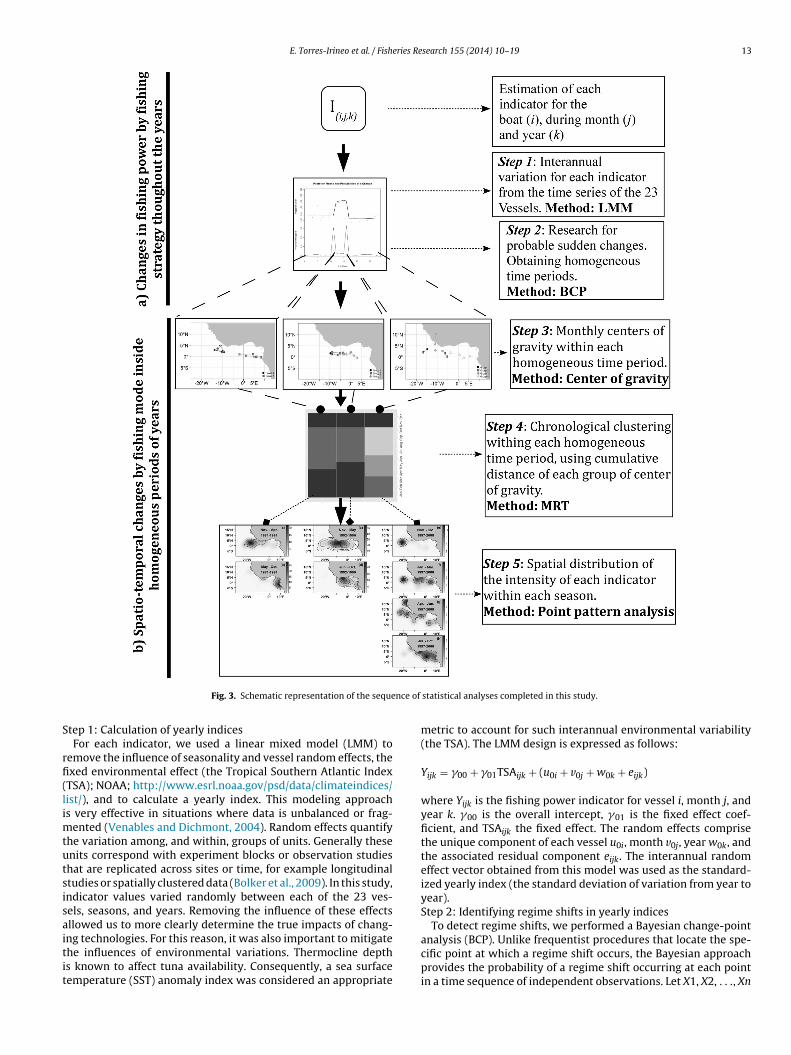
E. Torres-Irineo et al. / Fisheries Research 155 (2014) 10–19 13
nce o
Fig. 3. Schematic representation of the sequeStep 1: Calculation of yearly indicesFor each indicator, we used a linear mixed model (LMM) to
remove the influence of seasonality and vessel random effects, thefixed environmental effect (the Tropical Southern Atlantic Index(TSA); NOAA; http://www.esrl.noaa.gov/psd/data/climateindices/list/), and to calculate a yearly index. This modeling approachis very effective in situations where data is unbalanced or frag-mented (Venables and Dichmont, 2004). Random effects quantifythe variation among, and within, groups of units. Generally theseunits correspond with experiment blocks or observation studiesthat are replicated across sites or time, for example longitudinalstudies or spatially clustered data (Bolker et al., 2009). In this study,indicator values varied randomly between each of the 23 ves-sels, seasons, and years. Removing the influence of these effectsallowed us to more clearly determine the true impacts of chang-
ing technologies. For this reason, it was also important to mitigatethe influences of environmental variations. Thermocline depthis known to affect tuna availability. Consequently, a sea surfacetemperature (SST) anomaly index was considered an appropriatef statistical analyses completed in this study.
metric to account for such interannual environmental variability(the TSA). The LMM design is expressed as follows:
Yijk = �00 + �01TSAijk + (u0i + v0j + w0k + eijk)
where Yijk is the fishing power indicator for vessel i, month j, andyear k. �00 is the overall intercept, �01 is the fixed effect coef-ficient, and TSAijk the fixed effect. The random effects comprisethe unique component of each vessel u0i, month v0j, year w0k, andthe associated residual component eijk. The interannual randomeffect vector obtained from this model was used as the standard-ized yearly index (the standard deviation of variation from year toyear).Step 2: Identifying regime shifts in yearly indices
To detect regime shifts, we performed a Bayesian change-point
analysis (BCP). Unlike frequentist procedures that locate the spe-cific point at which a regime shift occurs, the Bayesian approachprovides the probability of a regime shift occurring at each pointin a time sequence of independent observations. Let X1, X2, . . ., Xn
1 eries R
4 E. Torres-Irineo et al. / Fishrepresent such a data sequence. A simple change-point model canbe written as follows:
Xi∼p(xi|�1), i = 1, . . ., t
Xi∼p(xi|�2), i = t + 1, . . ., n
where the density p(x|�) belongs to a known class of probabil-ity densities e.g., N(�1|�2
1 ), N(�2|�22 ) and t is the change point.
Barry and Hartigan (1993) proposed a product partition algorithmthat assumes there is an underlying sequence of parameters par-titioned into blocks of equal parameter values. The beginning ofeach block is called a change-point. In this study, we used thebcp R package to implement their algorithm which is describedwith Markov chain Monte Carlo sampling techniques (Erdman andEmerson, 2007).Step 3: Estimating the monthly center of gravity within each timeperiod
The regimes (time periods of homogeneous values) identifiedin the preceding step were each assumed to be characterized byunique spatio-temporal strata (i.e., with each stratum represent-ing a different fishing tactic and the overall group characterizing afishing strategy). To determine strata sizes for each regime withinboth fishing strategies, we estimated the monthly centers of grav-ity (CG) using the geographical coordinates. The CG concept comesfrom particle mechanics and refers to the mean location of themasses that make up a system of particles (Greiner, 2010). Con-sider a system which consists of n particles, with the positionvector rv, and the masses mv for v = (1,. . ., n). The CG of this systemis defined as occurring at point S with the position vector rS, whichcan be expressed as follows:
rS = 1M
n∑
v=1
mvrv
where M is the total mass of the system(∑n
v=1mv)
, and is the mass
moment.(∑n
v=1mvrv) The CG approach has been previously usedas a spatial indicator in ecological applications (Bez and Rivoirard,2001). In this analysis, we used the numbers of sets and their suminstead of population density values (as reported in the logbookdata with corresponding geographical coordinates).Step 4: Chronological clustering of monthly centers of gravity
Time-constrained clustering can be applied to introduce a con-straint of temporal contiguity in a clustering process for thepurposes of identifying discontinuities in multispecies time series(Legendre and Legendre, 1998). Multivariate regression trees(MRT; De’Ath, 2002) can be used to further constrain this process,delineating clusters both temporally and spatially (Borcard et al.,2011). The use of this method allows the recursive partitioning ofa quantitative variable under the control of a set of quantitativeor categorical explanatory variables. Firstly, a constrained parti-tioning of the data produces all possible partitions of the sites intotwo subgroups. This procedure is then repeated for each new sub-group, minimizing the sums of squared distances within groups.Secondly, a cross-validation of the partitions and a pruning of thetree are completed to establish the number of terminal nodes ofthe final tree. In this study, we used the cumulative geographicaldistance from the first monthly CG to the last in each time block
as the constraint of temporal contiguity, where the geographicalcoordinates of the each CG were used as the response variables.Using the cumulative geographical distance of CGs avoids cluster-ing two months close in space but chronologically distant.esearch 155 (2014) 10–19
Step 5: Intensity of each indicator according to the clusters iden-tified in each homogeneous block of years
Using the results from Step 4, a spatial point pattern analysiswas used to determine the spatial range of the two fishing powerindicators (FAD and FrSc). We used a Poisson process because of itsmore flexible approach to a wide range of problems (Bivand et al.,2008). As the clusters imply different strata in time and space, weassumed that the point process of each cluster was heterogeneous(i.e., intensity varied between locations). Following this assump-tion, intensity was estimated by a nonparametric method usingan isotropic Gaussian kernel smoothing function in the R packagespatstat (Baddeley and Turner, 2005).
3. Results
3.1. Regime shifts in fishing strategies
Regime shifts in the fishing strategies of the French purse seinerswere detected by identifying when sudden and significant changesoccurred in the time series of each indicator. The timing of theseshifts was then compared against the dates new technologies wereintroduced to the fleet (see Appendix S1 for LMM and BCP modelresults).
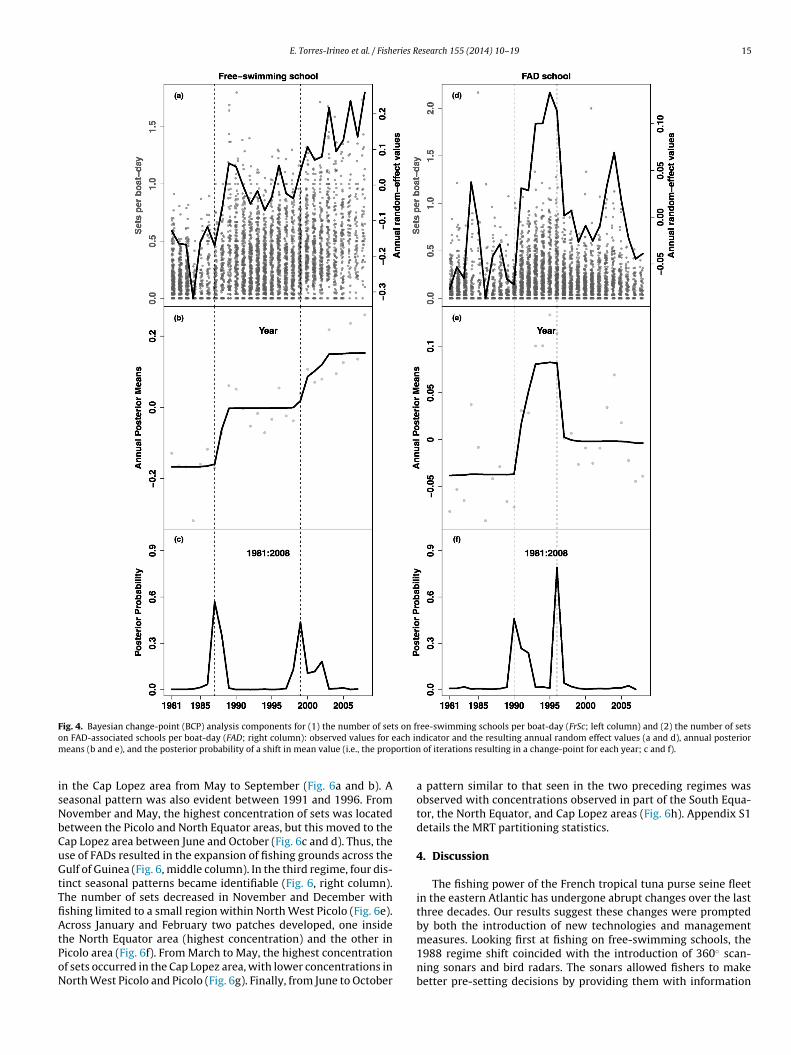
The BCP analysis revealed an upward trend in FrSc values overtime, with 2 marked shifts. These two change-points character-ize three distinct regimes (with homogenous years): 1981–1987,1988–1999, and 2000–2008 (Fig. 4, left column). Both points coin-cide with the introduction of important new technologies: openingpurse ring bolts, 360◦ scanning sonar, and bird radars (30 kW out-put power) around 1988 (Fig. 2), and current meters and the firstsatellite maps (e.g., SST maps) in 1999. The 2000–2008 period alsosaw the progressive introduction of increasingly higher-poweredsonars and bird radars.
Three distinct time periods: 1981–1990, 1991–1996, and1997–2008 were identified in the FAD values (Fig. 4, right column).Values increased from the first to second period, representing anincrease in the number of FAD-associated sets made per boat-day.During this second period, the number of FADs deployed increasedand a number of technological improvements were made, forexample, FADs were equipped with tracking devices. The majordecrease, observed in 1997, coincided with the voluntary morato-rium on FAD-associated fishing by European tuna operators acrossthe Gulf of Guinea (November to January). In 1999, ICCAT subse-quently adopted this ban and extended it to all surface fleets. Therelationship between new technological introductions and eachfishing mode are discussed in Section 4.
3.2. Spatio-temporal patterns in fishing strategies
The chronological clustering of the FrSc indicator revealed verysimilar spatio-temporal patterns in fishing strategies across thethree regimes, with variations only in their concentrations (Fig. 5).Between October and March, the highest concentrations of sets onfree-swimming schools occurred along the Equator (Fig. 5a, d, andg). From April to May, concentrations moved between Senegal andNorth West Picolo (Fig. 5b, e, and h) and then to the Cap Lopezarea between June and October (Fig. 5c, f, and i). Traditional fish-ing grounds were contracted during the 2000–2008 period to theNorth Equator and Cap Lopez areas (Fig. 5i). This was driven by thewithdrawal of vessels from the Senegal zone after 2006, followingthe non-renewal of European Union fishing agreements.
In contrast, the FAD indicator showed markedly different spatio-temporal patterns across the study period. During the first regime(1981–1990), a marked seasonal pattern was observed with setnumbers highest in the Picolo area between October and April but
E. Torres-Irineo et al. / Fisheries Research 155 (2014) 10–19 15
Fig. 4. Bayesian change-point (BCP) analysis components for (1) the number of sets on free-swimming schools per boat-day (FrSc; left column) and (2) the number of setso ach inm ortion
isNbCuGtTfiAtPoN
n FAD-associated schools per boat-day (FAD; right column): observed values for eeans (b and e), and the posterior probability of a shift in mean value (i.e., the prop
n the Cap Lopez area from May to September (Fig. 6a and b). Aeasonal pattern was also evident between 1991 and 1996. Fromovember and May, the highest concentration of sets was locatedetween the Picolo and North Equator areas, but this moved to theap Lopez area between June and October (Fig. 6c and d). Thus, these of FADs resulted in the expansion of fishing grounds across theulf of Guinea (Fig. 6, middle column). In the third regime, four dis-
inct seasonal patterns became identifiable (Fig. 6, right column).he number of sets decreased in November and December withshing limited to a small region within North West Picolo (Fig. 6e).cross January and February two patches developed, one inside
he North Equator area (highest concentration) and the other inicolo area (Fig. 6f). From March to May, the highest concentrationf sets occurred in the Cap Lopez area, with lower concentrations inorth West Picolo and Picolo (Fig. 6g). Finally, from June to October
dicator and the resulting annual random effect values (a and d), annual posterior of iterations resulting in a change-point for each year; c and f).
a pattern similar to that seen in the two preceding regimes wasobserved with concentrations observed in part of the South Equa-tor, the North Equator, and Cap Lopez areas (Fig. 6h). Appendix S1details the MRT partitioning statistics.
4. Discussion
The fishing power of the French tropical tuna purse seine fleetin the eastern Atlantic has undergone abrupt changes over the lastthree decades. Our results suggest these changes were promptedby both the introduction of new technologies and management
measures. Looking first at fishing on free-swimming schools, the1988 regime shift coincided with the introduction of 360◦ scan-ning sonars and bird radars. The sonars allowed fishers to makebetter pre-setting decisions by providing them with information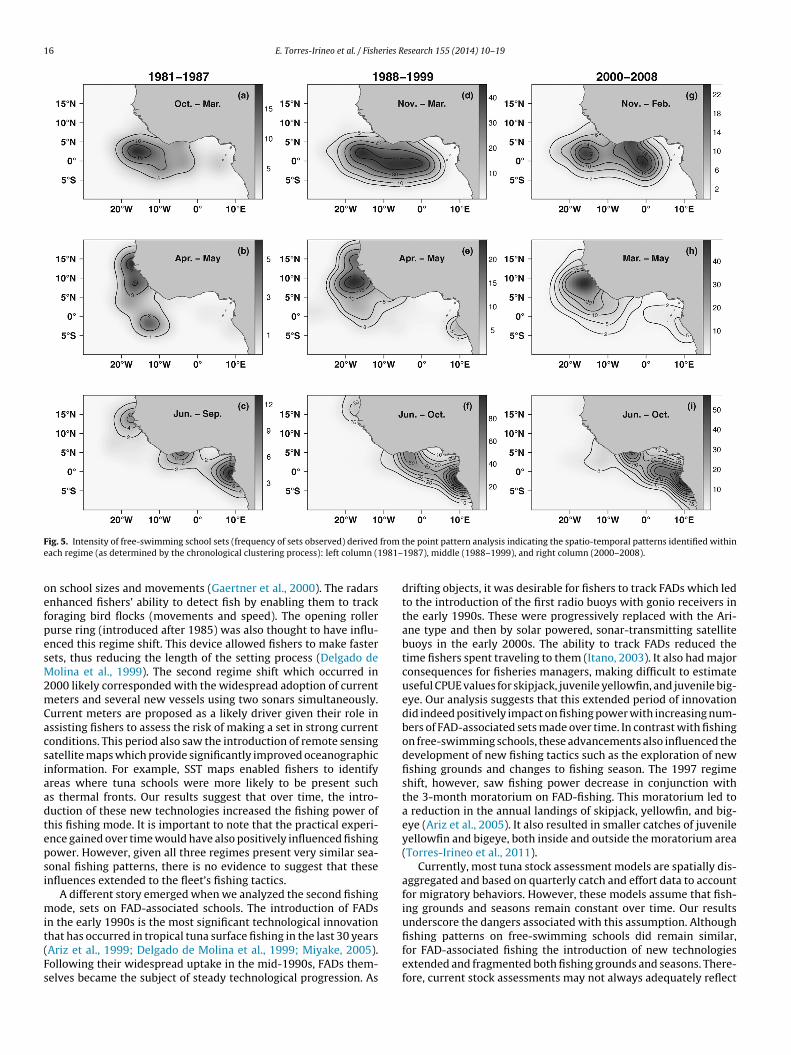
16 E. Torres-Irineo et al. / Fisheries Research 155 (2014) 10–19
F from
e 981–
oefpesM2mCacsiaadtepsi
mit(Fs
ig. 5. Intensity of free-swimming school sets (frequency of sets observed) derivedach regime (as determined by the chronological clustering process): left column (1
n school sizes and movements (Gaertner et al., 2000). The radarsnhanced fishers’ ability to detect fish by enabling them to trackoraging bird flocks (movements and speed). The opening rollerurse ring (introduced after 1985) was also thought to have influ-nced this regime shift. This device allowed fishers to make fasterets, thus reducing the length of the setting process (Delgado deolina et al., 1999). The second regime shift which occurred in
000 likely corresponded with the widespread adoption of currenteters and several new vessels using two sonars simultaneously.
urrent meters are proposed as a likely driver given their role inssisting fishers to assess the risk of making a set in strong currentonditions. This period also saw the introduction of remote sensingatellite maps which provide significantly improved oceanographicnformation. For example, SST maps enabled fishers to identifyreas where tuna schools were more likely to be present suchs thermal fronts. Our results suggest that over time, the intro-uction of these new technologies increased the fishing power ofhis fishing mode. It is important to note that the practical experi-nce gained over time would have also positively influenced fishingower. However, given all three regimes present very similar sea-onal fishing patterns, there is no evidence to suggest that thesenfluences extended to the fleet’s fishing tactics.
A different story emerged when we analyzed the second fishingode, sets on FAD-associated schools. The introduction of FADs
n the early 1990s is the most significant technological innovation
hat has occurred in tropical tuna surface fishing in the last 30 yearsAriz et al., 1999; Delgado de Molina et al., 1999; Miyake, 2005).ollowing their widespread uptake in the mid-1990s, FADs them-elves became the subject of steady technological progression. Asthe point pattern analysis indicating the spatio-temporal patterns identified within1987), middle (1988–1999), and right column (2000–2008).
drifting objects, it was desirable for fishers to track FADs which ledto the introduction of the first radio buoys with gonio receivers inthe early 1990s. These were progressively replaced with the Ari-ane type and then by solar powered, sonar-transmitting satellitebuoys in the early 2000s. The ability to track FADs reduced thetime fishers spent traveling to them (Itano, 2003). It also had majorconsequences for fisheries managers, making difficult to estimateuseful CPUE values for skipjack, juvenile yellowfin, and juvenile big-eye. Our analysis suggests that this extended period of innovationdid indeed positively impact on fishing power with increasing num-bers of FAD-associated sets made over time. In contrast with fishingon free-swimming schools, these advancements also influenced thedevelopment of new fishing tactics such as the exploration of newfishing grounds and changes to fishing season. The 1997 regimeshift, however, saw fishing power decrease in conjunction withthe 3-month moratorium on FAD-fishing. This moratorium led toa reduction in the annual landings of skipjack, yellowfin, and big-eye (Ariz et al., 2005). It also resulted in smaller catches of juvenileyellowfin and bigeye, both inside and outside the moratorium area(Torres-Irineo et al., 2011).
Currently, most tuna stock assessment models are spatially dis-aggregated and based on quarterly catch and effort data to accountfor migratory behaviors. However, these models assume that fish-ing grounds and seasons remain constant over time. Our resultsunderscore the dangers associated with this assumption. Although
fishing patterns on free-swimming schools did remain similar,for FAD-associated fishing the introduction of new technologiesextended and fragmented both fishing grounds and seasons. There-fore, current stock assessments may not always adequately reflect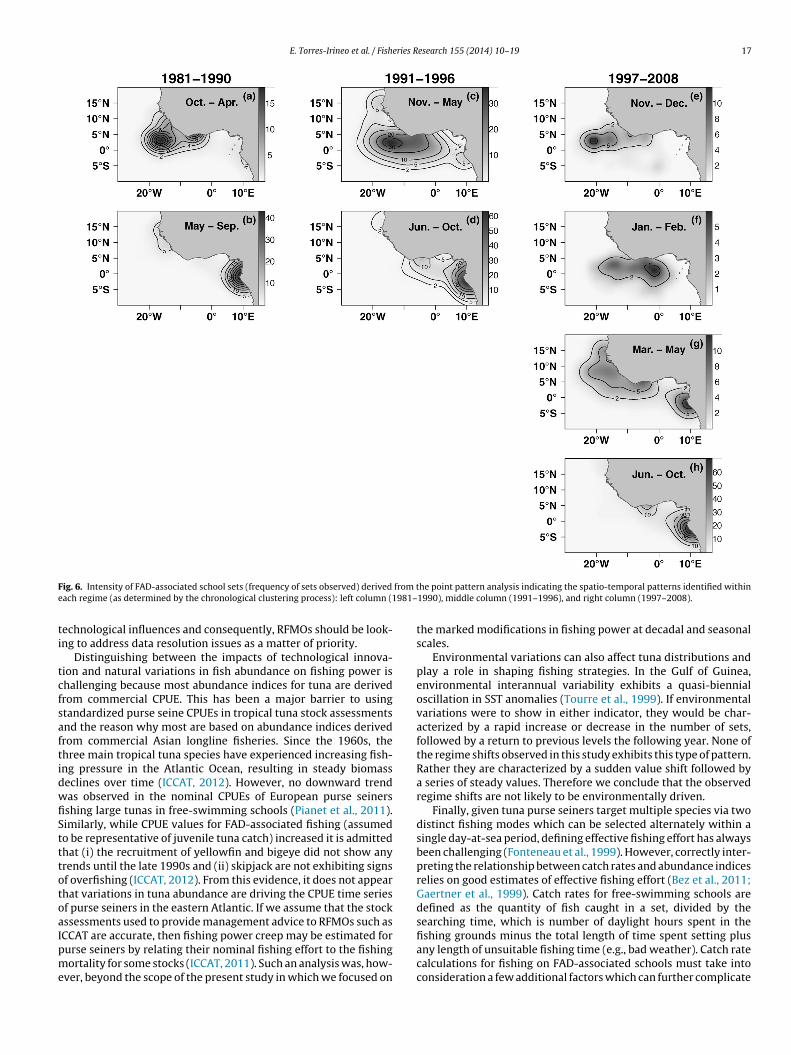
E. Torres-Irineo et al. / Fisheries Research 155 (2014) 10–19 17
F from te 981–
ti
tcfsaftidwfiStttotoaIpme
ig. 6. Intensity of FAD-associated school sets (frequency of sets observed) derived
ach regime (as determined by the chronological clustering process): left column (1
echnological influences and consequently, RFMOs should be look-ng to address data resolution issues as a matter of priority.
Distinguishing between the impacts of technological innova-ion and natural variations in fish abundance on fishing power ishallenging because most abundance indices for tuna are derivedrom commercial CPUE. This has been a major barrier to usingtandardized purse seine CPUEs in tropical tuna stock assessmentsnd the reason why most are based on abundance indices derivedrom commercial Asian longline fisheries. Since the 1960s, thehree main tropical tuna species have experienced increasing fish-ng pressure in the Atlantic Ocean, resulting in steady biomasseclines over time (ICCAT, 2012). However, no downward trendas observed in the nominal CPUEs of European purse seinersshing large tunas in free-swimming schools (Pianet et al., 2011).imilarly, while CPUE values for FAD-associated fishing (assumedo be representative of juvenile tuna catch) increased it is admittedhat (i) the recruitment of yellowfin and bigeye did not show anyrends until the late 1990s and (ii) skipjack are not exhibiting signsf overfishing (ICCAT, 2012). From this evidence, it does not appearhat variations in tuna abundance are driving the CPUE time seriesf purse seiners in the eastern Atlantic. If we assume that the stockssessments used to provide management advice to RFMOs such as
CCAT are accurate, then fishing power creep may be estimated forurse seiners by relating their nominal fishing effort to the fishingortality for some stocks (ICCAT, 2011). Such an analysis was, how-ver, beyond the scope of the present study in which we focused on
he point pattern analysis indicating the spatio-temporal patterns identified within1990), middle column (1991–1996), and right column (1997–2008).
the marked modifications in fishing power at decadal and seasonalscales.
Environmental variations can also affect tuna distributions andplay a role in shaping fishing strategies. In the Gulf of Guinea,environmental interannual variability exhibits a quasi-biennialoscillation in SST anomalies (Tourre et al., 1999). If environmentalvariations were to show in either indicator, they would be char-acterized by a rapid increase or decrease in the number of sets,followed by a return to previous levels the following year. None ofthe regime shifts observed in this study exhibits this type of pattern.Rather they are characterized by a sudden value shift followed bya series of steady values. Therefore we conclude that the observedregime shifts are not likely to be environmentally driven.
Finally, given tuna purse seiners target multiple species via twodistinct fishing modes which can be selected alternately within asingle day-at-sea period, defining effective fishing effort has alwaysbeen challenging (Fonteneau et al., 1999). However, correctly inter-preting the relationship between catch rates and abundance indicesrelies on good estimates of effective fishing effort (Bez et al., 2011;Gaertner et al., 1999). Catch rates for free-swimming schools aredefined as the quantity of fish caught in a set, divided by thesearching time, which is number of daylight hours spent in the
fishing grounds minus the total length of time spent setting plusany length of unsuitable fishing time (e.g., bad weather). Catch ratecalculations for fishing on FAD-associated schools must take intoconsideration a few additional factors which can further complicate
1 eries R
tmtFmthfiisaoriomtMufif
ncrrtwnti(tisuTtafipvu
A
at
A
iw(Es(tadgfP
8 E. Torres-Irineo et al. / Fish
he task of achieving good estimates. Much of the additional infor-ation required in FAD calculations is confidential: metrics such as
he number of FADs deployed by a vessel, the length of time eachAD is deployed for, the distances between deployed FADs, and theethod with which a FAD is detected are currently all unknown
o researchers and fisheries managers. Further, relationships thatave previously been well understood are also changing in thisshing mode. For example, the introduction of electronic track-
ng devices has dramatically modified the relationship betweenearching time and effective fishing effort. Typically fishers are nowble to move directly toward a buoy, even at night, thus avoidingr significantly reducing search times. Thus, it is difficult to defineepresentative fishing power indicators and we are aware this mayntroduce some weakness in the results of this study. However,ur results are conservative and true increases in fishing poweray be more pronounced where gains in fishing efficiency are par-
ially compensated by decreases in abundance (i.e., hyperstability).oreover, this analysis is an essential first step in improving our
nderstanding of how the introduction of new technology affectsshing power and fishing strategies and the results will inform the
uture direction of research in this area.In conclusion, in defining blocks of time in which homoge-
eous indicator values occurred (regimes), and assuming constantatchability occurred within each block, we have provided a usefulesource with which managers can use to correct CPUE-abundanceelationships developed over the last 30 years. It is crucial to ensurehat through a collaborative relationship with the fishing industry,e continue to expand our understanding of the influences tech-ological innovations have had, and continue to have, on tropicaluna purse seine fishery dynamics. Already, improved qualitativenformation is available on when new technologies are introduceddates) and French fishing companies have begun to share FADrajectory information with French scientists. Further, the recentmplementation of on-board electronic logbook systems on purseeiners are improving data collection and will likely improve ournderstanding of why a certain fishing mode or tactic is selected.his additional information will also assist managers in anticipatinghe response of fishers to management measures, for example time-rea closures. In light of our results in respect to FAD-associatedshing, the additional information that these electronic devices willrovide on FAD-associated fishing activities such as buoy transfers,isiting times, and deployment locations will prove particularlyseful.
uthor contributions
E.T-I., D.G., and M.D-L. conceived the idea; E.T-I., and D.G.nalyzed the data. E.T-I. led the writing with every co-author con-ributing.
cknowledgements
We thank anonymous referees for suggestions that helped tomprove the paper. The fisheries data analyzed in this publication
ere collected by the Institut de Recherche pour le DéveloppementIRD) component of the Mixed Research Unit 212 ‘Exploited Marinecosystems’ (IRD/Ifremer/U. Montpellier 2). Data collection wasupported by the EU-funded Data Collection Framework [DCF, RegEC) 1543/2000 and 199/2008]. We wish to acknowledge the con-ributions of ORTHONGEL, the staff of the Observatoire Thonier (IRD),nd all the technicians and fishermen that have been involved in
ata collection, processing, and management. We are particularlyrateful to A. Claude (SAUPIQUET) and M. Goujon (ORTHONGEL)or information on fishing technology. This study is part of theh.D. thesis conducted by the first author (ETI) at the University ofesearch 155 (2014) 10–19
Montpellier 2 (ED SIBAGHE) and funded by Consejo Nacionalde Ciencia y Tecnología (CONACYT), Mexico, scholarshipNo. 199730.
Appendix A. Supplementary data
Supplementary data associated with this article can befound, in the online version, at http://dx.doi.org/10.1016/j.fishres.2014.02.017.
References
Ariz, J., Delgado de Molina, A., Fonteneau, A., Gonzales Costas, F., Pallarés, P., 1999.Logs and tunas in the eastern tropical Atlantic: a review of present knowledgeand uncertainties. In: Scott, M.D., Bayliff, W.H., Lennert-Cody, C.E., Schaefer, K.M.(Eds.), Proceedings of the International Workshop on the Ecology and Fisheriesfor Tunas Associated with Floating Objects. Presented at the Inter-AmericanTropical Tuna Commission Special Report 11. La Jolla, CA, pp. 21–65.
Ariz, J., Delgado de Molina, A., Pallarés, P., Serralde, R., Santana, J.C., 2005. Evoluciónde las capturas y del esfuerzo de la flota espanola de cerco tropical en el OcéanoAtlántico tras la aplicación de las moratorias voluntarias y la recomendaciónde CICAA sobre el establecimiento de una veda de zona y temporada al uso dedispositivos agregadores de peces. Col. Vol. Sci. Pap. ICCAT 58, 372–384.
Baddeley, A., Turner, R., 2005. Spatstat: an R package for analyzing spatial pointpatterns. J. Stat. Software 12, 1–42.
Barry, D., Hartigan, J.A., 1993. A Bayesian analysis for change point problems. J. Am.Stat. Assoc. 88, 309–319.
Bez, N., Rivoirard, J., 2001. Transitive geostatistics to characterise spatial aggrega-tions with diffuse limits: an application on mackerel ichtyoplankton. Fish. Res.50, 41–58.
Bez, N., Walker, E., Gaertner, D., Rivoirard, J., Gaspar, P., 2011. Fishing activity of tunapurse seiners estimated from vessel monitoring system (VMS) data. Can. J. Fish.Aquat. Sci. 68, 1998–2010.
Bivand, R.S., Pebesma, E.J., Gómez-Rubio, V., 2008. Applied Spatial Data Analysis withR, Use R!. Springer, New York.
Bolker, B.M., Brooks, M.E., Clark, C.J., Geange, S.W., Poulsen, J.R., Stevens, M.H.H.,White, J.-S.S., 2009. Generalized linear mixed models: a practical guide for ecol-ogy and evolution. Trends Ecol. Evol. 24, 127–135.
Borcard, D., Gillet, F., Legendre, P., 2011. Numerical ecology with R, 1st ed. Springer,New York.
Castro, J.J., Santiago, J.A., Santana-Ortega, A.T., 2001. A general theory on fish aggre-gation to floating objects: an alternative to the meeting point hypothesis. Rev.Fish Biol. Fish. 11, 255–277.
Cayré, P., Amon-Kothias, J.B., Diouf, T., Stretta, J.M., 1993. Biology of tuna. In: Fonte-neau, A., Marcille, J. (Eds.), Resources, Fishing and Biology of the Tropical Tunasof the Eastern Central Atlantic, FAO Fisheries Document Paper. FAO, Rome, pp.147–244.
De’Ath, G., 2002. Multivariate regression trees: a new technique for modelingspecies-environment relationships. Ecology 83, 1105–1117.
Delgado de Molina, A., Fonteneau, A., Pallarés, P., Ariz, J., Gaertner, D., Santana, C.,1999. Atlantic tropical tuna fisheries: general overview. Col. Vol. Sci. Pap. ICCAT49, 241–252.
Eigaard, O.R., 2009. A bottom-up approach to technological development and itsmanagement implications in a commercial fishery. ICES J. Mar. Sci. 66, 916–927.
Eigaard, O.R., Munch-Petersen, S., 2011. Influence of fleet renewal and trawl devel-opment on landings per unit effort of the Danish northern shrimp (Pandalusborealis) fishery. ICES J. Mar. Sci. 68, 26–31.
Erdman, C., Emerson, J.W., 2007. BCP: an R package for performing a Bayesian anal-ysis of change point problems. J. Stat. Software 23, 1–13.
Fonteneau, A., 1976. Note sur les problèmes d’identification du bigeye dans lesstatistiques de pêche. Col. Vol. Sci. Pap. ICCAT 5, 168–171.
Fonteneau, A., Ariz, J., Gaertner, D., Nordstrom, V., Pallares, P., 2000. Observedchanges in the species composition of tuna schools in the Gulf of Guinea between1981 and 1999, in relation with the Fish Aggregating Device fishery. Aquat. LivingResour. 13, 253–257.
Fonteneau, A., Gaertner, D., Nordstrom, V., 1999. An overview of problems in thecatch per unit of effort and abundance relationship for the tropical purse seinefisheries. Col. Vol. Sci. Pap. ICCAT 49, 258–278.
Fonteneau, A., Lucas, V., Tewkai, E., Delgado, A., Demarcq, H., 2008. Mesoscaleexploitation of a major tuna concentration in the Indian Ocean. Aquat. Living.Resour. 21, 109–121.
Fréon, P., Dagorn, L., 2000. Review of fish associative behaviour: toward a generali-sation of the meeting point hypothesis. Rev. Fish Biol. Fish 10, 183–207.
Gaertner, D., Ariz, J., Hallier, J.P., Herrera Armas, M., 2000. Le point de vue despêcheurs thoniers à la senne sur l’augmentation des prises de patudo dans
l’Atlantique Est et sur les conditions d’utilisation du sonar. Col. Vol. Sci. Pap.ICCAT 51, 553–569.Gaertner, D., Pagavino, M., Marcano, J., 1999. Influence of fishers’ behaviour on thecatchability of surface tuna schools in the Venezuelan purse-seiner fishery inthe Caribbean Sea. Can. J. Fish. Aquat. Sci. 56, 394–406.
eries R
G
G
G
G
H
H
H
I
II
L
L
LM
cators. Aquat. Living Resour. 24, 337–350.
E. Torres-Irineo et al. / Fish
aertner, D., Pallarés, P., 2002. The European Union Research Project, Efficiency ofTuna Purse-Seiners and Effective Effort (ESTHER): Scientific report of project.Doc. SCTB15-FTWG-3.
aertner, D., Sacchi, J., 2000. Observations sur l’évolution de la dimension des sennesutilisées par la flottille franc aise de senneurs tropicaux opérant dans l’océanAtlantique. Col. Vol. Sci. Pap. ICCAT 51, 571–579.
ascuel, D., Fonteneau, A., Foucher, E., 1993. Analyse de l’évolution des puissances depêche par l’analyse des cohortes: application aux senneurs exploitant l’albacore(Thunnus albacares) dans l’Atlantique Est. Aquat. Living. Resour. 6, 15–30.
reiner, W., 2010. Classical Mechanics: systems of particles and Hamiltoniandynamics, 2nd ed. Springer, Verlag Berlin Heidelberg.
all, M., 1992. The association of tunas with floating objects and dolphins in theEastern Pacific Ocean. VII. Some hypotheses on the mechanisms governing theassociation of tunas with floating objects and dolphins. In: Presented at the Back-ground document for the International Workshop on the Ecology and Fisheriesfor Tunas Associated with Floating Objects, La Jolla, CA, p. 7.
ervé, A., Bard, F.X., Gonzales Costas, F., 1991. Facteurs d’accroissement potentielsde la puissance de pêche des senneurs tropicaux franc ais et espagnols entre1985 et 1989. Col. Vol. Sci. Pap. ICCAT 35.
ilborn, R., Walters, C., 1992. Quantitative Fisheries Stock Assessment: Choice,Dynamics and Uncertainty. Chapman and Hall, New York.
CCAT, 2011. Report of the 2011 ICCAT Yellowfin tuna stock assessment. ICCAT-SCRS,San Sebastian, Spain.
CCAT, 2012. ICCAT-SCRS, Madrid, Spain.tano, D., 2003. Documentation and classification of fishing gear and technology on
board tuna purse seine vessels. In: 16th Sixteenth Meeting of the Standing Com-mittee on Tuna and Billfish (SCTB16), Held in Mooloolaba, Queensland, Australia,pp. 9–16.
aloë, F., Samba, A., 1991. A simulation model of artisanal fisheries of Senegal. In:ICES Mar. Sci. Sym, pp. p281–p286.
e Gall, J.-Y., 2000. Contribution des DCP fixes et derivants a l’accroissement de lapuissance de peche des navires de peche thoniere. In: Le Gall, J.-Y., Cayré, P.,Taquet, M. (Eds.), Pêche Thonière et Dispositifs de Concentration de Poissons.Caribbean-Martinique, 15–19 October 1999, pp. 389–420.
egendre, P., Legendre, L.F.J., 1998. Numerical Ecology. Elsevier, Amsterdam.archal, P., Andersen, B., Caillart, B., Eigaard, O., Guyader, O., Hovgaard, H., Iriondo,
A., Fur, F.L., Sacchi, J., Santurtún, M., 2007. Impact of technological creep onfishing effort and fishing mortality, for a selection of European fleets. ICES J.Mar. Sci. 64, 192–209.
esearch 155 (2014) 10–19 19
Marchal, P., Ulrich, C., Korsbrekke, K., Pastoors, M., Rackham, B., 2003. Annual trendsin catchability and fish stock assessments. Sci. Mar. 67, 63–73.
Millischer, L., Gascuel, D., Biseau, A., 1999. Estimation of the overall fishing power: astudy of the dynamics and fishing strategies of Brittany’s industrial fleets. Aquat.Living Resour. 12, 89–103.
Miyake, P.M., 2005. A brief history of the tuna fisheries of the world. In: SecondMeeting of the Technical Advisory Committee of the FAO Project Managementof Tuna Fishing Capacity: Conservation and Socio-economics. FAO Fish. Proc.,Madrid, Spain, pp. 23–50.
Morón, J., Areso, J., Pallares, P., 2001. Statistics and technical information aboutthe Spanish purse seine fleet in the Pacific. In: 14th Meeting of the StandingCommittee on Tuna and Billfish, Noumea, New Caledonia, pp. 9–16.
Pallarés, P., Hallier, J.-P., 1997. Analyse du schéma d’échantillonnage multispéci-fique des thonidés tropicaux (Rapport scientifique No. Programme no 95/37).IEO/ORSTOM.
Pianet, R., Delgado, A., Floch, L., Ariz, J., Damiano, A., Sabate, I., Kouassi, Y., N’Gom Sow,F., 2011. Statistiques de la pêcherie thonière européenne et assimilée durant lapériode 1991–2010. Col. Vol. Sci. Pap. ICCAT 68, 886–914.
Pianet, R., Pallarés, P., Petit, C., 2000. New sampling and data processing strategyfor estimating the composition of catches by species and sizes in the Europeanpurse seine tropical tuna fisheries. In: IOTC Proceedings IOTC No. 3, pp. 104–139.
Reid, C., Kirkley, J.E., Squires, D., Ye, J., 2005. An analysis of the fishing capacity of theglobal tuna purse-seine fleet. In: Bayliff, W.H., Leiva Moreno, J.I., de Maikowski, J.(Eds.), Second Meeting of the Technical Advisory Committee of the FAO Project“Management of Tuna Fishing Capacity: Conservation and Socio-economics”.Madrid, Spain, 15–18 March 2004, FAO Fisheries Proceedings. FAO, Rome, pp.117–156.
Stretta, J.M., 1993. Environment and tuna fishing in the eastern tropical Atlantic. In:Fonteneau, A., Marcille, J. (Eds.), Resources, Fishing and Biology of the TropicalTunas of the Eastern Central Atlantic, FAO Fisheries Document Paper. FAO, Rome,pp. 245–288.
Torres-Irineo, E., Gaertner, D., de Molina, A.D., Ariz, J., 2011. Effects of time-areaclosure on tropical tuna purse-seine fleet dynamics through some fishery indi-
Tourre, Y.M., Rajagopalan, B., Kushnir, Y., 1999. Dominant patterns of climate vari-ability in the Atlantic Ocean during the last 136 years. J. Climate 12, 2285–2299.
Venables, W.N., Dichmont, C.M., 2004. GLMs, GAMs and GLMMs: an overview oftheory for applications in fisheries research. Fish. Res. 70, 319–337.