
Challenges in Conducting Secondary Data Analysis
24
CHALLENGES IN CONDUCTING SECONDARY DATA ANALYSIS Lorena Ortega Christine Paget Sina Fackler Nardos Tesfay Department of Education University of Oxford
Transcript of Challenges in Conducting Secondary Data Analysis

CHALLENGES IN CONDUCTING SECONDARY DATA ANALYSIS
Lorena OrtegaChristine Paget
Sina FacklerNardos Tesfay
Department of Education University of Oxford
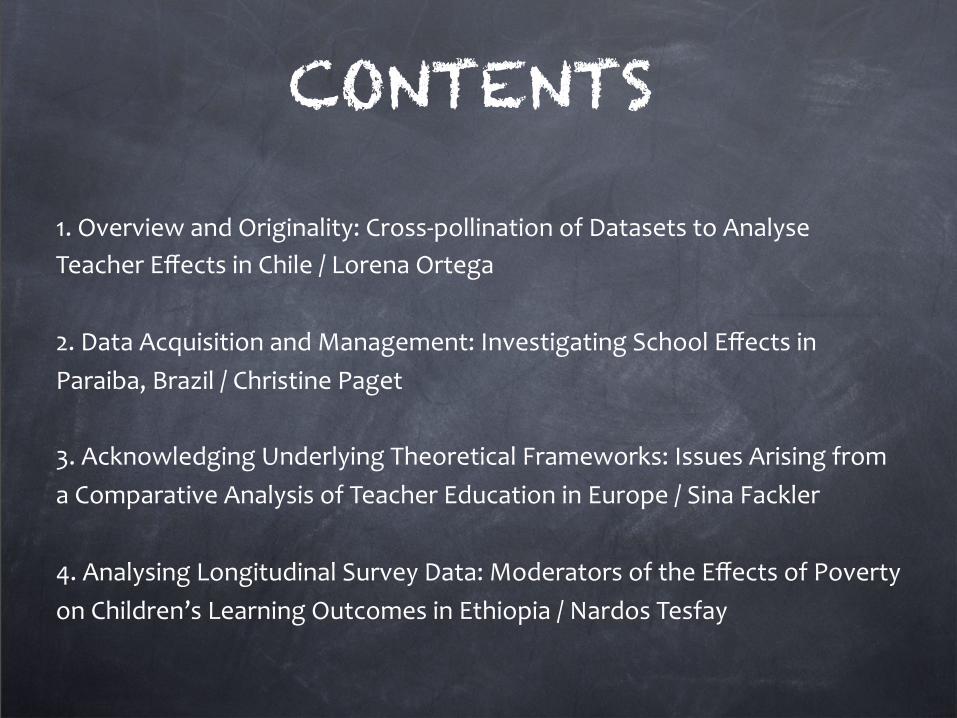
CONTENTS
1. Overview and Originality: Cross-‐pollination of Datasets to Analyse Teacher Effects in Chile / Lorena Ortega
2. Data Acquisition and Management: Investigating School Effects in Paraiba, Brazil / Christine Paget 3. Acknowledging Underlying Theoretical Frameworks: Issues Arising from a Comparative Analysis of Teacher Education in Europe / Sina Fackler
4. Analysing Longitudinal Survey Data: Moderators of the Effects of Poverty on Children’s Learning Outcomes in Ethiopia / Nardos Tesfay

Secondary Data Analysis
The vast amount of statistical data that is now available on the
Internet, and in other electronic forms, have resulted in a ‘data
deluge’ (Carter et al. 2011).
This provides both opportunities and challenges for researchers.
Definition of secondary data analysis: ‘an empirical exercise
carried out on data that has already been gathered or compiled in
some way’ (Dale et al., 1988).
Our interest here is with numeric secondary data.

The value of exploiting existing datasets
The primary advantage is that the data do not have to be
collected, with all that implies for financial and temporal benefits.
The second advantage is that analyses can focus on matters of
interest that have not been addressed.
A relatively under-‐used technique in education research: In UK
‘Education’ journals, less than half (42%) of the papers which used
numeric methods involved the analysis of secondary data (Smith
2008).
The use of secondary data is growing and is encouraged by
founding councils.

Sources of Secondary Data
Typically collected by a national statistical office, administrative agencies,
sectoral ministries, international governmental and statistical
organisations (www.secondarydataanalysis.com).
Survey research (e.g. Economic and Social Research Council Data
Archive).
International databases (e.g. OECD, UNESCO, United Nations and
the World Bank Education Databases).
Administrative data (e.g. UK National Statistics, the UK
Department of Education statistics).
Tests of student performance (e.g. PISA, TIMMS, PIRLS, etc.)

Main Criticisms
An approach that is not without its critics:
It might involve the analysis of data that has been collected
with a very different purpose in mind.
The secondary data analyst may be unaware of the context in
which the research took place.
That it is full of errors. Conceptual and practical problems.

Why use secondary data?
It is a method that is seemingly perfectly suited to ‘the research
needs of persons with macro-‐interest and micro-‐resources’ (Glaser,
1963, p. 11).
Numerous practical, social, methodological, theoretical and
pedagogical benefits.
Practical benefits:
Speed and cost.
Authority, quality and scale.
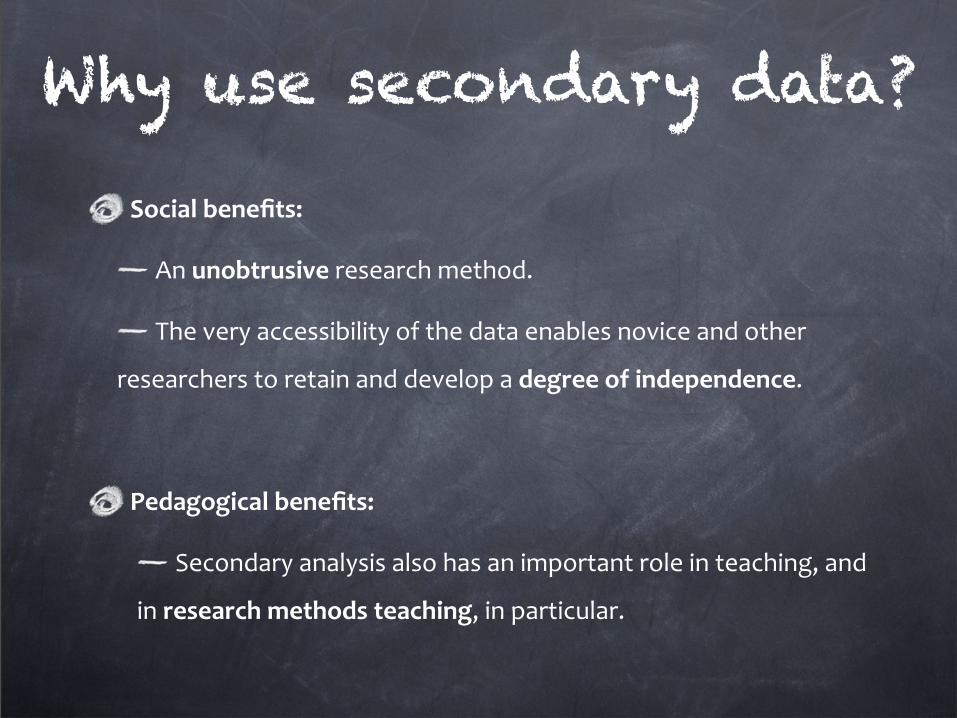
Social benefits:
An unobtrusive research method.
The very accessibility of the data enables novice and other
researchers to retain and develop a degree of independence.
Pedagogical benefits:
Secondary analysis also has an important role in teaching, and
in research methods teaching, in particular.
Why use secondary data?

Methodological benefits:
It can enable data to be analysed and replicated from different
perspectives and in this way provides opportunities for the
discovery of relationships not considered in the primary research.
Contribution to theory development:
According to Hakim (1982), it can ‘allow for greater
interaction between theory and empirical data because the
transition from theory development to theory testing is more
immediate’.
Why use secondary data?

Challenges
As with all research methods, there are understandable
challenges in analysing secondary data, particularly because it is data
that researchers have not gathered themselves.
Methodological as well as substantive the challenges.

Methodological Challenges
Accessing, managing and preparing large datasets for analysis
To make use of these data, is necessary to:
Understand the social construct of data – where data come
from, how they are collected and whether they are comparable
with other data and consistent over time – and,
Have the skills to interpret and analyse them.
Requires familiarity with the standards and systems of
classification used to construct data sets.

Methodological Challenges
Good use of these data requires statistical literacy.
Multiple methods for dealing with these large and often complex
secondary datasets.
Advanced statistical software packages have made analysis of very
large data sets within the reach of most researchers and their use is
now standard practice.
Initiatives to develop these capacities (e.g. the Quantitative
Methods Initiative -‐ ESRC, www.quantitativemethods.ac.uk/)

Substantive Challenges
The often ‘fuzzy’ nature of secondary analysis where the data
originally collected might not be a perfect match for the secondary
analysts’ research questions.
The availability of figures can determine what is considered
researchable, rather than the other way around.
An early decision has to be made as to whether the dataset is
likely to produce findings that are ‘good enough’ for the purpose at
hand.

Conclusions Secondary data analysis can help save time, money, career,
degrees, research interests, vitality and talent, self images and
myriads of data from untimely, unnecessary and unfortunate loss
(Glaser, 1963, p. 14).
Treating secondary data analysis with appropriate scepticism
about its technical and conceptual basis is essential.
The importance of transparency and rigour in analysing and
reporting the findings from secondary analysis:
To mitigate weaknesses in the data, where feasible.
To indicate the limitations inherent in secondary analysis.
SECONDARY DATA AND ORIGINALITY
Analysing teacher effects in Chile: A case of cross-pollination of datasets

Secondary Data and Originality
Academic production requires ‘originality’.
If you can think of a new question, you can do new research with
old data.
It may seem odd to suggest that using ‘old’ data can lead to more
original research than getting new data, yet according to Gorard
(2003) this is the case where ‘cross-‐pollination’ of datasets is
involved.
‘Cross-‐pollination’ formed by bringing together existing datasets
in a way that had not been thought of before.
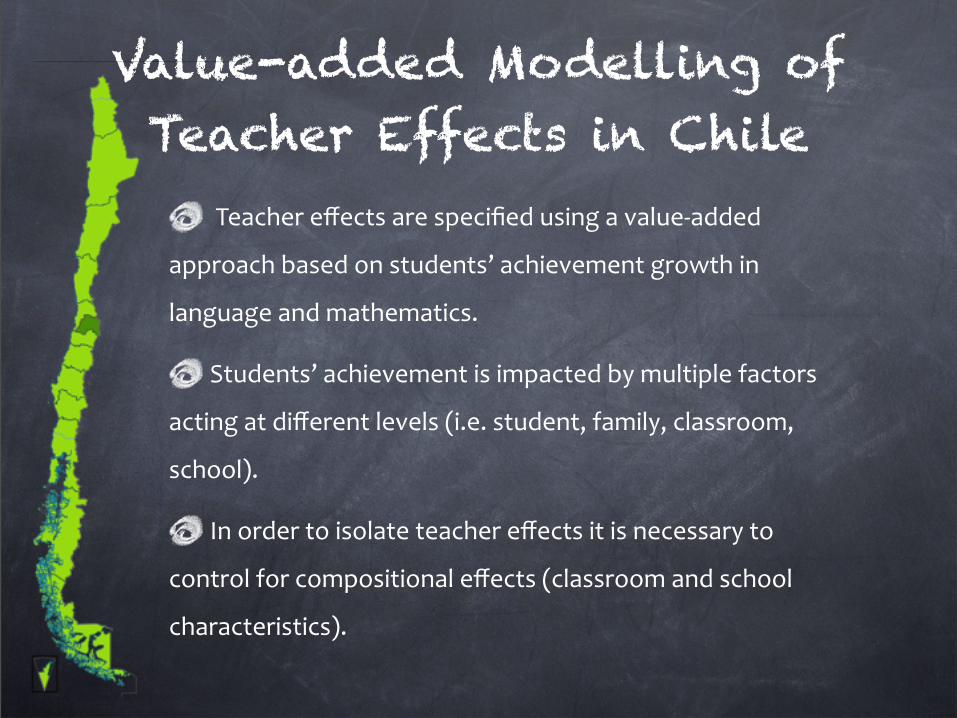
Value-added Modelling of Teacher Effects in Chile
Teacher effects are specified using a value-‐added
approach based on students’ achievement growth in
language and mathematics.
Students’ achievement is impacted by multiple factors
acting at different levels (i.e. student, family, classroom,
school).
In order to isolate teacher effects it is necessary to
control for compositional effects (classroom and school
characteristics).

The General System of Student Information (SIGE)
-‐ Schools, grades, classes and subject in which teachers taught, 2008-‐2011-‐ Teacher demographics, preparation and experience
The SEPA ProjectN = 72,660 students
-‐ Students’ academic progress in Mathematics and Language, 2008-‐2011
Secondary Sources
The SIMCE Assessment System-‐ Students’ demographics and socio-‐cultural background-‐ School characteristics
Catholic University of Chile
Ministry of Education
The School Enrolment Recording System
-‐ Size and composition of schools
Value-added Modelling of Teacher Effects
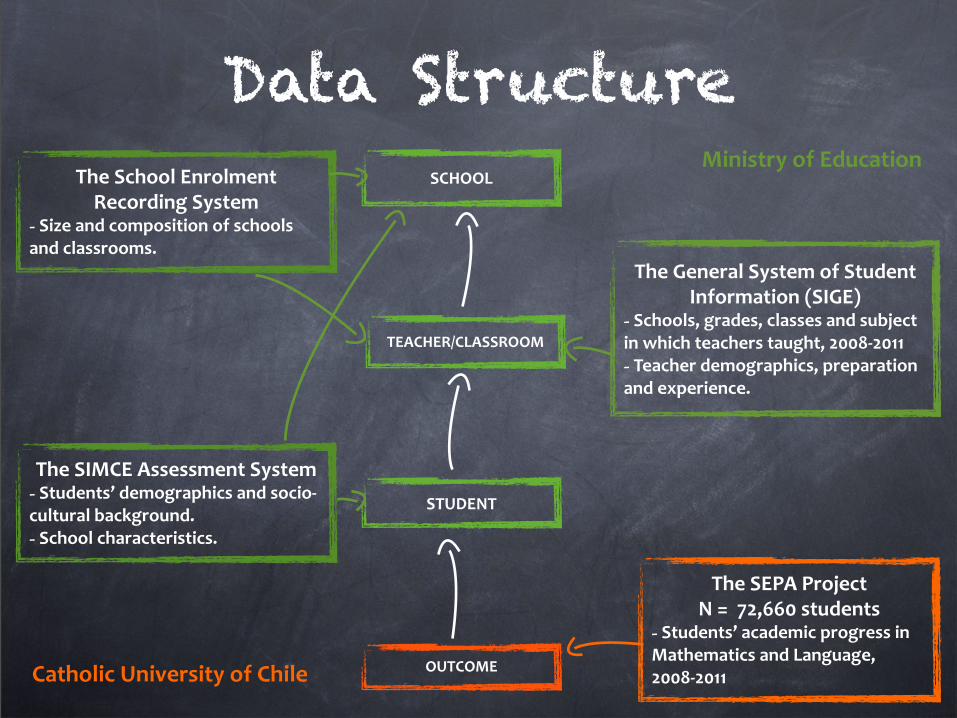
Data StructureSCHOOL
TEACHER/CLASSROOM
STUDENT
OUTCOME
The SEPA ProjectN = 72,660 students
-‐ Students’ academic progress in Mathematics and Language, 2008-‐2011
The SIMCE Assessment System-‐ Students’ demographics and socio-‐cultural background.-‐ School characteristics.
The School Enrolment Recording System
-‐ Size and composition of schools and classrooms.
The General System of Student Information (SIGE)
-‐ Schools, grades, classes and subject in which teachers taught, 2008-‐2011-‐ Teacher demographics, preparation and experience.
Ministry of Education
Catholic University of Chile
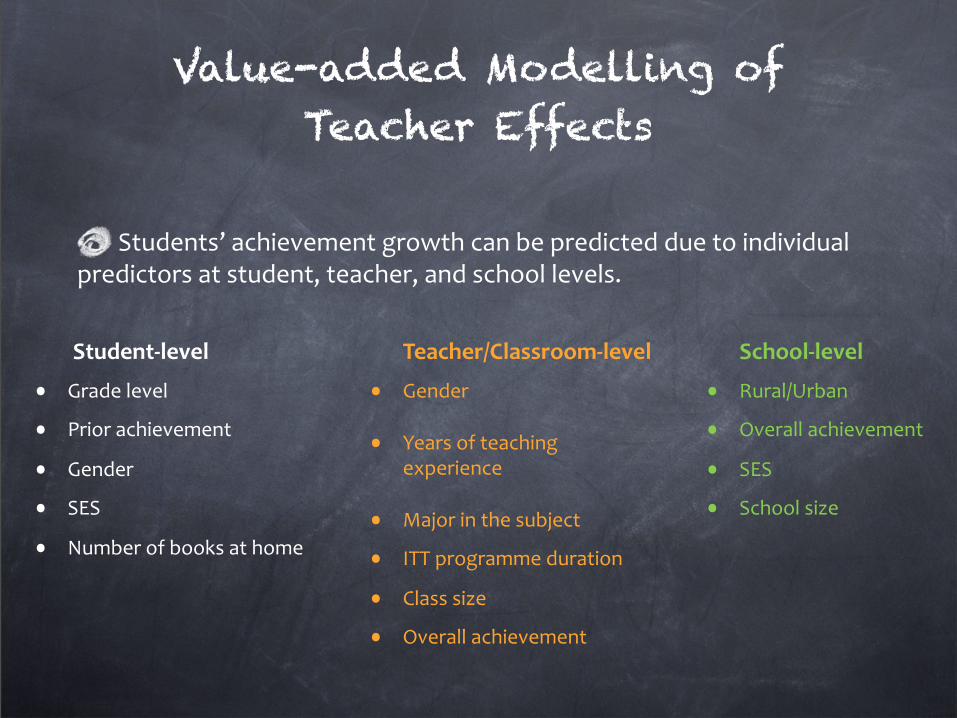
Student-‐level
• Grade level
• Prior achievement
• Gender
• SES
• Number of books at home
Teacher/Classroom-‐level
• Gender
• Years of teaching experience
• Major in the subject
• ITT programme duration
• Class size
• Overall achievement
School-‐level
• Rural/Urban
• Overall achievement
• SES
• School size
Students’ achievement growth can be predicted due to individual predictors at student, teacher, and school levels.
Value-added Modelling of Teacher Effects

Challenges Decentralised data administration:
Different timings and agendas across institutions.
Different procedures for getting access across institutions.
Different data format, coding and quality across institutions
and waves of data collection.
It is necessary to consider these issues in the project time-‐table.
and to develop a good recording system of methodological decisions
(e.g. syntax files and research diaries).

Challenges Restriction on variables available:
‘Process’ variables are not commonly found in secondary data.
(Teddlie and Reynolds, 2000)
ProcessProductOutput
Input
Context
It is necessary to complement with other sources of data (e.g.
video-‐archive of the National Teacher Evaluation System).

THANK YOU!

References
Carter, J, Noble, S, Russell, A & Swanson, E (2011) Developing statistical literacy using real-‐world data: investigating socioeconomic secondary data resources used in research and teaching, International Journal of Research & Method in Education, 34:3, 223-‐240
Dale, A., Arber, S. and Procter, M. (1988) Doing Secondary Analysis (London, Unwin Hyman).
Glaser, B.G. (1963) Retreading research materials: the use of secondary analysis by the independent researcher, The American Behavioural Scientist, 6 (10), 11–14.
Gorard, S 2003, Quantitative Methods in Social Science Research, Continuum, London.
Hakim, C. (1982) Secondary analysis and the relationship between official and academic social research, Sociology, 16 (1), 12–28.
Smith, E. (2008) Pitfalls and Promises: The Use of Secondary Data Analysis in Educational Research, British Journal of Educational Studies, vol. 56, no. 3, pp. 323–339.
Yorke, M (2011) Analysing existing datasets: some considerations arising from practical experience, International Journal of Research & Method in Education, 34:3, 255-‐267.