CEO compensation and incentives: Evidence from M&A ...
25
Journal of Financial Economics 73 (2004) 119–143 CEO compensation and incentives: Evidence from M&A bonuses $ Yaniv Grinstein*, Paul Hribar Johnson Graduate School of Management, Cornell University, Ithaca, NY 14853, USA Received 25 February 2003; accepted 30 June 2003 Abstract We investigate CEO compensation for completing M&A deals. We find that CEOs who have more power to influence board decisions receive significantly larger bonuses. We also find a positive relation between bonus compensation and measures of effort, but not between bonus compensation and deal performance. CEOs with more power also tend to engage in larger deals relative to the size of their own firms, and the market responds more negatively to their acquisition announcements. Our evidence is consistent with the argument that managerial power is the primary driver of M&A bonuses. r 2004 Elsevier B.V. All rights reserved. JEL classification: G34; J33 Keywords: CEO Compensation; Mergers and acquisitions 1. Introduction Anecdotal evidence suggests that some CEOs receive lucrative compensation packages for acquiring other firms. For example, in large recent merger and acquisition (M&A) deals, Exxon, HealthSouth, Bankers’ Trust, and Travelers ARTICLE IN PRESS $ We gratefully acknowledge the insightful comments and suggestions made by an anonymous referee, Warren Bailey, Lucian Bebchuk, Eli Berkovitch, Ronen Israel, Charles Lee, Roni Michaely, Derek Oler, Oded Sarig, Laura Starks, Bhaskaran Swaminathan, Avi Wohl, Amir Ziv, and seminar participants at Cornell University, IDC, and Tel-Aviv University. We thank Greg Austic for excellent research assistance. *Corresponding author. Cornell University, Johnson Graduate School of Management, Ithaca, NY 14853, USA. Tel.: +1-607-255-8686; fax: +1-607-254-4590. E-mail address: [email protected] (Y. Grinstein). 0304-405X/$ - see front matter r 2004 Elsevier B.V. All rights reserved. doi:10.1016/j.jfineco.2003.06.002
-
Upload
khangminh22 -
Category
Documents
-
view
0 -
download
0
Transcript of CEO compensation and incentives: Evidence from M&A ...

Journal of Financial Economics 73 (2004) 119–143
CEO compensation and incentives: Evidencefrom M&A bonuses$
Yaniv Grinstein*, Paul Hribar
Johnson Graduate School of Management, Cornell University, Ithaca, NY 14853, USA
Received 25 February 2003; accepted 30 June 2003
Abstract
We investigate CEO compensation for completing M&A deals. We find that CEOs who
have more power to influence board decisions receive significantly larger bonuses. We also find
a positive relation between bonus compensation and measures of effort, but not between
bonus compensation and deal performance. CEOs with more power also tend to engage in
larger deals relative to the size of their own firms, and the market responds more negatively to
their acquisition announcements. Our evidence is consistent with the argument that
managerial power is the primary driver of M&A bonuses.
r 2004 Elsevier B.V. All rights reserved.
JEL classification: G34; J33
Keywords: CEO Compensation; Mergers and acquisitions
1. Introduction
Anecdotal evidence suggests that some CEOs receive lucrative compensationpackages for acquiring other firms. For example, in large recent merger andacquisition (M&A) deals, Exxon, HealthSouth, Bankers’ Trust, and Travelers
ARTICLE IN PRESS
$We gratefully acknowledge the insightful comments and suggestions made by an anonymous referee,
Warren Bailey, Lucian Bebchuk, Eli Berkovitch, Ronen Israel, Charles Lee, Roni Michaely, Derek Oler,
Oded Sarig, Laura Starks, Bhaskaran Swaminathan, Avi Wohl, Amir Ziv, and seminar participants at
Cornell University, IDC, and Tel-Aviv University. We thank Greg Austic for excellent research assistance.
*Corresponding author. Cornell University, Johnson Graduate School of Management, Ithaca, NY
14853, USA. Tel.: +1-607-255-8686; fax: +1-607-254-4590.
E-mail address: [email protected] (Y. Grinstein).
0304-405X/$ - see front matter r 2004 Elsevier B.V. All rights reserved.
doi:10.1016/j.jfineco.2003.06.002

Group paid their CEOs cash bonuses of $5 million to $14 million dollars for thesuccessful completion of M&A deals.
In spite of these large compensation packages, prior research shows thatshareholders of acquiring firms do not typically profit from these deals. Forexample, Jensen and Ruback (1983) cite studies that find no positive announcementreturns to acquiring firms in merger deals. More recently, Moeller et al. (2003) reportsubstantial negative announcement returns and substantial losses to large acquiringfirms, especially for acquisitions occurring after 1997. Several studies also show anegative drift in the price of the acquiring firm several years after the acquisition(see e.g., Jensen and Ruback, 1983; Agrawal et al., 1992; Loughran and Vijh, 1997;Kohers and Kohers, 2001).
The apparent misalignment between compensation and outcomes warrants acloser look at the practice of paying CEOs for M&A deals. In this paper, we provideadditional insights with respect to the determinants of M&A compensation byaddressing the following questions. First, how common is the practice of providingM&A compensation? Second, to what extent is M&A compensation paid to alignCEO incentives with value maximization? Third, to what extent does managerialpower affect CEO compensation related to M&A deals? To the extent that M&Acompensation packages are associated with self-serving behavior, the costs of thesepackages can be substantial, as CEOs who acquire other firms because of the rentsthey can extract from the deals will not necessarily choose value-maximizing deals.
We address these questions by examining compensation related to 327 large M&Adeals in the U.S. between 1993 and 1999. We analyze the determinants of thecompensation level, and explore how measures of effort, skill, performance, andmanagerial power explain the cross-sectional variation in the bonus.
We find that 39% of the acquiring firms in our sample cite the completion of thedeal as a reason for rewarding their CEOs. In almost all of these cases, the paymentis given in the form of a cash bonus. Our cross-sectional analysis suggests thatmeasures of CEO effort and skill in forming the deal explain part of the variationin the level of the M&A bonus — bonuses are larger when the deals are larger, whenthe deals take longer to complete, and when there are more board meetings duringthe acquisition year.
Measures of performance, such as the market reaction to the announcement of thedeal or the premium paid for the target, do not explain the cross-sectional variationin the compensation. In fact, we find some evidence that such measures arenegatively related to the amount of the bonus awarded. In contrast, measures ofmanagerial power add significantly to the explanatory power of the variation in thebonus. For example, within the sample of firms that state that they give M&Abonuses, CEOs on the nominating committee receive, on average, an additional$1.408 million for deal completion. Moreover, CEOs who are also heads of theirboards, receive an additional $1.447 million. We also find that the two-dayannouncement period return of firms whose CEOs have the highest power is �3.8%,approximately three times lower than the abnormal return of the rest of theacquiring firms, which suggests that the deals undertaken by CEOs with significantpower are received more negatively by the market.
ARTICLE IN PRESSY. Grinstein, P. Hribar / Journal of Financial Economics 73 (2004) 119–143120
Finally, we find that compensation committee reports typically do not providemuch information relating to the reasons behind the payment of M&A bonuses, inspite of SEC requirements that companies report such information. Out of the 125firms who cite the completion of the deal as a reason for the bonus, only 64 firms(51%) provide more detailed explanation. In those firms, we find that the mostfrequent motivation for the M&A bonus is the resulting increase in firm size andrevenues (36 firms), followed by CEO effort and skill (27 firms). Only 22 firms arguethat value enhancement is a reason for the bonus.
The results of our tests indicate that measures of effort and skill explain only asmall part of the variation in bonus. Although deal size explains a large part ofcompensation, it is unclear whether this metric captures only effort and skill. Forexample, when comparing deal size across CEOs with different managerial power,we find that CEOs with the highest managerial power have the highest size ratio oftarget to acquirer. This evidence is consistent with previous arguments (e.g. Jensen,1986) that the propensity to increase size is itself a function of agency. Furthermore,compensation does not appear to increase with deal performance, and, compensa-tion committees rarely consider this dimension when awarding bonuses. Finally,managerial power explains a large part of the variation in compensation.
We interpret our results as consistent with the argument that M&A bonuses arepositively related to managerial power: managers who have more board power arelikely to get substantially higher bonuses, to engage in larger deals, and to havesubstantially smaller announcement returns.
This study contributes to the empirical literature that examines the relationbetween CEO compensation and M&A deals. Denis et al. (1997) and Datta et al.(2001) look at CEO compensation and ownership structures before M&A deals, andshow that increased insider ownership and equity-based compensation improve long-run post-acquisition performance. Bliss and Rosen (2001) show that CEOcompensation typically increases after bank mergers even if the acquirer’s stockprice declines. Rose and Shepard (1997) show that diversified firms tend to havehigher CEO compensation, although the difference appears to be due to managerialability. Unlike our study, these studies do not examine the compensation paid to theCEO for completing the deal. In contrast, Hartzel et al. (2001) do examinecompensation specifically related to acquisitions; however, they examine thecompensation of the CEO of the target firm, rather than that of the acquiring CEO.
Our paper also contributes to the literature that examines the relation betweenCEO compensation and CEO board power. Hallock (1997) looks at compensationof CEOs of large corporations in 1992 and finds that when there is an interlockingboard relation, the CEO receives greater compensation. Core et al. (1999) look atcompensation contracts of CEOs of large firms between 1982 and 1984 and find thatCEOs that are heads of their boards receive larger compensation. They also find thatthe reward is larger when a CEO has more influence over the selection of the boardmembers. Cyert et al. (2002) find that CEOs that are heads of their boards receivehigher compensation, and that compensation committees with higher equity stakestend to reduce the non-salary compensation awarded to the CEO. None of thesepapers considers incentive compensation related to M&A deals.
ARTICLE IN PRESSY. Grinstein, P. Hribar / Journal of Financial Economics 73 (2004) 119–143 121
The paper proceeds as follows. In Section 2 we provide the hypotheses. In Section3 we discuss our sample selection and variable measurement. In Section 4 we presentthe empirical results, including a cross-sectional analysis and a detailed analysis ofthe compensation committee reports. Section 5 concludes.
2. Hypotheses
In large public corporations, the board of directors is in charge of compensatingthe CEO. The traditional view is that the board offers the CEO a compensationcontract that maximizes shareholder value. The level of compensation depends bothon supply and demand in the labor market for CEOs and on the effort level thatCEOs exert in managing the firm. Therefore, a CEO whose skills are in short supplyor who is required to exert higher effort is paid more for his or her services.
Work by Mirrlees (1974, 1976), Holmstrom (1979), Grossman and Hart (1983),and others all show how to account for the moral hazard problem when designingthe compensation contract. In Holmstrom’s ‘‘hidden action’’ model, the agent(CEO) is required to perform a series of tasks to maximize the utility of the investors;however, the CEO’s tasks are unobservable to the investors and the CEO preferstasks that do not maximize investors’ wealth. In this context, the CEO should receivehigher compensation if the tasks require greater skill or if the CEO has to workharder, but since the board does not fully observe the tasks, it should alignmanagerial incentives by tying CEO compensation to observable outcome variablesthat are correlated with CEOs tasks. Compensation should therefore be based onobservable measures of tasks that maximize value, such as market returns orprofitability ratios.
In contrast to the above traditional view, a second view, the ‘‘managerial power’’approach, argues that CEOs have the power to influence board decisions includingcompensation decisions, and that compensation contracts do not necessarilymaximize shareholder wealth. This argument is consistent with empirical evidenceabout suboptimal CEO compensation contracts. For example: Blanchard et al.(1994) find that when companies receive a cash windfall, (i.e., cash that has nothingto do with firm performance), they increase the compensation to their CEOs;Yermack (1995) finds that stock options are not awarded optimally; and Yermack(1997) provides evidence consistent with the interpretation that CEOs time theirstock option awards just before favorable corporate news.
There are several reasons to believe that CEOs influence board decisions.Shivdasani and Yermack (1999) provide evidence that CEOs have the power toaffect the selection of directors. Jensen (1993), Bebchuk et al. (2002), and Bebchukand Fried (2003) argue that CEOs control the information that the board has aboutthe company because they determine the board meeting agenda and the informationgiven to the board, especially if they are the chairmen of their own boards. Theseauthors also argue that CEOs discourage board members who disagree with themfrom serving on the board, and that board members often hold a small amount ofstock in the company and therefore have little incentives to monitor.
ARTICLE IN PRESSY. Grinstein, P. Hribar / Journal of Financial Economics 73 (2004) 119–143122

Bebchuk et al. (2002) and Bebchuk and Fried (2003) formally tie managerialpower to CEO compensation. They argue that CEOs who have more power willextract more rent in the form of compensation. They also argue that the likelihood ofadopting a compensation arrangement that is favorable to executives but suboptimalfor shareholders will depend not only on the power that the CEO has, but also onhow the arrangement is perceived by shareholders. If the shareholders perceive thearrangement as a blunt expropriation, they are likely to act against it. This argumentimplies that CEOs that want to maximize rent extraction might try to find justifiablereasons for their compensation. A merger or acquisition could provide such ajustification — a manager who acquires another company spends extra time andeffort in constructing the deal, and thus the manager can use this task as ajustification for additional compensation.
Given these two differing views of managerial compensation, our objective is toexamine the extent to which the compensation related to M&A deals is consistentwith either the traditional view or with managerial power. Although we recognizethat these are not mutually exclusive alternatives, our goal is to learn the extent towhich each of these theories is consistent with cross-sectional variation in M&Acompensation.
According to the traditional view, there should be a positive correlation acrossacquiring firms between measures of deal complexity or measures of CEO effort inconstructing the deal and the level of deal compensation. Moreover, given the moralhazard problem, we should observe a positive correlation between observablemeasures of the success of the deal and the level of compensation. Under themanagerial power approach, there should be a positive correlation between the levelof compensation and the level of managerial power in the firm; managerial skilland performance should play a secondary role in explaining the variability incompensation.
3. Data description and variables
3.1. Data description
We identify mergers or acquisitions in the U.S. between 1993 and 1999 from theSDC database. We choose deals such that the value of the transaction is $1 billion orlarger, and the entities involved are public U.S. companies. Our sample is limited tolarge transactions because they represent economically significant events and aremore likely to directly affect managerial compensation. We examine only publiccompanies because of data availability. Deal related information is obtained fromthe SDC database, financial statement information is obtained from the Compustatdatabase, and returns data are obtained from the CRSP database.
We extract CEO compensation data for every acquiring CEO from theExecucomp database. Execucomp lists CEO compensation since 1993 for everyS&P 500, S&P MidCap 400, and S&P SmallCap 600 firms, and for other firms thatare not currently included in the indices, but once were. We eliminate any sample
ARTICLE IN PRESSY. Grinstein, P. Hribar / Journal of Financial Economics 73 (2004) 119–143 123
firms for which we are unable to obtain compensation information, which results in asample of 327 M&A deals.
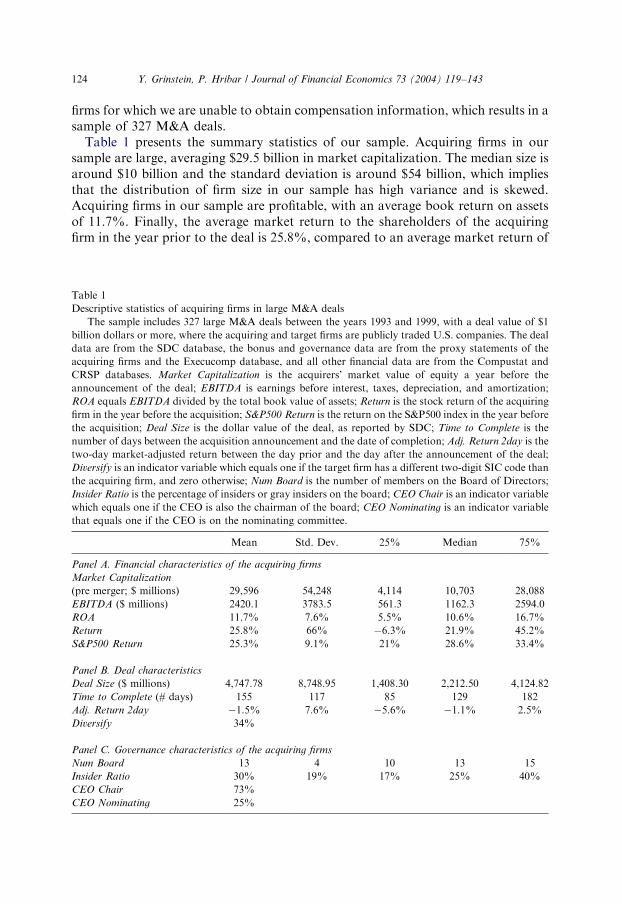
Table 1 presents the summary statistics of our sample. Acquiring firms in oursample are large, averaging $29.5 billion in market capitalization. The median size isaround $10 billion and the standard deviation is around $54 billion, which impliesthat the distribution of firm size in our sample has high variance and is skewed.Acquiring firms in our sample are profitable, with an average book return on assetsof 11.7%. Finally, the average market return to the shareholders of the acquiringfirm in the year prior to the deal is 25.8%, compared to an average market return of
ARTICLE IN PRESS
Table 1
Descriptive statistics of acquiring firms in large M&A deals
The sample includes 327 large M&A deals between the years 1993 and 1999, with a deal value of $1
billion dollars or more, where the acquiring and target firms are publicly traded U.S. companies. The deal
data are from the SDC database, the bonus and governance data are from the proxy statements of the
acquiring firms and the Execucomp database, and all other financial data are from the Compustat and
CRSP databases. Market Capitalization is the acquirers’ market value of equity a year before the
announcement of the deal; EBITDA is earnings before interest, taxes, depreciation, and amortization;
ROA equals EBITDA divided by the total book value of assets; Return is the stock return of the acquiring
firm in the year before the acquisition; S&P500 Return is the return on the S&P500 index in the year before
the acquisition; Deal Size is the dollar value of the deal, as reported by SDC; Time to Complete is the
number of days between the acquisition announcement and the date of completion; Adj. Return 2day is the
two-day market-adjusted return between the day prior and the day after the announcement of the deal;
Diversify is an indicator variable which equals one if the target firm has a different two-digit SIC code than
the acquiring firm, and zero otherwise; Num Board is the number of members on the Board of Directors;
Insider Ratio is the percentage of insiders or gray insiders on the board; CEO Chair is an indicator variable
which equals one if the CEO is also the chairman of the board; CEO Nominating is an indicator variable
that equals one if the CEO is on the nominating committee.
Mean Std. Dev. 25% Median 75%
Panel A. Financial characteristics of the acquiring firms
Market Capitalization
(pre merger; $ millions) 29,596 54,248 4,114 10,703 28,088
EBITDA ($ millions) 2420.1 3783.5 561.3 1162.3 2594.0
ROA 11.7% 7.6% 5.5% 10.6% 16.7%
Return 25.8% 66% �6.3% 21.9% 45.2%
S&P500 Return 25.3% 9.1% 21% 28.6% 33.4%
Panel B. Deal characteristics
Deal Size ($ millions) 4,747.78 8,748.95 1,408.30 2,212.50 4,124.82
Time to Complete (# days) 155 117 85 129 182
Adj. Return 2day �1.5% 7.6% �5.6% �1.1% 2.5%
Diversify 34%
Panel C. Governance characteristics of the acquiring firms
Num Board 13 4 10 13 15
Insider Ratio 30% 19% 17% 25% 40%
CEO Chair 73%
CEO Nominating 25%
Y. Grinstein, P. Hribar / Journal of Financial Economics 73 (2004) 119–143124

25.3% on the S&P 500 during that period. This evidence suggests that, on average,the acquiring firms do not perform significantly better than the market in the yearprior to the acquisition.
Panel B of Table 1 shows deal characteristics in our sample. The average dealvalue in our sample is $4.747 billion. The median deal value is $2.212 billion. Thelarge difference between these two metrics suggests that the data is skewed by severalparticularly large deals.1 From the day the deal is announced, it takes an average ofabout five months (155 days) to complete it and more than 75% of the firmscomplete the deal within six months.
The market tends to react negatively to the M&A announcement. The two-daymarket-adjusted return surrounding deal announcement is �1.5%, with 50% of thefirms experiencing a negative announcement effect of more than 1%. The lowannouncement effect is consistent with earlier research (Jensen and Ruback, 1983;Moeller et al., 2003). However, the large standard deviation suggests that theannouncement effect of some of the deals is quite large. Most of the acquiringfirms buy companies from the same line of business, (i.e., firms with the same two-digit SIC code). Only 34% of the acquiring firms in our sample buy entities fromother industries.
Panel C of Table 1 describes corporate governance characteristics of the acquiringfirms. The average number of board members is 13 members, where 30% of themembers are ‘‘insiders’’, either employees or former employees of the company, or,directors who declare in the proxy statement that they have a work affiliation withthe company (also known as ‘‘gray outsiders’’). In 73% of the acquiring firms, theCEO is also the chairman of the board. In 25% of the acquiring firms, the CEO is amember of the nominating committee, the committee that proposes new boardmembers. The governance characteristics in our sample are therefore relativelysimilar to those of the S&P 500 as reported in previous studies. For example,Shivdasani and Yermack (1999) report that for 1994, an average of 11.4 directors areon the board, 32.5% of CEOs are on the nominating committees, and 83.6% ofCEOs head their boards, while Klein (2002) reports that 59% of directors areindependent during the years 1992 and 1993.
3.2. CEO compensation related to mergers and acquisitions
For each of the acquiring firms in our sample, we read the proxy statements beforeand after the deal,2 which allows us to identify which components of CEOcompensation are directly associated with the deal, and to identify governancevariables in the acquiring firms. In 129 cases (39%), the compensation committee
ARTICLE IN PRESS
1 For example, the Exxon-Mobil merger has a deal value of $78.9 billion. Although we explicitly control
for size and heteroskedasticity in the regression tests, all findings are robust to excluding the five largest
deals from the analysis, each of which are greater than $40 billion.2 SEC regulation S-K (item 402 executive compensation section K), states that, at the end of every fiscal
year, firms must disclose their compensation policies with respect to the manager , and provide a specific
discussion describing each measure of the firm performance, whether qualitative or quantitative, on which
managerial compensation is based.
Y. Grinstein, P. Hribar / Journal of Financial Economics 73 (2004) 119–143 125
cites the completion of the deal as a reason for providing compensation. In almost allof these cases, the form of compensation is a cash bonus.3 Therefore, we focus ouranalysis on the bonus component.
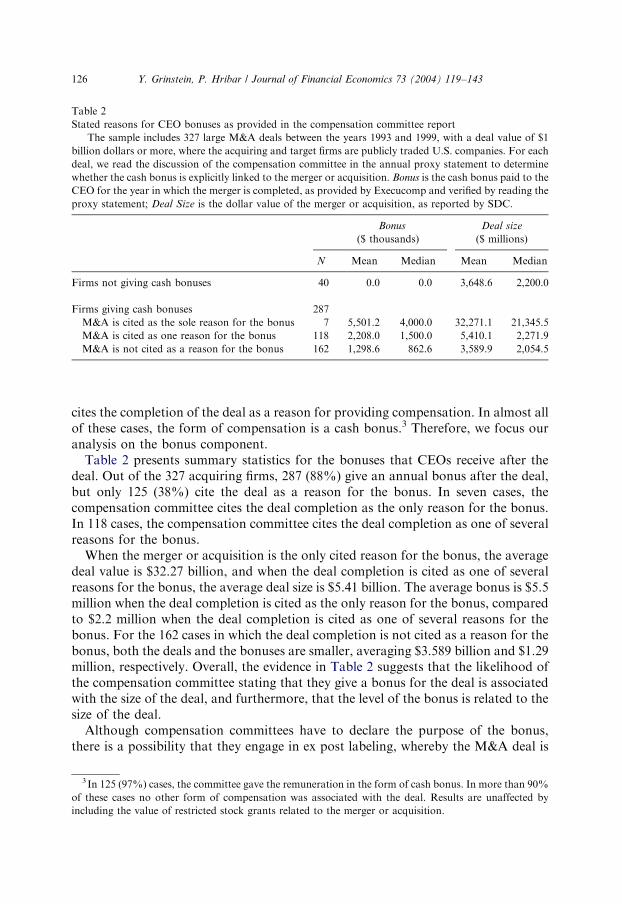
Table 2 presents summary statistics for the bonuses that CEOs receive after thedeal. Out of the 327 acquiring firms, 287 (88%) give an annual bonus after the deal,but only 125 (38%) cite the deal as a reason for the bonus. In seven cases, thecompensation committee cites the deal completion as the only reason for the bonus.In 118 cases, the compensation committee cites the deal completion as one of severalreasons for the bonus.
When the merger or acquisition is the only cited reason for the bonus, the averagedeal value is $32.27 billion, and when the deal completion is cited as one of severalreasons for the bonus, the average deal size is $5.41 billion. The average bonus is $5.5million when the deal completion is cited as the only reason for the bonus, comparedto $2.2 million when the deal completion is cited as one of several reasons for thebonus. For the 162 cases in which the deal completion is not cited as a reason for thebonus, both the deals and the bonuses are smaller, averaging $3.589 billion and $1.29million, respectively. Overall, the evidence in Table 2 suggests that the likelihood ofthe compensation committee stating that they give a bonus for the deal is associatedwith the size of the deal, and furthermore, that the level of the bonus is related to thesize of the deal.
Although compensation committees have to declare the purpose of the bonus,there is a possibility that they engage in ex post labeling, whereby the M&A deal is
ARTICLE IN PRESS
Table 2
Stated reasons for CEO bonuses as provided in the compensation committee report
The sample includes 327 large M&A deals between the years 1993 and 1999, with a deal value of $1
billion dollars or more, where the acquiring and target firms are publicly traded U.S. companies. For each
deal, we read the discussion of the compensation committee in the annual proxy statement to determine
whether the cash bonus is explicitly linked to the merger or acquisition. Bonus is the cash bonus paid to the
CEO for the year in which the merger is completed, as provided by Execucomp and verified by reading the
proxy statement; Deal Size is the dollar value of the merger or acquisition, as reported by SDC.
Bonus Deal size
($ thousands) ($ millions)
N Mean Median Mean Median
Firms not giving cash bonuses 40 0.0 0.0 3,648.6 2,200.0
Firms giving cash bonuses 287
M&A is cited as the sole reason for the bonus 7 5,501.2 4,000.0 32,271.1 21,345.5
M&A is cited as one reason for the bonus 118 2,208.0 1,500.0 5,410.1 2,271.9
M&A is not cited as a reason for the bonus 162 1,298.6 862.6 3,589.9 2,054.5
3 In 125 (97%) cases, the committee gave the remuneration in the form of cash bonus. In more than 90%
of these cases no other form of compensation was associated with the deal. Results are unaffected by
including the value of restricted stock grants related to the merger or acquisition.
Y. Grinstein, P. Hribar / Journal of Financial Economics 73 (2004) 119–143126

simply used as a reason for giving a bonus that would have been given regardless ofthe deal. Since we are interested in bonuses paid explicitly for mergers oracquisitions, our first set of analyses examines whether M&A bonuses actuallyrepresent additional compensation to CEOs. We begin by estimating the followingregression model using the entire Execucomp sample:
Bonusit ¼ a0 þ a1Sizeit þ a2ROAit þ a3ROAGrowthit þ a4Returnit
þ a5SalesGrowthit þ a6Marginit þ a7MarginGrowthit
þ a8AcquisitionDummyit þ ui þ ot þ eit: ð1Þ
The dependent variable in Eq. (1) is the bonus that the CEO of firm i receives atthe end of year t. The right-hand side consists of performance and control variables:Size is the firm size as measured by the book value of assets; ROA is earnings beforeinterest, depreciation, and amortization, divided by total book assets; ROA Growth
is the percentage growth in ROA relative to previous year; Return is the stock returnof the firm; Margin is the earnings before interest depreciation and amortizationdivided by sales; Margin Growth is the percentage growth in Margin from previousyear; and, Acquisition Dummy is an indicator variable that equals one if the firmacquired another firm during the year and the deal is worth $1 billion or more. Wealso include firm-specific and time-specific fixed effects to control for differences inthe average bonus across firms and over time. If firms pay bonuses to their CEOs foracquiring other firms, then the coefficient of Acquisition Dummy should be positiveand significant. If this were not the case, we might suspect that the declarations ofcompensation committees do not truly reflect compensation that is related to theacquisition.
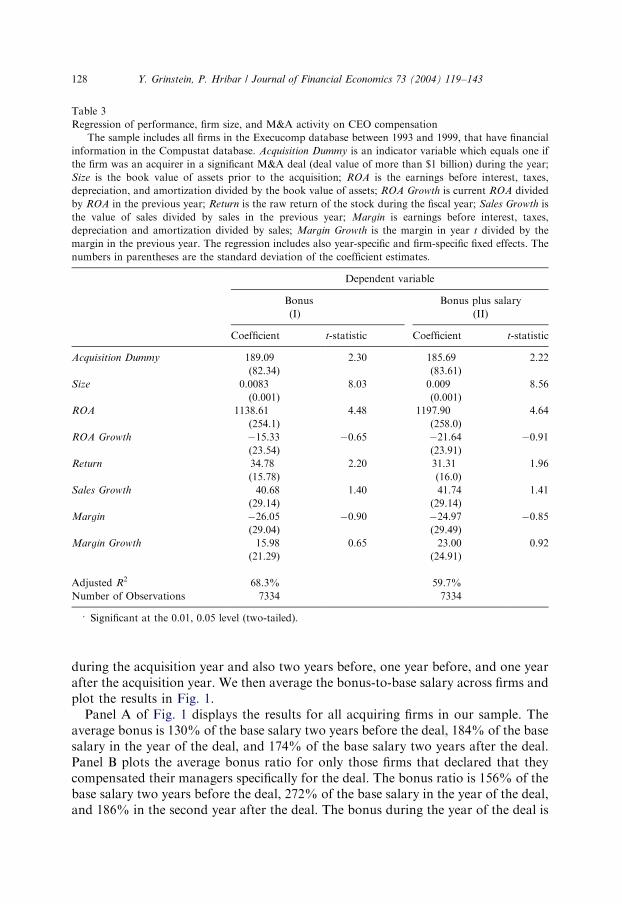
The results in Table 3 column I show that the coefficient of Acquisition Dummy
is positive and significant. This result suggests that firms pay higher bonusesfor acquisitions even after controlling for measures of performance and fixedeffects. Consistent with the prior literature, we also find significant effects for Size,ROA and Return.
To make sure that we do not capture a substitution effect between bonuses andother forms of compensation, such as salary or options, we rerun our regression andlet the dependent variable be bonuses-plus-salary. If there is a substitution effect weshould not find a positive relation between bonuses plus salary and the acquisitionyear dummy. The results in Table 3 column II show that the coefficient of theAcquisition Dummy variable is significant and positive, suggesting no substitution.We also estimate the regression in (1) using only salary, and only other forms ofcompensation (not shown). In both cases the coefficient of the Acquisition Dummy
variable is not significantly different from zero. This result reaffirms the assertion ofthe compensation committees that they give compensation for the acquisition mainlyin the form of bonuses.
To illustrate the acquisition effect on CEO bonus, we plot the bonus-to-base-salary ratio in acquisition and nonacquisition years for our sample of acquiringfirms. For each CEO in our sample, we compute the average base salary between1993 and 1999. Based on that value, we compute the bonus-to-base-salary ratio
ARTICLE IN PRESSY. Grinstein, P. Hribar / Journal of Financial Economics 73 (2004) 119–143 127
during the acquisition year and also two years before, one year before, and one yearafter the acquisition year. We then average the bonus-to-base salary across firms andplot the results in Fig. 1.
Panel A of Fig. 1 displays the results for all acquiring firms in our sample. Theaverage bonus is 130% of the base salary two years before the deal, 184% of the basesalary in the year of the deal, and 174% of the base salary two years after the deal.Panel B plots the average bonus ratio for only those firms that declared that theycompensated their managers specifically for the deal. The bonus ratio is 156% of thebase salary two years before the deal, 272% of the base salary in the year of the deal,and 186% in the second year after the deal. The bonus during the year of the deal is
ARTICLE IN PRESS
Table 3
Regression of performance, firm size, and M&A activity on CEO compensation
The sample includes all firms in the Execucomp database between 1993 and 1999, that have financial
information in the Compustat database. Acquisition Dummy is an indicator variable which equals one if
the firm was an acquirer in a significant M&A deal (deal value of more than $1 billion) during the year;
Size is the book value of assets prior to the acquisition; ROA is the earnings before interest, taxes,
depreciation, and amortization divided by the book value of assets; ROA Growth is current ROA divided
by ROA in the previous year; Return is the raw return of the stock during the fiscal year; Sales Growth is
the value of sales divided by sales in the previous year; Margin is earnings before interest, taxes,
depreciation and amortization divided by sales; Margin Growth is the margin in year t divided by the
margin in the previous year. The regression includes also year-specific and firm-specific fixed effects. The
numbers in parentheses are the standard deviation of the coefficient estimates.
Dependent variable
Bonus Bonus plus salary
(I) (II)
Coefficient t-statistic Coefficient t-statistic
Acquisition Dummy 189.09� 2.30 185.69� 2.22
(82.34) (83.61)
Size 0.0083�� 8.03 0.009�� 8.56
(0.001) (0.001)
ROA 1138.61�� 4.48 1197.90�� 4.64
(254.1) (258.0)
ROA Growth �15.33 �0.65 �21.64 �0.91
(23.54) (23.91)
Return 34.78� 2.20 31.31� 1.96
(15.78) (16.0)
Sales Growth 40.68 1.40 41.74 1.41
(29.14) (29.14)
Margin �26.05 �0.90 �24.97 �0.85
(29.04) (29.49)
Margin Growth 15.98 0.65 23.00 0.92
(21.29) (24.91)
Adjusted R2 68.3% 59.7%
Number of Observations 7334 7334
��,�Significant at the 0.01, 0.05 level (two-tailed).
Y. Grinstein, P. Hribar / Journal of Financial Economics 73 (2004) 119–143128

significantly higher than the bonus two years before or two years after the deal, at the5% level of significance.
To get a sense of how acquisition bonuses change over time, we display in Fig. 2the average bonus paid to the CEOs during the acquisition years for the years 1993to 1999. We also plot the average bonus paid to the firms in our sample in thenonacquisition years. Panel A shows that the average bonus in the acquisition years
ARTICLE IN PRESS
0
0.5
1
1.5
2
2.5
3
t-2 t-1 t t+1 t+2
Year relative to merger
Bon
us d
ivid
ed b
y av
erag
e sa
lary
0
0.5
1
1.5
2
2.5
3
t-2 t-1 t t+1 t+2
Year relative to merger
Bon
us d
ivid
ed b
y av
erag
e sa
lary
Panel A: All firms in the sample
Panel B: Firms whose board cite the deal as a reason for the bonus
Fig. 1. Magnitude of CEO bonuses as a percentage of their average base salary. For each acquiring firm
we identify the bonuses that the CEO receives two years before the deal (t�2) to two years after the deal
(t+2), and we divide the bonuses by the average base salary of that CEO. We then average the bonus-to-
base-salary ratio for the firms in the sample and plot the results. Panel A shows the results for all 327 firms
in the sample. Panel B shows the results for the sample of 125 firms whose compensation committees
report that they pay the bonus in year t for completing the deal. The sample includes large M&A deals
between the years 1993 and 1999, with a deal value of $1 billion dollars or more, where the acquiring and
target firms are publicly traded U.S. companies.
Y. Grinstein, P. Hribar / Journal of Financial Economics 73 (2004) 119–143 129
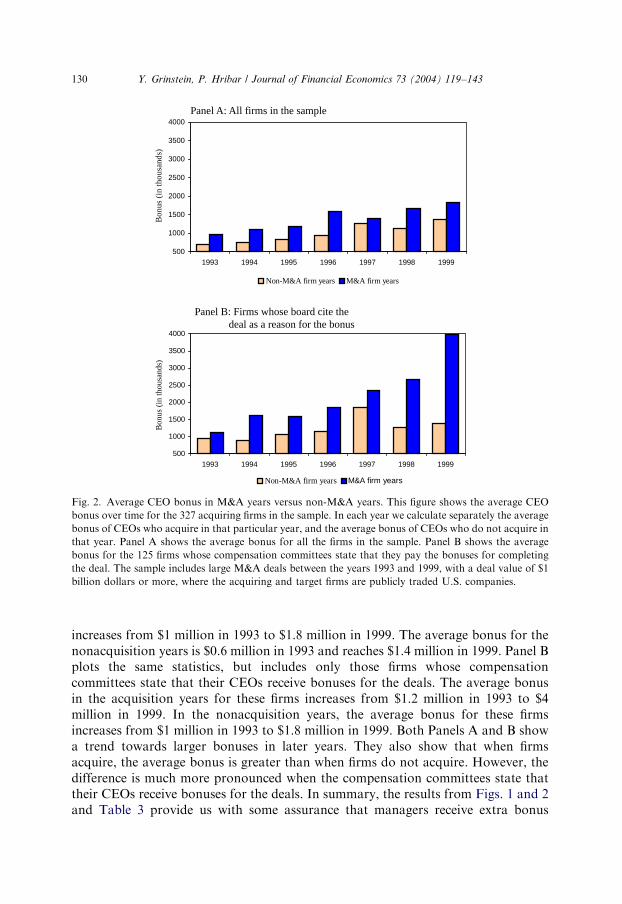
increases from $1 million in 1993 to $1.8 million in 1999. The average bonus for thenonacquisition years is $0.6 million in 1993 and reaches $1.4 million in 1999. Panel Bplots the same statistics, but includes only those firms whose compensationcommittees state that their CEOs receive bonuses for the deals. The average bonusin the acquisition years for these firms increases from $1.2 million in 1993 to $4million in 1999. In the nonacquisition years, the average bonus for these firmsincreases from $1 million in 1993 to $1.8 million in 1999. Both Panels A and B showa trend towards larger bonuses in later years. They also show that when firmsacquire, the average bonus is greater than when firms do not acquire. However, thedifference is much more pronounced when the compensation committees state thattheir CEOs receive bonuses for the deals. In summary, the results from Figs. 1 and 2and Table 3 provide us with some assurance that managers receive extra bonus
ARTICLE IN PRESS
500
1000
1500
2000
2500
3000
3500
4000
1993 1994 1995 1996 1997 1998 1999
Bon
us (
in th
ousa
nds)
Non-M&A firm years M&A firm years
500
1000
1500
2000
2500
3000
3500
4000
1993 1994 1995 1996 1997 1998 1999
Bon
us (
in th
ousa
nds)
Non-M&A firm years M&A firm years
Panel A: All firms in the sample
Panel B: Firms whose board cite the deal as a reason for the bonus
Fig. 2. Average CEO bonus in M&A years versus non-M&A years. This figure shows the average CEO
bonus over time for the 327 acquiring firms in the sample. In each year we calculate separately the average
bonus of CEOs who acquire in that particular year, and the average bonus of CEOs who do not acquire in
that year. Panel A shows the average bonus for all the firms in the sample. Panel B shows the average
bonus for the 125 firms whose compensation committees state that they pay the bonuses for completing
the deal. The sample includes large M&A deals between the years 1993 and 1999, with a deal value of $1
billion dollars or more, where the acquiring and target firms are publicly traded U.S. companies.
Y. Grinstein, P. Hribar / Journal of Financial Economics 73 (2004) 119–143130

compensation for the M&A deal, and moreover, that boards are not simply engagingin ex post re-labeling.
3.3. Measuring effort, skill, performance, and managerial power
In order to examine the determinants of the M&A bonuses, we need to obtainmeasures of effort, skill, performance, and managerial power. We begin by definingseveral indirect measures of effort and skill. According to the traditional contractingview, CEOs receive higher M&A bonuses if they are required to exert more effortand if their tasks require more skill. To the extent that the effort in forming andcompleting the deal is not fully observable, the compensation should rely on indirectmeasures of effort, such as performance measures.
The first measure we use is the size of the deal, Deal Size, defined as the value ofthe deal and obtained from the SDC database. We expect that larger deals are morecomplex and thus require more effort and skill on the part of the CEO. We note,however, that larger deal size could also indicate managerial tendency to overinvest(Jensen, 1986) and therefore might also imply that the board does not monitormanagerial investment activity properly, and that the CEO has higher board power.The second measure for effort is the time it takes to complete the deal (Time to
Complete). We define this measure as the log of the difference between thecompletion date and the announcement date, as provided by SDC. The thirdmeasure is a dummy that equals one if the firm acquires a target from a differentindustry (Diversify). We define same-industry acquisition if the two-digit SIC codesof the acquirer and the target are the same. All else equal, we expect an acquisition ofa firm from a different industry to require less effort, since there are fewer synergiesand integration problems between the target and the acquirer.
We also include a measure of performance, because to the extent that directmeasures of effort are unobservable, contracting on performance can help mitigatethe moral hazard problem. Our measure of performance is the two-day abnormalreturn surrounding the announcement of the merger or acquisition (Adj. Return
2day). We use market-adjusted returns, where the S&P500 is used as the relevantmarket index. This variable is intended to capture the market’s assessment ofwhether the CEO has made a value enhancing acquisition decision.
Our third set of variables captures the amount of managerial power that the CEOpossesses. Consistent with Bebchuk et al. (2002) and Bebchuk and Fried (2003),managerial power is defined as the ability of the CEO to influence directors, andthereby affect the compensation decision. We use several variables to approximatethe level of managerial power, several of which have been used in the past (e.g.,Shivdasani and Yermack, 1999; Core et al., 1999). Our first measure is a dummyvariable that equals one if the manager is also the chairman of the board, and zerootherwise (CEO Chair). We expect that CEOs who also serve as chairs will be able toexert more influence over the board. Our second measure is a dummy variable thatequals one if the CEO is also a member of the nominating committee (CEO
Nominating). A CEO who is also a member of the nominating committee should bemore able to influence the selection of new directors, and directors whose selection
ARTICLE IN PRESSY. Grinstein, P. Hribar / Journal of Financial Economics 73 (2004) 119–143 131
was influenced by the CEO might feel compelled to reciprocate with respect toexecutive compensation (Bebchuk et al., 2002, 2003). Our third measure is the ratioof the number of insiders and ‘‘gray’’ directors (those who were once insiders, or thathave business relation with the firm) to total directors (Insider Ratio), where a higherproportion of insiders would be indicative of greater managerial power. We note,however, that there is mixed evidence on whether higher ratio of outside directors ismore effective (see Core et al. (1999) for a review of the literature). Our final measureof managerial power is the number of directors on the board (Num Board). Weexpect larger number of board members to be associated with less effective boardand higher managerial power (Jensen, 1993; Yermack, 1996).
4. Empirical results
4.1. Cross sectional analysis
To investigate the extent to which effort, skill and managerial power explain thelevel of the bonus, we use the following regression model:
Bonusi ¼ a0 þ a1Sizei þ a2Deal Sizei þ a3Adj:Return2dayi
þ a4Time to Completei þ a5Diversifyi þ a6ROAi þ a7Returni
þ a8CEO Chairi þ a9CEO Nominatingi þ a10Insider Ratioi
þ a11Num Boardi þ a12Heckmani þ ½Year Dummies�
þ ½Industry Dummies� þ ei: ð2Þ
Our dependent variable, Bonus, is intended to capture the award paid to the CEOthat is associated with the M&A deal. However, because this exact amount is notgiven in most cases, we use several estimation techniques to isolate the bonus relatedto the deal (see below). All measures of effort, performance, and managerial powerare as defined in the previous section. Our control variables are time and industryfixed effects, to control for the impact of both increasing bonuses over time (see, e.g.Fig. 1) and systematic differences in bonuses across industries, and Size, which is thebook value of the acquirers’ assets at the beginning of the acquisition year.
We initially run an ordinary least squares estimation of Eq. (2). However, a Whitetest rejects the null of homoskedasticity at the 5% level (w2=34.47, p-value=0.024).Further analysis suggests that as the size of the acquirer increases, the absolute valueof the error term also increases. Therefore, we normalize all variables by the bookvalue of assets of the acquirer to control for heteroskedasticity. This approach issuccessful, as we no longer reject the null of homoskedasticity after this adjustment.
Additionally, a potential selection bias exists in this regression because theacquiring firms are not chosen at random from the population of firms. Ifthe omitted variables that determine whether a firm will acquire another firm arecorrelated with those that determine the bonuses, then a simple regression will have aspecification error. To overcome this potential misspecification we use the Heckman(1979) correction. We first run a probit regression over the Execucomp firms to
ARTICLE IN PRESSY. Grinstein, P. Hribar / Journal of Financial Economics 73 (2004) 119–143132
model the probability that a firm will undertake a large acquisition. Our explanatoryvariables for the probit regression are pre-merger market to book ratio, cash toassets, debt to assets, ROA, revenue, an indicator variable for new economy firms,and indicator variables for whether the firm acquired another firm in the previousyear or the previous two years. We also include year dummies and industrydummies. All variables except ROA are significant at the 5% level.
We use the estimates from the probit regression to construct the Heckman
variable, which when added to Eq. (2), corrects for a potential correlation betweenthe error in the first-stage probit regression and the error term (e) in Eq. (2).
From the compensation committee reports we are able to distinguish firms thatpay M&A bonuses from those that do not. However, when the CEO is awarded abonus both for completing the M&A deal and for performance not related to thedeal, the compensation committee often does not isolate that part of the bonus thatis associated with the deal. In these cases we need to empirically separate the M&A-related bonus.
We use multiple specifications to isolate the bonus paid for the M&A deal. In thefirst specification, we assume that whenever the CEO is paid for both performanceand the deal, the portion of performance can be reasonably approximated by theCEO’s bonus in the year prior to the deal.4 Therefore, we subtract the previous-yearbonus from all bonuses paid for both performance and the deal, and use them as thedependent variable. The bonuses of firms that do not cite the deal as a reason for thebonus are set to zero. We report the results of this procedure in column I of Table 4.
In the second specification, we account for the portion of the bonus not associatedwith the deal by considering only those firms whose compensation committees statethat they paid the bonus in part because of the deal. This procedure reducesthe sample to 122 firms. For these firms, we assume that the bonus is paid only forthe deal, and we therefore use the entire bonus amount as the dependent variable.We present the results of this second specification in column II of Table 4.
In the third specification we use the full sample and the entire amount of thebonus, and also include additional explanatory variables designed to capturenonacquisition-related aspects of firm performance that might explain the bonus.Drawing from our results in Table 3, we include the firm’s return on assets (ROA),defined as earnings before interest, taxes, depreciation, and amortization divided bybook value of assets at the beginning of the year, and the firm’s stock return duringthe acquisition year (Return). We then divide the sample into three groups of firms,those that pay a bonus exclusively for the deal (group D), those that pay a bonusboth for the deal and for performance not related to the deal (group DP), and thosethat do not pay a bonus for the deal (group P). The performance variables notassociated with the deal are interacted with indicator variables for groups P and DP,because these are the only groups for which the bonus is related to firm performance.The deal-related variables are interacted with indicator variables for groups D andDP, because only these bonuses should be associated with deal characteristics. The
ARTICLE IN PRESS
4 If the firm also acquired in the previous year, we use the bonus from the most recent year in which there
was no acquisition.
Y. Grinstein, P. Hribar / Journal of Financial Economics 73 (2004) 119–143 133

ARTICLE IN PRESS
Table 4
Regression of merger bonus on measures of effort, skill, and managerial power
The sample includes M&A deals between 1993 and 1999 with a deal value of $1 billion dollars or more,
where the acquiring and target firms are publicly traded U.S. companies, with nonmissing data for all of
the regressors. We categorize the sample into three groups of firms: those that cite the deal as the sole
reason for the bonus (group D); those that cite the deal and other non-deal related factors as reasons for
the bonus (group DP); and those who do not cite the deal as a reason for the bonus (group P). In models
(I) and (II), the dependent variable is the estimated merger bonus, for which we use the entire bonus for
group D, normalize the bonus of group P to zero, and adjust the bonus of group DP by subtracting the
CEO’s prior-year bonus. Model (I) uses the full sample while model (II) uses only groups D and DP. In
model (III), the dependent variable is the entire amount of the bonus, and we use regressors to control for
the portion of the bonus related to performance. Model (IV) is the same as model (III), except that the
dependent variable is the total salary plus bonus. Independent variables are defined as follows: Size is the
book value of assets prior to the acquisition. Deal Size is the dollar value of the deal, as reported by SDC;
Adj. Return 2day is the two-day market-adjusted return for the day prior to and the day of the merger
announcement; Time to Complete is the log of the number of days between the deal announcement and the
date of completion; Diversify is an indicator variable which equals one if the target firm has a different
two-digit SIC code than the acquiring firm; ROA is the earnings before interest, taxes, depreciation, and
amortization divided by the book value of assets; Return is the raw return of the stock during the fiscal
year; CEO Chair is an indicator variable that equals one if the CEO is also the chairman of the board;
CEO Nominating is an indicator variable that equals one if the CEO is on the nominating committee;
Insider Ratio is the percentage of insiders or gray insiders on the board; Num Board is the number of
members on the Board of Directors; Heckman is the coefficient from the Heckman (1979) correction. The
regression also includes 6 year and 11 industry dummies. To eliminate heteroskedasticity, the regression is
normalized by the book value of assets.
(I) (II) (III) (IV)
Variable Coefficient t-stat Coefficient t-stat Coefficient t-stat Coefficient t-stat
Size �0.358 �1.38 �0.207 �1.41 �0.396� �1.49 �0.437�� �1.64(0.259) (0.147) (0.265) (0.266)
Deal Size 0.271�� 4.03 0.322�� 3.11 0.213�� 2.66 0.212�� 2.62(0.067) (0.103) (0.08) (0.081)
Adj. Return 2day �82.4�� �3.79 25.4 0.68 �51.1� �2.31 �42.4 �1.90(21.8) (37.5) (22.1) (22.3)
Time to Complete 205.6�� 4.19 1425.2�� 3.96 188.4�� 2.90 203.2�� 3.07(49) (360.1) (64.9) (66.2)
Diversify �845.5�� �3.57 �271.2 �0.64 �510.6 �1.71 �512.2 �1.58(236.9) (421.2) (298.1) (324.9)
ROA — — — — 1383.2 0.96 53.2 0.04(1435.5) (1501.7)
Return — — — — 86.2 1.59 82.7 1.52(54.2) (54.5)
CEO Chair 578.2� 1.98 1447.5�� 2.70 828.0�� 2.79 838.0�� 2.72(292.8) (535.4) (296.7) (308.2)
CEO Nominating 722.6�� 2.69 1408.2�� 2.99 819.6�� 3.15 889.3�� 3.18(268.4) (471.6) (260.3) (279.9)
Insider Ratio 212.1 1.51 178.1 0.81 158.3 1.16 138.0 1.01(140.2) (220.8) (136.1) (136.2)
Num Board �332.6�� �6.75 �377.4�� �4.11 �304.5�� �6.21 �295.7�� �5.99(49.3) (91.8) (49.1) (49.4)
Heckman 0.232 1.81 0.090 1.34 0.298� 2.26 0.331� 2.50(0.128) (0.067) (0.132) (0.132)
Year Dummies Included Included Included IncludedIndustry Dummies Included Included Included Included
Adjusted R2 63.6% 73.7% 63.3% 61.5%Observations 242 122 242 242
��,�Significant at the 0.01, 0.05 level (two-tailed).
Y. Grinstein, P. Hribar / Journal of Financial Economics 73 (2004) 119–143134

variables associated with measures of managerial power are applicable to all firms,and are therefore not interacted with any of the subsamples. We present the resultsof this specification in column III of Table 4.5
Overall, the results in Table 4 are very similar across all three specifications. Thedeal size and time-to-complete coefficients are positive and significant in allspecifications, suggesting that measures of deal complexity are positively associatedwith the bonus. The Deal Size coefficient varies between 0.213 (column III) and 0.322(column II), and is statistically significant across the three specifications. The Time to
Complete coefficient varies between 188.4 (column III) and 1425.23 (column II), andis statistically significant across the three specifications. The Diversify coefficient issignificant and negative in the first specification, but insignificant in the second andthird specifications. Thus, there is limited evidence suggesting that CEOs of firmsthat acquire from outside their industry are rewarded differently than CEOs of firmswho acquire within the same industry.
Our measure of performance, Adj. Return 2day, is negative in column I (t statistic�3.79) and column III, (t-statistic �2.31) but not significant in column II. This resultdoes not support the hypothesis that CEOs are compensated for performance inM&A deals. In fact, the significantly negative relation suggests that the compensa-tion is not paid optimally. Overall, while there appears to be a relation betweenmeasures of effort and the bonus, there is no evidence that the bonus is related toobservable measures of performance, as suggested by moral hazard models.
The governance measures have a significant impact on the bonus. The CEO Chair
coefficient ranges between 578.2 (column I) and 1447.5 (column II), and isstatistically significant across the three specifications (t-statistics = 1.98, 2.70, 2.79).The CEO Nominating coefficient ranges between 722.6 (column I) and 1408.2(column II), and is statistically significant across the three specifications (t-statistics= 2.69, 2.99, and 3.15 respectively). The positive sign of these two coefficientssuggests that CEOs with greater board influence earn greater bonuses. The Insider
Ratio coefficient is positive in all three specifications but is not significant atconventional levels. This result is consistent with Core et al. (1999) who do not find asignificant relation between the insider ratio and managerial compensation, andmight suggest that our measure of insiders is a very noisy proxy for boardindependence.
Somewhat surprisingly, the Num Board coefficient is negative and significantacross all three specifications, ranging between �304.5 (column III) and �377.4(column II). This result implies that larger boards pay lower bonuses. On the surface,this result is inconsistent with Yermack’s (1996) finding that smaller boards areassociated with a higher Tobin Q, and the general notion that smaller boards aremore effective.
To better understand our findings with respect to board size, we conduct twosupplemental analyses. First, we examine the relation between Tobin’s Q and board
ARTICLE IN PRESS
5 In model III, the bonus variable is truncated at zero. Therefore, an OLS regression might suffer from
misspecification. To check if this is a concern, we reestimate this model using truncated OLS (tobit). All
inferences are unchanged using the tobit procedure.
Y. Grinstein, P. Hribar / Journal of Financial Economics 73 (2004) 119–143 135

size in our sample. Consistent with Yermack (1996), we find a negative relationbetween Tobin’s Q and board size. However, closer examination of our sample offirms reveals that about 40% of the firms in our sample that have high Tobin’s Q fallinto a category of new-economy firms (i.e. firms mainly in the telecommunicationand computer industry, which have a higher growth perspective (Murphy, 2003)).New-economy firms tend to have smaller boards and larger bonuses. Thus, onedifference between our findings and the findings in prior research is that during theperiod studied here, we have a significantly larger representation of new-economyfirms. Thus, high Q in our sample is not only a proxy for the efficiency but also forgrowth prospects; the larger bonuses in these firms seems to capture an industryeffect. We therefore add a new-economy dummy variable to our regressions. Thisnew-economy dummy reduces the magnitude of the negative coefficient of boardsize, but the coefficient is still significantly negative, which suggests that industryeffects explain only part of the result.
Second, we examine the partial correlation between bonus and board sizeconditional on each of the other explanatory variables, and find that the relationbetween bonus and board size is only significantly negative conditional on the CEObeing on the nominating committee. Therefore, we rerun the regression in column IIIseparately for those firms that have a CEO on the nominating committee (n=64) andthose firms that have a CEO that is not on the nominating committee (n=178). Forthe latter set of firms, the coefficient on board size is positive, but not significant. Forthe former set of firms, the coefficient is significantly negative. One interpretation ofthis finding is that when the CEO is more involved in choosing board members, asmaller board might actually mean that the CEO has more managerial power.
Our last variable, Heckman, has a positive coefficient across the threespecifications, and is statistically significant in one of them (column III). Thecoefficient is an estimate of the product of the standard deviation of the error inEq. (2) and the correlation between the error term in Eq. (2) and the error in the first-stage regression. Thus, the sign of the coefficient is determined by the correlationbetween the two error terms. A significantly positive coefficient therefore means thatthe error term in Eq. (2) is positively correlated with the error term in the first-stageregression. Intuitively, the positive coefficient on the Heckman variable suggests thatthe likelihood of acquiring is positively associated with the bonus paid for theacquisition. This result might also be interpreted as consistent with the managerialpower argument, in that CEOs that expect to extract higher bonuses for completingM&A deals are more likely to enter these deals.
To get a sense of the economic significance of our regression results, we examinethe magnitude of the statistically significant coefficients in column (III). An increaseof one standard deviation in deal size ($8.748 billion) increases the CEOcompensation by $1.86 million. An increase in the time to complete the deal byone standard deviation (117 days) from the mean increases the CEO’s compensationby $0.106 million. A decrease in abnormal return of 1% is associated with anincrease of $51.1 thousand in compensation. A CEO who is also the chair receives onaverage $828 thousand more than a CEO who is not. A CEO who is on thenominating committee receives on average $819.6 thousand more than a CEO who is
ARTICLE IN PRESSY. Grinstein, P. Hribar / Journal of Financial Economics 73 (2004) 119–143136
not on the nominating committee. An increase of one standard deviation in boardsize (4 members) decreases the bonus by about $1.2 million, and as mentioned above,this is driven by cases where the CEO is also on the nominating committee.
The economic significance of board power becomes even stronger within thesample of firms that state that they give an M&A bonus (column II). In thisspecification, a CEO who is also the chair receives on average $1.447 million and aCEO who is on the nominating committee receives on average an additional $1.408million more. We also get stronger effects in deal size and in the time to complete thedeal. An increase of one standard deviation in deal value ($8.748 billion) increasesthe CEO compensation by $2.816 million. An increase in the time to complete thedeal by one standard deviation (117 days) from the mean increases the CEO’scompensation by $0.801 million.
Overall, the results indicate that the most economically significant factors thatdetermine the compensation of the CEO appear to be deal size and the measures ofpower. While deal size might be indicative of greater effort and skill, it might alsoreflect agency problems associated with ‘‘empire building’’, and in this respect maybe related to the managerial power hypothesis. The most direct measure ofperformance, the two-day adjusted return, appears to be negatively related to thebonus, which suggests that compensation committees do not consider marketreaction to the announcement of the deal as a measure of performance. To the extentthat market reaction is indicative of the level of CEO expropriation in the deal, anegative relation between the announcement effect and the bonus is consistent withthe managerial power argument.
We also re-estimate the regression in column III, using bonus-plus-salary as thedependent variable. This specification is used to ensure that higher bonuses are notoffset by a lower base salary, and that the bonus effect we are capturing does indeedimpact the total salary of the CEO. We present the results in Table 4, column IV. Ifthere is a negative correlation between the bonus and salary, then the results incolumn III should not follow in column IV. Our results indicate that there is nooffsetting relation between the two components of compensation.
To get another sense of the effect of managerial power on compensation and otheraspects of the deal, we compare summary statistics of the acquiring firms, based onhow powerful the manager is in these firms. We first construct an index ofmanagerial power, by taking the sum of the three dichotomous managerial powervariables that are significant in Table 4. The three variables included in the index arethe indicator variable of whether the CEO is also the chairman of the board, theindicator variable of whether the CEO is on the nominating committee, and theindicator variable of whether the board size is smaller than the median size in oursample. Thus, the managerial power index can range from zero (least managerialpower), to three (greatest power). We present the results in Table 5.
Twenty-one acquiring firms have an index of zero, 106 firms have an index of one,90 firms have an index of two, and 25 firms have an index of three.6 The deal size of
ARTICLE IN PRESS
6 For example, an index of 3 implies that the CEO is also the chair, that the CEO serves on the
nominating committee, and that the board is below median size.
Y. Grinstein, P. Hribar / Journal of Financial Economics 73 (2004) 119–143 137

ARTIC
LEIN
PRES
S
Table 5
Bonus and deal characteristics based on managerial power variables
The sample includes large M&A deals between 1993 and 1999 with a deal value of $1 billion dollars or more, where the acquiring and target firms are
publicly traded U.S. companies. The Managerial Power index is constructed by taking the sum of three dichotomous managerial power indicator variables,
and therefore ranges from 0 to 3. The three variables included in the index are whether the CEO is also the chairman (equals one if CEO is chairman, zero
otherwise); whether the CEO is on the nominating committee (equals one if CEO is on nominating committee, zero otherwise); and whether the board size is
above or below the median board size for the firms in our sample (equals one if board size is lower than median board size, zero otherwise). Thus, firms with a
managerial power index of three have a CEO who is also the chairman, who is on the nominating committee, and who is on a relatively small board. Deal Size
is the dollar value of the deal, as reported by SDC; Deal to Assets is the value of the deal deflated by the assets of the acquiring firms; Bonus is the annual bonus
awarded to the CEO in the year of the merger or acquisition; Bonus to Deal Size is the CEO bonus deflated by the dollar value of the deal; Bonus to Time-to-
Complete is the CEO bonus deflated by the time to complete the merger; Adj. Return 2day is the two-day market-adjusted return for the day prior to and the
day of the merger announcement.
Variable Statistic Managerial Power Index t-statistic group 3 vs.
group 0
t-statistic group 3 vs.
groups 0,1,2
0 1 2 3
Deal Size Mean 9466.1 6436.7 3607.0 2743.2 2.77 3.35
($ millions) Median 5309.7 2932.7 1900.0 1657.4
Deal to Assets Mean 0.238 0.276 0.271 0.366 1.66 1.96
Median 0.170 0.190 0.235 0.285
Bonus Mean 2118.9 1613.9 1448.5 1847.4 0.37 0.58
($ thousands) Median 875.0 918.1 875.0 1200.0
Bonus to Deal Size Mean 0.538 0.458 0.718 1.188 1.98 2.77
(� 1000) Median 0.159 0.284 0.361 0.609
Bonus to Time-to-Complete Mean 18.03 12.05 23.64 19.21 0.16 0.34
($ thousands/days) Median 9.18 6.15 7.52 11.32
Adj. Return 2day Mean �0.0196 �0.0134 �0.0072 �0.0381 1.48 2.14
Median �0.0062 �0.0050 �0.0063 �0.0204
Number of observations 21 106 90 25
Y.
Grin
stein,
P.
Hrib
ar
/J
ou
rna
lo
fF
ina
ncia
lE
con
om
ics7
3(
20
04
)1
19
–1
43
138

the acquiring firms is largest for the least powerful CEO group, averaging $9.466billion and it decreases as the CEO becomes more powerful. The most powerful CEOgroup has an average deal size of $2.743 billion. However, when measuring the sizeof the deal relative to the size of the acquiring firm, (Deal to Assets), the mostpowerful CEOs engage in larger deals. They acquire companies whose size is onaverage 36% of their own firms’ assets. The least powerful CEOs acquire companieswhose size is on average only 23.8% of their own firms’ assets. The difference in theaverage deal size between the two groups is significant at the 5% level (t-statistic1.96). This result suggests that when controlling for acquirer size, deal size is not onlycorrelated with managerial skill but also with managerial power. This result isconsistent with the argument that deal size is itself a measure of agency conflicts(Jensen, 1986).
The average bonus levels in the four groups are not statistically different from oneanother. The average bonus of the most-powerful-CEO group is $1.847 million andthe bonus for the least-powerful-CEO group averages $2.118 million. However, thedifference in the ratio of bonus to deal size is significant. For the most-powerful-CEO group the ratio is 0.1188%, which is more than twice the ratio of 0.0538% forthe least-powerful-CEO group.
The two-day abnormal return of the deal announcement is negative, on average, inall groups. However, the return is statistically different from zero only in the most-powerful-CEO group. This group also averages the lowest two-day announcementperiod return of �3.8%, which is significantly lower than the return to the othergroups (t-statistic = 2.14). These results suggest that the market perceives as badnews M&A deals in which the CEO has board power. A CEO with greater power isassociated with a larger M&A deal relative to the size of his or her firm, higher cashbonus, and a more negative market perception. The results are consistent with theargument that managerial power enables the extraction of rents by the CEO.
4.2. Robustness
The fact that we get similar results using the three different methodologies suggeststhat the results are robust across various specifications. Nevertheless, the variableswe use to measure effort, skill, and performance might not capture the truemanagerial input in the deal. We therefore, repeat the regressions using othermeasures of effort, skill, and performance.7
Our first measure is the number of times that the board meets during theacquisition year. This variable might represent the level of complexity and theamount of decision-making associated with the deal. A second measure of effort isthe number of advisors who are hired for the acquisition. The larger the number ofadvisors, presumably the more complex the deal and the more effort required tocomplete the deal. We also use deal premium as a measure of deal performance,where we define the premium as the target price in the deal, divided by the market
ARTICLE IN PRESS
7 These variables are not included in our original regression, primarily because they reduce the sample
size considerably due to missing data in the SDC database.
Y. Grinstein, P. Hribar / Journal of Financial Economics 73 (2004) 119–143 139
value of the target four weeks before the deal. We obtain information on the numberof board meetings from the proxy statements, and on the number of advisors and themarket premium from SDC.
When we repeat the regression in Eq. (2) with the above variables, we find that thecoefficients associated with both the number of advisors and the deal premium arenot significant. The coefficient associated with the number of board meetings issignificant, however, with a coefficient of 67.3. This number suggests that for everyadditional board meeting, the CEO receives an additional $67.3 thousand. Theaverage number of meetings during the acquisition year is 5.0, and the standarddeviation is 3.0, suggesting that an increase in one standard deviation in the numberof board meetings is associated with an increase of about $200 thousand in bonus.The coefficients of all other included variables are qualitatively unchanged from thecoefficients in the original regressions. Overall, the results of our robustness checkssupport our original results, namely, that measures of CEO effort and skill have alimited power to explain the cross sectional-variation in the deal bonus, but thatmeasures of performance do not explain cross-sectional variation in the bonus.
4.3. Analysis of the compensation committee report
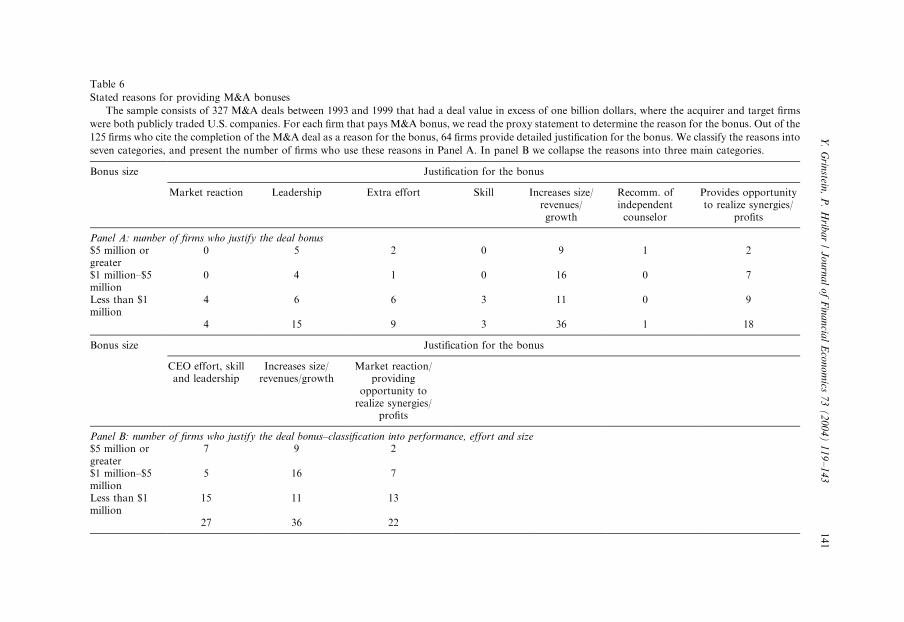
Our final analysis involves reading the compensation committee report toinvestigate the reasons cited for the CEO bonus, for cases in which a bonus isgiven in whole or in part for the merger or acquisition. In 61 cases (49%), thecompensation committee does not provide an explicit reason for the bonus, exceptfor mentioning that the CEO completed the deal, or that by executing the deal, theCEO complied with the strategy of the firm. This percentage holds both for firmsthat pay high bonuses and for firms that pay low bonuses. For the remaining firms,we classify the reasons into seven categories: market reaction; managerial leadership;managerial effort; managerial skill; increasing the size/revenues/growth of thecompany; recommendation of an independent counselor; and providing opportu-nities to realize synergies. Compensation committees might cite more than onereason for the bonus. We present the results in Table 6.
Panel A of Table 6 shows that the most frequent justification for the deal bonus(36 cases, or 56.25% of the sample of firms that provide reasons) is an increase in thesize, revenue, and growth of the firm. The least frequent reason is independentcouncil (one instance) and market reaction to the deal (four instances). This patternappears in the sample taken as a whole, as well as when the sample is partitioned bybonus size.
In Panel B, we recategorize the compensation committee comments into threegroups, one that relates to effort and skill, one that relates to performance, and onethat relates directly to size. In this case, the most frequent reason for compensatingthe CEO is for increasing firm size, revenues, and growth (56.25%). The second-mostfrequent reason is managerial effort and skill, and only in 34.3% of the cases is thereason maximizing profits and value.
The results suggest that compensation committees are reluctant to provideinformation about the CEO bonus. In 49% of the cases, the committees do not
ARTICLE IN PRESSY. Grinstein, P. Hribar / Journal of Financial Economics 73 (2004) 119–143140
ARTIC
LEIN
PRES
S
Table 6
Stated reasons for providing M&A bonuses
The sample consists of 327 M&A deals between 1993 and 1999 that had a deal value in excess of one billion dollars, where the acquirer and target firms
were both publicly traded U.S. companies. For each firm that pays M&A bonus, we read the proxy statement to determine the reason for the bonus. Out of the
125 firms who cite the completion of the M&A deal as a reason for the bonus, 64 firms provide detailed justification for the bonus. We classify the reasons into
seven categories, and present the number of firms who use these reasons in Panel A. In panel B we collapse the reasons into three main categories.
Bonus size Justification for the bonus
Market reaction Leadership Extra effort Skill Increases size/revenues/growth
Recomm. ofindependent
counselor
Provides opportunityto realize synergies/
profits
Panel A: number of firms who justify the deal bonus$5 million orgreater
0 5 2 0 9 1 2
$1 million–$5million
0 4 1 0 16 0 7
Less than $1million
4 6 6 3 11 0 9
4 15 9 3 36 1 18
Bonus size Justification for the bonus
CEO effort, skilland leadership
Increases size/revenues/growth
Market reaction/providing
opportunity torealize synergies/
profits
Panel B: number of firms who justify the deal bonus–classification into performance, effort and size$5 million orgreater
7 9 2
$1 million–$5million
5 16 7
Less than $1million
15 11 13
27 36 22
Y.
Grin
stein,
P.
Hrib
ar
/J
ou
rna
lo
fF
ina
ncia
lE
con
om
ics7
3(
20
04
)1
19
–1
43
141
justify the bonus beyond the fact that it is paid for completing the deal. In the rest ofthe cases, the compensation committees appear to be more concerned with payingtheir CEOs for maximizing firm size and revenues, rather than for maximizing value.
5. Conclusion
Using a sample of 327 large M&A deals between 1993 and 1999, we find thatabout 39% of the acquiring firms reward their CEOs for the successful completion ofa merger or acquisition deal. This compensation is mainly in the form of cashbonuses. Our analysis suggests that CEOs receive higher bonus compensation whenthe deals are larger. They also receive higher bonuses when they exert more effort informing the deal. However, except for deal size, we find that measures of effort andskill do not explain a significant amount of the variation in the bonus. We find someevidence that deal size is correlated with more managerial power, since more-powerful CEOs are likely to enter larger deals compared to the size of their ownfirms. We also find that measures of managerial power explain much of the cross-sectional variation in the bonus.
Our results suggest that managerial power plays a significant role in determiningM&A bonuses. Moreover, the managerial power variables appear to explain muchmore of the variation in the bonus than measures of effort or performance. Thesefindings are consistent with the argument of Bebchuk et al. (2002) and Bebchuk andFried (2003), that CEO power is a significant driver of CEO compensation.
We find additional evidence consistent with this argument. When we look at thecompensation committee reports, we find that compensation committees seem tohide information relating to why they give M&A bonuses. In about 50% of the cases,they do not provide clear information relating to why they give the deal bonuses. Inthe rest of the cases, their main arguments for bonuses rely on maximization of firmsize rather than on maximization of firm value.
The direct costs of deal bonuses seem small. However, potential indirect costsassociated with them could be very large. If CEOs have the power to affect boarddecisions and if they believe that M&A deals provide opportunities for them toextract rents from the shareholders through salaries and bonuses, CEOs may choosedeals that maximize their own wealth rather than shareholder value. We find thatM&A deals in which CEOs have more power suffer from a negative abnormal returnof �3.8%, which is significantly larger than the abnormal returns observed whenCEOs have less power. This large abnormal negative return suggests that theeconomic losses associated with self-dealing perks can be substantial.
References
Agrawal, A., Jaffe, J., Mandelker, G., 1992. The post-merger performance of acquiring firms: a re-
examination of an anomaly. Journal of Finance 47, 1605–1621.
Bebchuk, L.A., Fried, J.M., 2003. Executive compensation as an agency problem. Journal of Economic
Perspectives 17, 71–92.
ARTICLE IN PRESSY. Grinstein, P. Hribar / Journal of Financial Economics 73 (2004) 119–143142
Bebchuk, L.A., Fried, J.M., Walker, D.I., 2002. Managerial power and rent extraction in the design of
executive compensation. The University of Chicago Law Review 69, 751–846.
Blanchard, O.J., Lopez De Silanes, F., Shleifer, A., 1994. What do firms do with cash windfalls? Journal of
Financial Economics 36, 337–360.
Bliss, R.T., Rosen, R.J., 2001. CEO compensation and bank mergers. Journal of Financial Economics 61,
107–138.
Core, J.E., Holthausen, R.W., Larcker, D.F., 1999. Corporate governance, CEO compensation, and firm
performance. Journal of Financial Economics 51, 371–406.
Cyert, R., Kang, S., Kumar, P., 2002. Corporate governance, takeovers, and top-management
compensation: theory and evidence. Management Science 48, 453–469.
Datta, S., Iskandar-Datta, M., Raman, K., 2001. Executive compensation and corporate diversification
decisions. Journal of Finance 56, 2299–2336.
Denis, D.J., Denis, D.K., Sarin, A., 1997. Agency problems, equity ownership, and corporate
diversification. Journal of Finance 52, 135–160.
Grossman, S., Hart, O., 1983. An analysis of the principal agent problem. Econometrica 51, 7–45.
Hallock, K.F., 1997. Reciprocally interlocking boards of directors and executive compensation. Journal of
Financial and Quantitative Analysis 32, 331–344.
Hartzel, J., Ofek, E., Yermack, D., 2001. What’s in it for me? CEOs whose firms are acquired.
Unpublished working paper, New York University.
Heckman, J., 1979. Sample selection bias as a specification error. Econometrica 47, 153–161.
Holmstrom, B., 1979. Moral hazard and observability. Bell Journal of Economics 13, 234–340.
Jensen, M.C., 1986. Agency costs of free cash flow, corporate finance, and takeovers. The American
Economic Review 76, 323–329.
Jensen, M.C., 1993. The modern industrial revolution, exit, and the failure of internal control systems.
Journal of Finance 48, 831–880.
Jensen, M.C., Ruback, R., 1983. The market for corporate control: the scientific evidence. Journal of
Financial Economics 11, 5–50.
Klein, A., 2002. Audit committee, board of director characteristics, and earnings management. Journal of
Accounting and Economics 33, 375–400.
Kohers, N., Kohers, T., 2001. Takeovers by technology firms: expectations vs. reality. Financial
Management 30, 35–54.
Loughran, T., Vijh, A.M., 1997. Do long-term shareholders benefit from corporate acquisitions? Journal
of Finance 52, 1765–1790.
Mirrlees, J., 1974. Notes on welfare economics, information, and uncertainty. In: Balch, M., McFadden,
D., Wu, S. (Eds.), Essays on Economic Behavior Under Uncertainty. North-Holland, Amsterdam.
Mirrlees, J., 1976. The optimal structure of incentives and authority within an organization. Bell Journal
of Economics 7, 105–131.
Moeller, S.B., Schlingemann, F.P., Stulz, R.M., 2003. Do shareholders of acquiring firms gain from
acquisitions? Working Paper #2003-4, Ohio State University.
Murphy, K.J., 2003. Stock-based pay in new-economy firms. Journal of Accounting and Economics 34,
129–147.
Rose, N.L., Shepard, A., 1997. Firm diversification and CEO compensation: managerial ability or
executive entrenchment? Rand Journal of Economics 28, 489–514.
Shivdasani, A., Yermack, D., 1999. CEO involvement in the selection of new board members: an empirical
analysis. Journal of Finance 54, 1829–1853.
Yermack, D., 1995. Do corporations award CEO stock options effectively? Journal of Financial
Economics 39, 237–269.
Yermack, D., 1996. Higher market valuation of companies with a small board of directors. Journal of
Financial Economics 40, 185–211.
Yermack, D., 1997. Good timing: CEO stock option awards and company news announcements. Journal
of Finance 52, 449–476.
ARTICLE IN PRESSY. Grinstein, P. Hribar / Journal of Financial Economics 73 (2004) 119–143 143