
CENTRE OF COMPETENCE OF THE CIVIL PROTECTION DEPARTMENT PRESIDENCY OF THE COUNCIL OF MINISTERS
46
Nicola Casagli Giovanni Gigli, Veronica Tofani Warning systems: alert thresholds Department of Earth Sciences CENTRE OF COMPETENCE OF THE CIVIL PROTECTION DEPARTMENT PRESIDENCY OF THE COUNCIL OF MINISTERS
Transcript of CENTRE OF COMPETENCE OF THE CIVIL PROTECTION DEPARTMENT PRESIDENCY OF THE COUNCIL OF MINISTERS

Nicola CasagliGiovanni Gigli, Veronica Tofani
Warning systems: alert
thresholds
Department of Earth SciencesCENTRE OF COMPETENCE OF THE CIVIL PROTECTION DEPARTMENT
PRESIDENCY OF THE COUNCIL OF MINISTERS
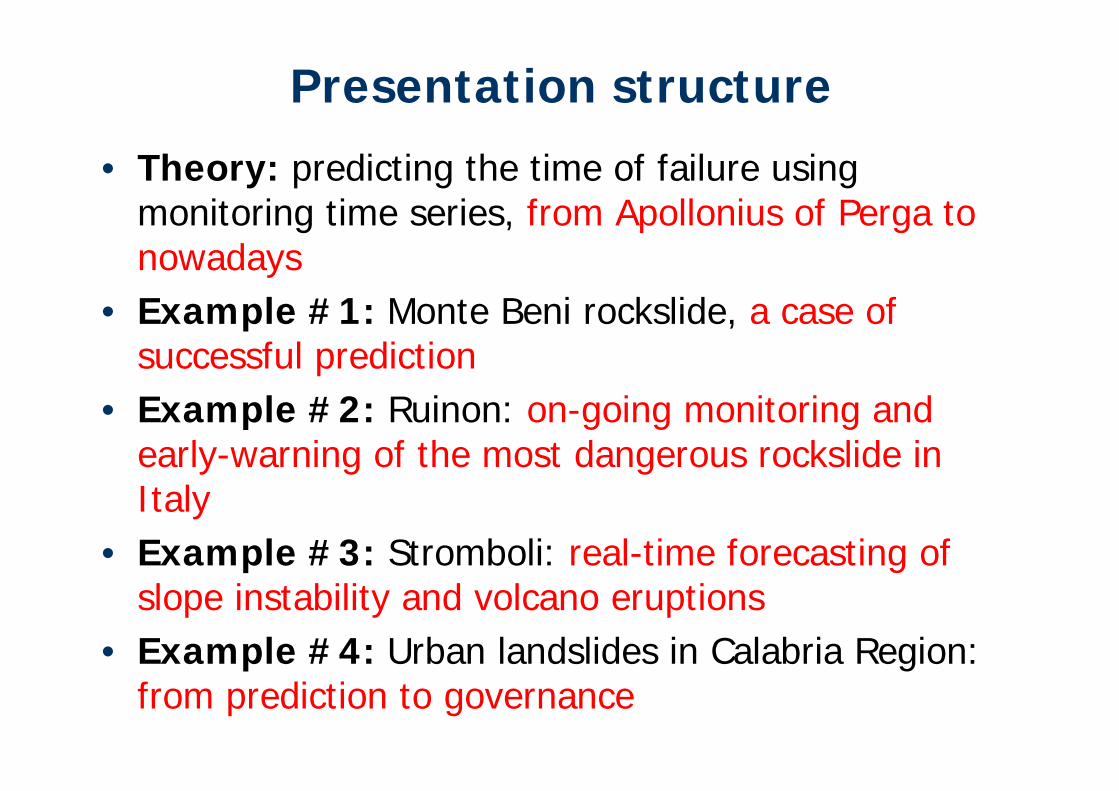
Presentation structure
• Theory: predicting the time of failure using monitoring time series, from Apollonius of Perga to nowadays
• Example #1: Monte Beni rockslide, a case of successful prediction
• Example #2: Ruinon: on-going monitoring and early-warning of the most dangerous rockslide in Italy
• Example #3: Stromboli: real-time forecasting of slope instability and volcano eruptions
• Example #4: Urban landslides in Calabria Region: from prediction to governance

Apollonius of Perga(Perga, 262 a.C. – Murtina, 190 a.C.)
The Conics
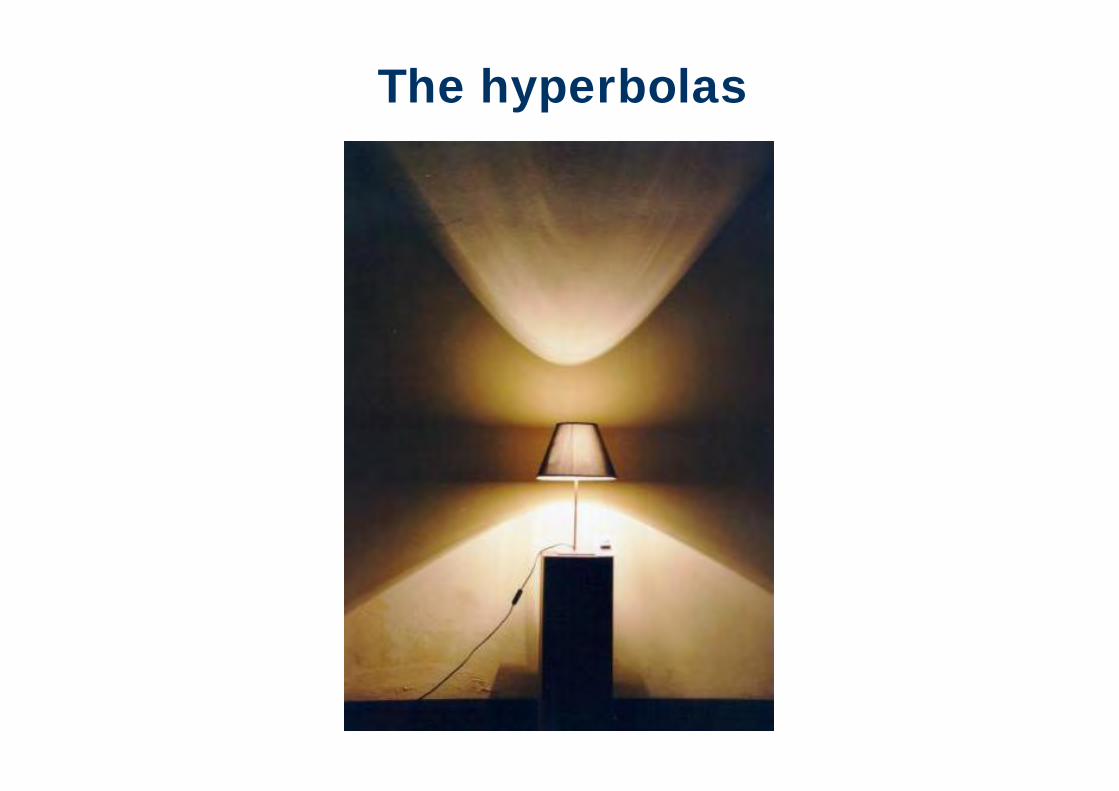
The hyperbolas
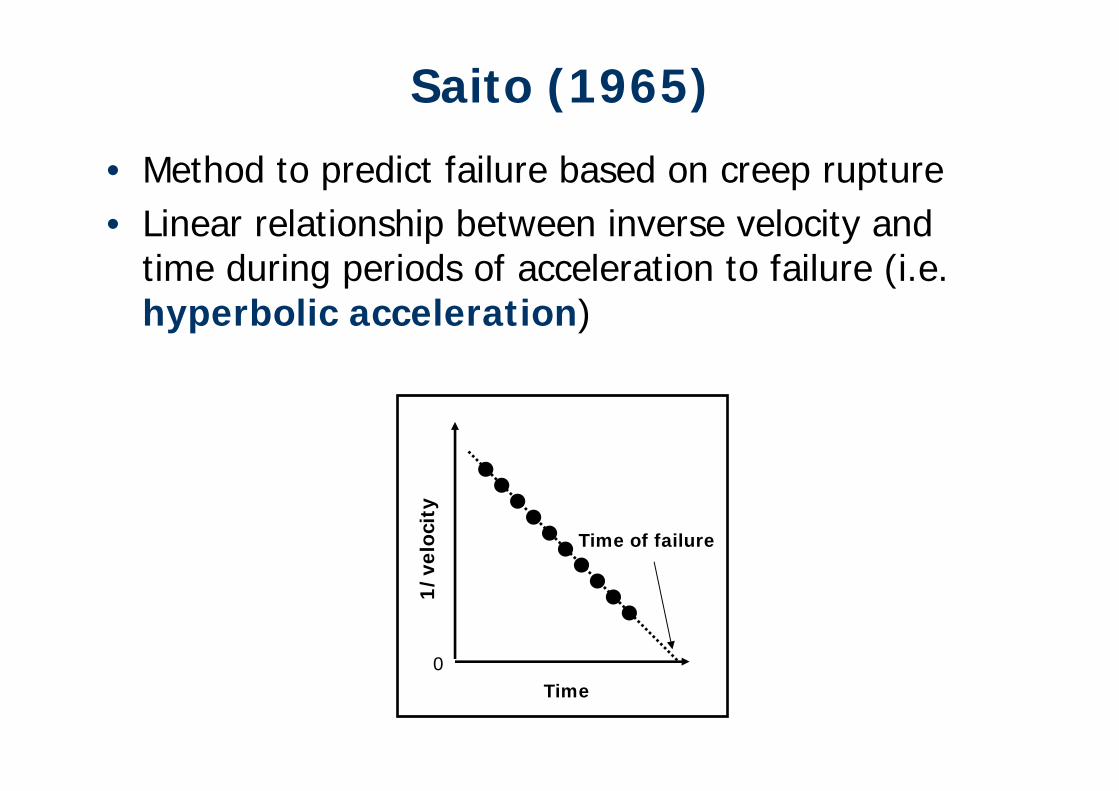
Saito (1965)
• Method to predict failure based on creep rupture• Linear relationship between inverse velocity and
time during periods of acceleration to failure (i.e. hyperbolic acceleration)
1/ve
loci
ty
Time
Time of failure
0
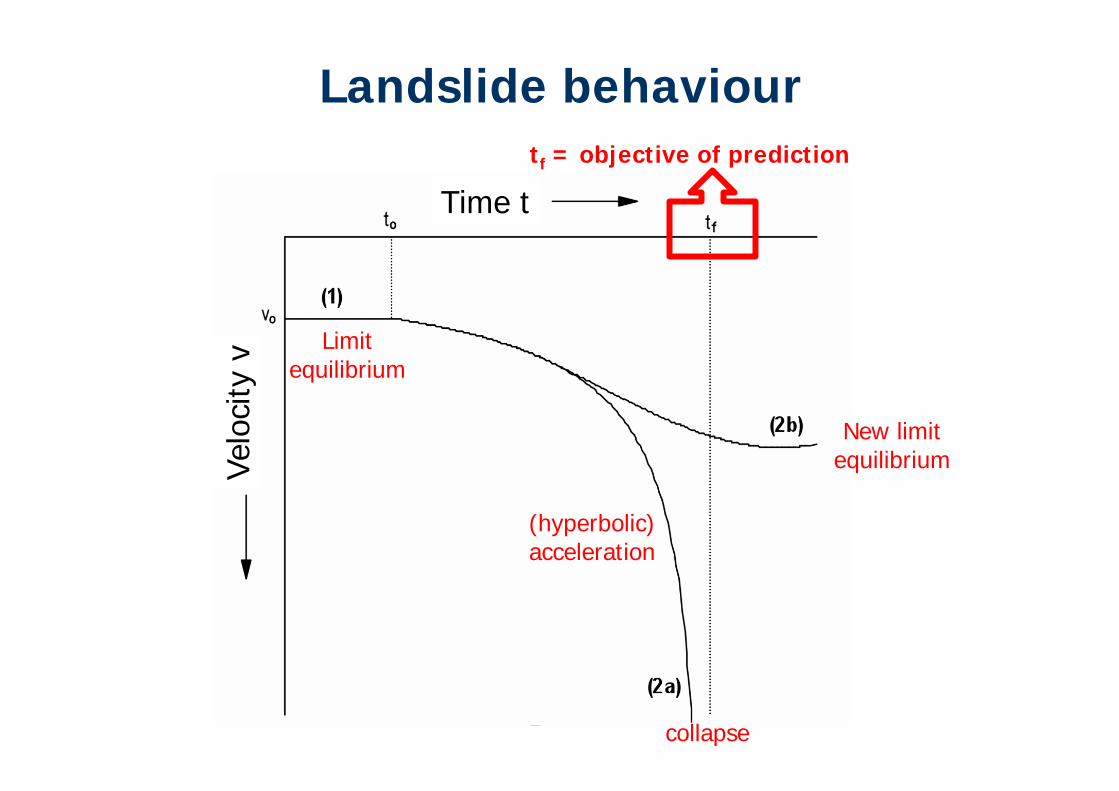
Landslide behaviour
Time tVe
loci
ty v
Limitequilibrium
New limitequilibrium
collapse
tf = objective of prediction
(hyperbolic) acceleration

Fukuzono (1985)
( ) ( ) ( )( )α
αα
−
−=−
−−
1
11
Avv
tt ifif
α
⎟⎠⎞
⎜⎝⎛=
dtdxA
dtxd2
2
for α >1:
Power law relationship between acceleration and velocity before failure, tested on laboratory physical models

Inverse-velocity methodFukuzono (1985)
( )[ ] 11
11
1 )(1 −− −−=⇒∞= ααα ttAv fvf i
If α = 2 :
V-1 = A(tf-t)HYPERBOLA

Barry Voight (1988)A relation to describe rate-dependent material failureScience (1988)
A method for prediction of volcano eruptionsNature (1988)
July 1995, Montserrat'sSoufriere Hills volcano
May 1980, Mt. St. Helens volcano
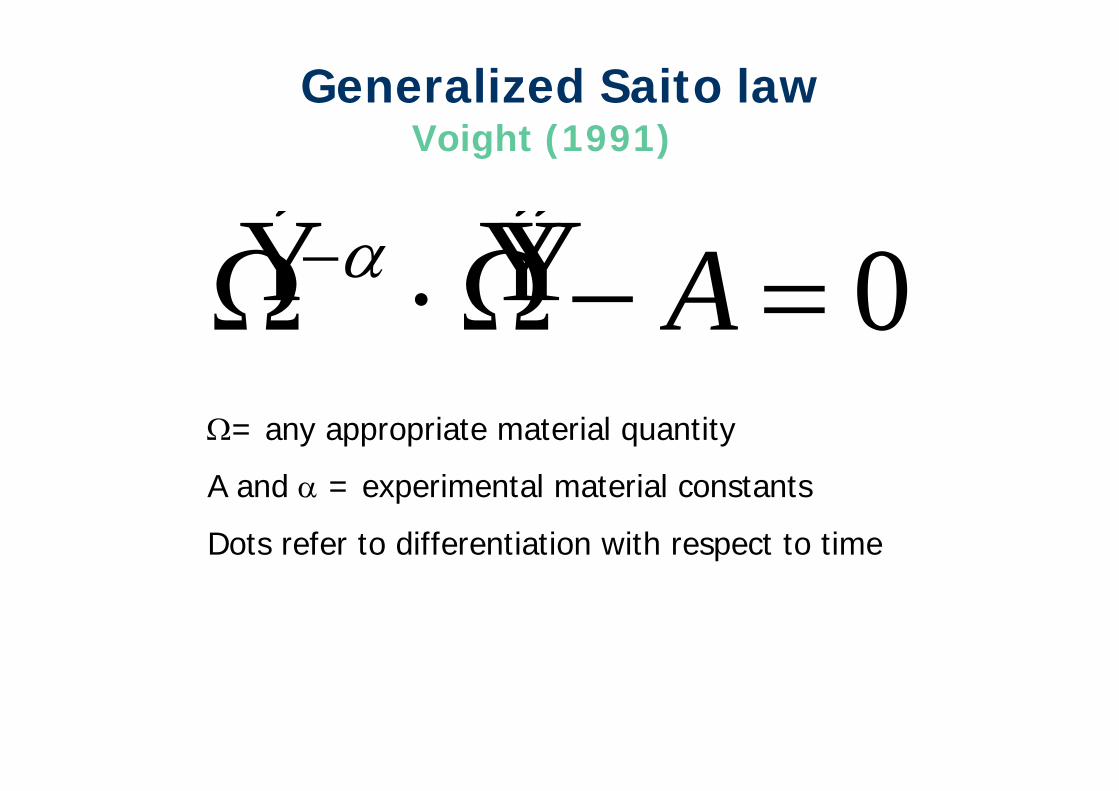
Generalized Saito law
Ý Ω −α ⋅ Ý Ý Ω − A = 0Ω= any appropriate material quantity
A and α = experimental material constants
Dots refer to differentiation with respect to time
Voight (1991)
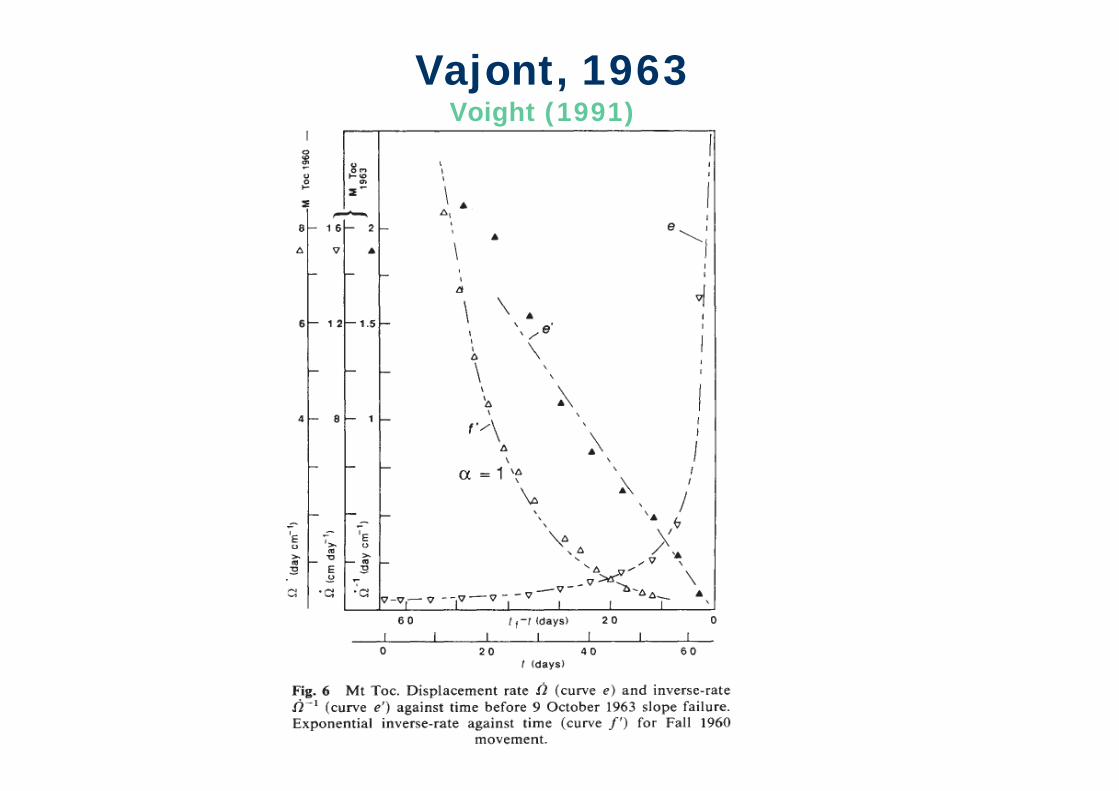
Vajont, 1963Voight (1991)

Voight (1991)Mt. St. Helens, 1980
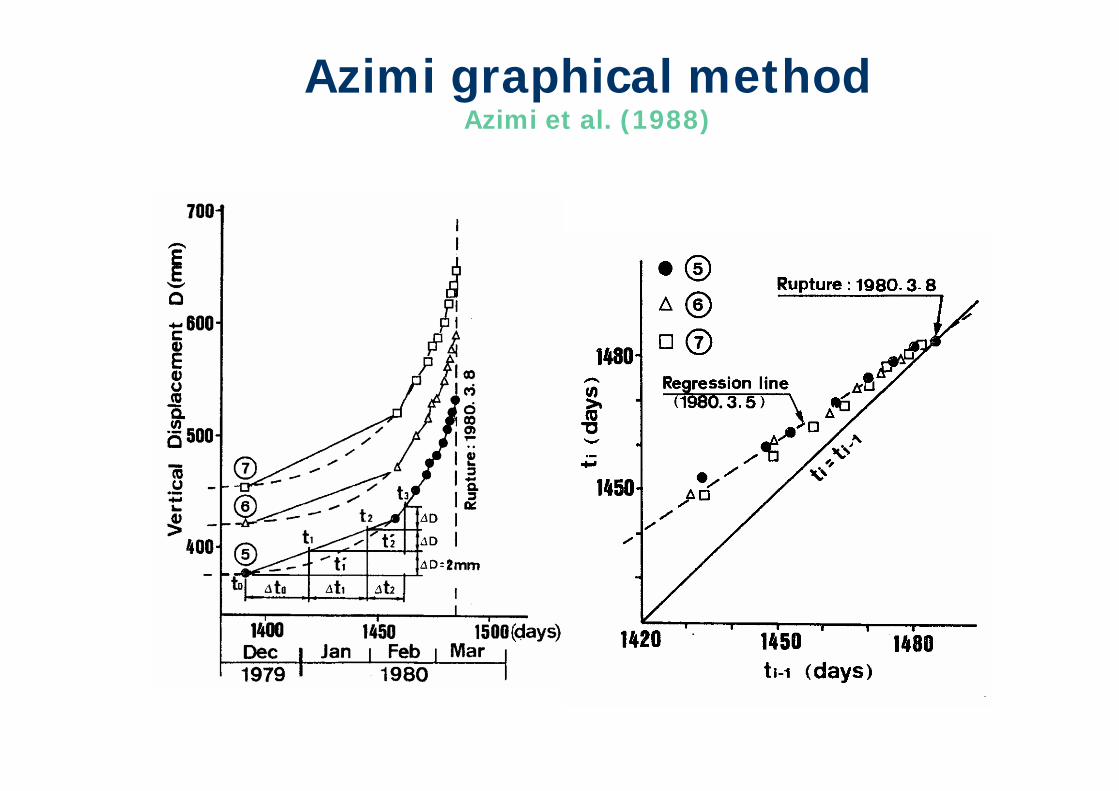
Azimi graphical methodAzimi et al. (1988)
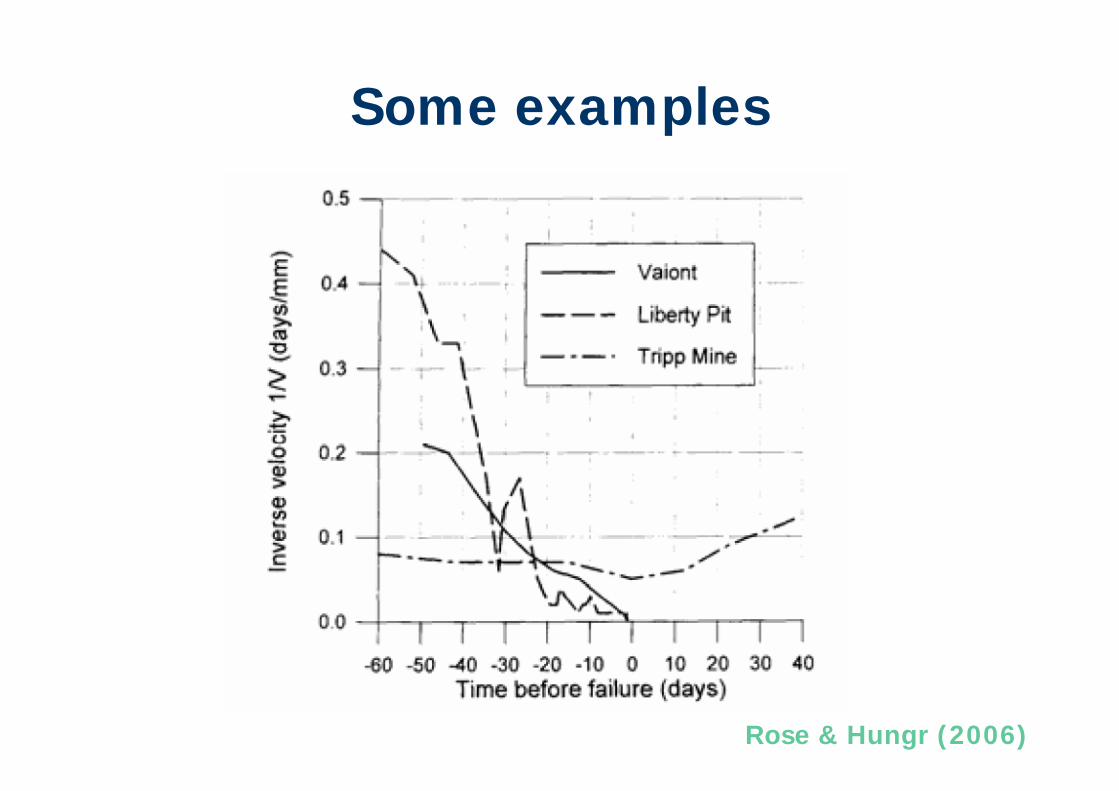
Some examples
Rose & Hungr (2006)
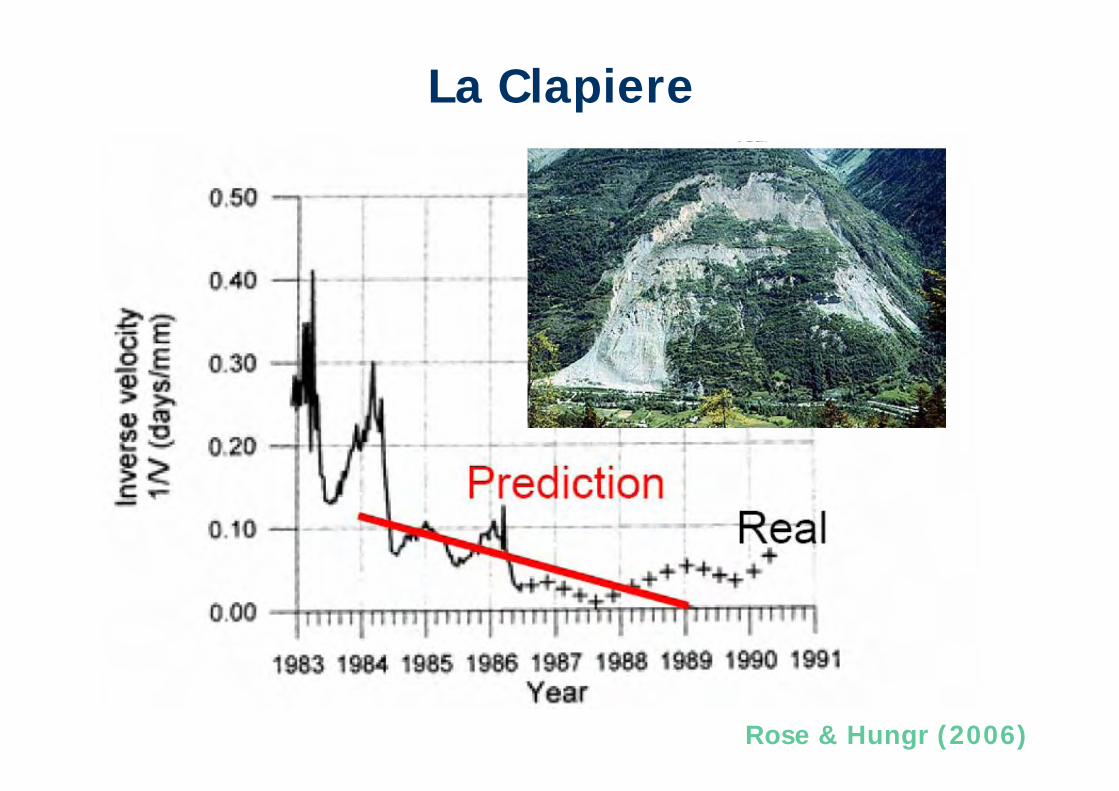
La Clapiere
Rose & Hungr (2006)
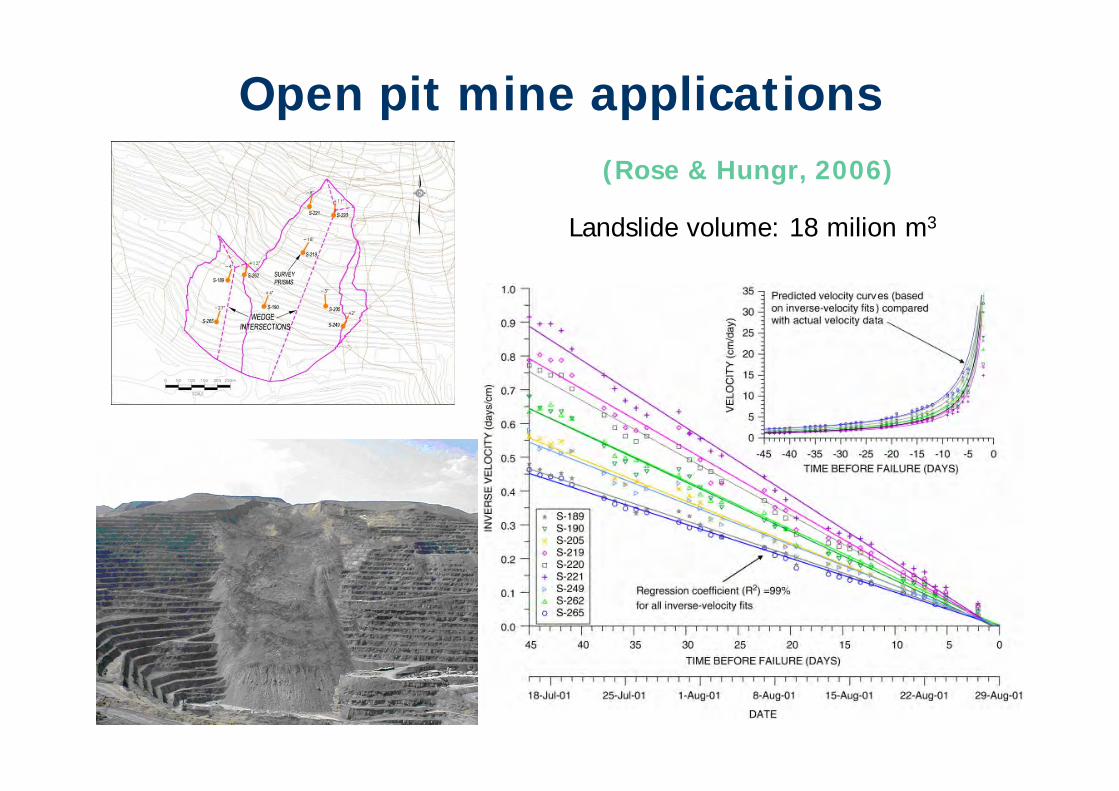
Landslide volume: 18 milion m3
Open pit mine applications(Rose & Hungr, 2006)
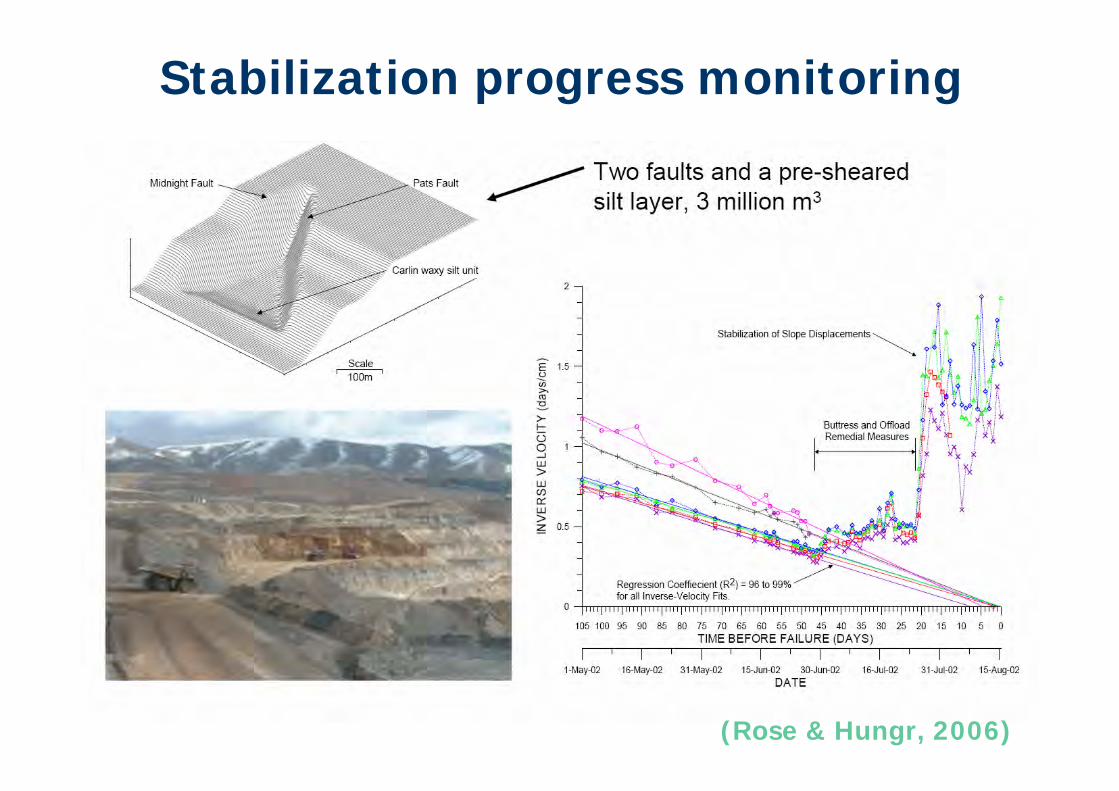
Stabilization progress monitoring
(Rose & Hungr, 2006)
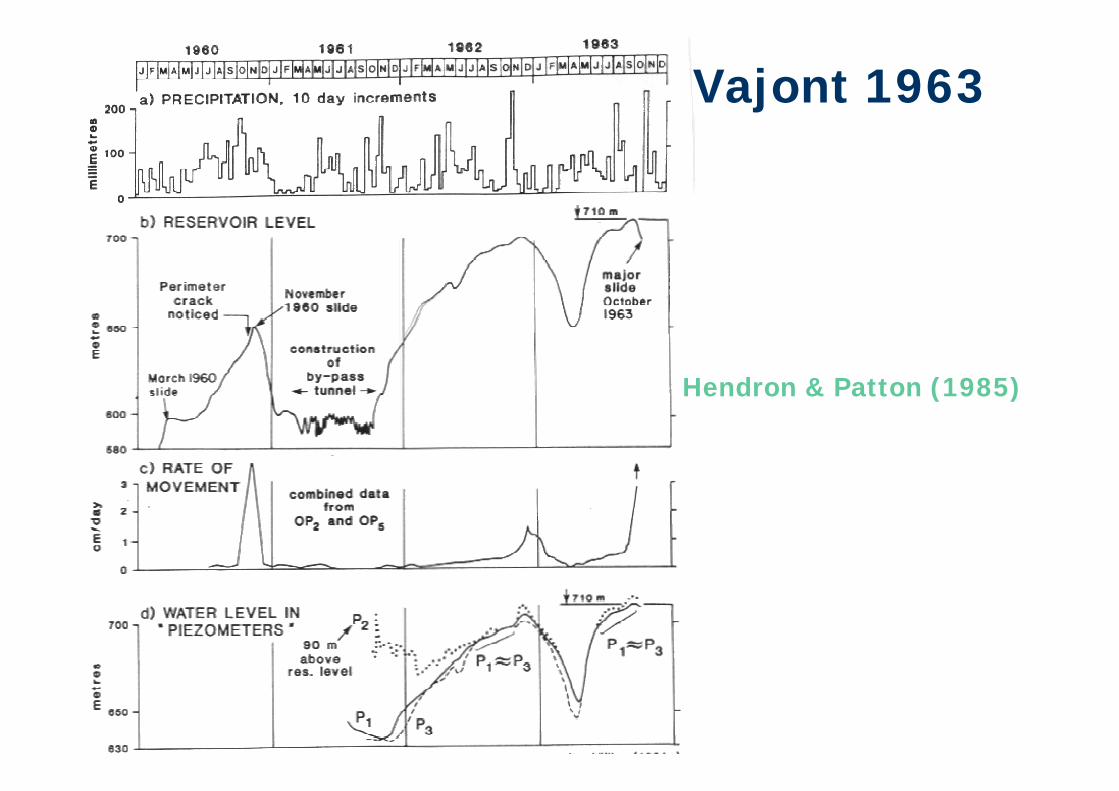
Vajont 1963
Hendron & Patton (1985)
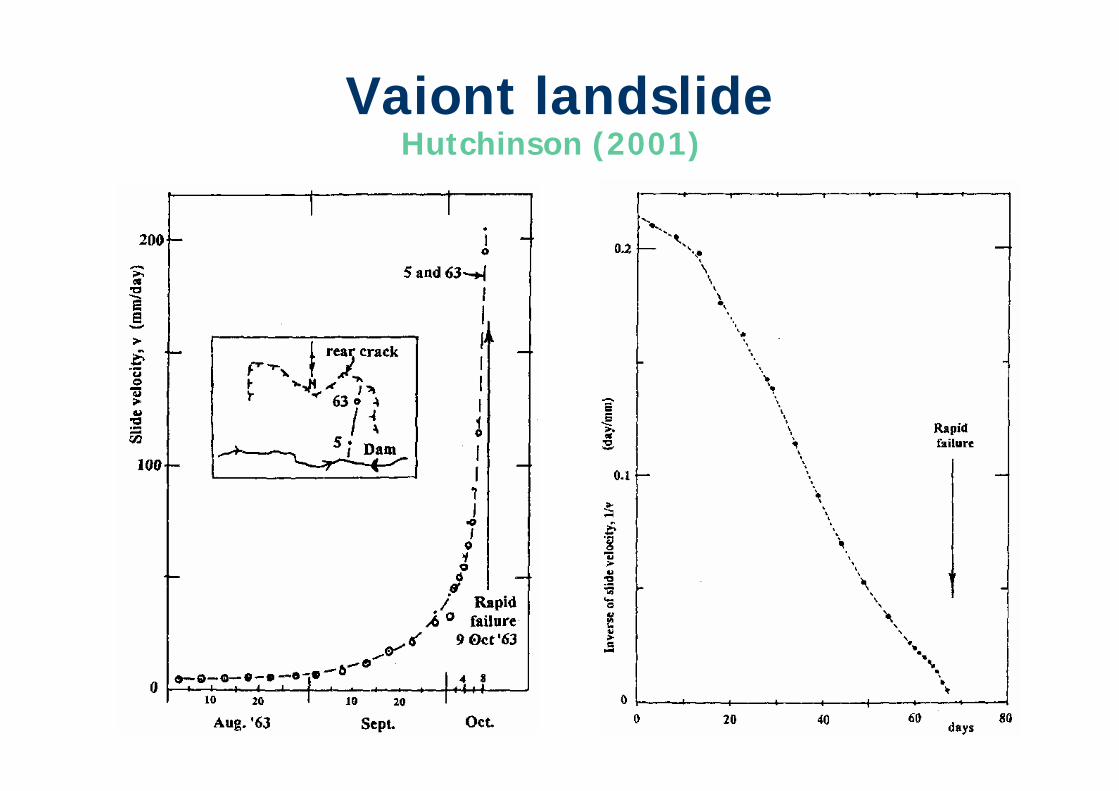
Vaiont landslideHutchinson (2001)

Vajont landslideHutchinson (2001)
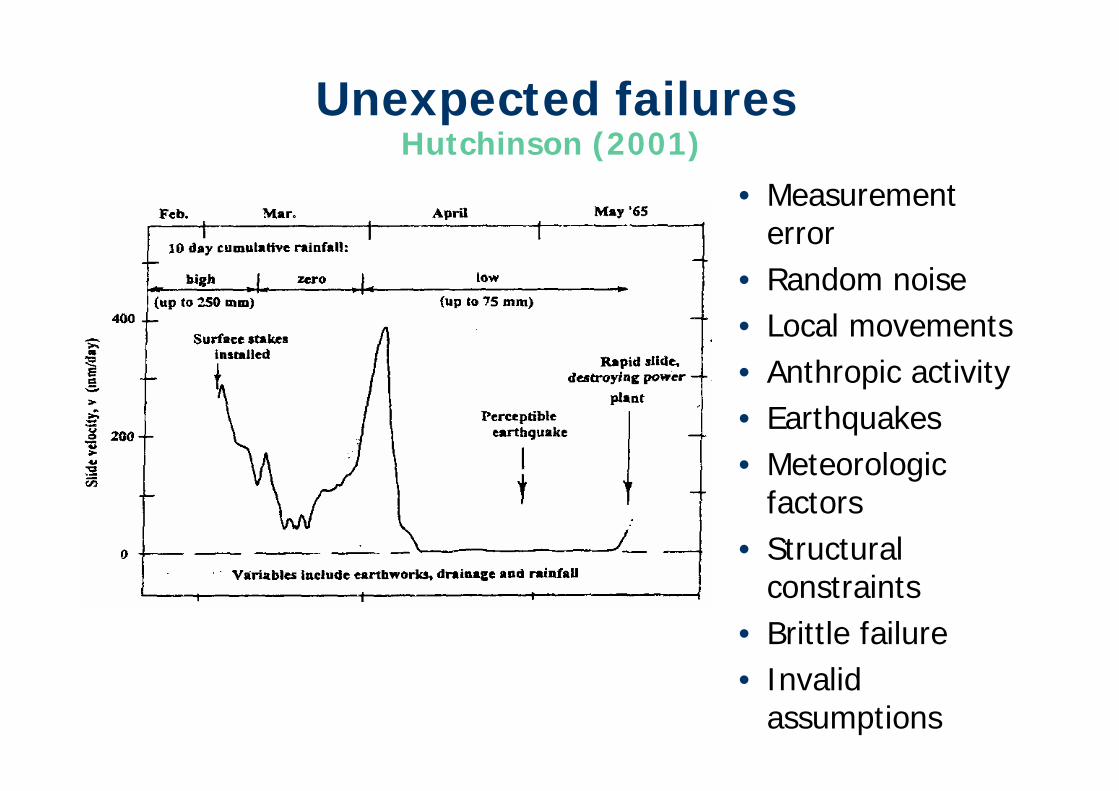
Unexpected failures
• Measurement error
• Random noise• Local movements• Anthropic activity• Earthquakes• Meteorologic
factors• Structural
constraints• Brittle failure• Invalid
assumptions
Hutchinson (2001)

Non linearityPetley (2003)
Data from A: Angeli et al. (1989); B: Salt (1985); C: CNR IRPI (2002); D: USGS (2002)

Non linearityPetley (2003)
• Two styles of accelerating behaviour are seen in landslides– Linearity = rupture surface development / brittle failure /
first-time failures– Asymptotic = sliding on existing surfaces / ductile
deformation / continuous or reactivated failures
• These considerations are based on a new model for the development of progressive failure in brittle landslides tested in laboratory

My personal experience
• The linear model applies to the most part of slope failures (both first time and reactivations) in a “simple”geological environment (i.e. with a single main driving factor of instability)
• Non-linear (asympthotic) behaviour has been observed in first time failures during volcano eruptions
• In many cases reactivated failures exhibit a brittle behavior (related to the linear model) – Key reference: HUTCHINSON J.N. (1987) - Mechanisms producing large displacements in landslides on pre-existing shears. 1st Sino-British Geol. Conf., Tapei, Memoir of the Geological Survey of China, 9, 175-200.
Casagli (today)

Example #1: Monte Beni

Montebeni (Italy) April 19th 2002

Perimetral crack
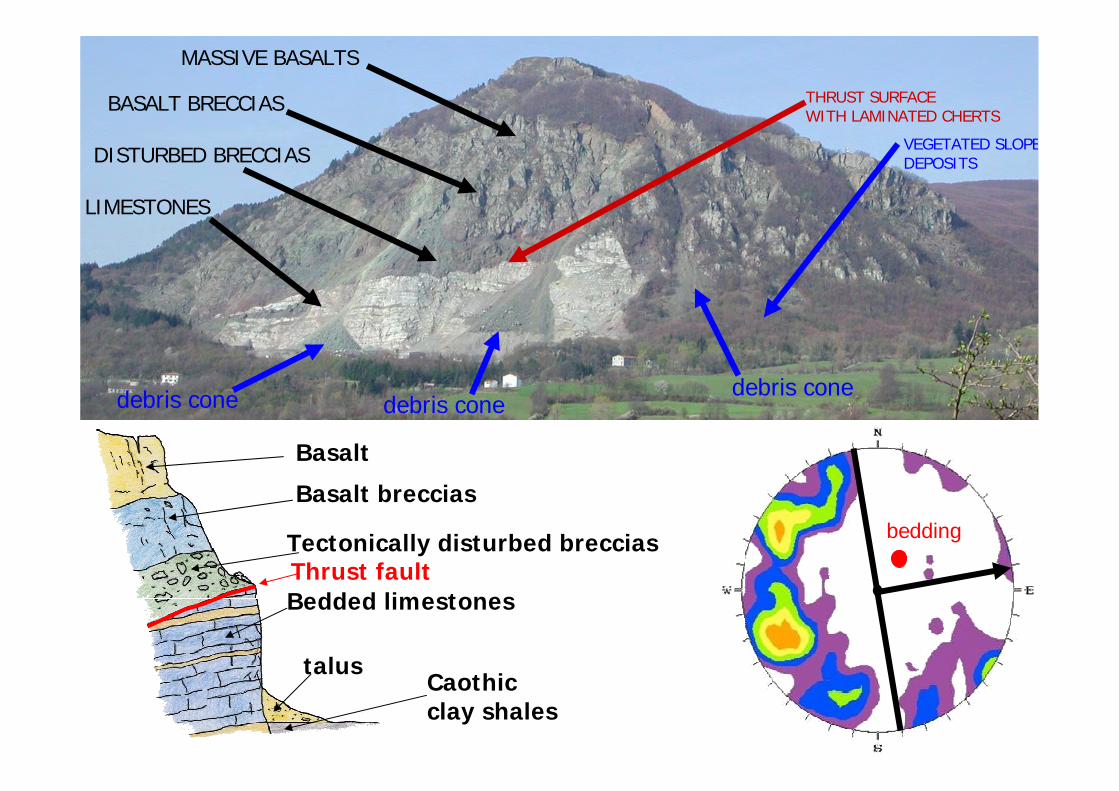
debris cone debris conedebris cone
MASSIVE BASALTS
BASALT BRECCIAS
DISTURBED BRECCIAS
LIMESTONES
THRUST SURFACEWITH LAMINATED CHERTS
VEGETATED SLOPEDEPOSITS
talus
Tectonically disturbed breccias
Bedded limestones
Caothic clay shales
Basalt
Basalt breccias
Thrust fault
bedding
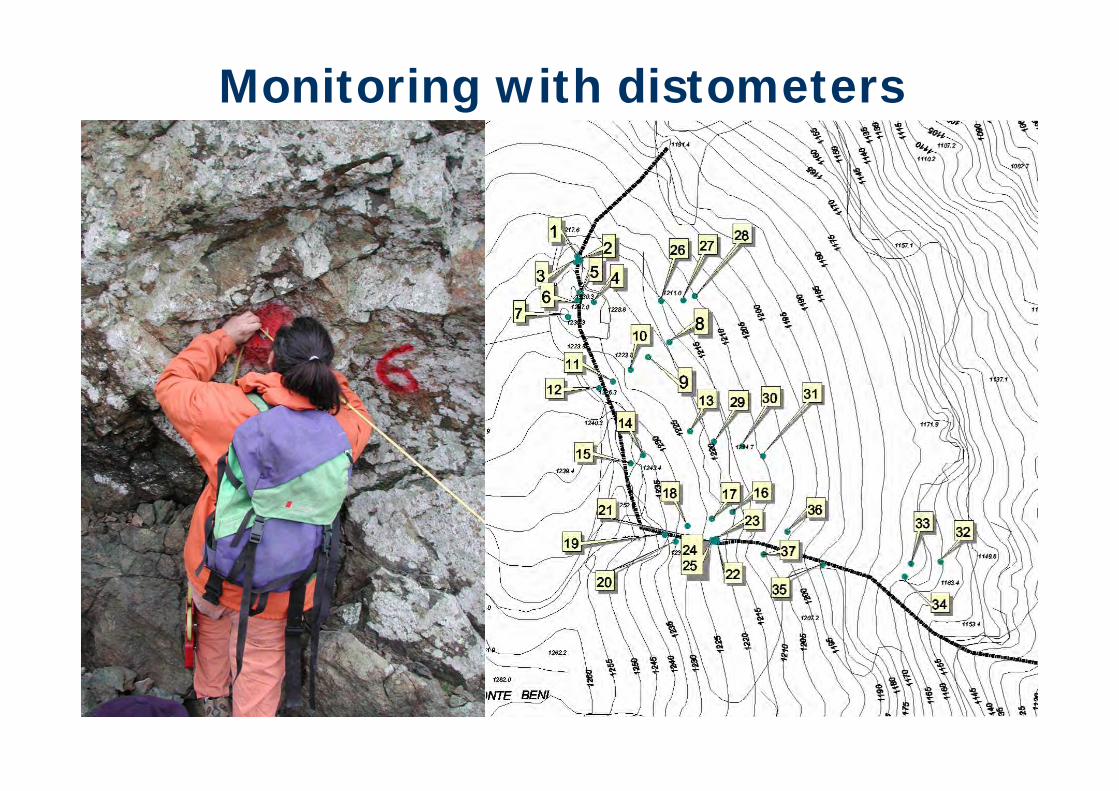
Monitoring with distometers
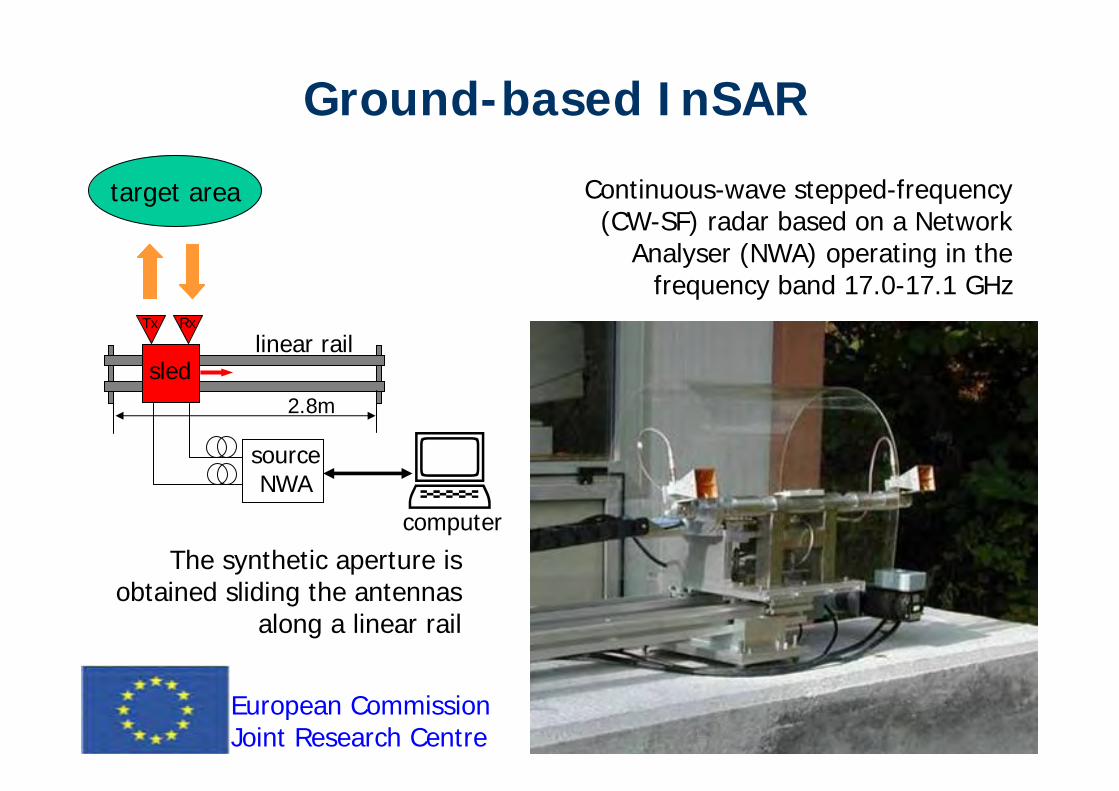
Continuous-wave stepped-frequency (CW-SF) radar based on a Network
Analyser (NWA) operating in the frequency band 17.0-17.1 GHz
Ground-based InSAR
The synthetic aperture is obtained sliding the antennas
along a linear rail
2.8m
target area
RxTx
sled
sourceNWA
computer
linear rail
European Commission Joint Research Centre
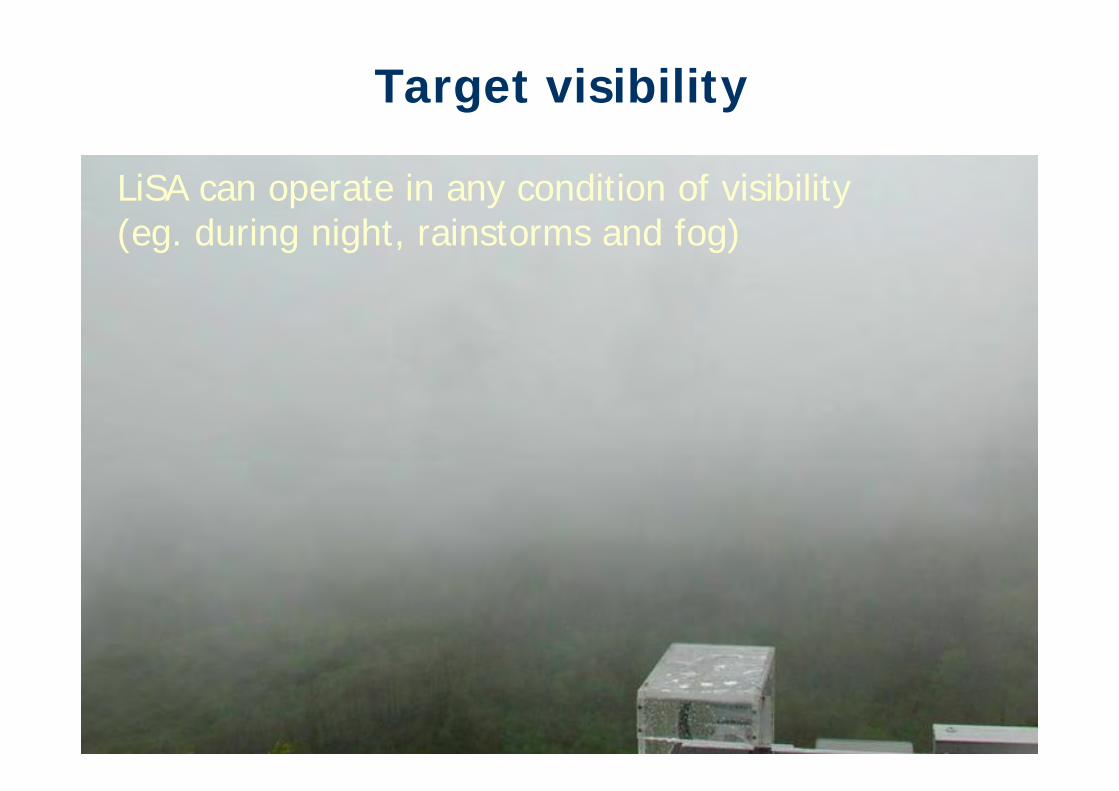
Target visibility
LiSA can operate in any condition of visibility(eg. during night, rainstorms and fog)
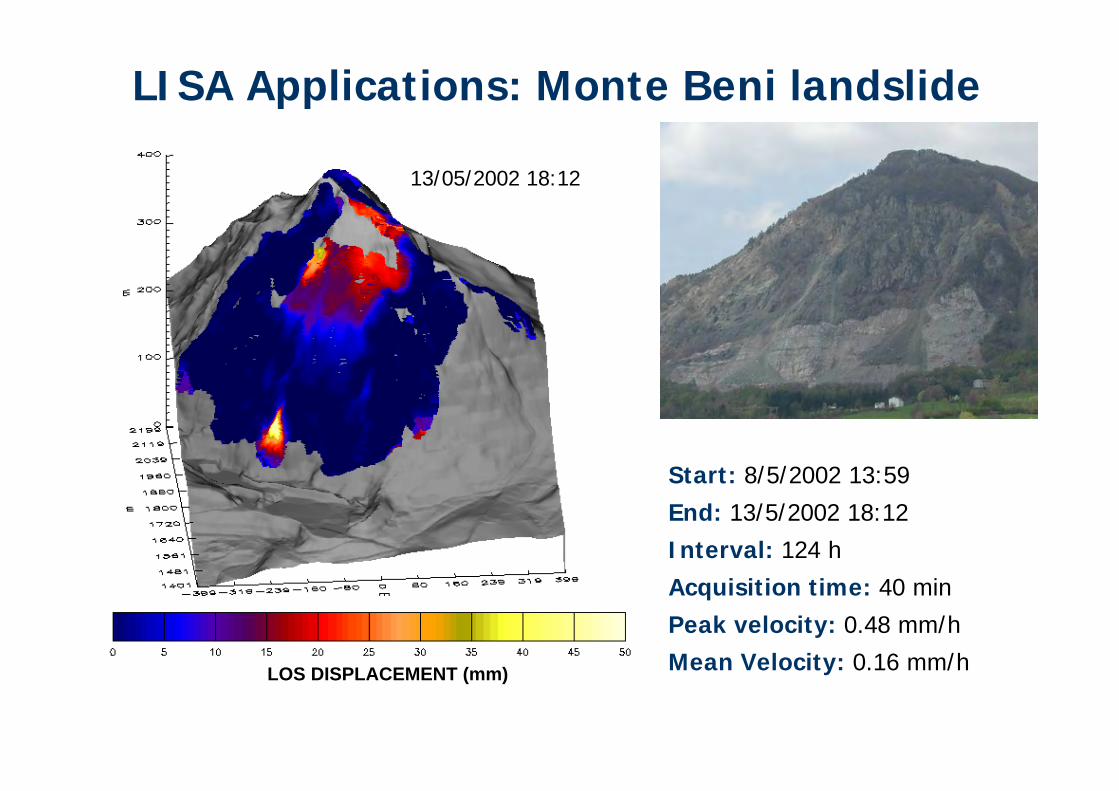
LISA Applications: Monte Beni landslide
Start: 8/5/2002 13:59
End: 13/5/2002 18:12
Interval: 124 h
Acquisition time: 40 min
Peak velocity: 0.48 mm/h
Mean Velocity: 0.16 mm/h
08/05/2002 13:5908/05/2002 17:1008/05/2002 20.2808/05/2002 23:3709/05/2002 00:0709/05/2002 04:0009/05/2002 06:3509/05/2002 08:4009/05/2002 11:2009/05/2002 14:0509/05/2002 16:5009/05/2002 19:2009/05/2002 23:5510/05/2002 03:1010/05/2002 05:5010/05/2002 09:4510/05/2002 11:5210/05/2002 13:5010/05/2002 16:4511/05/2002 19:0011/05/2002 21:2011/05/2002 23:4211/05/2002 19:0011/05/2002 21:2011/05/2002 23:4212/05/2002 02:4512/05/2002 06:0012/05/2002 08:3012/05/2002 11:2012/05/2002 14:3012/05/2002 17:3512/05/2002 20:1012/05/2002 22:4013/05/2002 02:1513/05/2002 05:4613/05/2002 08:5513/05/2002 12:4013/05/2002 12:4013/05/2002 15:4013/05/2002 18:12
LOS DISPLACEMENT (mm)

cum
ulat
ed d
ispl
acem
ent
(mm
)
point 1:displacement = 57 mmvelocity = 11 mm/day
point 5:displacement = 13 mmvelocity = 3 mm/day
point 4:displacement = 22 mmvelocity = 4 mm/day
point 3:displacement = 25 mmvelocity = 5 mm/day
point 2:displacement = 37 mmvelocity = 7 mm/day
point 1
point 2point 3
point 4
point 5D
ISP
LAC
EMEN
T (m
m)
m
m
elapsed time (min) elapsed time (min)
elapsed time (min) elapsed time (min)elapsed time (min)cu
mul
ated
dis
plac
emen
t (m
m)
cum
ulat
ed d
ispl
acem
ent
(mm
)
cum
ulat
ed d
ispl
acem
ent
(mm
)
cum
ulat
ed d
ispl
acem
ent
(mm
)Displacement histories
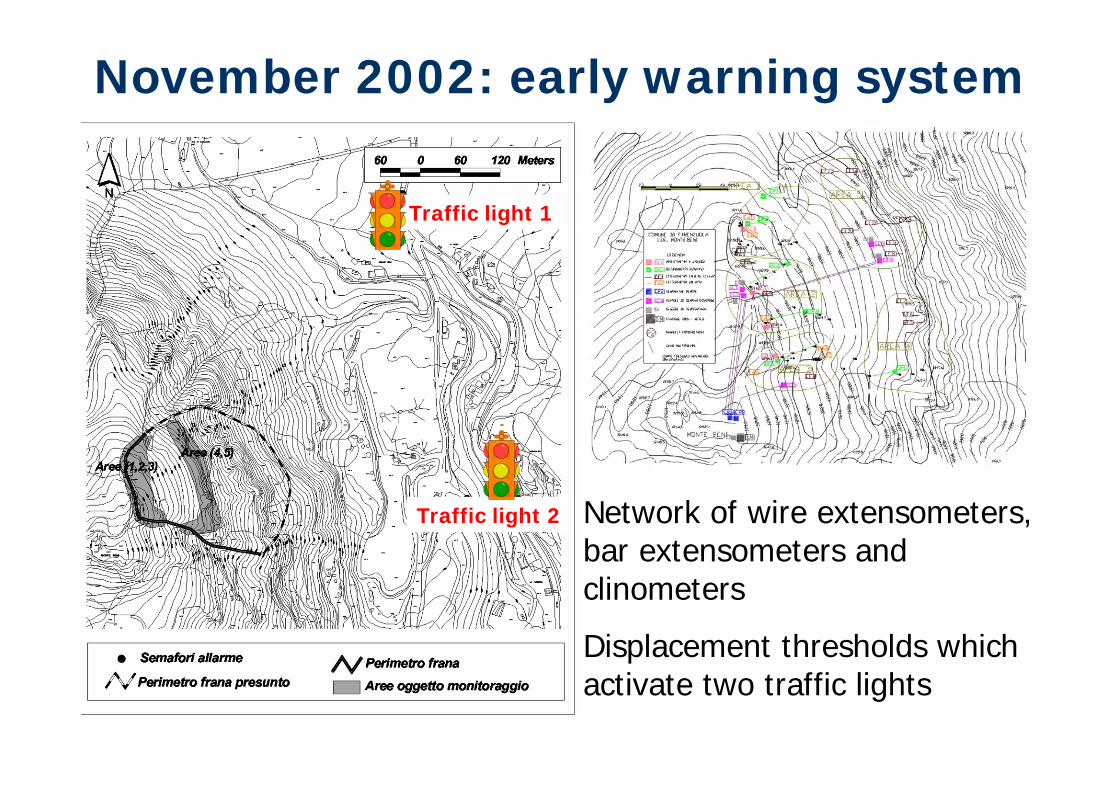
November 2002: early warning system
Traffic light 1
Traffic light 2 Network of wire extensometers, bar extensometers and clinometers
Displacement thresholds which activate two traffic lights

Early December: failure of sensorsarea 1
-50
0
50
100
150
200
250
300
350
400
30/11/02 0.00 2/12/02 0.00 4/12/02 0.00 6/12/02 0.00 8/12/02 0.00 10/12/02 0.00 12/12/02 0.00 14/12/02 0.00 16/12/02 0.00 18/12/02 0.00 20/12/02 0.00
data
mm
(cm
per
AL)
, °c DR1
DR2EF1FA1FA2AL1 TA1
area2
-10.00
40.00
90.00
140.00
190.00
240.00
290.00
340.00
30/11/020.00
2/12/020.00
4/12/020.00
6/12/020.00
8/12/020.00
10/12/020.00
12/12/020.00
14/12/020.00
16/12/020.00
18/12/020.00
20/12/020.00
data
mm
, cm
per
AL,
°c
DR3DR4 EF2EF3FA3AL3AL2TA2
area3
-20
30
80
130
180
230
280
330
380
430
27/11/0212.00
29/11/0212.00
1/12/0212.00
3/12/0212.00
5/12/0212.00
7/12/0212.00
9/12/0212.00
11/12/0212.00
13/12/0212.00
15/12/0212.00
17/12/0212.00
19/12/0212.00
data
mm
, cm
per
AL,
°c DR5
FA4FA5FA6EF4TA2DR6
area4
-50
-30
-10
10
30
50
70
90
27/11/0212.00
28/11/0212.00
29/11/0212.00
30/11/0212.00
1/12/0212.00
2/12/0212.00
3/12/0212.00
4/12/0212.00
5/12/0212.00
6/12/0212.00
7/12/0212.00
8/12/0212.00
data
mm
, °c
EF5EF6EF7TA 4
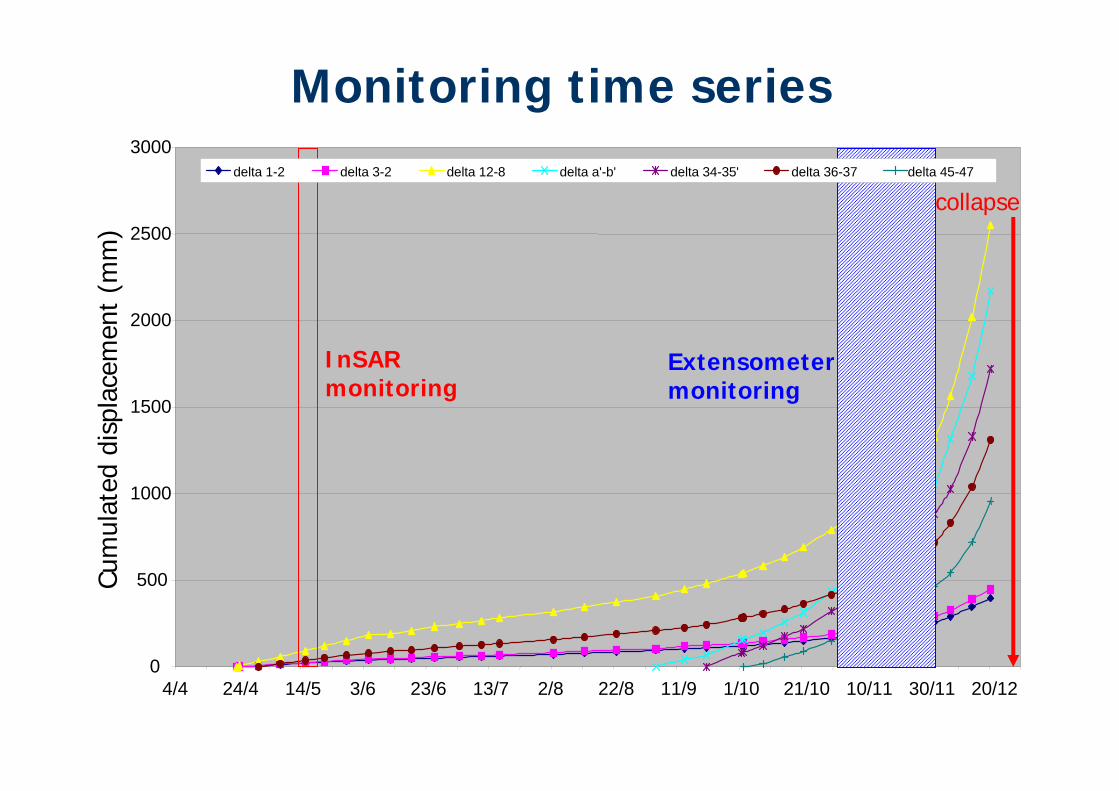
Monitoring time series
0
500
1000
1500
2000
2500
3000
4/4 24/4 14/5 3/6 23/6 13/7 2/8 22/8 11/9 1/10 21/10 10/11 30/11 20/12
InSAR monitoring
collapse
Cum
ulat
ed d
ispl
acem
ent
(mm
)
Extensometer monitoring
delta 1-2 delta 3-2 delta 12-8 delta a'-b' delta 34-35' delta 36-37 delta 45-47

Inverse velocity method
0.0000
0.1000
0.2000
0.3000
0.4000
0.5000
0.6000
0.7000
0.8000
0.9000
1.0000
1/9 9/9 17/9 25/9 3/10 11/10 19/10 27/10 4/11 12/11 20/11 28/11 6/12 14/12 22/12 30/12 7/1
1/v
(gio
rno/
mm
)
1/v1-2 1/v3-2 1/v12-8 1/va'-b' 1/v34-35' 1/v36-37 1/v45-47
collapse

0.0000
0.2000
0.4000
0.6000
0.8000
1.0000
1.2000
1.4000
1.6000
1.8000
13/7 23/7 2/8 12/8 22/8 1/9 11/9 21/9 1/10 11/10 21/10 31/10 10/11 20/11 30/11 10/12 20/12 30/12
1/v
(gio
rno/
mm
)
failure
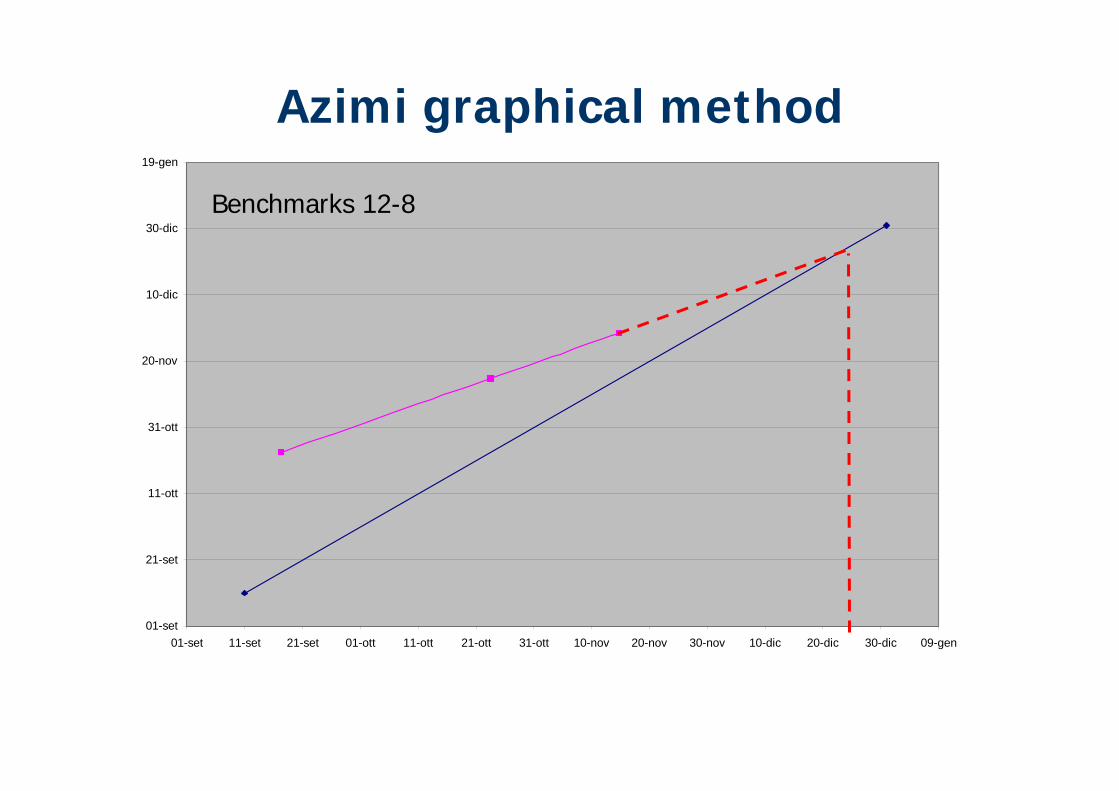
Benchmarks 1-2
Inverse velocity method
01-set
21-set
11-ott
31-ott
20-nov
10-dic
30-dic
19-gen
01-set 11-set 21-set 01-ott 11-ott 21-ott 31-ott 10-nov 20-nov 30-nov 10-dic 20-dic 30-dic 09-gen
Benchmarks 12-8
Azimi graphical method

Dispatches to civil protection authorities
• The landslide, until now sensitive to rainfall, is now increasing its rate of displacement independently from precipitation (letter of Prof. Canuti to the Mayor of Firenzuola, November 26th, 2002)
• The main landslide is on the point of collapsing. It is necessary that the evacuation measures will be strictly respected during Christmas holidays (letter of Prof. Canuti to the Mayor of Firenzuola, December 23rd, 2002)
• The main landslide will collapse within the first days of January 2003 (report of Prof. Canuti to the Civil Protection Commission, December 27th, 2002)

Numerical model of failure

Regional road
Perimetral crack
Landslide volume:500 000 m3
Angle of friction:34°
Graphical elaboration:Conefall(www.quanterra.org)
Risk scenario

December 14th 2002
Rock fall of 20 000 m3

December 15th 2002
Intitiation of the major collapse
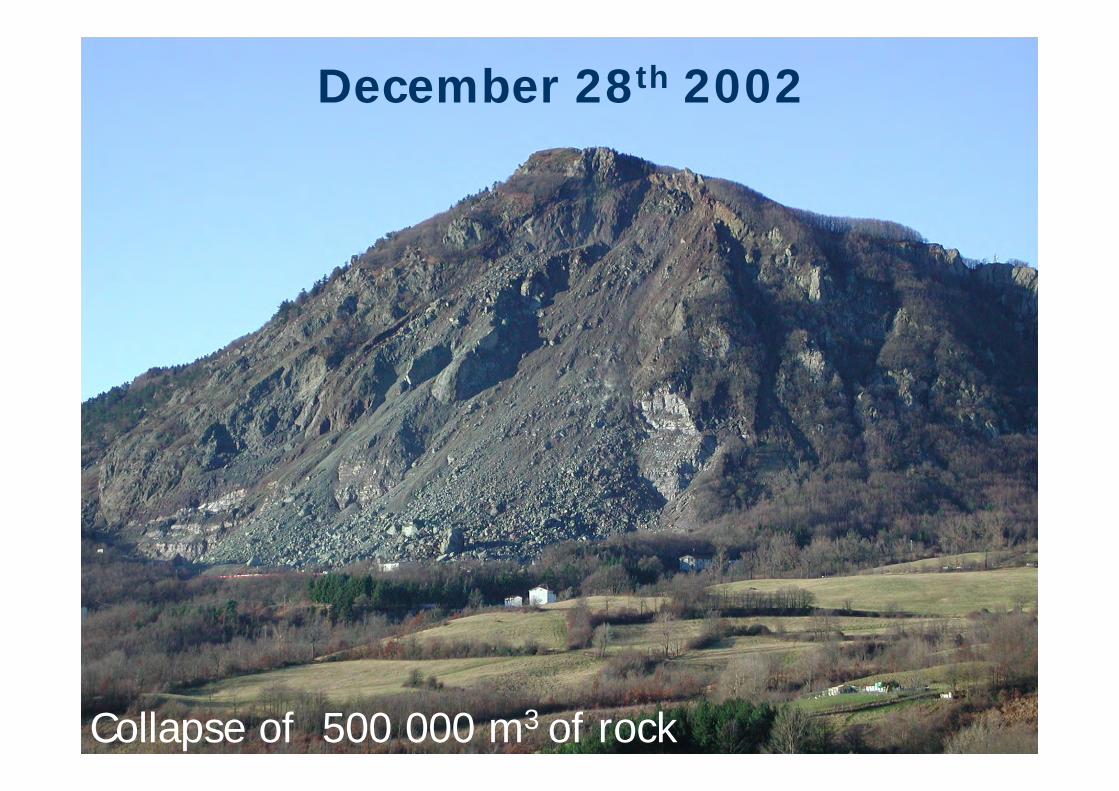
December 28th 2002
Collapse of 500 000 m3 of rock

Today