Census Atlas, Part- IX, Series-25, Chandigarh
109
CENSUS OF INDIA 1971 SERIES 2.S PART IX CENSUS ATLAS CHANDIGARH ARDAMAN SINGH Direct:or of" Chandigarh
-
Upload
khangminh22 -
Category
Documents
-
view
1 -
download
0
Transcript of Census Atlas, Part- IX, Series-25, Chandigarh
CENSUS OF INDIA 1971
SERIES 2.S
PART IX
CENSUS ATLAS
CHANDIGARH
ARDAMAN SINGH
Direct:or of" Ce"s~s C>p~rat:ions> Chandigarh
Part I
Partn-A
Partn'B
Part n·c (I) and (ii)
Pa'rt V-A
Partll-D
Partm
Par\IV
Part VI-A
Part VI·B
Part YIn·A
Part IX "'Part X
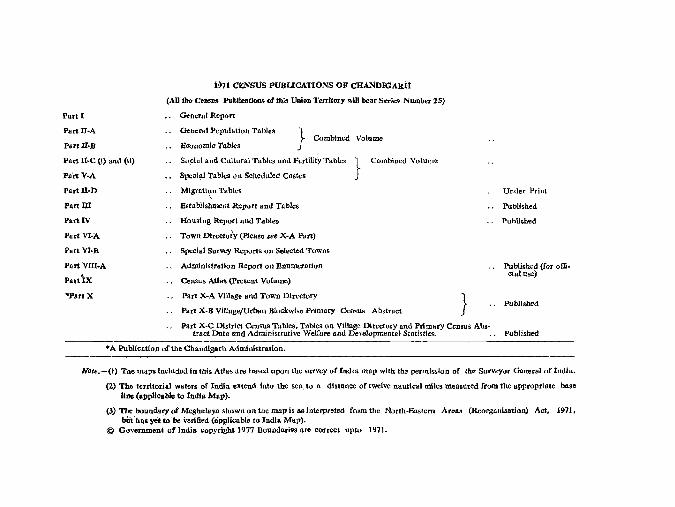
i?71 CENSUS PUBLiCATIONS OF CHANDIGARi:t
(AU ,he Census Publication.; of tbis Union Territory will bear Series Number 25)
General Report
General Population TabJea
Economic Tables ~ Combined Volume J
So,ciul and Cultural Tables and Fertility Tables }
Special Tables on Seheduled Ca.tes
MIgration Tables \
Establishment Report and Tables
Housing Report and Tables
Town Dlreetory (plea.e see X·A Part)
Special Survey Reports on Selected Towns
Administra1jon Report on Enumeration
Census Atla& (present Volume)
Part X·A Village and Town Directory
Combined Volume
Part X-B Vmage/Urban Blockwlse Primary Census Abstract 1 J
Part X·C District Census Tables* Tables on Village Directory and Primary Census Abs-
Under Print
Publlshed
Published
Published (for offi· clal use)
Published
tract Data and Administrutive Welfare und Developmental Statistics. PubH.shed
·A PubUcat{on of the Chandigarh Adrninl,trat{on.
Note.-(1) Tho maps inclUded tn this Atlas are based upon the survey of India map witll tile perlnlsslon of the Surveyor General of lndia.
(2) The territorial waters of India extend into the sea; to a dlsttmce of twelve nautical miles measured from the appropriate base line (applicable 10 India Map)_
(3) The boundary of Meghalaya shown on the map Is as interpreted ftom the North-Eastern Aroas (Reorgallbailan) Act, 1911. but -h.s yel to be Verified (aippllc'llble to India Map)_
© Gov.ramonl of India copyrighl1971 Boundaries are correcl upto 1971.
The history cf Chandlgarh, the city beautiful, begins with the partition of the Indian Sub·Contlnent. Lahore, the historic capital of undivided Punjab, having gone to Pakistan the need for a new capital for East Punjab arose. For a while the Government of East Punjab functioned at J~llundur. Thereafter as a make shift arrangement Simla became the Seat of Government. However, these places were not found suitable for a permauent Seat of Governmeot. Several claims were put and finally the present site was chosen for the capital city due to Its natural surroundings, viz. Patiali Rao on the west, Sukhna Choe on the east, the monsoon rivers and Shivalik Hills on the north-east, which make for a check on the haphazard growth of the city. Th,e other reasons fo(selecting this site were healthy climate, fertile land fOf growing trees, fmits and vegetables, plentiful supply of water and availability of building materials like stone, saud and cement. The city was named after 'Chandi', the God'dess of Chivalry. The holy shrine of Goddess 'Chandi' is located on Chandigarh·Kalka Road at a distance of about 12 kilometersin the State of Haryana.
2. Initially the plan of Chandigal'h wss entlUsted to Mr. Albert Mayar and Whittlesey of New York, Architects and Planners. At a later stage Monsieur Ii Corbusier, a Swiss born French Architect of world fame and the chief collaborator of U.N. Buildings at New York, was associated in this work along with Monsi(Ur Pierre Jeannert, his close associate in many of his great works of Architecture and Planning, Mr. Maxwell Fry, the acknowledged leader of modern Architecture In England and Miss Jane B. Drew, the best known woman Archi· tect in England. The present master plan of Chandigarh in execution is the outcome of the combined efforts of these experts.
3. The city has received wide acclaim as it represents the first major attempt at planning of a complete city which will function as a self·sufficient community. The basic planning unit of ~he city is the Sector. Each Sector is planned to be a self·contained unit providing for residential accommodation, a shopping centre, ed,uc:;tional and medical facilitks, [lace of worship, open space etc. The industrial area is to the east while the capitol complex is to the north.
4. The city was formally decleared open by the First President of India, Dr. Rajindra Prasad on the 7th October, 1953.

FOREWORD
it was In 1961 for the first time in the history of Indian census that a Census of India Atlas series'was brought out on various census themes as also non-census statistics for India and number of .t.tes'and union territories. Those aHases received wide recognition. During 1973-74. the Indian Census Centenary Atlas was brought out by the ~ffice of the Registrar General. India. The 1961 atlas waS eXhibited at the International Geographical Congress (1968) in New Delhi. A folio of the 1961 atlas comprising ten selected maps was distributed among the 1.500 delegates to the congres~, The centenary atlas was exhibited at the United Nations World Population Conference (1974) in Buchar.t.
Maps from the tahsil to the national level appear in most 1971 census table volumes. reports and publications. As part of the 1971 census taking. jurisdictiOJ;181 maps (bas\c census map documents) and urban land usc schematic maps were prepared to enrich the district census handbooks. the town directories and other census publications. The jurisdictional maps at taluka/dlstrict levels were combined In a volume known a. Administrative Atlas for each state with additional demographic information and published for six states. Others are likely to come out in course of time. These are the latest subject maps with reference to the 1971 Census. This uphoidSthe tradition of the census office of producing the largest number'of latest maps in the country.
The tabulation plan of the 1971 census aimed at presenting information based on various types of census data. The 1971 census of India atlas serles projects census data in thematic maps. The 1971 Atlas programme has been planned in a way that helps comparability with the 1961 data in areas like growth and density of population. sex, religion and literacy. Tile atlas selies. which forms part IX in the census publication series will provide coneladon of census data with non-census statistics and help in the analysis and evaluation of socio-economic problems at different administrative levels.
Planning of census atiases began along with pre-census preparations in 1969-70. A national conference Was organised in April. 1970 in the office of the Registrar General in which scholars like Prof. a.s. Gosal. Prof. V.L.S.P. Rao. Prof. Mansoor Alam. Dr. M.P. Thakore. Dr. L.S. Bhatt and Mr. H.M. Jones participated. It discussed the themes and techniques for the maps to be included in 1971 atlas. This scheme was sent to a large number of universities and institutions and valuable suggestions were received from Prof. O.H.K. Spate. Prof. John. E. Brush, Prof. John W. Dickay. Prof. R.M. Prothero and Prof. B.J. Garner. The scheme was then examined at conferences of directors of census operations at Courtallllm (1970) and at Pahalgam (1972).
The atlas series has been planned in such II way that a complete demographic profile for different administrative units in the country is available from the maps appearing In the atlases of state, and union territories and In the national voiume. Generally, atlases of states and union territories Include ~ight maps which give the geographical personality of the region. followed by population. seX and age. urbanisation. migration. argiculture. census industrial categories. electricity. transport and communications. trade and commerce and services. Thele are also maps devoted to scheduled castes and tribes. religion. education. housing and health.
ii
There has been slight deviation in the all-India volume to reduce the bulk of the atlas by combining themes on the maps. Certain inset arc added to provide more information on the subject. Diagrams, graphs, and tables based on quantitative measurement. of themes help in interpretations of each plate.
In the present all-India atlas, 80 plates arc included in four sections. Eleven plates show administrative boundaries and physical aspects. In the sections on demographic structure and trends, 35 plates cover! distribution of population, density and growth, sex and age and urbanisatIon. The economic aspects based'on census indust!'!al categories are 'shown in 13 plates. The socia-cultural aspects accounting for 20 plates relate to scheduled castcs ana tribes,. religion and education. A plate on the physiogeographical regions of Inuia has been included to enable the users to co-ordinate variables in "terms of such regions.
This Atlas programme has been exec~ted unaer the direction of Dr. B.K. Roy, Assistant Registrar General (Map). When Dr. Roy went on an U.N. assignment for two years, the work was carri(d on by the Map Division in Delhi nnder the supervision of Dr. R.R. Tripathi, now Map Officer. I congratulate all the members of Map Division in our Ddhi ClEee and the mtrnbelS of map units in the office of the directors of Census operations of state'lunion territori" on their lxcellent teEm work and their dedication which contributed to the sUCcess of this venture.
New Delhi; Gandhi Jayanti ; 7nd October, 1977
R. B. CHARI
Registrar General, India, Ex-officio Census Commissioner, India.
PREFACE
Besides the Survey of India and Geological Survey, the Census of India, at pre~ent, 1$ perhaps the largest olIngle producer of maps of the IadIan Sub-continent. A series of CeMu~ AdM wa1 brought out for the first time in 196 I Ccn1U1. Keeping In view the utlUty of thl~ project, It was contlnued III 1971 Censu< also. Shrl R. B. Chari, the eX-Registrar General, IndIa has depicted in great detail the picture of thl~ project in Ws 'Foreword' to this edition.
I have great pleasure in publishing this Atlas containing most useful information on the socia-economic conditions and demographIc set-up of the newly constituted Union Territory of ehandigarh for wWch it is the first Atlas. Most of the cartographic pre~entat[on going in this work had been planned and executed unde' the abl~ guidance of Shri K. K. Chakravorty, A~si~lanl Regl~trar General, India, who was holding additional charge of the office of the Director of Census Opcrations, Chandigarh, during his tenure for which I am grateful to Wm.
This Atlas aill1~' .t,depicting through. maps the demographic, social, cultural and economic trends recorded at the time of '1971 Census Explanatory notes specifying' the purpo~e and methodology are printed facing the maps enabling the reader to understand the cartographic presentation. Unlike other States, Chandlgarh is a small territory comprising onc district,two towns and twenty six inhabited v!l1age~ and eight uninhabited villages restricting the scope for,preparation and printing of .. good number of maps OIl all India pattern. Due to these limitations 38 plates have been printed fn thJs volume; three of these deal with orientation; two with physical features; seventeen with demographic structure and trends; seven with economic aspects and nine with soclo-cultural Mpects of this Union Territory.
I am greatly indebted to Shri P. Padmanabha, Regi~tr'" General India whose keen interest in bringing out tWs Atlas for a small unit like Chandigarh had been a g,'eat inspirad\?n fa, me. I mu;1 also express my gratitude to Dr. B.K. Roy, Assistant Registrar Genreral (map) and Dr. R. R. Tripathi, Map Officer, whose technical guldancc throughout have helped us in a great measure in accomplishing this work.
In my own office Shri B. D. Shann~, A"isiaut Director was of great help in getting through the maps and preparillgeKplanatorY. notes included in this Atlas He was ably assisted by Shri M. L. 'Sharma, Investigator and Shri Devinder Singh Sulhen, Draftsman for preparIDg ~be maps besides looking aner the printing. All other members of staff in this directorate were associated in one way or the other in preparatIo~ oC this volume. Mentlon may also be mado of Sarvshri Raj KUIllar and Yog Raj Grover, Statistical Assistants, Smt. Kamlesh Gupta, Mani~t Singh Bhatnagar and Attar Singh Thakur, Computor who made signlncant contribution in data pmce&sing and proof ",ading. Apa:t ftom t!t" )Ve are thankful to Shri S. R. Puri, Cartographer in the sister organisation of Haryana, for giving able guidance to the Draftsman III prepanng yarious maps as and when requested by him.
My thank! are also due to Shri R.. S. Nilkar, Controller; Shd P_ Oommen, Deputy Controller; Shri Amir Chand, Assist!,n! Controll~r and Shri Devinder Dutt Sharma Ofrset Overseer 'of the U. T. Administration Press, Chandigarh and their staff for arranging prmtmg of thIS Atla. excellently in shortest possible time.
Chandigarh,
March 26, 1979,
ARDAMAN SINGH
Direl-ioI of Census Operations,
Union Territory, Chandigarh.

Map No.
Foreword
Preface
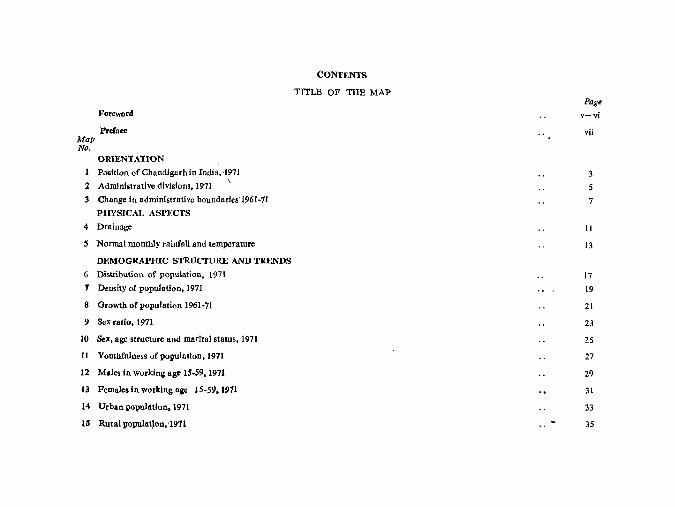
ORIENTATION
Position of Chandl gil r h in India, '1971
2 Administrative divisions, 1971 \
3 Change In administrative bonndarles'1961-71
PHYSICAJ~ ASP1·:CTS
4 Drainage
5 Normal monthly rainfall and temperature
DEMOGRAPIDC STRUCTURE AND TRENDS
6 Distribution of population, 1971
f Density of population, 1971
8 Growth of population 1961-71
9 Sex ratio, 1971
10 Sex, age structure and marital status, 1971
II Youthfulness of population, 1971
12 Males In working age 15-59. 1971
13 Females In working age 15-59.1911
14 Urban population. 1971
1" Rural populatjon,1911
CONTENTS
TITLE OF THE MAP Page
v-vi
vii
7
II
13
17
19
21
23
25
27
29
31
33
3S
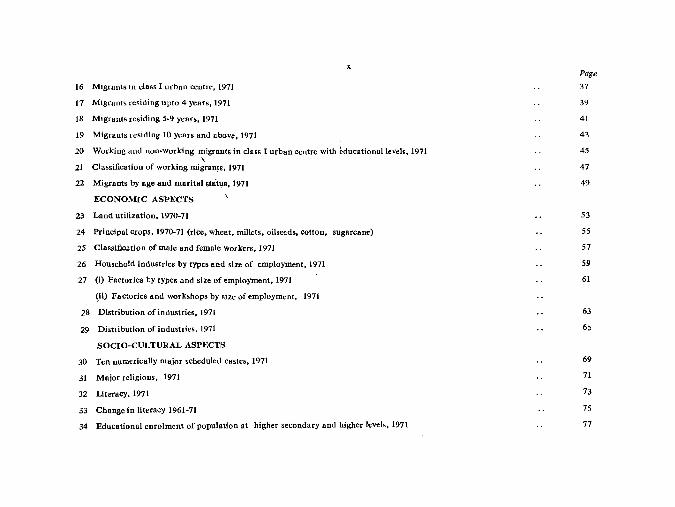
16 Migrants in class I urban centTe, 1971
17 Migrants residing u pto 4 yeaTs, 1971
18 Migrants residing 5 .. 9 years, 1971
19 Migrunts residln2 10 years and above, 1971
x
20 Working and non-working migrants in class I urban centre with cducatioDollevels, 1971 \
21 Classificutioll of working migr8n~t!. 1971
22 Migrants by age and marital staius. 1971
ECONOMIC ASPECTS
23 Land utilization. 1970-71
24 Principal crops. 1970·71 (dee, wheat, millets, oilsecds, cotton, sugarc8ne)
25 Classification ofmalc and female workers, 1971
26 Household industries by types and size of employment, 1971
27 (i) Factories by types and size of employment, 1971
(ii) Faetode. and workshops by size of employment, 1971
28 Distribution of industries, 1971
29 Disttibution of industries, 1971
SOCIO-CULTURAL ASPECTS
30 Ten numerically major scheduled castes, 1971
31 Major religions, 1971
32 Literacy, 1971
33 Change in literacy 1961-71
34 Educational enrolment of population at higher secondary and higher levels, 1971
Page
37
39
41
43
45
47
49
53
55
57
59
61
63
65
69
71
73
75
77
xi
35 Teach ... per 1000 of students at primary level of education, 1971
36 Teacher. per 1000 of population, 1971
37 Literates holding non-technical amI technical diplomas or certificates, 1971
38 Literates hol<ling university degrees/diplomas of the graduate level and above, 1971
Page
79
81
83
85

ORIENTATION
MAP 1
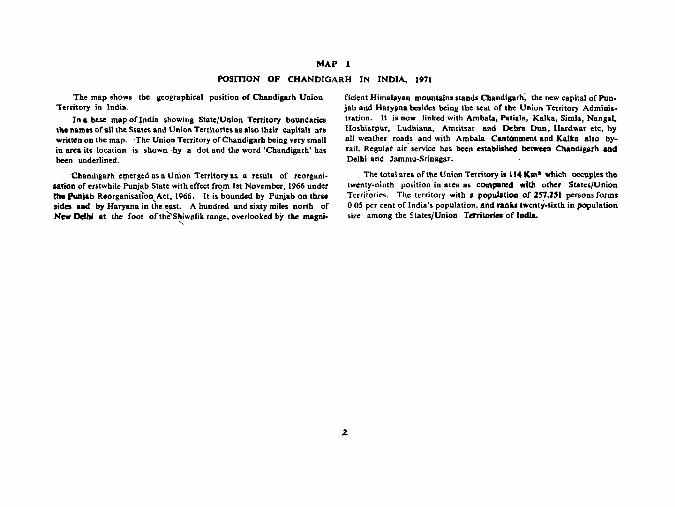
POsmON OF CHANDIGARH IN INDIA, 1971
The map shows the geographical position of Chandigarb Union Territory in India.
In a base map of India showing State/Union Territory boundaries. the names of all the States and Union Territories as also their capitals are written on the map. 'The Uni<;m Territory of Chandigarb being very small in area its location is shown ·by a dot and the word AChandigarh' has been underlined.
Chandigarh e~erged as a Union Territory u a result of reorganisalion of erstwhile Punjab Stale with effect from 1st November, 1966 under tile Punjab Reorganisati'on, Act, 1966. It is bounded by Punjab on three sides and by Haryana in the.east. A hundred and sixty mUes nonh of New Delhi at the foot ofth?S~walik range, overlooked by the magni.
(ieient Himalayan mountains stands Cbandigarh~ the new capital of Pun .. jab and Hary~na besides being the seat of the Union Territory Adminis. tration. It is DOW linked with Ambala, Patiala, Kalka, Simla, NangaJ. Hoshia.rpur, Ludhiana, Amritsar and Debra Dun. Hardwar etc. by all weather roads and with Ambala Cantonment and Kalka also by. rail. Regulaf air' service has been establilhed between Chandigarh and Delbi and Jammu-Srinagar.
The total area orth. Union Territory isl14ltm' which """upi •• the twenty-ninth position in area as compared with other States/Union Terriiories. The territory with" population of 257,251 persons forms 0.05 per cent of India's population, and rank. twentY·sixth in population size· among the States/Union TmitoriCI of 1ac1la.

MA.P" •
POSITION OF CHANDIGARH IN INDIA
-- - -~-----"_~er"'-·""·a ___ ",~"" ___ _"'''''_'''''''_''' __ 1a..
Thot_.,.""'....._.....,.., ___ _.,. .. _ .. .....-__ ~....._~) Art. 19;'"I.b<.ol ..... .,.".""" .... _......:: T_~~~I_ ..... """~ ..... ~_'_u.... __ a __ ~.,_._._....
_"" __ ........ lh.4a;p~._ .....
1971
... ., .......... ; ...... . ~'tClI ... /U .... 'DO'O T ........ ;IOO'I'-

MAP 1
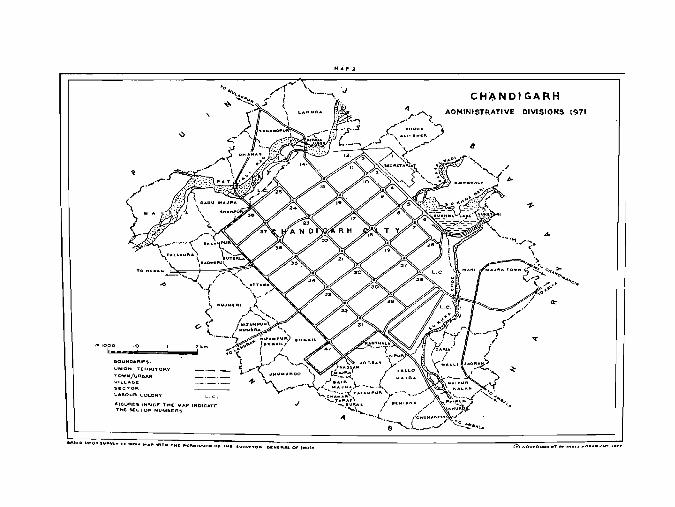
ADMINISTRATIVE DIVISIONS 1971
The map delineates the administrative set up of the Union Territory Chandig~rh.
Chandigarh comprises only one district and one tahsil. Jt has two urban units of Chandigarh City and Manl Majra town. The rural area comprises 34 villages of which 8 are uninhabited. The boundary of the Union Territory which coincides with the jurisdictions of the districl and the tahsil is marked with dash-dot lines. Boundaries of towns ,(urban units) are marked in. thick dash~dl)t lines, whereas the village bouri(la(ies are similarly shown in comparatively thin dash-dot li~es.
Persons. Union Territory/District Males. F~males
Chandfgarh ({) Population P.
M.
F.
(Ii) Area in Kmt
4
For Chandigarh City, sector boundaries with number are given as shown in the legend. The names of villages are given inside the village boundaries.
. \.The civic administration of Chandigarh city is with the Estate office~ whereas Gram Panchayat looks after the civic administration of Mani Majra ,town. Rural area is, however, under the administrative control of the'Deputy Commissioner. The area and popuJatjon for IuraJ and urban are~ of Chandigarh are give'n below ;-
Total, Rural Urban
257.251 24.311 232.940
147,080 14.444 131,636'
110,171 9.867, 100.304
114 '0 56'4 57-6
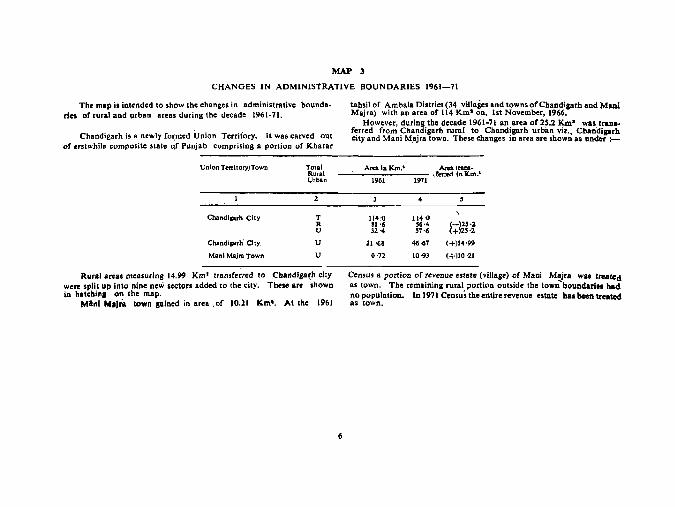
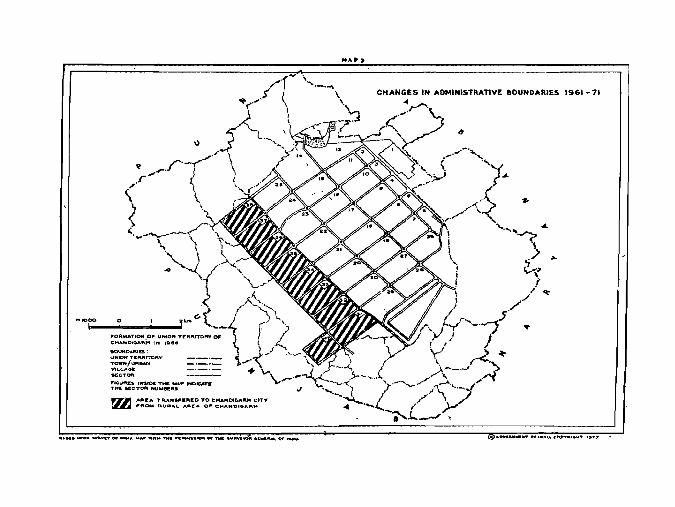
MAP 3
CHANGES IN ADMINISTRATIVE BOUNDARIES 1961-71
The map is intended to show the changes in administrative boundaries of rural and urban areas during the decade 1961·71.
Chandigarh is a newly fo~med Union Territory. It was carved out or erstwhile composite state oj Pu.njab comprising a portion of Kharar
Union Terrltory/TowII
Chandlprh City
Chandlgarh' ClW
Manl Majra Town
Total Rural Urbap
T R U
U
U
Rural .reas measuring 14.99 Km' tran.ferred 10 cbandisarh city w .... split up inlo nine new seclors added 10 the cily. Th ... are shown in halehinl on Ihe map.
Mini "'.Ira IDwn sained in are •. of 10.21 Km'. At Ih. 1961
6
tahsil of Ambala District (34 villages and towns of Chandigarh and Mani Majra) with an area ·of 114 Kms on, 1st November, 1966.
However, during the decade 1961·71 an area of 25.2 Km' was tran .. ferred from Chandigarh rural to Chandigarh urban viz., Chaniligarh city and Mani M,ajra town. These changes in area are shown as under :-
Arc~ln K.m.' AreatraDS-~rerred In Ken.'
1961 1971
114:0 114,0 81 '6 56·4 ~-125'1 32 '4 57'6 + 25·2
31 '68 46·67 <+)14,99
0'72 10'93 (+)10'21
C.nsus a portion of revenue .slale (villase) of Mani M~ra was treated as town. The remaining rural portion outside Ih. town boundarle. had no population. In 1971 Census the enlire rev.nue estate has been trealecl as town,
MAP a
CHANGES IN ADMINISTRATIVE BOUNDARIES 1961-71
...


PHYSICAL ASPECTS
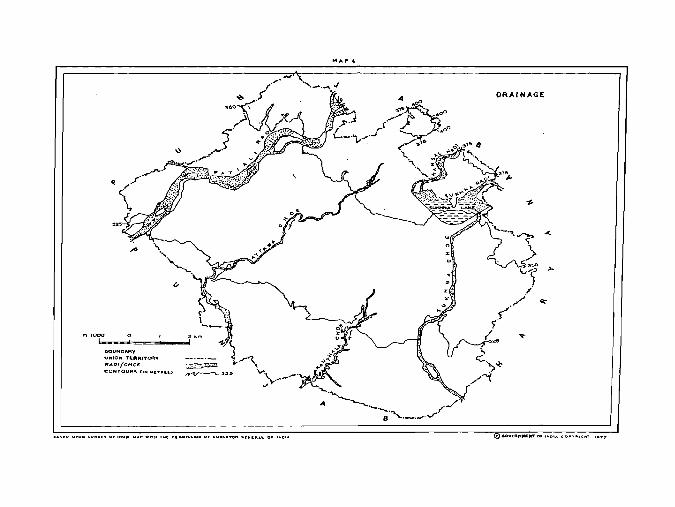
MAP <I
DRAINAGE
The mal' depicts the physiographic patterns of the Union Terri· tory.
The variation"S',,~n altitude arc shown by contours on the map si,ni· fyinS altitudes ranging below 325, 325·350, 350·375,375-400 and above <100 metres. The imp'or,:"-nt 'oboes' are marked suitably on the map.
10
Barrins some offshoots of Shiwalik raDge system touching the (,inse areal on tbe north-ea.t boundary~ Chandigarh Union Territory represcnt. a plain ar.... The two ••• sonal streams of Sukhna Choc and Patiali Rao as well as saine of the minor hill torrents which run through tbe union territory, ICrve as natural drainage system.
-1<{,
{.-'""' \ '", ;\-.-"-_.
DRAINAGE
MAP S
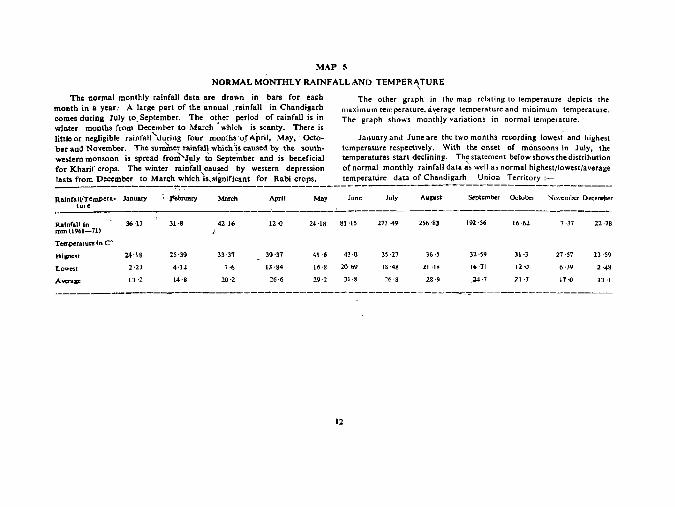
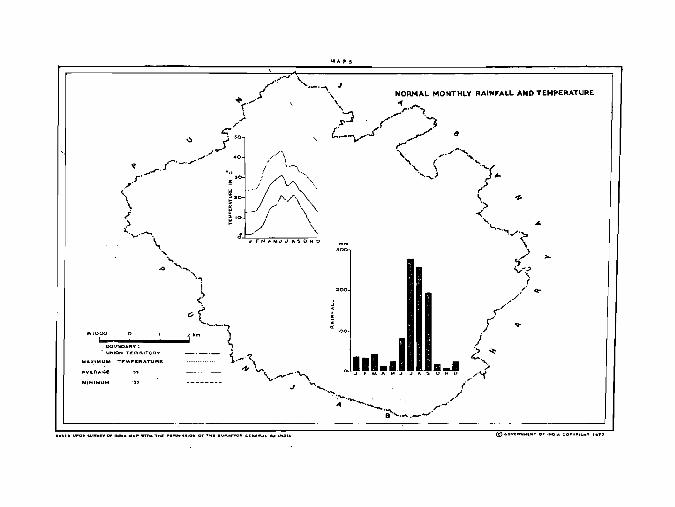
NORMAL MONTHLY RAINFALL AND TEMPERATURE \
The normal monthly rainfall data are drawn in bars for each month in a year> A large part of the annual . rainfall in Chandigarh comes during July to_ September. The other period of rainfall is in winter months from December to March ~ which is scanty. There is
The other graph' in the map relating to temperature depicts the max.imum temperature. a,:erage temperature and minimum temperature. The graph shows monthly variations in normal temperature.
littleor negligible rainfaU'''during four monthsio.fAprU, May.' Octo.. Januaryand Juneare the two months recording lowest and highest bet and November. The summer rainfaU which:is caused by the south· temperature respectively. W,th the onset of monsoons in July. the western monsoon is spread from"J:u1y io September and is beneficial temperatures start declining. Th~ statement below shows the distribution for Kharif crops. The winter rainfall'caused by western depression of normal monthly rainfall data as well ar, normal highest/lowest/average lasts from December to March which Is "significant for Rabi crops. temperature data of Chandigarh Union Territory:-
Rainfall/TemPera-ture ---
Rainfaliin mm(1961-71)
Temperature tn Co
His\lcst
Lowest
A_.ge
--------------------------------------------------------~------~,-',' January pebruary March
36'13 31·8 42-16
24·18 .5·39 33·37
2·23 4·12 7'6
13 ·2 14·8 20·2
April May June July August September Octo~r November Decel"lrber
---~------..:....------------------------------------
12·0
39·37
13 '84
26'6
24 '18 8J-15
41'. 43·0
16'8 20 '69
29·231·8
12
273 -49
35 ·21
18 '48
256·83
21 '18
28 ,9
192 ,56
32-59
16 ·71
.24.,
16'62
31-3
12'0
2.1 ·7
7 ·37
27 ·57
6·39
11'0
22 ·18
lJ ·59
2'48
13 ·1
MAPS
,


DEMOGRAPHIC STRUCTURE AND TRENDS
MAP 6
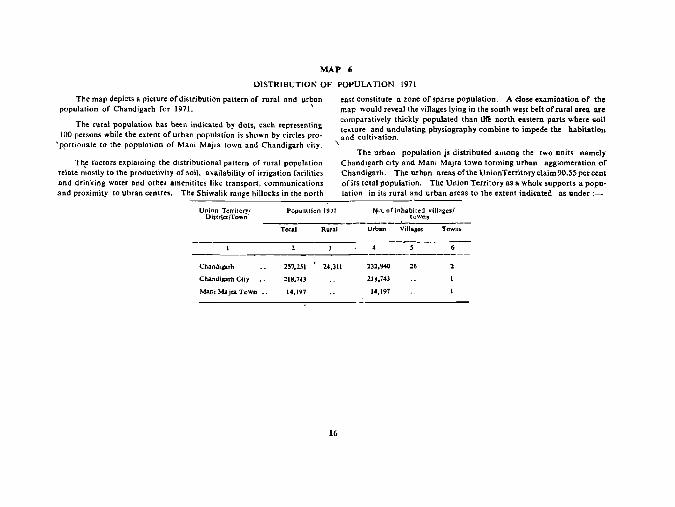
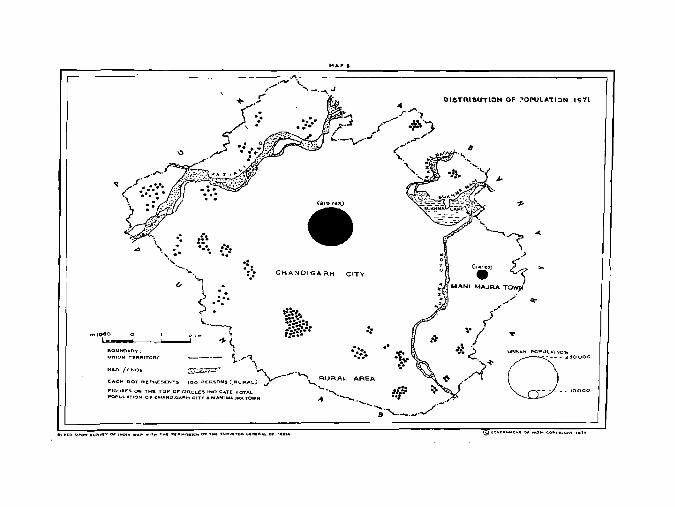
DISTRIBUTION OF POPULATION 1971
The map depicts a picture of distribution pattern of rural and urban population of Chandigarh for 1971. '
The rural population has been indicated by dots, each representing 100 persons while the extent of urban population is shown by circles pro
"'pprtionate to the population of Mani Majra town aDd Chandigarh city.
Thf factors explaining the distributional pattern of rural population relate mostly to the productivity of soil. availability of irrigation racilities and drinking water and other arnenitites like transport, communications and proximity to ubran centres. The Shiwalik range hillocks in the north
\
Union Territory.' District/Town
Population 1971
Total Rural
east constitute a zone of sparse population. A close examination of the map would reveal the villages lying in the south we~t belt or rural area are comparatively thickly populated than tHe north eastern parts where soil te~ture and undulating physiography combine to impede the habitation and cultivation.
The urban population js distributed among the two units namely Chandigarh city and Mani Majra town forming urban agglomeration of Chandigarh. T~e urban areas of the UnionTertitory claim 90.55 percent of its total population. The Union Territory as a whole supports a popu~ lation in its rural and urban areas to the extent indicated as under ;-
N.J. of inhabited villages! towns
Urban Villages Towns
Chandjgarh
Chandlgarh Ctly
Mani Majra Town ..
257,251
218.743
1",197
24,311 232,940
218.743
14,197
16
m,OOO
.: ... \, .' " .-
"
'-.._
... .. :z .......
(, i
<~ • ::. ~j •
.... _-.... , +(.
.. . ::. ...
&OUNO~f\Y : i UNION TERI'IITO~'( _._._ i..."..'\
\ . ............ -'\.J
CHAND~GARH CITY
::
.... ....... .. NIUU fel-4o~ ~ \.*\ __ "" EACH DOT R£F'F\E!.ENT$ 100 "ERSON5 ~RUFl,"_L) J~ \...." R.UR.AL- AREA
FI-(oUR!:5. ON THE TOP OF' CI'R;O=Le$ INPICAoTE TOT ... l. ' '-., d:.,: POPUI.. ... T.ON Of' 1; ..... NO,c:. ... 'U ... -CITT .. ""' ... Nl ........ fU.TOWN ... - ........ __ ··1
,.-;;.,._._./
~ISTI\I&UTIOH OF ~OPUL"'"IIo" 1971
MAP 7
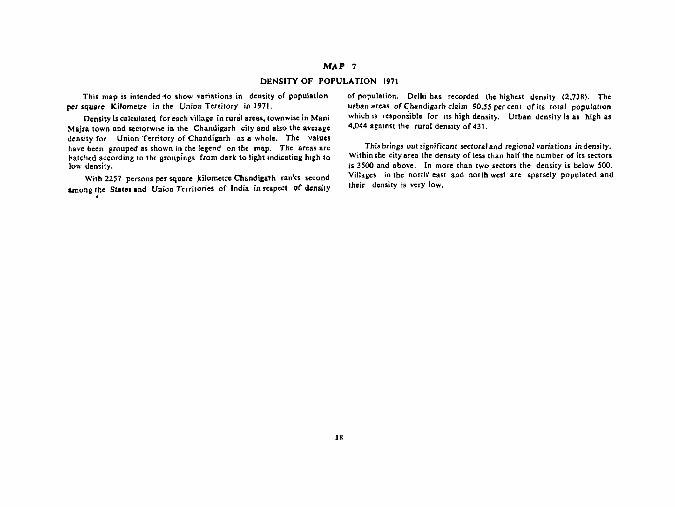
DENSITY OF POPULATION 1971
This map is intended'io show variations in density of population pC'r square KiJomet,re in the Union Territory in 1971.
Density is calculateti for each village in rural areas, townwise in Mani Majra town and sectorwl)c in the Chandigarh city and also the aveIsge density for Union Territory of Chandi"garh as a whole. The values have been grouped as shown in the legend on the map. The areas I1re l1atchcd according to the groupIngs froin dark to light indicating high to low density,
With 2257 persons per square _kilometre Chandigal'h ranks second arnong ~be States and Union Territories of Jndia in respec. of density
18
of population. Delhi has recorded the highest density (2,738). The urban areas of C:handigarh claim 90.55 per cent or its total populat(on which IS responsible for its high density. Urban den~ity is as high as 4,044 aga,nsllhe rural denSIty of 431.
This brings out significant sectoral and regionsl variations in density. Within the city area the density of less than half the number of its sectors is 3500 and above. In more than two ~sectors the density is below 500. Villages in the north' cast aDd north west are sparsely PQPulat('d and their density is very Jow.
"'1000
""IIIOU"'Oo\lII) ••
unION TCARITO"y
TOWN!UIII,U.N
VII.I.A(oC
"tCTO~
O_T ... NOT .. V ... IL. .... I.£
UNlroIl'I .... ITCO )(
, Mo\ .. ?
DENSITY OF POPULATION 1971
,_
MAP 8
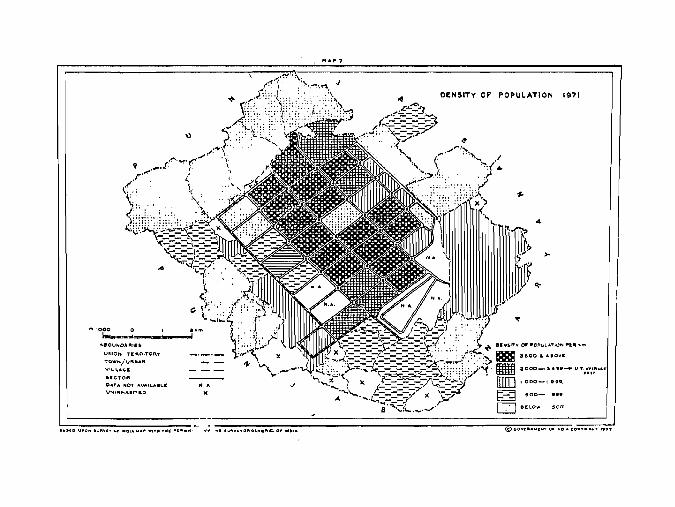
OROWTH OF POPULATION 1961-71,
The mop depicts thclnter-cen.al sr,owth rat. of populQtlon In dllT,rent , .reu of th. Unl!)n Territory of Chan~8arh a. wen •• the prossur. which the newly added pcpulntlon exert. on the oxl'tlnll population.
The Increase In populotlon I. d.plcled by circle. drawn prop,rtlonate totolal population f!)reuch of tile two urban Mt .. vlz.,Chnndlsnrh city ena Manl Majrs town nnd rUI al .roa$ of Ihe Union Territory. Th. ptrcenta¥<, fillur., Inside the clrclo ropr ••• nl the Inter-con,.1 Incr •••• oVer 1961 population II percontl!!' of 1971 population. Figur •• at the
20
top of clrcl •• Indicate populotlon in 1971. f>orCClltUsc variation (Saln or 10 .. ) durlns 1961-71 .. perccntllse of 1961 PUpulullnn I •• hown by dlff.renl hUlchlng.ln the background of the rrlp"cllve unit In accordance with the r,nns.' Indlclllcd In Ih. le¥<'od on th. map.
During 1961-71, popul.llon (If Chllndlgarh hAS Incr •• sed from '119,881 to 2'7,2'1 Indlcallng un absolute 1 ncrc ••• "f 137,370 perlons IInO a percenta&e incr ••• e of 114 ·59. Growth ral. in urblln ur •• Is r.ooro04 .s +134 '67; while It I. +17 ,91 fur rurlll .rc. during tho Urn. period.
""1000 0
!lOUNCARlE:Ii:
UNION TE"'AITOl=I:y
TOWN/U"" ..... N
M,.." •
... IIIOWTH OF POPU~ATION 191111-71
MAP 9
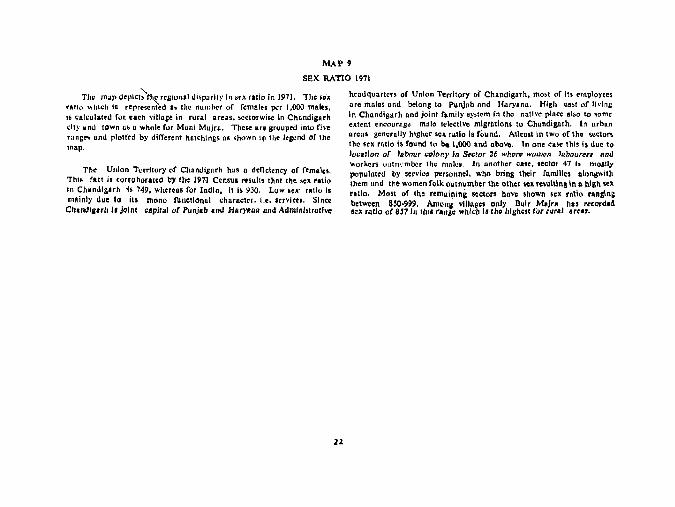
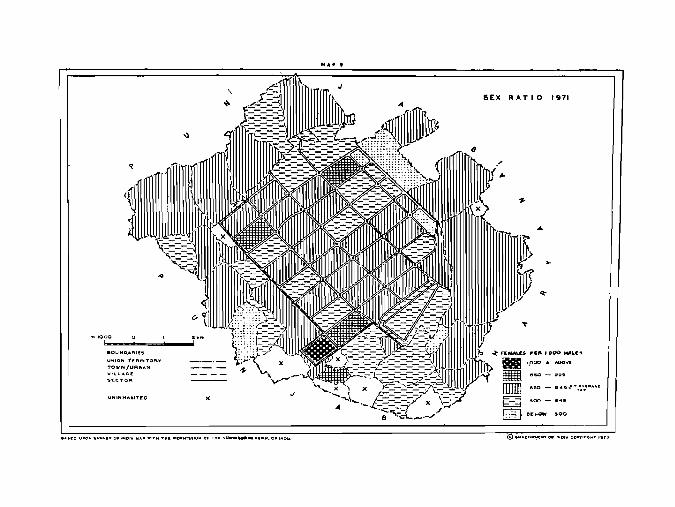
SEX RATtO 1971
The m.p d'PICl~,.gl"nll di'parily In .rx rali" in 1971. The .ex ratio Ylhil.!h i! reproscnted b the number of females per 1,000 ma(f"s, is calculated for. nch vIUose in rur.1 areas. >cctorwise in Cliondiglrh city lind tOwn ns D whol~ for Munl Mujru. Thcfoe are gruuprd Into five ",ns" nnd plotted by dlff.rent hotchlngs n. shown I. the legend (If the map.
The Union Territory of Chundignrh hus a dcnclcncy of fem.l ••. This fftct Is corroborated by Ihe 197·1 Census ... ults th., the ,.x rodo In CllIlndl&lrh 'Is 749, where •• for Indio, it is 930. Low.ex ratio Is mainly duc to It. mono IIInctlonal clinrocter. I. •. ,.rvlce.. Since
Chand/Barh "jolnl •• 1';1.1 or Punjlb and HarYBna and Admlnblrotl",
21
he.dqunrtcrs of Union Territory of Chondig.rh, most of its or"ploy,e' ore mnles and belong to Punjab nnd Haryan.. High 00,1 or IIvln~ In Chondlgarh nnd joint r~mlly .y.tem In the native place al,o 10 some extent encourn.s~ malo selective migrb.1ions to Chandignth. In urban orca_ generolly higher sex rutlo i. foune. Alleo.tln two of the .ecton the ,ex ratio i. roune to be 1,000 nne nbove. In one case this Is due to local!"., of l.bour cglony in S~ctor 26 where women InDou,,,,, and 'Workers (,Jutu': mbcr the mnh:s. In another CISC t sectOr 47 Is mostly populated by ,ervi •• personnel. who brinS their famill.. nlollllwlih Ihem nnd the women folk outnumber the other "'. re,ultlng In .. blgh sex ratio. Most of the remnilling sectol'1l bove .hown .eX rotlo raniling between 850·999. Amanlil villas •• only nulr Maj,. hl$ r<corel.", BeX rallo of 857 In Ihl. rl",. whlcb Illha hlshe5l1'or rural ar ••••
e01"l"O"'RI~~
UNlON TIl!:AAITORY
TOWN/UA.PJ~N
VILLAGf:
SEC'TO"
NA' ,
J
SEX RATIO 1971
MAP 10
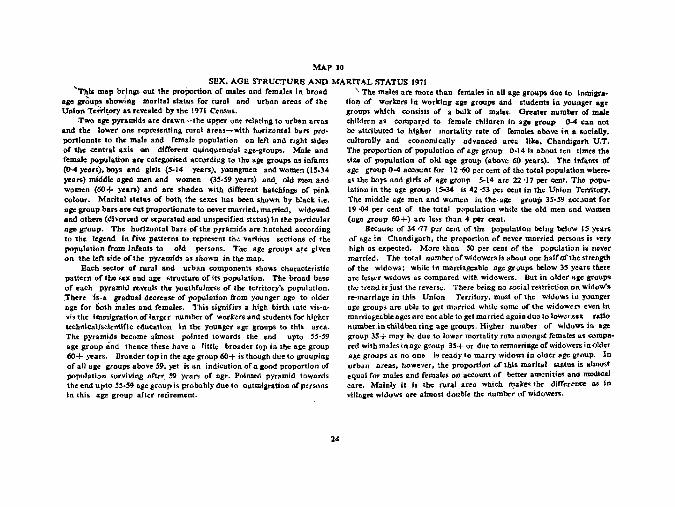
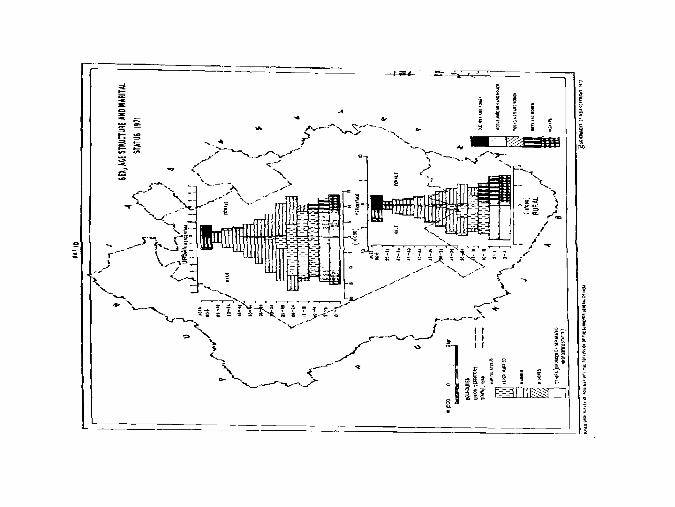
SEX, AGE S'l'RUCTURE AND MARITAL STATUS 1971 'T~. map br,lng. out the proPortion of males Dnd rem ale. In broad \ The mal •• ate more than remales in .11 ago groups due to inmill ....
age group~s showing marital status ror rural and IJ.rban areaS of the tio~ of workers in working age groups and students in younger age Union Temtorl' .s revealed by the 1971 Censu.. group, which consists of a bulk of males, Greater number of mal.
,Two age pyramids arc drawn-the upper one relating to urban areas children as compar,ed to femaJe chihlten in age group 0·4 can not and the tOWer one representing rural areas-wlth hC)rizontal bar'S pro- be attributed to higher mortality rate of females. a.bow in a socially. portionllte to the male and female population on left and right sides culturally and economically advanced area lib. Chandigarb. V.T. of the central axis .. n dUTetent quinquennial age·group$. Mal. and The proportion of population of age group 0.141, about ten Ilmro the female population arc categorised according to the ago glonps as infants .i .. of population of old age group (obove 60 yoors). The Infont. of (0-4 years). boy. and girls (5.14 .years), youngmen and women (15.34 age gloup 0-4 account for 12 -60 por cent of tho 'otal population where· years) middle ogeo men and women (35-59 years) and. old men and OS the boys and girls of age group 5-14 are 2Z '17 per cent. The popu. women (60+ years) and are shaden with different hatchings of pink lation in the age group 15·34 is 42 ·53 per cent in the Union Territory. colour. Marital statu'S of both the sexes has been shown by black i.e. 'the: middle age men and women in .the- age group 35 .. 59 accaunt Cor age sroup bars arC" cut proportionate: to nover married, married, widowed 19 1)4 per cent of the tota1 p,;:'pulation While the old men and women and others (divorced or separated and unspecifiea. status)ln the particular (age group 60+) are less than 4 per cent. age group. The horizontal bars of the pyramids are hatched according Because of 34·77 per cent of the population being below 15 years to the legend in five pattfrnl to represent th~ variOus sections of the of agl! in Chandig:at'h. the proportion or never married persons is vcry popu1atioft Crom Infants to old persons. The age groups a"e given high as expected. More than SO p~r cent of the p:tpulation is never on the left side of the pyramfds as shown in the map. married. The total number of widowers is about one half of the strength
Each sector of tural and urban components Shows characteristic of the widows,; while in marriageable age groups below 3S years there pattern of the sex and age structure of its p'opulation. The bread base are lesser widows as compared with widowers. But in oldet age groups or each pyramid reveals the youthfuJncs'i of the territory's population. the trend is just the reverse. There being no social restriction on widow's ,There is.a gradual decrease of population from younger age to older reo-marriage in this Union Terri1ory. most or the widows in younger age for -both males and females. This signifies. a high birth t ate vis-a~ age groups are able to get married whil~ some of the widQWI;rs even .n vis the immigt"ation or larget number of workl!rs and students ror nigher marriat:eable ages are not able to get married again due to lower.sex ratio technical/scientific tducation in the younger :age groups to this area. number.in children ling age groups. Higher number of widows in age The pyramids become almost pointed towards the end upto 5S~59 group 35 + may 00 due to lower mortality rntc! amongst females a'S cowpa-a~ group and thence tht:se have a little broader top in the agc:group red with males inage group 35+or due to remartiage afwidowers in older 60+ ~ars. Broader top in the age 'group 60+ is thllUgh. due to grouping age groups as no one is ready to marty widows in olaer age group. In of aU age groups above 59, yet is an indication of a good proportion of urban areas, however, the proportjon Df this marital itatus. is almost poJYUlation surviving after, 59 years of age. Pointed pyramid towards equaJ for males and females on account of better amenities and medica) the end upto 5S~59 a,ge grQup is probably due to outlUiaration oCpersons care. Mainly It i~ the rural atea Which n;takes the difference a5 in in this age group after retirement. villaa:es widows are aOOo$t doubJe the number of widowers.
24
__'I,-<r_._._~_ "'o,'=_t;:. -~~'~:::;::=!=====;---]\ i "ii: ~
! ~
... ~
~ '" ~ ~ - ~ = .... t; ... ~ § .... sf
MAP 11
YOU'rHFULNESS OJ' POPULATION 1971
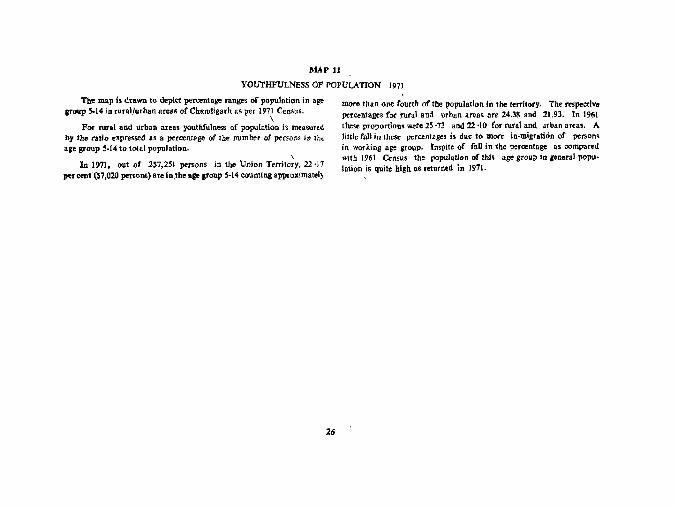
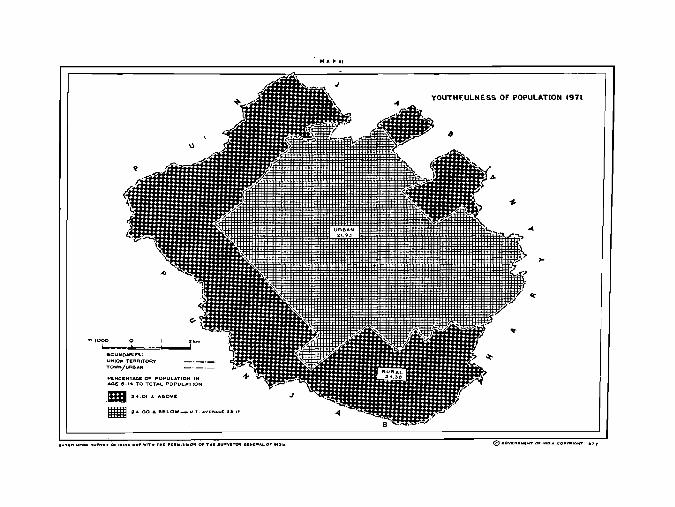
The map Is drawn to depict percentage ranges of population in age ,rOllp 5-14 in rural/urban areas of Chandlgarh.s per 1971 Census.
\ Par rur.1 and urban are •• youthfuln ... of population is measured
by the ratio e~pressed as a percentage of Ihe number of persons in Ihe age Bt0up 5-1410 total population.
\
In 1971. out of 2S7.2S1 pe1'S()ns in the Union Territory, 22 ·J7 per ccnt(S7,020 persGns) are in,the age grnup 5-14 counting approximately
26
more than one fourth of the population in the territ()fY. The respective percentages for .rural and urban areas are 24.38 and 21.93. In 1961 these proportions were 25 ·73 and 22 ·10 for rural and. urban areaS. A lillIe f.lI in these percentages i. due to mar. in-migration of persons in working age group. Inspite of faU in the percentage as compared with 1961 Census the population of this age group in general popuI.tion is quite high as returned in 1971.
m '000 e.oUND,ilRII!:S:
UNION TEI\RITORY
TOWN/1,.Fl!>A ...
P£.RCENTACoE OF POPULATION IN AGe; 5-'" TO TOT .. L POPUL .. TIO ...
. II1II 2<4.01 & A&OVe;
• 2" 00. e.ELOW_U.T. oOVIU,oOc:.£ a •. "
H""1t
YOUTHfULNESS OF POPUL"TION 1971
8
@GOV£" .... I[ .. T or , .. 11>, .. CII>"""IGHT '.77
MAP 12
MALES IN WORKlr-lO AOE 15-59, 1971
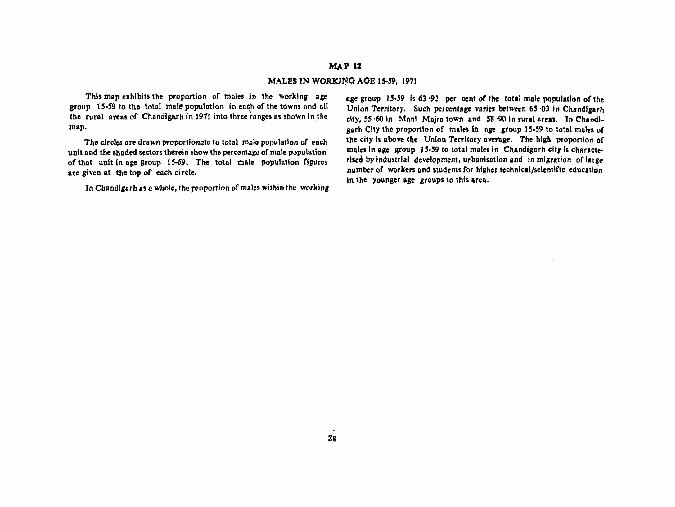
This m~p exhibits the proportion of molts In the working Dge group 15·59 to tho total male popuiotlon in .nch of the towns nnd nil Ibe rural orca. of Chandlsarh In 1911 into Ihree ~anges os .hown in th. map.
The cIrcles are drawn proportionate to total male population of .ach unit and the shaded sectors therein show the percontago of mal. papulation of that unit in a,e group iS~9. The totnl male population figures are given at the top of each circl ••
In Chandls.rh as. whole, the provortlon or mile. within Ihe working
28
nse group 1$·59 is 63 '93 per cent of the totll mal. populallon ofth. Union Territory. Such percenl.ge varies belwren 65 '03 In Ch.ndlllirh dty, 55·60 In MDnl Mnjrn town anc! 58 -90 in rural are.,. In Cbandl. garh City the proportion of male. In oge group 15·59 to total male. of the city I. above the Union Territory ...... 11". The high proj)Ortion ~f mal •• In age group 15·5910 total males In Cbandlgarh clt,l. charlote· rlsed by industrial development, urbanl.atlon and in mlgrBtion of large number of worke .. and ~tud.ntsfor higher technlcal/scltntiflc educstl';n in tht younger aie "oups to this area.

...
m 1000 -_ ....... -..... UNION T£~RITORY
"OWN/V~B"'I'I PERCENT ... C.E0'" "" ... t..E ~Pu'-"1'ION IN YJQRKlPII(,o ""GJ:; 15-$9 TO 'TOT"L io.vr.LE POPULATION
.. 65.00 a. AeOVE-
~ 5450()- 604.OQ.----..-"'.T ... VII: .... c.& 6:' .• ,. m ~!I.9'1i' .. Dr:\.QW ~:;~:'''...~TL:'';oT~O: ... ~:.~~.._C,L::,' .. o'e ... n
"'ALEa IN WORKING AGE 1!i-59 1971
MAP 13
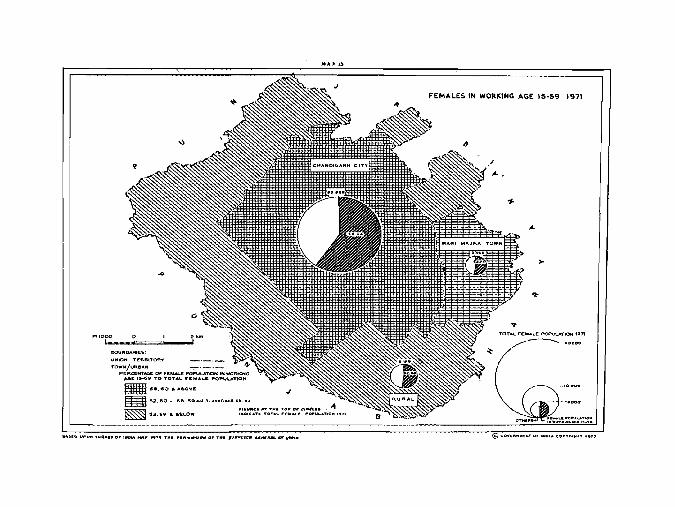
FEMALES IN WORKING AGE IS-59, 1971
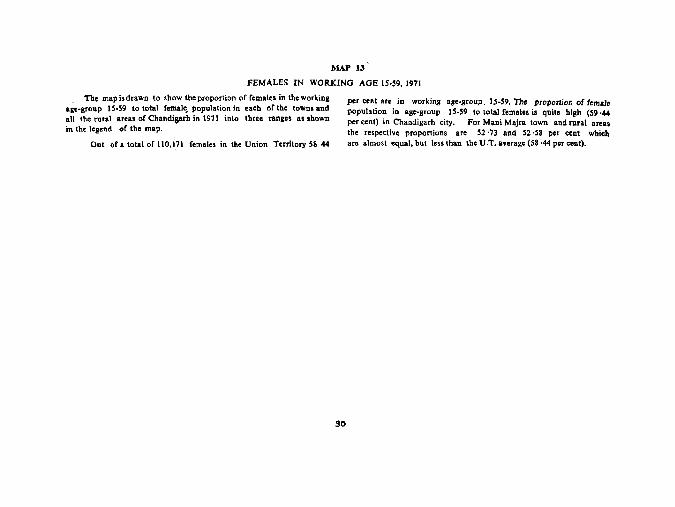
The map is drawn to .how the proportion of females in the working aSo-grollP 15-59 to total female. population in each of the towns and all the rural areas of Chandiearh in 1971 into throe rang.. as shown in the legend of the map,
Out of. total of 110,1,71 remales in the Union Territory 58 ·44
30
per ce~t are in working aBe-group. IS-59, The proportion of female population in age-group IS-59 to total females is quite high (59'44 per cent) in Chandigarh city. For Mani Majra town and rural areas the respective proportions are 52 ·73 and 52,58 per cent which are almost equal, but l.ss than the U .T, average (58 ,44 per cent).
MAP 13
FEMALES IN WOIiKING AGE 15-59 1971
>-
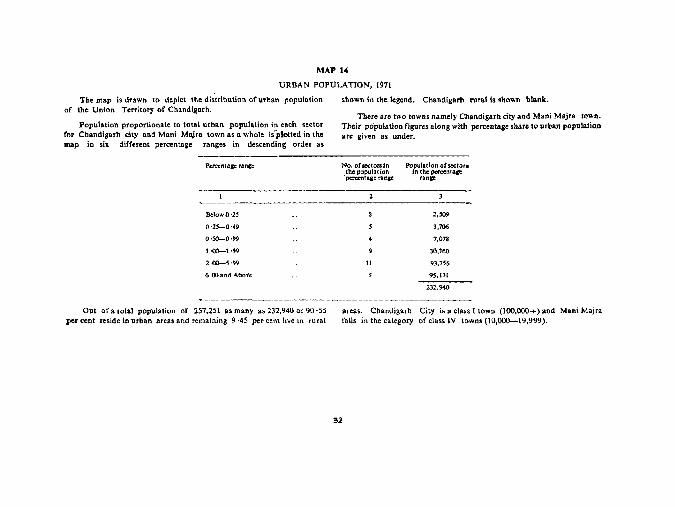
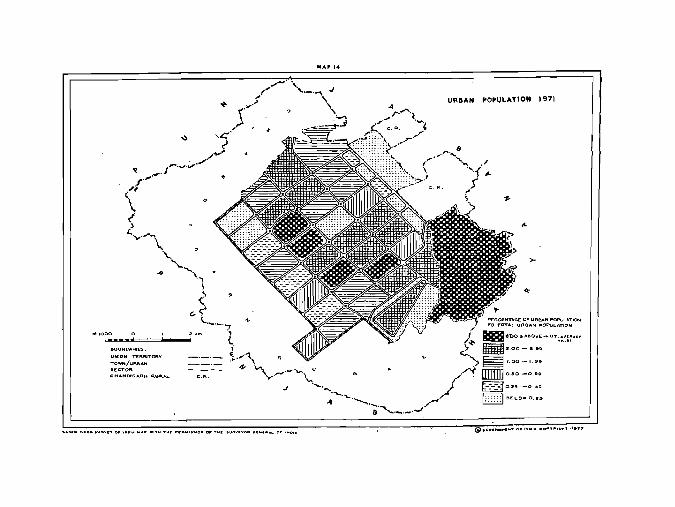
MAP 104
URBAN POPULATION, 1971
The map is drawn to depict the dis.tribution of urban population of the Union Territory of' Chandigarh.
Population proportionate to total urban populfltlon in each sector for Chandigarh city and Mani Majra town as a whole is'plotted in the map in six different percentage ranges in descending order as
Percentage ranee
BelowO'23
0,2'-0,49
0·.50-0·99
1·00-1·99
2 ·00-5·99
6 ,00 and AooY'e
Out of a total population of 257.251 as many as 232.940 or 90 ·55 per cent Itside in urban areas. and remaining 9 ·45 per cent live in rural
shown in the legend. Chandigarh rural is shown blank.
There are two towns namely Chandigarh city and Mani Majra town. Their population fjgures along with percentage share to 1!rban population are given as under.
No. of sectors In the population
'perecnt8ac ranlt'
II
Population of soctor, in the pcrccnta~
range
2,'1»
),706
7,078
30,760
93.'56
9:5.13l
232,940
areas. Chandigarh City is a class I town (100,000+) and Mani Majra fall, in the category of class IV towns (10,000-19,999).
32
UNION T"~Ft~TORY
TOWN/URBAN SECTO~
CH.NOtO:OAR,H R.U""1..
J
J
...
URBAN POPULATION 1971
PERCENT".GoE OF UR.B.4N F'OPUl- ... TION
TO TOT"'l vIlB"N POPULATION
Mel)() ."&O\lE_V:1'~~~~~"'6f Ui!_OO-5.a9
§,.oa.-I.gg
mnm 0.50 _0.99
t-:-:-'1 0.25 _0 49
1:;;:::1 BELO .... 0.25
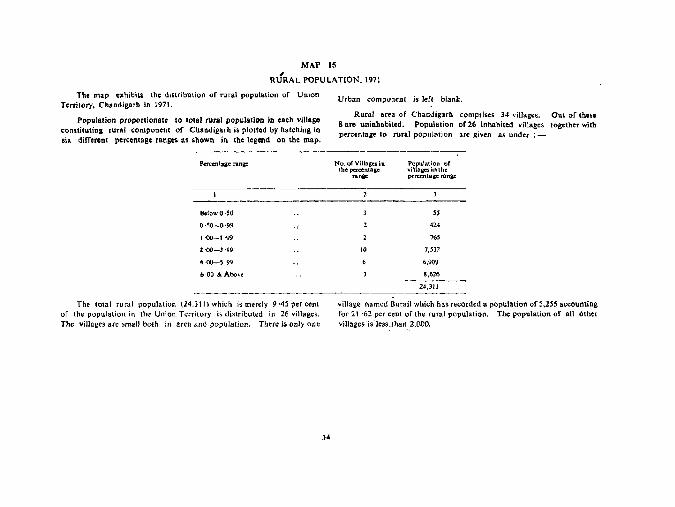
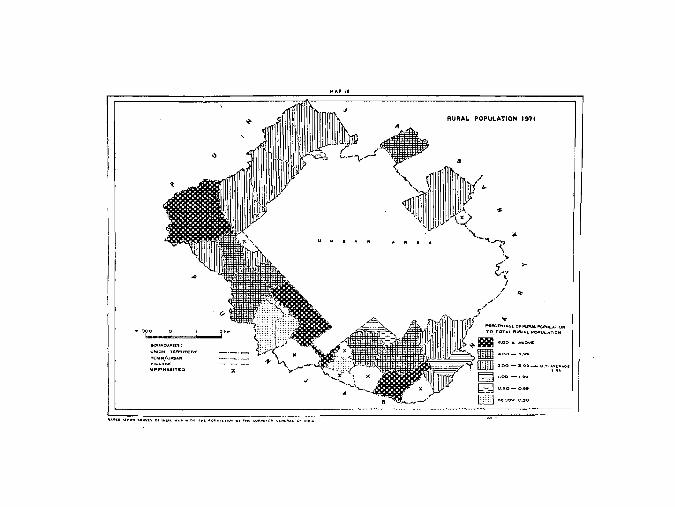
MAP 15 , RURAL POPULATION. 1971
The map clthibiU the distribution of rural population of Union Territo!,),. Chandigarh in 197 J.
Population proportionate to total rural population in each village constituting rural component of Chandigarh is plotted by hatchiog in six different percentage ran,es as shown in the legend on the map.
Percentage range
Below 0·50
0·50-0·99
1 -00-1,99
2·00-3·99
4-00-599
600 & Above
The total rural population (24.311) which is merely 9 ·45 per cent of the population in the Union Tl.:rritory is. di!itributed in 26 villages. The villages are small both in area al1d population. There is onJy one
34
Urban component is left blank.
Rural area of Chandigarh comprises 34 villages. Out of these 8 are uninhabited. Populadon of 26 inhabited villages. together with ,percentage to rural population are given as under :-
No. or Vitlag,esin the percentage
range
.0
Population (IF viUagesinthe percentage ranee
~j
42.
765
7.532
6,9~9
8,626
24.311
village named Burail which has recorded a population of 5.255 accounting for 21 ·62 per cent of the rural population. The population of all other villages 'is' less Jhan 2,000.
RURAL POPULATION 1911
~1J"D"AIl!'!i:
I.J"'ION T£R.Iu,.ORV
~~~(~~M IJNI"'H .... eIT£C x
MAP 16
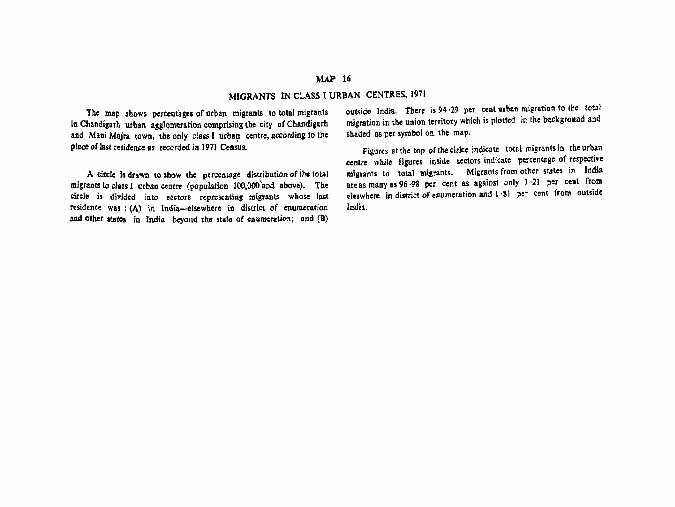
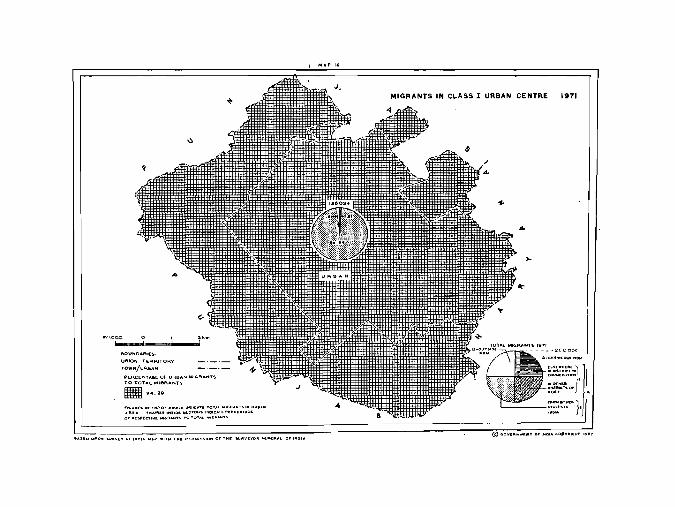
MIGRANTS IN CLASS I URBAN CENTRES, 1971
The map shows percentages of urban migrants to total migrants in Chandigarh urban agslqmer&tion comprising the city of Cbandigarb and Man! Majra town, tbe only class I urban ceotre, according to tbe place 01 last reside=lls recorded in 1971 Cens~s.
A circle I, drawn to show the p.roentllg~ distribution of ihe total migrants to class I urban centre (population IOO,OOO'and above). The eirele is divided into sectors representing migrants whose last residence was: (A) in India-elsewhere in district of enumeration AlIa other state, ·in India beyond tho state ot enumeration; and [D)
outside India. There is 94 ·29 per cent urban migration to the total migration in the union territory which is plotted in the background and
sbaded as per symbol on the map.
Figures at the top oftnecirlce inqicate total migrants in the urban centre while figures inside sectors indicate percentage of respective migrants to total migrants. Migrants from other states in India areas many as 96 ·98 per cent as against only 1·21 lIer cent from ele,where in district of enumeration and 1 'SI per cent from outside
India.
R!l4.29 ,,.or. ... "£' .. T,.OPOfC'''CLII:'~ICA·nET(n.u .. ''' ... A .. T'''''''''.''' .. . 11.... *",..,,,-", , .. .s,al: "teTOf<", .. OtC"'TEP~"Cur""'''1I: '''lItS,P£C,.."rololl<.R",NT1; TO TOT ....... ,('" .. ,N·U
I MAP 16
CENTRE 1971
""."'.'~ '''D~T''',CO , ",OT"J:. "J1oT_~O' "T#II:

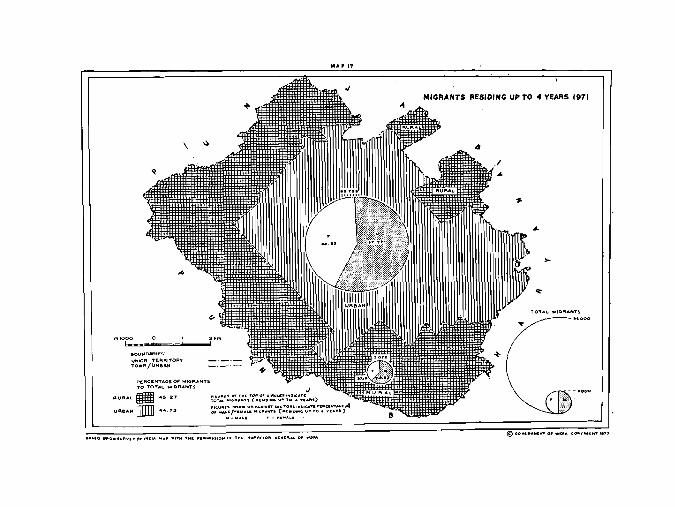
MAP 17
MIGRANTS RBSIDING UPTO 4 YEARS 1971
The map shows migrants by place ort •• t residence with duration of residence upto 4 yeats and percentage of migrants (residing upto 4 years) to total migrants separately (or rural and urban areas.
The circles arc drawn proportionate to total migrants residing upto 4 years in rural and urban areas. The. circles are then diVided proportionate to the male and female mig.rants. The JUra) and urban sectors have been shaded to distinguish one sector .from the other. The percentages of migrants (residing upto 4 )'can) to total migrants in rural and urban sectors are calculated and grouped into two ranges as ihown i.n the index from high to low values.
38
Migrants with duration of residence upto 4 years arc predominant in urban areas where their strength is 82.759 as against rural mjg~ants of only 5,072 persons. Among migraQts males are more than fcinalt& both in rural and urban areas. in urban areas there nre 57·77 . per cent male migrants and 42 ·23 per cent female migrants residing upto 4 years. In rural areas the proportionate variation of males is still wider as there are 62 ·82 per cent males against 37 ·18 per cent females among rural migrants.
mlOOO 0 be,.,.: "*=
e.OUUoAAIES·
UNIOI'I "'£A.FI.,TOI'IV TOWN/VR",..,N
\ '"
PERC!:N'TAGe: OF MI(OP.ANT5 TO TOTAl. """RANTS
"'URAl.. 4527
Ulll.l!!lAN aIIII1 44,73
M ..... 17
MIGRANTS RESIDING UP TO 4 YEARS 1971
TOTAL ""I(OR ... ",T!t
MAP 18
MIORANTS RESIDING ~ TO 9 YEARS 1971
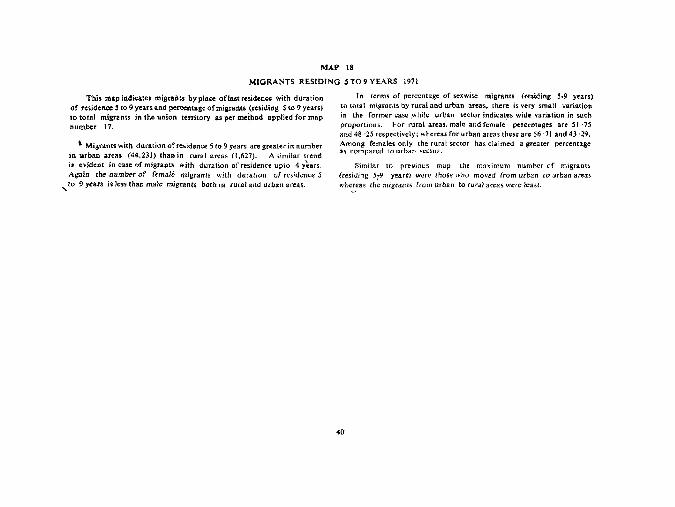
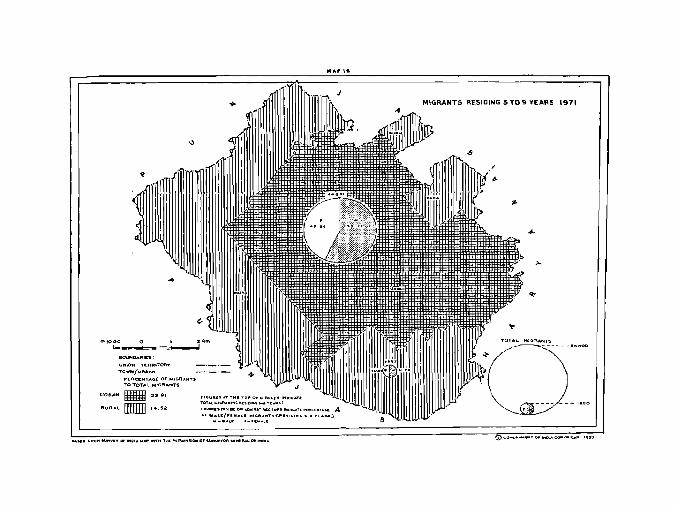
This map indicates migrants by place oflast residcn« with duration of res.idence S to 9 years and percentage of migrants (r~siding S to 9 years) 10 total migrants in the union territory as pet' me~hod applled for map number 17.
t Migrants with duration of residence 5 to 9 years Bre greater in number in urban areas (44,231) than in rural areas 0,627). A s,imilar tfl~nd i5 evident in case of migrants with duration of residence upto 4 y~ar$, Again the number of female migrant.s with duration of residence 5
,to 9 years is less thall male migrants both in Tura) and urba.n areas.
In terms of percentage of sexwise migrants (residinf! '.9 years) to total migrants by rural and urban areas. there is. very small variatJon in the former case ,while urban sector indicates wide variation in such proportions. For rural areas, male and female' percentages are 51 ·75 and 48 ·25 respectively; whereas for urban areas these are 56 ·11 and 43 ,29. Among females only the rural sector has claimed a greater percenta&e ~s compared tD urban sector.
Similar to previolJs mllp. lhe maximum number of migranb (residing 5~9 year,) were thoSe who moved from urban fo urban area!> whereas the migrants from urban to rural Breas werC' leasL
40
,OWN/URIMN
TO TOTAl. MIORA'I"IT'S
URBAN _ :2:1.9'
RURAL. UIIIII] 14,'S2
J
rl(.UIllt'!."T THE T",. o~ O;IA<;~,," '''Ole",Tt
,.OT4L .. ' ...... """'(JlUIOO~ .... yf_ ...... )
J
~'(. .. RE"''''.,,'KC) ... (. .. I'",.'\£C101'1 .. , .. O'';.Tf_PE .. C[NT .. c.t; A elf .. :~Et: .. :.6.l:_ .. :;:: .. -;r!.-(. .. IE!.III;lI .... s-. TE ....... ,)
MIGRANTS RESIDING:; TO ') YE .. RS 1971
MAP 19
MIGRANTS RESIDING 10 YEARS AND ABOVE 1971 \
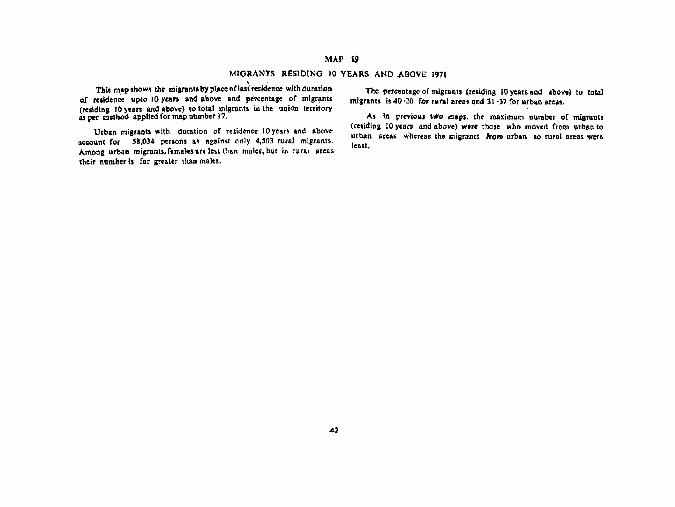
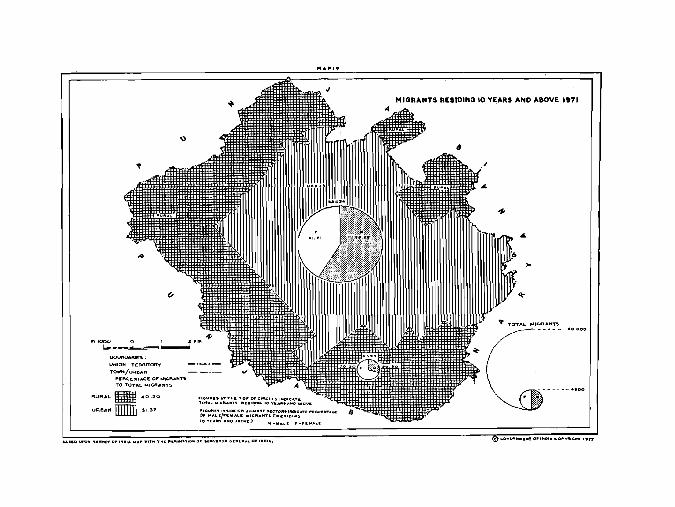
Thi. map shows the migrant, by place "Clut ,eosidence with duratioD of ~siden~. upto to yea.. and .. b<>"" and percental!" of migrants (residing 10 )'ean a.d above) to lotal migr.nts in the IIniOll territory .. per method applied for map numbe, I'.
Urban migrants with dutation or f($idence 10 years> and abovt aceount for S8,034 person! as against only 4,503 rural mi_'rants. Among urban migranls,femZlles a.re Ics5. than males, but in rllfal areas !:heir numbl:ris far gT~a.ler than males.
The perceotage of misrant, (,..siding 10 years and .bo~) to lolal mtgrants is 40 '::W for ru,,,,l arel'S and 31 ·37 for urba.n areas.
As in prn-io", two mill's. the maximum number of migrants (residing to years and abo\le) w.re those who moved from urba.n to urban areas whereas the misranls From urban to rural areas wen, least.
UNION TERRITORV
TOWN/UR~.AtI
PERC;"'"T.AGE Of' MIGRANTS TO TOTAL MIGRANT'S
RURAL _ .0.20
UR.~AN IIIITID :51.37
M""'9
~ TOT,to,L ,..16RANn
MAP 20
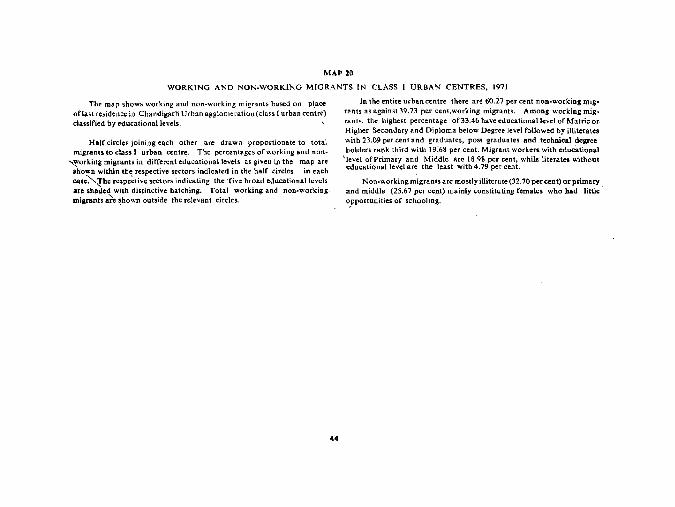
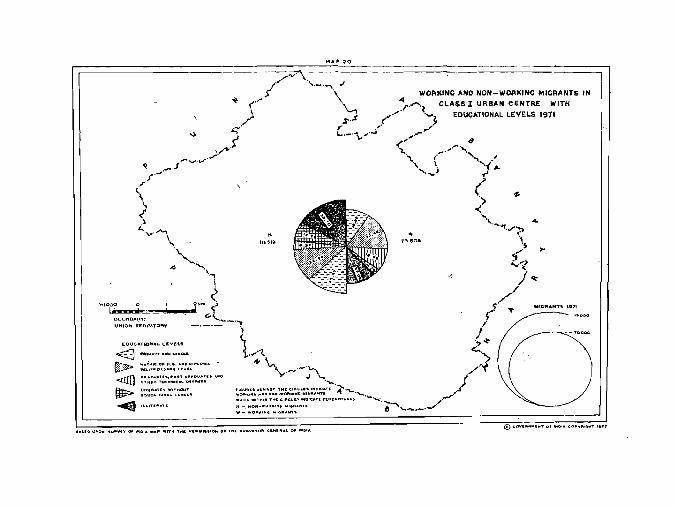
WORKING AND NON·WORKING MIGRANTS IN CLASS I URBAN CENTRES, 1971
The map shows working and non~working migmnts based on pl,ace oflast residence in Chandigarli Urban agglomeration (class I urban centre) classified by educational levels.
Half circles joining each other are drawn proportionate to total migrants to class I urban centr~. The percentages of working and non~
~orking migrants in different educational levels as given iJl the map are shown within the respective sectors indicated in the half circles in each case~hc respe~tive sectors 'indicating the 'five broad educational levels arc shaded with distinctive hatching. Total working and non-work.ing. migrants ate ~bown outside the relevant circles.
44
In the entire urban centre there are 60.27 per cent non-working mig .. rants as against 39.73 per cent,working migrants. Among working migrants. the highest percentage of33.46 have educational level of Matric or. Higher Secondary and Diploma below Degree level followed by illiterates with 23.09 per cent and graduates, post graduates and technical degree holders rank third with 19:68 per cent. Migrant workers with educational
\level of Primary and Middle are 18.98 per cent. while literates without educational level are the least with 4.79 per cent.
Non-working migrants are mostly illiterate (32.70 per cent) or primary and middle (25.67 per cent) mainly constituting females who bad llttlc' ~pportunities of schooling.
MAP 20
MAP 21
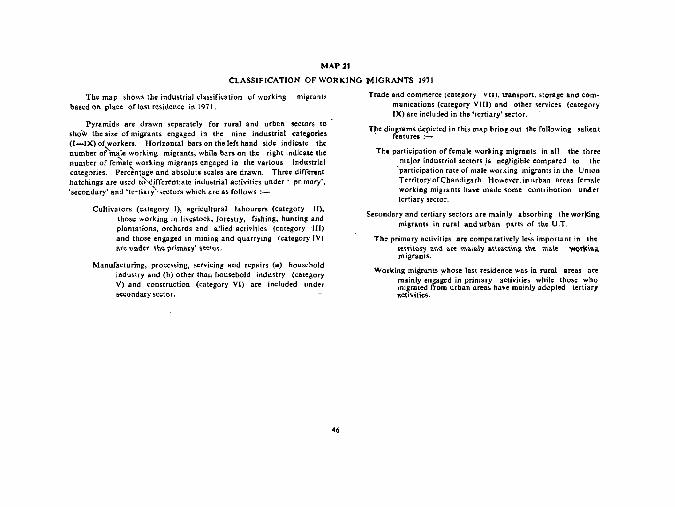
CLASSIFICATION OF WORKING MIGRANTS 1971
The map shows the industrial dassification of working migrants based on place oftastresidence in 19'11.
Pyramids are drawn separately for rural. and urban sectors (0
show ~he size of migrants engaged in the nine industrial catcs:ories ([-IX) of~orkers. Horizontal bars on the left hand side indicate the number of male working migrants, while bars on the right indicate the number of feniale working migrants engaged in the various industrial categories. Per~ntage and absolute scales are drawn. Three difrerent l1atchings are used t6-'differentiate industrial activities under' primar)". 'secondary· and 'tertiarY"'sectors which are as follows :-
Cultivators (category J), agricultural lal;>ourers (category 11). those working in livestock, forestry, fj$bing. hunting and plantations, orchards and allied activities (category HI) and those engaged in mining and quarrying (category IV) are \mdu the -p-rimary' s-ec\~r.
Manufacturing, processing, servicing and repairs (a) household Industry and (b) other than household industry (category V) and construction (category VI) are included under secondary sector.
46
Trade and commerce lcategory VJl). transport. storage and communications (caleE"Ory VIII) and other servi'ces (category IX) are included in the 'tc;rtiary' sector.
T{1e diagrams depicted in this map bring out the following salient reatures :-
The participation of felT).ale working migrants in all the three major industrial sectors .is negligible eompared to the
'"participation rate of male working migrants in the Union TerritoryofChandigarh. However. in urban areas female working migrants have made some contribution uJ1der tertiary sector.
Secondary and tertiary sectors are mainly absorbing the worlCing migrants in rural and urban parts of the U.T.
The primary activities are comparatively le;s important in the tenlto-ry and at"C main\-y 2atttOlt.ting the ma\e 'V4o$\'1\:& migrants.
Working migrants ~hose last residence was in rural areas ore mainly engaged in primary activities while those who migrated from urban areas have mainly adopted tertiary acti'lities.

\) \
M .... • 21
CLASSIFICATION OF WORKING MIGRANTS 1971
MAP 11
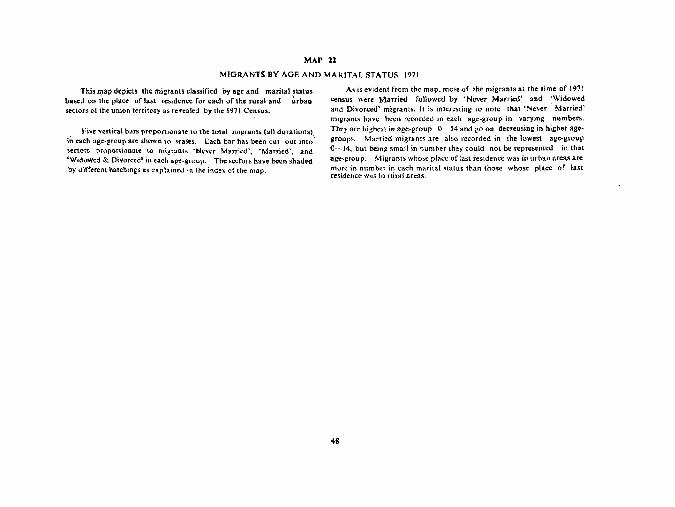
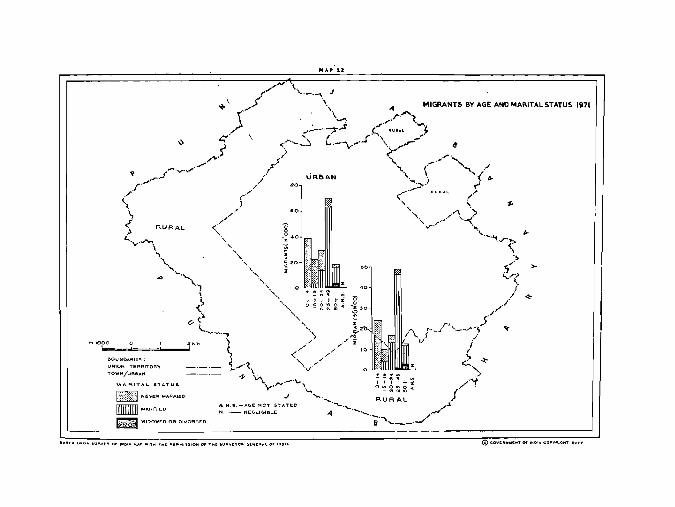
MfGRANTS BY AGE AND MARITAL STATUS 1971
This zryap depicts the migrants classified by age and marital status based on the place of las1 residence for each of the nllal and ~lban sectors of the union territor), as re.,eaJed by the 1971 Census.
._ }-'ive vutic:al b.us proportlOna1e to the tolal migrants (a1l durations\ in each age-group arc s.hown \0 snits. Each bar ha£ be-en cut Qut into sector'S proportionate to m,'grants ·t-Itver Married', -Married', and '\V.dt.lwed &. O''Iofccd' in each age-group. The ~ectors have been shaded by J.ifferent hatchings a~ ex.ptaineJ in tne index. of the map.
As is evident from the map, most of the migrants at the time of J97 I census were Married followed by 'Never Married' and 'Wjdowed and Divora:<)' migrants. It is interesting to note that 'Ne'\ler . Married~ migrants have been iecorded in each age~group in varying numbers. They are hig.hest in age~group 0-14 and go on decreasing in higher age~ groups. Married migrants are also recorded in the lowest age-group 0-14. but being small in number they could not be represented in that age-group. Migrant~ who~e place of last residence was in urban areas are more in number in each marital status than those whose place of last residence was in rural areas.
48
UN10N TERR1TOR'V
TOWN/URBAN
ITIIlllIl1,..AAR1ED
b~a ..... 100WED OR D1VORCED

ECONOMIC ASPECTS

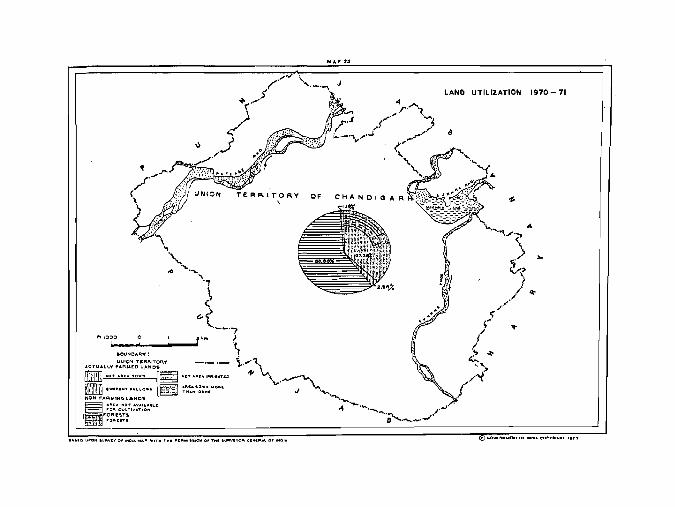
MAP 23 , LAND UTILIZATION, 1970.7'
The map r.v.al. the pattern of land us. in lhe Union Territory of Chandigarh u i~I~-71.
The land USe P.t(.~$ grouped into three major type, :
(A) Aelij.lly f.rmed land,
(8) Non·f.rmlng I.~s (C) Forest,
Actually f.rmed land •• rc further cl •• ,ined according to u,.s. such ".Ji) net .re. sown and (Ii) current fallow.. Net .re. sown represents land ,own with crops and current fallow indicates ar.bl.land kept fallow upto olle year.
Non.fllrming lands ar. sub·divided i~to Ihr •• Iype. : (i) .re. not .vuil.bte (or cultivation, (ii) pormanent pUlij,.. and other grazing l.nds und (iii) land under ml.cellaneou. tree crops and gro.o.. Ar •• lIot available for cultivation represent. land which i. barren or unculli-
vublc or covered by buiJdinss. water. roads. railways, mountains, deserts or olherwis.c approprillted for non·npricultural purposes, No area is reported under CYr.' (ii) •• <1 (iii) si.en abo ••.
Forests include nil the actually fl"ested nre •• or the lands c1 .... d or admini'tered a. fo .... ! under .n~ legal enactment dealing with forens whether state owned 'or private.
Seetors rcprc!i.enrins 'net arco s()wn', 'current rallows', 'aren not available rOf cultivation' Bnd 'rorest' ure ~hown in a tircle drawn on the map proportionate to t<ltal reported area of the union territory ar:cordins
to Yiliage papers. The sectM showine 'net are •• own: I, further divided under 'nel area irrigated' end 'area sown more than oncc', The sectors are shaded with .ppropriat. h.tchin~s.s .'plained in the index of the map.
For the union territory us U ... hole 39.94 per cont of (he reported DTI:Il is under 'uctua!Jy faimed lands', while ·nonafarmins hands' OCCUPJ
5g.88 per cent. The remaining I, I g per cent of the total area i. una.r 'fortsl',
S1
MAP' 2:1
\ J "-''''''\,
LAND UTILIZATION 1970 - 71
fh 1000
MAPU
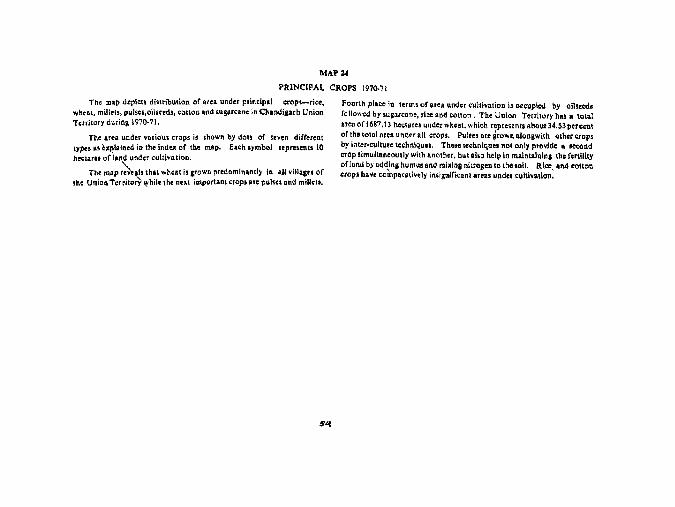
PRINCIPAL CROPS 197;).71
The map dtpic.ts disttibution of atea under principal crops-rice, wheal. millets, pulses,oHsteds, cotlon a.nd sugafcanc in Chandi,sarh Union Territory during 197Q-71.
the arca under 'Jllrious crops is shown by dOl! of seven different type. a ••• plal.cd i. the index of the map. Ea.h .ymbol r.pr •• enls 10 hecla'" of i.nd under culli •• ,ion.
The map ~ •• I'lh.t whtat is grown predomin.ntl~ in all ,ill.g •• of the Union. Tc-rrho;:Y'~hjh: the nut important crops ate pulses lind miUd •.
Fourlh place in term! ofat<:a under cultivation is occupied by oils.eeds followed by sugarcane, rice and colton. The Union Territory has B total area of 1687.13 hectare. under whe.I, which repr.sents aboul34.S3 percent or ,h. ,o',al nren under all .rop •.. Pul .... r. grown alongwith oth.r Qrop' by inter-culture technique.. The •• technique. nOI onl~ p'ovide •• o<:ond crop simultaneously wilh another, blOt 11.0 help ia malatainin. tho r.rdilly ofl.n" by aggin. hum~' and mblna nl,,08en to the .oil. Rice. and totton crops ha~e co~para.dvc:ly insigniFicanl areas I.lnder 'Culdva1ion.

PRINCIPAL CROPS 1970 -71
"'1000
• • II.
\·0· •• :.0. '\ • .0. •• 0.0.. 0 '': O. Or.~.· °
CHANDIGAFtH
...0 """.~.. 0·. ..:. °1 • ~c 0 • : • ° ~ C ~. o· .r@. c ~
'(.IJ. C • •• c lI •
'Ct,TY
G-~~ •• • 0. ° •• :. <..... . ._~- • ..., •• ~o.o •• 0.ll.. •
~.A ••• o.~o ·0. ~o Oll... ..0 : ..
~ . 6.. "". . 0. .• . . ° •
I--o_~~ __ '"
BDUNDAAY
UNION TEFlF.ITORy 'i..,.~.~:.:. 0 •• °0· .~. .... .4. •• °0.0. 4- \...oo-<..~. _~'~'"\ •• • • 4.4 °
y' ' ......... 0. 0 • • J ',.~ •• ·4 ••• 0· •• ·• 0 O •
. ~.-!. •• II. C • 0· oil. •
-4 ._._. at>..O .••• . -J./
.-; ............. ! . .:~_J'
<9
,I
...
-#-
....
~
<>-
...
~
MAP 25
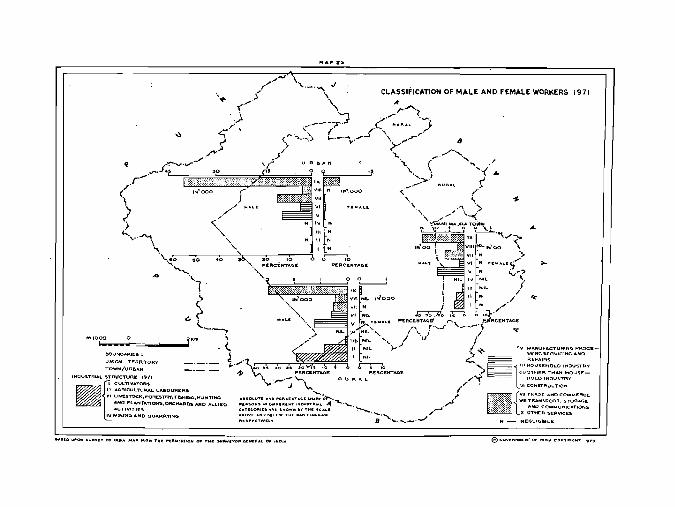
CL~SS[F[CATlON OF MALE AND FEMALE WORKERS 1971
The map depicls Ihe proporlion of male and female wor~ers 10 lota1 working population in the industrial categories (I-[X) in each urban area-Chandigarh city and Mani Majra town and for rural areas to~ gether.
The industrial structure in each unit is represented by a pyramid. Horizontal bars are drawn for each industrial category proportionate to the percentage of that category to the total workers. The bars on the lefl hand side indicate the number ofma)e worker~ and those on the right hand side the numbef'o~ female workers ~ngaged in various industrial categories. The absolute 'a,nd percentage .scales ore drawn' above and below the diagram respectively, to indicate the share of male and female workers in the various industriat t~egories. The nine industrial cate-" gories are further grouped into three,~ectors as fol1ows :-
Primary :-1 Cultivators, II Agncultural Labourers. HI Livestock. Forestry, Orchards and Allied activities.
Secondary :-lV Mining and Quarrying, V Manufacturing. Processing. Servicing and Repairs, (a) Household induslry, (b) other than Household industry and VI Conslruction.
Tertiary :-VII .Trade and Commerce, VIII Tra~sport, Slorage ind Communications and IX Other Services.
Under each sector,\ the industrial categories are differentiated by hatchings as shown in the i~dex of the map.
The map brings out tWo important features regardiogindusttial stru<!Ure; (1) it Is primarily non-agricullural eeol'0my as 95.59 per <ent of the lolal WOrQrs are engaged under terliary activities, especially in other services and' (2) the female participation rate in all the sectors of economy is very low.
UN!ON T£RfVTORY
TOWN/URBAN
,f (
MI." 25
..... ... '" Clol-SSIFICATION OF MALE AND FEMoI-lE WORKERS 1971
11
/
...
MANUFACTVRIN<O PR()CE",SINC, S,£R .... IClNC> .. NO
REPAIRS,
(I' HOUSEI-\OI..D !NOVS.T"'-"
(;<JOTHER. THAN I-IOUSEHOI..D INDUSTRY
I CONSTRVCTIO"
MAP,26
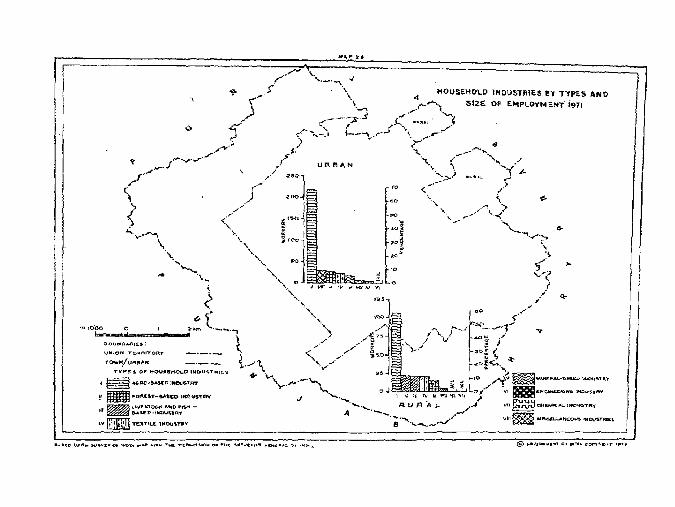
HOUSEHOLD INDUSTRIES BY TYPES, AND SIZE OF EMPLOYMENT 1971
The map displays distribution or eight types of household industries by rural and urban accordinB to their size of employment in )971.
~n each case for rural and llfba~ areas~ vertical bars proportionate to
the Dumber of workers employed in eight types of household illdultri'es.arc arranged in order of their size" of employment from high to low .. Absolute and percentage scales are drawn on left and right sides of tbe bar diagr~s respectively. The different shades inside the bars and Roman numeral; indicated below them along the horizontal axis depicts the types of household industries as given in the legend of the map.
III Chandigarh, both rural and urban areas employ a considerable proportion of the workers in household agro based industries viz., manufacture offood products, beverages, ,tobacco and tobacl;Q products. About 57.75 per cent of total of workers in household industries in rural areas are engaged in agro based industries> while a still higher p:rcentllge o( 67.70 is recorded (or urban arens.
In rural areas the other important industries are mineraJ based which emplOY 11.23 per' cent of the total workers in household industries
58
followed by livestock and fish based and textile industry each absorbing 10.10 per cent of the toral workers. Forest based industries are Jess develop ... ed and employ 7.49 per «nt of the workers in household industries. Other manufa!;;turing "industries and repairs grouped int~ miscellarieous industries af~ t~ least developed and employ only 2.13 per cent of the total workers In household industries.
But it is worth while to ,note that in urban areas. miscellaneous industries (typo VIlI) occupy' second position next only to agro based industri.s (type I) absorbing 9.32 per =t of the total workers in hou~ehoId indUStries. In this case, fOrest hased industries (type I[)
claim third position employing 1.16 per cent workers while texule industry (type IV) ranks fDurth With 6.52 per COni workers. The other important Industries are minn-al based (type V), chemical (type VII) and livestock and fish based (type Ill) in which 5.28,2.17 and 1.24 per cent of total wotkers in hOUSehold industries aTe engaged, respecti vely.
IWIJS .. l-iOLD II'lO\.)STR1ES flY T1'pfS AND Sl2a OF E.MPL()YM .. NT' i971
MAP 27
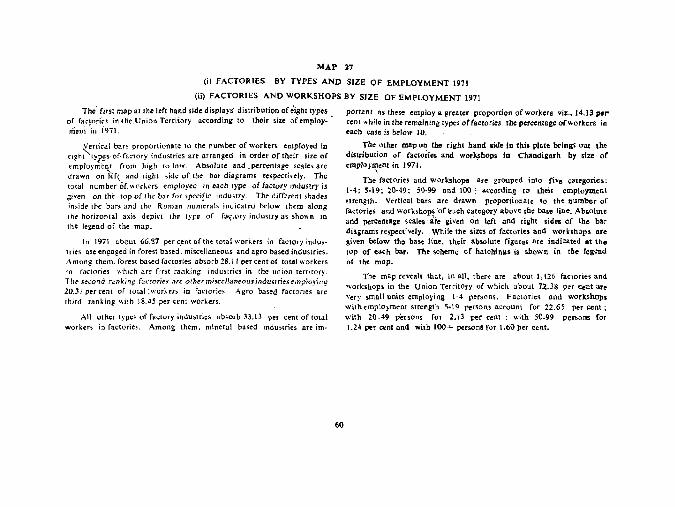
(i) FACTORIES BY TYPES AND SIZE OF EMPLOYMENT 1971
(ii) FACTORIES AND WORKSHOPS BY SIZE OF EMPLOYMENT 1971
The first map at the left hand sid. displays· distribution ofeighttypu of fa~,or,es' ~n ;the:Union Territory according to their size of employmi:nt in i971.
Vertical bars proponionate to the number of workers. empfoyed in elgh;"lxp~s-.OF factory industries are arranged in order of their size of employment from high to low. Absolute and ... percentage scales are drawn on 'JHt_ and right side of the bar diagrams respectively. The total number of, \!rod .. crs employed in each lype of factory industry is given on the top of the bar for ~pecific industry. The different shades in:-.ide the bar ... and the Roman numerals jndic~ted be-low them along the horizontal axis depkL the type of fa~tory industry as shown 10 the legend of the map.
rn 1971 about 66,87 per c,ent of the total workers in factory industries are engaged in forest based. miscellaneous and agro based industries. Among them. forest based factories absorb 28. J I per cent of [otal workers in factories \\'hlch .:Ire ffrst ranking industries in the union terriror)'. The- !i-:x.'ond nUlling factories au QthermI5ceI1ane-ousindustrle-semp'oying 20.3l percent of tolal :workers in f.aclorie~. Agro based facrories are fhird ranking \\ilh 18.45 per cent wor).;ers.
All other types of factory indu::.tries absorb 33.13 per cent of total workers in factories. Among them. mineral based industries are im-
portant as these employ a greater proportion of workers viz., 14.13 per cent while in the remaining- types of factories the percentage of workers in each case is below JO.
The other map on the right hand side in this plate brings Ollt ,he distribution of factories and workshop. In Chandigarh by size of employ'!(ent in 1971. .
The factories and workshops are grouped into fiVe categories; 1-4; 5-19; 20-49; 50·99 and 100+ according to their employment 5trength. Vertical bars arc dra.wn proportionate to the Ilumber of factories and worksbops~'of each category above the base line. AbSOlute and percentage s~ales" are given on loft and right sides of the bar diagrams respective1y. While the sizes of factories and workshops are given below the base line, their absolute (igutes are indicated at the tOP of each bar. The scheme cf hatching. is shown in tbe legend of the map.
The map reveals tho.t, in all, tber~ are about 1,\26 factories and workshop~ in the Union TerritOry of which about 12.38 per cent are very small units employing 1-4 persons. Factories and workshops with employment strength 5 .. 19 persons account for 22.65 per cent ~
with 20.49 persons fOI 2.13 per cent; with 50·99 penon, for 1.24 per cent and with lOO~ peTsons for 1.60 per cent.
FACTORI£S BY TYPES AND SfZE OF EMPLOYMENT 197'
~ .. G'''')- ..... ~ID' .. ot,I''TI'\V
" I!IIIIIll '0'"'-",,, '.0" .... ~ u.n'.," '.0 ".0- .... 0 , •• "" ••
,. IIlIlillrr:J .... ". ,.0."" ~ ." •• ,,- ..... '.0"""
YI ~ I'N~IM!'''IN'' '''OV!oT .. V
~ <M •• « .. '.0' ....
~ .,,< ...... ou. ,.ou"',,,
MA P 27
FACTORIES ANO'WORl(SHOPS BY SIZE OF EMPLOYMENT 1971
I::,,:,d H
mE .. t888l ~'oo +
@"OVI""NfNTQ"MD,,o,CDPV"''-t<T '977
MAP 28
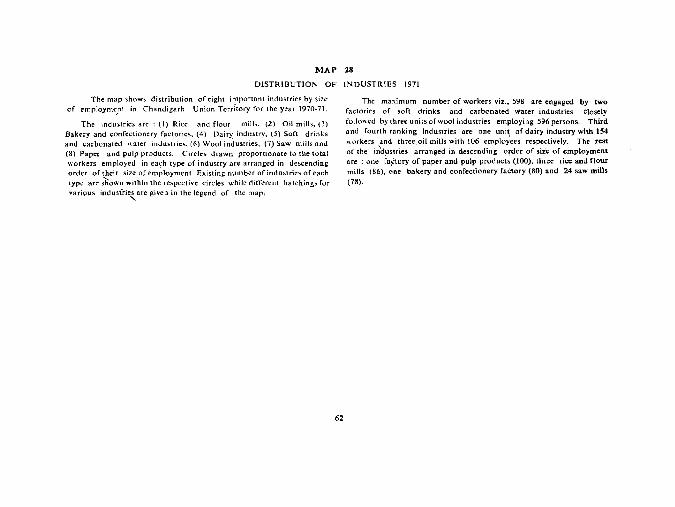
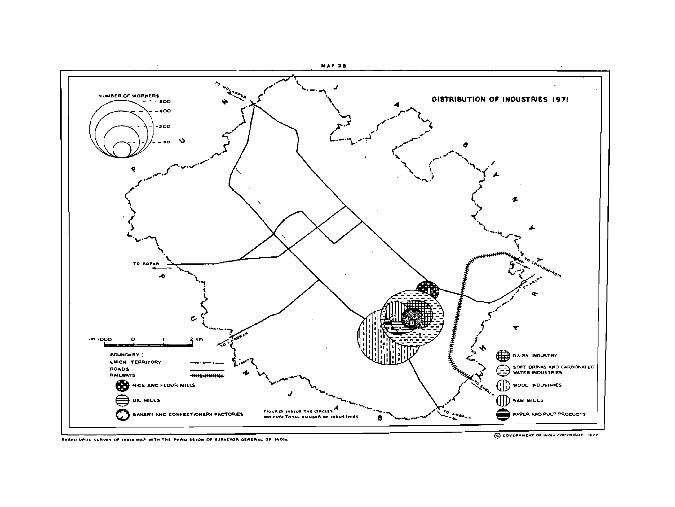
DISTRIBUTION OF INDUSTRIES 1971
The map show~ distribution of eight it11portant industries by size of cmploymcpt in Chandigarh Union Terrhory for the year 1970-71.
The industries are: (I) Rice and flour mills. (.2) Oil mills, (3) Bakery and confectionery faclones. (4) Dairy industry, (5) Soft drinks and !;arbonated water industries, (6) Wool industries, (7) Saw mills and (8) Paper and pulp products. Circles drawn proportionate to the total workers employed in ea'ih type of industry afe arranged in de~cendiDg
order of ~eir size of employment. Existing nllmber of industries of each type are shown within the respective circles while different hatChings for various indusiriez are given in the legend of the map~
62
The maximum number of workers viz,. '598 are engaged by two factories of soft drinks and carbonated \'later industries Closely followed by three units of wool industries employing 596 persons. Third and fourth ranking industries are one unit, of dairy industry with 1.54 workers ,and three,oil mills with 106 employees respectively_ The rest of the ind.!Jstries arranged in descending order of size of employment are: one fa~tory of paper and pulp products (IOO), three rice and flour mills (86), one bakery and confectionery factory (80) and 24 saw mills (78).
NUM&IER OF WOP.I<EA.~
~~::: \Co)Y_.o ~
6OUNOARy:
UNION TERRITORy
® OIL""ILL~ o &"'IU;1t'1 "toIO t:OWFEC:")oN~Rt ""'C'TOA.\E~
MAP 2.
DISTRIBUTION Of INDUSTRIES 1911
J
~, ........ ~ .. ' .... '0" T"~ GII"CL ... A ,1010,., • .,,, TO'." NU ... ,IIoCW ,HDUST""IS
@ .0" •••••• 00 , •• ,. ,o.,.,m ' • .,
MAP 29
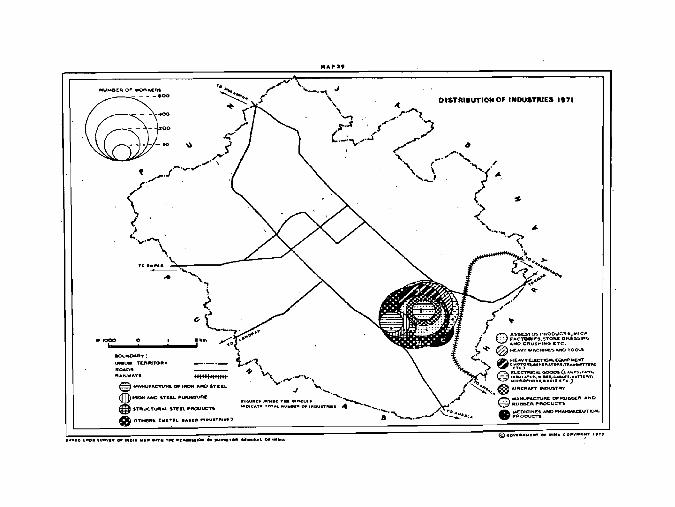
DISTRIBUTION OF INDUSTRIES 1971
This map shows distribution of eleven important industries on th(: same pattern of map number 28.
Details of particular group of industries shown in the respective circles ,vjth different hatchings are given in the legend of the map. All the metal based industries are grouped into 'other' and are predominant tn numerical strength (14 units) as well as size- of employment (789 persons). Factories- nanufacturing 'electrical goods' such as lamps, fans, insUlator, wires. cables. battery, microphone and radio etc., also form an important group of i'ri-d~stries in Chandigarh. There a~e fcur units of
64
such industries employing fiS7 persons. The third ranking important industries are five units of'heavy machines and tools' which have absorbed 412 workers. Next in importance by size of employment are fjve units engaged, in "asbestos pToduct~. mica factories. stone dressing and crushing etc.,' employing ~29 persons. The only unit ma~llfacturing ~heavy elC'ctrical equipment (motors, generators, transmitters cte"r affords employment toas many as 294 workers. There are two units of'medicines and pharmaceuticai products' with 214 workers. Rest of the five groups of industries employ Jess than 200 workers each.
_.000 0 1
BOUHp&.RV:
UNIOII T£RfIlrrO"V
II:O"D" "An..WAYS
MAP29
DtSTRllIUTIONOF INDUSTIIIES 1971
.lc,ull;t:' 1"~Dt: ,_ C"'CLI' "DICATO[ TOT ... .. u_. 0. I.~'TJQIJ" AI


SOCIO-CUL TURAL ASPECTS
MAP 3.
TI!N 'NUMElI.ICALLY MAJOR SCHEDULED C~'FES 1971
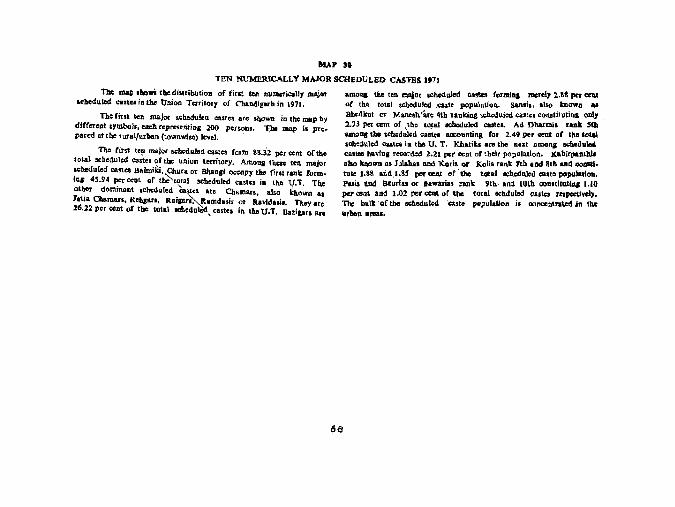
TIll: map ,ho'" tile di.tTibution of firot tell Du_,-ically _jIK •• II.d"led ... t .. iuhe Union Territory of Chandiguh in 1971.
The first ten, major schedulc:a Qlstes arc shawn in tbe map by direeTent .ymOoI., each repre,entin, 200 persons. TIle map i. PTO. pared at the ruralfurhan (townwhe) level. ' ,
Tho first te!' maior scbed.led cast .. fOfm ~S.:i2 per eont of tho total scbeduled castes oftho union territory. Amon. lhen ten major •• boduled caste. Balmilii, Chura or Bhatt,i oc<:opy tho fint rallk tor",. in. 45.94 per cent of th~tot'l scheduled cast •• in Ill. U.T. The olher dominant tichtdu led "'Cutel Ue Chama"t also kh_own •• 1.tia Cbama,., Kehl'n, RaiprhRamd •• i. or AavldA,i.. They .r. 26.22:por _I of lbe lotol acbedolCd, .asto, in IheU.T. Davca" .r.
amoaa tho tm major scheduled ta_ formiaa _el) 2,88 pet CCIII of the total scheduled ,ca,to population. san.i., ,Iso mown al Bhedkut or Manesb '"are 4th nnldn& ,"",duied ca.te, con.titutina om, 2.73 per eont of ,tho tO,tal ocIIedulod cast... Ad Dbarmi. rank Sib ..moIlS the scheduled calles accounting ror 2.49 per .,.", of th. toteI scheduled 085'e. in tbe U. T. Khotik. are the n •• t amons ochedlllc4 "".tos havilll reeordod 2.21 per cent of their pop.tadon. Kab'rpallthia olio known as JulJhaa and }{ori. 01' Koli. rank fth and 8th ... d COtlICi • tule 1.18 and,I,gS per Cent or' Ihc tCllol ochedlllod ... sto population. Paais ,nd 114 ... lu or a.waria, nnlt 9th, and 10th coultiluthll 1.10 per .. M and ].02 pet c:etIt or tlla 100ai sellduled call .. r .. peclivel,. 'The butt 'of Ihc scheduled 'C&stc pop"lalion i. oo_ntrated In tho uthan ami.
68

.. o
• A iA &.
eALWIKI,CIfU"" OR .ttANCoI C"",,,."',,JATIA C"~"A"."EM6"R.""'6"'Ri "Awe ••• 0" ""'\1'11:1.5 . a",ZIw."
.,."r:.o
TEN NUMERICALLY MAJOR SCHEDULED
CASTES 1971
•. 1
MAP:U
MAJOR RBLIGIONS 1971
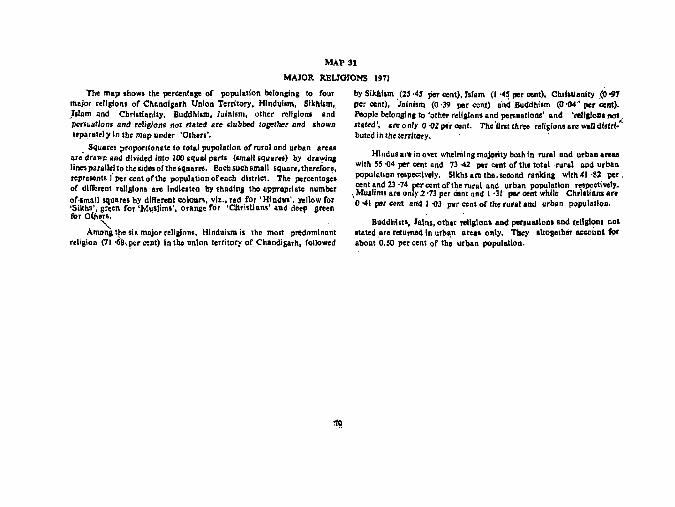
The ma,. shows the perccntage of population belonging ,to four majo, ,ellglons of Chanalga,h Union Tenltory, Hinduism, Slkhl,m, _Islam and Christianity. Buddhl'IIl, I.ini,m, other religions and pot'uatlon, Bnd religions nol ".red are clu!>bed togelher Bnd .hown ,epar.'el y in the map under 'Olhon' •
. Squares proportion.,e to lotal pupolation of rur.1 and urban are.s IIr. drawn and divided into 100 equal parIs (small squaro.) by drawln, Ilne$ parallel to tbeside. oi-the squares. Ea.h such oman 'quar., thereior.,. repre .. nts f pCr Cent of the population of •• ch dlslrlct. Th. percenta,e,
,of <lItTor.nl nllalon ...... Indleateo by shadln, the appropriate number of·amail squares by dillerenl <:oiaurs, ,i •. , red fOr 'Hind""'. ~.lIow for 'Sikhs', green for'Musiims', o,ang. fo, 'ChrisUans' and deep sr •• n for Ol,hers. ' '
Am~ t~. six major reli&lons, Hindllism is the most pl'l!domlnant relision (71 ·68,p.r cent) In the unIon territory of Chandisarh, followed
by Sikhism, (25 ·45 per cenl), Isr.m (1 '4~ pcr oent), Chdluanity ,(0 oIJ7 per oent), Jalnlsm (0·39 per cent) a'nd 'Buddhllm (0'04' per ccnl). People belonging to 'other reUslons and pe",uatlons' and ',.JlsioDS nor .tRled', .re only 0 -OZ per OCR!: Thelint three r.liglons arc well dlltrl! !luted in th<terrltory. .
Hindu5al'. in o'er whelming majority both In rural and urban areas with 550()4 per co"tand 73 ·42 pcr cent of the total rural and urban population respectively. Sikhs arc the.s.cond rankina with 41 ·82 per. cent and 23 ·74 per cent of the rural and urban Poplliation respectively.
\ Muslims are only 2 '13 por <ent and I ·31' par cont while ChrlltiaRs art o -41 par cenl and I -03 pcr cenl of Ihe rural and ~rban papulation.
Buddhists, Jo11\5,oth,r religlona and perauaslons aDd religIon. DOt
Ital<d',a,. returned in urban areas only. They altosethOr account for about 0.50 per cent of th~ urban poplllation.

RELI"ION'S
HINOU
" ... NU,,""'" CHRISTIAN
OTHER c .... e" .. "" .... LL !!;dUdllt lIIil_£ftINT!l
1% 0" T"il TOT"L .. O ..... L .. TION
M A' 31
MAJOR RELIGIONS 1971
@ .O ....... T .. 'NO,. ,O."".T ~
MAP31
Lrl'RltACY 1911
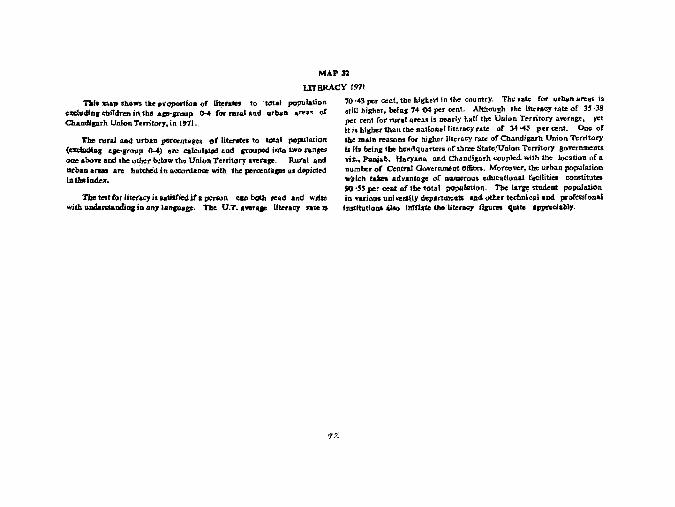
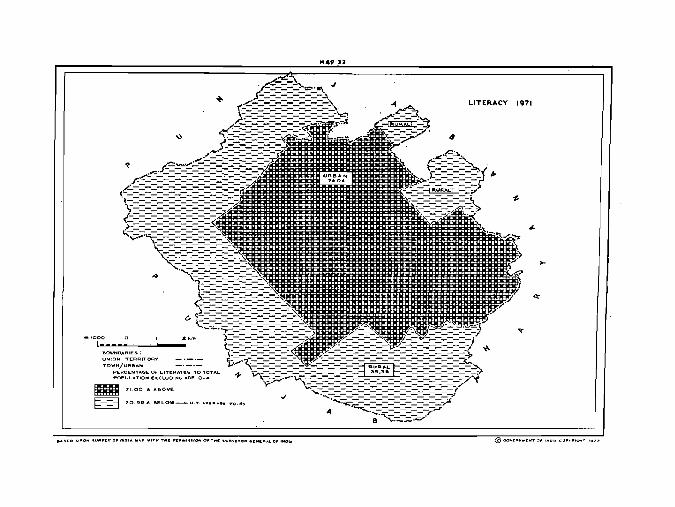
Tltl. mat> shows t~ proportion or Ute ... .,.. I() 'tDtaJ population e:a:ludin. children in. the &JIII'p'aup ()-4 r;" rural and u.baft areas of ChaDd.lprh UDion Territo'y. in 1971..
The ",tal and urban JlCt'''''nl.... of Iit...- to """I po)miatiQR (exdudin, .F-,,!J111' O-f) are calculJ1ed and JI'OOped into LWo l'aRg9
one abo ... and the other l"low 1M Union Territory .",ra... Rufal and urban...... .... hatdJOd in aoconlance with the po,,,,ntips as dopicted I" the Ind.". '
The test ror literacy i. salilficd if a ponon can boll> ..,ad and wriu witb u...t.rr.undl.,. in any lanlUge. The U.7. aWlr... UterlCY nlte is
']2:.
70 043 per cent, the highest in the -countr-y. The yate Cor u.rban areas 1$ .. ill higher. being 741>4 por oent. Although .be liluacy ute af 35 ·38 per cent (01' ru.ral areas. is nearly half the Union Territory average. yet it j$ higher than tb.e national literacy rate of 34·4$ per cent. One of the main reasons ror higher literacy rate or Chandfgarh UniGn Territory i, lis being lhe headquarters of three StateNolon Territory goverl1lDelllS 'rio .• Punjab. Batyana and Chandlgarh coupled with the 1o<3lion of a number of Central Govcrnment offices. MoteGvcr, Ihe urban populalion which takes advantage of n~rous educational facilities col151.itu.tes-90 -55 por cenJ of the total I'OJ'IIlati<>n. The lat)le student populatiOn in various unl ", ... (Iy departments and. otber leclml e.l.nd proCesslona' Institutl" ... &1110 IllIfbte tholitec.cy figu ..... quile Apptcdal>ly.
1ft 1000 b....b...._"""'~ __ ....
U"-IION TERRITORV
TOWN/URIIAN
PER(;EIIIT"{oE OF LITERATE':> 'TO TOTAL POPULATION EXCLUOlr>l(, AC.~ 0-4
~ 11.00" A60V£
t=-=3 70.996 !OELOW_U.T .... Vo:.~.~ 7"0 .... 3
MA. '1
LITERACY 1971
MAP 33
CHANGE IN LITERACY 1961-71
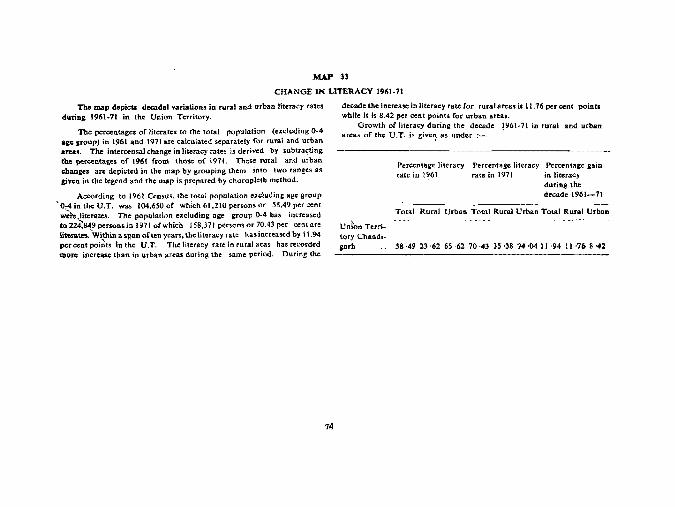
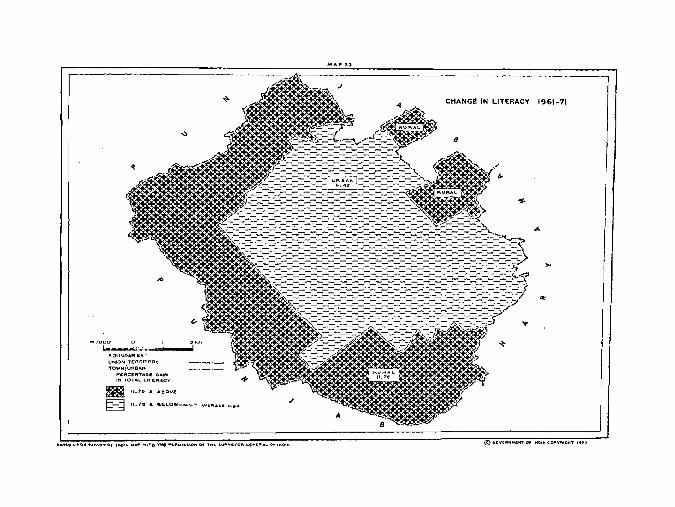
The map depicts dccadal variations in rural and urba,n literacy rates during 1961 .. 71 in the Union Territory.
The percentages of literates to the total population (cJ:duding O~4 age group) in 1961 and 1971 ate calculated separately for rural and urban areas. The intercensal change in literacy rates is derived by slJbtra~ting tbe petccntages (If 1961 from. those of t97l. These rural and urban ~hanges arc depicted in tbe map by grouping them imo two ranges as given in tbe legend and the map is prepared by chompleth method.
According to 1961 Census, the total population exc:}uding age group .. 0:-4 in the U.T. was 104.650. of which 61 ~210 persons or 58.49 per cent were~terates. The population ex~luding age group 0-4 has increased to 224~849 persons in 1911 of which 158,371 persons or 70.43 pel' cent a.Te liuIates.Within a span often yean. t.he literacy rate has increased by 1 t ,94 per cent poirl-ts in the U .T. The literacy rate in rural aeas has recorded mOle increase than in urban areas during the same period. During the
74
decade the increase in literacy rate for rural areas is It. 76 per cent points while it is 8.42 per cent points {or urban areas.
Growth of literacy during the decade 1961~71 in rural and urban areas of the U.T. is give'} as under:- .
Pe-l'centage literacy rate in 1961
Percentage Jiteracy rate in 1971
Percentage gain in literacy during the decade 1961-71
Totlll Rural Urban Total Rural Urban Total Rural Urban
union Terri~ tOt)' Challdi~ Earh 58 ·49 23 ·62 65 ·62 70 ·43 35 ·38 74·04 11 ·94 11 ·76 8 ·42
r.OUNDARIES: UNION TERRITOR'Y
,.OWtll/UAI!l .... " PEf'lCI!NT"~1;: ~""N IN TOTAL. L.ITEFl.t,C'(
~ 11.7& a A&OVE
~ It.75 & BEL.QW_U,T'''''I:''''''G. II ....
MAP 33
CHANGE IN LITERACY 1961-71
MAP 34
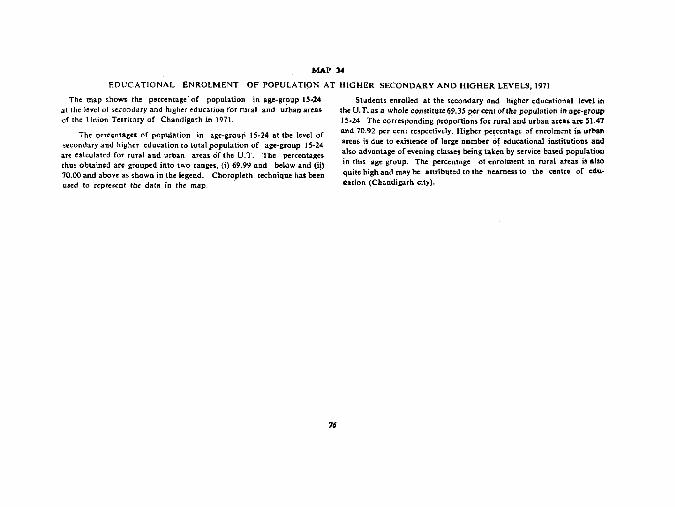
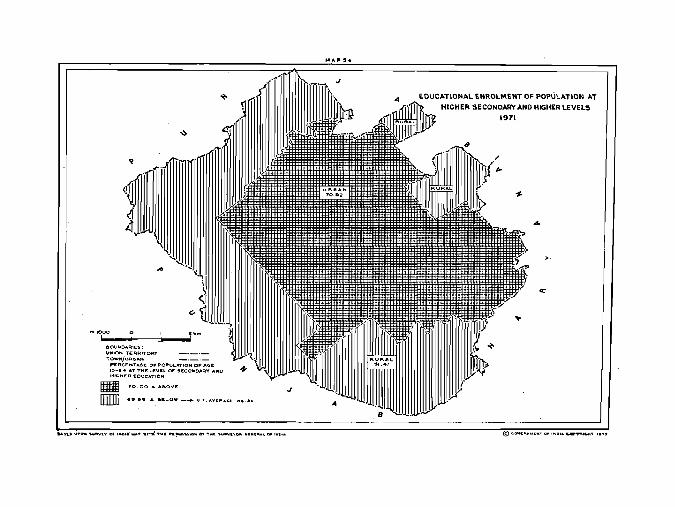
EDUCATIONAL ENROLMENT OF POPULATION AT HIGHER SECONDARY AND HIGHER LEVELS, 1971
The map shows. the pc[centa&e' of population in age-group I S-14 at the )!vel of secondary and higher ~duC'3tjon for rural and u~baD arcas of the Union Territory of Chandigarh in 1971.
The perecntagrs of population in age-group 15-24 at the level of s~ondary.and higher education to lotalpopulation of age-group 15-24
arc t:~lculated for rural and urban areas of the U.T. The percentages thus obtained are grouped into two raage., (i) 69.99 and below and (ii) 70.00 and above as shown in the legend. Choropletb tC'chniqu.e has been used to represent the data in the map.
,,.
Students enrolled at the secondary and higher educational level in the U. T. as a \Vhol. constitute 69.35 per cent oflhe population in age-group J 5-24 The corresponding proportions for rural and urban areas are 51.47 and 70.92 per cent respectively. Higher p~~centage of enrolment i"n urban areas is due to existence of large number of educational institutions and also advantage of evening classes being taken by service based population in this age group. The percentage of enrolment in rural areas is also quite high and may be attributed to the nearness to the centre of cdu. .. eOlian (Chandiga,b city).
...
eOUNOAAle;s:
"""'ON TERRITORY TCl'fll"jURe.",...
"ERCENTAC'.E 0' PO~ULATION OF ..,6£ 1~-2 •• .., THE LEYEI.. OF SECONO,o\RV AND "" 1-41t.HER EOUC.TION
_ 70.00 & A&OVE
[]]]]I) G9.'ii'lli &. BELOW -_ U.T ... VE .... G.II:
J
J
EDUCATIONAL ENROLMENT OF POPULATION AT
HICHER SECONDARY AND HIGHER LEVELS
1971
MAP 35
1:.EACHERS PER 1,000 OF STUDENTS AT PRIMARY LEVEL OF EDUCATION, 1971
This map shows the: number of teachers per '1,000 of students at primary level of education for rlJfal and urban areas of the union territory of Chandigarh in 1971.
The proportions of teachers per 1,000 students at primary level of education are calculated for tht rural and urban areas. These proportions arc ,louped into two ranges vi~" (i) 1_31 and (ti) 32·40 as shown in the legend and depicted by choropleth technique on the map.
16
The number of teachers per l.OOO of !itudcnts at 'he primary level of education work out to 32 for rural areas, 31 for urban areas and 32 for the U. T. as a whole. Higher ratio of leathers per 1000 of students at the primary (eyel of education in rural areas as compared to urban areas may be attributed to lesser enrolment in ~ural compared to urban areal,

,,(,('"
+ (0."".
~
/I.)
-.) ~ _.)
,.., .. ....,..A
~II·IIIIIIIIIIIIIIIIIIIII.' .~
." ."1
@60VtP."Nf:"TOF'""I,IIc;.OI'Y",r.HTI'71
MAP 36
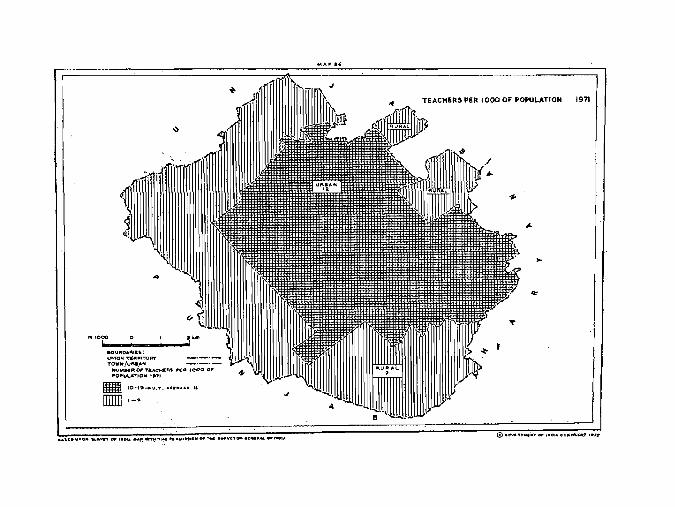
TEACHERS PER 1,000 OF POPULATION 1971
The map depict. tbe availability of teachers pc, 1,000 of population in rural and urban areas of union territory' of Chandig.rh in 1971.
The proportions of teachers per 1,000 of population for the rural aDd urblll areas aro calculated and ifoupod into two raDio" viz., (il 1-9
and (ii) 10-19. Cho,opleth meth,!'d is used to depict thc propor~oll'
(or rural a~d urban areas. The avcrage for the union tertitory as a whole comes to· 11 teachers
per 1,000 or population. The Dumber of teachers per ,1,000 of 1'Ol>ulotio" i. only9 for rural areas as compared to Ilia urhan areas or the V.T.
eo
·.m --------.oVflOA'_'IItS: UNION TPRlTORV' TOWN!U,.. •. AH
NI,IMH,.O"TI:ACfoCFlS I"r;FlIOOO OF ~Pu\'''T'OH ,.71
• I()-I$_V.T. ava" .......
rnIIll ,-.
TEACHERS PER 1000 OF POPULATION 1971
J
MAP]7
LITERATES HOLDING NON-TECHNICAL AND' TECHNICA.L DIPLOMA OR CER.TIFICATE 1971
The map represents rural and urban proportion. of 1l0n-techQical and to:chnlcaldlplorna or certificate (not equal to degree) holderoper 10.000
of literates in the union territory of Chandlgarh in 1971.
Cil"cles are drawn proportionate to total number of literates holding non .. technlcal and technical diploma or certificate not equal to degree for rural and urban areas oftlie U.T. The clr~es are fu?ther cut into two seaon nomely (I) technical ana(ff) DOD-technicnl. The oecior ropro.enting the proportion of technical diploma or certificate holders ha'S been shaded by thick slanting: lines and the percentage figures are ,given for e-ach sector.
The proportions of non-technical Bnd technical diploma, or certificate (not equal to degree) holders per 10,000 of total lilmites
,have ""en worked OUt for rural and urban areas and grouped
into two ranges viz .• (i) 1-10 and (il) 11-140 a. given in th. i legend. These proportions work out to 133 for 'the union territory
as a whoIel l 139 for urban areas and only 9. for rural areas. Areas outsiae, the circles have been hatched aecoMing to these ranges. Considerably high proporJion in 1Jtban areas is due t() location or servera) central ana state government oftioes employing high.ly educated scientific and ·technicaI as well as non·technical petsonel and the existence of large number of technical and professional institutions turning out such tec,h .. nocrats and other trained (non·teChnical) personnel who have ample opportunities of service and self employment aVenues llert. The p!:'r ... centages of technicaJ diploma at certificate holders arc higher both in ru.ral and urba~ areas of the U. T. These ~re 80.06 for urban areas. As for nOA.tac.h,nical diploma or certificate holders, their percentage in rural areas js IJ'l.Ore then double (42.86) a5 compared to urban areas (19.94).
82.
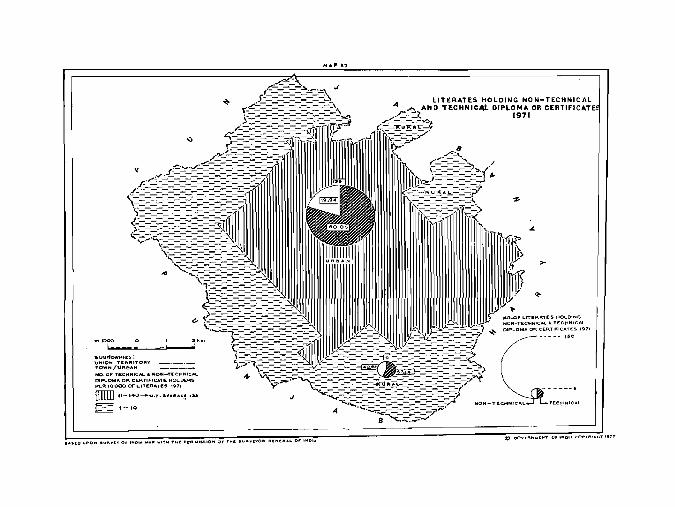
&OUl'IDAfH£S: VNtO ... T£RRITOA~ TOWN/URBAN
I'l10. OF TECHNICAl. & NOH-TECHNICAL DlPI.O!lllA OR c:~RT1FICATE HOI.O£R;S PER 1000;:> OF LITERIITE.S 1~71
ITIJI1] 1t-140_ .... ""r ... ~UU''''~ .31"
~'-IO
MA' 57
J
liTERATES HOLDING NON-TECHNICAL AMD TECHNICAl DIPLOMA 011 CEIITI
1971
"O.OF LIT£~ATE$ HOLDINe. NO"'-TE~HNJ~ItoL" TECHNICAL
~ DIPLO .... A OR ~~~T~F~C::~S 1971
::::== = = ===-_:'>._"C:~::~.~
.MAP 38
LITERATES HOLDING UNIVERSITY DEGREES/DIPLOMAS OF THE GRADUATE LIiVEL AND ABOVE 1911
The map shows the propottions oflit~rat~5 hola,ng university degrre diploma. or the graduate level and above per 10,000 of total lit.rat •• in
the V.T. in 1971.
One circle hn!!o been drawn in the map prop ort\Qnate to total number ot Ihente. holding univ .. ~it1 d,gree" diplomas in th' Union Territory The C'tRle hat been cut into two 5tctor5 urban and rural. The portJq-n r.presenting urban sector his been lh.d.d by thin slanting lio •• and rural) urban percentages of uniyorsity d.g .... fdlploma holde" are shown in the -rnpcctive sC'ctots.
The rropolli,,", of literates holding uni""rsity deg .... s/diplomas of graduate le .. 1 and above Per 10,000 of total Itt.rates are calculatA:C! far rural and urban ar"sana grouped ;nlo Iwo ranges as shown iD thel.gend. The rural and urban areas are hotched. occordinsl)' In the m.p. There art 102 literate, in rurol a"'O$, 1452 in urban •• eas and. 1,388 in the union territory os a whole. holding unlvorshy degrees/diplomas of ,reauate r.vel 611<i abo~ per 10,000 or total literateS
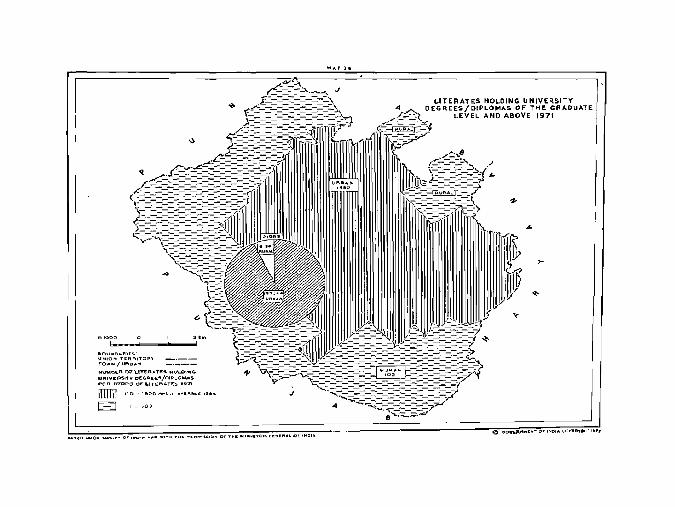
.. nU~O"l'IlI;:S: l,INIOf't TUH\ITCR'I TOW,,", I UF'leloN
NUMBER I)", LtTe:~ .... "I'E'S. 1-10\.0" .... UN'''E~ITV D£C'o .... EES/OIPI.OMASO IPE R. rooo-o OF LITEF\ATE"S ,,....,.
UIIID 110 - 1500.-.U.T "'''I:RIII ... " I~$.
S
LITERATES HOLDING UNIVERSITY DEGREES/DIPLOMAS OF THE GRAOUATE
LEVEL AND ABOVE 1971

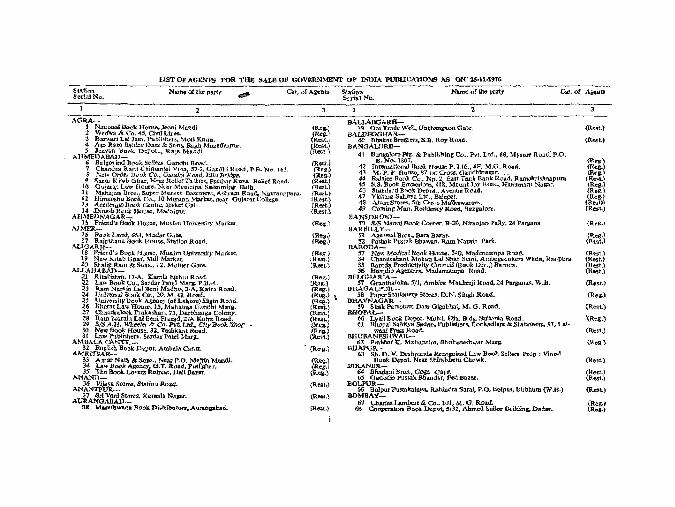
l.ISTOl'AGENlS FOR THJ;: S.u.EOF GO~R."IMENr OP INOlA PUBUCA'l1ONS AS 00::15·11·'_
StatiOll SedalNQ.
AGItA_
Name of the part!"
1 National Book Hou1le. Jeonj Matldi Z We~A-Co. 45, C:iVllLints. ::J. Ban\'3.d L~ J<l.Icl, Publbhn-s. Moti KI'Hm. 4- A$3 Ram B~ldev Dass &. 51)11S. Bagb MwaffaJflllf.
AR~Eh~~(}1;. Depot,~ aa;a MandL
6 .Balg:o\ ind Book SelleIs, Gandhi ROl'ld. 7 Chandra Rant Chimanl.al V(}fa. 57·2. Ganrllli Rc-ad. P.B. Nl), 163. 8 New Ord!>.f Book ('0., Gan.dhi It oec, EJli.~ BriDge. 9 Sastu}( itab allar, Near Relier Talkics-, PatlbM l<uva R.cJjei R()lkd.
to (3:ujatat U\'I' RCese, Near Muni;:ipaJ S~i:mmin@: 'Bath. J 1 M~hll.jon TIro:; .. :Super Mad:ct Ba.~cment.l\shlam }toad. Nayra.nb'ptlrB .• 12 lIiman:,huBool. Co., 10 Mis'Sio-n "Mar'bt. near OlJ.j~:'iltCo11ege 1) A('.adclU..icDoOK Celltre,..8i5ket Ga~r. "'" 14 ,D.inesh Beck House. Mac.laipl.lr.
AHMB,uNAGAR_ An.~It.~err.d·! Book HOllSC. Mus-lim Uni"\'~try Markel.
16 Book .land, ~fiJ. M"Cac G~te. 17 R..ajputana Book l{ou!oe. Station Road.
AL1GAR.H-~: ~~[~~blJg~~~~(1 ~~~.U11j""ct'8ity M .. rKet. 20 Sbalig Ram & Sons., IZ, M(lthoerGate.
ALLAl1AllAO-.21 lGtabista:n. 17~A. Kamla N'ellru Road. ~ Law Book Co .• Sat.aar }'ate! M.arg. po,BA. :::!3 ~.aQl: Natnin La! Beni Madho, ::I·A. 1(1I1r3 He-ad. :24 t;Divetsal liook Ce., ~I), M. O. Road. :1:, 1JniYeQitYDook Ascncy (of Lalaote} I3lgi:rt Jl.OAd. ~6 ~harat Law lIo:tlse, 25. Mahatma OatJdhi Marg. :Z7 Chaudca1oc:k Pntkashan. 73. Darbhansa Colony, 28 !tam :Naraln Lal Belli Prasad. 2jA Katra Road. 19 ~/SA.H. ~'1l«kr& Cl'I. Pvt. Ud'9 OtyBQoK Snor- -30 New Sook fiouse. 3~ Tllsbka.n.t Road. 31 law PublhhcfI. Sardarhtd Marg.
AM"BALA CANT'1:._ 32 English Book Depot.. AtubaIaCar.tt.
AMRr1""SA~-33 AmarNath & Sons .• Near P.O. M:afttb Mandi. 34 :taw .sock Agency, G.T. Road', Puil;ghar. 35 'the Book Llw~ Retn:ftt, BaU DB!".
A.l"'IAND-AN~N';;'~~tOtes:. Sts:tiOQ Road.
3-7 .srl VIIl.nJ St<'lu·.,!i, Xlltmala N,agsr. AVltANGAIlAD_
!JH ~(h_a.~a Book Distributon. Aurat:lgabad.
IRq.] (Reg.) (Row.i (Res,.) (Rest.)
(Rest.)
r:.~::~ (Rest.) {Rest.) >:Rc,!jt.) (Rest.} [Rest.) (Rest.)
(Re •. )
(Rtg..} (Reg,)
(ReB.) (Rest.} (R.est.)
(Reg.) :Reg.) (Reg.)
~~::~ \ (R~t.) (Res'-)
~':5 (Rt!g.., (\WI.)
(RoO.)
~~:1 (Re~,)
(Relit.)
(R ... ,)
(ll~t,)
Name o(1be party Cat. of Agut;
BALLABOARH-39 Om t["ade WeU .. VftUlangaon (Jatc.
BALUOOGI-fAR-40 Bhak:3t BroGlers, S.D. Roy Read.
BANGALOkE-41 B~aloTe Ptg, & ~b1ishlng Co •• Pvt. Ltd., .f!:8, Mysore ROIlt( P.O.
B.No.lao7. 42 Inteml'lH()oal Book iHml:Se P. UQ .• 4F. M.G. "hood. 4~ M. P. r. UOrnllC. 871st Cross,Oandhinagar •..
~ t"J.~o~o~!io~~~, t8:t:r~~~J~~!~~~;:=~~:r~ura 46 St:m,bird BrlOk De:Pot .• Avenlle! Road. 41 Vichara Sahitl'a Ltd .. Balepet. 48 Atam Str"res, Stll C"o~s M~"\~i:lj.wanm. 49 Coming Man~ R~j(fency ROOd, Bangalofe.
HAN5Dl>.0N1-iD SIS Msrroj Rook Corner, l1-~.I). Nmmjan Pally. 24 Panmna
BAREILLY-51 A.g:a.rwalltroB .• Ban Banr. 52 Pathak Pustak aha~an, Ram 'NaraitJ ParK:,
BARODA-53 Ne~ MedicatBO{Jk~. SAl), Madenzampa RMd. .54 Chruldtakant M"oha.n Lal Shah Scini, Ambegaonkers wada. RanPllra
~~ :r~~.~p~t~~~%~d=;'!!n~aOO~(l~t'~) Baroda. BELGHARiA-
57 Granthaloka. Sil, Ambica Mllt.betjiRolld,.24 Pargana;. W.E. BHA.GALrUR~
S8 P"aperStationety StOttS, D.N. Singh ROlI.d. DHAVNAQAR.-
.59 Shah Pan:otam DlUli Gigubbai. M~ G, Road. BHOPAL--
60 .1
t. Mohd. ~in.. Bldg. Sultania R.oad. PubllsbeJ':§. HOlikseilers &Stationers, J7. Lal~
..d.
(R~t.)
(R.-eH.)
(Reg.) (R<ll-) (Rog,) (Rest.) (Res.) (Reg.) (Reg.) (Ro"» (Rest.)
(Re.R.'
rn.~g:J (R .. ,,)
~~i:? (Rut.) (Rtst.}
(Resr.)
(Reg.)
(R~st.)
'(R~g,)
(RtS(.)
(R~g.)
(Ro,t,)
(Rc.ft.) (R-est,)
(Re!!:t.)
(Reg,) (ltoi;.)
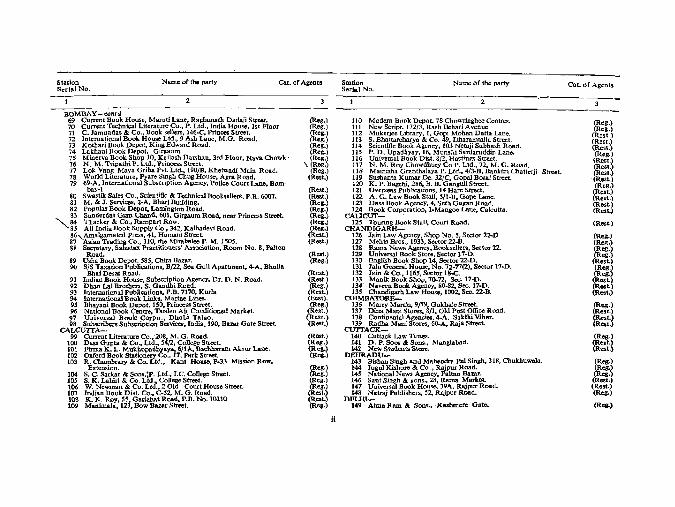
Station Serial No.
Name of the party Cat. of Agents
BOMBAY-contd 69 Current Book House, Marutj Lane, Raghunath Dadaji Street. 70 Current Technical Literatwe Co .• P. Ltd., India House, 1st Floor 71 C. Jamnadas & Co., Book sellers, 146~C, Princes Street. 72 International Book House Ltd., 9 Ash Lane, M.G. Road. 73 KothariBook Depot, King Edward Road. 74 Lakhani Book Depot. Girgaum. 75 Minerva Book Shop 10, Kailash Danhan. 3rd Floor, Naw Cbowk' 76 N. M. Tripatb\ P. Ltd., Princess Street. 71 Lok Vang Maya Grilla Pvt. Lid .• 190IB, Khetwadi Main Road. 78 World Literature. Pyare Singh Chug House, Agra Road. 79 69-A. International Subscription Agency, PoJjce Court Lane. Bom-
bay-I 80 Swastik Sales Co., Scientific & Technical Booksellers. P.R. 6007. 81 M. &. J. Services. 2-A, Bhari Building. 82 popular Book Depot. Lamington Road. 83 Sunderdas Gian Chand. 601. Gireaum Road, near Princes!!; Street.
""" ~~ l~at:~fa ~~~. s~:;;8g,~~~i. Kalbadevi Road.
:~'-A~lg.;~~~ ~s3t~: ::~~:!~tt;:tp. M. 1505. 88 SetretlUY. Salestax Practitioners' Association, Room No.8, Palton
Road. 89 Usha Book Depot. 585. Chira Bazar. 90 SIS Taxation Publica1ions. B/22. Sea Gull Apartment. +A. BhuDa
Bhai Desai Road. 91 Indian Book House, Subscription Agency. Dr. D. N. Road. 92 Dhan La! Brothers, S. Gandhi Road. 93 International Publications, P.B. 7170, Kurla 94 International 'Book Lhlk,. Marine Lines. 95 Bhayani Book Depot. 150. Princess Street. 96 National Book Centn!. Tardeo Air Conditionod Market. 97 Universal Book CorPD., Dhabi Talao. 98 Subscribers Subscription Services. India~ J 90. Bazar Gate Street.
CALCUITA-99 Cunent Literature Co .• '208. M. G. Road.
100 Dass Gupta & Co .• Ltd., 5412, College Street.
~gi ~~ \~k ~~ti~~~~~:.ai;!~!::~~~~am Alcrur Lane. 103 R. Chambrary & Co. Ltd.. Kant HoUle, P·33 Mission Row,
Extension. 104 S. C. Sarlar & SODS.:P. Ltd .• LC. CoUege Street. IDS S. K. Lahiri & Co. Ltd .• College Street. 106 W. Newman .& Co. Ltd., 2 Old Court House Street. 107 Indjan Book Dist. Co •• C-S4 M. G. Road. JOS Ie.. K. Roy, 55, Gariahat R()B_d. P.B. No. 10210 109 Manimala. 123, Bow Bazar Street.
(Reg.) (Reg.) (Reg.) (Reg.) (Re .. ) (Reg.)
\ ~~:::s (Reg.)
(Res •• )
(Re".) (Rest.) (Reg.)' (Reg.) (Re .. ) (Re.J (Reg.) (Res!.) (Rest.)
(R .... ) (Reg.)
(Res!.) (Rest.) (Reg.) (Res,,) (Be.t). (Reg.)
(Rest.) (Rest.) (Res'.)
(Rest.) (Reg.) (Reg.) (Roe.)
(Reg.) (Reg.) (Reg.) (Reg.) (Rest.) (Res!.) (Res·)
ii
Station SerlBI No.
Name of the party
110 Modem Book Depot. 78 Chowringhee Centre'!. ]11 New Script. 172/3. Rash Behari Avenue 112 Mukerjee Lihrary.l.Gopi Mohan Datta Lane. 113 S. Bhattarcharya & Co. 49. Dharamtalla Street. 114 Scientific Book Agency, 103 Netaji Subhash Road. 11S P. D. Upadhyay. 16. Munshi Sardaruddin Lane. 116 Universal Book Dist;8/2. Hastings Street. 117 N. M. Roy Chowdhury CO P. Ltd., 72. M. G. Road. 118 Mainisha Grantbalaya P. Ltd .• 4/3-B.llankim Chatterji Street. 119 Susbanta Kumar De. 32/C. GODa] Boml Street. 120 K. P. Bagchi. 286. B. B. GanguliStrcet. 121 Overseas Publications, 14 Hare Street. 122 A. G. Law Book StaU. S/l-B. Gcpe ~ne. 123 Das ... Book Agency. 4. Seth Gagan Road. 124 Book Corporation. I-Mangoe Lane, Calcutta.
CAUCUT- ' 125 Touring Book Stall, Court Road.
CHANPIGARH_ 126 Jain Law Asency, Shop No. S, Sector 22-0 121 Mehta Bros., 1933. Sector 22-B. 128 Rama News Agency. Booksellers, Sector 22. 129 Universal Book Store, Sector t7-D. 130 English Book: Shop 14, Sector 22~D. 131 Jain Oenenl1 House. No. 72-77(2), Sector 17-D. 132 Jain & Co .• 1165, Sector 18-C 133 ManikBook Shop. 70.72. Sec. 17~D. 134· Naveen Book. Agency. 80-82" Soc. 17-D. 135 Chandigarb Law House. 1002, Sec. 22·B.
COIMBATORB-136 Many Martin. 9/19, GokhaleStnet. 137 Dina Mani Stores. 8/1, Old PoSt Office Road. 138 Continental Agencies, 4-A, Sakthi Vihar. 139 Radha Mani Stores. 6()..A. Raja Street.
CU1TACK_ 140 Cuttack Law Times. 141 D. P. Soar &: SODS •• Manglabad. J42 New Students Store.
DEHRADU-143 Bishan Singh and Mahendra Pal Singh. 318, Chukhuwala. 144 Jugul Kishol'C & Co .• Rajpur Rmd. 145 National News Agency. Paltan Ba%aI'. 146 Sant Singh ,& sons., 28, Rama Market. 147 Universal Book Howe, 39A. Rajpur Road. 148 Natraj Publishers. 52. Rajpur Road.
DEUll_ 149 Atma Ram & Sons., ·Kashmcrc Gate.
Cat. of Agents
(Reg.) (Reg.)
(Rest.) (Rest.) (Rest.) (Reg.) (Rest.)
m:B -(Rest.) (Reg.)
(IIO$'.) (Res-t.) (Rest.) (Res •• )
(R .... )
(Reg.) (Reg.) (Reg.) (Reg.) (Rest.) (ReB.) (ReB.) (R .. ~) (Res'.) (Rest.)
(Reg.) (Rest.)
l~:::~ (~ei{:~ (Rest.)
(R.,;.) (Res·) (Reg.) (Res •• ) (II", •• ) (Reg.)
(Reg.)
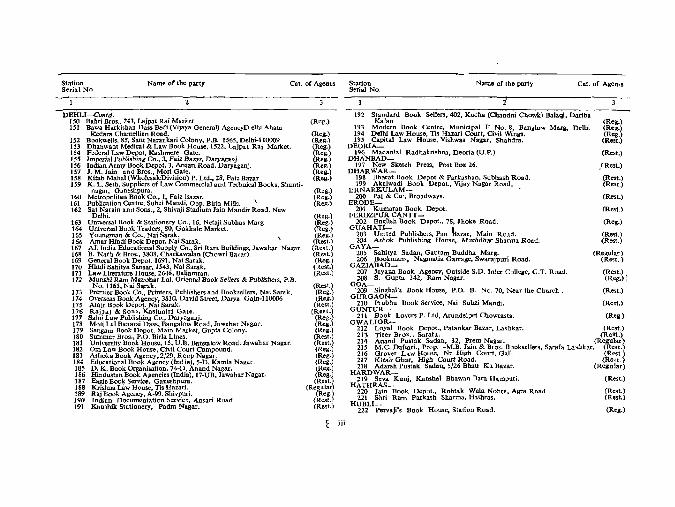
Station Serial No.
Name or the party Cat. of Agents Station Name of the party Cat. of AgentS
DEHU---Co1ltd. 150 Babri Bros .• 243, Lajpat Rai Market. lSI Bawa Harkishan Dass Bedi (Vijaya Genera]) AgencyD elhi Abata
K:.edara Chamellian Road. 152 Bookwells, 85, Sant Narankari Colony, P.B. 1565, Delhi-l 10009 153 Dhanwant Medical &. Law Book House, 1522. Lajpat Rai Market. 154 Federal Law Depot, Kashmere Gate. 155 Imperial PubJishing Co., 3, Faiz Bazar, Daryaganj. 156 Indian Army Book Depot. 3. Ansari Road. Daryaganj. 157 1. M. Jain and Bros., Morl Gate. 158 Kitab Mahat (WholesaleDivision) P. Ltd., 28. Faiz Bazar 159 K. L. Seth, Suppliers of Law Commercial ami Technical Books, Shanti-
nagar, Ganeshpura. 160 Metropolitan Book Co .• I, Faiz lJazar. 161 Publication Centre, Subzi Mandi. Opp. Birla Mills. \ 162 Sat NaTain anli Sons., 2, Shivaji Stadium Jain Mandir Road. New
Delhi. 163 Universal Bnok & Stationery Co .• 16. Netaji Subhas Marg 164 Universal Book Traders, !W, Gokhale Market. 165 Youngman & Co., Nai Sarak. 156 Amar Hindi Book Depot. Nai Sarak. 167 All India Educational Supply Co., Sri Ram Buildings, Jawahar Nagar 16B B. Nath & Bros., 3808, CharkawaJan (Chowri BaLar). 169 General Book Depot. 1691, Nai Sarak. 170 Hindi Sahitya Samar, 1543, Nai Sarak. 171 Law Literature House. 2646, Baiiamran. 172 MUDs-hi Ram Maoohar La), Orient<lJ Book Sellers & Publishers, P.D.
No. 1165, Nai Sarak. 173 Premier Book Co., Printers. Publishers and Booksellers. Nai Sarak. 174 Overseas Dook Agency, 3810. David Street, Dazya Gajn-l10006 17S Arnir Book Depot. Nai Sarak. 176 Rajpal & Sons, Kashmiri Gate. m ~~J t~l ::~;~~~,~~ii;'::r~~a~~ad, Jawah" Nag",. 179 Sangam Book Depot. Main Market, Gupta Colony. 180 Summer Bros., P.O. Birla Lines. 181 UniversitY Book Bouse, 15, U.D. Bangalow Road. lawahar Nagar, 182 Om Law Book House, Civil Court Compound. 183 Ashoka Book Agency,2/29, Roop Nagar. 184 Educational Book Agency (India), 5-D, Kamla Nagar. 185 D. K. Dook Organisation, 74-D. Anand Nagar. 186 Hindustan Book Agencies (India). 17-UB. JawaharNagar. 187 Eagle Boo~ Service, Ganeshpura. 188 Krishna Law House, Tis Hazari. 189 Raj Book Agency, A.99. Shivpuri. 190 Indian Documentation Scrnc". Ansari Road 191 Kaushik Stationery. Padm Nagar.
(Reg.)
(Reg.) (Reg.) (Reg.) (Reg.) (Reg.) (Reg.) (Re8-) (Reg.)
(Reg.) (Reg.) (Reg.)
(Reg.) (Reg_) (Reg.) (Reg_) (Rest.) {Rest.) (R",t.) (Reg.) (Rest.) (Rest.)
(Rest.) (Reg_) (Reg.)
(Rest.)
(~;~~J (Reg.) (Reg.) (Rest.) (Rest.) (Reg.) (Reg_) (Reg.) (Reg_) (Reg.) (Rest.)
(Regular) (Reg.)
(Rest.) (Rest.)
t iii
Serial No. ---3~
192 Standard Book Sellers, 402, Kucha (Chandni Chowk) Balaqi, Dari~--193 KaJan n . . (Reg.) 194 NelhiC~w ~;us~~t~cHa~;illc~~~t,Fa~lJln~~nglow Marg, Delhi ~~~.~
D~~RI?!ital Law House, Vishwas Nagar, Shahdra. (Relit:)
D~9XNBM;;j~lal Radhakrishna, Deoria (U.P.) (Rest.)
197 New Sketch Press, Post Dox 26. DHARWAR_
198 Bharat Book Depot & Parkashan, Subhash Road. 199 Akalwadi Book Depot .• Vijay Nagar Road.
ERNARKULAM-200 Pai & Co', Broadways.
ERODE_ 201 Kumaran Ilook Depot.
FEROZPUR CANTT-202 English Book Depot., 78. Shake Road.
aYJiHt~~~ Pllblishers, Pan ta-ntr, Main Raid. 204 Ashok Publishing House. Mllrlidhar Sharma Road.
GAYA-205 Sahitya Sadan. Gautam Buddha Marg.
Gi~~Ag~<g:~ns. Nagmatia Ganage, Swarajpuri Road,
207 Jayana Book Agency, Outside S.D. Inter College. G.T. Road. 208 S. Gupta 342, Ram Nagar.
GOA~b~G~~~~'$ Book House, P.O. B. No. 70, Near the Church.
210 Prabhu Book Service, Nai Subzi Mandi. GUNTUR-
211 Book Lovers P. Ltd, Arundelpet Chowrasta. GWALIOR-
.(Rest.)
(R",._) (&e,'.)
(Rest.)
(Rest.)
(Reg_)
(Re".) (Rest.)
(Regular) (Rest.)
(Rest.) (Reg.) I
(Rest.)
(Rest.)
(Reg.)
212 Loyal Book Depot .• Patankar Bazar, La~hkar. (Rest.) 213 Titer BroS .• Sarafa. (ReSt.) 214 Anand Pustak Sadan, 32. Prem Nagar. (Regular) 21S M.e. Daftaci., Prop. -M.B. Jain & Bros. Booksellers. Sarafa La~hkar. (Rest.) 216 Grover Law House, Nr. High Court, Gall. (Rest.) 217 KHao Ghar. High Court Road. (Rca ,)
Hl~D~!~~ Pustak Sadan. 5/26 Bhau Ka. Bazar. (Regular)
219 Seva Kunj. Kanshal Bhawan Bara Hampuri. (Rest.) HATHRAS_
220 Jain Dook Depot., Rohtak Wala Nohra, Agra Road 221 Stlri Ram Parkash Sharma, Hatbras.
HUBLI-222 Pervaji's Book House, Station Road.
(Rest.) (Rest.)
(Reg.)
Station Serial No.
Name of [he party Cat. of Agen!S Station Name of the Party
H~~E~~~;;aj Book Depot., Lakdikapul. 224 Bhasha Prakashan, 22-5-69, Gharkaman. 225 Book Syndicate, Devka Mahal, Opp. Central Bank. 226 Labour Law Publications,. 873, Sultan Bazar.
~~~ ~~~k ~i~k~C~:p2~fl~:'I~har~y~~~~da. INg~R~-;dhwa & Co. 27, Mahatma Gandhi .Road
230 Madhya Pradesh Book Centre. 41. Ahilyapura. 231 Modern Book House, Shiv Vilas Palace. 232 Swarup Bros., Khajwibazar. 233 Vinay Pustak BhandaT.
JA2~~L ~~:er;-Book House, 286, Ja~aharganj. 235 Popular Law House, Nr. Omll P.O.
" 236 Paras Book Depot., 129, Cant t.
JA.A;'U~~ia Book House, Fatehp,urlka Darwaza. .
~~~"Wi~!TI:!opu~'t~k ~hr~~~r,S~~hr~l~ajaj~kaMia~tl:hway, P.B No. 23. 240 University Dook House, Choura Rasta.
JAi£,U~faI~i""Law House. Booksellers & Publishers Opp. Prcm Parkash Cinema
~:~ p~~~~arM~~d~,D~~~~f~~~~in~as:ii~hWay. 244 Raj Book & Subs. Agency 16. Nehru Bazar 245 Krishna Book Depol .• C~ura Rasta. 246 Best Book Co., S.M.S. Highway. 247 Kishore Hook Depot;, ~ardar Pale~ Marg. 248 Rastogi Brothers., TnpatIa Bazar. Jalpur
JA2r:r'iJ~a';'l~ws Agency, Dak Bungalow.
JA2~.r\~Zd~hi Vastu Bhandar, ~atDabai Masjid Road.
JA2'ttH~~~U~itab Ghar. Digons1 Road P.B. No. 78. 252 Gupta Slores. DhatkidiLh. . 253 Sanyal Bros. Booksellers & News Agents, 26. Main Road. 254 Sokhey Trading Co. 1?lagonal Road.
JE~rO~bathi Pustak Bhandar. Main Road.
J~1rSb-;lversal Law House, 186. Chander Shekhar Azad.
JH2'WJ~~ ~~!:Sbarat Chandra
(Reg.) (Rest.) (Reg.) (Reg.)
(Regular) (Reg.)
(Reg.) (Re~t.) .(Reg.) (Reg.) (R~t.)
(Res·) (Rest.) (Rest.)
(Rest.) (Rest·) (Rest.) (Rest.)
(Reg.) (Reg.) (Reg.) (Rest.) (Rest.) (Rest.) (Reg.) (Reg.)
(Reg.)
(Rest.)
(Reg.) (Reg.) (Rest.) (R,,!.)
(Rest.)
(Res!.)
(Reg.)
iv
S~rial No.
JODHPUR-2.58 Cnopta Bros_, Trfpolla Ruar. 259 Dwp:l.ka nass R.at~i. Wholesale Books and News Agents. 260 Kltah Ghar. Sojatf Gate. 261 Rajasthan Law House, High Court Road.
JULLUNDUR_ • 262 Hazoorlna Bro.>., Main Gate.
JULLUNDUR CITY-263 University Publish~rs. Railway Road. 264 Law Book DepoL. Adda Basti. G.T. Road
KANPUR_ 265 Advani & Co .• P. Box 100. The Mall. 266 Sahitya Niketan. Shardhanand Park. 267 Universal Book Stan. The Mall. 268 Gandhi Shanti Pralisthan Kendra, Civil Lines. 269 law Book Emporium, 16/60, Civil tines.
KAPSAN_ 270 Parkashan Parasaran, 1/90, Namdar Niwas, Azad Marg.
\ K~HR~~ Mahat, Khl.Hda (DiSH. Pu~. KOLHAPIJR_
272 Maharashtra Granth Bhandar, Mah!1dwar Road. KUMTA_ K0~t6~G~mat. Booksellers & Stationers (S. Kanam)
214 Asoka nro~hers, Darjeeling LUCKNOW_
275 Balkrishna Book Co., B. 12-A. Nriata Nagar. 276 British Book Depot.. 84. Hazaratganj. 277 Eastern Book Co .• 34. Lalbagh Road. 278 Ram Advani. Hazratganj. P.B. 154. 279 Aequarium Supply Co .• 213. Faizahad Road. i~D~~~k~ Military Eliucational Stores •• 106/B, Sadar Bazar
281 Lyall Book Depot.. Chaura nazar. 282 Morundra Bros., Katchehri Road. 283 Nauda Stationery Bhandar. Pustak Bazar. 284 The Pharm:lecy News Pindi Street.
MADRAS_ • 285 Account Test Institute, P.O. 760, Egmoregore 286 C Subbiah Chetty & Co., 62, BIg. Street, Triplicane. 287 K. Krishnamurthy, Post .pox 384. 288 P. Vadhachary & Co., 8, Llnghi Chetty Street. 289 C. Sitaraman & Co., 33, Royapettach High Road. 290 M. SachechaIam & Co .• 14. Sankurama Chetty Street. 291 Madrass Book Agency. 42. Triumangiam Road. 292 The Rex Trading Co., P.D. 5049, Ill, Pedariar Koil Street.
\
Cat. of Agents
(Reg.) (Reg.) (Reg.) (Rest.)
(Rest.)
(Rest.) (Rest.)
(Reg.)
rn:::l (Res!.) (Rest.)
(Reg.)
(Rest.)
(Rest.)
(Rest.)
(Rest.)
(Reg.)
~~:l (Rcgd.) (Rest.) (Res!.)
(Reg.) (Rest) (Reg .. ) (Res!.)
(Reg.» (Reg.) (Reg.) (Reg.) (Reg.)
(Rest.) (Rest.) (Rest.
Station Serial No,
Name of the party
293 Mohan Pathippagam & Book Depot .• 3, Pyecraftll. Triplicane. 294 Swamy Publishers, P.B. No. 2468. 295 Naresh Co., 3, Dr. Rangachari Road, Mylapore. 296 Sangam Publsihers, 11. S.C. Street.
MADURA1~ 297 Ezhil Enterprjses, 116, Palace Road.
MANOASAUR_ , 298 Nahata Bros,. Booksellers & Stationers
MANGLORE---299 K. Bhoja Rao & Co., Kodial Bail
MANIPUR_ 300 P. C. Jttin & Co., Imphal
MEERUT_ 301 Loyal Book Deport.. Chhipi Tank. 302 Parkash Educational Stores, Subhash Bazar 1303 Bharat Educational Stores, Cbhipi Tank. 304 Nand Traders, Tyagi Mnrket.
MHUW CANIT:_ 305 Oxford Book Depot., Main Street.
MORAOABAO_ 306 Rama Dook Depot. Main Stc¢et.
MUSSOURI_ 307 Hind Traders N.A.A., Centre, Dick Road.
MUZAFFARNAGAR_ 308 B. S. Jain & Co., 71, Abupura. 309 Gargya & Co., 139, G. New Market.
MUZAFFARPUR_ 310 Scintific & Educational Supply Syndicate.
MYSORE- . 311 H. Vankatramlah & Sons, Krishnarajend.sa Orele. 3J2 People Hook House, Opp. : Jogan Mohan Palace. 313 Geeta Book House, New State Circle.
NAOIAO-314 R. S. Desai. Station Road.
NAGPUR_ liS Western Book Depot. Residency Road 316 The Executive Secretary. Mineral Industry Association, Mineral
House, near All India Radio Square. NAINITAL_
317 Consel Book Depot., Bara Bazar. NEW DELHI_
318 Amrit Book Co., Cannaught Circus. 319 Bhawani & Sons., SP. Cannaugbt Circus 320 Central News Agency, 23/90 Caonaught Circus. l21 English Book Stores, 7~L., Cannaught Circus. P.B. No. 328,
Cat. of Agents S tatioD Serlal No.
Nome of t he party Cat. of Agqflts
(Rest.) 322 Jain Book Agency. Cj9, PreIn House, Cannaught Place. (Reg.) (Rest.) 323 Jayana Book Depot .• P. B. No. 25m, Karol BaglI. (Reg.) (~t.) 324 Luxmi Book Stores, 72, Janpath, P.O. Box No. 553. (Reg.) (Rest,.) 325 Mehra Bros. 50·G, Kalkaji New Deh1i~19. (Reg.)
326 Navyug Traders, Desh Bandhu Gupta Road, Dev Nagar. (Reg.) (Res!.) 327 New Book Depot., Latest :Books Periodicals sty., P. B. No., 96
Cannaught Place . (Reg.) (Rest.) 328 Oxford Book & Stationery Co., Scindia House. (Reg.)
329 People Publishing House (P) Ltd., Rani Jhansi Road (Reg.) (Rest·) 330 Ram Krishna & Sons (of Lahore), 16/B Cannaught Place. (Reg.)
331 R. K. Publishers. 23. Deadonpura. Karol Dagh. (Reg.) "(Rest.) 332 Sharma Bros .• 17, New Market, Moti Nagar. (Reg.)
333 The Secretary, Indian Met Society, Ltd .• Lodi Road. (Reg.) (Reg.) 334 Suneja Book Centre, 24/90, Cannttught Place (Reg.) (Reg.) 335 United. Book Agency, 29/1557, Naiwala. KarolBagh (Reg.) (Reg.) 336 Hindi Book House. 82, Janpath. (Reg.)
(Re<;t.) 337 Lakshmi Rook Depot, 57 Ragarpura. Karol Bagh. (Rest.) 338 N. C. Kansil & Co., 4Q, Model Basa, P.O. Karol Bagh, New
(Rest.) Debli. ~Rest.) 339 Ravindra Book Agency, 4D/50, Double Storey, Lajpat Nagar, Rest.)
(Rest,) 340 Sant Ram Booksellers. 26, New MuniCipal Market, Lodi Colony. (Rest.) 341 Subhas Book Deopt, Shop No. Ill, Central Market, Srinivaspuri. (Rest.)
(Rest.) 342 The Seey. Federation of Association of Small Industry of India, 2J-B/2, Rohtak Road. (Rest.)
(Reg.) 343 Educational & Commercial Agencies. 5/151. Subhash Nagar (Rest.) (ReM.) 344 Delhi Book Company, M/l2. Cannaught accus. (Rest.)
345 Navran R.B.-7. Inderpuri (Re~t.) (Rest.) 346 Commercia1 Contacts Tnclb. Subhash Nagar. (Rest.)
347 A. Khosla & Co., Anand Niketan (Rest.) (Reg.) 348 Books India Corporation New Rohtak Road.. (Regular) (Reg.) 349 S, Chand & Co., P. Ltd., Ram Nagar. (Rest.) (Reg.) 350 Globe Pub1ications, C-33. Nizamudin East. (Rest.)
351 Scientific instrument stores, A-35S New Rajindera Nagar (Rest.) (Rest.) 352 Jain Map & Books Agency, Karol Bagh, (Reg'l
353 Hukam Chand & Sons, 3226. Ranjit Nagar. (Rest. (Reg.) 354 Star Publications Pvc. Ltd .• 4/5/B, Asaf Ali Road. (Re,t.)
355 Indian Publications. Trading Corporation. A~7. Nazamudin East. (Rest.) (Rest.) 356 Shee1 Trading Corporation, 5/5777, Sant Nari Dass Marg. (Reg.)
357 SlJpreme Trading Corporation, HadsaQ Chamber (Rest.) (Reg.) 358 Jain Brothers, New Delhi. (Rest.)
PALGHAT-(Reg.) 359 Educational Supplies Depot., Sultan pet (Rest.) (Reg.) PATNA-(Reg.) 360 Laxmi Trading Co., Padri Ki Haveli, (Reg.) (Reg.) 361 ], N. Agarwal & Co" Padri Ki Haveli. (Reg.)
v
StatIon Serial No.
Name-of tbe Darty Cat. of AgcJ1ts
362 Moti Lal Banarsi Dass &. OJ., Padri Ki Hav-tli ~63 Today & TomcITow. Ashok Rajp4th. 364 Books and Book.<;, Ashok Rajpath.
PONDICHERRY I . j65 Hon~t)· Book HOuse, 9 Rue DupIelX.
I'OONA- . 366 Decc:l.n Book Stall, Deccan Gymkhana.
~~J J~~:~~::;~~ll.ef.°~e~6~::., 8w~:~dcm High School, Bombay_ Poona Road.
~~~ I~~raa~~~kl ::~tl~~::' g::?N~r Ap-p? BW'O'lant C-howlc
311 Varma Book Centre. 649, Narayan P~th. 312 Seey .• Bharat ltihasa Samshodlullla Mandir, 1321, SadRshlv Petit. 313 Vidya Commeroo. Home, 379-A. Sbanwar l'elh
PRAYAG-374 Om PlJbli:;hing HOllSC. 842. Daraganj.
'-PUDUJ(KOlTA1-..... 375 Meellskasbi Pattlppagam, 4141, East Main Street.
37ti P. N.Swaminat!lan &. Co., Batar Street. Main Road. PUN'ALUR-
317 M. 1. Abraham (Kerala), RAIAHMUNDRAY-
318 Panchayat Aids •• 10..7-40, ForI Gate. RAJJCOT-~19 Mr.han LM Dm'S.b~:~i Shah, 'Rookse11e1':<; & Sum, &. J:t.d)l\.
Agc.nt. 18(1 Bhupaetai Parasmrn Shah &. Bros., B. B. Street. 38J Yjnay Book Depot, GoVl Qr. No.1 bcltinde S. B, L
RAIPUR-381: Pu:stak Pratishthan~ SatiDazar,
RANCHI-38; Crown Book Depot., Upper Bazar.
REWARI-384 Tita Ram S illSh: Lal.
ROHTAK-185 National Book House, Civil Road.
ROORKEE-386 Yashpal and BrotherS, Statioll Road
SANGRUR_ 387 Pl1njab Eductional Eporium, Dhuri Gate. 388 Gandhi Ma.rg Darshan PustakaIaya; Sangrur(Pb.)
SAUOI!.R-.3 ~9 Yadav Book StaJlJ Publ:isbers & Bocm.sellers.
(Reg.) (R",q (Rest.)
(Rest.)
(Reg,) (Reg.)
(R'=.~ (Reg.) (R .. ,.) (Rest.) (Re,'.)
(Resl.)
(Rest.) (Reg.)
(Rese)
(Rest.)
(Rog.) (Rest.) (Rest.)
(Rest.)
(Reg.)
(R'st.)
(Rest.)
(Rest.)
(Rest.) (Rest.)
(Rest.)
Stntion Serial No.
Namo of1he pari)'
SECUNOERABAD_
vi
390 HinQustan Dairy Publi~he~ Market Street .391 Minerva Book Centre. 8/78, New Alwal.
SHILLONG-392 Allied Publiptions D. Oak lands.
SHOLAPUR-393 Gajanan Book St~, Main Road.
STUGURI-394 N.B. Modem AgencJes, Hill Court Road.
SIMLA 395 Miraerva Book HOLlse, 46. The Ma.Il.
SlVAKASI-396 Oartesb Stores, South CarStreet,
SOI.AN_ , , 397 Jain Magazine Agencies, Ward 4nl~ Rajga.rh Road.
SURAT--'-398 Shri GiUanan P1.Vltakaiays. Tower- Road. 399 Gujarat S llbs. Agency. Ja wahar Lal Nehru Mara. A twa Lines. 400 ]J,p. Ttaders, Bhasia Euilding.
TEZPUR-401 lyon Parkashan BhawaD, Tapur, Assam,
TIRUPATI 402 Ravindra Book Centre. Balaji Colony.
TRlCHINOPOLLI-403 S. Krishnaswami.& Co. 3j,subbash Chandra Base Road.
TRICHURAPPALLY-404 Sri V[dY3.
TRIPURA_ 405 G.R.Dutta & Co. ScientifiC: Equipment Suppliers
TRIVANDRUM-406 International Book Depot. Main Road. 401 Reddiar Press &. Buok Depot, P.B. No.4. 408 Bhagya Enterprises, M.G, Roa.d 409 Sree Devi Book House. Cll~thitta. Trivllondrum.
TUTICORIN-410 K. Thiagaraj!ltl SI, Fresh Chapai Road. 411 Ar.asan Book Centre. 462. V.E. Road.
UDAIPUR-412 Book Centre, Maha:rana B!Jopal College. 411 lagdish & Co.
UJJAIN_ 414 Ra.ms Bros., 41~ Malipura
ULHASNAGAR-415 Raj nook Service.
Cat. of Agents
(R"'.) (Re.st.)
(Rest.)
(R .. t.)
(Rest.)
(Res •• )
(ReM.)
(Regular)
(Reg,) (Rest,) (Ren,)
(Re.t)
(Rest.)
(Regl.l.tar)
(Rest.)
(Resl.)
(Rest.) (Red.) (ReS-t.) (Rest.)
(Re.1.) (Rest,)
(Re,t.) (Rest.)
(Res!.)
(l\.esl.)
Station Serial NO.
VARANASI_
Na"'" or the party Cat. of Agent
:J .
416 Chowkhamba Sanskrit Series Offic •• Gop.1 Mondi, Lan •. P.B. No. 8
417 Kohinoor Stores, University R.oad, Lanka. 418 Viswal'idyalaya Parkashan. Cb""k. 419 Globe Book Centre. P.O. Hindu University. 4;zo Cbankhomba V;".. Bhar.ti, ON .. k.
VELLORE-421 A. V •• kat.osnbh.n, Law Bookullers.
(Reg.) (Reg.) (Reg.) (Rest.) (Rest)
(Rea.)
vii
StatiDn Seria1 No.
VUAYWADA-
Name of the patty
422 Visalanclhra Publishing House. VIZAGAPATAM- .
423 Ou"," Bro.. (Books), Vizi. Building Main Roa4. 424 The Secrelazy. Andbra University General Co. Op, Stores.
WARDHA-41$ Swarajya Bhandlr, Rathi Marut.
Qt. of Agent
(Rest.)
(Rest.) (ReI!.)
(Reg,)
LIST OF AGENTS FOR THE SALE OF GoVERNMENT OFINDIA PUBII·CATIONS AS ON 25·11·76
FOR
I Govt. of India Kitab Mahal, Unit No. 21, Emporia Building, Baba Kharak Singh Marg, New Delhi (phone 343708).
2 Govt. of India Book Dept., 8 Ks. Roy Road, Calcutta (phone No. 23-3813), 3 Sales Counter, Publication Branch, Udyog Bhawan. New Delhi. (Phone No.
372081). Sales Counter, Publication Branch, C.B.R. Building, New Delhi. Govt. of India Book Depot, Ground Floor, New C.G.D. Building Marine Lines, Bombay-20.
S & R AGENTS
The Assistant Director, Extension Centre, Bhtlli Raid. Dhanbad. The Asstt. Director. EJl:tension Centre. Santnagar, Hyderahad_18. The Asstt: Director. Govt. of India. S.I.S.1., Ministry orc & I. Extension, Centre, Kapileshwar Road. Belgaum.
4 The Asstt. Director. Extension Centre, Krishna Dlstt. (A.I.). .5 The As&U. Director,Footwear.Extension Centre,Polo GroundNo.1 Jodhpur 6 The Asstt Director. Industrial Extension Centre. Nadiad (Guj.). 7 The Development Commissioner, Small Sca1c: Industries, Udyog Bhawan,
New Delhi. 8 The Dy. Director Incharge, S.I.S.I., C/o Chief Civil Admn., Goa, Panjim. 9 The Diroctor, Govt. Pross Hyderabad.
10 The Director. IndianBureau or Mines, Govt. of[J:ldia, Ministry of Steel, Mines & Fuel, Nagpur.
11 The Director, S,I.S.1. Industrial Extension Centt'e, Udhne, Surat. 12 The Employment Officer, Employment Exchange, Dhar. Madhya Pradesh. 13 The Employment Officer, Employment ExcbaIlge.Gopal Shaw-an Morena. 14 The Employment Officer Employment Excha.nge, Jhabua. ' 15 The Head CJerk. Govt. Book Depot, Ahmedabad. 16 The Head Clerk, Photozincographic Press,S, :finance Road. Poona. 17 The, Officer-in-charge, Assam OoVl B.D. Gauhati. 18 The Officer-in-charge, Extension Centre, Club Road, Mazaffarpur, 19 The Officer-in-charge, Extension Cantre. Industrial Estate, Kolear, Ranchi. 20 The Officer-in-charge, State Information C-entfe, Ryderabad. 21 The Officer-in-charge, S.I.S.l. Extension Centre. MaIda. 22 The Otficer-in-charge, S.I.S.I. Harba, Tabalura. 24 Parganas. 23 The Officer.in-charge, University Employment Bureau, Lucknow. 24 The Officer-in-charge, S.I.S.I. Chrontanning Extension Centre~ Tangra. 33fl,
North Topsia Road, Calcutta-46. 25 The Officer-in-charge, S.I.S.O. Extension Centre (Foot wear). Cnlcutta-2, 26 The Officer-in-charge. S.I,S.I. Model Carpentry Workshop. Puyali Nagar, P.O.
Bumapur, 24 Parganas. 27 Publication Division. Sales Depot, North Block, New Delhi. 28 The Press Officer, Orissa Sectt, Cuttack. 29 The Registrar of Companies, AndhraBankBldg.,6.Linght ChettyStreet. P.B.
1530, MadIll'. 30 The Registrar of Companies, Assam, Manipur and Tripura, Shiiong. 31 The Registrar of Companies, Bihar Journal Road, Patna-l. 32 The Registrar of Cornfjanies 162, Brigade Road, Bangalore.
LOCAL SALES
33 The Registrar of Companies Everest, 100. Marine Drive. Bombay.
~t. i~: :::!sS:::: c:,rf~paan::~,GGj!~litorSt(~:jmaChar Bldy-, Ahmedabad. 36 The Registrar of Companies, H No. 3-5-837. Hydcl,Guda, Hyderabad. 37. The Registrar of Companies, Kerala 70. Feet Road, Ernakulam. 38 The Registrar of Companies, M.G, Road. West Cotto Building, P.O. Box 334.
Kanpur. 39 The Registrar of Companies, Naryani Bldg., Brabourne Road, Calcutta. 40 The Registrar of Companies, Orissa, Cuttack, Chandi, Ctlttack. 41 The Registrar of Companies,Pondicherry. . 42 The Registre.r of Companies, Punjab & Himachal Pradesh Link Road,
Jullundur City. 43 The Registrar of Cornpanies,Rajasthan & Ajrner,Sh. Kumta ParshadHouse,
1st _Floor. 'C' Scheme, Ashok Marg, Jaipur. 44 The Registrar of Companies. Sunlight Insurance Bldg., Ajmeri Gate, Exten-
tion, New Delhi. 45 Tht: Registrar of Trade Unions, Kanpur. 46 Soochna Sahita Depot. (State Book Depot), Lucknow . 47 Supdt., Bhupcndra State Press, Patiala. 48 Supdt., Govt. Prcss& Book Depot, Nagpur. 49 Supdt., Govt, Press, Mount Road, Madras. 50 Supdt.. Govt. Stationery Stores and Pubs .• P.O. Oulzarbagh, Patna. S! Supdt., Govt. Printing and Stationery Depot. Rajasthan, Jaipur City. 52' Supdt., Govt. Printing and Stationery, Rajkot. 53 Supdt., Govt. Printing and Stationery, Punjab Chandigarh. 54 Supdt.. Govt. State Emporium V.P. Rewa. S5 Dy. Controller, Printing & Stationery Office, Himachal Pradesh, Simla. 56 Supdt .• Printing and Stationery. Allahabad, Uttar Pradesh 57 Supdt.. Printing & Stationery, Madhya Pradesh. Owalior. 58 Supdt., Printing and Stationery, Chami Road. Bombay. 59 Supdt., State Govt. Press. Bhopal. 60 The Assistant Director, Publicity & Information, Vidhan Saudha, Bangalore-l 61 Supdt., Govt. Press. Trivandrum. 62 A?lit. Infl)1maticm Qiike1, PIt:M 'InfCotma.t\Du "BUte-au, lnfotmatit)n ~n.\tt.,
Srinagar. . 63 Chief Controlleroflmports & Exports Panjim,Goa. 64 Employment Officer, Employment Exchange (Near Bus Stop Sidhi (M.P.). 65 The Director, Regional Meteorological Centre Alipur, Calcutta. 66 The Asstt.'Director,State InformationCentre,Hubli 67 The Director of Supplies and disposals, Deptt. of Supply, to. Mount Road.
MaW-as-2. 68 Director General of Supplies and Disposals, N.I.C. Bldg., New Delhi. 69 The Controller of Imports and Exports, Rajkot. 70 The Inspector. Dock Safety, Mil & E Madras Harbour. Madras. 71 The Inspecting Asstt. Commissioner of Income Tax. Kerala, Ernakulam.
.... 72 The Under Secretary, Rajya Sabha Sectt., Parliament House, New Deihl. 73 ControJIer of Imports & Exports. 7. Portland Park, Visakhapatnam. 74 The Senior Inspector. Dock Salty BotawaUa Chambers, SirP.M. Road,Bombay. 75 Controller of Imports & Dxports I.B., 14-P.Pondicherry. 76 Dy. Director Incharge, S.l.S.I. Sahakar Bhawan. Trikon Bagicha. Rajkot.
viii
S. '" R. AGENTS
77 The Publicity and Liaison Officer, Forest Research Itlstitute and Colleges, Neat rol:cst. l' .0. Dt.hradun.
78 The AssU. Controller of Imports and Exports Govt. of India, Ministry of Commerte. New Kllndla.
79 The Deputy Director (S.D.) Esplanade East. Calcutta. ao The Director, Govt. of IndIa S.I.S.I., Ministry of I & S. Industrial Areas-B
Ludhiana. 81 The GOYI. Epigraphist fat India .
. 82 The Asstt. Director. lie. S.I.S.I. Extension Centre. Varanasi. 83 The Director of Supplies. Swarup Nagar, KanpllT. 84 The Asstt. Director (Admn.) Office of the Directorate of Supplies & Disposals,
85 ~:-'~lief Controller of I & B Ministry of International Trade, Madras. ' 86 The Dy, ControlJer of CUstoms, Custom House, Visakbapatnarn. 87 The Principal Officer, Marcantile Marine Deplt., Calcutt,a. SS The Director, S.I.S.I., Karan Nagar. Srinagar. . 89 The Director, S.1.S.1 .. l07,Industrial Estate. Kanpur. 90 The Director of Inspection. New Marine Lines, Bombay·1. 91 The Dy. Chief Controller of Imports &, Exports, T.D. Road, Ernakuiam,
~~ ~~ ~:~!: B~~:~~: V(ts.~~~~~~~ru:R:a~elI~\;ltur~ngabad. 94 The Employment Officer, 'ratcher. 95 The Director of Inspection, Directorate General of supplies & Disposal, Ii
Ganesh Chandra Avenue. Calcutta. 96 97 98 99
100 101 102 103 104 105 I~ 107 108 109 110
111 112 113 114 115
The Collector of Customs, New CUstom House, Bombay. The Controller of,Imports & Exports, Bangalore. The Admn. Officer, Tariff CommiSSion, WI, Queen's Road, Bombay. The Commissioner of Income Tax, Patiala. The Director, Ministry of 1. &. Supply, (Deptt. of Industry) Cuttack. The Dy. Director of Public Relations, State Information Centre. Patna. The Officer-in-Charge, State Information Centre, Madras. The Asstt. Director. S.LS.M.I., Road. Jaipur. The Collector of Customs. Madras. National Building Organisation. Nirman Bbawan, New Nelhi. ~: )(=:~ t!ni~e=~Db~~~.Dombay Region, Bombay. The Sardar Patel University, VaUabh Vidyanagar. The DU:ect.or of In~us!ries & Commerce, Bangalore-l. ~!n!7!~ft~l, P~~C'"tko~~di~~~~~se-g~thf COmmission for Scientific & Tech.
~~ ~~ce:o!/~!~~!i~r&~~e~~ati~~aiNr::~~:~~ Road, Jaipur. Controller of Aerodromes, Delhi. ControUcn-of Aerodromes, Calcutta. ControUer of Aerodromes, Bombay.
ix
116 Controller of Aerodromes. Madras: 117 The Registrar. Punjab Ageil. University, Ludhia.na. 118 The Land & De'Veloprnent Officer, Ministry of Health and Family Planning.
W.fJ. & D., Nirman Bhawan, New Delhi. 119 Acting Secretary, Ofrtcial Language (Lea.) commission Ministry of Law,
Bhagwan Dass Road, New Delhi. 120 Registrar General India, 2/A. Mansingh Road, New Delhi·ll. 121 The Director of Census Operations, Andhra Pradesh, Khusro Manzil,
Hyderabad-4. 122 The Director of Census operations, Assam, O.S. Road. Ulubari, Gaubati-7. 123 The Director of Census Operations, Bihar, Boring Canal Road./P otna. 124 The Director or Census Oper ations. Gujarat, Ellis Bridge. Ahmeda bad-6. 125 The Director or Census Operations. Haryana, S.C.O. No. 19, Sector 26,
Chandigarh. 126 The Director of Census Operations. Himachal Pradesh, Boswel, Simla-5. 127 The Director of Census Operations Jammu & Kashmir, 19 Karan Nagar, Srinagar 128 The Directr of Census Operations ICeralu. Kowdiar Avenue Road,
Trivandrunl-3. 129 The Director of Census Operations, Madhya Pradesh. Civil LInes Bhopal-2. 130 The Director of Census Operations. Matasbtra, Sprott Road Bombay·} (BR). 131 The Directr or Census Operations, Manipur ImPhal . 132 The Director Qf Census Operations, Meghalaya, N augri Hills, Shillong-3 133 The Dircctor of Census Operations, Mysore, Basappa CrosS Road Shanti
Naga-. Bangalorc-l. 134 The Director of Census Operations, Na.galand. Kohima, 135 The Director of Census Operations, Orissa, Cltandni Chowk, Cuttack-I. 136 The DirectoroFCensus Operations, PLlnjab, S.C.O. No. 17, Sector 26 Chantiigarh. 137 The Director of Census Operations, Rajasthan, Rambag Palace. Jaipur. 138 The Director of Census Operatios, Tamil Nadu, 10, Poes Garden. Madras-86. }39 The Director of Census Operations, Tripura, Durga Bari. West Compound.
Agartala. 140 The Director Of Operations Uttar Pradesh, 6 Park Road. Lucknow. 141 The Director of Census Operations, West BengaJ,20.British IndiaStrcet, 10th
Floor, Calcutta-t. 142 The Director of Census Operations. Anadaman and Nicobar Islands, Port Blair. 143 The Director of Census Operations Chadigarh S.C.O .• No. 18, Floor No.1.
Madhya Marg, ~toi--26. Chandigarh-160025. 144 The Director of Census Operations, Dadra and Nagar Haveli, Panaji. 145 The Director of Census Operations, Delhi. 2 Under Hill!; Road, DelhI-6, 146 TheDirec:torofCcnsusO~tioos, Goa, Daman & Diu, Dr. A. Borkar Road.
Panaji. 147 The Director of Census Operations, L.M. & A. Islands. Kavaratti. 148 The DireCtor of Census Operations, Tamil Nadu & PondichclTY. 10, Poes
Garden, Madras.

s. '" R. AGJlNfS
. IS ',I Sci::noe Doctlmentation -Celljre. ~1f",,·Delhi. ~~6 ~~ :gJ!~~tg[ Empl~:ment Offi~> D:i5U. Emp(oyrne,t E~h<1nf;e. Malaouram
~eJ~~1 S~~nec(or (H rs:.l ·Custom & Central ~,Stil1om;. J S1 The Asstt: Colte<:tor of t;ntral Excise,. I.J?~.I. DIY., Vlsakapatnam. 1.52 Th H Asslt Collectc.r Central ExClse. Hydereba~ ;~~ Th~Putjj~ RdaiionsOffiw. CoIlectorateotCus:toms ewCumstom House.
[.55 ~~D'j!r;i~naL Offi(:eT. coUectorale of Central Excise. Intf::~ted Div[sion.
156 T~::.t~~;: ColledC'I (Bqrs.) CollectOIale of Central Excise M~byaPrade5b and Vidharbha. Na~pur-44I)9()I.
The H rs Asstt Collector of Central Exc-~c. Guntur (A.~.~ .. ~i~ The A~tt. ColiectOl' of Cen.tral EK(j~. £~nakutam-l. DlVlSlon Ernakularn.
159 T~~~~·tt~. Collector (Hqrs.\ Coitectrn: of Central E:'Icise, Nngambak~m. ~!~s~~~I1~~:~~~3~entrar Exc~c. Di ... :isjonaJ Offi~. Ujj~in: 160
161 162 16J 164 165
166 .167 168 169 170
171 112 113 174 l7S 176 177 178 179
The Di",i;ional otrtCeT, Centra1 Ex~ise~ l?i.V!lOion Office Amra atr. Tile Assn. Colleclor, CenLral E"xClsc-.Dl'Vlsl-on, Bholl.Ql{M.~.), The Asstt. Co1le(:tor, Cemral Excise, M.O.D.~.~ ~ew .DeIhl. The A:-;:stt CoUedor ofCenfralExcise, lnt. DIvIsion, )Ildore. . The Director of H.A.U.,8ook Shop. Nehru Library Dldg •• H.A.U., H[~sat
(Harya®). . The A~stt. Collector, Centtal Excise & Customs, D~ub.r1. The Asstt. Collector, Ce'rltral Excise. Cuttack fOr~ssa).
~l~ ts~~i~' [~~~~:,' ~:~it::l E~~~~C'&V~~~~~~R~·~'~ela. The Asstt_ Coll~100Hqts.) Central Excise, New ExClse Bldg., ChuTCbgate,
T~~nAbd!~;_4~uO~lor (Hqrs.). Central Exc;}se, Bhubanesw.ar (Orhsa).
rb: ~~~f~~)t~~Imd.;f~ut~~rn~~s~:~~e~~ Cochitl·U.
R~ ~ti~~~~~~~E~~~ ~~~=~~!!~r. T!Je A5SU. Cc·llec1or'ofceou.aI Excise & (:llSI0Dls. s.cmbalplU'. The As'S1t. CD\\et:lor (Hqrs.), Centra~ 'Escise, ~anpur_ The Asstt. Collector Central Customs & ExCIse, JerhaL TIlt AS'5tl. Coik<:tor (Hqrs.). Central Excise. Patna, qo Collectorate of Central
Excise &. Customs. Pal~a lBU The rustt. Collect"-lt oCCUstoms. CUS(om HOI.!.se. New Kandra.
RAlLWA", DOOKsrALL HOLDERS Sis A.B. Wheeler &. Co., 15. Elgin Rood AIl<.habad. Sis Higginbothams &; Co .• Ltd.~ Mo!;nt Ruad, Mal:1ras. SIs QahlJot Bros., K.E.M. Road, ntkaner.
FOREIGN SIs Educaion Entocprise Private Ltd. Kathmandu (Ne~). SIs Aktieoolgat, C.E. Frit-zes KunSl, HovbokhandeJ, Fredgatioo.2, Box 1656.
Slockholm 1-6. (Sweden).
3 Rcise-und·Yer Kobres ve.rl.agc StuH GaTt POS1130, Gutonlcergstrlee 2~ Stuttgort Mr, 11245 Stuttgart, Den (Germany West).
<\. SllS Boo~ Centre, Lakshmi Mansion, 49, The Mall. Lahore(Pakistan), 5 SIs Dritghi Ranchi InlernatiOllUl Boak!:ell(!1's, Via Cavou.r, T-9-U 3-:5000 PodoYa
'S~~W'2pf & Co., Booksellers, Et1_gli..<;h Depll. Eisngasse JSBaseJ (Swilzcrlmtd). Otlo Harrassowitt B!Jchhandiung aund Antiquarial. 6200 Wi.-;cbadcn Taun(]stra
(Germany). 8 SIs A. A~hc[ & Co .• N. V. Kei7ersgracht. 526, Amsten:lam-c (Holland). 9 S!s Swets &- Zeitlinger N. V.471 & 487 KcizcN8racht Amsterdam (Holland).
10 M.F. Von Piers, Rcchitracl 62, SitldhoW-1l (Holland). 11 H.K. Lowi:s & Co Ltd., IJ6, Gower Street, London W,C.-I. 12 Herbert Willson Ltd .• Booksellers & Sub Ag_ent~ 161 Brough HJgh Stroot, London
. S. E.J. (England). 13 Buch und zeitacluifren, M.B.H. r·lnd ExtJort Cross und. KQnlli~i Onbuch
Hand)lng lnternation Vcrlagsa.UsUeferundelllbufg (Germany).-14 SIs' Store Nordiske YidenskaboghandeJ, Remersgade. 21 DK J 362. Copenh."Lg!:D
K. (Denmark). 15 The E:t-Libxis. l3uchhandeis,gelischaff, Harinoll Oswald & Co., K.G. Frankillk
Ma\n(Germ-any). 16 Dr. Lud':'i& Hantaschd Univcrsilylas·"Buchham.llung, 34·C, Ottingcn (Germany). 17 OUo Koelltz Anti9uaiat, 624, Keen.igsting TaUllus, Rerrnwaldstr.6(W.Germany) J8 Asia Library SerY.lce, 1841. 69th Avenycs~ Clifornia~ (U.S.A..). ;) l!:t Pubishing and D~tribution Co. lirl., Mitre Ho~e, 177, :Regfct Street, LonA
dGIlW-f . '2(1 R.ei~U-':er:k Ehrsvedag; 7, Slllttgart·Yaihing"-.II Postera:h "li·o..o83(1, Ho:tig1"l'iesen
str-25tGl:rrnan},). 21 Art!lur Pr~b5lbain Oriolltal Oook SeUer~ & Publisher. 4\, Great Russel S-treet
(LoDdon w.e.-I). 22 Independellt Publismng Co., 38, Kenning:lon J..ange. London S B.IL 23 Inter Conti.nenta\ Marketing Coflloration. Tokyo (Japan).
~~ ~~~~ ~~:!.f i:h:;g~':h~Ja!~y, S~~d~.~;g~)· 26 Stecbcrt MacmillioD IDe .• 7250. West FiEld Avenue, (New leru£Y 08! TO)
36168 DCO-Govt. Press, UT., Cild.