CEMBA 570: RESEARCH METHODOLGY
200
Transcript of CEMBA 570: RESEARCH METHODOLGY


UNIT 1 Il\1PORTANCE OF RESEARCH INDECISION lVIAKING
Objectives
After going through this unit, you should be able to:
• Explain the meaning of research in the context of making intelligent decisions.
• Discuss the need for research in decision making.
• Explain the actual process of research and its role in managerial decisions.
• Distinguish bet:\:veen the various types of research.
Structure
1.1 Introduction
1.2 Meaning of Research
1.3 Role of Research in Impoliant Areas
1.4 Process of Research
1.5 Types of Research
1.6 SummalY
1.7 Self-assessment Exercises
1.8 Fmiher Readings
1.1 INTRODUCTION
When managers use research, they are applying the methods of science to the art ofmanagement. All business undertakings operate in the world of uncertainty. There isno unique method which can entirely eliminate uncertainty. But researchmethodology, more than any other procedure, can minimise the degree ofuncertainty. Thus it reduces the probability of making a wrong choice amongstaltemative courses of action. This is particularly significant in the light of increasingcompetition and growing size which make the task of choosing the best course ofaction difficult for any business enterprise.
It is imperative that any type of organisation in the present environment needssystematic supply of information coupled with tools of analysis for making sounddecisions which involve minimum risk. It is in this context that the researchmethodology plays a velY important role. In this unit, we will discuss at length theimp011ance of research in decision making by delineating all its relevant elements.
1.2 MEANING OF RESEARCH
Research is not an existing bag of techniques. Research is not a fishing expedition oran encyclopaedic gathering of assorted facts. Research is purposeful investigation. Itprovides a structure for decision making. There are three parts involved in anyinvestigation: (1) the implicit question posed. (2) the explicit answer proposed.(3)collection, analysis, and interpretation of the information leading from thequestion to the answer. This third part is the defense that justifies therecommendation and is viewed as research. For example consider the statement "Werecommend that model A TV be priced at 14000/!". This was the recommendationforwarded to the marketing vice president by the marketing research manager. Theimplicit question posed in this quote is what should be the selling price of model A?The explicit answer is Rs.I4000/. The third pa11 deals with the collection, analysis,and interpretation of the information leading from the question to the answer ofRs. 14000/.
5

Introduction to ResearchMethodology
l@J
6
The word research identifies a process by which the organisation attempts to supplythe infoll11ation required for making sound management decisions. Research is notsynonymous with common sense. The difference revolves around words such as"systematic," "objective," and "reproducible."Both research and common sensedepend on infol111ation; the distinction between them lies in the procedures andmethods adopted by which the infoll11ation is obtained and used in arriving atconclusions. Research cannot adch'ess itself to the complete infollnation on aparticular subject. Hence t\\'o secondary characteristics of research specify"relevance", and "contro1."
A systematic approach is essential in good research. Each step must be so plannedthat it leads to the next step. It is usually very difficult to go back and conect themistakes of the previous step; sometimes it is impossible. Even when it is possible, itwill involve loss in time and money. Authors have divided research in to a number ofsteps. Both the number of steps and the names are somewhat arbitrary, however therecognition of a sequence is cl1lcia1. Planning and organisation are pmt of thissystematic approach with a lot of emphasis given to the interdependence of thevarious steps.
While planning, one of the velY common mistakes that is committed is the separationof data collection and data analysis. First we collect the data; then, we decide whatanlysis is appropriate. This approach invites a disaster. In one of the researchprojects, depth interviews of the fresh college students were cmTied out at a very highcost and the neceSS31Y data were all collected. The data were still unanalysed becauseno one knew how to proceed. Om point is that considerable thought should have beengiven at the planning stage itself as to what kind of analysis will be required for theproject which will satisfy the needs of the decision maker.
Objectivity warrants an approach which is independent of the researcher's personalviews and opinions with regard to the answer to the problem under investigation. It ispossible to have honest differences with respect to the proper definition or collectionprocedme, but the one selected must not be chosen in order to verify a prior position.
Look at a scene in the moming and then in the evening. Use the naked eye and thenthe tinted glasses. It is the same with research. A high proportion of shoppers in storeA have a positive opinion of store A. Shoppers in store B may have a totally differentopinion of store A. Pmchase behaviour varies with price spec.iaIs. It is alwayspossible to prove a point if one desires, by carefitlly selecting the respondents, time,and place. Tme research attempts to find out an unbiased answer to the decisionmaking problem.
A reproducible research procedure is one which an equally competent researchercould duplicate and from it obtain approximately the same results. In order to achievereproducibility, all procedmes must be stated unambiguously. Precise 'wording ofquestions, method of sampling, collection method, interviewer instmctions. and allother details must be clearly stated. Even if the environment changes, the research isatleast "conceptually" reproducible in the sense that the steps could be mentallyduplicated.
The interviewer should avoid the temptation of rephrasing the question for therespondent in order to preserve reproducibility aspect. Poor and vague samplingprocedure can also lead to nonreproducibility. If procedmes are vague and not statedclearly, you cannot expect consistency even from the same interviewers.
Relevancy accomplishes two imp01tant tasks. First it avoids the collection ofunnecessaty infol111ation along with the accompanying cost. In the second place itforces the comparison of the data collected with the decision maker's criteria foraction. Before the statt of the research project, you should ask the question "whataction would you take if the research ans,ver were?" This approach enables both theinvestigator and the decision maker to know whether the project is on the rightdirection.
Control aspect is particularly elusive in research. '.,Ve must be aware that the results ofom study are due to the presence of some factor other than those we are
investigating. It is impossible to have control on all other factors; the best \ve can dois to have control for those we think are most likely to cause us difficulty. Supposewe Shldy the relationship between shopping behaviour and income withoutcontrolling for education and age, it will be the height of folly since our findings mayreflect the effect of education or age rather than income.
Control raises extremely difficult issues when research is conducted in a liveenvironment. Many factors other than the ones of principal interest may influence theresearch results. The danger is that the researcher may attribute changes to onevariable when the uncontrolled variables are the causes.
Control must consider two aspects. (1) Those variables that are truly with in yourcontrol must be varied according to the nature of your investigation. (2) Thosevariables beyond your control should be recorded.
Activity 1
The three parts concerning any research investigation are:
Activity 2
The five distinguishing features of any good research are:
Activity 3
Mention a few research studies where it is impossible to have control on all otherfactors:
1.3 ROLE OF RESEARCH IN IMPORTANT AREAS
Through research, an executive can quickly get a synopsis of the CUlTent scenariowhich improves his infonnation base for making sound decisions affecting futureoperations of the enterprise. The following are the major areas in which researchplays a key role in making effective decisions.
Marketing
Marketing research has become very cl1lcial in taking sound marketing decisions.Marketing research involves the process of systematic collection, compilation,analysis, and interpretation of relevant data for marketing decisions. Research toolsare applied effectively for shldies involving demand forecasting, consumer buyingbehaviour, measuring advertising effectiveness, media selection, test marketing.product positioning. and new product potential.
Production
Research enables an organisation to decide on what to produce, how much toproduce, when to produce, and for whom to produce in the field of production.Research tools are also of immense help in quality control. and setting up optimuminventOly level.
Banking
Banking instihltions have found it usenll to setup research departments for the
Importance of Researchin Decisiollmakillg
l@J
7

Introduction to ResearchMethodology
~
8
purpose of gathering and analysing information both for their intemal operations andfor making indepth studies on economic conditions of business. Reserve Bank ofIndia has setup an excellent research department for planning and managementreporting.
Materials
The materials department uses research to fi'ame suitable policies regarding \vhere tobuy, how much to buy, when to buy, and at what price to buy.
Human resource development
The llUmanxesource development department uses research to study wage fates,incentive schemes, cost of living, employee tUlllOver rates, employment trends, andperformance appraisal. It also uses research effectively for its most impOliant activitynamely manpower platming.
Government
Research lays the foundation for all government policies in our economic system. Forexample, research is applied for evolving the union finance budget and railwaybudget evelY year. Research is used for economic planning and optimum utilisationof resources for the development of the nation. Research is also needed forsystematic collection of information on the economic and social structure of thenation. Such information indicates what is happening to the economy and 'whatchanges are taking place.
Activity 4
List out the uses of research in the field of:
a) Hospital Management
b) Railways
c) Temple Management
d) Traffic Control (by Police)
1.4 PROCESS OF RESEARCH
The process of research involves the following steps:
1) Problem definition
First of all we should be clear about the problem we are facing. Suppose in aparticular case we want to know which mail pie.ce be employed. Your decision maybe to use either direct mail piece A or direct mail piece. B. The researcher shouldadeast verify that these are the only two options open to you. Should other mailpieces be considered? Should methocl5 other than direct mail be. employed? Should acombination of A and B be used? Let us assume that the altematives have beenc011'ectly specified: either A or B will be employed.
We have identified the alternatives available to you. but we have not specified acomplete problem definition. The complete problem is also concerned with thecriterion that will detennine which mailing is superior. The criterion may be therupee value of the sales generated, number of persons placing orders., or perhapssome definition of profitability from sales generated. The definition of problem iscomposed of three aspects: (a) the specification of the unit of analysis for the study.

(b) the identification of the particular units with in the scope of the study (c) thespecification of the kind of info11nation sought conceming those units. What wouldMaking you like to know if information were free and without elTor? A completeanswer to this question defines the initial research problem. It may later be refinedand redefined because of cost or time considerations or because of measurementdifficulties, but it establishes a starting point.
The unit of analysis for you is a person, you want to know how persons ,,,,ouldrespond to mail piece A and mail piece B. Which persons? Are you interested in the5000 persons on the mailing list? The answer to this question determines thepatiicular units (universe or population) with in the scope of the study. Theinformation sought could be "will A or B generate a higher volume of sales in termsof rupee value from the 5000 names?"
The time dimension is missing; sales for what period of time? A properly definedpopulation must have time and space coordinates. If the mailing is scheduled forOctober 10, 1990, the relevant time period may be from the beginning of October tothe end of November. Alternatively, a much longer time dimension may be in view.The space coordinates of the problem definition are those that pertain to thegeographic area in which you contemplate possible actions.
2) Research design
The second step in research is the research design-the blue print for the research. Thebasic issues addressed in research design are:
1) Should the research environment be internally disturbed by the researcher inspecified ,"vays-an experimental design-or should the environment be studied as itexists without such disturbances? In our example of the mail orderfi11n.anexperimental design is required if the manager is to use mail piece A for onegroup and mail piece B for the second. A nonexperimental design would requirefinding past examples in which A and B had been applied-a most unlikelyoccunence, paliicularly for the population defined.
2) How many observations should be made on each unit in the study? when?
3) Should a single sample be chosen from the total population or should a series ofsamples be chosen from various subgroups of the population?
4) Should a probability or non-probability sampling procedure be adopted for thestudy?
3) Data collection
The next step in the research is the collection of relevant data. Collection involves thebasic definitions for the concepts to be investigated, specific wordings of inquiries tocommunicate those concepts, delineation of the environment in which the data willbe collected, specific field procedures. and the design of instruments for recordingthe actual data. Data collection looks forward to data analysis; data requirements forvarious analytical techniques must be anticipated in the data collection phase. Specialcare must be taken in the collection phase to avoid sources of understatement oroverstatement for the various characteristics. If such biases are feared, the researchershould consider whether there are ways of introducing adjustments. Theseadjustments would be introduced in the analysis phase. but the data must begenerated in the collection phase.
The collection phase must consider the diverse tasks of assignment and recruitmentof staft~ ways of increasing response rates, costs and bias sources under alternativecollection approaches, and proper training of personnel. The effect of each of theseon accuracy. monetaly costs, and time constraints must be evaluated. Finally, thecollection phase must be supervised as well as planned. Unfortunately, many wellplanned research projects have failed because of inadequate supervision. Procedureswhich sound good but are inadequately administered lead to invalid results just asmuch as ill-conceived procedures do.
The "operational definition" is a must in any scientific inquity and is mostobvious in the collection phase. The operational definition is the nitty-gritty ofhow the details of collection, measurement, and wording are to be handled in
Impoliance of Researchin Decision making
l@J
9

Introduction to ResearchMethodology
~
10
the research. It is the practical counter part of the concept developed for the decisionmaker's action problem and includes a variety of issues. The issues to be handledinclude the use of check responses versus open-ended questions, the number ofaltematives offered to the respondent, and whether the respondent is to choose thealtemative or whether he or she may select several.
Good research demands unambiguous tenns. Care must be exercised in the use ofmodifying adjectives or adverbs. The addition or deletion of a single word canproduce drastically ditferent results without clarifying the meaning of those results.Compare the following four questions.
Do you use brand X?
Have you ever used brand X?
Do you regularly use brand X?
Is brand X your favourite brand?
What fi'equency of use conesponds to each of these four questions? Does the fourthconespond to fi'equency in any way? The appropriate wording depends on theproblem at hand, but no wording can be appropriate unless its meaning is dear. If theprecise meaning does not really matter, the research doesn't matter either: so whybother?
The researcher and the decision maker desire data that are as fi'ee fi-om error aspossible. This is two-pronged:
1) the data collection plan-questions, instruments, and procedures-must beappropriate for the decision 111akelJ s problem and
2) the data collection plan must be properly implemented.. Implementation requirescompetent personnel plus supervision. It is easier to obtain valid data initiallythan to make cOll'ection later. Despite this, good research includes verification ofdata validity on atleast a sample basis.
The researcher should not ignore the possibility that relevant data are ah'eadyavailable. A vast amount of historical as well as cunent statistics.. ranging fi'omvarious census publications to special purpose survey of particular industries, andproducts are already available through govemment publications. This ly1Je of data iscalled secondary data and is provided by another source-has an obvious advantage incost and immediate availability. Its appropriateness for a pmiicular study must bejudged separately for each problem. Carefill evaluation of secondary sources for thequality of data is necessmy. The better sources supply a summary of proceduresemployed; lacking any basis for appraising the quality of data the researcher shouldbe extremely reluctant to rely on them.
Primmy data - data for which the researcher defines the tenns and exercis.es thesupervision of the project - must not be automatically construed as "more accuratethan secondmy data". The secondary sources may be more capable of generating therequired data. It may have the resources to obtain more representative and largersamples. It may have interviewers and measuring instruments with uniquecapabilities in specialised fields.
Errors associated with data are typically classified into two categories: sampling andnon-sampling enol's.
Sampling enors are differences that arise because a sample rather than a census isemployed. Different samples composed of different units \vmlld yield differentresults. The magnitude of the differences among the possible samples is an indicationof the amount of sampling error associated with the research plan.
Non-sampling ell'OrS arise because the data collection procedures. question wordings.etc. would not yield the "coned" result even if a census were employed. Biases areintroduced. Non-sampling enors canllot be mathematically appraised: theirmagnitude is more a subjective appraisal resting upon familiarity with the substantivenature of the investigation and data collection 'within it.

4) Data analysisThe fourth step in research is the analysis. In this stage the data collected areprocessed in order to summarise the results, whether they may be statements withrespect to single characteristic or relationship among characteristics. Data analysisseeks to determine how the units covered in the research project respond to the itemsunder investigation. This may be for individual questions or it may be for sets of'questions-seeking to discern whether any patterns exist. .
In our example the mail order finn has defined the decision: the use of either A 01' B.In this situation, if the data were available the manager would simply determine thesum of sales over the 5000 individuals with each mailing piece - a most elementmyanalytic process. Alte11latively, the manager could have subdivided the population inthe research design in order to study possible differences by market segments. Thesame type of comparison would be required, but the comparison would be for varioussubgroups rather than for the entire population.
The manger might also wonder whether certain types of individuals are betterprospects than others. Information must be obtained from each unit in the study forthose characteristics that the manager hypothesizes are indicators of the betterprospects. The data must then be analysed in a manner that is satisfactOlY for testingthe hypothesis. This can be further complicated by asking whether some individualsare "good" prospects regardless of which mailing piece is used, whether others are"good" prospects with only one of the mailing pieces, and finally whether others arenot "good" prospects with either mailing piece. This rephrasing will have substantialimplications for both data collection and analysis.
Data analysis can be conveniently classified as under:
1) Univariate analysis
2) Bivariate analysis
3) Multivariate analysis
Univariate analysis deals with a single characteristic of interest, bivariate analysisdeals with two characteristics of interest, and multivariate analysis deals "vith morethan two characteristics of interest. More on this can be found on another unit undermarketing research.
5) Int('rllr('fation of r('suIts
Interpretation of results is the "so what?" of research. Research is wasted and uselessunless it influences actions. It seems elementaty to say that research results musthave relevance for the decision to be made. We state it only because it is ignored somuch in. practice.
Not only must the results be interpreted into action recommendations but thereconmlendations must also be conununicated to the executive in an understandablemanner. It is not enough that the executive comprehend the recommendation; thecommunication must instill confidence that the recommendation is justified.Technicaljargans should be avoided except when absolutely essential. Results shouldbe presented in as simple a manner as possible. If the researcher cannot make theresults comprehensible to the executive the researcher may not have sufficientunderstanding of the problem to wan'ant adoption of the recommendation.
The line manager who uses research must be conversant with research procedures.This familiarity is needed for three distinct but related reasons.
a) The line manager must adopt or reject research recommendations. Therefore themanager must understand the proper interpretation of research results and theassumptions embodied in them.
b) The line manager poses the initial problem and its environment. Therefore themanager must understand the kinds of questions research can handle and the typeof structure required to make a problem "researchable".
c) The line manager is a prime target for "snow jobs" from researchers. Thereforethe manager must be capable of appraising the feasibility of research proposals.
ImpOitance of Researchin Decision making
l@J
11

Introduction to ResearchMethodology
l@J
12
Activity 5
The definition of problem is composed of
Acthity 6
List out the sources of Non-sampling error
Acthity 7
Can we reduce sampling en'or by increasing sample size? JustifY yom ans"\,ver
Activity 8
Data analysis can be classified into:
Activity 9
Explain the importance of interpretation of results.
1.5 TYPES OF RESEARCH
On the basis of the fundamental objectives of the research, \ve can classifY researchinto t:\''iO types:
1) Exploratory research
2) Conclusive research
1) Exploratory research
Many times a decision maker is grappling with broad and poorly defmed problems.Attempts to secme better definitions by analytic thinking may be the wrong approachand may even be counter productive counter productive. in the sense that thisapproach may lead to a definitive answer to the wrong question. Exploratory researchuses a less formal approach. It pmsues several possibilities simultaneously, and in asense it is not quite sure of its obje.ctive. Exploratory research is designed to providea background. to familiarise and. as the word implies, just "explore" the generalsubject. A pati of exploratory research is the investigation of relationships amongvariables without knowing why they are studied. It borders on an idle cmiosityapproach, differing fi:om it only in that the investigator thinks there may be a payoffin application somewhere in the forest of questions. Three typical approaches inexploratory research are:
a) the literatme survey.
b) the experience survey. and
c) the analysis of "insight-stimulating examples.
The literature search is fast economical way for researchers to develop a betterunderstanding of a problem area in which they have limited experience. It ahofamiliarises them with past research results, data sources. and the type of dataavailable.
The experience survey concentrates on persons who are particularly knowledgeablein the particular area. Representative samples are not desired. A covering of widely
divergent views is better. Researchers are not looking for conclusions; they arelooking for ideas.
The analysis of specific examples is a sort of case study approach, but againresearchers are looking for fresh possible divergent views.
2) Conclusive research
ExploratolY research gives rise to several hypotheses which will have to be tested fordrawing definite conclusions. These conclusions when tested for validity lay thestmcture for decision making. Conclusive research is used for this purpose of testingthe hypotheses generated by exploratOlY research. Conclusive research can beclassified as either descriptive 01' experimental.
Descriptive research
Descriptive research as the name suggests is designed to describe something - forexample, the characteristics of users of a given product; the degree to which productuse varies with income, age, sex 01' other characteristics; 01' the number who saw aspecific television commercial. To be of maximum benefit, a descriptive study mustcollect data for a definite purpose. Descriptive studies ValY in the degree to which aspecific hypothesis is the guide. It allows both implicit and explicit hypotheses to betested depending on the research problem. For example, a cereal company may findits sales declining. On the basis of market feedback the company may hypothesisethat teenage chikh'en do not eat its cereal for breakfast. A descriptive study can thenbe designed to test this hypothesis.
Experimental research
Experimentation will refer to that process of research in which one 01' more variablesare manipulated under conditions which penuit the collection of data which show theeffects. Experiments \vill create artificial situation so that the researcher can obtainthe particular data needed alld can measure the data accurately. Experiments areartificial in the sense that the situations al'e usually created for testing purposes. Thisartificiality is the essence of the experimental method, since it gives researchers morecontrol over the factors they are studying. If they can control the factors which arepresent in a given situation, they can obtain more conclusive evidence of cause andeffect relationships between any two of them. Thus the ability to set up a situation forthe express purpose of observing and recording accurately the effect on one factorwhen auother is deliberately changed permits researchers to accept 01' rejecthypothesis beyond reasonable doubt. If the objective is to validate in a resoundingmanner the cause and effect relationship among variables, then undoubtedlyexperiments are much more effective than descriptive techniques.
Activity 10
Research can be classified into:
Activity 11
You are product manager for brand A vanaspati, a nationally distributed brand. Forthe last foul' consecutive months, brand A shows a declining trend in sales. You askthe research department to do a study to determine why sales have declined.
Is this an exploratOlY 01' conclusive research? Explain your reasons.
1.6 SUl\11VIARY
We ha-ve stalted the discussed by emphasizing that research is the application of
Importance of Researchin Decision making
l@J
13
Introduction to ResearchMethodology
l@Jscience to the art of management. Research methodology minimises the degree oflUlceliainty involved in management decisions. Research lays the stmcture fordecision making. Research is not synonymous with common sense. Research ischaracterised by - systematic, objective, reproducible, relevance, and control.
The role of research in the important areas of management has been briefly covered.The areas include marketing, production, banking, materials, human resourcedevelopment, and government.
Research process involves the five impOliant steps-problem definition, researchdesign, data collection, data analysis., and interpretation of results. All these stepshave been explained in detail with their key elements.
We have dichotomised the types of research into-exploratory, and conclusive. Whileexploratory research enables the researcher to generate hypotheses, they are tested forvalidity by the conclusive research. Conclusive research could be further dividedinto-descriptive. and experimental. While the descriptive procedures merely test thehypotheses, the experimental research establishes in a more effective manner thecause and effect relationships among valiables.
1.7 SELF-ASSESSl\lENT EXERCISES
1) Briefly explain the meaning alld importance of each of the following in research.
a) Systematic
c) Control
e) Reproducible
b) Objectivity
d) Relevance
14
2) Explain succinctly the role of research in managerial planning alld decisions.
3) Name and briefly discuss the five steps of research process.
4) Analyse, cliticise, and explain:
a) Collection, analysis, interpretation., and research design are with in the areasof expertise of the researcher. The researcher who gets too involved in thespecification of management's question and action is asking for difficultiesand problems.
b) Research "control" of the environment introduces artificial conditions.Objective research is best achieved by recording what happens '.vithout"disturbing" the environment.
5) Explain and distinguish with example "primary data" and "secondary data".
6) What are the precautions one should take while, administering "Data collection"?
7) Explain briefly why data collection and data analysis should 110t be separated atthe planning stage of any research project.
8) Explain why the line manager must be conversant with research procedures.
9) Discuss with examples "ExploratOlY research", "Descriptive research". and"Experimental research".
1.8 FURTHER READINGS
Boyd, Westfall, and Stasch. "iWarketing Research Text and Cases". All IndiaTraveller Bookseller. New Delhi.
Brown. F.E. "lyfarketing Research, a structure for decision making", Addison Wesley Publishing Company.
Kothari, C.R. "Research l\fethodology - klethods and Techniques".Wiley Eastem Ltd.
Stockton and Clark. "Introduction to Business and Economic Statistics"D.B. Taraporevala Sons and Co. Private Limited, Bombay.,

UNIT 2 DEFINING RESEARCH PROBLElVIAND FORIVIULATION OFHYPOTHESIS
Objectives
After studying this unit, you should be able to:
• Explain clearly the distinguishing features of research problem
• Discuss the significance and importance of the elements that make up thecomplete research problem
• Formulate research problem in terms of a hypothesis to be tested.
Structure
2.1 Introduction
2.2 Points to Ponder on Research Problem
2.3 Unit of Analysis
2.4 Time and Space Coordinates
2.5 Characteristics ofInterest
2.6 Specific Environmental Conditions
2.7 Research Problem as a Hypothesis Testing
2.8 Summary
2.9 Self-assessment Exercises
2.10 Further Readings
2.1 INTRODUCTIONIn unit 1 we have discussed at length the impoliance of research in decision makingby delineating the meaning, role, process, and types of research. While discussing theresearch process, we gave a synopsis of "problem definition". In this unit we proposeto give a complete coverage on "defining research problem and formulation ofhypothesis", perhaps the most important step from the angle of making sounddecisions. Also as problem definition is the first step in research, a completeunderstanding of all its elements is imperative for making the right decision. Acomplete problem definition must specifY the following:
1) Unit of analysis
2) Time and space boundaries
3) Characteristics of interest
4) Specific environmental conditions
Taken together these four aspects identifY the who, when, where, and what to beresearched. Now we will dwell in detail all these four elements along with theassociated features which are interwoven with the research problem and hypothesistesting.
2.2 POINTS TO POl'J)ER ON RESEARCH PROBLElVIThe following points should be kept in mind while defining a research problem:
1) The right question must be addressed if research is to aid decision makers. Acorrect answer to the wrong question leads either to poor advice or to no advice.
2) VelY often in research problem we have a tendency to rationalize and defend ouractions once we have embarked upon a particular research plan. The best time toreview and consider alternative approaches is in the planning stage. If this is doneneedless cost of false stmi and redoing work could be avoided. 15

Introduction to ResearchMethodology
~
16
3) A good starting point in problem definition is to ask what the decision makerwould like to know if the requested information could be obtained without errorand without cost.
4) Another good rule to follow is "Never settle on a particular approach" withoutdeveloping and considering atleast one altemative".
5) The problem definition step of research is the detennination and structuring ofthe decision maker's question. It must be the decision maker's question and notthe researcher's question.
6) What decision do you face? If you do not have decision to make, there is noresearch problem.
7) What are your altematives? If there are no altematives to choose, again there isno research problem.
8) \Vhat are your criteria for choosing the best altemative? If you do not havecriteria for evaluation, again there is no research problem.
9) The researcher must avoid the acceptance of the superficial and the obvious.
Activity 1
Briefly mention advantages of considering mne points mentioned in 2.2 whiledefining a research problem.
2.3 UNITS OF ~~ALYSIS
The individuals or objects whose characteristics are to be measured are called theunits of analysis. They may be persons, groups of persons, business establishments,inanimate objects, transactions, monetmy units, or just about objects or activity aperson can name. Some very interesting communication studies have even usedwords as the units of analysis. Basically, the units answer the question, "What objectsam I interested in?" Consideration of several altematives for units will sharpen one'sthinking conceming the appropriate universe.
To illustrate the selection of units. consider a manufacturer of small electrical motorswho wishes to asceliain the extent to which its potential customers know thecompany exists. The potential customers are basically business entities. But the unitsof the universe could also be defined as purchasing departments, productiondepartments, engineering depmiments, or particular individuals within one or moredepmiments. Again we come to all the pervasive question of what altemative actionsare being considered by the manufacturer. In terms of these actions, who should beaware of the manufacturer's existence? Is the company considering specific acts thatmight increase awareness levels for certain groups? These are the sorts of questionsthat should be considered in specifying the appropriate units of analysis.
Let us go a step fmiher. Is each unit, however defined, equally important? Or doesimportance vary with the purchasing power of the potential customer? If purchasingpower is the critical item, one procedure is to use the units as established by the priorthought pattern and to weight each by the purchasing power of the entity itrepresents. With this approach. no difficulty or complexity is introduced in thedefinition of the universe, but a complexity must be introduced later in theprocessing.
Alternatively. the basic unit of analysis could be defined in terms of transactionsrather than in terms of potential buyers. With buyers as units. the universe consists ofpersons. groups of persons. or business entities. \Vith transactions as units, theuniverse consists of activities as the focus of interest. Typically, in research, \ve wish

to classify or measure the units according to some characteristics. Once more we seethe interdependence of research decisions: the selection of universe units is bestdetermined only in conjunction with what is to be measured.
Is the manufacturer interested in finding the percentage of buyers who are a\vare ofthe company's existence? Or is the manufacturer more concerned with the percentage of the transactions in the market place in which the buyer is aware (orunaware) of its existence? The same type of comparison would be required iflevel ofawareness were measured; here it might be average level of awareness of buyersversus average level per transaction.
Rupee value would be still another basis for establishing units. These rupees could berupees expended on small electrical motors of the type made by this manufacturer.The objective would then be to deternline the percentage of the total rupee valuemarket awareness of the company's existence. This was vety to close to what thepresident had in mind. In theOlY the president wanted to classify evety rupee spent ascoming from a buyer who was or was not aware of the company's existence. Thesame arithmetic result is obtained if buyers are classified according to awareness witheach buyer weighted by the rupee volume he or she generates.
The well known management concept of a "decision-making unit" (DMU) oftencomes into play in defining the units of the universe. But the DMU is usually difficultto define in an unambiguous manner. A purchase that is a wife's decision in onefamily may be a husband's decision in another and a joint decision in third. How doesone cope with this problem? A two step procedure is a possibility. The first stageunits are families; within each family the decision maker is identified. The units ofthe problem lUliverse are the DMU's. Any compromise research universe must beevaluated against that concept, including the possibility that the DMU is a group. Thefollowing example fi-om marketing will clarify the concepts.
The specification of the appropriate DMU for industrial products is more difficultthan it is for consumer products. The number of persons who have potentialinvolvement is greater. Job designations do not have the same meaning for allorganisations. Responsibilities for ultimate decisions vmy with size of organization,organizational stmcture, philosophy of decentralization, plus the personalitiesinvolved. The question is further complicated by the fact that some characteristics ofinterest refer to the organization-for example, size, geographic location, and pastpurchases-\vhi1e others, such as preferences education, and attitudes, uniquely refer tospecific individuals.
The problem definition, whether for a consumer product or an industrial product,must specify the units of analysis. It is better to en at this stage by specifyingconceptually correct units that pose difficult problems in implementations.Compromises in the transition to operational definitions can then be better evaluated.This approach also permits the possibility ofusing different procedures with differentmarket segments or a multistage approach in identifying the relevant DMU's.
Activity 2
Explain the meaning ofDMU with an example.
2.4 TIlVIE AND SPACE COORDINATES
The time dimension of a decision problem is always the future. Look at the followingquestions. What should we do the first of next month in order to produce the desiredeffect the following month? What will consumer response be to our contemplatedpromotion for the month of November? These questions indicate the futurity aspectof the time dimension of a decision problem. Managers continually run the risk ofmaking the right decision at the wrong time. Opportunities are transient: the
Defining ResearchProblem and Formulation
of Hypothesis
l@J
17
Introduction to ResearchMethodology
~
18
executive who assumes the static environment is doomed to failure. Therefore, it iscrucial that the decision maker and the researcher establish the appropriate timereference for-the decision.
What is the appropriate time decision for the manufacturer of small electrical motors?The manufacturing company is interested in awareness at the point in time
when it contemplates possible actions, either to modify that awareness level or tooperate within that constraint. If its decision is to be implemented on January 15,1991, it \vould like to know the conditions in the universe on that date. If theimplementation would be delayed for 5, 10, or, 20 months, the company would liketo know the state of the universe on those dates. Large time consuming capitalexpenditures may be initiated in the near fiJture, but the size of the expenditure isbased upon estimates of conditions at a distant point in time. The problem of roadconstruction and the road's ability to handle peak loads are all too familiar examples.Study of the present or the past is appropriate only in so far as it can indicate thefuture.
The space coordinates supply the geographic boundaries within which the action is tobe taken. In the problem de.finition, these lines are rarely neat political divisions orsubdivisions. Advertising media do not stop abruptly at city or state lines. Retailersand wholesalers usually welcome customers regardless of \vhere the customersreside. Sales ten'itories may, however, be established along counfly or state lines. In asimilar way, licensing by govenl1l1ental units may detenuine the appropriate spacecoordinates. In the absence of such extemaHy imposed constraints, the problemdefinition, in theOly, often includes the whole earth or the total of India. Recognitionof this fact in the problem definition will help evaluate the utility of a researchlmiverse that is considerably smaller.
The universe of interest may be defined either conceptually or by enumeration.. Forexample all cunent accounts of a service organization can be obtained from cunentrecords. These accounts have specific geographic locations, but the specification oflocation is neither necessary nor genuane to the problem definition. The enumerativeapproach to universe specification is appropriate so long as the decision maker hasthat group as his or her target and has a list available.
All Units or Spedfic Units
Ii is not sufficient to specify that the units of a problem are housewives, or autoowners, or purchasing agents unless decision maker tmly is interested in all personswithin the time and space limits. More often the decision maker is interested inemployed housewives, or housewives from households with an automatic washer, orhousewives who have tried product X. These examples illustrate three different typesof modifications applied to units: (1) a characteristic or present state of units, (2) acharacteristic of an object associated ''lith the tUlit rather than a more directcharacteristic of the unit itself (households with automatic washer). and (3) pastbehaviour of the unit (have tried product X). These few examples illustrate the vastscope of ways to limit the pm1icular units of concem.
Instead of specifying a universe of vehicle owners, a tyre manu£'1cturer might specifyvehicle owners whose income exceeds a stipulated amount and whose vehicles arenot equipped with radial lyres. Any business may select its own target markets.. eachof\vhich may form a universe worthy of study.
Stipulation of units according to characteristics of objects that are related to the unitsrather than characteristics of the units themselves sometimes obscure the natme ofthe units. Are the units pfi'rSOIlS whose vehicles do not have radial tyres or vehidfi'sthat do not have radial tyres? The proper selection can usually be accomplished byasking what the appropriate base is for calculating percentages or averages. Thedifference is often critical in the case of industrial products. The percentage ofmachines leased with maintenance contracts might be very different from thepercentages of leasees who lease with maintenance contracts. Failme to distinguishbetween the two could lead to quite diverse research designs and recommendedactions.
Activity 3
Company XYZ \vants to make a quick estimate of the total steel requirement in a

particular region to assess the scope for setting up a new steel plant. The companyshould decide within a year about its action (say before Aug. 1991).
Define the appropriate time and space coordinates and also the specific units ofanalysis for this problem.
2.5 CHARACTERISTICS OF INTERESTThe characteristics of interest identifY what there is about the units that is of concemto the decision maker. These characteristics fall into 1\.vo categories: the dependentvariables and the independent variables. The dependent variables are those of interestfor their own sake. For example, in marketing, they often refer to behaviour orattitude towards a firm's offering. Examples are purchases, awareness, opinions, orprofits associated with consumer behaviour attitudes. The independent variablesincluded in the problem definition are those characteristics thought to be related tothe dependent variables. These variables may either be within the control of the firm(endogenous) -such as adveliising, pricing or personnel changes -or beyond thecontrol of the finn (exogenous). Exogenous variables of potential interest cover amultitude of possibilities, varying from competitor and govenlluent actions toeconomic conditions to individual consumer characteristics.
It is impossible to give a complete list of various characteristics that may be ofinterest to the manager. In order to overcome this impossibility, many practitionersand theorist have suggested a multitude of classification schemes. Indeed it seemsthat all managers and researchers feel compelled to establish their own classificationscheme-and often more than one. No system is optimal for all projects and alldiscussions; but the 2 * 2 matrix developed by Frank, Massy, and Wind has 1\.voprincipal merits: simplicity and the highlighting of measurement assumptions. Thismatrix is presented in Table below. The 2 * 2 matrix, of course, yields four cells.Discussion of the separate cells with example from the field of marketing helpsclarifY the general classification scheme.
Characteristics
Defining ResearchProblem and Formulation
of Hy-pothesis
~
Objective
Inferred
General
(1)
(2)
Situation specific
(3)
(4)
Cell (1)-General objective measures. Cell (1) for example may contain two differenttypes of variables: demographic and socio-economic. The demographic are illustratedby age, sex, stage of life cycle, marital status, tenure, geographic location, and rare orethnic group. The socio-economic variables, usually stress income, education, andoccupation either singly or in some combination assumed to be a measures of socialclass.
These variables do not relate to specific products or market activity. They typicallyenter marketing research projects as potential explanatOlY variables for thecharacteristics of direct interest to the marketing manager rather than as variables ofdirect interest themselves. Does age - a variable of cell (1) - help discriminatebe1\.veen product users and nonusers? At what gage of fife cycle are the families mostinterested in condominium living? Neither age nor stage of life cycle would ofinterest in these examples apart from its potential relationship to specific products orcompanies.
The variables in this cell are objectively measured- once defined there is rarely anyquestion of how they should be measured or the establishment of the appropriatemeasure for the pmiicular unit. The relevance of the variable for the study may bedebated, but there is usually little debate conceming its measures. The measurementof the clll'onological age, length of time a family has occupied a particular residence,and number of children under six years of age pose little conceptual difficulties. 19

Introduction to ResearchMethodology
~
20
Cell (2) - General infened measures. Variables in this cell are general in characterand are not directly measurable. Personality traits, intelligence, and life style areillustrations of these variables. Disagreement conceming the proper or best measureof these characteristics is highly likely. Lack of unanimity is common even withrespect to the concepts, even more for the operational definitions. The inclusion ofthese variables in marketing research projects is usually motivated in the same way asthose of cell (1): they may be related to marketing variables of more direct interest.Therefore the marketing manager is often more concemed with their predictivepower than with the purity or defensibility of their definitions. The proper balancebetween quantitative and qualitative questions in an intelligence test or the relativemerits of aptitude and achievement tests are of little concem to the marketingmanager except as the various alternatives are related to product use, a sales person'sselling ability, or some other characteristic of direct interest to the finn.Cell (3)-Situation specific objective measures. Variables in this categOlY are typicallybehavioural with respect to the market place. Purchase behaviour, brand use, storepatronage and loyalty, adveltising exposure, and degree of innovation are examplesof these variables. Such behaviour is often an ultimate or intennediate goal of themarketing manager. Variables in this cell may be the dependent variable-the crucial"result"-measured in the research. These variables may also be potential independentvariables; prior behaviour may aid in understanding or predicting later behavioureither for the same variable or a related variable. For example heavy usage of productmay be related to brand loyalty.Cell (4)-Situation specific inferred measures. Attitudes, intentions, perceptions, andpreferences towards specific brands, products. and companies are examples of thetypical variables in this category. These variables differ from those in cell (3) becauseof the fact that they are neither directly measurable nor observable. Also theresearchers may disagree in either the conceptual or operational definitions ofvariables in cell (4). Contrary to the variables in cell (2), the variables in cell (4) maybe of direct interest to the marketing manager. Thus these variables are "results"under test in the research: the adequacy of their definitions is therefore critical. Theadveltising ladder concepts incorporate variables £i'om this cell, establishing mentalstates which are presumed to lead to and precede purchase and repeat purchase.It must be mentioned in the passing that the above table of 2*2 matrix can be used toidentify and measure the characteristics of interest for any research problem thoughwe have taken examples from marketing.Chal'actl'l'istics of IntHl'st Vl'l'SIlS Unit of AnalysisConfusion sometimes arises concerning the difference between the characteristic ofinterest and the unit of analysis. A manufacturer of drugs is interested in rupee valuesales of a patticular generic drug. The manufactmer wants to know rupee sales for agroup of six states during the period of September 1988-April 1989. Thus the timeand space coordinates have been defined for the research universe."Rupee value sales" is the characteristics of interest-this is the measure of concem tothe drug cOmpatlY. The unit of analysis identifies "on what" or "on whom" thecharacteristic of interest is measured. The unit of analysis for the drug company maybe the individual drug store. The research may collect rupee sales £i'om the individualdmg stores, adding them together in order to determine total sales in the six states.The characteristic of interest is cmcial to the management. Its value will serve as thebasis for the choosing among alternative actions. The unit of analysis establishes thesource for the infonnation. In many cases the unit employed is dictated byconvenience rather than the "proper" problem definition. For example. the drugcompany could generate aggregate sales by using the ultimate consumer as the unitinstead of using the drug store. The following table shows these two altemativeapproaches.
The drug company wants to know total sales (labelled as L L ). This figure can
be generated either by (1) detenning sales of each separate dmg store and summingthese values, or (2) determing purchase of each individual customer and summingthese values (Refer table). The first approach is based on the drug store as the unit of
analysis, collecting the column totals (L I, L 2, ....... ). The second approach is
based on the il1timate customer as the unit of analysis. Collecting row totals

(L A, L B). Since both approaches yield the target characteristics of interest
(LL ).Table 1: Two Alternative Units of AnaI)'sis for Determining Sales, Drug Company Problem
Drug store as unit of analysis
Defining ResearchProblem and Formulation
of Hypothesis
~
Ultimate customeras unit ofanalysis
Customer A
CustomerB
COLUMN TOTAL
Drug store 1
I'
Drugstore 2
I'
Row Total
either approach is satisfactory. The choice between the two approaches depends ontheir respective costs and the extent to which the necessary data can be obtained withaccuracy.
Two side issues should also be recognised in choosing between the two alternatives(a) Purchases by resident of six-state area may be made outside of the area or formnon drug store outlets. Sales by dmg stores in the six-state area may be made tononresidents. The researcher must decide whether these differences are trivial and, ifthey aren't, which alternative is better approximation of the tme problem. (b) Thecompany may be interested in the shape and distribution of sales (or purchase) amongunits. If so, the best way to proceed is to use the unit of analysis corresponding to thatinterest.
The problem could also be defined with other units of analysis. The individual salesperson, states are but a few of the possibilities. Again the choice depends on the easeof obtaining the necessalY data and the desire for detail concerning the distributionacross units.
Activity 4
By following the classification matrix 2*2 discussed above to measure characteristicsof interest in a research problem, construct an example in an area other thanmarketing to explain all the four cells.
2.6 ENVIRONMENTAL COl\TDITIONS
Environmental conditions fall within the categOly of relevant characteristics, but theycomprise a special type of relevant characteristic. The characteristics of interest arethe target variables. The research is undertaken in order to discover their values.Environmental conditions, however, are of concem because of their possiblerelationship with the characteristics of interest. What \vould sales be if prices wereRs. 169 7 Rs. 149 ? What would competitor do if we increased our advertising by25%7 or decreased it by 25% 7 How would A's action affect our sales and profits?What would happen to the supply of oil if the depletion allowance were cut in haWwere removed completely?
The environmental conditions specified in the research problem are of two types; (1)those beyond the finn's control and (2) those within the finn's control. The finn mustadjust to the first and choose wisely with respect to the second. Neither is possiblewithout knowing how the particular variables influence the characteristics of interest.Therefore both types of variables must be introduced into the research problem.
Ideally. the decision maker would like to know the precise value of all relevant,uncontrollable variables. He or she would like to knO\v the plans of all competitorsthe state of the economy availability of raw materiaL the international climate,fashion changes. and many other relevant factors. The decision maker cannot obtainall this information, but it is frequently possible to identify the factors that come tomeet. 21

Introduction to ResearchMethodology
~
22
critical to the existing problem. These factors are then incorporated in the problemdefinition as environmental conditions. They may be specified at a single value - inwhich case the solution recommended may be inappropriate for other values. Orseveral values may be specified-in which case altemative recommendations mayresult, depending on which set of conditions prevail at the decision time. Eachproblem faced should explicitly include one or more of these environments within theproblem definition.
For example, the research cannot study evelY price, evelY level and type ofadvertising support, or evelY sales training programme. Only a few altematives canbe researched. The research problem must specify those \\'hich seem most promising.These specifications are critical :. the research cannot answer unasked questions.
Activity 5
Explain with the help of a suitable example the need for introducing two types ofenvironmental conditions in a research problem.
2.7 RESEARCH PROBLE:NIAS HYPOTHESIS TESTING
It is often convenient to structure a research problem in tenns of a hypothesis to betested. The hypothesis must be agreed upon by both the manager and the researcher,although the fonnal statement is primarily the responsibility of the researcher. In thisuse of the word, a hypothesis is simply a statement about the universe. It mayor maynot be true; the research is designed to ascertain the truth. Consider the following pairof hypothesis.
HO: At least 10 % of the viewing audience for "children's" TV shows consists ofadults.
HI: Less than 10 % of the viewing audience for 'children's" TV shows consists ofadults.
First, it should be noted that these hypothesis are worded in such a way that eitherone or the other is con"ecl. They cannot both be correct, and they cannot both beinconecl. Second, in order for these two hypothesis to be useful in a researchdecision making situation, the decision maker should choose first act if the first istrue, and a second act if the second act is true. Both statements are characteristic ofall situations in 'which a research problem is properly structured in terms ofhypothesis testing.
The terminology "state of nature" is often used to refer to the true situation in theuniverse. For example. the advertising manager for a finn selling a productfrequently purchased by adults is considering the possibility of advertising theproduct on children's TV shows.
Table 2 shows a structuring of the hypothesis with respect to the decision making. Inthis case, the hypothesis have been constructed so that if HO is true. therecommendation is to adveliise while if HI is true. the recommendation is not toadvertise. This procedure can be extended to any number of altematives or options.The basic rule is that each hypothesis under test would lead to a specificrecommendation if it were tme. If any altematives enumerated would not be adoptedregardless of the research findings, those altematives can be eliminated without anyresearch. If several hypothesis would lead to the same recommendation. there is no

need to identify which of these hypothesis is tme-all hypothesis leading to the samealtemative can be grouped together into a single hypothesis.Tabll' 2: Statl's of Natm'l' \'l"rsus Rl'colDlDl'Jl(ll'd Dl'cisions. Pl'Opl'rly Stl'uchu'l'dRl'sl'al'ch Pl'obll'lD
Recommended decision
Defining ResearchProblem and Formulation
of Hypothesis
~
State of nature
HOtrueHI true
Advertise
x
Don't advertise
x
It has established the minimum purchasing power required for the medium and largestores as Rs.I00 million and Rs.250 million, respectively. A possible structuring ofthe three hypothesis is
HO : Total purchasing power is less than Rs. 100 million,HI: Total purchasing power is between Rs. 100 million and Rs. 250 million.H2: Total purchasing power is greater than Rs. 250 million.
The acceptance of one of these hypotheses leads directly to one of the three actionscontemplated: It is not necessary to determine purchasing power precisely than thatindicated in the three hypotheses. A two-stage research project might be indicated.Stage one would establish whether purchasing power were clearly within the valuesspecified by the hypotheses. Only if stage one revealed a figure close to Rs. 100million or Rs. 250 million would stage two be undetiaken. There is no reason to incurthe cost of determining purchasing power with precision unless that precision isrequired in decision making.Decision making as hypotheses testing is a two-step process with enol' possibilities ateach step. At step one there is the relationship behveen the states. of nature and theaction recommended. The percentage of adults in the audience may not be a properguide to action. The number of adults may be better guide. Rupee value expenditurein the product category may be still better. At step two there is the possibility that theresearch result may be enoneous with respect to the state of nature. The sample mayindicate that the percentage of adults in the audience is less than 10 %. Or theopposite enol' may occur. Research procedures do not yield cetiainty with respect tothe true state of nature. No matter how careful we are, we may conclude that HO istrue when HI is true or vice versa. This fact means the decision maker and theresearcher must evaluate the seriousness of different kinds of errors. The seriousnessof the en'ors can be appraised only in terms of the actions that will be recommended.No harm occurs until the conclusions have an impact on what the finn does.Table 3 presents the general situation with hvo possible states of nature and t\VOaltemative actions. Assuming the relationship between the two states of nature andthe hvo action is valid. no error occurs if we conclude that HO is tme and it is true:similarly, no etTOrs occur if we conclude that HI is tme and it is true. EtTOrs occur ineach of the other cells.Tabll' 3:Trnl' Statl's of Natul'l' Vl'l'SUS Conclnsions. Possibll' Typl's of Erl'ors
True state of nature
HO true
HI [rue
HO true
No error
Type 11 enol'
ConclusionsHI true
Type 1 error
No error
Consider the format of Table3 in terms of the problem dealing \vith advertising onchildren's TV shows. HO (at least 10 % of the audience is composed of adults) leadsto a recommendation to advetiise. HI (less than 10% of the audience is composed ofadults) leads to a recommendation not to advetiise. Under the Type 11 enol' \ve thinkHO is tme and recommend in favour of advertising, but less than 10% of theaudience is composed of adults. The opposite situation exists with the Type 1 enor.We recommend against advertising (thinking HI is tme). but at least 10% of theaudience is composed of adults. Which enol' is more serious-failing to take advantageof an existing opportunity or incun'ing expenditures? Placed in those tenus, it shouldbe obvious that no general answer can be given to the general question of which erroris more serious. The decision maker must carefully evaluate 23

Introduction to ResearchMethodology
l@J
24
each specific situation with its unique set of potential risks and benefits. Theidentification of which error is more serious is not a meaningless intellectualexercise! The analysis can be planned in such a way so as to minimise those enol'Sthat are vie\ved as more serious.
Activity 6
A hypothesis is --------------------------------------------------------universe
State of nature refers to -----------------------------------------------------mllverse
Activity 7
Consider any research problem of interest to you.. Structme it in terms of anappropriate hypothesis to be tested. Also mention the possible enol'S andrecommendations associated with your hypothesis. Illustrate your ans\ver \vith thehelp of a suitable example.
2.8 SUMlVIARY
One of the most frustrating feelings in the world is to have an ans\ver and wonderwhat the question was. Unless problems are well defined, research may lead to thisposition. Only slightly less frustrating is the feeling of having the right answer to thewrong question. Proper problem definition can avoid this difficulty, but the difficultyis more likely to be avoided if many altematives are considered in the early stages ofthe formulation of the problem. \Ve have covered all these aspects in detail in thisunit at the very beginning under "points to ponder on research problem".
We have then moved on to the problem definition by delineating all its elements.Problem definition can be divided in to fom main aspects: the units of analysis, thetime and space boundaries, the characteristics of interest, and the specificenvironmental conditions. We have stressed on the unambiguous delineation of thesefour aspects while fonnulating the research problem. The relevant chamcteristics arethe variables of concem to the decision maker in selecting among altematives.Typical research characteristics can be classified along t\VO dimensions: first, assituation specific or general; and second, as objectively measured or infened. Theenvironmental conditions are special types of characteristics-variables whose valuesthe decision maker wishes to stipulate. This is in contrast to the typical characteristicswhose value is to be detennined.
We have then highlighted the importance of structuring a research problem ashypothesis testing by making simple statements about the universe. These statementsmayor may not be true; the research is designed to ascertain its truth which in tumenables the decision maker to choose the right altemative in his problemenvironment. Through examples, we have focused on formulation of a researchproblem as hypothesis testing, evaluation of each specific situation with its benefitsand risks, and minimisation of those enol'S that are more serious.
2.9 SELF-ASSESS NT EXERCISES
1) Distinguish between the terms within each of the following pairs.
a) Endogenous variables and exogenous variables.
b) Characteristics of interest and unit of analysis.
c) General characteristics and situation spec.ific characteristics.
d) Objective characteristics and inferred characteristics.
2) Name and briefly explain the four basic parts of a problem definition.
3) Give an original example of a problem in which the unit of analysis is a DMU(Decision-making-unit). Make sure to include a discussion of how to measure theprincipal characteristic of interest for DMU's which involve more than a singleindividual.
4) A local supel111arket has experienced a decline in unit sales and little change inrupee value sales. Profits have almost vanished. The chief executive in searchingfor ways to revitalize the operation, was advised to increase the number of hoursthe market is open for business. He comes to you for advice in structuring aresearch problem that will provide relevant infol111ation for decision making.Define the problem, taking care to:
a) state the relevant question,
b) enumerate the altel1lative answers,
c) clearly define the units of analysis and characteristics of interest.
What are the relevant "states of nature" which would lead to the selection ofeach alternative answer?
5) A sPOltS goods company wishes to test two types of tennis rackets in order todetermine which one is "best".
a) Propose and defend a precise definition of "best".
b) What is the set of hypotheses that should be tested?
c) What action would be associated with each hypothesis?
6) Analyse, criticise, and explain:
a) Specific environmental conditions merely identify the problem situation andwould never be subject to control by the researcher.
b) The unit of analysis for a research problem 'will usually be either a singlephysical object or a group of physical objects-recognizing that human beingsfall within this concept.
c) There are hvo general categories "vithin the tel111 "characteristic of interest":(1) the admissible altel1lative actions (the independent variables) and (2)characteristics that may be related to these altel1lative actions (the dependentvariables).
d) Time and space coordinates of the research universe are easier to cope withwhen the universe corresponds to an existing list.
2.10 FURTHER READINGS
Boyd, Westfall, and Stasch, "Jvfarketing Research Text and Cases", All IndiaTraveller Bookseller. New Delhi.
Brown. F.E. "Jvfarketing Research, a stl'1lcture for decision making", AddisonWesley Publishing Company.
Kothari, C.R. "Research lvfethodology - Alethods and Techniques".Wiley Eastern Ltd.
Stockton and Clark, "Introduction to Business and Economic Statistics ",D.B. Taraporevala Sons and Co. Private Limited, Bombay.
Defining ResearchProblem and Formulation
of Hypothesis
~
25


26
UNIT 3 EXPERIlVIENTAL DESIGNS
Objectives
After reading this unit, you should be able to:
• Discuss the various experimental designs as powerful tools to study the cause andeffect relationships amongst variables in research.
• Explain the assumptions embodied in the design models.
• Choose the appropriate design model for a specific research problem.
Structure
3.1 Introduction
3.2 Completely Randomized Design
3.3 Randomized Complete Block Design
3.4 Latin Square Design
3.5 Factorial Design
3.6 Analysis of Covariance
3.7 SununalY
3.8 Self-assessment Exercises
3.9 Further Readings.
3.1 INTRODUCTIONAs you may recall, we have pointed out in unit 1 of this block that experiments aremuch more effective than descriptive techniques in establishing the casualrelationships. First, the units to be studied are selected by the researcher and each unitis assigned to the group determined by the researcher. The units do not select theirgroups, thus avoiding the self-selection bias. Second. a necessaIy consequence of thefirst, the researcher administers the predetermined treatment or treatments to the lUlitswith in each group.The use of a control group is almost mandatolY in experimental designs. Theinclusion of a control group permits a better isolation of the treatment componentthrough a proper design like a simple cross sectional design.A major contribution that the statisticians have made to experimental design is thedevelopment of randomization concept which enables the researcher to reduce theeffect of the uncontrolled variables on comparative measures of response to thevariables that are under the experimenter's control. Randomization is a useful devicefor ensuring on the average, that uncontrolled variables do not £'tvour one treatmentversus others.In this unit, we will be, discussing some of the major experimental designs whichinclude:
1) Completely Randomized Design2) Randomized Complete Block Design
3) Latin Square Design4) Factorial Design
5) Analysis. of Covariance\Ve will describe each of these experimental designs in detail in terms of role, themodel. and the assumptions embodied in the model with few illustrations. We \villnot dwell into the computation aspect and instead focus on interpretation of theresults. It is strongly suggested here that you use computer soft\'vare packages likeSPSS. STAT GRAPHICS, and BMD for getting the relevant ANOVA tables asoutput which can be interpreted by you. The interpretation of the results is muchmore important than the drudgely of complex computations.

It may be mentioned in the passing that in MS-61, block 5, we have given completedetails regarding calculations of the relevant sum of squares and F ratio forhypothesis testing in the case of one way and two way analysis of variance. Youplease go through the same for understanding the principles of breaking down thetotal variation into meaningn11 components of variations. This methodology andprinciple remains the same in all the designs and therefore with a little more effortyou should be able to understand and work out the details. 1),7e again reiterate thatyou use the software packages which have lots of options and flexibilities. You willreally enjoy the subject in this way and will be able to understand the intricacies ofthe models which in turn will enable you to choose the right design for your researchproblem-be it in medicine, management. social science, etc.
3.2COIVIPLETLY RANDO:MIZED DESIGN
Frequently an investigator wishes to compare three or more treatments in a singleexperiment. In a survey, too, he may wish to study several populations: for example,he may be interested in IQ scores from a standard test for students at five schools,Such comparisons could be accomplished by looking at the samples two at a time andcomparing the means. Although feasible, this is an inefficient method of comparisonfor more than two populations.
One reason for its inefficiency 1S that the standard deviation for the differencebetween the two, sample means is not calculated from all the samples but insteaduses samples only from the two populations under immediate consideration. Second,we feel intuitively that we shall almost find a significant difference between at leastone pair of means (the extreme ones, e.g.) if we consider enough identicalpopulations. We can no longer trust our level of significance.
Therefore, instead of using two samples at a time, we wish to make a single test tofind out whether the students from the five schools are from five populations havingthe same population mean. The null hypothesis we wish to test is:
HO: = fl2 = P3 = P4 = f15. Our reason for making such a test is not that we think fivepopulation means may be equal. They probably are unequal. However, if apreliminary test fails to show that the means are unequal, we may feel that thedifferences are rather small and do not wanant further investigation.
Completely randomized design is primarily concerned with tests for populationmeans. To study the means, it is necessary to "analyze the variance".
Let us consider a particular example. An investigator wished to study the effect offertilizers on the yield of corn. He divided the field into 24 rectangular plots of thesame size and shape. His four treatments consisted of (1) no fe11ilizer, (2) K20 +N, 3)K20+P20S, and (4) N+P20S. He assigned
Table 1: Yields ofCorll Under Four Treatments
Observation 2 3 4 5 6 LV ij ?i.;-'
Treatments1. Control 99 40 61 72 76 84 432 722. K,O+N 96 84 82 104 99 105 570 953. K,O +P,O, 63 57 81 59 64 72 396 664. N + P,O, 79 92 91 87 78 71 498 83
r ~ Y'j = 1,896, y._ -79;-1 J-l
each treatment at random to six of the 24 plots. The yields in bushels per acre, arepresented in table L Here we use i to denote the number of the treatment and j torefer to the number of the observation. The sample means are designated by Y;.,where the dot in the second subscript position-indicates that we have averaged overthe second subscript j; in other words Y:., is the mean of all the observations of theith sample, The overall mean is denoted by Y.. , the two dots indicate that the mean isobtained by summing over both subscripts and then dividing by the total number.
Experimental Designs
t§)J
27

Introduction to ResearchMethodology
l@J
The investigator's pm-pose is usually to leam to something about the populations fromwhich the samples are drawn. To accomplish this. he needs an lmderlying model.For this Model. we assume that our four samples. each consisting of six com yields.are independent random samples from four populations. that each of the fourpopulations has a normal distribution. and. finally. that the variance of the fourpopulations are equal. The investigator should consider these assumptions carefully.
The four populations means may be designated lll.tI2 •. l13.and l14' \Ve arbitrarily
divide each of these four means into two parts. The first part is the mean of the fourpopulation means. which we call the "overall mean." and the second part is thedifference between the mean of each population and the overall mean. In symbols.the means are written as
lit = ll+Up ...... ·.ll+U4• where II denotes the overall mean and ui is the difference
tli -tl . The overall mean has been chosen in such a way that + u. = 0 • where a is,i;....j l
i=t
the munber of treatments (in this case. 4). If in our example the four populations
means were fll = 70. ~t2 = 100. ~13 = 70. ~14 = 80. we \vouId have ~I = (70 + 100 + 70
+ 80)/4 = 80. The population means could then be written.fll=~l+al = 80+ (-10)
flz = fl + a z = 80 + (+ 20)
fI3=P+U) = 80+(-10)
fl. =[I+a .. = 80 + (+0).
The difference ui = t1i -ll is often called the effect of the particular treatment. It
should not be confilsed with U, the probability of re:iecting a null hypothesis which is
true. In the example, the ui sum to zero and this is always the case.
\Ve think. then. of a population mean as the sum of two palis : an overa}] mean(which. as an average of the four population means. may be of little interest to us)and the pali that we attribute to the pmiicular treatment. Using this notation, we cansummerize the model just described by saying that each observation Y'l is anindependent observation from a normally distributed population whose mean is JI+U i
and whose variance is denoted by a 1e' TIns can be written
Y'J' IND (~+ aita~), 1: Cl; = 0, i. = l •..... ,a;t-1 ..
J = 1,..... n,
\\There a is the number of treatments. n is the number of observations on eachtreatment. and IND is read as "independently nOfmally distributed.' In this model, ,veare studying only these particular a populations.An equivalent way of writing down the model wInch is often convenient isY jj = 11 + a; +E:,j
~J ~ = 0; I::ij IND (0, a~); = i = l, ,a; j = 1,.....•n
Here we think of a pmiicu1ar com yield Yij as made up of its population mean ll+U i
plus whatever is left over, which we call Eij . In our data, !"',r example, Y13=
82=80+20+(-18); therefore, if the mean yield for the second population is 100. E 13 =
-18. These 24 deviations form a random sample of 24 E ij . all fiom a nonna1
population with zero mean and vmiance al•. Note that because in practice we do not
know the population means, we cannot know the values of the 24 E'l 'So They can
however, be estimated fiom the sample data.Format for AnalJsis ofVarianc.. Tahl.. fOI' Compl..tl'l)' Randomizl'll D..sign
Source ofVariation
Sum ofSquares DF
MeallSquare
ComputedF"alue
Tabl.•F value
28
Due toTreatment
Residual
Totat
55, = n t (Yi · - Y,.)' lit - 1 MS, = SS,l(a - 1) MS.!MS,
SS,. = ZIp',; - Y,.)' lit (n - 1) MS, = SS,/a (n-1)
SS, - II(Y i; - Y.f an - 1
Read at a''Ibfrom table

Analysis of Variance Table For COl'll Yields (Our Illustration)
Source of Sum of Mean Computed TableVariation DF Fvaiue F valueDue to(reatment 2940 3 980 5.99 3.1O(at 5%)Residual 3272 20 163.t1
TOlal 6212 23
It may be pointed out here that the fonnat table above is the "Analysis of Variance"Table (often called as ANOVA table)-the general table for a completely randomizeddesign with equal number of observations on each treatment.
The second one is the ANOVA table for our illustration on the yield of com asinfluenzed by the four treatments.
We proceed finally to an F test of the null hypothesis that all the four populationmeans are the same. This amounts to:
Ho: ~ll=~l2=1l3=~l4
Since the calculated F value exceeds the table F value at 5% level, we reject Ho andconclude that the four population means are not the same and that the treatmentlevels are different.
Activity 1
Suppose an adveliising finn wants to test three different themes-Theme A, Theme B,Theme C, for a brand on a sample target audience of 60 people. The firm measuresthe response on a 0-11 scale. (0 denotes no interest and 11 denote very high interestin purchasing the adveliised brand). How will you go about evaluating the threethemes by perfonning a completely randomized design model? State the nullhypothesis. You may assign equal number of observations to each treatment (theme).State clearly the assumptions of this model.
3.3 RAND01\UZED COlVIPLETE BLOCK DESIGN
In the completely randomized design, treatments are assigned at random. Forexample, if the treatments are three drugs and there are 24 patients, eight patients areassigned at random to each of the three treatments.
The 24 patients may valY widely in initial condition, and their initial condition mayaffect their response to the drugs. In the completely randomized design. we try totake care of these differences among the patients by assigning them at random intogroups of eight patients. Unfortunately, it is possible that all the patients receivingCh11g 1 may be comparatively healthy and all those receiving drug 2 may becomparatively unhealthy, even though the assignment was randomly made. Byrandomization, however, at least we have given each drug an equal chance withrespect to the initial condition of the groups. Further more, we can expect that if theexperiment is large enough, randomization will roughly equalize the initial conditionof the three groups. Besides initial condition, the experimenter may feel that otherfactors might influence the response to the drugs (e.g., age or \veight).
A block design is a much useclmethod for dealing with factors that are known to beimp0l1ant and which the investigator wishes to eliminate rather than to study.
In the randomized complete block design, still with three treatments and 24 patients,the patients are divided into eight blocks, each consisting of three patients. Theseblocks are fanned so that each block is as homogeneous as possible. Each blockconsists of as many experimental units as there are treatments-three, in this case. Theblocks might be easily formed on the basis of age, for example, with blocks 1 and 8consisting of the three youngest and the three oldest patients, respectively. Theindividuals in a particular block are as alike as possible. On the other hand, there maybe wide differences between the individuals for different blocks.
Experimental Designs
~
29

Introduction to ResearchMethodology
l@JAfter the blocks are fonned, the tlll"ee dmgs are assigned at random to the tlll"eepatients within each block. If the blocking has been done on a factor such as initialcondition, and if initial condition is important in determining the level of theresponse, the responses to the dmgs \vill differ widely from block to block. Ho\vever,because each drug is used exactly once in each block, the design is balanced and themean treatment responses to the three dmgs will be comparable. The differencesobserved among the dmgs should be largely unaffected by initial condition. BelO\vare the eight blocks with a possible treatment assignment.
Block Number
Patient Numl'et 1 2
1 Drug 3 Drug 22 Drug 1 Drug!3 Drug 2 Drug 3
8
Drug 1Drug 3Drug 2
When the data are gathered, they are a11'anged in rows according to treatment (drug),and \ve have
Block Number
Drug Number
123
2
Note that this is a balanced design-each treatment occurs once in each block; thus ifwe obtain the mean response for dmg 1 over the eight blocks, it will be comparableto the mean response for dmgs 2 or 3.This type of design is widely used. For example, industrial material frequently arrivesin batches that tend to be homogeneous; thus a batch may be used as a block. Inlaboratories, to take another case, results often differ from day to day. and thereforedays fiequently serve as blocks. A common practice is to block out technician effect.In agricultural experiments, the blocks are sometimes separate plots of land. Thetechnique of randomized blocks is a very usefitl one for removing unwantedvariation. Frequently the investigator can obtain significant differences amongtreatment effects using a smaller sample size with the randomized complete blockdesign than with a completely randomized design.In planning an experiment it is important to identify in advance the factors that mayintroduce unwanted variation in the response (i.e., variation not due to the treatmenteffect) and to block accordingly. If results differ from day to day, days becomeblocks, and the design should be balanced within days. Each treatment must occurexactly the same number of times within each day, and it must be assigned at randomwithin the day.Tbl'IllOdl'!\Ve assume that each observation can be described as follows:
Y;j = I..l + OJ + f3j +E: ij i = 1,..... ,a; j = l,.....b,
with• b
... n. = 0 ! A, = °:=1"""1 'j_l ....J and Eij IND (0, o~).
30
Here u i is the effect of the ith treatment and ~j is the effect of the jth block. Note
that the treatments cOl1'espond to rows and the blocks correspond to columns. ThusYi ; with i=2 and j=3 denotes the second treatment and the third block.From the model as just given, we can read four assumptions:1) The response to the ith treatment in the jth block Yii is from a normal distribution.
(There are ab distributions.)2) The means of the ab normal distributions can be expressed in the form
~l+Ui + ~j' This propelty is often called additivity. or altematively, no
interaction.3) The variances of the ab populations are equal. This property IS known as
homoscedasticity.

4) The Eij (deviations from the means) are statistically independent. If we know
that Ell is large, we have no reason to expect El2 to be small (or large, for that
matter).As an exainple of a randomized complete block design, we use the following
data.Randomized complete block design with three treatments (3 coupon plans and four
blocks (Store sizes)
Experimental Designs
~
V;.16139
Store 411
85
Store 31513
7
Store 1201714
TreatmentCoupon plan 1Coupon plan 2Coupon plan 3
Data represents campa eola sales in numlxr of ea~es._---:--__---:.......::..:.:.:.s.:=.::.:::..::::.:::.c..:;:.::..;:::::.:::...:.:=~~=___~.. .~
BlockStore 2
181410
g11.71417 Y.. - 12.7--------_._--~~...---:------------
Stores are blocked on the basis of the size because we expect some variation in colasales due to the size of the stores. Store 1 is the largest size, followed by store 2 nextlargest, and so on. Treatments (coupon plan 1, coupon plan 2, and coupon plan 3) arerandomly assigned to test units within each block.
Hypothesis ofprimmy interest-There is no difference amongst treatment effects.
Hypothesis of secondaly interest-There is no difference amongst block effects.
Format of Analysis of Variance Table for Randomized Complete Block Design
Format of Analysis of Variance Table for Latin Square Design
Source ofVari:itlrm
Sums ofSquares: OF
MeanSqunrc3
Computed TableP YDoluc r vttluc
Due to Treatments SS.=b~1 (V;.-V..)2 a-I MS,=SS,I(a-l) MS,/MS,
Due to Blocks SS,,=J: (V i-V..)2 b-l MS,=SS,I(b-l) MSJMS.I-I . " •
Residual 5S. =
~I ~l (Y'j-Y;+Y,j+Y·Y(a-l) (b-l) MS" = SSni (a-l)(b-2)
Read at
table
Tota!
ANevA Table for Our mustl'lltlonCoupon Experimenl with Blocking for Store Size
Since the calculated F value exceeds the table F value at 5% level of significanceboth for treatment effect and block effect. we reject the null hypotheses and concludethat treatment effect is significant and also the block effect is significant.
We conclude that after blocking for store size, the coupon plans do make a differencein sales of cola.
Activity 2
What are the improvements made in the randomized complete block design over thecompletely randomized design?
......................................................................................................
.......................................................................................................31
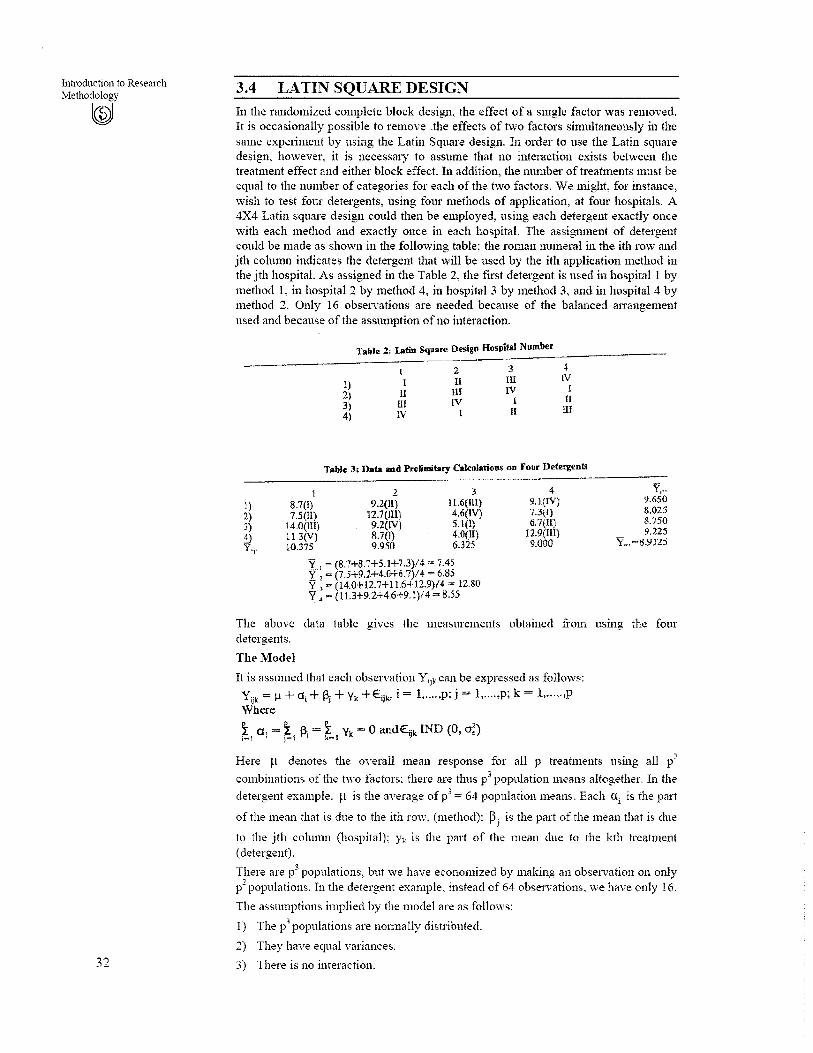
Introduction to ResearchMethodology
[email protected] LATIN SQUARE DESIGN
In the randomized complete block design, the effect of a single factor was removed.It is occasionally possible to remove .the effects of t\VO factors simultaneously in thesame experiment by using the Latin Square design. In order to use the Latin squaredesign, however, it is necessmy to assume tlmt no interaction exists between thetreatment effect and either block effect. In addition. the number of treatments must beequal to the number of categories for each of the two factors. We might, for instance,wish to test four detergents, using four methods of application, at four hospitals. A4X4 Latin square design could then be employed, using each detergent exactly oncewith each method and exactly once in each hospital. The assignment of detergentcould be made as shown in the following table; the roman numeral in the ith row andjth column indicates the detergent that will be used by the ith application method inthe jth hospital. As assigned in the Table 2, the first detergent is used in hospital 1 bymethod 1, in hospital 2 by method 4, in hospital 3 by method 3, and in hospital 4 bymethod 2. Only 16 observations are needed because of the balanced anangementused and because of the assumption of no interaction.
Table Z: latin Sqwue l)gign Hospital Number---:-------
1)2\3)4)
IIIIIIIN
2.II!IIIV
I
3IIIIV
1II
4IV
IIIIII
Table 3: Data and PreJimitary Cakulati(>os on Four Detergents---------1)2)3)±.)Y· l ·
1 2 38.7(1) 9.2(II) 1L6(1lI)7.5(1I) J2.7(Ill) 4.6(IV)
14.0(1Il) 9.2(iV) 5.1 (I)113(V) 8.7(l) 4.0(Il)10375 9.950 6.325
Y I = (8.7+8.7+5.1+7.3)/4 = 7.45'Y 1 = (7.5+9.2+4.0+6.7)/4 = 6.85'Y, = (14.0+12.7+11.6+12.9)/4 = 12.80Y. = (11.3+9.2+4.6+9.1)/4 = 8.55
49.1{rl/)7.3fl)6.7(1I)
12.9(IIl)9.000
Yi ••9.6508.0258.7509.225
Y... =8.9125
The above data table glves the measurements obtained fi-om USl1lg the fourdetergents.
The Model
It is assumed that each observation Yjjkcan be expressed as follows:Y
ijk= Il + Cli + I3j + Yk +Eijk, i = 1, ,p; j = l, ,p; k = l, ,p
Where
I 0:, = ~ J3 =! Yk = 0 andEnk IND (0, aDi-I • J-! J k-l .,
Here ~l denotes the overall mean response for all p treatments using all pl
combinations of the two factors; there are thus p3 population means altogether. In thedetergent example. ~l is the average of p3 = 64 population means, Each aj is the part
of the mean that is due to the ith row. (method); PJ is the pmi of the mean that is clue
to the jth column (hospital); Yk is the part of the mean due to the kth treatment(detergent).
There are p3 populations, but we have economized by making an observation on onlypl populations. In the detergent example. instead of 64 observations. we have only 16.
The assumptions implied by the model are as follows:
I) The p3 populations are nonnally distributed.
2) They have equal variances.
3) There is no interaction.

4) The E's are independent of one another.
The assumptions of no interaction is implicit in the statement of the model. We have
stated that the mean of Yijk is ~t+ai + ~j + Yk ; this indicates that the first detergent
has the same effect no matter which hospital is involved and no matter which methodis used. Each hospital performs equally well with each method.
The assumption of independent E 's would be violated if, for example, half theexperiment were conducted at one time and half were conducted six months later.
Format of Analysis of Variance .Table for Latin Square Design
Source of Sums of DF Mean F FVariation Squares Squares Computed Tabled(1) (2) (3) (4) (6) (7)Due Rows SS.=P~l (Yj..-Y..•f p-l MS.-SS/(p-1) MS./MS, Read atDue Columns . - -
S~=Pj~l (y·j·-y...r p-l MSb=~/(p-l) MSb/MS, a-I from
Due Treatments SSc-pt (y..t·-Y...)' p-1 MSc=SSJ(p-l) MS/MS, tableResidual. 5S, = t ~l t Yijl (p-l) (p-2) MS, = SS/(p-l)(p-2)
-Yj••-Yj.. -Yt..+2Y...)2
Total i ! i (Yo -Y...)! p2-11"'1 ;-t 1-1 IJk
AnaI)-s1s of VariaJlce Table for Detel1lent Data
Source of 5umsof DF Mean F FVariation Squares Squares Computed Tabled...-..__(lL (2) (3) (4) (6) (7)DlIeMethod 5,822 3 1,941 1.44 4.76 (at 5%)DlIe Hospital 39,672 3 13,224 9.78 4.76 (at 5%)DlIe Detergent 86,548 3 28,849 42.68 4.76 (at 5%)Residual 4,055 6 1,676fota] 136,097 15
The hypotheses to be tested are:
Ho: There are no differences among the row means
Ho: There are no differences among the column means
Ho : There are no differences among the treatment means
In our example, the rows are methods, columns are hospitals, and the treatments arethe detergents.
The calculated F exceeds the table F at 5% level for hospitals and detergents. RejectHoand conclude that there are differences in performance among the four detergents:there are ditferences among the hospitals.
The calculated F is less than the table F at 5% level in the case of the methods. Donot reject H o and infer that there may be no differences among the four applicationmethods.
The advantage of a Latin square design over the randomized complete block design isthat the effect of a second factor is eliminated without increasing the size of theexperiment, provided always that no interactions exist.
Activity 3
State the Latin square model with the assumptions clearly embodied in the model.
Experimental Designs
~
33
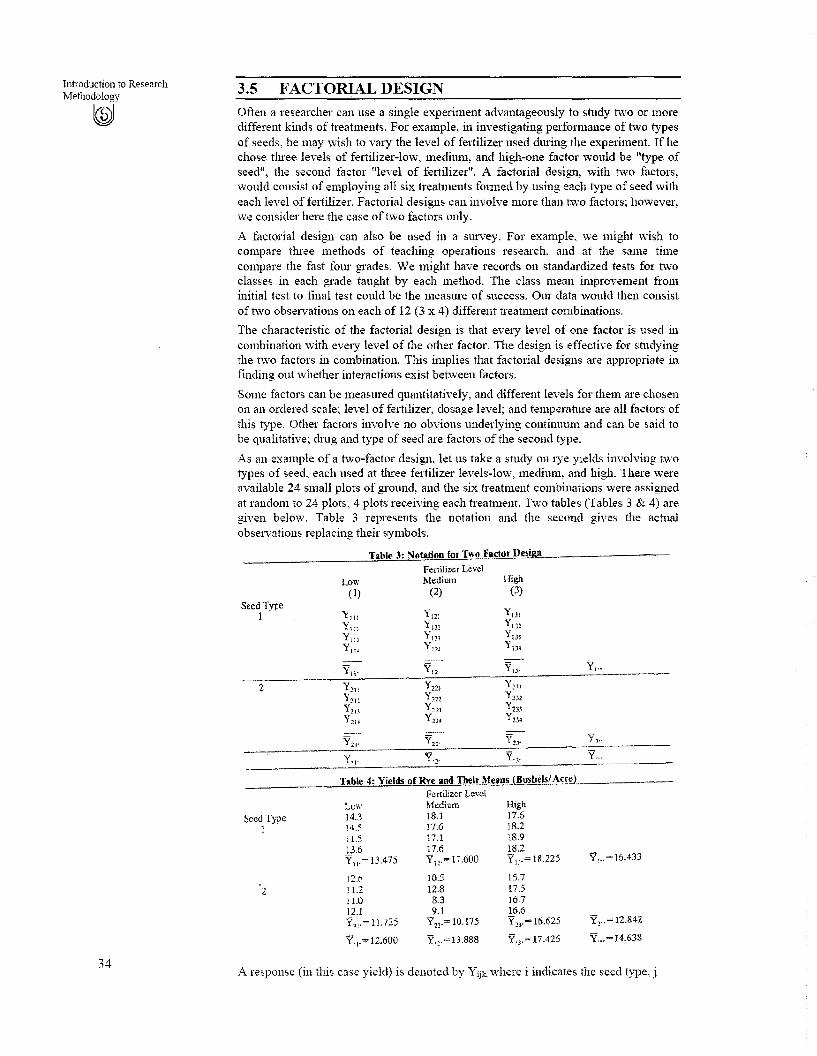
Introduction to ResearchMethodology
~
3.5 FACTORIAL DESIGNOften a researcher can use a single experiment advantageously to study two or moredifferent kinds of treatments. For example, in investigating performance of two typesof seeds, he may wish to vary the level of fertilizer used during the experiment. If hechose three levels of fertilizer-low, medium, and high-one factor would be "type ofseed", the second factor "level of fe11ilizer". A factorial design, with two factors,would consist of employing all six treatments formed by using each type. of seed witheach level of fertilizer. Factorial designs can involve more than two factors; however.we consider here the case oftwo factors only.
A factorial design can also be used in a survey. For example, we might wish tocompare three methods of teaching operations research, and at the same timecompare the fast four grades. We might have records on standardized tests for twoclasses in each grade taught by each method. The class mean improvement frominitial test to final test could be the measure of success. Our data would then consistof two observations on each of 12 (3 x 4) different treatment combinations.
The characteristic of the factorial design is that every level of one factor is used incombination with every level of the other factor. The design is effective for studyingthe two factors in combination. This implies that factorial designs are appropriate infinding out whether interactions exist between factors.
Some factors can be measured quantitatively, and different levels for them m'e chosenon an ordered scale; level of fe11ilizer, dosage level; and temperature are all factors ofthis type. Other factors involve no obvious underlying continuum and can be said tobe qualitative; drug and type of seed are factors of the second type.
As an example of a two-factor design, let us take a study on lye yields involving twotypes of seed, each used at three fertilizer levels-low, medium, and high. There ,vereavailable 24 small plots of ground, and the six treatment combinations were assignedat random to 24 plots, 4 plots receiving each treatment. Two tables (Tables 3 & 4) aregiven below. Table 3 represents the notation and the second gives the actualobservations replacing their ',ymbols.
Table 3: Notation for Two Factor Design
Y", Y12: Y 13\
Y,lC y~:u Y mYl11 Y", YlJJY ltL Yl:?t Y13~
'Vll· )'t1' V'j'Y211 Y221 Y211
y~U! Ym Y 211
Y:nJ Yon Y23J
Y2l~ Y22.1 Ym
YZ1 ' '112' V,J'Y.,. y.2· Y.).
Seed Type1
2
Low( 1)
Fertilizer LevelMedium
(2)High
(3)
v, ..
Y...
Seed Type1
Table 4: Yields of R"e and Their Means (~~elslAc!e~)L' _
Fertilizer !,..eve!Low Medium High14.3 18.1 17.614.5 17.6 18.211.5 17.1 18.913.6 17.6 18.2Y".=13.475 Y".=17.600 Y]].=18.225 Y,..~15,433
212.611.211.012.1Y".= 11.725
Y· 1·=12.600
10.512.88.39.1
Y21·=1O·175
'1.:.=13.888
15.711516.716.6\'n'= 16.625
'1.].-17,425
Y\..=12.842
Y...~14.638
34A response (in this case yield) is denoted by Yijk where i indicates the seed type, j

indicates the fertilizer level, and k is the observation number. For example, Y213, isthe yield in the third of the fom plots that used seed type 2 and a low fertilizer level.
The cell means, denoted by Yij. are the means for each treatment combination. The
mean of all 12 observations on the i th seed type is Yi.. ,o the mean of all 8observations on the jth fertilizer is Y.j.: the overall mean of the 24 observations is
y ...
The ModelWhere
p = Overall means response:
(Li = effect of the ith level of the first factor
~ J = effect of the jth level of the second factor
(a~)ij = interaction between the ith level of the first factor and the jth level of
the second factor.E ijk = deviation of Yijk from the population mean response for the ij th
population.
~I 0i = ~ (3). = ~ (0[3);)· = ~ (0[3);), = 0 and r;)k IND (0, 0;),- J-l 1-1 1'-1 w:.
Format Of Analysis OfVariance For Two Factor Factorial Design
Experimental Designs
~
Source ofVariation
(1)
Sums ofSquares
(2)
DF
(3)
MeanSquares
(4)
~
Computed(6)
FTabled
(7)
(a-l) (b-l) MS,,=SS••i(a-l)
(Irl)
Due.'\.
Due B
Due AB
SS.~bni: (Y,.._ Y...)2,-,S~,~a,,~, (Y,-Y..)'
SS••=nr tt-l I-I
(Y,j'-Y'''-Y'j'+Y'''Y
a-1
b-l
MS.~SS/(a-l)
MS,,=SSJ(b-1)
MS,/MS, l Read at
MS.,IMS, JI n% from
MS••/MS, table
Residual
Total
MS, = SS,Iab(n-l)
ANOVA Table For Om Illustration Problem On Two Types Of Seed With ThreeFertilizer Levels
Sf)urcc of Sums of DF Mean F FValiation Squares Squares Computed Tabled
( 1) (2) (3) (4) (6) (7)
Due Seeds 77.4 1 77.4 63.3 4.41 (at 5%)Due FertilizerLevels 99.9 2 49.9 40.9 3.55 (at 5%)Seed Fertilizerlnteroction 44.1 2 22.1 18.0 3.55 (at 5%)Residual 22.0 18 1.2
Total 243.4 23
From the last two columns of the table, we conclude (by comparing the computed Fvalue with table F value) the following:1) Differences exist between yields from the two seed types.2) Differences exist among yields from the three levels of fertilizer.3) Interactions exist between seed type and fertilizer level.* computed F exceeds table IF at 5% significance level for all the three above.leading to rejection of null hypothesis of no difference.Activity 4What are the specialities of the factorial designs?
35
Introduction to ResearchMethodology
l@J
36
3.6 ANALYSIS OF COVARIANCE
Analysis of covariance is a combination of the two techniques-analysis of varianceand regression. It is the simultaneous study of several regressions.
The purpose of analysis of covariance is to remove the effect of one or moreunwanted factors in an analysis of variance. For example, in studying the heights ofthree populations of children (cyanotic heart disease children, sibs of heart-diseasechildren, and ''\-vell children"), we may wish to eliminate the effect of age. A variablewhose effect one wishes to eliminate by means of a covariance analysis is called acovariate or a concomitant variable.
The analysis of covariance has the following uses:
1) To increase precision in randomized experiments. In such applications thecovariate X is a measurement taken on each experimental unit before thetreatments are applied that predicts to some degree the final response Y on thelUlit. By adjusting the treatment means after giving regard to the concomitantvariable, we obtain a lower experimental error and more precise comparisonsamong the treatments. This is probably the commonest use of covatiance.
2) To adjust for sources of bias in observational studies. An investigator is studyingthe relationship between obesity in workers and the physical activit~y required intheir occupations. If obesity is linearly related to age, differences found in obesityamong different occupations may be due in part to these age differences.Consequently he adjusts for a possible source of bias in his comparison amongoccupations.
3) To throw light on the nature of treatment effects in randomized experiments. Inan experiment on the effects of soil fumigants on nematodes, \vhich attack somefarm crops, significant differences between fumigants were found both in thenumbers of nematode cysts and in the yields of crop. This raises the question: canthe differences in yields be ascribed to the differences in numbers of nematodes?Analysis of covariance can provide answer to this question.
4) To study regressions in multiple classifications. For example, an investigator isstudying the relationship between expenditure per student in schools (Y) andpercapita income (X) in large cities. If he has data for a large numbers of citiesfor each of four years, he may want to examine whether the relationship is samein different sections of the country, or whether it remains the same [i'om year toyear. Sometimes the question is whether the relationship is straight or clll"Ved.
Because analysis of covariance techniques are complicated, we confine ourselvesmainly to the purpose and uses as mentioned above and highlight a practical situation\vhere the covariance analysis can be employed. Those \vho would like to go deeper,may refer to the book on "Statistical Methods" by Snedecor & Cochran. It is alsostrongly suggested that you should use SPSS, or Biomedical Programmes for analysisand intelvretation of covariance. These packages provide a complete and flexibleanalysis.
As an example consider the following data on language scores (Y) for students taughtby three different methods. Measurements on IQ(X) are also available. Since thestudents are not assigned at random to the tlu'ee teaching methods, there may easilybe differences in IQ scores among the three groups.
Our objective is to examine differences in language scores among the three methodsafter the effect of IQ has been eliminated. Otherwise, if we claim that metll0d I issuperior to method II, we may not be able to refute the statement that the obsel"Veddifference between the methods occurs because the IQs of the students using methodI were higher than using method II.
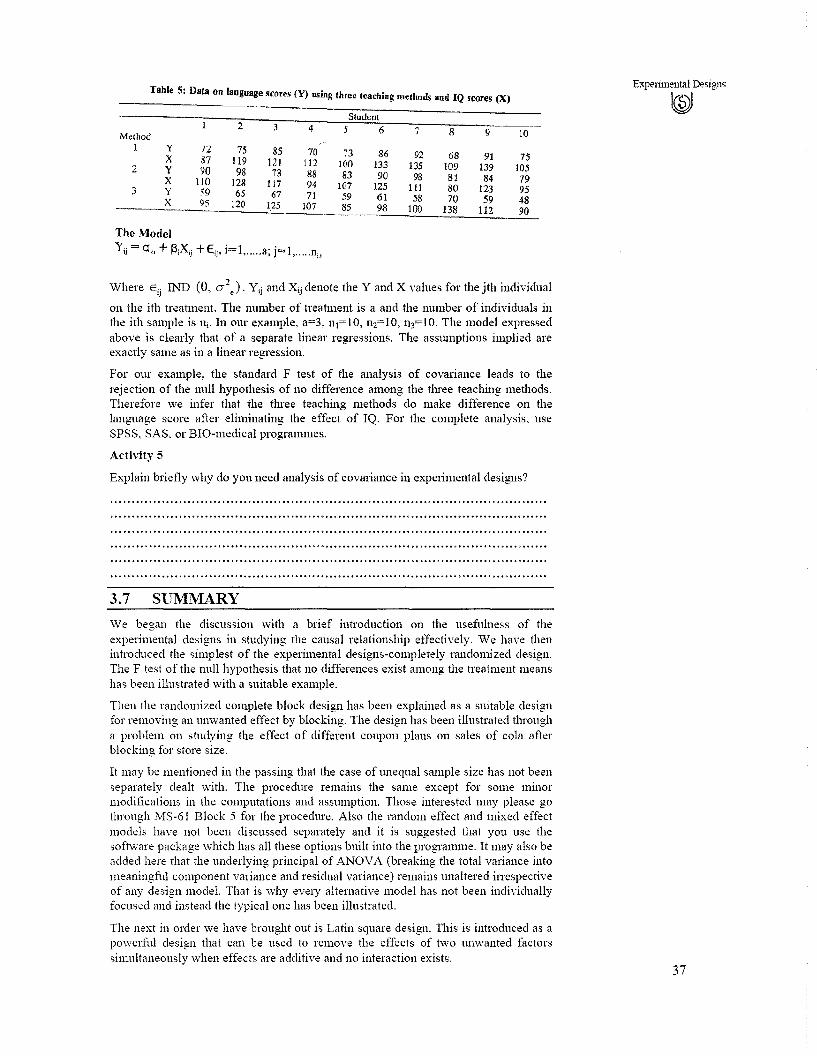
Table 5: Data on language scores (Y) using three teaching methods and IQ scores (X)
Where E ij IND (0, (71e)' Yij and Xij denote the Y and X values for the jth individual
on the ith treatment. The number of treatment is a and the number of individuals inthe ith sample is ni. In our example, a=3, n1=1O, n1=1O, n3=10. The model expressedabove is clearly that of a separate linear regressions. The assumptions implied areexactly same as in a linear regression.
For our example, the standard F test of the analysis of covariance leads to therejection of the null hypothesis of no difference among the three teaching methods.Therefore we infer that the three teaching methods do make difference on thelanguage score after eliminating the effect of IQ. For the complete analysis, useSPSS, SAS, or BIO-medical programmes.
Activity 5
Explain briefly why do you need analysis of covariance in experimental designs?
3.7 SUMNIARY
We began the discussion with a brief introduction on the usefulness of theexperimental designs in studying the causal relationship effectively. We have thenintroduced the simplest of the experimental designs-completely randomized design.The F test of the null hypothesis that no differences exist among the treatment meanshas been illustrated with a suitable example.
Then the randomized complete block design has been explained as a suitable designfor removing an unwanted effect by blocking. The design has been illustrated througha problem on studying the effect of different coupon plans on sales of cola afterblocking for store size.
It may be mentioned in the passing that the case of unequal sample size has not beenseparately dealt with. The procedure remains the same except for some minormodifications in the computations and assumption. Those interested may please gothrough 1v18-61 Block 5 for the procedure. Also the random effect and mixed effectmodels have not been discussed separately and it is suggested that you use thesoftware package which has all these options built into the programme. It may also beadded here that the underlying principal of ANOVA (breaking the total variance intomeaningful component variance and residual variance) remains unaltered il1'espectiveof any design model. That is \vhy every alternative model has not been individuallyfocused and instead the typical one has been illustrated.
The next in order we have brought out is Latin square design. This is introduced as apo\verful design that can be used to remove the effects of two unwanted factorssimultaneously when effects are additive and no interaction exists.
Experimental Designs
~
37

Introduction to ResearchMethodology
~
We have then moved on to the factorial design \vhich we have conceptualised in caseoftwo factors. We have emphasised that this design is very effective for student thetwo factors in combination from the angle of finding whether the interaction existbetween factors.
The last model in this unit we have discussed is the analysis of covariance. This isuseful technique in experiments or in surveys when the investigator \vishes to red thevariance and to remove the effect of a factor (concomitant variable or covariancesuch as age, which may have an appreciable effect on his response variable.
3.8 SELF-ASSESSl\'IENT EXERCISES
1) State clearly the assumptiolls embodied in all the experimental designscompletely randomized design, randomized complete block design, Latin squaredesign, factorial design, and analysis of covariance.
2) The marketing research department of the Gamma adhesive company isattempting to find some attribute of their gUlllliled labels that can bemerchandised as being superior to competitive brands. The manager of thedepartment feels that their strength of their adhesive represents a goodpromotional point in increasing sales. Accordingly, samples of the company'sadhesive and three other brands are tested by an independent research companyThe "strength indices" of the four products are as follows.
Trial
12:I45
GammaAdhexive X y I
35 }:! 11 14II 2'1 J~ J'I211 17 23 2626 24- 17 J932 [S I'! 22
a) Test the null hypothesis that the means of all treatments are equal
b) Assume now that the trials can be treated as blocks, perfolln the analysis ofthe randomized complete block design and compare your ans·wer with pal'!(a)
c) Discuss clearly the advantages of the randomized complete block design overthe completely randomized design in the context of this example.
3) A researcher has can'ied out the following Latin square design:
Hi E, H, 13,
AI C '= 13 C '= 16 C,= 16 C"= 14,C; 21lAz c,= 9 '= 17 C,= 20 C, -
A, C, '= 14 C, = 19 C = l7 C, .. n,A. c. l5 C, = 17 C - IX C, '= 19.-
The data above refer to unit sales.
Ai = Shelf height
Bj '= Number of racings
Ck = Shelffullness
a) Test the hypothesis that no significant differences exist among sales responsesdue to shelf height. number of t~'lCings. and shelf fullness.
b) ·Write the complete Latin square model for this problem.
4. Consider the follmving factoriallayoUl:
ij,k = 1.2.3,
38
Direct Mail
LevellLevel 2Level 3
Level J
40;3337;4051;47
Level ;;
47:5\51;611
56;600:,:-j67.;;76

a) Test the null hypothesis that there 1S no difference III sales due to personalselling effort and direct mail
b) Does a significant interaction exist ben>.'een personal selling eff0l1 and directmail advertising"
5) a) Distinguish clearly between analysis of variance and analysis of covariance.
b) Give one practical situation 'where analysis of covariance will have to be used.
3.9 FURTHER READINGS
Dunn Olive Jean and Virginia A Clarck, "Applied .Statistics" John Wiley and Sons.
Green Paul E and Donald S. Tull,"Research for Marketing Decisions" Prentice HallofIndia. New Delhi.
Snedecor, George W. " Stans/ad lvfetbocV' The IOWA State University Press,AMES. IOWA, USA (6th Edition).
Experimental Designs
~
39

UNIT 4 METHODS AND TECHNIQUES OFDATA COLLECTION
Structure
4.1 Introduction
42 Primary and Secondary Data
4.3 Methods of Collecting Primary Data
4.4 Merits and Demerits of Different Methods of Collecting Primary Data
4.5 Designing a Questionnaire
4.6 Pretesting a Questionnaire
4.7 Editing of Primary Data
4.8 Technique oflnterview
4.9 Collection of Secondary Data
4.10 Scrutiny of Secondary Data
4.11 Summary
4.12 Key Words
4.13 Self-assessment Exercises
4.14 Answers
4.15 Further Readings
4.1 INTRODUCTIONThe increasingly complex nature of business and government has focused attentionon the uses of research methodology in solving managerial problems. The credibilityof the results derived from the application of such methodology is dependent uponthe upto date information about the various pertinent characters included in theanalysis. To illustrate, the demand of disc records has dropped dramatically aftercassettes have entered into the market commercially. This information must be takeninto consideration for formulating marketing strategy by a dealer selling musicalproducts. Information expressed in appropriate quantitative form are known as data.The necessity and usefulness of information gathering or data collection cannot beoveremphasised in government policies. The government must be aware of the actualscenario of the acceptance of family planning before it can formulate any policy inthis matter. The components of this scenario are provided by appropriate data to becollected from various families. In industrial disputes regarding wages, cost of livingindex, a data based indicator of inflation is often accepted as a guideline forarbitration.In short, neither a business decision nor a governmental decision can be made in a 5

Data Collection andMeasurement
l@J
6
casual manner in the highly involved environment prevailing in this age. It is throughappropriate data and their analysis that the decision maker becomes equipped withproper tools of decision making.
4.2 PRIMARY AND SECONDARY DATAThe primary data are those which are collected afresh and for the first time, andthus happen to be original in character. Such data are published by authorities whothemselves are responsible for their collection.The secondary data, on the other hand, are those which have already been collectedby some other agency and which have already been processed. Generally speaking,secondary data are information which have previously been collected by someorganisation to satisfY its own need but it is being used by the department underreference for an entirely different reason. For example, the census figures arepublished every tenth year by the Registrar General of India. But the census figuresare also used by demographers and other social scientists for planning and research.Thus, the officials of the department of Registrar General will visualise the censusfigures as primary data. But a demographer using the same census figures to preparea mortality table will consider them as secondary data.Even when an organisation is interested to collect primary data it is necessary to takehelp of various types of secondary data to design a proper sampling scheme. Thisaspect of the use of secondary data will be covered in the next unit.Activity 1State whether the following data are primary or secondary?i) The Secretary, Merchant Chamber of Commerce is using the figures published in
"Reserve Bank ofIndia Bulletin" (Published monthly by Reserve Bank ofIndia)as the basis of forecasting money supply during the next month.
ii) The Secretary, department of mines is writing a report on various types of miningaccidents using the data available in the "Annual Report of the ChiefInspector ofMines in India" issued by the Office of the ChiefInspector of Mines.
iii) The Textile Commissioner is preparing a report on the prospect of textile exportbased on the data available in "Indian Textile Bulletin" published by his ownoffice.
iv) National Thermal Power Corporation is examining the supply of coal to theirthermal power stations using the data available in "Monthly Coal Bulletin"published monthly by the office ofthe ChiefInspector of Mines.
v) A work study inspector decides about the time taken to perform a patiicular jobon an assembly line on the basis of random observations collected by him.
vi) The Presidency Surgeon is examining the relationship between cigarette smokingand heart disease based on the data published in "Indian Medical Journal".
4.3 METHODS OF COLLECTING. PRIMARY DATAThe collection of primary data for business research is of paramount impOliance toassist management in making decisions. Generally, information regarding a largenumber of characteristics are necessary to analyse any problem pertaining tomanagement. For instance, a study relating to employment in rural areas requires dataon income, wages, types of crops and land holdings. The collection of primary datathus requires a great deal of deliberation and expertise. Depending upon the nature ofinformation necessary the following methods of collecting primary data are available.1) Observation MethodThe investigator collects the requisite information personally through observation.For example, in order to study the conditions of students residing in a university, theinvestigator meets the students in their hostels and collects necessary data after apersonal study. The
information about the extent of damage caused by natural calamities like flood can becollected by personal observation by a trained investigator. As the investigator issolely responsible for Collection of data by this method, his training, skill andknowledge play an impOliant role on the quality of primary data.
A slight variation of this procedure is indirect oral investigation where data arecollected through indirect sources. Persons who are likely to have information aboutthe problem are interrogated and on the basis of their answers, primary data becomeavailable. Most of the Commissions of Enquiry or Committees appointed byGovernment collect primary data by this method. The accuracy of the primary datacollected by this method depends largely upon the type of persons interviewed andhence these persons have to be selected very carefully.
2) Questionnaire Method
A popular and common method of collection of primary data is by personallyinterviewing individuals, recording their answers in a structured questionnaire. Thecomplete enumeration of Indian decennial census is performed by this method. Theenumerators visit the dwellings of individuals and put questions to them which elicitthe relevant information about the subject of enquiry. This information is recorded inthe questionnaire. Occasionally a part of the questionnaire is unstructured so that theinterviewee can feel free to share information about intimate matters with theinterviewer. As the data are collected by the field staff personally it is also known aspersonal interview method.
Much of the accuracy of the collected data, however, depends on the ability andtactfulness of investigators, who should be subjected to special training as to howthey should elicit the correct information through friendly discussions.
3) Mailed Questionnaire Method
A set of questions relevant to subject of enquiry are mailed to a selected list ofpersons with a request to return them duly filled in. Supplementary instructionsregarding the definitions of terms used and the methods of filling up the forms shouldalso accompany the questionnaire. This method can only be used when therespondents are literate and can answer the questions in writing. The questions shouldbe very clear without any ambiguity keeping in mind that there is no investigator tohelp the respondent.
The method of collecting data by mailing the questionnaires to the respondents ismost extensively employed in various business and economic surveys. This methodsaves both time and cost and can cover a large area. The absence of an investigator,however, renders the responses less reliable. The method also suffers from a largedegree of non response.
4) Telephone Interview
This method of collecting information consists in contacting respondents ontelephone itself. This method is inexpensive but limited in scope as respondents mustpossess a telephone. The telephone interview method is used in industrial surveysspecially in developed regions.
4.4 MERITS AND DEMERITS OF DIFFERENTMETHODS OF COLLECTING PRIMARY DATA
Generally speaking, the conditions under which the data are to be obtained willpredetermine the method of data collection. If a relatively few items of informationare sought quickly covering a number of industries and funds are limited telephoneinterviews should be recommended for collection of data. If depth interviews andprobing techniques are to be employed, it is necessary to employ investigators tocollect data. Thus, each method has its uses and none is superior in all situations. Thejoint use of more than one data collection method is sometimes preferred for a varietyof reasons. When a wide geographic area is being covered, the use of mailquestionnaires supplemented by personal interviews will yield more reliable resultsthan either method alone.
Two tables, Table 1 reviewing the relative merits and demerits of the principalmethods of data collection and Table 2 under different resource level are presentedbelow:
Methods and Techniques ofData Collection
~
7

Data Collection and Table 1 : Comparison of Principal Methods of Data CollectionMeasurement
~ Personal Mailed TelephoneInterview with Quutionnaire Inten'iewQuestionnaire A<clvantages
Most flexible i) Wider and more Wider and moremethod of ~ntative representativeobtaining data coverage ~si ble coverage ~sible
at the same cost at the same cost
Ii) Identilyof Ii) No field Staff ii) No field Staffrespondent koown is required is required
iii) Non response iii) Cost per questionnaire iii) Cost ofvery low relatively low response low.
iv) Supervision and iv) No bias of iv) Quick wayofcontrol possi ble interviewers obtaining data
v) RespondenlS cananswer questiondire::tly
Disadvantages
i) MoS! expensive i) High degree of i) Non telephonemethod of non response owners and thosecollecting data with unlisted
numbers cannotbe reached
ii) Considerable Ii) Questions which ii) Interview periodsupervision require probing is soonnecessary C3JIOOI be asked
iii) Bias of the iii) Slowest ofall iii) Questions which require probinginvestigators methods ofdata collection cannot be askJxIpresent in theresponses iv) Assumes that the respondent
is educated.
Table 2 : Preferred Data Colledion Methods
Funds Time Type of Personal Mail TelepboneData Interview
Restricted Restricted Few Items XResnicted Restricted Mucb Information X
Restricted Ample Few Items X XRestricted Ample Much Wormation X XAmple Resnicted Few Items X XAmple Restricted Much Wonnation X
Ample Ample Few Items X XAmple Ample Much Information X
Activity 2
State with reason the type of data collection method to be followed in the followingcases.
i) A severe drought has damaged the crop in the country. You are required todetermine the extent of damage for remedial measures.
8

ii) A railway accident occurred at a distance of 20 km from New Delhi railwaystation. You are asked to ascertain the cause of the accident and the extent ofdisaster.
iii) The Directorate of Cottage and Small Scale Industries desires to find out thereasons for non payment of loan taken by a number of artisans and small traders.You are asked to find out the reasons of non repayment.
iv) The new General Manager claims that the telephone service of the city hasbecome vastly improved during the last one year. You are assigned theresponsibility of providing a data based report on this claim expeditiously.
v) A manufacturer of a certain type of electronic product is interested to collectworldwide data on similar product with limited fund. You have to recommendhim a suitable data collection method.
vi) It has been claimed by the Department of family welfare that the publicity overthe media has increased the practice of family planning in the rural area. You areasked to collect data to-support or refute the claim.
vii) A company selling a type of household appliance is interested to know theperformance of its product from the customers with known addresses who areactually using it. The company is interested to collect data in an appropriatemanner.
Activity 3
Answer true or false
i) Indian decennial census is conducted by personal interview with questionnaire ...
ii) A great deal of interviewer bias is present in mailed questionnaire method of datacollection .
iii) The use of telephone interview method is limited as the interview period is shOJi..
iv) The highest degree of non response occurs in mailed questionnaire method .
v) With restricted funds and ample time mailed questionnaire method is the suitableprocedure for data collection .
Methods and Techniques ofData Collection
~
9

Data Collection andMeasurement
l(§)J
10
vi) If the type of data to be collected is sensitive in nature, one should adopttelephones interview " '" .
vii) Personal interview with questionnaire should be used to find ouUhe averagenumber of persons visiting a post office per day .
4.5 DESIGNING A QUESTIONNAIREA questionnaire is a proforma containing a sequence of questions to elicitinformation from the interviewees. The questionnaire is used for personal interview.At the same time the questionnaire is also mailed to individuals who are requested towrite the answers against each question and to return the completed proforma bypost.
The questionnaire is the heart of the primary data collection technique. Hence; itsdrafting requires utmost skill. The questions must be clear, simple and to the point.They must be well organised from the point of view of the respondent and beformulated in such a manner as to provide the data in so far as possible in the desiredform. This is specially true of a mail questionnaire which essentially has to speak foritself. If it is not clear; not only the replies may be vague and of little value but manypotential respondents may not bother returning the questionnaire at all.
A questionnaire may be said to possess three main aspects:
1) The General Form
2) The Question Sequence
3) The Question Wording
1) The General Form
The form of a questionnaire will depend partly on the type of data being sought andpartly on the data collection method to be used. The choice lies between twoextremes. On the one hand, there is the highly structured questionnaire in which allquestions and answers are specified and continents in the respondents' own words areheld to a minimum. At the other end is the unstructured questionnaire in which theinterviewer is provided with a general brief on the sort of information to be obtainedbut the exact question is largely his own responsibility.
The unstructured questionnaires are useful in carrying out in depth interviewswhere the aim is to probe for attitudes and reasons. They may also be effectivelyemployed in pretesting, the result of which can be used as a basis for constructing astructured questionnaire at a later stage. Thus, in order to ascertain the expectation ofthe television viewers about a programme interviews may be conducted withunstructured questionnaires. The resulting range of answers may then be used toprepare a structured questionnaire for use in the main part of the study.
The main disadvantage with any unstructured questionnaire is that it requirespersonal interview. It cannot be used in the mailed questionnaire method of datacollection.
A structured questionnaire usually has fixed alternative answers to each question.They are simple to administer and relatively inexpensive to analyse. Thequestionnaires have, however, their limitations. It is not possible to record theresponses made by the respondent in their own words. They are consideredinappropriate in investigations where the aim happens to be to probe for attitudes andfeelings.
2) The Question Sequence
The introduction to the questionnaire should be as short and simple as possible. Theintroductory letter accompanying the mailed questionnaire should also be made verybrief. The introduction lays the foundation for establishing the rapport with therespondent in addition to making the interview possible.
Once the rapport is established the questions will generally seek substantiveinformation of' value to the study. As a general rule, questions that put too great astrain on the memory or the intellect should be reserved till later. Likewise, questionsrelating to personal wealth and personal character should be avoided in thebeginning.

Following the opening phase should come the questions that are really vital to theinterview. Even here, substantive questions should be surrounded by more interestingones in order that the attention does not slip. Awkward questions, which create therisk thafthe re?pondent may' discontihu'e"the interview are usually relegated towardthe end. By the'time the interview has been terminated, some information is alreadyavailable with the intervieWer. '. .
Ideally, the question sequence' should conform to the respondents' way of thinking,and this is wher'e'unstructured interviews are highly advantageous. The interviewercan rearrange the order of the' questions to fit the discussion in each particular case.With structured questionnaire the best that can be done is to determine withpretesting the question sequence which is likely to pr9duce good rapport with mostpeople.
3) The Question Wording
It has .been stated that the question wprding and formulation are more of an ali than ascience. Science does enter; however, in testing the stability and the adequacy ofreplies for business and management decisions. The wording of the questions shouldbe impartial so as not to give a biased picture of the true state of affairs. Colourfuladjectives and undue descriptive phrases should be avoided. In general the questionsshould be worded such that (a) they are easily understood (b) they are simple Cc)they are concrete and conform to respondents' way ofthinking.
Multiple choice questions constitute the basis of a structured questionnaire,particularly 'in a mailed questionnaire method. But in addition to these questionsvarious open ended questions are generally inserted to provide a more completepicture of the respondent's feelings and attitudes.
A questionnaire with an objective to collect information concerning the loanees whohave taken loan from a bank during the last five years under the Self Employment toEducated Unemployed Youth Scheme is presented below. Note that the first fewquestions make the interviewer familiar with the subject. "I he substantiveinformation commences from question 9 but the two embarrassing questions 11 and12 is followed by a Sympathetic question 13. Although the questionnaire is structuredan unstructured part has been included in the answer of question 14 to record thediversity of replies.
BANK OF NEW DELHI
Self Employment to Educated Unemployed Youth Scheme
Methods and Techniques ofData Collection
l@J
1.
2.
3.
Questionnaire No ..
Narne of Loanee .............................................................................." , , .
Address .
4. Educationai Qualifications: (General)
Below Matriculation
Matriculation and above but below Graduate
Graduate and above
. 5. Educational Qualifications: (Technical)
None
Technical Diploma
Technical Degrec
6. Data of Birth • .
7. When did you start your .Business? : ..
Not yct started c=J Less than one year back [_. lOne year and above but less than two
years back c=J Two years and above but less than three ycars back I ~ Three years and above
but less than four years back c:::::=:J Four ycars and abovc but less than five years back c=J11

Data Collection andMeasurement
l@8. Type of Business
Agrobased [ I Supply of Material C]Manufacturing '__J Retail Selling c=JChemical c=J Transport c=JService CJ Other. please specify CJ
9. From which branch of the bank did you borrow?
Branch A [==:J Branch BCJ Branch C CJ BranchD i I10. When did you borrow money?
Less than one year back CJOne ycar and above but less than two years back CJTwo years and above but less than three years back CJThree years and above but less than four years back CJFour years and above but less than five years back I i
II. What was the aI\l0u nt of loan ?
Upto Rs 10,000 [==:JAbove Rs 10,000 but less than or equal to Rs 25,000 CJAbove Rs 25.000 but less than or equal to Rs 50.000 CJAbove Rs 50,000 CJ
12. How many instalments have you repaid so fa.?
None
Uptotive
More than five but less than or equal to tenII'-----'
More than ten
B. 'What difficulties are you facing in your project?
Lack of customer demand
Lack of raw material
Lack of power
Lack of skilled worker
Difficulty in procuring trade
license and other Government papers .
Other, please speci/)'
14. Your suggestions to overcome these difficulties
12
Signature of the Investigator ..
Name of the Investigator. ..
Date of Interview .
Activity 4
The following paragraph shows an unstructured questionnaire
We want to know about 'major purchases of goods and services (over Rs 1000) madeby the respondent or his family during the last five years. What were the prices andhow were they paid for; e.g. cash, instalment, borrowing etc.? Of particular interestare the following:
Television, Refrigerator, Vacation, Children's education.
We are also interested to know if the respondent or members of his family areplanning to spend money on any ofthe-above items during the next two years. If theydo, we want to have an indication of its cost and its mode of payment.
Prepare a structured Questionnaire on the basis of this unstructured questionnaire.
.......................................................................................................
Activity 5
A local newspaper wants to ascertain the extent to which the inclusion of a dailystock market page might increase its circulation. Prepare a questionnaire to collectthe pertinent information.
Activity 6
Explain what is wrong in the following forms of questions in a questionnaire.
i) Have you a Savings Account?
ii) What is the.profession of your husband?
iii) What is the price you paid for a piece of soap' Brand A' ?Why do you prefer it ?
iv) Is the bus service reasonably good?
Methods and Techniques ofData Collection
~
13

Data Collection andMeasurement
l@Jv) Isn't this a nice colour ?
14
vi) How many razor blades do you use annually?
vii) Did you decide to buy the scooter after the loan was approved?
viii) Do you believe borrowing from personal finance companies is faster and morepleasant than borrowing from banks?
4.6 PRETESTING A QUESTIONNAIRE
The pretest is a valuable indicator of the effectiveness of a questionnaire to collectdata. The pretesting of questionnaire consists in selecting, approaching andinterviewing a small segment in the same manner to be followed in the full scaleoperation and then analysing the results in the light of the objectives fthe study.
We can understand from the pretest whether the replies provide the type ofinformation needed or whether the respondents are misinterpreting any of thequestions. In addition, results obtained in a pretest can at times suggest new ideas orhypotheses worthy offurther examination.
If a pretest indicates any change of importance, a further pretest may be warranted toreview, the questionnaire. Thus, the mere fact that the wording of a questionoriginally misunderstood has been changed does not of itself ensure the clarity of thenew form. A few interviews with the new question form are highly desirable.
Pretests are sometimes conducted in an informal Manner.
Activity 7
You have drafted a questionnaire to find out why employees leave a given company.Pretest your questionnaire and in the light of the results obtained, list out where youwould like to make modifications in the questionnaire.
4.7 EDITING OF PRIMARY DATA
Editing involves reviewing the data collected by investigators to ensure maximumaccuracy and unambiguity. It should be done as soon as possible after the data havebeen collected. If the size of the data is relatively small, it is desirable that only oneperson edit all the data for the entire study. The different steps of editing areindicated below.
i) Checking legibility Obviously, the data must be legible to be used. If a responseis not presented clearly, the concerned investigator should be asked to rewrite it.
ii) Checking completeness An omitted entry on a fully structured questionnairemay mean that no attempt was made to collect data from the respondent or thatthe investigator simply did not record the data. If the investigator did not recordthe data,

·prompt editing and questioning of the investigator may provide the missing item.If an entry is missing because of the first possible cause, there is not much thatcan be done, except to make another attempt to get the missing data. Obviously,this requires knowing why the entry is missing.
iii) Checking consistency: The editor should examine each questionnaire to checkinconsistency or inaccuracy if any, in the statement. The income and expenditurefigures may be unduly inconsistent. The age and the date of birth may disagree.The area of an agricultural plot may be unduly large. The concerned investigatorsshould be asked to make the necessary corrections. If there is any repetitiveresponse pattern in the reports of individual investigators they may representinvestigator bias or perhaps attempted dishonesty.
Activity 8
To find out why employees leave a given job, you have administered a questionnaireto collect the relevant data. Edit all the data for the study before you proceed toanalyse it.
4.8 TECHNIQUE OF INTERVIEW
The general qualities that an interviewer should possess can be identified asextroversion, impartiality to different points of view, friendliness without gettingpersonal, ability to remain calm under many different circumstances,conscientiousness, perseverance, accuracy of reporting and adaptability. In addition,the interviewer must plan in advance and should fully know the problem underconsideration. He must choose a suitable time and place so that the interviewee mayfeel at ease during the interview. In order to establish proper rappOli specially in therural areas if a significant part of the respondents are women, female interviewer'must be employed to obtain the responses. If the language of the questionnaire isEnglish, translation in the regional languages must be available so that theinterviewer has no ambiguity about the questions.
While collecting data regarding various industrial problems, the interviewer shouldproceed very cautiously and systematically as the success of his project woulddepend entirely on the co-operation of the others. The interviewer is also expected tobe familiar with all the material already published by the organisation. In anadministrative hierarchy, it is preferable to begin interviews by contacting theofficials at the middle and lower levels and to collect all relevant material availablewith them.
The selection, training and supervision of interviewers are very importantadministrative functions for collection of reliable data.
4.9 COLLECTION OF SECONDARY DATA
Secondary data are data which have been collected and analysed by some otheragency. The sources of secondary data could be :
i) Various publications of Central, State and local governments : Theimportant official publications are Statistical Abstract', India-Annual; MonthlyAbstract of Statistics (both published by Central Statistical Organisation );Indian Agricultural Statistics (Annual) (Published by Ministry of Food andAgriculture ); Index Number of Wholesale Prices in India (Weekly) (Publishedby Ministry of Commerce and Industry); Reserve. Bank of India Bulletin(Monthly) (Published by Reserve Bank ofIndia)..
ii) Various publications of foreign governments or of international bodi-es :The important publications are publications of international bodies like UNO,FAO, WHO, UNESCO, ILO, Statistical Year Book (Published by theStatistical Office of the United Nations), Yearbook of Labour Statistics(Published by ILO, Geneva).
Methods and Techniques ofData Collection
~
15

Data Collection andMeasurement
l@J
16
The secondary data-provided by such publications are authentic, but along with otherthings, one must be specially careful about the units in respect of currency, weightetc. which greatly vary from one country to another.
iii) journals of trade, commerce, economics, engineering etc. published byresponsible trade associations, Chambers of Commerce provide secondary datain respect of some important items. Some examples ofthis kind of publicationsare "Annual Report of the Chief Inspector of Mines in India" (issued annuallyby the office of the Chief Inspector of Mines, Dhanbad) and "Indian TextileBulletin (issued monthly by the Textile Commissioner, Bombay).
iv) The other sources of secondary data are books, magazines and newspapers,reports prepared by various universities, historical documents, diaries, letters,unpublished biographies and autobiographies.
Activity 9
If you were to estimate demand for vegetable oil in India, list out the variables onwhich you would like to collect secondary data. Also find out the sources where youcould obtain secondary data on the variables you have listed.
4.10 SCRUTINY OF SECONDARY DATA
Primary data are to be scrutinised after the questionnaires are completed by theinterviewers. Likewise, the secondary data are to be scrutinised before they arecompiled from the source. The scrutiny should be made to assess the suitability,reliability, adequacy and accuracy of the data to be compiled and to be used for theproposed study.
1) Suitability: The compiler should satisfy himself that the data contained in thepublication will be suitable for his study. In particular, the conformity of thedefinitions, units of measurement and time frame should be checked. Forexample, one US gallon is different from one British gallon.
2) Reliability: The reliability of the secondary data can be ascertained from thecollecting agency, mode of collection and the time period of collection. Forinstance, secondary data collected by a voluntary agency with unskilledinvestigators :;re unlikely to be reliable.
3) Adequacy: The source of data may be suitable and reliable but the data maynot be, adequate for the proposed enquiry. The original data may cover a biggeror narrower geographical region or the data may not cover suitable periods. Forinstance, per capita income of Pakistan prior to 1971 is inadequate forreference during the subsequent periods as it became separated into twodifferent countries with-considerable variation in standard of living.
4) Accuracy: The user must be satisfied about the accuracy of the secondarydata. The process of collecting raw data, the reproduction of processed data inthe publication, the degree of accuracy desired and achieved should also besatisfactory and acceptable to the researcher.
4.11 SUMMARY
The pattern of business and industry in the present day environment has become quitecomplex and involved due to a variety of reasons. Any meaningful decision to bemade in this context must be objective and fact based in nature. This is achieved bycollecting and analysing appropriate data. Data may broadly be divided into twocategories, namely primary data and secondary data. The primary data are thosewhich are collected for the first time by the organisation which is using them. Thesecondary data, on the other hand, are those which, have already been collected bysome other agency but also can be used by the

organisation under consideration. Primary data maybe collected by observation, oralinvestigation, questionnaire method or by telephone interviews. Questionnairesmay be used for data collection by interviewers. They may also be mailed toprospective respondents. The drafting of a good questionnaire requires utmost skill.The process of interviewing also requires a great deal of tact, patience and,competence to establish rapport with the respondent. Secondary data are available invarious published and unpublished documents. The suitability, reliability, adequacyand accuracy of the secondary data should, however, be ensured before they are usedfor research problems.
. 4.12 KEY WORDS
Primary Data are data collected by the organisation itself.
Secondary Data are data collected and processed by some other agency.
Observation Method is the procedure through which the investigator collectsinformation by personal observation.
A Questionnaire is a proforma containing a sequence of questions to elicitinformation from the interviewees.
The Questionnaire Method is the Method of collecting data by personal visit with aquestionnaire.
The Mailed Questionnaire Method is the method of collecting data by mailingquestionnaire.
The Telephone Interview Method is the method of collecting data by contactingrespondents over telephone.
4.13 SELF-ASSESSMENT EXERCISES
I) Describe the various methods of collecting primary data and comment on theirrelative advantages and disadvantages.
2) Define secondary data. State their chief sources and point out the dangersinvolved in their use and the precautions necessary to use them. Illustrate withexamples.
3) Which method is most suitable for conducting enquiry regarding familywelfare programme in India? Explain its merits and demerits.
4) Examine the merits and limitations of the observation method in collectingdata. Illustrate your answer with suitable examples.
5) What are the guiding considerations in the construction of questionnaire ?Explain.
6) You have been assigned the task of finding the various problems of railwaycommuters in Bombay. Design a suitable questionnaire to be used in this study.
7) The Chamber of Commerce has appointed you to ascertain the reaction of theFinance Bill, 1990. Design a suitable questionnaire to be mailed to collectinformation in this matter.
4.14 ANSWERS
Activity 1
(i) secondary (ii) primary (iii) primary (iv) secondary (v) primary (vi) secondary
Activity 2
i) By observation method since the remedial measures have to be adoptedquickly. There is hardly anytime for questionnaire design and interview.
!i) By indirect oral investigation from the persons who were present at the time ofthe accident. Since the accident took place before your arrival to the accidentscene only the testimony of the persons can provide the relevant data.
iii) By personal interview with questionnaire as the mailed questionnaire method isunlikely to elicit any response.
Methods and Techniques ofData Collection
l@J
17

Data Collection andMeasurement
~
18
iv) Since the claim of the General Manager is relevant to the telephone owners ofthe city,
v) the telephone interview method is the appropriate procedure of data collection.
vi) With a limited fund it is not possible to visit several countries for personalinterview. So, the Mailed Questionnaire method is the appropriate method ofdata collection.
vii) The data should be collected by personal interview with questionnaire. Mailedquestionnaire method is unsuitable for rural areas.
viii) As the addresses of the customers are known mailed questionnaire method isthe appropriate method of data collection. Personal interview is likely to bequite expensive considering the purpose ofthe enquiry.
Activity 3
(i) True (ii) False (iii) False (iv) True (v) True (vi) False (vii) False
Activity 6
i) This question is unpleasant to the person who has none and will seeminquisitive who has one and therefore tends to annoy him.
ii) This question is rude. The proper way to elicit this information is to design thequestion as "Is your husband an engineer, a doctor, a chartered accountant, aprofessor and so on T'
iii) The answer to the second question will be influenced by the first question. Thebrand may be preferred or not preferred due to its price only irrespective of theother qualities of the product,
iv) The question is suggestive and the answer ofthe interviewee may be biased outof politeness.
v) Wrong due to the same reason as in (iv).
vi) The question is unrealistic as the respondent cannot possibly remember thisnumber. The more realistic question will be to ask, "How many razor bladesdid you use last week T'
vii) The question is ambiguous. Neither "Yes" nor "No" gives the correct sequenceof events.
viii) The question is ambiguous. It is not clear whether "Yes" means "faster" and/or"more pleasant". The same remark is applicable for "No".
4.15 FURTHER READINGS
Gopal, M.H. 1964. An Introduction to Research Procedure in Social Sciences, AsiaPublishing House: Bombay.
Kothari, C.R. 1989. Research Methodology Methods and Techniques, Wiley EasternLimited: New Delhi.
Sadhu, A.N. and A. Singh. 1980. Research Methodology in Social Sciences, SterlingPublishers Private Limited: New Delhi.
Wilkinson, T.S. and P.L. Bliandarkar. 1979. Methodology and Techniques of SocialResearch, Himalaya Publishing House: Bombay.


UNIT 5 SAMPLING AND SAMPLINGDESIGNS
Objectives
On successful completion ofthis unit, you should be able to :
• explain the advantage of sampling vis-a-vis census operations;
• identify the population, sample, sampling unit and sampling frame;
• apply probabilistic consideration to use simple random sampling with or withoutreplacement;
• discuss the idea of stratification of a population and to use stratified samplingmethod to improve precision;
• describe other sampling methods of data collection suitable in relevant cases;design a suitable sampling scheme keeping both cost and precision in view;
• explain the use of non probability sampling despite its theoretical weaknesses.
StructUioe
5.1 Introduction
5.2 Advantage of Sampling Over Census
5.3 Simple Random Sampling
5.4 Sampling Frame
5.5 Probabilistic Aspects of Sampling
5.6 Stratified Random Sampling
5.7 Other Methods of Sampling
5.8 Sampling Design
5.9 Non Probability Sampling Methods
5.10 Summary
5.11 Key Words
5.12 Self assessment Exercises
5.13 Answers
5.14 FUJiher Readings
5.1 INTRODUCTIONThe terminology "sampling" indicates the selection of a part of a group or anaggregate with a view to obtaining information about the whole. This aggregate orthe totality of all members is known as Population although they need not be humanbeings. The selected part" which is used to ascertain the characteristics of thepopulation is called Sample. While choosing a sample, the population is assumed tobe composed of individual units or members, some of which are included in thesample. The total number of members of the population and the number included inthe sample ~re called Population Size and Sample Size respectively.While the definitions of a population and a sample have been introduced in a formalmanner in the previous paragraph, the idea of sampling is not really new. The processof generalising on the basis of information collected on a part is really a traditionalpractice. The annual production of a certain crop in a region is computed on the basisof a sample. The quality of a product coming out of a production process isascertained, on the basis of a sample. The government and its various agenciesconduct surveys from time to time to examine various economic and related issuesthrough samples.
With the advancement of management science more sophisticated applications of 19

Data Collection andMeasurement
20
sampling in business and industry are available. Sampling methodology can be usedby an auditor or an accountant to estimate the value of total inventory in the storeswithout actually inspecting all the items physically. Opinion polls based on samplesis used to forecast the result of a forthcoming election.
Activity 1Define population and sampling unit in each of the following problems.
i) Popularity offamily planning among families having more than two children.
ii) Election fOJ: a political office with adult franchise.
iii) Measurement of volume oftimber available in forest.
iv) Annual fruit in a hilly district.
v) Study of birth rate in a district.
5.2 ADVANTAGE OF SAMPLING OVER CENSUSThe census or complete enumeration consists in collecting data from each andevery unit from the population. The sampling only chooses apati of the units fromthe population for the same study. The sampling has a number of advantages ascompared to complete enumeration due to a variety of reasons.
Less Expensive
The first obvious advantage of sampling is that it is less expensive. If we want tostudy the consumer reaction before launching a new product it will be much lessexpensive to carry out a consumer survey based on a sample rather than study ing theentire population which is the potential group of customers. Although in decennialcensus every individual is enumerated, celiain aspects of the population are studiedon a sample basis with a view to reduce cost.
Less Time Consuming
The smaller size of the sample enables us to collect the data more quickly than tosurvey all the units of the population even if we are willing to spend money. This ispatiicularly the case ifthe decision is time bound. An accountant may be interested toknow the total inventory value quickly to prepare a periodical report like a monthlybalance sheet and a profit and loss account. A detailed study on the inventory islikely to take too long to enable him to prepare the report in time. If we want tomeasure the consumer price index in a patiicular month we cannot collect data of allthe consumer prices even if the expenditure is not a hindrance. The collection of dataon all the consumer items and their processing in all probability are going to takemore than a month. Thus when ready, the price index will not serve any meaningfulpurpose.
Greater Accuracy
It is possible to achieve greater accuracy by using appropriate sampling techniquesthan by a complete enumeration of all the units of the population. Completeenumeration may result in accuracies of the data. Consider an inspector who isvisually inspecting the quality of finishing of a certain machinery. After observing alarge number of such items he cannot just distinguish items with defective finishfrom good one's. Once such inspection fatigue develops the accuracy of examiningthe population completely is considerably decreased. On the other hand, if a smallnumber of items is observed the basic data will be much more accurate. It is of coursetrue that the conclusion about a population characteristic such as the proportion ofdefective items from a sample will also introduce error in the system. However, sucherrors, known as sampling errors, can be studied, controlled and probabilitystatements can be made about their magnitude. The accuracy which results due tofatigue of the inspector is known as non sampling error. It is difficult to recognisethe pattern of the non sampling error and it is not possible to make any commentabout its magnitude even probabilistically.

Destructive Enumeration
Sampling is indispensable if the enumeration is destructive. If you are interested incomputing the average life of fluorescent temps supplied in a batch the life of theentire batch cannot be examined to compute the average since this means that theentire supply will be wasted. Thus, in this case there is no other alternative than toexamine the life of a sample of lamps-and draw an inference about the entire batch.
Activity 2
Name a few research studies carried out in your organisation or the organisation youknow of where sample surveys were conducted.
Activity 3
List out the advantages of sampling over complete enumeration (relative it to thestudies in Activity 2).
5.3 SIMPLE RANDOM SAMPLING
The representative character of a sample is ensured by allocating some probabilityto each unit pf the population for being included in the sample. The simple randomsample assigns equal probability to each unit of the population. The simple randomsample can be chosen both with and without replacement.
Simple Random Sampling with Replacement
Suppose the population consists ofN units and we want to select a sample of size n.In simple J'andom sampling with replacement we choose an observation from thepopulation in such a manner that every unit ofthe population has an equal chance oflIN to be included in the sample. After the first unit is selected its value is recordedand it is again placed back in the population. The second unit is drawn exactly in theswiPe manner as the first unit. This procedure is continued until nth unit of the sampleis selected. Clearly, in this case each unit of the population has an equal chance oflIN to be included in each ofthe n units of the sample.
Simple Random Sampling without Replacement
In this case when the first unit is chosen every unit of the population has a chance oflIN to be included in the sample. After the first unit is chosen it is no longer replacedin the population. The second unit is selected from the remaining N-l members of thepopulation so that each unit has a chance of l/N-I to be included in the sample. The
1procedure is continued till nth unit of the sample is chosen with probability --
N-n+1
We now consider the operational aspect of selecting a simple random sample.
Random Sampling Numbers
The random sampling numbers are collection of digits generated through aprobabilistic mechanism. The numbershave the following propeliies:
i) The probability that each digit 0, I, 2, 3, 4, 5, 6, 7, 8, 9, will appear at anyparticular place is the same, namely 1/1 0.
ii) The occurrence of any two digits in any two places is independent of each other.A Table of Random Sampling Numbers are given below:
Sampling and SamplingDesigns
~
21

Data Collection andMeasurement Table 1: Random Sampling Numbers
~ 78994 36244 02673 25475 84953 61793 50243 63423
04909 58485 70686 93930 348&0 73059 06823 80257
46582 73570 33004 51795 86477 46730 60460 70345
29242 89792 88634 60285 07190 07795 27011 85941
68104 81339 97090 20601 78940 20228 22803 96070
17156 02182 82504 19880 93747 80910 76260 25136
50711 94789 07171 02103 99057 98775 37'197 18325
39449 52409 75095 77720 39729 03205 09313 43545
An ExampleSuppose a class has 115 students and you have been asked to selected a sample ofsize 15 with replacement.The students are numbered in some order from 1 to 115 so that each student isidentified uniquely by a serial number. Since the total number of students 115 is athree digit number we take numbers in groups of three. The student bearing serialnumber 1 is identified with the number 001, the student bearing the serial number 2 isidentified with the number 002 and so on. Proceeding in this manner the digit 115will correspond to the student bearing the serial number 115. The number 116 willagain correspond to the student bearing the serial number 1, the number 117 again tothe student bearing the serial 2. This process will continue upto 920, the highestmultiple of 115 less than 1000. The digits 921-999 and 000 will be rejected.It is possible to select three digit numbers from the random number table anywhere.However, once a starting position has been selected you should continue to choosenumbers according to the given sequence. For the sake of simplicity we start at thebeginning row wise. The Table 2 below shows the selection of a sample of size 15with replacement.
Table 2: Selection or Random Sample with Rand.(}m Numbers
Random No. Selected Remark Serial No. of the selected student
789 Actep! 99
943 Reject
2 624 Accepl 49
402 Accept 57
4 673 Accept 9S
5 254 Accept 24
6 758 Acccpt 68
7 495 Accept 35
361 Accept 16
9 793 AcCCf,t J03
10 502 Acrept 42
1J 436 Aro..1J(. 80
12 342 Accept 112
13 049 Accept 49
14 095 Accepl 95
22
J5 848 Acce(ll 43
Note that the student bearing the serial number 49 has been selected twice. This ispermissible since the sampling is with replacement.
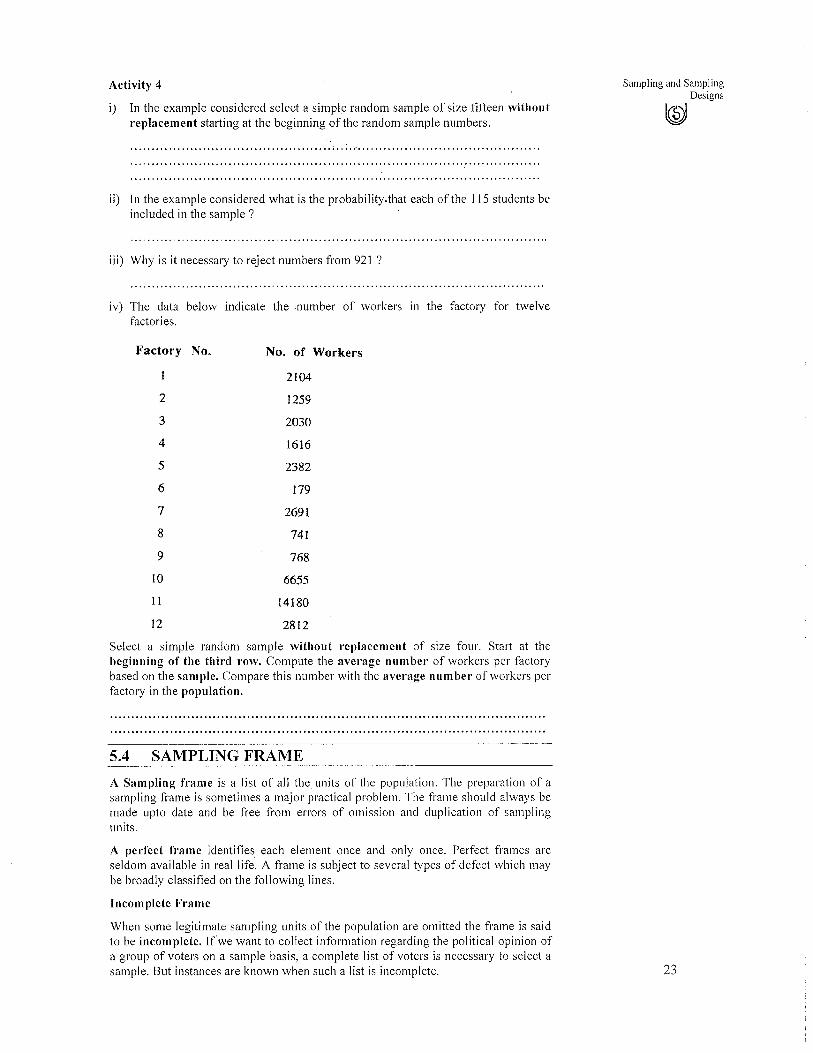
Activity 4
i) In the example considered select a simple random sample of size fifteen withoutreplacement starting at the beginning of the random sample numbers.
ii) In the example considered what is the probability.that each of the 115 students beincluded in the sample?
iii) Why is it necessary to reject numbers from 921 ?
iv) The data below indicate the .number of workers in the factory for twelvefactories.
Factory No. No. of Workers
2104
2 1259
3 2030
4 1616
5 2382
6 179
7 2691
8 741
9 768
10 6655
11 14180
12 2812
Select a simple random sample without replacement of size four. Start at thebeginning of the third row. Compute the average number of workers per factorybased on the sample. Compare this number with the average number of workers perfactory in the population.
5.4 SAMPLING FRAME
A Sampling frame is a list of all the units of the population. The preparation of asampling frame is sometimes a major practical problem. The frame should always bemade upto date and be free from errors of omission and duplication of samplingunits.
A perfect frame identifies each element once and only once. Perfect frames areseldom available in real life. A frame is subject to several types of defect which maybe broadly classified on the following lines.
Incomplete Frame
When some legitimate sampling units of the population are omitted the frame is saidto be incomplete. If'we want to collect information regarding the political opinion ofa group of voters on a sample basis, a complete list of voters is necessary to select asample. But instances are known when such a list is incomplete.
Sampling and SamplingDesigns
l@J
23

Data Collection andMeasurement
~
24
Inaccurate FrameWhen some of the sampling units of the population are listed inaccurately or someunits which do not actually exist are included, the frame is said to be inaccurate. Ifyou use the list of ration cards as a frame to select persons obviously such a framewill be inaccurate as the details about the persons such as age are never updated.
Inadequate FrameA frame which does not include all units of the population by its structure is aninadequate frame. If you use the list of names included in the telephone directory ofa city as the frame for selecting a sample to collect information about a consumerproduct, obviously it will be an inadequate frame. It will include the names of onlythose persons who have a telephone omitting the majority of the residents of the city.
Out of Date FrameA frame is out of date when it has not been updated although it was accurate,complete and adequate at the time of preparation. The use of census blocks as aframe to select a sample of households is a fairly accurate frame immediately afterthe decennial census. But thereafter, its reliability as a frame deteriorates in a rapidlygrowing or rapidly declining area.
Activity 5Consider the sampling problems indicated in Activity 1. Suggest a suitable frame ineach case.
5.5 PROBABILISTIC ASPECTS OF SAMPLINGSimple random sampling is based on the concept of probability. The use ofprobability in sampling theory makes it a reliable tool to draw inference orconclusion about the population. Although the types of conclusion or inference canbe quite diverse, two particular types of decision making are quite prevalent inproblems of business and government.
On various occasions, the management would like to know the percentage orproportion of units in the population with a celiain characteristic. An organisationselling consumer product may like to know the proportion of potential consumersusing a certain type of cosmetic. The government may like to know the percent ofsmall farmers owning some cultivable land in a rural region. A manufacturerplanning to expoli some product may be interested to ascertain the proportion ofdefect free units his system is capable of manufacturing.
The performance level of many products in a mass production shows statisticalvariation. This aspect of quantitative analysis has been discussed in MS-8 Block 3.Thus, we would only indicate the results without details. A manufacturer offluorescent lamps would like to know the average life of these lamps keeping in mindthat there will be variation- in life between individual lamps. An investor could beinterested to know the prices of a number of stocks. But as the prices vary over theyear, he may look for the average price of these stocks over the year.
In the first case, it is assumed that the proportion of units in the population with thespecific characteristic is P (unknown) (0 < P < I) which is also referred to aspopulation proportion. You select a simple random sample (with or withoutreplacement) of sized and find out the number of units in the sample possessing theparticular characteristic under consideration. Suppose p is the proportion of units inthe sample possessing the characteristic. Then the numerical value of p gives us anindication of the unknown population proportion P. Likewise, the mean characteristicof all the units of the population is unknown. Suppose you select a simple randomsample (with or without replacement) of size n and denote by Yh Y2,' "',Yll thecharacteristic of these selected units of the sample (such as life of this lamp or the
price of the stock on that particular day). The sample mean y is
- 1y= - (y I +y 2 +. ...+y n )
n

The numerical value ofy provides an indication of the population mean m.
The unknown quantities P or m are commonly referred to as pal'ameters of thepopulation. The corresponding sample counterparts p or yare known as estimators.The quantity p is bas~d on sample observations only: This is why it is also known as
a statistic. Likewise y is also a statistic.
It must be recognised that an estimator is also a statistical variable with a samplingdistribution. The variance of this sampling distribution is an indicator of the extent oferror c9mmitted by using an estimator in place of a parameter. In particular, the
- -variance Of p, V(p) and the variance of y, V (y) are known to be
V(p) =fQ(Q= I -P) l·f·>l.e I' I .-n • ill ~?.rnp e IS se eered WIth repla-::ernent
V( ) _.EQ N-n. , .p - n x N--I ' if the sample IS selected without replacement.
(}'2 .
V(y) = ~ , if the sample is selected with replacement.
0'2 N .V(y) ;; ~ (N =~ ), if the sample is selected without replacement.
The quantity 0-2 is the variance of all the units of the population. This quantity is
unknown but its estimator on the basis of a simple random sample of size n withobserved units (Yb yb .... Yn) is
2 1 -2 -2S ==-[(y\ -y) + +(yn -y) ]
I-n
The estimate of PQ is pq/n-J.n
It may be observed from the expressions of variances of V(p) and V( Y) that they are
virtually identical for sampling with and without replacement when the populationsize is very large compared to the sample size.
The square root of the variance of an estimator is usually known as its standarderror. The standard error is generally taken as a measure of precision to beachieved by sampling and will be used for developing suitable sampling design in asubsequent section.
Activity 6
A list of 3000 voters of a ward in a city was examined for measuring the accuracy ofage of individuals. A random sample of 300 names was taken, which revealed that 5 Icitizens were shown with wrong ages. Estimate the propOliion of voters having awrong description of age. Estimate the standard error of the estimate if the samplingis done (a) with replacement (b) without replacement.
5.6 STRATIFIED RANDOM SAMPLING
The simple random sampling may not always provide a representative miniature ofthe population. Certain segments of a population can easily be under representedwhen an unrestricted random sample is chosen. Hence, when considerableheterogeneity is present in the population with regard to subject matter under study,it is. often a good idea to divide the population into segments or strata and select aceliain number of sampling units from each stratum thus ensuring representationfrom all relevant segments. Thus for designing a suitable marketing strategy for aconsumers durable, the population of consumers may be divided into strata by
. incon1e level and a certain number of consumers can be selected randomly from eachstrata.
Sampling and SamplingDesigns
l@
25

Data Collection andMeasurement
26
Speaking formally, the population of N units is subdivided into k sub-populationsor strata the ith sub-population having N unit (i = 1, 2, , k). These sub-populations are non overlapping so that they comprise the whole population such that
N I + Nz + + N k = N
A simple random sample (with or without replacement) is selected independentlyin each stratum, the sample size in the ith stratum being
nj (i = 1,2, , k).Thus the total sample size is n = nl = n2 = = nk.
The stratification should be performed in such a manner that the strata arehomogeneous within themselves with respect to the characteristic under study. Onthe other hand, strata should be heterogeneous between themselves. Sometimesadministrative convenience is taken into consideration to stratifY the population. Forinstance, in order to study the problems of railway commuters each railway divisionmay be considered to be a different stratum. In rural areas, the region coveringadjacent districts are likely to be homogenous with respect to socio-economic andcultural pattern. Hence they could be included in a common strata. Distribution ofconsumer products may face different types of problems in rural, urban or hilly areas.These may be considered as separate stratum from the point of view of management.
Allocation or Sample Size in Different Strata
In stratified sampling, the sample to different strata is allocated on the basis of threeconsiderations.
i) The total number of units in the stratum i.e. stratum size
ii) The variability within the stratum
iii) The cost of taking observation per sampling unit each stratum.
From the point of view of management the most effective utilisation of the resourceswill be achieved if the variance of the estimator is minimised for a fixed budget orthe cost of sampling is minimised for a fixed variance of the estimator. In practice,however, two different types of allocation are mostly prevalent.
Proportional Allocation
This procedure of allocation is very common in practice because of its simplicity.The number of sampling units n, allocated to the ith stratum is proportional to thenumber of units in the population. Symbolically
- N"('_l 2 k)nj - nN' 1-, , .•......
Optimum Allocation
Let Cj be the cost of sampling one unit from stratum i and 0,2 be the variance of the
2units belonging to stratum i. We assume that knowledge about 0, is available from
a previous consumer survey. Then, symbolically
N (J'/-fC'J 1 (. I 2k ; 1 = , , ... k)
L(Nicr/~)i=I
According to this principle of asceliaining the sample size, the sample size in aparticular stratum is larger if (i) the stratum size is larger (ii) the stratum has largervariability and (iii) the sampling cost in the stratum is lower.
An Example
The Table 3 below shows the allocation of a sample of size 400 in seven strata. Thestrata have been formed according to monthly income of the consumers.

Table 3 : Allocation of Sample According to Different MethodsSampling and Sampling
Designs
Monthly ~ 0'1 Cj ..rc; nl NjO'i/;fC; nl ~"Income N (Rs) (Rs) (Propor' k (Op!i.(Rs) tional)
L(N10',/;fC;)mum)
j,,1
Under 200) .IS 100 2,50 1.6 72 .038 15
200Q.3999 .31 250 2.00 1.4 124 .189 76
4000-5999 .24 400 2.00 1.4 96 .234 94
6000-7999 .14 700 2.00 1.4 56 ,238 95
SOOQ.9999 .07 1000 2.50 1.6 28 .149 60
10000-14999 .04 1200 3.20 1.8 16 ,091 36
15000 and above .02 1800 4.00 2.0 8 .061 24
Total 1.00 400 400
As a market heterogeneity is present among the income strata the optimum allocationdiffers sharply from the proportional. allocation, placing more emphasis onrepresentation from the higher income strata. This is because the higher incomegroup has a large variability.
Activity 7
A bank wants to select a sample of 500 borrowers who have borrowed money duringthe last one year. The borrowers who have taken loan can be divided into four strataaccording to occupation with stratum sizes N, = 10000, N2 = 5000, N3 = 3000, N 4 =
2000. What should be the sample sizes in the four stratum with (i) Proportionalallocation (ii) Optimum allocation? In the second case the cost of sampling each unitis Rs 20 irrespective of the occupational classes. But the standard deviations of thecharacteristic under study are Rs 420, 262.5, 603 and 355 respectively for the fourstrata.
5.7 OTHER METHODS OF SAMPLING G.
Cluster Sampling: In this method of sampling a collection or a Cluster of samplingunits are selected in a random manner. Then each unit of the cluster is included in thesample.
In order to motivate the use of a Cluster, we consider a survey where the samplingunits are households in a rural area. If simple random sampling is used to selecthouseholds they will be located over several villages. On the other hand, a village canbe regarded as a Cluster of households. We select a .few villages randomly andinclude every household in the selected villages in our sample. Such a samplingprocedure will be an illustration of Clustel" Sampling. It has a number of advantagesover simple random sampling.
i) If the households are chosen using simple random sampling, they are likely to bedistributed over several villages. Hence from administrative point of view such aselection will involve more cost, more field supervision and more travelling. Onthe other hand, if a selected village is completely enumerated, the cost involvedwill be lower and the supervision exercised will be better.
ii) If the households in the sample are distributed over several villages then a framecontaining the list of households of each of these villages is necessary for properidentification and selection of the household in the sample. On the other hand, ifevery 27

Data Collection andMeasurement
28
household in a selected village is included in the sample, no sampling framelisting the households in a village is necessary.
iii) If the type of question is of intimate nature an isolated household selected in avillage is unlikely to cooperate with the investigators. On the other hand, if everyhousehold in a village is visited, a particular household after observing that hisneighbours are also being interviewed are likely to offer greater cooperation andas such the quality of the basic data will be more reliable.
In the example presented in this section clusters have been formed based ongeographic subdivisions. A village is a natural geographic Cluster of households. ACluster sample with clusters based on geographic subdivisions is known as areaSample and the procedure is known as area Sampling.A Cluster sample need not be always formed on geographic consideration. Supposewe want to estimate the proportion of defective machine parts in the inventory. Ifthere are 20,000 items stored in 400 cases of 50 each, then those 400 cases can beconsidered as clusters. A Cluster sample of ten cases may be randomly selectedresulting in a sample of 500 items.For a given sample size, the variance of an estimator increases or equivalently theestimator becomes less precise with a larger cluster size. On the other hand, the costdecreases with a larger cluster size. We may balance the two conflicting aspects ofthe problems by finding out the Optimum Cluster size which minimises thevariance of the estimator for a fixed cost or minimise the cost for a given level ofprecision.Systematic SamplingThe mechanics of taking a systematic sample are very simple. Suppose thepopulation consists of ordered N units (numbered from I to N) and a sample of size n
Nis selected from the population in such a way that - =k (rounded to the nearest
ninteger). Here k is called sampling interval. In systematic sampling from the first k ofthe units a unit is selected randomly. Then every kth unit is selected in the sample. Asfor illustration, suppose k = 20. Then among the first 20 units coming out through theproduction line one unit is selected randomly. Suppose this is unit number 9. Thenwe select unit number, 29, 49, .... .in our sample till the requisite sample size hasbeen reached.The main advantage of systematic sampling is its simplicity of selection, OperationalConvenience and even spread of the sample over the population. The investigatorsusing this sampling method need not be familiar with the use of random samplingnumbers. It has been found very useful in forest surveys for estimating the volume oftimber or in fisheries for estimating the total catch of fish. The method can be usedeven when no formal list of the units of the population is available. As forillustration, a five per cent sample of the household in a locality can be selected byselecting every twentieth household after all the households are ordered in asystematic manner.Although a systematic sample is not a random sample in the strict sense of the tern,its performance is quite comparable to a random sample. However, if there is ahidden periodicity in the population, systematic sampling will prove to be aninefficient method of sampling. As for illustration, if every twentififth unit of aproduction process is defective a four per cent systematic sample will select alldefective or all non defective items depending upon the starting point. Such anorientation is, however, very rare.Multistage Sampling: The multistage sampling procedure is used for large scaleenquiry covering large geographical area such as a state. As for illustration, a bankmay like to gather information regarding the quality of customer service it is offeringin a state. A random sample of districts is selected from the list of districts. Fromeach of the selected districts a number of branches are randomly selected. From eachof the selected branches a number of depositors which is the ultimate samplesampling unit is selected randomly for collecting information. The districts are calledfirst stage units, the branches are known as the second stage units and the depositorsare regarded as the third stage units. This is an illustration of three stage sampling,the third stage units being the ultimate sampling units.The multistage sampling procedure has the advantage that the frame of second stage
units is necessary only for the selected first stage units. Likewise, the frame of thethird stage units is necessary only for the selected second stage uhits. The procedureis quite flexible and it permits the use of different selection procedures in differentstages. It may also be mentioned that multistage sampling is the only samplingprocedure available in a number of practical situations, such as collecting informationabout consumers in a large geographical region. This is because no satisfactorysampling frame is available for the ultimate stage units, namely, consiJmers and thecost of preparing such a frame is prohibitive.
5.8 SAMPLING DESIGNA Sampling design is a definite plan for obtaining a.sample from a given population.It refers to the technique or the procedure' the business researches would adopt toselect units for the sample. It will also indicate the number of units to be included inthe sample also known as Sample size. Sampling design is determined before dataare collected. While developing a sampling design, the management must payattention to the following points.Type of PopulationThe first step in developing any sampling design is to clearly define the aggregate ofsampling units, namely, the population. Sometimes the structure of the population isquite unambiguous such as the population of a city or the number of workers in afactory. However, there may be occasions where the composition of the population isnot so simple. For example, in the context of advertising a company may like tocollect information about the number of television viewers watching theadvertisement.Sampling UnitThe sampling unit must be identified before selection of a sample. A sampling unitmay be a natural geographical unit such as a state, a district, a village or aconstructed unit such as a L use or a flat. It may be a social entity such as a familyor a school. It may also be an individual. The management should be able to selectappropriate unit so that its objective is achieved.Type of SampleYou have observed in the previous subsections that statiing from simple randomsampling, the business researcher has a wide choice of sampling procedures. Eachprocedure has its suitability for the relevant occasion. The type of frame necessaryalso depends upon the sampling procedure being used. As for illustration, the use ofsimple random sampling will require a comprehensive list of the sampling units.But a two stage sampling will require the list of all first stage units and the list of allsecond stage units in the selected fil'st stage units only.Size of the SampleThere are two basic requirements for the sampling procedure to fulfill. A samplemust be representative and it must be adequate. When it is representative, a samplewill be relatively small piece of the population that mirrors the various patterns andsubclasses of the population. A sample is adequate if it provides an estimator withsufficiently high precision. It should be remembered in this context that the higher isthe precision, the larger is the sample size and more is the cost.An ExampleA market research unit wants to conduct a survey in order to estimate the proportionof smokers smoking a particular brand of cigarette. If it is required to esti mate 'with90% probability within .02 of the true proportion; how many observations should betaken?Suppose, n is the sample size to be determined and p is the observed proportion ofsmokers. Then if the population size is sufficiently large, from section 5.5irrespective of sampling with or without replacement
V = p(l-p)(p) n
The notation P is the unknown population proportion of smokers. Further, asindicated in MS-8, section 14.6 for large n, p is normally distributed with expectationP (unknown population proportion of smokers) and variance V(p). Since theestimator p should be within :02 of the true proportion P with 90% probability
p{lp-pl s .02} = .90
.,'
Sampling and SamplingDesigns
l@J
29

Data Collection andMeasurement
~ i.e.
Le.
{I{; (p - p)1 .02 -..J-;; }
p --I P (1 - P) ::; -V P (1 - P)
P {I Z I ::; ..02~} = .90--Ip (l - P)
.90
= 1:645.yp (l - P>
where z is normally distributed with expectation zero and variance one. From theTable of Normal Distribution (Mustafi, 1981)
.02{;
i.e. n = 6800 P (I-P)
1Since the maximum value ofP (I-P) = -, the sample size necessary is 1700.
4
Activity 8
What should be the size of the sample ( assumed to be large) if in a largeconsignment of items the population propOliion defective is to be estimated within.02 of true value with probability .95?
5.9 NON PROBABILITY SAMPLING METHODS
30
Non probability sampling is the sampling procedure which does not provide anybasis for estimating the probability that each item in the population possesses to beincluded in the sample. In such a case, the sampling error is not measurable and theerror in the estimator tends to increase sharply because the representativeness of thesample members is questionable. Nevertheless, non probability samples are useful incertain situations. This is the case when the representativeness is not particularly theprimary issue. In pretesting a questionnaire, we are interested to ascertain itssuitability for the problem under consideration. Non probability sampling methodscan be used to contact respondents in this case as the primary aim is to probe for thepossible range of answers.
In general, there are three types of non probability sampling that may, underappropriate conditions, be useful in business and government. These areConvenience, Judgement and Quota sampling.
1) Convenience Sampling: Under convenience sampling, as the name implies, thesamples are selected at the convenience of the researcher or investigator. Here, wehave no way of determining the representativeness of the sample. This results intobiased estimates. Therefore, it is not possible to make an estimate of sampling erroras the difference between sample estimate and population parameter is unknown bothin terms of magnitude and direction. It. is therefore suggested that conveniencesampling should not be used in both descriptive and causal studies as it is notpossible to make any definitive statements about the results from such a sample.
This method may be quite useful in exploratory designs as a basis for generatinghypotheses. The method is also useful in testing of questionnaire etc. at the pretestphase of the study. Convenience sampling is extensively used in marketing studiesand otherwise. This would be clear from the following examples.
i) Suppose a marketing research study aims at estimating the proportion of Pan(Seettle leave) shops in Delhi which store a particular drink say Maaza It isdecided to take a sample of size 100. What investigator does is to visit 100 Panshops near his place of residence as it is very convenient to him and observewhether a Pan shop stores Maaza

or not. This is definitely not a representative sample as most Pan shops in Delhihad no chance of being selected. It is only those Pan shops which were near theresidence of the investigator had a chance of being selected.
ii) The other example where convenience sampling is often used is in testmarketing. There might be some cities whose demographic make ups areapproximately the same as national average. While conducting marketing testsfor new products, the researcher may take samples of consumers from such citiesand obtain consumer evaluations about these products as these are supposed torepresent "national" tastes. .
iii) A ball pen manufacturing company is interested iri knowing the opinions aboutthe ball pen (like smooth flow of ink, resistance to breakage ofthe cover etc.) it ispresently manufacturing with a view to modify it to suit customers need. The jobis given to a marketing researcher who visits a college near his place of residenceand asks a few students (a convenient.sample) their opinion about the ball pen inquestion.
iv) As another example a researcher might visit a few shops to observe what brandof vegetable oil people are buying so as to make inference about the share of aparticular brand he is interested in.
2) Judgement Sampling: Judgement sampling is also called purposive sampling.Under this sampling procedure, a researcher deliberately or purposively draws asample from the population which he thinks is a representative of the population.Needless to mention, all members of the population are not given chance to beselected in the sample. The personal bias of the investigator has a great chance ofentering the sample and if the investigator chooses a sample to give results whichfavours his view point, the entire study may be vitiated.However, if personal biases are avoided, then the relevant experience and theacquaintance of the investigator with the population may help to choose a relativelyrepresentative sample from the population. It is not possible to make an estimate ofsampling error as we cannot determine how precise our sample estimates are.Judgement sampling is used in a number of cases, some of which are mentionedbelow.i) Suppose we have a panel of expelis to decide about the launching of a new
product in the next year. If for some reason or the other, a member drops outfrom the panel, the chairman of the panel, may suggest the name of anotherperson whom he thinks has the same expertise and experience to be a member ofthe said panel. This new member was chosen deliberately - a case of Judgementsampling.
ii) The method could be used in a study involving the performance of salesmen. Thesalesmen could be grouped into top-grade and low-grade performer according tocertain specified qualities. Having done so, the sales manager may indicate whoin his opinion would fall into which category. Needless to mention this is abiased method. However in the absence of any objective data, one might have toresort to this type of sampling.
3) Quota Sampling: This is a very commonly used sampling method in marketingresearch studies. Here the sample is selected on the basis of certain basic parameterssuch as age, sex, income and occupation that describe the nature of a population so asto make it representative of the population. The'investigators or field workers areinstructed to choose a sample that conforms to these parameters. The field workersare assigned quotas of the numbers of units satisfying the required characteristics onwhich data should be collected. However, before collecting data on these units theinvestigators are supposed to verify that the units qualify these characteristics.Suppose we are conducting a survey to study the buying behaviour of a product and itis believed that the buying behaviour is greatly influenced by the income level of theconsumers. We assume that it is possible to divide our population into three incomestrata such as high income group, middle income group and low income group.FUliher it is known that '20% of the population is in high income group, 35% in themiddle income group and 45% in the low income group. Suppose it is decided toselect a sample of size 200 from the population. Therefore, samples of size 40, 70and 90 should come from high income, middle income and low income groupsrespectively. Now the various field workers are assigned quotas to select the sample
Sampling and SamplingDesigns
l@J
31

Data Collection andMeasurement
from each group in such a way that a total sample of 200 is selected in the sameproportion as mentioned above. For example, the firs' t field worker may be assigneda quota of 10 consumer from the high income group, 25 from the middle incomegroup and 40 from the low income group. Similarly the 2nd field worker may begiven a different quota and so on such that a total sample of 200 is obtained in thesame propOliion as discussed earlier.The above example was a very simple one, suppose we are told fWiher that thebuying behaviour is not only influenced by his income but also by his age(categorised as 45 and above or below 45). With this additional character, supposethe distribution of population (universe) is as follows:
Table 4 : Distribution of Population (%)
~iI
TO~High Milile Low IIncome Income Incomei ~ . I .[ II Ii~I 45 and above i 12 10 30 I 52 II below 45 I 8 25 !5 48
f
I T~ rI,
]20 35 i 45 ! 100I-~ 1
The above table indicates that in this universe there are 12% of people in the highincome group and fall in the age group of 45 and above, there are 25% people inmiddle income group and below the age of 45 and so on. Suppose, it is decided totake a sample of size 200. Therefore the distribution of the sample conforming tothese two parameters (in the same proportion as population) would be as follows:
Table 5 : Distribution of Sample' (Numbers)
90
I~I High I Mid:lJe I I 1~. Low TOla!
I Age I Income Income ) Income f
I I I45 and above 24
I
I II 20 60I 104below 45 I
,16 50 30 I
I 96 f, I
! i
~_T_Otal J, 4o__--'-__~_IO___L_
32
The above table shows that a sample of 30 should be taken from the population withlow income and below the age of 45. Similarly a sample of 20 should be taken fromthe population with middle income and having age of 45 and above, and so on.Now, having decided the size of sample falling under each of the six cells ["highincome and below 45" "middle income with 45 and above" and so on], we fix thequotas for each of the field worker to collect data conforming to the above norms soas to obtain a total sample of size 200.At the outset, the Quota sampling procedure might look similar to stratified sampling.However, there is a difference between the two. Under stratified sampling, the fieldworker selects a random sample from each cell of the population, whereas underQuota sampling the selection of sample is not random. It is left to the judgement ofthe field worker.The Quota sampling method has some weaknesses. These are listed below:i) It is usually difficult to obtain an accurate and up to date propOliion of
respondent assigned to each cell.ii) As the number of parameters (control characteristics) associated with the
objectives of the study become large, the total number of cells increase. Thismakes the task of field staff difficult as it may not be easy to get a desiredrespondent.
iii) It is very important that all of the proper parameters (control characteristics)related to the study in question must be incorporated while taking a sample. Theresults of the study could be misleading if any relevant parameter is omitted forone reason or the other.

iv) The field workers might like to visit those areas where the chances of theavailability of a respondent satisfying certain desired parameters is very high.Further, the field workers
might avoid certain respondents who look unfriendly and live in houses whichmay not be of good appearance. These factors are likely to make the findings ofthe study less reliable. .
The Quota sampling method has some advantages too. The method has a lower costand field workers have a free hand to select respondents for each cell to fill theirquota. The samples, if selected with care would result into more definitive findings.
Activity 9
Make a list of some researGh studies where some of the non probability methodscould be used. Also justify the choice of a particular sampling method you haveselected for a study.
5.10 SUMMARYA sample is a part of a group or aggregate selected with a view to obtaininginformation about the whole group also known as population. The population iscomposed of a number of units. The total number of units in the population and in thesample are known as the population size and the sample size respectively. Thetechnique of sampling has been used in traditional problems such as estimating theyield of crop or examining the quality of an outgoing product. In addition to thesetraditional spheres, sampling has been applied successfully in management problemssuch as estimation of inventory by sampling or in socio-economic problems such asascertaining the trend of a political process through opinion polls. As compared tocensus or complete enumeration sampling is less expensive, less time consuming andmore accurate. Further sampling is the only method for collecting information whenthe measurement ofthe sampling unit is destructive in nature.
A probabilistic sampling attaches some probability to each unit of the population tobe included in the sample and in this sense it is a representative sample of thepopulation. A simple random sample attaches equal probability to each unit of thepopulation to be selected in the sample. Operationally, the selection of a randomsample is based on a sampling frame containing a list of all the units of populationand a table of random sampling numbers.
When the population is heterogeneous we divide the units into several groups eachknown as a stratum. The strata are so selected that each stratum is as homogeneous aspossible while the compositions of two different strata are as heterogeneous aspossible. The sampling units are selected from each stratum using simple randomsampling. This procedure known as stratified sampling which improves the precisionof the estimator.
Another sampling procedure known as cluster sampling is frequently used inconsumer survey in rural areas where a number of sampling units are groupedtogether as clusters. A number of clusters is selected randomly and the units of eachcluster are completely enumerated. A cluster sample incurs less expenditure andprovides more reliable data. Other sampling methods used in business research aresystematic sampling and multistage Sampling.
A sampling design is a suitable scheme for obtaining a sample from a givenpopulation. It also indicates the size of the sample to be used keeping the cost andprecision in view.
Non probabilistic samplihg such as Convenience Sampling, Judgement Sampling andQuota Sampling are sometimes used although representativeness of such a samplecannot be ensured.
5.11 KEY WORDSSampling is the selection of a part of a group with a view to obtaining informationabout the whole.
Population is the aggregate from which a sample is taken.
Sampling and SamplingDesigns
l@J
33
Data Collection andMeasurement
34
Sampling Units are units or members which constitute the population.
Population size is the total number of units present in the population.
Sample size is the total number of units in the sample.
Simple Random Sample is a sample where each unit of the population has an equalchance of being included in the sample.
Random Sampling Numbers are a collection of digits generated through aprobabilistic mechanism.
A Sampling frame is a list of all the units of the population.
Stratified Random Sample is a sample collected by dividing the entire populationinto a number of subgroups and selecting a simple random sample from eachsubgroup.
Cluster Sample is a sample where a collection or cluster of sampling units isselected randomly.
Systematic Sample is a sample where the units are selected at equal interval.
Multistage Sample is a sample where the sampling units are selected through severalstages.
A Sampling Design is a definite plan for obtaining a sample from a givenpopulation.
Convenience Sampling is a process of selecting a sample based on convenience.
Judgement Sampling is a procedure where the sample is selected through judgementor expertise.
Quota Sampling is a procedure where the sample is selected according to a numberof key characteristics.
5.12 SELF-ASSESSMENT EXERCISES
1) Define Population and Sampling unit for selecting a simple random sample ineach ofthe following cases.
i) Fifty voters of a constituency.
ii) Twenty-five stocks from the Bombay Stock Exchange.
iii) Twenty students enrolled in University' 1T.
iv) One hundred depositors of a branch of a bank.
2) Discuss the advantages of sampling method over census method of datacollections.
3) "Sampling is a necessity under certain conditions." Explain with illustrativeexamples.
4) What is meant by "representativeness" in a Sample? Explain in what sense asimple random sample is representative ofthe population?
5) Show that in simple random sampling without replacement each sample of size
n from a population of size N has a probability of being selected is y(~).
6) What are random numbers? Select with the help ofthe table of random numbersa simple random sample of size ten without replacement from a population of121 households.
7) Discuss the impOitance of sampling frame. What are the possible errors resultingfrom a faulty sampling frame?
8) What do you mean by sampling design ? What points should be taken intoconsideration while developing the sampling design for studying in the problemsof domestic airline passengers?

9) State the formulas for the standard errors of sample mean and sample proportion:Explain how standard error of sample proportion can be used to determine thesample size.
10) What should be sample size so that the proportion of TV owners during the lastone year opting for hire purchase scheme is estimated within an error of .03 withprobability 0.98 ?
11) Under what circumstances stratified random sampling procedure is consideredappropriate? How would you select such a sample? Explain by means of anexample.
12) A certain population is divided into five strata so that N 1 = 2000, N2 = 2000, N3 =
1800, N4 = 1700, Ns = 2500. The respective standard deviations are: (}j = 1.6,
(}2 = 2.0, (}3 = 4.4, (}4 = 4.8 and (}s = 6.0. Further, the sampling cost in the first
two strata is Rs. 4 per interview and in the remaining three strata the samplingcost is Rs. 6 per interview. How a sample of size 226 should be allocated to fivestrata with (i) proportional allotment (ii) optimal allotment.
13) Under what circumstances would you recommend (i) cluster sampling (ii)systematic sampling (iii) multistage sampling (iv) non probability sampling. Givean example in each case.
14) Answer true or false
i) In order to gather opinion about a television show I asked the views of myfriends, the friends asked about the show to their friends and in this way asample is selected. The sampling procedure is judgement sampling.
ii) A cluster sample provides more reliable data because of completeenumeration within a cluster.
iii) A systematic sample can be used even if a formal list of all the units of thepopulation is not available.
iv) The main difficulty with multistage sampling is that we have to preparealong frame.
v) If the population size and the sample size increase in such a manner that thesample size is always one tenth of the population size, simple randomsampling with or without replacement is equivalent.
vi) In stratified sampling with optimum allocation, if the cost of sampling isequal in each stratum then the strata with larger size will always have a largeallocation of sample size.
5.13 ANSWERS
Activity 1
i) Population: All couples living together and whose wife is in the child bearingage group (commonly known as Eligible Couple) with two children.
Sampling Unit: Eligible couple with two children.
ii) Population: All eligible voters for the political office i.e. all adults.
Sampling Unit: Eligible voter.
iii) PoPuIlltion All the trees of the forest.
Sampling and SamplingDesigns
l@J
35

Data Collection andMeasurement
l@JSampling Unit: Tree
iv) Population All the Apple trees in the district.
Sampling Unit: Apple tree.
v) Population All eligible couples.
Sampling Unit: Wife ofthe eligible couple.
Activity 4i) Random No. Remark
selectedSerial No. of theselected student
789 Accept
943 Reject
2 624 Accept
3 402 Accept
4 673 Accept
5 254 Accept
6 758., Accept
7 495 Accept
8 361 Accept
9 793 Accept
10 502 Accept
II 436 Accept
12 342 Accept
049 Reject
13 095 Accept
14 848 Accept
15 570 Accept
ii)I
115
99
49
57
98
24
68
35
16
!O3
42
80
112
95
43
110
No. ofworkers
FactoryNo.selected
iii) If the numbers from 921 ... 999, 000 are not rejected, the students bearing serial
numbers I to 80 have a chance of _9_ of being selected. The remaining students1000
have a chance of _8_ of being selected. So each unit of the population does not1000
have equal probability of being included in the sample.
iv) Random No. Remarkselected
46 Accept !O 6655. 58 Reject
2 27 Accept 3 20303 35 Accept II 14180
70 Reject
4 33 Accept 9 768
Average No. of workers per factory in the sample 5908.25
36 Average No. of workers per factory in the population 3118.08

Activity 5
i) The frame of all eligible couples with more than two children should be obtainedby census method.
ii) The frame is the voters list which is the list of all adults.
iii) Each tree in the forest should be serially marked. The marked trees form thesampling frame.
iv) Each apple tree in the district is serially marked. The marked apple trees form thesampling frame.
v) The frame of all eligible couples should be obtained by census method.
Activity 6
51Estimate = --
300
Estimate ofthe standard error
a) With replacement = .0217
b) Without replacement = .0206
Activity 7
i) n] = 250, nz = 125, n3 = 75, n4 = 50.
ii) n]=261, nz = 82, n3 =113, n4 = 44.
Activity 8
n = 2401
Self-assessment Exercises
1) i) Population: All the voters.
Sampling unit: A voter.
ii) Population: All the stocks listed in Bombay stock exchange.
Sampling unit: A stock.
iii) Population: All the students enrolled in the University '1'.
Sampling unit: A student.
iv) Population: All the depositors ofthe branch.
Sampling unit: A depositor.
5) Suppose PI, pz, ...... PI1 be any n units of population. The probability that the firstunit selected is PI> .... , nth unit selected is Pn when the sampling is withoutreplacement is given by
1 1 1 1-x--x--x .......x---N N-l N-2 N-n+l
(N-n)!
N!
But any permutation of PI> pz, ... pn will result in an identical sample. Hence, theprobability of selecting the sample whose composition is (PI> pz, .. "PI1) is
Sampling and SamplingDesigns
~
(N-n)! n!
N!
1
C)10)n=1508'
12) Proportional Allocation
nl = 45, nz = 45, n3 = 41, n4 = 38, n5 = 57 37

Data Collection andMeasurement
38
Optimal Allocation
nl = 22, nz = 28, nz = 45, n4 = 46, ns = 85
14) i) False, it is Convenience Sampling.
ii) True.
iii) True.
iv) False, the sampling frame of the second stage units are required only for theselected first stage units.
v) False, n!N = 1/10.
vi) False, the sample size will depend upon both the stratum size and the stratumstandard deviation.
5.14 FURTHER READINGS
Ferber, R. and PJ. Verdoom, 1962. Research Methods in Economics and Basiness,Macmillan: USA.
Haber, A. and R. P. Runyon, 1972. General Statistics, Addison-Wesley: USA.
Kothari, C.R. 1985. Research Methodology Methods and Techniques, Wiley Eastern :New Delhi.
Mustafi, c.K. 1981. Statistical Methods in Managerial Decisions, Macmillan: NewDelhi.
Singh, D. and F.S. Chaudhary, 1986. TheOlJ! and Analysis ofSample Survey Designs,Wiley Eastern: New Delhi.
Tull, DS and G.S. Albaum, 1973. Survey Research a Decisional Approach, IntextEducational Publishers: USA.


UNIT 6 ATTITUDE lVIEASUREl\IENT ANDSCALES
Objectives
After reading this unit, you should be able to :
• describe the type of managerial research problems which utilise the tools ofattitude measurement:
• discuss the type of issues which come up when one attempts the measurement ofattitudes:
• explain the different attitude measurement scales, alongwith their strengths andlimitations:
• decide for which type of research problems ~ne should go in for specific scale orthink of using multidimensional scaling.
Structure
6.1 Introduction
6.2 Attitudes, Attributes and Beliefs
6.3 Issues in Attitude Measurement
6.4 Scaling of Attitudes
6.5 Deterministic Attitude Measurement Models: The Guttman Scale
6.6 Thurstone's Equal-Appearing Interval Scale
6.7 The Semantic Differential Scale
6.8 Summative Models: The Likert Scale
6.9 The Q-Sort Technique
6.10 Multidimensional Scaling
6.11 Selection of an Appropriate Attitude Measurement Scale
6.12 Limitations of Attitude Measurement Scales
6.13 Summary
6.14 KeyWords
6.15 Self-assessment Exercises
6.16 Further Readings
6.1 INTRODUCTIONThere are a number of management decisions which are taken in an organisation,from time to time. The decisions may relate to the acquisition or disposal ofmaterials/machines, manufacturing or marketing of products, hiring or firing ofemployees, opening or closedown of plants, promotion or reversion of personnel, andso on. Some of these decisions may rely on data for which the units of measurementare capable of statistical manipulation. Such data largely refer to quantifiableparameters or numerical properties of a given population. However, there areillustrations of other decisions which may rely primarily on behavioural data or datawhich is statistically not manipulatable, in the strict sense of the word. The units ofmeasurement of such data are not interchangeable and are not susceptible to rigorousstatistical analysis. The major area of utilisation of such data lies in the discipline ofmarketing where the-manager is interested in knowing the attitudes of the CUlTent andpotential users of his/her product or service towards his/her product or serviceconcept or idea. This knowledge of attitudes could result in decisions which would besensible and effective. Some illustrations of managerial decisions which rely onattitude measurement are product positioning and market segmentation, advertising 39

Data Collection andMeasurement
~
40
message decisions etc.
6.2 ATTITIJDES, ATTRIBUTES AND BELIEFSBefore one phmges into the topic of attitude measurement, it will be worthwhile tounderstand the key tenus which figure repeatedly in this topic.Each object/product/service is believed to be composed of certain characteristicswhich fulfil certain needs of its user. These needs may be of psychological, physicalor social nature. The characteristics of the object lUlder consideration are caned itsattributes. The tenll belief refers to judgements made by a user regarding the objectpossessing certain attributes or not. Finally, the tenu attitude refers to thepredisposition/mental state of individuals/users towards a productfidea/attributes ofan object. It also implies the mental readiness to act in a particular manner andinfluences the individuals's behaviour towards the object/grouplorganizationlpersonunder consideration. The salient factors that go into the building of the overallattitude of the individual towards the object are a) hislher beliefs about the attributespossessed by the object, b) hisl11er preference or othenvise for those attributes .. and c.)the relative importance of each attribute to the individual's. decision making process.
6.3 ISSUES IN ATTITUDE l\IEAS1JREl\iIENTMeasurement implies the process of obtaining infoll11ation which can be subject toanalysis. Attitude mea~;urement relates to the process of measuring an individual'sattihlde towards an object. "Vhen we go for measurement of attitudes or any otherparameter, one has to clearly sort out the following:• "what" has to be measured?• "who" is to be measured?• the accuracy desired in the measurement• the costs pemllssible• the choices available in the measurementldata collection techniques.In attitude measurement, the researcher is primarily interested in measming the "stateof mind" of the respondent (s). It may include factors such as awareness.. attihldesand decision processes. An interesting characteristics of these measures is that theirverification is rather difficult. There is no \.vay to determine \.vhether the answer givenby a respondent to the level of liking for a new prochlct, such as ice-cream mix,represents the "truth" or not. The researcher, unless he is a "telepathist". cannotactually observe the states of mind like preference.. likes and dislikes .. etc. Such thingscan only be infened.It has been stated in the previous section. that attitudes are affected by attributes andbeliefs. So, the first step, before embarking on an attitude-measurement exercise.. isselecting the relevant attributes of the o~iect under investigation. For instance. thesalient attributes of a product like "Shrikhand" may be price, shelf life, t1avouL andpack size. For a public distribution system they may be quality of grains, prices.outlet working timings, and assurance of availability. It is dearly impossible tomeasure every att1ibute of the process/object lmder consideration. The researchershould settle for the relevant ones only. It is advisable to measure only thoseattributes \vhich can be related to actions by the respondents. Exploratory researchcan be helpful in identifying attributes. The methods used could include nondisguisedones like depth interviews and disguised ones like projective techni.ques. The depthinterviews are the most commonly used technique. They use no structured frameworkfor gathering infol1uation. The respondents are. encouraged to talk about the objectunder investigation and the investigator tries to uncover its salient attributes in thisprocess. This procedure requires skilled investigators. It is also considered costly andthe results are prone to bias errors. The projective techniques attempt to uncover theinformation from the respondent in an indirect manner. The subject is requested torespond to incomplete stimuli here. In doing so.. he/she is believed to reveal elementsof attitude towards the object that \.vill not be revealed in response to direct queries.The projective techniques used may include a cartoon test, word association test.sentence completion test, etc. Though these techniques also have somedisadvantages, they are used more than the nondisguised methods.
The next important issue in attitude measurement is that "who" is to be measured. Itinvolves people. The question to be posed now is of what kind ? Their education.age, sex.. occupation, religion etc. may have a beming on the choice of the
measurement method. The measurement procedure must be designed with thecharacteristics of the respondents under consideration. For instance, using a mailquestionnaire for disinterested or hostile respondents would hardly be the right choiceas a research instrument.The third major issue in attitude measurement is the choices in data collection andmeasurement tec1miques. The data collection techniques can be categorised into (a)Questi01maire methods, and (b) Observational methods. Usually questionnaires areused for measuring the attitudes.The approaches for measuring attitudes are as follows:1) Self-rep01i inventories2) Using psychological measures like galvanic skin response or pupillary response3) Projective techniques like thematic a perception test.The self-report inventories, also known as attitude scales, involve presenting thesubjects with a list containing favourable and unfavourable statements about theresearch topic and ask whether they agree or disagree with each of them.Most attitude measurement methods use the self-report technique. However theydiffer in tenllS of the way the scales are constructed and used.
The weaknesses of the self-report measures are that:1) The results are limited to what the individuals know about their attitudes and are
willing to relate,2) The validity of the verbalised attitudes is questionable.We will be discussing some of these scales, alongwith their characteristics, in thesubsequent sections of this unit.Finally, the last major issue for a managerial researcher here relates to the costs andaccuracy desired in the measurement. As has been stated earlier, these type ofmeasurements are never entirely free of inaccuracy. Moreover, cost and accuracy aregenerally reciprocal properties in measurement. The intimate knowledge of aresearch instrument can go a long way in the conect interpretation of the results.
Activity 1List out the salient attributes of the following products.
Altitude Measurement andScales
Is, N. Product
I l) Toilet SoanI '"
Attributes
....................................................................................
.............................................................................. , .....
.....................................................................................
2) Toothpaste ....................................................................................
....................................................................................
... ~ .
I') :ri:~
I
........................................................................................
.....................................................................................
......................................................................................
......................................................................................
...................................................... h ••••••••••••••••••.•••••••••••
i 4) Colour TV ........................................, , , .
..............................' .
.................................................. , .
........................................................................................
41

Data Collection andMeasmement
5) Shoes•• "" ~ •·•••••••• 0 o,~ _••••••••• eO _ ••' "'. 0',
............................... +0 .
...................................................._. ., _- .
- - •••• 0 - ~ 0 0 _. ~ ••••••• o •• o " •••••
6) Camera
Activity 2
.............................................................. .............." .
-- .
• 00 " •••_, •• , ' , .• ~ ••••••• " '" , .
..... .,. ~., .- ~.'.".' ,g S >-s, .go- g' a>- ••••••••
42
You may conduct depth interviews to identify attributes of the products mentioned inActivity 1. Compare it \vith the one you have already listed out in Activity 1.
Activity 3
List out the tlu'ee important issues in attitude measurement.
6.4 SCALING OF ATTITUDES
Researchers in management have dipped into the bag of tricks of sociologists andpsychologists to develop the teclmiques for measurement of attitudes. Basically. whatis done here is to con11:ont the respondent with a number of favourable andunfavourable statements about the subject and find out the extent of his/heragreement or disagreement with them. The object here is, to measure people's attitudeto ideas, products or service. The scales are usually highly structured. The underlyingassumption in attitude scaling is that attitudes determine opinions and decisions aboutthe product/service/idea. To understand the human behaviour. and to influence it in agiven direction, it is necessmy to understand the opinions and the basic attitudesunderlying them.
There are many types of scales and scaling techniques. \Ve have to choose the mostappropriate technique to suit the research being done. The statements containedtherein have to be prepared in such a way that the answers received can easily beconverted into numerical values. The three most commonly used scales are theNominal scale. the Ordinal scale and the Interval scale. You will note later on that theappropriateness of a statistical method depends upon the type of scale used in datacollection.
I) Nominal Scale : The nominal scale simply allows the categorization ofresponses into a number of mutually exclusive categories. There are 110 relationshipsbetween the categories. implying that there is no ranking or ordering. The typicalapplications of the nominal scale is in classification of responses by social class."like" or "dislike". "yes" or "no". sex, and so on. The statistical operation possible fornominally scaled data is counting only.
2) Ordinal Scale : The ordinal scale.. allO\vs the respondents to rank some

altematives by some common variable. An illustration of this would be the ranking ofthree brands of pasteurised milk by a group of consumers on the basis of theperceived quality. Here it is feasible for a user of the product to rank the brands fromthe best to the worst. However the amount of difference between the ranks cawlOt befound but. It is only possible to compute positional statistical measures like medianand. mode for such data.
3) Interval Scale: The deficiencies of the nominal and the ordinal scales are takencare of in the interval scale. The scale has an arbitrmy zero point with numbersplaced at equally appearing intervals. A number of statistical operations includingaddition, subtraction, and computation of the mean can be done on intervally scaleddata.
Mostly the nominal and the ordinal type of scales are used in attitude measurement.However, there are attempts to treat them or conveli them into interval scales so as tomake the data more amenable to statistical operations. But the reasonability of thisassumption should be always tested before making inferences.
Most of the attitude measurement scales used are ordinal in nature, though there isattempt to treat the resulting data as intervally scaled. The simplest possible type ofsuch scale has the respondent classifying the object/issue/product/himself into oneamong two dichotomous categories. Further refinements may include the provision ofadditional altematives denoting the degrees of liking or disliking. These are listed insequence so that the altematives fonn a type of scale. These scales are basically selfreport inventories, with a list of favourable and unfavourable statements towards thesubject.
The attitude measurement scales can be categorised into those which areunidimensional in nature and those which are multidimensional. The different type ofsingle dimensional attitude measurement scales \vhich are available are graphical andnumerical scales. slUlUnated scales, paired comparisons, equal-appearing intervals,etc. Some scales of the above-mentioned type will be discussed in the subsequentsections of this unit.
Activity 4
Identify the scale to which the following statements/responses belong.
Attitude MeaslU'ement andScales
S.No. Statement/Response
l) Cleaning ability of various floor polish brands
2) The classification of super-markets by "carry ourbrand" versus "do not carry our brand"
3) Awareness of four print advertisement
4) Does your car has radial tyres - yes or no?
5) The fahrenheit scale for measuring temperature
6) Assignment of number of basketball players
7) T.V.A looks better than T.V. B
Scale
6.5 DETERIVIINISTIC ATTITUDE lVIEASURElVIENTJ.\;IODELS: THE GUTTlVIAN SCALE
In the detenninistic attitude measurement techniques the underlying assumption isthat each statement has a perfect relationship, of one type or another, with theparticular dimension of the attitude being investigated. For instance, let us consider aresearch study where one is interested in investigating a community's attitude tofamily planning. The items in the questionnaire which relate to this could consist ofthe following:
1) Family planning is the best hope for our countly
2) Family planning would lead to healthier children
3) We should all participate in the family planning programme.
Yes No
43

Data Collection andMeaSlU'ement
l@J
44
Usually a person who answers YES to 1, \vould have a high probability of ans1,veringas YES to the subsequent statements, Any person who does not answer as YES to 1but does answer as YES to 2 would have a high probability of answering YES to thelater items, Any set of items that produces a pattem of responses as we havedescribed here is called a Guttman Scale.
Guttman scale analysis is usually applied to dichotomous data, i,e., data with onlytwo values, YES or NO, 0 or 1, agree or disagree, etc. However, a number of reasonshave made the Guttman scale and impractical tool for the measurement of attitudes.First, the constmction of the scale requires a lot of time and effort. Secondly, theremay be velY few items existing that may fit the model. Since such scales seldom havemore than eight items, they can make only rather gross distinctions amongrespondents.
Activity 5
Define Dichotomous data,
Activity 6
Mention two reasons which make Guttman scale an impractical tool for themeasurements of attitudes.
6.6 THURSTONE'S EQUAL-APPEARING INTERVALSCALE
In this scale we are interested in scaling respondents and not statements. The firststep in the scale constmction is to scale the attitude statements along the attitudecontinuum, This is done by asking some "judges" to evaluate the items along somecontinuum,
The statements are printed on some cards and the judges are asked to smt thestatements into 11 groups, The extreme piles represent the most favourable and themost unfavourable statements. The judges are expected to make the intervals betweenthe groups equal. The mean rating by judges is taken as the scale point for each item,Items which are found to be ambiguous or irrelevant are dropped. The items selectedfor the final scale are such that (a) each item has a small standard deviation of ratingsover judges and (b) the mean ratings spread evenly from one end of the ratingcontinuum to the other, The selected items are listed in a random order to form thefinal scale,
The administration of the scale for the measurement of the attitude of a respondentneeds the latter to mark only the items with which he/she agrees, The score for therespondent then is taken as the scale value of the median item endorsed or theaverage scale value of the items endorsed, For instance, suppose a respondent agreeswith items which have scale values as 9, 10, and 11. This would imply that he has at:-lVourable attitude to the object (assuming that score of 11 implies most positiveattitude !),
The Thurstone scales are prepared with an odd number of positions, the usual numberbeing 11, The scale has some drawbacks such as the time requirement being fairlyhigh, the influencing of scale positions by the attitudes of the judges. and noinformation on the degree or intensity of agreement with the different items,

Activity 7
Construct a Thurstone's equal-appearing interval scale for a bank interested inknowing about its image in public by developing a number of statements relating toits service, location and timings, etc.
6.7 THE SElVIANTIC DIFFERENTIAL SCALE
The tell11 Semantic differential scale refers to any collection of rating scales anchoredby bipolar adjectives. It is a very flexible approach to obtaining measures of attitudes.The, object that is rated is called the "concept" and almost anything can be ratedincluding family plalU1ing, cosmetics, Shrikhand, political parties, etc.
107nally, a semantic differential scale is based on a seven-point rating scale for eachof a number of attributes relating to the research topic. The extreme point representthe bipolar adjectives with the central categolY representing neutral. In the semanticdifferential scale only the extremes have names. The in-between categories haveeither blank spaces or sometimes a number. Some examples of the scale are asfollows
Good Bad
Honest Dishonest
Progressive Behind the times
The preparation of a semantic differential scale for a study requires expressing thethings that could he used to describe the object. and thus serve as a bets for attitudeformation, in terms of positive and negative statements. The negative phrase issometimes put on the left side of the scale and sometimes on the right. This preventsa respondent with a positive attitude from simply checking either the left or righthand sides without reading the describing words.
The scale can be used for a variety of purposes. 11 can be used to check 'whether arespondent has a favourable attitude towards the object, which out of threeneighbourhood banks has the most appealing profile for housewives, etc.
It is possible to assign points to individual cells in the scale. Then one could anive atthe scores for comparisons of different objects. The Figure 1 gives an example basedon image study of three neighbourhood banks among a sample of 100 housewives.
Attitude Measurement andScales
Modem
Progressive
'Friendly
aIIlI~ere
Helpful
StaffReliable
Quick service
Clean
A : Bank A B: Bank B C: Bank C
Old fashJoned
Behind the times
Unfriernlly
UI'!leJpful
StaffUnreUable
Slow selVice
Dirty
FIg. I Average ratings based on consumers attitude towards neighbourhood banks
45

Data Collection andMeastuE'"ment
l@J
46
The study shown in Fig.1 indicates to a bank manager those aspects in the bank'simage which are relatively weak or strong in the eyes of the customers, vis-ii-vis whathe/she was plmming to achieve mId how this bank compared the other twoneighbourhood banks. The image profiles are based on the scores of each respondenton each dimension and the average total scores tor all respondents provides an indexof the overall image rating. The maximum score possible for each bml1\. is +21 andminimum possible score is -21. The bank A scored +10, bank B -8, and bml1\. C - 4.These scores are based on each attribute having the same \veighting factor of 1.However, in case the researcher \vants to weigh the attributes in a different way, it isfeasible. This may lead to different image score for the rival banks. For the managerof bank A, we can conclude that the attributes which need immediate attention areservice reliability, followed by modemisation and staff attitudes towards thecustomers.Acthity 8Use semantic differential technique to develop the profile of three talcum po\vderproducing companies in India.
6.8 SUMMATIVE lVIODELS: THE LIKERT SCALEThe summative models assume that the individual items in the scale aremonotonically related to the underlying attributes and a summation of the item scoresis related linearly to the attitude. In a summative model, one obtains the total score byadding scores on individual items. For the statements that imply negative attitudes,the scoring is reversed. The scales allow an expression of the intensity of feeling.These scales are also called Likert scales. Here, instead of having just "agree" and"disagree" in the scale, we can have intensities vmying from "strongly agree" to"strongly disagree".The scale construction consists of the following steps:1) Write a large number of statements that-concem the particular attitudinal object
being investigated. For instance one may be looking at the role of voluntaryagencies in providing health services in rural areas. Most of these statementsshould either be moderately positive or moderately negative. Neutral items aregenerally avoided in these scales. The items should be evenly divided betweenpositive and negative statements.
2) Administer the pool of statements on a group of respondents who are similar tothe population on whom the scale will be used. For example, if we want to studythe attitude of housewives the pool should be administered on a group ofhousewives with similar background to our final population.
3) Assign scale values to the degrees of agreement or disagreement with each item.The particular values may differ fiom one researcher to another, Sometimes onemay adopt the values 1,2,3,4,5 and sometimes +2, +1.. 0, -1. -2. For negativeitems the directions should be reversed.
4) Calculate a total attitude score for each respondent using the same scalingprocedure, The distribution of total scores is then used to refine the list of items.This step is called item analysis.
5) Item analysis : Analyse the responses and select for the scale those items whichmost clearly differentiate behveen the highest and lowest scores. This can be done bydividing the respondents into the high and the low scoring categories, The highscorers can be assumed to be with favourable attitudes and the low scorers can betaken as having the least t~Tvourable attitudes. If the statement is a good one. then it issafe to expect that the mean score for the favourable group would be greater than themean score lor the unfavourable group, If the mean scores across the hvo groups, foran item, are found nearly equal or equal, then that statement can be dropped from thescale. One can take the high group as the top twenty-rave per cent of all total scoresand the low group as
the lowest twenty-five per cent. Altematively we can divide the respondents intoAttitude Measurement and qualiiles and compute the median score for each itemfor the highest twenty-five per cent States and the lowest twenty-five per cent ofscale scores.
6) The statements remaining in the pruned fast are randomly_ordered on the scaleform. The positive and negative ones are mixed.
7) The scale is now administered on the respondents who are asked to indicate theirdegree of agreement with the items. A respondent's total score is generated as thesum of his scores on each statement.
The summated scales have certain advantages. They are easy to construct, are highlyreliable, and can be adapted to the measurement of many different kinds of attitudes.
Activit~' 9
How would you use a Likert scale to asceliain the image of Colgate toothpasteamong some consumers ?
6.9 THE Q-SORT TECHNIQUE
The Q-SOli technique grew out of a more general methodology for the study ofverbalized attitudes, preferences etc. The peculiar characteristic of this methodologyis that here it is more important to make comparisons among different responseswithin respondents than benveen respondents. Thus it is a comparative rather than anabsolute rating method.
In the area of management, the application of Q-sort has come up in marketingresearch. Here the respondents may be requested to emmciate their images of theirideal brands, specified brands and their CUlTent brand. The respondent may be given alarge number of statements (50-100) describing the characteristics of a product. Forinstance for a cosmetic product like shampoo he may be asked to comparealtematives with adjectives like "easy_ to use", "economical", and "safe for children",with instructions to alTay them along the continuum "least prefelTed - the idealshampoo". Essentially what the respondents have done here is to alTay the attributesalong the scale.
The Q-sOli technique is faster and less tedious for subjects than paired comparisonmeasures. It also forces the subject to conform to quotas at each point of the scale soas to yield a normal or quasi-normal distribution.
The utility of Q-sort in marketing research is to derive clusters of individuals whodisplay similar preferences, thus representing unique market segments. The objectiveof Q-sort, thus, is intensive study of individuals.
6.10 l\HJLTIDIlVIENSIONAL SCALING
In the attitude measurement scales which have been discussed till no\\' the object ismeasured against each characteristic, one at a time. The measurement process tellslittle about the relative impOliance of different characteristics or how thecharacteristics relate to each other. \\Then these aspects become important. one takesrecourse to multidimensional scaling. It is a term used to describe a group ofanalytical techniques used to study attitudes, specially those relating to perceptionsand preferences. These techniques attempt to identify the object attributes that areimportant to the respondents and to measure their relative importance. The majorapplication of multidimensional scaling in managerial research comes in marketingreseai'ch. Some·of the uses \vhich have already been illustrated in the literature are asfollows:
Attitude Measurement andScales
47

Data Collection andMeasmement
l@J
48
Advertising : It has been applied here to answer questions such as: Which mediashould be used for getting the desired reach? If written media is selected then whichmagazines newspapers to advertise in ?
Market Segmentation Vendor Evaluations
A detailed discussion of Multidimensional Scaling is outside the purview of this unit.Generally the use of this method requires the use of a computer and a number ofcomputer programmes, both on pes and the larger systems are available. For adetailed discussion on Multidimensional Scaling, please refer Handbook ofMarketing Research, Robeli Ferber (eel.), pp. 3-44 to 3-61.
6.11 SELECTION OF AN APPROPRIATE ATTITUDE~IEASURE:MENTSCALE
We have examined in the earlier sections a number of different techniques which areavailable for the measurement of attitudes. Each has some strengths and someweaknesses. Almost every technique can be used for the measurement of anycomponent of attitudes. But at the same time all techniques are not suitable for allpurposes. Then selection of the scale depends on the stage and the size of theresearch project. The costs of developing and implementing the instrument, reliabilityand validity of the instrument and the statistical analysis necessary.
Generally, Thurstone's scale, Q-sort and the Semantic differential scale are prefelTedfor preliminmy investigation. The Likeli scale is used for item analysis. For specificattributes the semantic differential scale is velY appropriate.
Overall the semantic differential is simple in concept and results obtained arecomparable with more complex, one dimensional methods. Hence, it is widely used.
6.12 LIIVIITATIONS OF ATTITUDE ~IEASUREIVIENT
SCALES
The main limitation of these tools is the emphasis on describing attihldes rather thanpredicting behaviour. This is primarily because of a lack of models that describe therole of attihldes in behaviour.
6.13 SU~lMARY
\Ve have briet1y examined the role of attitude measurement and scales in managerialresearch. We started by looking at the type of managerial decisions which needquantification of attitudinal data. Subsequently. we defined some key terms such asattributes, beliefs and attitudes. This was followed by a discussion on the criticalissues in attitude measurement. Then the different types of scales, viz.. nominal,ordinal, and interval, which feature in this field, \vere described. This was followedby five impoliant tools/scales of attitude measurement. viz., Guttman, Thurstone'sequal-appearing interval, Semantic Differential, Likert's and the Q-sort technique.Simultaneously, the steps in scale construction and their use were also highlighted, Abrief discussion of multidimensional scaling followed. Finally, the issues of theselection of an appropriate attitude measurement scale and the limitations of theseresearch tools were discussed.
6.14 KEY \VORDS
Attributes: Characteristics of the object, tinder investigation,
Beliefs : Judgements made by a user regarding the object possessing certainattributes or not.
Attitude: Predisposition of individuals) towards the attributes of an object.
Measurement: The process of obtaining infonnation, which can be subjected toanalysis.

Scale: A collection of statements \"vhich can be used for measuring attitudes.
Respondent/Subject : Person on whom an attitude measurement scale isadministered.
Bipolar adjectives: A pair of words which have opposite meanings.
6.15 SELF-ASSESSlVIENT EXERCISES
1) What do you understand. by the tenus attitude and attitude measurement ?Explain.
2) Which type of managerial research and decisions utilise attihlde measurement?Explain with examples.
3) Review briefly the different types of issues in attitude measurement.
4) Compare and contrast the various attitude measurement teclUliques. When willyou use each of them? Discuss briefly.
5) In which type of Shldy will you use multidimensional scaling? Discuss.
6.16 FURTHER READINGS
Bailey, Kenneth D., 1978,lvfethods 0/Social Research, The Free Press, New York.
Churchill, Gilbert A., 1983, Marketing Research: Methodological Foundations, TheDryden Press. New York.
Nunally, Jum C., 1978, Ps.vchometric Theory, Tata McGraw-Hill, New Delhi. Feber,Robert 1974, Handbook o/lvlarketing Research, McGraw-Hill, New York.
Meister, David, 1985, Behavioural Ana~}'sis and Aleasurement kfethods, John Wiley,New York.
Rodger, Lesile W., 1984, Statistics/or Alarketing, McGraw-Hill (UK), London.
Boyd, H.W., Westfall, Ralph, and S.F. Statch, 1986, Marketing Research: Text andCases, Richard D. Invin, Illinois.
Aaker, David A. and George S. Day, 1983, Marketing Research, John Wiley; NewYak. Luck, D.l, et aI., 1978, Marketing Research, Prentice Hall (India), New Delhi.
Lundstrom, William J.;et. al. November 1976. "The development 0/ a scale tomeasllre consllmer discontent ", Journal of Marketing Research, Vol. 13, pp. 373-381.
Balasubramanian, Siva K. and Wagner A. Kamakura, August, 1989. "j\1easuringConsllmer attitudes t01l'ard~ the market place with tailored il/tell'iew", Journal 0/Marketing Research, Vol. 26, pp. 311-326.
Attitude MeaS1u-ement andScales
49


UNIT 7 DATA PROCESSING
Objectives
After studying this unit, you should be able to:
• explain the significance of data presentation
• describe various types of data classification
• develop appropriate data tabulation and presentation devices.
Structure
7.1 Introduction
7.2 Editing of Data
7.3 Coding of Data
7.4 Classification of Data
7.5 Statistical Series
7.6 Tables as Data Presentation Devices
7.7 Graphical Presentation of Data
7.8 Summary
7.9 Self-assessment Exercises
7.10 Further Readings
7.1 INTRODUCTIONThe data collected from the field has to be processed and analysed as laid down in theresearch plan. The processing of data primarily mean editing, coding, classificationand the tabulation of the data collected so that they are amenable to analysis. In thisunit, therefore, we shall concentrate on the various aspects of processing of data.Further, the presentation of data can be either in tabulation forms or through charts.In Unit 6, Block 2 (Data Collection and Analysis) of Quantitative Analysis forManagerial Applications (MS-8), you have been introduced to the basic concepts ofpresentation of data. You are, therefore, advised to refer to it for better understandingof this unit.
7.2 EDITING OF DATAThe editing of data is a process of examining the raw data to detect errors andomissions and to correct them, if possible, so as to ensure completeness, consistency,accuracy and homogeneity. This will facilitate coding and tabulation of data. In fact,the editing involves a careful scrutiny of the completed questionnaires.The editing can be done at two stages: field editing and central editing.Field editing : The field editing consists of review of the reporting forms by theinvestigator for completing or translating what the latter has written in abbreviatedform at the time of interviewing the respondent. This form of editing is necessary inview of the writing of individuals, which vary from individual to individual andsometimes difficult for the tabulator to understand. This sort of editing should bedone as soon as possible after the interview, as it may be necessary sometimes torecall the menlOry. While doing so; care should be taken so that the investigator doesnot correct the errors of omission by simply guesing what the respondent would haveanswered ifthe question was put to him.Central Editing : Central editing should be carried out when all the forms ofschedules have been completed and returned to the headquarters. This type of editingrequires that all the forms are thoroughly edited by a single person (editor) in a smallfield study or a small group of persons in case of a large field study. The editor maycorrect the obvious errors, such as an entry in a wrong place, entry recorded in dailyterms whereas it should have been recorded in weeks/months, etc, Sometimes, 5

Data Presentation and Analysis
l@J
6
inappropriate or missing replies can also be recorded by the editor by reviewing theother information recorded in the schedule. If necessary, the respondent may becontacted for clarification. All the incorrect replies, which are quite obvious, must bedeleted from the schedules.
The editor should be familiar with the instructions and the codes given to theinterviewers while editing. The new (corrected) entry made by the editor should be insome distinctiv~ form and they be initialed by the editor. The date of editing may alsobe recorded on the schedule for any future references.
Activity 1
Define the following
a) Field editing
b) Central editing
Activity 2
Your organisation is conducting a survey to determine the consumption pattern offood items by households in Delhi. You are the head of computer divisionresponsible for editing the raw data from the questionnaires and analysing the same.A filled up set of questionnaires have been sent to you. List out the points on whichyou would like to concentrate while editing the raw data.
7.3 CODING OF DATA
Coding is the process of assigning some symbols (either) alphabetical or numerals or(both)to the answers so that the responses can be recorded into a limited number ofclasses or categories. The classes should be appropriate to the research problem beingstudied. They must be exhaustive and must be mutually exclusive so that the answercan be placed in one and only one cell in a given category. Further, every class mustbe defined in terms of only one concept.
The coding is necessary for the efficient analysis of data. The coding decisionsshould usually be taken at the designing stage of the questionnaire itself so that thelikely responses to questions are pre-coded. This simplifies computer tabulation ofthe data for further analysis. It may be noted that any errors in coding should beeliminated altogether or at least be reduced to the minimum possible level.
7.4 CLASSIFICATION OF DATA
In most research studies, voluminous raw data collected through a survey need to bereduced into homogeneous groups for any meaningful analysis. This necessitatesclassification of data, which in simple terms is the process of arranging data in groupsor classes on. the basis of some characteristics. Classification helps in makingcomparisons and drawing meaningful conclusions. Classification can either beaccording to attributes or according to numerical characteristics.

In case of classification according to attributes, the data is classified by descriptivei.e. sex, caste, education, land holding, etc. The descriptive characteristics refer toqualitative phenomenon which cannot be measured quantitatively, only theirpresence or absence in an individual item can be observed. This classification caneither be simple or manifold. In case of simple classification, also referred to asclassification according to dichotomy, each class is divided into two sub-classes andonly one attribute is studied, such as employed or unemployed, resident or nonresident, married or unmarried, etc. In case of manifold classification, more than oneattributes are considered, and therefore, the classification leads to the formation of anumber of classes and sub-classes. For example, industries may be classed asbelonging to public sector or private sector. Among .each of these broad classes, therecan be a second level classification in terms of large and small, which can further beclassified (third level) as profit making and loss making, and so on. This process ofsubclassification is carried keeping in view our basic purpose for which theclassification is required. The objectives have to be clearly defined before theclassification can be carried out. Further, the attributes should be defined in such away that there is least possibility of ambiguity concerning the said attributes.
Data Processing
~
When individual observations possess numerical characteristics, such as height,weight, marks, income, etc, they are classified on the basis of class intervals . Forexample, persons whose monthly income is between Rs. 1001 and Rs. 1500 mayform one group, those whose income is within Rs. 150.1 and Rs. 2000 may formanother group, and so on. In this manner, the entire data may be divided into anumber of groups or classes, which are usually called class-intervals. The number ofitems in each class is called the frequency of the class. Every class has two limits: anupper limit and a lower limit, which are known as class limits. The differencebetween these two limits is called the magnitude of the class or the class interval.Several aspects of classification of data has been detailed in Unit 6 (Presentation ofData), Block 2 (Data Collection and Analysis) of Quantitative Analysis forManagerial Applications (MS-8). You are advised to refer to that study material.
Activity 3
1060,1370,2375,1470,2250,
1200,2190,1800,2255,2000,
945,2240,1700,1165,1945,
Following data refer to monthly salary of 40 employees of an organisation. Tabulatethe data using the inclusive and exclusive methods:
1060, 1310, 1255, 750, 1690,2125, 2120, 1190, 1120, 2130,1440, 2560, 870, 2000, 1870,1940, 2250, 1460, 1750, 1875,2060, 2135, 2125, 1760, 1650,
7.5 STATISTICAL SERIES
A series is defined as a logical or systematic arrangement of observations or items.When the attributes or things are counted, measured or weighed and arranged in anorderly manner, say either discending or ascending order, they constitute a series.When the statistical data pertains to time, the series is said to be historical or timeseries. The important factor in such series is the chronology. When the data pertainsto space, the series is referred to as spacial, and is also known as geographical series.When the data refers to physical conditions such as height. weight, age, etc., theseries is referred to as condition series. The following series, for example, refers tospecial series of regionwise sales of a firm during 1989-90.
7
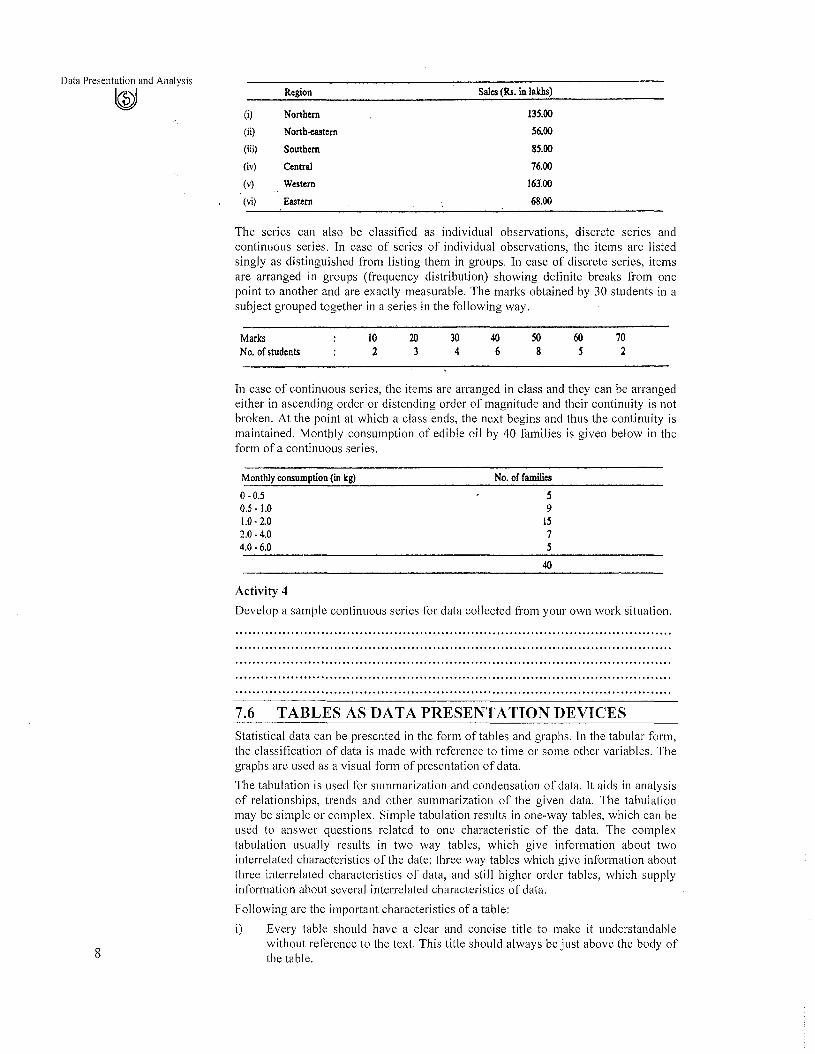
Data Presentation and Analysis
l@J Region Sales (lb. in lakhs)
(i) Northern 135.00
(ii) North-eastern 56.00
(iii) Southern 85.00
(iv) Central 76.00
(v) Western 163.00
(vi) Eastern 68.00
The series can also be classified as individual observations, discrete series andcontinuous series. In case of series of individual observations, the items are listedsingly as distinguished from listing them in groups. In case of discrete series, itemsare arranged in groups (frequency distribution) showing definite breaks from onepoint to another and are exactly measurable. The marks obtained by 30 students in asubject grouped together in a series in the following way.
MarksNo. of students
102
203
304
406
508
605
702
In case of continuous series, the items are arranged in class and they can be arrangedeither in ascending order or distending order of magnitude and their continuity is notbroken. At the point at which a class ends, the next begins and thus the continuity ismaintained. Monthly consumption of edible oil by 40 families is given below in theform of a continuous series.
Monthly consumption (in kg)
0-0.50.5 - 1.01.0- 2.02.0- 4.04.0 - 6.0
No. of families
59
1575
40
8
Activity 4
Develop a sample continuous series for data collected from your own work situation.
7.6 TABLES AS DATA PRESENTATION DEVICESStatistical data can be presented in the form of tables and graphs. In the tabular form,the classification of data is made with reference to time or some other variables. Thegraphs are used as a visual form of presentation of data.
The tabulation is used for summarization and condensation of data. It aids in analysisof relationships, trends and other summarization of the given data. The tabulationmay be simple or complex. Simple tabulation results in one-way tables, which can beused to answer questions related to one characteristic of the data. The complextabulation usually results in two way tables, which give information about twointerrelated characteristics of the date; three way tables which give information aboutthree interrelated characteristics of data, and still higher order tables, which supplyinformation about several interrelated characteristics of data.
Following are the important characteristics of a table:
i) Every table should have a clear and concise title to make it understandablewithout reference to the text. This title should always be just above the body ofthe table.

ii) Every table should be given a distinctnumber to facilitate easy reference.
iii) Every table should have captions (column headings) and stubs (row headings)and they should be clear and brief.
iv) The units of measurements used must always be indicated.
v) Source or sources from where the data in the table have been obtained must beindicated at the bottom of the table.
vi) Explanatory footnotes, if any, concerning the table should be given beneath thetable along with reference symbol.
vii) The columns in the tables may be numbered to facilitate reference.
viii) Abbreviations should be used to the minimum possible extent.
ix) The tables should be logical, clear, accurate and as simple as possible.
x) The arrangement of the data categories in a table may be a chronological,geographical, alphabetical or according to magnitude to facilitate comparison.
xi) Finally, the table must suit the needs and requirements of the research study.
Activity 5
Using your own data source, present the data on any agricultural commodity In atabular form.
7.7 GRAPIHICAL PRESENTATION OF DATA
Several types of graphs or charts are used to present statistical data. Of them, thefollowing are commonly used: bar chart, two dimensional diagrams, pictograms,piecharts and arithmetic chart or line chart. Several of these have been discussed indetail in Unit 6, (Presentation of data). Block 2 (Data Collection and Analysis) ofQuantitative Analysis for Managerial Applications (MS-8). You may therefore referto the said study material. Therefore, charts and graphs not covered are discussedbelow.
Two dimensional diagrams: The commonly used two dimensional diagrams arerectangular diagrams and squares. In rectangular diagrams the rectangles are used topresent the data in the graphic form. These diagrams are used for comparing two setsof data. The height of the rectangle is proportional to the ratio ofthe data which bearto each other in a given series and the width of the rectangle varies in proportion tothe aggregate. Before constructing the rectangular diagram, the data is converted intopercentages. A rectangular diagram to the data on cost of production and profits, intwo firms A and B is given below.
Firm A Firm B
Absolute (Rs. in Lakhs) % Absolute (Rs. in Lakhs) %
Raw material 75.00 50 120.00 32
Labour 30.00 20 m.oo 36
Overheads 30.00 20 75.00 20
Profits 15.00 10 45.00 12
When the difference between two quantities is very large, one bar would become toobig and the other too small in a rectangular diagram. To overcome this difficulty,squares are used to present the data. The size of the square is the square roots of thegiven data.
Data Processing
l@J
9

I----R"" :"larn;,"----I
Data Presentation and Analysis
~100
75nI 50%
50
,.l-) LI__---'-__IIJl.l.:.lJJ.tLL PI_'O_iit_~ JLL'f.LL.!JlLi:.LL.L'f.LL.l.fLLtLL_
Finn A Finn B
Pictograms : In this form of presentation, data are represented by a picture. Forexample, population figures are presented by the picture of a human being,production figures of, say motorbikes, is presented by the picture of a motorbike,cattle population is presented by a picture of a cattle and so on. The following figurepresents a pictograph showing troops strengths of two countries A and B.
COl!ntry
A
B
Pie Chart : In a pie chart, different segments of a circle represent percentagecontribution of various components to the total. It brings out the relative importanceof various components of data. For drawing a pie chart, we construct a circle of anydiameter and then the circle is broken into a desired number of segments, angle 3600
represents 100 per cent. The cost of production in an industry is presented below inthe form of a pie chart.
10
Raw Material
Labour
,-i.--t:=- Miscellancous

78
Line or Arithmetic Chart : The line or arithmetic chart is used to identifY thechanges or the trend that exist in a series of data. The data on export sales of acompany between 1978 and 1989 is presented below in the form of a line chait.Although we can see changes in the data, the presentation of the same on a line chartgives a better
~
~ 12:'.0
;j Jilll.!!
~
7:'.03
:;IU)
25'0~1~~~L" I I I I I , ," Year79 SO X1 Xl 83 S4 85 86 87 88 89
picture of the information. The other forms of presentation of the data have alreadybeen discussed in Unit 6, Block 2 of Quantitative Analysis for ManagerialApplications (MS-8).
Activity 6
With the help of your own data, draw an appropriate chart to present the same.
7.8 SUMMARYWe have in this unit discussed the various aspects of data processing. The importanceof editing and coding of data before any processing has been emphasised here. In anyresearch studies, the voluminous data can be handled only after classifying the same.The various aspects of classification, summarisation and presentation of data havebeen discussed.
7.9 SELF-ASSESSMENT EXERCISES1) Describe, in brief, the importance of editing, coding, classification, tabulation
and presentation of data in the context of research study.
2) Discuss the different aspects of classification of data. What are the likelyproblems encountered in the classification and how they can be handled?
3) Why tabulation is considered essential in a research study? Give thecharacteristics of a good table.
4) Write briefly about the different forms of data presentation devices.
5) Monthly salary of 32 employees of a firm are given below. Tabulate the dataafter selecting a suitable class interval.
Data Processing
l@J
2250, 1800, 1650, 1760, 3520, 5600. 2450, 2680,2700, i680, 3650, 3240, 5050, 3150, 1860, 2425,4520, 3275, 4215, 3760, 1950, 1850, 3750, ms,4"00, 3800, 4300, 2750, 4370, 3350, 2375. 3215
11

Data Presentation and Analysis
l@ 6) Profit (Rs.in lakhs) after tax, for a pharmaceutical firm between 1980 and 1988is given below. Draw a line chart.1980, 1981, 1982, 1983, 1984, 1985, 1986, 1987, 198850.0. 115.0, 127.0, 138.0, 126.0, 115.0, 148.0, 168.0, 195.0
7) Draw a pie chart for comparing the various costs (Rs.in lakhs) of the housebuilding activities in two periods, 1984 and 1989.
1984 1989
Land COSl 0.75 1.00
Material cost 1.00 1.75
Labour cost 0.60 1.00
Fixtures & furnitures 0.40 0.75
Miscellaneous 0.25 0.50
8) The following data relate to the advances to various sectors of a nationalisedbank for the year 1989. Present the data in a pie diagram.Sector Amount (Rs. in Millions)
Public Sector - Food
Public sector - Food
-Non Food
Olhers
7.10 FURTHER READINGS
1550.0
650.0
325.0
2450.0
12
Enns, P.G., 1985. Business Statistics, Richard D. Irwin Inc.: Homewood.
Kothari, Cr., 1986. Research Methodology-Methods and Techniques, Wiley Eastern;New Delhi.
Robert Sandy, 1990. Statistics for Business and Economics, Me Graw-HillInternational: Singapore.
Shenoy, G.V., Srivastava, U.K. and Sharma, s.c. 1988.Business Statistics, WileyEastern: New Delhi.


UNIT 8
Objectives
STATISTICAL ANALYSIS ANDINTERPRETATION OF DATA:NONPARAMETRIC TESTS
On successful completion of this unit, you should be able to
• explain the differences between parametric and nonparametric tests
• describe the relevance of nonparametric tests in data analysis
• discuss the steps involved in the nonparametric test
• design and conduct one sample, two samples and more than two samplesnonparametric tests.
Structure
8. I Introduction
8.2 One Sample Tests
8.3 Two Sample Tests
8.4 K Sample Tests
8.5 Summary
8.6 Self-assessment Exercises
8.7 Further Readings
8.1 INTRODUCTIONIn Unit 15, Block 4 (Sampling and Sampling Distributions) of Quantitative Analysisfor Managerial Decisions (MS-8), you have been introduced to the general class oftesting of hypotheses. These tests, popularly known as parametric tests, assume thatparameters such as mean, standard deviation, etc. exist and are used to develop a test.For example, a t-test is based upon the comparison of means of two samples. Theparametric tests are developed with an assumption that the form of the populationdistribution was known and that a test concerning a parameter of the distribution wasto be made. Tests of hypotheses which deal with population parameters are calledparametric tests.There are situations, particularly in psychological or in market research studies,where in the basic assumptions underlying the parametric tests are not valid or onedoes not have the knowledge of the distribution of the population parameter beingtested. The tests which handle problems of these types are known as non parametrictests or distribution free tests.In the recent past, the nonparametric tests have gained importance basically for threereasons:(i) These tests require no or less restricting assumptions than the corresponding
parametric tests,(ii) these tests are more suitable for analysing ranked, scaled or rated data, and(iii) these tests involve very few arithmetic computations.
However, it must be understood that when basic assumptions about the parametrictests are valid, the nonparametric tests are less powerful than the parametric tests.Thus, there is a greater risk of accepting a false hypothesis and thus committing atype II error. Secondly, in nonparametric methods, the null hypothesis is somewhatloosely defined thereby, when the null hypothesis is rejected, the nonparametric testsyield less precise conclusions compared to the parametric tests. For example, inparametric tests we have a test for equality of two population means compared to thetwo population distributions are identical in a nonparametric test. In this case, arejection of null hypothesis in a parametric test would mean that the two population 13

Data Presentation and Analysis
~
14
means are not equal while the rejection of the null hypothesis in the nonparametrictest leads to the conclusion that the two population distributions are different, thespecific form of the difference between the two distributions is not clearly specified.
The following ale some of the typical situations for using nonparametric tests:
i) In a consumer behaviour survey for new package design, the responses are notlikely to be normally distributed but clustering around two extreme positions,with a very few respondents giving a neutral response to the package design.
ii) Sometimes, the responses to a question are given in terms of names (nominaldata), which cannot be treated as numbers. For example, if we ask younggraduates "in which part of the country would you like to take up a job andlive", the replies could be north, north-west, west or south, etc. Nominal datacan be analysed only by nonparametric methods.
iii) In mailed questionnaire method of survey, more often partially filledquestionnaires are received. Nonparametric tests are designed to take themissions data and make necessary adjustments to extract maximuminformation from the available data.
iv) Nonparametric tests can be used to provide reasonably good results even forvery small samples.
8.2 ONE SAMPLE TESTSThe one sample tests are used to answer the questions such as:
i) Is there a significant difference between the observed and expectedfrequencies?
ii) Is it reasonable to believe that the sample has been drawn from a specifiedpopulation?
iii) Is it reasonable to accept that the sample is a random sample from some knownpopulation?
The tests which are used to obtain answers to the above questions are classified astests for goodness of fit.
Kolmogorov-Smirnov One Sample Test
This test is used for comparing the distribution on an ordinal scale. The test isconcerned with the degree ,of agreement between the distribution of observed valuesand some specified theoretical distribution. It determines whether the scores in asample can reasonably be thought to have come from a population having thetheoretical distribution.
Example: A leading paint manufacturer is interested in developing a new colourshade. He is interested in testing four different shades: dark, bright, light and verylight. A sample of 160 customers were shown these four shades and following resultswere obtained: 30 liked the dark shade, 45 liked the bright shade, 60 liked the lightshade and the remaining liked the very light shade. The manufacturer wants to knowwhether the sample results indicate any preference towards the shade?
The test procedure to test the above hypothesis involves specifYing the cumulativefrequency distribution which would occur given the theoretical distribution under H.and comparing that with the observed (from the sample) cumulative frequencydistribution. The point at which these two distributions show the greatest absolutedifference is determined. Reference to the sampling distribution would indicatewhether such a difference is likely to be on the basis of chance. The KolmogorovSmirnov test assumes that the distribution of the variable being tested in continuousas specified by the cumulative frequency distribution. The test statistic is given by
D = maximum {IFo(x)-S,,(X)I}
Where Fo (x) is the theoretical cumulative frequency distribution (under Ho) and S"(x) is the observed cumulative frequency distribution, with a sample of size n.Statistical Table I at the end of this unit gives the critical value for D. If thecalculated value of D exceeds this value, the null hypothesis is rejected, i.e. theobserved difference is significant.
In our above example, the calculated value of D is obtained as follows:

standard deviation := S.D. (r) =
Shade Chosen
Dark Bright Light Very light
Observed number of customers 30 45 60 25S, (x) == observed-<:um-distribution 0.1875 0.4688 0.8438 ooסס.1Fo (x) == theoretical-cum- 0.25 0.50 0.75 1.00distribution
IF,(x) S. (x) i 0.0625 0.0312 0.0938 00== max [I Po (x) - s, (x) I} == 0.0938
For large n and at 5 per cent significance level, the critical value of D is given by
1.36.j;; This value is equal to 0.1075. As the calculated value of D is less than the
critical value, the null hypothesis is not rejected, i.e., any difference in shadepreference is only due to chance.
Runs Test for Randomness
In order to draw conclusions about the population on the basis of the sampleinformation, it is necessary that the sample drawn must be random or unbiased. Theruns test is used to test the sample for randomness. The test is based on the order orsequence in which the individual observations originally were obtained. A run isdefined as a sequence of identical symbols or elements which are followed andproceeded by different types of symbols or elements or by no symbols on either side.
For example, in studying the arrival pattern of customers in a large departmentalstore, we might observe the following sequence of male (M) and female (F) arrivals
M M FFFMM FFFM MMM FM M FFM
For this sample of 20 customers, we can observe that there are in all 9 runs. The totalnumber of runs in a sample is an indication of whether or not the sample is random.Too few runs or too many runs indicates lack of independence or nonrandomness. Inorder to use the runs test, we observe the sequence of occurrence of the nl + n2 = nevents (observations) and determine the number of runs, r. If both nl and n2 are equalto or less than 20, then we use the statistical Table 2 at the end of this unit, to find outthe critical value for r under Ho with °= 0.05. If the observed value of r falls withinthe critical value, we accept Ho. Otherwise, the null hypothesis (Ho) is rejected. Ifeither nl or n2 is larger than 20, we use normal distribution as an approximation to thesampling distribution ofr, with
2nl nlMean:= E (r) = + 1nl +n2
and
2nl nl (2nl n2 -nl -n2)
(nl + n2)1 (nl + n2 - I)
The null hypothesis is tested using the test statistics
IZI = Ir - E(r)1S.D(r)
The normal probability table is used to obtain the critical value of Z and thehypothesis Ho is rejected when the calculated value of Z is greater than the criticalvalue.
In order to study the arrival pattern of customers at a Supermarket, the manager noteddown the arrival sequence of customers, sex-wise (M and W denote man and womanarrival). The sequence is:
MM WWW M WW MM WWWW MMM WW MM W MMM WWW MM WWMM WW M WW MM WW M WW MM WW
In order to conclude the randomness of the arrival pattern of the customers, we canuse the runs test.
The hypothesis to be tested here is:
Statistical Analysis andInterpretation of Data:
Nonparametric Tests
~
15

Data Presentation and Analysis
~Ho : The arrival pattern, sex-wise, of the customers at the supermarket is random.
HI : The arrival pattern, sex-wise, of the customers at the sup market is not random.
Here
nl = 23, nz = 27, I' = 24
E(r) = 2nl nL + Inl + 112
= 2 X 23 X 27 + I =25.823 +27
S.D(r) =
=
2nl n2 (2nl n2 -nt -n2)
(nl + n2i (nt'+ nz -1)
2 X 23 X 27 (2 X 23 X 27 - 23 - 27)
(23 + 27i (23 + 27 - 1)= 3.48
/21 = Ir - E(r)1S.D.(r)
= 124 - 25.81 = 0.523.48
16
As a = 0.05, the critical value of Z is 1.96. As the calculated value of Z is less thanthe critical value, the null hypothesis is accepted. Thus, the arrival pattern of thecustomers (sex-wise) is random.
One-Sample Sign Test
In Block 4 of MS-8, all tests concerning means that you have studied are based on theassumption that the samples are taken from a population having roughly the shape ofa normal distribution. When this assumption is untenable, the standard tests can bereplaced by nonparametric tests. Here we will discuss one such nonparametric tests,namely, sign test.
The one-sample sign test is applicable, when sample is taken from a continuoussymmetrical population. In this case, the probability that the sample value is less than
mean and the probability a sample value is greater than mean are both !. Suppose2
we are testing our null hypothesis Ho: Ji = Jio against a suitable alternative
hypothesis by using a sample of size n. The procedure adopted in the sign test is verysimple. Each sample value greater than 110 is replaced by a plus sign and each samplevalue less'than is replaced by a negative sign. We then test the null hypothesis thatthese plus and minus signs are the values of random variable having a binomial
distribution with p = ! .In case any sample value exactly equals 11o, we simply omit2
it.
For a small sample, the test is performed by computing the binomial probabilities (oryou may refer to binomial probabilities table). For a large sample, the normaldistribution is used as an approximation to the binomial distribution.
Example: It is desired to test the hypothesis that the median value IJ of a continuousdistribution is 15 against the alternative hypothesis ~l> 15. Twenty observations weretaken and the following results were obtained:
17,18,16,16,17,19,14,13,19,21,22,11,9,12,14,17,23, 18, 17, 16
You may use a = 0.05 level of significance.
Solution: Replacing each value greater than 15 with a plus sign and each value lessthan 15 with a minus sign we get:
++++++--+++---- ++++++Now the question is whether 14 plus signs observed in 20 trials suppOlis the null
I. 1 . 1
hypot 1eSlS p = - or the alternative hypotheSIS p > - .2 2

=: -2.85
1 < .. •
We can find that for n = 20 and p = - the probability of 14 or more successes IS 0.052
and since this is less than or equal to a = 0.05, we reject the null hypothesisTherefore, the median value of the distribution is greater than IS.
You may please note that in the above example both np and n (l-p) are greater than5. Therefore, we could have as well used normal approximation to binomialdistribution. We will illustrate this with a different example.
Example: The data given below is on a large industrial plant's daily emission ofsulphur oxides (in tons)
17 15 20 29 19 18 22 25 rJ 924 20 17 6 24 14 15 23 24 26f9 23 28 19 16 22 24 17 20 1319 10 23 18 31 13 20 17 24 14
Use the one-sample sign test to test the null hypothesis that the plant's true averagedaily emission of sulphur oxide is Il = 23.5 tons against the alternative hypothesis Il
< 23.5 tons at the 0.05 level of significance.
Solution: There are II plus signs and 29 minus signs.
Ho : P = 1/2
HI: p < 1/2
1X = 1I n = 40 P = -, , 2
Z =: X ~ npo
Jnpo (I-po)
11-40(1/2)
J40q)( PAbsolute value of computed Z ie IZI = 2.85Absolute value of tabulated Z ie IZI = 1.645at Ct =: 0.05 (Obtained from standard normal table)
Since computed IZI > tabular Ill, we reject Ho
Therefore, we conclude that plant's true average daily emission of sulfur oxides isless than 23.5 tons.
CHI-Square Test
In certain market research field studies, we have responses which can be classifiedinto two mutually exclusive classes, such as like-dislike, favour-not favour, etc. TheChi-square (X2
) test of goodness of fit is used here tests whether a significantdifference exists between the observed number of responses and an expected numberbased on the null hypothesis in each category or class. The test statistic used here is
Statistical Analysis andInterpretation of Data:
Nonparametric Tests
l@J
(OJ - Ei
E;1"-"" !
Where Oi and Ei are the observed and expected frequencies in the ilh class, therebring k classes. For a given level of significance (a), if the calculated value of X2 isgreater than the critical value, the null hypothesis is rejected.
As an illustration, let us consider a textile manufacturer who is interested in studyingthe customer preference for designs before commencing a commercial production.He conducts a survey of 100 customers all over the country and classifies theirresponses in the following way:
Prefer: design I 20, design II 30, design 111 18 and design IV 32.
X2 test can be used to test the hypothesis that the customers have no preference forany particular design.
17

Data Presentation and Analysis
~Under the null hypothesis of no preference for any design, the expected (E j ) and theobserved (OD frequencies can be given as follows:
Preference
Eo
Design I
2520
Design II
2530
Design III
2518
Design IV
2532
x2 :::: k (0, - Ej)2
I Eii=1
:::: (20 - 25)2 + (30 - 25)1 ,-T
25 25(18 - 25)2 + (32 - 25)2
~---.::::..!... == 5.9225 25
18
The critical value of X2 at 5 per cent level of significance with 3 (= k - 1) degrees offreedom is 7.81473 (see table ofX2 distribution). As the calculated value ofX2 is lessthan the critical value, the null hypothesis is rejected. Thus, the survey of customersindicates no particular preference for any design.
Activity 1
The following arrangement indicates whether 25 consecutive persons interviewed bya social scientist are for (F) or against (A) an increase in the number of crimes in acertain locality:
F, F, F, F, F, F, A, F, F, F, F, F, A, F, F, F, F, A, A, F, F, F, F, F, F,.
Test whether this arrangement of A's and F's may be regarded as random at 5% levelof significance.
Activity 2
An unbiased coin was tossed 30 times and the following sequence of heads (H) andtails (T) was observed;
H HH TTTTH HTTTH H H TT H H H TTTTH HTH H T
Find out the number of runs in the sample.
Activity 3
In a given year, the average number of days that a (small) sample of 15 wholesalersof drugs and drug sundries required to convert receivables into cash were 33.9, 35.4,37.3,40.9,27.8,35.5,34.6,41.1,30.0,43.2,33.9,41.3, 32.0, 37.7 and 35.2 days. Usethe one-sample sign test to test the null hypothesis fl = 32.0 days against the
alternative hypothesis fl > 32 days at the 0.0 I level of significance.
8.3 TWO SAMPLE TESTS
The two sample tests are used to evaluate the effectiveness (or response) of twotreatments, two methods, say, teaching or two promotional strategies in marketing. Ineach ofthese cases, the sample which has been administered with the treatment is

compared with the one which has been administered with another treatment. Forexample, while comparing the two advertising strategies on two groups ofconsumers, one group might react differently compared to the other not because ofthe advertisement alone, but also because of other factors such as their background,social status, etc. In problems of this type, there can be two independent samples, orthe same sample studied again, Le., before and after the advertising campaign.
The Sign Test
This test is based on the sign of a pair of observations. The test is of pmticular usewhen the measurements of observations are on a qualitative basis. Suppose, forexample, in a market research study, the researcher selects a panel of 35 people andobtains their attitudes towards the company's product. He then shows anadveltisement and gets their response towards the product. For every person whoserating of the product increased, we have a plus sign and for those whose ratings havedeclined, we have a negative sign and for the one which remains unchanged, thecorresponding sample observation is dropped from the analysis.
The null hypothesis to be tested by the sign test is that
P (XA > XB) P (XA < XB) = 1/2
where XA is the rating before the advertisement (treatment) and XB is the rating afterthe advertise!~lel\t.
In case of small samples, the probability associated with the occurrence of aparticular number of +s and -s is determined with the help of the binomialdistribution with p = q = 1/2, n is the sample size and x is the number offewer signs.
We will illustrate the test with the help of an example.
Example : To determine the effectiveness of a new traffic control system, thenumber of accidents that occurred at a random sample of eight dangerousintersections during the four weeks before and the four weeks following theinstallation of the new system
e observed with the following results:
Statistical Analysis andInterpretation of Data:
Nonparametric Tests
~
9 and 5
12 and 7
7 and 3
12 and 5
3 and 4
5 and 5
16 and 11
6 and 1
Use the sign test at the level of significance a = 0.10 to test the null hypothesis thatthe new traffic control system is as effective as the old system against the alternativehypothesis that the new system is more effective.
Solution: There are 6 plus signs, 1 minus and we discard one observation. We have1
to find the probability of 6 or more success in 7 trials with p = - It can be found out2
using
, binomial probability distribution that this probability is 0.063 which is less than a0.10. Therefore, the null hypothesis must be rejected.
Therefore, the new traffic control is more effective.
Please note that if our sample is large, we may use normal approximation to binomialdistribution and carry out Z test as explained earlier.
The Median Test
The sign test discussed above can be used only when the observations are paired, i.e.,the elements are studied before and after the treatment. This may not always bepossible, as we may have samples of different sizes from two populations. In such asituation, median test is appropriate. The median test is used to give informationwhether the two independent samples belong to the population with the same median.
The procedure involved in the median test is to pool both the samples and thendetermine the combined median. Then, the two sample observations are tabulated inthe form of a 2 X 2 table with respect to the median in the following way:
19

Data Presentation and Analysis
~Grouping of samples for Median test
Number of elements
Above the median
Below the median
Total
Sample I
a
c
a+c
Sample"
b
d
b+d
Total
a+b
c+d
If both the samples are from the population with the same median, 50 per cent ofsample's elements will be above the median and the other 50 per cent below themedian. If the number of elements (n] + n2) in the, two samples is small, we find out
p=(~l) (b2)
(~1 tb2)If this probability is greater than a the level of significance, the null hypothesis isaccepted, i.e., the two samples have been drawn from the same population.
In order to demonstrate the use of median test, let us consider the following example:
Example : Two different fertilizers were used to a sample of eight plots (of samesize) each. The farm yield from these plots are given below:
Plot No.
Fertilizer A
Fertilizer B
123
49 32 44
40 45 50
4 5
48 51
43 37
6 7
34 30
47 55
8
42
57
The researcher would like to test the hypothesis that the two fertilizers yield the samemedian output. Let the level of significance be 5 per cent.Solution: The hypothesis to be tested here is that yield by the two fertilizers have thesame median.The median ofthe combined sample is 44.5 (i.e. the average of 44 and 45) Groupingthe sample elements into elements above and below the median, we get
Above the median
Below the median
FertilizersI II
3 5
5 3
Total
8
8
Since the number of dements (i.e. nl + n2) is small, we find
p=(~l) (~2)
(n~::2)
20
=0.244
As this probability is greater than 0.05, level of significance, the null hypothesis isaccepted. Thus the yield by the two fertilizers have the same median.
When nl + n2 is large, we use X2 (Chi-square) test for accepting or rejecting the nullhypothesis. The test incorporating the correction for continuity is givers below:
[N 2
N lad - bel - -~}'
(a + b) (c + d) (a + c) (b + d)

Under null hypothesis, the above statistics follows a Chi-square with 1 degree offreedom. Large values of Xl are significant for the null hypothesis. The tabulatedvalues of Xl are obtained from Table 3 given at the end of this unit. Let us illustratethe test with the help of an example.
Example: The table below gives the arithmetic addition scores for 27 individuals.belonging to two groups. We want to test the hypothesis of no difference betweenthese two sets of score. We may choose as per cent level of significance.
Table: Scores on an addition Test.
X Y
12 716 1218 147 186 54 1611 912 108 1420 318 1816 910 7
4
Solution: Group X contains 13 scores and group Y, 14. For the set of 27 scores, wecompute the median which is found to be 11.
In case both of these distributions come from the same population, half of the Xvalues and half of the Y values would lie above median and half of the X values andhalf of the Y values would lie below it. A contingency table is set up as follow:
x y
Above Median 7 6 13a b a+b
Below median 6 8 14c d c+d
13 14 27a+c b+d N
We compute X 2 as follows:
N [ i ad -- be I -.!f r(a + b) (e + d) (a + e) (b + d)
27[ 156-361- ¥r(13) (14) (13) (14)
Statistical Analysis andInterpretation of Data:
Nonparametric Tests
~
=
=
. 227 [20 - n.5 J
33, 124
27 (42.25)
33,124
0.034
Table value of Xl with 1 degree of freedom = 6.63. Therefore, Xl value IS notsignificant. Therefore both these distributions come from same population. 21
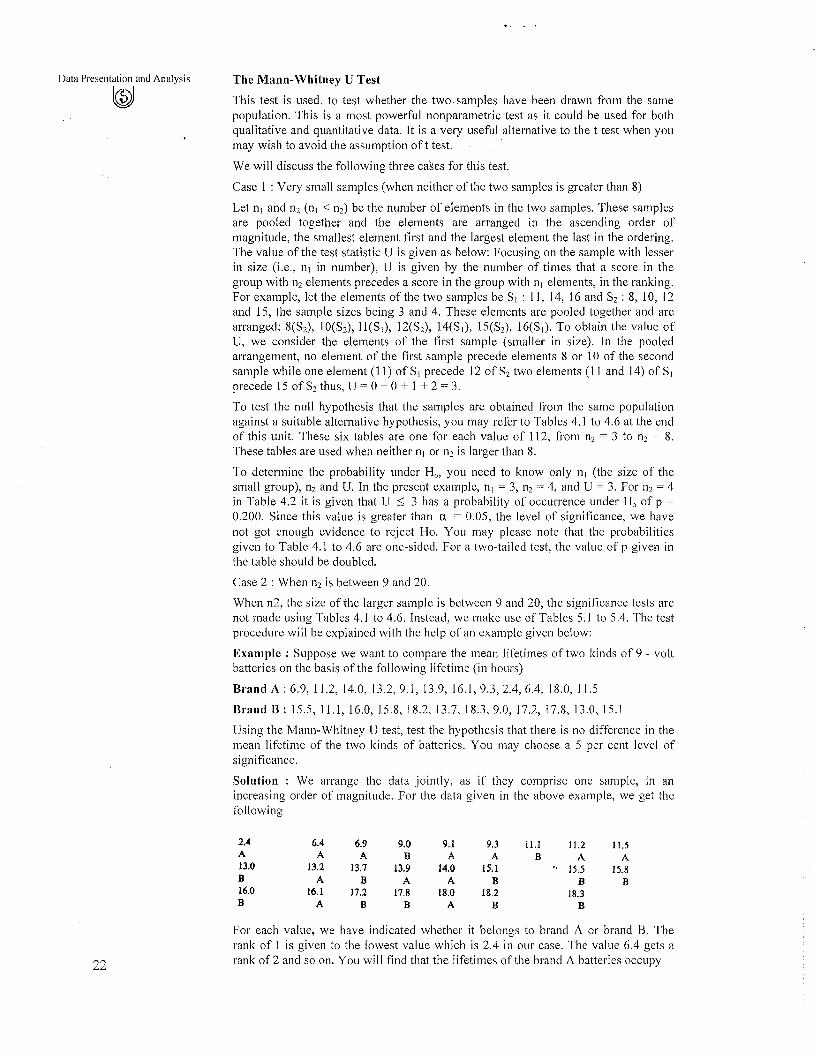
Data Presentation and Analysis
~
22
The Mann-Whitney U Test
This test is used. to test whether the two. samples have been drawn from the samepopulation. This is a most powerful nonparametric test as it could be used for bothqualitative and quantitative data. It is a very useful alternative to the t test when youmay wish to avoid the assumption oft test.
We will discuss the following three cases for this test.
Case 1 : Very small samples (when neither of the two samples is greater than 8)
Let nl and n2 (nl < n2) be the number of elements in the two samples. These samplesare pooled together and the elements are arranged in the ascending order ofmagnitude, the smallest element first and the largest element the last in the ordering.The value of the test statistic U is given as below: Focusing on the sample with lesserin size (i.e., nl in number), U is given by the number of times that a score in thegroup with n2 elements precedes a score in the group with nl elements, in the ranking.For example, let the elements of the two samples be SI : 11, 14, 16 and S2 : 8, 10, 12and 15, the sample sizes being 3 and 4. These elements are pooled together and arearranged: 8(S2), 10(S2), 11(SI), 12(S2), 14(SI), 15(S2), 16(SI)' To obtain the value ofU, we consider the elements of the first sample (smaller in size). In the pooledarrangement, no element of the first sample precede elements 8 or 10 of the secondsample while one element (11) of SI precede 12 of S2 two elements (11 and 14) of SIprecede 15 of S2 thus, U = 0 + 0 + 1 + 2 = 3.
To test the null hypothesis that the samples are obtained from the same populationagainst a suitable alternative hypothesis, you may refer to Tables 4.1 to 4.6 at the endof this unit. These six tables are one for each value of 112, from n2 = 3 to n2 = 8.These tables are used when neither nl or n2 is larger than 8.
To determine the probability under Ho, you need to know only nl (the size of thesmall group), n2 and U. In the present example, nl = 3, n2 = 4, and U = 3. For n2 = 4in Table 4.2 it is given that U ~ 3 has a probability of occurrence under Ho of p =
0.200. Since this value is greater than a = 0.05, the level of significance, we havenot got enough evidence to reject Ho. You may please note that the probabilitiesgiven to Table 4.1 to 4.6 are one-sided. For a two-tailed test, the value of p given inthe table should be doubled.
Case 2 : When n2 is between 9 and 20.
When n2, the size of the larger sample is between 9 and 20, the significance tests arenot made using Tables 4.1 to 4.6. Instead, we make use of Tables 5.1 to 5.4. The testprocedure will be explained with the help of an example given below:
Example: Suppose we want to compare the mean lifetimes of two kinds of 9 - voltbatteries on the basis of the following lifetime (in hours)
Brand A : 6.9, 11.2, 14.0, 13.2, 9.1, 13.9, 16.1, 9.3, 2.4, 6.4, 18.0, 11.5
BrandB: 15.5,11.1,16.0,15.8,18.2,13.7,18.3,9.0,17.2,17.8, 13.0,15.1
Using the Mann-Whitney U test, test the hypothesis that there is no difference in themean lifetime of the two kinds of batteries. You may choose a 5 per cent level ofsignificance.
Solution : We arrange the data jointly, as if they comprise one sample, in anincreasing order of magnitude. For the data given in the above example, we get thefollowing
2.4 6.4 6.9 9.0 9.1 9.3 11.1 11.2 II.5A A A B A A B A A13.0 13.2 13.7 13.9 14.0 IS.! " 15.5 15.8B A B A A B B B16.0 16.1 17.2 17.8 18.0 18.2 18.3.B A B B A B B
For each value, we have indicated whether it belongs to brand A or brand B. Therank of 1 is given to the lowest value which is 2.4 in our case. The value 6.4 gets arank of2 and so on. You will find that the lifetimes of the brand A batteries occupy

ranks 1,2,3,5,6,8,9,11,13,14,19 and 22 while those of brand B occupy ranks4,7,10,12,15,16,17,18,20,21,23 and 24.
You may note that there are no ties here between values belonging to differentsamples. However, if there were ties, each of the tied observations would beassigned the mean of the ranks which they jointly occupy. Suppose, if the fifth
and sixth values were same, we would assign each the rank 5 +6
= 5.5 , and if2
the seventh, eight, and ninth values were the same, we would assign each the
rank 7+8+9 =83
The null hypothesis to be tested in this case is :
Ho : Two samples come from identical populations.
The alternative hypothesis is :
HI : Two samples come from different populations.
We obtain the value ofU as follows:
UI = nInz + nl(nl + 1)
Rl2
or
Ul = n,nl + nl (nl + 1)- R l
2
Where R[ is the sum of the ranks of the values of the first sample and Rz is the sum ofthe ranks of the values of the second sample.
For our example, we may compute the values ofU I and Uz as
UI
=12.12+ 12(13) -113=1092
and
Uz =12.12+ 12(13) -187=352
Please note that R I = 1 + 2 + 3 + 5 + 6 + 8 + 9 + 11 + 13 + 14 + 19 + 22 = 113
(sum ofthe ranks of the values ofthe first sample)
and
Rz= 4 + 7 + 10+ 12 + 15 + 16 + 17 + 18 + 20 + 21 + 23 + 24 = 187
Now the smaller of the two values U I and Uz is our U which equals 35. Please notethat U I + Uz = 109 + 35 = 144, which equals nl nz == 12.12 == 144.
Finally, since U = 35 is less than 37, the value of U 0.05 for two sided test given nl =
12 and nz = 12, (Table 5.3), we find that the null hypothesis must be rejected.Therefore, there is difference in the lifetime of two kinds of batteries.
Case 3 : Large sample (nz larger than 20)
For large sample, under the null hypothesis, U has a normal distribution with
Statistical Analysis andInterpretation of Data:
Nonparametric Tests
~
mean = (n I
2nl
) and S.D. = VThe test statistics is
U-~2
Z= --;:::-========. / n, nl (n, + n. + 1)
V 12
nl ill (nl + nl + I)
12
This value of Z is compared with the critical value (from the normal probabilitytable) and a de vision to accept or reject the null hypothesis is taken.
23

Data Presentation and Analysis
~Example : Following are the scores obtained by two groups of students in acompetitive examination. Test whether the two groups belong to the same population.
Scores
Group A
GroupB
51 68, 90, 81. 3D, 46, 99, 98, 11, 06, 19, 43
95, 82, 65, 85, 65, 81, 50, 60, IS, OS, 35, 32
Solution : Since these two sample observations are independent, we use the MannWhitney U test to test the hypothesis (Ho) that the two samples belong to the samepopulation. We pool both the samples and rank them. This is done as follows
Score 05. 06, II. 15. 19. 30, 32, 35. 43, 46. 50, 51
Group B A A B A A B B A A B A
Rank I 2 3 4 5 6 7 8 9 to II 12
Score 60, 65 65, 68, 81, 81, 82. 85, 90, 95, 98, 99
Group B B B A A B B B A B A A
Rank 13 14.5 14.5 16 17.5 17.5 19 20 21 22 23 24
We shall consider the sum of the ranks of elements of group A. Thus, we have R]=148.5. Therefore,
D = fil n2 + nl (nl + 1). 2
= 15 X 15 + 15 X 16 - 148.5 = 198.52
E (D) =~ = 15 X 15 = 112.52 2
S.D.(D) = = . / 15 X 15 X 31
V 12=24.109
Z= U~E(D)
S.D. (D)
196.5 - 112.524.109
=3.84
24
At 5 per cent significance, the critical value of Z is 1.96. As the calculated value of Zis greater than the critical value, the null hypothesis is rejected. Thus, the two groupsof students do not belong to the same population.
Wilcoxon Matched-Pail's Signed Rank Test
You would recall that in the sign test the value of the difference of scores was usedonly to determine its sign but its magnitude was not taken into account. TheWilcoxon Matched-Pairs signed rank test incorporates this additional information andattaches a greater weight to matched pair which shows a larger difference. This istherefore, a more powerful test than the sign test.
It is very frequent to come across two-related samples. The common a examples area study where wife and husband are matched or when some subjects are studiedbefore and after experiment or we are trying to compare the output oftwo machines.The null hypothesis to be tested in this case is that there are no differences in the twogroups with respect to the characteristics under study. The test procedure is asfollows:
1) Let di represents the difference score for any matched pair. We rank all the di's
without regard to their sign, i.e. rank all Idil's.
2) To each rank, prefix the sign of the difference.
3) Ifany di = 0, delete it and reduce the sample size accordingly.

4) If there are ties in some of the values of di's assign an average rank to such pairsby averaging their rank positions. Suppose our sample size is 6, and the di valuesare
-0.5, - I, -2, -2, 2, 3
The absolute values are 0.5, 1,2,2,2,3
3+4+5We assign a rank of --- = 4 to each of the third, fourth and fifth pair.
3
Statistical Analysis andInterpretation of Data:
Nonparametric Tests
~
Brand B51
414341473224584353525744574068
73
434753584752583861565634556575
Brand AI
2345678910II1213141516
5) The test statistic T is calculated which happens to be smaller sure of like signedranks. T is obtained by totalling all the ranks with positive signs and totallingseparately all the ranks with negative signs. The smaller ofthese two sum's is T.
6) For the purpose of accepting or rejecting the null hypothesis of no differencebetween the values of the given pairs of observations at a desired level ofsignificance, we compare the observed value ofT with the tabulated value givenin Table 6 at the end of this unit. If observed (calculated) value of T is less thanor equal to the tabulated value, we reject the null hypothesis.
Let us illustrate the test with the help of following example.
Example: An experiment is conducted to judge the effect of brand name on qualityperception. 16 subjects are recruited for the purpose and are asked to taste andcompare two samples of product on a set of scale items judged to be ordinal. Thefollowing data are obtained:
Pair
Test the hypothesis, using Wilcoxan Matched-Pairs signed rank test, that there is nodifference between the perceived quality of the two samples. Use 5% level ofsignificance.
Solution: The null hypothesis to be tested is
Ho : There is no difference between the perceived quality oftwo samples against thealternative hypothesis
HI: There is difference between the perceived quality of two samples.
The value ofT statistic can be worked out as under:
Pair Brand A Brand B Difference Rank of Rank with sigdi Idil +
I 73 51 22 13 132 43 41 2 2.5 2.53 47 43 4 4.5 4.54 53 41 12 II II5 58 47 II 10 106 47 32 15 12 127 52 24 28 15 158 58 58 0 25

Data Presentation and AnalysisPair Brand A Brand B Difference Rank of Rank with sig
~ di Idil +
9 38 43 -5 6 -6
10 61 53 8 8 8
II 56 52 4 4.5 4.5
12 56 57 -I I -I
13 34 44 -10 9 -914 55 57 -·2 2.5 -2.5
15 65 40 25 14 14
16 75 68 7 7 7
Total 101.5 -18.5
Hence, T-18.5
The pair number 8 is dropped as 'd' value of this is zero and therefore our samplesize. reduces to n= (16 - 1) = 15
For a two-tailed test, the table value of T at 5% level of significance when n = 15 is25. The calculated value of T is 18.5 which is less than the table value of 25.Therefore, the null hypothesis is rejected and we conclude that there is differencebetween the perceived quality of the two samples.
In the case of large sample where n exceeds 25, the sampling distribution of T is
approximately normal with mean T = 0(0+1
) and standard deviation4
T= 0(0+1)(20+1)
24out pairs, ifany)]
We compute
T- 0(0+1)
Z=----r===4~=0(0+1)(20+ 1)
24
where n = [(number of matched pairs) - (number of dropped
This is a standard normal variable under Ho. We therefore, use standard normal tablesto decide the rejection or acceptance of the null hypothesis.
Activity 4
In a farm experiment, two different treatments A and B were applied to four and fiverandomly selected plots respectively. The yield from these plots are given below. Usean appropriate test to conclude that the two treatments do not effect the yieldsignificantly.
Treatment A : 17, 12, 16, 10
Treatment B : 15, 8, 14, 9, 13
Activity 5
Below are the scores of a group of normals and a group of psychotics on the picturecompletion scale of the Wechsler-Bellevue. Test the hypothesis of no differenceusing the median test.
26
N (Normd)66
1413IS687
10141014
P (Psychotics)72
12138642.2
12

Activity 6
The following are the weight gains (in pounds) of two random samples of youngTurkeys fed two dim~rent diets but otherwise kept under identical conditions:
Diet I : 16.3,10.1; 10.7, 13.5, 14.9, 11.8, 14.3, 10.2,12.0,14.7,23.6,15.1,14.5,18.4,13.2,14.0
Diet 2 : 213,23,8,15.4,19.6,12.0,13:9,18.8,19.2,15.3,20.1, 14.8,18.9,20.7,21.1,15.8,16.2
Use the Mann-Whitney U test at the 0.01 level of significance to test the nullhypothesis that the two populations sampled have identical distributions against thealternative hypothesis that on the average the second diet produces a greater gain inweight.
Activity 7
In the data below, column X represents 10 scores of members of a control group in anexperiment. Column Y represents, the scores of 10 matched individuals who weregiven the same test after a period of stress. Test the hypothesis of no difference usingWilcoxan matched - pairs signed - ranks test. You may choose 5% level ofsignificance
Statistical Analysis andInterpretation of Data:
Nonparametric Tests
~
X
46686058424340563858
Y
36505840444329364648
.......................................................................................................
8.4 K SAMPLE TESTS
The tests discussed earlier are concerned with one or two samples. There are severalsituations where we will have to handle more than two samples simultaneously anddecide whether or not these samples belong to the same population. For example, in alarge unit, a product is produced by several machines simultaneously and samples aredrawn from each machine's output to test for quality. The production manager wouldlike to test whether all the machines produce items of same quality.
The Median Test
This test for k samples is an extension of the median test for two samples. Here theelements of all the samples are pooled together and the combined median is foundout. Then the sample elements are tabulated in the form of a 2 X k matrix withrespect to the combined, median. For example, in case of a 3-sample study, thetabulate result would be as follows:
27

Number of elementsData Presentation and Analysis
~ Sample I Sample II Sample III Total
above the median a b c a+b+c
below the median d e d+e+f
If all the sample elements are from the same population or from populations withsame median, equal number of observations lie in the two classifications: above themedian and below the median. The associated probability is given by
12
n (n + 1)H=
p=( nl + n2 + n3)
a +b +c
If this probability is smaller than a, the level of significance, then the null hypothesisis rejected. i.e., the samples do not belong to the same population. For large samples,X2 test with (k - 1) degrees of freedom is used to accept or reject the null hypothesis.The Kruskal-Wallis TestIn the test, all the elements of different samples are pooled together and they areranked with the lowest score receiving a rank value of 1. Ties are treated in the usualfashion for ranking data. If all the samples belong to the same population (the nullhypothesis), then the sum of the ranks of the elements of each sample would, beequal. Let rj be the sum of the ranks of the elements of the ilh sample. The KruskalWallis test uses the X2-test to test the null hypothesis. The test statistics is given by
k 2
! ~ - 3 (n+1);=1 nj
where n is the total number of elements in the k samples. H follows a X2 distributionwith (k - 1) degrees offreedom. The null hypothesis is rejected ifthe calculated valueof H is greater than X2
•
Example: In an agricultural field experiment, three different fertilizers were used onsample plots and yields were recorded. On the basis of these data, test the hypothesisthat there is no significant difference in yields from three different fertilizers.
Yield (in MT)
Fertilizer A 2.48, 3.25, 3.94, 3.45 3.0, 4.0, 3.6, 3.87
Fertilizer B 2.84, 3.1, 3.5, 2.27, 3.88, 2.87, 3.27, 2.8
Fertilizer C 3.4, 3.17, 2.85, 2.46, 3.15, 2.69, 2.88, 3.44
Solution : In order to use the Kruskal- Wallis test, we pool the elements and rankthem. These rankings are given below:
Yield 2.27, 2.46, ·2.48, 2.69, 2.8. 2.84, 2.85, 2.87, 2.88Rank 1 2 3 4 5 6 7 8 9Fertilizer B C A C B B C B C
Yield 3.0, 3.1, 3.15. 3.17. 3.25, 3.27, 3.4, 3.44, 3.45Rank 10 II 12 13 14 15 16 17 18Fertilizer A B C C A B C C A
Yield 3.5, 3.6, 3.87, 3.88, 3.94. 4.0Rank 19 20 21 22 23 24Fertilizer B A A B A A
From the above rankings, we getrl= 133, r2 = S7 and rJ = SO. Therefore,
H= _1_2_ 3 2
Irj
- 3 (n + I)n(n + I) nj
i=1
28
12 [13S3
2+
24(25)
= 7?.145 - 75 =4.145
si + S02] _ 3 X 258 8 .

The critical value of H from X2-distribution with two degrees offreedom at 5 percent level of significance is 5.99. As the calculated value of H is less than criticalvalue, the null hypothesis is accepted. Thus, all the three fertilizers yield the samelevel of output.
Activity 8
Using the median test for the data given above, draw your conclusions.
Activity 9
Use the Kruskal-Wallis H test at 5% level of significance to test the nuH hypothesisthat a professional bowler performs equally weH with the four bowling baHs, giventhe following results:
Bowling Results in Five Games
Statistical Analysis andInterpretation of Data:
Nonparametric Tests
l@J
With BaH No. A
With Ball No. B
With BaH No. C
With BaH No. D
8.5 SUMMARY
271
252
260
279
282
275
255
242
257
302
239
297
248
268
246
270
262
276
266
258
In this unit, we have introduced the role of non parametric statistical tests in theanalysis of statistical data. When the basic assumptions underlying the parametrictests are not valid or when one does not have the knowledge of the distribution of theparameter, then the nonparametric tests are the appropriate tests to draw inferencesabout the hypotheses. These tests are more suitable for analysing ranked, scaled orrated data. However, when the basic assumptions underlying the parametric tests arevalid, the nonparametric tests are less powerful than the parametric tests. Therefore,if for such problems non parametric tests are used, there is a greater risk 9f acceptinga false hypothesis and thus committing a type II error.
These nonparametric tests are grouped into one sample, two sample and k sampletests. One sample tests are used to study whether there is significant differencebetween observed and expected frequencies, or whether it is reasonable to accept thatthe sample drawn is a random sample or whether the sample has been drawn from aspecified population. The two sample tests are used to study the effectiveness of twotreatments, two methods or two strategies, etc. In problems of this type, there can betwo independent samples or the same sample elements are studied again. K-sampletests are an extension of two sample tests. Here, instead of two samples we havemore than two samples being studied simultaneously.
8.6 SELF-ASSESSMENT EXERCISES
1) Distinguish the differences between parametric and nonparametric tests. Whatare the impOliances of nonparametric tests?
2) A sample of three hundred and fifty people were asked their preferences for fourbrands of tea. 125 preferred brand A, 100 preferred brand B, 60 preferred brandC and the remaining brand D. Does this indicate a brand preference?
29

Data Presentation and Analysis
l@J3) A manufacturer of biscuits uses a machine to insert randomly one of the two
types of gifts in each box. The manufacturer wants randomness so that everypurchaser in the neighbourhood does not get the same gift. A sample of 50successive boxes are chosen to see if the machine is properly mixing the twotypes of gifts. The examination of these 50 boxes revealed the data on gifts asfollows (X and Y represent two different kinds of gifts ).
XYYXXXYYYXXYYXYYXXXYYXXyyXYYXXXXYYXXYYXXXYXXYYYUsing the runs test, what will you conclude about the randomness?
4) The following 40 numbers are taken from a two-digited number table:
41, 61, 51, 81, 68, 30, 81, 90, 46, 99, 98, 11, 06,
12, 18, 16, 19, 43, 95, 82, 65, 85, 65, 81, 00, 50,
11, 07, 17, 53, 69, 51, 97, 79, 69, 60, 15, 05, 37 40
Test the randomness ofthe numbers on the basis of runs up and runs down.
5) Two quality assurance managers independently collected samples of 100 articlesfrom a number of sales depots and tested them for quality. The number ofdefectives per sales depot were as follows:
Manager A 2, 11,0,7,3,5,3,9
Manager B 8, 5, 4, 3, 6, 12,5
Test the hypothesis that the two managers have the samples from the same lot by(i) median test and (ii) Maan-Whitney U test.
6) The data related to mean life times oftwo brands of bulbs are given below:
Rr"nrl A 47'i 400 4'i0 4')'i 4,0 44'i 4"0 4'" 41'i 410 4')0Brand B 418. 525. 500. 435. 455. 440. 465. 505. 415. 505. 395
Using Maan-Whitney U-test, will you conclude that the life times of two brandsof bulbs are equal?
7) A market researcher was interested in testing the preference of consumers for twobrand of detergent soaps. The consumers were asked to rate the two brands onthe cleaniness it provides on a four-point scale. The consumers response is givenbelow:
Consumer Number I 2 3 4 5 6 7 8 9 10 11 12 13 14 I
Rating for A 4 2 1 4 3 3 4 2 I 4 1 I 2 2 4Rating for B 2 3 2 3 2 4 2 1 I 3 2 2 2 3 3
Consumer Number 16 17 18 19 20 21 22 23 24 25 26 27 28 293
Rating for A 3 3 4 4 4 4 3 3 3 4 4 4 1 3 3Rating for B 3 2 3 3 2 4 2 1 2 3 1 3 2 4 2
Will you conclude that the effectiveness of the two brands is the same? Use the signtest.
8) A consumer product sold in a departmental store is often purchased on impulse.Three different stores were tried for this product and weekly sales in units foreach store were recorded:
St(m~-A 7n 71 n 11 1R 74 14 40 7'i nStore B 28, 31, 15, 33, 36, 42, 34, 18Store r: 21 12 21. l'i 17 79 2R. 10. 12Using median test and Kruskal- Wallis test, test the hypothesis that there is nodifference in the distribution of sales at three different stores.
9) The quantity of serum albumin (gms) per 10 ml in lepers under three differentdrugs and the control group were as follows:
Serial No. Control Drug A Drug B DrugC
1 0.39 0.31 0.43 0.36
2 0.31 .0.41 OAO 0.37
3 0.32 0.42 0.41 0.38
30 4 0.42 0.37 0.38 0.42

Serial No. Control Drug A DrugB DrugC Statistical Analysis andInterpretation of Data:
5 0.40 0.36 0.33 0.38 Nonparametric Tests
6 0.36 0.45 0.36 0.30 l®J7 0.34 0.42 0.45 0.358 0.37 0.36 0.32 0.369 0.35 0.46 0.42 0.38
Using Kruskal-Wallis test, test the hypothesis that the serum albumin content In
different groups of persons under different drugs is the same.
8.7 FURTHER READINGS
,Bernard Ostle and Mensing RW, 1975, Statistics in Research, the Iowa StateUniversity Press, Ames.
Gravetter, FJ and Wallnau, LB, 1985, Statistics for the Behavioural Sciences, WestPublishing Co, St Paul.
Shenoy, GV and Pant Madan, 1990, Statistical Methods in Business and SocialSciences, Macmillan India Ltd., New Delhi.
Siegel, S. and Castellan, NJ (Jr), 1988, Nonparametric Statistics for BehaviouralSciences, (2nd Ed), McGraw-Hill Book Co., New York.
Srivastava, UK, Shenoy, GV and Sharma, SC, 1989, Quantitative Techniques forManagerial Decisions, (2nd Ed), Wiley Eastern, New Delhi. ,
31
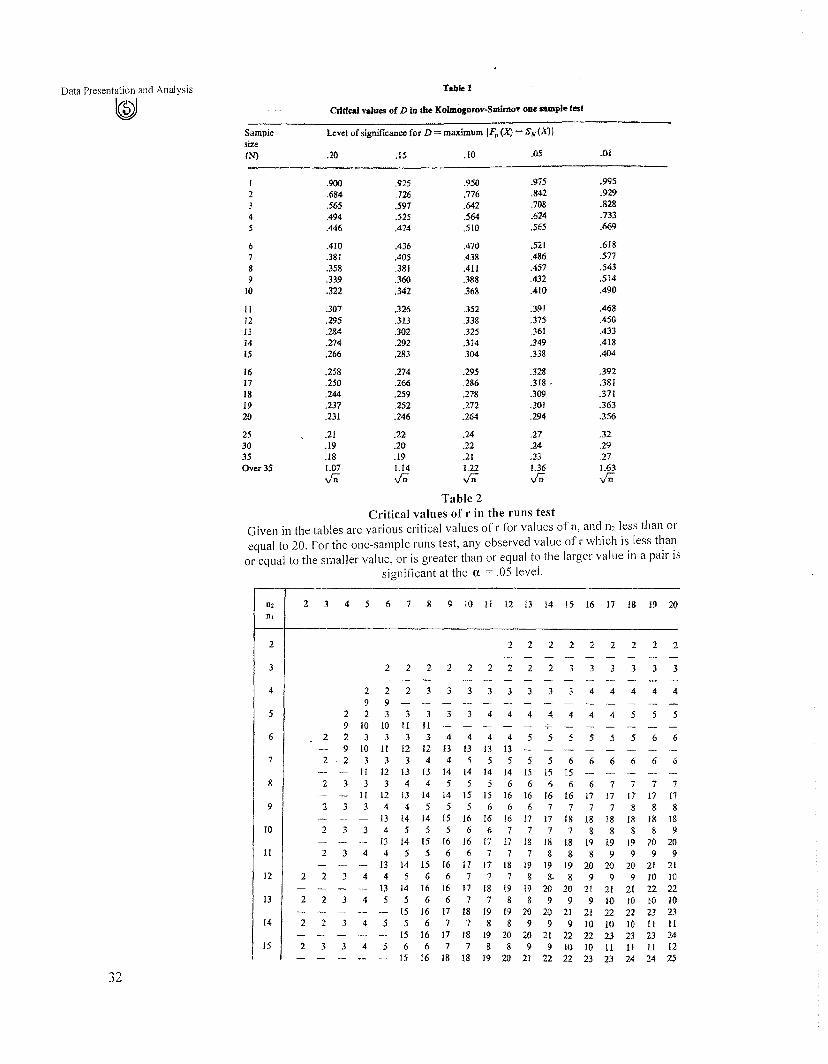
Data Presentation and Analysis Table 1
~ Critlad values of D in 1M Kolmogorov-Smimov one sample test
Sample Level ofsignillcance for D= maximum IFn(X) - S,v(Xjfsize(N) ,20 .. .10 .05 .01•• J
I .900 .925 .950 .975 .995
2 .684 ,726 .776 .842 .929
3 .565 .597 .642 .708 .8284 .494 .525 .564 .624 .133
5 .446 A74 .510 .565 .669
6 .410 .436 ,47(1 521 .618
7 .381 .405 .438 .486 577
8 .358 .381 All .457 .543
9 .339 .360 .388 .432 .514
10 .322 .342 .368 .410 .490
11 .307 .326 .352 .391 .46812 .295 .313 .338 .375 .45013 .284 .302 .325 .361 .43314 .274 .292 .314 .349 041815 .266 .283 .304 .338 .404
16 .258 .274 .295 .328 .39217 .250 .266 .286 .318 • .38118 .244 .259 .278 .309 .37119 .231 .252 .272 .301 .36320 .231 .246 .264 .294 .356
.32
.29
.271.63vn
.27
.24
.231.36.In
.22
.20
.191.14vn
.21
.19
.181.07vn
.24
.22
.211.22vn
Table 2Critical values of r in the runs test
Given in the tables are various critical values of r for values of n, and n2 less than orequal to 20. For the one-sample runs test, any observed value of I' which is less than
or equal to the smaller value, or is greater than or equal to the larger value in a pair issignificant at the U. = .05 level.
253035Over 35
15 16 18 18 19 20 21 22 22 23 23 24 24 25
n, 2 3 4 5 6 7 8 9 10 11 12 13 14 15 16 17 18 19 20n,
2 2 2 2 2 2 2 2 2 2- - - - - _. - -
I 3 2 2 2 2 2 2 2 2 2 3 3 3 3 3 3
- - .- - .- .., - - - - - - - - .-4 2 2 2 3 3 3 3 3 3 3 3 4 4 4 4 4
9 9 - - - .- '- - - - - - ,,- - - -5 2 2 3 3 3 3 3 4 4 4 4 4 4 4 5 5 5
9 10 10 U II - - - - - +- - - - - - -6 2 2 3 3 3 3 4 4 4 4 5 5 5 5 5 5 6 6
- 9 10 11 12 12 f3 13 13 13 - - - - - - - .-7 2 2 3 3 3 4 4 5 5 5 5 5 6 6 6 6 6 <)
- - 11 12 13 13 14 14 14 14 15 IS 15 - -- .- _.. --8 2 3 3 3 4 4 5 5 5 6 6 6 6 6 7 7 7 7
- - II 12 13 14 14 15 IS 16 16 16 16 17 17 17 17 n9 2 3 3 4 4 5 5 5 6 6 6 7 7 7 7 8 & 8
-- - - 13 14 14 15 16 [6 16 17 17 1& 18 1& 18 18 1810 2 3 3 4 5 5 5 6 6 7 7 7 7 8 8 8 8 9
- - - 13 14 15 16 16 17 17 18 18 18 19 19 19 20 20II 2 3 4 4 5 5 6 6 7 7 7 8 & 8 9 9 9 9
- -- - 13 14 IS 16 17 17 18 19 19 19 20 20 20 21 2112 2 2 3 4 4 5 6 6 7 7 7 8 S- a 9 9 9 10 10
- - - - 13 14 16 16 17 18 19 19 20 20 21 21 21 22 2213 2 2 3 4 5 5 6 6 7 7 8 8 9 9 9 10 10 to 10
- - - - - IS 16 17 18 19 19 20 20 21 21 22 22 23 2314 2 2 3 4 5 5 6 7 7 8 8 9 9 9 10 10 10 II II
- - - - - 15 16 17 18 19 20 20 21 22 22 23 23 23 2415 2 3 3 4 5 6 6 7 7 8 8 9 9 10 IO II 11 II 12, - - - - -
32

n, 2 3 4 5 I> 7 ~ 9 10 '. 12 13 14 15 16 17 Ig 19 20
n,
16 i 3 4 4 5 6 6 7 8 8 9 9 '10 '10. '11 II' II 12 12
- - - - - .- 17 18 19 20 21 21 22 23 23 24 25 25 2517 2 3 4 4 5 6 7 7 8 9 9' 10 10 II Jl II 12 12 13
- -- - - - - 17 18 19 20 21 22 23 23 24 25 25 26 2618 2 3 4 5 5 6 7 8 8 9 9 10 10 II II 12 12 13 13
- - - - - .- 17 18 19 20 21 22 23 24 25 25 26 26 2719 2 3 4 5 6 6 7 8 8 9 10 10 II II 12 12 13 13 13
- - '- -- - -- 17 18 20· 21 22 23 23 24 25 26 26 27 2720 2 3 4 5 6 6 7 8. 9 9 10 10 Il 12 12 13 13 13 14
- - - - - - 17 1.8 20 21 22 23 24 25 25 26 27 27 28
Statistical Analysis andInterpretation of Data:
Nonparametric Tests
~
Table 3
ProplJrtions of Area for the X' Distribution
II
Fordf =: 1.2 For df "" 30
Proportion of area
df 0.995 0.990 0.975 0.950 0.900 0.500 0.100 0.050 0.025 0.010 0.005
I 0.00004 0.0011l6 0.00098 0.00393 0.0158 0.455 2..71 3.84 5.02 6.63 7.882 0.0100 0.0201 0.0506 0.103 0.211 1.386 4..61 5.99 7.38 9.21 10.603 0.072 0.115 0.216 0.352 0.584 2.366 6.25 7.81 9.35 11.34 12.844 0.207 0.297 0.484 0.711 1.064 3.357 7.78 9.49 11.14 13.28 14.865 0,412 0.554 0.831 1./45 1.61 4.251 9.24 11.07 12.83 15.09 16.75
6 0.676 0.872 1.24 1.64 2.20 5.35 10.64 12.59 14.45 16.81 18.557 0.989 1.24 1.69 2.17 2.83 6.35 12.02 14.07 16.01 18.48 20.288 1.34 1.65 2.18 2.73 3.49 7.34 13.36 15.51 17.53 20.09 21.969 1.73 2.09 2.70 3.33 4.17 8.34 14.68 16.92 19.02 21.67 23.59
10 2.16 2.56 3.25 3.94 4.87 9.34 15.99 18.31 20.48 23.21 25.19
11 2.60 3.05 3.82 4.57 5.58 10.34 17.28 19.68 21.92 24.73 26.7612 3.07 3.57 4.40 5.23 6.30 11.34 18.55 21.03 23.34 26.22 28.3013 3.57 4.11 5.01 5.89 7.04 12.34 19.81 22.36 24.74 27.69 29.8214 4.07 4.66 5.63 6.57 7.79 13.34 21.06 23.68 26.12 29.14 31.3215 4.60 5.23 6.26 7.26 8.55 14.34 22.31 25.00 27.49 30.58 32.80
16 5.14 5.81 6.91 7.96 9.31 15.34 23.54 26.30 28.85 32.00 34.2717 5.70 6.41 7.56 8.67 10.09 16.34 24.77 27.59 30.19 33.41 35.7218 6.26 7.01 8.23 9.39 10.86 17.34 25.99 28.87 31.53 34.81 37.16i9 6.84 7.63 8.91 10.12 11.65 18.34 27.20 30.14 32.85 36.19 38.5820 7.43 8.26 9.59 10.85 12.44 19.34 28.41 31.41 34.17 37.57 40.00
11 8.03 8.90 10.28 11.59 13.24 20.34 29.62 32.67 35.48 38.93 41.4022 8.64 9.54 10.98 12.34 14.04 21.34 30.81 33.92 36.78 40.29 42.8023 9.26 10.20 11.69 13.09 14.85 22.34 32.01 35.17 38.08 41.64 44.1824 9.89 10.86 12.40 13.85 15.66 23.34 33.20 36.42 39.36 42.98 45.5625 10.52 11.52 13.12 14.61 16.47 204 34.38 37.65 40.65 44.31 46.93
26 /1.16 1220 '13.84 15.38 1729 25.34 35.56 38.89 41.92 45.64 48.2927 11.81 12.83 14.57 16.15 18.11 26.34 36.74 40.11 43./9 46.96 49.642X 12.46 13.56 15.3/ 16.93 18.94 27.34 37.92 41.34 44.46 48.28 50.9929 /3./2 14.26 16.05 17.71 19.77 28.34 39.09 42.56 45.72 49.59 5234
To 1179 14.95 16.79 /8.49 20.60 29.34 40.26 43.77 46.98 50.89 53.674,) 20.71 22.16 24.43 16.51 29.05 39.34 51.81 55.76 59.34 6>.34 66.77SA 27.99 29.71 32.36 34.76 3769 49.33 63.17 67.50 71.42 76.15 79.49(-,) 35.53 '17.43 40.48 43.19 46.46 59.33 74.40 79.08 83.30 88.38 91.95
70 43.28 45.44 4876 51.74 55J3 69.33 85.53 90.53 95.02 100.4 104.2~o 51.17 53.54 51.17 60.39 64.28 79.33 98.58 101.9 106.6 1123 1/6.3~o 59.20 61.75 65.65 69.13 73.29 89.33 107.6 IIJ.I 118./ 124.1 128.3
1"0 67.33 7006 74.22 77.93 8236 99.33 118.5 124,) 129.6 135.8 140.2
33
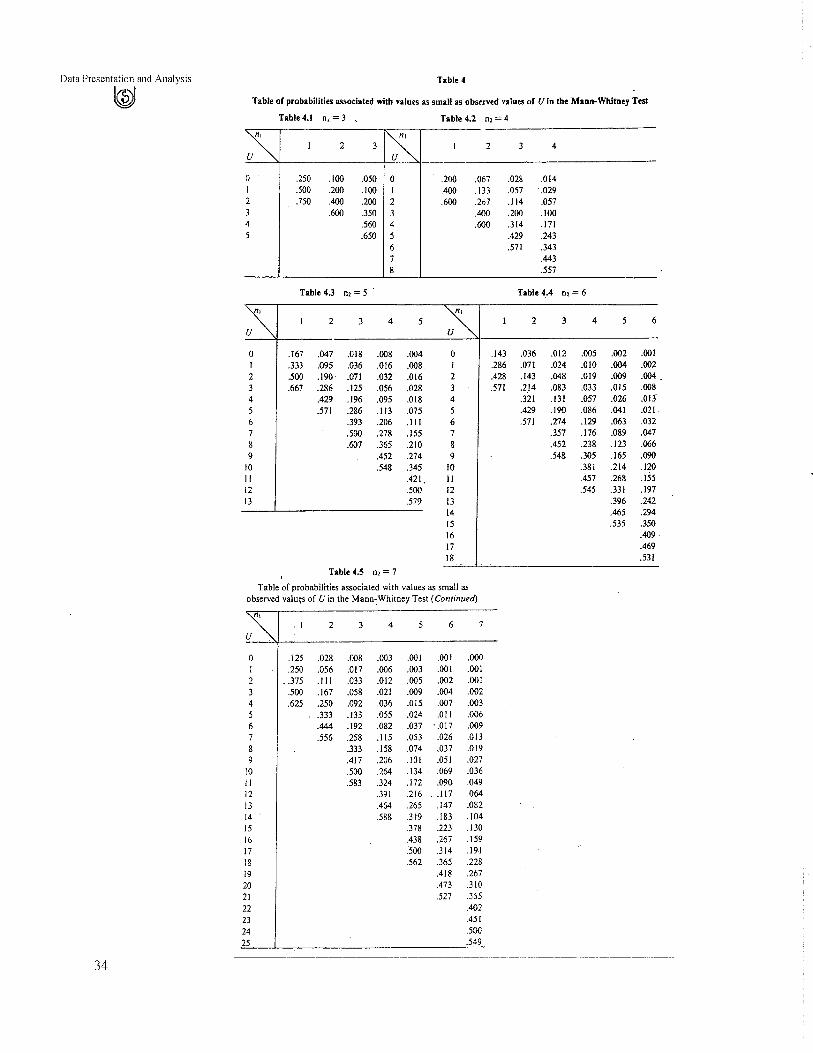
Data Presentation and Analysis
~Table 4
Table of probabilities associated with values as small as observed values of Uln the Mann-Whitney Test
Table 4.1 n, =3 , Table 4.2 n, =4
~ I 2 3~ I 2 3 4
0 .250 .100 .050 0 .200 .067 .028 .014I .500 .200 .100 I .400 .133 .057 .0292 .750 .400 .200 2 .600 .267 .114 .0573 .600 .350 3 .400 .200 .1004 .560 4 .600 .314 .1715 .650 5 .429 .243
6 .571 .3437 .4438 .557
Table 4.3 n, = 5 . Table 4.-4 n, = 6
~ I 2 3 4 5 ~ I 2 3 4 5 6
0 .167 .047 .018 .008 .004 0 .143 .036 .012 .005 .002 .001I .333 .095 .036 .016 .008 . I .286 .071 .024 .010 .004 .0022 .500 .190, .071 .032 .016 2 ,428 .143 .048 .019 .009 .0043 .667 .286 .125 .056 .028 3 .571 .2.1 4 .083 .033 .015 .0084 .429 .196 .095 .018 4 .321 .131 .057 .026 .013'
5 .571 .286 .113 .075 5 .429 .190 .086 .041 .021.
6 .393 .206 .111 6 .571 .274 .129 .063 .0327 .500 .278 .155 7 .357 .176 .089 .047
8 .607 .365 .210 8 .452 .238 .123 .0669 .452 .274 9 .548 .305 .165 .090
10 .548 .345 10 .381 .214 .120II .421 11 .457 .268 .15512 .500 12 .545 .331 .19713 .579 13 .396 .242
14 .465 .29415 .535 .35016 .409·17 .46918 .531..
Table 4.5 n, = 7
Table of probabilities associated with values as small asobserved valu~s of U in the Mann-Whitney Test (Continued)
. I 2 3 4 5 6
34
!!0 .125 .028 .008 .003 .001 .001 .000I .250 .056 .017 .006 .003 .001 .0012 ..375 .111 .033 .012 .005 :002 .0013 .500 .167 .058 .021 .009 .004 .0024 .625 .250 .092 .036 .015 .007 .0035 .333 .133 .055 .024 .011 .0066 .444 .192 .082 .037 '.017 .0097 .556 .258 .115 .053 .026 .0138 .333 .158 .074 .037 .0199 .417 .206 .101 .051 .027
10 .500 .264 .134 . .069 .036II .583 .324 .172 .090 .04912 .391 .216 .. 117 .06413 .464 .265 .147 .08214 .588 .319 .183 .10415 .378 .223 .13016 .438 .267 .15917 .'500 .314 .19118 .562 .365 .22819 .418 .267
20 .473 .31021 .527 .355
22 .402
23 .451
24 .500
25 .549
------- -------------- - - ------------------_ .._---------------- - -- ------------------

Table 4.6 n, == 8 Statistical Analysis andInterpretation of Data:
Table of probabilities associated with values as small as observed values of U in the Nonparametric TestsMann-Whitney Test (Continued) l®J
n,2 3 4 5 ~ , 7 rNormal
U
0 .111 .022 ':006 .002 -t)01 . .000 .000 .000 3.308 .001I .222 .044 .012 .004 .002 .001 .000 .000 3.203 .0012 .333 .089 .024 .008 .003 .001 .001 .000 3.098 .0013 .444 .133 .042 .014 .005 002 .001 .001 2.993 ,0014 .556 .200 .067 .024 .009 .004 .002 .001 2.888 0025 .267 .097 .036 .015 .006 .003 .001 2783 .0036 .356 .139 .055 :023 .010 .005 .002 2.678 .0047 .444 .188 .077 .033 .015 .007 ,003 2,573 .0058 .556 .218 .107 .047 .021 .010 .005 2.468 .0079 315 .141 .064 .030 .014 .007 2.363 .009
10 .387 .184 .085 .041 .020 .010 2.258 .012II .461 .230 .111 .054 .027 .014 2.153 .01612 .539 .285 .142 .071 .036 ,019 2.048 .02013 :341 .177 .091 .047 '.025 1.91.1 .02614 .404 .217 .114 .060 .032 1.833 .03315 .467 .262 .141 .076 .041 1.733 .04416 .533 .311 .172 .095 .052 1.628 .05217 .362 .207 .116 .065 1.523 .06418 .416 .245 .140 .080 1.418 .07819 .472 .286 .168 .097 1.313 .09420 .528 .331 .198 .117 1.208 .1132.1 .377 .232 .139 1.102 .13522 .426 268 .164 .998 15923 .475 .306 .191 893 18524 .525 ,317 .221 .788 .21525 .389 .253 .683 .24726 .433 .287 .578 .28227 .478 .323 .473 .31828 .522 .360 .368 .35629 .399 .263 .39630 .439 .158 .43731 .480 .052 .48132 520


~ 9 10 II 12 13 14 15 '16 17 18 19 20
III
8 18 20 23 26 28 31 33 36 39 44 44 479 2\ 24 27 30 33 36 39 42 45 48 5l 54
10 24 27 31 34 37 41 44 48 51 55 58 6211 27 3\ 34 38 42 46 50 51 57 61 65 6912 30 31 38 42 47 51 55 60 64 68 72 7713 33 37 42 47 51 56 64 65 70 75 80 81i4 36 41 46 5\ 56 61 66 71 77 82 87 9215 39 44 50 55 61 66 72 77 88 88 94 10016 42 48 54 60 65 71 77 83 89 95 101 10717 45 51 57 64 70 77 83 89 96 102 \09 11518 48 55 61 68 75 82 88 95 102 109 116 12319 51 58 65 72 80 87 94 101 109 116 123 13020 51 62 69 77 84 92 100 107 115 123 130 138
Tabl.6
CriticJlI Values of TIN THE WILCOXON MATCHED-PAIRS TEST
Level of significance for one-tailed test.025 .01 .005
Level of significance for two-tailed testn .05 .02 .01
6 07 2 08 4 2 09 6 3 2
10 8 5 3
11 11 7 512 14 10 713 17 13 1014 21 16 1315 25 20 16
16 30 24 2017 35 28 2318 40 33 2819 46 38 3220 52 43 38
21 59 49 4322 66 56 4923 73 62 5524 81 69 6125 89 77 68
I.bl,1
Area Under Norm.1 Curv.
Statistical Analysis andInterpretation of Data:
Nonparametric Tests
~
An entl)' in the table is the proportion under the entire curve which is between z = 0 and a positive value ofz. Artas for negative values for l are obtained by symmetry.
Areas of a standard normal distribution
.0 0.01 .02 .03 .04 .05 .06 .07 .08 .09
.0 .0000 .0040 .0080 .0120 .0160 .0199 .0239 .0279 .0319 .0359
.I .0398 .0438 .0418 .0517 .0551 .0596 .0636 .0675 .0714 .0753
.2 .0793 .0832 .0871 .00IG .0948 .0987 .1026 1064 .1103 .11413 .1179 .1217 ,1255 .1293 .1331 .1368 ,1406 .1443 .1480 .1517.4 .1554 .1591 .1628 .1664 .1700 .1736 ,1772 ,1808 .1844 .1879.5 .1915 .1950 .1985 .2019 .2054 ,2088 .2123 .2157 . ,2190 ,2224
.6 .2257 ,2291 .2324 .2357 .2389 ,2422 .2454 .2486 .2517 .2549
.7 .2580 .2611 .2642 .2673 .2903 .2734 ,2764 .2794 .2823 .2852
.8 .2881 .2910 .2939 .2967 ,2995 ,3023 3051 3078 ,3106 3133,9 .3159 .3186 3212 3238 3264 .3289 3315 .3340 .3365 3389
LO .3413 .3438 ,3461 .3485 .3508 ,3531 3554 3577 3599 3621
37

Data Presentation and Analysis.0 .001 .02 .03 .04 .05 .06 .07 .08 .09
~z
I.J .3643 .3665 .3686 .3708 .3729 .3749 .3170 .3790 .3810 .38301.2 .3849 .3869 .3888 .3907 .3925 .3944 .3962 .3980 .3997 ,40151.3 .4032 .4049 .4066 .4082 .4099 ,4115 .4131 ~4147 ,4162 .41771.4 .4192 .4207 .4222 .4236 .4251 .4265 .4279 .4292 .4306 .43191.5 .4332 .4345 .4357 .4370 .4382 .4394 .4406 .4418 .4429 .4441
1.6 .4452 .4463 .4474 .4484 .4495 .4505 .4515 ,4525 .4535 ,45451.7 ,4554 ,4564 .4573 ,4582 .4591 .4599 .4608 .4616 ,4625 .46331.8 .4641 .4649 .4657 ,4664 .4671 .4678 ,4686 .4693 .4699 .47061.9 ,4713 .4719 .4726 .4732 .4738 .4744 .4750 .4756 .4761 .47672.0 .4772 .4178 .4783 .4788 .4793 .4798 ,4803 ,4808 .4812 .4817
2.1 .4821 .4826 .4830 ,4834 .4838 .4842 .4846 .4850 .4854 ,48572.2 .4861 .4864 .4868 .4871 .4875 .4878 .4881 ,4884 .4887 .48902.3 .4893 .4896 .4898 ,4901 ,4904 .4906 .4909 ,4911 ,49B .49162.4 .4918 .4920 .4922 .4925 .4927 .4929 .4931 ,4932 .4934 .49362.5 .4938 .4940 .4941 .4943 ,4945 .4946 .4948 .4949 .4951 .4952
2.6 .4953 .4955 .4956 ,4957 ,4959 ,4960 .4961 .4962 .4963 :49642.7 .4965 .4966 ,4967 .4968 .4969 ,4970 .4971 .4972 .4973 .49742.8 .4974 .4975 .4976 .4917 .4977 .4978 .4979 .4979 .4980 .49812.9 .4981 .4982 .4982 .4993 .4984 .4984 .4985 .4985 .4986 .49863.0 .4987 .4987 .4987 .4988 .4988 .4989 .4989 .4989 ,4990 ,4990
38


UNIT 9 MULTIVARIATE ANALYSIS OFDATA
Objectives
After studying this unit, you should be able to:
• explain the concept of association that takes place between a dependent variableand a set of independent variables
•. describe the various multivariate procedures available to analyse associative datain the context of any research problem
• interpret the findings of multivariate analysis in any research study
• use a particular technique of multivariate analysis suitable for a particularbusiness research problem.
Structure
9.1 Introduction
9.2 Regression Analysis
9.3 Discriminant Analysis
9.4 Factor Analysis
9.5 Summary
9.6 Self-assessment Exercises
9.7 FUliher Readings
9.1 INTRODUCTIONIn MS-8 (Quantitative Analysis for Managerial Applications), we have covered thefundamentals of statistical inference with special emphasis on hypothesis testing asan effective tool for business decisions. Univariate analysis forms the foundation forthe development of multivariate analysis, which is the topic of discussion in this unit.While the concept of the univariate analysis will continue to draw our attention timeand again, our focus in this unit will be on procedures of multivariate analysis whichhas emerged as the most striking trend in business research methodology.Description and analysis of associative data involves studying the relationship anddegree of association among several variables and therefore multivariate proceduresbecome imperative. We shall attempt to highlight the procedures. We have discussedhere three multivariate techniques, namely Regression Analysis, DiscriminantAnalysis and Factor Analysis.Regression analysis finds out the degree or relationship between a dependent variableand a set of independent variables by fitting a statistical equation through the methodof least square. Whenever we' are interested in the combined influence of severalindependent variables upon a dependent variable our study is that of multipleregression. For example, demand may be influenced not only by price but also bygrowth in industrial production, extent of import prices of other goods, consumer'sincome, taste and preferences etc. Business researchers could use regression forexplaining per cent variation in dependent variable caused by a number ofindependent variables and also problems involving prediction or forecasting.Discriminant analysis is useful in situations where a total sample could be classifiedinto mutually exclusive and exhaustive groups on the basis of a set of predictorvariables. Unlike the regression analysis these predictor variables need not beindependent! For example, one may wish to predict whether sales potential in a'pmiicular marketing territory will be 'good' or 'bad' based on the territory's personaldisposal income, population density and number of retail outlets. You may like toclassify a consumer as a user or non-user of one of the five brands of a product basedon his age, income and length of time spent in his present job. Here the interest iswhat variables discriminate well between groups. 39

Data Presentation and Analysis
l®J
40
Factor analysis provides an approach that reduces a set of variables into one or moreunderlying variables. The technique groups together those variables that seem tobelong together and simultaneously supplies the weighing scheme. For example, 'onemay be interested in the identification of factors that determine the company's image.When the decision maker is overwhelmed by many variables the factor analysiscomes to his help in compressing many variables into a few meaningful dimensions,like service orientation, quality level and width of assOliment in a research projectinvolving 20 retail chains on 35 factors or variables.
9.2 REGRESSION ANALYSISRegression analysis is probably the most widely applied technique amongst theanalytical models of association used in business research. Regression analysisattempts to study the relationship between a dependent variable and a set ofindependent variables (one or more). For example, in demand analysis, demand isversely related to price for normal commodities. We may write D = A - BP, where Dis. the demand which is the dependent variable, P is the unit price of the commodity,an independent variable. This is an example of a simple linear regression equation.The multiple linear regressions model is the prototype of single criterion/ multiplepredictor association model where we would like to study the combined influence ofseveral independent variables upon one dependent variable. In the above example if Pis the consumer price index, and Q is the index of industrial production, we may beable to study demand as a function of two independent variables P and Q and write D= A - BP + C Q as a multiple linear regression model.
The objectives ofthe business researchers in using Regression Analysis are:
I) To study a general underlying pattern connecting the dependent variable andindependent variables by establishing a functional relationship between the two.In this equation the degree of relationship is derived which is a matter of interestto the researcher in his study.
2) To use the well-established regression equation for problems involvingprediction and forecasting.
3) To study how much of the variation in the dependent variable is explained by theset of independent variables. This would enable him to remove certain unwantedvariables from the system. For example, if 95% of variation in demand in a studycould be explained by price and consumer rating index, the researcher may dropother factors like industrial production, extent of imports, substitution effect etc.which may contribute only 5% of variation in demand provided all the causalvariables are linearly independent.
We proceed by first discussing bivariate (simple) regression involving the dependentvariables as a function of one independent variable and then onto multiple regression.
Simple linear regression model is given by
Y=Po +PIXI+ E
where Y is the dependent variable,
X I is independent variable
E is a random error term
Po and PI are the regression coefficients to be estimated.
Assumptions ofthe model
I) The relationship between Y and XI is linear.
2) Y is a random variable which follows a normal distribution from which samplevalues are drawn independently.
3) XI is fixed and is non-stochastic (non-random).
4) The means of all these normal distribution of Y as conditioned by Xi lie on a
straight line with slope PI'
5) E is the error term n IND (0, (52) and independent of X I.

Computational aspect:
Estimated regression line based on sampling is written as lY = a+bX l a and bare
estimates of fJo and fJI obtained through the method of least square by minimising
the error sum of squares.
We state the normal equations without going into any derivations. The normalequations are:
IY=na+bIXI
IXIY=a IXI +b Ix;
Solve these two simultaneous equations you get the values of a and b.
"2Total sum of squares = :s (Y - Y)(TSS)
• "... 'l'7 2RegressiOn sum of squares = :s (Y - I)(RSS)
/'- 2Error sum of squares =:s (Y - Y)(ESS)
Form the ANOVA Table for Regression
~~ n-I T§Ho PI = 0 There is no linear relationship between Y and XI (Y & XI are independent).HI PI -:F 0 There is linear relationship between Yand XI as stated in our model.
If the calculated F exceeds Table F (1, n - 2) at 5% level, reject Ho and accept HI.
Strength of association
It is one thing to find the -regression equation after validating the linearityrelationship; but at this point we still do not know how strong the association is. Inother words, how well does XI predict Y?
This is measured by the co-efficient of determination
2 RSS V·· . Y I' db' d I"I' = -- = anatlon 111 exp a1l1e y regressIOn compare to tota varIatIon.TSS
Higher the 1'2, greater is the degree ofrelationship.
The product moment correlation or simple correlation co-efficient between Y and Xl
is= § =)RSSTSS
1'2 lies between 0 and 1.0 measuring no correlation and I measunng perfectcorrelation.
I' lies between - I and + 1 and the sign of I' is determined by the sign of the sampleregression coefficient (b) in the sample regression equation
lY = a+bX I
Having given a foundation structure with underlying assumptions and possibleanalysis of the model, we now turn our attention to a numerical example to clarify theconcepts. It is needless to mention that analysis of data and interpretation of theresults are of paramount importance.
Suppose that a researcher is interested in consumer's attitude towards nutritional dietof a ready-to-eat cereal.
Statistical Analysis andInterpretation of Data:
Nonparametric Tests
l@J
41

Data Presentation and Analysis
~X J: the amount of protein per standard servingIn the nature of a pretest, the researcher obtains consumer's interval-scaled evaluationof the ten concept descriptions, on a preference rating scale ranging from 1, dislikeextremely, upto 9, like extremely well. The data is given below.
Rater Preferenu raMe (Y) Protein X,1 3 4 IY=43Y=4.32 7 9
3 2 3 SX, =43)(, =4.34 I I5 6 3 ryX, =2476 2 47 g 7 IXr=255g 3 39 9 8
ro 2 I
i) Fit a linear regression model ofY on Xl.ii) Test the validity of the equation statistically.iii) What do you think ofthe strength of association?Answer
i) The normal equations are};Y =na +b};X1 Here n =10};X1Y = a };Xl + b };Xfi.e. lOa + 43b =4343a + 255b =247
solving these two simultaneous equationswe have b == 0.886a = 0.491
Regression Equation is Y=0.491 +0.886Xlsubstitute for all X to get y5
The regression co-efficient b = 0.886 indicates the change in Y per unit change in XI
ii) Validity of the equationANDVA calculation
Total sum of squares (TSS) =}; (Y - Y)2= (3 - 4.3i + (7 - 4.3i +.... + (2 - 4.3i=76.10
• Regression sum of squares (RSS) =}; (Y - Y)2 •=(4.034 - 4.3)2 + (8.464 - 4.3)2 +....+ (1.377 - 4.3)2 =55.01
• Error sum of squares = }; (Y - Y)2 =(- 1.034i +(- 1.464)2 + '" + (O.623i=21.09
• Table of Actual Vs predicted
42
ActualY3721628392......Y=4.3
PredIctedY
4.0348.4643.1481.3773.1484.0346.6923.1487.5791.377
Enory-y
- Ul34- 1.464-1.l48-0.377- 2.852-2.034- 1.308- 0.148- 1.422-0.623
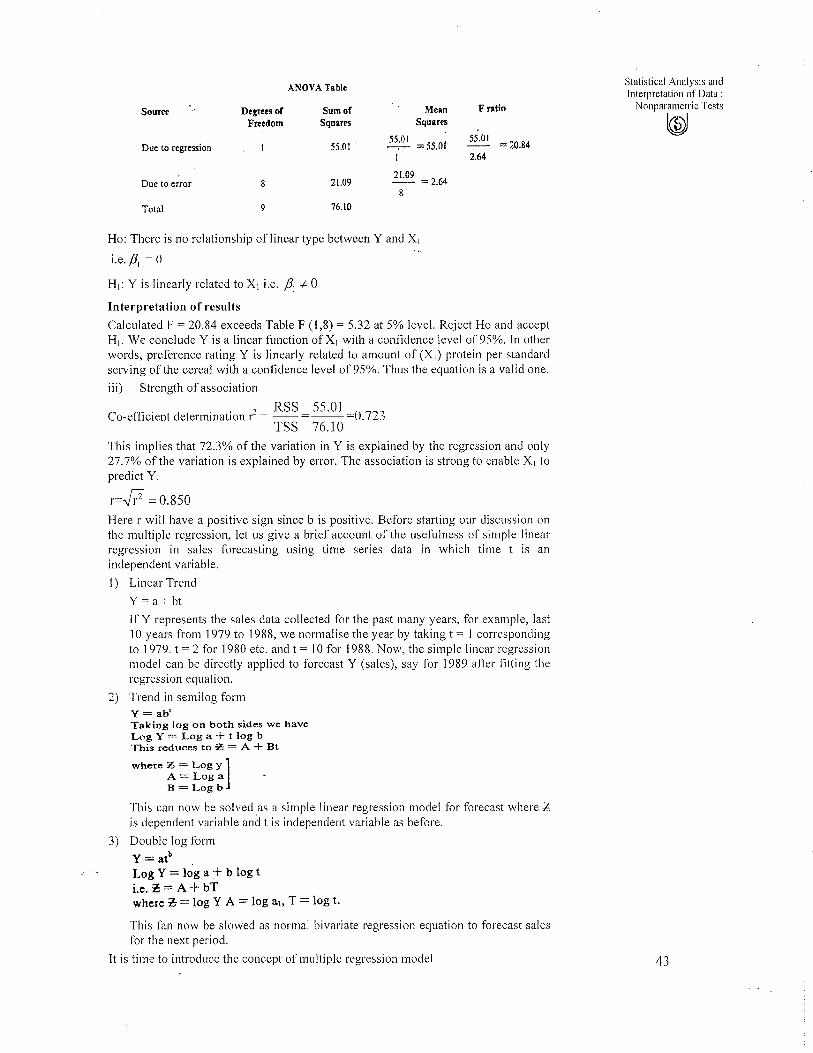
ANOVA Table
SOUTce Degrees of Sum of Mean F ratio
Freedom Squares Squares
55:0 I = 55.0t55.01
'" 20.84Due to regression 55.01I 2.64
Due to error 8 21.09 21.09 =2.64
8
Total 9 76.10
Ho: There is no relationship oflinear type between Y and XI
i.e. /31 = 0
HI: Y is linearly related to Xl i.e. /3] *- 0
Interpretation of results
Calculated F = 20.84 exceeds Table F (1,8) = 5.32 at 5% level. Reject Ho and acceptHI. We conclude Y is a linear function of Xl with a confidence level of 95%. In otherwords, preference rating Y is linearly related to amount of (Xl) protein per standardserving of the cereal with a confidence level of95%. Thus the equation is a valid one.
iii) Strength of association
. •• 2 RSS 55.01 0723Co-efficIent determmatlOn r = --=--= .TSS 76.10
This implies that 72.3% of the variation in Y is explained by the regression and only27.7% of the variation is explained by error. The association is strong to enable Xl topredict Y.
r=# =0.850Here r will have a positive sign since b is positive. Before starting our discussion onthe multiple regression, let us give a brief account of the usefulness of simple linearregression in sales forecasting using time series data in which time t is anindependent variable.
1) Linear Trend
Y = a + bt
If Y represents the sales data collected for the past many years, for example, last10 years from 1979 to 1988, we normalise the year by taking t = I correspondingto 1979. t = 2 for 1980 etc. and t = 10 for 1988. Now, the simple linear regressionmodel can be directly applied to forecast Y (sales), say for 1989 after fitting theregression equation.
2) Trend in semi log form
Y=ab'Taking log on both sides we haveL,'g Y = Log a + t log bThis reduces to ;e = A + Bt
where ~ = Log y ]A= Log aB = Log b
This can now be solved as a simple linear regression model for forecast where:z:,is dependent variable and t is independent variable as before.
3) Double log form
y= atb
Log Y ::::: log a + b log t
Le. :t: = A + bTwhere 'h =log Y A = log at, T = log t.
This fan now be slowed as normal bivariate regression equation to forecast salesfor the next period.
It is time to introduce the concept of multiple regression model
Statistical Analysis andInterpretation of Data:
Nonparametric Tests
l@J
43

Data Presentation and Analysis
~Y=~O+~IXI +~2X2"""+~kXk+E
The assumptions are exactly same as simple linear regression except that you add X],Xb Xk in the place of XI because Y is linearly related to XI Xk and ouraim is to understand the combined influence of the K factors X], XL Xk on Y. Tounderstand the concept clearly, let us study a case of 2 independent variables andwrite the model as
Y=~o +~IXI +~2X2+ E
so that lY = a + b XI + cX2 being the estimated regression equation where we addone more independent variable X2 in the model. Suppose we extend the previousexample of bivariate regression on preference rating Vs. protein (Xl) by adding X2:
the percentage of minimum daily requirements of vitamin D per standard serving. Letus see how the multiple regression model emerges to explain the variation in thedependent variable Y caused by XI and X2• Let us look at the following table givingthe data on Y, X], and X2 •
Rater
I23456789
10
Preferente Ratingy3721628392
ProteinX,
493[
347381
VitaminDX,
27I2349273
2:Y~' 432:X 1 =43:;;X, =40
:;;YX, = 247:!:YX, =232
XX; = 255XX; = 226
XX,X, = /29
44
The normal eq..uations are:
I Y=Na +b I Xl +C I X2I YX1 = a IXI +b I xi +c I Xl X2ZYX2 =a IX2 +b I XIXl +C ZX~
lOa + 43b + 40c = 4343a + 255b + 229c = 24740a + 229b + 226c = 232Solving for a, band c we havea=0.247b = 0.493c=0.484
IV = 0.247 + 0.493 XI +0.484X2
Here band c are called partial regression co-efficients, b = 0.493 denotes the change
in IV per unit change in Xl when X2 is held constant. Similarly c = 0.484 denotes the
change in lY per unit change in X2 when XI is held constant.By now you must have noticed the cumbersome calculations involved when thenumber of variables increase and becomes extremely difficult when the number ofvariables is more than 3. One has to resort to computer based regression models. Infact it may be mentioned here that all multivariate procedures require the help ofcomputer when the variables and observations are large. As before we can calculatethe other co-efficients like R2 co-efficient of multiple determination and R multiplecorrelation co-efficient and also ANOVA for hypothesis testing. The author hasdeveloped his own user friendly program for multiple regression with aconversational style based on IBM PC MS DOS. We will use the output of theprogram and interpret the results of our problem which is the most important aspectfor us.Multiple Linear RegressionNumber of Variables ? 3Number of Observations? 10WANT TO CHANGE NUMBER OF VARIABLESINUMBER OFOBSERVATIONS (Y OR N)? NNAME OF VARIABLE # 1 ? YNAME OF VARIABLE # 2 ? XlNAME OF VARIABLE # 3 ? X2

DATA GATHERED FOR VARIABLE Y:PERIOD # I 3PERIOD # 2 7PERIOD # 3 2PERIOD # 4 IPERIOD # 5 6PERIOD # 6 2PERIOD # 7 8PERIOD # 8 3PERIOD # 9 ? 9PERIOD # 10 ? 2
DATA GATHERED FOR VARIABLE Xl:PERIOD # I ? 4PERIOD # 2 ? 9PERIOD # 3 ? 3PERIOD # 4 ?' I·PERIOD # 5 ? 3PERIOD # 6 ? 4PERIOD # 7 ? 7PERIOD # 8 '7 3PERIOD # 9 7 8PERIOD # 10 ? I
DATA GATHERED FOR VARIABLE X2:PERIOD # I 7 2PERIOD # 2 ? 7PERIOD # 3 ? IPERIOD # 4 ? 2PERIOD # 5 7 3PERIOD # 6 ? 4PERIOD # 7 7 9PERIOD # 8 ? 2PERIOD # 9 ? 7PERIOD # 10 ? 3
Correlation MatrixI .85 .85
.85 I .84
.85 .84 IVariance Covariance Matrix
2.91 6.9 6.676.9 2.79 6.336.67 6.33 2.71
Statistical Analysis andInterpretation of Data:
Nonparametric Tests
l@J
VariableYXIX2
CONTINUE?YCONTINUE?Y
Mean4.34.34
Std Deviation2.9078442.7908582.708013
Regression Equation
Dependent Variable : Y
Independent variable
XlX2CONSTANT
Determination Co-efficientCorrelation Co-efficient
'F-TestDegrees of FreedomSum of squares of error
CONTINUE?CONTINUE? Y
ESTlMATED BETA %COEFFICIENT
.49 .49
.48 .45.2471704
,78.89
12.652.7
16.49
Errors
.34
.35
T-Test
1.471.4
45
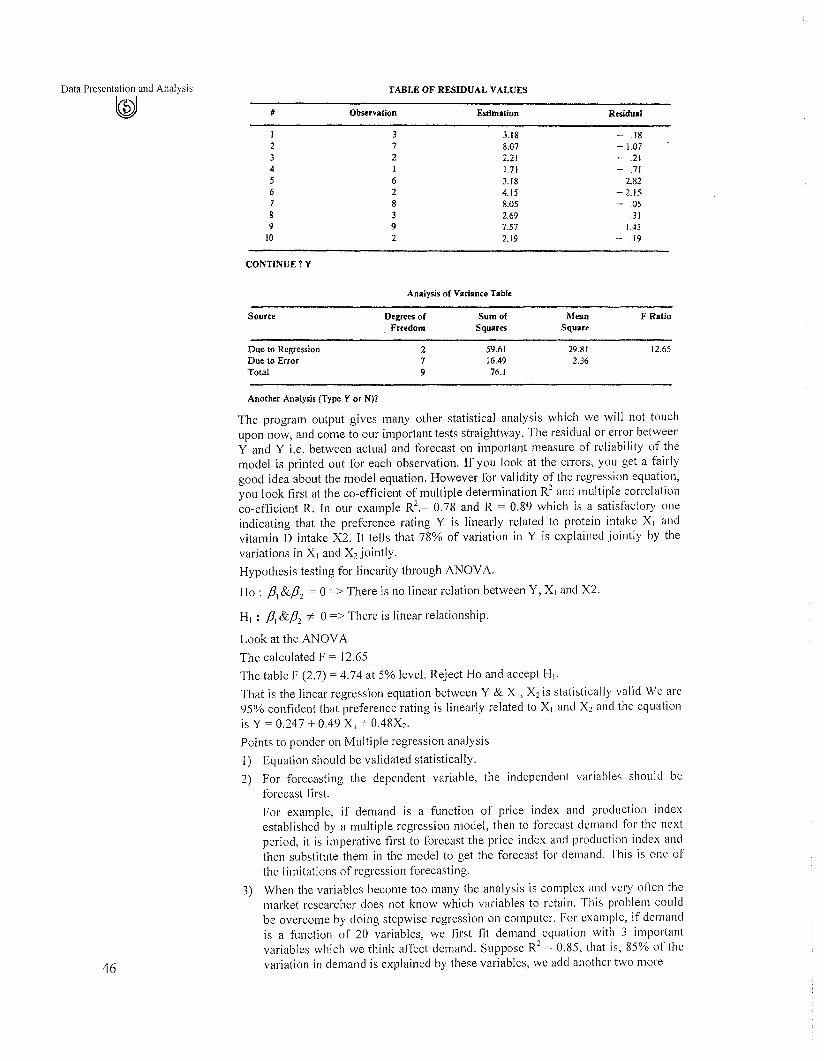
TABLE OF RESIDUAL VALUESData Presentation and Analysis
l@J # Observation Estimation
I 3 3.182 7 8.073 2 2.2/4 I 1.715 6 3.186 2 4.157 8 8.058 3 2.699 9 7.57
10 2 2.19
CONTINUE tv
Analysis of Variance Table
Re$idual
- .18- 1.07- .21- .71
2.82-2.15- .05
.3l1.43
- .19
Source
Due to RegressionDue to ErrorTotal
Another Analysis (Type Y or N)?
Degrees of. Freedom
279
SumoCSquares
59.6116.4976.1
MeanSquare
29.812.36
F Ratio
12.65
46
The program output gives many other statistical analysis which we will not touchupon now, and come to our important tests straightway. The residual or error betweenY and Y i.e. between actual and forecast on important measure of reliability of themodel is printed out for each observation. If you look at the errors, you get a fairlygood idea about the model equation. However for validity of the regression equation,you look first at the co-efficient of multiple determination RZ and multiple correlationco-efficient R. In our example RZ.= 0.78 and R = 0.89 which is a satisfactory oneindicating that the preference rating Y is linearly related to protein intake XI andvitamin D intake X2. It tells that 78% of variation in Y is explained jointly by thevariations in XI and Xzjointly.
Hypothesis testing for linearity through ANOVA.
Ho : PI &pz = 0 => There is no linear relation between Y, X Iand X2.
HI : PI &pz *- 0 => There is linear relationship.
Look at the ANOVA
The calculated F = 12.65
The table F (2.7) = 4.74 at 5% level. Reject Ho and accept HI'
That is the linear regression equation between Y & X], Xz is statistically valid We are95% confident that preference rating is linearly related to XI and Xz and the equationis Y = 0.247 + 0.49 XI + 0.48Xz.
Points to ponder on Multiple regression analysis
I) Equation should be validated statistically.
2) For forecasting the dependent variable, the independent variables should beforecast fi rst.
For example, if demand is a function of price index and production indexestablished by a multiple regression model, then to forecast demand for the nextperiod, it is imperative first to forecast the price index and production index andthen substitute them in the model to get the forecast for demand. This is one ofthe limitations of regression forecasting.
3) When the variables become too many the analysis is complex and very often themarket researcher does not know which variables to retain. This problem couldbe overcome by doing stepwise regression on computer. For example, if demandis a function of 20 variables, we first fit demand equation with 3 importantvariables which we think affect demand. Suppose RZ
= 0.85, that is, 85% of thevariation in demand is explained by these variables, we add another two more

variables of impOliance to make five independent variables. Now if R2= 0.95 we can
as well stop adding further variables as the contribution may not appreciably improvethe situation. We can thus visualise demand as a function of just 5 variables. Thevarious permutations of changing and adding variables is possible only with the helpof a computer. The important point to remember is that the cut off point for thenumber of variables to be added should be based on the increase every time you geton R2
• The moment the increase is marginal, stop adding variables.
4) If the independent variables among themselves are highly correlated, then we arefacing the problem of 'multicollinearity'. Normally we say that the paIiialregression co-efficient with respect to XI implies change in Y per unit change inXI provided X2,X2 .... are held constant. This poses a serious problem if there ismulticollinearity. One way to overcome multicollinearity is to drop certainvariables from the model if the corresponding standard error of regression coefficient are unduly large. Another method is to see whether the original set couldbe transformed into another linear composite so that the new variables areuncorrelated.
Activity 1
List out the limitations ofregression analysis for forecasting.
Activity 2
In what ways can multiple regression be used to forecast some industry's sales?
Activity 3
Zippy Cola is studying the effect of its latest adveliising campaign. People chosen atrandom were called and asked how many cans of Zippy Cola they had bought in thepast week and how many Zippy Cola advertisements they had either read or seen inthe past week.
Statistical Analysis andInterpretation of Data:
Nonparametric Tests
l@J
X (number of ads)
Y (cans purchased)
49301625
12147635610
a) Develop the estimating equation that best fits the data.
b) Calculate the sample co-efficient of determination and interpret it.
c) Forecast the number of cans purchased when the numbers of advertisementsseen or read in the past week were 10.
47

Data Presentation and Analysis
~9.3 DISCRIMINANT ANALYSISIt has been pointed out earlier, that the discriminant analysis is a useful tool forsituations where the total sample is to be divided into two or more mutually exclusiveand collectively exhaustive groups on the basis of a set of predictor variables. Forexample, a problem involving classifying sales people into successful andunsuccessful; classifying customers into owners or and non-owners of video taperecorder, are examples of discriminant analysis.
Objectives of two group discriminant analysis:
1) Finding linear composites of the predictor variables that enable the analyst toseparate the groups by maximising among groups relative to with in-groupsvariation.
2) Establishing procedures for assigning new individuals, whose profiles but notgroup identity are known, to one ofthe two groups.
3) Testing whether significant differences exist between the mean predictorvariable profiles of the two groups.
4) Determining which variables account most for intergroup differences in meanprofiles.
A numerical example
Let us return to the example involving ready-to-eat cereal was presented in theregression analysis. However, in this problem the ten consumer raters are simplyasked to classify the cereal into one of two categories like versus dislike. The data isgiven below: Here again
XI : The amount of protein (in grams) per standard serving.
X2 : The percentage of minimum daily requirements of vitamin D per standardserving.
Also shown in the data table are the various sums of squares and cross products, themeans on XI and X 2 of each group, and total sample mean.
Consumer evaluations (like versus dislike) of ten cereals varying in nutritionalcontent
4 4.4 Sum 90
Protein VitsmlnD xix, X~
2 4 43 2 '14 5 165 4 256 7 36
Person Evaluation
I Dislke2 Dislike3 Dislike4 Dislike5 Dislike
Mean
6 Like7 Like8 Like9 Like
10 Like
Mean
Grand MeanStandard deviation
The grand mean is XI = 6.5 X2 = 5.4
789
10U
9
6.53.028
64769
6.4 Sum
5.42.01l
49
6481
10012!
415
xl X,X,
!6 84 6
25 2016 204'1 42
110 ~'5
36 4216 324'1 6336 608! '1'1
218 296
48
We first note from the table that the two groups are much more widely separated onXI (Protein) than they are on X2 (Vitamin D). If we were forced to choose just one ofthe variables, it would appear that XI is a better bet than X2• However, there isinformation provided by the group separation on X2, so we wonder if some linearcomposite of both X I and X 2 could do better than X I alone. Accordingly, we have thefollowing linear function:
Z = KIX I + K 2X 2 where K I and K 2 are the weights that we seek.
But how shall we define variability? In discriminant analysis, we are concerned with

Total
2026.4
16
the ratio of two sums of squares after the set· of scores on th({ linear composite hasbeen computed. One sum of squared deviations represents the variability of the twogroup means on the composite around their grand mean. The second sum of squareddeviations represents the pooled variability of the individual cases around theirrespective group means also on the linear composite. One can then find the ratio ofthe first sum of squares to the second. It is this ratio that is to be maximised throughthe appropriate selection of K I and K2• Solving for K I and K2 involves a proceduresimilar to the one encountered in the multiple regression. However, in the presentcase, we shall want to find a set of sums of squares and cross products that relate to
the variation within groups. For ease of calculation let us define XI = XI - XI and X2
= X2 - X 2 (i.e. each observation measured from its mean).
Solving for K I and K2.
Mean corrected sums of squares and cross productsDislike... Like...
Ixl = I(X, - Xl)' =I xl- Nxl = 10 10Ixi = k(X, - X,)' = I xl- Nxl = 13.2 13.2
IX1~: = I (Xl - Xl)(X, - X:') =I1X1X, - NX;X, = 8 8
The normal equations are
KI 4 x1 + K2 4XIX2 =XI (Likers) - XI (dislikers)
KI 4XIX2 + K2 4 x~ =X2 (Likers) - X2 (Dislikers)
20 K, + 16 K2 = 9 - 4 =5
16 KI + 26.4 K2 =6.4 - 4.4 =2
Solving these two simultaneous equations, we have K1 = 0.368, K2 =- 0.147Discriminant function -r =0.368X1 - 0.147X2
We can also find discriminants scores for the means of the two groups and the grandmean.
r (dislikers) =0.368 (4) - 0.147 (4.4) =0.824r (likers) =0.368 (9) - 0.147 (6.4) =2.368~ (grand means) = 0.368 (6.5) - 0.147 (5.4) = 1.596
We note that the discriminant function "favours" XI by giving about 2.5 times the(absolute value) weight (K I = 0.368 versus K2= - 0.147) to XI as is given to X2.
The discriminant scores of each person are shown below. Each score is computed bythe application of the discriminant function to the persons original XI and X2 Values.
Statistical Analysis andInterpretation of Data:
Nonparametric Tests
l@J
Person12345
Dislike... I
Discriminant Score0.1480.8090.7351.250L176
Person6789
10
Liken
Discriminant Score1.6912.3532.2792.7942.721
Mean 0.824 MeanGrand Mean 1.596
2.368
Between group variability:
5 (0.824 - 1.596i + 5 (2.368 - 1.59~)2 == 5.96
Within group variability
Dislikers (0.148 -0.824)2 + (0.809 - 0.824)2 +.... + (1.176 0.824)" = 0.772
Likers (1.691 - 2.368)" + (2.353 - 2.368)2 +.... + (2.721 + 2.368)2 = 0.7721.544
. .. .. C 5.96 386Dlscnmmant cntenon =-- = .1.544
Since the normal equations for solving KI and K2 are obtained by maximising theratio between group and within group variance the discriminant criterion as 49
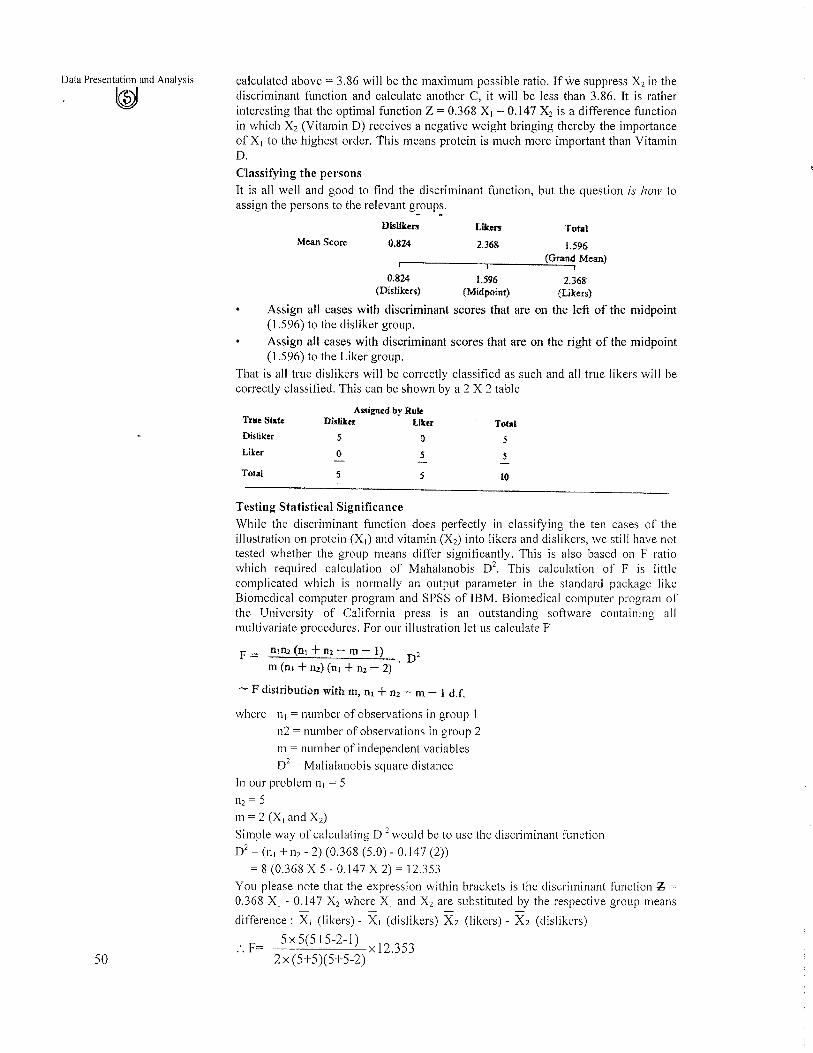
Data Presentation and Analysis
l@Jcalculated above = 3.86 will be the maximum possible ratio. Ifwe suppress X2in thediscriminant function and calculate another C, it will be less than 3.86. It is ratherinteresting that the optimal function Z = 0.368 Xl - 0.147 X2 is a difference functionin which X2 (Vitamin D) receives a negative weight bringing thereby the importanceof Xl to the highest order. This means protein is much more important than VitaminD.
Classifying the persons
It is all well and good to find the discriminant function, but the question is how toassign the persons to the relevant groups.
Liken
2.3680.824
Disliken
Mean ScoreTotal
1.596
r-. tl.::G::r::an::;.d Mean)
I
0.824 L596 2.36&(Dislikers) (Midpoint) (Likers)
Assign all cases with discriminant scores that are on the left of the midpoint(1.596) to the disliker group.
Assign all cases with discriminant scores that are on the right of the midpoint(1.596) to the Liker group.
That is all true dislikers will be correctly classified as such and all true likers will becorrectly classified. This can be shown by a 2 X 2 table
Assigned by RuleTrue State Disliker Liker TotalDisliker 5 0 5Liker 0 5 5
Total 5 5 10
50
Testing Statistical Significance
While the discriminant function does perfectly in classifying the ten cases of theillustration on protein (XI) and vitamin (X2) into likers and dislikers, we still have nottested whether the group means differ significantly. This is also based on F ratiowhich required calculation of Mahalanobis D2. This calculation of F is littlecomplicated which is normally an output parameter in the standard package likeBiomedical computer program and SPSS of IBM. Biomedical computer program ofthe University of California press is an outstanding software containing allmultivariate procedures. For our illustration let us calculate F
F == n,nz (nl + n2 - m - I) . D2m (n, + n2) (n, + n2 - 2)
- F distribution with m, nl + n2 - m - I d.l
where nl = number of observations in group 1
n2 = number of observations in group 2
m = number of independent variables
D2= Malialanobis square distance
In our problem nl = 5
n2 = 5
m = 2 (XI and X2)
Simple way of calculating D 2would be to use the discriminant function
D2= (nl + n2 - 2) (0.368 (5.0) - 0.147 (2»
= 8 (0.368 X 5 - 0.147 X 2) = 12.353
You please note that the expression within brackets is the discriminant function 'b =
0.368 XI - 0.147 X2 where Xl and X2 are substituted by the respective group means- - - -
difference: Xl (likers) - XI (dislikers) X 2 (likers) - X2 (dislikers)
:. F= 5x 5(5+5-2-1) x 12.3532x (5+5)(5+5-2)

25x7 x12.353=13.5112xlOx8
Table F (2,7) = 4.74 at 5% level.
Since the calculated F exceeds table F at 5% level, reject Ho and accept HI i.e. thegroup means are not equal in importance with a probability of 95%. This clearlyvalidates the relative importance of XI far higher than X 2•
Brief remarks on Multiple Discriminant analysis
You would have realised by now the complexity of calculations in the discriminantanalysis involving 2 predictors which itself needs computer based solutions when thenumber of observations increases considerable. Multiple discriminant analysis isinvariably carried out by means of computer programs. One of the most flexible andcomprehensive programs in BMD-07 of the biomedical program series of theUniversity of California press. SFSS also has all multivariate procedures. It may bementioned that the basic structure of the bivariate analysis remains same in multiplecase also. What is important for you is interpretation of the results and findings of thestudy.
Activity 4
What are the differences between Regression Analysis and Discriminant Analysis?
Activity 5
List out a few research studies where Discriminant Analysis has possibleapplications.
9.4 FACTOR ANALYSIS
Factor analysis is a generic name given to a class of techniques whose purpose is datareduction and summarisation. Very often market researchers are overwhelmed by theplethora of data. Factor analysis comes to their rescue in reducing the number ofvariables. Factor analysis does not entail partitioning the data matrix into criterionand predictor subsets; rather interest is centred on relationships involving the wholeset of variables. In factor analysis:
I) The analyst is interested in examining the "strength" of the overall associationamong variables in the sense that he would like to account for this association interms of a smaller set of linear composites of the original variables that preservemost of the information in the full data set. Often his interest will emphasizedescription of the data rather than statistical inference.
2) No attempt is made to divide the variables into criterion versus prediction sets.
3) The models are primarily based on linear relationships.
Factor analysis is a "search" technique. The researcher-decision maker does nottypically have a clear priori structure of the number of factors to be identified. Cut offpoints with respect to stopping rules for the analysis are often ad hoc as the outputbecomes available. Even where the procedures and rules are stipulated in advance,the results are more descriptive than inferential.
Statistical Analysis andInterpretation of Data:
Nonparametric Tests
l®J
51

Data Presentation and Analysis
l®JThe procedure involved in computation of factor analysis is extremely complicatedand cannot be carried out effectively without the help of computer. Packages likeSPSS, SAS and Biomedical programs (BMD) can be used to analyse variouscombinations leading to factor reduction. We will make an attempt to conceptualisethe scenario of factor analysis with emphasis on the interpretation of figures.The term "factor analysis" embraces a variety of techniques. Our discussion focuseson one procedure : principal component analysis and the factors derived from theanalysis are expressed as linear equations. These linear equations are ofthe form
F; = a]; Xl +a2;x 2 + a3; x 3 +........+ am; xm
The i factors are derived, and each variable appears in each equation. The a-coefficients indicate the importance of each variable with respect to a particular factor.Co-efficient of zero indicating the variable is of no significance for the factor. Inprincipal component analysis, the factors are derived sequentially, using criteria ofmaximum reduction in variance and non-correlation among factors.
Let us go to a specific example to explain factor analysis and its output.Example : A manufacturer of fabricating pmis is interested in identifYing thedeterminants of a successful salesperson. The manufacturer has on file theinformation shown in the following table. He is wondering whether he could reducethese seven variables to two or three factors, for a meaningful appreciation of theproblem.Data Matrix for Factor Analysis of seven variables (14 sales people)
Salesptrson
Height(X,)
Educations(X,)
Age No. of' Size of(X.) Clilldren (X,) household
(X.)
IQ(X,)
1 67 155 12 27 0 2 1022 69 175 1I 35 3 6 923 71 170 14 32 1 3 III4 70 160 16 25 0 1 II 55 72 180 12 36 2 4 1086 69 170 11 41 3 5 'Xl7 74 195 13 30 1 2 1148 68 160 16 32 1 3 1189 70 175 12 45 4 6 12110 71 180 13 24 0 2 921166 145 1039 2 4 10012 75 210 16 26 0 1 10913 70 160 12 31 0 3 10214 71 175 13 43 3 5 112
Can we now collapse the seven variables into three factors? Intuition might suggestthe presence of three primary factors: A maturity factor revealed in age/children/sizeof household, physical size as shown by height and weight, and intelligence ortraining as revealed by education and IQ.The sales people data have been analysed by the SAS program. This program acceptsdata in the original units, automatically transforming them into standard scores. Thethree factors derived from the sales people data by a principal component analysis(SAS program) are presented belowThree-factor results with seven variables.
0.94550
Communality
0.961400.<n7380.860060.955640.967300.947560.94918
III
- 0.30331-0.44273
0.426310.187330.05883
- 0.019530.805241.J57090.16530
II
0.721700.759320.185130.411l60.492470.300070.466961.851360.26448
Sales people characteristicsFactorI
0.590380.452560.80252
-0.86689-0.84930- 0.92582
0.287613.610070.51572
Variable
HeightWeightEducationAgeNo. of childrenSize of houeholdIQSum of squaresVariance summarised
52

Factor Loading: The co-efficients in the factor equations are called "factor loadings"They appear above in each factor column, corresponding to each variable. Theequations are:
F 1 =O.59038xl + 0,45256x2 + 0.80252x3 - 0.86689:<4- O.84930xs - 0.92582x6 + O.28761x7
F2 =O.72170XI + O.75932x2 + O.I8513x3 + 0,41116:<4+ 0,49247x5 + O.30007x6 + 0,46696x7
F3 =- 0.30331xl - 0.44273x2 +0,42631x3 +0.18733:<4-+ 0.5883x5 - 0.01953x6 + 0.80524x7
The factor loadings depict the relative importance of each variable with respect to apmiicular factor. In all the three equations, education eX3) and IQ eX7) have gotpositive loading factor indicating that they are variables of importance in determiningthe success of sales person.
Variance summarised : Factor analysis employs the criterion of maximumreduction of variance - variance found in the initial set of variables. Each factorcontributes to reduction. In our example Factor I accounts for 51.6 per cent of thetotal variance. Factor II for 26.4 per cent and Factor III for 16.5 per cent. Togetherthe three factors "explain" almost 95 percent of the variance.
Communality: In the ideal solution the factors derived will explain 100 per cent ofthe variance in ea h of the original variables, "communality" measures the percentageof the variance in the original variables that is captured by the combination of factorsin the solution.. Thus a communality is computed for each of the original variables.Each variables communality might be thought of as showing the extent to which it isrevealed by the system of factors. In our example the communality is over 85 percent for every variable. Thus the three factors seem to capture the underlyingdimensions involved in these variables.
There is yet another analysis called varimax rotation, after we get the initial results.This could be employed if needed by the analyst. We do not intend to dwell on thisand those who want to go into this aspect can use SAS program for varimax rotation.
In the concluding remarks, it should be mentioned that there are two importantsubjective issues which should be properly resolved before employing factor analysismodel. They are:
1) How many factors should be employed in attempting to reduce the data? Whatcriteria should be used in establishing that number?
2) The labelling of the factors is purely intuitive and subjective.
Activity 6
Mention briefly the purpose and uses offactor analysis.
9.5 SUMMARY
In this unit, we have given a brief introduction of the multivariate tools and theirapplicability in the relevant problem areas.
We started the discussion with the regression analysis, which is probably the mostwidely used technique amongst the analytical models of association. We have started
Statistical Analysis andInterpretation of Data:
Nonparametric Tests
~
53

Data Presentation and Analysis
l@J
54
the simple linear regression model first to introduce the concept of regression andthen moved on to the multiple linear regression mode. All the underlyingassumptions of the model have been explained. Both the bivariate and multivariateregression models have been illustrated using the example of preference rating as afunction of protein intakes, and vitamin 0 intake perception in the case of a ready-toeat cereal. The concept of testing the linear equation, contribution made by regressionin explaining variation in dependent variables and strength of association have allbeen explained using ANOVA table. A brief account of the role of regression in salesforecasting involving time series analysis has also been given. The need for resortingto computer solutions for large number of variables and observations has beenbrought out with an actual print out of the example already discussed. The concept ofstepwise regression and the problems encountered in any regression analysis havealso been explained.
Next, we have gone to the discriminant analysis technique-a technique when theinterest is to classify the groups on the basis of a set of predictor variables. We haveexplained the concept of separation by giving examples of classifying sales peopleinto successful and unsuccessful, customers into owners and non-owners etc. Asbefore, we have begun the discussion with discriminant function involving twopredictor variables using the example of 'ready-to-eat cereal problem' but with adifference-classifying the persons into liker group and disliker group. Thediscriminant function, the discriminant criterion and the assignment rule have allbeen explained. Testing the statistical significance using F test based on MahalanobisD2 has also been carried out. We have pointed out that the multiple discriminantanalysis involving more than two predictor variables require the use of computeralthough the basic structure ofthe model does not change.
Factor analysis is the last multivariate tool that we have discussed in this unit. Wehave first mentioned that the fundamental objective of factor analysis is to reduce thenumber of variables in the data matrix. Then it has been pointed out that thecomputation of any factor analysis involves very complex calculation which willhave to be solved using computer packages like SAS. The concepts of "factorloading", "variance summarised" and "communality" have been explained using onepractical example that has been solved by SAS program. The subjective issues like"how many factors?" "what criteria to decide this number?" and "labelling of thefactors" have been mentioned at the end.
As concluding remarks, it may be mentioned here that 1) all multivariate procedurescan be more effectively solved using standard computer packages when the numberof variables and number of observations increase significantly, 2) what is moreimportant is the ability to interpret the results of the market research study involvingmultivariate analysis.
9.6 SELF-ASSESSMENT EXERCISES
I) a) In a demand forecasting study involving a normal commodity, two simple linearregression models are fitted:
D = 8.5 + O.22p (r2 = 0.75)
Log 0 = 1.3 + 0.10 log p (r2 = 0.80)
i) which model would you prefer and why?
ii) mention the dependent and independent variables.
b) A manufacturer of industrial supplies developed the following model forpredicting the number of sales per month
y= 41+ .3X] + .05X2 - 7X3 + IOX4
where Y =Sales per month
X]= Number of manufacturing firms
X2 = Number of wholesale and retail firms
X3= Number of competing firms
X4 = Number of full-time company sales people.
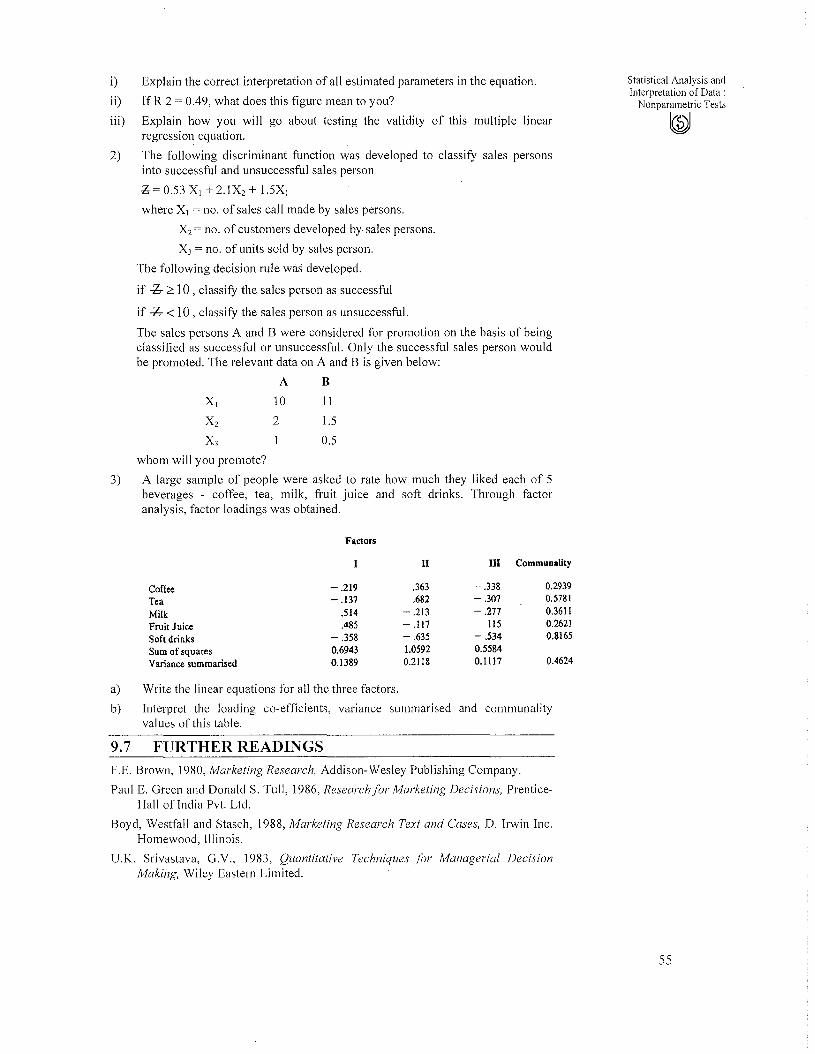
i) Explain the correct interpretation of all estimated parameters in the equation.
ii) IfR 2 = 0.49, what does this figure mean to you?
iii) Explain how you will go about testing the validity of this multiple linearregression equation.
2) The following discriminant function was developed to classify sales personsinto successful and unsuccessful sales person
b = 0.53 XI + 2.1X2 + 1.5XI
where Xl = no. of sales call made by sales persons.
X2 = no. of customers developed by sales persons.
X3 = no. of units sold by sales person.
The following decision rule was developed.
if -b ~ 10, classify the sales person as successful
if -b < 10 , classify the sales person as unsuccessful.
The sales persons A and B were considered for promotion on the basis of beingclassified as successful or unsuccessful. Only the successful sales person wouldbe promoted. The relevant data on A and B is given below:
A BXl 10 II
X2 2 1.5
X3 I 0.5
whom will you promote?
3) A large sample of people were asked to rate how much they liked each of 5beverages - coffee, tea, milk, fruit juice and soft drinks. Through factoranalysis, factor loadings was obtained.
Factors
II III CommunaUty
Coffee -.219 .363 - .338 0.2939
Tea -.137 .682 -.307 0.5781
Milk .514 - .213 - .277 0.3611
FruitJuice .485 - .117 115 0.2621
Soft drinks - .358 - .635 - .534 0.8165
Sum of squares 0.6943 1.0592 0.5584
Variance summarised 0.1389 0.2118 0.1117 0.4624
a) Write the linear equations for all the three factors.
b) Interpret the loading co-efficients, variance summarised and communalityvalues of this table.
9.7 FURTHER READINGSF.E. Brown, 1980, Marketing Research, Addison-Wesley Publishing Company.
Paul E. Green and Donald S. Tull, 1986, Researchfor Marketing Decisions, PrenticeHall ofIndia Pvt. Ltd.
Boyd, Westfall and Stasch, 1988, Marketing Research Text and Cases, D. Irwin Inc.Homewood, Illinois.
U.K. Srivastava, G.V., 1983, Quantitative Techniques for Managerial DecisionMaking, Wiley Eastern Limited.
Statistical Analysis andInterpretation of Data:
Nonparametric Tests
~
55

56
UNIT 10 MODEL BUILDING ANDDECISION-MAKING
Objectives
After reading this unit, you should be able to :
• explain the concepts of model building and decision-making;
• discuss the need for model building in managerial research;
• relate the different types of models to different decision-making situations;
• describe the principles of designing models for different types of managerialresearch/decision-making situations.
Structure
10.1 Introduction
10.2 Models and Model Building
10.3 Role of Models in Managerial Decision-making
lOA Types of Models
10.5 Objectives of Modelling
10.6 Model Building/ Model Development
10.7 Model Validation
10.8 Simulation Models
10.9 Summary
10.10 Key Words
10.11 Self-assessment Exercises
10.12 Further Readings
10.1 INTRODUCTIONA manager, whichever type of organisation he/she works in, very often facessituations where he/she has to decide/ choose among two or more alternative coursesof action. These are called decision-making situations. An illustration of such asituation would be the point of time when you possibly took the decision to join/takeup this management programme. Possibly, you had a number of alternativemanagement education programmes to choose from. Or, at worst, maybe you hadadmission in this programme only. Even in that extreme type of situation you had achoice -whether to join the programme or not! You have, depending upon your owndecision-making process, made the decision.The different types of managerial decisions have been categorised in the followingmanner;1) Routine/Repetitive/Programmable vs.
NonroutinelNonprogrammable decisions.2) Operating vs. Strategic decisions.The routine/ repetitive/ programmable decisions are those which can be taken care ofby the manager by resOliing to standard operating procedures (also called "sops" inmanagerial parlance). Such decisions the manager has to take fairly often and he/sheknows the information required to facilitate them. Usually the decision maker hasknowledge in the form of "this is what you do" or "this is how you process" for suchdecision-making situations. Examples of these decisions could be processing a loan
.' application in a financial institution and supplier selection by a materials manager ina manufacturing organisation.
The non-repetitive/ non-programmable/ strategic decisions are those which have afairly long-term effect in an organisation. Their characteristics are such that no

routine methods, in terms of standard operating procedures, can be developed fortaking care of them. The element of subjectivity/judgement in such decision-makingis fairly high. Since the type of problem faced by the decision maker may varyconsiderably from one situation to another, the information needs and the processingrequired to arrive at the decision may also be quite different.
The decision-making process followed may consist, broadly, of some or all of thesteps given below:
I) Problem definition;
2) IdentifYing objectives, criteria and goals;
3) Generation! Enumeration of alternative courses of action;
4) Evaluation of alternatives;
5) Selection/ choosing the "best" alternative;
6) Implementation of the selected alternative.
All the above steps are critical in decision-making situations. However, in the fourthand fifth steps; i.e., evaluation and selection, models playa fairly important role. Inthis unit we will concentrate on Model Building and Decision-making.
Activity 1
Suppose you have recently bought a Texla Colour TV for your house. Describebriefly the decision process you have gone through before making this choice.
10.2 MODELS AND MODELLINGMany managerial decision-making situations in organisations are quite complex. So,managers often take recourse to models to arrive at decisions.
Model: The term 'model' has several connotations. The dictionary meaning of thisword is "a representation of a thing". It is also defined as the body of informationabout a system gathered for the purpose of studying the system. It is also stated as thespecification of a set of variables and their interrelationships, designed to representsome real system or process in whole or in part. All the above given definitions arehelpful to us.
of Modelling: Models can be understood in terms of their structure and purpose. Thepurpose of modelling for managers is to help them in decision-making. The term'structure' in models refers to the relationships of the different components of themodel.
In case of large, complex and untried problem situations the manager is vary abouttaking decisions based on intuitions. A wrong decision can possibly land theorganisation in dire straits. Here modelling comes in handy. It is possible for themanager to model the decision-making situation and tryout the alternatives on it toenable him to select the "best" one. This can be compared to non-destructive testingin case of manufacturing organisations.Presentation of Models: There are different forms through which Models can bepresented. They are as follows:
1) Verbal or prose models.2) Graphical! conceptual models.3) Mathematical models.4) Logical flow models.Verbal Models : The verbal models use everyday English as the language ofrepresentation. An examPle of such model from the area of materials managementwould be as follows:
"The price of materials is related to the quantum of purchases for many items.As the quantum of purchases increases, the unit procurement price exhibits adecrease in a step-wise fashion. However, beyond a particular price level nofurther discounts are available."
Model Building andDecision-making
l@J
57

Data Presentation and Analysis
~.Graphical Models : The graphical models are more specific than verbal models.They depict the interrelationships between the different variables or parts of themodel in diagrammatic or picture form. They improve exposition, facilitatediscussions and guide analysis. The development of mathematical models usuallyfollows graphical models. An example of a graphical model in the area of projectmanagement is given in Figure.
Resource Availability ~
Active Projects -> Activities --~needingresources
D M Me a ec k t
hs n 0
g d0
n
~Resource
Allocation
Fig. 1: A diagrammatic model o(decision-making for Resource-Constrained Projects
Mathematical Models : The mathematical models describe the relationshipsbetween the variables in terms of mathematical equations or inequalities. Most ofthese include clearly the objectives, the uncertainties and the variables. These modelshave the following advantages:
1) They can be used for a wide variety of analysis.
2) They can be translated into computer programs.
The example of a mathematical model that is very often used by materials managersis the Economic Order Quantity (EOQ). It gives the optimal order quantity (Q) for aproduct in terms of its annual demand (A), the ordering cost per order (Co), theinventory carrying cost per unit (Ci) and the purchase cost per unit (Cp). The modelequation is as follows:
Q = ~(2 * A * Co/Ci * Cp)
Logical Flow Models: The logical flow models are a special class of diagrammaticmodels. Here, the model is expressed in form of symbols which are usually used incomputer programming and software development. These models are very useful forsituations which require multiple decision points and alternative paths. These models,once one is familiar with the symbols used, are fairly easy to follow. An example ofsuch a model for a materials procurement situation with quantity discounts allowed,is as given in Figure 2.
YES NO
Procurementprice = 10
Total cost =1O*Q
ProcurementPrice = 15
Total Cost =15· Q
58 Fig.2: A logical flow model for material procurement decisions with quantitative discountsallowed.

Activity 2
Mention below a mathematical model which has been used for sales forecasting byyour organisation or any organisation you know of.
Activity 3
Think of a production decision situation and present it diagrammatically using logicalflow model.
10.3 ROLE OF MODELLING IN RESEARCH INMANAGERIAL DECISION-MAKING: ANILLUSTRATION
In the previous sections of this unit we have tried to explore the topics of modelbuilding and decision-making. However, we confined ourselves to bits and pieces ofeach concept and their illustration in a comprehensive decision-making situation hasnot been attempted. In this section we will look at a managerial decision-makingsituation in totality and try to understand the type of modelling which may prove ofuse to the decision maker.
The example we will consider here is the case of a co-operative state level milk andmilk products marketing federation. The federation has a number of district leveldairies affiliated to it, each having capacity to process raw milk and convert it into anumber of milk products like cheese, butter, milk powders, ghee, shrikhand, etc. Thediagrammatic model of the processes in this set up is depicted in Figure 3.
I he typical problems faced by the managers in such organisations are that: (a) theamount of milk procurement by the individual district dairies is uncertain, (b) thereare limited processing capacities for different products, and (c) the product demandsare uncertain and show large fluctuations across seasons, months and even weekdays.
The type of decisions which have to be made in such a set up can be viewed as acombination of shoJi/ intermediate term and long-term ones. The short-term decisionsare typically product-mix decisions like deciding : (I) whereto produce whichproduct and (2) when to produce it. The profitability of the organisation depends to agreat extent on the ability ofthe management to make these decisions optimally. Thelong-term decisions relate to (I) the capacity creation decisions such as which type ofnew capacity to create, when, and at which location(s) and (2) which new products togo in for. Needless to say, this is a rather complex decision-making situation andintuitive or experience based decisions may be way off from the optimal ones.Modelling of the decision-making process and the interrelationships here can provevery useful.
Model JMiji.!daDhiidDecision-making
l@
59

Data Presentation and Analysis
~In absence of a large integrated model, a researcher could attempt to model differentsubsystems in this set up. For instance, time series forecasting based models couldprove useful for taking care of the milk procurement subsystem; for the productdemand forecasting one could take recourse, again, to time series or regression basedmodels; and for product-mix decisions one could develop Linear Programming basedmodels.
Union level
Pasteurisation
Marketedas Liquidmilk
Federationlevel
Conversioninto Products
Products fromUnions
Depots/regions
Demand servicedthrough a .networkof wholesalers,and retailers
60
Fig. 3: A diagrammatic model of the interrelationships in a Milk Marketing Federation.
We have in this section seen a real life, complex managerial decision-makingsituation and looked at the possible models the researcher could propose to improvethe decision-making. Similar models could be built for other decision-makingsituations.
Activity 4
Briefly describe a complex managerial decision-making situation and decide thevarious possible models that could be used for decision-making.

10.4 TYPES OF MODELS
Models in managerial/ system studies have been classified in many ways. Thedimensions in describing the models are: (a) Physical vs. Mathematical, (b) Macrovs. Micro, (c) Static vs. Dynamic: (d) Analytical vs. Numerical and (e) Deterministicvs. Stochastic.
Physical Models: In physical models a scaled down replica of the actual system isvery often created. These models are usually used by engineers and scientists. Inmanagerial research one finds the utilisation of physical models in the realm ofmarketing in testing of alternative packaging concepts.
Mathematical Models: The mathematical models use symbolic notation andequations to represent a decision-making situation. The system attributes arerepresented by variables and the activities by mathematical functions that interrelatethe variables. We have earlier seen the Economic order quantity model as anillustration of such a model (please refer Section 10.2). .
Macro vs. Micro Models: The terms macro and micro in modelling are also referredto as aggregative and disaggregative respectively. The macro models present aholistic picture of a decision-making situation in terms of aggregates. The micromodels include explicit representations of the individual components ofthe system.
Static vs. Dynamic Models: The difference between the Static and Dynamic modelsis vis-a-vis the consideration of time as an element in the model. Sta4c modelsassume the system to be in a balance state and show the values and relationships forthat only. Dynamic models, however, follow the changes over time that result fromthe system activities. Obviously, the dynamic models are more complex and moredifficult to build than the static models. At the same time, they are more powerful andmore useful for most real life situations.
Analytical Numerical Models: The analytical and the numerical models refer to theprocedures used to solve mathematical models. Mathematical models that useanalytical techniques (meaning deductive reasoning) can be classified as analyticaltype models. Those which require a numerical computational technique can be callednumerical type mathematical models.
Deterministic vs. Stochastic Models: The final way of classifYing models is intothe deterministic and the probabilistic/stochastic ones. The stochastic modelsexplicitly take into consideration the uncertainty that is present in the decisionmaking process being modelled. We have seen this type of situation cropping up inthe case of the milk marketing federation decision-making. The demand for theproducts and the milk procurement, in this situation (please refer Section 10.3) areunceliain. When we explicitly build up these uncertainties into our milk federationmodel then it gets transformed from a deterministic to a stochastic/ probabilistic typeof model.
Activity 5
Give an example each of the following models used for decision-making.
(a) Macro Model
(b) Micro Model
Model Building andDecision-making
~
61

Data Presentation and Analysis
l@J
62
(c) Determine Model
(d) Stochastic Model
10.5 OBJECTIVES OF MODELLING
The objectives or purposes which underlie the construction of models may vary fromone decision-making situation to another. In one case it may be used for explanationpurposes whereas in another it may be used to arrive at the optimum course of action.The different purposes for which modelling is attempted can be categorised asfollows:
1) Description of the system functioning.
2) Prediction of the future.
3) Helping the decision maker/ manager decide what to do.
The first purpose is to describe or explain a system and the processes therein. Suchmodels help the researcher or the manager in understanding complex, interactivesystems or processes. The understanding, in many situations, results in improveddecision-making. An example of this can be quoted from consumer behaviourproblems in the realm of marketing. Utilising these models the manager canunderstand the differences in buying pattern of household groups. This can help himin designing hopefully, improved marketing strategies.
The second objective of modelling is to predict future events. Sometimes the modelsdeveloped for thc dcscription/cxplanation can bc utilised for prediction purposes also.Of course, the assumption made here is that the past behaviour is an importantindicator ofthe future. The predictive models provide valuable inputs for managerialdecision-making.
The last major objective of modelling is to provide the manager inputs on what heshould do in a decision-making situation. The objective of modelling here is tooptimize the decision of the manager subject to the constraints within which he isoperating. For instance, a materials manager may like to order the materials for hisorganisation in such a manner that the total annual inventory related costs areminimum, and the working capital never exceeds a limit specified by the topmanagement or a bank. The objective of modelling, in this situation, would be toarrive at the optimal material ordering policies.
Activity 6
You may go through various issues of any management journal(s). It is vary likelythat you may come across a regression model for estimating, sales, advertisementexpenditure, price or any other variable. Discuss how the model may be used for thefollowing:
(i) Explanation purposes
(ii) Prediction of the future value of the dependent variable.
(iii)Helping the decision maker decide what to do to achieve a given object.
10.6 MODEL BUILDING/MODEL DEVELOPMENT
The approach used for model building or model development for managerialdecision-making will vary from one situation to another. However, we can enumeratea number of generalized steps which can be considered as being common to mostmodelling efforts. The steps are
1) IdentifYing and formulating the decision problem.
2) IdentifYing the objective(s) ofthe decision maker(s).
3) System elements identification and block building.
4) Determining the relevance of different aspects of the system.
5) Choosing and evaluating a model form.
6) Model calibration.
7) Implementation.
The decision problem for which the researcher intends to develop a model needs tobe identified and formulated properly. Precise problem formulation can lead one tothe right type of solution methodology. This process can require a fair amount ofeffOli. Improper identification of the problem can lead to solutions for problemswhich either do not exist or are not impOliant enough. A classic illustration of this isthe case of a manager stating that the cause of bad performance of his company wasthe costing system being followed. A careful analysis of the situation by a consultantindicated that the actual problem lay elsewhere, i.e., the improper product-mix beingproduced by the company. One can easily see here the radically different solutions!models which could emerge for the rather different identifications of the problem!
The problem identification is accompanied by understanding the decision process andthe objective(s) of the decision maker(s). Very often, specially in case of complex'problems, one may run into situations of multiple conflicting objectives.Determination of the dominant objective, trading-off between the objectives, andweighting the objectives could be some ways of taking care of this problem. Thetypical objectives which could feature in such models can be maximising profits,minimizing costs, maximizing employment, maximizing welfare, and so on.
The next major step in model building is description of the system in terms of blocks.Each of the blocks is a pali of the system which has a few input variables and a fewoutput variables. The decision-making system as a whole can be described in termsof interconnections between blocks and can be represented pictorially as a simpleblock diagram. For instance, we can represent a typical marketing system in form ofa block diagram (please refer Figure 4). However, one should continuously questionthe relevance of the different blocks vis-i-vis the problem definition and theobjectives. Inclusion of the not so relevant segments in the model increases themodel complexity and solution effort.
Model Building andDecision-making
~
63

Data Presentation and Analysis
~A number of alternative modelling forms or structures may be possible. For instance,in modelIing marketing decision-making situations, one may ask questions such aswhether the model justifies assumptions of linearity, non-linearity (but Iinearizable)and so on. Depending upon the modelling situation one may recommend theappropriate modelling form. The model selection should be made considering itsappropriateness for the situation. One could evaluate it on criteria like theoreticalsoundness, goodness of fit to the historical data, and possibility of producingdecisions which are acceptable in the given context.
//
/
MarketingManager
FinishedgoodsWarepouse-
.-:-:-:"'L.-_~:....-...".---I"::r-:-:----E:.;;..r-
---....... Product Flows:. - -- - ...... Information Flows
Fig. 4: A Model of the Product and Information Flows in a Competitive Marketing Systems.
The final steps in the model development process are related to model calibration andimplementation. This involves assigning values to the parameters in the mode. Whensample data is available then we can use statistical techniques for calibration.However, in situations where little or no data is available, one has to take recourse tosubjective procedures. Model implementation involves training the suppOli personneland the management on system use procedures. Documentation of the model andprocedures for continuous review and modifications are also important here.
Activity 7
You are the personnel manager of a construction company. If you were asked to builda model to forecast the manpower requirements of both skilled and non-skilledworkers for the next five year, list out the steps you may consider for building themodel.
10.7 MODEL VALIDATION
When a model of a decision-making situation is ready a final question about itsvalidity should always be raised. The modeller should check whether the modelrepresents the real life ~ituation and is of use to the decision maker.
64
A number of criteria have been proposed for model validation. The ones which areconsidered important for managerial applications are face validity, statistical validityand use validity.

In face validity, among other things, we are concerned about the validity of the modelstructure. One attempts to find whether the model does things which are consistentwith managerial experience and intuition. This improves the likelihood of the modelactually being used.
In statistical validity we try to evaluate the quality of relationships being used in themodel. The use validity criteria may vary with the intended use of the model. Forinstance, for descriptive models one would place emphasis on face validity andgoodness of fit.
10.8 SIMULATION MODELS
Simulation models are a distinct class of quantitative models, usually computerbased, which are found to be of use for complex decision problems. The term.simulation' is used to describe a procedure of establishing a model and deriving asolution numerically. A series of trial and error experiments are conducted on themodel to predict the behaviour of the system over a period of time. In this way theoperation of the real system can be replicated. This is also a technique which is usedfor decision-making under conditions of uncertainty. Generally, simulation is usedfor modelling in conditions where mathematical formulation and solution of modelare not feasible. This methodology has been used in numerous types of decisionproblems ranging from queuing and inventory management to energy policymodelling. A detailed discussion of simulation is beyond the purview of this unit. Forthose of you who would like to read more on this, we would recommend acomprehensive text like Gordon (1987) or Shenoy et., al. (1983).
10.9 SUMMARY
In this unit we have briefly examined the role of models in managerial decisionmaking research. We have also examined the different types of managerial decisionsand the process of decision-making. This was followed by a discussion on the type ofmodels and their characteristics. A specific model was discussed describing thedecision-making scenario in a milk marketing federation. We noted that there couldbe three types of modelling objectives viz., descriptive, predictive and normative. Abrief description of the model development and validation processes followed.Finally, a brief exposure to simulation models was provided.
10.10 KEY WORDS
Decision: Arriving at a choice amongst alternatives
Model: Body of information about a system gathered for the purpose of studying thesystem
Block: A pmi ofthe system being modelled
Validation: Checking whether the model actually replicates the actual system.
Simulation : A technique for studying alternative courses of action by building amodel of system under investigation.
10.11 SELF-ASSESSMENT EXERCISES
1) What do you understand by the term decision-making? What is the role ofmodels in managerial decision-making? Explain.
2). Briefly review the different types of models alongwith their characteristics.
3) Take a complex decision-making situation in your organisation. Try to identifythe blocks in it along with their interrelationships. Try to prepare a graphicalmodel of this decision-making situation.
4) What are the purposes of modelling? Discuss.
Model Building andDecision-making
D .. l®J k'eClSlOn-ma mg V
65

Data Presentation and Analysis
~
66
10.12 FURTHER READINGS
Bass, Bernard M., 1983. Organizational Decision Making, Irwin, Illinois.
Gordon, Geoffrey, 1987. System Simulation, PHI, New Delhi.
Ferber, Robert (ed.)., 1974. Handbook of Marketing Research. McGraw-Hill, NewYork.
Lilien, Gary 1. and Philip Kotler, 1983. Marketing Decision Making; A ModelBuilding Approach, Harper & Row, New York.
Shenoy, GVS, et a\., 1983. Quantitative Techniques for Managerial DecisionMaking, Wiley Eastern, 1983.


UNIT 11 SUBSTANCE OF REPORTS
Objectives:
After reading this unit, you should be able to:
• discuss the subject matter of various types of reports
• prepare a proposal for any type of report
• review and edit the draft of a report.
Structure
11.1 Introduction
11.2 Proposal
11.3 Categories of Report
11.4 Reviewing the Draft
11.5 Summary
11.6 Self-Assessment Exercises
11.7 Further Readings
11.1 INTRODUCTIONReport writing is common to both academic and managerial situations.In academics, reports are used for comprehensive and application oriented leaming.Student reports are called term papers, project reports, theses, and dissertationsdepending on the nature of the report, the time and effOlt expected ofthe student, andthe curriculum design. Further, researchers put out their initial findings in a researchreport, paper, or monograph, which is later condensed into an article or expanded intoa series of mticles or a book.In organizations, reports form the basis for decision making. These reports areexpected to be brief but comprehensive and reflect the thinking of the manager, themanagement committee, or the consulting group that has been given the terms ofreference for fact finding or decision making.
11.2 PROPOSALPreparation of repOlts is time consuming and expensive. Therefore, reports have to bevery sharply focused in purpose, content, and readership. And to control the finaloutcome of the product-whether it is a research report, committee/ consultingadministrative report, or student report-it is often preceded by a proposal and itsacceptance or modification and periodic interim repOlts and their acceptance ormodification by the sponsor.A proposal gives information on the following items:1) Descriptive title ofthe study2) Names of authors and their background3) Nature of the study
Problem to be examinedSignificance and need for the studyBackground information availableScope of the study-extent and limitationsTo whom will it be useful
4) Hypothesis, if any, to be tested5) Data
SourcesCollection procedureMethodology for analysis 5

Report Writing andPresentation
l@J
6
6) Equipment and facilities required
7) Schedule-target dates for completing
a) Library research
b) Primary research 0
c) Data organization and analysis
d) Outlining the report
e) First draft
h Final draft
8) Likely product or tentative outline
9) Cost estimates
10) Bibliography
Activity 1
Decide on a topic on which you would like to do a report, do a preliminary librarysurvey-on the topic, write a proposal, and check whether it answers all the questionsindicated under the information to be given in a proposal.
11.3 CATEGORIES OF REPORT
Reports fall into three major categories:
1) Information oriented
2) Decision oriented
3) Research oriented
The substance and focus of the content determines the category. However, a reportmay contain characteristics of more than one category.
Information Reports
In describing any person, object, situation, or concept, the following seven questions(6 Ws+ I H) help to convey a comprehensive picture:Subject/Object Action ReasouWHO? WHAT? WHY?WHOM? WHEN?
WHERE?HOW?
Therefore, the comprehensiveness of an information or descriptive report can bechecked by iteratively asking:
WHO does WHAT to WHOM
WHEN, WHERE, HOW
and WHY?
Information reports are the first step to understand the existing situation (for instance,business, economic, technological, labour, market, or research scenario reports) orwhat has been discussed or decided (for instance, the minutes of a meeting) form thefoundation for subsequent decision reports and research reports.
Decision Reports
Decision reports adopt the following steps of the problem solving approach:
1) IdentifYing the problem
2) Constructing the criteria

3) Generating and evaluating the options
4) Making a decision
5) Drawing up an action plan
5) Working out a contingency plan
Problem
The problem is the beginning and the end of decision making. A start with a wrongproblem, a wrong hypothesis, or a wrong assumption will only solve a non-existingproblem or create a new problem.
In defining the problem, identify the following elements:
1) What is the situation, and what should it be? This question sets the overallobjective for the problem.
2) What are the symptoms, and what are the causes?
3) What is the central issue, and what are the subordinate issues?
4) What are the decision areas, and what needs to be done immediately, in the shortterm, medium term, or long term?
For analysing a problem, Kepner and Tregoe (See under suggested readings)recommend sorting out the information under what, where, when and extent acrosswhat is and what is not, the distinctiveness in the situation, and changes which mayhave taken place as follows:
Substance of Reports
l@J
What?
Where?
When?
Extent?
Is Is not Distinctivenessin Is
Change
After this analysis, compare the deduced causes with the actual or observed ones.
Const.-ucting the Criteria
Words like aim, goal, objective, intention, purpose, and criterion are used sometimessynonymously or with different meanings. Here the first five words are treated assynonymous and are recognized at the problem definition stage itself whileidentifYing what the situation is and should be.
However, to bring the existing situation to what it should be, criteria or yardsticks areused to evaluate options. Criteria link the problem definition with the option,generation and evaluation.
In constructing the criteria, SWOT analysis is useful. Recognize the strengths and theweaknesses of the decision maker and the organization and the opportunitiesavailable and threats confronting the decision maker and the organization in a givensituation. This analysis helps in constructing the criteria which in turn help inevaluating the options against the feasibility of implementation.
Further, ensure and explicitly clarifY the following:
1) The criteria arise out ofthe problem definition and are not independent of it.
2) They are measurable or observable as much as possible. However, nonquantifiable criteria are not ignored merely because they cannot be quantified.
3) They are prioritized and tradeoffs are recognized.
4) They encompass a holistic view-economics, personal, organizational, andsocietal considerations.
5) They are not loaded or one-sided. Both pro and con aspects are considered.
7

Report Writing andPresentation
8
Generating and Evaluating the Options
In generating options, creativity is required. Sometimes the options are obvious. Butone can look beyond the obvious.
Once a set of options have been generated, they are shortlisted and ranked by priorityor their probability of meeting the objectives, identified in the problem definition.
Then the options are evaluated against the criteria and possible implications inimplementation without losing track of the main objective of what the situationshould be. The evaluation process demands logical and critical thinking.
The presentation of evaluation is structured by criteria or options depending uponwhich structure is easy to understand. For instance, if the criteria are few and optionsare many, the presentation will be easy to understand if it is structured by criteria. Butif the options are few and criteria are many, the presentation will be effective if it isstructured according to options.
Making a decision
The decision or recommendation flows out of the evaluation of the options, providedthe thinking process has been logical so far.
The recommendation should be an adequate response to the problem andimplementable.
Drawing up an action plan
Even the best analysis can go waste if attention is not paid to the action plan. Theaction steps and their consequences should be visualized to avoid being caughtunawares. Be clear of who does what, when, where, and how. Even at this stage wehave to go through the problem solving steps in a futuristic scenario-what problemsdo we anticipate, what objectives and criteria would we like to pursue, what optionswould be open to us, and what choices can we make under what circumstances?
Working out a contingency plan
Administrators, executives, and managers thrive on optimism and confidence to getthings done. Yet, if something can go wrong, it is likely to go wrong. They shouldhave the parachute ready to bailout. The contingency plan must emerge from theaction plan. There is need to think of how to achieve the second best objective if thefirst one is not feasible.
Conclusion
The problem solving approach helps only when one can question oneself again andagain at every stage and bring to bear various' thought processes to do acomprehensive analysis and synthesis. Then only will the administrator, executive, ormanager be able to genuinely share his/her thoughts with the reader.
If the problem solving approach and steps are used merely as a form filling exercise,a superficial analysis and report will result. An attractive package does notnecessarily mean a good product.
An executive report is not a summary of the view and information that a decisionmaker has elicited but an analysis a!1d synthesis of an integrated decision orrecommendation. Thinking through a decision making situation is an iterative act.
A good decision report is structured sequentially but reflects comprehensively theiterative thinking process of the decision maker(s).
Research Repol·ts
Research repOlis contribute to the growth of subject literature. They pave the way fornew information, significant hypotheses, and innovative and rigorous methods ofresearch and measurement. They broadly have the following organization
I) Literature survey to find gaps in knowledge.
2) Nature and scope of the study, hypothesis to be tested, and significance and Kutility ofthe study.

3) Methodology for collecting data, conducting the experiment, and analysing thedata. .,
4) Description and analysis of the experiment and data.
5) Findings.
6) Conclusions.
7) Recommendations.
8) Suggestions for further research.
9) Backup evidence and data.
Activity 2
Describe a strike or any other serious incident that has recently occurred in yourorganisation and check whether your description answers all the questions indicatedunder descriptive reporting.
Activity 3
Take a report of your organisation and check whether the problem solving approachor descriptive approach has been used. If you were to rewrite the report, what will beyour contents outline and what stages would you do to improve the report.
......................................................................................................
11.4 REVIEWING THE DRAFT
The report should be thoroughly reviewed and edited before the final report issubmitted. The following questions MH help to review the draft:
1) Author's purpose?
2) Reader's profile?
3) Content?
4) Language and tone?
5) Length?
6) Appearance?
Author's Purpose
The lack of clarity and explicitness in the communication purpose leads to two majorproblems: 0) confusion in determining the mix of content, language and tone, length,and looks and (2) misinterpretation of the message.
Reader's Profile
The readership may consist of one or more persons or one or more groups. If morethan one person or segment is involved, check whether all of them are on the samewavelength. If not, segregate the common interest areas from the special interestones. Then decide on the types and parts of the report which can satisfY variousreader groups.
Think of the organization and social membership and hierarchical level of the reader.An executive writing a report, for instance, should know whether the reader is aninsider or an outsider to the organization or the cultural system, an immediate boss or
Substance of Reports
~
9

Report Writing andPresentation
l@J
10
a boss who is two or three rungs removed, a colleague or a subordinate. Anunderstanding of the reader on these lines helps the author to modulate the content,language, and tone to suit the reader. .
The -major discriminating features of the reader's profile are the cultural, social,religious, ideological, educational, economic, and age.
Also pay attention to the reader's inter~st and familiarity of the subject and thelanguage. Otherwise, you may be' pitching the communication either too high or toolow.
Content
The content is the crucial communication axle between the author and the reader.Attention should ·be.given to the content's focus, its organization, accuracy of facts,and logic of arguments. These are discussed below:
Focus: Failure to prune and polish the content's focus makes the report as diffused asan amateur's photograph. All the wisdom of an author cannot be wrapped up in a fewpages. Only the essentials required for the purpose can be covered.
The focus should be clarified right in first few paragraphs to attract the reader'sattention and hold it. This is the first and last chance to catch the reader's attention.The main theme, presentation scheme" author's purpose, and intended readershipshould be indicated right in the beginning. The appropriate style and tone of thelanguage should be set into motion right from the first sentence and be kept up till theend.
Organization: The focus is the foundation for the rest of the content. If any materialis added or deleted in the text, check the focus delineated in the beginning to seewhether any , changes are required in the foundation. If needed, change either thefocus or the text to get the consistency. Otherwise, different messa$es may emergefrom the communication and confuse the reader.
Then ensure that:
I) the discussion is organized step-by-step into patis, sub-patis, and paragraphs,
2) the arguments of each section and paragraph flow smoothly into the next one,and '
3) too many ideas are not crammed into one section.
To check that the various parts of the report and ideas are sequenced effectively,constantly ask whether a different sequence would be easier for the reader'scomprehension.
Examine the structure of paragraphs. The most recommended structure forparagraphs in recent years has been the "inverted pyramid" style.
First, this style calls for putting forward the most important point first and then goingdown in priority. The idea is to put forward as much essential information as possibleto the readers before their attention wavers or is lost.
Second, the style calls for putting forward the conclusion first or the main topic ortheme in the very first sentence of the paragraph and then substantiating orsuppoliing it with information and evidence in the order of priority beginning withthe most essential or important at the top. The idea is that even if the reader skimsthrough the first sentences of paragraphs, he/she should be able to get the gist of thecontent.
Accuracy of Facts : Authors can lose their credibility if they fail to check theaccuracy of facts, figures, quotations, and references. A discerning reader can easilycheck the internal consistency of the report by comparing information across pagesand sections.
Evaluation oflnformation : Decision makers often lack data or information. Not allthat they want is available. Therefore, they have to constantly ask: What is theminimum data required for the decision, what is available, what can be got within theavailable time and money, and what cannot be obtained? Sometimes they have tomake assumptions to fill up the gaps.
Facts, figures, and opinions have to be interpreted to become evidence for throwing
light on an issue. Facts and figures do not speak for themselves. Only theirinterpretation makes an argument.
For effective communication, logic is a dependable tool in convincing. the reader ofthe reasonableness of the points of view. But how can we make sense out ofconfusing and constantly changing situations? How can we recognizeunreasonableness of the seemingly reasonable arguments? We can do it by
• Analysing the situation.
• X-raying the facts through their smoke screens-words, opinions, andassumptions.
• Examining the inference process.
• Capsulizing and concretizing the ideas.
Situational Analysis: What is good in one situation may not necessarily be so inanother and that one situation may appear to be similar and yet be different. We haveto list and arrange (either mentally or on paper) the elements and the actors of asituation to understand the dynamics of the' situation. We can map out the territory onthe basis of who did and said what to whom.
Elements, which shape a situation, could be of various kinds. Decision to buy or notto buy a new machine; decision to postpone the decision on the new machine;installing or not installing the new machine; decision to buy from one and not theother; X, Y, Z companies quoting different prices for the same product; thegovernment's decision to make a statutory requirement of giving X amount of bonus;the company's offer of Y amount of bonus to its employees; workers threatening togo on strike; the boss having a poor opinion about the subordinate; X having celiainimage in the company; X being granted leave while Y has been refused leave; Xtelling Y that Z is a fine fellow-all such elements shape a situation.
Actors in a situation also matter. The managing director's request often get treated asan order. A colleague's request remains a request. And a subordinate's requestremains in the basket for consideration in due course oftime. If two or three workersask for a change in timings, the manager may not consider the event as serious. If 80per cent of the workers ask for it, the significance drastically changes; the managerwill hasten to find a solution.
In arranging the elements and actors, we can try to understand-the rules of the gameopportunities and threats inherent in the situation. If a strike is on, for example, wecan identify the areas of agreement and disagreement, items on which themanagement 'will bend its back to avoid a strike, items on which the management'stail will be up, and power that the management can and cannot draw from thegovernment and the situation within the country or the timing of the happening. It issuch opportunities and threats which help the management to form the strategy forsolution.
In arranging the, elements of a situation, we must check whether the element isrelevant to the situation. If it is, we consider it in ordering the elements. If not, weignore it. For example, at the year end when the financial statements are beingprepared, the death of the chief accountant may contribute to a serious situation; butthe death of a worker will be inconsequential. However; if a company' has launched afamily planning programme for its workers, the death of even a worker due to anoperation can jeopardize the whole programme; but the death of even the managingdirector in such a situation will be inconsequential.
The elements of a situation can be structured along the following dimensionsdepending on the situation: a) time, b) space, c) quantity, d) quality, e) cost, andf)hierarchy.
Each dimension offers a two-pronged fork-a) the relationship ofthe element to othersand b) the magnitude of the element itself.
The time sequence among elements helps in understanding the situation. If theproduction has been going down, for instance, it is possible to attribute its cause to a
Subslance of Reporls
l@J
11

Report Writing andPresentation
l®J
12
new procedure that has been introduced. But if production drop was noticed evenbefore the procedure was introduced, the latter cannot be the cause for the former-atthe most it could have aggravated the problem. Moreover, finciing out the events atthe starting point of the production may help in focussing the attention on causes ofthe problem. . .
An understanding of the spatial arrangement of element adds to the understanding ofthe situation. For example, if three plants-A, B, and C in that order-are in . straightline at different distances, we know that plant B is between plant A and plant C. Ifthey are located in a triangle, plant A could be at equidistance from plant B and plantC. If we are planning for a common processing facility at a central plant, we knowthat we can locate the facility in plant B in the first case and in plant A in the secondcase. Moreover, the information about the space available in each plant helps us tocheck whether it matches with the space required for the new facility.
Similarly, each element can be ranked according to quantity and quality, and eachelement's available quantity and quality can be checked against the requirement.
The cost dimension help, like the earlier four dimensions, in ranking elements andcomparing each element against the requirement. But it has third fork. It can alsoprovide an all-inclusive comparative picture ofvarious elements. The cost dimensioncan include within it the time, space, quantity, and quality dimensions when they arequantified in money terms.
Finally, the hierarchical dimension is the most difficult one to understand andpinpoint. The elements and actors in this dimension are constantly changing. Today'scolleague may be tomorrow's boss. Hierarchical positions within the company willbroadly indicate the authority, power, influence, and responsibility each actor wields.Moreover, the secretary to the boss sometimes commands power which is notreflected by his/ her position in the organizational chart.
The structuring of elements and actors across different dimensions helps inexamining various elements and their relationships and in focusing on the decisionmaking area or the problem.
X-Raying of Facts: Facts often get shaded by three smoke screens-words, opinions,and assumptions.
The hazy picture of facts that we get at first sight gives us the feeling that we haveunderstood the facts. Yet the real shape of the facts eludes us unless we x-ray thefacts through the smoke screens. Unless we understand the facts in their real form,our conclusions may be way offthe reality.
The Meaning of the same word for the writer and the reader may be different. If acompany says that its staff is "disciplined", what does it mean? Does it mean thatthey have "a high commitment to work, a task, or a cause"? Does it mean that theyare "obedient yes-men"? Does it mean that they are "punctua(? Does it mean thatthey are "faithful and loyal"? Does it mean that they are "polite"? It could mean someof these, all of these, or something else what the company considers as discipline.Can we break through this smoke screen or"discipline" to find out what the reality is?
Opinion is another smoke screen which envelops facts. When a personnel manager,for example, says-that Mr. X is 58 years old and he will be retiring in another twoyears, the statements can be checked. One can cross check from Mr. X's personnelfile whether he is 58 and from the company policy whether the retirement age for theemployee is 60. But when the personnel manager writes about Ms. Y, who is beingconsidered for a training programme, that she is "too old to learn", the age of Ms. Ycan be any where say between 21 and 60. In fact, the opinion of the personnelmanager may have been based on observations other than age. Therefore, facts andobservations on which this opinion has been based need to be ascertained beforeagreeing or disagreeing with the personnel manager's recommendation.
The third smoke screen is made up of assumptions. When there is a gap in theinformation or an uncertainty about the future events, we make assumptions, which ifthey are not recognised as assumptions, escape the scrutiny and pass off as facts.
Assumptions can be of two kinds: illustrative and critical: An illustrative assumptionhelps to describe a process or a result concretely so that further arguments can bebuilt. For example, if the price of product X is Rs. 10 per piece and an excise levy of10 percent ad valorem is assumed, the effective price to the customer is Rs. 11. If thetaxis 20 percent, the effective price is Rs. 12. Here, the assumptions about thepercentage of excise duty are made to explain how the effective price to the customerwill vary depending on the percentage oftax.
However, if a company feels that the demand of its product will remain unchanged ata price of Rs. 11 but will fall drastically at Rs. 12, it will seriously think before thebudget session of Parliament about the impact of change in the tax structure. If itassumes the rate at 10 per cent, it has no cause for worry. If it assumes that the ratewill be 20 per cent or between 10 per cent and 20 per cent, it has to examine theimpact of tax on the demand for the product. Therefore, the assumption in thissituation about the likely tax rate is critical because it affects the decision.
Then how can we penetrate the smoke screens to see the facts as they are? A threepronged attack may be useful. First concretize all general statements. Second, checkagainst the actual. Third, examine contradictions in evidence.
Statement qualified by general words like "all", "almost all", "most", "the majority","the minority", "few", and "some" can distort the picture of the actual situation. Whena company says that the majority of its employees are satisfied workers, it may meanthat 251 workers out of 500 are happy. The arithmetic is correct, but therepresentation of the gravity of the situation is doubtful. When a company says thatonly a few of its employees are disgruntled and does not reveal that these few are theopinion leaders, it may not be projecting the true picture.
General adjectives or qualijj;ing words hide facts. When a manager says that X is agood employee or an average employee, it is not clear what X is capable of doing ornot doing. We can arrive at the actual profile of X only when the manager spells outconcretely what is meant by good and whether X has been actually rated againstthose criteria. However, labels like "good", "average", and "bad" keep floatingunchallenged.
Having concretized the generic words to understand what is actually meant, checkwhether the so calledfacts are really facts. When someone, for example, claims thathe/she belong to X, Y, Z category and hence eligible to a certain privilege, ascertainfirst whether he/she really belongs to the privileged category or not. Often rules andprocedures are quoted by memory to help or hinder someone. Check whether such arule or procedure really exists, or had existed and changed over time, or is beinganticipated to be introduced, or never existed except in the mind of the personquoting it.
Often we come across contradictOly observations about an item when only one ofthem can be true. For example, X may repmi that machine Y has broken down. But Zmay report that machine Y is in working condition. The contradiction needs to beexamined. Maybe X and Z are talking about two different machines. Or X and Z aretalking of two jobs of which the machine at present can do one and cannot do theother. Or X and Z are picking on each other. Unless such contradictions of facts arerecognized and challenged, facts will continue to elude and delude us.
Inference Process : The first step in examining the inference process is tounderstand the cause-and-effect relationship.
When a company, for example, begins to lose its market share, the marketingmanager investigates with the assumption that there is a cause or a set of causesunderlying the loss of market share. Unless the cause(s) is clearly understood, theattempt to change the effect is likely to be a shot in the dark.
The next step is to draw conclusions pom facts and observations through deductive(general to specific) and/or inductive (specific to general) reasoning processes.
Deductive Inference: If a universal or general principle is known or has beenproved to be true, conclusions can-be drawn from it about individuals falling in thatuniverse. Let us take an example:
1) No leave was granted to the employees of company X on a celiain date.
Subslance of Reporls
~
13

Report Writing andPresentation
~
14
2) Y is an employee of company X.
3) Therefore, Y was not granted leave on that date.
In using this kind of reasoning, we should make sure that the universal principle istrue and the linkage between the universal principle and the individual is relevant;otherwise the conclusion drawn in a particular situation mayor may not be valid. Ifsome employees were granted leave and some-were not, we cannot be sure into
. which category Y falls. Much worse will be the situation if Y is not an employee ofthe company; the universal principle stated will then have no relevance to Y, and,therefore, it cannot be concluded definitely whether Y was granted leave or not.
Inductive Inference : When universal or general principles are not available,conclusions are drawn on the basis of observations of individual units in a universe.The basic assumption in inductive reasoning is that the particular units partake of theuniversal character:
If a company, for example, wants to find out the customer reaction to a new productor service, one method is to ask all the customers about it. But the number ofcustomers may be so large that the company has to resort to sampling. From thesample reaction, it can then generalize or interpret likely response to the new productor service.
When inductive inference is being drawn from sampling, we must guard againstsome loopholes:
First, is the sample relevant?
Second, is the method right?
Third, the existence of causes other than the ones identified cannot be ruled outwithout careful scrutiny. For example, a manager may generalize that the employeeswant job security because some of them had left the company for lower wages.Another manager may conclude from talking to the same workers that they leftbecause they lived at far-off places from the plant.
Fourth, opinions may change. Therefore, feedback collected today may notnecessarily hold good tomorrow when the action is taken.
Capsulization and Concretization: Capsulization involves both a) miniaturizationof the main theme and identification of the high points of evidence and argumentsand b) chewing ideas bit-by-bit. It dispels the fog or impression that long-windedarguments or lengthy repOlis create. By understanding the main ideas and the mainpoints in a nutshell or a skeleton form, we can map out the territory and identify thetraps.
Concretization involves use of a) specific words and b) visualization. The statementthat plant A is "10 km away" from plant B is more specific than plant A is "very far"or "quite close" to plant B. Instead of saying that the new policy of the government is"generally favourable" or "generally unfavourable" to the organization, we canspecify the implications-say in rupees and paise. We can translate the favourablenessor unfavourableness through the balance sheet and the income statement. We canspecify in implementation terms the new opportunities and threats to our business.
Traps of Logic : In playing the trap detection game, we should recognize thefollowing common traps:
1) Avoidance
2) Diversion
3) Stacking the deck
4) Either-or
The avoidance trap can be recognized when one begins by saying, "I am notconcerned with... " or "How am I concerned with... " Another form of avoidance iswhat is commonly known as "pass the buck". The buck could be passed upwards,downwards, or sideways. All of us play it to avoid taking the decision or applying

ourselves to the problem on hand. The more sophisticated form of avoidance ismuch-can-be-said-on-both-sides technique used when one has to make a choice.
The diversion trap operates mainly on diverting the attention from the main theme orargument.
One diversionary technique is to side-track the main issue. If the general manager isdiscussing a strike on hand with the plant manager, the latter may fritter away thetime by talking about the general climate or history of unionism in the country, orgeneral absenteeism of the workers or the promotion of a person in another plant, orfor that matter he may talk about the weather.
Another kind of diversion can be provided by emotional appeal. Both themanagement and the union use the technique by appealing to fairness, prestige andprejudice. Appeals and insinuations on both sides divert the attention from the realissue. If a case of reinstatement of an employee who has been fired for malpracticeis discussed, the real issue of whether the employee has been guilty or not is wrappedup in emotional terms of victimization.
Another diversionary tag is to project self-confidence-a tool often used by salesmen.The way the salesman-talks or carries himself may numb the purchase manager fromexamining whether the selling company can provide after-sales service or somecritical issues before making the purchase.
One more diversionary technique is to cite an authority. The chairman or themanaging director wants it done this way, or all the world over it is done that way, orthe Bible-whatever book you swear by-says so are common indicators of thistechnique.
Stacking-the-deck trap is sprung by citing only facts that support an argument andignoring unfavourable ones. A manager who is interested in promoting subordinate Xmay quote facts which help to build X's c~se and suppress the weak points.Moreover, the weak points of other contenders may be highlighted and their pluspoints blanked out. Similarly, a purchase manager, who is interested in helping asupplier, may stack up all the plus points of the favoured supplier and all the minuspoints of other suppliers. Moreover, the manager may gloss over contradictions in therecommendation. Supplier X may be rejected for inability to provide after-salesservice. But in the same breath, supplier Y may be recommended without telling hisinability also to provide the expected_ aftei'-sales service.
The either-or trap (i.e., either this or that only) is aimed at limiting the thinking toonly two choices without proving that only two choices are feasible in a givensituation. The attention is fixed only to black or white and is not allowed to examinethe possibilities of grey areas or any other colour. Either one is a friend or an enemy.All other possibilities are ruled out. When a manager argues that product A is to bebought from supplier X or supplier Y, the mind is closed to the choice of a mix or asupplier Z. Of course, such an argument becomes valid if it is proven that neithergrey nor any other colour exists in the given situation.
Language and Tone
Since the purpose of communication is to make the reader understand the message,use the vocabulary and sentence structures which the reader understands. Theterminology and language structures of a subject specialist are not familiar to nonspecialist. Even among the specialists, sometimes there are differences in the usageof terminology and language structures. For effective communication, the author hasto climb down or climb up to the reader's level-a difficult adjustment for many of usto make.
Abstract phrases are difficult to comprehend. Concrete phrases are easy tounderstand. For example, a word like "freedom" is abstract unless it is followed by adefinition or an example. "This is better" or "that is good or bad" are oft-madejudgements. But the reader finds it difficult to understand "better than what" or "goodor bad by what criteria". Generic adjectives and adverbs sabotage the effectiveness ofcommunication. For example" instead of merely stating that XYZ company is a large
Substance of Reports
l®J
15

Report Writing andPresentation
l@J
16
company, the author can also indicate the various dimensions (e.g., sales, profits, andemployees) which lead to the conclusion that the company is large.
Finally, the tone of the language also matters. It can make the reader receive, ignore,or reject the message. Executives have to differentiate and modulate the tone ofwriting to superiors, peers, and subordinates.
Length
How long should the report be? This is a matter to be judged by the author keeping inmind the purpose, the subject, and the reader's interest. Shorter the content, the moreattractive it is to the reader. But it cannot be so brief as to miss the essential pointsand the linkages in the flow of arguments and force the reader to ask for moreinformation. If the length does not match with the reader's interest and patience, theauthor has to rework and scale down the purpose, the focus, or the content.
Check the readability of paragraphs. As a thumb rule, paragraphs should not exceedeight typed lines, sentences should not exceed more than three typed lines, andpunctuated pauses should not go over two typed lines.
In short, the communication should be like a capsule. It should be small enough toswallow but powerful enough to act.
Here are a few suggestions to save words:
I) Cut out repetitions, unless they are meant for sharpening the message.
2) Take out redundancies. (Instead of "takes 10 minutes of time", write "takes I I0minutes". Instead of "The profit increased to the tune of Rs. 50 lakh", write"The profit increased to Rs. 50 lakh".)
3) Use active voice. (Instead of "The balance sheet is given in Exhibit I ", write"Exhibit I gives the balance sheet".)
4) Use shorter and direct verbs. (Instead of "They had done investigations in thematter", write "They had investigated the matter". Instead of "To make acomparison of these two divisions", write "To compare these two divisions".)
5) Eliminate weighty expressions. (Instead of "The demand will fall in the eventof price going up", write "The demand will fall if the price goes up".)
6) Make concrete adjectives. (instead of "The company incurred a loss of Rs.20,000", write "The company incurred Rs. 20,000 loss" or even better "Thecompany lost Rs. 20,000".)
7) Strike out it and there. (Instead of "There was no machine available", write "Nomachine was available".)
8) Use abbreviations which are more familiar than their expanded forms. (Insteadof "United Nations Educational, Scientific, and Cultural Organization", write"UNESCO".) (See 7.5)
9) Use pronouns wherever possible. If confusion arises, clarify the pronoun byname or by words like "former" or "latter". (Note the difference between"former" and "farmer" and between "latter" and "later".) Note the modern trendof avoiding the use of "he" alone as a generic pronoun unless if suits thecontext. If a generic pronoun is needed, use "he/she", or rephrase the sentenceto drop it, or use plural nouns and pronouns._
10) Use the full name of a person at the first reference. Then use only the shortname, preferably the last name in a formal repoti.
Appearance
The novelty or presentation is as important as the originality of ideas. Both areproducts of creativity and criticalness. Presentation attracts the readers, and thecontent holds their attention. Both the product and the package are equally important.

Activity 4
Take one of your recent reports. Analyse it by going through the steps indicated forreviewing a draft. Write down what improvements and where you would make inyour report.
11.5 SUMMARY
In this unit, we have discussed the steps involved in preparation of a proposal for areport. Three categories of reports namely Information reports, Decision reports andResearch reports have been explained. The steps involved in writing various types ofrepotts are also discussed. Before a final repoti is submitted, the report should bethoroughly reviewed and edited. The unit concludes by answering certain questionsfor reviewing the draft of a report.
11.6 SELF-ASSESSMENT EXERCISES
1) Take a paragraph at random from any repcnt and analyse whether the firstsentence contains the conclusion or announces the topic and the rest of theparagraph substantiates the first sentence. If not rewrite the paragraph in theinverted pyramid style.
2) Write a performance report on any of your subordinates. Check whether youhave qualified and explained all the general adjectives like "sincere" and "hardworking" you have used to describe the person.
3) Take a management case and analyse it. .Write a repoti using the formatsuggested for decision making reports. Identify the mental process you have gonethrough using creative, logical, and critical thinking at different stages of solvingthe problem and writing the repoti.
4) Take any managerial decision that was taken in your organization and of whichyou are aware of the information and the process through which it has gonethrough. Analyse the problem solving steps that have gone through and theimprovement that you would suggest if the same situation has to be faced all overagain.
11.7 FURTHER READINGS
Gallagher, J. William, "Report Writing for Management", Addison-Wesley
Substance of Reports
~
17

Report Writing and'Presentation
l@J
18
Golen, P. Steven, "Report Writingfor Business and Industry", Business
Communication Service
Kepner H. Charles and Benjamin B. Tregoe, ''77ie Rational Manager", McGraw-HillBook Company (1965)
Sharma, R.C and Krishna Mohan, "Business Correspondence And Report Writing",Tata McGraw-Hill.
Wright, c., "Report Writing", Witherby & Co. England.


UNIT 12 FORMATS OF REPORTSObjectives
After going through this unit, you should be able to:
• Distinguish between various parts of a report
• Explain the different parts of a report
• Instruct the typist as to how he/she should go about typing the report
• Edit any report by using the copy reading and proof reading symbols.
Structure
12.1 Introduction
12:2 Parts of a Report
12.3 Cover and Title Page
12.4 Introductory Pages
12.5 Text
12.6 Reference Section
12.7 Typing Instructions
12.8 Copy Reading
12.9 Proof Reading
12.10 Summary
12.11 Self-Assessment Exercises
12.12 FUliher Readings
12.1 INTRODUCTIONIn the last unit, we have explained the steps one should follow while writing aproposal for any type of report. The subject matter of various types of reports wasalso discussed. It was also explained as to how one should go about editing the draftof a report. The next stage is understanding the Formats of Reports which is thesubject matter of this unit. It explains the contents of Cover and the Title Page. Weshould also understand as to what goes into Introductory pages, Text and ReferenceSection of a report. Once this is known there is a standard format in which the reportshould be typed. Therefore, a few pages are devoted in this unit on typinginstructions. Once the report is typed, it should be edited by using the copy readingand proofreading symbols. This forms the concluding section of this unit.
12.2 PARTS OF A REPORTThe different parts of a report are:1) Cover and the title page2) Introductory pages
a) Forewordb) Prefacec) Acknowledgementd) Table of contentse) Lists of tables and illustrationsf) Summary
3) Texta) Headingsb) Quotationsc) Footnotesd) Exhibits
4) Reference sectiona) Appendices 19

Report Writing andPresentation
l@J
20
b) Bibliography
c) Glossary (if required)
12.3 COVER AND THE TITLE PAGEThe cover and the title page of a report contain the following information:
1) Title of the subject or project
2) Presented to whom
3) On what date
4) For what purpose
5) Written by whom
If there is any restriction on the circulation of the report, it is indicated (e.g., "ForOfficial Use Only") in the top right corner ofthe cover and the title page.
Examples of the cover and the title page for research reports, conference papers,committee/consulting/administrative reports, and student reports are given below.
Example of the Cover and the Title Pagefor a Research Report
Research Monograph No. 10
CRISIS IN THE SUGAR INDUSTRY
S. Ramesh ChanderProfessor
School of ManagementRegional University, Ahmedabad
Council of Management ResearchNew Delhi
I January 1986
Example of the Cover and the Title Pagefor a Conference Paper
CRISIS IN THE SUGAR INDUSTRY
A PaperPresented to the National Economic Conference
held at theSchool of Management
Regional University, Ahmedabad
onI January 1986
byRamesh Chander
ProfessorInstitute of Business
National University. Jaipur

Example of the Cover and the Title Pagefor a Committee/Consulting/ Administrative Report
For Clfficial Use Only
WORKING CAPITAL REQUIREMENTSOF
RAJPUR TEXTILE MILL
Presented to theManaging DirectorRajpur Textile Mill
onI January 1986
byProfessor Ramesh Chander
andProfessor Ramesh Kumar
School of ManagementRegional University, Ahmedabad
Example of the Cover and the Title Pagefor a Student Report
CRISIS IN THE SUGAR INDUSTRY
A PaperPresented to
Professor Ramesh ChanderSchool of Management, Regional University
onI January 1986
in Partial FuiflImentof the Requirements for the
Managerial Economics Course in theMaster of Business Administration Programme
byRamesh Kumar
Activity 1
Take any report which has been recently prepared in your organisation and checkwhether cover and title page contain all the essential information. If not, prepare anew cover and title page .
......................................................................................................
......................................................................................................
......................................................................................................
......................................................................................................
Formals of Reports
~
21

Report Writing andPresentation
l@J
22
12.4 INTRODUCTORY PAGESThe introductory pages are given lower case Roman numerals (e.g., i, ii, iii). Arabicnumerals (e.g., 1, 2, 3) are used from the first page of the introduction. Theintroductory pages contain the following:
1) Foreword
2) Preface
3) Acknowledgement
4) Table of contents
5) Lists of Tables and Illustrations
6) Summary
1) Foreword
The first page of the foreword is not numbered, but it is counted among theintroductory pages. Usually·a foreword is one page or even shorter. If a foreword ismore than a page, subsequent pages of the foreword are numbered in lower caseRoman numerals.
The foreword is written by someone other than the author. It is written by anauthority on the subject or the sponsor of the research or the book and introduces theauthor and the work to the reader.
At the end of the foreword, the writer's name appears on the right side. On the leftside, address and place of writing the foreword, and date appear. Name, address,place and date are put in italics.
2) Preface
The first page of the preface is not numbered, but it is counted among theintroductory pages. Subsequent pages of the preface are numbered in lower caseRoman numerals.
The preface is written by the author to indicate how the subject was chosen, itsimportance and need, and the focus of the book's content, purpose, and audience.
At the end of the preface, the author's name is given on the right side. On the leftside, address and place of writing the preface, and date appear. Name, address, placeand date are put in italics.
3) Acknowledgement
If the acknowledgement section is short, it is treated as a part of the preface. If it islong, it is put in a separate section.
The first page of the acknowledgement, is not numbered, but it is counted among theintroductory pages. Subsequent pages of the acknowledgement are numbered inlower case Roman numerals.
At the end of the acknowledgement, only the author's name appears in italics in theright-hand corner.
4) Table of Contents
In writing the table of contents, great care should be taken. The contents sheet is botha summary and a guide to the various segments of the book. The table of contentsshould cover all the essential parts ofthe book and yet be brief enough to be clear andattractive.
The first page is not numbered, but the subsequent pages are numbered in lower caseRoman numerals.
The heading TABLE OF CONTENTS or CONTENTS in all capital16tters appears atthe top. On the left side, foreword, preface, acknowledgement, and numbers and titlesof sections, chapters, centre heads, centre subheads, and side heads are listed. On theright side, the corresponding page numbers are given. The page numbers are alignedon the right.

The section and chapter titles are put in all capital letters. The centre head is put incapital and lower case letters. The centre subheads and side heads are put in lowercase letters, except the first letter of the first word and proper nouns.
The classification of the headings can be done in the traditional or decimal system inthe declining order as follows:
Formats of Reports
~
Traditional ClassificationJ.
A.
I.
a.
Decimal Classificationl.
1.1
1.1.1
The headings of the text can be indented III a step form to visually highlight theclassification.
At the end of the headings of the text, references to appendices, bibliography,glossary, and index appear. These references are put in all capital letters from themargin.
Samples of contents sheet in traditional and decimal classification follow.
ForewordPrefaceAcknowledgement
Example ofthe Contents Sheel in Traditional ClassificationCONTENTS
\I
viiix
SECTION (PART) A (I)I. CHAPTER TITLE
A. Centre Headl. Centre subhead
a. Side head
SECTION BII. CHAPTER TITLE
A. Centre HeadI. Centre subhead
a. Side headB. Centre Head
l. Centre subheada. Side headb. Side head
SECTION CIll. SUMMARY AND CONCLUSION
A. SummaryB. Conclusion
APPENDICESA. QuestionnaireB. I ntcrvicw
BIBLIOGRAPHYGLOSSARY
I33
1012
151717181920212225
27292935
373945
5155
ForewordPrefaceAcknowledgement
Example ofthe Contents Sheet in Decimal ClassificationCONTENTS
\I
viiix
~ECTION (PART) A (I)I. CHAPTER TITLE
1.1 Centre Head1.1.1 Centre su bhead
a. Side head
SECTION B2. CHAPTER TITLE
2.1 Centre Head2.1.1 Centre Subhead
a. Side head22 Centre head
2.2.1 Centre Subhead
I33
1012
15171718192021 23

Report Writing andPresentation
l@Ja. Side headb. Side head
SECTION C3. SUMMARY AND CONCLUSION
3.1 Summary3.2 Conclusion
APPENDICESI. Questionnaire2. Interview
BIBUOGRA PHYGLOSSARY
2225
27292935
373945
5155
24
5) Lists of Tables and Illustrations
Lists of tables and illustrations follow the table of contents. Each list starts on aseparate page. If the items in each list are few, both the lists are put on the same pagebut under different headings.
The headings for these lists may be in all capital letters-LIST OF TABLES, LIST OFILLUSTRATIONS, TABLES, or ILLUSTRATIONS, and they follow the format ofthe heading that is used on the contents page-TABLE OF CONTENTS orCONTENTS.
Only the first letter ofthe main words are capitalised in writing the titles oftables andillustrations.
The second and subsequent lines of an item are indented. The page number appearsagainst the first, second, or third line where the item's description ends.
Tables and illustrations are numbered continuously in serial order throughout thebook in Arabic numerals (e.g., 1, 2, 3,) or in the decimal form (e.g., 1.1, 2.1, 2.2.,3.1). In the latter classification, the first number refers to the chapter number and thesecond one to the serial order of the table or illustration within the chapter.
Example
TABLES
1) Growth of Consumer Goods Production 10
2) Index Number of Excise Duties Rates on Capital and Consumer Goods 30
6) Summary
A report invariably carries an abstract or an executive summary in the initial pages asa help to the busy researcher or executive. The summary is positioned immediatelybefore or after the contents sheet. The summary and the contents together provide anoverview to the reader. The length of the summary may vary from 100 words to1,000 words.
In a short repOli, the preface itself becomes the summary. In a long report, thesummary is given in the first chapter of the text.
The summary should highlight the following essential information:
1) What is the study about?
2) What is the extent and limitation of the coverage?
3) What is the significance and need for the study?
4) What kind of data has been used?
5) What research methodology has been used?
6) Whatare the findings and conclusions?
7) What are the incidental findings, if any?
8) Flow can the concfusions be used and by whom?
9) What are the recommendations and the suggested action Plan?
Activity 2
Take a report you have recently written and examine whether the introductory pagescontain all the sections indicated in this unit. If not, put in these sections if they arenecessary for the report.
12.5 TEXTThe subject matter of Text is divided into the following:
1) Headings
2) Quotations
3) Footnotes
4) Exhibits
1) Headings
The following types of headings are common:
1) Centre Read (All caps, without underlining)
2) Centre Subhead (Caps and lower case, underlined)
3) Side Head (All caps, without underlining)
4) Side Head (Caps and lower case underlined)
5) Paragraph Head followed by a colon (caps and lower case, underlined)
Which combination of headings to use depends on the number of classifications ordivisions that a chapter has.
Centre Head : A centre head is typed in all capital letters. If the title is long, theinverted pyramid style (i.e., the second line shorter than the first, the third line shorterthan the second) is used. All caps headings are not underlined; underlining isunnecessary because capital letters are enough to attract the reader's attention.
Example
CHALKING OUT APROGRAMME FOR
IMPORT SUBSTITUTION AND
EXPORT PROMOTION
Centre Subhead : The first letter of the first and the last word and all nouns,adjectives, verbs and adverbs in the title are capitalized. Atticles, prepositions, andconjunctions are not capitalized. .
Example
Chalking out a Programme for
Import Substitution and
Export Promotion
Side Heads: Words in the side head are either written in all capitals or capitalized asin the centre subhead and underlined.
Example
Import Substitution and Export Promotion
Paragraph Head : Words in a paragraph head are capitalized as in the centresubhead and underlined. At the end, a colon appears, and then the paragraph starts.
Example
Import Substitution and Export Promotion: The Seventh Five-Year Plan of India hasattempted .
2) Quotation
Quotations Marks: Double quotation marks (" ") are used. A quotation within aquotation is put in single quotation marks (' '). Example: He said, "To the selfish,'freedom' is synonymous with licence."
Punctuation and Quotation Marks: The quotation mark is put after the commaand the full stop. (Example: 'To the selfish," he said, "freedom is synonymous withlicence. ") But the quotation mark is put before the semi-colon and colon. (Example:The following are methods of "realistic learning": case method, tutorial method,
group discussions and business games.) The quotation mark is put before or after the
Formats of Reports
l@J
25

Report Writing andPresentation
~
26
question mark or the exclamation mark depending on the sense. Examples: 1.) Heasked, "Did you write to Ramesh?" 2) What do you mean by "freedom"?
• J
" II. "?", ,1I II. ".1I,
When to Use Quotation Marks: Quotation marks are used for 1) a directly quotedpassage or word, 2) a word or phrase to the emphasized, and 3) titles of articles,chapters, sections of a book, reports, and unpublished works.
How to Quote : a) All quotations should correspond exactly to the original inwording, spelling, and punctuation. b) Quotations up to three typewritten lines arerun into the text. c) Direct quotations over three typewritten lines are set in indentedparagraphs. Quotation marks are not used for indented paragraphs.
Five Ways of Introducing a Quotation:
a) Introduction: He said, "The primary test of success in a negotiation is thepresence of goodwill on both sides."
b) Interpolation: "The primary test of success in a negotiation," he said, "is thepresence of goodwill on both sides."
c) End Reference: "The primary test of success in a negotiation is the presence ofgoodwill on both sides," he said.
d) Indented Paragraph: He said:
For the workers no real advance in their standard of living possible withoutsteady increase in productivity because any increase in wages generally,beyond certain narrow units, would otherwise be nullified by a rise in prices.
e) Running into a Sentence: He recommended that "joint management councils beset up in all establishments in the public as well as private sector in whichconditions favourable to the success of the scheme exist".
Omission in a Quotation
a) Omission of a word or words from the quotation is indicated by ellipsis, i.e.,three dots .).
b) Omission, ofa whole paragraph is indicated by a line ofdots.
Author's Comments in a Quotation
a) Comments ofthe author in a quotation are separated by brackets [].
b) If there is an obvious error in the original source, it is quoted as in the originalsource. The author can indicate that he is doing so by [sic].
3) Footnotes
Types of Footnotes : A footnote either indicates the source of the reference orprovides an explanation which is not important enough to include in the text.
In the traditional system, both kinds of footnotes are treated in the same form and areincluded either at the bottom of the page or at the end ofthe chapter or book.
In the modern system, explanatory footnotes are put at the bottom of the page and arelinked with the text with a footnote number. But source references are incorporatedwithin the text and are supplemented by a bibliographical note at the end of thechapter or book.
Rationale of Footnotes : Footnotes help the readers to check the accuracy of theinterpretation of the source by going to the source if they want to. They are also anacknowledgement of the author's indebtedness to the sources. They lend authority tothe work and help the readers to distinguish between the author's own contributionand that of others.
Where to Put the Footnote: Footnotes appear at the bottom of the page or at theend of the chapter or report (before the appendices section).
Numbering of Footnotes
a) For any editorial comment on the chapter or title, an asterisk is used.

b) In the text Arabic numerals are used for footnoting. Each new chapter beginswith number 1.
c) The number is typed half a space above the line or within parentheses. No spaceis given between the number and the word. No punctuation mark is used after thenumber. .
d) The number is placed at the end of a sentence or, if necessary to clarify themeaning, at the end of the relevant word' or phrase. Commonly the numberappears after the last quotation mark. In an indented paragraph, the numberappears at the end of the last sentence in the quotation.
Footnotes at the Bottom of the Pagea) After the last line of the text, three spaces are given and a IS-space line is drawn
to separate the footnotes from the text. Then three spaces are given and the firstfootnote is typed.
b) Each footnote is typed in single space. Between two footnotes, two spaces aregiven.
c) The first lane of each footnote is indented five spaces, and the rest of the lines arestarted from the regular margin.
d) Footnotes should not overflow from one page to another. If the last footnote of apage has to be carried over to the next page, the carry-over portion is typed at thebottom of the next page before the footnote references of that page begin. Thefootnote of the first page is broken in the middle of a sentence so that the readeris made to turn to the next page to read the rest of the footnote.
Separated Reference Notes and Explanatory NotesWithin the text, immediately after a quotation or a paraphrased statement, the lastname of the author, year of publication, and page number (Rao, 1981, p. 101) areindicated within parentheses. If more than one publication of the author in the sameyear are referred to, a letter is added after the year of publication (Rao, 1981 (a), p.101).If the author's name is mentioned in the text in introducing the quotation or theparaphrased statement, the reference to the name in the parentheses is dropped. If theyear is also mentioned in the text, the reference to the year in the parentheses is alsodropped.The source references are elaborated in notes at the end of the article, chapter, orbook. The reference notes are presented in a bibliographical form.The explanatory notes are presented as in the traditional footnote form with a numberat the appropriate place in the text and the explanatory footnote at the bottom of thepage.Examples of Footnote EntriesComparative examples of footnote and bibliographical entries are given under thebibliography section.Comparative examples of traditional and modern footnoting forms follow.
Example of Traditional FootnotingHISTORY OF CORONETThe first issue of Coronet put out by Esquire, Inc., was dated November 1936. Itappeared "with a five-color cover, [carrying] drawings, etchings, and colorreproductions of Raphael and Rembrandt in addition to fiction, articles, andphotographs." (1)Esquire described the contents of Coronet in an advertisement as follows:The book-size magazine of popular culture is a "believe-it-or-not" of money's worth,for the many-sided CORONET is truly four magazine in one: It's a magnificentlyillustrated journal of the fine arts; it's a breath-takingly beautiful "picture magazine"of unforgettable photographs; it's a full-strength satire and humor magazine; and adistinguished general magazine... Each issue is an entertaining education in "thingsyou never knew till now"-a liberal culture cour~e in capsule form -a little college inyour coat pocket:(2)Within 48 hours, according to its first publisher, David A. Smart, the 250,000 copiesof the first issue weresold out. (3)
Formats of Reports
l@J
27

Report Writing andPresentation
~
28
1) Theodore Peterson, Magazines in the Twentieth Century (Urbana: University ofIllinois Press, 1964), pp. 342-3.
2) Esquire, December 1936, p. 322. For complete discussion on format and contentsof the magazine, see, Chap. IV.
3) Peterson, op, cit., p. 343. For the names of all the editors and publishers of themagazine, see Chap. III.
Example ofModern FootnotingHISTORY OF CORONETThe first issue of Coronet put out by Esquire, Inc., was dated November 1936. Itappeared with a five-color cover, [carrying] drawings, etchings, and colorreproductions of Raphael and Rembrandt in addition to fiction, articles, andphotographs (Peterson, 1964, pp. 342-3).Esquire (December 1936, p. 322) described the contents of Coronet in anadvertisement as follows:The book-size magazine of popular culture is a "believe-it-or-not" or money's wOlth,for the many-sided CORONET is truly four magazines in one: It's a magnificentlyillustrated journal of the fine arts; it's a breath-takingly beautiful "picture magazine"of unforgettable photographs; it's a full-strength satire and humor magazine; and adistinguished general magazine... Each issue is an entertaining education in "thingsyou never knew till now"-a liberal culture course in capsule form-a little college inyour coat pocket: (1)Within 48 hours, according to its first publisher, David A. Smart" the 250,000 copiesof the first issue were sold out (Peterson, 1964, p. 343. (2)1) For complete discussion on format and contents of the magazine, see Chap. IV.2) For the names of all editors are publishers ofthe magazine, see Chap. III.
NOTES[At the end of the Chapter]Peterson, Theodore, Magazines in the Twentieth Century. Urbana: University ofIllinois Press, 1964.4) ExhibitsTABLESReference and InterpretationBefore a table is introduced, it is referred in the text (e.g., see Table 1.1; refer toTable 1.1; as in Table 1.1; Table 1.1 indicates). A table is meant only to expand,clarifY, or give visual explanation rather than stand by itself. The text shouldhighlight the table's focus and conclusions.An example of a good match between the text and the table is quoted below fromAnne Anastasi's Fields of Applied Psychology (New York: McGraw-Trull BookCompany, 1964); page 146:The Communication Process: Industrial psychologists have investigated the communicationprocess from many angles. Some have been concerned with the relative effectiveness ofdifferent media. In one such study (II) information was transmitted by five different methodsin various departments of an industrial plant. Later, tests were administered to determine howmuch the individual employees had actually received and retained. The results are shown inTable 10. It will be noted that the combination of oral and written communication gave thebest results but that oral only was more effective than written only. Bulletin board andgrapevine yielded the poorest results.
Table 10 Mean Information Test Scores of Employees Receiving communicationthrough Different Media (From Dahle, 11, p. 245)
Medium No. of MeanEmployees Test Score*
Combined oral and written 102 7.70Oral Only 94 6.17Written only 109 4.91Bulletin board 115 3.72Grapevine only (control group) 108 3.56* All differences are significant at the 5 per cent level or better except that betweenthe last two means in the column.Identificationa) Each table is given a number, title, and, if needed, a subtitle. All identificationsare centred.

b) Arabic numerals, instead of Roman numerals or capital letters, are recommendedfor numbering the tables. Usually technical monographs and books contain manytables. As the number increases, Roman numerals become unfamiliar to the reader.Roman numerals also occupy more space than Arabic numerals. If there are morethan 26 tables, capital letters will not be sufficient to identifY them.
Tables can be numbered consecutively throughout the chapter as 1.1, 1.2,
·1.3 .... wherein the first number refers to the chapter and the second number to thetable.
c) For the title and subtitle, all capital letters are used.
d) Abbreviations and symbols are not used in the title or subtitle.
Body
a) Column headings are typed vertically, and abbreviations are used as spacesavers. If uncommon abbreviations are used, they are explained in footnotes. Themain words of column headings are capitalized and underlined if column rules arenot used. .
b) Identifications of measurement units (e.g., Rs., S) are put in column headings.
c) Column numbers are usually avoided. But they are used if references are made tocolumns (e.g., Col. 1, or the total of Cols. 1 and 4) either in the text or in the table.
d) The row captions are aligned on the left. But the numbers are aligned on theright. If there is a sub-caption, it is indented three spaces inside. Single space is usedthroughout. Between the caption and the sub-caption double space is given. If thecaptions run into two or more lines, the serial numbers corresponding to the captionsare aligned.
ExampleTable 1.1
Changes In Indilti of Industrial Production(Base: 1956= 100)
Period General Basic Capital lnter- ConsumerIndex Industries Goods mediate Good.
Goods
Plan I· +26.0 n.a n.a. n.a~ n.a.(+5.0)
Plan II +30.8 +67.2·· +50.1 +21.3 +14.7(+5.9) (+ 11.9) (+ 11.3) (+5.0) (+3j)
Plan III +38.7··· +55.0 +98.1 +36.0 +28.7(+6.8) (+7.1) (+ 14.P.) (+6.4) (+S.2)
Source: Reser"" Bank of India Bulletin. June 1957.Abbreviation: n.a. = not available.Symbol: ( ) Figures in parentheses represent annual rate of increase.• Data for Plan I are estimaH:d.••...Example
Formats of Reports
l@J
ExpendilUre Heads
I) Miscellan<'Ous Expen'sesa. Training 'Programmeb. High Yielding Varieties Projectc. Chair for Management Practicesd. Suhsidized Programme
2) Amount Transferred to Reserve or Specific Fundsa. Fund for conwyance advance to officers and staffb. Fund [or schularships
T"101
Amount(Rs.)
1.83,770.3116.593.44l~,OOO.OO
31.230.67
1,00.000.001.75.000.00
5.24.594.42
29
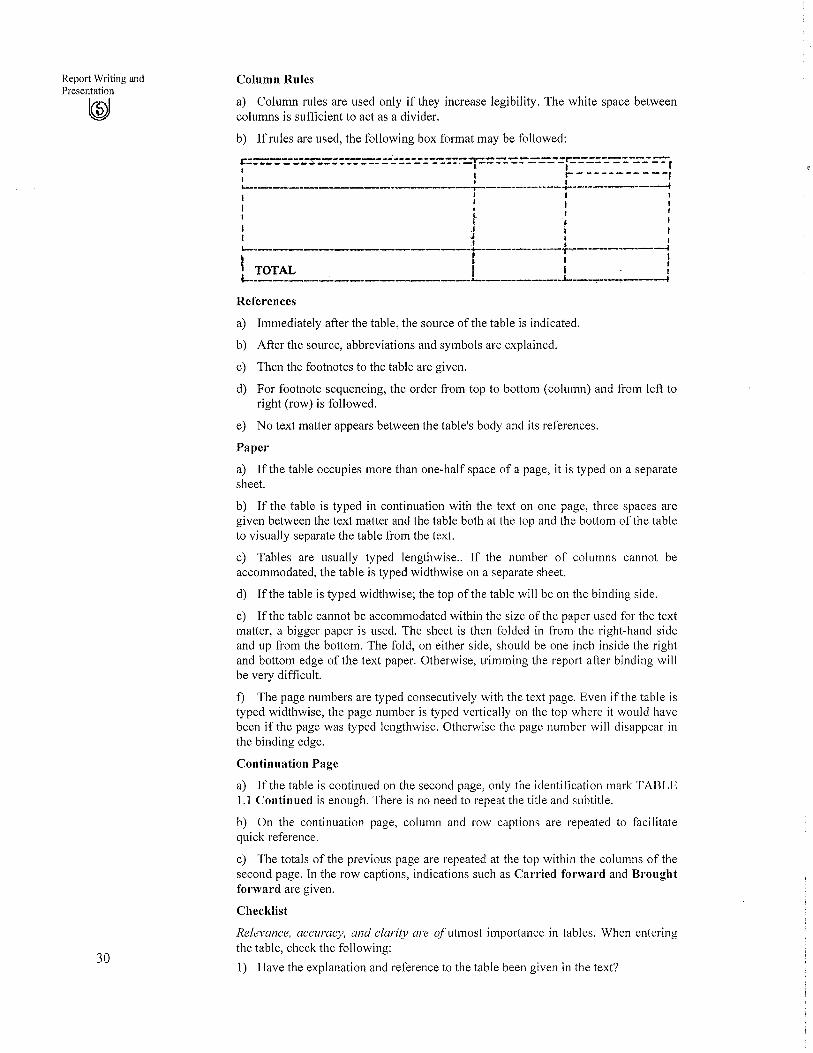
Report Writing andPresentation
l@J
30
Column Rules
a) Column rules are used only if they increase legibility. The white space betweencolumns is sufficient to act as a divider.
b) If rules are used, the following box format may be followed:
r===---=-.:::.-.:r:.:=::-:-::::-==:=.:::::-::=-::-:.-::-:::-_.,-=.==-:.-==-===--=p:.=::-::-=::-=--=:-rI I r- - - - - - - - - - - -r:.- ... -:..-.. --:.-- ----f
I I II I Ii I II ~ I
.I i II 1: I1-- +- ,......- •__:,
i I I rI TOTAL fl. :~---------------"---------.1..--.,.....----4
References
a) Immediately after the table, the source of the table is indicated.
b) After the source, abbreviations and symbols are explained.
c) Then the footnotes to the table are given.
d) For footnote sequencing, the order from top to bottom (column) and from left toright (row) is followed.
e) No text matter appears between the table's body and its references.
Paper
a) If the table occupies more than one-half space of a page, it is typed on a separatesheet.
b) If the table is typed in continuation with the text on one page, three spaces aregiven between the text matter and the table both at the top and the bottom of the tableto visually separate the table from the text.
c) Tables are usually typed lengthwise.. If the number of columns cannot beaccommodated, the table is typed widthwise on a separate sheet.
d) If the table is typed widthwise; the top ofthe table will be on the binding side.
e) Ifthe table cannot be accommodated within the size of the paper used for the textmatter, a bigger paper is used. The sheet is then folded in from the right-hand sideand up from the bottom. The fold, on either side, should be one inch inside the rightand bottom edge of the text paper. Otherwise, trimming the repOli after binding willbe very difficult.
f) The page numbers are typed consecutively with the text page. Even if the table istyped widthwise, the page number is typed vertically on the top where it would havebeen if the page was typed lengthwise. Otherwise the page number will disappear inthe binding edge.
Continuation Page
a) If the table is continued on the second page, only the identification mark TABLE1.1 Continued is enough. There is no need to repeat the title and subtitle.
b) On the continuation page, column and row captions are repeated to facilitatequick reference.
c) The totals of the previous page are repeated at the top within the columns of thesecond page. In the row captions, indications such as Carried forward and Broughtforward are given.
Checklist
Relevance, accuracy, and clarity are a/utmost importance in tables. When enteringthe table, check the following:
1) Have the explanation and reference to the table been given in the text?

2) It is essential to have the table for clarity and extra information?
3) Is the representation of the data comprehensive and understandable?
4) Is the table number correct?
5) Are the title and subtitle clear and concise?
6) Are the column headings clearly classified?
7) Are the row captions clearly classified?
8) Are the data accurately entered and represented?
9) Are the totals and other computations correct?
10) Has the source been given?
11) Have all the uncommon abbreviations been spelt out?
12) Have all footnote entries been made?
13) If column rules are used, have all rules beenproperly drawn?
Illustrations
Illustrations cover charts, graphs, diagrams, and maps. Most of the instructions givenfor tables hold good for illustrations.
Identification
Illustrations are identified as FIGURE, CHART, MAP, or DIAGRAM. Theidentification marks (i.e., number title, and, if any, subtitle) are put at the bottom,because an illustration, unlike a table, is studied from bottom upwards.
Activity 3
Take a report that you have recently written and examine the following:
a) Check the presentation of quotations and footnotes. Rewrite the references bothin traditional and modern format.
b) Go through the exhibits in the report and compare against the checklist given inthis unit. Improve the presentation of exhibits and prune them down to the bareminimum required. Rewrite the explanation to them in the text.
12.6 REFERENCE SECTIONThis section follows the text. First comes the appendices section, then thebibliography and glossary. Each section is separated by a divider page on which onlythe words APPENDICES, BIBLIOGRAPHY, or GLOSSARY in all capital lettersappear.
All reference section pages are numbered in Arabic numerals in continuation with thepage numbers of the text.
1) Appendices
What Goes into an Appendix
a) Supplementary or secondary references are put in the appendices section. But allprimary reference material of immediate importance to the reader is incorporated inthe text. The appendices help the author to authenticate the thesis and help the readerto check the data.
b) The material that is usually put in the appendices is indicated below:
1) Original data
2) Long tables
3) Long quotations
4) Supportive legal decisions, laws, and documents
5) Illustrative material
6) Extensive computations
Formats of Reports
l@J
31

3) Place of publication4) Publisher5) Date of publication6) Number of pages
Report Writing andPresentation
~
32
7) Questionnaires and letters
8) Schedules or forms used in collecting data9) Case studies/histories10) Transcripts of interviewsNumbering of Appendices
The appendices can be serialized with capital letters (Appendix A, Appendix B) todifferentiate from the chapter or table numbers.References to Appendices
a) In the text, reader's attention is drawn to the appendices as in the case of tables.b) All appendices are listed in the table of contents.2) BibliographiesPositioning of the Bibliography
The bibliography comes after the appendices section and is separated from it by adivision sheet written BIBLIOGRAPHY. It is listed as a major section in all capitalletters in the table of content.
A bibliography contains the source of every reference cited in the footnote and anyother relevant works that the author has consulted. It gives the reader an idea of theliterature available on the subject and that has influenced or aided the author.Bibliographical InformationThe following information is given for each bibliographical reference:
Books Magazines and NewspapersI) Author(s) 1) Author(s)
2) Title (underlined) 2) Title of the article (within quotationmarks)
3) Title ofthe magazine (underlined)4) Volume number (Roman numerals)5) Serial number (Arabic numerals)6) Date of issue7) Page numbers of the article
Types of BibliographiesThe title of a bibliography should indicate what type of items are listed.Some common varieties of bibliographies are given below:
a) Bibliog,oaphy of Works cited lists only those items which have been referred toin the text.
b) Selected Bibliography contains only those items which the author thinks are ofprimary interest to the reader and indicates the criteria used for selecting the items.c) Annotated Bibliography gives a brief description of each item to help the readerto find out the usefulness of the book.Difference between Bibliographical and Footnote Entries
The formats of bibliography and footnote differ in the following respects:
a) In a bibliography, the first line of an item begins at the left margin and thesubsequent lines are indented. But in a footnote, the first line is indented and thesubsequent lines of the item begin at the left margin.
b) In a bibliography, the last name of the author is given first (Kumar, Arvind), butin a footnote the first name is given first (Arvind Kumar).
c) A bibliography is arranged within a section in the alphabetical order of the lastname of the author or in the alphabetical order of the title of the work, or in thechronological order of publication. But footnotes are arranged in the sequence inwhich they have been referred to in the text.
d) Punctuation, marks in a bibliography and in a footnote are different.
e) In a bibliography the total number of pages of a book (205 pp.) or page numbersof the article (1-21) are given, while in a footnote only the specific page (p. 21) orpages cited (pp. 3-5) are given.

How to Make a Bibliography Formats of Reports
Solutions to some of the difficulties commonly faced in writing a bibliography aregiven below:
a) When the bibliography is long, items are classified for easy reference accordingto 1) format like books, periodicals, and newspapers, 2) subject or theme, or 3)chronological order.
b) If the name of the author is not given, the title of the book or the article appearsfirst. "A", "An", and "The" in the beginning of the title are ignored for determiningthe alphabetical order; however, the article appears in the listing if it is a part of thetitle.
c) An author's works written in collaboration with others are listed after the workswhich he has written alone.
d) If there are more than three authors, the symbol et al. is used after, the firstauthor's name and other names are omitted.
e) If two or more works of an author are listed, the author's name is written for thefirst time, and for subsequent items a 10-space line is drawn where the author's nameshould appear.
t) Within the works of an author, the order is determined by the alphabetical orderofthe title of the work or the date of publication.
g) If two or more persons have written the book, the names are listed in the ordermentioned in the book or article.
Examples ofBibliographical and Footnote Entries
ONE AUTHORBibliographyBasu, Amrendra. Consumer Price Index: Theory. Practice and Use In India. Calcutta: Modern Book Agency,1963. 175 pp.Footnote1 Amrendra Basu, Consumer Prlu Index: Theory, Practice and Use In India (Calcutta: Madem BookAgency, 1963), p. 10.
TWO AUTHORSBibliographySingh, Mohinder; and Pandya, J.F. Government Publications of India. Delhi: Metropolitan Book Co.PVL Ltd., 1967. 270 pp.Footnote
1 Mohinder Singh and J.F. Pandya, Government Pub/iC/ltlons of India (Delhi: Metropolitan Book Co.Pvt. Ltd., 1967. p. 21.
THREE AUTHORSBibliographyMote, V.L.; Malya, M. Meenakshi; and Saba, Jahar. Toblesfor Capital Investment Analysis.Ahmedabad: Indian Institute of Management, 1986. 36 pp.FootnoJe1 V.L. Mote, M. Meenakshi Malya, and Jahar Saha, Tables for Capital Investment Analysis(Ahmedabad: Indian Institute of Management, 1968) p. 10.
MORE THAN THREE AUTHORSBibliographyDesai, D.K., et 01.• Studies In Block Development and Cooperative Organisation. Ahmedabad: IndianIlIJtitute of Management, 1966. 382 pp.FootnoteI D.K. Desai, et 01., Studies In Block Devel~pment and Cooperath'e Organisation. (Ahmedabad: IndianInstitute of Management, 1966) p. 10
EDITED BOOKBibliographyBasu,G. (cd). Indian Tax Laws and Foreigners Having Investment In India or Having BusinessConnections in or with India. Calcutta: Oxford Book & Stationery, 1962. 140 pp.FootnoteI G. Basu (cd), Indian Tax Laws and Foreigners Having Investment In India or Having BusinessConnections In or with India. (Calcutta: Oxford Book & Stationery, 1962) p. 10
Fa/mats of Reports
l@J
33

Report Writing andPresentation
l@J
34
TRANSLATIONBibliographyBata, Thomas..How I Began. Trans. Jan Baros. Batanagar: Club for Graduates ofBata School, 1942.332 pp.FootnoteI Thomas Bata, How I Began. Trans. Jan Baros. (Batanagar: Club for Graduates ofBata School, 1942) p.I 0
ARTICLE IN A BOOKBibliographyArgyris, Chris, "Individual Actualization in Complex Organizations", Organizationand Administration: A Book of Readings, Ishwar Dayal and Kamini Adhikari.Bombay: Progressive Corpn., 1969.2-50. FootnoteI Chris Argyris, "Individual Actualization in Complex Organizations", Organizationand Administration. A Book of Readings, Ishwar Dayal and Kamini Adhikari.(Bombay: Progressive Corpn., 1969) p. 10.
DIFFERENT EDITIONSBibliographyBasu, Durga Das. Shorter Constitution ofIndia. 5th edn. Calcutta: S.C. Sarkar, 1967.250 pp. FootnoteI Durga Das Basu, Shorter Constitution of India. (5th edn. Calcutta: S.C. SarkaI',1967) p. 10.
MORE THAN ONE VOLUMEBibliographyMyrdal, Gunnar. Asian Drama: An InquiJy into the Poverty ofNations. 3 Vols. NewYork: The Twentieth Century Fund, 1968.FootnoteI Gunnar Myrdal, Asian Drama: An Inquiry into the Poverty of Nations. 3 Vols.(New York: The Twentieth Century Fund, 1968), I, 20.
PART OF A SERIESBibliographyDecentralization : Strategy and Structure, Alumni Conference Series, 1967.Ahmedabad: Indiian Institute of Management, 1968. 161 pp.FootnoteI Decentralization : Strategy and Structure (Alumni Conference Series, 1967;Ahmedabad: Indian Institute of Management, 1968), p. 10
GOVERNMENT PUBLICATIONBibliographyMinistry of Law, Government ofIndia. The Copyright Act, 1957 (14 of 1957). Delhi:The Manager of Publications, 1960.32 pp.Footnote1 Ministry of Law, Government of India. 'The Copyright Act, 1957 (14 of 1957).(Delhi: The Manager of Publications, 1960), p. 10.
MIMEOGRAPHED OR PHOTOCOPIED MATERIALBibliographyRao, G.N. "A Life Table Approach to Wastage in Education", Jaipur: University ofRajasthan, 1958.121 pp. (Mimeographed)Footnote1 G.N. Rao, "A Life Table Approach to Wastage in Education", (Jaipur: Universityof Rajasthan, 1958), p.1 O. (Mimeographed)
ARTICLE IN A JOURNALBibliographyGandhi, Ved P. "Taxation of Agricultural Incomes", Industrial Times, X; 12, (15 June1968), 8. Footnote1 Ved P. Gandhi, "Taxation of Agricultural Incomes", Industrial Times, X; 12, (15June 1968), 8.ARTICLE IN A NEWSPAPERBibliographyGandhi, Ved. P. "Will the Budget Achieve Its Aims? Certain Doubts", The EconomicTimes, VIII, 2,

(8 March 1968), 5. Footnote1 Ved P. Gandhi, "Will the Budget Achieve Its Aims? Certain Doubts", TheEconomic Times, VIII, 2,(8 March 1968), 5.BOOK REVIEWBibliographyDesai, D.K. "Review ofApplication ofProgramming Techniques to Indian FarmingConditions by SS Jain and A.S. Kahlar", Indian Journal ofAgricultural Economics,XXIII, 1, (Jan-Mar 1968),91-94. Footnote1 D.K. Desai, "Review of Application of Programming Techniques to IndianFarming Conditions by SSJain and A.S. Kahlar", Indian Journal ofAgricultural Economics, XXIlI, 1, (Jan-Mar1968),92: 34
ASSOCIATION JOURNALBibliographyAggarwal, S.c. "Modern trends in Production Planning and Control", ManagementReview (Baroda Management Association), VII, 1, (Nov 1967), 17-19.Footnote1 S.C. Aggarwal, "Modern trends in Production Planning and Control", ManagementReview (Baroda Management Association), VII, 1, (Nov 1967), 18.
CONFERENCE PAPERBibliographyBhattacharya, S.K. "Control 'techniques and Their Applicability." Paper read at theAhmedabad Management Association, Ahmedabad, 22 Nov 1967. 12 pp.(Mimeographed)Footnote1, S.K. Bhattacharya, "Control Techniques and Their Applicability." Paper read at theAhmedabad Management Association, Ahmedabad, 22 Nov 1967. p.1 I(Mimeographed)
MORE THAN ONE ITEM OF AN AUTHORBibliographyShah, B.G. "Farm Finance: A Few important Issues", Artha Kkas, IV, 1, (Jan 1968),38-45. "Manpower Development for Banks", The Feonomic Times, VllI, 3, (26 June1968), 5.3) GlossaryWhat is a Glossary : A glossary is a short dictionary glvmg definitions andexamples of terms and phrases which are technical, used in a special connotation bythe author, unfamiliar to the reader, or foreign to the language in which the book iswritten. It is listed as a major section in all capital letters in the table of contents.Positioning of a Glossary: The glossary appears after the bibliography. It may alsoappear in the introductory pages of a book after the lists of tables and illustrations.Order of Listing : Items are listed in alphabetical and normal order. Example:.Centre Heading is lasted under 'C and not under H.Activity 4Take any report and check whether bibliography is presented in the standard form. Ifnot, rewrite the bibliography.
Activity 5Examine the appendices to any report. Are all of them essential for understanding thetheme of the report. Can they be pruned?
......................................................................................................12.7 TYPING INSTRUCTIONSFor typing of a report, the following should be kept in mind.
Formats of Reports
l@J
35

1 space2 spaces2 spaces1 space2 spaces
Report Writing andPresentation
l®J
36
Papera) Quarto-size, white, thick, unruled paper is used for manuscripts.
b) Typing is done on only one side of the paper.
MarginsThe following margins may be followed:
Left = 1.5 in.
Right = 1 in.
Top and bottom 1 in. (But on the first page of every major division, e.g.,beginning of a chapter give 3 in. space at the top. give 3 in.space at the top.
Uniform margins make the typescript look neat.
Indentiona) The first line of a regular paragraph is indented five spaces from the margin.
b) All lines in an indented paragraph are indented five spaces from the margin. Butthe first line of an indented paragraph, if it has a paragraph beginning, is indented 10spaces from the margin.
Example:The increase in taxation on commodities through excise duties and custom duties hasincreased the tax and therefore the prices.
Spacing between Linesa) The whole manuscript is typed in double space, except indented paragraphs,tables, and footnotes, which are usually in single space. Wherever single space isused, double space is given between paragraphs or sets of items.
b) Triple space is given 1) before a paragraph head and 2) before and after a centrehead, centre subhead, side head, indented paragraph, or table.Spacing within a SentenceBetween wordsAfter a semi-colonAfter a colonAfter a commaAfter a full stopBefore the firstparenthesis or bracket 1 spaceAfter the last parenthesis 1 spaceNo space is given in the following cases:a) Between the last letter and the comma, semi-colon, colon, exclamation mark,question mark, last parenthesis, and last bracket.b) Between the first quotation mark and the following word.c) Between the last quotation mark and the last quoted word or punctuation.d) Between the dash and the words preceding or following it.e) Between hyphenated words.±) Between the bar (I) and the words preceding or following it.
12.8 COPY READINGThe copy reader's symbols are used for instructing the typist or secretary. But theproof reading symbols are used for instructing the printer. Some symbols arecommon. But the symbols'for proof reading are more than for copy reading. (Copyreading symbols with explanations are given at the end of this unit in Appendix A.)
12.9 PROOF READINGTypes of Proofsa) Usually the printer sends galley proofs (also known as first proofs), page proofs,and engraver's proofs (wherever photographs or other illustrations are involved). Ifrequired, revised proofs at any stage are sent. For a high quality work, the printerprovides a dummy, which is also called machine proof or press proof.
b) The galley proof is the one which is not divided into pages. Galleys, the shortname for galley proofs, are in single column set in the line width of the text and

sometimes as long as 24 inches. The second stage is that of page proofs, which giveFormats of Reports an idea what each page will contain and look fake. Dummy is thefinal stage which represents the printed version before copies are run off.
How to Proof Read
a) A good proof reader has accuracy to pin-point all the mistakes, clarity in givinginstructions to the printer, and speed for meeting the printer's deadlines.
b) Correction marks are indicated at two places 1) within the line where thecorrection is to be carried out and 2) in the margin against the corresponding linegiving the instruction. If there are two or more corrections in a line, both the right andleft margins are used for instructions.- The sequence of instructions corresponds tothe sequence of marks within the line in order from left to right. Each instruction Isseparated by a bar (/).
c) Instructions are never given at the place of correction. The printer only goesthrough the margins and never reads through the proofs. If the instruction is not in themargin, the printer will miss it.
d) The proof may be marked preferably with a red ballpoint pen. The red colourshows up better in the background of black ink and darkness of the composing room.Avoid red ink or pencil. Ink spreads on the cheap paper used for proofs and pencilmarks are not sharp.
e) To catch as many errors as possible, proof may be read four times as follows:
I) Ask another person to read the copy aloud while you go through the proofs.
2) bead the proof alone without somebody reading from the copy.
3) Check all the headings and subheadings.
4) Check all the cross references.
Above all, remember proofs have to be read letter by letter rather than word by word.
t) Proofs are meant to be corrected but not edited. Additions and deletions at theproof stage, commonly known as author's alterations (AA), are time consuming andvery expensive. The cost of making these alterations are passed on to the author.Large-scale editing will upset the layout of the pages also. But if the mistake is veryglaring, edit it at the proof stage rather than let it go into the final print.
(Proof reading symbols with explanations are given at the end of this unit inAppendix B.)
Returning the Proofs
a) Proofs must be returned to the printer according to the agreed schedule. Thedelay on author's part upset scheduling of the machines and other operations of theprinter and the publisher.
b) The manuscript is also returned with the proofs. The printer uses the manuscriptfor his checking and record in case any suit for damages is filed. The manuscriptbecomes the property ofthe printer.
The author can use the duplicate of the manuscript for correcting. Then the printerneed not send the original copy back and forth.
c) Sometimes printers send two proof copies-6ne for the author's record and theother for returning to the printer.
d) For security, either hand deliver the proofs or send in a registered cover.
Activity 6
Take any report and edit it using copy reading and proofreading symbols.
Formats of Reports
~
37

Report Writing andPresentation
l@J
38
12.10 SUMMARY
In this unit, we have discussed the various parts of a report. They are divided intocover and Title Page, Introductory Pages, Text and Reference Section. Cover andTitle Page have these components (a) Title of the subject or Project (b) Presented towhom (c) on what date (d) for what purpose (e) written by whom. The Introductorypages contain (a) Foreward (b) Preface (c) Acknowledgement (d) Table of contents(e) Listing of Tables and Illustrations and (f) Summary. The subject matter of Text isdivided into (a) Headings (b) Quotations (c) Footnotes (d) Exhibits. Referencesection follows the Text. It contains (a) Appendices (b) Bibliography and (c)Glossary. Each of these heads and subheads are explained with the help of examples.
The unit also explains the typing instructions which should be followed while typingthe report. The unit concludes by explaining how one goes about proof reading thereport.
12.11 SELF-ASSESSMENT EXERCISES
Take a report that you have recently written and examine the following:
1) Does the cover and the title page contain all the essential information? If not,prepare a new cover and title page.
2) Do the introductory pages contain all the sections indicated in this unit? If not,put in these sections if they are necessary for the report.
3) Is the table of contents comprehensive? If not, prepare a fresh table of contents.For practice, prepare the contents both in traditional and decimal classifications.
4) Read through the headings in the report. Improve the wording, sequence, andpresentation of the headings. Rewrite the contents page according to the newheadings inside the report.
5) Does your report contain the executive summary? If yes, check whether it iscomprehensive? If not, write an executive summary.
6) Check the presentation of quotations and footnotes. Rewrite the references bothin traditional and modern format.
7) Go through the exhibits in the report and compare against the checklist given inthis unit. Improve the presentation of the exhibits and prune them down to thebare minimum required. Rewrite the explanation to them in the text.
8) Examine the appendices to the report. Are all of them essential for understandingthe theme of the report? Can they be pruned?
9) Is the bibliography presented in the standard form? If not, rewrite thebibliography.
10) Edit your report using the copy reading and proof reading symbols.
12.12 FURTHER READINGS
Gallagher, J. William, "Report Writingfor Management", Addison-Wesley
Golen, P. Stevan, "Report Writing for Business and Industly", BusinessCommunication Service
Sharma R.C. and Krishan Mohan, "Business Correspondence and Report Writing",Tata McGraw-Hill
Wright, c., "Report Writing", Witherby & Co England
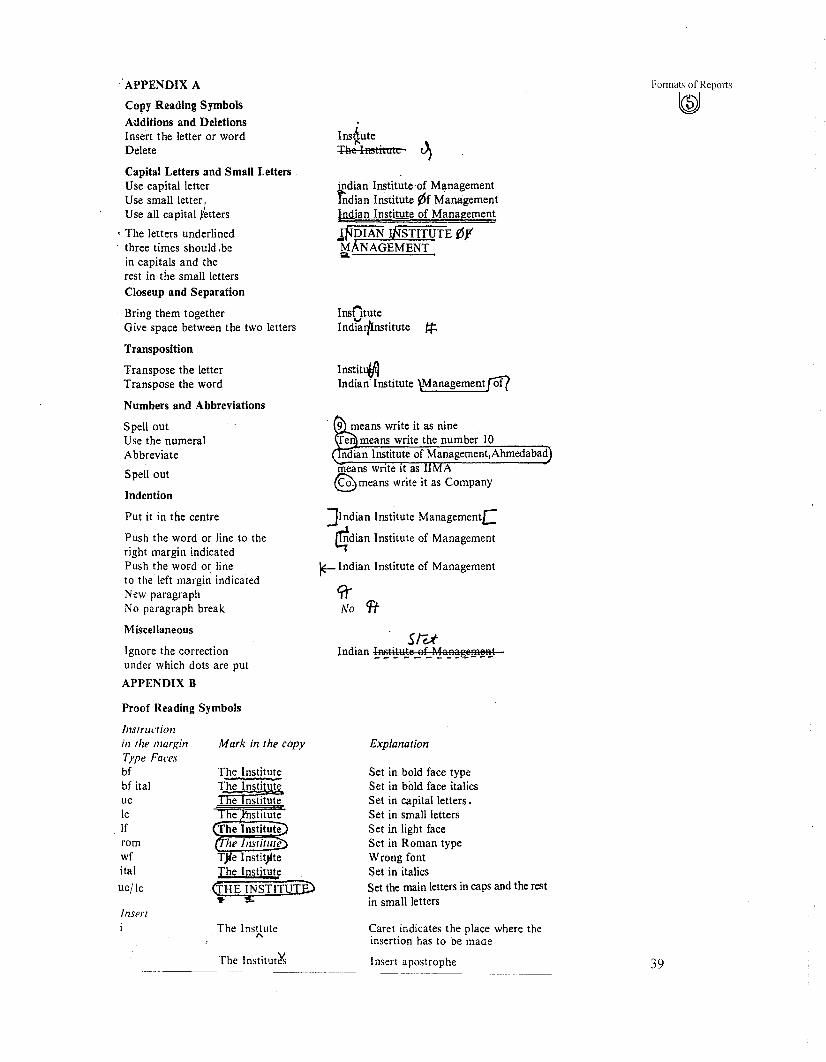
'APPENDIX A
Copy Reading Symbols
Additions and DeletionsInsert the letter or wordDelete
Capital Letters and Small LettersUse capital letterUse small letterUse all capital Yetters
• The letters underlinedthree times should,bein capitals and therest in the small lettersCloseup and Separation
Bring them togetherGive space between the two letters
Transposition
Transpose the letterTranspose the word
Numbers and Abbreviations
Spell outUse the numeralAbbreviate
Spell out
Indention
Put it in the centre
Push the word or line to theright margin indicatedPush the word or lineto the left margin indicatedNew paragraphNo paragraph break
Miscellaneous
Ignore the correctionunder which dots are put
APPENDIX B
Proof Reading Symbols
Ins~ute ."+lie ImtItate
£dian Institute of ManagementIndian Institute ¢f Mana'gementIndian Institute of Management
.!PDIAN STITUTE i51M NAGEMENT .a"---'---'-=~::;;':':'~
InslltuteInd~IjInstitute t+
Institt#)Indian' Institute \Management[Of?
9 means write it as nineTen means write the number 10ndian Institute of Management,Ahmedabad
means wnte It as A@means write it as Company
]Indian Institute ManagementC
~dian Institute of Management
\E--lndian Institute of Management
srdIndian LR§.t\!Y1@Jltt>.!a.!!~~fl\!l'!.t
Formats of Reports
l@J
Ills(rlld iOIl
ill (he JIlarxillType Facl'sbfbf ita]uclcIfromwfital
uc! Ie
Inserr
Mark in the copy
The Insttute"
The Institut~
Explanation
Set in bold face typeSet in bold face italicsSet in capital letters .Set in small lettersSet in light faceSet in Roman typeWrong fontSet in italicsSet the main letters in caps and the restin small letters
Caret indicates the place where theinsertion has to be mane
Insert apostrophe 39

transp.ose
Move up
Move down
Move to the left
Move to the right
Put in the centre
Insert exclamation mark
Equalize leading or space betweenlines
Insert parentheses
Give space
Close up
Correct uneven spacing
Insert comma
Insert semi-eolon
Insert colon
Insert subscript
Insert superscript
Insert full stop
Insert question mark
Insert quotation marks
Insert brackets
Insert hyphen
Insert dash
I\Ahmedabad"
AAhmedabad"
Indian Institute ofManagementft<hmedabad
The Institute
The Institute'sactivities ar~
These are the Institute'sactivities1\
What are the activitiesof the Institute
AOh"Semi"annual
The two Institutes"at Ahmedabad and Calcutta
"'The InstituteV
eq#
~
~
Spacing#
eq#
Th~nstitute,..
Instuute
Indian'Institute'ofManagem~ntlat~hmedabad
Indian Institute of
IManagement at~hmedabadand
other institutions
Movement of Position
tr Instittl1tl
~ Insitute
InsRMe
C !'E-Institute
') qnstitute
1[ ]INSTITUTEC
?
~fv
[IJ(f)
A·
'Voo
o-I1--1
Report Writing andPresentation
l@J
Misce/laneous
The~ Institute~
"The Institute...
"The Institu~e
Institute "
Delete
Paragraph
No paragraph
Invert the letter
40
II ~he Institute
.T.he,. In.stitute
The nstitute
The~stltute
ThlJnstitute
Straighten tbe line
Correct the alignment
Broken letter
Ignore the correction


.,.....
UNIT 13 PRESENTATION OF A REPORT
Objectives
After reading this unit, you should be able to :
• Distinguish between various components of presentation' skills.
• Describe the elements of presentation.
• Discuss the usefulness of AV aids.
• Enumerate suggestions for preparing of AV aids.
• Explain the use of AV materials.
• Suggest to a presenter the care he has to take while presenting a report.
Structure
13.1 Introduction
13.2 Communication Dimensions
13.3 Presentation Package
13.4 Audio-Visual Aids
13.5 Presenter's Poise
13.6 Summary
13.7 Self-Assessment Exercises
13.8 Further Readings
13.1 INTRODUCTIONIn the Jast unit, we expJained the varIOUS parts of a report. The next stage ispresentation of a report.
Presentation has become an important communication medium in organizationsbecause a report is understood better if it is accompanied by a presentation. Thereaders can enter into a dialogue with the author(s) of the report to share the thinkingprocess that the author(s) has gone through in writing the report. Therefore, fhemanager is expected to have as much facility in presentation as he is expected to havein report writing.
Presentation skills include the ability to mix in the right proportion various eJementsof
1) communication dimensions,
2) presentation package, and
3) use of audio-visuaJ aids to achieve the given purpose with an audience.
Moreover, the presenter needs to acquire the pubJic conversation (rather than pubJicspeaking or oratory) skills.
13.2 COMMUNICATION DIMENSIONSThe major eJements of communication dimension, which are relevant to apresentation, are:
J) Purpose
2) Audience
3) Media
4) Message
5) Time
6) PJace
7) Cost41

Report Writing andPresentation
l@J
42
While preparing for presentation, the presenter has to ask searching questions tounderstand each of the above mentioned dimensions of communication and find theright mix to serve his purpose. This process makes the presentation both a scienceand an art.
1) PurposeThe first step to think through the purpose of the presentation and to focus it sharply.The presenter can try to achieve a variety of purposes. Some instances of presentationpurposes are as follows:Informing?Selling?Exploring?
Decision making?Persuading?Changing attitude or behaviour?Within each of these, the focus can be sharpened by breaking them into subsets. Forexample, if it is a decision making, situation, would the presenter be interested inpersuading the audience toa) accept a decision which has already been 'takenb) vole on a decisionc) provide feedback for decision makingd) take a decision, ore) explore areas which need attention for decision making at a later time.Depending on the purpose, the elements of the communication mix, presentationpackage, and AV aids have to be adjusted to get the right effect.
2) AudienceIn a presentation, multiple audiences interact at the same time. The sender and thereceivers of the message keep changing roles through clarification queries, questionand answer, dialogue, and discussion. It is a live and dynamic situation in which thepresenter shapes the message in the open.The audience interest can be held on if the presenter focuses on issues of theirimmediate interest and allows them to participate in understanding the information.One way monologue is a sure way to dampen the audience enthusiasm and interest.
3) MediaIn a presentation, sound, sight, and body language come into play. Therefore, thecoordination of all three at one shot becomes an important aspect of presentation.Moreover, a presentation helps to broaden or open up the horizon of thought.Therefore, to treat presentation as an extension of written medium by projectingwritten data on the screen and making the audience read it is a self-defeating andexpensive proposition. Also concentrating on anyone medium-sight or sound-failingto take full advantage ofthe potentialities of presentation.
Since presentation is more suited for interaction, reading from a prepared text ordelivering a memorized speech puts a barrier between the audience and the presenter.However, notes, as memory aids, cannot be dispensed with for an organizedpresentation.The notes can be telegraphic and on 3x5 inch cards which the presenter can see atone glance and be on his way. Often, the OHP transparencies are sufficient asmemory aids. A notecard may look as follows:
Outline1) Communication mix2) Presentation package
3) AV tools4) Presenter's poise
4) Message

The presenter has to think of the focus of the message-its breadth and depth-as muchas a writer does. But the dimensions are different. The presenter cannot get as muchdepth and complexity as a writer can achieve. Therefore, the focus of a presentationhas to be different from that of a report.
A presentation concentrating on a single theme or a few major strands of a theme ismore comprehensible to the audience and leaves a more lasting impression than theone with too many diverse issues.
Organization of the message is as important in presentation as in writing. Confusedorganization confuses the audience and leads them to focus their attention onunimportant or unintended issues.
Next, concretization of the message in presentation is as important as in good writing.However, the presentation, because it combines sound and sight media, helps toconcretize the message more than the written medium. Ore step further inconcretization leads to visualization of ideas and hearing of actual sounds: only thepresentation medium helps, to achieve this level of concretization.
Since the presentation situation is built on interaction between the presenter and theaudience, the emotional content of the message and the audience should beconsidered. Concretization at the emotional level reinforces the logical concretizationof the message. Even simple words like "our company", "my company", "yourcompany", and "the company" carry emotional and attitudinal connotations. Thesephrases reflect in a way where the presenter stands in respect to the company and theaudience. In this respect, the presenter's body language also comes into play.
5) Time
The element of time in a presentation situation depends on various factors likeavailability of the room, audience, and presenter. The presenter can select the righttime if he has the choice. Presentations immediately after lunch, for instance, fail tohold the attention of the audience.
Another major aspect is how much time is given to the presenter to make thepresentation. This is a crucial dimension which decides the length and the overallcommunication mix.
The timing or sequencing of the message or its various parts is also significant. Isyour audience prepared for it? When can you get their maximum attention?
6) Place
The presenter may not have much choice in selecting the place. But to make the bestuse of the place and the facilities available will depend on the presenter. Whet-tearthe room is square or rectangular, whether it is large or small enough for theaudience, whether the seating arrangement is fixed or movable are some examples ofthe questions which bother a presenter. On the room arrangement depend the kind ofaudio-visual tools that can be used and the type of interaction that the presenter canhave with the audience.
An examination of the following elements of a room will help in finding the rightmix for an effective presentation:
I) Room dimensions
2) Seating
3) Number of people expected
4) Space available for the presenter
5) AV equipments available
7) Cost
The preparation of a good presentation is time consuming and expensive. Thepresenter should ask himself a) whether he is trying to achieve through presentationwhat he could have easily achieved through written communication and b) whetherhe could use cheaper production methods and aids than the ones he has chosen to putacross the message.
Presentation of Report
l@J
43

Report Writing andPresentation
l@J
44
~....~
Activity 1
You want to describe the major events of your college life to a group of your friends.You make a 3 minutes presentation and ask for their reactions to presentations andtheir suggestions for improvement on the focus of the presentation theme. List-outthe suggestions they make to you.
13.3 PRESENTATION PACKAGE
The presentation package could be as follows:
1) Pre-presentation handout if necessary to prepare the audience for understandingthe presentation,
2) Presentation.
3) Two-way feedback between the audience and the presenter and among theaudience members through question and answer or discussion.
4) Post-presentation handout if necessary to reinforce the message or help recall.
Activity 2
Yours is a consulting organisation which undertakes business research studies. Aprospective client visits your organisation and wants to know the types of job yourorganisation undertakes. What sort of pre-presentation handouts would you preparebefore making a presentation to him?
13.4 AUDIO-VISUAL AIDS
Audio-visual aids can be broadly classified as follows:
I) Audio
1) Tape recorder
2) Gramophone or compact disc
II) Visual
Non- Projected
1) Blackboard
2) Bulletin boards or flip charts
3) Models
Projected
1) Epidiascope
2) Overhead
3) Slide
4) Film strip
5) Tachistoscope (Slide projector with a timer)
Audio-Visual
1) Film (8 mm, 16 mm)
2) Video cassette

Usefulness of AV Aids
Since AV aids help in recreating reality in a miniature form through visuals andsound, greater CREDIBILITY and CLARITY can be achieved in presentation.
Since both sound and sight senses are activated at the same time along with the bodylanguage, CONCENTRATION, RETENTION, and RECALL, can be obtained inpresentation.
AV aids can also help in collapsing DISTANCE and TIME. They help us to presentto the audience materials and experiences from far-off places and from differenttimes in the past to make the message concrete and clear.
Suggestions for Preparing of AV aids
1) Organize the material into small modules.
2) Do not put more than seven or eight lines on a transparency.
3) Use as few words as possible. Use telegraphic style, abbreviations, and symbolswhich the audience can understand.
4) visualize or picture your ideas ijpossible.
5) Make the pictures and letters bright enough to be visible from a distance.
6) Make the letters big and thick enough to be read by all.
7) Use light colours, like' yellow, light blue, or pink for background. Use dark orbright colours like red, black, orange, or green for pictures and letters toimprove visibility. Note that black or red letters on a yellow background have thehighest visibility.
8) Make the sound material audible, pleasing in tone, varied and synchronized withvisuals.
9) Finally, before presentation, check the audibility, visibility, and readability ofyour A V materials, if possible, in the actual place of presentation.
How to Use Some AV Materials Blackboard
1) Plan
What goes on it?
When goes on it?
Where is it to be entered?
What is to be retained and what is to be erased?
2) In planning the arrangement of materials on the blackboard, it will' help tomentally divide the blackboard space into different parts:
Top half! Bottom half
Left Column Middle Column Right Column
3) For writing on the blackboard, break the chalk into two pieces and use the softinner side for writi.ng to avoid the squeaking noise. Hold the chalk like a brush toget large and thick letters. Use different coloured chalks to differentiate thesegments of the subject matter.
4) The more time you take to write on the blackboard, the longer is your back to theaudience, and the longer you hide the message from them. Use the blackboard forshort spans of time. Develop a telegraphic language and a shorthand which youraudience can understand. Words with only consonants (dropping the vowels) canbe easily recognized.
5) Check at the end ofthe session
a) Does the material on the blackboard look neat and organized?
b) Does it contain only material which is essential to recall your message?
c) is your writing visible and readable to the audience?
Bulletin Boa,"ds
The following materials are used for bulletin boards:
Wood Pulp
Presentation of Report
l@
45

Steel (Magnetic) and Prestograph sign boards are also available. Bulletin boards areuseful for exhibiting samples and drawings.
Flip Charts
1) Can be an extension to the blackboard and the overhead projector.
2) Back and forth referencing can be done.
3) Useful, like the blackboard"jor interactive communication. Flipcharts, like OHPtransparencies, can he prepared before hand.
Felt Board
4) Useful for demonstrating changes.
5) Use sand paper strips or any stick on material at the back ofthe paper for stickingto the felt.
6) Materials tend to fall off after a few minutes.
Overhad Projector
1) It can project a) transparencies, b) cutouts and outlines (Silhouette) of smallobjects, c) negatives, d) material on transparent glass, and e) transparent colours.
2) Writing on the transparencies at the time of presentation is possible.
3) While using the projector, the speaker can face the audience-an advantage notavailable with the blackboard.
4) Can work in ordinary light-an advantage not available with the opaque projector(epidiascope), slide projector, or film projector.
5) More matter can be accommodated than on a blackboard.
6) Highly flexible:
Matter can be exposed either for long periods or short periods.
Material can be partially hidden if needed.
Material can be referred back and forth.
7) Material can be pretested before putting on slide or film strip.
8) Printed material can be transferred to the transparencies through photocopying,
9) Only line drawings can be reproduced.
Note: Switch off the projector whenever not needed to protect it from overheating.
Making of Transparencies
1) Thin plastic sheets and acetate or triacetate films can be used for makingtransparencies. Plastic sheets are cheaper than acetate or triacetate sheets.
2) Can write on plastic sheets and films with OHP pens. While writing on atransparency put a graph paper underneath the transparency to be able to, writeuniformly big letters.
3) Photocopying can be done on plastic sheets and films.
4) Acetate or triacetate films can be used for writing with OHP pens havingtransparent colours.
5) OHP pens come in two kinds-permanent and non-permanent. Erasing is notpossible when permanent ink is used. A special erasure pen is available toremove a word or two if needed. But transparencies written with non-permanentink can be washed by water and reused.
Opaque Projector (Epidiascope)
1) Useful for projecting non-transparent material-printed paper, cloth, or smallobjects-in actual colours.
2) Dark roam is essential.
Report Writing andPresentation
l(p)J
46
Felt Thermocole

Slides
1) Can be made in black and white or in colour. Best for highlighting coloured andhalftone pictures.
2) Can be synchronized with running commentary on tape recorder.
3) Presentation sequence can be changed.
4) Useful for showing on and off during the talk.
5) Audience attention can be held for about 30 minutes.
Film Strips
1) Film strips give a feeling of continuity.
2) Can be synchronized with running commentary on the tape recoder.
3) Can be made in black and white and in colour.
4) Once the strip is made, the sequence ofthe material cannot be changed.
5) Audience attention cannot be held for more than 10 to 15 minutes.
Films
1) When you make a film, be clear of the purpose. Check whether your purpose isto:
a) communicate information (documentaries of actual events or reenactedevents serve this purpose).
b) change attitudes (dramatization of ideal reactions or situations).
c) Develop skills (giving step-by-step close-ups of an operation).
d) Develop interest (using unusual effects).
e) Raise issue (using open-ended techniques).
Activity 3
You have recently read a book and your friends want you to make a briefpresentation about it. How would you go about preparing and handling of audiovisual materials?
13.5 PRESENTER'S POISE
The presenter himself is an essential part of the presentation. His poise andconfidence matter a lot in putting across the ideas.
First, the presenter's posture and movement on the digs or at the speaking place and,his hand gestures indicate the level of confidence of the presenter. Slouchingpositions, leg crossing, rubbing hands or wild gesticulation, or hands in pocketsindicate lack of authority and confidence in the presenter. Sometimes the presenter'shabits may become dysfunctional because they draw the attention of the audienceaway from the main theme.
Second, the presenter's ability to maintain eye contact with the audience and keep hisfacial expressions suited to the subject become also important. Lack of eye contactwith the total audience, not with just one or two persons in the audience, indicate lackof confidence in the presenter. Moreover, the presenter will not be able to get non-
Presentation of Report
l@J
47

Report Writing andPresentation
~
48
verbal cues from the audience of their interest and understanding through out thepresentation.
Finally, the fluency, pace of delivery, level of the voice, and command of thelanguage signal to the audience the level of confidence and preparedness of thepresenter.
The only way that presenters can gain confidence is to repeatedly take theopportunity to make presentations, analyse their presentations for improvement, andobserve experienced presenters in action. Only thorough preparedness andinvolvement with the subject help presenters to overcome their inhibitions and fearsand gain confidence.
Activity 4
Suppose you have made a 3-minute presentation to a group of friends describing yourfuture career plans. Ask for their reactions to the presentation and their suggestionsfor improvement on your presentation confidence and behaviour.
List out the suggestions below:
13.6 SUMMARY
In this unit, we have discussed various components of presentation skills. Theseinclude I) communication dimensions, 2) presentation package, and 3) use of audiovisual aids.
The important elements of communication dimensions namely (a) Purpose (b)Audience (c) Media (d) Message (e) Time (t) Place and (g) Cost are explained. Theseelements have a great relevance to a presentation. The various components ofpresentation package are also mentioned. Under the heading Audio-Visual Aids, wehave explained the usefulness of AV aids. Also, suggestions for preparing of AV aidsare described in this unit. The unit also explains how to use some AV material.
Presenter's Poise is one of the most important part of presentation. The unit concludesby suggesting as to what should presenter do in putting across his ideas.
13.7 SELF-ASSESSMENT EXERCISES
I) Take any of the following topics, prepare for a presentation of 3 minutes, anddeliver it to a group, of friends or colleagues. Ask for their reactions to presentationsand their suggestions for improvement on
a) the focus of the presentation theme,
b) the preparation and handling of the audio-visual materials, and
c) your presentation confidence and behaviour.
Suggested Topics
I) Introduce yourself to a group of visitors.
2) Introduce a colleague of yours to your club members.
3) Describe your college to a group of your friends.
4) Talk about your parents or any relatives who have influenced you the most to agroup of friends.

5) Describe any interesting habits or hobbies ofyours to a group ofyour colleagues.
6) Describe the working of a machine to a group of non-technical people.
7) Give your comments on any significant national or international event to a groupof your colleagues.
2) After you have done a few 3-minute presentations and gained confidence, takeany recent report of your organization and make a 3D-minute presentation to yourcolleagues.
13.8 FURTHER READINGS
Gallagher, J. William, "Report Writingfor Management". Addison-Wesley,
Golen, P Steven, "Report Writing for Business and IndustlY" BusinessCommunication Service
Sharma, R.C. and Krishna Mohan, "Business Correspondence and Report Writing",Tata McGraw-Hill
Wright, C., "Report Writing", Witherby & Co. England.
Presentation of Report
l@J
49