Case Study: No Child Left Behind Brad Thiessen
40
1 Case Study: No Child Left Behind Brad Thiessen
-
Upload
khangminh22 -
Category
Documents
-
view
1 -
download
0
Transcript of Case Study: No Child Left Behind Brad Thiessen

1
Case Study: No Child Left Behind
Brad Thiessen

2
Table of Contents:
Part I: Policy Inputs………………………………………….… 3 – 9Comparison of ESEA reauthorizations ……………………………. 8Map of Policy Inputs ………………………………………………… 9Sources cited ………………………………………………………… 9
Part II: Production Technologies …………………………… 10 – 26Legislative and Implied Authority…………………………………… 10Agency and Administrative Authority………………………………. 11 – 12
U.S. Department of Education Organization ………………... 12 – 13Iowa Department of Education Organization ………………... 14
Program & Rules ……………………………………………………..15 – 21Iowa’s Implementation ……………….…………………………19 – 21February 2005 Update to Iowa’s Implementation Plan …….. 20
Grants ………………………………………………………………… 22Contracts ……………………………………………………………... 22 – 23Budget ………………………………………….…………………….. 23 – 26Sources Cited …………………………………………………………26
Part III: Results ………..………………………………………... 27 – 33Outputs ……………………………………………………………….. 27Outcomes …………………………………………………………….. 28 – 32Sources Cited …………………………………………………………33
Part IV: Context & Content .…………………………………... 34 – 39Context ……………………….………………………………………. 34 – 35
Government Sector ……………………………………………. 34 – 35Market/Private Sectors ………………………………………… 35
Summary …………………………………………………………….. 36 – 37Sources Cited …………………………………………………………38
Complete List of Sources .………………………………….…. 39 – 40

3
Part I: Policy Inputs
On January 8, 2002, President Bush signed the 1,180-page No Child Left Behind Act into law. The bipartisaneffort represents the product of almost four decades of federal expansion into public education, dating back to theElementary and Secondary Education Act (ESEA) of 1965. As part of his administration’s “War on Poverty,” PresidentLyndon Johnson signed the ESEA in 1965 to provide states $2 billion in its first year to improve educationalopportunities for economically disadvantaged students. This federal support of public education continued for the nextdecade, as federal spending on education increased more than 200% from 1965-1975. An economic downturn in the1970s caused federal spending to increase only by 2% over the next five years; however, the establishment of the U.S.Department of Education in 1979 made it clear that the federal government intended to remain involved in publiceducation policy (Young, 2004).
In 1980, Ronald Reagan became president after campaigning to decrease the size and scope of the federalgovernment – even campaigning to abolish the U.S. Department of Education. In his first term, federal spending onpublic education declined by 21% (Young, 2004). Despite the decrease in federal funding, the Reagan administrationproved to have a lasting impact on public education policy when he and Secretary of Education Terrell Bell assembledthe National Commission on Excellence in Education (NCEE). The NCEE was created in August 1981 under theauthority of 20 U.S.C. 1233a to “review and synthesize data and scholarly literature on the quality of learning andteaching in the nation’s schools, colleges, universities, both public and private, with special concern for the educationexperience of teenage youth.” (U.S. Department of Education, 1983). The NCEE published A Nation At Risk in 1983,finding the public educational system was producing mediocre results. Among its findings: (U.S. Department ofEducation, 1983)
1. 13% of 17-year-olds in the U.S. can be considered functionally illiterate2. SAT scores consistently declined in verbal, math, physics, and English3. Only 20% of 17-year-olds could write a persuasive essay4. Only one-third of 17-year-olds could solve math problems requiring several steps5. Remedial math courses in public 4-year colleges represented 25% of all college math courses
In addition to focusing attention on the problems in the public education system, the report proposed severalsolutions. Recommendations were made in four key areas: (Harcourt, 2003)
1. Content – The report concluded that school content had become diluted and without a central purpose.2. Expectations – The report recommended schools adopt rigorous and measurable standards and expectations3. Time – The report found American students spent less time on school work and time was used ineffectively4. Teaching – The report found teacher preparation programs needed substantial improvement
The report also concluded that if the U.S. established a common set of academic standards, only 20% of all high schoolstudents would have met those standards.
Although the report called for the creation of a core curriculum (common academic standards), PresidentReagan left the work of standard setting to the states (leading to the diversity in content standards and academic
The text to the left provides an historicalaccount of the development of NCLB.
The text in this column analyzes the specificpolicy inputs (problems, solutions, issues,policy entrepreneurs, and agendas) thatshaped the NCLB policy.
Situation becomes a ProblemWith regards to public education, thecountry faced the following situation in the1960s:
1) A growing number of economicallydisadvantaged students caused by theincreasing poverty rate
2) A decline in federal spending onpublic education following theincreases appropriated in the 1965Elementary and SecondaryEducation Act (ESEA).
The 1983 publication of A Nation At Riskfocused attention on the fact that many highschool graduates did not have the skillsthought necessary to compete in a globaleconomy (which was important in this coldwar era).
In addition to defining the problem vianumbers, the report defined the problems byoffering solutions. According to thesolutions offered by the report, America’spublic education system had four problems:
1) A lack of content standards2) A lack of high expectations3) A lack of time in the school day/year4) A lack of quality teachers
The problem was further defined byPresident Reagan’s preference to leavestandard-setting to the states. If each statecould set its own standards, how could webe sure each state had high qualitystandards? In other words, America’spublic education problem was that not allstates and schools had high quality contentstandards and high performanceexpectations.
4
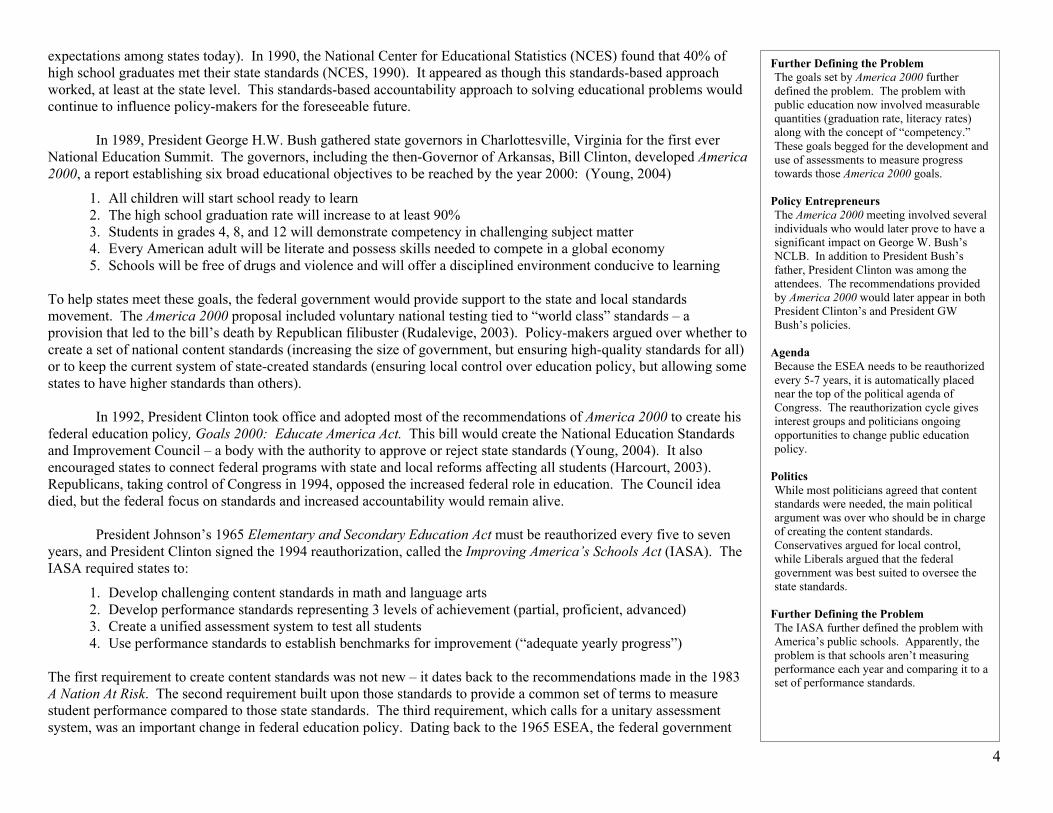
expectations among states today). In 1990, the National Center for Educational Statistics (NCES) found that 40% ofhigh school graduates met their state standards (NCES, 1990). It appeared as though this standards-based approachworked, at least at the state level. This standards-based accountability approach to solving educational problems wouldcontinue to influence policy-makers for the foreseeable future.
In 1989, President George H.W. Bush gathered state governors in Charlottesville, Virginia for the first everNational Education Summit. The governors, including the then-Governor of Arkansas, Bill Clinton, developed America2000, a report establishing six broad educational objectives to be reached by the year 2000: (Young, 2004)
1. All children will start school ready to learn2. The high school graduation rate will increase to at least 90%3. Students in grades 4, 8, and 12 will demonstrate competency in challenging subject matter4. Every American adult will be literate and possess skills needed to compete in a global economy5. Schools will be free of drugs and violence and will offer a disciplined environment conducive to learning
To help states meet these goals, the federal government would provide support to the state and local standardsmovement. The America 2000 proposal included voluntary national testing tied to “world class” standards – aprovision that led to the bill’s death by Republican filibuster (Rudalevige, 2003). Policy-makers argued over whether tocreate a set of national content standards (increasing the size of government, but ensuring high-quality standards for all)or to keep the current system of state-created standards (ensuring local control over education policy, but allowing somestates to have higher standards than others).
In 1992, President Clinton took office and adopted most of the recommendations of America 2000 to create hisfederal education policy, Goals 2000: Educate America Act. This bill would create the National Education Standardsand Improvement Council – a body with the authority to approve or reject state standards (Young, 2004). It alsoencouraged states to connect federal programs with state and local reforms affecting all students (Harcourt, 2003).Republicans, taking control of Congress in 1994, opposed the increased federal role in education. The Council ideadied, but the federal focus on standards and increased accountability would remain alive.
President Johnson’s 1965 Elementary and Secondary Education Act must be reauthorized every five to sevenyears, and President Clinton signed the 1994 reauthorization, called the Improving America’s Schools Act (IASA). TheIASA required states to:
1. Develop challenging content standards in math and language arts2. Develop performance standards representing 3 levels of achievement (partial, proficient, advanced)3. Create a unified assessment system to test all students4. Use performance standards to establish benchmarks for improvement (“adequate yearly progress”)
The first requirement to create content standards was not new – it dates back to the recommendations made in the 1983A Nation At Risk. The second requirement built upon those standards to provide a common set of terms to measurestudent performance compared to those state standards. The third requirement, which calls for a unitary assessmentsystem, was an important change in federal education policy. Dating back to the 1965 ESEA, the federal government
Further Defining the ProblemThe goals set by America 2000 furtherdefined the problem. The problem withpublic education now involved measurablequantities (graduation rate, literacy rates)along with the concept of “competency.”These goals begged for the development anduse of assessments to measure progresstowards those America 2000 goals.
Policy EntrepreneursThe America 2000 meeting involved severalindividuals who would later prove to have asignificant impact on George W. Bush’sNCLB. In addition to President Bush’sfather, President Clinton was among theattendees. The recommendations providedby America 2000 would later appear in bothPresident Clinton’s and President GWBush’s policies.
AgendaBecause the ESEA needs to be reauthorizedevery 5-7 years, it is automatically placednear the top of the political agenda ofCongress. The reauthorization cycle givesinterest groups and politicians ongoingopportunities to change public educationpolicy.
PoliticsWhile most politicians agreed that contentstandards were needed, the main politicalargument was over who should be in chargeof creating the content standards.Conservatives argued for local control,while Liberals argued that the federalgovernment was best suited to oversee thestate standards.
Further Defining the ProblemThe IASA further defined the problem withAmerica’s public schools. Apparently, theproblem is that schools aren’t measuringperformance each year and comparing it to aset of performance standards.

5
focused almost solely on the achievement of economically disadvantaged (and special education) students. The IASAcalled on states to measure the achievement of all students; not just those in specific subgroups. The fourth requirementof IASA was also an important change. Instead of simply measuring student performance, as was established inprevious federal education policy, the IASA required states and schools to continuously improve student achievement.Although no deadline or final goal was created, schools were required to show continuous progress towards makingadequate yearly progress (AYP) or face consequences, such as offering supplemental services and school choice tostudents or replacing existing staff (Young, 2004). It was also mandated that to continue to receive funding, states mustcomply with the general requirements of IASA.
With no deadline established for states to make AYP, the IASA had no teeth. Standards were supposed to be inplace by 1997 (and assessment systems and definitions of AYP were to be set by 2001), but the administration neverwithheld funds from states that failed to meet these timelines (Rudalevige, 2003). The Clinton administration,concerned about upsetting the Republican-controlled Congress, focused on providing states with assistance indeveloping standards and assessment systems. The lack of sanctions led to the American Federation of Teachers notingthat just 17% of states had established clear content standards and assessment systems by the deadlines establishedunder IASA (AFT, 2000). It was clear, however, that the federal government was interested in reviewing state contentstandards and holding schools accountable for the performance of their students as measured by achievement tests.
In April of 1999, Andrew Rotherham of the Democratic Leadership Council’s Progressive Policy Institutewrote an influential white paper on federal education policy. He wrote that Congress, to rectify the IASA’s status as“an undertaking without consequences” for everyone except students, should set performance benchmarks andterminate aid to schools and states that failed to meet those benchmarks. Rotherham recommended the 50+ categoricalgrants in the ESEA be reduced to five broad “performance-based grants: (1) Title I compensatory-education program,(2) teacher quality, (3) English proficiency, (4) public school choice, and (5) innovation (Rudalevige, 2003). During thenext reauthorization cycle, Conservatives would come to support Rotherham’s ideas of state flexibility in spendingmoney from the five grants tied to measurable performance goals. Democrats generally opposed the broad block grantsthat threatened educational programs that have specific purposes.
The proposal that finally reached the Senate floor included a pilot block-grant program that would givespending discretion to 15 states. The proposal still allowed states to define AYP, but required states to ensure allsubgroups of students would be proficient in 10 years. Schools failing to make AYP for two consecutive years wouldbe required to offer students the change to transfer to another public school in the district and pay the costs oftransportation.
This proposal satisfied no one. Liberal Democrats tried to amend the policy to protect existing programs from block grants and to push for class-sizereduction, school construction, and teacher training. Conservatives such as Senator Judd Gregg (R-NH) demanded larger block-grant, school choice, and voucherprograms (Rudalevige, 2003). Other Democrats, led by Senator Joseph Lieberman (D-CN) pushed a modified block-grant program, which would create fivemajor grants (as defined in Rotherham’s paper), raise overall funding by $35 billion over five years, keep the class-size reduction program, and add $100 millionfor public school choice (Rudalevige, 2003). This proposal got just 13 votes. Instead of working on further compromises, both sides decided to take theirchances in the upcoming presidential election. This marked the first time in history that the ESEA was not reauthorized on time.
Policy Entrepreneurs & PoliticsPresident Bush, having won a close election,moved to create bipartisan support for hispolicy. By focusing on his Republicansupporters and Democrats open to his ideas,he was able to garner the necessary support.
By focusing on accountability and pushingthe voucher issue to the back burner, Bushmade sure NCLB would not be stalled dueto a dispute in which both parties are firmlyat odds.
PoliticsFurther attempting to gather bipartisansupport, Bush created a name for the billthat no one could disagree with. Who wantsto leave children behind?
Bush also recognized that to get his policypassed, he would need the support of theDemocrat regulars. By focusing on SenatorKennedy, Bush was able to persuade otherDemocrats to jump on board.
Ignoring the implementation specifics ofNCLB allowed politicians to focus on thegeneral direction they wanted the policy totake.

6
George W. Bush, who campaigned as a “Compassionate Conservative,” placed education as a priority on hisdomestic policy agenda. His “compassion” was aimed at those students trapped by “the soft bigotry of lowexpectations,” while his conservatism aimed to maximize parental choice and local flexibility in education spending.Bush also differed from traditional Conservatives by favoring a strong federal role in public education. Bush wasdeclared the winner of the 2000 election and set to persuade Republicans in Congress to support what they had rejectedjust one session earlier.
President Bush invited 20 members of Congress to Austin, Texas to discuss education policy. He pushed therepresentatives to build upon the successes of IASA and the successes experienced by the state of Texas, which hadseen steady improvements in standardized test scores among minority students perhaps due to its mandatory testingpolicy (Young, 2004). Bush appointed Alexander Kress, a Dallas attorney, Texas school board member, and memberof the Democratic Leadership Council, to head a policy staff that would work with these Congressmen. Being amember of the Democratic Leadership Council, Kress was familiar with Rotherham’s white paper, the IASA, America2000, and Goals 2000. Among the Congressmen attending the meeting were the Chair of the House Committee onEducation and the Workforce, John Boehner (R-OH), Judd Gregg (R-NH), Jim Jeffords (R-VT), Evan Bayh (D-IN),Tim Roemer (D-IN), and Zell Miller (D-GA). Ted Kennedy (D-MA) was not present; showing that Bush was willing towork with “New” Democrats. During this meeting, Bush lobbied to eliminate Republican language calling for theabolition of the Department of Education. Bush also assured Democrats that the voucher issue was not as important asthe accountability issue (Rudalevige, 2003).
No Child Left Behind emerged as a 30-page legislative blueprint just three days after President Bush’s inauguration. This outline of NCLB included theblock-grant proposal (dating back to Rotherham’s paper in 1999), annual testing requirements for grades 3-8 (expanding on IASA’s requirements), and thepublication of state and school report cards (based on the reporting system in Texas). This proposal also required states to participate in NAEP (NationalAssessment of Educational Progress) each year (in order to provide a standard measuring stick for all states and schools). Title I schools would be required todemonstrate that disadvantaged students were making AYP. The proposal did not specify the requirements for sanctions when a school failed to make AYP, butdid include provisions for public school choice, supplemental services, and vouchers towards private schools. The proposal also set aside bonus funding forschools that succeeded in closing achievement gaps while reducing administrative funds for schools that failed to make AYP (Rudalevige, 2003).
President Bush tried his best to gain bipartisan support for this proposal. He took the name “No Child Left Behind” from the Liberal Children’s DefenseFund, whose mission is “to leave no child behind.” (Liberal Children’s Defense Fund, 2005). He also had representatives Kress and Gregg convince SenatorKennedy to support the proposal (thus gaining the support of the Democratic regulars). With Kennedy on board, it didn’t matter that Jim Jeffords left theRepublican party to become an independent – it appeared as though the bill was going to quickly pass without major obstacles.
In its attempt to appeal to all political viewpoints, the NCLB proposal didn’t address many of the policy details needed for implementation. Nonetheless,the bill was introduced on March 22, 2001. After a couple months deliberation, the House Committee on Education and the Workforce reported the bill out ofcommittee in May of 2001. Disagreeing with the bill’s focus on using assessments as the sole basis on which to measure school performance, the NationalEducators Association (NEA) sent letters to Congressional leaders voicing their concerns (NEA, 2004). The letters had little impact -- the voucher provisionswere defeated as was the coalition of Barney Frank (D-MA) and Peter Hoekstra (D-MI) who attempted to eliminate annual testing requirements (Rudalevige,2003). On May 23, House Resolution 1 (HR-1) was passed by a vote of 384-45 (Republicans made up 3/4 of the “no” votes) (Young, 2004). While the NEAissued a list of 19 concerns with HR-1, the bill was sent to the Senate.
Political Institutions & EntrepreneursThe House Committee on Education and theWorkforce worked out the details of NCLB.The Senate, more closely divided than theRepublican-controlled House, addedprograms onto the bill and increased itsprice tag.
The NEA was the first special interest groupthat tried to heavily influence thedevelopment of NCLB. The NEA, withsupport from the General AccountingOffice’s report on the problems with AYPprovisions, was able to influenceaccountability provisions in the final law.
AgendaBecause the reauthorization of ESEA wasalready overdue, NCLB remained a priorityon many agendas through the 9/11 attacksand worries over terrorism.

7
The Senate quickly worked to add to the bill. Democrats in the Senate agreed to $181 billion in special education funding over ten years in addition tothe $132 billion set aside for Title I. A total of 89 programs were included in the Senate version of the bill (up from 55 programs in the existing law and 47programs in the House bill) with a total price of $33 billion (compared to $19 billion in the president’s plan and $23 billion in the House’s version). Over thecourse of seven weeks, 150 amendments were made to the bill (Rudalevige, 2003). Some of the most drastic attempts to amend the bill included Senator PaulWellston’s (MN) failed attempt to defer annual testing requirements unless federal Title I funding was tripled (Rudalevige, 2003). Without that provision, SenateBill S1 was approved 91-8 on June 14, 2001.
The NEA once again issued letters against the proposal. Between July and August of 2001, the NEA submitted 14 separate sets of comments toconference staff on each of the major programs and issues where the House and Senate differed (NEA, 2005). Towards the end of July, both the House andSenate agreed to establish a conference committee to pass NCLB in a bipartisan effort. Before the committee could convene, the General Accounting Office(GAO) issued a report that concerned many legislators (Young, 2004).
The GAO report indicated that thousands of schools would quickly be labeled “in need of improvement” under the current definitions of proficiency andAYP (Young, 2004). This report sparked a movement against the strong accountability provisions in NCLB. Jim Jeffords created analyses claiming that amajority of schools would fail under the bill’s formula for calculating AYP. This led to new language in the bill requiring at least a 1% improvement in testscores each year for each subgroup (rather than the more stringent requirements defined by the current language in the bill). The new language would also allowschools to be judged over 3-year periods, instead of annually, and would more heavily weight the scores of the lowest achieving students (this giving schoolsmore credit for closing the achievement gap than for overall achievement gains). This new language was declared to be unfair by civil rights groups, so AYPnegotiations continued (Rudalevige, 2003).
It was now obvious that NCLB was not going to pass without opposition. Conservatives wouldn’t pass the bill without vouchers, Liberals wouldn’t passthe bill with vouchers; teacher’s unions didn’t want mandatory testing, while President Bush’s main focus was on accountability. The debate reached its apexwhen the National Conference of State Legislatures called the bill’s testing provisions “seriously and perhaps irreparably flawed.” (Young, 2004).
Working through the controversy, the conference committee took five months to bridge 2,750 differences between the House and Senate versions of thebill (Rudalevige, 2003). The bill’s language was revised to reflect concerns raised by the GAO and special interest groups. Even the September 11th attack andfollowing anthrax scare did not push NCLB off the legislators’ agendas. The final language in the bill allowed for a pilot block-grant program along with extramoney for charter schools. Special education funding was cut, while supplemental service provisions were refined. Schools were required to have all studentsreach proficiency within 12 years. Districts were allowed to average results across three-year periods, but still required to make AYP annually. While states wererequired to participate in NAEP biennially, sanctions were not tied to NAEP performance. AYP provisions were vague and purposefully announced last to avoidpressure from special interest groups (Rudalevige, 2003).
The NEA submitted a letter stating that despite their concerns over the cut in special education funding, they would not oppose the final conferenceagreement (NEA, 2005). With most of the debates on major issues settled, the House and Senate passed the final version of No Child Left Behind by votes of384-41 and 87-10 on December 18, 2001 (Young, 2004). President Bush signed NCLB (Public Law Number 107-110) into law on January 8, 2002.

8
The following table displays some of the key differences among the various reauthorizations of ESEA from 1981 – 2001. From the table, it is easy to see howprevious policies became inputs for the development of NCLB.
Source: Redalevige, 2003.STANDARDS ASSESSMENT SANCTIONS
Established?Deadline forproficiency?
Subgroupstracked?
State Testing?High-Stakes
National?Adequate Yearly
Progress?School Improve.
Plans?Restructuring of
Schools?Public school
choice?
Reagan & Bush(1981-1992)
Yes; voluntarystandards
No No NoProposed NAEP
as benchmark (notpassed)
No No No
Proposed tuitiontax credits andTitle I vouchers
(not passed)
103rd Congress(1993-94)
Yes, for Title Istudents
No NoYes; 3 tests
betweengrades 3-12
No Yes, but vague Yes No No
106th Congress(1999-2000)
Proposed for allstudents (only
passed the House)
Proposed 10years (onlypassed the
House)
Proposed (onlypassed the
House)Yes; 3 tests
Proposedvoluntary
(implementationbanned)
Proposed (onlypassed House)
Proposed (onlypassed House)
Proposed (onlypassed House)
Proposed (notpassed)
GW Bushcampaign
(2000)Yes No Partial
Yes; annualtests for
grades 3-8
Yes, NAEP asbenchmark
Yes Yes Yes Yes
NCLB (2001)Yes; mandatory for
all studentsYes, 12 years
Yes; race, LEP,disability, Title I
Yes; annualtests for
grades 3-8 andone in 10-12
Partial; NAEPrequired but notlinked to funding
Yes Yes YesPartial, plus
supplementalservices vouchers
9
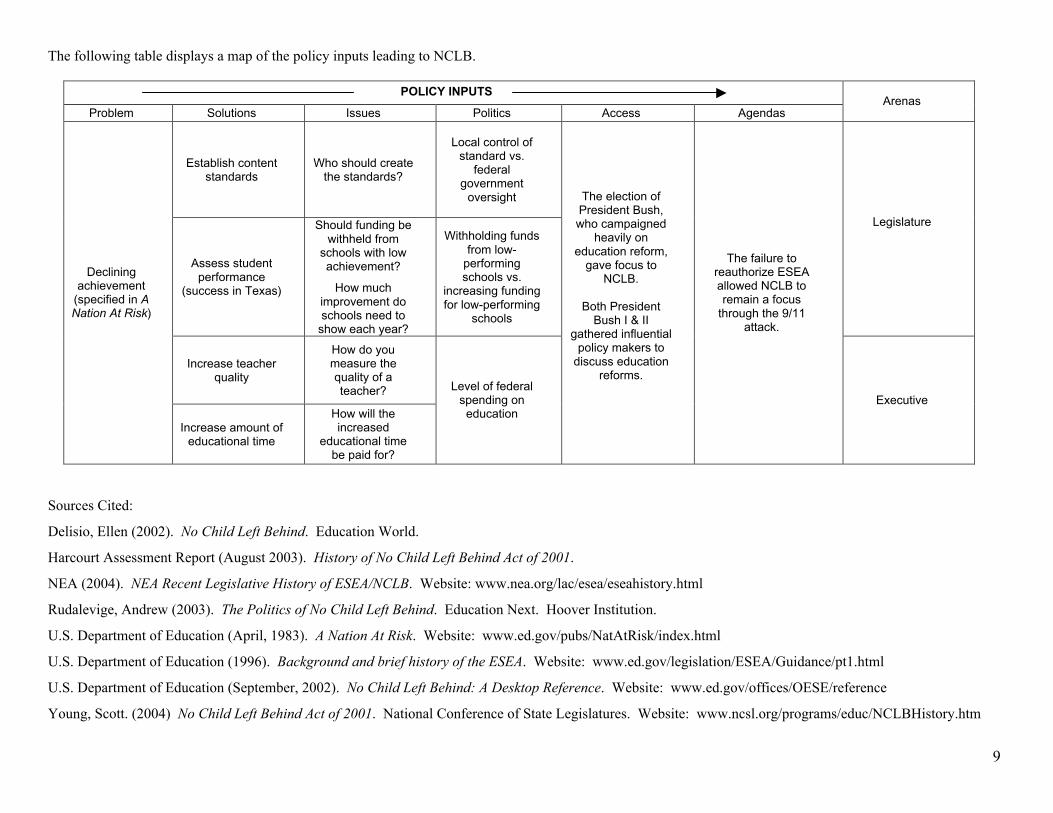
The following table displays a map of the policy inputs leading to NCLB.
POLICY INPUTS
Problem Solutions Issues Politics Access AgendasArenas
Establish contentstandards
Who should createthe standards?
Local control ofstandard vs.
federalgovernment
oversight
Assess studentperformance
(success in Texas)
Should funding bewithheld from
schools with lowachievement?
How muchimprovement doschools need to
show each year?
Withholding fundsfrom low-
performingschools vs.
increasing fundingfor low-performing
schools
Legislature
Increase teacherquality
How do youmeasure thequality of ateacher?
Decliningachievement
(specified in ANation At Risk)
Increase amount ofeducational time
How will theincreased
educational timebe paid for?
Level of federalspending on
education
The election ofPresident Bush,who campaigned
heavily oneducation reform,
gave focus toNCLB.
Both PresidentBush I & II
gathered influentialpolicy makers to
discuss educationreforms.
The failure toreauthorize ESEAallowed NCLB toremain a focus
through the 9/11attack.
Executive
Sources Cited:
Delisio, Ellen (2002). No Child Left Behind. Education World.
Harcourt Assessment Report (August 2003). History of No Child Left Behind Act of 2001.
NEA (2004). NEA Recent Legislative History of ESEA/NCLB. Website: www.nea.org/lac/esea/eseahistory.html
Rudalevige, Andrew (2003). The Politics of No Child Left Behind. Education Next. Hoover Institution.
U.S. Department of Education (April, 1983). A Nation At Risk. Website: www.ed.gov/pubs/NatAtRisk/index.html
U.S. Department of Education (1996). Background and brief history of the ESEA. Website: www.ed.gov/legislation/ESEA/Guidance/pt1.html
U.S. Department of Education (September, 2002). No Child Left Behind: A Desktop Reference. Website: www.ed.gov/offices/OESE/reference
Young, Scott. (2004) No Child Left Behind Act of 2001. National Conference of State Legislatures. Website: www.ncsl.org/programs/educ/NCLBHistory.htm

10
Part II: Production Technologies
Legislative & Implied Authority
Because the U.S. Constitution does not designate a role in public education for the federal government, states are typically responsible for developing,implementing, and funding education policies. This all changed when the federal government took an interest in the quality of the nation’s public schools in themid 1960s. The original Elementary and Secondary Education Act (ESEA) gave the federal government the authority to supplement state support of publiceducation.
Originally designed by Francis Keppel, President Johnson’s Commissioner of Education, the ESEA authorized grants to improve the education of theeconomically disadvantaged. Since the federal government has the responsibility to see its money is spent effectively, the ESEA also gave the federalgovernment the implied authority to oversee the achievement of low-income students. Originally authorized only through 1970, Congress has reauthorized theESEA every five to six years. Each reauthorization cycle has managed to expand upon the authority of the ESEA (examples include the 1994 IASA and Goals2000 discussed in Part I of this paper). NCLB currently authorizes the federal government to oversee the achievement of all students; not just the economicallydisadvantaged.
The authority of the ESEA has also expanded through the annual budget cycle. In it’s initial year, $1.94 billion was appropriated for the act. The 1994budget called for $13 billion (of which $10.3 billion was appropriated). In 2002, the first year of No Child Left Behind, $22.5 billion was appropriated for theESEA. Current language in NCLB authorizes Congress to spend “such sums as may be required” to implement the education reforms beyond fiscal year 2002(U.S. Budget, 2005). The chart at the bottom of this page displays the federal funds provided throughout the history of the ESEA. Each time the federalgovernment has increased spending on education, it has increased its authority (either legislative or implied) in public education matters.
11
Agency & Administrative Authority
While the federal government gained legislative and implied authority over public education, it granted administrative authority for the ESEA to the U.S.Department of Education (DOE). First established in 1867 by President Andrew Jackson, the purpose of the DOE was to gather statistics about the nation’sschools. Less than one year after its conception, public fear over the increased federal control of local public schools caused President Jackson to convert theDOE into the Office of Education, an agency with reduced authority over local schools (Ed Facts, 1992).
The limited authority of the Office of Education would expand through legislative action. The Second Morrill Act of 1890 granted the Office ofEducation the authority to administer support for public colleges and universities. The 1917 Smith-Hughes Act and the 1946 George-Barden Act granted theOffice authority over workforce training for high school students. The Lanham Act of 1941 and the Impact Aid Laws of 1950 authorized the Office of Educationto pay local school districts impacted by the presence of the military during World War II. The 1944 GI Bill and the 1958 National Defense Education Act furtherincreased the Office’s influence by authorizing the Office of Education to provide postsecondary assistance to nearly 8 million WWII veterans (Ed Facts, 1992).
These legislative acts, in addition to the ESEA of 1965, increased the authority of the federal government in public education. To administer theselegislative policies and programs, Congress passed the Department of Education Organization Act of 1979. This act created the U.S. Department of Education(DOE) whose mission was to:
1. Strengthen the Federal commitment to assuring access to equal educational opportunity for every individual2. Supplement and complement the efforts of states, the local school systems and other instrumentalities of the states, the private sector, public and private
nonprofit educational research institutions, community-based organizations, parents, and students to improve the quality of education3. Encourage the increased involvement of the public, parents, and students in Federal education programs4. Promote improvements in the quality and usefulness of education through Federally supported research, evaluation, and sharing of information5. Improve the coordination of Federal education programs6. Improve the management of Federal education activities7. Increase the accountability of Federal education programs to the President, the Congress, and the public (Ed Facts, 1992)
Throughout its existence, the DOE has been transferred and reassigned to many different departments. In 1981, the DOE was established as a cabinet-level position under the auspices of the Department of Health, Education, and Welfare. The current mission of the DOE is “to ensure equal access to educationand to promote educational excellence throughout the Nation.” According to the DOE website, this mission is carried out in two ways:
1. The Secretary of Education and the DOE play a leadership role in the ongoing national dialog over how to improve our educational system for all2. The DOE administers programs that cover every area of education - from preschool to postdoc research (U.S. Department of Education, 2005).
The DOE is authorized with four responsibilities:
1. To establish policies relating to financial aid for education, to administer distribution for these funds, and to monitor their use2. To collect data and oversee research on America's schools and disseminate this information to the public3. To identify major issues and problems in education and to focus attention to these problems4. To enforce federal statutes prohibiting discrimination in programs and activities receiving federal funds and to ensure equal access to education
The policies and programs for which the DOE is responsible must be authorized by Congress and signed into law by the President. The DOE is onlygranted the authority to develop regulations used to implement these policies. To oversee the actions of the DEO, these regulations are then published in theFederal Register and reviewed by Congress (Ed Facts, 1992).

12
In establishing the DOE, Congress was careful to specify areas in which the DOE does not have authority. According to the DOE website, the DOE doesnot establish schools/colleges, develop curricula, or set requirements for enrollment and graduation. These responsibilities remain with states and local schooldistricts. As stated in the 1979 Department of Education Organization Act, the DOE is prohibited from exercising “any direction, supervision, or control over thecurriculum program of instruction, administration, or personnel of any educational institution, school, or school system.” (Young, 2004).
U.S. Department of Education Organization
The DOE was established with a staff of 7,528. Twenty-five years later, the number of DOE staff has declined to 4,487. During thatsame time period, the funds appropriated to the DOE have risen substantially. The following table displays the federal moneyappropriated to the DOE throughout its history:
Money Budgeted & Appropriated to the U.S. Department of Education (Source: DOE website)Note: All numbers represent billions of dollars
YearPresident’s Budget
for DOEAppropriation
% Change in appropriationfrom previous term
Difference betweenAppropriated – Budgeted
1980 14 14 -- --
1984 13.3 15.3 9.2% 2.0
1988 15.4 20 30.7% 4.6
1992 31.3 32 60% 0.7
1996 33.8 30.5 (4.7%) (-3.3)
2000 37.5 38.4 25.9% 0.9
2004 64.8 67.2 75% 2.4
2006 -- 71.5 6.4% --
Throughout its history, the DOE has typically been appropriated slightly more money each year than the amount requested in thepresident’s budget. The DOE has also experienced annual increases in its funding throughout its history (apart from the period from1994-1996).
The DOE houses nearly two-dozen separate offices. The following page displays an organizational chart of the DOE along with briefdescriptions of the responsibilities of each office. The chart shows the vertical and horizontal organization of the DOE along with theoffices responsible for oversight.

13
Secretary of Education(Forms agency goals and
represents the DOE)
Office of the Deputy Secretary(Oversees program offices andexternal relations; works with
Secretary to achieve policy goals)
Office of the Under Secretary(Responsible for Budget Office and
Office of Policy & Planning)
Office of Public Affairs
Office of Vocational & Adult Education(Funding for adult basic skills development)
Office of General Counsel(Provides DOE with legal services)
Office of Inspector General(Oversees programs and operationsto prevent waste, fraud, and abuse)
Office of Elementary & Secondary Education(Develops regulations for programs in elementary and
secondary education)
Office of the Postsecondary Education(Financial aid for students; development of student
housing and facilities)
Office of Innovation & Improvement(Oversees research funding)
Office of English Language Acquisition(Oversees programs designed for limited English
proficient students)
Office of Intergovernmental & Interagency Affairs(Intermediary to intergovernmental, international,
community and other groups)
Office of Legislative & Congressional Affairs(Coordinates legislative activities)
Office for Civil Rights(Enforces laws prohibiting discrimination; providesassistance to schools for civil rights compliance)
Institute of Education Sciences
Office of the Special Education/Rehabilitation(Promotes programs for disabled children and adults)
Office of Safe & Drug-Free Schools(Promotes anti-drug, anti-violence programs)
Federal Student Aid
Office of Management(Provides DOE with legal services)
Office of Chief Financial Officer(Oversees financial matters and
coordinates contracts and grants)
Office of Chief Information Officer
Office of Management(Administers FERPA and provides
personnel support services)
Operations

14
The accountability programs in NCLB are housed primarily within the Office of Elementary & Secondary Education. Other NCLB programs (teacherquality, English proficiency, and innovative programs) are housed in other offices.
In addition to the authority it receives from its authorization cycle, the ESEA also expands its authority through the annual budget cycle. The budgetprocess will be discussed later in this paper.
Iowa Department of Education Organization
The Iowa Department of Education, whose implementation of NCLB will be discussed later in this paper, has the following organization.
The Bureaus of Planning, Research, & Evaluation and Information Technology Services are in charge of gathering and disseminating testscores from Iowa school districts. These Bureaus, along with the Division of Early Childhood, Elementary, and Secondary Education andthe Office of the Director, developed Iowa’s implementation plan for NCLB (discussed later in this paper). The Bureau of PractitionerPreparation and Licensure handles NCLB teacher quality requirements.
State Board of Education Office of the Director
Bureau of CommunityColleges and Career &
Technical Education
Bureau of InternalOperations
Bureau of Planning,Research, and
Evaluation
Bureau of InformationTechnology Services
Bureau of NutritionPrograms & School
Transportation
Bureau of PractitionerPreparation &
Licensure
Bureau of Children,Family, and Community
Services
Bureau of InstructionalServices
Bureau ofAdministrative Services
Bureau of DisabilityDetermination Services
Bureau of FieldServices
Bureau ofRehabilitation
Resources
State Library
Bureau of InformationServices
Bureau of LibraryDevelopment
Bureau of State DataCenter
Bureau of TechnicalServices
State DocumentsCenter
Law Library
Division ofAdministration
Division ofDevelopment
Division of EducationalTelecommunications
Division of Engineering
Division ofProgramming &
Production
Division of CommunityColleges & Workforce
Preparation
Division of Financial &Information Services
Division of EarlyChildhood, Elementary,
& Secondary Ed
Division of VocationalRehabilitation Services
Division of LibraryServices
Iowa Public Television

15
Program & Rules
With its legislative and administrative authority, the DOE is the home agency for the various programs that fall under the No Child Left Behind policy.According to the NCLB Desktop Reference, these programs were designed to address the following goals:
• Improve the academic performance of disadvantaged students• Improve the quality of teaching and instruction• Move limited English proficient students to English fluency• Promote informed parental choice and innovative programs• Encourage safe schools for the 21st Century• Increase funding for Impact Aid• Encourage freedom and accountability
To address these goals, programs within the NCLB legislation were based on the four principles: (1) increasing accountability for student academic achievement,(2) increasing flexibility and local control of education funds, (3) empowering parents, and (4) focusing on research-based practices. These programs wereheavily influenced by the experiences of those who crafted the legislation (the 1980s standards movement, the America 2000 panel, and the successesexperienced with the accountability practices in Texas).
This section will analyze the architecture of several NCLB programs. Because of the large number of programs within NCLB, focus will be placed onlyon programs designed to increase student achievement through accountability (Title I-A of the law). Readers interested in the design of other NCLB programs(teacher quality, safe schools, English fluency, spending flexibility) should read No Child Left Behind: A Desktop Reference published by the DOE (availableonline: www.ed.gov/offices/OESE/reference ).
Goal: Increase academic performance of all students and close achievement gaps due to gender, race, and socioeconomic status
Content & Performance StandardsThe 1994 IASA signed by President Clinton required states to develop challenging content standards (what students should learn) in language arts andmathematics by the 2002-03 school year (although no sanctions were placed on states failing to meet the deadline). NCLB expands upon the IASA byrequiring states to develop challenging content standards in science by the 2005-06 school year. States must have their standards approved when theysubmit their implementation plans to the DOE (all state implementation plans were approved on June 10, 2003). States failing to develop approvedcontent standards by the stated deadlines will receive sanctions (described later in this paper).
Additionally, NCLB requires states to develop performance standards (how much/well students should learn) to represent three levels of achievement: (1)partially proficient, (2) proficient, and (3) advanced. These performance benchmarks must align with the content standards and must clearly define thelevel at which a student is declared to be proficient in a content area.
NCLB authorized $10.35 billion to fund states in the development of their standards. At the end of 2004, only two states had not developed contentstandards as defined by NCLB. The state of Iowa uses standards developed by local school districts and the state of Ohio is in the process of developingits science standards (Young, 2004). State content standards are available from each state’s department of education for public review.
Assessments & Accountability PlansUnder the 1994 IASA, states were required to develop and administer assessments aligned with their math and language arts content/performancestandards once grades 3-5, 6-9, and 10-12. Again, no sanctions were placed on states that failed to meet these requirements. NCLB expands upon the

16
IASA by requiring states to test all students in grades 3-8 and 11 annually. Language arts and mathematics tests must be in place by 2005-06, whilescience testing must take place by 2007-08. Additionally, states are required to participate in the National Assessment of Educational Performance(NAEP) biennially beginning in 2002-03. Sanctions are placed on states not meeting these requirements.
In requiring the participation of all students in the assessment system, NCLB mandates that 95% of all students must be tested each year. Furthermore,95% of students in each subgroup (male/female, racial groups, disabled students, low-income students) must be tested. This requirement does not apply ifthe number of students in any subgroup is insufficient to yield statistically reliable information or if the results would reveal identifiable information aboutan individual student.
Originally, NCLB allowed states to develop alternative assessments for up to 0.5% of the state’s most disabled students. This was later increased to allow1% of students to take alternative assessments. States must provide accommodations to other disabled students (as specified in their Individual EducationPlans) in order to meet the 95% participation rate. The testing requirement for disabled students remains a point of debate for NCLB.
To aid states in the development of their assessment systems, $387 million was directly appropriated for annual assessment development. Of that amount,$370 million was automatically appropriated to the states (each state receives $3 million; the rest is distributed per-pupil). Another $17 million wasappropriated for competitive grants to states based on the quality of their applications. NCLB includes a provision which allows states to suspend theadministration of their assessment systems if federal funding does not meet specified funding levels each year (Young, 2004).
NCLB also mandates that states administer tests of English proficiency to all limited English proficiency (LEP) students by 2002-03. Students who haveattended a school in the U.S. for three consecutive years must be tested in English unless an individual assessment by the school district finds testing inthe native language would be more reliable. A total of $665 million was appropriated as state grants (based on percentage of immigrant students in eachstate) for LEP testing.
ReportingUnder the 1994 IASA, student test scores must be reported at the state, district, and school level and must be reported for gender, race, Englishproficiency, migrant status, disability, and socioeconomic subgroups. School districts were also required to produce profiles for each school anddisseminate these reports to teachers, parents, students, and the community. NCLB authorizes sanctions against states and school districts not meetingthese requirements. Furthermore, these “school report cards” must include information on teacher qualifications in each school - specifying thepercentage of classes taught by teachers who are “highly qualified” (as defined in NCLB) in each school. These report cards must be developedbeginning in 2002-03.
No direct funding was appropriated to aid states in the development of these report cards, but states may use a portion of the $10.35 billion appropriatedfor Title I for this purpose. The state school report cards may be viewed at http://www.schoolresults.org/
Adequate Yearly Progress & Proficiency GoalsUnder the 1994 IASA, states were required to use their performance standards to establish “adequate yearly progress” (AYP). AYP refers to annualachievement goals that all schools and school districts in the state were required to meet. States developed these performance goals (such as “90% ofstudents must be proficient in reading”) and schools were told that they could face sanctions if the goals were not met.
NCLB strengthened both the goals and sanctions of the IASA. NCLB mandates that all students must be proficient in reading, math, and science by theyear 2014 (12 years after the law was passed). AYP goals are defined established by each state as annual benchmarks to ensure states and schools

17
progress towards this 100% proficiency goal each year. For example, if 40% of the students in a state were proficient in 2002, the state may decide to setAYP goals of 5% each year in order to reach the 100% proficiency goal by 2014.
NCLB also requires schools, school districts, and states to ensure each student subgroup meets AYP goals. States, therefore, must demonstrate that low-income, racial minority, and disabled students are making continual progress towards 100% proficiency. NCLB also clearly states the sanctions facingschools, districts, and states if AYP goals are not met.
Funding for the development and monitoring of AYP goals is included as part of the $10.35 billion appropriated for Title I.
Sanctions & AwardsAs was discussed earlier, a failing of the 1994 IASA was that sanctions were not placed on states failing to meet the requirements of the law. UnderNCLB, states, schools, and school districts face sanctions if:
1) The state fails to develop content standards, performance standards, or an assessment system2) Fewer than 95% of students are assessed in a year3) Fewer than 95% of students in any subgroup are assessed in a year4) Student achievement decreases5) Student achievement increases, but does not increase enough to meet AYP goals6) Achievement levels for a particular subgroup of students fails to meet AYP goals
The severity of the sanctions depends on the number of consecutive years a school or district fails to meet its goals.
1) Schools that fail to meet AYP goals for one year will be listed on the annual state report cards
2) Schools that fail to meet AYP goals for 2 consecutive years will receive the following sanctions:a. Schools are provided technical assistance (the state may change criteria for distributing funds)b. Schools must develop 2-year school improvement plans that explain how they will increase student achievementc. Schools will be labeled as “Schools in need of improvement” (SINI)d. Parents are notified of the SINI labele. Districts who fail to meet AYP for 2 years must set aside 10% of funds for professional development for teachersf. All students enrolled in a SINI for 2 or more consecutive years must be offered public school choice
i. Parents are allowed to choose any public school in the district for their children ii. All students are allowed to transfer to other public schools until building safety codes would be violated iii. The district must spend at least 5% of Title I funds for transporting students to their chosen public school iv. Students transferring to another public school may remain in that school as long as they wish v. If all schools in a district are SINI, an agreement must be made with another district to allow public school choice
3) Schools that fail to meet AYP goals for 3 consecutive years will receive all of the above sanctions plus:a. Low-income students who have been enrolled in a low performing school for 3 years must be offered supplemental servicesb. These supplemental services must come from an approved service provider (public or private)c. Districts pay for the services, but are not required to pay transportation costs for these supplemental servicesd. Title I funds must be set aside by the district for the costs of these supplemental services.e. Supplemental services must be research-based and must have a record of effectiveness

18
4) Schools that fail to meet AYP goals for 4 consecutive years will receive all of the above sanctions plus:a. School staff members who contribute to the problem may be replacedb. The school may be forced to implement a new curriculumc. District can significantly decrease the management authority at the schoold. The school can extend the school day or school yeare. Schools can appoint outside experts who specialize in improving student achievementf. Schools can choose other major internal restructuring
5) Schools that fail to meet AYP goals for 5 consecutive years will receive all of the above sanctions plus:a. Schools can be reopened as charter schoolsb. Districts can replace principals and entire building staffc. Schools can contract with a private management companyd. The state can take over the school
6) Schools that fail to meet AYP goals for 6 consecutive years will receive all of the above sanctions plus:a. The school must continue to implement changes beginning no later than the 1st day of school
7) If a district fails to meet AYP goals for 4 consecutive years, it will receive the following sanctions:a. Students may be offered the choice to transfer to higher-performing schools in other districtsb. Reduced administrative fundsc. Replacement of district personneld. Abolishing or restructuring the district
If a school or district meets its AYP goals for one year, sanctions are suspended. In order to be taken off the sanctions list completely, schools must meettheir AYP goals for two consecutive years. NCLB also contains language describing a “safe harbor option” for schools. If a school increases theproficiency rate of one of its student subgroups by at least 10% in one year and shows increases in another measure of student performance, the schoolwill not face sanctions.
NCLB also offers rewards for states, districts, and schools who are in compliance with the law. One-time bonuses were offered to states that establishedcontent standards and assessment systems by the specified deadlines. Funds were authorized to reward states that narrow the achievement gap andimprove overall student achievement. Finally, schools that make the greatest progress in improving the achievement of disadvantaged students willreceive recognition from the DOE and will receive funding bonuses (Young, 2004).
The programs of NCLB described above were heavily influenced by previous public education legislation. While the federal government providesfunding for these programs, the actual work involved in implementing the programs and policies falls upon the states and local educators. With allreports and oversight coming from the DOE, the programs of NCLB are mostly vertically managed.

19
Iowa’s plan to implement NCLB programs was approved on June 6, 2003 (IASB, 2003)
Content & Performance StandardsIowa is one of the few states that previously allowed individual school districts to develop content standards in language arts,mathematics, and science. The state received permission to maintain this local control over content standards under NCLB.
Assessment, Accountability, Reporting, and AYPWhile the state does allow districts to develop their own assessment plans, the state has an unofficial assessment system in placewith the Iowa Tests of Basic Skills (ITBS) and the Iowa Tests of Educational Development. All students are required to be tested.Scores from subgroups containing fewer than 40 students (in any school) are not reported, but will counted towards the state’s AYPgoals.
Schools housing students in grades K-8 are also held accountable for student attendance rates (calculated by dividing the averagenumber of days students attending by the total number of days it was possible for students to attend). High schools in the state areheld accountable for the graduation rate of their students (calculated by dividing the number of graduates by the number ofgraduates plus the number of dropouts in that high school class over the past four years).
Iowa set the “proficient” performance standard at the 40th national percentile of the ITBS. Since the test was normed in 2000, thismeans that in order to earn a proficient score, a student must outscore 40% of the norming sample that took the test in the year 2000(approximately equivalent to answering 50% of the items correctly on the test). Proficiency rates are averaged over two-yearperiods and compared to AYP goals.
According to Iowa’s AYP model, schools must not only meet state AYP goals but also district AYP goals. The chart on the nextpage illustrates the AYP goals for a school in the Clinton Community School District. If the proficiency rate of a school is aboveboth the district and state lines, the school has met its goals. If the proficiency drops between the lines (it still remains above eitherthe state or district goals), the school must submit an improvement plan to the Iowa Department of Education. If the proficiencyrate for a school drops below both lines, the school will receive the SINI label and will receive sanctions.
The current plan is that by the end of the 2005-06 year, elementary schools will combine test scores from grades 3-5 to measureprogress towards AYP goals. Middle schools will combine grades 6-8 and high schools will report scores from grade 11 only.Confidence intervals will be created for these proficiency rates to ensure drops in proficiency are not due to random sampling error.
The state is currently developing a centralized student information system to track and report testing data (modifying ProjectEASIER, which collects and reports enrollment information from Iowa’s schools). School report cards are available online and thestate report card is published each year as the Annual Condition of Education Report. The law in Iowa before NCLB alreadyrequired districts to create Annual Progress Reports (school report cards). Under NCLB, districts are required to disseminate theirAnnual Progress Reports to the public by August 15th each year.

20
AYP Goals for the Clinton Community School District (CCSD)
Each grade and subject area has its own AYP goals. The above chart and table show the AYP goals for 4th grade math proficiencyfor the Clinton Community School District.
February 2005 Update to Iowa’s Implementation PlanIn February of 2005, the Iowa Department of Education modified its NCLB implementation plan. Beginning with the 2005-06school year, the following changes will be made:
1. Annual data will be reported instead of biennial data. The state discovered that under biennial reportingrequirements, it was more difficult for schools to make AYP if they failed to make AYP the previous year.
2. Instead of reporting test scores from grades 3-8 and 11, schools will collapse their test scores across grades andreport one set of test scores for the elementary grades (averaging grades 3-5), middle school grades (averagingscores from grades 6-8), and high school grades (grade 11). This will ease reporting requirements for each district.
4th Grade Reading Trajectory
100%
94%
88%
82%
76%76%
70%70%
64%
95%
91%
86%
81%81%
77%77%
72%
50%
60%
70%
80%
90%
100%
2002 2003 2004 2005 2006 2007 2008 2009 2010 2011 2012 2013 2014
CCSD Proficiency
State Proficiency
4th Grade Math AYP Goal for Proficiency
2002-03 64%
2003-04 64%
2004-05 70%
2005-06 70%
2006-07 70%
2007-08 76%
2008-09 76%
2009-10 76%
2010-11 82%
2011-12 88%
2012-13 94%
2013-14 100%

21
Personal Implementation Experience
Iowa Department of EducationI had been working at the Iowa Department of Education for four months before NCLB was signed into law. Right after it
became law, the Iowa DOE had to scramble to meet federal mandates. Our first duty was to develop an implementation plan for thestate of Iowa. Because NCLB encompasses elementary education, secondary education, teacher licensure, and administration, theIowa DOE gathered people from just about every office within the department to form an implementation team. Because I wasworking for the Bureau of Planning, Research, and Evaluation, I helped this implementation team prepare the state implementationplan.
Decisions were made in regards to standards-development (districts would create their own standards), assessment choice(districts could choose their assessments, but the ITBS was strongly recommended), and reporting requirements. Since schooldistricts were already required to submit enrollment information online (Basic Educational Data Survey), it was decided that testscores would be piggybacked on the current information technology system.
The next major decision to be made was how to define proficiency and how to set AYP goals. The proficiency definition camefrom the Iowa Testing Programs. For years, the ITBS had declared any student scoring above the 40th national percentile to beproficient. This definition was kept for NCLB requirements. AYP goals were more difficult to establish. The Iowa DOE met withschool district officials, experts from the Iowa Testing Programs, and federal DOE officials to create the AYP goals. It was decidedthat school districts would track their own performance and report their biennial test scores to the Iowa Department of Education inAugust each year. This information would be added to the Annual Progress Report requirements districts had faced for several years.
Clinton Community School District8 months after NCLB was passed, I took a job as an Assessment Coordinator at a school district. Here I gained hands-on
experience in gathering accountability information and submitting it to the Iowa DOE.
Districts were given a checklist of 96 reporting requirements in order for their Annual Progress Reports (APR) to meet NCLBrequirements. Included in this list of requirements was the mandate that districts must calculate AYP progress and create a list ofschools failing to meet AYP goals. Once the APR had been completed, it was submitted to the Iowa DOE. The Iowa DOE gathered ateam (school district officials, Iowa Testing Programs staff, Iowa DOE volunteers) to review the APRs from all the school districts inIowa. The reviewers ensured all the required information was reported and certified each APR.
Once each district APR was certified, the Bureau of Planning, Research, and Evaluation would create the Annual Condition ofEducation (ACE) report for the state of Iowa and submit it to the Division of Financial & Information Services within the Iowa DOE.This ACE report would then be submitted to the Office of the Secretary of the federal DOE for review. Once the Secretary certifiesthe ACE, the states reporting requirements are fulfilled for the year.

22
The preceding pages outlined the design of NCLB and the rules established by legislators and the DOE. The program is designed to hold schoolsaccountable for student achievement and the rules ensure this will be the case. While the general rules were established in the legislation, states were allowed tocreate their own specific rules (definitions of AYP and proficiency) in order to fulfill NCLB requirements. Evaluation of the programs within NCLB should bestraightforward. As schools, districts, and states move towards the 2014 deadline, the programs of NCLB will be evaluated in terms of the percentage of schoolsmeeting AYP goals each year. The programs will also be evaluated by the results of the required biennial NAEP testing.
Grants
As mentioned earlier, NCLB was based on the block-grant proposal first described by Rotherham in his 1999 white paper. While the full block-grantproposal wasn’t realized in the final legislation, NCLB still contains grant provisions. For example, NCLB provided $17 million in competitive grants for stateaccountability plans. States with the best accountability plans, as judged by the U.S. Department of Education, were awarded these funds for the implementationof their plans. NCLB also provided $665 million in grants under its English proficiency programs. These formulaic grants were awarded based on the percentageof Limited English Proficient students in each state (those with more LEP students received more money) (U.S. Department of Education, 2002).
NCLB also has provisions to provide awards to states and school districts that are able to close their achievement gaps. The details of these awards arenot provided in the actual NCLB legislation. NCLB has additional provisions for grants based on “innovative programs.” The money for these grants goesdirectly to the states. The states, in turn, award the grants to providers of innovative programs (U.S. Department of Education, 2002).
Contracts
As described in the Program & Rules section of this paper, NCLB is a federal mandate to the states. After NCLB was signed into law, states faced thetask of creating content standards and assessment systems. Many states contracted these jobs to test publishers and educational organizations with expertise inthese areas.
The state of Iowa contracted the University of Iowa to develop the Iowa Technical Adequacy Project (ITAP). Since Iowa allows districts to create theirown content standards, the ITAP was a project designed to ensure districts developed high quality standards that aligned with the Iowa Tests of Basic Skills(ITBS). ITAP began in January of 2003, with a series of ICN sessions that instructed district administrators on the steps they would have to take to ensure theircontent standards were of high quality. Under ITAP, administrators from Iowa school districts met face-to-face with experts from the Iowa Testing Programs tocomplete the work of aligning content standards with the ITBS. ITAP was completed in October 2003, when districts submitted details of the alignment of theircontent standards with the ITBS to the Iowa Department of Education. Detailed information about ITAP is found at http://projects.education.uiowa.edu/itap/
The ITAP contract was signed with the Center for Evaluation and Assessment, which is housed in the College of Education at the University of Iowa.The contract came about after a request for proposal (RFP) was developed by the Iowa Department of Education in June of 2002(http://www.state.ia.us/educate/ecese/is/dwa/doc/app.htm). The proposal called for “an outside vendor or individual with assessment expertise to complete thenecessary work with the assistance of the Department’s Cross Bureau Assessment Team” (Grant Application, 2002).
In addition to meeting the application requirements (the application is signed and received before the June 24, 2002 deadline; the correct font and papersize are used), the RFP stated that the Iowa Department of Education Cross Bureau Assessment Team would read and score the grant applications. Scores were

23
based on a 5-point rubric developed by the Iowa Department of Education. The applicant receiving the highest score (not the lowest bidder) would be consideredfor funding. According to the RFP, scores were based on the following criteria:
• The quality of the narrative description of the activities proposed to meet the intended outcomes• A description of the training process (60 points possible) and a description of how deadlines will be met
• Of these 60 points, 25 points were awarded based on the quality of the delivery model.• 25 points were also awarded for information about how the grantee would provide ongoing support• 15 points were awarded for materials and selection of training sites,
• Another 50 points were awarded for information on how the grantee would evaluate the performance of their activities• 20 points were awarded based on the itemized budgeted costs proposed by the applicant• 10 points were awarded based on the credentials of the applicants along with assurances that the applicant would comply with federal laws
A total of $638,000 was awarded to the Center for Evaluation and Assessment to complete the ITAP. (University of Iowa, 2002)
The state of Iowa also contracted with Measured Progress, an assessment company, to develop alternative assessments for disabled students. Informationon this contract can be found at http://www.measuredprogress.org/Assessments/GeneralEducation/PastClients.html.
Within the state of Iowa, school districts are also contracting out services under NCLB requirements. Recall that districts failing to meet AYP goals forthree consecutive years are required to provide supplemental services to their students. Districts are beginning to sign contracts with supplemental serviceproviders to meet these requirements. According to the Iowa Department of Education, various school districts have contracts with 13 different supplementalservice providers. These providers are both public (Davenport Community Schools) and private (Sylvan Learning Centers); for-profit and not-for-profit. Theseproviders must demonstrate the effectiveness of their services and must be approved by the state. A list of providers in Iowa can be found athttp://www.state.ia.us/educate/ecese/asis/ibp/sesp/.
24
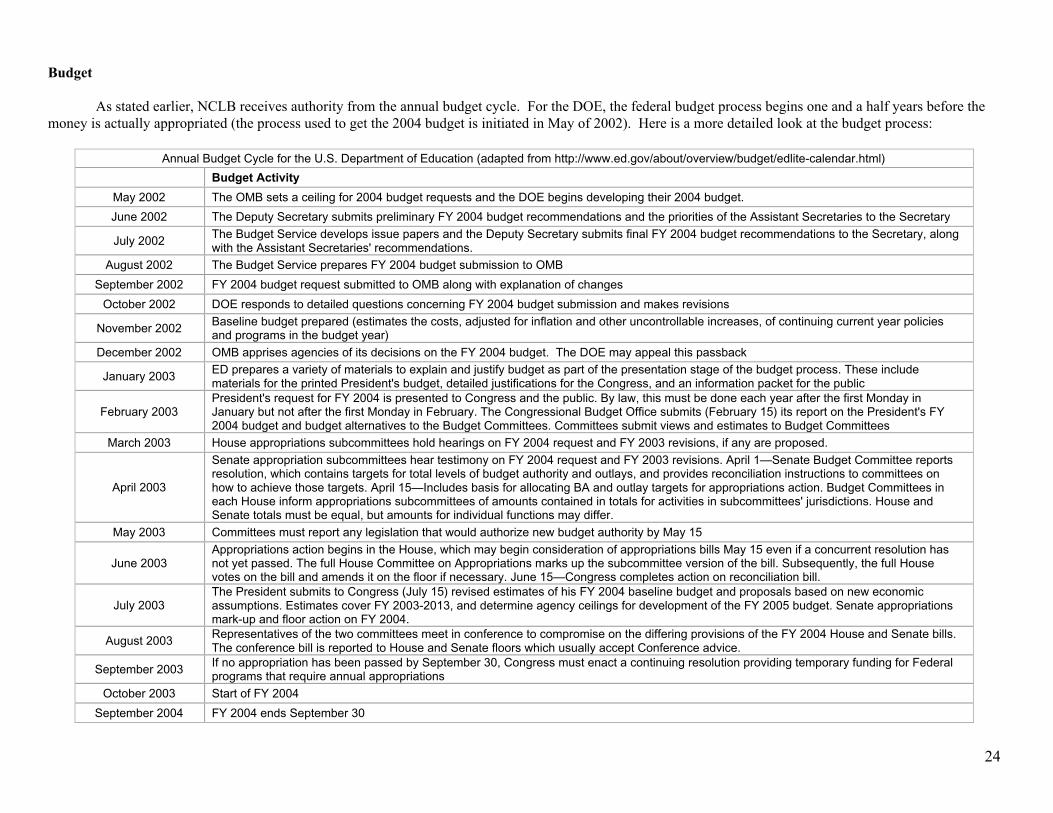
Budget
As stated earlier, NCLB receives authority from the annual budget cycle. For the DOE, the federal budget process begins one and a half years before themoney is actually appropriated (the process used to get the 2004 budget is initiated in May of 2002). Here is a more detailed look at the budget process:
Annual Budget Cycle for the U.S. Department of Education (adapted from http://www.ed.gov/about/overview/budget/edlite-calendar.html)
Budget Activity
May 2002 The OMB sets a ceiling for 2004 budget requests and the DOE begins developing their 2004 budget.
June 2002 The Deputy Secretary submits preliminary FY 2004 budget recommendations and the priorities of the Assistant Secretaries to the Secretary
July 2002The Budget Service develops issue papers and the Deputy Secretary submits final FY 2004 budget recommendations to the Secretary, alongwith the Assistant Secretaries' recommendations.
August 2002 The Budget Service prepares FY 2004 budget submission to OMB
September 2002 FY 2004 budget request submitted to OMB along with explanation of changes
October 2002 DOE responds to detailed questions concerning FY 2004 budget submission and makes revisions
November 2002Baseline budget prepared (estimates the costs, adjusted for inflation and other uncontrollable increases, of continuing current year policiesand programs in the budget year)
December 2002 OMB apprises agencies of its decisions on the FY 2004 budget. The DOE may appeal this passback
January 2003ED prepares a variety of materials to explain and justify budget as part of the presentation stage of the budget process. These includematerials for the printed President's budget, detailed justifications for the Congress, and an information packet for the public
February 2003President's request for FY 2004 is presented to Congress and the public. By law, this must be done each year after the first Monday inJanuary but not after the first Monday in February. The Congressional Budget Office submits (February 15) its report on the President's FY2004 budget and budget alternatives to the Budget Committees. Committees submit views and estimates to Budget Committees
March 2003 House appropriations subcommittees hold hearings on FY 2004 request and FY 2003 revisions, if any are proposed.
April 2003
Senate appropriation subcommittees hear testimony on FY 2004 request and FY 2003 revisions. April 1—Senate Budget Committee reportsresolution, which contains targets for total levels of budget authority and outlays, and provides reconciliation instructions to committees onhow to achieve those targets. April 15—Includes basis for allocating BA and outlay targets for appropriations action. Budget Committees ineach House inform appropriations subcommittees of amounts contained in totals for activities in subcommittees' jurisdictions. House andSenate totals must be equal, but amounts for individual functions may differ.
May 2003 Committees must report any legislation that would authorize new budget authority by May 15
June 2003Appropriations action begins in the House, which may begin consideration of appropriations bills May 15 even if a concurrent resolution hasnot yet passed. The full House Committee on Appropriations marks up the subcommittee version of the bill. Subsequently, the full Housevotes on the bill and amends it on the floor if necessary. June 15—Congress completes action on reconciliation bill.
July 2003The President submits to Congress (July 15) revised estimates of his FY 2004 baseline budget and proposals based on new economicassumptions. Estimates cover FY 2003-2013, and determine agency ceilings for development of the FY 2005 budget. Senate appropriationsmark-up and floor action on FY 2004.
August 2003Representatives of the two committees meet in conference to compromise on the differing provisions of the FY 2004 House and Senate bills.The conference bill is reported to House and Senate floors which usually accept Conference advice.
September 2003If no appropriation has been passed by September 30, Congress must enact a continuing resolution providing temporary funding for Federalprograms that require annual appropriations
October 2003 Start of FY 2004
September 2004 FY 2004 ends September 30

25
At any given time, the DOE is managing budgets for 2 or 3 separate fiscal years.
Formulation of the budget begins one and a half years before the beginning of the fiscal year. The DOE sets its priorities and submits its requests to theOMB. The legislative enactment phase of the budget process then begins, with the preparation of the President’s budget to Congress. Both the House and theSenate then agree upon their own budget plans to guide future spending. This spending includes discretionary spending (approximately 88% of the DOE budgetis discretionary) and mandatory spending (for the DOE, the Federal Government is mandated by law to cover the cost of guaranteeing loans to students) (BudgetProcess, 2005). The third phase of the budget process, enactment, begins with the OMB apportioning funds to the DOE. The DOE then submits an operatingplan detailing when the funds will be required. At the end of the fiscal year, the DOE submits a detailed report of its spending and the totals are then used insetting the President’s next budget.
The President’s 2006 budget calls for the following appropriations under NCLB: (White House, 2005)
• $13.3 billion for Title I grants to Local Educational Agencies (LEAs) to help states meet the accountability and teacher quality requirements. Thisamount would represent a 52% increase in Title I spending since the enactment of NCLB.
• $412 million for state assessment grants to maintain required levels of support for test development. Of this amount, $12 million would be set aside forcompetitive grants focusing on using technology to support innovative test design. The “required levels of support” refers to the provisions discussedearlier in this paper in which states may suspend assessment development if federal spending dips below a specified level.
• $2.92 billion is requested for improving teacher quality. This money would be granted to states.• $500 million for a new Teacher Incentive Fund which would provide formula and competitive grants to states with innovative teacher pay systems.• $1.0 billion for Reading First, the program that focuses on research-based reading instruction for children before the third grade• $104 million is requested for Early Reading First, which focuses on preschool reading instruction• $676 million is requested for English Language Acquisition programs• $164 million is requested for research and development in reading comprehension, math, and science instruction; and teacher quality.
The NCLB specifies funds to be appropriated in the years 2002-03. The law authorizes “funds as necessary” for the years 2004-2014.
The following table displays the amount of money budgeted for NCLB programs in the state of Iowa.
Federal Funds Budgeted to Iowa For Selected NCLB Programs (* = Estimated)
2001 2002 2003 2004 2005* 2006*
All NCLB Programs 88,946,961 121,107,111 121,890,957 125,457,413 122,242,178 124,932,658
Annual Change -- +36.2% +0.6% +2.9% -2.6% +2.2%
Title I 56,568,655 62,955,699 62,955,699 64,684,556 63,983,273 65,227,433
Teacher Quality 0 21,991,566 22,012,532 22,014,697 21,863,139 21,863,139
State Assessments 0 5,126,708 5,226,824 5,178,609 5,272,343 8,466,213
Total Federal Expenditures For Iowa 901,002,267 1,046,528,127 1,182,551,484 1,336,058,298 1,409,996,505 1,496,741,205
NCLB as a % of Total Federal Spending 9.87% 11.57% 10.31% 9.39% 8.67% 8.35%
Source: http://www.ed.gov/about/overview/budget/statetables/

26
The table shows the increase in federal funding in the state of Iowa since the enactment of NCLB in 2001. Looking at federal NCLB spending in the state ofIowa as a percentage of total federal education spending in the state, it appears as though NCLB has not been the major growth factor in federal educationspending in Iowa.
Sources Cited:
Collender, S (1998). The Guide to the Federal Budget: Fiscal 1998
Consolidated State Application Accountability Workbook for State Grants under Title IX, Part C, Section 9302 of the Elementary and Secondary Education Act(Public Law 107-110) (2003)
Grant Application (2002). Technical Assistance to Determine Quality of Alignment Of District-wide Assessment Measures. Iowa Department of Education
Iowa Association of School Boards (2003). IASB Compass, Volume VII, Number 1.
State Assessment and Accountability Systems: 50 State Profiles (2000), Consortium for Policy Research in Education
University of Iowa (2002). Education First College of Education Newsletter, November.
U.S. Department of Education (1992). Ed Facts: Information About the U.S. Department of Education, Washington, DC: U.S. Government Printing Office.
U.S. Department of Education (September, 2002). No Child Left Behind: A Desktop Reference. Website: www.ed.gov/offices/OESE/reference
U.S. Department of Education (2005). Budget Process in the U.S. Department of Education, Office of Management and Budget.Website: http://www.ed.gov/about/overview/budget/process.html?src=rt
Budget Process in the U.S. Department of Education (2005).
White House (2002). Transforming the Federal Role in Education
Young, Scott. (2004) No Child Left Behind Act Accountability & AYP. National Conference of State Legislatures.Website: www.ncsl.org/programs/educ/NCLBHistory.htm

27
Part III: Results
Outputs
Target Population Output (Benefit / Burden) Allocation Method
StatesSchool DistrictsSchools
Title I funds (benefit)
Formula grants:
A set amount of the total appropriation is set-aside for the secretary of the interior and “outlyingareas.” The Department allocates the remaining funds through state and local education agenciesas formula grants. From the amount for the “outlying areas,” $5 million is reserved forcompetitive grants
Federal funds are allocated through four statutory formulas based primarily on census povertyestimates and the cost of education in each state. Basic Grants provide funding for schooldistricts in which low-income students make-up more than 2 percent of total enrollment.Concentration Grants are awarded to districts in which low-income students account for morethan 15% of the total enrollment. Targeted Grants are based on the same formulas except thatdistricts with higher percentages of low-income students receive more funds. Education FinanceIncentive Grants allocate funds to states based on a state’s effort to provide financial support foreducation compared to its relative wealth (U.S. Department of Education, 2005).
StatesSchool DistrictsSchools
Assessment System GrantsExcellent Schools Grants(benefits)
Competitive Grants:
As discussed earlier, NCLB provides funds for states with the best implementation plans. NCLBalso sets-aside funds to reward schools that meet AYP goals and close achievement gaps.
StatesSchool Districts
Requirements for Standardsand Annual Assessment(burdens)
Regulation:
As described earlier, NCLB required states to develop content standards and implementassessment systems. All states, school districts, and schools receiving federal Title I funds areheld to these regulations.
StatesSchool DistrictsSchools
Reporting Requirements(burdens)
Regulation:
As described earlier, NCLB requires states, school districts, and schools to create annual reportcards. All states, school districts, and schools receiving federal Title I funds are held to theseregulations.
StatesSchool DistrictsSchools
AYP Sanctions(burdens)
Sanction:
The AYP sanctions are detailed in the previous section of this paper.

28
Outcomes
The previous page listed the actual benefits or burdens – the outputs – NCLB provides to the public. This section will outline the outcomes – theconsequences – resulting from NCLB.
Short-Term OutcomesRight after NCLB was signed into law, states scrambled to develop content standards and implement accountability systems. Some states that had
previously implemented accountability systems sought waivers from the NCLB requirements, while other states quickly gathered resources to meet these newrequirements. While NCLB allocated $400 million for states to develop accountability plans, The National Association of State Boards of Education estimatedthe cost of implementing testing programs at $7 billion over seven years (The National Association of State Boards of Education, 2002).
This movement to develop accountability systems lead to the major short-term outcome from NCLB: an increased focus on professional development.Teachers and school administrators needed to learn about the requirements of NCLB. They also needed training in implementing accountability systems. Duringthe 2002-03 academic year, school districts in Iowa spent a good deal of their professional development time discussing NCLB provisions. In Iowa, teachers andadministrators were trained to either develop or interpret district-developed content standards. In some districts, teachers were trained to teach their students test-taking skills. NCLB definitely had the short-term outcome of focusing school district administrators and teachers on measurable student achievement.
Mid-Term OutcomesLonger-term, the major consequences of NCLB have been the sanctions handed-out to schools that have failed to make AYP. According to the National
Education Association, 26,896 schools failed to meet their AYP goals during the 2003-04 academic year. The following year, only 20,948 schools failed to makeAYP (NEA, 2005). Looking at these numbers, it appears as though NCLB requirements are leading to higher test scores for students. In fact, in 2004-05, 38states managed to decrease the number of schools failing to make AYP (NEA, 2005).
The NEA identifies three possible reasons for the declining number of schools failing to make AYP:1. Federal Rules Changes -- The DOE has changed rules regarding the testing of disabled students and English Language Learners, causing
fewer of these students to be included in the school accountability systems.2. State Accountability Plan Changes -- Many states, including Iowa, have modified their implementation plans. These modifications, including
raising the number of students in each subgroup required for reporting purposes, can hide the performance of low-achieving students.3. AYP Goal Threshold. In 2004-05, the AYP goals did not increase for many states. The chart on page 20 of this paper demonstrates that
AYP goals will increase for the 2005-06 academic year. This should lead to an increase in the number of schools failing to make AYP (NEA,2005).
Looking at the data another way paints a more pessimistic picture. While the number of schools failing to make AYP has declined, the number of schools“in need of improvement” (failing to make AYP for 2 or more consecutive years) has been increasing. The table on the next page shows the number of schoolsfacing sanctions during the 2002-03 school year. While the number of “failing schools” decreased from 8,652 to 6,256 from 2002-03 to 2003-04, this numberjumped to 10,991 in 2004,05 (NEA, 2005). Forty-four states have had an increase in the number of schools facing sanctions since 2002-03. Various studies haveprojected that by 2014, somewhere between 75% - 99% of all public schools will be “in need of improvement.”
In Iowa, the number of schools “in need of assistance” has increased from 26 in 2002-03 to 66 in 2003-04 (representing 4.4% of all Iowa public schools).In addition, nine of the 370 public school districts in Iowa are currently facing NCLB sanctions.

29
Schools Facing Sanctions in 2002-032002-03 2002-03
Alabama 57 Montana 68
Alaska 11 Nebraska 105
Arizona 344 Nevada 19
Arkansas 0 New Hampshire 4
California 1,009 New Jersey 274
Colorado 154 New Mexico 63
Connecticut 28 New York 529
Delaware 20 North Carolina 17
D.C. 12 North Dakota 20
Florida 246 Ohio 760
Georgia 625 Oklahoma 33
Hawaii 85 Oregon 9
Idaho 88 Pennsylvania 256
Illinois 435 Puerto Rico 234
Indiana 97 Rhode Island 34
Iowa 26 South Carolina 31
Kansas 118 South Dakota 13
Kentucky 107 Tennessee 132
Louisiana 24 Texas 121
Main 19 Utah 22
Maryland 118 Vermont 28
Massachusetts 259 Virginia 35
Michigan 1,513 Washington 60
Minnesota 79 West Virginia 13
Mississippi 122 Wisconsin 113
Missouri 63 Wyoming 0
TOTAL 8,652
Simply becoming a “school in need of improvement” isn’t much of an outcome – the real outcomes are the sanctions faced by these schools. Parents ofstudents at these schools can choose to attend another public school. The students at these schools are given supplemental services and more school time isdevoted to test preparation skills. Teachers at these schools – whose jobs may be at risk – are given more professional development responsibilities.Administrators at these schools must develop school improvement plans and must do as much damage control as possible.
According to the case study provided by Dr. Helms, the increasing number of schools failing to make AYP could also lead to the following outcomes: (1)lowered standards, (2) score inflation, (3) curriculum narrowing, (4) neglected content outside reading, math, and science, (5) cheating, (6) doing more with less,(7) diversion of resources, (8) more policy relevant information, (9) better feedback to teachers and parents, (10) better tracking of individual student progress,(11) better tracking of teachers, (12) changes in teacher assignment practices, (13) improved reading and math achievement, (14) more resources for at-riskstudents (Helms, 2004).

30
Long-Term OutcomesNCLB is still a relatively new law, but some of its long-term outcomes can be predicted. With its testing requirements and focus on research-based
methods, NCLB will lead to a greater, more sophisticated research base for the education field (see Iowa’s Successful Districts below). NCLB will also provideopportunities for private education companies to profit via its testing requirements (for test publishers and test preparation companies) and its provisions forsupplemental services. Another long-term outcome of NCLB will be its impact on teacher education programs.
Iowa’s Successful Districts – a list of districts experiencing success under NCLB (source: Iowa Department of Education)
Cedar Falls, Creston, Davenport, LeMars, Saydel, and South Tama community school districts each received a “Breaking Barriers to Learning andTeaching Award,” which were created by the State Board of Education to recognize successful district efforts to address chronic achievement gaps byimproving instruction, curriculum and professional development opportunities for teachers. Districts earned the award if they improved achievementamong African American, Hispanic, or low-income students by 20% or more, without letting any other group of students decline in their achievement.
Cedar Falls improved reading achievement among low-income 11th graders by 35.5%. In addition to all staff contributing to careful analysis of testresults and brainstorming improvement strategies for test-taking, Superintendent Dan Smith said counselors also are meeting with 11th graders prior totaking the ITEDs to discuss student goals and how improving their scores would benefit the student as a practice for taking college prep tests.
Creston improved reading achievement among low-income 4th graders by 20.4%. The district has implemented stronger staff development focusing onreading instruction strategies, particularly with reading comprehension among elementary students. Elementary teachers also have implemented astronger articulated curriculum with established times to introduce, instruct, assess and maintain reading skills. Superintendent Tim Hood believes thefocus on gathering achievement data and continuously monitoring student progress has been key. Davenport improved reading achievement among Hispanic 8th graders by 20%. The district has implemented numerous programs to help studentsimprove their reading ability, including focus lessons, the Reading First program, setting aside time for uninterrupted reading, and professionaldevelopment for teachers. The district also has strong programs in place in terms of supporting students who are learning the English language, saidsuperintendent Norbert Schuerman.
LeMars improved math achievement among low-income 4th graders by 23%. The district benefited from professional development that trained staff toanalyze achievement data and diagnose areas of difficulty such as math problem solving. They received additional training support from Western HillsArea Education Agency to learn new teaching methods targeted to specific learning needs. The goal, said Superintendent Todd Wendt, is to haveteaching techniques that will build student skills over time, and assure all children are proficient.
Saydel improved math achievement among low-income 8th graders by 21%. The district is beginning to see results of a new, integrated, standards-basedmath curriculum implemented several years ago, said Superintendent Chuck Knight. It focuses on problem solving, which he said works for at-riskstudents as well as those already proficient. In addition, teachers have received staff development that trains them to differentiate instruction for eachgroup of students, rather than “teach to the middle” and lose students on either end of the achievement spectrum.
South Tama improved math achievement among low-income 11th graders by 23.5%. Staff have gained greater awareness and appreciation forassessments as a necessary benchmark, and have helped students understand their importance as well. Resisting the temptation to “teach to the test,”teachers have helped students develop a creative mindset that is test ready, and hosted a picnic to reward students who improved their achievement.Superintendent Larry Molacek said an afterschool program that combines time for homework and tutoring with social activities also has helped students.In addition, Heartland Area Education Agency is providing training to the staff to help them better understand poverty.

31
Another major outcome of NCLB has been the attention it has brought to several important educational debates:
1. The role of the federal government in education2. School choice, vouchers, and public vs. private schools3. The role of testing in education; the role of test preparation in education4. The role of experimental research in education (versus the traditional observational research)5. Local vs. state-developed vs. national curriculum6. Teacher tenure vs. flexibility in hiring/firing decisions7. The definition of “successful” students, schools, and teachers
While NCLB will not settle any arguments, it will provide additional information and research in each of these seven areas of debate.
The final outcome of NCLB has been the increased federal legislation activity in education. Here is a partial list of educational legislation proposed inresponse to NCLB:
Date Proposed Legislation
05/20/03 Senator Feingold (D-WI) proposes S. 956 – the Student Testing Flexibility Act of 2003
06/06/03 NEA submits the Great Public Schools for Every Child bill
06/11/03Representative Moore (D-KS) introduced the Keeping Our Promises to America’s Children Act (HR 2394) which would suspend sanctions against schools thatfail to meet AYP unless Title I is fully funded
07/10/03The House rejected (199-223) an amendment that would have suspended for one year the sanctions imposed on schools that fail to meet AYP because Title Iwas not fully funded
09/10/03 Representative Strickland (D-OH) proposes a bill to amend AYP and the sanction provisions of NCLB
12/09/03 Secretary Paige announced the first rules change under NCLB, providing additional flexibility in assessing certain students with disabilities
01/08/04 Senator Kennedy and Democrats on the Senate HELP committee sent a letter to Secretary Paige criticizing NCLB funding/implementation
02/19/04 Secretary Paige announced a new rule providing flexibility for assessing limited-English-proficient students
03/15/04 Secretary Paige announced new rules providing flexibility for rural teachers in meeting the “highly qualified teachers” rules
03/24/0431 Democratic members of the House and Senate Education committees sent a joint letter to Secretary Paige asking him to allow states to recalculate AYPdeterminations for the 2002-03 school year based on the new AYP rules
03/29/04 Secretary Paige announced new flexibility in calculating the 95% participation rate. This was the 4th and final change announced by Paige
05/13/04 The Wisconsin Attorney General issued a legal opinion stating that NCLB is an unfunded mandate & the state does not have to spend its own money to comply
06/17/04 Senator Kennedy (D-MA) & Representative Miller (D-CA) introduced the NCLB Fairness Act reexamining school ratings based on revised guidelines
07/22/04Representative John (D-LA) introduced the Keeping Our Education Promise to America’s Children act (HR 4957). The legislation would defer sanctionsimposed on school districts for any year in which Title I is funded at less than 97% of the authorized amount
Source: National Education Association (2004)

32
While it is easy to identify the outcomes of NCLB, it’s difficult to evaluate the effects of those outcomes. It’s even difficult to determine public opinionregarding NCLB and its outcomes. According to the 36th Annual Phi Delta Kappa/Gallup Poll of the Public’s Attitudes Towards Public Schools conducted in2004:
• 68% of respondents said they know little or nothing about NCLB (62% of public school parents know little or nothing about NCLB)• 55% of respondents said they did not know enough about NCLB to say whether their view was favorable or unfavorable• 67% say the performance of a school’s students on a single test is not sufficient for judging whether the school is in need of improvement• 73% say it is not possible to judge a student’s proficiency in English and math on the basis of a single test• 81% are concerned that the emphasis on English and math will mean less emphasis on art, music, history, and other subjects• 80% would favor keeping students in schools found to be in need of improvement and making additional efforts to help them (which NCLB encourages)• 52% oppose separating test scores by race and ethnicity, disabled status, English-speaking ability, and poverty level• 61% oppose requiring special education students to meet the same standards as other students
This data would seem to indicate the public either does not know about NCLB or does not support its outcomes. Other responses from the same poll indicate atleast some level of public support for NCLB:
• 51% believe NCLB will improve student achievement in their local schools• 40% say there is about the right amount of emphasis on standardized tests (32% say there is too much emphasis; 22% say there is too little emphasis)
The results of this survey were disputed by the Chairman of the House Education & the Workforce Committee, John Boehner (R-OH). Boehmer found that thequestions in the Phi Delta Kappa/Gallup poll were based on distorted descriptions of NCLB. Furthermore, Boehner cites a 2003 survey conducted by theWinston Group for the group Americans for Better Education, which finds:
• 66% of respondents believe increasing funding and raising standards and accountability are most important in improving education• 91% of respondents support requiring school districts to give parents annual report cards on overall academic performance of schools• 76% support allowing parents with children in underachieving schools to transfer their children to a better public school or charter school.
These results make it difficult to gauge the public view of NCLB. Perhaps the outcomes of NCLB can be evaluated best by the organization that most stronglyopposes the law. The National Center for Fair & Open Testing (Fairtest) publishes an annual report card for NCLB. In its 3rd-Year NCLB Report Card forGeorge W. Bush, Fairtest gives the following grades:
• Public Relations: A-• Accountability: D• Parental Choice: C-• Focusing Attention on Children Left Behind: C• High-quality Assessment: F• Real Improvements in Educational Quality: F (Fairtest, 2005)

33
Sources Cited:
Azzam, A. (2004). NCLB: Up Close and Personal. Educational Leadership, 62(2).
Boehner, J. (2004). Boehner Challenges Conclusions of Phi Delta Kappa Poll on NCLB. News from the Committee on Education & the Workforce
Costrell, R. & Peyser, J. (2003). Exploring the Costs of Accountability. Education Next. Website: http://www.educationnext.org/20042/22.html
Delisio, E. (2002). No Child Left Behind: What It Means to You. Education World. Website: http://www.educationworld.com/a_issues/issues273.shtml
Education Commission of the States (2001). A Closer Look: State Policy Trends in Three Key Areas of the Bush Education Plan – Testing, Accountability, andSchool Choice. Website: http://www.ecs.org/
Fairtest (2004). 3rd-Year NCLB Report Card for George W. Bush. National Center for Fairness in Testing.Website: http://fairtest.org/nattest/Year%20three%20Report%20Card.html
Helms, L (2004). Case Study: Tracking the Fallout – No Child Left Behind. American Public Policymaking: Getting Results, pp. 16-30 – 16-31.
National Education Association (2004). NEA Recent Legislative History of ESEA/NCLB. Website: www.nea.org/lac/esea/eseahistory.html
National Education Association (2005). NCLB Testing Results Offer Complex, Muddled Picture: Emerging Trends Under the Law’s Annual Rating System.Website: http://www.nea.org/esea/ayptrends1104.html
Peterson, G (2004). The No Child Left Behind Act and its Influence on Current and Future District Leaders. Journal of Law and Education, July 2004.
Renner, E (2004). No Child Left Behind Act. Paper in Using Information Effectively in Education course,
Ritter, G. & Lucas, C. (2002). Estimations of Readiness for NCLB: Lessons Learned From State Education Officials. Education Next.Website: http://www.educationnext.org/unabridged/20034/54.pdf
Rose, L. & Gallup, A. (2004). 36th Annual Phi Delta Kappa/Gallup Poll of the Public’s Attitudes Towards Public Schools Online Edition.Website: http://www.pdkintl.org/kappan/k0409pol.htm
United States General Accounting Office (2003). Characteristics of Tests Will Influence Expenses; Information Sharing May Help States Realize Efficiencies.Report to Congressional Requesters. Website: http://www.gao.gov/cgi-bin/getrpt?GAO-03-389
U.S. Department of Education (2005). Education for the Disadvantaged--Grants to Local Education Agencies, Improving the Academic Achievement of theDisadvantaged (Title I, ESEA), Title I. Website: http://web99.ed.gov/GTEP/Program2.nsf/0/70eb1e6490cc838b852563bc00540507?OpenDocument

34
Part IV: Context & Content
Government Sector
Historical ContextThe historical context surrounding the development of NCLB is discussed in Part I of this paper. NCLB was the product of the movement to increase the
federal government’s role in public education (from the 1965 ESEA) and the movement to hold schools accountable for measurable results (partly from America2000 and Goals 2000). NCLB was influenced by the context under which it was developed; it also has influenced the current political context regarding publiceducation. For example, Conservative Republicans, who once moved to abolish the federal Department of Education, now support NCLB and the increasedfederal spending it requires. Liberal organizations, such as the National Education Association, that once supported any increase in federal education spendingnow, in an effort to eliminate the accountability provisions under NCLB, are champions for state rights (declaring that NCLB is a federal intrusion on publiceducation).
Government RolesThe roles of the federal government, the states, and school districts are discussed in Part II of this paper. NCLB is a federally funded mandate that states
must implement (In Iowa, much of the implementation has been left to individual school districts). The controversy arises over whether or not NCLB is an“unfunded mandate.”
Many states and individual educators have declared NCLB to be an unfunded mandate. Wisconsin Attorney General Peg Lautenschlager issued a legalopinion in May of 2004 questioning the federal government’s right to mandate accountability provisions without fully funding them. The challenge was due to aprovision in NCLB stating the federal government cannot “mandate a state to spend any costs not paid for under this act.” Lautenschlager concluded that to meetthe mandates under NCLB, the state of Wisconsin would require an additional $2.5 billion in total expenditures (Lautenschlager, 2004). A report released by thePublic Agenda organization found that 89% of superintendents and 88% of public school principals call NCLB an “unfunded mandate” (Public Agenda, 2003).The bipartisan National Governors Association voted unanimously in 2003 to declare NCLB to be an “unfunded mandate” (Willen, 2003).
Other sources have declared that NCLB is neither unfunded nor a mandate. The General Accounting Office found that NCLB is not an “unfundedmandate” under the specific legal definition found in the Unfunded Mandates Reform Act of 1995 (URMA). The GAO concluded that since states are under noobligation to accept federal education funds, NCLB is not a mandate (United States General Accounting Office, 2004). Another study conducted by theEducation Leaders Council found that NCLB was not an unfunded mandate and that states would actually receive a $787 million surplus in federal educationfunds from 2004 to 2005 (Education Leaders Council, 2004). A 2004 report from the U.S. Department of Education’s Budget Services Office backs up thisclaim, declaring that states are “sitting on more than $10 billion in federal education funding appropriated between FY 2000 and FY 2003 (U.S. Department ofEducation, 2004).
While NCLB is technically not an unfunded mandate, as defined by the GAO, the majority of stakeholders seem to believe it is under-funded. This andthe public opinion poll data discussed on page 32 seem to indicate the majority of Americans are generally against NCLB. It’s worthwhile to consider what wentwrong with the development and/or implementation of NCLB.
What’s Gone WrongOne of the major faults of NCLB is in its timing. While NCLB was being developed, the federal government was running a surplus. When economic
issues, the threat of terrorism, and the Iraq War caused the government to run a deficit, the high cost of NCLB had to be justified. Another fault of NCLB lies inits lack of attention to details. By allowing states to define important terms such as “proficiency” and “adequate yearly progress” and by not specifying exactly

35
how disabled students should be included in accountability provisions, NCLB was open for interpretation and, therefore, criticism. The third fault is that whileNCLB does provide enough funding for tests and accountability provisions, it does not provide enough funding for states and schools to improve their educationalsystems. This means that states will have enough money to determine that their schools need improvement, but they will not have enough money to makeimprovements. The final fault of NCLB is that it is tied to the George W. Bush administration, which is a favorite target of criticism from liberal organizationssuch as the National Education Association.
Market/Private Sectors
NCLB has provided two main opportunities for the market and private sectors. First, test publishers have had opportunities to win contracts to developstate assessment systems. This paper has already discussed how Iowa Testing Programs was awarded the contract to ensure the technical adequacy of districtdeveloped assessment systems in the state of Iowa. Measured Progress is another organization that has profited from NCLB’s testing requirements.
Measured Progress, a for-profit company established in 1983, reorganized into a 501(c)3 not-for-profit organization after NCLB was signed into law.Instead of taking the path of the test developers (developing and selling tests to the states), Measured Progress became a test consultant for more than half of allstates. Measured Progress assists states in setting AYP goals and dealing with specific testing issues, such as the testing of special education students.
The other opportunity for the market and private sectors is in providing supplemental services. As discussed earlier, schools that fail to make AYP for 3or more years must provide supplemental services to their students. Private for-profit, not-for-profit, and public organizations have already applied to becomeauthorized supplemental service providers. The following list displays the authorized supplemental service providers in the state of Iowa as of 1/10/2005:
Supplemental Service Providers in Iowa (Source: http://www.state.ia.us/educate/ecese/asis/ibp/sesp/ )Beyond the Bell After School Program – Sioux CityDavenport Community Schools 21st Century Community Learning CenterDubuque Community School DistrictEduCare Learning Centers, Inc.Education Station, A Sylvan PartnershipFailure Free ReadingFreedom of Speech, Inc.Kumon North America, Inc.LightspanLindamood-Bell Learning ProcessesSusan SeidenfeldVoyager Expanded LearningWaterloo Community Schools Supplemental Educational Services (In cooperation with Gear-Up through the University of Northern Iowa)
Another, admittedly unexpected, opportunity for the private and market sectors has been in promoting NCLB to the public. In January of 2005, the USAToday discovered that radio host Armstrong Williams was paid $240,000 to “regularly comment on NCLB” during his radio broadcast and to interview Secretaryof Education Rod Paige for radio spots airing in 2004. This agreement was part of a $1 million deal the U.S. Department of Education made with the Ketchumpublic relations firm to promote NCLB through video “news releases” designed to look like news reports (Toggo, 2005). This scandal served to further solidifyopposition to the NCLB legislation.

36
Summary
This paper has discussed how various policy entrepreneurs (mainly think tanks and politicians) and issues (the role of the federal government in publiceducation, school choice, vouchers, assessment, and accountability) came together to shape No Child Left Behind. To summarize the evolution of NCLB, thefollowing policy map is presented:
CONTEXT POLICYMAKING PROCESSPRODUCTION
LEVEL SECTOR
INPUTSProblemsSolutions
IssuesAuthority Agency Program Rule Contract Budget
OUTPUTSBenefitsBurdens
Target Group
OUTCOMESObjectives
ImpactsConditions
Government
Market
Civil National
Private
Government
Market
CivilState
Private
Government
Market
Civil
Local
Private

37
Beginning at the top-left of the map…
1. The federal government defines the problem of declining student achievement in America through its 1983 A Nation At Risk report. The report recommendsthat standards be developed. State governors working with at a federal government level provide further possible solutions through the 1989 NationalEducation Summit, America 2000,and Goals 2000. The 1994 Improving America’s Schools Act sets the stage for testing requirements and accountabilitysystems.
2. States, Texas in particular, find testing and accountability improve student achievement. The civil sector also provides possible solutions to the educationalcrisis through Andrew Rotherham’s influential white paper in 1999.
3. Some authority for overseeing public education is granted to the U.S. Department of Education when it was created in 1979. Through subsequentreauthorizations of the Elementary and Secondary Education Act, that authority increases.
4. Influenced heavily by think tanks and state experiences, the federal government develops and passes the NCLB legislation on January 8, 2002. Thelegislation creates programs and rules, but requires states to develop many of their own rules (through each state’s Department of Education). In Iowa, thestate-developed rules require local school districts to develop rules.
5. NCLB provides federal grants to states. States contract with organizations in the private sector in developing and implementing their accountability systems.
6. These contracts and grants set budgets. The federal budget influences state budgets which, in turn, influence local school district budgets.
7. The program rules provide outputs to states, schools, and the civil sector. The primary outputs are: reporting requirements, sanctions, awards, andinformation (test scores and raw data used for research).
8. Organizations and individuals consume many of the outputs (state and school report cards). This information yields outcomes, including public schoolchoice.
9. Outcomes, such public attitudes towards NCLB and the list of schools in need of improvement, lead to modifications in NCLB rules (such as changes in thetesting requirements for limited English proficiency students). In this way, outcomes of NCLB become inputs to further refine NCLB rules.

38
Sources Cited:
Boehner, J. (2004). No Child Left Behind is Funded. House Education & the Workforce Committee Fact Sheet, Oct. 7, 2004.Website: http://edworkforce.house.gov/issues/108th/recess/nclbfunded.htm
Education Leaders Council (2004). NCLB Under a Microscope: A Cost Analysis of the Fiscal Impact of the No Child Left Behind Act of 2001 on States andLocal Education Agencies, January 2004. Website: http://www.educationleaders.org/elc/events/elc_cost_study-04.pdf
Lautenschlager, P. (2004). Letter to Wisconsin Senator Fred Risser, May 12, 2004.Website: http://www.thompson.com/libraries/education/common/reports/5-12-04-risser-letter.doc?VIRTUAL=risserletter
Public Agenda (2003). Rolling Up Their Sleeves: Superintendents and Principals Talk About What’s Needed to Fix Public Schools.Website: http://www.nsba.org/site/doc_sbn.asp?TRACKID=&VID=58&CID=1336&DID=32476
Toppo, G. (2005). Education Department Paid Commentator to Promote Law. USA Today, 1/7/2005.
Willen, L. (2003). Bush’s No Child Left Behind Education Plan Gets Failing Grades. Time Out From Testing.orgWebsite: http://www.timeoutfromtesting.org/0930_article_failing.php
United States General Accounting Office (2004). Unfunded Mandates: Analysis of Reform Act Coverage. Report to the Chairman, Subcommittee on Oversightof Government Management, the Federal Workforce, and the District of Columbia, Committee on Governmental Affairs, U.S. Senate, May 2004Website: http://www.gao.gov/new.items/d04637.pdf

39
Complete List of Sources
Azzam, A. (2004). NCLB: Up Close and Personal. Educational Leadership, 62(2).
Boehner, J. (2004). Boehner Challenges Conclusions of Phi Delta Kappa Poll on NCLB. News from the Committee on Education & the Workforce
Boehner, J. (2004). No Child Left Behind is Funded. House Education & the Workforce Committee Fact Sheet, Oct. 7, 2004.Website: http://edworkforce.house.gov/issues/108th/recess/nclbfunded.htm
Collender, S (1998). The Guide to the Federal Budget: Fiscal 1998
Consolidated State Application Accountability Workbook for State Grants under Title IX, Part C, Section 9302 of the Elementary and Secondary Education Act(Public Law 107-110) (2003)
Costrell, R. & Peyser, J. (2003). Exploring the Costs of Accountability. Education Next. Website: http://www.educationnext.org/20042/22.html
Delisio, E. (2002). No Child Left Behind: What It Means to You. Education World. Website: http://www.educationworld.com/a_issues/issues273.shtml
Education Commission of the States (2001). A Closer Look: State Policy Trends in Three Key Areas of the Bush Education Plan – Testing, Accountability, andSchool Choice. Website: http://www.ecs.org/
Education Leaders Council (2004). NCLB Under a Microscope: A Cost Analysis of the Fiscal Impact of the No Child Left Behind Act of 2001 on States andLocal Education Agencies, January 2004. Website: http://www.educationleaders.org/elc/events/elc_cost_study-04.pdf
Fairtest (2004). 3rd-Year NCLB Report Card for George W. Bush. National Center for Fairness in Testing.Website: http://fairtest.org/nattest/Year%20three%20Report%20Card.html
Grant Application (2002). Technical Assistance to Determine Quality of Alignment Of District-wide Assessment Measures. Iowa Department of Education
Harcourt Assessment Report (August 2003). History of No Child Left Behind Act of 2001.
Helms, L (2004). Case Study: Tracking the Fallout – No Child Left Behind. American Public Policymaking: Getting Results, pp. 16-30 – 16-31.
Iowa Association of School Boards (2003). IASB Compass, Volume VII, Number 1.
Lautenschlager, P. (2004). Letter to Wisconsin Senator Fred Risser, May 12, 2004.Website: http://www.thompson.com/libraries/education/common/reports/5-12-04-risser-letter.doc?VIRTUAL=risserletter
National Education Association (2004). NEA Recent Legislative History of ESEA/NCLB. Website: www.nea.org/lac/esea/eseahistory.html
National Education Association (2005). NCLB Testing Results Offer Complex, Muddled Picture: Emerging Trends Under the Law’s Annual Rating System.Website: http://www.nea.org/esea/ayptrends1104.html
Peterson, G (2004). The No Child Left Behind Act and its Influence on Current and Future District Leaders. Journal of Law and Education, July 2004.

40
Public Agenda (2003). Rolling Up Their Sleeves: Superintendents and Principals Talk About What’s Needed to Fix Public Schools.Website: http://www.nsba.org/site/doc_sbn.asp?TRACKID=&VID=58&CID=1336&DID=32476
Renner, E (2004). No Child Left Behind Act. Paper in Using Information Effectively in Education course,
Ritter, G. & Lucas, C. (2002). Estimations of Readiness for NCLB: Lessons Learned From State Education Officials. Education Next.Website: http://www.educationnext.org/unabridged/20034/54.pdf
Rose, L. & Gallup, A. (2004). 36th Annual Phi Delta Kappa/Gallup Poll of the Public’s Attitudes Towards Public Schools Online Edition.Website: http://www.pdkintl.org/kappan/k0409pol.htm
Rudalevige, Andrew (2003). The Politics of No Child Left Behind. Education Next. Hoover Institution.
State Assessment and Accountability Systems: 50 State Profiles (2000), Consortium for Policy Research in Education
Toppo, G. (2005). Education Department Paid Commentator to Promote Law. USA Today, 1/7/2005.
University of Iowa (2002). Education First College of Education Newsletter, November.
United States General Accounting Office (2004). Unfunded Mandates: Analysis of Reform Act Coverage. Report to the Chairman, Subcommittee on Oversightof Government Management, the Federal Workforce, and the District of Columbia, Committee on Governmental Affairs, U.S. Senate, May 2004Website: http://www.gao.gov/new.items/d04637.pdf
United States General Accounting Office (2003). Characteristics of Tests Will Influence Expenses; Information Sharing May Help States Realize Efficiencies.Report to Congressional Requesters. Website: http://www.gao.gov/cgi-bin/getrpt?GAO-03-389
U.S. Department of Education (April, 1983). A Nation At Risk. Website: www.ed.gov/pubs/NatAtRisk/index.html
U.S. Department of Education (1992). Ed Facts: Information About the U.S. Department of Education, Washington, DC: U.S. Government Printing Office.
U.S. Department of Education (1996). Background and brief history of the ESEA. Website: www.ed.gov/legislation/ESEA/Guidance/pt1.html
U.S. Department of Education (September, 2002). No Child Left Behind: A Desktop Reference. Website: www.ed.gov/offices/OESE/reference
U.S. Department of Education (2005). Budget Process in the U.S. Department of Education, Office of Management and Budget.Website: http://www.ed.gov/about/overview/budget/process.html?src=rt
U.S. Department of Education (2005). Education for the Disadvantaged--Grants to Local Education Agencies, Improving the Academic Achievement of theDisadvantaged (Title I, ESEA), Title I. Website: http://web99.ed.gov/GTEP/Program2.nsf/0/70eb1e6490cc838b852563bc00540507?OpenDocument
White House (2002). Transforming the Federal Role in Education
Willen, L. (2003). Bush’s No Child Left Behind Education Plan Gets Failing Grades. Time Out From Testing.orgWebsite: http://www.timeoutfromtesting.org/0930_article_failing.php
Young, Scott. (2004) No Child Left Behind Act Accountability & AYP. National Conference of State Legislatures.Website: www.ncsl.org/programs/educ/NCLBHistory.htm