Case Studies and Skills Revision Guide - Cantell School
37
1 GCSE Case Studies and Skills Revision Guide Examination Year of 2020 Name . . OCR Geography A Past papers http://www.ocr.org.uk/qualifications/gcse-geography-a- geographical-themes-j383-from-2016/assessment/
-
Upload
khangminh22 -
Category
Documents
-
view
2 -
download
0
Transcript of Case Studies and Skills Revision Guide - Cantell School

1
GCSE
Case Studies and Skills
Revision Guide
Examination Year of 2020
Name . .
OCR Geography A
Past papers
http://www.ocr.org.uk/qualifications/gcse-geography-a-geographical-themes-j383-from-2016/assessment/

2
Contents
Paper 1 Checklist: Unit 1: Landscapes of the UK ............................................................................ 3
Case Study - The River Severn ....................................................................................................... 4
Case Study - Isle of Purbeck, Swanage Bay.................................................................................... 6
Paper 1 Checklist – Unit 2: People of the UK.................................................................................. 7
Case Study – Urban Regeneration in Greenwich Peninsula, London .............................................. 8
Case Study - Southampton .............................................................................................................. 9
Paper 1 Checklist – Unit 3: Environmental Challenges ................................................................. 12
Case Study - Somerset Levels ....................................................................................................... 13
Paper 2 Checklist - Unit 1 – Ecosystems of the planet .................................................................. 15
Case Study - Peruvian Amazon Rainforest .................................................................................... 16
Case Study - Andros Barrier Reef .................................................................................................. 17
Paper 2 Checklist–Unit 2 – People of the Planet ........................................................................... 19
Case Study - Ethiopia .................................................................................................................... 20
Rio De Janeiro ............................................................................................................................... 22
Paper 2 Checklist – Unit 3 – Environmental threats to our planet .................................................. 24
Case Study - The Big Dry .............................................................................................................. 25
Paper 1 -3 Checklist – GEOGRAPHICAL SKILLS ........................................................................ 27
Paper 3 Checklist– FIELDWORK SKILLS ..................................................................................... 29
SECTION B .................................................................................................................................... 29
COMPONENT – GEOGRAPHICAL SKILLS SECTION Data Collection ........................................ 30
How to PRESENT data with the PROS and CONS ....................................................................... 31
....................................................................................................................................................... 33
Case Study – HUMAN Study – SOUTHAMPTON ......................................................................... 34
Case Study – PHYSICAL Study – SWANAGE .............................................................................. 35
Questions ....................................................................................................................................... 36
3
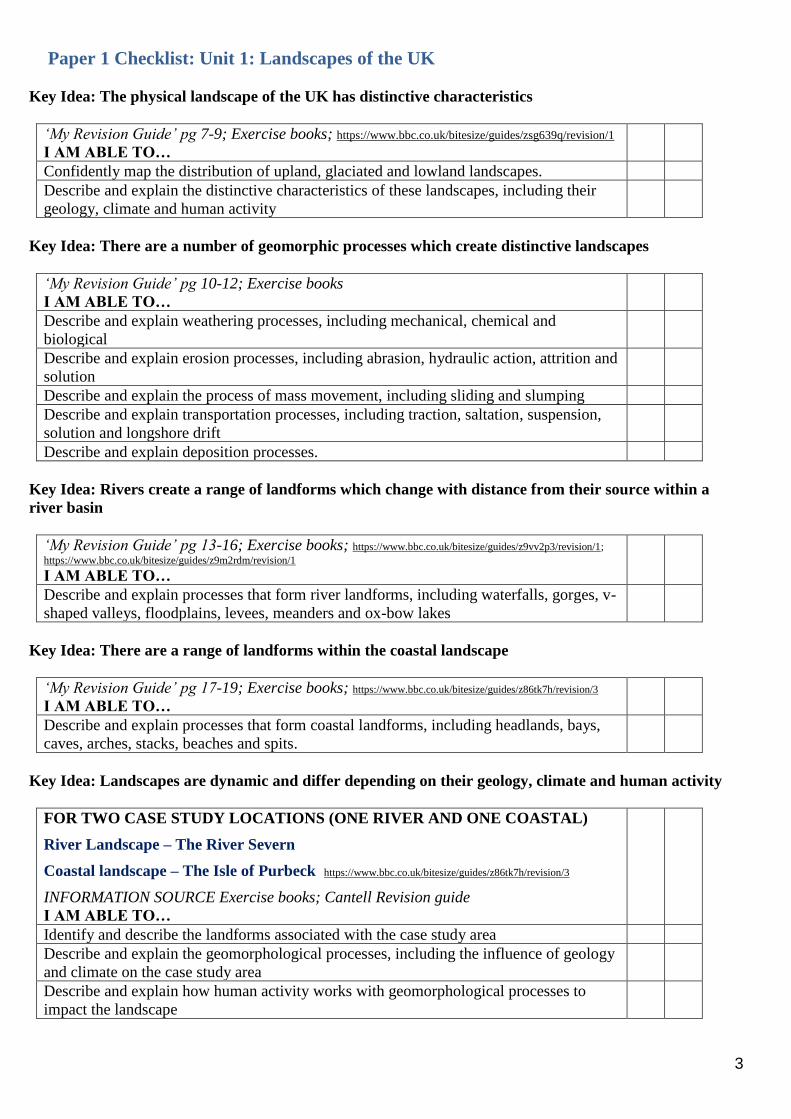
Paper 1 Checklist: Unit 1: Landscapes of the UK
Key Idea: The physical landscape of the UK has distinctive characteristics
‘My Revision Guide’ pg 7-9; Exercise books; https://www.bbc.co.uk/bitesize/guides/zsg639q/revision/1
I AM ABLE TO…
Confidently map the distribution of upland, glaciated and lowland landscapes.
Describe and explain the distinctive characteristics of these landscapes, including their
geology, climate and human activity
Key Idea: There are a number of geomorphic processes which create distinctive landscapes
‘My Revision Guide’ pg 10-12; Exercise books
I AM ABLE TO…
Describe and explain weathering processes, including mechanical, chemical and
biological
Describe and explain erosion processes, including abrasion, hydraulic action, attrition and
solution
Describe and explain the process of mass movement, including sliding and slumping
Describe and explain transportation processes, including traction, saltation, suspension,
solution and longshore drift
Describe and explain deposition processes.
Key Idea: Rivers create a range of landforms which change with distance from their source within a
river basin
‘My Revision Guide’ pg 13-16; Exercise books; https://www.bbc.co.uk/bitesize/guides/z9vv2p3/revision/1;
https://www.bbc.co.uk/bitesize/guides/z9m2rdm/revision/1
I AM ABLE TO…
Describe and explain processes that form river landforms, including waterfalls, gorges, v-
shaped valleys, floodplains, levees, meanders and ox-bow lakes
Key Idea: There are a range of landforms within the coastal landscape
‘My Revision Guide’ pg 17-19; Exercise books; https://www.bbc.co.uk/bitesize/guides/z86tk7h/revision/3
I AM ABLE TO…
Describe and explain processes that form coastal landforms, including headlands, bays,
caves, arches, stacks, beaches and spits.
Key Idea: Landscapes are dynamic and differ depending on their geology, climate and human activity
FOR TWO CASE STUDY LOCATIONS (ONE RIVER AND ONE COASTAL)
River Landscape – The River Severn
Coastal landscape – The Isle of Purbeck https://www.bbc.co.uk/bitesize/guides/z86tk7h/revision/3
INFORMATION SOURCE Exercise books; Cantell Revision guide
I AM ABLE TO…
Identify and describe the landforms associated with the case study area
Describe and explain the geomorphological processes, including the influence of geology
and climate on the case study area
Describe and explain how human activity works with geomorphological processes to
impact the landscape
4
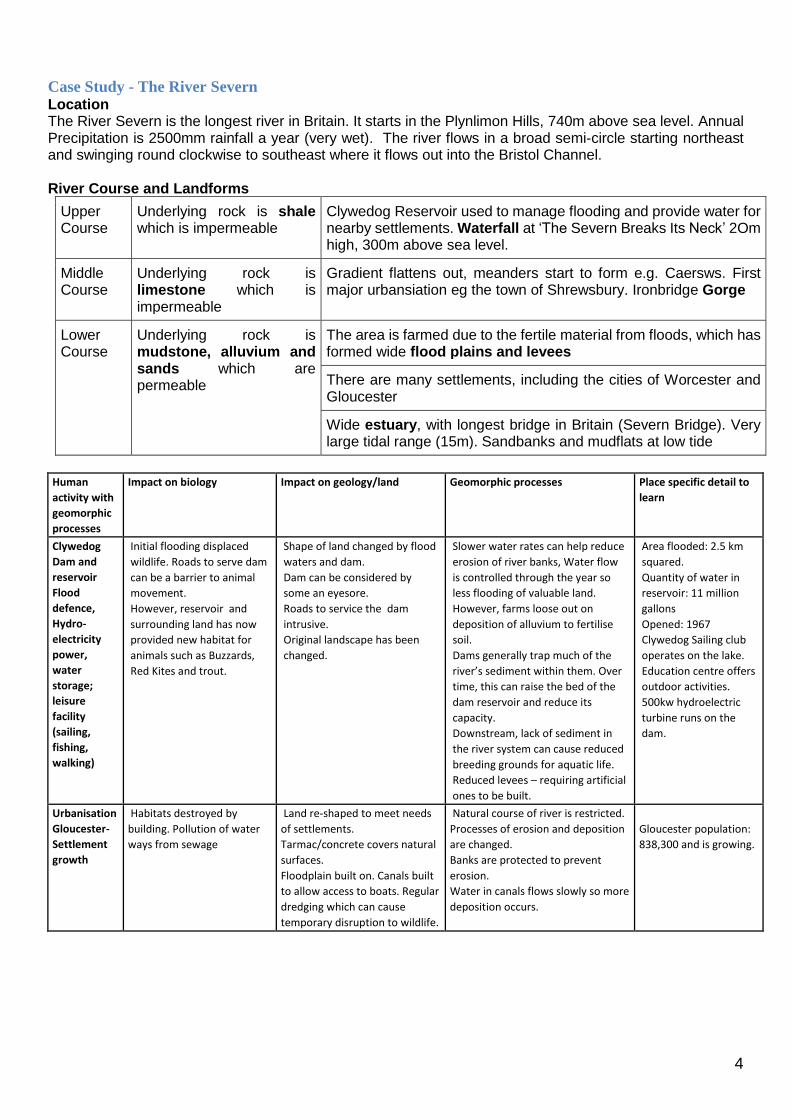
Case Study - The River Severn Location The River Severn is the longest river in Britain. It starts in the Plynlimon Hills, 740m above sea level. Annual Precipitation is 2500mm rainfall a year (very wet). The river flows in a broad semi-circle starting northeast and swinging round clockwise to southeast where it flows out into the Bristol Channel. River Course and Landforms
Upper Course
Underlying rock is shale which is impermeable
Clywedog Reservoir used to manage flooding and provide water for nearby settlements. Waterfall at ‘The Severn Breaks Its Neck’ 2Om high, 300m above sea level.
Middle Course
Underlying rock is limestone which is impermeable
Gradient flattens out, meanders start to form e.g. Caersws. First major urbansiation eg the town of Shrewsbury. Ironbridge Gorge
Lower Course
Underlying rock is mudstone, alluvium and sands which are permeable
The area is farmed due to the fertile material from floods, which has formed wide flood plains and levees
There are many settlements, including the cities of Worcester and Gloucester
Wide estuary, with longest bridge in Britain (Severn Bridge). Very large tidal range (15m). Sandbanks and mudflats at low tide
Human
activity with
geomorphic
processes
Impact on biology Impact on geology/land Geomorphic processes Place specific detail to
learn
Clywedog
Dam and
reservoir Flood
defence,
Hydro-
electricity
power,
water
storage;
leisure
facility
(sailing,
fishing,
walking)
Initial flooding displaced
wildlife. Roads to serve dam
can be a barrier to animal
movement. However, reservoir and
surrounding land has now
provided new habitat for
animals such as Buzzards,
Red Kites and trout.
Shape of land changed by flood
waters and dam. Dam can be considered by
some an eyesore. Roads to service the dam
intrusive. Original landscape has been
changed.
Slower water rates can help reduce
erosion of river banks, Water flow
is controlled through the year so
less flooding of valuable land.
However, farms loose out on
deposition of alluvium to fertilise
soil. Dams generally trap much of the
river’s sediment within them. Over
time, this can raise the bed of the
dam reservoir and reduce its
capacity. Downstream, lack of sediment in
the river system can cause reduced
breeding grounds for aquatic life.
Reduced levees – requiring artificial
ones to be built.
Area flooded: 2.5 km
squared. Quantity of water in
reservoir: 11 million
gallons Opened: 1967 Clywedog Sailing club
operates on the lake. Education centre offers
outdoor activities. 500kw hydroelectric
turbine runs on the
dam.
Urbanisation
Gloucester- Settlement
growth
Habitats destroyed by
building. Pollution of water
ways from sewage
Land re-shaped to meet needs
of settlements. Tarmac/concrete covers natural
surfaces. Floodplain built on. Canals built
to allow access to boats. Regular
dredging which can cause
temporary disruption to wildlife.
Natural course of river is restricted.
Processes of erosion and deposition
are changed. Banks are protected to prevent
erosion. Water in canals flows slowly so more
deposition occurs.
Gloucester population: 838,300 and is growing.
5
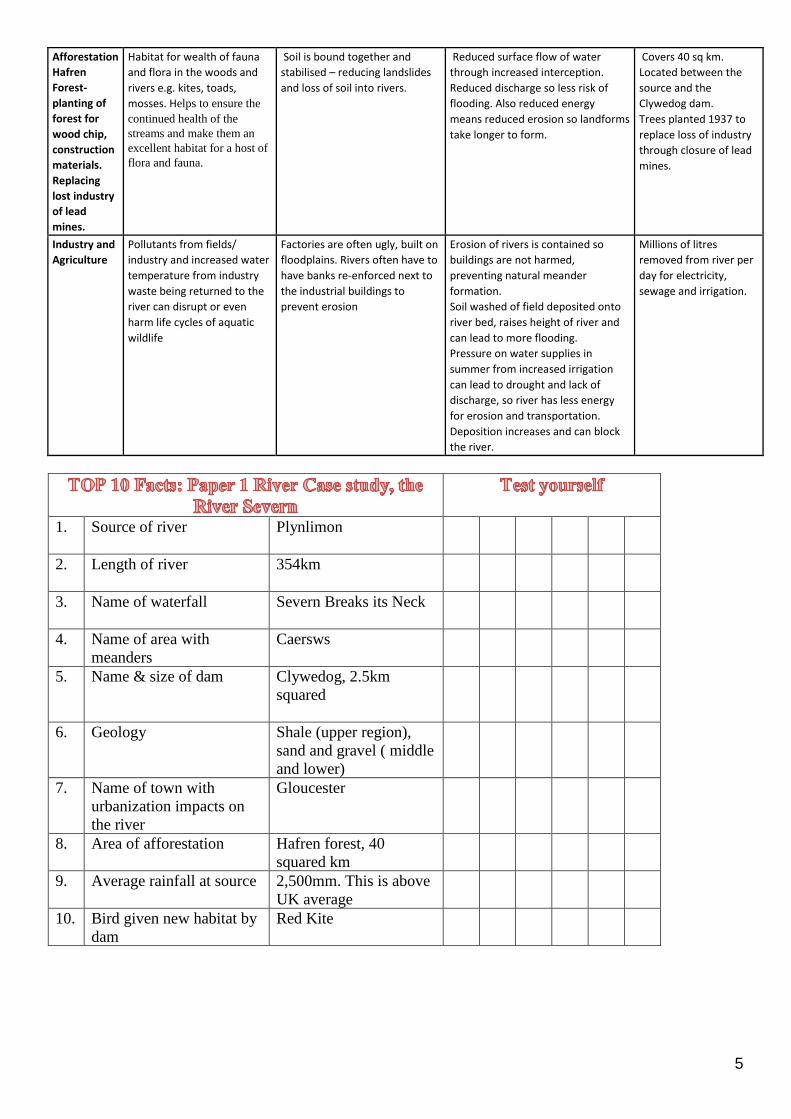
Afforestation Hafren
Forest-
planting of
forest for
wood chip,
construction
materials.
Replacing
lost industry
of lead
mines.
Habitat for wealth of fauna
and flora in the woods and
rivers e.g. kites, toads,
mosses. Helps to ensure the
continued health of the
streams and make them an
excellent habitat for a host of
flora and fauna.
Soil is bound together and
stabilised – reducing landslides
and loss of soil into rivers.
Reduced surface flow of water
through increased interception. Reduced discharge so less risk of
flooding. Also reduced energy
means reduced erosion so landforms
take longer to form.
Covers 40 sq km. Located between the
source and the
Clywedog dam. Trees planted 1937 to
replace loss of industry
through closure of lead
mines.
Industry and
Agriculture
Pollutants from fields/
industry and increased water
temperature from industry
waste being returned to the
river can disrupt or even
harm life cycles of aquatic
wildlife
Factories are often ugly, built on
floodplains. Rivers often have to
have banks re-enforced next to
the industrial buildings to
prevent erosion
Erosion of rivers is contained so
buildings are not harmed,
preventing natural meander
formation.
Soil washed of field deposited onto
river bed, raises height of river and
can lead to more flooding.
Pressure on water supplies in
summer from increased irrigation
can lead to drought and lack of
discharge, so river has less energy
for erosion and transportation.
Deposition increases and can block
the river.
Millions of litres
removed from river per
day for electricity,
sewage and irrigation.
1. Source of river Plynlimon
2. Length of river 354km
3. Name of waterfall Severn Breaks its Neck
4. Name of area with
meanders
Caersws
5. Name & size of dam Clywedog, 2.5km
squared
6. Geology Shale (upper region),
sand and gravel ( middle
and lower)
7. Name of town with
urbanization impacts on
the river
Gloucester
8. Area of afforestation Hafren forest, 40
squared km
9. Average rainfall at source 2,500mm. This is above
UK average
10. Bird given new habitat by
dam
Red Kite

6
Case Study - Isle of Purbeck, Swanage Bay
What are the landforms? The area is known as the Isle of Purbeck, even though it is not an island. It is an area that is distinctive because 3 bands of different rock type alternating to form a discordant coastline, resulting in a range of distinct landforms.
• Swanage Bay itself is Clay, a soft rock that is easily eroded. This has created a bay between two headlands to the north and south, and a sandy beach.
• To the North is a band of Chalk, a hard rock that does not erode easily. This has led to the formation of stacks on the end of the headland at Ballard Point, known as ‘Old Harry Rocks’.
• To the south is another band of hard rock, this time Limestone, which does not erode easily. This has led to the formation of another headland (Durlston Head)
Why protect the coastline?
• It is an important tourist hub, the beach is sheltered and clean (European Blue Flag awards), safe for children so popular with families. The beach is one of the main attractions of the town
• Important businesses, such as the Grand Hotel, were at risk of falling into the sea.
• The coastline around the bay is internationally important (dinosaur fossils are sometimes found) Human Sea Defences
• £2.2 million spent on groynes and beach replenishment
• In 2005, 18 wooden groynes were installed along the beach
• IN 2006, 90,000 cubic metres of sand was deposited on the beach. This will need to be added to every 20 years with another 20,000 cubic metres taken from nearby Poole Harbour.
• Sea wall along the back of the beach, stretching from the town in the southern part of the bay to the sand and clay cliffs at the northern end.
• Cliff regrading and stabilization to reduce angle and increases stability Success/Sustainability of the defences
• Mixed success – no major erosion or collapses since 2005 but in 2012, heavy rain led to a number of sections of cliff collapsing onto the beach and sea wall
• Emergency cliff stabilization was carried out, which included 350 soil nails (12m long steel bars driven into the cliff and cemented in place)
• Increased security for local residents – socially sustainable
• Economically sensible, as tourism is a major boost to the economy – economically sustainable
• Material dredged from local Poole Harbour, so minimal transport costs of beach replenishment – environmentally sustainable
• The groynes cause sediment starvation to the north of Swanage Bay
1. Three bands of rock Chalk, clay, limestone
2. Number of timber groynes replaced in 2005 18
3. Beach replenished with how much sand? 90,000 cubic meters
4. Cost of management schemes £2.2m
5. Location where sand was taken from Poole Harbour
6. Fine for sewage leak into bay £975,000
7. Rare orchid growing on chalk headland and
sewage roof
Spider Orchid
8. Length of bay with management works 1.8km
9. Flag awarded for clean beach status Blue flag
10. Name of headland and stack Ballard point and Old Harry

7
Paper 1 Checklist – Unit 2: People of the UK
Key Idea: The UK is connected to many other countries and places.
‘My Revision Guide’ pg 25-26; Exercise books
I AM ABLE TO…
Give an overview of who the UK trades with.
Define the terms export and import.
Key Idea: The UK is a diverse and unequal society which has geographical patterns.
‘My Revision Guide’ pg 27-30; Exercise books
I AM ABLE TO…
Describe and explain the UK’s patterns of diversity including – employment, income, life
expectancy, educational attainment, ethnicity and access to broadband.
Key Idea: There are different causes and consequences of development within the UK.
Plus - Case study of the consequences of economic growth and/or decline for the Greenwich Peninsula. ‘My Revision Guide’ pg 31-34; Exercise books; Cantell Revision Guide; https://www.bbc.co.uk/bitesize/guides/zqhvmnb/revision/1
I AM ABLE TO…
Describe and explain the causes of uneven development including geographical location,
economic change, infrastructure and government policy.
Case study - With reference to the Greenwich Peninsula case study – describe and explain
the consequences of economic decline and growth.
Key Idea: The UK’s population is changing.
‘My Revision Guide’ pg 37-45; Exercise books; https://www.bbc.co.uk/bitesize/guides/z334nbk/revision/4
I AM ABLE TO…
Describe and explain how the UK’s population has changed and link this to the
demographic transition model.
Describe and explain the causes, effects and responses to an aging population.
Outline flows of migration to the UK and give an overview of the social and economic
impacts.
Key Idea: There are causes for and consequences of urban trends in the UK.
‘My Revision Guide’ pg 46-47; Exercise books
I AM ABLE TO…
Give an overview of the urban trends in the UK including suburbanisation, counter-
urbanisation and re-urbanisation.
Outline the social, economic and environmental consequences of these trends.
Key Idea: Cities have distinct challenges and ways of life, influenced by their people, culture and
geography – Southampton case study.
Southampton Booklet; Exercise books; Cantell Revision Guide
I AM ABLE TO…
Describe the location and influences of Southampton from regional to global scale and
explain the impact on its growth and character – ways of life / culture / ethnicity / housing
/ leisure.
Describe and explain the contemporary challenges facing Southampton including
housing, transport and waste management.
Describe and explain the sustainable strategies in place to overcome the challenges.
8
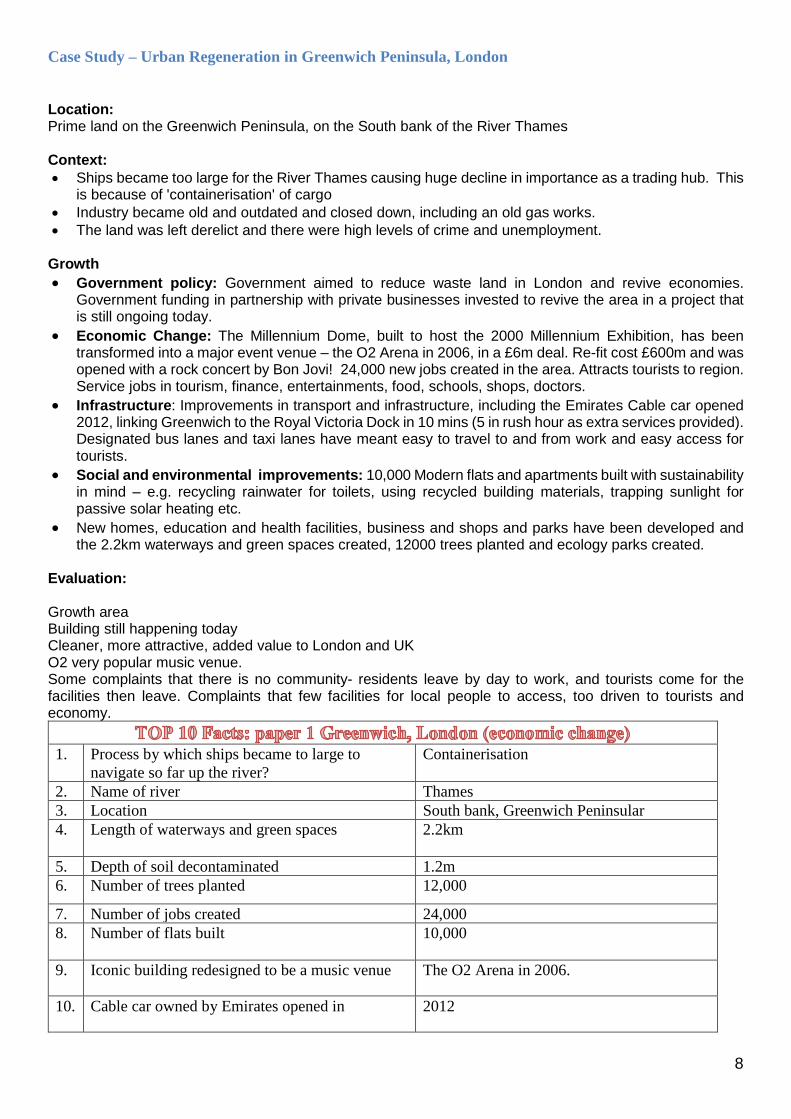
Case Study – Urban Regeneration in Greenwich Peninsula, London
Location: Prime land on the Greenwich Peninsula, on the South bank of the River Thames Context:
• Ships became too large for the River Thames causing huge decline in importance as a trading hub. This is because of 'containerisation' of cargo
• Industry became old and outdated and closed down, including an old gas works.
• The land was left derelict and there were high levels of crime and unemployment. Growth
• Government policy: Government aimed to reduce waste land in London and revive economies. Government funding in partnership with private businesses invested to revive the area in a project that is still ongoing today.
• Economic Change: The Millennium Dome, built to host the 2000 Millennium Exhibition, has been transformed into a major event venue – the O2 Arena in 2006, in a £6m deal. Re-fit cost £600m and was opened with a rock concert by Bon Jovi! 24,000 new jobs created in the area. Attracts tourists to region. Service jobs in tourism, finance, entertainments, food, schools, shops, doctors.
• Infrastructure: Improvements in transport and infrastructure, including the Emirates Cable car opened 2012, linking Greenwich to the Royal Victoria Dock in 10 mins (5 in rush hour as extra services provided). Designated bus lanes and taxi lanes have meant easy to travel to and from work and easy access for tourists.
• Social and environmental improvements: 10,000 Modern flats and apartments built with sustainability in mind – e.g. recycling rainwater for toilets, using recycled building materials, trapping sunlight for passive solar heating etc.
• New homes, education and health facilities, business and shops and parks have been developed and the 2.2km waterways and green spaces created, 12000 trees planted and ecology parks created.
Evaluation: Growth area Building still happening today Cleaner, more attractive, added value to London and UK O2 very popular music venue. Some complaints that there is no community- residents leave by day to work, and tourists come for the facilities then leave. Complaints that few facilities for local people to access, too driven to tourists and economy.
1. Process by which ships became to large to
navigate so far up the river?
Containerisation
2. Name of river Thames
3. Location South bank, Greenwich Peninsular
4. Length of waterways and green spaces 2.2km
5. Depth of soil decontaminated 1.2m
6. Number of trees planted 12,000
7. Number of jobs created 24,000
8. Number of flats built 10,000
9. Iconic building redesigned to be a music venue The O2 Arena in 2006.
10. Cable car owned by Emirates opened in 2012
9
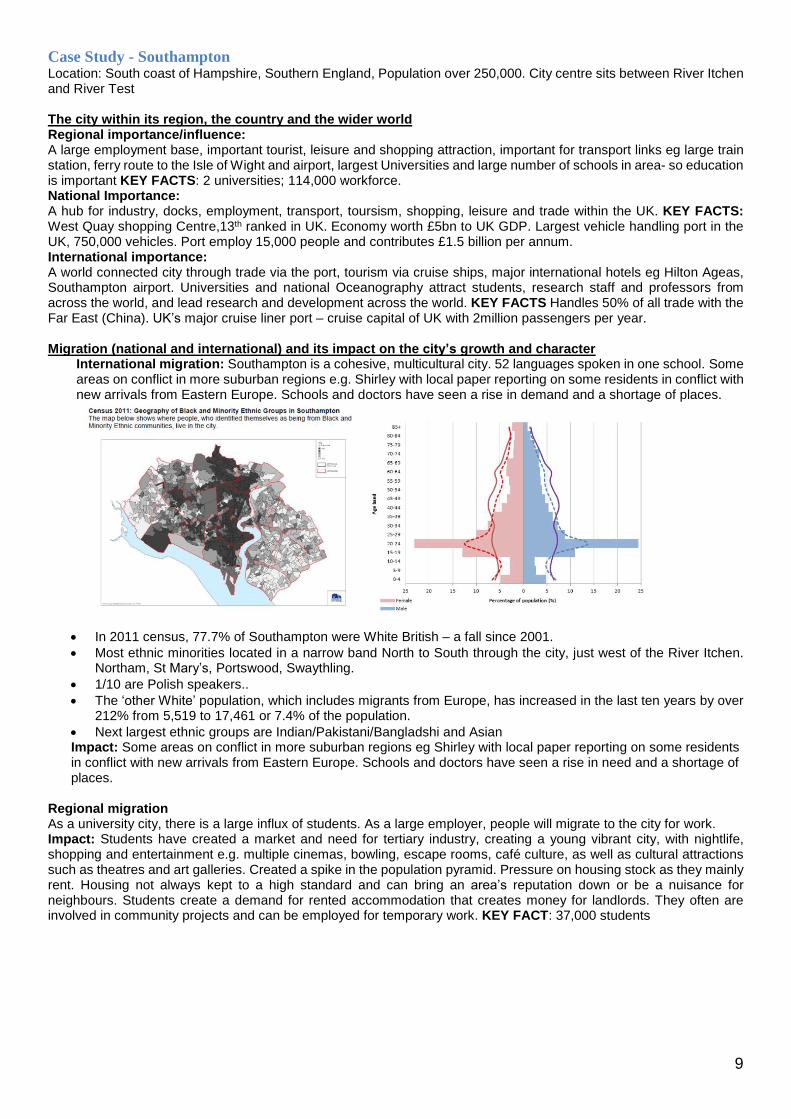
Case Study - Southampton Location: South coast of Hampshire, Southern England, Population over 250,000. City centre sits between River Itchen and River Test The city within its region, the country and the wider world Regional importance/influence: A large employment base, important tourist, leisure and shopping attraction, important for transport links eg large train station, ferry route to the Isle of Wight and airport, largest Universities and large number of schools in area- so education is important KEY FACTS: 2 universities; 114,000 workforce. National Importance: A hub for industry, docks, employment, transport, toursism, shopping, leisure and trade within the UK. KEY FACTS: West Quay shopping Centre,13th ranked in UK. Economy worth £5bn to UK GDP. Largest vehicle handling port in the UK, 750,000 vehicles. Port employ 15,000 people and contributes £1.5 billion per annum. International importance: A world connected city through trade via the port, tourism via cruise ships, major international hotels eg Hilton Ageas, Southampton airport. Universities and national Oceanography attract students, research staff and professors from across the world, and lead research and development across the world. KEY FACTS Handles 50% of all trade with the Far East (China). UK’s major cruise liner port – cruise capital of UK with 2million passengers per year. Migration (national and international) and its impact on the city’s growth and character
International migration: Southampton is a cohesive, multicultural city. 52 languages spoken in one school. Some areas on conflict in more suburban regions e.g. Shirley with local paper reporting on some residents in conflict with new arrivals from Eastern Europe. Schools and doctors have seen a rise in demand and a shortage of places.
• In 2011 census, 77.7% of Southampton were White British – a fall since 2001.
• Most ethnic minorities located in a narrow band North to South through the city, just west of the River Itchen. Northam, St Mary’s, Portswood, Swaythling.
• 1/10 are Polish speakers..
• The ‘other White’ population, which includes migrants from Europe, has increased in the last ten years by over 212% from 5,519 to 17,461 or 7.4% of the population.
• Next largest ethnic groups are Indian/Pakistani/Bangladshi and Asian Impact: Some areas on conflict in more suburban regions eg Shirley with local paper reporting on some residents in conflict with new arrivals from Eastern Europe. Schools and doctors have seen a rise in need and a shortage of places.
Regional migration As a university city, there is a large influx of students. As a large employer, people will migrate to the city for work. Impact: Students have created a market and need for tertiary industry, creating a young vibrant city, with nightlife, shopping and entertainment e.g. multiple cinemas, bowling, escape rooms, café culture, as well as cultural attractions such as theatres and art galleries. Created a spike in the population pyramid. Pressure on housing stock as they mainly rent. Housing not always kept to a high standard and can bring an area’s reputation down or be a nuisance for neighbours. Students create a demand for rented accommodation that creates money for landlords. They often are involved in community projects and can be employed for temporary work. KEY FACT: 37,000 students

10
The ways of life within the city add your own knowledge too! CULTURE: Premier League football, Mayflower Theatre, Museums, Art Galleries, the Cultural Quarter, religious and music festivals in the parks (e.g. Common People), celebrations across religions, religions of all sorts are represented – Catholic, Buddhist, Muslim, Sikh, Christina, Chinese Christian Churches, Quakers... ETHNICITY – see migration & culture HOUSING- see challenges. Mix of housing – inner city Terraced housing eg St. Mary’s, new flats e.g. replacing East Street Car park, Suburbs with semi and detached housing eg Bassett, student accommodation, retirement homes. LEISURE AND CONSUMPTION (shopping) Close to New Forest National Park; major festivals e.g. Common People; Shopping eg West Quay and New West Quay south ranked 13th in UK; multiple cinemas, bars and restaurants; bowling; escape rooms; historic attractions e.g. the Walls, Tudor House, SeaCity Museum; Swimming- The Quays with an Olympic size diving and swimming pool. CityRide, an annual cycle event Southampton marathon, each attract around 12,000 people. Contemporary challenges that affect urban change, including housing availability, transport provision and waste management Challenges Over the next two decades, almost 19,000 new homes, 210,000m² of employment space and significant retail and leisure development is required. This could lead to 18% more people wanting to come into the city centre. Housing provision: Average salaries below National Average. 7000 household on waiting list for council accommodation. Transitional student populations reduces sense of community in some areas. Rented accommodation needed for students, but is often low quality and poorly maintained housing stock. As with the rest of the nation, more starter homes are needed for first time buyers. Key challenge: growing population – especially of young people through reurbanisation – challenge is the provision of quality and quantity of affordable housing. Waste Management: Recycling rates lower than national average. 30,000 tonnes of waste is recycled, the rest is incinerated or landfilled. Much of waste either goes to landfill, or to the Hythe incinerator, where the burnt rubbish produces electricity. Some concerns of the adding to air pollution from the fumes. Fly-tipping often occurs. New 2 bin systems to increase recycling but was initially unpopular with residents, as many inner city houses do not have the space for 2 bins. Fears of attracting pests. Key Challenge: A growing city, but waste production must decrease and recycling must increase. Transport: Due to the rivers, Southampton has many bridging points which pinch traffic and cause severe congestion. Physical barriers so a challenge to increase road capacity. City becomes congested at peak times (8-9am, 5-6pm), 110 early deaths a year from atmospheric pollution, 9 Air Quality Management Areas (AQMAs) where air quality is very poor. Encircled by M27 motorway. 2 million cruise passengers each year and growing, 50% of international UK trade with China, Premier League football stadium, 13th largest shopping centre- all these economic growth areas encourage more traffic into the city centre, creating more congestion. The key challenge is for a sustainable city that can grow economically and provide jobs, , yet not harm the health and environment of the city’s population.
Sustainable strategies to overcome one of the city’s challenges: Transport Provision
• CityMaster Plan
• Access Hierarchy used to restrict access of private vehicles to city centre.
• Redevelopment of train station to encourage more people to arrive by train, not car.
• Public transport encouraged with use of bus and taxi lanes.
• Improvement of road networks, especially those leading to the docks and cruise terminals
• Increasing height of bridges so freight can move from lorries to trains, to reduce air pollution and traffic
• Bike hire to encourage cycling around city, less pollution and congestion.
• Provision of subway network to allow pedestrian access.
• Upgrading of M27 to create Smart motorway – but concerns over how safe it will be with increasing fatalities on similar schemes across the country
• Southampton Cycling strategy: New upgrading of cycle routes- 10 year strategy begun in 2017, to create a network of cycle paths to link the city.
• 4.8% of journeys in Southampton are made by bike – this is double the national average.
• https://transport.southampton.gov.uk/connected-southampton-2040/southampton-cycle-network/
• https://transport.southampton.gov.uk/media/1089/cycling-southampton-2017-2027-final.pdf

11
1. Population 250,000
2. % white British 77%
3. Proportion speaking
polish
1/10
4. Number of early deaths
per year due to air
pollution
110
5. Number of students
needing housing?
37,500
6. West Quay national
ranking
13th
7. Value of ports 15,000 jobs, £1.5bn/yr
8. Cruise capital of UK
handling how many
people
2m passengers/year
9. Number of households on
council waiting list?
7000
10. 30,000 tonnes of rubbish
recycled. How does this
compare?
Below UK average
12
Paper 1 Checklist – Unit 3: Environmental Challenges
Key Ideas: The UK has a unique climate for its latitude which can create extreme weather conditions.
Extreme flood hazard events are becoming more commonplace in the UK.
‘My Revision Guide’ pg 50-52; Exercise books
I AM ABLE TO…
Describe how air masses, the North Atlantic drift, prevailing winds and continentality
influence weather in the UK.
Describe how different air masses cause extreme weather events in the UK.
Key Ideas: Case study on flooding – Somerset Levels
‘My Revision Guide’ pg53-54; Exercise books, Cantell Revision Guide; https://geogteacher.files.wordpress.com/2016/11/gactive-somerset-levels-up-to-q5.pdf I AM ABLE TO…
Explain the causes, effects and management of the Somerset Levels flood event.
Key Idea: Humans use, modify and change ecosystems and environments to obtain food, energy and
water.
‘My Revision Guide’ pg 55-56; Exercise books
I AM ABLE TO…
Explain how environments and ecosystems in the UK are used and modified by humans to...
...provide food by the mechanisation of farming and commercial fishing.
... provide energy by wind power and fracking.
... provide water by creating reservoirs and transferring water.
Key Idea: There are a range of energy sources available to the UK.
‘My Revision Guide’ pg 57-58; Exercise books; https://www.bbc.co.uk/bitesize/guides/zxhnwxs/revision/1
I AM ABLE TO…
Describe the difference between renewable and non-renewable energy sources and give
examples.
Explain how renewable and non-renewable energy sources contribute to the energy
supply of the UK.
Key Idea: Energy in the UK is affected by a large number of factors and requires careful management
and consideration of future supplies.
‘My Revision Guide’ pg 60-68; Exercise books
I AM ABLE TO…
Describe how energy supply and demand has changed in the UK from 1950 and how the
government and international organisations have influenced this.
Describe the strategies for sustainable use and supply of energy and evaluate their
success.
Describe the development of renewable energy in the UK and explain its impact on
people and the environment.
Evaluate the extent to which we should use non-renewable energy.
Explain the economic, political and environmental factors affecting UK energy supply in
the future.
13
Case Study - Somerset Levels January 2014. 65million m3 floodwater covered 65km2 Landscape • Previously covered by sea but drained in the 17th century for agriculture • Channels built to drain the marshes • Very low lying land, therefore vulnerable to both tidal flooding and storm
Causes Physical • Prolonged rain and tidal surges • Powerful jet stream drove low-pressure systems and their storms across the Atlantic • 12 major storms between mid-December 2013 and mid-February 2014 • Low lying land surrounded by hills. Human • River Parret has not been dredged for 20 years and was blocked. It used to be dredged every 5 years
costing £4m, which meant that the river could have been wider and deeper. • Farmers had warned the government it was required. • Building homes on the floodplain, some below sea level
Impacts Social • 600 homes affected, including villages cut off e.g. Muchelney • Roads inaccessible so journey times increased
Economic • Cost to Somerset between £82m and £147m • Livestock had to be moved or sold • Businesses lost trade
Environmental • Nearly 7000 hectares agricultural land under water for over a month • Natural England said there was little impact on the wildlife
Local Management Environment Agency • 62 pumps working 24 hours a day removed 1.5m tonnes of water • Pumps borrowed from the Netherlands
Emergency Support • Royal marines helped villages that had been cut off • Police increased patrols
Defences • Nearly 50 defences in need of repair, including embankments, pumps and coastal defences
Future • Dredging in River Parret occurred after the flood • Farmers will be paid to store flood water • Attempts to reduce run-off from housing developments
National Management • Government 20-year flood plan - Local strategies implemented and paid for by government. • Dredge more of the River Parret and River Thames • Repair damaged flood banks • Raise the road to Muchelney • Permanent pumps • Build a total barrier, similar to the Thames Barrier
14
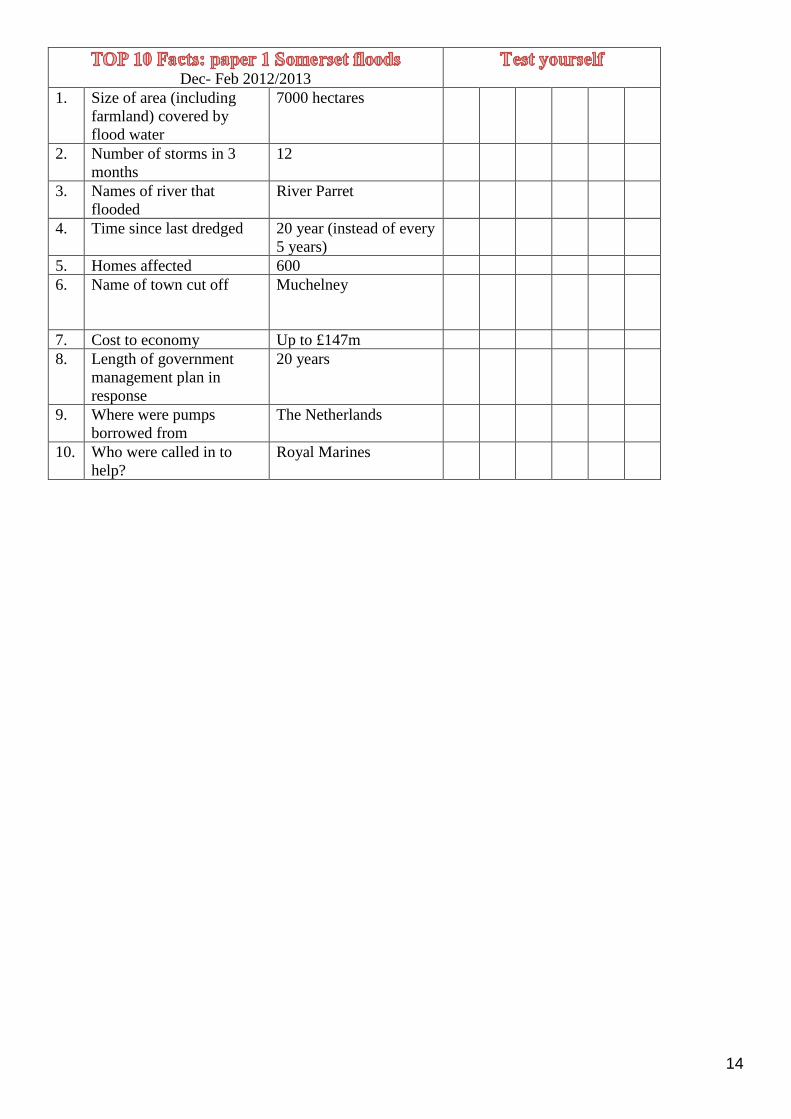
Dec- Feb 2012/2013
1. Size of area (including
farmland) covered by
flood water
7000 hectares
2. Number of storms in 3
months
12
3. Names of river that
flooded
River Parret
4. Time since last dredged 20 year (instead of every
5 years)
5. Homes affected 600
6. Name of town cut off Muchelney
7. Cost to economy Up to £147m
8. Length of government
management plan in
response
20 years
9. Where were pumps
borrowed from
The Netherlands
10. Who were called in to
help?
Royal Marines

15
Paper 2 Checklist - Unit 1 – Ecosystems of the planet
Key Idea: Ecosystems consist of interdependent components.
Ecosystems have distinct distributions and characteristics
‘My Revision Guide’ pg69-73; Exercise books; https://www.bbc.co.uk/bitesize/guides/z2ntk7h/revision/1;
https://www.bbc.co.uk/bitesize/topics/z638q6f I AM ABLE TO…
Describe and explain how ecosystems work using key terms – abiotic, biotic and
interdependent.
I can describe the location of the world’s main biomes and give an overview of their
climate, plants and animals.
Key Idea: Tropical Rainforests
There are major tropical rainforests in the world
Bio-diverse ecosystems are under threat from human activity.
‘My Revision Guide’ pg 74-75;78-79; Exercise books; Cantell Revision Guide;
https://www.bbc.co.uk/bitesize/guides/zpbfqty/revision/1
I AM ABLE TO…
Locate tropical rainforests including - the Amazon, Central America, Congo River Basin,
Madagascan, SE Asia and Australasian forests.
Describe and explain the processes that operate in tropical rainforests including nutrient
and water.
In relation to the case study of the Peruvian Rainforest I can describe and explain the
interdependence of the climate, soil, water, plants, animals and humans.
In relation to the case study of the Peruvian Rainforest I can explain the value of the
rainforest to humans and the planet.
In relation to the case study of the Peruvian Rainforest I can explain how people are
trying to manage the area sustainably.
Key Idea: Coral Reefs
There are major coral reefs in the world
Bio-diverse ecosystems are under threat from human activity.
‘My Revision Guide’ pg 76-77;80-81; Exercise books; Cantell Revision Guide
I AM ABLE TO…
Locate warm coral reefs including - the great Barrier reef, Red Sea Coral reef, Caledonia
Barrier reef, Mesoamerican Barrier Reef, Florida Reef and Andros Coral reef.
Describe and explain the nutrient cycle on reefs.
In relation to the case study of the Andros Barrier Reef I can describe and explain the
interdependence of the climate, soil, water, plants, animals and humans.
In relation to the case study of the Andros Barrier Reef I can explain the value of the
rainforest to humans and the planet.
In relation to the case study of the Andros Barrier Reef I can explain how people are
trying to manage the area sustainably.

16
Case Study - Peruvian Amazon Rainforest Covers 60% of Peru, has an average temperature of 28oC and annual rainfall of 2600mm. Interdependence
• Plants prevent soil erosion as their roots hold the soil together and the dense leaf coverage protects it from heavy rainfall and wind.
• Plants rely on bees and butterflies for pollination, the bees and the butterflies need the pollen for food: a symbiotic relationship.
• Harpy Eagles build nests in the highest emergent trees, to protect their young from predators
• Epiphytes grow on other plants to reach the sun but do not have roots so rely on the rainfall for water.
• Deforestation reduces CO2 absorption, which adds to the greenhouse effect and changes the climate. Value to Humans
• Timber comes from many valuable hardwood trees including Mahogany for furniture.
• There are valuable minerals such as oil, natural gas and gold.
• Fifteen hydro-electricity dams are planned to be constructed, for local consumption and to sell electricity to Brazil.
• The plants have medicinal qualities. Scientists believe plants can help cure cancer, help digestion and many more undiscovered properties.
• The Amazonian tribes live a sustainable life in the jungle.
Value to the Planet
• There is huge biodiversity: Peru has nearly 3000 known species of fauna, 16% which are endemic to Peru (only found there).
• The water cycle relies on the trees in the rainforests to give off water through transpiration, increasing humidity and rainfall. The climate is dryer when rainforests are cut down.
• The carbon cycle is reliant on the rainforests as the trees absorb CO2 when they photosynthesise and store a lot of carbon. If trees are cut down and burnt, the carbon is released into the atmosphere increasing the greenhouse effect.
Threats to Biodiversity
• The value of hardwood has led to extensive logging, of which 95% is unregulated and illegal.
• Carmisea natural gas project could earn Peru billions in exports and save it $4 billion for its own energy use. However, it is in one of the most bio diverse areas of the rainforest and the home of several tribes. It has already resulted in deforestation, water pollution and landslides.
• Gold mining the deposits in the rivers earns a lot of money, however huge machinery is required to extract it. Mercury is also used which is highly toxic and has damaged the water in the area, which poisoned local tribes.
• Agriculture uses the lowland areas, clearing them for farming cattle and soybeans.
• Fires used to clear the rainforest can burn out of control, wiping out large habitats and killing animals.
• Highways are being constructed including building a major road, the Trans-oceanic Highway, will cause deforestation for the space required. Fears it will also worsen illegal logging near the road.
Sustainable Management
• Management plans are required for all logging. However, there is so much illegal logging over a huge area so it is hard to police.
• Indigenous community reserves allow tribes to have ownership over their land and the extraction of materials. They have sustainable management plans of their own.
• The Purus-Manu Conservation Corridor includes Alto Purus and Manu National Parks, as well as indigenous community’s reserves. Supports long-term biodiversity conservation, including river dolphins, howler monkeys and Mahogany trees, and benefiting about 60 local communities. 10 million hectares, representing the largest protected area of the Peruvian Rainforest. Joining several National Parks through the conservation corridor provides a larger natural unbroken area for animals to live in, which increases their range and resilience to extinction from small separate areas.
• Eco-tourism to provide sustainable economy whilst protecting the environment.

17
Case Study - Andros Barrier Reef Located in the Bahamas and reaches over 200km long. It is a barrier as it is parallel to the shoreline.
Interdependence
• There are 164 species of fish and coral, including red snapper, reef shark and green turtle.
• The fish benefit from safety and shelter of the reef for breeding.
• The coral benefits from the nitrogen excreted by the fish and the material from the seabed swept up by fish shoals.
• The Warm, tropical climate and clear sea allows photosynthesis so phytoplankton can survive. All other parts of the reef system rely on phytoplankton as they are the base of the food chain
Value to Humans and the Planet
• Tourism is thriving as there are recreational activities such as fishing, snorkelling and scuba diving. The angle of the sun makes it particularly attractive. This brings in over $150 million a year for the local economy.
• The fish are caught and sold both within the Bahamas and abroad. Lobster and snapper earn locals millions of dollars.
• Coral reef is a successful breeding ground as they shelter the fish to breed, especially in mangrove forests. This helps repopulate fish stocks for human use.
• It is a natural coastal protection - coastal erosion is reduced and flooding are reduced as the shallow water causes waves to break before they reach the land.
• There are medicinal chemicals released by coral species may help cure various diseases including asthma.
• The reef is used for research by scientists as this is one of the healthiest in the world.
Threats to Biodiversity
• Overfishing by commercial fishermen is reducing the number of fish which threatens the balance of the food chain.
• Sponges are being removed to sell.
• The tourists touch and stand on the coral, damaging it.
• Land-based pollution, including when chemicals from agriculture or sewage enter the rivers, are taken out to sea clouding the water. This clouds the water and reduces the sunlight penetration, restricting photosynthesis for the phytoplankton.
• There is marine-based pollution, such as oil and chemicals released by boats, especially near deep sea fishing areas. Anchors are also dropped on the coral, damaging it.
• Climate change creates higher temperatures creating corals stress, causing them to expel zooxanthellae. This changes their nutrient cycle causing them to bleach (turn white) and eventually die. This is expected to happen in 2040.
Sustainable Management
• The Andros West Side National Park provides a balance between traditions and conservation.
• Fishing is controlled so that fish stocks do not run out.
• Ecotourism is encouraged, providing jobs and environmental protection and education.
• Developments are controlled.
• The Crab replenishment reserve has the best land crab area in Andros. It is set aside to rebuild the crab population and ensure it is sustainable.
• Exuma Cays Land and Sea Park is a coral nursery. Endangered species are monitored and conserved before being planted in the coral reef.
• These are all small scale localized management strategies. Ultimately, Global Warming and the Enhanced Greenhouse Effect may be contributing to the loss of Coral Reefs all over the world that localized management strategies can do little about.

18
1. Number of species in the
Amazon
2937
2. Carbon saved by
agroforestry eg Ben And
Jerry’s Vanilla
85,000 tonnes
3. % of logging that is still
illegal
95%
4. Name of major road being
built to boost economy of
region
Trans Ocean Highway
5. Size of Peru-Manu
conservation corridor 7
number of reserves
10m hectares with 63
reserves
6. Example of protected
species
River Dolphin/Harpy
Eagle/Howler monkey
7. 3 key resources fund in
the forest
Gold, Gas, wood (eg
Mahogany)
8. Number of people
displaced for HEP dams
6000
9. How much of Peru is
covered by the Amazon?
60%
10. % of species unique to
Peru
16%
1. How many species of fish
and examples?
164 eg Parrot fish,
Green Turtle
2. Length of reef? 200km
3. Value of tourism to area? $150m/yr
4. Example of species caught
and sold to local markets
and tourists?
Sponge
5. % of coral habitat
government is committed
to protect
20%
6. Name of reserve to protect
crabs for a sustainable
future
Crab Replenishment
Reserve
7. Size of crab reserve? 4000 acres
8. Name of a coral nursery to
re-introduce species
Exuma Cays Land and
Sea Park
9. Example of eco-tourism Small Hope
10. % of locals that felt
tourism enhanced their
lives
79%
19
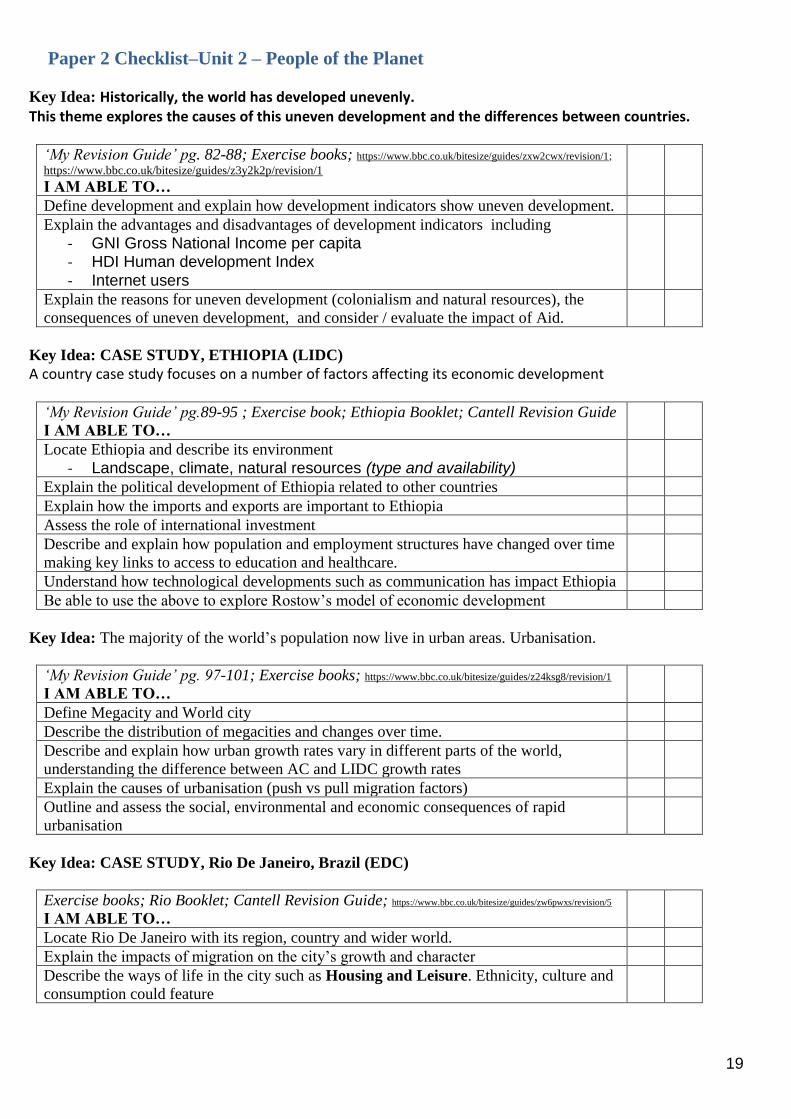
Paper 2 Checklist–Unit 2 – People of the Planet
Key Idea: Historically, the world has developed unevenly. This theme explores the causes of this uneven development and the differences between countries.
‘My Revision Guide’ pg. 82-88; Exercise books; https://www.bbc.co.uk/bitesize/guides/zxw2cwx/revision/1;
https://www.bbc.co.uk/bitesize/guides/z3y2k2p/revision/1 I AM ABLE TO…
Define development and explain how development indicators show uneven development.
Explain the advantages and disadvantages of development indicators including
- GNI Gross National Income per capita - HDI Human development Index - Internet users
Explain the reasons for uneven development (colonialism and natural resources), the
consequences of uneven development, and consider / evaluate the impact of Aid.
Key Idea: CASE STUDY, ETHIOPIA (LIDC)
A country case study focuses on a number of factors affecting its economic development
‘My Revision Guide’ pg.89-95 ; Exercise book; Ethiopia Booklet; Cantell Revision Guide
I AM ABLE TO…
Locate Ethiopia and describe its environment
- Landscape, climate, natural resources (type and availability)
Explain the political development of Ethiopia related to other countries
Explain how the imports and exports are important to Ethiopia
Assess the role of international investment
Describe and explain how population and employment structures have changed over time
making key links to access to education and healthcare.
Understand how technological developments such as communication has impact Ethiopia
Be able to use the above to explore Rostow’s model of economic development
Key Idea: The majority of the world’s population now live in urban areas. Urbanisation.
‘My Revision Guide’ pg. 97-101; Exercise books; https://www.bbc.co.uk/bitesize/guides/z24ksg8/revision/1
I AM ABLE TO…
Define Megacity and World city
Describe the distribution of megacities and changes over time.
Describe and explain how urban growth rates vary in different parts of the world,
understanding the difference between AC and LIDC growth rates
Explain the causes of urbanisation (push vs pull migration factors)
Outline and assess the social, environmental and economic consequences of rapid
urbanisation
Key Idea: CASE STUDY, Rio De Janeiro, Brazil (EDC)
Exercise books; Rio Booklet; Cantell Revision Guide; https://www.bbc.co.uk/bitesize/guides/zw6pwxs/revision/5
I AM ABLE TO…
Locate Rio De Janeiro with its region, country and wider world.
Explain the impacts of migration on the city’s growth and character
Describe the ways of life in the city such as Housing and Leisure. Ethnicity, culture and
consumption could feature

20
Explain the contemporary challenges that effect Rio De Janeiro and the strategies to
overcome these. Challenges include, housing availability, transport provision, waste
management
Case Study - Ethiopia LIDC, below world average wealth for LIDCs, GNI per capita $505 (world average $10858) Landlocked country, 11% economic growth: very high Environment • Climate: unreliable and extreme with droughts and monsoons. Western areas are more mild. • Fauna: flamingo, lion, gorilla, elephant Ecosystems • Mountains: over 4500m cold, sometimes snow covered • Woodland forests: low areas with fertile soil, good for crops and animal grazing • Grassland: fertile, but vulnerable to droughts • Semi-arid: mainly shrubs, subsistence farming although beginning to introduce large scale agriculture • Desert: uninhabited area e.g. Dallol • Wetland: rivers, lakes and swamps Resources • Minerals such as gold, platinum and copper • 2012: 19% export were mining (mostly gold) • Only one large gold mine in operation • Plans to explore potential of oil and gas reserve
Politics • Largely independent, only 6 years colonialism • Political instability after WWII, largely due to droughts restricting food production. Military take over
resulting in communism (supported by Soviet Union) • 1984-85 famine killed one million people- due to drought and high food prices • 1991 democracy, free trade and support for farmers with tax free fertiliser • Continued international (USA) and national support for agricultural and economic development
Trade Ethiopia is trade deficit Exports: $3bn • Agriculture: 80% exports and 46% GDP • Coffee, livestock and flowers • Vulnerable to climate and global price change • Exports to Somalia, Germany and China
Imports : $11nb • Petroleum (11%), Trucks (4%) and Fertilisers (3%) • Imports from China, Saudi Arabia and India
International Investment • From governments, UN, business and charities • H&M: textiles manufacturing • Hilton Hotels: leisure and tourism • Provide employment and income, but often low salary and poor working conditions due to lack of
regulation
Population and Employment • 94 million people, growing 2.6% a year • HDI 0.435 and life expectancy only 63 (world: 72) but increasing with better healthcare • 80% jobs in agriculture • 2.5 million jobs in tourism, higher paid and contribute more to the national economy • Adventure tourist potential: volcanoes, desert, historical sites and mountains
21
Social Factors Education • 96% primary school, up from 50% in 1990, but adult literacy still only 36% • Very few females in secondary education although this is improving
Health • Maternal mortality has fallen 23% and infant mortality has halved since 1990 • HIV/AIDs pandemic has stabilized, and 89% live within 10km of a doctor • Malaria still responsible for 20% child deaths but mosquito nets are now available
Technology • Behind the rest of Africa • Telecoms are state owned: poor quality • 4% internet access and 12% mobile ownership • No international banking or credit cards • Chinese investment to reduce cost of mobiles and internet and so increase use • Hope to develop technology to allow businesses to develop and grow
Aid 5m people receive food every year Goat Aid- Oxfam • Give a goat, it provides milk for food, manure for fertiliser, give birth to sell. • Sustainable gift: can survive in most locations, locally sourced, traditional way of life • Criticism that they need food and water when there is a shortage • Gives women some control of their lives • Goats can be sold by their owners if do not have skills or understanding and money used for
unintended/unsustainable purposes
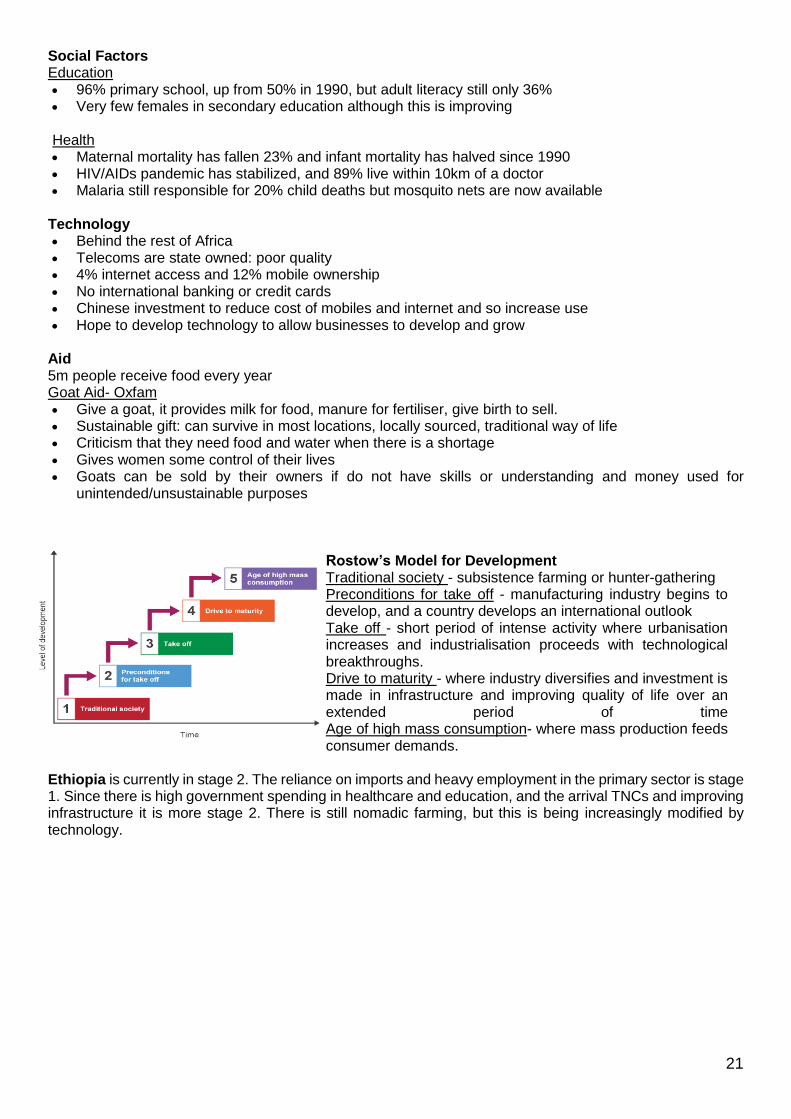
Rostow’s Model for Development Traditional society - subsistence farming or hunter-gathering Preconditions for take off - manufacturing industry begins to develop, and a country develops an international outlook Take off - short period of intense activity where urbanisation increases and industrialisation proceeds with technological breakthroughs. Drive to maturity - where industry diversifies and investment is made in infrastructure and improving quality of life over an extended period of time Age of high mass consumption- where mass production feeds consumer demands.
Ethiopia is currently in stage 2. The reliance on imports and heavy employment in the primary sector is stage 1. Since there is high government spending in healthcare and education, and the arrival TNCs and improving infrastructure it is more stage 2. There is still nomadic farming, but this is being increasingly modified by technology.

22
Rio De Janeiro The second largest city in Brazil. 6 million people live within the city, 12 million live in the wider area.
Migration
• Colonisation of Brazil by Portugal began the first waves of early migration with the influx of African slaves. When released these freed slaves were the founders of Rio’s favelas.
• At the end of the 19th century, the government encouraged migration from Germany, Italy and Japan
• Recently, economic developments are attracting rural to urban migrants and undocumented immigrants from neighbouring countries.
Character of Rio
• A host City for the 2014 FIFA World Cup & Host of the 2016 Summer Olympics
• Every year Rio enjoys celebrating its Carnival
• Shopping varies from high end boutiques through to street sellers
• Various housing zones from favelas to luxury, gated communities.
• Many cultural and historical attractions, world-class accommodation and plenty of tours.
Challenges for Rio
• Rio’s population has more than trebled since 1950 to 6.45 million in 2016, places stress on waste management, the management of transport and the availability of housing.
Waste:
• Pollution in Guanabara Bay is a major threat to wildlife and tourism.
• Four hundred tonnes of untreated sewage pours into Guanabara Bay each day
• Seventy tonnes of industrial waste enters the bay each day from factories in Rio’s industrial zone
• The 6 million people produce 3.5 million metric tonnes of waste a year, equivalent to 1.6 kg per person per day. Favelas have no proper roads, making waste collection by lorry virtually impossible.
Transport:
• Although the mountains that surround Rio are very picturesque, they also hem the city in
• A large volume of traffic is forced along a few main roads causing severe congestion, noise and air pollution from vehicle exhausts. Rio is world famous for its horrendous traffic jams.
Housing:
• 25% live in favelas
• Roçinha is Rio’s largest and oldest favela. There are various estimates ranging from 69,000 - 300,000 living in Rocinha, showing the difficulty of monitoring and measuring its population
• Houses in favelas are built with basic materials such as scrap wood & corrugated iron, although as an older favela these houses have been upgraded to brick and cement in Rocinha
• About 12% of the households in Rio do not have running water
• Residents use illegal connections or ‘gatos’ to overhead pylons to secure electricity, which is very dangerous
• Diseases spread fast due to unsanitary conditions and high population density.
Sustainable management of housing Self-help schemes:
• Community projects to self-improve e.g. clearing rubbish sites to create a garden re-using the waste products
• Residents given materials by local authority to self-improve housing quality Site and service
• Brick built homes with services (sewers, electricity, road access) and community facilities (e.g. schools).
• Quality improves but rent is charged, and less homes are available. Pacification
• Police clear criminal gangs e.g. the Red Command from favelas but only successful in small favelas. • Community facilities then provided to re-build and structure the community.
• Fear of police violence as 1 in 23 arrests result in a death (1 in 30,000 in USA).

23
1. Population of wider city 12m
2. Events that Rio famous for? Hosting World Cup 2014 and Olympics 2016.
Carnivals, surfing, multicultural.
3. Main exports? Sugar and oranges
4. Kg of waster per person per day 1.6kg
5. Traffic and roads constrained by Mountains and inlets eg Sugar Loaf Mountain
6. % living in favelas 25%
7. Name of largest favela Rochina
8. Name of crime gang Red Command
9. % of households with no water 12%
10. Police brutality causes how many deaths? 1 in 23
1. Low GNI of $505
2. Range of ecosystems Forests, deserts, grasslands, wetlands
3. % of exports from mining 19%
4. Date of famine following communist rule by
Russia
1984-1985, 1m deaths.
5. Value of agriculture 80% exports, 46% GDP
6. Trade surplus or deficit? Deficit- $3bn exports, $11bn imports
7. Examples of international investment Hilton Hotels, H7M
8. HDI & life expectancy 0.435, 63 years
9. Jobs in tourism 2.5m and rising
10. % of primary children in duction Recently risen to 96%
11. Fall in infant mortality Halved since 1990
12. 5 of child deaths due to Malaria 20%
13. Internet access 4%
14. Example of Aid project Goat Aid, Tigray region
15. % increase of calories for those on the
scheme
42%
24
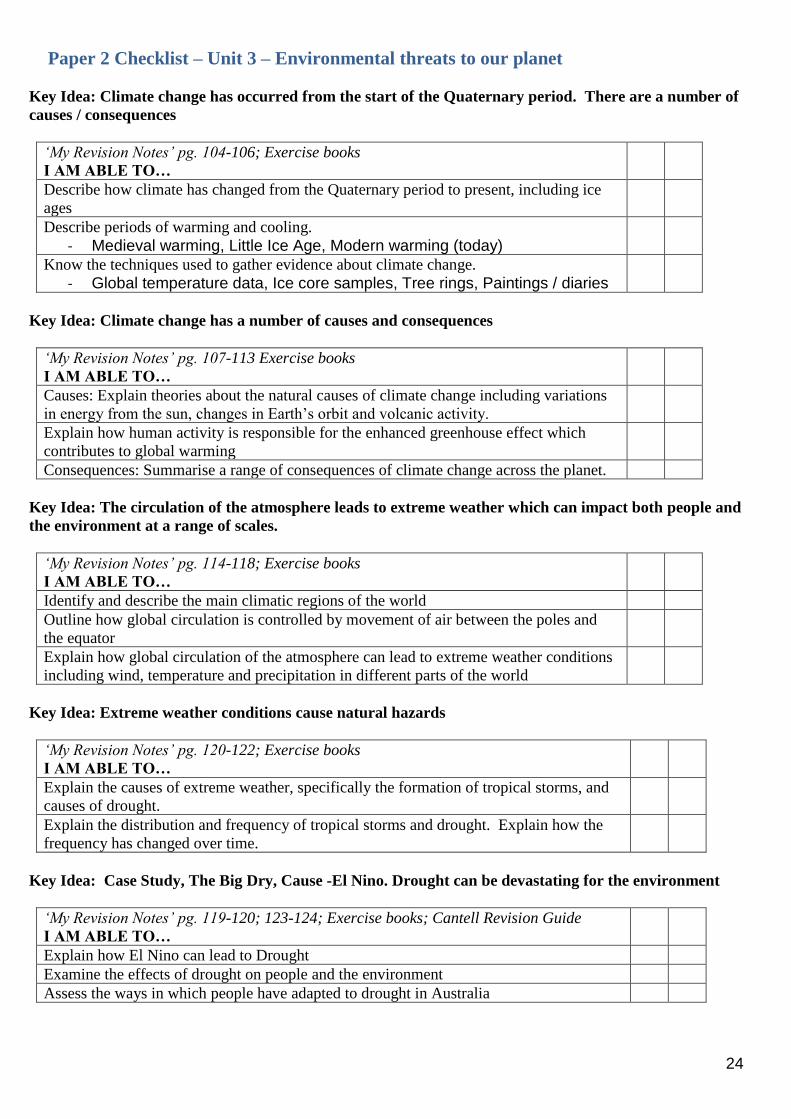
Paper 2 Checklist – Unit 3 – Environmental threats to our planet
Key Idea: Climate change has occurred from the start of the Quaternary period. There are a number of
causes / consequences
‘My Revision Notes’ pg. 104-106; Exercise books
I AM ABLE TO…
Describe how climate has changed from the Quaternary period to present, including ice
ages
Describe periods of warming and cooling.
- Medieval warming, Little Ice Age, Modern warming (today)
Know the techniques used to gather evidence about climate change.
- Global temperature data, Ice core samples, Tree rings, Paintings / diaries
Key Idea: Climate change has a number of causes and consequences
‘My Revision Notes’ pg. 107-113 Exercise books
I AM ABLE TO…
Causes: Explain theories about the natural causes of climate change including variations
in energy from the sun, changes in Earth’s orbit and volcanic activity.
Explain how human activity is responsible for the enhanced greenhouse effect which
contributes to global warming
Consequences: Summarise a range of consequences of climate change across the planet.
Key Idea: The circulation of the atmosphere leads to extreme weather which can impact both people and
the environment at a range of scales.
‘My Revision Notes’ pg. 114-118; Exercise books
I AM ABLE TO…
Identify and describe the main climatic regions of the world
Outline how global circulation is controlled by movement of air between the poles and
the equator
Explain how global circulation of the atmosphere can lead to extreme weather conditions
including wind, temperature and precipitation in different parts of the world
Key Idea: Extreme weather conditions cause natural hazards
‘My Revision Notes’ pg. 120-122; Exercise books
I AM ABLE TO…
Explain the causes of extreme weather, specifically the formation of tropical storms, and
causes of drought.
Explain the distribution and frequency of tropical storms and drought. Explain how the
frequency has changed over time.
Key Idea: Case Study, The Big Dry, Cause -El Nino. Drought can be devastating for the environment
‘My Revision Notes’ pg. 119-120; 123-124; Exercise books; Cantell Revision Guide
I AM ABLE TO…
Explain how El Nino can lead to Drought
Examine the effects of drought on people and the environment
Assess the ways in which people have adapted to drought in Australia

25
Case Study - The Big Dry Drought caused by El Niño, 2002 - 2009, in Eastern Australia
Causes El Niño • Australia becomes drier as rainfall decreases • Trade winds that bring warm water weaken, increasing the air pressure and reducing rainfall • Eastern Australia becomes hotter and drier • Low and irregular rainfall Over Use • Driest inhabited continent • Although only 23 million people, due to lack of water this is over populated • 2 million people live on the Murray River • Murray River provides water for agriculture in the region • 40% of agriculture and 70% irrigated crops and pasture
Responses to drought Farmers • Received $400 - $600 per fortnight each • More efficient irrigation systems • Buying feed for cows Individuals • Recycle waste water from showers, sinks and
washing machines • Showers limited to 4 minutes • Personal donations of food to farmers Government • Legislation to ban car washing and limit
showers • States urged to hand the responsibility for the
Murray river to the central government • New desalination plant in Sydney • Subsidising rainwater storage for homes • $1.7m a day in drought relief from the
government
Consequences of drought Social • People in rural areas had a lack of water • This put pressure on city populations • Rural suicide rates rose • Farmers facing debt due to buying feed for
cows. Economic • Water bills rose 20% in 2008 • Agriculture was severely impacted • Farmers had to sell cattle as they could not
afford to feed them • Food prices rose as they had to import • Dairy farm number halved • 10 000 employed in cotton industry impacted • Tourism was negatively impacted Environmental • Grassland turned to scrubland • Energy from HEP was reduced so more fossil
fuels used • Water quality reduced as toxic algal outbreaks
in the depleted rivers, dams and lakes • Loss of vegetation, wildlife and biodiversity • Soil erosion as it dried out and was blown
away http://theconversation.com/australia-is-not-ready-for-the-next-big-dry-12819
Normal Conditions El Niṅo
Trade winds blow across the Pacific from Peru towards Australia and Indonesia
Trade winds weaken, stop or even reverse
Warm water is pushed towards Australia Warm water moves away from Australia, back towards Peru
Rising warm, moist air in Australia, causing heavy rainfall
High Pressure in Western Australia leading to extremely low rates of rain.
Australia: warm, heavy rainfall Australia: warm, dry and possible drought
Success of responses
El Nino is natural process– this cannot be resolved by
Austrailia. Droughts are unpredictable and so very
hard to prepare for.
Many criticisms that farmer subsidies were withdrawn
too quickly.
Also criticisms over Australia’s general water
management.

26
TOP 10 Facts: paper 2 The Big Dry, Australia
1. Direst conditions in how many
years?
125 years
2. What % of Australia’s
irrigated farms are in this
region?
70%
3. Water bills rose by how
much?
20%
4. Number of cotton workers
who lost their jobs?
10,000
5. Name of the river basin? Murray-Darling River Basin
6. Date? 2002-2009
7. Amount of drought relief
spent per day from
government to farmers?
$1.7m
8. Annual Rainfall was what %
below normal?
40-60%
9. Showers limited to…? 4 minutes
10. Population within river basin? 2 million
27
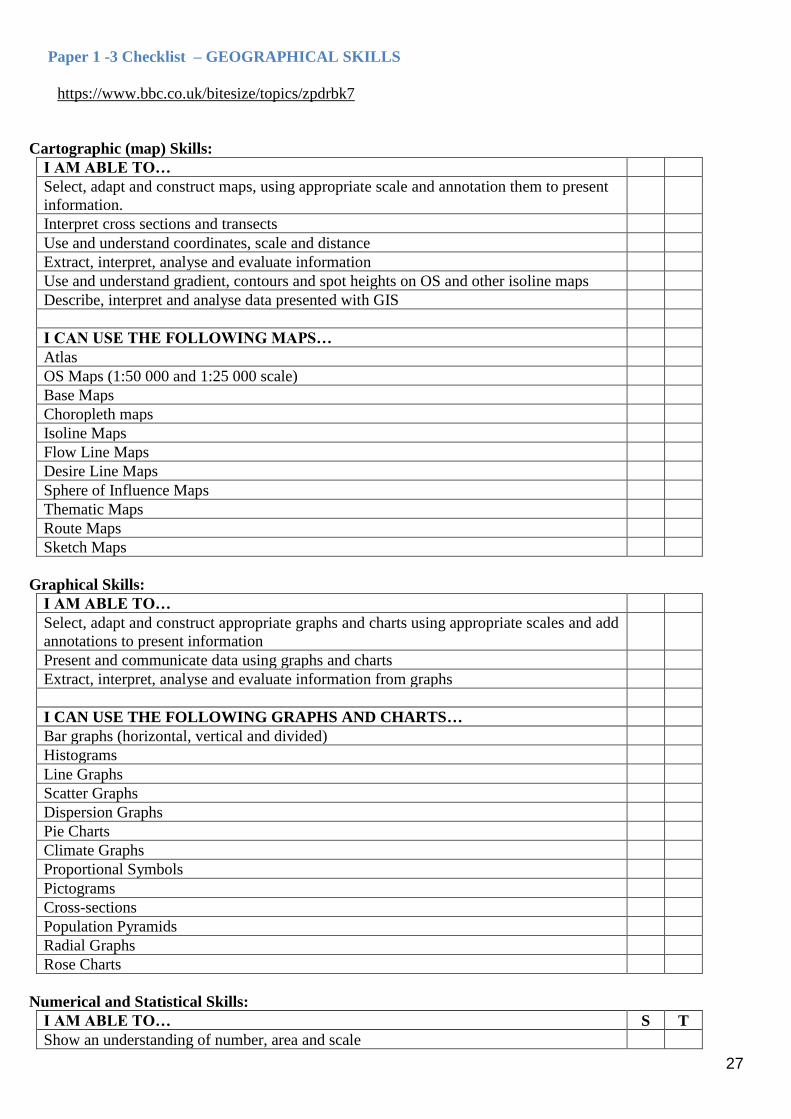
Paper 1 -3 Checklist – GEOGRAPHICAL SKILLS
https://www.bbc.co.uk/bitesize/topics/zpdrbk7
Cartographic (map) Skills:
I AM ABLE TO…
Select, adapt and construct maps, using appropriate scale and annotation them to present
information.
Interpret cross sections and transects
Use and understand coordinates, scale and distance
Extract, interpret, analyse and evaluate information
Use and understand gradient, contours and spot heights on OS and other isoline maps
Describe, interpret and analyse data presented with GIS
I CAN USE THE FOLLOWING MAPS…
Atlas
OS Maps (1:50 000 and 1:25 000 scale)
Base Maps
Choropleth maps
Isoline Maps
Flow Line Maps
Desire Line Maps
Sphere of Influence Maps
Thematic Maps
Route Maps
Sketch Maps
Graphical Skills:
I AM ABLE TO…
Select, adapt and construct appropriate graphs and charts using appropriate scales and add
annotations to present information
Present and communicate data using graphs and charts
Extract, interpret, analyse and evaluate information from graphs
I CAN USE THE FOLLOWING GRAPHS AND CHARTS…
Bar graphs (horizontal, vertical and divided)
Histograms
Line Graphs
Scatter Graphs
Dispersion Graphs
Pie Charts
Climate Graphs
Proportional Symbols
Pictograms
Cross-sections
Population Pyramids
Radial Graphs
Rose Charts
Numerical and Statistical Skills:
I AM ABLE TO… S T
Show an understanding of number, area and scale
28
Show an understanding of quantitative relationships
Understand and use proportion, ratio, magnitude and frequency
Use measures of median, mean, range, quartiles/inter-quartile range, mode and modal
Use percentages and percentiles
Design fieldwork data collection sheets and collect accurate, reliable data with
appropriate sampling
Interpret tables of data
Describe data in bivariate data
Sketch a trend line through a scatter plot
Draw a line of best fit
Make predictions and see trends in data
Identify weaknesses in statistical data presentations
Arrive at conclusions in relation to numerical and statistical data
Other Skills:
I AM ABLE TO… S T
Interpret, analyse and evaluate images (photographs, cartoons and diagrams)
Interpret, analyse and understand a variety of written articles
Recognise bias in written articles
Suggest reasons for using maps, graphs, statistical techniques and visual sources
Suggest improvements and issues with maps, graphs, statistical techniques and visual
sources
These skills will be covered throughout the two year course and across the different themes to develop your
understanding of the issues and concepts covered. A number of these skills will be developed while
covering the Geographical Skills section B work (two fieldwork experiences).
29
Paper 3 Checklist– FIELDWORK SKILLS
SECTION B
‘Geographical fieldwork is the experience of understanding and applying specific geographical
knowledge, understanding and skills to a particular and real out-of-classroom context.’
This is assessed in the Geographical Skills examination.
I AM ABLE TO…
Understand the kind of questions capable of being investigated through fieldwork and
have an understanding of the geographical enquiry process appropriate to investigate
them.
Suggest, use and describe a range of fieldwork techniques and methods, including
observations and taking measurements.
Process and present data using maps, graphs and diagrams.
Analyse and explain data that has been collected.
Draw conclusions (supported by data) and summaries from fieldwork transcripts and
data.
Reflect critically on fieldwork data, methods used, conclusions drawn and knowledge
gained.

30
COMPONENT – GEOGRAPHICAL SKILLS SECTION Data Collection
:
Secondary Data
This research involves gathering information from
sources that have already been completed. This
can even be statistical (number form), written or
mapped. Secondary data should be used to help
your investigation. It should only be a small part
of the investigation.
Qualitative Research
Qualitative research gathers information that is not in numerical form. For
example, diary accounts, open-ended questionnaires, unstructured interviews
and unstructured observations.
It is useful for studies at the individual level and can find out what people
think.
This type of data is typically descriptive data and as such is harder to
analyse.
Quantitative Research
Quantitative research gathers data in numerical form which can
be put into categories, or in rank order, or measured in units of
measurement. This type of data can be used to construct graphs
and tables of raw data.
This methods mostly avoids personal basis and greater
accuracy of results.
Data is much more narrower and may not always reflect
feelings or situations
Sampling Strategies
Random sampling: this is the most accurate method as there is no bias involved as every person or place has an equal
chance of being sampled.
Systematic sampling: this is a quick and easy method to use where a regular sample is taken, e.g. river depth readings
may be taken every 50cm across the channel. This type of sampling does not always work well with questionnaires
as it may not be possible to ask every 10th person, for example, who enters a shopping area.
Stratified sampling: this is where people or places are deliberately chosen according to the topic being investigated;
for example, a questionnaire about a regeneration project might be asked to an equal number of males and females
within pre-determined age groups; e.g. five males and five females aged 20-39, five of each gender aged 40-59 and
so on. This can also be used alongside random or systematic sampling.
Random
sampling:
Systematic
sampling: Stratified
sampling
1. Ask a
question –Is it
suitable?
2. Design
collection
3. Data Collection
4. Data Present
5. Data Analysis
6. Conclusion
7. Evaluate
The Enquiry
Approach
How can we get primary data?
• Ask Questionnaires
• Interview
• Measure a variable… cars, noise (Dc), number of people, the environment (EQI), beach width, groyne drop etc.
Primary data
This information must come from the students
own observations and measurements collected
in the field. This primary information must
form the basis of each investigation. Field
work must provide sufficient information to
allow for adequate interpretation and analysis
How can we get
secondary data?
Written records,
newspapers, census data,
historical archives,
reports
Interpreting maps
(historical and OS maps)

31
How to PRESENT data with the PROS and CONS
EVALUATION: Do your own for EQA / bar
chart from your field work
Data Presentation Methods
Bar graphs (horizontal,
vertical and divided)
Histograms
Line Graphs
Scatter Graphs
Dispersion Graphs
Pie Charts
Climate Graphs
Proportional Symbols
Pictograms
Cross-sections
Population Pyramids
Radial Graphs
Rose Charts

32
Strengths:
Show several sets of data.
Some spatial element to representation of data.
Weaknesses:
× Hard to spot anomalies
× Area covered is not proportional so can be misleading.
Radial and Rose Charts
33
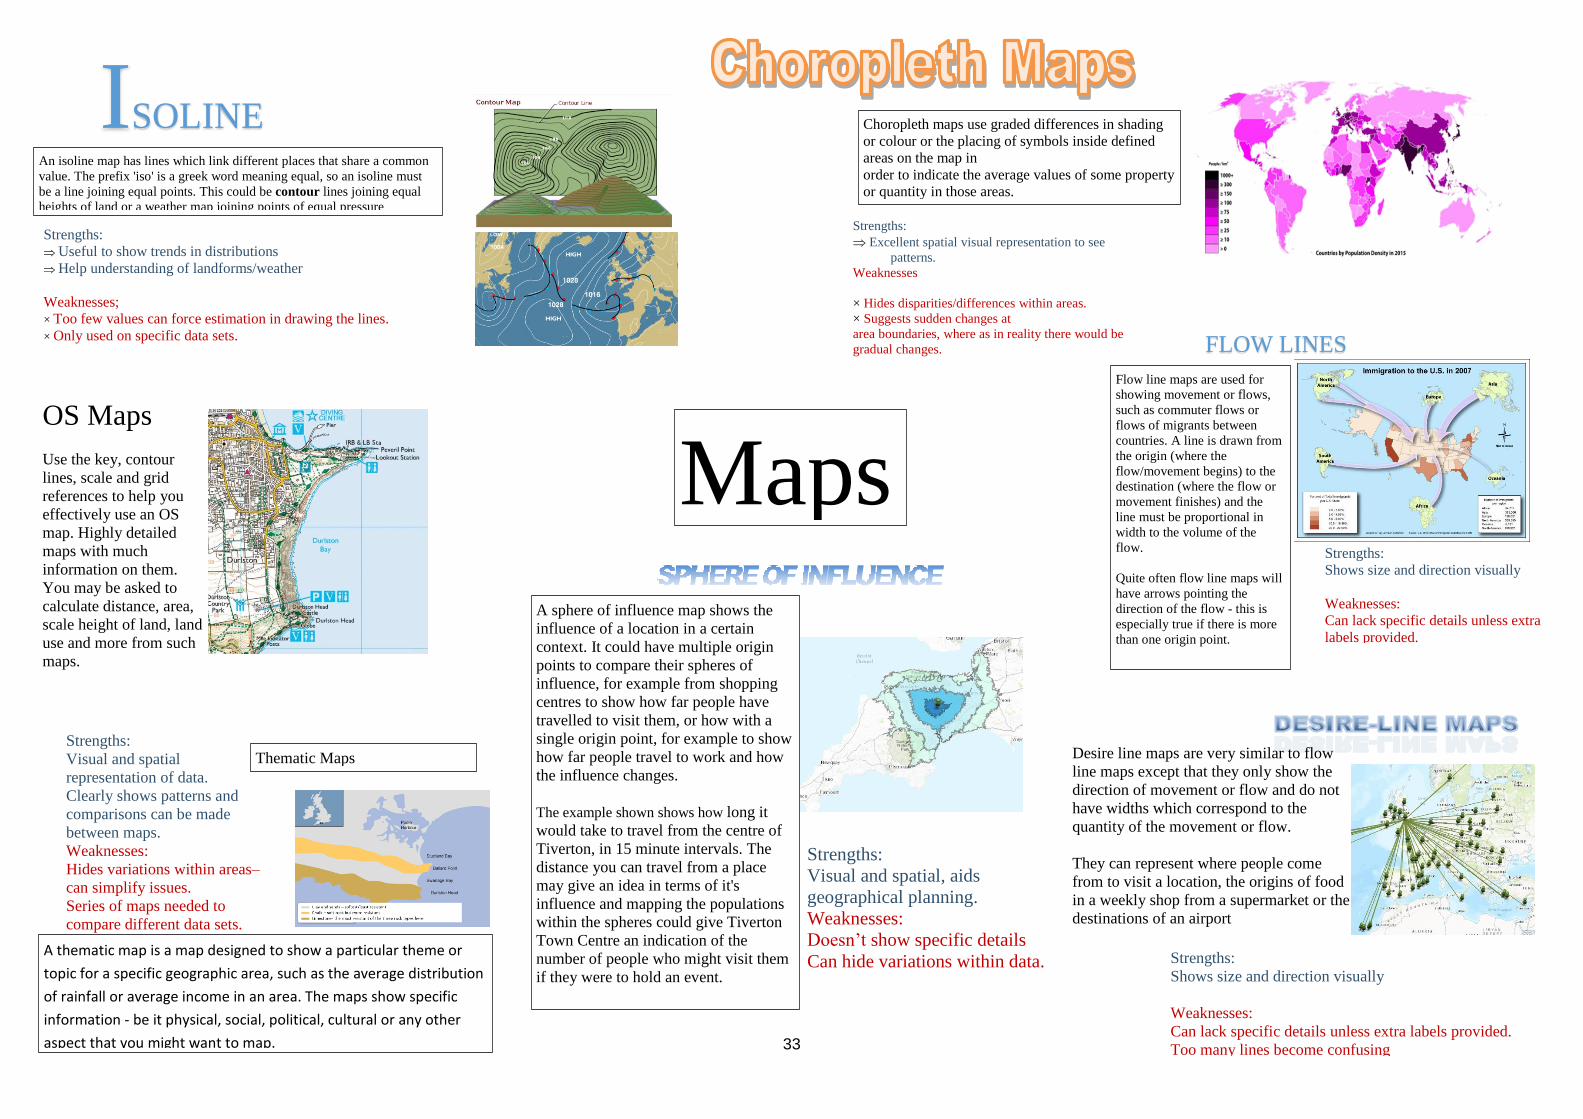
Maps
Strengths:
Useful to show trends in distributions
Help understanding of landforms/weather
Weaknesses;
× Too few values can force estimation in drawing the lines.
× Only used on specific data sets.
ISOLINE
MAP Strengths:
Excellent spatial visual representation to see
patterns.
Weaknesses
× Hides disparities/differences within areas.
× Suggests sudden changes at
area boundaries, where as in reality there would be
gradual changes. FLOW LINES
Strengths:
Shows size and direction visually
Weaknesses:
Can lack specific details unless extra
labels provided.
Too many lines become confusing
Strengths:
Shows size and direction visually
Weaknesses:
Can lack specific details unless extra labels provided.
Too many lines become confusing
Strengths:
Visual and spatial, aids
geographical planning.
Weaknesses:
Doesn’t show specific details
Can hide variations within data. A thematic map is a map designed to show a particular theme or
topic for a specific geographic area, such as the average distribution
of rainfall or average income in an area. The maps show specific
information - be it physical, social, political, cultural or any other
aspect that you might want to map.
Strengths:
Visual and spatial
representation of data.
Clearly shows patterns and
comparisons can be made
between maps.
Weaknesses:
Hides variations within areas–
can simplify issues.
Series of maps needed to
compare different data sets.
Thematic Maps
OS Maps
Use the key, contour
lines, scale and grid
references to help you
effectively use an OS
map. Highly detailed
maps with much
information on them.
You may be asked to
calculate distance, area,
scale height of land, land
use and more from such
maps.
Choropleth maps use graded differences in shading
or colour or the placing of symbols inside defined
areas on the map in
order to indicate the average values of some property
or quantity in those areas.
An isoline map has lines which link different places that share a common
value. The prefix 'iso' is a greek word meaning equal, so an isoline must
be a line joining equal points. This could be contour lines joining equal
heights of land or a weather map joining points of equal pressure
(isobars).
A sphere of influence map shows the
influence of a location in a certain
context. It could have multiple origin
points to compare their spheres of
influence, for example from shopping
centres to show how far people have
travelled to visit them, or how with a
single origin point, for example to show
how far people travel to work and how
the influence changes.
The example shown shows how long it
would take to travel from the centre of
Tiverton, in 15 minute intervals. The
distance you can travel from a place
may give an idea in terms of it's
influence and mapping the populations
within the spheres could give Tiverton
Town Centre an indication of the
number of people who might visit them
if they were to hold an event.
Flow line maps are used for
showing movement or flows,
such as commuter flows or
flows of migrants between
countries. A line is drawn from
the origin (where the
flow/movement begins) to the
destination (where the flow or
movement finishes) and the
line must be proportional in
width to the volume of the
flow.
Quite often flow line maps will
have arrows pointing the
direction of the flow - this is
especially true if there is more
than one origin point.
Desire line maps are very similar to flow
line maps except that they only show the
direction of movement or flow and do not
have widths which correspond to the
quantity of the movement or flow.
They can represent where people come
from to visit a location, the origins of food
in a weekly shop from a supermarket or the
destinations of an airport
34
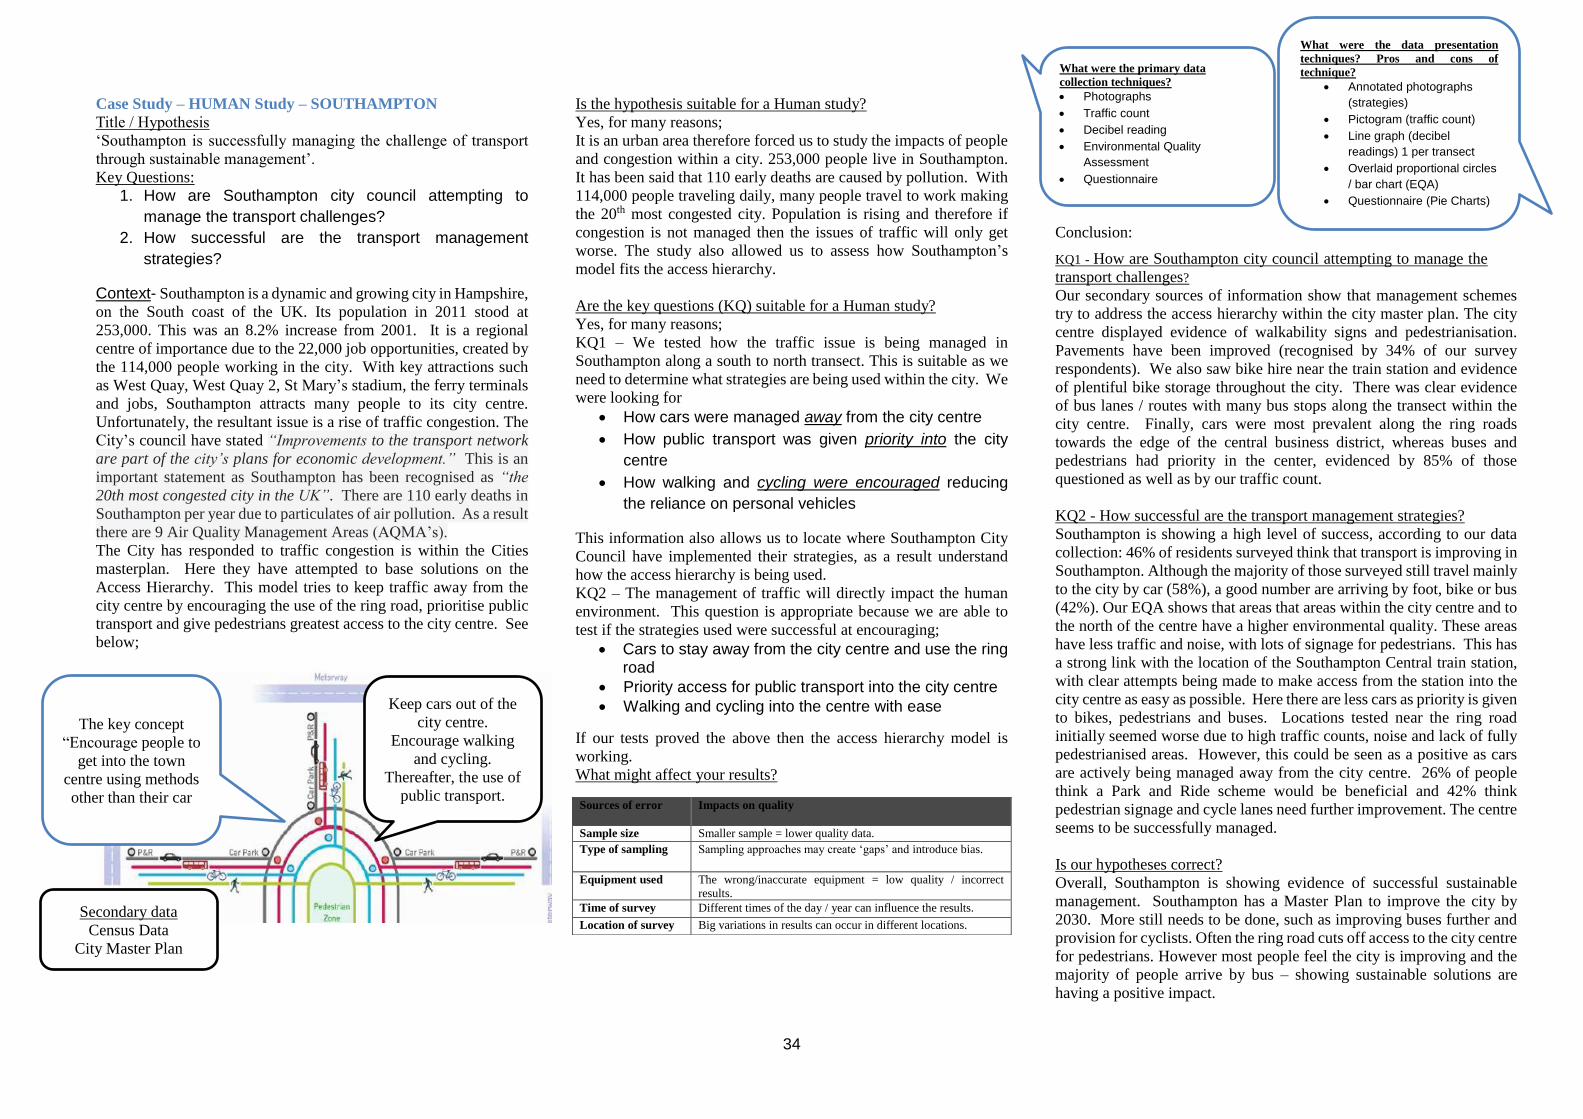
Case Study – HUMAN Study – SOUTHAMPTON
Title / Hypothesis
‘Southampton is successfully managing the challenge of transport
through sustainable management’.
Key Questions:
1. How are Southampton city council attempting to
manage the transport challenges?
2. How successful are the transport management
strategies?
Context- Southampton is a dynamic and growing city in Hampshire,
on the South coast of the UK. Its population in 2011 stood at
253,000. This was an 8.2% increase from 2001. It is a regional
centre of importance due to the 22,000 job opportunities, created by
the 114,000 people working in the city. With key attractions such
as West Quay, West Quay 2, St Mary’s stadium, the ferry terminals
and jobs, Southampton attracts many people to its city centre.
Unfortunately, the resultant issue is a rise of traffic congestion. The
City’s council have stated “Improvements to the transport network
are part of the city’s plans for economic development.” This is an
important statement as Southampton has been recognised as “the
20th most congested city in the UK”. There are 110 early deaths in
Southampton per year due to particulates of air pollution. As a result
there are 9 Air Quality Management Areas (AQMA’s).
The City has responded to traffic congestion is within the Cities
masterplan. Here they have attempted to base solutions on the
Access Hierarchy. This model tries to keep traffic away from the
city centre by encouraging the use of the ring road, prioritise public
transport and give pedestrians greatest access to the city centre. See
below;
Is the hypothesis suitable for a Human study?
Yes, for many reasons;
It is an urban area therefore forced us to study the impacts of people
and congestion within a city. 253,000 people live in Southampton.
It has been said that 110 early deaths are caused by pollution. With
114,000 people traveling daily, many people travel to work making
the 20th most congested city. Population is rising and therefore if
congestion is not managed then the issues of traffic will only get
worse. The study also allowed us to assess how Southampton’s
model fits the access hierarchy.
Are the key questions (KQ) suitable for a Human study?
Yes, for many reasons;
KQ1 – We tested how the traffic issue is being managed in
Southampton along a south to north transect. This is suitable as we
need to determine what strategies are being used within the city. We
were looking for
• How cars were managed away from the city centre
• How public transport was given priority into the city
centre
• How walking and cycling were encouraged reducing
the reliance on personal vehicles
This information also allows us to locate where Southampton City
Council have implemented their strategies, as a result understand
how the access hierarchy is being used.
KQ2 – The management of traffic will directly impact the human
environment. This question is appropriate because we are able to
test if the strategies used were successful at encouraging;
• Cars to stay away from the city centre and use the ring road
• Priority access for public transport into the city centre
• Walking and cycling into the centre with ease
If our tests proved the above then the access hierarchy model is
working.
What might affect your results?
Conclusion:
KQ1 - How are Southampton city council attempting to manage the
transport challenges?
Our secondary sources of information show that management schemes
try to address the access hierarchy within the city master plan. The city
centre displayed evidence of walkability signs and pedestrianisation.
Pavements have been improved (recognised by 34% of our survey
respondents). We also saw bike hire near the train station and evidence
of plentiful bike storage throughout the city. There was clear evidence
of bus lanes / routes with many bus stops along the transect within the
city centre. Finally, cars were most prevalent along the ring roads
towards the edge of the central business district, whereas buses and
pedestrians had priority in the center, evidenced by 85% of those
questioned as well as by our traffic count.
KQ2 - How successful are the transport management strategies?
Southampton is showing a high level of success, according to our data
collection: 46% of residents surveyed think that transport is improving in
Southampton. Although the majority of those surveyed still travel mainly
to the city by car (58%), a good number are arriving by foot, bike or bus
(42%). Our EQA shows that areas that areas within the city centre and to
the north of the centre have a higher environmental quality. These areas
have less traffic and noise, with lots of signage for pedestrians. This has
a strong link with the location of the Southampton Central train station,
with clear attempts being made to make access from the station into the
city centre as easy as possible. Here there are less cars as priority is given
to bikes, pedestrians and buses. Locations tested near the ring road
initially seemed worse due to high traffic counts, noise and lack of fully
pedestrianised areas. However, this could be seen as a positive as cars
are actively being managed away from the city centre. 26% of people
think a Park and Ride scheme would be beneficial and 42% think
pedestrian signage and cycle lanes need further improvement. The centre
seems to be successfully managed.
Is our hypotheses correct?
Overall, Southampton is showing evidence of successful sustainable
management. Southampton has a Master Plan to improve the city by
2030. More still needs to be done, such as improving buses further and
provision for cyclists. Often the ring road cuts off access to the city centre
for pedestrians. However most people feel the city is improving and the
majority of people arrive by bus – showing sustainable solutions are
having a positive impact.
Sources of error Impacts on quality
Sample size Smaller sample = lower quality data.
Type of sampling Sampling approaches may create ‘gaps’ and introduce bias.
Equipment used The wrong/inaccurate equipment = low quality / incorrect
results.
Time of survey Different times of the day / year can influence the results.
Location of survey Big variations in results can occur in different locations.
The key concept
“Encourage people to
get into the town
centre using methods
other than their car
Keep cars out of the
city centre.
Encourage walking
and cycling.
Thereafter, the use of
public transport.
What were the primary data
collection techniques?
• Photographs
• Traffic count
• Decibel reading
• Environmental Quality
Assessment
• Questionnaire
What were the data presentation
techniques? Pros and cons of
technique?
• Annotated photographs
(strategies)
• Pictogram (traffic count)
• Line graph (decibel
readings) 1 per transect
• Overlaid proportional circles
/ bar chart (EQA)
• Questionnaire (Pie Charts)
Secondary data
Census Data
City Master Plan
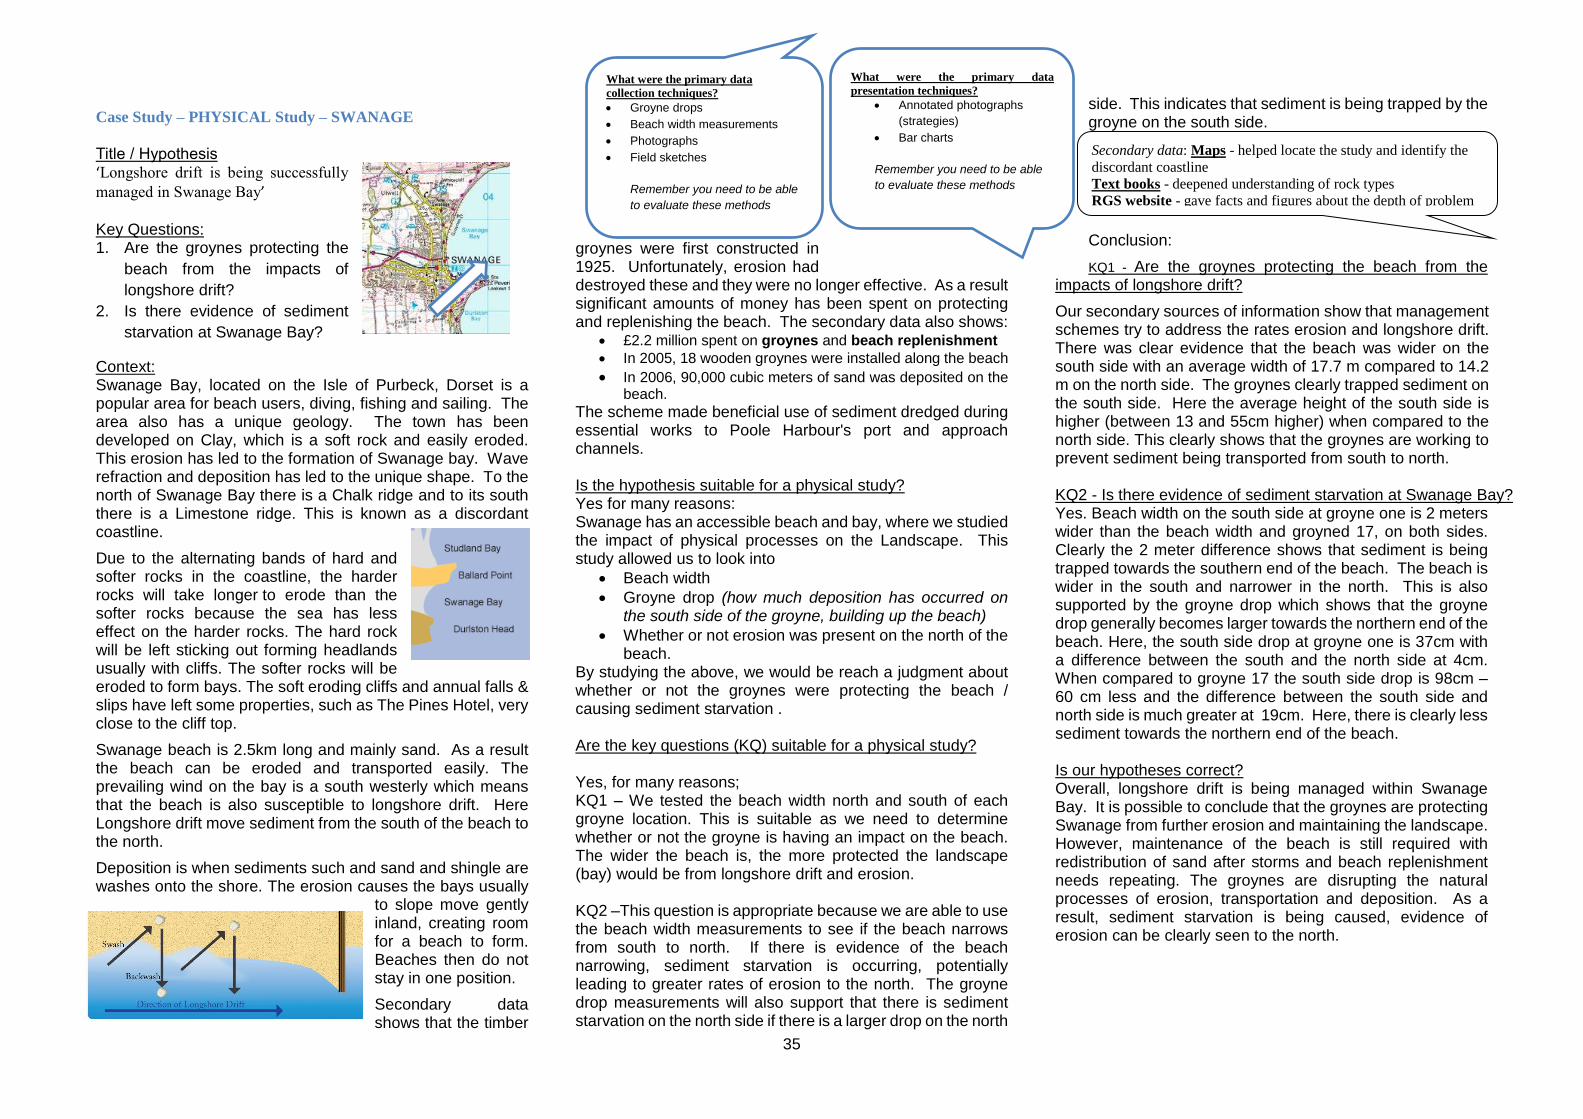
35
Case Study – PHYSICAL Study – SWANAGE
Title / Hypothesis ‘Longshore drift is being successfully
managed in Swanage Bay’ Key Questions: 1. Are the groynes protecting the
beach from the impacts of
longshore drift?
2. Is there evidence of sediment
starvation at Swanage Bay?
Context: Swanage Bay, located on the Isle of Purbeck, Dorset is a popular area for beach users, diving, fishing and sailing. The area also has a unique geology. The town has been developed on Clay, which is a soft rock and easily eroded. This erosion has led to the formation of Swanage bay. Wave refraction and deposition has led to the unique shape. To the north of Swanage Bay there is a Chalk ridge and to its south there is a Limestone ridge. This is known as a discordant coastline.
Due to the alternating bands of hard and softer rocks in the coastline, the harder rocks will take longer to erode than the softer rocks because the sea has less effect on the harder rocks. The hard rock will be left sticking out forming headlands usually with cliffs. The softer rocks will be eroded to form bays. The soft eroding cliffs and annual falls & slips have left some properties, such as The Pines Hotel, very close to the cliff top.
Swanage beach is 2.5km long and mainly sand. As a result the beach can be eroded and transported easily. The prevailing wind on the bay is a south westerly which means that the beach is also susceptible to longshore drift. Here Longshore drift move sediment from the south of the beach to the north.
Deposition is when sediments such and sand and shingle are washes onto the shore. The erosion causes the bays usually
to slope move gently inland, creating room for a beach to form. Beaches then do not stay in one position.
Secondary data shows that the timber
groynes were first constructed in 1925. Unfortunately, erosion had destroyed these and they were no longer effective. As a result significant amounts of money has been spent on protecting and replenishing the beach. The secondary data also shows:
• £2.2 million spent on groynes and beach replenishment
• In 2005, 18 wooden groynes were installed along the beach
• In 2006, 90,000 cubic meters of sand was deposited on the beach.
The scheme made beneficial use of sediment dredged during essential works to Poole Harbour's port and approach channels. Is the hypothesis suitable for a physical study? Yes for many reasons: Swanage has an accessible beach and bay, where we studied the impact of physical processes on the Landscape. This study allowed us to look into
• Beach width
• Groyne drop (how much deposition has occurred on the south side of the groyne, building up the beach)
• Whether or not erosion was present on the north of the beach.
By studying the above, we would be reach a judgment about whether or not the groynes were protecting the beach / causing sediment starvation . Are the key questions (KQ) suitable for a physical study? Yes, for many reasons; KQ1 – We tested the beach width north and south of each groyne location. This is suitable as we need to determine whether or not the groyne is having an impact on the beach. The wider the beach is, the more protected the landscape (bay) would be from longshore drift and erosion. KQ2 –This question is appropriate because we are able to use the beach width measurements to see if the beach narrows from south to north. If there is evidence of the beach narrowing, sediment starvation is occurring, potentially leading to greater rates of erosion to the north. The groyne drop measurements will also support that there is sediment starvation on the north side if there is a larger drop on the north
side. This indicates that sediment is being trapped by the groyne on the south side.
Conclusion:
KQ1 - Are the groynes protecting the beach from the impacts of longshore drift?
Our secondary sources of information show that management schemes try to address the rates erosion and longshore drift. There was clear evidence that the beach was wider on the south side with an average width of 17.7 m compared to 14.2 m on the north side. The groynes clearly trapped sediment on the south side. Here the average height of the south side is higher (between 13 and 55cm higher) when compared to the north side. This clearly shows that the groynes are working to prevent sediment being transported from south to north. KQ2 - Is there evidence of sediment starvation at Swanage Bay? Yes. Beach width on the south side at groyne one is 2 meters wider than the beach width and groyned 17, on both sides. Clearly the 2 meter difference shows that sediment is being trapped towards the southern end of the beach. The beach is wider in the south and narrower in the north. This is also supported by the groyne drop which shows that the groyne drop generally becomes larger towards the northern end of the beach. Here, the south side drop at groyne one is 37cm with a difference between the south and the north side at 4cm. When compared to groyne 17 the south side drop is 98cm – 60 cm less and the difference between the south side and north side is much greater at 19cm. Here, there is clearly less sediment towards the northern end of the beach. Is our hypotheses correct? Overall, longshore drift is being managed within Swanage Bay. It is possible to conclude that the groynes are protecting Swanage from further erosion and maintaining the landscape. However, maintenance of the beach is still required with redistribution of sand after storms and beach replenishment needs repeating. The groynes are disrupting the natural processes of erosion, transportation and deposition. As a result, sediment starvation is being caused, evidence of erosion can be clearly seen to the north.
What were the primary data
collection techniques?
• Groyne drops
• Beach width measurements
• Photographs
• Field sketches
Remember you need to be able
to evaluate these methods
What were the primary data
presentation techniques?
• Annotated photographs
(strategies)
• Bar charts
Remember you need to be able
to evaluate these methods
Secondary data: Maps - helped locate the study and identify the
discordant coastline
Text books - deepened understanding of rock types
RGS website - gave facts and figures about the depth of problem
and solutions.

36
Questions Each exam section will start with short answer, point marked questions (1, 2, 3 and 4 mark questions) before finishing with a level of response question of either 6 marks, 8 marks or 12 marks.
Whether the theme ends with a 6 mark, 8 mark or 12 mark question will vary year on year – but there will always be one 6 mark, one 8 mark and one 12 mark question on the paper as a whole.
Case Studies The 12 mark question will also have 3 SPaG marks available (total of 15 marks for the question).
River Severn Isle of Purbeck Urban regeneration of Greenwich Peninsula
Southampton Flood Event - Somerset Levels
*Not a Case STUDY Energy patterns
Q1. Discuss how human activity has influenced the geomorphic processes in this landscape. (6)
Q1. Explain how human activity has influenced the geomorphic processes in this landscape. (6)
Q1. Explain how government policy can lead to uneven development within the UK. (6) Change govt. policy for location, economic change/infrastructure
Q1. Describe the role of your city within its region, nation and the world.(6)
Q1. To what extent was weather the cause of the UK flood event you have studied. (8)
*Q1. Evaluate the success of one national strategy to sustainably improve energy supply. (6)
Q2. Examine the impact of geomorphic processes on the formation of landforms in your chosen River landscape.(8)
Q2. Examine the impact of geomorphic processes on the formation of landforms in your chosen coastal landscape. (8)
Q2. To what extent was urban and economic decline managed successfully for a location of your chosen study (8)
Q2. To what extent has the city of your chosen location successfully managed a contemporary challenge (transport) (12)
Q2. Assess the impacts of a flood event you have studied. (8)
*Q2. Assess whether the sustainable management of energy has been successful at a local scale. (15)
Q3. To what extent has human activity positively impacted the river landscape in your chosen area? (8)
Q3. Examine how far human activity has positively impacted the coastal landscape in your chosen area. (8)
Q3. Examine the causes of economic change in your chosen UK city (8)
Q3. To what extent has migration influenced the character of a city of your chosen location? (8) Q3b. Examine the factors that influence the ways of life in your chosen city. (8)
Q3a. Examine the responses to a flood event. (8) Q3b. Examine the impact of how a flood event was managed at a variety of scales (15)
*Q3. Using your own understanding, assess how far fracking has modified the UK environment.(6) (Fracking Could be changed for; wind, mechanisation of farming, fishing, reservoirs, water transfer schemes)
Q4. Discuss how geomorphic processes have led to the formation of Floodplains and Levees. (6) (Re-use this Q for other landforms – waterfalls/meander/ox-bow lakes)
*Q4. Discuss how geomorphic processes have led to the formation of beaches. (6) (spits/headlands & bays/stacks &stumps)
Q4. To what extent was urban decline managed successfully for a location of your chosen study (8)
Q4. Contemporary challenges affecting UK cities include housing availability, transport provision and waste management. To what extent is housing availability the greatest contemporary challenge affecting your chosen UK city? (15)
*Q4. How can air masses lead to extreme weather in the UK? (6)
*Q4a. Using your own understanding, assess how far mechanisation of farming has modified the environment and ecosystem.(6) *Q4b. Using your own understanding, assess how far commercial fishing has modified the environment and ecosystem.(6)
*Q5. Describe three features of a glaciated landscape. (3) *Not Case Study
*Q5. To what extent has Southampton passed through the stages of the urbanisation cycle? (12)
*Q5 ‘Drought has a greater impact than foods. Discuss using your own knowledge (Somerset vs Australia)
*Q5. To what extent should non-renewable energy contribute to the UK’s future energy mix? Consider the economic, political and environmental factors?(15).
Be ready to compare river and coasts Be ready to compare to Rio Compare to Australia High marks are not just for case studies!
37
Case Studies
Peruvian Amazon Andros Barrier Reef LIDC Ethiopia and Aid EDC City Rio De Janeiro El Nino – The Big Dry “A drought Event”
Q1. Environmental management strategies often fail to protect ecosystems. How far do you agree with this statement in relation to one ecosystem that you have studied? (6)
Q1. Environmental management strategies often fail to protect ecosystems. How far do you agree with this statement in relation to one ecosystem that you have studied? (6)
Q1. To what extent is the location of your chosen LIDC or EDC the main cause for its level of development? (15) You may wish to consider; political development (colonialism), imports / exports, international investment, social factors or technological developments.
Q1. You have studied a UK city and a city in an LIDC / EDC country. Evaluate which of these cities have been the most successful at improving the quality of life for its people. (15) Consider; culture, ethnicity, housing, leisure, transport and waste management.
Q1. Discuss the differences in extreme weather conditions in contrasting countries. You should develop your ideas fully. (6) (Somerset Vs Australia)
Q2. Evaluate the sustainability of one attempt to manage threats to the biodiversity of a tropical Rainforest. (15)
Q2. Evaluate the sustainability of one attempt to manage threats to the biodiversity of a Coral Reef. (15)
Q2. Analyse the influence of one aid project on the economic development of an LIDC or EDC. (8)
Q2. Examine how far migration influences the growth and character of cities in LIDCs or EDCs. Use case study knowledge in your answer. (12)
Q2. Discuss the effects of drought on people and the environment in your case study area.(6)
Q3. ‘Tropical rainforests experience greater threats to their biodiversity than coral reefs.’ To what extent do you agree with this statement? (6)
Q3. Evaluate the success of one
small scale example of sustainable
management for a location of your
choice (6)
Q3. Study the Rostow model. Discuss and justify which stage your chosen EDC / LIDC belongs to. (8)
Q3. Contemporary challenges affecting LIDC / EDC cities include housing availability, transport provision and waste management. To what extent is housing availability the greatest contemporary challenge affecting your chosen LIDC / EDC city? (15)
Q3. Explain how El Niño/La Niña leads to drought in your case study area (6)
Q4. Explain how the ecosystems of the Tropical Rainforest / Coral Reef are interdependent (12). You will need to discuss nutrient cycles
in both, water cycle in TRF, as well as food chains. Interdependence =
soil, climate, plants, animals.
Q4. To what extent has Foreign investment in Ethiopia led to enhanced development? (8) Consider technological developments, TNC’s and the Chinese involvement
Q4. Discuss the strategies that different stakeholders used to adapt to the Drought conditions caused be El Nino / La Nina. (12)
*Q5. Explain how the Desert ecosystem is interdependent. (4) *Not a case study. Do you know your different ecosystems? Hot desert, polar, grasslands, temperate forests
Q5. Name and locate key coral reef locations (6)
*Q5. What are the advantages and disadvantages of ‘number of internet users’ as a development indicator? (4) What about HDI? GNI?
Q4. Examine the factor that influence the ways of life in your chosen city. (8)
*Q5. Suggest how an increased number of tropical storms can be linked to climate change. (4) Re-answer for drought
Q6. Name and locate key Tropical Rainforest locations (6)
Q6. Evaluate whether tropical rainforests are of more value than coral reefs to humans and the planet. (15)
Q6. Name one economic indicator and explain how it shows how developed an LIDC / EDC is.
Q5. Describe the role of your city within its region, nation and the world.(6)
*Q6. To what extent is climate change natural or caused by humans? (15)
Be ready to compare the 2 ecosystems Be ready to compare to UK Be ready to compare to Southampton
Be ready to compare Australia’s drought To UK Somerset floods