carson city consolidated municipality notice of meeting of the ...
367
Audit Committee Page 1 May 10, 2018 CARSON CITY CONSOLIDATED MUNICIPALITY NOTICE OF MEETING OF THE AUDIT COMMITTEE Day: Thursday Date: May 10, 2018 Time: Beginning at 3:00 pm Location: Community Center, Sierra Room, 851 East William Street, Carson City, Nevada 851 East William Street Carson City, Nevada AGENDA 1. Call to Order 2. Roll Call 3. Public Comments and Discussion: The public is invited at this time to comment on and discuss any topic that is relevant to, or within the authority of, the Carson City Audit Committee. In order for members of the public to participate in the Committee’s consideration of an agenda item, the Committee strongly encourages members of the public to comment on an agenda item during the item itself. No action may be taken on a matter raised under public comment unless the item has been specifically included on the agenda as an item upon which action may be taken. 4. For Possible Action: Approval of Minutes - February 21, 2018 & February 28, 2018 5. For Possible Action: Adoption of Agenda 6. Meeting Items 6.A For Possible Action: Discussion and direction to Staff regarding the results of the annual audit of the Carson City Comprehensive Annual Financial Report for the fiscal year ended June 30, 2017. (Jason Link, [email protected]) Staff Summary: Representatives from Eide Bailey, LLP and City staff will be discussing the results of the annual audit of the Carson City Comprehensive Annual Financial Report for the fiscal year ended June 30, 2017. 6.B For Possible Action: Discussion and direction to Staff regarding the work plan of the external auditor in conjunction with the annual audit of the Carson City Comprehensive Annual Financial Report for the fiscal year ended June 30, 2018. (Jason Link, [email protected]) Staff Summary: Representatives from Piercy Bowler and City staff will be discussing the work plan of the annual audit of the Carson City Comprehensive Annual Financial Report for the fiscal year ended June 30, 2018.
-
Upload
khangminh22 -
Category
Documents
-
view
0 -
download
0
Transcript of carson city consolidated municipality notice of meeting of the ...

Audit Committee Page 1 May 10, 2018
CARSON CITY CONSOLIDATED MUNICIPALITY NOTICE OF MEETING OF THE
AUDIT COMMITTEE Day: Thursday Date: May 10, 2018 Time: Beginning at 3:00 pm Location: Community Center, Sierra Room, 851 East William Street, Carson City, Nevada 851 East William Street Carson City, Nevada
AGENDA
1. Call to Order
2. Roll Call 3. Public Comments and Discussion: The public is invited at this time to comment on and discuss any topic that is relevant to, or within the authority of, the Carson City Audit Committee. In order for members of the public to participate in the Committee’s consideration of an agenda item, the Committee strongly encourages members of the public to comment on an agenda item during the item itself. No action may be taken on a matter raised under public comment unless the item has been specifically included on the agenda as an item upon which action may be taken.
4. For Possible Action: Approval of Minutes - February 21, 2018 & February 28, 2018
5. For Possible Action: Adoption of Agenda 6. Meeting Items
6.A For Possible Action: Discussion and direction to Staff regarding the results of the annual audit of the Carson City Comprehensive Annual Financial Report for the fiscal year ended June 30, 2017. (Jason Link, [email protected]) Staff Summary: Representatives from Eide Bailey, LLP and City staff will be discussing the results of the annual audit of the Carson City Comprehensive Annual Financial Report for the fiscal year ended June 30, 2017.
6.B For Possible Action: Discussion and direction to Staff regarding the work plan of the external auditor in conjunction with the annual audit of the Carson City Comprehensive Annual Financial Report for the fiscal year ended June 30, 2018. (Jason Link, [email protected]) Staff Summary: Representatives from Piercy Bowler and City staff will be discussing the work plan of the annual audit of the Carson City Comprehensive Annual Financial Report for the fiscal year ended June 30, 2018.
Audit Committee Page 2 May 10, 2018
6.C For Possible Action: To accept and approve the Internal Auditor’s report and procedures related to the Public Guardian’s asset liquidation process and provide recommendations to the Board of Supervisors related to the audit findings. (Jason Link, [email protected]) Staff Summary: The Internal Auditor has completed a review of the Public Guardian asset liquidation process. Moss Adams will present their report to the Audit Committee for discussion and possible recommendations to the Board of Supervisors. 6.D For Possible Action: To accept and approve the Internal Auditor’s report and procedures related to the capital projects process and provide recommendations to the Board of Supervisors related to the audit findings. (Jason Link, [email protected]) Staff Summary: The Internal Auditor has completed a review of Carson City’s capital projects process. Moss Adams will present their report to the Audit Committee for discussion and possible recommendations to the Board of Supervisors.
6.E For Possible Action: Discussion and direction to Staff regarding the current Audit Work Program Update. (Jason Link, [email protected]) Staff Summary: Representatives from Moss Adams and City staff will be discussing and taking direction from the Audit Committee regarding the current work program.
6.F For Possible Action: Discussion and possible action to identify, discuss, and provide recommendations to the Board of Supervisors on projects to be performed by the Internal Auditor for the period ending June 30, 2019. (Jason Link, [email protected]) Staff Summary: Moss Adams will provide recommendations for future internal audits for the period ending June 30, 2019.
6.G Presentation Only: Presentation to inform the Audit Committee on the progress of Carson City’s Asset Management Program. (Dan Stucky; [email protected], Stephanie Hicks; [email protected], and Matt Lawton; [email protected]) Staff Summary: Staff will provide information to the Audit Committee regarding the progress of Carson City’s Asset Management Program.
7. Public Comment: The public is invited at this time to comment on any matter that is not specifically included on the agenda as an action item. No action may be taken on a matter raised under this item of the agenda.
8. For Possible Action: To Adjourn --------------------------------------------------------------------------------------------------------------------------- Agenda Management Notice - Items on the agenda may be taken out of order; the public body may combine two or more agenda items for consideration; and the public body may remove an item from the agenda or delay discussion relating to an item on the agenda at any time. Titles of agenda items are intended to identify specific matters. If you desire detailed information concerning any subject matter itemized within this agenda, you are encouraged to call the responsible

Audit Committee Page 3 May 10, 2018
agency or the City Manager’s Office. You are encouraged to attend this meeting and participate by commenting on any agendized item. Notice to persons with disabilities: Members of the public who are disabled and require special assistance or accommodations at the meeting are requested to notify the City Manager’s Office in writing at 201 North Carson Street, Carson City, NV, 89701, or by calling (775) 887-2100 at least 24 hours in advance. To request a copy of the supporting materials for this meeting contact Courttney Nicholas at [email protected] or call (775) 887-2133. This agenda and backup information are available on the City’s website at www.carson.org, and at the Finance Office - City Hall, 201 N. Carson Street, Ste 3, Carson City, Nevada (775) 887-2133. This notice has been posted at the following locations: Community Center 851 East William Street City Hall 201 North Carson Street Carson City Library 900 North Roop Street Community Development Permit Center 108 Proctor Street http://notice.nv.gov


CARSON CITY AUDIT COMMITTEEMinutes of the February 21, 2018 Meeting
Page 1 DRAFT
A regular meeting of the Carson City Audit Committee was scheduled for 3:00 p.m. on Wednesday,February 21, 2018 in the Community Center Sierra Room, 851 East William Street, Carson City, Nevada.
PRESENT: Chairperson Stephen FergusonVice Chairperson Michael BertrandMember Lori BagwellMember Ernie MayhornMember Bepsy Strasburg
STAFF: Jason Link, Chief Financial OfficerAdriana Fralick, Chief Deputy District AttorneyKathleen King, Chief Deputy Clerk
NOTE: A recording of these proceedings, the committee’s agenda materials, and any writtencomments or documentation provided to the Clerk, during the meeting, are part of the public record. Thesematerials are available for review, in the Clerk’s Office, during regular business hours.
1 - 2. CALL TO ORDER AND ROLL CALL (3:04:30) - Chairperson Ferguson called the meeting toorder at 3:04 p.m. Ms. King called the roll; a quorum was present.
3. PUBLIC COMMENTS AND DISCUSSION (3:04:54) - Chairperson Ferguson entertained publiccomment; however, none was forthcoming.
4. POSSIBLE ACTION ON APPROVAL OF MINUTES (3:05:35) - Chairperson Fergusonintroduced this item. Ms. Fralick directed that no action could be taken because the date of the minutes tobe approved was inadvertently omitted from the agenda. Chairperson Ferguson advised that approval ofthe October meeting minutes would be deferred to the next meeting.
5. POSSIBLE ACTION ON ADOPTION OF AGENDA (3:06:07) - Chairperson Fergusonwelcomed Member Strasburg, who expressed appreciation for the opportunity to serve. ChairpersonFerguson entertained a motion to adopt the agenda. Vice Chairperson Bertrand so moved. The motionwas seconded and carried unanimously.
6. PUBLIC MEETING ITEMS:6(A) DISCUSSION AND POSSIBLE ACTION TO DIRECT STAFF REGARDING THE
CURRENT AUDIT WORK PROGRAM UPDATE (3:06:51) - Chairperson Ferguson introduced thisitem. Mr. Link provided an overview of the staff report, and introduced Moss-Adams LLP Partner MarkSteranka. Mr. Steranka reviewed the February 21, 2018 memorandum included in the agenda materials.
Chief Information Officer Eric Von Schimmelmann and Mr. Steranka responded to questions regardingthe IT Security Review, and extensive discussion followed. Chairperson Ferguson entertained a motion. Member Bagwell moved to remove the Performance Metrics Validation Project from the Audit Plan. Vice Chairperson Bertrand seconded the motion. Motion carried 5-0.
5

CARSON CITY AUDIT COMMITTEEMinutes of the February 21, 2018 Meeting
Page 2 DRAFT
Chairperson Ferguson entertained a motion relative to the IT Security Policy. Following extensivediscussion, Member Mayhorn moved to redirect Moss - Adams LLP for the IT Security Review togo from testing into policy creation, and shift the $5,000 from the Performance Metrics ValidationProject, as well as $5,000 from the Audit Findings Validation Project, to make that a $20,000 budget. Vice Chairperson Bertrand seconded the motion. Motion carried 5-0.
6(B) DISCUSSION AND POSSIBLE ACTION REGARDING THE MONITORING,REVIEW, AND CLOSURE OF INTERNAL AUDIT FINDINGS INCLUDED IN THE AUDITFINDINGS TRACKING REPORT AND PROVIDE RECOMMENDATIONS TO THE BOARD OFSUPERVISORS FOR CLOSURE OF COMPLETED PROJECTS (3:52:12) - Chairperson Fergusonintroduced this item, and Moss - Adams LLP Partner Mark Steranka reviewed the agenda materials. Mr.Link, Mr. Steranka, and Chief Information Officer Eric Von Schimmelmann responded to questions ofclarification. Discussion took place throughout the committee’s review of the report which was includedin the agenda materials.
Chairperson Ferguson entertained comments or discussion on HTE or the small works projects review. When no comments were forthcoming, he entertained a motion. Member Bagwell moved to close HTE,“seven of them and then item 3, the final one on small works projects.” Member Mayhorn secondedthe motion. Motion carried 5-0.
6(C) POSSIBLE ACTION TO APPROVE THE FINANCE REVIEW AND SELECTIONCOMMITTEE’S RECOMMENDATION FOR CONTRACT AWARD TO PIERCY BOWLERTAYLOR & KERN FOR THE CARSON CITY EXTERNAL AUDIT FUNCTION, ANDAUTHORIZE STAFF TO PREPARE A CONTRACT AND BOARD ACTION FORM FOR BOARDOF SUPERVISORS APPROVAL (4:14:35) - Chairperson Ferguson introduced this item. Mr. Linkprovided background information and reviewed the agenda materials. Mr. Link responded to questions anddiscussion ensued. Following discussion, consensus of the committee was to schedule a special meetingfor 5:00 p.m. on February 28th.
7. PUBLIC COMMENT (4:31:14) - Chairperson Ferguson entertained public comment; however,none was forthcoming. Following a brief discussion, consensus of the committee was to schedule the nextregular committee meeting for 3:00 p.m. on Thursday, May 10th.
8. ACTION TO ADJOURN (4:32:50) - Chairperson Ferguson adjourned the meeting at 4:32 p.m.
The Minutes of the February 21, 2018 Carson City Audit Committee meeting are so approved this _____day of May, 2018.
_________________________________________________STEPHEN FERGUSON, Chair
6

CARSON CITY AUDIT COMMITTEEMinutes of the February 28, 2018 Special Meeting
Page 1 DRAFT
A meeting of the Carson City Audit Committee was scheduled for 5:00 p.m. on Wednesday, February 28,2018 in the Community Development Permit Center Conference Room, 108 East Proctor Street, CarsonCity, Nevada.
PRESENT: Chairperson Stephen FergusonVice Chairperson Michael BertrandMember Lori BagwellMember Ernie MayhornMember Bepsy Strasburg
STAFF: Nancy Paulson, Deputy City ManagerJason Link, Chief Financial OfficerLaura Rader, Purchasing and Contracts AdministratorIris Yowell, Deputy District AttorneyKathleen King, Chief Deputy Clerk
NOTE: A recording of these proceedings, the committee’s agenda materials, and any writtencomments or documentation provided to the Clerk, during the meeting, are part of the public record. Thesematerials are available for review, in the Clerk’s Office, during regular business hours.
1 - 2. CALL TO ORDER AND ROLL CALL (5:09:22) - Chairperson Ferguson called the meeting toorder at 5:09 p.m. Ms. King called the roll; a quorum was present. Vice Chairperson Bertrand participatedby telephone.
3. PUBLIC COMMENTS AND DISCUSSION (5:09:49) - Chairperson Ferguson entertained publiccomment; however, none was forthcoming.
4. POSSIBLE ACTION ON APPROVAL OF MINUTES - October 3, 2017 (5:10:24) -Chairperson Ferguson introduced this item, and entertained a motion. Member Bagwell moved toapprove the minutes, as presented. Member Mayhorn seconded the motion. Motion carriedunanimously.
5. POSSIBLE ACTION ON ADOPTION OF AGENDA (5:10:58) - Chairperson Ferguson deemedthe agenda adopted, as published.
6. PUBLIC MEETING ITEMS:6(A) POSSIBLE ACTION TO RECOMMEND THAT THE BOARD OF SUPERVISORS
APPROVE THE FINANCE REVIEW AND SELECTION COMMITTEE’S RECOMMENDATIONFOR CONTRACT AWARD TO PIERCY BOWLER TAYLOR & KERN FOR THE CARSONCITY EXTERNAL AUDIT FUNCTION (5:11:19) - Chairperson Ferguson introduced this item, and Mr.Link reviewed the agenda materials. At Chairperson Ferguson’s request, Mr. Link reviewed the Statementsof Qualification process, and explained the recommendation of Piercy Bowler Taylor & Kern. Ms. Paulsonand Ms. Rader provided additional clarification. Mr. Link, Ms. Paulson, and Ms. Rader responded toquestions of clarification, and discussion followed.
7

CARSON CITY AUDIT COMMITTEEMinutes of the February 28, 2018 Special Meeting
Page 2 DRAFT
Chairperson Ferguson entertained additional comments or questions and, when none were forthcoming,a motion. Member Strasburg moved to approve the Finance Review and Selection Committee’srecommendation for contract award to Piercy Bowler Taylor & Kern for the Carson City externalaudit function, as presented. Member Mayhorn seconded the motion. Motion carried 5-0.
7. PUBLIC COMMENT (5:26:04) - Chairperson Ferguson entertained public comment; however,none was forthcoming.
8. ACTION TO ADJOURN (5:26:21) - Chairperson Ferguson adjourned the meeting at 5:26 p.m.
The Minutes of the February 28, 2018 special meeting of the Carson City Audit Committee are so approvedthis _____ day of May, 2018.
_________________________________________________STEPHEN FERGUSON, Chair
8

Final Version: 12/04/15
STAFF REPORT
Report To: Audit Committee Meeting Date: 05/10/2018
Staff Contact: Jason Link, Chief Financial Officer
Agenda Title: For Possible Action: To accept and approve the External Auditor’s report and procedures related to the Carson City Comprehensive Annual Financial Report for fiscal year ended June 30, 2017 and provide recommendations to the Board of Supervisors related to the audit findings. (Jason Link, [email protected])
Staff Summary: Representatives from Eide Bailey, LLP and City staff will be discussing the results of the annual audit of the Carson City Comprehensive Annual Financial Report for the fiscal year ended June 30, 2017.
Agenda Action: Formal Action/Motion Time Requested: 10 minutes
Proposed MotionWill depend on discussion and possible recommendations.
Board’s Strategic GoalEfficient Government
Previous Action N/A
Background/Issues & Analysis NRS 354.624 requires the City to provide for an annual audit of all its financial statements. The Carson City Comprehensive Annual Financial Report (CAFR) for the fiscal year ended June 30, 2017 has been completed by the Finance Department and audited by the City’s independent auditors, Eide Bailly, LLP.
The CAFR for fiscal year 2017 included two (2) financial statement findings and two (2) federal award findings and questioned costs (found on pages 202 to 205 in the CAFR).
Applicable Statute, Code, Policy, Rule or Regulation NRS 354.624, Carson City Charter 3.075, Carson City Municipal Code 2.14.040(2)(f)
Financial InformationIs there a fiscal impact? Yes No
If yes, account name/number:
Is it currently budgeted? Yes No
Explanation of Fiscal Impact: N/A9

Staff Report Page 2
Alternatives N/A
Board Action Taken:Motion: ______________________________ 1) _________________ Aye/Nay 2) _________________ ________
________________________________
___________________________ (Vote Recorded By)
10

w w w . e i d e b a i l l y . c o m
Presentation of 2017 Audit Results
CARSON CITY, NEVADA
For Presentation Purposes Only
Dan Carter, CPA – Engagement [email protected]
775.689.9271
This presentation is intended solely for information and use by the Board of Supervisors and management of Carson City and is not intended to be and should not be used by anyone other than these specified parties.
11

w w w . e i d e b a i l l y . c o m
CONTENTS
Fiscal Year 2017 Financial Highlights
Summary of Audit Results
On the Horizon
For Presentation Purposes Only
12

w w w . e i d e b a i l l y . c o m
Fiscal Year 2017 Highlights
For Presentation Purposes Only
13
w w w . e i d e b a i l l y . c o m
For Presentation Purposes Only
14

w w w . e i d e b a i l l y . c o m
For Presentation Purposes Only
15

w w w . e i d e b a i l l y . c o m
For Presentation Purposes Only
16

w w w . e i d e b a i l l y . c o m
For Presentation Purposes Only
17

w w w . e i d e b a i l l y . c o m
For Presentation Purposes Only
18

w w w . e i d e b a i l l y . c o m
For Presentation Purposes Only
19

w w w . e i d e b a i l l y . c o m
For Presentation Purposes Only
20

w w w . e i d e b a i l l y . c o m
For Presentation Purposes Only
21

w w w . e i d e b a i l l y . c o m
Summary of Audit Results
For Presentation Purposes Only
22

w w w . e i d e b a i l l y . c o m
Summary of Audit Results
Independent Auditor’s Report on the Basic Financial Statements (pgs. 9-11)
Independent Auditor’s Report on Internal Control over Financial Reporting and on Compliance and Other Matters Based on an Audit of Financial Statements Performed in Accordance with Government Auditing Standards (pgs. 188-189)
Independent Auditor’s Report on Compliance For Each Major Federal Program and Report on Internal Control Over Compliance Required by Uniform Guidance (pgs. 190-192)
For Presentation Purposes Only
23

w w w . e i d e b a i l l y . c o m
Summary of Audit Results
Independent Auditor’s Report on the Basic Financial Statements
Unmodified opinion
Compliance with NRS and NAC is discussed in Note 2B to the financial statements (pg. 45)
For Presentation Purposes Only
24

w w w . e i d e b a i l l y . c o m
Summary of Audit Results
Independent Auditor’s Report on Internal Control over Financial Reporting and on Compliance and Other Matters Based on an Audit of Financial Statements Performed in Accordance with Government Auditing Standards
Not an expression of an opinion
Two material weaknesses identified
No significant deficiencies reported
For Presentation Purposes Only
25

w w w . e i d e b a i l l y . c o m
Summary of Audit Results
Independent Auditor’s Report on Compliance For Each Major Federal Program and Report on Internal Control Over Compliance Required by Uniform Guidance
Modified opinion on complianceNot an expression of
an opinion regarding internal control over complianceTwo material
weaknesses identified No significant
deficiencies reported
For Presentation Purposes Only
26

w w w . e i d e b a i l l y . c o m
Summary of Audit Results
Status of Prior Year Findings
Prior year reported three findings
Corrective action has been taken by the City for two of the prior year findings.
Finding 2016-001 not corrected.
For Presentation Purposes Only
27
w w w . e i d e b a i l l y . c o m
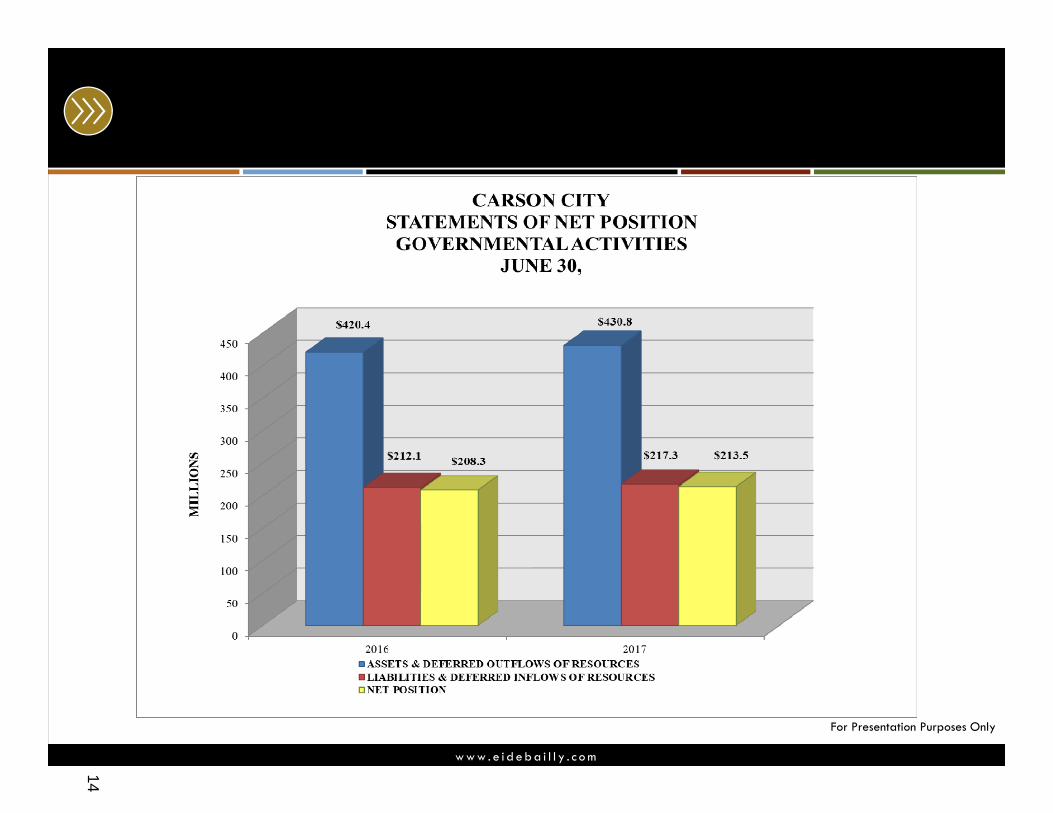
On the Horizon
Governmental Accounting Standards Board (GASB) Statement No. 75 – Accounting and Financial Reporting for Postemployment Benefits Other Than Pension Plans
For Presentation Purposes Only
28

w w w . e i d e b a i l l y . c o m
This presentation is presented with the understanding that the information contained does not constitute legal, accounting or other professional advice. It is not intended to be responsive to any individual situation or concerns, as the contents of this presentation are intended for general informational purposes only. Viewers are urged not to act upon the information contained in this presentation without first consulting competent legal, accounting or other professional advice regarding implications of a particular factual situation. Questions and additional information can be submitted to your Eide Bailly representative, or to the presenter of this session.
Questions?
29

w w w . e i d e b a i l l y . c o m
Dan Carter, CPA – Engagement [email protected]
775.689.9271
Thank You!
30

Carson City, nevada Comprehensive annual
FinanCial report year ended June 30, 2017
31

32

CARSON CITY, NEVADA COMPREHENSIVE ANNUAL FINANCIAL REPORT
YEAR ENDED JUNE 30, 2017
Prepared by: Finance Department Nancy Paulson, Chief Financial Officer
33

34

CARSON CITY, NEVADA COMPREHENSIVE ANNUAL FINANCIAL REPORT
FOR THE YEAR ENDED JUNE 30, 2017
TABLE OF CONTENTS
Page INTRODUCTORY SECTION Letter of Transmittal 1-5 GFOA Certificate of Achievement 6 Organization Chart 7 Listing of Principal Officials 8 FINANCIAL SECTION Independent Auditor’s Report 9-11 Management’s Discussion and Analysis (required supplementary information) 12-21 Basic Financial Statements: Government-Wide Financial Statements Statement of Net Position 22-23 Statement of Activities 24-25 Fund Financial Statements: Balance Sheet – Governmental Funds 26 Reconciliation of the Balance Sheet to the Statement of Net Position – Governmental Funds 27 Statement of Revenues, Expenditures, and Changes in Fund Balances – Governmental Funds 28 Reconciliation of the Statement of Revenues, Expenditures, and Changes in Fund Balances to the Statement of Activities – Governmental Funds 29 Statement of Revenues, Expenditures, and Changes in Fund Balance - Budget and Actual - General Fund 30 Statement of Net Position – Proprietary Funds 31-32 Statement of Revenues, Expenses, and Changes in Net Position – Proprietary Funds 33 Statement of Cash Flows – Proprietary Funds 34-35 Statement of Fiduciary Net Position – Fiduciary Funds 36 Statement of Changes in Fiduciary Net Position – Fiduciary Funds 37 Notes to Financial Statements 38-72 Required Supplementary Information: Schedule of Funding Progress - Other Postemployment Benefits 73 Schedule of the City’s Proportionate Share of the Net Pension Liability 74 Schedule of the City’s Contributions 75 Combining and Individual Fund Statements and Schedules: Governmental Funds: Schedule of Revenues, Expenditures, and Changes in Fund Balances – Budget and Actual – General Fund 76-87 Nonmajor Governmental Funds Combining Balance Sheet 88 Nonmajor Governmental Funds Combining Statement of Revenues, Expenditures, and Changes in Fund Balances 89 Nonmajor Special Revenue Funds Combining Balance Sheet 90-94 Nonmajor Special Revenue Funds Combining Statement of Revenues, Expenditures, and Changes in Fund Balances 95-99
35

CARSON CITY, NEVADA COMPREHENSIVE ANNUAL FINANCIAL REPORT
FOR THE YEAR ENDED JUNE 30, 2017
TABLE OF CONTENTS
Page Schedule of Revenues, Expenditures, and Changes in Fund Balances – Budget and Actual:
Senior Citizens Center Fund 100 Cooperative Extension Fund 101 Traffic Transportation Fund 102 Supplemental Indigent Fund 103 Library Gift Fund 104 Administrative Assessments Fund 105 911 Surcharge Fund 106 Capital Projects Fund 107-108Street Maintenance Fund 109Redevelopment Administration Fund 110Carson City Transit Fund 111Commissary Fund 112V & T Special Infrastructure Fund 113Campo Fund 114Airport Fund 115Regional Transportation Fund 116Quality of Life Fund 117-118Grant Fund 119-120
Nonmajor Debt Service Funds Combining Balance Sheet 121Nonmajor Debt Service Funds Combining Statement of Revenues, Expenditures, and Changes in Fund Balances 122Schedule of Revenues, Expenditures, and Changes in Fund Balances – Budget and Actual:
Carson City Debt Service Fund 123-124Redevelopment Debt Service Fund 125
Nonmajor Capital Projects Funds Combining Balance Sheet 126Nonmajor Capital Projects Funds Combining Statement of Revenues, Expenditures, and Changes in Fund Balances 127Schedule of Revenues, Expenditures, and Changes in Fund Balances – Budget and Actual:
Extraordinary Maintenance Fund 128Residential Construction Fund 129Infrastructure Fund 130Redevelopment Revolving Fund 131
Proprietary Funds: Major Enterprise Funds:
Sewer Fund: Schedule of Revenues, Expenses, and Changes in Net Position – Budget and Actual 132
Schedule of Cash Flows – Budget and Actual 133-134Water Fund:
Schedule of Revenues, Expenses, and Changes in Net Position – Budget and Actual 135Schedule of Cash Flows – Budget and Actual 136-137
Nonmajor Enterprise Funds: Combining Statement of Net Position 138Combining Statement of Revenues, Expenses, and Changes in Net Position 139Combining Statement of Cash Flows 140-141
36

CARSON CITY, NEVADA COMPREHENSIVE ANNUAL FINANCIAL REPORT
FOR THE YEAR ENDED JUNE 30, 2017
TABLE OF CONTENTS
Page Ambulance Fund:
Schedule of Revenues, Expenses, and Changes in Net Position – Budget and Actual 142 Schedule of Cash Flows – Budget and Actual 143 Stormwater Drainage Fund:
Schedule of Revenues, Expenses, and Changes in Net Position – Budget and Actual 144 Schedule of Cash Flows – Budget and Actual 145-146
Cemetery Fund: Schedule of Revenues, Expenses, and Changes in Net Position – Budget and Actual 147
Schedule of Cash Flows – Budget and Actual 148Building Permits Fund:
Schedule of Revenues, Expenses, and Changes in Net Position – Budget and Actual 149Schedule of Cash Flows – Budget and Actual 150
Internal Service Funds: Combining Statement of Net Position 151Combining Statement of Revenues, Expenses, and Changes in Net Position 152Combining Statement of Cash Flows 153-154
Group Medical Insurance Fund: Schedule of Revenues, Expenses, and Changes in Net Position – Budget and Actual 155
Schedule of Cash Flows – Budget and Actual 156Workers' Compensation Fund:
Schedule of Revenues, Expenses, and Changes in Net Position – Budget and Actual 157Schedule of Cash Flows – Budget and Actual 158
Insurance Fund: Schedule of Revenues, Expenses, and Changes in Net Position – Budget and Actual 159
Schedule of Cash Flows – Budget and Actual 160Fleet Management Fund:
Schedule of Revenues, Expenses, and Changes in Net Position – Budget and Actual 161Schedule of Cash Flows – Budget and Actual 162-163
Fiduciary Funds: Combining Statement of Changes in Assets and Liabilities – All Agency Funds 164-166
STATISTICAL SECTION (UNAUDITED) Schedule 1.1 – Net Position by Component 167 Schedule 1.2 – Changes in Net Position 168-170Schedule 1.3 – Fund Balances, Governmental Funds 171Schedule 1.4 – Changes in Fund Balances, Governmental Funds 172-173Schedule 2.1 – Assessed and Estimated Actual Value of Taxable Property 174Schedule 2.2 – Direct and Overlapping Property Tax Rates 175Schedule 2.3 – Ten Largest Assessed Valuations 176Schedule 2.4 – Property Tax Levies and Collections 177Schedule 3.1 – Ratios of Outstanding Debt by Type 178Schedule 3.2 – General Obligation Direct and Overlapping Debt 179Schedule 3.3 – Legal Debt Margin Information 180Schedule 3.4 – Pledged Revenue Coverage 181Schedule 4.1 – Demographic and Economic Statistics 182Schedule 4.2 – Principal Employers 183Schedule 5.1 – Full-time Equivalent City Government Employees by Function 184Schedule 5.2 – Operating Indicators by Function/Program 185-186Schedule 5.3 – Capital Assets Statistics by Function/Program 187
37

CARSON CITY, NEVADA COMPREHENSIVE ANNUAL FINANCIAL REPORT
FOR THE YEAR ENDED JUNE 30, 2017
TABLE OF CONTENTS
Page COMPLIANCE SECTION Independent Auditor's Report on Internal Control over Financial Reporting and on Compliance and Other Matters Based on an Audit of Financial Statements Performed in Accordance with Government Auditing Standards 188-189 Independent Auditor's Report on Compliance For Each Major Federal Program; Report on Internal Control Over Compliance Required by Uniform Guidance 190-192
Auditor’s Comments: Statute Compliance 193 Progress on Prior Year Statute Compliance 193 Prior Year Recommendations 193 Current Year Recommendations 193 Schedule of Expenditures of Federal Awards 194-199 Notes to the Schedule of Expenditures of Federal Awards 200
Schedule of Findings and Questioned Costs 201-205 Schedule of Fees Imposed Subject to the Provisions of NRS 354.5989 – Limitation of Fees for Business Licenses 206
38

INTRODUCTORY SECTION
39

40

DEPARTMENT OF FINANCE 201 North Carson Street, Suite #3 • 89701 • (775) 887-2133 1
November 21, 2017 Honorable Mayor, Members of the Board of Supervisors and the Citizens of Carson City: The comprehensive annual financial report of Carson City for the fiscal year ended June 30, 2017, is hereby submitted as mandated by both local ordinances and state statutes. These ordinances and statutes require that Carson City issue annually a report on its financial position and activity, and that this report be audited by an independent firm of certified public accountants.
Management assumes full responsibility for the completeness and reliability of the information contained in this report, based upon a comprehensive framework of internal control that it has established for this purpose. Because the cost of internal control should not exceed anticipated benefits, the objective is to provide reasonable, rather than absolute, assurance that the financial statements are free of any material misstatements.
Eide Bailly, LLP, Certified Public Accountants, have issued an unmodified opinion on
Carson City’s financial statements for the year ended June 30, 2017. The independent auditor’s report is located at the front of the financial section of this report. Carson City is required to undergo an annual single audit in conformity with the provisions of Government Auditing Standards and the U.S. Office of Management and Budget (OMB) Compliance Supplement. Information related to this single audit, including the schedule of expenditures of federal awards, the independent auditor's reports on internal controls and compliance, the schedule of findings and questioned costs and the summary schedule of prior audit findings are included in the compliance section. Accounting principles generally accepted in the United States of America (GAAP) require that management provide a narrative introduction, overview, and analysis to accompany the basic financial statements in the form of Management’s Discussion and Analysis (MD&A). This letter of transmittal is designed to complement the MD&A and should be read in conjunction with it. Carson City’s MD&A can be found immediately following the report of the independent auditors. The financial reporting entity, Carson City, includes all the funds of the primary government (i.e., the Consolidated Municipality of Carson City as legally defined), as well as, all of its component units. Component units are legally separate entities for which the primary government is financially accountable. Blended component units, although legally separate entities, are, in substance, part of the primary government's operations and are included as part of the primary government. Accordingly, the Redevelopment Authority is reported as special revenue, debt service and capital project funds of the primary government. Discretely presented component units are reported in a separate column in the government-wide financial statements to emphasize that they are legally separate from the primary government and to differentiate their financial position and results of operations from those of the primary government. The Carson City Culture and Tourism Authority, formerly known as, Carson City Culture and Tourism Authority and Airport Authority are reported as discretely presented component units.
CARSON CITY, NEVADA CONSOLIDATED MUNICIPALITY AND STATE CAPITAL
41

2
THE CITY AND ITS GOVERNING BODY
Carson City is the capital city of the State of Nevada. Carson City was founded as a trading post in 1858 and incorporated February 25, 1875. Carson City is a combined City and County governmental entity formed by the consolidation of the City of Carson City and Ormsby County on July 19, 1969. Carson City has a land area of 147 square miles and an estimated population of 54,273 as of June 30, 2017. The City is empowered to levy a property tax on both real and personal property located within its boundaries. Real and personal taxable property located within the City has an estimated market value of $4,129,013,637 and an assessed value of $1,445,154,773. The City operates under what is commonly known as a "council-manager" form of government which was established by charter and adopted by the State Legislature. Under this form of government, Carson City is governed by a mayor and four supervisors who are elected at large, on a non-partisan basis, for overlapping four year terms. The Board of Supervisors is a policy-making board, appointing a city manager to oversee daily operations. Carson City provides a full range of services including police and fire protection; sewer and water services; the construction and maintenance of highways, streets and infrastructure; and culture and recreational activities. The City maintains several budgetary controls to ensure compliance with legal provisions embodied in the annual appropriated budget approved by the City's governing body in accordance with Nevada Revised Statutes Chapter 354, the Local Government Budget and Finance Act. Activities of the general fund, special revenue funds, capital projects funds, debt service funds, enterprise funds and internal service funds are included in the annual appropriated budget. The level of budgetary control (that is, the level of which expenditures cannot legally exceed the appropriated amount) is established by function within an individual fund for governmental funds and the sum of operating and non-operating expenses in the proprietary funds.
LOCAL ECONOMY Carson City is located in the Northwestern part of the State. Nevada's rate of growth in population had been one of the highest in the nation, but with the recent economic downturn, this number is expected to remain flat at best for the next several years. Carson City’s population increased 0.6% when comparing July 1, 2016 to July 1, 2017. During the past year, Carson City experienced growth in the real estate market, not unlike the region, the state, and the nation. According to the Assessor’s office, the average sales price of a home this year has risen to around $328,098, up from $279,880 (17% increase) in the prior year. The average price in Carson City hit its peak in 2006 with the average sales price around $346,000. Property tax revenue increased slightly from the prior year (1.3%) due to an increase in assessed valuation for FY 16-17. Taxable sales are now increasing as the economy improves contributing to the $2.6 million (10.4%) increase in the consolidated tax revenues. Our region is finally back to pre-recession unemployment rates at 4.6%. At the end of the current fiscal year, total fund balance of the general fund exceeded the final budget by $4,789,746. Of this amount, $1,355,278 has been included as a budgetary resource in the subsequent year’s budget to eliminate a projected excess of expected expenditures over expected revenues.
42

3
The assessed valuation of Carson City increased 5.2% in FY 16-17 and in FY 17-18 the assessed valuation increased by 3.9%. Due to a cap on the growth in property tax for existing property and improvements approved by the 2005 Nevada State Legislature, the real growth in tax revenues is limited. The growth in the tax bill for residential property is limited to 3% annual growth and commercial property can grow by a maximum of 8% per year. Only new construction is outside of this cap for the first year it is on the tax rolls. The difference between the actual tax calculation (assessed valuation (x) tax rate) and the capped tax calculation is termed the “abatement”. In the general fund, this abatement amount will be approximately $5.75 million in FY 17-18. The growth in the tax bill is further reduced given a provision of Nevada Revised Statute 361.4722, which includes an additional limit based on the greater of the 10-year average percentage change in assessed valuation or twice the percentage increase in the Consumer Price Index (CPI). A very low percentage increase in the CPI of just 1.3% resulted in a property tax cap of 2.6% for both residential and commercial properties for FY 17-18. In an effort to increase property tax revenues and provide a possible funding source for the City’s Asset Management Program, the Board of Supervisors approved a five cent increase in the City’s operating tax rate for FY 17-18. However, due to the property tax caps, property tax revenues are only expected to increase by 3%.
With the recent completion of the Carson Street Downtown Revitalization Project, there is a renewed sense of interest in new retail and restaurant activity in the downtown area. A mixed-use commercial and residential project is currently under construction in the downtown. This project includes commercial space (retail, dining and office space) on the first and second floors and ten residential units on the third and fourth floors. In the southern part of the City, a building permit is currently under review for a Marriott Towneplace Suites. The four story hotel along South Curry Street is planned to include ninety-five guestrooms. Regarding residential activity, plans / construction is moving forward on a variety of projects including the Vintage at Kings Canyon, the Lompa Ranch Development, Mills Landing and Shultz Ranch. In addition, several apartment and townhome projects are in various stages of review / construction throughout the City.
LONG-TERM FINANCIAL PLANNING AND MAJOR INITIATIVES
Unrestricted fund balance (the total of the committed, assigned, and unassigned components of fund balance) in the General Fund at year end was 12.5% of total General Fund expenditures. This amount is significantly above the policy goal set by the Board of Supervisors for budgetary and planning purposes (i.e., one month of general fund expenditures, approximately 8.3%).
Fees charged at the Carson City Landfill were set based upon regional market rates rather than actual costs. The resultant change in rates has produced revenues in excess of expenditures at the Landfill. These excess revenues will be used to help offset overall General Fund ongoing expenditures.
The City has entered back into a period of economic growth and development. New residential and commercial development has been extremely strong with new building permits valued at $108.9 million for calendar year 2016 compared to just $19.8 million in 2009.
Pursuant to Nevada Revised Statutes, the City maintains a five-year Capital Improvement Program (CIP) which serves as its planning document to ensure that its facilities, equipment, and infrastructure are well maintained and operating in peak condition. Under the guidance of a CIP Committee, this process gives the City the ability to plan for its capital needs and allocate short-term and long-term resources appropriately. As part of this process, the City identifies and quantifies the operational costs associated with its capital projects and budgets resources accordingly. The FY 17-18 Capital Improvement Program includes $13.4 million in capital projects and equipment replacement for Governmental Activities and $13.7 million for Business-Type Activities for a total of $27.1 million. Included in this $27.1 million is $9.1 million for the rehabilitation of the Water Resource Recovery Facility and $2.0 million for sewer line replacement, $4.9 million for road construction and signals, $1.2 43

4
million in building improvements, approximately $3.9 million for vehicle and equipment replacement $1.9 million in computer system replacement, $1 million in parks, open space and park equipment replacement, and $3.1 million for other equipment and water system improvements.
A 1/8 cent increase in sales tax was approved and implemented in October 2014 which will be used to pay down capital project bonds. These bonds have been used pursuant to NRS 377B, for projects including, but not limited to, construction of an animal services facility and street and pedestrian improvements in the downtown area which were both completed in October 2016 and a multi-purpose athletic center which was completed in January 2016. Design work has begun for the Downtown Curry Streetscape Project and street beautification and utility improvements on five east / west downtown streets between Carson Street and Curry Street. Construction is anticipated to begin in April 2018. The South Carson Street Corridor Project is currently under design as well with construction anticipated to begin in 2019. The remaining infrastructure sales tax projects are anticipated to be designed and constructed in future years with the proceeds from the issuance of additional bonds.
Improvements to the Water Resource Recovery Facility are being implemented due to our
outdated facility. The City recently completed replacing the secondary treatment and solids mixing systems. The construction of this phase is in close out and is expected to be completed by the end of this year. There is an additional $10 million phase called WRRF – Capital Improvements FY18, which is currently under design that will include some items that weren’t covered in the first phase including odor control system, reconditioning of primary settling tanks, new underground piping to the secondary system, reconditioning of the secondary settling tanks, lining of the overflow basin, repurposing existing aeration basin and replacing electrical distribution systems. This work will continue over the next two years. The Board authorized a comprehensive review of water and sewer rates in fiscal year 2013 and as a result authorized water and sewer rate increases for the five subsequent years to fund these upgrades as well as provide reserves for system reinvestment as the comprehensive review determined we were relying too heavily on debt for capital improvements. The Carson Freeway, Phases 2B-1 and 2B-2 are complete and 2B-3 was completed on August 2, 2017, which extended the freeway from Fairview Drive to Highway 50 / S. Carson Street. By agreement with the State, Carson City will defer payment of local fuel taxes until the completion of Phase 2B-4 which will include the S. Carson St. Interchange.
RELEVANT FINANCIAL POLICIES
A minimum unrestricted ending fund balance of not less than 5% (with a goal of 8.3%) of total budgeted expenditures shall be included in the General Fund budget each fiscal year. An inability to meet this requirement must be approved by the Board of Supervisors.
For the FY 17-18, the City budgeted an ending fund balance of 7.6% of budgeted expenditures,
an increase of 7% from the amount budgeted in the prior fiscal year.
OTHER INFORMATION AWARDS. The Government Finance Officers Association of the United States and Canada (GFOA) awarded a Certificate of Achievement for Excellence in Financial Reporting to Carson City for its comprehensive annual financial report for the fiscal year ended June 30, 2016. The Certificate of Achievement is a prestigious national award recognizing conformance with the highest standards for preparation of state and local government financial reports.
44

5
In order to be awarded a Certificate of Achievement, a government unit must publish an easily readable and efficiently organized comprehensive annual financial report, whose contents conform to program standards. Such a CAFR must satisfy both generally accepted accounting principles and applicable legal requirements.
A Certificate of Achievement is valid for a period of one year only. Carson City has received a Certificate of Achievement for the last twenty-seven consecutive years. We believe our current report continues to conform to the Certificate of Achievement program requirements, and we are submitting it to GFOA.
ACKNOWLEDGMENTS. The preparation of the comprehensive annual financial report on a timely basis was made possible by the dedicated service of the entire staff of the Finance Department. Each member of the department has my sincere appreciation for the contribution made in the preparation of this report.
In closing, without the leadership and support of the Carson City Board of Supervisors, the continued strengthening of the City's finances and the continued dedication to financial excellence would not have been possible.
Sincerely,
Nancy Paulson, CPA Chief Financial Officer
45

6
46

7
Citi
zens
of C
arso
n Ci
ty
Dist
rict A
ttor
ney
Elec
ted
Dist
rict C
ourt
Judg
e (2
)El
ecte
dTr
easu
rer
Elec
ted
Just
ice
of th
e Pe
ace
(2)
Elec
ted
May
or &
Boa
rd o
f Su
perv
isor
s (5)
Elec
ted
Asse
ssor
Elec
ted
Cler
k/Re
cord
erEl
ecte
dSh
eriff
Elec
ted
Juve
nile
De
tent
ion/
Prob
atio
nAp
poin
ted
Publ
ic G
uard
ian
BOS
Appo
inte
dAl
tern
ativ
e Se
nten
cing
BOS
Appo
inte
dIn
tern
al A
udito
rBO
SAp
poin
ted
City
Man
ager
BOS
Appo
inte
d
Depu
tyCi
ty M
anag
erCM
App
oint
ed
Heal
th &
Hum
an
Serv
ices
CM A
ppoi
nted
Fire
De
part
men
tCM
App
oint
ed
Com
mun
ity
Deve
lopm
ent
CM A
ppoi
nted
Fina
nce
Depa
rtm
ent
CM A
ppoi
nted
Busi
ness
Re
sour
ces
Man
ager
CM A
ppoi
nted
Park
s &
Recr
eatio
nCM
App
oint
ed
Publ
ic W
orks
CM A
ppoi
nted
Hum
an R
esou
rces
CM A
ppoi
nted
Info
rmat
ion
Tech
nolo
gyCM
App
oint
ed
Purc
hasi
ng &
Co
ntra
cts
Risk
M
anag
emen
t
Build
ing
Divi
sion
Busi
ness
Li
cens
e
Code
En
forc
emen
t
Plan
ning
Adm
inis
trat
ion
Emer
genc
y M
anag
emen
t
Prev
entio
n
Ope
ratio
ns &
EM
S
Publ
ic H
ealth
Nur
sing
Hum
an S
ervi
ces
Dise
ase P
reve
ntio
n &
Co
ntro
l
Chro
nic D
isea
se
Prev
entio
n&
Hea
lth
Prom
otio
n
Adm
inis
trat
ion
Publ
ic H
ealth
Pr
epar
edne
ss
Recr
eatio
n
Park
M
aint
enan
ce
Ope
n Sp
ace
Com
mun
ity
Cent
er
Aqua
tic Fa
cilit
y
Adm
inis
trat
ion
Adm
inis
trat
ion
Engi
neer
ing
Ope
ratio
ns
Envi
ronm
enta
l
Tran
spor
tatio
n
Faci
litie
s M
aint
enan
ce
47

8
CARSON CITY, NEVADA LISTING OF PRINCIPAL OFFICIALS
FY 2017 TITLE NAME Mayor Robert L. Crowell Supervisor, Ward 1 Karen Abowd Supervisor, Ward 2 Brad Bonkowski Supervisor, Ward 3 Lori Bagwell Supervisor, Ward 4 John Barrette Assessor Dave Dawley Treasurer Gayle Robertson District Attorney Jason Woodbury District Court I Judge James T. Russell District Court II Judge James E. Wilson, Jr. Justice of the Peace Judge Thomas Armstrong Justice of the Peace Judge John Tatro Clerk-Recorder Susan Merriwether Sheriff Ken Furlong City Manager Nick Marano Chief Financial Officer/Risk Manager Nancy Paulson Chief Information Officer Eric Von Schimmelmann Community Development Director Lee Plemel Cooperative Extension Director Lindsay Chichester Library Director Sena Loyd Health & Human Services Director Nicki Aaker Juvenile Special Master Kimberly Okezie Chief Juvenile Probation Officer Ali Banister Parks and Recreation Director Jennifer Budge Fire Chief Sean Slamon Senior Center Director Courtney Warner Human Resources Director Melanie Bruketta Public Works Director Darren Schulz Engineering Manager Daniel Stucky Transportation Program Manager Lucia Maloney
48

FINANCIAL SECTION
49

50

What inspires you, inspires us. Let’s talk. | eidebailly.com5441 Kietzke Ln., Ste. 150 | Reno, NV 89511-2094 | T 775.689.9100 | F 775.689.9299 | EOE
9
Independent Auditor’s Report
To the Honorable Mayor and Members of the Board of Supervisors Carson City, Nevada
Report on the Financial Statements We have audited the accompanying financial statements of the governmental activities, the business-type activities, the aggregate discretely presented component units, each major fund, and the aggregate remaining fund information of Carson City, Nevada (the City) as of and for the year ended June 30, 2017, and the related notes to the financial statements, which collectively comprise the City’s basic financial statements as listed in the table of contents.
Management’s Responsibility for the Financial Statements Management is responsible for the preparation and fair presentation of these financial statements in accordance with accounting principles generally accepted in the United States of America; this includes the design, implementation, and maintenance of internal control relevant to the preparation and fair presentation of financial statements that are free from material misstatement, whether due to fraud or error.
Auditor’s Responsibility Our responsibility is to express opinions on these financial statements based on our audits. We did not audit the financial statements of the Airport Authority of Carson City, Nevada, or the Carson City Culture and Tourism Authority, which represent 100% of the assets, net position, and revenues of the aggregate discretely presented component units. Those statements were audited by other auditors whose reports have been furnished to us, and our opinion, insofar as it relates to the amounts included for the Airport Authority of Carson City, Nevada and the Carson City Culture and Tourism Authority is based solely on the reports of the other auditors. We conducted our audits in accordance with auditing standards generally accepted in the United States of America and the standards applicable to financial audits contained in Government Auditing Standards, issued by the Comptroller General of the United States. Those standards require that we plan and perform the audit to obtain reasonable assurance about whether the financial statements are free from material misstatement.
An audit involves performing procedures to obtain audit evidence about the amounts and disclosures in the financial statements. The procedures selected depend on the auditor’s judgment, including the assessment of the risks of material misstatement of the financial statements, whether due to fraud or error. In making those risk assessments, the auditor considers internal control relevant to the entity’s preparation and fair presentation of the financial statements in order to design audit procedures that are appropriate in the circumstances, but not for the purpose of expressing an opinion on the effectiveness of the entity’s internal control. Accordingly, we express no such opinion. An audit also includes evaluating the appropriateness of accounting policies used and the reasonableness of significant accounting estimates made by management, as well as evaluating the overall presentation of the financial statements. 51

52

10
We believe that the audit evidence we have obtained is sufficient and appropriate to provide a basis for our audit opinions. Opinions In our opinion, based on our audit and the reports of other auditors, the financial statements referred to above present fairly, in all material respects, the respective financial position of the governmental activities, the business-type activities, the aggregate discretely presented component units, each major fund, and the aggregate remaining fund information of the City, as of June 30, 2017, and the respective changes in financial position and, where applicable, cash flows thereof and the respective budgetary comparison for the General Fund for the year then ended in accordance with accounting principles generally accepted in the United States of America. Other Matters Required Supplementary Information Accounting principles generally accepted in the United States of America require that the management’s discussion and analysis on pages 12 through 21, the schedule of funding progress – other postemployment benefits on page 73, the schedule of the City’s proportionate share of the net pension liability on page 74, and the schedule of City’s contributions on page 75, be presented to supplement the basic financial statements. Such information, although not a part of the basic financial statements, is required by the Governmental Accounting Standards Board, who considers it to be an essential part of financial reporting for placing the basic financial statements in an appropriate operational, economic, or historical context. We have applied certain limited procedures to the required supplementary information in accordance with auditing standards generally accepted in the United States of America, which consisted of inquires of management about the methods of preparing the information and comparing the information for consistency with management’s responses to our inquires, the basic financial statements, and other knowledge we obtained during our audit of the basic financial statements. We do not express an opinion or provide any assurance on the information because the limited procedures do not provide us with sufficient evidence to express an opinion or provide any assurance. Other Information Our audit was conducted for the purpose of forming opinions on the financial statements that collectively comprise the City’s financial statements. The introductory section, combining and individual fund financial statements and schedules including budgetary comparisons, and statistical section are presented for purposes of additional analysis and are not a required part of the financial statements. The accompanying schedule of expenditures of federal awards is presented for purposes of additional analysis as required by the audit requirements of Title 2 U.S. Code of Federal Regulations (CAFR) Part 200, Uniform Administrative Requirements, Cost Principles, and Audit Requirements for Federal Awards, and is also not a required part of the basic financial statements. The combining and individual fund financial statements and schedules including budgetary comparisons and the schedule of expenditures of federal awards are the responsibility of management and were derived from and relate directly to the underlying accounting and other records used to prepare the basic financial statements. Such information has been subjected to the auditing procedures applied in the audit of the basic financial statements and certain additional procedures, including comparing and reconciling such information directly to the underlying accounting and other records used to prepare the basic financial statements or to the basic financial statements themselves, and other additional procedures in accordance with auditing standards generally accepted in the United States of America. In our opinion, the combining and individual fund statements and schedules including budgetary comparisons and the schedule of expenditures of federal awards are fairly stated, in all material respects, in relation to the basic financial statements as a whole.
53

54

11
The introductory and statistical sections have not been subjected to the auditing procedures applied in the audit of the basic financial statements and, accordingly, we do not express an opinion or provide any assurance on them.
Prior Year Comparative Information The combining and individual fund financial statements and schedules related to the 2016 financial statements are presented for purposes of additional analysis and were derived from and relate directly to the underlying accounting and other records used to prepare the 2016 financial statements. The information has been subjected to the auditing procedures applied in the audit of the 2016 basic financial statements and certain additional procedures, including comparing and reconciling such information directly to the underlying accounting and other records used to prepare those financial statements or to those financial statements themselves, and other additional procedures in accordance with auditing standards generally accepted in the United States of America. The statements and schedules referred to above are consistent in relation to the basic financial statements from which they have been derived.
Other Reporting Required by Government Auditing Standards In accordance with Government Auditing Standards, we have also issued a report dated November 30, 2017, on our consideration of the City’s internal control over financial reporting and on our tests of its compliance with certain provisions of laws, regulations, contracts, grant agreements, and other matters. The purpose of that report is solely to describe the scope of our testing of internal control over financial reporting and compliance and the results of that testing, and not to provide an opinion on the effectiveness of the City’s internal control over financial reporting or on compliance. That report is an integral part of an audit performed in accordance with Government Auditing Standards in considering the City’s internal control over financial reporting and compliance.
Reno, Nevada November 30, 2017
55

56

Carson City, Nevada Management’s Discussion and Analysis
12
As management of Carson City, Nevada (City), we offer readers of the City’s financial statements this narrative overview and analysis of the financial activities of the City for the fiscal year ended June 30, 2017. We encourage readers to consider the information presented here in conjunction with additional information that we have furnished in our letter of transmittal, which can be found on pages 1-5 of this report.
Financial Highlights The assets and deferred outflows of resources of the City exceeded its liabilities and deferred inflows of
resources at the close of the most recent fiscal year by $314,225,049 (net position). The City’s total net position increased by $11,237,126 (3.7%). This increase is attributable to a year over year
consolidated tax increase of 10.4% while initial budget only included a 4.0% increase. As of the close of the current fiscal year, the City’s governmental funds reported combined ending fund
balances of $22,266,875, a decrease of $629,391 in comparison to the prior year. Approximately 29.0% of this amount ($6,447,478) is available for spending at the City’s discretion (unassigned fund balance).
At the end of the current fiscal year, unrestricted fund balance for the General Fund was $8,179,956, or 12.5% of total General Fund expenditures.
The City’s total bonded debt and notes payable increased by $18,680,868 (11.0%) during the current fiscal year as a result of $25,380,900 of Sewer, Water and Stormwater State Revolving Fund debt issuance, as well as $3,425,293 of Energy Efficiency Installment Purchase Agreements issued, reduced by current year principal payments on debt.
The City’s total capital assets increased by $23,334,552 (4.2%) during the fiscal year as a result of the construction of the water resource recovery facility, the completion of the downtown streetscape project, and the new animal shelter.
Overview of the Financial Statements This discussion and analysis is intended to serve as an introduction to the City’s basic financial statements. The City’s basic financial statements comprise three components: 1) government-wide financial statements, 2) fund financial statements, and 3) notes to the financial statements. This report also contains other supplementary information in addition to the basic financial statements themselves. Government-wide financial statements. The government-wide financial statements are designed to provide readers with a broad overview of the City’s finances, in a manner similar to a private-sector business. The statement of net position presents financial information on all of the City’s assets, liabilities, and deferred inflows / outflows of resources, with the difference reported as net position. Over time, increases or decreases in net position may serve as a useful indicator of whether the financial position of the City is improving or deteriorating. The statement of activities presents information showing how the City’s net position changed during the most recent fiscal year. All changes in net position are reported as soon as the underlying event giving rise to the change occurs, regardless of the timing of related cash flows. Thus, revenues and expenses are reported in this statement for some items that will only result in cash flows in future fiscal periods (e.g., uncollected taxes and earned but unused vacation leave). Both of the government-wide financial statements distinguish functions of the City that are principally supported by taxes and intergovernmental revenues (governmental activities) from other functions that are intended to recover all or a significant portion of their costs through user fees and charges (business-type activities). The governmental activities of the City include general government, public safety, judicial, public works, sanitation, health, welfare, community support, airport, economic opportunity, and culture and recreation. The business-type activities of the City include water, sewer, ambulance, cemetery, building permits and stormwater drainage. The government-wide financial statements include not only the City itself (known as the primary government), but also a legally separate airport authority and a legally separate culture and tourism authority for which the City is financially accountable. Financial information for these component units is reported separately from the financial information presented for the primary government itself. The Redevelopment Authority, although also legally separate, functions for all practical purposes as a department of the City, therefore has been included as an integral part of the primary government. The government-wide financial statements can be found on pages 22-25 of this report. 57

Carson City, Nevada Management’s Discussion and Analysis
13
Fund financial statements. A fund is a grouping of related accounts that is used to maintain control over resources that have been segregated for specific activities or objectives. The City, like other state and local governments, uses fund accounting to ensure and demonstrate compliance with finance-related legal requirements. All of the funds of the City can be divided into three categories: governmental funds, proprietary funds, and fiduciary funds.
Governmental funds. Governmental funds are used to account for essentially the same functions reported as governmental activities in the government-wide financial statements. However, unlike the government-wide financial statements, governmental fund financial statements focus on near-term inflows and outflows of spendable resources, as well as on balances of spendable resources available at the end of the fiscal year. Such information may be useful in evaluating a government’s near-term financing requirements.
Because the focus of the governmental funds is narrower than that of the government-wide financial statements, it is useful to compare the information presented for governmental funds with similar information presented for governmental activities in the government-wide financial statements. By doing so, readers may better understand the long-term impact of the government’s near-term financing decisions. Both the governmental fund balance sheet and the governmental fund statement of revenues, expenditures, and changes in fund balances provide a reconciliation to facilitate this comparison between governmental funds and governmental activities.
The City maintains twenty-five individual governmental funds. Information is presented separately in the governmental fund balance sheet and in the governmental fund statement of revenues, expenditures, and changes in fund balances for the General Fund which is considered to be a major fund. Data from the other twenty-four governmental funds are combined into a single, aggregated presentation. Individual fund data for each of these nonmajor governmental funds is provided in the form of combining and individual fund statements and schedules elsewhere in this report.
The City adopts an annual appropriated budget for its General Fund and for each of its special revenue funds, debt service funds and capital projects funds. A budgetary comparison schedule has been provided for each of the City’s governmental funds to demonstrate compliance with this budget. The budgetary comparison statement for the General Fund the major governmental fund is located in the basic financial statements and budgetary comparison schedules for the nonmajor governmental funds are provided in the individual funds statements.
The basic governmental fund financial statements can be found on pages 26-30 of this report.
Proprietary funds. The City maintains two different types of proprietary funds. Enterprise funds are used to report the same functions presented as business-type activities in the government-wide financial statements. The City uses enterprise funds to account for its water, sewer, ambulance, cemetery, building permit, and stormwater drainage operations. Internal service funds are an accounting device used to accumulate and allocate costs internally among the City’s various functions. The City uses internal service funds to account for its group medical insurance, workers’ compensation, insurance and fleet management. Because these services predominantly benefit governmental rather than business-type functions, they have been included within governmental activities in the government-wide financial statements.
Proprietary funds provide the same type of information as the government-wide financial statements, only in more detail. The proprietary fund financial statements provide separate information for the water and sewer operations, each of which are considered to be major funds of the City. Conversely, internal service funds are combined into a single, aggregated presentation in the proprietary fund financial statements. Data from the other four enterprise funds are combined into a single, aggregated presentation. Individual fund data for each of these nonmajor funds is provided in the form of combining and individual fund statements and schedules elsewhere in this report. Individual fund data for the internal service funds is provided in the form of combining and individual fund statements and schedules elsewhere in this report.
The basic proprietary fund financial statements can be found on pages 31-35 of this report.
Fiduciary funds. Fiduciary funds are used to account for resources held for the benefit of parties outside the government. Fiduciary funds are not reflected in the government-wide financial statement because the resources of those funds are not available to support the City’s own programs. The accounting used for fiduciary funds is much like that used for proprietary funds.
58

Carson City, Nevada Management’s Discussion and Analysis
14
The basic fiduciary fund financial statements can be found on pages 36-37 of this report. Notes to the financial statements. The notes provide additional information that is essential to a gaining full understanding of the data provided in the government-wide and fund financial statements. The notes to the financial statements can be found on pages 38-72 of this report. Other Information. In addition to the basic financial statements and accompanying notes, this report presents required supplementary information concerning the City’s progress in funding its obligation to provide OPEB benefits to its employees, schedule of City’s proportionate share of the net pension liability, and the Schedule of City’s retirement contributions. Required supplementary information can be found on page 73-75 of this report. The combining statements referred to earlier in connection with nonmajor governmental funds, internal service funds, and enterprise funds are presented following the required supplementary information. Combining and individual fund statements and schedules can be found on pages 76-166 of this report.
Government-wide Financial Analysis As noted earlier, net position may serve over time as a useful indicator of a government’s financial position. In the case of the City, assets and deferred outflows of resources exceeded liabilities and deferred inflows of resources by $314,225,049 at the close of the most recent fiscal year. By far the largest portion of the City’s net position (126.0%) reflects its investment in capital assets (e.g., land, buildings, improvements, machinery and equipment, and infrastructure), less any related outstanding debt that was used to acquire those assets. The City uses these capital assets to provide a variety of services to its citizens. Accordingly, these assets are not available for future spending. Although the City’s investment in capital assets is reported net of related debt, it should be noted that the resources used to repay this debt must be provided from other sources, since the capital assets themselves cannot be used to liquidate these liabilities.
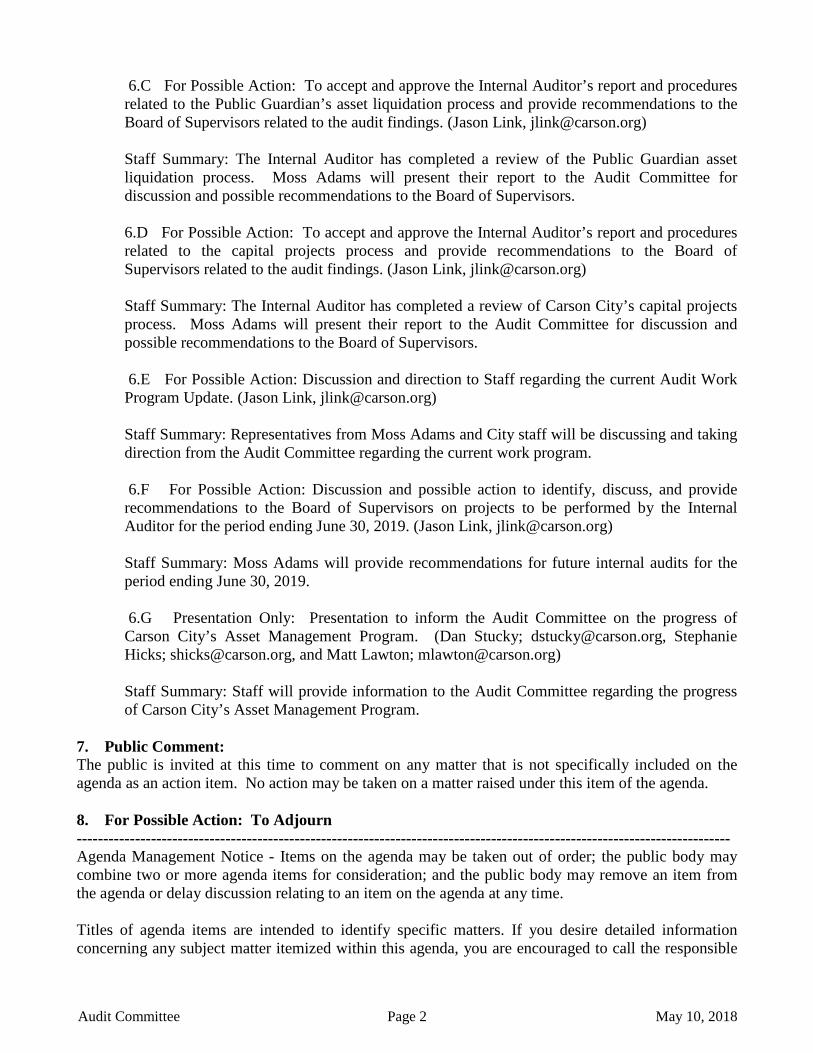
Carson City’s Net Position Governmental Business-type
Activities Activities Total - Primary Government
2017 2016 2017 2016 2017 2016
Current and other assets $ 35,837,763 $ 40,377,560 $ 23,301,945 $ 15,310,416 $ 59,139,708 $ 55,687,976
Capital assets 373,399,113 366,329,346 203,567,677 187,302,922 576,966,790 553,632,268
Total assets 409,236,876 406,706,906 226,869,622 202,613,338 636,106,498 609,320,244 Deferred outflows of resources 21,559,535
13,647,688 2,938,867 2,049,524 24,498,402 15,697,212
Total assets and deferred outflows of resources 430,796,411 420,354,594 229,808,489 204,662,862 660,604,900 625,017,456 Long-term liabilities outstanding 195,146,009 190,600,752 117,170,531 101,397,266 312,316,540 291,998,018
Other liabilities 15,004,728 11,970,340 10,879,547 7,257,065 25,884,275 19,227,405
Total liabilities 210,150,737 202,571,092 128,050,078 108,654,331 338,200,815 311,225,423 Deferred inflows of resources 7,191,779 9,519,869 987,257 1,284,241 8,179,036 10,804,110 Total liabilities and deferred inflows of resources 217,342,516 212,090,961 129,037,335 109,938,572 346,379,851 322,029,533
Net position: Net investment in capital assets 302,089,834 299,558,400 93,571,145 94,521,657 395,660,979 394,080,057
Restricted 10,081,646 13,049,482 - - 10,081,646 13,049,482
Unrestricted (98,717,585) (104,344,249) 7,200,009 202,633 (91,517,576) (104,141,616)
Total net position $213,453,895 $208,263,633 $100,771,154 $94,724,290 $314,225,049 $302,987,923
59

Carson City, Nevada Management’s Discussion and Analysis
15
An additional portion of the City’s net position (3.2%) represents resources that are subject to external restrictions on how they may be used. This leaves a negative balance of $91,517,576 for unrestricted net position.
At the end of the current fiscal year, the City is able to report positive balances in two of the three categories of net position for the government as a whole, as well as, for its separate governmental activities. Unrestricted net position is reported as a negative balance. The business-type activities reported positive balances in all categories of net position. In the prior fiscal year, the City reported positive balances in all categories with the exception of unrestricted net position.
The City’s net position increased $11,237,126 during the current fiscal year. The increase is attributable to increases in sales, property and consolidated taxes, as well as charges for services in Building Permits, Sewer and Water Funds.
Carson City’s Changes in Net Position
Governmental Activities Business-Type Activities Total – Primary Government
2017 2016 2017 2016 2017 2016
Revenues:
Program revenues:
Charges for services $13,326,513 $12,395,216 $34,370,565 $31,360,939 $47,697,078 $43,756,155
Operating grants and
contributions 6,263,119 6,910,090 500 - 6,263,619 6,910,090
Capital grants and
contributions 3,936,604 1,767,300 833,172 782,391 4,769,776 2,549,691
General revenues:
Property taxes 27,522,923 27,166,226 - - 27,522,923 27,166,226
Other taxes 45,556,767 42,493,326 - - 45,556,767 42,493,326
Other 353,939 602,647 60,748 187,344 414,687 789,991
Total Revenues 96,959,865 91,334,805 35,264,985 32,330,674 132,224,850 123,665,479
Expenses:
General government 14,887,443 14,820,254 - - 14,887,443 14,820,254
Public safety 34,946,511 34,442,723 - - 34,946,511 34,442,723
Judicial 7,017,989 6,241,597 - - 7,017,989 6,241,597
Public works 9,904,418 9,052,258 - - 9,904,418 9,052,258
Sanitation 2,060,980 1,838,049 - - 2,060,980 1,838,049
Health 5,998,209 6,344,506 - - 5,998,209 6,344,506
Welfare 2,164,908 2,038,500 - - 2,164,908 2,038,500
Culture and recreation 9,595,541 9,530,025 - - 9,595,541 9,530,025
Community support 1,058,025 597,679 - - 1,058,025 597,679
Airport 548,672 465,157 - - 548,672 465,157
Economic opportunity 90,492 119,127 - - 90,492 119,127
Interest and fiscal charges 3,089,777 3,167,238 - - 3,089,777 3,167,238
Sewer - - 10,249,949 9,596,628 10,249,949 9,596,628
Water - - 13,464,964 13,710,079 13,464,964 13,710,079
Stormwater Drainage - - 1,033,393 1,159,632 1,033,393 1,159,632
Ambulance - - 3,544,833 3,505,024 3,544,833 3,505,024
Cemetery - - 227,792 233,663 227,792 233,663
Building Permits - - 1,103,828 1,148,900 1,103,828 1,148,900
Total Expenses 91,362,965 88,657,113 29,624,759 29,353,926 120,987,724 118,011,039 60

Carson City, Nevada Management’s Discussion and Analysis
16
Governmental Activities Business-Type Activities Total
2017 2016 2017 2016 2017 2016
Increase (decrease) in net
position before transfers $5,596,900 $2,677,692 $5,640,226 $2,976,748 $11,237,126 $5,654,440
Transfers (406,638) (311,622) 406,638 311,622 - -
Increase (decrease) in Net
Position 5,190,262 2,366,070 6,046,864 3,288,370 11,237,126 5,654,440
Net position – July 1 208,263,633 205,897,563 94,724,290 91,435,920 302,987,923 297,333,483
Net position - June 30 $213,453,895 $208,263,633 $100,771,154 $94,724,290 $314,225,049 $302,987,923
Governmental activities. Governmental activities increased the City’s net position by $5,190,262. This results in a net change (increase) of $2,824,192 when compared to the increase of $2,366,070 in the prior year. Key elements of the change from prior year are as follows:
$3.2 million increase in sales and consolidated taxes. $827,000 increase in landfill fees. $2.1 million increase in Federal Grants for the Airport. $3.2 million increase in OPEB Obligation expense due to changes in actuarial assumptions.
Program revenues for governmental activities provided 25.8% of the resources necessary to pay the cost of providing program services. The remaining program costs were financed with general revenues. The largest general revenues are property taxes of $27,522,923 and consolidated taxes of $27,426,295.
-
5
10
15
20
25
30
35
40
Mill
ions
Expenses and Program Revenues - Governmental Activities
expenses
program revenues
61

Carson City, Nevada Management’s Discussion and Analysis
17
Business-type activities. Business-type activities increased the City’s net position by $6,046,864. This results in a net change (increase) of $2,758,494 when compared to the increase of $3,288,370 in the prior year. Key elements of the change from prior year are as follows:
$1.6 million (13.7%) increase in sewer revenue is due to a rate increase implemented July 1, 2013 by theBoard of Supervisors for upcoming capital purchases and reinvestment.
$653,000 increase in sewer expenses which includes contract adjustments and merit increases foremployees, and interest due on debt issues.
$1.2 million (8.7%) increase in water charges for services expected given rate increases, implemented July1, 2013 by the Board of Supervisors for upcoming capital purchases and reinvestment.
$245,000 decrease in the Water Expenses as they purchased fewer water meters during the year.
Sewer and water expenses represent 80.1% of total expenses for business-type activities.
Charges for services13.7%
Operating grants and contributions
6.5%
Capital grants andcontributions4.1%
Property taxes28.4%
Consolidated tax28.3%
Other taxes18.7%
Unrestrictedinvestment income0.1%
Other0.3%
Revenues by Source - Governmental Activities
-
1
2
3
4
5
6
7
8
9
10
11
12
13
14
15
16
17
Sewer Water Stormwater Drainage Ambulance Cemetery Building Permits
Mill
ions
Expenses and Program Revenues - Business - type Activities
expenses
program revenues
62

Carson City, Nevada Management’s Discussion and Analysis
18
Financial Analysis of the Government’s Funds As noted earlier, the City uses fund accounting to ensure and demonstrate compliance with finance-related legal requirements. Governmental funds. The focus of the City’s governmental funds is to provide information on near-term inflows, outflows, and balances of spendable resources. Such information is useful in assessing the City’s financing requirements. In particular, unassigned fund balance may serve as a useful measure of a government’s net resources available for discretionary use as they represent the portion of fund balance which has not yet been limited to use for a particular purpose by either an external party, the City itself, or a group or individual that has been delegated authority to assign resources for use for particular purposes by the City’s Board of Supervisors. At June 30, 2017, the City’s governmental funds reported combined ending fund balances of $22,266,875, a decrease of $629,391 in comparison with the prior year. Approximately 29.0% of this amount ($6,447,478) constitutes unassigned fund balance, which is available for spending at the City’s discretion. The remainder of the fund balance is either nonspendable, restricted, committed, or assigned to indicate that it is: 1) not in spendable form ($455,137), 2) restricted for particular purposes ($11,035,145), 3) committed for particular purposes ($10,044), or 4) assigned for particular purposes ($4,319,071). The General Fund is the chief operating fund of the City. At the end of the current fiscal year, unassigned fund balance of the General Fund was $6,447,478, while total fund balance increased to $1,215,874. As a measure of the General Fund’s liquidity, it may be useful to compare both unassigned fund balance and total fund balance to total general fund expenditures. Unassigned fund balance represents 9.8% of total general fund expenditures, while total fund balance represents 14.4% of that same amount. The fund balance of the City’s general fund increased by $1,215,874 during the current fiscal year. This results in a net change (decrease) of $663,044 when compared to the increase of $552,830 in the prior year. Key elements of the change from prior year are as follows:
Consolidated tax revenues increased by $2,579,409 from the prior year. This is revenue passed through from the State, which is the result of an increase in taxable sales as our economy recovers.
Property tax revenues increased by $294,001 from the prior year. This is a result of the increase in assessed values.
Increase in landfill fees of $808,944. General fund expenditures increased by approximately $1.3 million (or 2.0%). This increase was mostly
due to an increase in salaries and benefits during the current fiscal year as a result of the contract adjustments and merit increases.
Increases in transfers out of $878,700 to Capital Projects Fund for deferred capital needs, $250,000 to the Insurance Fund related to the 2017 Flood, and $358,277 to the Grant Fund as we moved the Clinical Services and Vaccine program reserves to this fund for tracking purposes.
Charges for services97.5%
Operating grants and contributions
0.0%
Capital grants and contributions
2.4%
Miscellaneous general revenue
0.2%
Revenues by Source - Business - type Activities
63

Carson City, Nevada Management’s Discussion and Analysis
19
Proprietary funds. The City’s proprietary funds provide the same type of information found in the government-wide financial statements, but in more detail.
Unrestricted net position at the end of the year amounted to $9,703,193 in the Sewer Fund and $1,759,493 in the Water Fund. The Sewer Funds total net position increased by $3,168,355 and the Water Funds net position increased by $2,260,257. Other factors concerning the finances of these two funds have already been addressed in the discussion of the City’s business-type activities.
General Fund Budgetary Highlights:
Budgeted appropriations increased $4,046,750 between the original budget and the final amended budget. The increase can be briefly summarized as follows:
Carryover of program costs and savings from the prior year budget amounting to $2,747,134 allocated tovarious departments.
$1,549,616 increase in various department appropriations offset by increases in charges for services,intergovernmental revenues, and other miscellaneous revenues.
Of this increase, $847,703 was funded from Landfill revenue charges for services, $341,555 was funded from intergovernmental revenues, $110,358 was funded from refunds, reimbursements, grants and donations, and $2,747,134 was to be budgeted from available fund balance.
The significant differences between the final amended budget and actual amounts are as follows:
Actual intergovernmental revenues were $810,006 more than the final budget due to an increase inconsolidated tax revenue. This increase is offset by a decrease of $480,000 which was budgeted as anintergovernmental revenue but for financial reporting purposes was reclassified as a transfer in from theRedevelopment Revolving Fund.
Actual expenditures by function were less than the final budget as a result of expenditure reductions,employee vacancies and unspent restricted funds that will be carried over to the next fiscal year’s budget.
Capital Asset and Debt Administration
Capital assets. The City’s investment in capital assets for its governmental and business-type activities as of June 30, 2017, amounts to $576,966,790 (net of accumulated depreciation). This investment in capital assets includes land, buildings, improvements, machinery and equipment, infrastructure, water capacity and water rights. The total increase in the City’s investment in capital assets for the current fiscal year was 4.2% (a 1.9% increase for governmental activities and an 8.7% increase for business-type activities).
Major capital asset events during the current fiscal year included the following:
East-West Water Transmission Main Phase II and Water Resource Recovery Facility projects continuedduring fiscal year 17 resulting in an increase in construction in progress in the Sewer and Water Funds ofapproximately $18.8 million.
Downtown Streetscape project and several smaller street and sidewalk projects were completed in fiscalyear 17, resulting in a reclassification from construction in progress to infrastructure of $3.5 million and$1.6 million, respectively.
Animal Control Facility was completed in fiscal year 17 and reclassified from construction in progress toBuildings in the amount of $3,232,655.
Fiscal year 17 the City started work on the Energy Efficiency Project resulting in an increase toconstruction in progress of $3.5 million
64

Carson City, Nevada Management’s Discussion and Analysis
20
Carson City’s Capital Assets (net of depreciation)
Governmental Activities Business-Type Activities Total
2017 2016 2017 2016 2017 2016
Land $136,918,665 $136,831,268 $ 5,401,968 $ 5,397,807 $142,320,633 $142,229,075
CIP - Infrastructure 264,514 5,331,527 - - 264,514 5,331,527
Construction in progress 3,741,698 4,394,566 41,980,282 23,178,003 45,721,980 27,572,569
Buildings 62,414,757 60,612,033 14,293,308 14,712,965 76,708,065 75,324,998
Improvements other than
Buildings 28,739,104 27,521,519 114,810,292 116,918,170 143,549,396 144,439,689
Machinery and equipment 9,432,206 8,892,729 2,930,451 2,944,601 12,362,657 11,837,330
Infrastructure 131,888,169 122,745,704 - - 131,888,169 122,745,704
Water capacity - - 4,169,896 4,169,896 4,169,896 4,169,896
Water rights - - 19,981,480 19,981,480 19,981,480 19,981,480
Total 373,399,113 $366,329,346 $203,567,677 $187,302,922 $576,966,790 $553,632,268
Additional information on the City’s capital assets can be found in Note 3-B on pages 49-53 of this report. Long-term debt. At the end of the current fiscal year, the City had total bonded debt outstanding of $180,851,630. Of this amount, $165,467,430 comprises debt backed by the full faith and credit of the government. The remainder of the City’s bonded debt represents bonds secured solely by specified revenue sources (i.e., revenue bonds).
Carson City’s Outstanding Debt General Obligation, Revenue Bonds and Notes Payable
Governmental Activities Business-Type Activities Total
2017 2016 2017 2016 2017 2016
General obligation
Bonds $59,670,000 $63,375,000 $105,797,430 $85,399,055 $165,467,430 $148,774,005
Revenue bonds 15,384,200 15,970,500 - - 15,384,200 15,970,500
Notes Payable 6,240,093 3,361,300 785,800 1,090,800 7,025,893 4,452,100
Total $81,294,293 $82,706,800 106,583,230 $86,489,855 $187,877,523 $169,196,655
The City’s total bonded debt and notes payable increased by $18,680,868 (11.0%) from the prior year primarily due to the General Obligation Revenue Bonds - State of Nevada Revolving Loan authorized $35.8 million in the prior year and $25.4 million was drawn down during the current year. Notes payable increased by $2,573,793 (57.8%) due to two installment purchase agreements entered into for the Energy Efficiency project during fiscal year 2017 for a total authorized amount of $4.3 million and $3.4 million was drawn on those notes as of June 30, 2017. Revenue Bonds decreased by $586,300 (3.7%) due to current year principal payments. The City maintained an “AA-” rating from Standard & Poor’s and an “A1” rating from Moody’s for general obligation debt. State statutes limit the amount of general obligation debt a governmental entity may issue to 15.0% of its total assessed valuation. The current debt limitation for the City is $226,790,989, which is significantly in excess of the City’s outstanding general obligation debt. Additional information on the City’s long-term debt can be found in Note 3-D on pages 54-61 of this report.
65

Carson City, Nevada Management’s Discussion and Analysis
21
Economic Factors and Next Year’s Budgets and Rates
The City’s unemployment rate was 4.6% at June 30, 2017, which is a decrease from a rate of 6.9% a yearago. The national and state unemployment rates were 4.4% and 4.9%, respectively, at June 30, 2017.
The City’s assessed value increased 5.2% in fiscal year 2016-17 to $1.445 billion and increased 3.9% infiscal year 2017-18 to $1.502 billion.
Consolidated tax revenue was projected to increase 4.0% for fiscal year 2017-18. July 2017 shows a 8.5%increase and August 2017 shows a 12.9% increase compared to the same months during fiscal year2016-17.
All of these factors were considered in preparing the City’s budget for the 2018 fiscal year.
During the current fiscal year, unrestricted fund balance in the General Fund increased from $7,318,481 to $8,179,956. The City has assigned $1,355,278 of this amount for eliminating a 2018 fiscal year budget deficiency.
Requests for Information
This financial report is designed to provide a general overview of the City’s finances for all those with an interest in the government’s finances. Questions concerning any of the information provided in this report or requests for additional information should be addressed to the Carson City Finance Department, 201 N. Carson Street, Suite 3, Carson City, Nevada 89701.
66

BASIC FINANCIAL STATEMENTS
67

See accompanying notes. 22
CARSON CITY, NEVADASTATEMENT OF NET POSITION
JUNE 30, 2017
PRIMARY GOVERNMENT
GOVERNMENTAL BUSINESS-TYPE
ACTIVITIES ACTIVITIES TOTALASSETS
Cash and investments 20,777,720$ 18,891,116$ 39,668,836$ Receivables (net of allowances for uncollectibles) 3,083,456 4,191,369 7,274,825 Due from other governments 9,968,166 523,412 10,491,578 Due from primary government - - - Internal balances 700,486 (700,486) - Inventories 224,736 361,792 586,528 Prepaids 502,992 34,742 537,734 Restricted assets:
Cash and investments 490,207 - 490,207
Other assets 90,000 - 90,000 Capital assets (net of
accumulated depreciation):Land 136,918,665 5,401,968 142,320,633 Construction in progress - infrastructure 264,514 - 264,514 Construction in progress 3,741,698 41,980,282 45,721,980 Buildings 62,414,757 14,293,308 76,708,065 Improvements other than buildings 28,739,104 114,810,292 143,549,396 Machinery and equipment 9,432,206 2,930,451 12,362,657 Infrastructure 131,888,169 - 131,888,169 Water capacity - 4,169,896 4,169,896 Water rights - 19,981,480 19,981,480
Total Assets 409,236,876 226,869,622 636,106,498
DEFERRED OUTFLOWS OF RESOURCESDeferred retirement contributions 10,048,314 1,254,808 11,303,122 Deferred actuarial adjustment to 2016 contributions 547,834 66,444 614,278 Deferred earnings on retirement investment 7,821,519 975,576 8,797,095 Deferred loss on refundings 3,141,868 642,039 3,783,907
Total Deferred Outflows of Resources 21,559,535 2,938,867 24,498,402
Total Assets and Deferred Outflows of Resources 430,796,411 229,808,489 660,604,900
LIABILITIESAccounts payable and accrued expenses 5,765,567 2,607,346 8,372,913 Accrued interest payable 545,657 1,060,813 1,606,470 Due to other governments 447,648 340,107 787,755 Due to component units 246,131 - 246,131 Unearned revenue 99,423 263,533 362,956 Other liabilities 114,454 7,200 121,654 Current liabilities payable from restricted assets 490,207 - 490,207 Noncurrent liabilities:
Due within one year 7,295,641 6,600,548 13,896,189 Due in more than one year 88,578,280 103,202,109 191,780,389
Net OPEB obligation 22,601,778 3,388,786 25,990,564 Net retirement obligations 83,965,951 10,579,636 94,545,587
Total Liabilities 210,150,737 128,050,078 338,200,815
DEFERRED INFLOWS OF RESOURCESDeferred change in retirement experience 5,638,455 702,725 6,341,180 Deferred change in retirement contributions 1,553,324 194,143 1,747,467 Deferred gain on refundings - 90,389 90,389
Total Deferred Inflows of Resources 7,191,779 987,257 8,179,036
Total Liabilities and Deferred Inflows of Resources 217,342,516 129,037,335 346,379,851
NET POSITIONNet investment in capital assets 302,089,834 93,571,145 395,660,979 Restricted for:
General government 835,633 - 835,633 Public safety 354,718 - 354,718 Judicial 443,386 - 443,386 Health 623,138 - 623,138 Welfare 21,536 - 21,536 Culture and recreation 1,812,308 - 1,812,308 Debt service - - - Economic opportunity 4,469 4,469 Infrastructure projects 2,891,574 2,891,574 Redevelopment 778,512 - 778,512 Claims 2,316,372 - 2,316,372
Unrestricted (98,717,585) 7,200,009 (91,517,576)
Total Net Position 213,453,895$ 100,771,154$ 314,225,049$ 68

See accompanying notes. 23
COMPONENT UNITS
CULTURE
AIRPORT AND TOURISM
AUTHORITY AUTHORITY
697,829$ 1,368,333$ 35,634 244,629
191,242 25,000 246,131 -
- - - -
4,567 2,024
- -
170,213 -
146,542 - - - - - - - - 5,841
69,771 68,164 - - - - - -
1,561,929 1,713,991
14,690 104,988 - 3,445
21,532 50,569 - -
36,222 159,002
1,598,151 1,872,993
280,347 103,246 - - - 23,137 - - - -
14,856 - -
24,627 - 498,903 65,692
- 289,842 231,620 537,706
1,050,353 1,019,623
15,510 36,426 46,878 10,063
- -
62,388 46,489
1,112,741 1,066,112
216,313 74,005
- - - - - - - - - - - - - 698,291 - -
- - - -
269,097 34,585
485,410$ 806,881$ 69

See accompanying notes. 24
CARSON CITY, NEVADASTATEMENT OF ACTIVITIES
FOR THE YEAR ENDED JUNE 30, 2017
OPERATING CAPITALCHARGES FOR GRANTS AND GRANTS AND
EXPENSES SERVICES CONTRIBUTIONS CONTRIBUTIONSFUNCTIONS/PROGRAMS
Primary government:Governmental Activities:
General government $ 14,887,443 $ 3,203,733 $ 1,024,317 $ - Public safety 34,946,511 1,403,924 693,507 170,486 Judicial 7,017,989 1,732,900 48,945 - Public works 9,904,418 271,693 1,221,193 1,214,364 Sanitation 2,060,980 4,614,674 - - Health 5,998,209 665,181 2,438,005 - Welfare 2,164,908 - 317,352 - Culture and recreation 9,595,541 1,433,832 310,100 230,901 Community support 1,058,025 576 - 12,600 Airport 548,672 - - 2,308,253 Economic opportunity 90,492 - 209,700 -
Debt Service: Interest and fiscal charges 3,089,777 - - -
Total Governmental Activities 91,362,965 13,326,513 6,263,119 3,936,604
Business-Type Activities:Sewer 10,249,949 13,021,147 - 286,134 Water 13,464,964 15,278,926 - 389,824 Stormwater Drainage 1,033,393 1,362,516 - 157,214 Ambulance 3,544,833 3,315,712 - - Cemetery 227,792 152,015 500 - Building Permits 1,103,828 1,240,249 - -
Total Business-Type Activities 29,624,759 34,370,565 500 833,172
Total Primary Government $ 120,987,724 $ 47,697,078 $ 6,263,619 $ 4,769,776
Component units:Airport Authority $ 2,962,972 $ 434,089 $ 2,386,190 $ - Culture and Tourism Authority 2,024,036 12,877 31,694 -
Total Component Units $ 4,987,008 $ 446,966 $ 2,417,884 $ -
General Revenues:Property taxesSales taxesUnrestricted intergovernmental revenues - Consolidated taxFranchise taxesOther taxesRoom taxesMotor vehicle fuel taxUnrestricted investment incomeMiscellaneous revenueGain on sale of capital assets
Transfers
Total General Revenues and Transfers
Change in Net Position
NET POSITION, JULY 1
NET POSITION, JUNE 30
PROGRAM REVENUES
70

See accompanying notes. 25
GOVERNMENTAL BUSINESS-TYPEACTIVITIES ACTIVITIES TOTAL
$ (10,659,393) $ - $ (10,659,393) $ - $ - (32,678,594) - (32,678,594) - -
(5,236,144) - (5,236,144) - - (7,197,168) - (7,197,168) - - 2,553,694 - 2,553,694 - -
(2,895,023) - (2,895,023) - - (1,847,556) - (1,847,556) - - (7,620,708) - (7,620,708) - - (1,044,849) - (1,044,849) - - 1,759,581 - 1,759,581 - -
119,208 - 119,208 - -
(3,089,777) - (3,089,777) - -
(67,836,729) - (67,836,729) - -
- 3,057,332 3,057,332 - - - 2,203,786 2,203,786 - - - 486,337 486,337 - - - (229,121) (229,121) - - - (75,277) (75,277) - - - 136,421 136,421 - -
- 5,579,478 5,579,478 - -
(67,836,729) 5,579,478 (62,257,251) - -
- - - (142,693) - - - - - (1,979,465)
- - - (142,693) (1,979,465)
27,522,923 - 27,522,923 209,001 - 7,721,472 - 7,721,472 -
27,426,295 - 27,426,295 - - 4,970,904 - 4,970,904 - -
281,063 - 281,063 - - - - - - 1,934,371
5,157,033 - 5,157,033 - - 81,370 54,321 135,691 803 14,967
272,569 - 272,569 - - - 6,427 6,427 - -
(406,638) 406,638 - - -
73,026,991 467,386 73,494,377 209,804 1,949,338
5,190,262 6,046,864 11,237,126 67,111 (30,127)
208,263,633 94,724,290 302,987,923 418,299 837,008
$ 213,453,895 $ 100,771,154 $ 314,225,049 $ 485,410 $ 806,881
AUTHORITY AUTHORITY
NET (EXPENSE) REVENUE AND CHANGES IN NET POSITION COMPONENT UNITS
CULTUREAIRPORT AND TOURISM
71

See accompanying notes. 26
OTHER TOTALGOVERNMENTAL GOVERNMENTAL
GENERAL FUNDS FUNDSASSETS
Cash and investments 6,192,551$ 9,750,736$ 15,943,287$ Receivables (net of allowances
for uncollectibles):Taxes, delinquent 296,701 37,984 334,685 Accounts receivable 1,708,994 730,921 2,439,915 Interest 95,865 - 95,865
Due from other funds 42,951 7,320 50,271 Due from other governments 5,106,574 4,367,420 9,473,994 Inventories 2,753 - 2,753 Prepaid items 412,410 39,975 452,385 Restricted assets:
Cash and investments 447,234 42,973 490,207
Total Assets 14,306,033$ 14,977,329$ 29,283,362$
LIABILITIES, DEFERRED INFLOWS OF RESOURCES, AND FUND BALANCES Liabilities:
Accounts payable 1,046,482$ 1,402,161$ 2,448,643$ Accrued salaries and benefits 2,654,766 208,863 2,863,629 Due to other funds - 50,271 50,271 Due to other governments 200,244 241,279 441,523 Due to component units 215,171 30,960 246,131 Other liabilities 114,454 - 114,454 Unearned revenue - 99,423 99,423 Payable from restricted assets 447,234 42,973 490,207
Total Liabilities 4,678,351 2,075,930 6,754,281
Deferred inflows of resources:Unavailable revenue - delinquent landfill fees 261 - 261 Unavailable revenue - delinquent property taxes 230,405 31,540 261,945
Total Deferred Inflows of Resources 230,666 31,540 262,206
Fund balances:Nonspendable 415,162 39,975 455,137 Restricted 801,898 10,233,247 11,035,145 Committed - 10,044 10,044 Assigned 1,732,478 2,586,593 4,319,071 Unassigned 6,447,478 - 6,447,478
Total Fund Balances 9,397,016 12,869,859 22,266,875
Total Liabilities, Deferred Inflowsof Resources, and Fund Balance 14,306,033$ 14,977,329$ 29,283,362$
CARSON CITY, NEVADABALANCE SHEET
GOVERNMENTAL FUNDSJUNE 30, 2017
72

See accompanying notes. 27
CARSON CITY, NEVADARECONCILIATION OF THE BALANCE SHEET
TO THE STATEMENT OF NET POSITIONGOVERNMENTAL FUNDS
JUNE 30, 2017
Fund Balances - Governmental Funds (page 26) $ 22,266,875
Amounts reported for governmental activities in the statementof net position (pages 22-23) are different because:
Capital assets used in governmental activities are notfinancial resources and, therefore, are not reportedin the governmental funds.
Governmental capital assets $ 482,043,267 Less: Accumulated depreciation (111,089,142)
370,954,125 Long-term liabilities, deferred outflows of resources and deferred inflows of
resources, including bonds payable, are not due and payable in the currentperiod, and therefore are not reported in the governmental funds.
General obligation revenue bonds payable (59,670,000) Notes payable (6,240,093) Revenue bonds payable (15,384,200) Issuance premium (3,844,087) Less: current year amortization 304,624 Capital leases payable (65,204) Landfill closure / post closure costs (3,781,203) Net OPEB obligation (22,233,657) Net retirement obligation (82,039,378) Deferred outflows of resources: Deferred retirement contributions 9,833,139 Deferred actuarial adjustment to 2016 contributions 536,412 Deferred loss on refundings 3,141,868 Deferred earnings on retirement investments 7,653,800 Deferred inflows of resources: Deferred difference between expected and actual retirement experience (5,517,645) Deferred change in retirement contributions (1,519,947) Compensated absences (5,455,191)
(184,280,762)
Interest payable (545,657)
Deferred inflows of resources represent amounts that are notavailable to fund current expenditures and, therefore,are not reported in the governmental funds. 262,206
Internal service funds are used by management to charge the costs of certainactivities to individual funds. Net position of the internal service fundsare reported with governmental activities. 4,096,622
Internal balances are receivable from business-type activities. 700,486
Net Position - Governmental Activities (pages 22-23) $ 213,453,895
73

See accompanying notes. 28
CARSON CITY, NEVADASTATEMENT OF REVENUES, EXPENDITURES,
AND CHANGES IN FUND BALANCESGOVERNMENTAL FUNDS
FOR THE YEAR ENDED JUNE 30, 2017
OTHER TOTALGOVERNMENTAL GOVERNMENTAL
GENERAL FUNDS FUNDS
Revenues:Taxes 22,608,987$ 16,335,804$ 38,944,791$ Licenses and permits 6,562,319 209,789 6,772,108 Intergovernmental revenues 28,286,192 10,203,140 38,489,332 Charges for services 12,714,864 475,446 13,190,310 Fines and forfeits 764,906 26,034 790,940 Miscellaneous 1,378,005 692,230 2,070,235
Total Revenues 72,315,273 27,942,443 100,257,716
Expenditures:Current:
General government 15,081,020 358,474 15,439,494 Public safety 30,626,879 1,198,619 31,825,498 Judicial 6,423,660 158,945 6,582,605 Public works 2,158,460 7,015,258 9,173,718 Sanitation 1,840,005 - 1,840,005 Health 2,655,322 2,511,348 5,166,670 Welfare 356,595 1,768,947 2,125,542 Culture and recreation 5,721,113 1,789,396 7,510,509 Community support 331,134 402,594 733,728 Airport - 74,903 74,903 Economic opportunity - 90,492 90,492
Capital outlay 271,901 14,589,207 14,861,108 Debt service:
Principal retirement - 5,239,300 5,239,300 Interest and fiscal charges - 3,178,466 3,178,466
Total Expenditures 65,466,089 38,375,949 103,842,038
Excess (Deficiency) of Revenuesover Expenditures 6,849,184 (10,433,506) (3,584,322)
Other Financing Sources (Uses):Capital leases 54,845 30,000 84,845 Refunding debt issued - 5,951,000 5,951,000 Debt Issued - 3,425,293 3,425,293 Payment to refunded bond escrow agent - (5,859,759) (5,859,759) Sale of capital assets - 43,552 43,552 Transfers in 582,321 11,620,788 12,203,109 Transfers out (6,270,476) (6,622,633) (12,893,109)
Total Other FinancingSources (Uses) (5,633,310) 8,588,241 2,954,931
Net Change in Fund Balances 1,215,874 (1,845,265) (629,391)
Fund Balances, July 1 8,181,142 14,715,124 22,896,266
Fund Balances, June 30 9,397,016$ 12,869,859$ 22,266,875$
74

See accompanying notes. 29
CARSON CITY, NEVADARECONCILIATION OF THE STATEMENT OF REVENUES,
EXPENDITURES, AND CHANGES IN FUND BALANCESTO THE STATEMENT OF ACTIVITIES
GOVERNMENTAL FUNDSFOR THE YEAR ENDED JUNE 30, 2017
Net Change in Fund Balances - Governmental Funds (page 28) $ (629,391)
Amounts reported for governmental activities in the statement ofactivities (pages 24-25) are different because:
Governmental funds report capital outlays as expenditures and the proceedsfrom the sale of assets as other financing sources. However, in the statementof activities, the cost of those assets is depreciated over their estimateduseful lives and only the gain or loss is recorded when assets are sold.
Expenditures for capital assets $ 14,861,108 Contributions of capital assets from business-type activities 23,469 Donated capital assets 216,825 Sale/disposition of assets (487,047) Less: Current year depreciation (7,391,311)
7,223,044 Revenues in the statement of activities that do not provide current financial
resources are not reported as revenues in governmental funds.Change in unavailable revenue (22,977)
Bond and note proceeds and capital leases provide current financial resourcesto governmental funds, but issuing debt increases long-term liabilities in thestatement of net position. Repayment of bonds and note principal andcapital leases is an expenditure in the governmental fund, but the repaymentreduces long-term liabilities in the statement of net position. This is theamount by which bonds and notes issued and capital lease financingexceeded repayments and costs of issuance.
Bonds issued (9,376,293) Capital lease (84,845) Accrued interest (545,657) Capital lease payments 29,822 Interest payments 589,305 Principal payments 5,239,300 Payment to escrow agent for refunding 5,859,759
1,711,391 Some expenses reported in the statement of activities do not require the use
of current financial resources and, therefore, are not reported as expenditures in governmental funds.
Amortization of loss on bond refunding (259,583) Amortization of bond premiums 304,624 Change in long-term landfill closure / post closure (149,413) Change in net OPEB asset (1,390) Change in net OPEB obligation (3,159,476) Change in net retirement obligation (10,677,668) Change in deferred outflows of resources 7,683,118 Change in deferred inflows of resources 2,287,869 Change in long-term compensated absences 445,318
(3,526,601) Internal service funds are used by management to charge the costs of certain
activities to individual funds. The net income of the internal service fundsis reported with governmental activities. 434,796
Change in Net Assets of Governmental Activities (pages 24-25) $ 5,190,262
75

This page intentionally left blank.
76

CARSON CITYGENERAL FUND
STATEMENT OF REVENUES, EXPENDITURES,AND CHANGES IN FUND BALANCES - BUDGET AND ACTUAL
FOR THE YEAR ENDED JUNE 30, 2017
VARIANCE ACTUAL WITH
ORIGINAL FINAL AMOUNTS FINAL BUDGET
Revenues:Taxes 22,582,474$ 22,582,474$ 22,608,987$ 26,513$ Licenses and permits 6,936,867 6,936,867 6,562,319 (374,548) Intergovernmental revenues 27,134,631 27,476,186 28,286,192 810,006 Charges for services 11,638,896 12,486,599 12,714,864 228,265 Fines and forfeits 694,600 694,600 764,906 70,306 Miscellaneous 1,183,813 1,544,171 1,378,005 (166,166)
Total Revenues 70,171,281 71,720,897 72,315,273 594,376
Expenditures:Current:
General government 15,911,629 16,341,210 15,081,020 1,260,190 Public safety 31,819,245 31,888,493 30,626,879 1,261,614 Judicial 4,764,624 6,556,101 6,423,660 132,441 Public works 2,050,165 2,190,640 2,158,460 32,180 Sanitation 1,858,384 2,025,814 1,840,005 185,809 Health 2,815,102 3,284,896 2,655,322 629,574 Welfare 515,597 515,597 356,595 159,002 Culture and recreation 5,943,213 6,062,832 5,721,113 341,719 Community support 336,513 336,513 331,134 5,379
Capital Outlay - 176,844 271,901 (95,057)
Total Expenditures 66,014,472 69,378,940 65,466,089 3,912,851
Excess (Deficiency) of Revenuesover Expenditures 4,156,809 2,341,957 6,849,184 4,507,227
Other Financing Sources (Uses):Capital leases - - 54,845 54,845 Transfers in 113,684 (136,316) 582,321 718,637 Transfers out (4,647,231) (5,733,484) (6,270,476) (536,992) Contingency (450,000) - - -
Total Other FinancingSources (Uses) (4,983,547) (5,869,800) (5,633,310) 236,490
Net Change in Fund Balances (826,738) (3,527,843) 1,215,874 4,743,717
Fund Balances, July 1 5,480,037 8,181,142 8,181,142 -
Fund Balances, June 30 4,653,299$ 4,653,299$ 9,397,016$ 4,743,717$
BUDGETED AMOUNTS
See accompanying notes.
77

See accompanying notes. 31
CARSON CITY, NEVADASTATEMENT OF NET POSITION
PROPRIETARY FUNDS
GOVERNMENTALACTIVITIES -
OTHER TOTAL INTERNALENTERPRISE ENTERPRISE SERVICE
SEWER WATER FUNDS FUNDS FUNDS
ASSETSCurrent assets:
Cash and investments 12,773,552$ 4,179,422$ 1,938,142$ 18,891,116$ 4,834,433$ Receivables:
Accounts and contracts, net 1,174,071 1,584,705 1,432,593 4,191,369 212,991 Due from other governments 117,412 406,000 - 523,412 494,172 Inventories - 348,284 13,508 361,792 221,983 Prepaid items 30,033 4,360 349 34,742 50,607
Total Current Assets 14,095,068 6,522,771 3,384,592 24,002,431 5,814,186
Noncurrent assets:Other assets - - - - 90,000
Capital assets:Land 841,784 2,671,955 1,888,230 5,401,969 - Water capacity - 4,169,896 - 4,169,896 - Buildings 15,294,303 4,708,903 590,143 20,593,349 1,820,327 Improvements other than buildings 104,923,370 108,347,384 8,293,783 221,564,537 - Machinery and equipment 5,249,426 4,757,488 2,287,108 12,294,022 1,238,464 Water rights - 19,981,480 - 19,981,480 - Construction in progress 35,665,897 6,078,997 235,387 41,980,281 -
161,974,780 150,716,103 13,294,651 325,985,534 3,058,791 Less: Accumulated depreciation (69,038,615) (50,244,940) (3,134,302) (122,417,857) (613,803)
Net Capital Assets 92,936,165 100,471,163 10,160,349 203,567,677 2,444,988
Total Noncurrent Assets 92,936,165 100,471,163 10,160,349 203,567,677 2,534,988
Total Assets 107,031,233 106,993,934 13,544,941 227,570,108 8,349,174
Deferred outflows of resources:Deferred retirement contributions 308,436 355,805 590,567 1,254,808 215,175 Deferred actuarial adjustment to 2016 contributions 16,387 18,839 31,218 66,444 11,422 Deferred earnings on retirement investments 240,601 276,603 458,372 975,576 167,719 Deferred loss on refundings 132,411 411,413 98,215 642,039 -
Total Deferred Outflows of Resources 697,835 1,062,660 1,178,372 2,938,867 394,316
Total Assets and Deferred Outflowsof Resources 107,729,068 108,056,594 14,723,313 230,508,975 8,743,490
JUNE 30, 2017(PAGE 1 OF 2)
BUSINESS-TYPE ACTIVITIES - ENTERPRISE FUNDS
78

See accompanying notes. 32
CARSON CITY, NEVADASTATEMENT OF NET POSITION
PROPRIETARY FUNDS
GOVERNMENTALACTIVITIES -
OTHER TOTAL INTERNALENTERPRISE ENTERPRISE SERVICE
SEWER WATER FUNDS FUNDS FUNDS
LIABILITIESCurrent liabilities:
Accounts payable 1,856,681$ 394,255$ 171,178$ 2,422,114$ 418,808$ Accrued salaries and benefits 55,426 65,586 64,220 185,232 34,488 Accrued interest 497,361 541,919 21,533 1,060,813 - Due to other governments - 340,072 35 340,107 6,125 Unearned revenue 754 2,369 260,410 263,533 - Other current liabilities - - - - 389,033 Current portion:
Commitments payable - 7,200 - 7,200 - Accrued compensated absences 30,008 10,319 66,107 106,434 50,938 General obligation bonds and notes
payable 2,530,571 3,466,021 497,522 6,494,114 -
Total Current Liabilities 4,970,801 4,827,741 1,081,005 10,879,547 899,392
Noncurrent liabilities: Accrued compensated absences 186,305 276,768 217,243 680,316 84,605 Net OPEB obligation 769,493 976,219 1,643,074 3,388,786 368,121 Net retirement obligation 2,356,744 2,957,527 5,265,365 10,579,636 1,926,573 Other liabilities - - - - 1,213,990 General obligation bonds
and notes payable 43,842,026 54,892,051 3,787,716 102,521,793 -
Total Noncurrent Liabilities 47,154,568 59,102,565 10,913,398 117,170,531 3,593,289
Total Liabilities 52,125,369 63,930,306 11,994,403 128,050,078 4,492,681
Deferred inflows of resources:Deferred change in retirement experience 173,310 199,242 330,173 702,725 120,810 Deferred change in retirement contributions 47,881 55,045 91,217 194,143 33,377 Deferred gain on refundings 30,464 59,925 - 90,389 -
Total Deferred Inflows of Resources 251,655 314,212 421,390 987,257 154,187
Total Liabilities and Deferred Inflowsof Resources 52,377,024 64,244,518 12,415,793 129,037,335 4,646,868
NET POSITIONNet investment in capital
assets 45,648,851 42,052,583 5,869,711 93,571,145 2,444,988 Restricted
Claims - - - - 2,316,372 Unrestricted 9,703,193 1,759,493 (3,562,191) 7,900,495 (664,738)
Total Net Position 55,352,044$ 43,812,076$ 2,307,520$ 101,471,640 4,096,622$
Adjustment to reflect the consolidation of internal service fund activities related to enterprise funds. (700,486)
Net position of business - type activities 100,771,154$
BUSINESS-TYPE ACTIVITIES - ENTERPRISE FUNDS
JUNE 30, 2017(PAGE 2 OF 2)
79

This page intentionally left blank.
80

See accompanying notes. 33
CARSON CITY, NEVADASTATEMENT OF REVENUES, EXPENSES,
AND CHANGES IN NET POSITIONPROPRIETARY FUNDS
FOR THE YEAR ENDED JUNE 30, 2017
BUSINESS-TYPE ACTIVITIES - ENTERPRISE FUNDSGOVERNMENTAL
ACTIVITIES -OTHER TOTAL INTERNAL
ENTERPRISE ENTERPRISE SERVICESEWER WATER FUNDS FUNDS FUNDS
Operating Revenues:Charges for services 12,996,501$ 15,053,015$ 6,063,596$ 34,113,112$ 12,955,755$
Operating Expenses:Salaries and wages 1,491,839 1,559,356 1,716,097 4,767,292 747,904Employee benefits 782,452 934,593 1,259,174 2,976,219 481,433Services and supplies 3,508,870 5,453,566 2,378,436 11,340,872 12,093,934Depreciation 3,385,557 3,331,454 380,796 7,097,807 162,008
Total Operating Expenses 9,168,718 11,278,969 5,734,503 26,182,190 13,485,279
Operating Income (Loss) 3,827,783 3,774,046 329,093 7,930,922 (529,524)
Nonoperating Revenues (Expenses):Investment income 29,684 17,742 6,895 54,321 15,811Miscellaneous 23,138 1,582 7,396 32,116 73,941Interest expense (1,002,575) (2,047,931) (128,528) (3,179,034) - Federal interest subsidy 1,508 224,329 - 225,837 - Gain (loss) on sales of capital assets 4,085 (98,004) - (93,919) (64,300) Bond issuance costs (1,402) (1,331) - (2,733) -
Total Nonoperating Revenues (Expenses) (945,562) (1,903,613) (114,237) (2,963,412) 25,452
Income (Loss) Before Contributions and Transfers 2,882,221 1,870,433 214,856 4,967,510 (504,072)
Capital Contributions:Capital assets - 4,161 157,214 161,375 - Capital grants - 125,000 - 125,000 495,050Developers 41,974 75,648 - 117,622 - Connection fees 244,160 185,015 - 429,175 -
Total Capital Contributions 286,134 389,824 157,214 833,172 495,050
Transfers In - - 440,000 440,000 281,020
Transfers Out - - (31,020) (31,020) -
Total Transfers - - 408,980 408,980 281,020
Change in Net Position 3,168,355 2,260,257 781,050 6,209,662 271,998
Net Position, July 1 52,183,689 41,551,819 1,526,470 3,824,624
Net Position, June 30 55,352,044$ 43,812,076$ 2,307,520$ 4,096,622$
Adjustment to reflect the consolidation of internal service fund activities related to enterprise funds. (162,798)
Change in net position of business - type activities 6,046,864$ 81

See accompanying notes. 34
CARSON CITY, NEVADASTATEMENT OF CASH FLOWS
PROPRIETARY FUNDSFOR THE YEAR ENDED JUNE 30, 2017
(PAGE 1 OF 2)
BUSINESS-TYPE ACTIVITIES - ENTERPRISE FUNDSGOVERNMENTAL
ACTIVITIES -OTHER TOTAL INTERNAL
ENTERPRISE ENTERPRISE SERVICESEWER WATER FUNDS FUNDS FUNDS
CASH FLOWS FROM OPERATING ACTIVITIESCash received for services 13,008,697$ 14,972,082$ 5,908,512$ 33,889,291$ 1,797,883$ Cash received from employee contributions - - - - 1,152,002 Cash received from employer contributions - - - - 10,274,001 Cash payments for personnel costs (2,314,441) (2,383,873) (2,931,649) (7,629,963) (1,378,155) Cash payments for services and supplies (3,202,442) (5,824,882) (2,415,833) (11,443,157) (12,841,663) Miscellaneous cash received 23,138 1,582 7,396 32,116 73,941
Net Cash Provided (Used) byOperating Activities 7,514,952 6,764,909 568,426 14,848,287 (921,991)
CASH FLOWS FROM NONCAPITALFINANCING ACTIVITIES
Transfer to other funds - - (31,020) (31,020) - Transfer from other funds - - 440,000 440,000 281,020
Net Cash Provided (Used) by
Noncapital Financing Activities - - 408,980 408,980 281,020
CASH FLOWS FROM CAPITAL ANDRELATED FINANCING ACTIVITIES
Proceeds from capital debt 25,075,445 831,455 305,456 26,212,356 - Proceeds from sales of capital assets - - - - 3,477 Connection fees 244,160 185,015 - 429,175 - Acquisition of capital assets (24,437,754) (1,088,285) (395,277) (25,921,316) (76,509) Principal paid on capital debt (1,614,719) (3,229,806) (443,001) (5,287,526) - Interest paid on capital debt (732,338) (2,089,288) (108,555) (2,930,181) - Bond issuance costs (1,402) (1,331) - (2,733) - Federal interest subsidy 1,508 224,329 - 225,837 - Subsidy from grant - 125,000 - 125,000 495,050
Net Cash Provided (Used) by Capitaland Related Financing Activities (1,465,100) (5,042,911) (641,377) (7,149,388) 422,018
CASH FLOWS FROM INVESTING ACTIVITIESInvestment income 29,684 17,742 6,895 54,321 15,811
Net Increase (Decrease) in Cashand Cash Equivalents 6,079,536 1,739,740 342,924 8,162,200 (203,142)
Cash and Cash Equivalents, July 1 6,694,016 2,439,682 1,595,218 10,728,916 5,037,575
Cash and Cash Equivalents, June 30 12,773,552$ 4,179,422$ 1,938,142$ 18,891,116$ 4,834,433$
82

See accompanying notes. 35
CARSON CITY, NEVADASTATEMENT OF CASH FLOWS
PROPRIETARY FUNDSFOR THE YEAR ENDED JUNE 30, 2017
(PAGE 2 OF 2)
BUSINESS-TYPE ACTIVITIES - ENTERPRISE FUNDSGOVERNMENTAL
ACTIVITIES -OTHER TOTAL INTERNAL
ENTERPRISE ENTERPRISE SERVICESEWER WATER FUNDS FUNDS FUNDS
RECONCILIATION OF OPERATING INCOME (LOSS) TO NETCASH PROVIDED (USED) BY OPERATING ACTIVITIES:
Operating income (loss) 3,827,783$ 3,774,046$ 329,093$ 7,930,922$ (529,523)$
Adjustments to reconcile operating income(loss) to net cash provided (used) byoperating activities:
Depreciation and amortization expense 3,385,557 3,331,454 380,796 7,097,807 162,008 Miscellaneous revenues 23,138 1,582 7,396 32,116 73,941 Changes in assets and liabilities:
(Increase) decrease in:Accounts receivable 12,445 115,892 (114,989) 13,348 288,212 Due from other governments (21,647) 496 - (21,151) (488,750) Inventories (937) 2,376 1,439 (53,933) Prepaid items (1,174) 12,949 2,462 14,237 (41,106) Other assets - - - - (20,000) Retirment deferred outflows (258,760) (284,269) (445,605) (988,634) (178,053)
Increase (decrease) in:Accounts payable 329,422 (142,132) (40,508) 146,782 4,228 Accrued salaries and benefits (64,386) (64,673) (92,774) (221,833) (37,899) Due to other governments (173) (241,692) (1,727) (243,592) (22,661) Deferred revenue - - - - - Unearned revenue (23) (201,551) (40,095) (241,669) - Connection deposits (226) 4,726 4,500 - Accrued compensated absences (114,249) (8,935) (137,235) (260,419) (183,280) Net OPEB obligation 132,441 164,422 217,871 514,734 65,932 Net retirement obligation 320,273 380,381 652,522 1,353,176 224,703 Other liabilities - - - - (145,589) Retirement deferred outflows (55,469) (76,850) (151,157) (283,476) (40,221)
Total Adjustments 3,687,169 2,990,863 239,333 6,917,365 (392,468)
Net Cash Provided (Used) byOperating Activities 7,514,952$ 6,764,909$ 568,426$ 14,848,287$ (921,991)$
NONCASH INVESTING, CAPITAL ANDFINANCING ACTIVITIES:
Purchase of capital assets on account 151,403$ 50,793$ 5,400$ 207,596$ -$ Retainage payable on construction of
capital assets 763,314 2,515 - 765,829 - Contributed capital assets 41,974 79,809 157,214 278,997 -
83

See accompanying notes. 36
CARSON CITY, NEVADASTATEMENT OF FIDUCIARY NET POSITION
FIDUCIARY FUNDSJUNE 30, 2017
INVESTMENT AGENCYTRUST FUND FUNDS
ASSETSCash and investments
Unrestricted 8,223,429$ 1,063,927$ Taxes receivable, delinquent - 181,049 Due from other governments - 19,347
Total Assets 8,223,429 1,264,323
LIABILITIESAccounts payable - 26,858 Due to other governments - 1,224,348 Other liabilities - 13,117
Total Liabilities - 1,264,323
NET POSITIONHeld in trust for pool participants 8,223,429$ -$
84

See accompanying notes. 37
CARSON CITY, NEVADASTATEMENT OF CHANGES IN FIDUCIARY NET POSITION
FIDUCIARY FUNDSFOR THE YEAR ENDED JUNE 30, 2017
INVESTMENTTRUST FUND
ADDITIONSInvestment income 37,449$ Capital share transactions:
Shares sold 5,817,058
Total Additions 5,854,507
DEDUCTIONSCapital share transactions:
Shares redeemed 5,609,411
Change in Net Position 245,096
Net Position, July 1 7,978,333
Net Position, June 30 8,223,429$
85

CARSON CITY NOTES TO FINANCIAL STATEMENTS
JUNE 30, 2017
38
NOTE 1 - SUMMARY OF SIGNIFICANT ACCOUNTING POLICIES A. REPORTING ENTITY Carson City, Nevada (the City) is a consolidated municipality governed by an elected mayor and a four-member board, which
comprise the Board of Supervisors. The accompanying financial statements present the City and its component units, entities for which the government is considered to be financially accountable. Blended component units, although legally separate entities, are, in substance, part of the City's operations, and, therefore, data from these units are combined with data of the primary government. Each discretely presented component unit, on the other hand, is reported in a separate column in the government-wide financial statements to emphasize that it is legally separate from the government. Each blended and discretely presented component unit has a June 30 year end.
BLENDED COMPONENT UNIT. The Redevelopment Authority is governed by a board comprised of the City's elected
Board of Supervisors. The ad valorem tax rates and bond issuance authorizations are approved by the Redevelopment Authority and the Board of Supervisors and the legal liability for the general obligation portion of the Redevelopment Authority's debt remains with the City. The financial statements of the Redevelopment Authority are reported as special revenue, debt service and capital projects funds of the City and did not obtain a separate financial audit.
DISCRETELY PRESENTED COMPONENT UNITS. The Carson City Culture and Tourism Authority, (formerly known as,
Carson City Visitors’ Bureau) is responsible for the promotion of tourism in Carson City. The members of the Culture and Tourism Authority’s governing board are appointed by the Board of Supervisors. The Culture and Tourism Authority is fiscally dependent upon the City since the Board of Supervisors sets the room tax rates and must approve any general obligation debt issuances. The Culture and Tourism Authority is presented as a governmental activity.
The Carson City Airport Authority is responsible for the operations of the Carson City Airport. The members of the Airport
Authority are appointed by the Board of Supervisors. The Airport Authority is fiscally dependent upon the City since the Board of Supervisors is the recognized grantee for any Federal Aviation Administration grants awarded on behalf of the Authority and any property tax levies must be approved by the Board of Supervisors. The Airport Authority is presented as a governmental activity.
Complete financial statements for each of the discretely presented component units may be obtained at the entity's administrative
offices. Carson City Culture and Tourism Authority 1900 South Carson Street Carson City, Nevada Carson City Airport Authority 2600 East Graves Lane, Suite 6 Carson City, Nevada B. GOVERNMENT-WIDE AND FUND FINANCIAL STATEMENTS
Government-Wide Financial Statements – The government-wide financial statements (i.e., the statement of net position and the statement of activities) report information on all the nonfiduciary activities of the primary government and its component units. For the most part, the effect of interfund activity has been removed from these statements. Governmental activities, which normally are supported by taxes and intergovernmental revenues, are reported separately from business-type activities, which rely to a significant extent on fees and charges for support. Likewise, the primary government is reported separately from certain legally separate component units for which the primary government is financially accountable. The statement of activities demonstrates the degree to which the direct expenses of a given function or segment are offset by program revenues. Direct expenses are those that are clearly identifiable with a specific function or segment. Program revenues include 1) charges to customers or applicants who purchase, use, or directly benefit from goods, services, or privileges provided by a given function or segment and 2) grants and contributions that are restricted to meeting the operational or capital requirements of a particular function or segment. Taxes and other items not properly included among program revenues are reported instead as general revenues. 86

CARSON CITY NOTES TO FINANCIAL STATEMENTS
JUNE 30, 2017
39
Fund Financial Statements – Separate financial statements are provided for governmental funds, proprietary funds, and fiduciary funds, even though the latter are excluded from the government-wide financial statements. Major individual governmental funds and major individual enterprise funds are reported as separate columns in the fund financial statements.
C. MEASUREMENT FOCUS, BASIS OF ACCOUNTING, AND FINANCIAL STATEMENT PRESENTATION
The government-wide financial statements are reported using the economic resources measurement focus and the accrual basis of accounting, as are the proprietary fund and fiduciary fund financial statements. Revenues are recorded when earned and expenses are recorded when a liability is incurred, regardless of the timing of related cash flows. Property taxes are recognized as revenues in the year for which they are levied. Grants and similar items are recognized as revenue as soon as all eligibility requirements imposed by the provider have been met.
Governmental fund financial statements are reported using the current financial resources measurement focus and the modified accrual basis of accounting. Revenues are recognized as soon as they are both measurable and available. "Measurable" means the amount of the transaction can be determined and "available" means collectible within the current period or soon enough thereafter to pay liabilities of the current period. The City considers all revenues, except grants, available if they are collected within 60 days of the end of the current fiscal period. Grant revenues are considered available if they are collected within 120 days of the end of the current fiscal period. Expenditures generally are recorded when a liability is incurred, as under accrual accounting. However, debt service expenditures, as well as expenditures related to compensated absences and claims and judgments, are recorded only when payment is due.
Property taxes, consolidated taxes, franchise fees, motor vehicle fuel taxes, and interest associated with the current fiscal period are all considered to be susceptible to accrual and so have been recognized as revenues of the current fiscal period.
Shared revenues are recorded at the time of receipt or earlier if the susceptible to accrual criteria are met. Grants and similar items are recognized as revenues when eligibility requirements imposed by the provider have been met. All other revenue items are considered to be measurable and available only when cash is received by the City.
The government reports the following major governmental fund:
The General Fund is the City's primary operating fund. It accounts for all financial resources of the general government, except those required to be accounted for in another fund.
The government reports the following major proprietary funds:
The Sewer Fund accounts for the activities of the sewer services provided to the residents of Carson City.
The Water Fund accounts for the activities of the water services provided to the residents of Carson City.
Additionally, the government reports the following fund types:
Internal service funds account for group medical insurance, workers’ compensation, liability and property insurance, and fleet management services provided to other departments or agencies of the government, or to other governments, on a cost reimbursement basis.
The Investment Trust Fund accounts for the external portion of the investment pool administered by the City which includes assets held in trust for the school district.
Agency funds are custodial in nature and do not involve measurement of results of operations. The funds account for assets held by the City as an agent for various local governments, special districts and individuals. Included are funds for property taxes, sales taxes, shared revenues and other financial resources for schools, special districts, and other state and city agencies.
As a general rule, the effect of interfund activity has been eliminated from the government-wide financial statements. Exceptions to this general rule are interfund services provided and used and other charges between the City’s business-type activities and various other functions of the government. Elimination of these charges would distort the direct costs and program revenues reported for the various functions concerned.
87
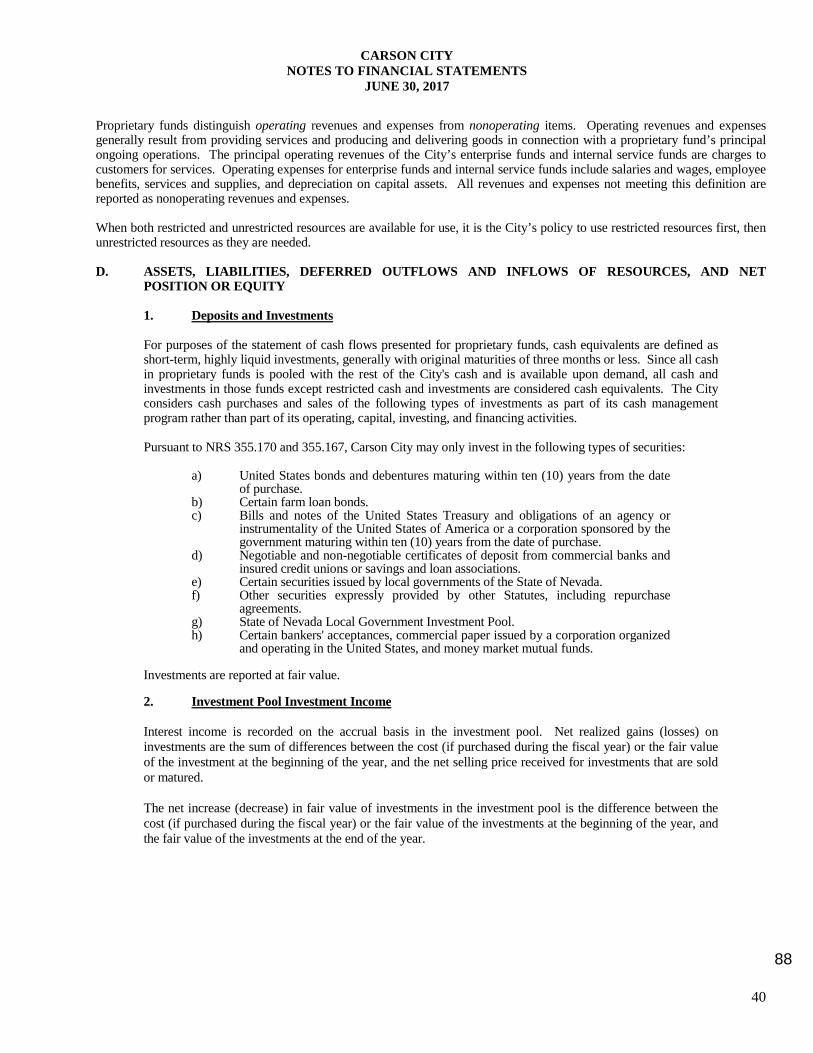
CARSON CITY NOTES TO FINANCIAL STATEMENTS
JUNE 30, 2017
40
Proprietary funds distinguish operating revenues and expenses from nonoperating items. Operating revenues and expenses generally result from providing services and producing and delivering goods in connection with a proprietary fund’s principal ongoing operations. The principal operating revenues of the City’s enterprise funds and internal service funds are charges to customers for services. Operating expenses for enterprise funds and internal service funds include salaries and wages, employee benefits, services and supplies, and depreciation on capital assets. All revenues and expenses not meeting this definition are reported as nonoperating revenues and expenses.
When both restricted and unrestricted resources are available for use, it is the City’s policy to use restricted resources first, then
unrestricted resources as they are needed.
D. ASSETS, LIABILITIES, DEFERRED OUTFLOWS AND INFLOWS OF RESOURCES, AND NET POSITION OR EQUITY
1. Deposits and Investments For purposes of the statement of cash flows presented for proprietary funds, cash equivalents are defined as
short-term, highly liquid investments, generally with original maturities of three months or less. Since all cash in proprietary funds is pooled with the rest of the City's cash and is available upon demand, all cash and investments in those funds except restricted cash and investments are considered cash equivalents. The City considers cash purchases and sales of the following types of investments as part of its cash management program rather than part of its operating, capital, investing, and financing activities.
Pursuant to NRS 355.170 and 355.167, Carson City may only invest in the following types of securities:
a) United States bonds and debentures maturing within ten (10) years from the date of purchase.
b) Certain farm loan bonds. c) Bills and notes of the United States Treasury and obligations of an agency or
instrumentality of the United States of America or a corporation sponsored by the government maturing within ten (10) years from the date of purchase.
d) Negotiable and non-negotiable certificates of deposit from commercial banks and insured credit unions or savings and loan associations.
e) Certain securities issued by local governments of the State of Nevada. f) Other securities expressly provided by other Statutes, including repurchase
agreements. g) State of Nevada Local Government Investment Pool. h) Certain bankers' acceptances, commercial paper issued by a corporation organized
and operating in the United States, and money market mutual funds. Investments are reported at fair value. 2. Investment Pool Investment Income Interest income is recorded on the accrual basis in the investment pool. Net realized gains (losses) on
investments are the sum of differences between the cost (if purchased during the fiscal year) or the fair value of the investment at the beginning of the year, and the net selling price received for investments that are sold or matured.
The net increase (decrease) in fair value of investments in the investment pool is the difference between the
cost (if purchased during the fiscal year) or the fair value of the investments at the beginning of the year, and the fair value of the investments at the end of the year.
88

CARSON CITY NOTES TO FINANCIAL STATEMENTS
JUNE 30, 2017
41
3. Receivables and Payables
Activity between funds that are representative of lending/borrowing arrangements outstanding at the end of the fiscal year are referred to as either “due to/from other funds” (i.e., the current portion of interfund loans) or “advances to/from other funds” (i.e., the non-current portion of interfund loans). Any residual balances outstanding between the governmental activities and business-type activities are reported in the government- wide financial statements as “internal balances.” Operating appropriations and subsidies are accounted for as transfers in the funds involved.
Advances between funds, as reported in the fund financial statements, are offset by nonspendable fund balance in the applicable governmental funds to indicate that they are not available for appropriation and are not expendable available financial resources.
All funds employ the allowance method of recognizing bad debts. Management does not anticipate any material collection losses with respect to its accounts receivable balances in any fund, except the Ambulance Fund; and, therefore, the allowance in those funds is zero.
The Ambulance Fund accounts receivable are presented net of the allowance for uncollectible accounts. Allowance for uncollectible accounts at June 30, 2017 is $198,384 and represents claims outstanding more than 180 days. Total uncollectible ambulance charges written off during the period amounted to $608,180.
Property taxes are levied as of July 1 on property values assessed the previous December. Taxes may be paid in four installments on the third Monday in August and the first Mondays in October, January, and March. Penalties are assessed if a taxpayer fails to pay an installment within ten days of the installment due date. On the first Monday in June, if the taxes remain unpaid, a Treasurer's Trustee Certificate is issued conveying the property to the Treasurer as Trustee, constituting a lien for back taxes and accumulated delinquency charges. A two year redemption period begins after the certificate placing such property in trust is issued. Redemption may be made by the owner and such persons as described by Statute by paying all back taxes and accumulated penalties, interest, and costs before sale. For property with taxes remaining unpaid at the end of the two year redemption period, The City may take a deed to the property and proceed to a tax sale. Secured roll property taxes receivable reflect only those taxes receivable from the delinquent roll years. No provision for uncollectible accounts has been established since management does not anticipate any material collection losses in respect to the remaining balances.
Accounts receivable for the discretely presented component units do not reflect an allowance for uncollectible accounts. The managements of the respective entities do not anticipate any material collection losses with respect to accounts receivable balances.
4. Inventories and Prepaid Items
The City's policy is to value inventories in Governmental Funds at cost using the average cost method, while Proprietary Fund inventories are valued at cost using the weighted average method. Inventories of governmental funds are recorded as expenditures when consumed rather than when purchased.
Certain payments to vendors reflect costs applicable to future accounting periods and are recorded as prepaid items in both government-wide and fund financial statements. The City uses the consumption method, expenses are recorded to the period in which those services were used.
5. Restricted Assets
Certain assets of the City's General Fund and Commissary Special Revenue Fund are classified as restricted assets because their use is restricted as the amounts are held for others.
89

CARSON CITY NOTES TO FINANCIAL STATEMENTS
JUNE 30, 2017
42
6. Capital Assets Capital assets, which include land, construction in progress, buildings, improvements, machinery and
equipment and infrastructure assets (e.g., roads, bridges, sidewalks, and similar items), are reported in the applicable governmental or business-type activities columns in the government-wide financial statements. Capital assets are defined by the City as assets with an initial, individual cost of more than $5,000 and an estimated useful life of at least one year. Such assets are recorded at historical cost or estimated historical cost if purchased or constructed. Donated capital assets are recorded at estimated fair market value at the date of donation.
The costs of normal maintenance and repairs that do not add to the value of the asset or materially extend asset
lives are not capitalized. Major outlays for capital assets and improvements are capitalized as projects are constructed. Interest incurred
during the construction phase of capital assets of business-type activities is included as part of the capitalized value of the assets constructed.
Capital assets are depreciated using the straight-line method over the following estimated useful lives:
Assets Years Buildings 40-50 Improvements other than buildings 30-45 Machinery and equipment 5-10 Infrastructure 15-50
7. Long-Term Obligations In the government-wide financial statements and the proprietary fund types in the fund financial statements,
long-term debt and other long-term obligations are reported as liabilities in the applicable governmental activities, business-type activities, or proprietary fund type statement of net position. Bond premiums and discounts, are deferred and amortized over the life of the bonds using the straight-line method. For current and advanced refundings resulting in the defeasance of debt, the difference between the reacquisition price and the net carrying amount of the old debt is deferred as an inflow or an outflow and amortized as a component of interest expense using the straight-line method. Bonds payable are reported net of the applicable bond premium or discount.
In the fund financial statements, governmental fund types recognize bond premiums and discounts, as well as
bond issuance costs, during the current period. The face amount of debt issued is reported as other financing sources. Premiums received on debt issuances are reported as other financing sources while discounts on debt issuances are reported as other financing uses. Issuance costs, whether or not withheld from the actual debt proceeds received, are reported as debt service expenditures in the year incurred.
It is the City's policy to permit employees to accumulate earned but unused vacation and sick pay benefits.
The City pays a portion of the employee's unused sick leave at the time of employee termination if provided for in the applicable Employee Association contract. Vacation pay and sick leave payoff are accrued when incurred in the government-wide and proprietary fund financial statements. A liability for these amounts is reported in governmental funds only if they have matured, for example, as a result of employee resignations and retirements.
8. Pension For purposes of measuring the net pension liability and pension expense, information about the fiduciary
net position of the Public Employees’ Retirement System of the State of Nevada (PERS) Base Plan (Base Plan) and additions to/deductions from Base Plan’s fiduciary net position have been determined on the same basis as they are reported by the Base Plan. For this purpose, benefit payments (including refunds of employee contributions) are recognized when due and payable in accordance with the benefit terms. Investments are reported at fair value.
90

CARSON CITY NOTES TO FINANCIAL STATEMENTS
JUNE 30, 2017
43
9. Deferred Outflows and Deferred Inflows of Resources and Restatements
Deferred outflow of resources represents a consumption of net position that applies to a future period and so will not be recognized as an outflow or resources (expense/expenditure) until that time. Deferred inflow of resources represents an acquisition of net position that applies to a future period and so will not be recognized as an inflow of resources (revenue) until that time.
Items currently presented as deferred outflows and deferred inflows are as follows:
• Unamortized gains or losses resulting from advance bond refunding’s are presented as deferredinflows of resources and deferred outflows of resources.
• Delinquent property taxes and delinquent landfill fees are presented in the General Fund andOther Governmental Funds as a deferred inflow of resources, specifically unavailable revenue-delinquent property taxes and delinquent landfill fees. Property tax revenues are considered“delinquent” when the due date of an assessment has passed and any statutory appeal rights haveexpired. Landfill fees earned but delinquent are considered delinquent if unpaid within 10 daysof the due date.
• The City participates in Public Employees’ Retirement System of the State of Nevada (PERS)and Judicial Retirement System of the State of Nevada (JRS), and will now present the City’sportion of these retirement obligations on the Statement of Net Position. In addition, the Citywill recognize differences between expected and actual experience and the net differencebetween projected and actual earnings on pension plans investments as a deferred inflow ofresources, and changes in the employer’s proportion and differences between the employer’scontributions and the employer’s proportionate contributions and City contributions subsequentto the measurement date as deferred outflows of resources. Contributions subsequent to themeasurement date include the current fiscal year contributions made by the City to PERS andJRS. All other deferred amounts were obtained from the Schedule of Employer Allocations,Schedule of Pension Amounts by Employer, and Related Notes Report prepared by PERS andthe GASB 68 Actuarial Valuation for JRS for the Fiscal Year Ended June 30, 2016.
10. Connection Fees
It is the policy of the Board of Supervisors that new users hooking up to the water and sewer systems pay a "pro rata" share of the cost of the existing systems as calculated on the basis of "Equivalent Residential Customers." To this end, a connection fee is charged for new hookups to the water and sewer systems and the amounts are reported as capital contributions.
11. Equity Classifications
In the government-wide financial statements, equity is classified as net position and displayed in three components:
• Net Investment in Capital Assets – Consists of capital assets, net of accumulated depreciation andreduced by outstanding balances of any bonds, notes or other borrowings that are attributable tothe acquisition, construction or improvement of those assets.
• Restricted Net Position – Consists of net position with constraints placed on their use either by (1)external groups such as creditors, grantors, contributors, or laws and regulations of othergovernments; (2) law through constitutional provisions or enabling legislation.
• Unrestricted Net Position – All other net position that do not meet the definition of “net investmentin capital assets, net of related debt” or “restricted.”
In the fund financial statements, governmental fund equity is classified as fund balance.
91

CARSON CITY NOTES TO FINANCIAL STATEMENTS
JUNE 30, 2017
44
Fund Balance Classification:
In the governmental fund statements, fund balance classifications describe the relative strength of the spending constraints:
• Nonspendable: This classification includes amounts that cannot be spent because they are either (a) not inspendable form or (b) are legally or contractually required to be maintained intact.
• Restricted: This classification includes amounts for which constraints have been placed on the use of theresources either (a) externally imposed by creditors (such as through a debt covenant), grantors,contributors, or laws or regulations of other governments, or (b) imposed by law through constitutionalprovisions or enabling legislation.
• Committed: This classification includes amounts that can be used only for specific purposes pursuant toconstraints imposed by formal action of the Board of Supervisors. These amounts cannot be used for anyother purpose unless the Board of Supervisors removes or changes the specified use by taking the sametype of action (resolution) that was employed when the funds were initially committed.
• Assigned: This classification includes amounts that are constrained by the City’s intended use for aspecific purpose but are neither restricted nor committed. The Board of Supervisors, in accordance withthe Fund Balance Policy, has delegated the authority to assign fund balance for specific purposes to theCity Manager or the Finance Director. This classification also includes the remaining positive fundbalance for all governmental funds except for the General Fund.
• Unassigned: This classification includes the residual fund balance for the General Fund. The GeneralFund is the only fund that would report a positive amount in unassigned fund balance. The unassignedclassification also includes negative residual fund balance of any other governmental fund that cannotbe eliminated by offsetting of assigned fund balance amounts.
A minimum unrestricted ending fund balance of not less than 5% (with a goal of 8.3%) of total budgeted expenditures shall be included in the General Fund budget each fiscal year. An inability to meet this requirement must be approved by the Board of Supervisors.
Spending Order of Fund Balances:
Fund balance classifications should depict the nature of the net resources that are reported in the governmental fund. Fund balance in individual governmental funds may be comprised of a single classification or many classifications.
When both restricted and unrestricted funds are available for expenditure, it is the City’s policy to expend restricted resources first then unrestricted resources.
Unrestricted fund balance includes the committed, assigned, and unassigned classifications. When any of these amounts are available for expenditure, it is the City’s policy to expend committed resources first, followed by assigned resources, then unassigned resources.
12. Comparative Data
Comparative total data for the prior year have been presented only for individual funds in the fund financial statements in order to provide an understanding of the changes in financial position and operations for the funds. Also, certain amounts presented in prior year data have been reclassified in order to be consistent with current year's presentation.
E. IMPLEMENTATION OF GASB STATEMENTS NO. 77 AND NO. 82
As of July 1, 2016, the City adopted GASB Statement No. 77, Tax Abatement Disclosures. The implementation of this standard requires state and local governments to disclose tax abatements affecting their revenue-raising abilities in their financial reports. The additional disclosures required by this standards are included in Note 4.
As of July 1, 2016, the City adopted GASB Statement No. 82, Pension Issues – an amendment of GASB Statements No. 67, No. 68, and No. 73. The implementation of this standard is to clarify issues regarding the presentation of payroll-related measures in required supplementary information. 92

CARSON CITY NOTES TO FINANCIAL STATEMENTS
JUNE 30, 2017
45
NOTE 2 - STEWARDSHIP, COMPLIANCE AND ACCOUNTABILITY
A. BUDGETARY INFORMATION
Annual budgets are adopted on a basis consistent with generally accepted accounting principles for all governmental and proprietary funds. All annual appropriations lapse at fiscal year-end.
On or before mid-February of each year, all agencies of the City must submit requests for appropriations to the Internal Finance Committee comprised of the City Manager, Finance Director, District Attorney and Human Resources Director in order that a budget may be prepared. Before April 15th, a tentative budget is submitted to the Board of Supervisors, the Redevelopment Authority, and the State of Nevada. The City then holds a series of public hearings and a final budget must be prepared and adopted no later than June 1st.
The appropriated budget is prepared by fund, function and department. The City's department heads may request transfers of appropriations within the department's budget categories. Transfers of appropriations between department categories or functions within a fund may be made with the City Manager's approval. Transfers of appropriations between funds, from contingency accounts, or increases in budget appropriations require the approval of the Board of Supervisors or Redevelopment Authority. The legal level of budgetary control (i.e., the level at which expenditures may not legally exceed appropriations) is the function level for governmental funds and the sum of operating and nonoperating expenses in the proprietary funds. There are no budgetary restrictions in the debt service funds regarding expenditures related to payments of principal and interest on long-term debt. The Board of Supervisors made several supplemental budgetary appropriations throughout the year.
B. EXCESS OF EXPENDITURES OVER APPROPRIATIONS
The City conformed to all significant statutory constraints on its financial administration during the fiscal year.
C. DEFICIT FUND EQUITY
The Ambulance and the Group Medical Insurance Funds have deficit fund balances of $3,407,938 and $181,135, respectively. These deficit balances are due to large retirement obligations added according to GASB Statement No. 68, Accounting and Financial Reporting for Pensions.
NOTE 3 - DETAILED NOTES ON ALL FUNDS
A. DEPOSITS AND INVESTMENTS
At year end, the City's carrying amount of deposits was $4,866,572 and the bank balance was $5,653,225. All of the bank balance was covered by FDIC, SIPC, or collateralized by the Office of the State Treasurer/Nevada Collateral Pool.
The carrying amount of deposits for Carson City Airport Authority, discretely presented component unit, was $697,829, and the bank balance was $703,238. All of the bank balance was covered by federal depository insurance or by collateral held by the component unit’s agent in the component unit’s name. As of June 30, 2017, the Carson City Culture and Tourism Authority (formerly known as Carson City Visitors’ Bureau) is investing in the Carson City Investment Pool, their balance is $1,368,333.
The City has a formal investment policy to establish guidelines for the prudent investment of City funds. Funds of the City will be invested in compliance with the provisions of Nevada Revised Statutes (NRS), Chapters 355.167 through 355.200, and other applicable statutes. Allowable investments are described in Note 1.D.1.
The City categorizes the fair value measurements of its investments based on the hierarchy established by generally accepted accounting principles. The fair value hierarchy, which has three levels, is based on the valuation inputs used to measure an asset’s fair value:
Level 1 – Inputs are quoted prices in active markets for identical assets; Level 2 – Inputs are significant other observable inputs; and Level 3 – Inputs are significant unobservable inputs. 93

CARSON CITY NOTES TO FINANCIAL STATEMENTS
JUNE 30, 2017
46
The City does not have any investments that are measured using Level 3 inputs.
As of June 30, 2017, the City had the following recurring fair value measurements below:
Fair Value Measurements Using Government-wide Balances: Investment Type Total Level 1 Inputs Level 2 Inputs
U.S. Treasuries $ 5,937,912 $ 5,937,912 $ - U.S. Agencies 13,808,540 - 13,808,540Corporate Bonds 12,226,900 - 12,226,900Money Market Mutual Fund 186,933 186,933 -
32,160,285 6,124,845 26,035,440
State of Nevada: Local Government Investment Pool 13,765,695 - -
Total $ 45,925,980 $ 6,124,845 $ 26,035,440
Investments categorized as Level 1 are valued using prices quoted in active markets for those investments. Investments categorized as Level 2 are valued at fair value based on the observable market prices of the underlying assets held by the pool or fund less liabilities.
At year end, the City had the following investments and maturities:
Investment Maturities (in Years) Less
Investment Type Fair Value Than 1 1-5 6-10 10+
U.S. Treasuries $ 5,937,912 $ 498,475 $ 5,439,437 $ - $ - U.S. Agencies 13,808,540 1,745,236 10,960,333 832,343 270,628 Corporate Bonds 12,226,900 2,609,090 9,617,810 - - Money Market Mutual Fund 186,933 186,933 - - - State of Nevada: Local Government Investment Pool 13,765,695 13,765,695 - - -
Total $ 45,925,980 $ 18,805,429 $ 26,017,580 $ 832,343 $ 270,628
Interest Rate Risk. As a means of limiting its exposure to fair value losses arising from rising interest rates, the City’s Investment Policy states that portfolio maturities must be structured to avoid the forced sale of securities in any but the most severe circumstances. To this end, portfolio management procedures will provide for the projection of a “minimum liquidity requirement” for the City’s operating fund.
The following procedures will be applied:
• Minimum Liquidity Requirement: This is defined as the total cash flow needed to pay City obligations for a period offour weeks. All securities to be included in the “minimum liquidity requirement” must mature within 28 days.
• Intermediate Market Investment: That portion of City funds remaining after deletion of the “minimum liquidityrequirement” may be invested in the intermediate market, defined herein as instruments maturing between zero and tenyears.
• No U.S. bonds, debentures, bills, notes, agency obligations or other securities, including those used as collateral forrepurchase agreements, may have a maturity date of more than 10 years from the date of purchase. Securities purchasedby money managers under the provisions of NRS 355.171 may have a longer stated maturity date.
94

CARSON CITY NOTES TO FINANCIAL STATEMENTS
JUNE 30, 2017
47
Credit Risk. Funds invested with the State of Nevada Treasurer in the Local Government Investment Pool may be invested as permitted by Nevada Revised Statutes. City policy does not further restrict these investments. As of June 30, 2017, the City’s investments in U.S. Agencies were rated AA- by Standard and Poor’s and A1 by Moody’s Investors Service. The City’s investment in the State of Nevada Local Government Investment Pool is an unrated external investment pool with an average duration of 142 days. The City’s investments in corporate bonds were rated as follows:
AAA AA A Not Rated Moody’s $4,546,888 $ 1,496,770 $1,935,278 $4,247,964 S&P 4,021,277 1,248,960 2,183,088 4,773,575
Concentration of Credit Risk. The City’s Investment Policy states that no more than 20% of the total book value of the portfolio will be invested in a single security type with the exception of U.S. Treasury and government agency securities.
At June 30, 2017, the following investments exceeded 5% of the City’s total:
Federal Home Loan Mortgage Corporation $5,651,613 12.31% Federal Home Loan Banks 4,140,197 9.01% Federal National Mortgage Association 4,016,730 8.75%
A reconciliation of cash and investments for the primary government follows:
Cash on hand $ 7,522 Carrying amount of deposits 4,866,572 Carrying amount of investments 45,925,980
$50,800,074 Less: Carrying amount of deposits held for component unit (1,368,333)
$49,431,741
Cash and investments – governmental activities $20,767,251 Cash and investments – business-type activities 18,891,114 Cash and investments – investment trust fund 8,223,429 Cash and investments – OPEB trust fund (4,220) Cash and investments – agency funds 1,063,960 Cash and investments – restricted 490,207
$49,431,741
The State of Nevada Local Government Investment Pool is an external pool administered by the State Treasurer, with oversight by the State of Nevada Board of Finance. Investment in the Local Government Investment Pool is carried at fair value, which is the same as the value of the pool shares.
The City administers an external investment pool combining the City money with involuntary investments from the Carson City School District and voluntary investments from the Carson City Other Post-Employment Benefits Trust Fund. Each participant's share is equal to their original investment plus or minus monthly allocation of interest income and realized and unrealized gains and losses. Interest allocation is calculated monthly and is based on the month end cash balances of each fund participating in the pool. The fair value and interest receivable allocations are calculated at year end and are based on the average monthly cash balance of each fund participating in the pool. The determination of realized gains and losses is independent of the determination of the net change in the fair value of investments and realized gains and losses on investments that were held by the governmental entity during a previous accounting period(s) but sold during the current period were used to compute the change in the fair value of investments for the previous year(s) as well as the current year. The participant's share and redemption value are calculated using the same method. The Board of Supervisors has overall responsibility for investment of the City funds, including the Investment Trust Fund, in accordance with NRS 355.175. The Carson City Chief Investment Official is the Carson City Treasurer, under authority delegated by the Board of Supervisors. The City has not provided or obtained any legally binding guarantees during the period to support the value of shares. The external investment pool is not registered with the SEC as an investment company. 95

CARSON CITY NOTES TO FINANCIAL STATEMENTS
JUNE 30, 2017
48
Summary of investments held in the external investment pool at June 30, 2017:
Principal Amount Number Interest Maturity
Investment Type Fair Value of Shares Rate Dates
U.S. Treasuries $ 5,937,912 $ 5,971,000 0.75-1.50% 02/28/2018-03/31/2021 U.S. Agencies 13,808,540 13,822,765 0.75-5.5% 09/25/2017-07/25/2035 Corporate Bonds 12,226,900 12,221,922 0.0-5.65% 07/03/2017-03/15/2022 Money Market Mutual Fund 186,933 186,933 0.0% 07/01/2017 State of Nevada Local Government Investment Pool 13,765,695 13,765,695 Variable 07/01/2017
Total Pooled Investments $45,925,980
External Investment Pool financial statements:
Statement of Net Position, June 30, 2017
Assets: Investments in securities:
U.S. Treasuries $ 5,937,912 U.S. Agencies 13,808,540 Corporate Bonds 12,226,900 Money Market Mutual Fund 186,933 State of Nevada Local Government Investment Pool 13,765,695
Interest receivable 95,865
Total Assets $46,021,845
Net position consists of: Internal participants $37,802,636 External participants 8,219,209
Total Net Position Held in Trust for Pool Participants (Participant units outstanding, $1.00/par) $46,021,845
Statement of Changes in Net Position, Year Ended June 30, 2017
Additions: Capital share transactions $ 7,578,927 Investment income 594,142
Realized gains (losses) (73,592) Unrealized gains (losses) (292,893)
Total Additions 7,806,584
Deductions: Investment fees 46,987
Total Deductions 46,987
Net Increase 7,759,597
Net position: Beginning of Year 38,262,248
End of Year $ 46,021,845
96

CARSON CITY NOTES TO FINANCIAL STATEMENTS
JUNE 30, 2017
49
B. CAPITAL ASSETS
Capital asset activity of the primary government for the year ended June 30, 2017, was as follows:
Balance Balance July 1, 2016 Increases Decreases Transfers June 30, 2017
Governmental activities: Capital assets, not being depreciated:
Land $ 136,831,268 $ 112,098 $ (24,701) $ - $ 136,918,665Construction in progress - infrastructure 5,331,527 222,349 (3,325) (5,286,037) 264,514 Construction in progress 4,394,566 3,711,233 - (4,364,101) 3,741,698
Total Capital Assets not being Depreciated 146,557,361 4,045,680 (28,026) (9,650,138) 140,924,877
Capital assets, being depreciated: Buildings 85,181,423 659,764 (345,434) 3,232,655 88,728,408 Improvements other than buildings 46,970,743 2,700,054 (7,301) 87,723 49,751,219 Machinery and equipment 34,340,864 1,819,431 (1,261,541) 1,309,959 36,208,713 Infrastructure 158,278,168 5,929,512 - 5,281,161 169,488,841
Total Capital Assets being Depreciated 324,771,198 11,108,761 (1,614,276) 9,911,498 344,177,181
Less accumulated depreciation for: Buildings (24,569,390) (1,771,896) 27,635 - (26,313,651)Improvements other than buildings (19,449,224) (1,564,838) 1,947 - (21,012,115)Machinery and equipment (25,448,135) (2,148,377) 1,079,025 (259,020) (26,776,507)Infrastructure (35,532,464) (2,068,208) - - (37,600,672)
Total Accumulated Depreciation (104,999,213) (7,553,319) 1,108,607 (259,020) (111,702,945)
Total Capital Assets being Depreciated, Net 219,771,985 3,555,442 (505,669) 9,652,478 232,474,236
Governmental Activities Capital Assets, Net $ 366,329,346 $ 7,601,122 $ (533,695) $ 2,340 $ 373,399,113
97

CARSON CITY NOTES TO FINANCIAL STATEMENTS
JUNE 30, 2017
50
Balance Balance
July 1, 2016 Increases Decreases Transfers June 30, 2017
Business-type activities:
Capital assets, not being depreciated: Land $ 5,397,807 $ 4,161 $ - $ - $ 5,401,968Construction in progress 23,178,003 21,824,052 - (3,021,773) 41,980,282Water rights 19,981,480 - - - 19,981,480 Water Capacity 4,169,896 - - - 4,169,896
Total Capital Assets not being Depreciated 52,727,186 21,828,213 - (3,021,773) 71,533,626
Capital assets, being depreciated: Buildings 20,593,349 - - - 20,593,349 Improvements other than buildings 217,837,832 939,173 - 2,787,532 221,564,537 Machinery and equipment 11,634,106 597,521 (113,696) 195,209 12,313,140
Total Capital Assets being Depreciated 250,065,287 1,536,694 (113,696) 2,982,741 254,471,026
Less accumulated depreciation for:
Buildings (5,880,384) (419,657) - - (6,300,041) Improvements other than buildings (100,919,662) (5,834,583) - - (106,754,245) Machinery and equipment (8,689,505) (843,572) 113,696 36,692 (9,382,689)
Total Accumulated Depreciation (115,489,551) (7,097,812) 113,696 36,692 (122,436,975)
Total Capital Assets being Depreciated, Net 134,575,736 (5,561,118) - 3,019,433 132,034,051
Business-type activities capital assets, Net $ 187,302,922 $ 16,267,095 $ - $ (2,340) $ 203,567,677
Depreciation expense was charged to functions/programs of the primary government as follows:
Governmental activities: General government $ 546,551 Judicial 54,084 Public safety 1,393,965 Public works 2,604,287 Airport 476,769 Health 687,285 Culture and recreation 1,631,370 Capital assets held by the government’s internal service funds are
charged to the various functions based on their usage of the assets 162,008
Total Depreciation Expense – Governmental Activities $7,553,319
Business-type activities: Ambulance $ 46,432 Sewer 3,385,558 Water 3,331,455 Cemetery 12,892 Storm Drainage 321,475
Total Depreciation Expense – Business-Type Activities $7,097,812
98

CARSON CITY NOTES TO FINANCIAL STATEMENTS
JUNE 30, 2017
51
Construction commitments
The City was committed to construction projects in various funds, as of June 30, 2017, as follows:
Remaining Project Name Value of Work Commitment Contract Number Completed as of as of Vendor Name Bid Award June 30, 2017 June 30, 2017
Sewer Fund: CMAR Water Resource Recovery Facility Phase 1 - #1314-132B KG Walters/Q&D $29,991,581 $25,435,312 $4,556,269
N. Nevada St. & N. Division St. Sewer &Water Main Replacement - #1617-119Peek Brothers Construction, Inc. 2,197,952 109,166 2,088,786
Transportation Projects: Blue Line ADA Improvements #1617-123 Justin Wilson Construction, LLC 76,642 72,807 3,835
Koontz Land ADA Improvements #1617-152 Justin Wilson Construction, LLC 61,125 - 61,125
Parks and Recreation – Swimming Pool: Aquatic Center Re-roof Project #1617-056 Alpine Roofing 54,278 49,344 4,934
Rifle Range Vault Toilet & ADA #1617-147 MNW Construction, LLC 11,000 2,750 8,250
Infrastructure Fund: CMAR Downtown Carson Streetscape Project - #1415-145B Q&D Construction 8,258,518 8,093,348 165,170
Insurance Fund: Vicee Canyon Sediment Basin Repair Project (2017 Flood) - #1617-155 Horizon Construction, Inc. 50,175 45,614 4,561
Combs/Timberline Sediment Basin Project (2017 Flood) - #1617-157 ARMAC Construction, LLC 98,489 98,015 474
Historic Roberts House Preservation Project (Arson) - #1617-118 Central Sierra Construction, Inc. 45,500 - 45,500
Total $40,845,260 $33,906,356 $6,938,904
Other Commitments:
On April 1, 1997, the City entered into an agreement with the State of Nevada, Department of Transportation (Highway Agreement No. R159-97-060) to help construct the Carson City Bypass. The City is funding this obligation through a $.05 increase in the county motor vehicle fuel tax. The City intends to contribute a total of $19 million plus interest. As of June 30, 2017 the City has contributed $14,196,189.
99

CARSON CITY NOTES TO FINANCIAL STATEMENTS
JUNE 30, 2017
52
In August 2004, the City and the State of Nevada, Department of Transportation (NDOT) added Amendment 1 to the above Agreement. The amendment provides for the following:
• The City shall pay to NDOT an amount of $15,000,000, with payments beginning upon completion of the funding
obligation for Phase I of the freeway as prescribed in Highway Agreement No. R159-97-060 and amended herein, estimated to start in 2011 and finish in 2026. For Phase 2, the City shall pay the tax based on a $.03 levy in the county motor vehicle fuel tax. The amounts received from the additional $.02 levy will be used to maintain Carson Street and Fairview Drive as described below.
• It is further agreed that the City will assume ownership and maintenance responsibility for Carson Street from approximately Arrowhead Drive in the north to the intersection of the Carson City Freeway at the Spooner Intersection to the south, upon construction completion to the point when vehicles are using Phase 2.
• The City also agrees to construct Fairview Drive to a minimum of four through lanes with turn lanes, from the terminus of Phase 2A at Fairview Drive to US 395/Carson Street, and to be responsible for maintenance of Fairview Drive.
• NDOT agrees to defer payment by the City of the current $.05 tax as defined in Highway Agreement No. R159-97-060 from the period beginning July 1, 2005 through June 30, 2008, to allow the City to utilize the payments for the Fairview Drive improvements.
In December 2007, the City and the NDOT added Amendment 2. The amendment provides for the following:
• City agreed to assume ownership and maintenance responsibility of additional State streets in lieu of remaining payment due for Phase 1 in the amount of $4.8 million dollars.
• Deferred payment of $.03 tax to July 1, 2009, to allow construction of Fairview Drive.
In 2009, the City and the NDOT added Amendment 3. The amendment provides for the following:
• City agreed to take additional State streets for maintenance and forego pavement rehabilitation by NDOT of Carson Street in lieu of a portion of the remaining payment due for Phase 2 in the amount of $7.9 million dollars.
• Deferred $.03 tax payments for remaining $7.1 million until completion of Phase 2B. On August 10, 2016 the City and the NDOT added Amendment 4. The amendment provides for the following:
• Clarification that the portions of Snyder Avenue and S. Carson Street (including associated Frontage Road) would be relinquished to the City as previously agreed upon following completion and opening to traffic of Phase 2B-3 of the freeway (expected in 2018). Although the freeway is open to traffic the State has not completed the project.
• NDOT shall pay Carson City a sum not to exceed $5.1 million for improvements to include a Complete Streets Project within the relinquished State highways area, which Carson City agrees to have under construction by the end of 2019.
• Clarification of the deferred $.03 tax payments for the remaining $7.1 million was included which states that tax payments are deferred until the completion of Phase 2B, including the completion of the interchange at Carson Street/U.S. Highway 50 West at the southern terminus of the Carson City Freeway, (known as Phase 2B-4).
As of June 30, 2017, Phase 2B-4 had not yet been initiated or programmed by the Nevada Department of Transportation and, as such, the $.03 tax payments mentioned above remain deferred.
100

CARSON CITY NOTES TO FINANCIAL STATEMENTS
JUNE 30, 2017
53
Discretely presented component units
Activity for the Airport Authority for the year ended June 30, 2017 was as follows:
Balance Balance July 1, 2016 Increases Decreases June 30, 2017
Capital assets not being depreciated: Land $ 146,542 $ - $ - $146,542
Total Capital Assets not being Depreciated 146,542 - - 146,542
Capital assets being depreciated: Machinery and equipment 705,815 - - 705,815 Less accumulated depreciation for:
Machinery and equipment (614,272) (21,772) - (636,044)
Total Capital Assets being Depreciated, Net 91,543 (21,772) - 69,771
Airport Authority Capital Assets, Net $ 238,085 $ (21,772) $ - $216,313
Activity for the Culture and Tourism Authority for the year ended June 30, 2017 was as follows:
Balance Balance July 1, 2016 Increases Decreases June 30, 2017
Capital assets, not being depreciated: Website $ 41,028 $ - $ - $ 41,028
Total Capital Assets not being Depreciated 41,028 - - 41,028
Capital assets, being depreciated: Improvement other than buildings 8,388 - - 8,388 Machinery and equipment 42,795 - - 42,795
Total Capital Assets being Depreciated 51,183 - - 51,183
Less accumulated depreciation for: Improvements other than buildings (1,349) (1,198) - (2,547)Machinery and equipment (9,545) (6,114) - (15,659)
Total Accumulated Depreciation (10,894) (7,312) - (18,206)
Total Assets Being Depreciated, Net 40,289 (7,312) - 32,977
Culture and Tourism Authority Capital Assets, Net $ 81,317 $ (7,312) $ - $ 74,005
C. INTERFUND RECEIVABLES, PAYABLES, AND TRANSFERS
The composition of interfund balances as of June 30, 2017, is as follows:
Due to/from other funds:
Receivable Fund Payable Fund Amount
General Fund Nonmajor governmental funds $42,951
Nonmajor governmental funds Nonmajor governmental funds $7,320 101

CARSON CITY NOTES TO FINANCIAL STATEMENTS
JUNE 30, 2017
54
The above interfund balances at June 30, 2017 are generally short-term loans to cover temporary cash deficits in various funds. They are expected to be repaid in the next fiscal year. Due to/from primary government and component units:
Receivable Fund Payable Fund Amount Component unit – Airport Authority Primary government – General Fund $ 246,131 Interfund transfers:
Transfers In: Transfers out:
General
Fund
Internal Service Funds
Nonmajor Enterprise
Funds
Nonmajor Governmental
Funds
Total General Fund
$ - $250,000
$440,000
$5,580,476 $6,270,476
Nonmajor Governmental Funds Nonmajor Enterprise Funds
582,321 -
-
31,020
- -
6,040,312 -
6,622,633
31,020 Total Transfers $582,321 $281,020 $ 440,000 $11,620,788 $12,924,129
Transfers are used to (1) move revenues from the fund that statute or budget requires to collect them to the fund that statute or budget requires to expend them, and (2) use unrestricted revenues collected in the General Fund to finance various programs accounted for in other funds in accordance with budgetary authorizations. D. LONG-TERM DEBT
General Obligation Bonds. The City issues general obligation bonds to provide funds for the acquisition and construction of
major capital facilities. General obligation bonds have been issued for both governmental and business-type activities. In addition, general obligation bonds have been issued to refund general obligation bonds.
General obligation bonds are direct obligations and pledge the full faith and credit of the City. These bonds generally are issued
as serial bonds with equal amounts of principal maturing each year.
Business-type general obligation bonds through the State of Nevada revolving loan program were authorized on July 10, 2015 up to the amounts of $12,000,000 Sewer Bonds. At June 30, 2017 amounts drawn and payable are $8,257,708. General obligation revenue bonds through the State of Nevada revolving loan program were issued to finance capital improvement projects for the City’s public sewer system. General obligation bonds currently outstanding are as follows:
Purpose Interest Rates Amount Governmental activities 3.00-5.00% $ 13,340,000 Governmental activities - refunding 2.00-5.00% 46,330,000 Business-type activities 0.0-6.662% 82,095,430 Business-type activities - refunding 2.0-5.000% 23,702,000
102

CARSON CITY NOTES TO FINANCIAL STATEMENTS
JUNE 30, 2017
55
Revenue Bonds. The City also issues bonds where the City pledges income derived from the acquired or constructed assets to pay debt service. On May 25, 2017 the City issued Highway Revenue (Motor Vehicle Fuel Tax) Refunding Bonds Series 2017 in the amount of $5,951,000, proceeds were used to partially refund the 2008 Highway Revenue Bonds. Revenue bonds outstanding at year end are as follows:
Purpose Interest Rates Amount
Governmental activities: Regional Transportation 2.37-5.00% $ 15,384,200
Notes Payable. The City issues notes to provide funds for open space, various improvements, and vehicles and to refund Redevelopment debt. On December 14, 2016 the City issued two installment purchase agreements for an energy efficiency project, one was a 10 year tax exempt note in the amount of $1,156,700, and the other was a 20 year qualified energy conservation bond in the amount of $3,101,538. The installment purchase agreements are payable to the City on a reimbursement basis, as of June 30, 2017 the City had drawn $3,425,293. Notes payable outstanding at year end are as follows:
Purpose Interest Rates Amount
Governmental activities: Installment purchase agreement BRIC Purchase 2.650% 899,800 Landfill capital equipment 2.230% 1,253,000 911 Surcharge capital equipment 2.230% 662,000 Installment purchase agreement Energy Efficiency 2.190% 790,343 Energy Efficiency (QECB) 4.690% 2,634,950 Business-type activities: Stormwater Drainage 1.880% 260,900 Sewer 1.880% 524,900
Pledged Revenues. The City has pledged specific revenues to repay bonds in governmental and business-type activities.
Governmental activities
The City has pledged 15% of the consolidated tax revenue receipts for the repayment of various General Obligation Revenue bonds consisting of the Refunding Bonds series 2010, 2013 Installment Purchase Agreement, Refunding Bonds Series 2013A, Medium Term Landfill Capital Acquisition Bonds Series 2014, Medium Term 911 Surcharge Capital Acquisition Bonds Series 2014 and the Refunding Capital Improvement Bonds Series 2015C. The total principal and interest remaining to be paid on the bonds is $41,491,312 payable through fiscal year 2033. For the current year, principal and interest paid for the bonds totaled $3,805,032 and pledged revenues totaled $4,113,944.
The City has pledged future 1/4 cent voter approved (Quality of Life) sales tax revenues to repay $9,060,000 in Parks Refunding Bonds Series 2010 and Parks Refunding Bonds Series 2013C. Proceeds of the bonds provided financing for new parks facilities, to purchase open space and to improve and equip current parks facilities. The bonds are intended to be paid solely from the 1/4 cent tax revenues and are payable through fiscal year 2030. Annual principal and interest payments on the bonds are expected to require 25% of the pledged revenues. The total principal and interest remaining to be paid on the bonds is $8,870,605. For the current year, principal and interest paid for the bonds totaled $655,169 and pledged revenues totaled $2,575,087.
The City has pledged future 1/8 cent sales tax revenues (NRS 377B), to repay $8,400,000 in General Obligation V&T Historical Refunding Bonds Series 2014E. The bonds are intended to be paid solely from the 1/8 cent tax revenues and are payable through fiscal year 2026. Annual principal and interest payments on the bonds are expected to require 81% of the pledged revenues. The total principal and interest remaining to be paid on the bonds is $9,384,575. For the current year, principal and interest paid for the bonds totaled $1,042,450 and pledged revenues totaled $1,287,504.
103

CARSON CITY NOTES TO FINANCIAL STATEMENTS
JUNE 30, 2017
56
The City has pledged future 1/8 cent sales tax revenue (NRS 377B), to repay $13,600,000 in General Obligation Infrastructure Sales Tax Bonds 2014F. The bonds are intended to be paid solely from the 1/8 cent tax revenues and are payable through fiscal year Fiscal Year 2045. Annual principal and interest payments on the bonds are expected to require 60% of the pledged revenues. The total principal and interest remaining to be paid on the bonds is $21,703,875. For the current year, principal and interest paid for the bonds totaled $773,575, and pledged revenues totaled $1,283,794.
The City has pledged room tax to repay $3,350,000 in Room Tax Refunding Revenue Supported Bonds. The bonds are intended to be paid solely from room tax and are payable through fiscal year 2023. Annual principal and interest payments on the bonds are expected to require 17% of the pledged revenues. The total principal and interest remaining to be paid on the bonds is $2,375,350. For the current year, principal and interest paid for the bonds totaled $347,655 and pledged revenues totaled $1,934,371. The City has pledged motor vehicle fuel tax revenues to repay $9,055,000 in Highway Revenue (Motor Vehicle Fuel Tax) Improvement Bonds Series 2008, and $3,332,300 in Refunding Highway Revenue (Motor Vehicle Fuel Tax) Subordinate Lien Refunding Bonds Series 2012, $6,170,000 in Refunding Highway Revenue (Motor Vehicle Fuel Tax) Subordinate Lien Improvement Bonds Series 2015, and $5,951,000 in Refunding Highway Revenue (Motor Vehicle Fuel Tax) Refunding Bonds Series 2017. The bonds are secured solely from motor vehicle fuel tax and are payable through fiscal year 2030. Annual principal and interest payments on the bonds are expected to require 57% of the pledged revenues. The total principal and interest remaining to be paid on the bonds is $18,550,489. For the current year, principal and interest paid for the bonds totaled $1,634,911 and pledged revenues totaled $2,858,234. Business-type activities
The City has pledged future sewer utility customer revenues, connection fees and investment earnings, net of specified operating expenses to repay $56,741,728 in sewer utility system general obligation revenue bonds issued between fiscal years 1995 and 2017. Sewer State Revolving Fund Bonds issued July 10, 2015 totaled $12,000,000 are not fully drawn down, as of June 30, 2017 only $8,257,708 was drawn. Proceeds from the bonds provided financing for expansion of, and improvements to, the sewer utility system. The bonds are intended to be paid solely from utility customer net revenues and are payable through fiscal year 2035. Annual principal and interest payments on the bonds are expected to require as much as 100% of the utility’s net revenues. The total principal and interest remaining to be paid on the bonds is $57,179,902. For the current year, principal and interest paid for the bonds totaled $2,638,875 and net pledged revenues totaled $7,510,428. The City has pledged future water utility customer revenues and connection fees and investment earnings, net of specified operating expenses to repay $69,147,000 in water utility system general obligation revenue bonds issued between fiscal years 1998 and 2014. The bonds are intended to be paid solely from utility customer net revenues and are payable through fiscal year 2040. Annual principal and interest payments on the bonds are expected to require as much as 100% of the utility’s net revenues. The total principal and interest remaining to be paid on the bonds is $78,211,548. For the current year, principal and interest paid for the bonds totaled $5,277,736 and net pledged revenues totaled $7,532,837. The City has pledged future storm drainage utility customer revenues and connection fees and investment earnings, net of specified operating expenses to repay $5,141,738 in storm drainage utility system general obligation revenue bonds issued between fiscal years 2005 and 2014. The bonds are intended to be paid solely from utility customer net revenues and are payable through fiscal year 2034. Annual principal and interest payments on the bonds are expected to require as much as 100% of the utility’s net revenues. The total principal and interest remaining to be paid on the bonds is $4,980,928. For the current year, principal and interest paid for the bonds totaled $571,528 and net pledged revenues totaled $805,080.
104

CARSON CITY NOTES TO FINANCIAL STATEMENTS
JUNE 30, 2017
57
Capital Leases. The City has entered into lease agreements as lessee for financing the acquisition of office equipment. The net present value of minimum lease payments at year end was $65,202 to be paid in full in 2021.
The assets acquired through capital lease are as follows:
Governmental Activities
Asset: Machinery and equipment $ 95,143
Less: Accumulated depreciation (19,201)
Total $ 75,942
Compensated Absences. The compensated absences liability attributable to governmental activities is liquidated primarily by the General Fund.
Advanced Refundings. During the year ended June 30, 2017 the City had the following advanced refundings:
On May 25, 2017, the City issued $5,951,000 of Highway Revenue (Motor Vehicle Fuel Tax) Refunding Bonds Series 2017 to provide resources for capital improvements and to purchase U.S. Government State and Local Government Series securities that were placed in an irrevocable trust for the purpose of generating resources for all future debt service payments of $5,549,500 of Highway Revenue Bonds. The refunding was undertaken to refund the “Regional Transportation Improvement Program Note, Series 2008” maturing on November 1, 2027. As a result, the refunded bonds are considered to be defeased and the liability has been removed from the government-wide Statement of Net Position. The reacquisition price exceeded the net carrying amount of the old debt by $310,259. This amount is being netted against the new debt and amortized over the remaining life of the new debt, which is the same as the old debt. The advanced refunding resulted in a decrease in total debt service payments over the next eleven years of $678,286 and an economic gain of $585,669. The total amount of the outstanding debt defeased and placed in an irrevocable trust at May 25, 2017 was $5,859,759.
Conduit Debt. On March 4, 2002, October 1, 2003, and October 27, 2005, the City issued $45,185,000, $95,000,000, and $15,000,000, respectively, in revenue bonds for Carson-Tahoe Regional Healthcare, a non-profit corporation. As of September 1, 2012 the City issued $52,930,000 in Hospital Revenue Refunding Bonds (Carson Tahoe Regional HealthCare Project) Series 2012 for the sole purpose of refunding $20,180,000 of the March 4, 2002 Hospital Revenue Bonds (Carson-Tahoe Hospital Project) Series 2002 and $39,035,000 of the October 1, 2003 Hospital Revenue Bonds (Carson-Tahoe Hospital Project) Series 2003A. The bonds issued pursuant to NRS Chapter 268, are not obligations of the City, nor shall they ever constitute a debt of the City and therefore have been excluded from the City’s financial statements. The principal balance outstanding at June 30, 2017 was $96,135,000.
105

CARSON CITY NOTES TO FINANCIAL STATEMENTS
JUNE 30, 2017
58
Changes in long-term liabilities. Long-term liability activity of the primary government for the year ended June 30, 2017, was as follows:
Balance Balance Due WithinJuly 1, 2016 Additions Reductions June 30, 2017 One Year
Governmental Activities:Bonds payable:General obligation revenue bonds:2.0 to 3.5% Park refunding general obligation revenuebonds series 2010, due 11/01/18 - $2,505,000 1,045,000$ -$ (335,000)$ 710,000$ 350,000$
2.0 to 4.0% Various Purpose refunding general obligationrevenue bonds series 2010, due 6/01/21 - $4,705,000 2,455,000 - (605,000) 1,850,000 630,000
2.2 to 3.5% Various Purpose refunding general obligationrevenue bonds series 2013A, due 5/31/30 - $16,520,000 14,465,000 - (750,000) 13,715,000 780,000
2.0 to 2.5% Room Tax refunding general obligationrevenue bonds series 2013B, due 6/01/23 - $3,350,000 2,495,000 - (295,000) 2,200,000 300,000
2.0 to 4.0% Parks refunding general obligationrevenue bonds series 2013C, due 3/01/30 - $6,555,000 6,505,000 - (80,000) 6,425,000 75,000
2.0 to 5.0% V&T refunding general obligationrevenue bonds series 2014E, due 12/01/25 - $8,400,000 8,400,000 - (720,000) 7,680,000 735,000
3.0 to 5.0% Infrastructure Sales Tax general obligationrevenue bonds series 2014F, due 9/01/44 - $13,600,000 13,600,000 - (260,000) 13,340,000 270,000
2.0 to 5.0% Capital improv. refunding general obligationrevenue bonds series 2015C, due 5/01/33 - $15,410,000 14,410,000 - (660,000) 13,750,000 670,000
Subtotal 63,375,000 - (3,705,000) 59,670,000 3,810,000
Revenue Bonds:4.9% 2008 Highway Revenue motor vehiclefuel tax revenue bonds, due 11/01/27 - $9,055,000 6,912,200 - (5,865,800) 1,046,400 329,700
2.370% 2012 Highway Revenue refunding motorvehicle fuel tax revenue bonds, due 11/01/23 - $3,332,300 2,928,300 - (336,500) 2,591,800 346,900
3.0 to 5.0% 2015 Highway Revenue refunding motorvehicle fuel tax revenue bonds, due 11/01/29 - $6,170,000 6,130,000 - (335,000) 5,795,000 345,000
2.415% Highway Revenue refunding motor vehiclefuel tax revenue bonds, due 11/1/2027 - $5,951,000 - 5,951,000 - 5,951,000 83,000
Subtotal 15,970,500 5,951,000 (6,537,300) 15,384,200 1,104,600
Notes Payable:1.88% Capital Projects general obligation (limited tax)medium-term note dated 7/8/12, due 3/1/17 - $1,100,000 226,900 - (226,900) - -
2.65% Installment purchase agreement, buildingpurchase, medium-term note dated 4/24/13, due 4/1/28 - $1,169,500 969,400 - (69,600) 899,800 71,500
2.230% Landfill general obligation (limited tax) medium-term note dated 6/24/2014, due 6/1/2024 - $1,733,000 1,416,000 - (163,000) 1,253,000 167,000
2.230% 911 Surcharge general obligation (limited tax)medium-term note dated 6/24/14, due 6/1/24 - $918,000 749,000 - (87,000) 662,000 88,000
2.190% Installment purchase agreement, energy savingscontract, medium term note dated 12/14/2016,due 12/1/2025 - $1,156,700 - 790,343 - 790,343 56,300
4.690% Installment purchase agreement, energy savingscontract (Qualified Energy Conservation Bond)dated 12/14/16, due 12/1/2036 - $3,101,538 - 2,634,950 - 2,634,950 -
Subtotal 3,361,300 3,425,293 (546,500) 6,240,093 382,800 106

CARSON CITY NOTES TO FINANCIAL STATEMENTS
JUNE 30, 2017
59
Changes in long-term liabilities. Long-term liability activity of the primary government for the year ended June 30, 2017, was as follows:
Balance Balance Due WithinJuly 1, 2016 Additions Reductions June 30, 2017 One Year
Deferred amounts:For issuance premiums 3,844,087$ -$ (304,624)$ 3,539,463$ 304,624$
Total Bonds and Notes Payable 86,550,887 9,376,293 (11,093,424) 84,833,756 5,602,024
Incurred but not Reported Claims Liability: 1,748,612 828,535 (974,124) 1,603,023 389,033 Capital Leases: 10,181 84,845 (29,822) 65,204 30,060 Landfill Closure/Post closure costs: 3,631,790 149,413 - 3,781,203 134,228 Compensated Absences Payable: 6,219,332 3,378,426 (4,007,023) 5,590,735 840,296
Governmental Activity Long-Term Liabilities 98,160,802 13,817,512 (16,104,393) 95,873,921 6,995,641
Business Type Activities:Bonds payable: 57,179,902 78,211,548 4,980,928 140,372,378 General obligation revenue bonds: 2,638,875 5,277,736 571,528 8,488,139 3.23% Sewer general obligation revenue bonds, dated1998 State of Nevada revolving loan, due 07/01/18 - $6,096,302 1,078,728 - (421,150) 657,578 434,863
0% Water general obligation revenue bonds series 2009State of Nevada revolving loan, due 07/01/29 - $3,400,000 2,481,081 - (183,784) 2,297,297 183,784
6.662% Water general obligation revenue bondsseries 2010A, due 11/01/39 - $10,100,000 10,100,000 - - 10,100,000 -
2.0 to 4.125% Water refunding general obligationrevenue bonds series 2010B, due 11/01/21 - $7,095,000 4,650,000 - (520,000) 4,130,000 765,000
3.75% Water general obligation revenue bonds series2010E State of Nevada revolving loan due 7/1/2030authorized up to - $21,900,000 19,235,932 - (1,113,405) 18,122,527 1,141,752
2.0-4.5% Sewer refunding general obligation revenuebonds series 2010D, due 11/1/29 - $2,690,000 960,000 - (55,000) 905,000 55,000
3.75% Sewer general obligation revenue bonds series2010F State of Nevada revolving loan due 7/1/2030- $2,748,556 2,301,961 - (134,570) 2,167,391 137,805
4% Water general obligation revenuebonds series 2012, due 11/1/31 - $3.750.000 3,235,000 - (150,000) 3,085,000 155,000
4% Water refunding general obligation revenuebonds series 2012, due 11/1/26 - $11,565,000 9,865,000 - (625,000) 9,240,000 335,000
3.966% Sewer general obligation revenuebonds series 2012, due 11/1/31 - $2,250,000 1,930,000 - (90,000) 1,840,000 90,000
4% Sewer refunding general obligation revenuebonds series 2012, due 11/1/23 - $3,685,000 2,255,000 - (500,000) 1,755,000 220,000
2.79% Sewer general obligation revenue bonds series2014 State of Nevada revolving loan due 1/1/2034- $23,787,662 6,902,907 16,884,755 - 23,787,662 1,110,407
2.79% Water general obligation revenue bonds series2014 State of Nevada revolving loan due 1/1/2034- $6,000,000 5,168,545 - (140,616) 5,027,929 273,618
2.79% Stormwater general obligation revenue bonds series2014 State of Nevada revolving loan due 1/1/2034- $962,338 656,883 305,455 - 962,338 44,922
107

CARSON CITY NOTES TO FINANCIAL STATEMENTS
JUNE 30, 2017
60
Changes in long-term liabilities. Long-term liability activity of the primary government for the year ended June 30, 2017, was as follows:
Balance Balance Due WithinJuly 1, 2016 Additions Reductions June 30, 2017 One Year
General obligation revenue bonds (Continued):2.53% Water refunding general obligation revenuebonds series 2014C, due 6/1/25 - $5,337,000 5,107,000$ -$ (497,000)$ 4,610,000$ 512,000$
2.53% Stormwater refunding general obligation revenuebonds series 2014, due 6/1/25 - $3,466,000 3,404,000 - (342,000) 3,062,000 350,000
2.37% Sewer general obligation revenue bonds series2015 State of Nevada revolving loan due 7/1/2035- $12,000,000 67,018 8,190,690 - 8,257,708 -
2 to 5% Sewer improv. and refunding general obligation revenuerevenue bonds series 2015, due 11/1/34 - $6,245,000 6,000,000 - (210,000) 5,790,000 215,000
Subtotal 85,399,055 25,380,900 (4,982,525) 105,797,430 6,024,151
Notes Payable:1.88% Drainage refunding general obligation (limitedtax) medium-term bond, due 09/01/19 - $713,400 361,900 - (101,000) 260,900 102,600
1.88% Sewer refunding general obligation (limited tax) medium-term bond, due 09/01/19 - $1,436,500 728,900 - (204,000) 524,900 207,400
Subtotal 1,090,800 - (305,000) 785,800 310,000
Deferred amounts:For issuance premiums 1,767,657 - (159,102) 1,608,555 160,558 For issuance discounts (7,927) - 595 (7,332) (594)
Total bonds payable 88,249,585 25,380,900 (5,446,032) 108,184,453 6,494,115
Compensated Absences Payable: 1,047,169 300,624 (561,043) 786,750 107,144
Business-Type Activity Long-Term Liabilities 89,296,754 25,681,524 (6,007,075) 108,971,203 6,601,259
Total debt 187,457,556$ 39,499,036$ (22,111,468)$ 204,845,124$ 13,596,900$
Internal service funds predominately serve the governmental funds. Accordingly, long-term liabilities for them are included as part of the above totalsfor governmental activities. At year-end, $135,544 of internal service funds compensated absences and $1,603,023 of incurred but not reported claimsliability are included in the above amounts.Discretely presented component units
Long-term liability activity for the Airport Authority for the year ended June 30, 2017, was as follows:
Balance Balance Due WithinJuly 1, 2016 Additions Reductions June 30, 2017 One Year
Airport lease agreement 176,453$ -$ (6,240)$ 170,213$ 6,240$ Prepaid lease Agreements 341,860 27,424 (15,967) 353,317 18,387
518,313$ 27,424$ (22,207)$ 523,530$ 24,627$
Long-term liability activity for the Culture and Tourism Authority for the year ended June 30, 2017, was as follows:
Balance Balance Due WithinJuly 1, 2016 Additions Reductions June 30, 2017 One Year
Compensated absences 67,883$ -$ (2,191)$ 65,692$ -$
108

CARSON CITY NOTES TO FINANCIAL STATEMENTS
JUNE 30, 2017
61
Year EndedJune 30 Principal Interest Principal Interest Principal Interest
2018 3,809,999$ 2,190,273$ 1,104,600$ 475,869$ 382,800$ 235,149$ 2019 4,055,000 2,067,498 1,131,600 448,114 447,300 225,981 2020 4,175,000 1,940,874 1,172,600 407,615 463,500 215,652 2021 4,315,000 1,804,323 1,211,100 368,534 481,000 204,957 2022 4,270,000 1,645,099 1,247,600 332,872 497,900 193,863
2023-2027 16,860,001 6,066,659 6,871,700 1,028,691 1,939,138 805,056 2028-2032 12,695,000 3,062,794 2,645,000 104,594 1,309,300 528,478 2033-2037 4,185,000 1,362,787 - - 1,552,100 203,228 2038-2042 3,115,000 759,300 - - - - 2043-2045 2,190,000 133,800 - - - -
Total 59,670,000$ 21,033,404$ 15,384,200$ 3,166,289$ 7,073,038$ 2,612,364$
General ObligationRevenue Bonds
Year EndedJune 30 Principal Interest Principal Interest
2018 6,024,151$ 3,300,879$ 310,000$ 19,595$ 2019 6,363,778 3,166,118 315,800 13,710 2020 6,321,751 2,981,887 160,000 2,555 2021 6,519,658 2,790,742 - - 2022 6,720,842 2,603,139 - -
2023-2027 33,993,075 9,853,060 - - 2028-2032 24,488,364 5,608,404 - - 2033-2037 12,437,261 2,272,295 - - 2038-2042 3,760,000 345,313 - - 2043-2045 - - - -
Total 106,628,879$ 32,921,838$ 785,800$ 35,860$
Notes
Payment requirements for debt service. The annual debt service requirements to maturity for all bonds outstanding of the primary government are as follows:
BUSINESS-TYPE ACTIVITIES
NotesPayable
PayableGeneral Obligation
Revenue Bonds
GOVERNMENTAL ACTIVITIES
RevenueBonds
109

CARSON CITY NOTES TO FINANCIAL STATEMENTS
JUNE 30, 2017
62
E. RESTRICTED ASSETS
The balances of the City's restricted asset accounts in the governmental funds are as follows:
General Commissary Total Funds held in trust $447,234 $ 42,973 $490,207
F. FUND BALANCES/NET POSITION
Government-wide Financial Statements. The government-wide Statement of Net Position utilizes a proprietary presentation.Net position is categorized as net investment in capital assets, restricted and unrestricted.
Restricted resources have externally imposed (statutory, bond covenant, contract or grant) limitations on their use. Restrictedresources are classified either by function, debt service, capital projects, or claims. Resources restricted by function relate to netresources of governmental and enterprise funds whose use is legally limited by outside parties for a specific purpose.Restrictions for debt service represent resources legally restricted by State Statute or bond covenants for future debt servicerequirements of both principal and interest. Amounts restricted for capital projects consist of unspent grants, donations, and debtproceeds with third party restrictions for use on specific projects or programs. Net position restricted for claims represents theamount legally required to be held for payment of future claims in the Workers’ Compensation Fund and Insurance Fund. Thegovernment-wide Statement of Net Position reports $10,081,646 of restricted net resources, all of which is externally imposed.
Unrestricted net position represents available financial resources of the City.
Fund Financial Statements. Governmental fund balances are classified as nonspendable, restricted, committed, assignedand/or unassigned based primarily on the extent to which the City is bound to observe constraints imposed on the use of theresources of the funds.
Other Total General Governmental Governmental
Fund Funds Funds
Fund Balances
Nonspendable: Inventories $ 2,753 $ - $ 2,753 Prepaid items 412,409 39,975 452,384
Total Nonspendable 415,162 39,975 455,137
110

CARSON CITY NOTES TO FINANCIAL STATEMENTS
JUNE 30, 2017
63
Other Total General Governmental Governmental
Fund Funds Funds
Restricted for: Recorder technology $ 38,469 $ - $ 38,469 Court programs and expansion 345,990 89,127 435,117 Health and human services programs 140,746 482,390 623,136 Parks and recreation programs 126,105 - 126,105Sheriff's programs 72,894 115,180 188,074Clerk / Recorder programs 3,178 - 3,178District Attorney programs 74,516 - 74,516Infrastructure projects - 3,491,908 3,491,908Street maintenance - 678,318 678,318 Extraordinary maintenance - 114,595 114,595 Redevelopment - 904,559 904,559 Public transportation services - 345,164 345,164 Roadways - 1,029,025 1,029,025 Parks and open space - 2,424,563 2,424,563 Fire programs - 642 642 Juvenile programs - 58 58 Senior Center - 73,272 73,272 Cooperative extension - 241,725 241,725 Indigent programs - 21,536 21,536 Library - 34,621 34,621 Emergency communications - 186,564 186,564
Total Restricted 801,898 10,233,247 11,035,145
Committed to: Traffic control - 10,044 10,044
Assigned to: Assessor technology 153,333 - 153,333Fire programs 8,275 - 8,275Sheriff's programs 76,366 27,869 104,235Juvenile programs 4,635 - 4,635Other programs 7,252 - 7,252Health and human services programs 97,505 148,792 246,297Parks and recreation programs 29,834 - 29,834Grant programs - 422,657 422,657Subsequent year's budget deficit 1,355,278 - 1,355,278Capital improvement projects - 1,920,305 1,920,305Debt service - 66,970 66,970
Total Assigned 1,732,478 2,586,593 4,319,071
Unassigned 6,447,478 - 6,447,478
$ 9,397,016 $ 12,869,859 $ 22,266,875
111

CARSON CITY NOTES TO FINANCIAL STATEMENTS
JUNE 30, 2017
64
NOTE 4 - OTHER INFORMATION A. RISK MANAGEMENT The City is exposed to various risks of loss related to torts; theft of, damage to, and destruction of assets; errors and omissions;
and natural disasters. General liability insurance has a $1,000,000 maximum coverage per occurrence, $1,000,000 personal injury, and a $2,000,000 general aggregate maximum benefit, with a self-insured retention of $100,000 per occurrence. For property insurance, the policy limit is $210,000,000 with a deductible of $25,000 per occurrence. The earth movement policy limit is $50,000,000 with a deductible of 2% per unit of insurance or $100,000 minimum per location. The flood property policy limit is $50,000,000 with a deductible of $100,000 per location. The flood property – high hazard zone policy limit is $5,000,000 with a $250,000 per occurrence deductible. Other coverage currently held by the City, including airport liability, auto physical damage, boiler and machinery and bonds on public officials, are insured with deductibles varying from $10,000 to $25,000. As of July 1, 2010, the City formed its own self-insured workers compensation program. This program exposes the City to various risks of loss related to large claims based on the health of their work force; therefore, an excess loss policy provides coverage. Statutory limits for worker’s compensation coverage are $1,000,000 for employer’s liability limits with self-insured retentions of $2,000,000 for police and fire employees and $750,000 for all other employees, per accident. The City’s total net position of the Worker’s Compensation Fund was $1,157,011 at June 30, 2017.
Liabilities are reported when it is probable that a loss has occurred and the amount of loss can be reasonably estimated. Liabilities include an amount for claims that have been incurred but not reported (IBNRs). Claims liabilities are calculated considering the effects of inflation, recent claim settlement trends, including frequency and amount of payouts, and other economic and social factors. The liabilities for claims and judgments are reported in the Workers’ Compensation and Insurance Funds. Changes in the balances of claims liabilities during the past two years are as follows:
Current Long-Term Totals Portion Portion 2017 2016
Unpaid claims, beginning of fiscal year $ 725,879 $ 1,022,733 $1,748,612 $ 850,258 Claims and changes in estimates 637,278 191,257 828,535 2,587,930 Claim payments (974,124) - (974,124) (1,689,576) Unpaid claims, end of fiscal year $ 389,033 $1,213,990 $ 1,603,023 $ 1,748,612
Settlements have not exceeded coverages in any of the past three fiscal years.
B. LANDFILL CLOSURE AND POSTCLOSURE COSTS The City operates a Municipal Solid Waste Landfill. The operation of this landfill is regulated by both federal and state
governments under Subtitle D (40 CFR Part 258) and NRS 444.556. Recognition of liability for closure and post closure care costs is based on landfill capacity used to date. This liability at June 30, 2017, $3,781,203 is reported in governmental activities. It is estimated that the landfill will be used for an additional fifty years and that at June 30, 2017, approximately 41.19% of its capacity had been utilized. The City passes the EPA "financial assurance test" for local governments, and will self-assure payment for its obligations for closure, post closure, and corrective care costs. The estimated total current cost of closure and post closure care, $9,179,906 has been calculated in 2017 dollars in accordance with current federal and state regulations and will be adjusted each year for changes resulting from inflation, deflation or technology.
C. CONTINGENT LIABILITIES The City is a defendant in various lawsuits. Although the outcome of these lawsuits is not determinable, it is the opinion of the
District Attorney, the City's counsel, that resolution of these matters will not have a material adverse effect on the financial condition of the City.
112

CARSON CITY NOTES TO FINANCIAL STATEMENTS
JUNE 30, 2017
65
D. OTHER POSTEMPLOYMENT BENEFITS (OPEB)
From an accrual accounting perspective, the cost of postemployment healthcare and life insurance benefits, like the cost of pension benefits, generally should be associated with the periods in which the cost occurs, rather than in the future when it will be paid. The City recognizes the cost of postemployment healthcare and life insurance in the year when the employee services are received, reports the accumulated liability from prior years, and provides information useful in assessing potential demands on the City’s future cash flows.
Plan Descriptions. The City contributes to a single-employer defined benefit healthcare and life insurance plan, the City’s Retiree Subsidy Plan (City’s Plan), and an agent multiple-employer defined healthcare plan, State of Nevada Public Employees’ Benefits Program (PEBP). Both plans provide medical, dental, vision, accidental death and dismemberment, and life insurance benefits to eligible retired City employees and beneficiaries.
Benefit provisions for the City’s Plan are established pursuant to NRS 287.023 and amended through Board resolution and contracts between the City and the various bargaining units. The City explicitly subsidizes the healthcare premiums pursuant to the City’s Plan and contracts negotiated with various bargaining units. The City currently contributes toward the cost of coverage as follows:
• Firefighters who retire under Nevada PERS after July 1, 2002, sheriff’s department employees who retire underNevada PERS after June 30, 2010, and Carson City Employee Association (CCEA – Classified Employees) who retireunder Nevada PERS after July 1, 2013, at age 47 or older and with 20 or more years of service receive a percentage ofthe medical, dental, vision and life insurance premiums for themselves and their dependents. The City pays 90% of theretiree group health premium until age 65, then 50% of the retiree's Medicare supplement medical premium. The Citypays 50% of dependent coverage until age 65, then 25% of the dependent's Medicare supplement medical premium.
• Unclassified Employees who retire under Nevada PERS after July 1, 2013, at age 47 or older and with 15 or more yearsof service receive a percentage of their medical, dental, vision and life insurance premiums for themselves and theirdependents. If an employee has more than 15 years of service, the City pays 75% of the retiree group health premiumsand 25% of their dependent’s premium. Employees with over 20 years of service the City pays 90% of the retiree grouphealth premiums and 50% of their dependent’s premium. Once the retiree reaches age 65, the City pays 50% of theretiree’s and 25% of their dependent’s supplement medical premium.
• Employees that retired from the City prior to the above contract changes who had at least 10 years of service (includingfirefighters and sheriff’s department retirees not yet eligible or not qualifying for the benefits above) received a subsidyof $6 per month for each year of service toward the cost of their coverage. Retirees were allowed to elect to continuecoverage for their spouse and other eligible dependents, however, had to do so entirely at their expense.
Under state law, retiree loss experience is pooled with active loss experience for the purposes of setting rates in the City’s Plan. The difference between the true claims cost and the blended premium is an implicit rate subsidy that creates an OPEB obligation for the City.
The City serves as a secondary carrier for retirees eligible for Medicare. Expenditures for post-employment healthcare and life insurance are recognized each month when premiums are paid. A summary of the premium rates for the City’s Plan, as of July 1, 2016, are shown below:
113

CARSON CITY NOTES TO FINANCIAL STATEMENTS
JUNE 30, 2017
66
Retirees Without Medicare HMO POS (In Area) PPO (Out of Area)
Retiree $ 568.93 $ 629.62 $ 867.26 Retiree & spouse/both without Medicare 1,123.69 1,248.11 1,735.35 Retiree & spouse 1 without Medicare 1,019.68 1,128.53 1,560.77 Retiree & children without Medicare 1,078.17 1,194.60 1,650.56 Retiree & family/both without Medicare 1,719.82 1,909.99 2,654.65 Retiree & family/1 without Medicare 1,256.54 1,377.30 1,877.00
Retirees With Medicare HMO POS (In Area) PPO (Out of Area) Retiree $ 435.95 $ 476.72 $ 644.04 Retiree & spouse/both with Medicare 877.60 965.16 1,322.29 Retiree & spouse 1 with Medicare 1,019.68 1,128.53 1,560.77 Retiree & children with Medicare 1,069.84 1,185.03 1,636.58 Retiree & family/both with Medicare 1,101.77 1,199.36 1,617.20 Retiree & family/1 with Medicare 1,256.54 1,377.30 1,877.00
The NPEBP Master Plan Document can be obtained by writing to the Nevada Public Employees’ Medical Program, 901 South Stewart Street, Suite 1001, Carson City, NV 89701.
Benefit provisions for PEBP are established pursuant to NRS 287.023 and are subject to amendment by the State of Nevada each biennium. Pursuant to NRS 287.023 (as amended during the 2007 session of the Nevada Legislature), through November 29, 2008, retirees had the option to participate in the City’s Plan for post-employment healthcare and life insurance benefits or to join PEBP offered by the State of Nevada. However, subsequent to November 29, 2008, retirees no longer have the option of joining PEBP, yet still retain the option to participate in the City’s Plan. Local governments are required to pay the same portion of cost of coverage for those persons joining PEBP that the State of Nevada pays for those persons retired from state service who have continued to participate in the plan.
The City is required to provide a subsidy for their retirees that have elected to join PEBP. The subsidy is paid on the pay-as-you-go basis. Contribution requirements for plan members and the participating employers are assessed by the PEBP Board annually. The contributions required for PEBP subsidies depend on the date of retirement of prior years of PERS service for employees earned while working for the City. These subsidies are then allocated and billed to all applicable former employers of the retiree. The City’s portion of the monthly subsidies ranged from $0.73 to $773.87 during the 2017 fiscal year.
Funding Policy and Annual OPEB Cost. The City funded the annual OPEB cost on a pay as you go basis for both plans; however as of July 1, 2015 the Board of Supervisors established the Carson City Other Post-Employment Benefits Trust Fund. The City intends to fund the Trust annually at a rate of approximately 1% of covered payroll, over normal costs. The net OPEB obligation attributable to governmental activities is liquidated primarily by the General Fund.
The City’s actuarial valuation for the plans was prepared from employee and retiree data as of June 30, 2017. The City engaged the original actuary to incorporate the July 1, 2016 benefit changes into the fiscal year ended June 30, 2017 OPEB estimate. The number of participants as of June 30, 2017, the effective date of the OPEB valuation, is as follows:
City Plan PEBP Plan
Active employees 576 -
Retirees enrolled in City Plan 151 -
Retirees enrolled in PEBP - 196
114

CARSON CITY NOTES TO FINANCIAL STATEMENTS
JUNE 30, 2017
67
The City’s annual OPEB cost, the percentage of annual OPEB cost contributed to the plans, and the net OPEB obligations (assets), by plan, for fiscal year 2016-2017 and the two preceding years were as follows:
Fiscal Year Ended
Annual OPEB Cost
Employer Contributions
Percentage of Annual OPEB
Cost Contributed
Net OPEB Obligation
(Asset) City Plan 6/30/15 $ 4,436,073 $ 749,055 16.89% $19,094,558 City Plan 6/30/16 $ 4,797,397 $ 1,641,533 34.22% $22,250,422 City Plan 6/30/17 $ 4,964,076 $ 1,276,308 25.71% $25,938,190
PEBP 6/30/15 $ 449,893 $ 425,328 94.54% $ (41,946) PEBP 6/30/16 $ 451,976 $ 411,420 91.03% $ (1,390) PEBP 6/30/17 $ 485,997 $ 417,968 86.00% $ 66,639
Totals 6/30/15 $ 4,885,966 $ 1,174,383 24.04% $19,052,612 Totals 6/30/16 $ 5,249,373 $ 2,052,953 39.11% $22,249,032 Totals 6/30/17 $ 5,450,073 $ 1,694,276 31.09% $26,004,829
The net OPEB obligation (asset) as of June 30, 2017, was calculated as follows:
City Plan PEBP Plan Totals Normal Cost (Current Service Cost) $ 2,705,495 $ - $ 2,705,495 Amortization of unfunded actuarial accrued liability 2,208,066 485,957 2,694,023 Total Annual Required Contribution (ARC or Annual OPEB cost) $ 4,913,561 485,957 5,399,518 Interest on the beginning net OPEB obligation (asset) 995,522 (56) 995,466 ARC adjustment (945,007) 96 (944,911) Annual OPEB cost 4,964,076 485,997 5,450,073 Contributions made (1,276,308) (417,968) (1,694,276) Increase (decrease) in net OPEB obligation (asset) 3,687,768 68,029 3,755,797 Net OPEB obligation (asset), beginning of year 22,250,422 (1,390) 22,249,032
Net OPEB obligation (asset), end of year $ 25,938,190 $ 66,639 $ 26,004,829
Funded Status and Funding Progress. The funded status of the plans as of the latest actuarial valuation date of June 30, 2017, was as follows:
City Plan PEBP Plan Totals Accrued actuarial liability (a) $ 56,695,207 $ 6,885,558 $ 63,580,765 Actuarial value of plan assets (b) 750,518 - 750,518 Unfunded actuarial accrued Liability (a) - (b) $ 55,944,689 $ 6,885,558 $ 62,830,247 Funded ratio (b) / (a) 1.32% 0% 1.18% Covered payroll (c) $ 36,664,557 N/A N/A Unfunded actuarial accrued liability as a percentage of covered payroll ([(a) – (b)] / (c)) 152.59% N/A N/A
115

CARSON CITY NOTES TO FINANCIAL STATEMENTS
JUNE 30, 2017
68
Actuarial valuations involve estimates of the value of reported amounts and assumptions about the probability of the events in the future. Amounts determined regarding the funded status of the plan and the annual required contributions of the employer are subject to continual revision as actual results are compared to past expectations and new estimates are made about the future. The required schedule of funding progress presented as required supplementary information provides multiyear trend information that shows whether the actuarial value of plan assets is increasing or decreasing over time relative to the actuarial accrued liability for benefits. Actuarial Methods and Assumptions. Projections of benefits are based on the substantive plan (the plan as understood by the employer and plan members) and include the types of benefits in force at the valuation date and the pattern of sharing benefits between the City and the plan members at that point. Actuarial calculations reflect long-term perspective and employ methods and assumptions that are designed to reduce short-term volatility in actuarial accrued liabilities and the actuarial value of assets. Significant methods and assumptions were as follows:
City Plan PEBP Plan Actuarial valuation date 6/30/17 6/30/17 Actuarial cost method Entry age normal cost Entry age normal cost Amortization method Level percentage of pay Level dollar Remaining amortization period 30 years, open 22 years, closed Asset valuation method N / A N / A Actuarial assumptions: Investment rate of return Inflation rate Projected salary increases Healthcare inflation rate * Medical – decreasing 0.5% each year until ultimate trend rate of 5% is reached.
4.47% 2.75% 4.0% Medical – 7.0% *
4.0% 2.75% 4.0% Medical – 7.0% *
Carson City OPEB Trust Fund. Complete financial statements for the trust may be obtained at City of Carson City, Finance Department, 201 North Carson Street, Suite #3, Carson City, NV 89701.
E. DEFINED BENEFIT PENSION PLAN
Plan Description. Carson City contributes to the Public Employees’ Retirement System of the State of Nevada (PERS) and Judicial Retirement System of the State of Nevada (JRS). PERS and JRS administer cost-sharing, multiple-employer, defined benefit public employees’ retirement systems, PERS includes both Regular and Police/Fire members, and JRS includes only Justices of the peace and municipal judges. PERS was established by the Nevada Legislature in 1947, effective July 1, 1948. PERS is administered to provide a reasonable base income to qualified employees who have been employed by a public employer and whose earnings capacities have been removed or substantially impaired by age or disability. JRS was established in 2001 by the Nevada Legislature (NRS 1A.160) and is governed by the Public Employees’ Retirement Board. Benefits Provided. Benefits, as required by the Nevada Revised Statutes (NRS or statute), are determined by the number of years of accredited service at time of retirement and the member’s highest average compensation in any 36 consecutive months with special provisions for members entering PERS on or after January 1, 2010 and July 1, 2015. Benefit payments to which participants or their beneficiaries may be entitled under the plan include pension benefits, disability benefits, and survivor benefits. Monthly benefit allowances for members are computed as 2.5% of average compensation for each accredited year of service prior to July 1, 2001. For service earned on and after July 1, 2001, this multiplier is 2.67% of average compensation. For members entering PERS and JRS on or after January 1, 2010, there is a 2.5% multiplier, and for members entering on or after July 1, 2015, there is a 2.25% factor. PERS offers several alternatives to the unmodified service retirement allowance which, in general, allow the retired employee to accept a reduced service retirement allowance payable monthly during his or her lifetime and various optional monthly payments to a named beneficiary after his or her death. Post-retirement increases are provided by authority of NRS 286.575 - .579.
116

CARSON CITY NOTES TO FINANCIAL STATEMENTS
JUNE 30, 2017
69
Vesting. Regular members are eligible for retirement at age 65 with five years of service, at age 60 with 10 years of service, or at any age with thirty years of service. Regular members entering PERS on or after January 1, 2010, are eligible for retirement at age 65 with five years of service, at age 62 with 10 years of service, or any age with thirty years of service. Regular members entering PERS on or after July 1, 2015, are eligible for retirement at age 65 with five years of service, or age 62 with ten years of service, at age 55 with thirty years of service, or at any age with thirty-three and a third years of service. Police/Fire members are eligible for retirement at age 65 with five years of service, at age 55 with ten years of service, at age 50 with twenty years of service, or at any age with twenty-five years of service. Police/Fire members entering PERS on or after January 1, 2010, are eligible for retirement at 65 with five years of service, at age 60 with ten years of service, at age 50 with twenty years of service, or at any age with thirty years of service. Only service performed in a position as a police officer or firefighter may be counted towards eligibility for retirement as Police/Fire accredited service.
The normal ceiling limitation on monthly benefits allowances is 75% of average compensation for PERS and JRS. However, a PERS member who has an effective date of membership before July 1, 1985, is entitled to a benefit of up to 90% of average compensation. Both Regular and Police/Fire members become fully vested as to benefits upon completion of five years of service.
Contributions. The authority for establishing and amending the obligation to make contributions and member contribution rates, is set by statute. New hires, in agencies which did not elect the Employer-Pay Contribution (EPC) plan prior to July 1, 1983, have the option of selecting one of two contribution plans. Contributions are shared equally by employer and employee. Employees can take a reduced salary and have contributions made by the employer (EPC) or can make contributions by a payroll deduction matched by the employer.
PERS’ and JRS’ basic funding policies provide for periodic contributions at a level pattern of cost as a percentage of salary throughout an employee’s working lifetime in order to accumulate sufficient assets to pay benefits when due.
PERS and JRS receives an actuarial valuation on an annual basis indicating the contribution rates required to fund PERS and JRS on an actuarial reserve basis. Contributions actually made are in accordance with the required rates established by the Nevada Legislature. These statutory rates are increased/decreased pursuant to NRS 286.421, NRS 286.450 and NRS 1A.180(1).
The actuary funding method used is the Entry Age Normal Cost Method. It is intended to meet the funding objective and result in a relatively level long-term contribution requirement as a percentage of salary.
For the fiscal year ended June 30, 2016 and June 30, 2017 the Statutory Employer/employee matching rate was 14.50% for Regular and 20.75% for Police/Fire. The Employer-pay contributions (EPC) rate was 28% for Regular and 40.5% for Police/Fire. For the fiscal years ended June 30, 2016 and June 30, 2017 the Statutory Employer-pay contributions (EPC) rate was 15.25% for justices of the peace and other municipal judges.
The City’s contributions were $11,281,288 and $11,099,260 for the years ended June 30, 2017 and 2016, respectively.
PERS Investment Policy. PERS’ policies which determine the investment portfolio target asset allocation are established by the PERS Board. The asset allocation is reviewed annually and is designed to meet the future risk and return needs of the System.
The following was the PERS Board adopted policy target asset allocation as of June 30, 2016:
Asset Class
PERS Target
Allocation
PERS Long-Term Geometric
Expected Real Rate of Return
JRS Target Allocation
JRS Long-Term Geometric
Expected Real Rate of Return
Domestic Equity 42% 5.50% 49% 5.50% International Equity 18% 5.75% 21% 5.75% Domestic Fixed Income 30% 0.25% 30% 0.25% Private Markets 10% 6.80% 0% 0.00%
As of June 30, 2016, PERS’ and JRS’ long-term inflation assumption was 3.5%. 117

CARSON CITY NOTES TO FINANCIAL STATEMENTS
JUNE 30, 2017
70
Net Pension Liability. At June 30, 2017, the City reported a liability for its proportionate share of the net pension liability. The net pension liability was measured as of June 30, 2016, and the total pension liability used to calculate the net pension liability was determined by an actuarial valuation as of that date. The City’s allocation percentage of the net pension liability was based on the City’s total contributions due on wages paid during the measurement period. The City’s proportion of the net pension liability is based on its combined employer and member contributions relative to the total combined employer and member contributions for all employers participating in PERS and JRS for the period ended June 30, 2016. At June 30, 2016, the City’s proportion of PERS was 0.71147%, including Carson City Culture and Tourism Authority (A Component Unit of Carson City) and the Carson City Water Sub-Conservancy District (An Agency Fund of Carson City). Once these external entities were removed, Carson City’s proportion is 0.70192%, which is a decrease of .01566 from its proportion measured as of June 30, 2015. At June 30, 2016, the City’s proportion of JRS was .35864%, which was an increase of 0.07483 from its proportion measured as of June 30, 2015. Pension Liability Discount Rate Sensitivity. The following presents the net pension liability of the City as of June 30, 2016, calculated using the discount rate of 8.00%, as well as what the City’s net pension liability would be if it were calculated using a discount rate that is 1-percentage-point lower (7.00%) or 1-percentage-point higher (9.00%) than the current discount rate:
1% Decrease in Discount Rate
(7.00%) Discount Rate
(8.00%)
1% Increase in Discount Rate
(9.00%) PERS Net Pension Liability $138,466,285 $94,464,352 $57,855,285 JRS Net Pension Liability 132,090 81,235 38,254
Pension Plan Fiduciary Net Position. Detailed information about the pension plan’s fiduciary net position is available in the PERS and JRS Comprehensive Annual Financial Report, available on the PERS website, www.nvperson.org, or may be obtained from the Public Employees’ Retirement System, 693 West Nye Lane, Carson City, Nevada 89703. Actuarial Assumptions. The City’s net pension liability was measured as of June 30, 2016, and the total pension liability used to calculate the net pension liability was determined by an actuarial valuation as of that date. The total pension liability was determined using the following actuarial assumptions, applied to all periods included in the measurement:
Inflation Rate 3.50% Payroll Growth 5.00% including inflation Investment Rate of Return 8.00% Productivity Pay Increase 0.75% Projected Salary Increases Regular: 4.60% to 9.75%, depending on service Police/Fire: 5.25% to 14.5%, depending on service Justices: 3.0% to 8.0% depending on service Rates include inflation and productivity increases Consumer Price Index 3.50% Other Assumptions Same as those used in the June 30, 2016 funding
actuarial valuation
Mortality rates for non-disabled male regular members were based on the RP-2000 Combined Healthy Mortality Table projected to 2013 with Scale AA. Mortality rates for non-disabled female regular members were based on the RP-2000 Combined Healthy Mortality Table, projected to 2013 with Scale AA, set back one year. Mortality rates for all non-disabled police/fire members were based on the RP-2000 Combined Healthy Mortality Table projected to 2013 with Scale AA, set forward one year. The mortality table used in the actuarial valuation to project mortality rates for all disabled regular members and all disabled police/fire members is the RP-2000 Disabled Retiree Mortality Table projected to 2013 with Scale AA, set forward three years. Actuarial assumptions used in the June 30, 2016 valuation were based on the results of the experience review completed in 2013.
The discount rate used to measure the total pension liability was 8.00% as of June 30, 2016. The projection of cash flows used to determine the discount rate assumed that employee and employer contributions will be made at the rate specified in statute. Based on that assumption, the pension plan’s fiduciary net position at June 30, 2016, was projected to be available to
118

CARSON CITY NOTES TO FINANCIAL STATEMENTS
JUNE 30, 2017
71
make all projected future benefit payments of current active and inactive employees. Therefore, the long-term expected rate of return on pension plan investments was applied to all periods of projected benefit payments to determine the total pension liability as of June 30, 2016.
Pension Expense, Deferred Outflows of Resources and Deferred Inflows of Resources Related to Pensions. For the year ended June 30, 2017, the City recognized pension expense of $11,989,937 for PERS and $20,721 for JRS. At June 30, 2017, the City reported deferred outflows of resources and deferred inflows of resources related to pensions from the following sources:
PERS JRS
Deferred Outflows
of Resources
Deferred Inflows
of Resources
Deferred Outflows
of Resources
Deferred Inflows
of Resources
Differences between expected and actual experience $ - $ 6,325,157 $ - $ 16,023
Changes in assumptions or other inputs - 1,747,467 2,657 - Net difference between projected and actual earnings on pension plan investments 8,781,055 - 16,040 -
Changes in the employer’s proportion and differences between the employer’s contributions and the employer’s proportionate contributions 598,059 - 13,562 -
City contributions subsequent to the measurement date 11,281,288 - 21,834 -
Total $ 20,660,402 $ 8,072,624 $ 54,093 $ 16,023
$11,303,122 was reported as deferred outflows of resources related to pensions resulting from Employer contributions subsequent to the measurement date and will be recognized as a reduction of the net pension liability in the year ending June 30, 2018.
The average of the expected remaining service lives of all employees that are provided with pensions through PERS (active and inactive employees) determined at July 1, 2015 (the beginning of the measurement period ended June 30, 2016) is 6.48 years and JRS is 4.8 years.
Other estimated amounts reported as deferred outflows of resources and deferred inflows of resources related to pensions will be recognized in pension expense as follows:
Year ended June 30: PERS JRS 2018 ($ 919,304) $ 3,644 2019 (919,304) 3,644 2020 2,922,019 3,644 2021 1,312,206 5,304 2022 (820,905) - Thereafter (268,222) -
Additional Information. Additional information is available on the PERS website at www.nvpers.org under Quick Links – Publications.
119

CARSON CITY NOTES TO FINANCIAL STATEMENTS
JUNE 30, 2017
72
F. TAX ABATEMENTS
Implementation of GASB Statement No. 77: As of July 1, 2016 the City adopted GASB Statement No. 77, Tax Abatement Disclosures. The implementation of this standard requires governments to disclose certain arrangements related to the reduction in taxes that results from an agreement between one or more governmental entities and an individual or entity. The City has entered into agreements in accordance with the provisions of the Nevada Revised Statutes (NRS) Chapter 279, the Redevelopment of Communities, in order to stimulate economic growth. The City currently has four agreements in place. Abatements are calculated on the Basic City-County Relief Tax and the Supplemental City-County Relief Tax (“sales taxes”) collected in Carson City for each business. The Southgate Big 5 agreement is for the expansion of an existing business, which provides that the business will not receive abatements on a certain base amount of sales tax, but the City will reimburse 50% of sales taxes paid as abatements, for a 15 year period, on any sales taxes paid beyond that base amount. The remaining agreements are for new businesses moving into Carson City, for which the City agreed to reimburse 50% of sales taxes paid as abatements on all sales for a 15 year period.
Percentage Calendar 2016 Expiration Name Base Amount of Abatement Abatement Paid Date Southgate – Big 5 $ 20,831 50% $ 4,193 10/21/2025 Southgate – Big Lots - 50% 31,049 10/21/2025 Beall’s - 50% 16,321 12/31/2029 Sportsman’s Warehouse - 50% 97,696 12/31/2029
$ 149,259
Beginning in Fiscal Year 2014 GMRI Olive Garden was granted a partial property tax abatement based on the provisions of NAC 701A.280, for a duration of 6 years and in an annual amount that equals 25% of the portion of the taxes imposed pursuant to NRS Chapter 361. This is a State of Nevada Energy Related Tax Incentive to encourage businesses to construct energy efficient buildings. Total Property taxes abated for fiscal year ended June 30, 2017 totaled $2,113.
G. SUBSEQUENT EVENTS
On July 6, 2017, Carson City issued $3,840,000 of General Obligation (Limited Tax) Medium Term Bond, Series 2017. The bonds are secured by the full faith and credit of the City, subject to Nevada Constitutional and statutory limitations on the aggregate amount of property taxes that may be levied by and within the City. The proceeds will be used for various capital projects and equipment needs of the City.
On November 7th, Carson City issued $6,000,000 of General Obligation (Limited Tax) Sewer Bonds (Additionally Secured by Pledged Revenues), Series 2017B, through the State of Nevada Municipal Bond Bank. The bonds are secured by the full faith and credit of the City, subject to Nevada Constitutional and statutory limitations on the aggregate amount of property taxes that may be levied by and within the City, and are additionally secured by pledged sewer system revenues. The proceeds will be used in the rehabilitation of the Wastewater Reclamation Facility as well as various improvements to the wastewater system.
120

See accompanying notes. 73
CARSON CITY, NEVADAREQUIRED SUPPLEMENTARY INFORMATION
FOR THE YEAR ENDED JUNE 30, 2017
Schedule of Funding Progress - Other Post Employment Benefits
Actuarial UAAL as a Accrued Percentage
Actuarial Actuarial Liability (AAL) - Unfunded AAL Funded of Covered Valuation Value of Entry Age (UAAL) Ratio Covered Payroll
Date Assets (a) Normal Cost (b) (b - a) (a / b) Payroll (c) ([b - a] / c)
City Plan 6/30/17 750,518$ 56,695,207$ 55,944,689$ 1.3% 36,664,557$ 152.59%
PEBP 6/30/17 - 6,885,558 6,885,558 - N/A N/A
Total 6/30/17 750,518$ 63,580,765$ 62,830,247$ 1.3%
City Plan 6/30/15 -$ 50,747,594$ 50,747,594$ 0% 32,085,798$ 158.16%
PEBP 6/30/15 - 6,681,568 6,681,568 - N/A N/A
Total 6/30/15 -$ 57,429,162$ 57,429,162$ 0%
City Plan 6/30/13 -$ 32,624,566$ 32,624,566$ 0% 32,019,089$ 101.89%
PEBP 6/30/13 - 9,312,605 9,312,605 - N/A N/A
Total 6/30/13 -$ 41,937,171$ 41,937,171$ 0%
Trend AnalysisThe principal changes from the June 30, 2013 valuation to the June 30, 2017 valuation are:
(1) Improvements in the mortality table resulting in longer life expectancies for City Retirees and PEBP retirees (increase);(2) updates of employees and premium data (increase);(3) an extension of paid dental, vision, and life insurance benefits for Sheriff's department retirees (increase);
(6) Carson City Employees Association negotiated a percentage of premium paid for the retirees subsidy in liue of raisesduring FY14, instead of the prior subsidy, which was $6 per year of service. (Increase)
(7) Legislative change to PEBP's now provide for different levels of Agency subsidy based on the level and type of coverage,which lead to higher subsidies paid by the City in future years. (Increase)
(8) recognition of the projected excise tax for high cost coverage. (Increase)
(4) a small increase in the assumed percentage of employees and their dependents who will elect coverage in retirement;(5) an update to the trend assumptions for future increases in medical premiums (Increase).
121

See accompanying notes. 74
CARSON CITY, NEVADAREQUIRED SUPPLEMENTARY INFORMATION
FOR THE YEAR ENDED JUNE 30, 2017
Schedule of the City's Proportionate Share of the Net Pension LiabilityLast Ten Fiscal Years*
Public Employees Retirement System of Nevada2016 2015 2014
City's proportion of the net pension liability 0.70192% 0.71758% 0.71205%City's proportionate share of the net pension liability 94,464,352$ 82,230,821$ 74,209,811$ Covered Payroll 37,585,137$ 36,559,436$ 35,233,657$ City's proportionate share of the net pension liability as a
percentage of it's covered payroll 251.33% 224.92% 210.62%Plan fiduciary net position as a percentage of the total
pension liability 72.20% 75.10% 76.30%
Judicial Retirement System of Nevada
City's proportion of the net pension liability 0.35864% 0.28381% 0.28061%City's proportionate share of the net pension liability 81,235$ 59,219$ 46,348$ Covered Payroll 136,630$ 114,925$ 105,258$ City's proportionate share of the net pension liability as a
percentage of it's covered payroll 59.46% 51.53% 44.03%Plan fiduciary net position as a percentage of the total
pension liability 81.70% 82.60% 84.80%
* GASB Statement No. 68 requires ten years of information to be presented in this table. However, untilten years of data is available, the City will present information only for those years for whichinformation is available.
122

See accompanying notes. 75
CARSON CITY, NEVADAREQUIRED SUPPLEMENTARY INFORMATION
FOR THE YEAR ENDED JUNE 30, 2017
Schedule of the City's ContributionsLast Ten Fiscal Years*
Public Employees Retirement System of Nevada2017 2016 2015
Statutorily required contributions 11,281,288$ 11,099,260$ 10,302,384$ Contributions in relation to the statutorily required contributio 11,281,288 11,099,260 10,302,384Contribution (deficiency) excess - - - Covered Payroll 40,080,581 37,585,137 36,559,436Contributions as a percentage of covered payroll 28.15% 29.53% 28.18%
Judicial Retirement System of Nevada
Statutorily required contributions 21,834$ 20,704$ 17,469$ Contributions in relation to the statutorily required contributio 21,834 20,704 17,469Contribution (deficiency) excess - - - Covered Payroll 143,174 136,630 114,925Contributions as a percentage of covered payroll 15.25% 15.15% 15.20%
* GASB Statement No. 68 requires ten years of information to be presented in this table. However, until tenyears of data is available, the City will present information only for those years for which information isavailable.
123

This page intentionally left blank.
124
GENERAL FUND
The General Fund is used to account for resources traditionally associated with government, which are not required legally or by sound financial management to be accounted for in another fund.
125

See accompanying notes. 76
SCHEDULE OF REVENUES, EXPENDITURES,AND CHANGES IN FUND BALANCES - BUDGET AND ACTUAL
(WITH COMPARATIVE ACTUAL AMOUNTS FOR THE YEAR ENDED JUNE 30, 2016)(PAGE 1 OF 12)
FINALBUDGET ACTUAL VARIANCE 2016
Revenues:Taxes:
Ad valorem 22,582,474$ 22,608,987$ 26,513$ 22,314,986$
Licenses and permits:Business licenses and permits:
Business licenses 683,400 796,531 113,131 672,989 Liquor licenses 155,000 159,285 4,285 168,175 City / county gaming licenses 611,050 623,380 12,330 632,068 Right-of-way toll 241,680 262,375 20,695 234,241
Franchise fees:Gas 1,258,763 1,117,342 (141,421) 1,230,906 Electric 2,363,400 1,981,989 (381,411) 2,177,457 Telephone 716,797 622,253 (94,544) 696,128 Sanitation 458,540 489,464 30,924 465,283 Cable television 436,187 497,481 61,294 440,161
6,924,817 6,550,100 (374,717) 6,717,408
Nonbusiness licenses andpermits:
Marriage licenses 12,000 12,201 201 12,138 Mobile home permits 50 18 (32) 55
12,050 12,219 169 12,193 Total Licenses and
Permits 6,936,867 6,562,319 (374,548) 6,729,601
Intergovernmental revenues:Federal grants:
HIV/AIDS Surveillance - - - 3,400
- - - 3,400Federal payments in lieu
of taxes 119,000 109,045 (9,955) 116,489
State shared revenues:Consolidated tax revenues 26,144,276 27,426,295 1,282,019 24,846,886 State gaming licenses 145,000 137,003 (7,997) 138,096 Candidate filing fee - - - 1,050Court administrative assessments 152,460 140,835 (11,625) 131,543
26,441,736 27,704,133 1,262,397 25,117,575
CARSON CITY, NEVADAGENERAL FUND
FOR THE YEAR ENDED JUNE 30, 2017
126

See accompanying notes. 77
SCHEDULE OF REVENUES, EXPENDITURES,AND CHANGES IN FUND BALANCES - BUDGET AND ACTUAL
FOR THE YEAR ENDED JUNE 30, 2017(WITH COMPARATIVE ACTUAL AMOUNTS FOR THE YEAR ENDED JUNE 30, 2016)
(PAGE 2 OF 12)
FINALBUDGET ACTUAL VARIANCE 2016
Other local government grants:Interlocal cooperative
agreements 850,752$ 410,912$ (439,840)$ 216,228$
Other local government sharedrevenues:
Miscellaneous othergovernments 64,698 62,102 (2,596) 62,942
Total IntergovernmentalRevenues 27,476,186 28,286,192 810,006 25,516,634
Charges for services:General government:
Treasurer fees 20,000 17,475 (2,525) 18,430 Clerk fees 138,000 154,907 16,907 136,213 Recorder fees 208,610 234,960 26,350 215,857 Technology fees 30,000 29,877 (123) 28,698Assessor commissions 208,000 211,320 3,320 219,866 Building and zoning fees 110,000 155,028 45,028 132,813 Public administrator fees 110,000 122,525 12,525 113,006 Administration fees 4,154,417 4,202,504 48,087 4,358,516 Miscellaneous 8,200 11,227 3,027 9,043
4,987,227 5,139,823 152,596 5,232,442
Judicial:Drug Court 12,000 9,655 (2,345) 10,660 Court facilities 90,000 87,507 (2,493) 83,579 Justice civil fees 556,000 568,217 12,217 563,896
658,000 665,379 7,379 658,135
Public safety:Police:
Sheriff's fees 322,000 282,132 (39,868) 309,859 Fire 9,000 16,827 7,827 11,881 Protective services 113,200 133,680 20,480 133,152
444,200 432,639 (11,561) 454,892
Sanitation:Landfill fees 4,469,873 4,555,665 85,792 3,746,721
GENERAL FUNDCARSON CITY, NEVADA
127

See accompanying notes. 78
SCHEDULE OF REVENUES, EXPENDITURES,AND CHANGES IN FUND BALANCES - BUDGET AND ACTUAL
FOR THE YEAR ENDED JUNE 30, 2017(WITH COMPARATIVE ACTUAL AMOUNTS FOR THE YEAR ENDED JUNE 30, 2016)
(PAGE 3 OF 12)
FINALBUDGET ACTUAL VARIANCE 2016
Health:Vaccine 185,000$ 187,364$ 2,364$ 272,212$ Clinic services 130,000 177,504 47,504 188,360Health inspection fees 226,311 232,535 6,224 235,080
541,311 597,403 56,092 695,652
Culture and recreation 1,385,988 1,323,955 (62,033) 1,425,448
Total Charges for Services 12,486,599 12,714,864 228,265 12,213,290
Fines and forfeits:Court 694,600 755,058 60,458 686,826Sheriff - 9,848 9,848 5,560
Total Fines and Forfeits 694,600 764,906 70,306 692,386
Miscellaneous:Investment income 40,000 37,758 (2,242) 115,127Rents and royalties 199,960 207,014 7,054 210,412Other 80,603 118,073 37,470 81,501Gifts and donations 250 37,217 36,967 127,790Refunds and reimbursements 808,358 654,202 (154,156) 811,672Penalties and interest -
delinquent taxes 415,000 323,741 (91,259) 490,696
Total Miscellaneous 1,544,171 1,378,005 (166,166) 1,837,198
Total Revenues 71,720,897 72,315,273 594,376 69,304,095
Expenditures:General Government:
Legislative:Board of Supervisors:
Salaries and wages 130,507 129,084 1,423 125,260Employee benefits 101,696 95,293 6,403 97,242Services and supplies 20,450 14,971 5,479 17,978
Total Legislative 252,653 239,348 13,305 240,480
Executive:Clerk:
Salaries and wages 205,718 205,685 33 196,096Employee benefits 65,308 64,823 485 62,546Services and supplies 19,823 11,533 8,290 13,544
290,849 282,041 8,808 272,186
Elections:Salaries and wages 136,304 131,648 4,656 124,560Employee benefits 61,010 59,780 1,230 58,564Services and supplies 73,670 65,203 8,467 55,171
270,984 256,631 14,353 238,295
CARSON CITY, NEVADAGENERAL FUND
128

See accompanying notes. 79
SCHEDULE OF REVENUES, EXPENDITURES,AND CHANGES IN FUND BALANCES - BUDGET AND ACTUAL
FOR THE YEAR ENDED JUNE 30, 2017(WITH COMPARATIVE ACTUAL AMOUNTS FOR THE YEAR ENDED JUNE 30, 2016)
(PAGE 4 OF 12)
FINALBUDGET ACTUAL VARIANCE 2016
Public Guardian:Salaries and wages 145,726$ 144,536$ 1,190$ 117,744$ Employee benefits 68,215 68,630 (415) 48,964 Services and supplies 6,750 5,130 1,620 5,779
220,691 218,296 2,395 172,487
Treasurer:Salaries and wages 328,124 301,250 26,874 304,328 Employee benefits 164,111 141,869 22,242 149,916 Services and supplies 44,680 52,447 (7,767) 50,129
536,915 495,566 41,349 504,373
Recorder:Salaries and wages 344,018 341,305 2,713 331,054 Employee benefits 157,989 156,100 1,889 152,485 Services and supplies 85,904 47,326 38,578 28,675
587,911 544,731 43,180 512,214
Assessor:Salaries and wages 487,837 488,471 (634) 469,073 Employee benefits 224,176 220,677 3,499 214,347 Services and supplies 192,094 23,092 169,002 68,169
904,107 732,240 171,867 751,589
District Attorney:Salaries and wages 1,706,348 1,617,457 88,891 1,572,678 Employee benefits 756,051 709,474 46,577 657,822 Services and supplies 205,693 108,959 96,734 103,494
2,668,092 2,435,890 232,202 2,333,994
City Manager:Salaries and wages 373,054 341,345 31,709 363,089 Employee benefits 152,992 138,432 14,560 147,454 Services and supplies 94,953 81,210 13,743 138,930 Capital outlay - - - 10,300
620,999 560,987 60,012 659,773
Central Services:Services and supplies 1,959,608 1,946,545 13,063 1,872,316
Total Executive 8,060,156 7,472,927 587,229 7,317,227
Finance:Finance:
Salaries and wages 460,341 463,835 (3,494) 483,922 Employee benefits 227,793 216,709 11,084 208,361 Services and supplies 94,743 76,925 17,818 96,567
782,877 757,469 25,408 788,850
GENERAL FUNDCARSON CITY, NEVADA
129

See accompanying notes. 80
SCHEDULE OF REVENUES, EXPENDITURES,AND CHANGES IN FUND BALANCES - BUDGET AND ACTUAL
FOR THE YEAR ENDED JUNE 30, 2017(WITH COMPARATIVE ACTUAL AMOUNTS FOR THE YEAR ENDED JUNE 30, 2016)
(PAGE 5 OF 12)
FINALBUDGET ACTUAL VARIANCE 2016
Internal Auditor:Services and supplies 110,200$ 91,882$ 18,318$ 100,908$
Purchasing:Salaries and wages 86,345 86,282 63 77,366Employee benefits 32,646 32,618 28 29,212Services and supplies 9,032 8,860 172 10,283
128,023 127,760 263 116,861
Human Resources:Salaries and wages 202,817 199,537 3,280 199,347Employee benefits 87,926 84,200 3,726 84,936Services and supplies 88,040 67,564 20,476 37,603
378,783 351,301 27,482 321,886
Total Finance 1,399,883 1,328,412 71,471 1,328,505
Other:Community Development:
Planning:Salaries and wages 449,286 429,058 20,228 395,023Employee benefits 178,557 169,797 8,760 171,906Services and supplies 51,921 50,542 1,379 43,337
679,764 649,397 30,367 610,266
Business License:Salaries and wages 69,889 65,034 4,855 66,648Employee benefits 34,834 30,804 4,030 33,793Services and supplies 11,750 8,295 3,455 8,084
116,473 104,133 12,340 108,525
Total Community Development 796,237 753,530 42,707 718,791
Information Technology:Salaries and wages 828,951 759,228 69,723 734,914Employee benefits 373,015 340,849 32,166 327,847Services and supplies 842,294 717,864 124,430 659,953Capital outlay - 54,845 (54,845) 15,000
2,044,260 1,872,786 171,474 1,737,714
Geographic Information Systems:Services and supplies 271,500 160,395 111,105 270,305Capital outlay - 30,439 (30,439) -
271,500 190,834 80,666 270,305
Public Defender:Services and supplies 1,572,365 1,546,150 26,215 1,558,341
Public Safety Complex / Courthouse:Services and supplies 344,725 188,919 155,806 252,458
CARSON CITY, NEVADAGENERAL FUND
130

See accompanying notes. 81
SCHEDULE OF REVENUES, EXPENDITURES,AND CHANGES IN FUND BALANCES - BUDGET AND ACTUAL
FOR THE YEAR ENDED JUNE 30, 2017(WITH COMPARATIVE ACTUAL AMOUNTS FOR THE YEAR ENDED JUNE 30, 2016)
(PAGE 6 OF 12)
FINALBUDGET ACTUAL VARIANCE 2016
City Hall:Services and supplies 115,760$ 90,057$ 25,703$ 76,393$
Northgate:Services and supplies 32,800 26,693 6,107 28,825
Facilities Maintenance:Salaries and wages 709,336 714,666 (5,330) 704,285 Employee benefits 327,062 315,887 11,175 302,187 Services and supplies 414,473 395,656 18,817 382,186
1,450,871 1,426,209 24,662 1,388,658
Total Other 6,628,518 6,095,178 533,340 6,031,485
Total General Government 16,341,210 15,135,865 1,205,345 14,917,697
Public Safety:Sheriff:
Chartered Administration:Salaries and wages 721,521 698,729 22,792 612,654 Employee benefits 347,793 307,037 40,756 314,017
1,069,314 1,005,766 63,548 926,671
Administrative Services:Salaries and wages 276,763 304,901 (28,138) 257,223 Employee benefits 195,702 193,974 1,728 178,615 Services and supplies 609,952 559,129 50,823 651,856 Capital outlay - - - 39,666
1,082,417 1,058,004 24,413 1,127,360
Investigations:Salaries and wages 1,292,353 1,286,507 5,846 1,297,988 Employee benefits 738,864 705,140 33,724 702,821 Services and supplies 349,647 316,996 32,651 281,075 Capital outlay - - - 26,642
2,380,864 2,308,643 72,221 2,308,526
Operational Services:Salaries and wages 3,863,483 3,750,560 112,923 3,627,659 Employee benefits 2,314,802 2,264,453 50,349 2,177,055 Services and supplies 598,271 622,221 (23,950) 639,595 Capital outlay - - - 1,078
6,776,556 6,637,234 139,322 6,445,387
CARSON CITY, NEVADAGENERAL FUND
131

See accompanying notes. 82
SCHEDULE OF REVENUES, EXPENDITURES,AND CHANGES IN FUND BALANCES - BUDGET AND ACTUAL
FOR THE YEAR ENDED JUNE 30, 2017(WITH COMPARATIVE ACTUAL AMOUNTS FOR THE YEAR ENDED JUNE 30, 2016)
(PAGE 7 OF 12)
FINALBUDGET ACTUAL VARIANCE 2016
Detention Facility:Salaries and wages 2,379,130$ 2,416,609$ (37,479)$ 2,376,782$ Employee benefits 1,479,633 1,467,226 12,407 1,420,700Services and supplies 440,453 431,452 9,001 391,968
4,299,216 4,315,287 (16,071) 4,189,450
General Services:Salaries and wages 380,099 361,426 18,673 435,997Employee benefits 168,312 158,831 9,481 203,572Services and supplies 64,395 60,638 3,757 65,288
612,806 580,895 31,911 704,857
Dispatch:Salaries and wages 1,292,707 1,244,313 48,394 1,282,414Employee benefits 515,126 482,357 32,769 473,043Services and supplies 139,346 144,842 (5,496) 144,556
1,947,179 1,871,512 75,667 1,900,013
Federal, Tri-Net Grant:Salaries and wages 23,580 11,982 11,598 649Employee benefits 54,810 41,307 13,503 51,506Services and supplies 14,370 10,546 3,824 16,085
92,760 63,835 28,925 68,240
Total Sheriff 18,261,112 17,841,176 419,936 17,670,504
Fire:Administration:
Salaries and wages 499,302 357,322 141,980 300,580Employee benefits 158,967 94,300 64,667 149,754Services and supplies 42,333 48,761 (6,428) 48,470
700,602 500,383 200,219 498,804Operations:
Salaries and wages 5,031,603 4,925,786 105,817 4,866,514Employee benefits 2,344,105 2,281,329 62,776 2,317,661Services and supplies 548,912 552,131 (3,219) 515,649Capital outlay - - - 10,195
7,924,620 7,759,246 165,374 7,710,019
Prevention:Salaries and wages 315,579 291,270 24,309 272,626Employee benefits 126,325 115,938 10,387 121,940Services and supplies 50,888 55,288 (4,400) 49,493
492,792 462,496 30,296 444,059
Emergency Management:Salaries and wages 184,404 222,010 (37,606) 108,693Employee benefits 104,318 85,579 18,739 96,464Services and supplies 20,706 20,405 301 24,453
309,428 327,994 (18,566) 229,610
CARSON CITY, NEVADAGENERAL FUND
132

See accompanying notes. 83
SCHEDULE OF REVENUES, EXPENDITURES,AND CHANGES IN FUND BALANCES - BUDGET AND ACTUAL
FOR THE YEAR ENDED JUNE 30, 2017(WITH COMPARATIVE ACTUAL AMOUNTS FOR THE YEAR ENDED JUNE 30, 2016)
(PAGE 8 OF 12)
FINALBUDGET ACTUAL VARIANCE 2016
Training:Salaries and wages 162,701$ 132,369$ 30,332$ 111,877$ Employee benefits 89,053 80,697 8,356 63,674 Services and supplies 113,835 101,847 11,988 99,096
365,589 314,913 50,676 274,647
Wildland Fire Management:Salaries and wages 178,771 125,585 53,186 206,670 Employee benefits 5,568 9,941 (4,373) 15,608 Services and supplies 274,780 199,178 75,602 178,902 Capital outlay 30,000 30,000 - -
489,119 364,704 124,415 401,180
Total Fire 10,282,150 9,729,736 552,414 9,558,319
Corrections:Juvenile Probation:
Salaries and wages 961,165 907,480 53,685 813,515 Employee benefits 516,945 465,138 51,807 470,757 Services and supplies 286,016 215,665 70,351 258,391 Capital outlay 46,029 46,028 1 -
1,810,155 1,634,311 175,844 1,542,663
Juvenile Detention:Salaries and wages 1,040,342 1,005,792 34,550 1,023,863 Employee benefits 461,473 426,413 35,060 415,272 Services and supplies 109,290 95,918 13,372 106,016
1,611,105 1,528,123 82,982 1,545,151
Total Corrections 3,421,260 3,162,434 258,826 3,087,814
Total Public Safety 31,964,522 30,733,346 1,231,176 30,316,637
Judicial:Juvenile Court:
Salaries and wages 365,113 379,593 (14,480) 272,606 Employee benefits 173,502 178,553 (5,051) 130,964 Services and supplies 98,002 64,068 33,934 77,916
Total Juvenile Court 636,617 622,214 14,403 481,486
Justice Court:Salaries and wages 2,326,092 2,340,967 (14,875) 2,306,927 Employee benefits 1,103,177 1,066,702 36,475 1,096,646 Services and supplies 1,299,887 1,173,009 126,878 906,845 Capital outlay 63,940 67,761 (3,821) 21,169
Total Justice Court 4,793,096 4,648,439 144,657 4,331,587
Alternative Sentencing:Salaries and wages 704,782 712,408 (7,626) 655,453 Employee benefits 321,545 334,178 (12,633) 255,630 Services and supplies 164,001 174,182 (10,181) 177,452
Total Alternative Sentencing 1,190,328 1,220,768 (30,440) 1,088,535
Total Judicial 6,620,041 6,491,421 128,620 5,901,608
GENERAL FUNDCARSON CITY, NEVADA
133

See accompanying notes. 84
SCHEDULE OF REVENUES, EXPENDITURES,AND CHANGES IN FUND BALANCES - BUDGET AND ACTUAL
FOR THE YEAR ENDED JUNE 30, 2017(WITH COMPARATIVE ACTUAL AMOUNTS FOR THE YEAR ENDED JUNE 30, 2016)
(PAGE 9 OF 12)
FINALBUDGET ACTUAL VARIANCE 2016
Public Works:Engineering / Public Works:
Public Works:Salaries and wages 1,245,716$ 1,214,720$ 30,996$ 1,294,800$ Employee benefits 843,176 843,472 (296) 798,461Services and supplies 101,748 100,268 1,480 95,694
Total Public Works 2,190,640 2,158,460 32,180 2,188,955
Sanitation:Landfill:
Salaries and wages 638,618 600,220 38,398 554,006Employee benefits 277,266 270,892 6,374 238,826Services and supplies 1,109,930 968,893 141,037 812,137
Total Sanitation 2,025,814 1,840,005 185,809 1,604,969
Health:Public Health Administration:
Salaries and wages 248,687 248,840 (153) 257,263Employee benefits 120,145 114,465 5,680 120,125Services and supplies 775,115 680,715 94,400 697,095
Total Public HealthAdministration 1,143,947 1,044,020 99,927 1,074,483
Medical:Salaries and wages 71,080 70,857 223 70,458Employee benefits 35,074 35,035 39 34,048Services and supplies 564,312 333,007 231,305 450,640
Total Medical 670,466 438,899 231,567 555,146
Environmental Health:Salaries and wages 181,694 178,729 2,965 344,411Employee benefits 64,426 64,050 376 130,137Services and supplies 13,224 4,847 8,377 28,036
Total Environmental Health 259,344 247,626 11,718 502,584
Douglas County Environmental Health:Salaries and wages 162,254 140,310 21,944 - Employee benefits 73,254 55,309 17,945 - Services and supplies 28,074 18,317 9,757 -
Total Environmental Health 263,582 213,936 49,646 -
Animal Services:Services and supplies 947,557 710,841 236,716 705,834
Total Health 3,284,896 2,655,322 629,574 2,838,047
GENERAL FUNDCARSON CITY, NEVADA
134

See accompanying notes. 85
SCHEDULE OF REVENUES, EXPENDITURES,AND CHANGES IN FUND BALANCES - BUDGET AND ACTUAL
FOR THE YEAR ENDED JUNE 30, 2017(WITH COMPARATIVE ACTUAL AMOUNTS FOR THE YEAR ENDED JUNE 30, 2016)
(PAGE 10 OF 12)
FINALBUDGET ACTUAL VARIANCE 2016
Welfare:Administration:
Salaries and wages 106,178$ 102,442$ 3,736$ 101,191$ Employee benefits 59,025 58,264 761 56,919 Services and supplies 328,931 176,022 152,909 90,874
Total Administration 494,134 336,728 157,406 248,984
Sexual Assalt Response Team (SART):Salaries and wages 16,000 13,865 2,135 3,675 Employee benefits 505 416 89 122 Services and supplies 4,958 5,586 (628) 9,006
Total SART 21,463 19,867 1,596 12,803
Total Welfare 515,597 356,595 159,002 261,787
Culture and Recreation:Parks:
Parks and Recreation Administration:Salaries and wages 439,708 422,490 17,218 454,711 Employee benefits 204,329 197,511 6,818 188,789 Services and supplies 82,827 74,599 8,228 36,479
726,864 694,600 32,264 679,979
Park Maintenance:Salaries and wages 542,347 507,055 35,292 545,172 Employee benefits 254,403 236,099 18,304 229,023 Services and supplies 524,177 526,657 (2,480) 559,978
1,320,927 1,269,811 51,116 1,334,173
Grants, Gifts, and Donations:Salaries and wages 65,259 51,696 13,563 48,724 Services and supplies 66,751 16,570 50,181 34,661 Capital outlay 15,484 22,268 (6,784) 2,621
147,494 90,534 56,960 86,006
Youth Sports AssociationSalaries and wages 45,588 27,420 18,168 35,579 Services and supplies 61,437 51,999 9,438 50,809
107,025 79,419 27,606 86,388
Total Parks 2,302,310 2,134,364 167,946 2,186,546
Participant Recreation:Community Center:
Salaries and wages 172,186 150,795 21,391 145,498 Employee benefits 55,072 53,636 1,436 51,407 Services and supplies 141,103 119,528 21,575 124,195
368,361 323,959 44,402 321,100
CARSON CITY, NEVADAGENERAL FUND
135

See accompanying notes. 86
SCHEDULE OF REVENUES, EXPENDITURES,AND CHANGES IN FUND BALANCES - BUDGET AND ACTUAL
FOR THE YEAR ENDED JUNE 30, 2017(WITH COMPARATIVE ACTUAL AMOUNTS FOR THE YEAR ENDED JUNE 30, 2016)
(PAGE 11 OF 12)
FINALBUDGET ACTUAL VARIANCE 2016
Recreation:Salaries and wages 285,710$ 329,952$ (44,242)$ 285,805$ Employee benefits 41,232 27,184 14,048 51,803 Services and supplies 85,871 59,918 25,953 58,390
412,813 417,054 (4,241) 395,998
Swimming Pool:Salaries and wages 365,264 388,138 (22,874) 407,117Employee benefits 82,616 82,116 500 78,839Services and supplies 228,579 168,023 60,556 179,633
676,459 638,277 38,182 665,589
Ice Rink:Salaries and wages 46,886 45,704 1,182 30,642 Employee benefits 1,013 849 164 1,620 Services and supplies 44,039 45,527 (1,488) 32,072
91,938 92,080 (142) 64,334
Nevada Fair:Salaries and wages - - - 15,954 Employee benefits - - - 794 Services and supplies - - - 142,565
- - - 159,313
Sports:Salaries and wages 166,139 162,970 3,169 171,695 Employee benefits 50,379 43,061 7,318 49,360 Services and supplies 165,535 164,767 768 151,461
382,053 370,798 11,255 372,516
Multi-Purpose Athletic CenterSalaries and wages 53,571 49,694 3,877 518 Employee benefits 1,692 1,493 199 16 Services and supplies 104,646 80,206 24,440 39,292
159,909 131,393 28,516 39,826
Total ParticipantRecreation 2,091,533 1,973,561 117,972 2,018,676
Library:Salaries and wages 876,586 870,109 6,477 892,482Employee benefits 379,520 342,631 36,889 321,564Services and supplies 428,367 422,716 5,651 384,236Capital outlay 21,391 20,560 831 -
1,705,864 1,656,016 49,848 1,598,282Total Culture and
Recreation 6,099,707 5,763,941 335,766 5,803,504
CARSON CITY, NEVADAGENERAL FUND
136

See accompanying notes. 87
SCHEDULE OF REVENUES, EXPENDITURES,AND CHANGES IN FUND BALANCES - BUDGET AND ACTUAL
FOR THE YEAR ENDED JUNE 30, 2017(WITH COMPARATIVE ACTUAL AMOUNTS FOR THE YEAR ENDED JUNE 30, 2016)
(PAGE 12 OF 12)
FINALBUDGET ACTUAL VARIANCE 2016
Community Support:Support Services:
Services and supplies 336,513$ 331,134$ 5,379$ 368,771$
Total Expenditures 69,378,940 65,466,089 3,912,851 64,201,965
Excess (Deficiency) of Revenues over Expenditures 2,341,957 6,849,184 4,507,227 5,102,130
Other Financing Sources (Uses):Capital Leases - 54,845 54,845 10,300 Transfers in (out):
Quality of Life Fund 63,684 52,321 (11,363) 68,608 Insurance Fund (250,000) (250,000) - - Redevelopment Revolving Fund - 480,000 480,000 480,000 MAC Maintenance 50,000 50,000 - 25,000 Capital Projects Fund (1,653,700) (1,653,700) - (775,000) Infrastructure Fund - - - (82,100) Library Gift Fund (932) (932) - - Carson City Debt Service
Fund (2,937,860) (2,937,860) - (2,896,204) Traffic Transportation Fund (20,000) (20,000) - (10,000) Street Maintenance - - - (370,197) Cemetery Fund (90,000) (90,000) - (90,000) Carson City Transit Fund (400,000) (400,000) - (400,000) Grant Fund (180,992) (467,984) (286,992) (109,707) Ambulance Fund (350,000) (350,000) - (300,000) Extraordinary Maintenance (100,000) (100,000) - (100,000)
Total Other FinancingSources (Uses) (5,869,800) (5,633,310) 236,490 (4,549,300)
Net Change in Fund Balances (3,527,843) 1,215,874 4,743,717 552,830
Fund Balances, July 1 8,181,142 8,181,142 - 7,628,312
Fund Balances, June 30 4,653,299$ 9,397,016$ 4,743,717$ 8,181,142$
GENERAL FUNDCARSON CITY, NEVADA
137

This page intentionally left blank.
138

NONMAJOR GOVERNMENTAL FUNDS
_________________________________________________________________ Combining Balance Sheet Combining Statement of Revenues, Expenditures, and Changes in Fund Balances
139

See accompanying notes. 88
CARSON CITY, NEVADA
TOTALSPECIAL DEBT CAPITAL NONMAJOR
REVENUE SERVICE PROJECTS GOVERNMENTALFUNDS FUNDS FUNDS FUNDS
ASSETSCash and investments 5,610,558$ 186,955$ 3,953,223$ 9,750,736$ Receivables (net of allowances
for uncollectibles):Taxes, delinquent 29,609 8,375 - 37,984 Accounts receivable 708,627 22,294 - 730,921
Due from other funds 7,320 - - 7,320 Due from other governments 4,131,769 - 235,651 4,367,420 Prepaid items 39,975 - - 39,975 Restricted assets:
Cash and investments 42,973 - - 42,973
Total Assets 10,570,831$ 217,624$ 4,188,874$ 14,977,329$
LIABILITIES, DEFERRED INFLOWS OF RESOURCES, AND FUND BALANCES Liabilities:
Accounts payable 1,215,318$ 2,000$ 184,843$ 1,402,161$ Accrued salaries and benefits 208,863 - - 208,863 Due to other funds 50,271 - - 50,271 Due to other governments 241,279 - - 241,279 Due to component units 30,960 - - 30,960 Unearned revenue 99,423 - - 99,423 Payable from restricted assets 42,973 - - 42,973
Total Liabilities 1,889,087 2,000 184,843 2,075,930
Deferred inflows of resources:Unavailable revenue - delinquent
property taxes 23,943 7,597 - 31,540
Fund balances:Nonspendable 39,975 - - 39,975 Restricted 6,088,159 141,057 4,004,031 10,233,247 Committed 10,044 - - 10,044 Assigned 2,519,623 66,970 - 2,586,593
Total Fund Balances 8,657,801 208,027 4,004,031 12,869,859
Total Liabilities, Deferred Inflowsof Resources, and Fund Balances 10,570,831$ 217,624$ 4,188,874$ 14,977,329$
COMBINING BALANCE SHEETNONMAJOR GOVERNMENTAL FUNDS
JUNE 30, 2017
140

See accompanying notes. 89
TOTALSPECIAL DEBT CAPITAL NONMAJOR
REVENUE SERVICE PROJECTS GOVERNMENTALFUNDS FUNDS FUNDS FUNDS
Revenues:Taxes 13,134,413$ 1,745,597$ 1,455,794$ 16,335,804$ Licenses and permits 209,789 - - 209,789 Intergovernmental revenues 9,811,978 391,162 - 10,203,140 Charges for services 475,446 - - 475,446 Fines and forfeits 26,034 - - 26,034 Miscellaneous 572,907 97,570 21,753 692,230
Total Revenues 24,230,567 2,234,329 1,477,547 27,942,443
Expenditures:Current:
General government 358,474 - - 358,474 Public safety 1,198,619 - - 1,198,619 Judicial 158,945 - - 158,945 Public works 7,015,258 - - 7,015,258 Sanitation - - - - Health 2,506,692 - 4,656 2,511,348 Welfare 1,768,947 - - 1,768,947 Culture and recreation 1,789,396 - - 1,789,396 Community support - - 402,594 402,594 Airport 74,903 - - 74,903 Economic opportunity 90,492 - - 90,492
Capital outlay 9,580,644 - 5,008,563 14,589,207 Debt service:
Principal retirement - 5,239,300 - 5,239,300 Interest and fiscal charges - 3,178,466 - 3,178,466
Total Expenditures 24,542,370 8,417,766 5,415,813 38,375,949
Excess (Deficiency) of Revenuesover Expenditures (311,803) (6,183,437) (3,938,266) (10,433,506)
Other Financing Sources (Uses):Refunding bonds issued - 5,951,000 - 5,951,000 Capital leases 30,000 - - 30,000 Debt issued 3,425,293 - - 3,425,293 Payment to refunded bond escrow agent - (5,859,759) - (5,859,759)Sale of capital assets 43,552 - - 43,552 Transfers in 2,842,555 7,468,459 1,309,774 11,620,788 Transfers out (3,888,329) (1,480,729) (1,253,575) (6,622,633)
Total Other FinancingSources (Uses) 2,453,071 6,078,971 56,199 8,588,241
Net Change in Fund Balances 2,141,268 (104,466) (3,882,067) (1,845,265)
Fund Balances, July 1 6,516,533 312,493 7,886,098 14,715,124
Fund Balances, June 30 8,657,801$ 208,027$ 4,004,031$ 12,869,859$
FOR THE YEAR ENDED JUNE 30, 2017
CARSON CITY, NEVADACOMBINING STATEMENT OF REVENUES, EXPENDITURES,
AND CHANGES IN FUND BALANCESNONMAJOR GOVERNMENTAL FUNDS
141

This page intentionally left blank.
142

SPECIAL REVENUE FUNDS
Special Revenue Funds are used to account for specific revenues that are legally restricted to expenditure for particular purposes.
Nonmajor Funds Senior Citizens Center Fund - This Fund is used to account for the 1984 voter-approved tax override of five cents to provide for the construction, furnishing, equipment, operation, and ongoing maintenance of Senior Citizens facilities in Carson City. Cooperative Extension Fund - This Fund was established in accordance with Nevada Revised Statute 549.020 and is used to account for the City's share of the Cooperative Extension work which is funded by a one cent to five cent tax rate subject to Board of Supervisor approval. Traffic Transportation Fund - This Fund was established in accordance with the Carson City Charter Section 2.240 and is used to account for monies received for parking fees and fines and may be expended only for the establishment, repair, and control of parking meters, facilities for parking, and any other appurtenances necessary for traffic control. Supplemental Indigent Fund - This Fund is used to account for additional indigent expenditures other than General Fund requirements and for the collection and payment to the State of Nevada for the auto accident indigent ad valorem tax levy. Library Gift Fund - This Fund was established in accordance with Nevada Revised Statute 379.106 and is used to account for all gifts to the Ormsby Public Library. Administrative Assessments Fund - This Fund was established by NRS 176.059 and is used to account for the City's share of assessments on misdemeanor convictions. 911 Surcharge Fund - This Fund was established in accordance with Nevada Revised Statute 244A.7643 and is used to account for the 911 surcharge monies that may be expended only for the enhancement or improvement of the telephone system for reporting an emergency in Carson City County. Capital Projects Fund - This Fund is used to account for the additional ad valorem tax imposed in accordance with Nevada Revised Statute 354.598155 for the purpose of replacing major assets.
143

This page intentionally left blank.
144

SPECIAL REVENUE FUNDS Continued
Street Maintenance Fund - This Fund is used to account for the one-quarter percent (0.25%) retail sales and use tax for the sole purpose of maintaining and repairing public roads within Carson City; the one cent per gallon motor vehicle fuel tax approved by the voters in 1986 for the purpose of repairing or restoring existing paved roads, streets, and alleys; and the 3.60 and 1.75 cents per gallon motor vehicle fuel taxes collected in accordance with Nevada Revised Statutes 365.180 and 365.190. Redevelopment Administration Fund - This Fund is used to account for the operations of the Redevelopment Agency, which has been combined with Carson City for financial statement purposes. Carson City Transit Fund - This Fund is used to account for transit grants, fares, donations, and additional City funding to be used for the sole purpose of providing public transportation services within Carson City. Commissary Fund - This Fund is used to operate a commissary to allow the Sheriff to sell to the prisoners food, beverages, toiletries, and similar items as the Sheriff may approve. The Sheriff must expend the profits from the operation of the commissary only for the welfare and benefit of the prisoners in the jail.
V & T Special Infrastructure Fund – This fund is used to account for the 0.125% sales tax revenue that is pledged for the payment of principal and interest on the bonds known as the V & T Historical Bonds. Campo Fund - This fund is used to account for revenues received and expenditures incurred related to the administration of Federal Highway Administration and Federal Transit Administration Metropolitan Planning activities. Airport Fund - This Fund is used to account for Federal Aviation Administration grants awarded to the City. Regional Transportation Fund - This Fund is used to account for the nine cent per gallon County fuel tax imposed in accordance with Nevada Revised Statute 373.030. The monies are to be used for the purpose of street and highway construction. Quality of Life Fund - This Fund is used to account for a voter approved one-quarter percent (0.25%) sales tax for the purpose of acquiring open space and the construction and maintenance of park and trail facilities. Grant Fund - This fund is used to account for state and federal grants.
145

See accompanying notes. 90
FOR THE YEAR ENDED JUNE 30, 2017(PAGE 1 OF 3)
SENIOR CITIZENSCOOPERATIVE TRAFFIC SUPPLEMENTALCENTER EXTENSION TRANSPORTATION INDIGENT
ASSETSCash and investments:
Unrestricted 86,826$ 251,661$ 11,177$ 157,857$ Restricted - - - -
Taxes receivable, delinquent 6,501 1,653 - 14,953 Accounts receivable 213 3 - -Due from other funds - - - -Due from other governments - 7,121 - 40,112 Prepaid items - - - -
Total Assets 93,540$ 260,438$ 11,177$ 212,922$
LIABILITIES, DEFERRED INFLOWS OF RESOURCES, AND FUND BALANCESLiabilities:
Accounts payable 6,349$ 13,311$ -$ 480$ Accrued salaries and benefits 8,662 301 1,133 23,016 Due to other funds - - - - Due to other governments - 3,763 - 155,797 Due to component units - - - -Unearned revenue - - - -Payable from restricted assets - - - -
Total Liabilities 15,011 17,375 1,133 179,293
Deferred inflows of resources:Unavailable revenue - delinquent property taxes 5,256 1,339 - 12,093
Fund balances:Nonspendable - - - - Restricted 73,273 241,724 - 21,536 Committed - - 10,044 - Assigned - - - -
Total Fund Balances 73,273 241,724 10,044 21,536
Total Liabilities, Deferred Inflowsof Resources, and Fund Balances 93,540$ 260,438$ 11,177$ 212,922$
CARSON CITY, NEVADACOMBINING BALANCE SHEET
NONMAJOR SPECIAL REVENUE FUNDS
146

See accompanying notes. 91
L LIBRARY ADMINISTRATIVE 911 CAPITAL GIFT ASSESSMENTS SURCHARGE PROJECTS
39,971$ 111,142$ 168,956$ 1,935,819$ - - - - - - - 6,502 - - 18,416 680,359 - - - - - 588 - -
1,371 298 35,163 -
41,342$ 112,028$ 222,535$ 2,622,680$
5,321$ 603$ 808$ 697,122$ 29 - - -
- - - - - 22,000 - - - - - - - - - - - - - -
5,350 22,603 808 697,122
- - - 5,255
1,371 298 35,163 - 34,621 89,127 186,564 -
- - - - - - - 1,920,303
35,992 89,425 221,727 1,920,303
41,342$ 112,028$ 222,535$ 2,622,680$
147

See accompanying notes. 92
CARSON CITY, NEVADACOMBINING BALANCE SHEET
NONMAJOR SPECIAL REVENUE FUNDSFOR THE YEAR ENDED JUNE 30, 2017
(PAGE 2 OF 3)
STREET REDEVELOPMENT CARSON CITYMAINTENANCE ADMINISTRATION TRANSIT
ASSETSCash and investments:
Unrestricted 57,965$ 89,934$ 223,305$ Restricted - - -
Taxes receivable, delinquent - - - Accounts receivable - - 2,000 Due from other funds - - - Due from other governments 787,901 - 175,197 Prepaid items 160 - -
Total Assets 846,026$ 89,934$ 400,502$
LIABILITIES, DEFERRED INFLOWS OF RESOURCES, AND FUND BALANCESLiabilities:
Accounts payable 114,670$ 2,734$ 73,273$ Accrued salaries and benefits 52,877 4,041 2,164 Due to other funds - - - Due to other governments - - 12,024 Due to component units - - - Unearned revenue - - - Payable from restricted assets - - -
Total Liabilities 167,547 6,775 87,461
Deferred inflows of resources:Unavailable revenue - delinquent property taxes - - -
FUND BALANCESNonspendable 160 - - Restricted 678,319 83,159 313,041 Committed - - - Assigned - - -
Total Fund Balances 678,479 83,159 313,041
Total Liabilities, Deferred Inflowsof Resources, and Fund Balances 846,026$ 89,934$ 400,502$
148

See accompanying notes. 93
V & T SPECIALCOMMISSARY INFRASTRUCTURE CAMPO AIRPORT
140,594$ 364,251$ -$ -$ 42,973 - - -
- - - - - - - - - - - - - 236,375 64,890 30,960 - - 513 -
183,567$ 600,626$ 65,403$ 30,960$
24,242$ 292$ 25,447$ -$ 1,172 - - -
- - 7,320 - - - - - - - - 30,960 - - - -
42,973 - - -
68,387 292 32,767 30,960
- - - -
- - 513 - 115,180 600,334 32,123 -
- - - - - - - -
115,180 600,334 32,636 -
183,567$ 600,626$ 65,403$ 30,960$
149

This page intentionally left blank.
150

See accompanying notes. 94
CARSON CITY, NEVADACOMBINING BALANCE SHEET
NONMAJOR SPECIAL REVENUE FUNDSFOR THE YEAR ENDED JUNE 30, 2017
(PAGE 3 OF 3)
REGIONAL QUALITYTRANSPORTATION OF LIFE GRANT TOTAL
ASSETSCash and investments:
Unrestricted 298,404$ 1,672,696$ -$ 5,610,558$ Restricted - - - 42,973
Taxes receivable, delinquent - - - 29,609 Accounts receivable - 2,000 5,636 708,627 Due from other funds 7,320 - - 7,320 Due from other governments 889,652 510,527 1,388,446 4,131,769 Prepaid items 375 149 1,946 39,975
Total Assets 1,195,751$ 2,185,372$ 1,396,028$ 10,570,831$
LIABILITIES, DEFERRED INFLOWS OF RESOURCES, AND FUND BALANCESLiabilities:
Accounts payable 125,054$ 57,873$ 67,739$ 1,215,318$ Accrued salaries and benefits 34,630 14,775 66,063 208,863 Due to other funds - - 42,951 50,271 Due to other governments 6,667 5,534 35,494 241,279 Due to component units - - - 30,960 Unearned revenue - - 99,423 99,423 Payable from restricted assets - - - 42,973
Total Liabilities 166,351 78,182 311,670 1,889,087
Deferred inflows of resources:Unavailable revenue - delinquent property taxes - - - 23,943
FUND BALANCESNonspendable 375 149 1,946 39,975 Restricted 1,029,025 2,107,041 483,092 6,088,159 Committed - - - 10,044 Assigned - - 599,320 2,519,623
Total Fund Balances 1,029,400 2,107,190 1,084,358 8,657,801
Total Liabilities, Deferred Inflowsof Resources, and Fund Balances 1,195,751$ 2,185,372$ 1,396,028$ 10,570,831$
151

See accompanying notes. 95
SENIORCITIZENS COOPERATIVE TRAFFIC SUPPLEMENTALCENTER EXTENSION TRANSPORTATION INDIGENT
Revenues:Taxes 629,208$ 161,077$ -$ 1,447,186$ Licenses and permits - - - - Intergovernmental revenues - 10,000 - - Charges for services - 7,086 - - Fines and forfeits - - 26,034 - Miscellaneous 618 13,050 9,829 1,622
Total Revenues 629,826 191,213 35,863 1,448,808
Expenditures:Current:
General government - - - - Public safety - - 52,675 - Judicial - - - - Public works - - - - Welfare - - - 1,448,243 Health - - - - Culture and recreation 452,664 174,471 - - Airport - - - - Economic opportunity - - - -
Capital outlay - - - -
Total Expenditures 452,664 174,471 52,675 1,448,243
Excess (Deficiency) of Revenuesover Expenditures 177,162 16,742 (16,812) 565
Other Financing Sources (Uses):Debt issued - - - - Capital leases - - - - Sale of capital assets - - - - Transfers in - - 20,000 - Transfers out (151,600) - - -
Total Other FinancingSources (Uses) (151,600) - 20,000 -
Net Change in Fund Balances 25,562 16,742 3,188 565
Fund Balances, July 1 47,711 224,982 6,856 20,971
Fund Balances, June 30 73,273$ 241,724$ 10,044$ 21,536$
CARSON CITY, NEVADACOMBINING STATEMENT OF REVENUES, EXPENDITURES,
AND CHANGES IN FUND BALANCESNONMAJOR SPECIAL REVENUE FUNDS
FOR THE YEAR ENDED JUNE 30, 2017(PAGE 1 OF 3)
152

See accompanying notes. 96
LIBRARY ADMINISTRATIVE 911 CAPITALGIFT ASSESSMENTS SURCHARGE PROJECTS
-$ -$ -$ 629,216$ - - 209,789 - - 61,714 - 76,000 - - - - - - - -
85,228 - 534 3,265
85,228 61,714 210,323 708,481
- - - 50,692 - - 151,725 32,263 - 48,957 - - - - - 157,530 - - - - - - - -
119,598 - - - - - - - - - - -
5,469 - 172,138 3,805,279
125,067 48,957 323,863 4,045,764
(39,839) 12,757 (113,540) (3,337,283)
- - - 3,425,293 - - 30,000 - - - - 15,598
932 - - 1,653,700 - - (103,223) (230,104)
932 - (73,223) 4,864,487
(38,907) 12,757 (186,763) 1,527,204
74,899 76,668 408,490 393,099
35,992$ 89,425$ 221,727$ 1,920,303$
153

See accompanying notes. 97
CARSON CITY, NEVADACOMBINING STATEMENT OF REVENUES, EXPENDITURES,
AND CHANGES IN FUND BALANCESNONMAJOR SPECIAL REVENUE FUNDS
FOR THE YEAR ENDED JUNE 30, 2017(PAGE 2 OF 3)
STREET REDEVELOPMENT CARSON CITYMAINTENANCE ADMINISTRATION TRANSIT
Revenues:Taxes 2,959,823$ -$ -$ Licenses and permits - - - Intergovernmental revenues 1,393,363 - 1,338,031 Charges for services 159,836 - 96,894 Fines and forfeits - - - Miscellaneous (805) 9,416 16,258
Total Revenues 4,512,217 9,416 1,451,183
Expenditures:Current:
General government - 275,812 - Public safety - - - Judicial - - - Public works 4,754,996 - 1,234,330 Welfare - - - Health - - - Culture and recreation - - - Airport - - - Economic opportunity - - -
Capital outlay 330,966 - 636,795
Total Expenditures 5,085,962 275,812 1,871,125
Excess (Deficiency) of Revenuesover Expenditures (573,745) (266,396) (419,942)
Other Financing Sources (Uses):Debt issued - - - Capital leases - - - Sale of capital assets 20,639 - 7,315 Transfers in - 287,342 400,000 Transfers out - - -
Total Other FinancingSources (Uses) 20,639 287,342 407,315
Net Change in Fund Balances (553,106) 20,946 (12,627)
Fund Balances, July 1 1,231,585 62,213 325,668
Fund Balances, June 30 678,479$ 83,159$ 313,041$
154

See accompanying notes. 98
V & T SPECIALCOMMISSARY INFRASTRUCTURE CAMPO AIRPORT
-$ 1,287,504$ -$ -$ - - - - - - 367,371 2,308,253
144,152 - - - - - - -
87,788 1,283 - -
231,940 1,288,787 367,371 2,308,253
- 292 - - 193,643 - - -
- - - - - - 373,796 - - - - - - - - - - - - - - - - 74,903 - - - - - - - 2,233,350
193,643 292 373,796 2,308,253
38,297 1,288,495 (6,425) -
- - - - - - - - - - - - - - 12,597 - - (1,042,450) - -
- (1,042,450) 12,597 -
38,297 246,045 6,172 -
76,883 354,289 26,464 -
115,180$ 600,334$ 32,636$ -$
155

See accompanying notes. 99
REGIONAL QUALITYTRANSPORTATION OF LIFE GRANT TOTAL
Revenues:Taxes 3,445,312$ 2,575,087$ -$ 13,134,413$ Licenses and permits - - - 209,789 Intergovernmental revenues 411,581 86,239 3,759,426 9,811,978 Charges for services - 708 66,770 475,446 Fines and forfeits - - - 26,034 Miscellaneous 137,586 12,115 195,120 572,907
Total Revenues 3,994,479 2,674,149 4,021,316 24,230,567
Expenditures:Current:
General government - - 31,678 358,474 Public safety - - 768,313 1,198,619 Judicial - - 109,988 158,945 Public works 494,606 - - 7,015,258 Welfare - - 320,704 1,768,947 Health - - 2,506,692 2,506,692 Culture and recreation - 916,826 125,837 1,789,396 Airport - - - 74,903 Economic opportunity - - 90,492 90,492
Capital outlay 1,781,578 382,421 232,648 9,580,644
Total Expenditures 2,276,184 1,299,247 4,186,352 24,542,370
Excess (Deficiency) of Revenuesover Expenditures 1,718,295 1,374,902 (165,036) (311,803)
Other Financing Sources (Uses):Debt issued - - - 3,425,293 Capital leases - - - 30,000 Sale of capital assets - - - 43,552 Transfers in - - 467,984 2,842,555 Transfers out (1,663,895) (697,057) - (3,888,329)
Total Other FinancingSources (Uses) (1,663,895) (697,057) 467,984 2,453,071
Net Change in Fund Balances 54,400 677,845 302,948 2,141,268
Fund Balances, July 1 975,000 1,429,345 781,410 6,516,533
Fund Balances, June 30 1,029,400$ 2,107,190$ 1,084,358$ 8,657,801$
CARSON CITY, NEVADACOMBINING STATEMENT OF REVENUES, EXPENDITURES,
AND CHANGES IN FUND BALANCESNONMAJOR SPECIAL REVENUE FUNDS
FOR THE YEAR ENDED JUNE 30, 2017(PAGE 3 OF 3)
156

See accompanying notes. 100
CARSON CITY, NEVADA
SCHEDULE OF REVENUES, EXPENDITURES,AND CHANGES IN FUND BALANCES - BUDGET AND ACTUAL
(WITH COMPARATIVE ACTUAL AMOUNTS FOR THE YEAR ENDED JUNE 30, 2016)
FINAL BUDGET ACTUAL VARIANCE 2016
Revenues:Taxes:
Ad valorem 620,602$ 629,208$ 8,606$ 625,158$
Miscellaneous:Investment income 500 618 118 1,214
Total Revenues 621,102 629,826 8,724 626,372
Expenditures:Culture and recreation:
Participant recreation:Salaries and wages 229,041 230,179 (1,138) 222,239 Employee benefits 128,021 122,261 5,760 119,935 Services and supplies 106,701 100,224 6,477 110,368
Total Expenditures 463,763 452,664 11,099 452,542
Excess (Deficiency) of Revenuesover Expenditures 157,339 177,162 19,823 173,830
Other Financing Sources (Uses):Transfers in (out):
Carson City Debt Service Fund (151,600) (151,600) - (152,000)
Total Other Financing Sources (Uses) (151,600) (151,600) - (152,000)
Net Change in Fund Balances 5,739 25,562 19,823 21,830
Fund Balances, July 1 47,711 47,711 - 25,881
Fund Balances, June 30 53,450$ 73,273$ 19,823$ 47,711$
SENIOR CITIZENS CENTER FUND
FOR THE YEAR ENDED JUNE 30, 2017
157

See accompanying notes. 101
CARSON CITY, NEVADACOOPERATIVE EXTENSION FUND
SCHEDULE OF REVENUES, EXPENDITURES,AND CHANGES IN FUND BALANCES - BUDGET AND ACTUAL
FOR THE YEAR ENDED JUNE 30, 2017(WITH COMPARATIVE ACTUAL AMOUNTS FOR THE YEAR ENDED JUNE 30, 2016)
FINALBUDGET ACTUAL VARIANCE 2016
Revenues:Taxes:
Ad valorem 158,877$ 161,077$ 2,200$ 160,036$
Intergovernmental revenues:
Other local government grants:
Interlocal cooperative
agreements - 10,000 10,000 -
Charges for services - 7,086 7,086 -
Miscellaneous:Refunds and reimbursements 12,905 13,050 145 13,315
Total Revenues 171,782 191,213 19,431 173,351
Expenditures:Culture and recreation:
Cooperative extension:Salaries and wages 8,000 12,907 (4,907) 7,601 Employee benefits 200 396 (196) 228 Services and supplies 368,564 161,168 207,396 170,677
Total Expenditures 376,764 174,471 202,293 178,506
Excess (Deficiency) of Revenuesover Expenditures (204,982) 16,742 221,724 (5,155)
Fund Balances, July 1 224,982 224,982 - 230,137
Fund Balances, June 30 20,000$ 241,724$ 221,724$ 224,982$
158

See accompanying notes. 102
CARSON CITY, NEVADATRAFFIC TRANSPORTATION FUND
SCHEDULE OF REVENUES, EXPENDITURES,AND CHANGES IN FUND BALANCES - BUDGET AND ACTUAL
FOR THE YEAR ENDED JUNE 30, 2017(WITH COMPARATIVE ACTUAL AMOUNTS FOR THE YEAR ENDED JUNE 30, 2016)
FINAL BUDGET ACTUAL VARIANCE 2016
Revenues:Fines and forfeits:
Fines:Court 30,000$ 26,034$ (3,966)$ 33,509$
Miscellaneous:Investment income 100 28 (72) 33 Rents and royalties 16,150 9,000 (7,150) 11,940 Other - 801 801 277
16,250 9,829 (6,421) 12,250
Total Revenues 46,250 35,863 (10,387) 45,759
Expenditures:Public safety:
Sheriff - parking enforcement:Salaries and wages 32,876 31,354 1,522 30,161 Employee benefits 16,990 16,702 288 15,014 Services and supplies 16,054 4,619 11,435 11,454
Total Expenditures 65,920 52,675 13,245 56,629
Excess (Deficiency) of Revenuesover Expenditures (19,670) (16,812) 2,858 (10,870)
Other Financing Sources (Uses):Transfers in (out):
General Fund 20,000 20,000 - 10,000
Net Change in Fund Balances 330 3,188 2,858 (870)
Fund Balances, July 1 4,977 6,856 1,879 7,726
Fund Balances, June 30 5,307$ 10,044$ 4,737$ 6,856$
159

See accompanying notes. 103
CARSON CITY, NEVADASUPPLEMENTAL INDIGENT FUND
SCHEDULE OF REVENUES, EXPENDITURES,AND CHANGES IN FUND BALANCES - BUDGET AND ACTUAL
FOR THE YEAR ENDED JUNE 30, 2017(WITH COMPARATIVE ACTUAL AMOUNTS FOR THE YEAR ENDED JUNE 30, 2016)
FINALBUDGET ACTUAL VARIANCE 2016
Revenues:Taxes:
Ad valorem 1,427,385$ 1,447,186$ 19,801$ 1,437,862$
Miscellaneous:Investment income 1,000 1,622 622 3,533
Total Revenues 1,428,385 1,448,808 20,423 1,441,395
Expenditures:Welfare:
Institutional care:Salaries and wages 80,000 79,195 805 - Employee benefits - 23,478 (23,478) - Services and supplies 1,369,356 1,345,570 23,786 1,420,467
Total Expenditures 1,449,356 1,448,243 1,113 1,420,467
Excess (Deficiency) of Revenuesover Expenditures (20,971) 565 21,536 20,928
Fund Balances, July 1 20,971 20,971 - 43
Fund Balances, June 30 -$ 21,536$ 21,536$ 20,971$
160

See accompanying notes. 104
CARSON CITY, NEVADALIBRARY GIFT FUND
SCHEDULE OF REVENUES, EXPENDITURES,AND CHANGES IN FUND BALANCES - BUDGET AND ACTUAL
FOR THE YEAR ENDED JUNE 30, 2017(WITH COMPARATIVE ACTUAL AMOUNTS FOR THE YEAR ENDED JUNE 30, 2016)
FINAL BUDGET ACTUAL VARIANCE 2016
Revenues:Miscellaneous:
Investment income 1,000$ 155$ (845)$ 799$ Donations and gifts 88,375 85,073 (3,302) 89,168
Total Revenues 89,375 85,228 (4,147) 89,967
Expenditures:Culture and recreation:
Libraries:Salaries and wages 10,000 7,993 2,007 15,210 Employee benefits 475 393 82 738 Services and supplies 135,672 111,212 24,460 131,796 Capital outlay 12,500 5,469 7,031 10,943
Total Expenditures 158,647 125,067 33,580 158,687
Excess (Deficiency) of Revenuesover Expenditures (69,272) (39,839) 29,433 (68,720)
Other Financing Sources (Uses):Transfers in (out):
General Fund - 932 932 -
Net Change in Fund Balances (69,272) (38,907) 30,365 (68,720)
Fund Balances, July 1 74,899 74,899 - 143,619
Fund Balances, June 30 5,627$ 35,992$ 30,365$ 74,899$
161
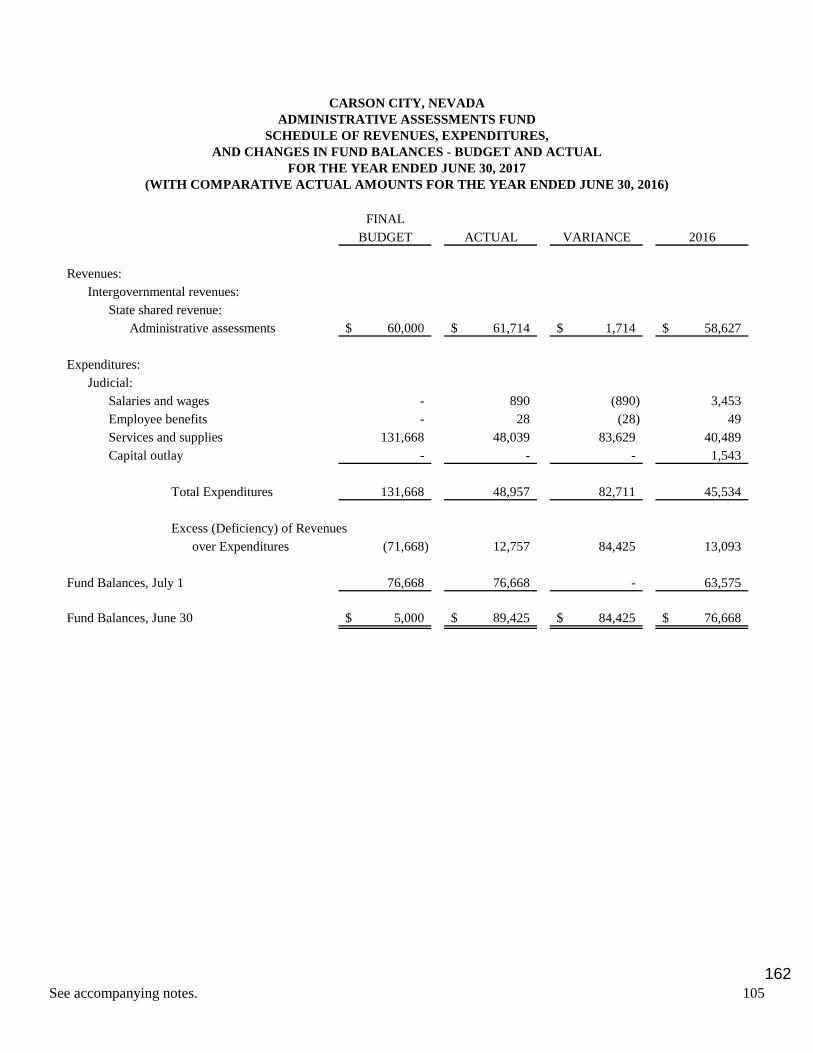
See accompanying notes. 105
CARSON CITY, NEVADAADMINISTRATIVE ASSESSMENTS FUND
SCHEDULE OF REVENUES, EXPENDITURES,AND CHANGES IN FUND BALANCES - BUDGET AND ACTUAL
FOR THE YEAR ENDED JUNE 30, 2017(WITH COMPARATIVE ACTUAL AMOUNTS FOR THE YEAR ENDED JUNE 30, 2016)
FINALBUDGET ACTUAL VARIANCE 2016
Revenues:Intergovernmental revenues:
State shared revenue:Administrative assessments 60,000$ 61,714$ 1,714$ 58,627$
Expenditures:Judicial:
Salaries and wages - 890 (890) 3,453 Employee benefits - 28 (28) 49 Services and supplies 131,668 48,039 83,629 40,489 Capital outlay - - - 1,543
Total Expenditures 131,668 48,957 82,711 45,534
Excess (Deficiency) of Revenuesover Expenditures (71,668) 12,757 84,425 13,093
Fund Balances, July 1 76,668 76,668 - 63,575
Fund Balances, June 30 5,000$ 89,425$ 84,425$ 76,668$
162

See accompanying notes. 106
CARSON CITY, NEVADA911 SURCHARGE FUND
SCHEDULE OF REVENUES, EXPENDITURES,AND CHANGES IN FUND BALANCES - BUDGET AND ACTUAL
FOR THE YEAR ENDED JUNE 30, 2017(WITH COMPARATIVE ACTUAL AMOUNTS FOR THE YEAR ENDED JUNE 30, 2016)
FINAL BUDGET ACTUAL VARIANCE 2016
Revenues:Licenses and permits:
Franchise fees:Telephone 218,000$ 209,789$ (8,211)$ 212,164$
Miscellaneous:Investment income 1,000 534 (466) 3,114
Total Revenues 219,000 210,323 (8,677) 215,278
Expenditures:Public Safety:
Services and supplies 319,938 151,725 168,213 209,959 Capital outlay 154,329 172,138 (17,809) 271,934
Total Expenditures 474,267 323,863 150,404 481,893
Excess (Deficiency) of Revenuesover Expenditures (255,267) (113,540) 141,727 (266,615)
Other Financing Sources (Uses):Capital leases - 30,000 30,000 - Transfers in (out):
Carson City Debt Service Fund (103,223) (103,223) - (103,130)
Total Other Financing Sources (Uses) (103,223) (73,223) 30,000 (103,130)
Net Change in Fund Balances (358,490) (186,763) 171,727 (369,745)
Fund Balances, July 1 408,490 408,490 - 778,235
Fund Balances, June 30 50,000$ 221,727$ 171,727$ 408,490$
163
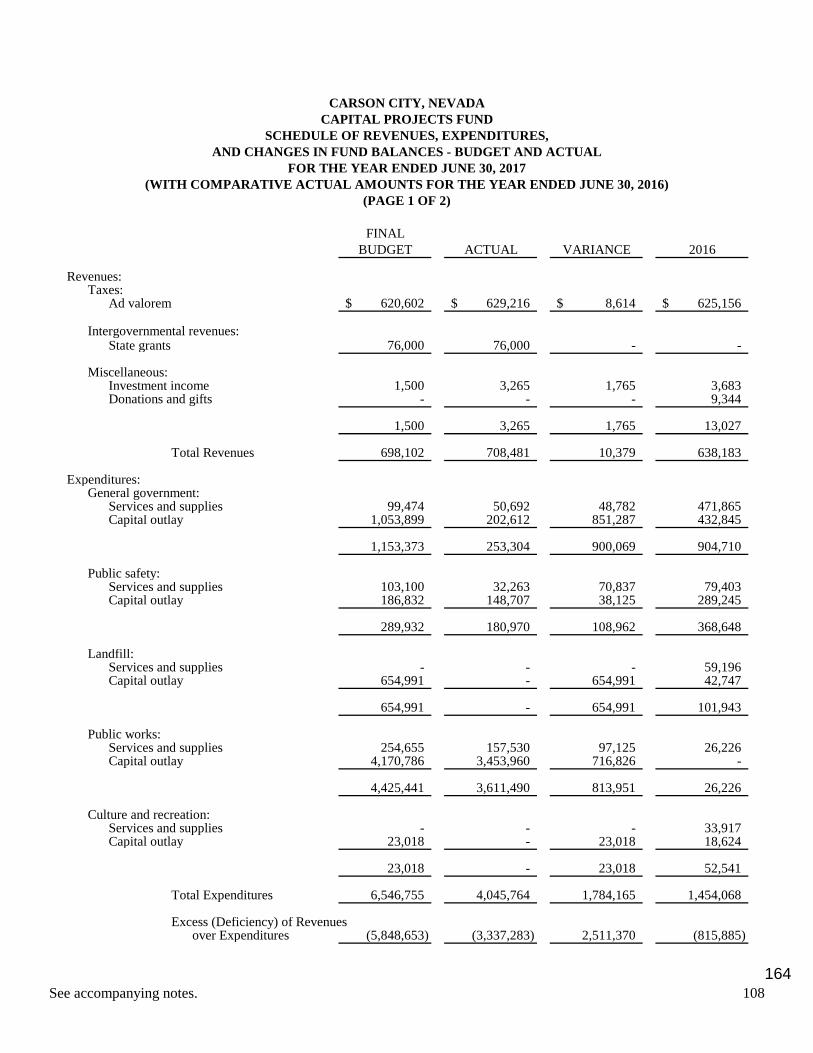
See accompanying notes. 108
CARSON CITY, NEVADACAPITAL PROJECTS FUND
SCHEDULE OF REVENUES, EXPENDITURES,AND CHANGES IN FUND BALANCES - BUDGET AND ACTUAL
(WITH COMPARATIVE ACTUAL AMOUNTS FOR THE YEAR ENDED JUNE 30, 2016)(PAGE 1 OF 2)
FINALBUDGET ACTUAL VARIANCE 2016
Revenues:Taxes:
Ad valorem 620,602$ 629,216$ 8,614$ 625,156$
Intergovernmental revenues:State grants 76,000 76,000 - -
Miscellaneous:Investment income 1,500 3,265 1,765 3,683 Donations and gifts - - - 9,344
1,500 3,265 1,765 13,027
Total Revenues 698,102 708,481 10,379 638,183
Expenditures:General government:
Services and supplies 99,474 50,692 48,782 471,865 Capital outlay 1,053,899 202,612 851,287 432,845
1,153,373 253,304 900,069 904,710
Public safety:Services and supplies 103,100 32,263 70,837 79,403 Capital outlay 186,832 148,707 38,125 289,245
289,932 180,970 108,962 368,648
Landfill:Services and supplies - - - 59,196 Capital outlay 654,991 - 654,991 42,747
654,991 - 654,991 101,943
Public works:Services and supplies 254,655 157,530 97,125 26,226 Capital outlay 4,170,786 3,453,960 716,826 -
4,425,441 3,611,490 813,951 26,226
Culture and recreation:Services and supplies - - - 33,917 Capital outlay 23,018 - 23,018 18,624
23,018 - 23,018 52,541
Total Expenditures 6,546,755 4,045,764 1,784,165 1,454,068
Excess (Deficiency) of Revenuesover Expenditures (5,848,653) (3,337,283) 2,511,370 (815,885)
FOR THE YEAR ENDED JUNE 30, 2017
164

See accompanying notes. 108
CARSON CITY, NEVADACAPITAL PROJECTS FUND
SCHEDULE OF REVENUES, EXPENDITURES,AND CHANGES IN FUND BALANCES - BUDGET AND ACTUAL
FOR THE YEAR ENDED JUNE 30, 2017(WITH COMPARATIVE ACTUAL AMOUNTS FOR THE YEAR ENDED JUNE 30, 2016)
(PAGE 2 OF 2)
FINAL BUDGET ACTUAL VARIANCE 2016
Other Financing Sources (Uses):Debt issued 4,258,238$ 3,425,293$ (832,945)$ -$ Sale of capital assets 15,598 15,598 - 30,799 Transfers in (out):
General Fund 1,653,700 1,653,700 - 775,000 Carson City Debt Service Fund (262,602) (230,104) 32,498 (230,111)
Total Other Financing Sources (Uses) 5,664,934 4,864,487 (800,447) 575,688
Net Change in Fund Balances (183,719) 1,527,204 1,710,923 (240,197)
Fund Balances, July 1 393,099 393,099 - 633,296
Fund Balances, June 30 209,380$ 1,920,303$ 1,710,923$ 393,099$
165

See accompanying notes. 109
FINALBUDGET ACTUAL VARIANCE 2016
Revenues:Taxes:
County option motor vehiclefuel tax 375,421$ 384,736$ 9,315$ 376,731$
Sales tax, voter approved 2,460,686 2,575,087 114,401 2,363,332
2,836,107 2,959,823 123,716 2,740,063
Intergovernmental revenues:Federal grants - 648 648 5,127 State shared revenues:
Motor vehicle fuel tax 1,300,723 1,326,985 26,262 1,297,002 Other local government grants 53,500 65,730 12,230 78,821
1,354,223 1,393,363 39,140 1,380,950
Charges for services 65,000 159,836 94,836 88,192
Miscellaneous:Investment income 1,000 (1,005) (2,005) 6,840 Refunds and reimbursements - 200 200 240
1,000 (805) (1,805) 7,080
Total Revenues 4,256,330 4,512,217 255,887 4,216,285
Expenditures:Public works:
Salaries and wages 1,413,409 1,440,895 (27,486) 1,396,615 Employee benefits 592,325 592,502 (177) 558,890Services and supplies 2,976,709 2,721,599 255,110 2,459,750 Capital outlay 403,504 330,966 72,538 758,548
Total Expenditures 5,385,947 5,085,962 299,985 5,173,803
Excess (Deficiency) of Revenuesover Expenditures (1,129,617) (573,745) 555,872 (957,518)
Other Financing Sources (Uses):Sale of capital assets - 20,639 20,639 42,560 Transfers in (out):
General Fund - - - 370,197 Regional Transportation Fund - - - 574,197
Total Other FinancingSources (Uses) - 20,639 20,639 986,954
Net Change in Fund Balances (1,129,617) (553,106) 576,511 29,436
Fund Balances, July 1 1,231,585 1,231,585 - 1,202,149
Fund Balances, June 30 101,968$ 678,479$ 576,511$ 1,231,585$
(WITH COMPARATIVE ACTUAL AMOUNTS FOR THE YEAR ENDED JUNE 30, 2016)FOR THE YEAR ENDED JUNE 30, 2017
CARSON CITY, NEVADASTREET MAINTENANCE FUND
SCHEDULE OF REVENUES, EXPENDITURES,AND CHANGES IN FUND BALANCES - BUDGET AND ACTUAL
166

See accompanying notes. 110
CARSON CITY, NEVADAREDEVELOPMENT ADMINISTRATION FUND
(WITH COMPARATIVE ACTUAL AMOUNTS FOR THE YEAR ENDED JUNE 30, 2016)
FINAL BUDGET ACTUAL VARIANCE 2016
Revenues:Miscellaneous:
Investment income 500$ 821$ 321$ 1,261$ Other 10,000 8,595 (1,405) 10,960
10,500 9,416 (1,084) 12,221
Total Revenues 10,500 9,416 (1,084) 12,221
Expenditures:General government:
Salaries and wages 97,059 97,701 (642) 94,938 Employee benefits 26,152 23,864 2,288 25,290 Services and supplies 194,710 154,247 40,463 194,839
Total Expenditures 317,921 275,812 42,109 315,067
Excess (Deficiency) of Revenuesover Expenditures (307,421) (266,396) 41,025 (302,846)
Other Financing Sources (Uses):Transfers in (out):
Redevelopment Debt Service Fund 287,342 287,342 - 278,891
Net Change in Fund Balances (20,079) 20,946 41,025 (23,955)
Fund Balances, July 1 62,213 62,213 - 86,168
Fund Balances, June 30 42,134$ 83,159$ 41,025$ 62,213$
SCHEDULE OF REVENUES, EXPENDITURES,AND CHANGES IN FUND BALANCES - BUDGET AND ACTUAL
FOR THE YEAR ENDED JUNE 30, 2017
167

See accompanying notes. 111
CARSON CITY, NEVADACARSON CITY TRANSIT FUND
(WITH COMPARATIVE ACTUAL AMOUNTS FOR THE YEAR ENDED JUNE 30, 2016)
FINALBUDGET ACTUAL VARIANCE 2016
Revenues:Intergovernmental revenues:
Federal grants 1,701,955$ 1,288,031$ (413,924)$ 908,943$ State grants 50,000 50,000 - 50,000
1,751,955 1,338,031 (413,924) 958,943
Charges for services:Ticket sales 93,622 96,894 3,272 91,244
Miscellaneous:Investment income 1,000 1,495 495 2,715 Rents and royalties 20,000 14,763 (5,237) 15,759
21,000 16,258 (4,742) 18,474
Total Revenues 1,866,577 1,451,183 (415,394) 1,068,661
Expenditures:Public works:
Transit system:Salaries and wages 27,013 19,503 7,510 27,574 Employee benefits 31,248 37,158 (5,910) 31,306 Services and supplies 1,475,988 1,177,669 298,319 1,214,645 Capital outlay 1,022,717 636,795 385,922 81,626
Total Expenditures 2,556,966 1,871,125 685,841 1,355,151
Excess (Deficiency) of Revenuesover Expenditures (690,389) (419,942) 270,447 (286,490)
Other Financing Sources (Uses):Sale of capital assets - 7,315 7,315 - Transfers in (out):
General Fund 400,000 400,000 - 400,000
Net Change in Fund Balances (290,389) (12,627) 277,762 113,510
Fund Balances, July 1 325,668 325,668 - 212,158
Fund Balances, June 30 35,279$ 313,041$ 277,762$ 325,668$
SCHEDULE OF REVENUES, EXPENDITURES,AND CHANGES IN FUND BALANCES - BUDGET AND ACTUAL
FOR THE YEAR ENDED JUNE 30, 2017
168

See accompanying notes. 112
FINAL BUDGET ACTUAL VARIANCE 2016
Revenues:Charges for Services:
Public safety:Commissary sales 140,000$ 144,152$ 4,152$ 111,936$
Miscellaneous:Investment income 300 496 196 956 Rents and royalties 60,000 83,686 23,686 81,024 Donations and gifts - 231 231 251 Other - 3,375 3,375 1,516
60,300 87,788 27,488 83,747
Total Revenues 200,300 231,940 31,640 195,683
Expenditures:Public safety:
Salaries and wages 80,815 55,519 25,296 69,676 Employee benefits 17,262 16,133 1,129 15,114 Services and supplies 161,383 121,991 39,392 123,706
Total Expenditures 259,460 193,643 65,817 208,496
Net Change in Fund Balances (59,160) 38,297 97,457 (12,813)
Fund Balances, July 1 76,883 76,883 - 89,696
Fund Balances, June 30 17,723$ 115,180$ 97,457$ 76,883$
SCHEDULE OF REVENUES, EXPENDITURES,COMMISSARY FUND
CARSON CITY, NEVADA
(WITH COMPARATIVE ACTUAL AMOUNTS FOR THE YEAR ENDED JUNE 30, 2016)
FOR THE YEAR ENDED JUNE 30, 2017AND CHANGES IN FUND BALANCES - BUDGET AND ACTUAL
169

See accompanying notes. 113
CARSON CITY, NEVADAV & T SPECIAL INFRASTRUCTURE FUND
SCHEDULE OF REVENUES, EXPENDITURES,AND CHANGES IN FUND BALANCES - BUDGET AND ACTUAL
FINALBUDGET ACTUAL VARIANCE 2016
Revenues:Taxes:
Sales tax 1,230,753$ 1,287,504$ 56,751$ 1,181,643$
Intergovernmental revenues:Other local government grants:
Interlocal cooperative agreements - - - 100,000
Miscellaneous:Investment income 100 1,283 1,183 894
Total Revenues 1,230,853 1,288,787 57,934 1,282,537
Expenditures:General government:
Services and supplies 1,250 292 958 1,075
Excess (Deficiency) of Revenuesover Expenditures 1,229,603 1,288,495 58,892 1,281,462
Other Financing Sources (Uses):Transfers in (out):
Carson City Debt Service Fund (1,042,450) (1,042,450) - (1,125,878)
Net Change in Fund Balances 187,153 246,045 58,892 155,584
Fund Balances, July 1 354,289 354,289 - 198,705
Fund Balances, June 30 541,442$ 600,334$ 58,892$ 354,289$
(WITH COMPARATIVE ACTUAL AMOUNTS FOR THE YEAR ENDED JUNE 30, 2016)FOR THE YEAR ENDED JUNE 30, 2017
170

See accompanying notes. 114
CARSON CITYCAMPO FUND
SCHEDULE OF REVENUES, EXPENDITURES,AND CHANGES IN FUND BALANCES - BUDGET AND ACTUAL
FOR THE YEAR ENDED JUNE 30, 2017(WITH COMPARATIVE ACTUAL AMOUNTS FOR THE YEAR ENDED JUNE 30, 2016)
FINAL BUDGET ACTUAL VARIANCE 2016
Revenues:Intergovernmental revenues:
Federal grants 360,050$ 360,968$ 918$ 393,255$ Other local government grants:
Interlocal cooperative agreements 6,386 6,403 17 8,407
Total Revenues 366,436 367,371 935 401,662
Expenditures:Public works:
Services and supplies 379,000 373,796 5,204 418,067
Excess (Deficiency) of Revenuesover Expenditures (12,564) (6,425) 6,139 (16,405)
Other Financing Sources (Uses):Transfers in (out):
Regional TransportationFund 12,597 12,597 - 16,542
Net Change in Fund Balances 33 6,172 6,139 137
Fund Balances, July 1 26,464 26,464 - 26,327
Fund Balances, June 30 26,497$ 32,636$ 6,139$ 26,464$
171

See accompanying notes. 115
CARSON CITY, NEVADAAIRPORT FUND
SCHEDULE OF REVENUES, EXPENDITURES,AND CHANGES IN FUND BALANCES - BUDGET AND ACTUAL
FOR THE YEAR ENDED JUNE 30, 2017(WITH COMPARATIVE ACTUAL AMOUNTS FOR THE YEAR ENDED JUNE 30, 2016)
FINALBUDGET ACTUAL VARIANCE 2016
Revenues:Intergovernmental revenues:
Federal grant, FAA 2,573,438$ 2,163,987$ (409,451)$ 150,000$ Other local shared revenues:
CC Airport Authority 171,562 144,266 (27,296) 10,000
Total Revenues 2,745,000 2,308,253 (436,747) 160,000
Expenditures:Airport:
Services and supplies - 74,903 (74,903) - Capital outlay 2,745,000 2,233,350 511,650 160,000
Total Expenditures 2,745,000 2,308,253 436,747 160,000
Excess (Deficiency) of Revenuesover Expenditures - - - -
Fund Balances, July 1 - - - -
Fund Balances, June 30 -$ -$ -$ -$
172

See accompanying notes. 116
CARSON CITY, NEVADAREGIONAL TRANSPORTATION FUND
SCHEDULE OF REVENUES, EXPENDITURES,AND CHANGES IN FUND BALANCES - BUDGET AND ACTUAL
FOR THE YEAR ENDED JUNE 30, 2017(WITH COMPARATIVE ACTUAL AMOUNTS FOR THE YEAR ENDED JUNE 30, 2016)
FINAL BUDGET ACTUAL VARIANCE 2016
Revenues:Taxes:
County option motor vehiclefuel tax 3,361,551$ 3,445,312$ 83,761$ 3,373,625$
Intergovernmental revenues:Federal grants 1,052,390 411,581 (640,809) 456,805
Miscellaneous:Investment income 500 1,666 1,166 2,305 Gifts and donations 10,000 10,208 208 10,212 Misellaneous other 125,712 125,712 - -
136,212 137,586 1,374 12,517
Total Revenues 4,550,153 3,994,479 (555,674) 3,842,947
Expenditures:Public works:
Paved streets:Salaries and wages 22,771 57,070 (34,299) - Employee benefits 140,193 116,415 23,778 52,885 Services and supplies 368,411 321,121 47,290 314,776 Capital outlay 3,269,818 1,781,578 1,488,240 795,187
Total Expenditures 3,801,193 2,276,184 1,525,009 1,162,848
Excess (Deficiency) of Revenues over Expenditures 748,960 1,718,295 969,335 2,680,099
Other Financing Sources (Uses):Transfers in (out):
Street Maintenance Fund - - - (574,197) Campo Fund (12,597) (12,597) - (16,542) Carson City Debt Service Fund (1,634,911) (1,634,911) - (1,668,734) Infrastructure Fund (16,387) (16,387) - -
Total Other Financing Sources (Uses) (1,663,895) (1,663,895) - (2,259,473)
Net Change in Fund Balances (914,935) 54,400 969,335 420,626
Fund Balances, July 1 975,000 975,000 - 554,374
Fund Balances, June 30 60,065$ 1,029,400$ 969,335$ 975,000$
173

See accompanying notes. 117
CARSON CITY, NEVADAQUALITY OF LIFE FUND
(WITH COMPARATIVE ACTUAL AMOUNTS FOR THE YEAR ENDED JUNE 30, 2016)(PAGE 1 OF 2)
FINALBUDGET ACTUAL VARIANCE 2016
Revenues:Taxes:
Sales tax, voter approved 2,475,441$ 2,575,087$ 99,646$ 2,363,277$
Intergovernmental revenues:Federal grants 475,969 50,577 (425,392) 152,199 State grants 115,636 16,218 (99,418) - Other local government grants:
Noxious weed abatement 15,000 19,444 4,444 15,000 Eagle Creek restoration - - - 10,000
606,605 86,239 (520,366) 177,199
Charges for services: - 708 708 857
Miscellaneous:Investment income 5,000 5,805 805 6,393 Other 6,210 6,310 100 -
11,210 12,115 905 6,393
Total Revenues 3,093,256 2,674,149 (419,107) 2,547,726
Expenditures:Culture and recreation:
Park maintenance:Salaries and wages 83,953 75,902 8,051 84,744 Employee benefits 23,446 20,956 2,490 20,173 Services and supplies 263,900 227,412 36,488 280,197 Capital outlay 15,000 - 15,000 18,203
386,299 324,270 62,029 403,317 Parks capital:
Salaries and wages 14,287 13,423 864 14,190 Employee benefits 451 - 451 - Services and supplies 62,388 37,654 24,734 60,168 Capital outlay 836,384 326,197 510,187 2,713,951
913,510 377,274 536,236 2,788,309 Quality of life:
Salaries and wages 291,633 232,652 58,981 242,876 Employee benefits 102,056 99,134 2,922 81,086 Services and supplies 531,004 209,693 321,311 300,649 Capital outlay 1,452,724 56,224 1,396,500 131,789
2,377,417 597,703 1,779,714 756,400
Total Expenditures 3,677,226 1,299,247 2,377,979 3,948,026
SCHEDULE OF REVENUES, EXPENDITURES,AND CHANGES IN FUND BALANCES - BUDGET AND ACTUAL
FOR THE YEAR ENDED JUNE 30, 2017
174

See accompanying notes. 118
CARSON CITY, NEVADAQUALITY OF LIFE FUND
FOR THE YEAR ENDED JUNE 30, 2017(WITH COMPARATIVE ACTUAL AMOUNTS FOR THE YEAR ENDED JUNE 30, 2016)
(PAGE 2 OF 2)
FINALBUDGET ACTUAL VARIANCE 2016
Excess (Deficiency) of Revenuesover Expenditures (583,970)$ 1,374,902$ 1,958,872$ (1,400,300)$
Other Financing Sources (Uses):Sale of capital assets - - - 570 Transfers in (out):
General Fund (113,684) (102,321) 11,363 (93,608) Carson City Debt Service Fund (594,736) (594,736) - (595,537)
Total Other FinancingSources (Uses) (708,420) (697,057) 11,363 (688,575)
Net Change in Fund Balances (1,292,390) 677,845 1,970,235 (2,088,875)
Fund Balances, July 1 1,429,345 1,429,345 - 3,518,220
Fund Balances, June 30 136,955$ 2,107,190$ 1,970,235$ 1,429,345$
SCHEDULE OF REVENUES, EXPENDITURES,AND CHANGES IN FUND BALANCES - BUDGET AND ACTUAL
175

See accompanying notes. 119
CARSON CITY, NEVADAGRANT FUND
(PAGE 1 OF 2)
FINALBUDGET ACTUAL VARIANCE 2016
Revenues:Intergovernmental revenues:
Federal grants 4,172,377$ 3,078,807$ (1,093,570)$ 3,778,293$ State grants 475,831 271,059 (204,772) 296,929 Other local government grants:
Interlocal cooperative agreements 582,702 409,560 (173,142) 477,326
5,230,910 3,759,426 (1,471,484) 4,552,548
Charges for services - 66,770 66,770 112,705
Miscellaneous:Donations and gifts 23,264 92,936 69,672 93,765 Other 39,520 102,184 62,664 112,701
62,784 195,120 132,336 206,466
Total Revenues 5,293,694 4,021,316 (1,272,378) 4,871,719
Expenditures:General government:
Services and supplies 83,414 31,678 51,736 29,663
83,414 31,678 51,736 29,663
Public safety:Salaries and wages 347,549 271,221 76,328 157,145 Employee benefits 156,561 150,137 6,424 102,049 Services and supplies 560,340 346,955 213,385 627,633 Capital outlay 196,866 170,486 26,380 77,423
1,261,316 938,799 322,517 964,250
Judicial:Salaries and wages 59,868 60,020 (152) 57,251 Employee benefits 27,185 26,990 195 26,130 Services and supplies 23,000 22,978 22 26,576 Capital outlay 5,412 5,412 - 13,488
115,465 115,400 65 123,445
Welfare:Salaries and wages 129,185 129,892 (707) 111,409 Employee benefits 66,017 61,806 4,211 56,698 Services and supplies 208,177 129,006 79,171 174,271 Capital outlay 25,500 25,500 - -
428,879 346,204 82,675 342,378
SCHEDULE OF REVENUES, EXPENDITURES,AND CHANGES IN FUND BALANCES - BUDGET AND ACTUAL
(WITH COMPARATIVE ACTUAL AMOUNTS FOR THE YEAR ENDED JUNE 30, 2016)FOR THE YEAR ENDED JUNE 30, 2017
176

See accompanying notes. 120
CARSON CITY, NEVADAGRANT FUND
FOR THE YEAR ENDED JUNE 30, 2017
(PAGE 2 OF 2)
FINAL BUDGET ACTUAL VARIANCE 2016
Health:Salaries and wages 1,859,773$ 1,397,121$ 462,652$ 1,578,339$ Employee benefits 694,852 542,213 152,639 603,426 Services and supplies 895,417 567,358 328,059 542,266
3,450,042 2,506,692 943,350 2,724,031
Culture and recreation:Salaries and wages 59,706 52,348 7,358 43,125 Employee benefits 1,794 2,067 (273) 1,337 Services and supplies 73,162 71,422 1,740 120,538 Capital outlay - - - 18,708
134,662 125,837 8,825 183,708 Economic opportunity:
Services and supplies 357,108 90,492 266,616 160,396 Capital outlay 54,902 31,250 23,652 443,473
412,010 121,742 290,268 603,869
Total Expenditures 5,885,788 4,186,352 1,699,436 4,971,344
Excess (Deficiency) of Revenuesover Expenditures (592,094) (165,036) 427,058 (99,625)
Other Financing Sources (Uses):Transfers in (out):
General Fund 180,992 467,984 286,992 109,707 General Fund (370,308) - 370,308 -
Total Other FinancingSources (Uses) (189,316) 467,984 657,300 109,707
Net Change in Fund Balances (781,410) 302,948 1,084,358 10,082
Fund Balances, July 1 781,410 781,410 - 771,328
Fund Balances, June 30 -$ 1,084,358$ 1,084,358$ 781,410$
(WITH COMPARATIVE ACTUAL AMOUNTS FOR THE YEAR ENDED JUNE 30, 2016)
SCHEDULE OF REVENUES, EXPENDITURES,AND CHANGES IN FUND BALANCES - BUDGET AND ACTUAL
177

This page intentionally left blank.
178

DEBT SERVICE FUNDS
Debt Service Funds are used to account for the accumulation of resources and payment of long-term obligation principal and interest from governmental resources.
Nonmajor Funds
Carson City Debt Service Fund - This Fund is used to accumulate monies for payment of general obligation bonds, notes, and capital lease obligations of the City that are not required to be accounted for in the Proprietary Funds.
Redevelopment Debt Service Fund - This Fund is used to accumulate monies for the payment of bonds and notes of the Redevelopment Agency.
179

See accompanying notes. 121
CARSON CITY, NEVADACOMBINING BALANCE SHEET
NONMAJOR DEBT SERVICE FUNDSFOR THE YEAR ENDED JUNE 30, 2017
CARSON REDEVELOPMENTCITY DEBT DEBT TOTAL
ASSETSCash and investments 46,676$ 140,279$ 186,955$ Taxes receivable, delinquent - 8,375 8,375 Accounts receivable 22,294 - 22,294
Total Assets 68,970$ 148,654$ 217,624$
DEFERRED INFLOWS OF RESOURCES, AND FUND BALANCESLiabilities:
Accounts payable 2,000$ -$ 2,000$
Deferred inflows of resources:Unavailable revenue - delinquent property taxes -$ 7,597$ 7,597$
Fund balances:Restricted - 141,057 141,057 Assigned 66,970 - 66,970
Total Fund Balances 66,970 141,057 208,027
Total Deferred Inflows of Resourcesand Fund Balances 68,970$ 148,654$ 217,624$
180

See accompanying notes. 122
CARSON CITY, NEVADACOMBINING STATEMENT OF REVENUES, EXPENDITURES,
AND CHANGES IN FUND BALANCESNONMAJOR DEBT SERVICE FUNDS
FOR THE YEAR ENDED JUNE 30, 2017
CARSON REDEVELOPMENTCITY DEBT DEBT TOTAL
Revenues:Taxes -$ 1,745,597$ 1,745,597$ Intergovernmental revenues 391,162 - 391,162 Miscellaneous 97,645 (75) 97,570
Total Revenues 488,807 1,745,522 2,234,329
Expenditures:Debt service:
Principal 5,009,300 230,000 5,239,300 Interest 3,049,121 49,600 3,098,721 Fiscal charges 79,645 100 79,745
Total Expenditures 8,138,066 279,700 8,417,766
Excess (Deficiency) of Revenuesover Expenditures (7,649,259) 1,465,822 (6,183,437)
Other Financing Sources (Uses):Refunding bonds issued 5,951,000 - 5,951,000 Payment to refunded bond escrow agent (5,859,759) - (5,859,759) Transfers in 7,468,459 - 7,468,459 Transfers out - (1,480,729) (1,480,729)
Total Other FinancingSources (Uses) 7,559,700 (1,480,729) 6,078,971
Net Change in Fund Balances (89,559) (14,907) (104,466)
Fund Balances, July 1 156,529 155,964 312,493
Fund Balances, June 30 66,970$ 141,057$ 208,027$
181

See accompanying notes. 123
CARSON CITY, NEVADACARSON CITY DEBT SERVICE FUND
(WITH COMPARATIVE ACTUAL AMOUNTS FOR THE YEAR ENDED JUNE 30, 2016)(PAGE 1 OF 2)
FINALBUDGET ACTUAL VARIANCE 2016
Revenues:Intergovernmental revenues:
Federal interest subsidy 43,507$ 43,507$ -$ -$ Other local government grants:
Interlocal cooperative agreements 347,655 347,655 - 348,455
391,162 391,162 - 348,455
Miscellaneous:Investment income 7,954 2,518 (5,436) 6,671 Rents and royalties 100,000 95,127 (4,873) 95,175
107,954 97,645 (10,309) 101,846
Total Revenues 499,116 488,807 (10,309) 450,301
Expenditures:Debt service:
General obligation bonds:Principal 3,475,000 3,475,000 - 2,775,000 Interest 2,247,449 2,247,449 - 2,266,401
5,722,449 5,722,449 - 5,041,401
Revenue bonds:Principal 987,800 987,800 - 968,600 Interest 647,111 647,111 - 616,683
1,634,911 1,634,911 - 1,585,283
Notes payable:Principal 546,500 546,500 - 534,500
Interest 154,561 154,561 - 86,822
701,061 701,061 - 621,322
Fiscal charges 93,241 79,645 13,596 340,650
Total Expenditures 8,151,662 8,138,066 13,596 7,588,656
Excess (Deficiency) of Revenuesover Expenditures (7,652,546) (7,649,259) 3,287 (7,138,355)
SCHEDULE OF REVENUES, EXPENDITURES,AND CHANGES IN FUND BALANCES - BUDGET AND ACTUAL
FOR THE YEAR ENDED JUNE 30, 2017
182

See accompanying notes. 124
CARSON CITY, NEVADACARSON CITY DEBT SERVICE FUND
FOR THE YEAR ENDED JUNE 30, 2017(WITH COMPARATIVE ACTUAL AMOUNTS FOR THE YEAR ENDED JUNE 30, 2016)
(PAGE 2 OF 2)
FINALBUDGET ACTUAL VARIANCE 2016
Other Financing Sources (Uses):Refunding bonds issued 5,951,000$ 5,951,000$ -$ 21,580,000$ Premium on refunding bonds - - - 1,836,172 Payment to refunded bond escrow agent (5,859,759) (5,859,759) - (23,701,582) Transfers in (out):
General Fund 2,937,860 2,937,860 - 2,896,204 Senior Citizens Center Fund 151,600 151,600 - 152,000 Regional Transportation Fund 1,634,911 1,634,911 - 1,668,734 Capital Projects Fund 230,104 230,104 - 230,111 Infrastructure Tax Fund 773,575 773,575 - 623,845 V & T Special Infrastructure Fund 1,042,450 1,042,450 - 1,125,878 Quality of Life Fund 594,736 594,736 - 595,537 911 Surcharge Fund 103,223 103,223 - 103,130
Total Other FinancingSources (Uses) 7,559,700 7,559,700 - 7,110,029
Net Change in Fund Balances (92,846) (89,559) 3,287 (28,326)
Fund Balances, July 1 156,529 156,529 - 184,855
Fund Balances, June 30 63,683$ 66,970$ 3,287$ 156,529$
SCHEDULE OF REVENUES, EXPENDITURES,AND CHANGES IN FUND BALANCES - BUDGET AND ACTUAL
183

See accompanying notes. 125
CARSON CITY, NEVADAREDEVELOPMENT DEBT SERVICE FUND
(WITH COMPARATIVE ACTUAL AMOUNTS FOR THE YEAR ENDED JUNE 30, 2016)
FINALBUDGET ACTUAL VARIANCE 2016
Revenues:Taxes:
Ad valorem 1,717,909$ 1,745,597$ 27,688$ 1,734,336$
MiscellaneousInvestment income 500 (75) (575) 7,749
Total Revenues 1,718,409 1,745,522 27,113 1,742,085
Expenditures:Debt service:
Principal 230,000 230,000 - 220,000 Interest 49,600 49,600 - 58,400 Fiscal charges 100 100 - 100
Total Expenditures 279,700 279,700 - 278,500
Excess (Deficiency) of Revenuesover Expenditures 1,438,709 1,465,822 27,113 1,463,585
Other Financing Sources (Uses):Transfers in (out):
Redevelopment Administration Fund (287,342) (287,342) - (278,891) Redevelopment Revolving Fund (1,193,387) (1,193,387) - (1,233,383)
Total Other FinancingSources (Uses) (1,480,729) (1,480,729) - (1,512,274)
Net Change in Fund Balances (42,020) (14,907) 27,113 (48,689)
Fund Balances, July 1 155,964 155,964 - 204,653
Fund Balances, June 30 113,944$ 141,057$ 27,113$ 155,964$
SCHEDULE OF REVENUES, EXPENDITURES,AND CHANGES IN FUND BALANCES - BUDGET AND ACTUAL
FOR THE YEAR ENDED JUNE 30, 2017
184

CAPITAL PROJECTS FUNDS
Capital Projects Funds are used to account for the acquisition and construction of major capital facilities other than those financed by Proprietary Funds.
Nonmajor Funds
Extraordinary Maintenance Fund - This Fund is used to account for expenditures in accordance with NRS 354.6105 for the extraordinary maintenance, repair, or improvement of capital projects or facilities that replace capital projects of the City. Residential Construction Fund - This Fund is used to account for the one percent tax on the valuation of each building permit issued or $1,000 per residential dwelling unit, whichever is less, to be used for the purpose of providing neighborhood parks and park facilities in accordance with Nevada Revised Statute 278.4983. Infrastructure Fund - This Fund accounts for one-eighth of one percent (.125) increase in Sales Taxes pursuant to Nevada Revised Statute 377B. Proceeds from this tax must be spent in accordance with the Plan set forth, which includes payment of principal and interest on notes, bonds or other securities issued to provide money for the cost of the capital projects, facilities, and activities described in the Plan. Redevelopment Revolving Fund - This Fund is used to account for construction projects of the Redevelopment Agency.
185

See accompanying notes. 126
CARSON CITY, NEVADACOMBINING BALANCE SHEET
NONMAJOR CAPITAL PROJECTS FUNDSFOR THE YEAR ENDED JUNE 30, 2017
EXTRAORDINARY RESIDENTIAL INFRASTRUCTURE REDEVELOPMENTMAINTENANCE CONSTRUCTION TAX REVOLVING TOTAL
ASSETSCash and investments: 114,595$ 321,519$ 2,836,766$ 680,343$ 3,953,223$ Due from other govenments - - 235,651 - 235,651
Total Assets 114,595$ 321,519$ 3,072,417$ 680,343$ 4,188,874$
LIABILITIESAccounts payable -$ 4,000$ 180,843$ -$ 184,843$
FUND BALANCESRestricted 114,595 317,519 2,891,574 680,343 4,004,031
Total Liabilitiesand Fund Balances 114,595$ 321,519$ 3,072,417$ 680,343$ 4,188,874$
186

See accompanying notes. 127
CARSON CITY, NEVADACOMBINING STATEMENT OF REVENUES, EXPENDITURES,
AND CHANGES IN FUND BALANCESNONMAJOR CAPITAL PROJECTS FUNDS
FOR THE YEAR ENDED JUNE 30, 2017
EXTRAORDINARY RESIDENTIAL INFRASTRUCTURE REDEVELOPMENT MAINTENANCE CONSTRUCTION TAX REVOLVING TOTAL
Revenues:Taxes -$ 172,000$ 1,283,794$ -$ 1,455,794$ Miscellaneous - 1,290 16,162 4,301 21,753
Total Revenues - 173,290 1,299,956 4,301 1,477,547
Expenditures:Current:
Health - - 4,656 - 4,656 Community support - - 2,140 400,454 402,594
Capital outlay:General Government 1,472 - - - 1,472 Health - - 699,051 - 699,051 Culture and recreation - 59,329 - - 59,329 Community support - - 3,994,336 254,375 4,248,711
Total Expenditures 1,472 59,329 4,700,183 654,829 5,415,813
Excess (Deficiency) of Revenuesover Expenditures (1,472) 113,961 (3,400,227) (650,528) (3,938,266)
Other Financing Sources (Uses):Transfers in 100,000 - 16,387 1,193,387 1,309,774 Transfers out - - (773,575) (480,000) (1,253,575)
Total Other FinancingSources (Uses) 100,000 - (757,188) 713,387 56,199
Net Change in Fund Balances 98,528 113,961 (4,157,415) 62,859 (3,882,067)
Fund Balances, July 1 16,067 203,558 7,048,989 617,484 7,886,098
Fund Balances, June 30 114,595$ 317,519$ 2,891,574$ 680,343$ 4,004,031$
187

See accompanying notes. 128
CARSON CITY, NEVADAEXTRAORDINARY MAINTENANCE FUND
(WITH COMPARATIVE ACTUAL AMOUNTS FOR THE YEAR ENDED JUNE 30, 2016)
FINALBUDGET ACTUAL VARIANCE 2016
Expenditures:General Government:
Services and supplies 11,067$ -$ 11,067$ 83,933$ Capital outlay 100,000 1,472 98,528 -
Total Expenditures 111,067 1,472 109,595 83,933
Excess (Deficiency) of Revenuesover Expenditures (111,067) (1,472) 109,595 (83,933)
Other Financing Sources (Uses):Transfers in (out):
General Fund 100,000 100,000 - 100,000
Net Change in Fund Balances (11,067) 98,528 109,595 16,067
Fund Balances, July 1 16,067 16,067 - -
Fund Balances, June 30 5,000$ 114,595$ 109,595$ 16,067$
SCHEDULE OF REVENUES, EXPENDITURES,AND CHANGES IN FUND BALANCES - BUDGET AND ACTUAL
FOR THE YEAR ENDED JUNE 30, 2017
188

See accompanying notes. 129
CARSON CITY, NEVADARESIDENTIAL CONSTRUCTION FUND
(WITH COMPARATIVE ACTUAL AMOUNTS FOR THE YEAR ENDED JUNE 30, 2016)
FINALBUDGET ACTUAL VARIANCE 2016
Revenues:Taxes:
Park residential construction tax 125,000$ 172,000$ 47,000$ 153,696$
Miscellaneous:Investment income 1,000 1,290 290 1,631
Total Revenues 126,000 173,290 47,290 155,327
Expenditures:Culture and recreation:
Parks:Services and supplies - - - 10,225
Capital outlay:Schulz Ranch - 49,000 (49,000) - Silver Oaks - - - 77,896 Ross Gold Park 212,545 4,103 208,442 2,246 Other projects 112,013 6,226 105,787 -
324,558 59,329 265,229 80,142
Total Expenditures 324,558 59,329 265,229 90,367
Excess (Deficiency) of Revenuesover Expenditures (198,558) 113,961 312,519 64,960
Fund Balances, July 1 203,558 203,558 - 138,598
Fund Balances, June 30 5,000$ 317,519$ 312,519$ 203,558$
SCHEDULE OF REVENUES, EXPENDITURES,AND CHANGES IN FUND BALANCES - BUDGET AND ACTUAL
FOR THE YEAR ENDED JUNE 30, 2017
189
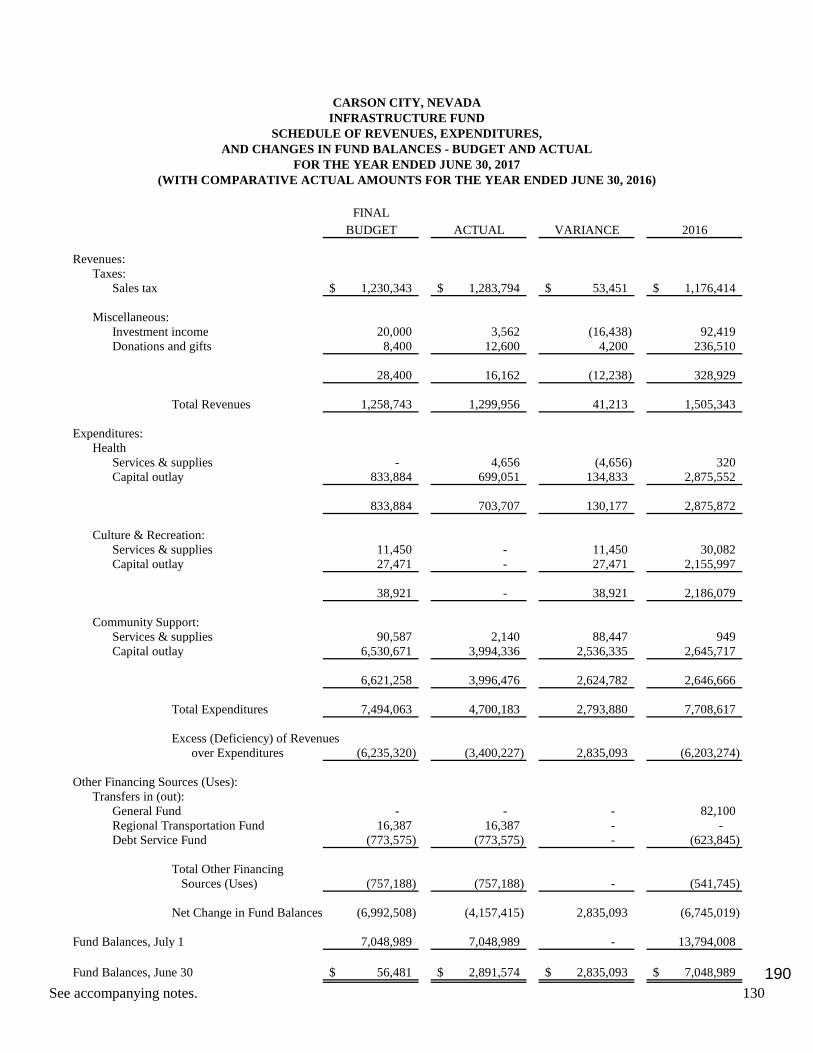
See accompanying notes. 130
CARSON CITY, NEVADAINFRASTRUCTURE FUND
SCHEDULE OF REVENUES, EXPENDITURES,AND CHANGES IN FUND BALANCES - BUDGET AND ACTUAL
FINALBUDGET ACTUAL VARIANCE 2016
Revenues:Taxes:
Sales tax 1,230,343$ 1,283,794$ 53,451$ 1,176,414$
Miscellaneous:Investment income 20,000 3,562 (16,438) 92,419 Donations and gifts 8,400 12,600 4,200 236,510
28,400 16,162 (12,238) 328,929
Total Revenues 1,258,743 1,299,956 41,213 1,505,343
Expenditures:Health
Services & supplies - 4,656 (4,656) 320 Capital outlay 833,884 699,051 134,833 2,875,552
833,884 703,707 130,177 2,875,872
Culture & Recreation:Services & supplies 11,450 - 11,450 30,082 Capital outlay 27,471 - 27,471 2,155,997
38,921 - 38,921 2,186,079
Community Support:Services & supplies 90,587 2,140 88,447 949 Capital outlay 6,530,671 3,994,336 2,536,335 2,645,717
6,621,258 3,996,476 2,624,782 2,646,666
Total Expenditures 7,494,063 4,700,183 2,793,880 7,708,617
Excess (Deficiency) of Revenuesover Expenditures (6,235,320) (3,400,227) 2,835,093 (6,203,274)
Other Financing Sources (Uses):Transfers in (out):
General Fund - - - 82,100 Regional Transportation Fund 16,387 16,387 - - Debt Service Fund (773,575) (773,575) - (623,845)
Total Other Financing Sources (Uses) (757,188) (757,188) - (541,745)
Net Change in Fund Balances (6,992,508) (4,157,415) 2,835,093 (6,745,019)
Fund Balances, July 1 7,048,989 7,048,989 - 13,794,008
Fund Balances, June 30 56,481$ 2,891,574$ 2,835,093$ 7,048,989$
(WITH COMPARATIVE ACTUAL AMOUNTS FOR THE YEAR ENDED JUNE 30, 2016)FOR THE YEAR ENDED JUNE 30, 2017
190
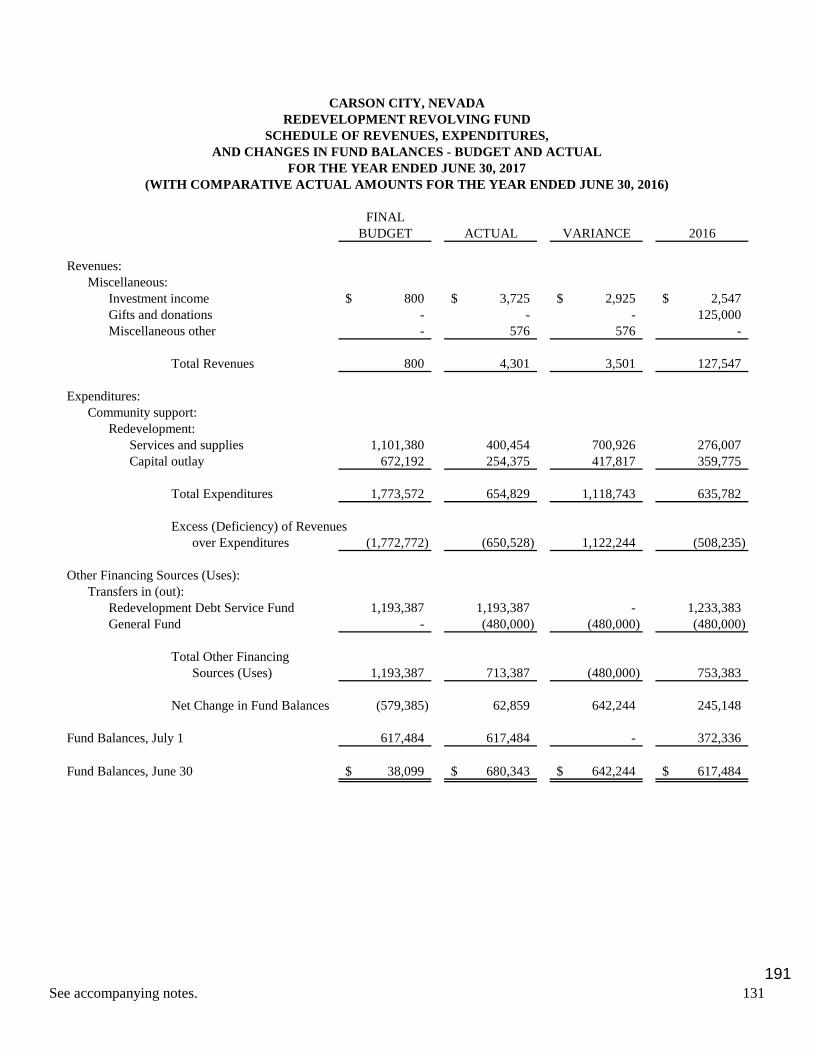
See accompanying notes. 131
CARSON CITY, NEVADAREDEVELOPMENT REVOLVING FUND
(WITH COMPARATIVE ACTUAL AMOUNTS FOR THE YEAR ENDED JUNE 30, 2016)
FINALBUDGET ACTUAL VARIANCE 2016
Revenues:Miscellaneous:
Investment income 800$ 3,725$ 2,925$ 2,547$ Gifts and donations - - - 125,000 Miscellaneous other - 576 576 -
Total Revenues 800 4,301 3,501 127,547
Expenditures:Community support:
Redevelopment:Services and supplies 1,101,380 400,454 700,926 276,007 Capital outlay 672,192 254,375 417,817 359,775
Total Expenditures 1,773,572 654,829 1,118,743 635,782
Excess (Deficiency) of Revenuesover Expenditures (1,772,772) (650,528) 1,122,244 (508,235)
Other Financing Sources (Uses):Transfers in (out):
Redevelopment Debt Service Fund 1,193,387 1,193,387 - 1,233,383 General Fund - (480,000) (480,000) (480,000)
Total Other FinancingSources (Uses) 1,193,387 713,387 (480,000) 753,383
Net Change in Fund Balances (579,385) 62,859 642,244 245,148
Fund Balances, July 1 617,484 617,484 - 372,336
Fund Balances, June 30 38,099$ 680,343$ 642,244$ 617,484$
SCHEDULE OF REVENUES, EXPENDITURES,AND CHANGES IN FUND BALANCES - BUDGET AND ACTUAL
FOR THE YEAR ENDED JUNE 30, 2017
191

This page intentionally left blank.
192

ENTERPRISE FUNDS
Enterprise Funds are used to account for operations that are financed and operated in a manner similar to private business enterprises──where the intent of the government's board is that the costs of providing goods and services to the general public on a continuing basis be financed or recovered primarily through user charges; or where the government's board has decided that periodic determination of net income is appropriate for accountability purposes.
Major Funds
Sewer Fund - This Fund is used to account for the revenues and expenses of sewer services provided to the residents of Carson City. Water Fund - This Fund is used to account for the revenues and expenses of water services provided to the residents of Carson City.
Nonmajor Funds
Ambulance Fund - This Fund is used to account for the operations of the ambulance service provided by the Carson City Fire Department. Stormwater Drainage Fund - This Fund is used to account for the revenues and expenses of the stormwater management program. Cemetery Fund - This Fund is used to account for the costs of providing interment services and perpetual care of the City's cemetery. Building Permits Fund - This Fund is used to account for the revenues and expenses of the Building Permit Program.
193

See accompanying notes. 132
CARSON CITY, NEVADASEWER FUND
SCHEDULE OF REVENUES, EXPENSES,AND CHANGES IN NET POSITION - BUDGET AND ACTUAL
FOR THE YEAR ENDED JUNE 30, 2017(WITH COMPARATIVE ACTUAL AMOUNTS FOR THE YEAR ENDED JUNE 30, 2016)
FINAL BUDGET ACTUAL VARIANCE 2016
Operating Revenues:Charges for services:
User fees and charges 12,809,680$ 12,996,501$ 186,821$ 11,426,700$
Operating Expenses:Salaries and wages 1,591,696 1,491,839 99,857 1,527,606 Employee benefits 777,838 782,452 (4,614) 647,304 Services and supplies 3,952,205 3,508,870 443,335 3,255,356 Depreciation 3,500,000 3,385,557 114,443 3,311,678
Total Operating Expenses 9,821,739 9,168,718 653,021 8,741,944
Operating Income (Loss) 2,987,941 3,827,783 839,842 2,684,756
Nonoperating Revenues (Expenses):Investment income 2,500 29,684 27,184 73,440 Miscellaneous 17,000 23,138 6,138 21,669 Interest expense (1,173,505) (1,002,575) 170,930 (627,293) Federal interest subsidy 1,550 1,508 (42) 1,617 Gain (loss) on sales of
capital assets - 4,085 4,085 (19,616) Bond issuance costs - (1,402) (1,402) (179,194)
Total Nonoperating Revenues(Expenses) (1,152,455) (945,562) 206,893 (729,377)
Income (Loss) Before Transfers and Contributions 1,835,486 2,882,221 1,046,735 1,955,379
Capital Contributions:Capital assets - - - 7,885 Developers - 41,974 41,974 61,155 Connection fees 40,000 244,160 204,160 60,408
Total Capital Contributions 40,000 286,134 246,134 129,448
Change in Net Position 1,875,486$ 3,168,355 1,292,869$ 2,084,827
Net Position, July 1 52,183,689 50,098,862
Net Position, June 30 55,352,044$ 52,183,689$
194

See accompanying notes. 133
CARSON CITY, NEVADASEWER FUND
SCHEDULE OF CASH FLOWS - BUDGET AND ACTUALFOR THE YEAR ENDED JUNE 30, 2017
(WITH COMPARATIVE ACTUAL AMOUNTS FOR THE YEAR ENDED JUNE 30, 2016)(PAGE 1 OF 2)
FINALBUDGET ACTUAL VARIANCE 2016
CASH FLOWS FROM OPERATING ACTIVITIESCash received for services 12,809,680$ 13,008,697$ 199,017$ 11,359,349$ Cash payments for personnel costs (2,249,150) (2,314,441) (65,291) (2,083,334) Cash payments for services and supplies (3,952,205) (3,202,442) 749,763 (2,938,240) Miscellaneous cash received 17,000 23,138 6,138 -
Net Cash Provided (Used) byOperating Activities 6,625,325 7,514,952 889,627 6,337,775
CASH FLOWS FROM CAPITAL AND RELATEDFINANCING ACTIVITIES
Proceeds from capital debt 27,895,076 25,075,445 (2,819,631) 10,180,882 Connection fees 40,000 244,160 204,160 60,408 Acquisition of capital assets (37,135,076) (24,437,754) 12,697,322 (10,175,617) Principal paid on capital debt (2,127,152) (1,614,719) 512,433 (1,854,234) Interest paid on capital debt (1,173,505) (732,338) 441,167 (179,593) Bond issuance costs - (1,402) (1,402) (179,194) Federal interest subsidy 1,550 1,508 (42) 1,617
Net Cash Provided (Used) by Capitaland Related Financing Activities (12,499,107) (1,465,100) 11,034,007 (2,145,731)
CASH FLOWS FROM INVESTING ACTIVITIESInvestment income 2,500 29,684 27,184 73,440
Net Increase (Decrease) in Cashand Cash Equivalents (5,871,282) 6,079,536 11,950,818 4,265,484
Cash and Cash Equivalents, July 1 6,694,016 6,694,016 - 2,428,532
Cash and Cash Equivalents, June 30 822,734$ 12,773,552$ 11,950,818$ 6,694,016$
195

See accompanying notes. 134
CARSON CITY, NEVADASEWER FUND
SCHEDULE OF CASH FLOWS - BUDGET AND ACTUALFOR THE YEAR ENDED JUNE 30, 2017
(WITH COMPARATIVE ACTUAL AMOUNTS FOR THE YEAR ENDED JUNE 30, 2016)(PAGE 2 OF 2)
FINALBUDGET ACTUAL VARIANCE 2016
RECONCILIATION OF OPERATING INCOME (LOSS) TO NET CASH PROVIDED (USED) BY OPERATING ACTIVITIES:Operating income (loss) 2,987,941$ 3,827,783$ 839,842$ 2,684,756$
Adjustments to reconcile operating income(loss) to net cash provided (used) byoperating activities:
Depreciation and amortization expense 3,500,000 3,385,557 (114,443) 3,311,678 Nonoperating revenues 17,000 23,138 6,138 21,669 Changes in assets and liabilities:
(Increase) decrease in:Accounts receivable - 12,445 12,445 (88,680) Due from other governments - (21,647) (21,647) (16,705) Prepaid items - (1,174) (1,174) (27,986) Retirement deferred outflows - (258,760) (258,760) (48,688)
Increase (decrease) in:Accounts payable - 329,422 329,422 361,634 Accrued salaries and benefits - (64,386) (64,386) (10,630) Due to other governments - (173) (173) 173 Unearned revenue - (23) (23) (40) Connection deposits - (226) (226) (300) Accrued compensated absences - (114,249) (114,249) 52,695 Net OPEB obligation 120,384 132,441 12,057 109,440 Net retirement obligation - 320,273 320,273 188,647 Retirement deferred inflows - (55,469) (55,469) (199,888)
Total Adjustments 3,637,384 3,687,169 49,785 3,653,019
Net Cash Provided (Used) byOperating Activities 6,625,325$ 7,514,952$ 889,627$ 6,337,775$
NONCASH INVESTING, CAPITAL ANDFINANCING ACTIVITIES:
Purchase of capital assets on account 151,403$ 3,134,896$ Retainage payable on construction of
capital assets 763,314 172,348 Refunding amounts paid to escrow - 245,000 Contributed capital assets 41,974 69,040
196

See accompanying notes. 135
CARSON CITY, NEVADAWATER FUND
SCHEDULE OF REVENUES, EXPENSES,AND CHANGES IN NET POSITION - BUDGET AND ACTUAL
FOR THE YEAR ENDED JUNE 30, 2017(WITH COMPARATIVE ACTUAL AMOUNTS FOR THE YEAR ENDED JUNE 30, 2016)
FINALBUDGET ACTUAL VARIANCE 2016
Operating Revenues:Charges for services:
User fees and charges 14,205,732$ 14,715,096$ 509,364$ 13,506,051$ Other charges 306,800 337,919 31,119 323,814
Total Operating Revenues 14,512,532 15,053,015 540,483 13,829,865
Operating Expenses:Salaries and wages 1,755,576 1,559,356 196,220 1,591,756 Employee benefits 955,793 934,593 21,200 809,054 Services and supplies 5,754,157 5,453,566 300,591 5,873,005 Depreciation and
amortization 3,500,000 3,331,454 168,546 3,319,902
Total Operating Expenses 11,965,526 11,278,969 686,557 11,593,717
Operating Income (Loss) 2,547,006 3,774,046 1,227,040 2,236,148
Nonoperating Revenues (Expenses):Investment income 15,000 17,742 2,742 18,698 Miscellaneous 5,000 1,582 (3,418) 6,385 Interest expense (2,060,970) (2,047,931) 13,039 (2,076,556) Federal interest subsidy 217,420 224,329 6,909 224,721 Gain (loss) on sales of
capital assets - (98,004) (98,004) 25,399 Bond issuance costs (152,000) (1,331) 150,669 (1,581)
Total Nonoperating Revenues(Expenses) (1,975,550) (1,903,613) 71,937 (1,802,934)
Income (Loss) Before Contributionsand Transfers 571,456 1,870,433 1,298,977 433,214
Capital Contributions:Capital assets - 4,161 4,161 4,145 Capital grants - 125,000 125,000 125,000 Developers - 75,648 75,648 265,244 Connection fees 26,035 185,015 158,980 46,034
Total Capital Contributions 26,035 389,824 363,789 440,423
Change in Net Position 597,491$ 2,260,257 1,662,766$ 873,637
Net Position, July 1 41,551,819 40,678,182
Net Position, June 30 43,812,076$ 41,551,819$
197

See accompanying notes. 136
CARSON CITY, NEVADAWATER FUND
SCHEDULE OF CASH FLOWS - BUDGET AND ACTUALFOR THE YEAR ENDED JUNE 30, 2017
(WITH COMPARATIVE ACTUAL AMOUNTS FOR THE YEAR ENDED JUNE 30, 2016)(PAGE 1 OF 2)
FINALBUDGET ACTUAL VARIANCE 2016
CASH FLOWS FROM OPERATING ACTIVITIESCash received for services 14,512,532$ 14,972,082$ 459,550$ 14,061,625$ Cash payments for personnel costs (2,547,729) (2,383,873) 163,856 (2,317,798) Cash payments for services and supplies (5,754,157) (5,824,882) (70,725) (5,629,106) Miscellaneous cash received 5,000 1,582 (3,418) 6,385
Net Cash Provided (Used) byOperating Activities 6,215,646 6,764,909 549,263 6,121,106
CASH FLOWS FROM CAPITAL AND RELATEDFINANCING ACTIVITIES
Proceeds from capital debt 5,000,000 831,455 (4,168,545) 3,292,189 Connection fees 26,035 185,015 158,980 46,034 Acquisition of capital assets (3,587,000) (1,088,285) 2,498,715 (4,293,571) Principal paid on capital debt (3,344,672) (3,229,806) 114,866 (3,093,545) Interest paid on capital debt (2,060,970) (2,089,288) (28,318) (2,113,535) Bond issuance costs (152,000) (1,331) 150,669 (1,581) Federal interest subsidy 217,420 224,329 6,909 224,721 Subsidy from grant - 125,000 125,000 125,000
Net Cash Provided (Used) by Capitaland Related Financing Activitie (3,901,187) (5,042,911) (1,141,724) (5,814,288)
CASH FLOWS FROM INVESTING ACTIVITIESInvestment income 15,000 17,742 2,742 18,698
Net Increase (Decrease) in Cashand Cash Equivalents 2,329,459 1,739,740 (589,719) 325,516
Cash and Cash Equivalents, July 1 2,439,682 2,439,682 - 2,114,166
Cash and Cash Equivalents, June 30 4,769,141$ 4,179,422$ (589,719)$ 2,439,682$
198

See accompanying notes. 137
CARSON CITY, NEVADAWATER FUND
SCHEDULE OF CASH FLOWS - BUDGET AND ACTUALFOR THE YEAR ENDED JUNE 30, 2017
(WITH COMPARATIVE ACTUAL AMOUNTS FOR THE YEAR ENDED JUNE 30, 2016)(PAGE 2 OF 2)
FINALBUDGET ACTUAL VARIANCE 2016
RECONCILIATION OF OPERATING INCOME (LOSS)TO NET CASH PROVIDED (USED) BY OPERATING ACTIVITIES:Operating income (loss) 2,547,006$ 3,774,046$ 1,227,040$ 2,236,148$
Adjustments to reconcile operating income(loss) to net cash provided (used) byoperating activities:
Depreciation and amortization expense 3,500,000 3,331,454 (168,546) 3,319,902 Nonoperating revenues 5,000 1,582 (3,418) 6,385 Changes in assets and liabilities:
(Increase) decrease in:Accounts receivable - 115,892 115,892 25,786 Due from other governments - 496 496 1,991 Inventories - (937) (937) (33,090) Prepaid items - 12,949 12,949 (14,712) Retirement deferred outflows - (284,269) (284,269) (42,848)
Increase (decrease) in:Accounts payable - (142,132) (142,132) (104,379) Accrued salaries and benefits - (64,673) (64,673) (17,486) Due to other governments - (241,692) (241,692) 394,089 Unearned revenue - (201,551) (201,551) 201,275 Connection deposits - 4,726 4,726 4,699 Accrued compensated absences - (8,935) (8,935) 8,099 Net OPEB obligation 163,640 164,422 782 148,764 Net retirement obligation - 380,381 380,381 254,379 Retirement deferred inflows - (76,850) (76,850) (267,896)
Total Adjustments 3,668,640 2,990,863 (677,777) 3,884,958
Net Cash Provided (Used) byOperating Activities 6,215,646$ 6,764,909$ 549,263$ 6,121,106$
NONCASH INVESTING, CAPITAL ANDFINANCING ACTIVITIES:
Purchase of capital assets on account 50,793$ 575,882$ Retainage payable on construction of
capital assets 2,515 4,988 Contributed capital assets 79,809 269,389
199

See accompanying notes. 138
CARSON CITY, NEVADACOMBINING STATEMENT OF NET POSITION
NONMAJOR ENTERPRISE FUNDSFOR THE YEAR ENDED JUNE 30, 2017
STORMWATER BUILDINGAMBULANCE DRAINAGE CEMETERY PERMITS TOTAL
ASSETSCurrent assets:
Cash and investments 803,349$ 364,430$ 203,732$ 566,631$ 1,938,142$ Receivables:
Accounts and contracts, net 1,313,834 118,759 - - 1,432,593 Inventories - - 13,508 - 13,508 Prepaid items 193 156 - - 349
Total Current Assets 2,117,376 483,345 217,240 566,631 3,384,592
Capital assets:Land - 1,594,781 293,449 - 1,888,230 Buildings - 235,212 354,931 - 590,143 Improvements other than buildings - 8,120,572 173,211 - 8,293,783 Machinery and equipment 764,219 1,395,240 127,649 - 2,287,108 Construction in progress 37,104 198,283 - - 235,387
801,323 11,544,088 949,240 - 13,294,651 Less: Accumulated depreciation (564,074) (2,258,824) (311,404) - (3,134,302)
Net Capital Assets 237,249 9,285,264 637,836 - 10,160,349
Total Noncurrent Assets 237,249 9,285,264 637,836 - 10,160,349
Total Assets 2,354,625 9,768,609 855,076 566,631 13,544,941
Deferred Outflows of ResourcesDeferred retirement contributions 532,183 23,057 17,012 18,315 590,567 Deferred actuarial adjustment to contributions 28,168 1,196 897 957 31,218 Deferred earnings on retirement investments 413,588 17,562 13,172 14,050 458,372 Deferred loss on refundings - 98,215 - - 98,215
Total Deferred Outflows of Resources 973,939 140,030 31,081 33,322 1,178,372
Total Assets and Deferred Outflowsof Resources 3,328,564 9,908,639 886,157 599,953 14,723,313
LIABILITIES:Current liabilities:
Accounts payable 56,732 8,284 6,168 99,994 171,178 Accrued salaries and benefits 55,170 5,024 1,738 2,288 64,220 Accrued interest - 21,533 - - 21,533 Due to other governments 35 - - - 35 Unearned revenue - - 260,410 - 260,410 Current portion:
Accrued compensated absences 49,076 978 7,993 8,060 66,107 General obligation bonds and notes
payable - 497,522 - - 497,522
Total Current Liabilities 161,013 533,341 276,309 110,342 1,081,005
Noncurrent liabilities: Accrued compensated absences, net of
current portion 181,936 27,726 - 7,581 217,243 Net OPEB obligation 1,349,909 90,752 96,699 105,714 1,643,074 Net retirement obligation 4,663,424 216,470 197,005 188,466 5,265,365 General obligation bonds and notes payable - 3,787,716 - - 3,787,716
Total Noncurrent Liabilities 6,195,269 4,122,664 293,704 301,761 10,913,398
Total Liabilities 6,356,282 4,656,005 570,013 412,103 11,994,403
Deferred inflows of resources:Deferred change in retirement experience 297,915 12,650 9,488 10,120 330,173 Deferred change in retirement contributions 82,305 3,495 2,621 2,796 91,217
Total Deferred Inflows of Resources 380,220 16,145 12,109 12,916 421,390
Total Liabilities and Deferred Inflowsof Resources 6,736,502 4,672,150 582,122 425,019 12,415,793
NET POSITIONNet investment in capital assets 237,249 4,994,626 637,836 - 5,869,711 Unrestricted (3,645,187) 241,863 (333,801) 174,934 (3,562,191)
Total Net Position (3,407,938)$ 5,236,489$ 304,035$ 174,934$ 2,307,520$ 200

See accompanying notes. 139
CARSON CITY, NEVADACOMBINING STATEMENT OF REVENUES, EXPENSES,
AND CHANGES IN NET POSITIONNONMAJOR ENTERPRISE FUNDS
FOR THE YEAR ENDED JUNE 30, 2017
STORMWATER BUILDINGAMBULANCE DRAINAGE CEMETERY PERMITS TOTAL
Operating Revenues:Charges for services 3,314,887$ 1,361,322$ 147,138$ 1,240,249$ 6,063,596$
Operating Expenses:Salaries and wages 1,537,779 45,118 104,895 28,305 1,716,097 Employee benefits 1,093,582 70,169 59,065 36,358 1,259,174 Services and supplies 847,780 443,349 46,626 1,040,681 2,378,436 Depreciation 46,432 321,472 12,892 - 380,796
Total Operating Expenses 3,525,573 880,108 223,478 1,105,344 5,734,503
Operating Income (Loss) (210,686) 481,214 (76,340) 134,905 329,093
Nonoperating Revenues (Expenses):Investment income 2,689 1,200 755 2,251 6,895 Miscellaneous 825 1,194 5,377 - 7,396 Interest expense - (128,528) - - (128,528)
Total Nonoperating Revenues (Expenses) 3,514 (126,134) 6,132 2,251 (114,237)
Income (Loss) Before CapitalContributions and Transfers (207,172) 355,080 (70,208) 137,156 214,856
Capital Contributions:Capital assets - 157,214 - - 157,214
Transfers:Transfers In 350,000 - 90,000 - 440,000 Transfers Out (31,020) - - - (31,020)
Total Transfers 318,980 - 90,000 - 408,980
Change in Net Position 111,808 512,294 19,792 137,156 781,050
Net Position, July 1 (3,519,746) 4,724,195 284,243 37,778 1,526,470
Net Position, June 30 (3,407,938)$ 5,236,489$ 304,035$ 174,934$ 2,307,520$
201

See accompanying notes. 140
CARSON CITY, NEVADACOMBINING STATEMENT OF CASH FLOWS
NONMAJOR ENTERPRISE FUNDSFOR THE YEAR ENDED JUNE 30, 2017
(PAGE 1 OF 2)
STORMWATER BUILDINGAMBULANCE DRAINAGE CEMETERY PERMITS TOTAL
CASH FLOWS FROM OPERATING ACTIVITIESCash received for services 3,185,122$ 1,359,864$ 123,277$ 1,240,249$ 5,908,512$ Cash payments for personnel costs (2,473,132) (171,767) (188,707) (98,043) (2,931,649) Cash payments for services and supplies (895,614) (446,581) (38,928) (1,034,710) (2,415,833) Miscellaneous cash received 825 1,194 5,377 - 7,396
Net Cash Provided (Used) byOperating Activities (182,799) 742,710 (98,981) 107,496 568,426
CASH FLOWS FROM NONCAPITAL FINANCINGACTIVITIES
Transfer from other funds 350,000 - 90,000 - 440,000 Transfer to other funds (31,020) - - - (31,020)
Net Cash Provided (Used) byNoncapital Financing Activities 318,980 - 90,000 - 408,980
CASH FLOWS FROM CAPITAL AND RELATEDFINANCING ACTIVITIES
Proceeds from capital debt - 305,456 - - 305,456 Acquisition of capital assets (205,606) (189,671) - - (395,277) Principal paid on capital debt - (443,001) - - (443,001) Interest paid on capital debt - (108,555) - - (108,555)
Net Cash Provided (Used) by Capitaland Related Financing Activities (205,606) (435,771) - - (641,377)
CASH FLOWS FROM INVESTING ACTIVITIESInvestment income 2,689 1,200 755 2,251 6,895
Net Increase (Decrease) in Cashand Cash Equivalents (66,736) 308,139 (8,226) 109,747 342,924
Cash and Cash Equivalents, July 1 870,085 56,291 211,958 456,884 1,595,218
Cash and Cash Equivalents, June 30 803,349$ 364,430$ 203,732$ 566,631$ 1,938,142$
202

See accompanying notes. 141
CARSON CITY, NEVADACOMBINING STATEMENT OF CASH FLOWS
NONMAJOR ENTERPRISE FUNDSFOR THE YEAR ENDED JUNE 30, 2017
(PAGE 2 OF 2)
STORMWATER BUILDINGAMBULANCE DRAINAGE CEMETERY PERMITS TOTAL
RECONCILIATION OF OPERATING INCOME(LOSS) TO NET CASH PROVIDED (USED)BY OPERATING ACTIVITIES:
Operating income (loss) (210,686)$ 481,214$ (76,340)$ 134,905$ 329,093$
Adjustments to reconcile operating income(loss) to net cash provided (used) byoperating activities:
Depreciation and amortization expense 46,432 321,472 12,892 - 380,796 Nonoperating revenues 825 1,194 5,377 - 7,396 Changes in assets and liabilities:
(Increase) decrease in:Accounts receivable (129,765) 14,776 - - (114,989) Inventories - - 2,376 - 2,376 Prepaid items 534 1,928 - - 2,462 Retirement deferred outflows (412,194) (13,259) (5,786) (14,366) (445,605)
Increase (decrease) in:Accounts payable (48,403) (3,398) 5,322 5,971 (40,508) Accrued salaries and benefits (76,654) (6,008) (6,942) (3,170) (92,774) Due to other governments 35 (1,762) - - (1,727) Unearned revenue - (16,234) (23,861) - (40,095) Accrued compensated absences 9,416 (69,397) (40,148) (37,106) (137,235) Net OPEB obligation 184,649 13,229 14,131 5,862 217,871 Net retirement obligation 580,180 28,446 24,321 19,575 652,522 Retirement deferred inflows (127,168) (9,491) (10,323) (4,175) (151,157)
Total Adjustments 27,887 261,496 (22,641) (27,409) 239,333
Net Cash Provided (Used) byOperating Activities (182,799)$ 742,710$ (98,981)$ 107,496$ 568,426$
NONCASH INVESTING, CAPITAL AND FINANCING ACTIVITIES:
Purchase of capital assets on account -$ 5,400$ -$ -$ 5,400$ Contributed capital assets - 157,214 - - 157,214
203

See accompanying notes. 142
CARSON CITY, NEVADAAMBULANCE FUND
SCHEDULE OF REVENUES, EXPENSES,AND CHANGES IN NET POSITION - BUDGET AND ACTUAL
FOR THE YEAR ENDED JUNE 30, 2017(WITH COMPARATIVE ACTUAL AMOUNTS FOR THE YEAR ENDED JUNE 30, 2016)
FINAL BUDGET ACTUAL VARIANCE 2016
Operating Revenues:Charges for services 3,029,849$ 3,314,887$ 285,038$ 3,205,144$
Operating Expenses:Salaries and wages 1,560,507 1,537,779 22,728 1,557,975 Employee benefits 1,082,868 1,093,582 (10,714) 917,245 Services and supplies 943,489 847,780 95,709 897,090 Depreciation 35,000 46,432 (11,432) 32,390
Total Operating Expenses 3,621,864 3,525,573 96,291 3,404,700
Operating Income (Loss) (592,015) (210,686) 381,329 (199,556)
Nonoperating Revenues (Expenses):Investment income 500 2,689 2,189 5,087 Miscellaneous - 825 825 - Gain (loss) on disposal of capital
assets - - - (9,159)
Total Nonoperating Revenues(Expenses) 500 3,514 3,014 (4,072)
Income (Loss) Before Transfers (591,515) (207,172) 384,343 (203,628)
Capital Contributions:Capital grants - - - 46,451
Tranfers in (out):General Fund 350,000 350,000 - 300,000 Fleet Management Fund (31,020) (31,020) - (31,020)
Total Transfers 318,980 318,980 - 268,980
Change in Net Position (272,535)$ 111,808 384,343$ 111,803
Net Position, July 1 (3,519,746) (3,631,549)
Net Position, June 30 (3,407,938)$ (3,519,746)$
204

See accompanying notes. 143
CARSON CITY, NEVADAAMBULANCE FUND
SCHEDULE OF CASH FLOWS - BUDGET AND ACTUALFOR THE YEAR ENDED JUNE 30, 2017
(WITH COMPARATIVE ACTUAL AMOUNTS FOR THE YEAR ENDED JUNE 30, 2016)
FINALBUDGET ACTUAL VARIANCE 2016
CASH FLOWS FROM OPERATING ACTIVITIESCash received for services 3,029,849$ 3,185,122$ 155,273$ 3,171,183$ Cash payments for personnel costs (2,534,775) (2,473,132) 61,643 (2,418,019) Cash payments for services and supplies (943,489) (895,614) 47,875 (847,709) Miscellaneous cash received - 825 825 -
Net Cash Provided (Used) byOperating Activities (448,415) (182,799) 265,616 (94,545)
CASH FLOWS FROM NONCAPITAL FINANCING ACTIVITIES
Transfer from other funds 350,000 350,000 - 300,000 Transfer to other funds (31,020) (31,020) - (31,020)
Net Cash Provided (Used) by NoncapitalFinancing Activities 318,980 318,980 - 268,980
CASH FLOWS FROM CAPITAL AND RELATEDFINANCING ACTIVITIES
Acquisition of capital assets - (205,606) (205,606) - Subsidy from grant - - - 46,451
Net Cash Provided (Used) by Capitaland Related Financing Activities - (205,606) (205,606) 46,451
CASH FLOWS FROM INVESTING ACTIVITIESInvestment income 500 2,689 2,189 5,087
Net Increase (Decrease) in Cashand Cash Equivalents (128,935) (66,736) 62,199 225,973
Cash and Cash Equivalents, July 1 870,085 870,085 - 644,112
Cash and Cash Equivalents, June 30 741,150$ 803,349$ 62,199$ 870,085$
RECONCILIATION OF OPERATING INCOME (LOSS) TO NET CASH PROVIDED (USED)BY OPERATING ACTIVITIES:Operating income (loss) (592,015)$ (210,686)$ 381,329$ (199,556)$
Adjustments to reconcile operating income(loss) to net cash provided (used) byoperating activities:
Depreciation and amortization expense 35,000 46,432 11,432 32,390 Nonoperating revenues - 825 825 - Changes in assets and liabilities:
(Increase) decrease in:Accounts receivable - (129,765) (129,765) (33,961) Prepaid items - 534 534 (727) Retirement deferred outflows - (412,194) (412,194) (50,875)
Increase (decrease) in:Accounts payable - (48,403) (48,403) 51,128 Accrued salaries and benefits - (76,654) (76,654) 26,192 Due to other governments - 35 35 (1,020) Accrued compensated absences - 9,416 9,416 (5,943) Net OPEB obligation 108,600 184,649 76,049 108,600 Net retirement obligation - 580,180 580,180 417,278 Retirement deferred inflows - (127,168) (127,168) (438,051)
Total Adjustments 143,600 27,887 (115,713) 105,011
Net Cash Provided (Used) byOperating Activities (448,415)$ (182,799)$ 265,616$ (94,545)$ 205

See accompanying notes. 144
CARSON CITY, NEVADASTORMWATER DRAINAGE FUND
SCHEDULE OF REVENUES, EXPENSES,AND CHANGES IN NET POSITION - BUDGET AND ACTUAL
FOR THE YEAR ENDED JUNE 30, 2017(WITH COMPARATIVE ACTUAL AMOUNTS FOR THE YEAR ENDED JUNE 30, 2016)
FINAL BUDGET ACTUAL VARIANCE 2016
Operating Revenues:Charges for services:
User fees and charges 1,393,881$ 1,361,322$ (32,559)$ 1,391,102$
Operating Expenses:Salaries and wages 145,495 45,118 100,377 138,697 Employee benefits 73,562 70,169 3,393 61,911 Services and supplies 461,631 443,349 18,282 490,632 Depreciation 282,000 321,472 (39,472) 287,059
Total Operating Expenses 962,688 880,108 82,580 978,299
Operating Income 431,193 481,214 50,021 412,803
Nonoperating Revenues (Expenses):Investment income 500 1,200 700 2,797 Miscellaneous income - 1,194 1,194 - Interest expense (142,389) (128,528) 13,861 (125,656) Gain (loss) on sales of capital assets - - - (56,828) Bond issuance costs - - - (250)
Total Nonoperating Revenues(Expenses) (141,889) (126,134) 15,755 (179,937)
Income (Loss) Before Contributionsand Transfers 289,304 355,080 65,776 232,866
Capital Contributions:Capital assets - 157,214 157,214 21,516 Developers - - - 112,140
Total Capital Contributions - 157,214 157,214 133,656
Change in Net Position 289,304$ 512,294 222,990$ 366,522
Net Position, July 1 4,724,195 4,357,673
Net Position, June 30 5,236,489$ 4,724,195$
206

See accompanying notes. 145
CARSON CITY, NEVADASTORMWATER DRAINAGE FUND
SCHEDULE OF CASH FLOWS - BUDGET AND ACTUAL
(WITH COMPARATIVE ACTUAL AMOUNTS FOR THE YEAR ENDED JUNE 30, 2016)(PAGE 1 OF 2)
FINALBUDGET ACTUAL VARIANCE 2016
CASH FLOWS FROM OPERATING ACTIVITIESCash received for services 1,393,881$ 1,359,864$ (34,017)$ 1,410,157$ Cash payments for personnel costs (208,235) (171,767) 36,468 (185,101) Cash payments for services and supplies (461,631) (446,581) 15,050 (487,318) Miscellaneous cash received - 1,194 1,194 -
Net Cash Provided (Used) byOperating Activities 724,015 742,710 18,695 737,738
CASH FLOWS FROM CAPITAL AND RELATEDFINANCING ACTIVITIES
Proceeds from capital debt 1,212,377 305,456 (906,921) 280,842 Acquisition of capital assets (1,191,965) (189,671) 1,002,294 (516,534) Principal paid on capital debt (485,142) (443,001) 42,141 (427,900) Interest paid on capital debt (142,389) (108,555) 33,834 (108,657) Bond issuance costs - - - (250) Subsidy from grant - - - -
Net Cash Provided (Used) by Capitaland Related Financing Activities (607,119) (435,771) 171,348 (772,499)
CASH FLOWS FROM INVESTING ACTIVITIESInvestment income 500 1,200 700 2,797
Net Increase (Decrease) in Cashand Cash Equivalents 117,396 308,139 190,743 (31,964)
Cash and Cash Equivalents, July 1 56,291 56,291 - 88,255
Cash and Cash Equivalents, June 30 173,687$ 364,430$ 190,743$ 56,291$
FOR THE YEAR ENDED JUNE 30, 2017
207

See accompanying notes. 146
CARSON CITY, NEVADASTORMWATER DRAINAGE FUND
SCHEDULE OF CASH FLOWS - BUDGET AND ACTUALFOR THE YEAR ENDED JUNE 30, 2017
(WITH COMPARATIVE ACTUAL AMOUNTS FOR THE YEAR ENDED JUNE 30, 2016)
FINAL BUDGET ACTUAL VARIANCE 2016
RECONCILIATION OF OPERATING INCOME (LOSS) TO NET CASH PROVIDED (USED) BY OPERATINGACTIVITIES:Operating income (loss) 431,193$ 481,214$ 50,021$ 412,803$
Adjustments to reconcile operating income (loss)to net cash provided (used) by operatingactivities:
Depreciation and amortization expense 282,000 321,472 39,472 287,059 Nonoperating revenues - 1,194 1,194 - Changes in assets and liabilities:
(Increase) decrease in:Accounts receivable - 14,776 14,776 2,821 Prepaid items - 1,928 1,928 (1,684) Retirement deferred outflows - (13,259) (13,259) (4,614)
Increase (decrease) in:Accounts payable - (3,398) (3,398) 3,286 Accrued salaries and benefits - (6,008) (6,008) 2,315 Due to other governments - (1,762) (1,762) 1,712 Unearned revenue - (16,234) (16,234) 16,234 Accrued compensated absences - (69,397) (69,397) 9,009 Net OPEB obligation 10,822 13,229 2,407 9,838 Net retirement obligation - 28,446 28,446 17,341 Retirement deferred inflows - (9,491) (9,491) (18,382)
Total Adjustments 292,822 261,496 (31,326) 324,935
Net Cash Provided (Used) byOperating Activities 724,015$ 742,710$ 18,695$ 737,738$
NONCASH INVESTING, CAPITAL ANDFINANCING ACTIVITIES:
Purchase of capital assets on account 5,400$ 6,476$ Contributed capital assets 157,214 133,656
(PAGE 2 OF 2)
208

See accompanying notes. 147
CARSON CITY, NEVADACEMETERY FUND
SCHEDULE OF REVENUES, EXPENSES,AND CHANGES IN NET POSITION - BUDGET AND ACTUAL
FOR THE YEAR ENDED JUNE 30, 2017(WITH COMPARATIVE ACTUAL AMOUNTS FOR THE YEAR ENDED JUNE 30, 2016)
FINALBUDGET ACTUAL VARIANCE 2016
Operating Revenues:Charges for services 115,573$ 147,138$ 31,565$ 91,213$
Operating Expenses:Salaries and wages 118,256 104,895 13,361 110,323 Employee benefits 62,795 59,065 3,730 55,402 Services and supplies 75,087 46,626 28,461 53,130 Depreciation 12,900 12,892 8 13,402
Total Operating Expenses 269,038 223,478 45,560 232,257
Operating Income (Loss) (153,465) (76,340) 77,125 (141,044)
Nonoperating Revenues (Expenses):Investment income 1,000 755 (245) 1,283 Miscellaneous 3,476 5,377 1,901 2,937
Total Nonoperating Revenues(Expenses) 4,476 6,132 1,656 4,220
Income (Loss) BeforeTransfers (148,989) (70,208) 78,781 (136,824)
Transfers in (out)General Fund 90,000 90,000 - 90,000
Change in Net Position (58,989)$ 19,792 78,781$ (46,824)
Net Position, July 1 284,243 331,067
Net Position, June 30 304,035$ 284,243$
209

See accompanying notes. 148
CARSON CITY, NEVADACEMETERY FUND
SCHEDULE OF CASH FLOWS - BUDGET AND ACTUALFOR THE YEAR ENDED JUNE 30, 2017
(WITH COMPARATIVE ACTUAL AMOUNTS FOR THE YEAR ENDED JUNE 30, 2016)
FINAL BUDGET ACTUAL VARIANCE 2016
CASH FLOWS FROM OPERATING ACTIVITIESCash received for services 115,573$ 123,277$ 7,704$ 92,560$ Cash payments for personnel costs (163,915) (188,707) (24,792) (153,385) Cash payments for services and supplies (75,087) (38,928) 36,159 (45,110) Miscellaneous cash received 3,476 5,377 1,901 2,937
Net Cash Provided (Used) byOperating Activities (119,953) (98,981) 20,972 (102,998)
CASH FLOWS FROM NONCAPITALFINANCING ACTIVITIES
Transfer from other funds 90,000 90,000 - 90,000
CASH FLOWS FROM INVESTING ACTIVITIESInvestment income 1,000 755 (245) 1,283
Net Increase (Decrease) in Cash and Cash Equivalents (28,953) (8,226) 20,727 (11,715)
Cash and Cash Equivalents, July 1 211,958 211,958 - 223,673
Cash and Cash Equivalents, June 30 183,005$ 203,732$ 20,727$ 211,958$
RECONCILIATION OF OPERATING INCOME (LOSS)TO NET CASH PROVIDED (USED) BY OPERATINGACTIVITIES:Operating income (loss) (153,465)$ (76,340)$ 77,125$ (141,044)$
Adjustments to reconcile operating income (loss)to net cash provided (used) by operatingactivities:
Depreciation and amortization expense 12,900 12,892 (8) 13,402 Nonoperating revenues 3,476 5,377 1,901 2,937 Changes in assets and liabilities:
(Increase) decrease in:Inventories - 2,376 2,376 7,925 Retirement deferred outflows - (5,786) (5,786) (3,759)
Increase (decrease) in:Accounts payable - 5,322 5,322 95 Accrued salaries and benefits - (6,942) (6,942) 1,357 Unearned revenue - (23,861) (23,861) 1,347 Accrued compensated absences - (40,148) (40,148) 79 Net OPEB obligation 17,136 14,131 (3,005) 15,578 Net retirement obligation - 24,321 24,321 16,844 Retirement deferred inflows - (10,323) (10,323) (17,759)
Total Adjustments 33,512 (22,641) (56,153) 38,046
Net Cash Provided (Used) byOperating Activities (119,953)$ (98,981)$ 20,972$ (102,998)$
210

See accompanying notes. 149
CARSON CITY, NEVADABUILDING PERMITS FUND
SCHEDULE OF REVENUES, EXPENSES,AND CHANGES IN NET POSITION - BUDGET AND ACTUAL
FOR THE YEAR ENDED JUNE 30, 2017(WITH COMPARATIVE ACTUAL AMOUNTS FOR THE YEAR ENDED JUNE 30, 2016)
FINALBUDGET ACTUAL VARIANCE 2016
Operating Revenues:Charges for services
User fees and charges 1,200,000$ 1,240,249$ 40,249$ 1,159,586$
Operating Expenses:Salaries and wages 65,782 28,305 37,477 88,704 Employee benefits 36,281 36,358 (77) 37,214 Services and supplies 1,310,939 1,040,681 270,258 1,025,802
Total Operating Expenses 1,413,002 1,105,344 307,658 1,151,720
Operating Income (Loss) (213,002) 134,905 347,907 7,866
Nonoperating Revenues (Expenses):Investment income 1,000 2,251 1,251 3,812 Miscellaneous - - - 41,883
Total Nonoperating Revenues(Expenses) 1,000 2,251 1,251 45,695
Change in Net Position (212,002)$ 137,156 349,158$ 53,561
Net Position, July 1 37,778 (15,783)
Net Position, June 30 174,934$ 37,778$
211

See accompanying notes. 150
CARSON CITY, NEVADABUILDING PERMITS FUND
SCHEDULE OF CASH FLOWS - BUDGET AND ACTUALFOR THE YEAR ENDED JUNE 30, 2017
(WITH COMPARATIVE ACTUAL AMOUNTS FOR THE YEAR ENDED JUNE 30, 2016)
FINALBUDGET ACTUAL VARIANCE 2016
CASH FLOWS FROM OPERATING ACTIVITIESCash received for services 1,200,000$ 1,240,249$ 40,249$ 1,158,885$ Cash payments for personnel costs (94,304) (98,043) (3,739) (93,470) Cash payments for services and supplies (1,310,939) (1,034,710) 276,229 (979,510) Miscellaneous cash received - - - 41,883
Net Cash Provided (Used) byOperating Activities (205,243) 107,496 312,739 127,788
CASH FLOWS FROM INVESTING ACTIVITIESInvestment income 1,000 2,251 1,251 3,812
Net Increase (Decrease) in Cashand Cash Equivalents (204,243) 109,747 313,990 131,600
Cash and Cash Equivalents, July 1 456,884 456,884 - 325,284
Cash and Cash Equivalents, June 30 252,641$ 566,631$ 313,990$ 456,884$
RECONCILIATION OF OPERATING INCOME (LOSS) TO NET CASH PROVIDED (USED) BY OPERATINGACTIVITIES:Operating income (loss) (213,002)$ 134,905$ 347,907$ 7,866$
Adjustments to reconcile operating income (loss)to net cash provided (used) by operatingactivities:
Non operating revenues - - - 41,883 Changes in assets and liabilities:
(Increase) decrease in:Prepaid items - - - 100 Retirement deferred outflows - (14,366) (14,366) -
Increase (decrease) in:Accounts payable - 5,971 5,971 46,192 Accrued salaries and benefits - (3,170) (3,170) (940) Due to other governments - - - (701) Accrued compensated absences - (37,106) (37,106) 24,842 Net OPEB obligation 7,759 5,862 (1,897) 7,054 Net retirement obligation - 19,575 19,575 20,471 Retirement deferred inflows - (4,175) (4,175) (18,979)
Total Adjustments 7,759 (27,409) (35,168) 119,922
Net Cash Provided (Used) byOperating Activities (205,243)$ 107,496$ 312,739$ 127,788$
212
INTERNAL SERVICE FUNDS
Internal Service Funds are used to account for the financing of goods or services provided by one department or agency of a government to other departments or agencies on a cost reimbursement basis. Accounting for Internal Service Funds as a proprietary fund type is designed to accumulate the total cost (including depreciation) of providing a particular service. Costs for services are reimbursed by the departments or agencies to which the services are provided.
Group Medical Insurance Fund - This Fund is used to account for monies collected from City departments and employees to be expended for claims for medical services provided to employees and their dependents. Workers' Compensation Fund - This Fund is used to account for monies collected for the insurance program from City departments to be expended for payment of claims, as required by law, to employees injured by accident while at work. Insurance Fund - This Fund is used to account for monies collected from City departments for liability and property insurance. Fleet Management Fund - This fund is used to account for monies collected from City departments for fleet maintenance operations.
213

See accompanying notes. 151
CARSON CITY, NEVADAINTERNAL SERVICE FUNDS
COMBINING STATEMENT OF NET POSITIONJUNE 30, 2017
GROUPMEDICAL WORKERS' FLEET
INSURANCE COMPENSATION INSURANCE MANAGEMENT TOTALASSETS
Current assets:Cash and investments 256,714$ 2,956,396$ 1,166,571$ 454,752$ 4,834,433$ Receivables:
Accounts and contracts, net 193,292 18,784 915 - 212,991 Due from other governments - 5,422 488,750 - 494,172 Inventories - - - 221,983 221,983 Prepaid items 39,805 8,525 762 1,515 50,607
Total Current Assets 489,811 2,989,127 1,656,998 678,250 5,814,186
Noncurrent assets:Other assets - 50,000 40,000 - 90,000
Capital assets:Buildings - - - 1,820,327 1,820,327 Machinery and equipment - 219,799 186,748 831,917 1,238,464
- 219,799 186,748 2,652,244 3,058,791 Less: Accumulated depreciation - (129,940) (108,603) (375,260) (613,803)
Net Capital Assets - 89,859 78,145 2,276,984 2,444,988
Total Noncurrent Assets - 139,859 118,145 2,276,984 2,534,988
Total Assets 489,811 3,128,986 1,775,143 2,955,234 8,349,174
Deferred outflows of resources:Deferred retirement contributions 50,744 27,523 22,294 114,614 215,175 Deferred actuarial adjustment to
contributions 2,691 1,435 1,196 6,100 11,422 Deferred earnings on retirement investments 39,515 21,075 17,562 89,567 167,719
Total Deferred Outflows of Resources 92,950 50,033 41,052 210,281 394,316
Total Assets and DeferredOutflows of Resources 582,761 3,179,019 1,816,195 3,165,515 8,743,490
LIABILITIESCurrent liabilities:
Accounts payable 200,862 14,995 100,499 102,452 418,808 Accrued salaries and benefits 6,761 3,405 2,780 21,542 34,488 Due to other governments - - 6,125 - 6,125Other current liabilities - 389,033 - - 389,033 Current portion:
Accrued compensated absences 3,587 27,493 3,584 16,274 50,938
Total Current Liabilities 211,210 434,926 112,988 140,268 899,392
Noncurrent liabilities:Accrued compensated absences 30,425 - 12,360 41,820 84,605 Net OPEB obligation 79,282 34,644 26,838 227,357 368,121 Net retirement obligation 406,652 450,644 188,929 880,348 1,926,573 Other liabilities - 1,082,420 131,570 - 1,213,990
Total Noncurrent Liabilities 516,359 1,567,708 359,697 1,149,525 3,593,289
Total Liabilities 727,569 2,002,634 472,685 1,289,793 4,492,681
Deferred inflows of resources:Deferred change in retirement experience 28,463 15,180 12,650 64,517 120,810 Deferred change in retirement contributions 7,864 4,194 3,495 17,824 33,377
Total Deferred Inflows ofResources 36,327 19,374 16,145 82,341 154,187
Total Liabilitites and DeferredInflows of Resources 763,896 2,022,008 488,830 1,372,134 4,646,868
NET POSITIONNet investment in capital
assets - 89,859 78,145 2,276,984 2,444,988 Restricted
Claims - 1,067,152 1,249,220 - 2,316,372 Unrestricted (181,135) - - (483,603) (664,738)
Total Net Position (181,135)$ 1,157,011$ 1,327,365$ 1,793,381$ 4,096,622$ 214

See accompanying notes. 152
CARSON CITY, NEVADAINTERNAL SERVICE FUNDS
COMBINING STATEMENT OF REVENUES, EXPENSESAND CHANGES IN NET POSITION
FOR THE YEAR ENDED JUNE 30, 2017
GROUP MEDICAL WORKERS' FLEET
INSURANCE COMPENSATION INSURANCE MANAGEMENT TOTAL
Operating Revenues:Charges for services 8,412,724$ 952,719$ 1,792,429$ 1,797,883$ 12,955,755$
Operating Expenses:Salaries and wages 166,553 32,667 55,671 493,013 747,904 Employee benefits 105,277 52,712 43,196 280,248 481,433 Services and supplies 8,243,676 1,014,982 2,024,685 810,591 12,093,934 Depreciation - 21,980 16,946 123,082 162,008
Total Operating Expenses 8,515,506 1,122,341 2,140,498 1,706,934 13,485,279
Operating Income (Loss) (102,782) (169,622) (348,069) 90,949 (529,524)
Nonoperating Revenues (Expenses):Investment income 457 9,795 4,070 1,489 15,811 Miscellaneous 1,760 - 72,181 - 73,941 Gain (loss) on disposal of capital assets - - (21,129) (43,171) (64,300)
Total Nonoperating Revenues (Expenses) 2,217 9,795 55,122 (41,682) 25,452
Income (Loss) Before Transfers (100,565) (159,827) (292,947) 49,267 (504,072)
Capital Contributions:Capital grants - 6,300 488,750 - 495,050
Total Capital Contributions - 6,300 488,750 - 495,050
Transfers:Transfers In - - 250,000 31,020 281,020
Change in Net Position (100,565) (153,527) 445,803 80,287 271,998
Net Position, July 1 (80,570) 1,310,538 881,562 1,713,094 3,824,624
Net Position, June 30 (181,135)$ 1,157,011$ 1,327,365$ 1,793,381$ 4,096,622$
215

See accompanying notes. 153
CARSON CITY, NEVADAINTERNAL SERVICE FUNDS
COMBINING STATEMENT OF CASH FLOWSFOR THE YEAR ENDED JUNE 30, 2017
(PAGE 1 OF 2)
GROUPMEDICAL WORKERS' FLEET
INSURANCE COMPENSATION INSURANCE MANAGEMENT TOTALCASH FLOWS FROM OPERATING
ACTIVITIESCash received for services -$ -$ -$ 1,797,883$ 1,797,883$ Cash received from customers 1,152,002 - - - 1,152,002 Cash received from other funds 7,522,082 951,851 1,800,068 - 10,274,001 Cash payments for personnel costs (306,287) (150,610) (123,259) (797,999) (1,378,155) Cash payments for services and supplies (8,282,021) (1,078,226) (2,554,241) (927,175) (12,841,663) Miscellaneous cash received 1,760 - 72,181 - 73,941
Net Cash Provided (Used) byOperating Activities 87,536 (276,985) (805,251) 72,709 (921,991)
CASH FLOWS FROM NONCAPITAL FINANCINGACTIVITIES
Transfer from other funds - - 250,000 31,020 281,020
CASH FLOWS FROM CAPITAL ANDRELATED FINANCING ACTIVITIES
Proceeds from sales of assets - - - 3,477 3,477 Acquisition of capital assets - - (21,130) (55,379) (76,509) Subsidy from grant - 6,300 488,750 - 495,050
Net Cash Provided (Used) by Capital and Related Financing Activities - 6,300 467,620 (51,902) 422,018
CASH FLOWS FROM INVESTINGACTIVITIESInvestment income 457 9,795 4,070 1,489 15,811
Net Increase (Decrease) in Cashand Cash Equivalents 87,993 (260,890) (83,561) 53,316 (203,142)
Cash and Cash Equivalents, July 1 168,721 3,217,286 1,250,132 401,436 5,037,575
Cash and Cash Equivalents, June 30 256,714$ 2,956,396$ 1,166,571$ 454,752$ 4,834,433$
216

See accompanying notes. 154
CARSON CITY, NEVADAINTERNAL SERVICE FUNDS
COMBINING STATEMENT OF CASH FLOWSFOR THE YEAR ENDED JUNE 30, 2017
(PAGE 2 OF 2)
GROUP MEDICAL WORKERS' FLEET
INSURANCE COMPENSATION INSURANCE MANAGEMENT TOTALRECONCILIATION OF OPERATING INCOME (LOSS) TO
NET CASH PROVIDED (USED) BY OPERATINGACTIVITIES:
Operating income (loss) (102,781)$ (169,622)$ (348,069)$ 90,949$ (529,523)$
Adjustments to reconcile operating income (loss) to net cash provided (used) by operating activities:
Depreciation and amortization expense - 21,980 16,946 123,082 162,008 Nonoperating revenues 1,760 - 72,181 - 73,941 Changes in assets and liabilities:
(Increase) decrease in: Accounts receivable 261,360 19,213 7,639 - 288,212 Due from other governments - - (488,750) - (488,750) Other assets - (20,000) - - (20,000) Inventories - - - (53,933) (53,933) Prepaid items (38,957) (942) 308 (1,515) (41,106) Retirement deferred outflows (41,707) (21,165) (17,515) (97,666) (178,053)
Increase (decrease) in: Accounts payable 611 14,719 50,034 (61,136) 4,228 Accrued salaries and benefits (9,576) (4,894) (4,054) (19,375) (37,899) Due to other governments - (20,081) (2,580) - (22,661) Accrued compensated absences (40,153) (68,221) (26,540) (48,366) (183,280) Net OPEB obligation 13,523 5,951 4,469 41,989 65,932 Net retirement obligation 53,060 29,360 24,467 117,816 224,703 Other liabilities - (57,021) (88,568) - (145,589) Retirement deferred inflows (9,604) (6,262) (5,219) (19,136) (40,221)
Total Adjustments 190,317 (107,363) (457,182) (18,240) (392,468)
Net Cash Provided (Used) by
Operating Activities 87,536$ (276,985)$ (805,251)$ 72,709$ (921,991)$
217

See accompanying notes. 155
CARSON CITY, NEVADAGROUP MEDICAL INSURANCE FUND
SCHEDULE OF REVENUES, EXPENSES,AND CHANGES IN NET POSITION - BUDGET AND ACTUAL
FOR THE YEAR ENDED JUNE 30, 2017(WITH COMPARATIVE ACTUAL AMOUNTS FOR THE YEAR ENDED JUNE 30, 2016)
FINALBUDGET ACTUAL VARIANCE 2016
Operating Revenues:Employee contributions 1,256,213$ 1,152,002$ (104,211)$ 1,165,956$ Employer contributions 7,470,195 7,260,722 (209,473) 7,150,424
Total Operating Revenues 8,726,408 8,412,724 (313,684) 8,316,380
Operating Expenses:Salaries and wages 217,232 166,553 50,679 201,957 Employee benefits 104,546 105,277 (731) 86,264 Services and supplies 8,199,375 8,243,676 (44,301) 8,571,368 Depreciation 611 - 611 -
Total Operating Expenses 8,521,764 8,515,506 6,258 8,859,589
Operating Income (Loss) 204,644 (102,782) (307,426) (543,209)
Nonoperating Revenues (Expenses):Investment income 1,000 457 (543) 1,198 Miscellaneous - 1,760 1,760 476 Gain (loss) on disposal of capital assets - - - (4,277)
Total Nonoperating Revenues(Expenses) 1,000 2,217 1,217 (2,603)
Income (Loss) Before Transfers 205,644 (100,565) (306,209) (545,812)
Change in Net Position 205,644$ (100,565) (306,209)$ (545,812)
Net Position, July 1 (80,570) 465,242
Net Position, June 30 (181,135)$ (80,570)$
218

See accompanying notes. 156
CARSON CITY, NEVADAGROUP MEDICAL INSURANCE FUND
SCHEDULE OF CASH FLOWS - BUDGET AND ACTUALFOR THE YEAR ENDED JUNE 30, 2017
(WITH COMPARATIVE ACTUAL AMOUNTS FOR THE YEAR ENDED JUNE 30, 2016)
FINAL BUDGET ACTUAL VARIANCE 2016
CASH FLOWS FROM OPERATING ACTIVITIESCash received from customers 1,256,213$ 1,152,002$ (104,211)$ 1,165,956$ Cash received from other funds 7,470,195 7,522,082 51,887 7,074,644 Cash payments for personnel costs (311,541) (306,287) 5,254 (266,432) Cash payments for services and supplies (8,199,375) (8,282,021) (82,646) (8,378,583) Miscellaneous cash received - 1,760 1,760 476
Net Cash Provided (Used) byOperating Activities 215,492 87,536 (127,956) (403,939)
CASH FLOWS FROM INVESTING ACTIVITIESInvestment income 1,000 457 (543) 1,198
Net Increase (Decrease) in Cashand Cash Equivalents 216,492 87,993 (128,499) (402,741)
Cash and Cash Equivalents, July 1 168,721 168,721 - 571,462
Cash and Cash Equivalents, June 30 385,213$ 256,714$ (128,499)$ 168,721$
RECONCILIATION OF OPERATING INCOME (LOSS)TO NET CASH PROVIDED (USED) BY OPERATINGACTIVITIES:
Operating income (loss) 204,644$ (102,781)$ (307,425)$ (543,209)$
Adjustments to reconcile operatingincome (loss) to net cash provided (used)by operating activities:
Depreciation 611 - (611) - Nonoperating revenues - 1,760 1,760 476 Changes in assets and liabilities:
(Increase) decrease in:Accounts receivable - 261,360 261,360 (75,780) Prepaid items - (38,957) (38,957) (479) Retirement deferred outflows - (41,707) (41,707) (6,641)
Increase (decrease) in:Accounts payable - 611 611 193,264 Accrued salaries and benefits - (9,576) (9,576) 6,358 Accrued compensated absences - (40,153) (40,153) 14,640 Net OPEB obligation 10,237 13,523 3,286 9,306 Net retirement obligation - 53,060 53,060 34,490 Retirement deferred inflows - (9,604) (9,604) (36,364)
Total Adjustments 10,848 190,317 179,469 139,270
Net Cash Provided (Used) byOperating Activities 215,492$ 87,536$ (127,956)$ (403,939)$
219

See accompanying notes. 157
CARSON CITY, NEVADAWORKERS' COMPENSATION FUND
SCHEDULE OF REVENUES, EXPENSES,AND CHANGES IN NET POSITION - BUDGET AND ACTUAL
FOR THE YEAR ENDED JUNE 30, 2017(WITH COMPARATIVE ACTUAL AMOUNTS FOR THE YEAR ENDED JUNE 30, 2016)
FINALBUDGET ACTUAL VARIANCE 2016
Operating Revenues:Charges for services:
Employer contributions 980,461$ 952,719$ (27,742)$ 825,530$
Operating Expenses:Salaries and wages 100,913 32,667 68,246 98,466 Employee benefits 49,655 52,712 (3,057) 67,860 Services and supplies 1,215,274 1,014,982 200,292 1,752,898 Depreciation 21,980 21,980 - 21,980
Total Operating Expenses 1,387,822 1,122,341 265,481 1,941,204
Operating Income (Loss) (407,361) (169,622) 237,739 (1,115,674)
Nonoperating Revenues (Expenses):Investment income 20,000 9,795 (10,205) 27,812 Miscellaneous - - - 928
Total Nonoperating Revenues(Expenses) 20,000 9,795 (10,205) 28,740
Income (Loss) Before Contributio (387,361) (159,827) 227,534 (1,086,934)
Capital Contributions:Capital grants - 6,300 6,300 -
Change in Net Position (387,361)$ (153,527) 233,834$ (1,086,934)
Net Position, July 1 1,310,538 2,397,472
Net Position, June 30 1,157,011$ 1,310,538$
220

See accompanying notes. 158
CARSON CITY, NEVADAWORKERS' COMPENSATION FUND
SCHEDULE OF CASH FLOWS - BUDGET AND ACTUALFOR THE YEAR ENDED JUNE 30, 2017
(WITH COMPARATIVE ACTUAL AMOUNTS FOR THE YEAR ENDED JUNE 30, 2016)
FINAL BUDGET ACTUAL VARIANCE 2016
CASH FLOWS FROM OPERATING ACTIVITIESCash received from other funds 980,461$ 951,851$ (28,610)$ 834,278$ Cash payments for personnel costs (144,999) (150,610) (5,611) (160,274) Cash payments for services and supplies (1,215,274) (1,078,226) 137,048 (872,946) Miscellaneous cash received - - - 928
Net Cash Provided (Used) byOperating Activities (379,812) (276,985) 102,827 (198,014)
CASH FLOWS FROM CAPITAL AND RELATEDFINANCING ACTIVITIES
Subsidy from grant - 6,300 6,300 -
CASH FLOWS FROM INVESTING ACTIVITIESInvestment income 20,000 9,795 (10,205) 27,812
Net Increase (Decrease) in Cash and Cash Equivalents (359,812) (260,890) 98,922 (170,202)
Cash and Cash Equivalents, July 1 3,217,286 3,217,286 - 3,387,488
Cash and Cash Equivalents, June 30 2,857,474$ 2,956,396$ 98,922$ 3,217,286$
RECONCILIATION OF OPERATING INCOME (LOSS)TO NET CASH PROVIDED (USED) BY OPERATINGACTIVITIES:
Operating income (loss) (407,361)$ (169,622)$ 237,739$ (1,115,674)$
Adjustments to reconcile operatingincome (loss) to net cash provided (used)by operating activities:
Depreciation 21,980 21,980 - 21,980 Nonoperating revenues - - - 928 Changes in assets and liabilities:
(Increase) decrease in:Accounts receivable - 19,213 19,213 (11,333) Other assets - (20,000) (20,000) - Prepaid items - (942) (942) (540) Retirement deferred outflows - (21,165) (21,165) 20,195
Increase (decrease) in:Accounts payable - 14,719 14,719 (21,307) Accrued salaries and benefits - (4,894) (4,894) 1,220 Due to other governments - (20,081) (20,081) 20,081 Accrued compensated absences - (68,221) (68,221) (19,276) Other liabilities - (57,021) (57,021) 901,799 NET OPEB obligation 5,569 5,951 382 5,063 NET retirement obligation - 29,360 29,360 65,078 Retirement deferred inflows - (6,262) (6,262) (66,228)
Total Adjustments 27,549 (107,363) (134,912) 917,660
Net Cash Provided (Used) byOperating Activities (379,812)$ (276,985)$ 102,827$ (198,014)$
221

See accompanying notes. 159
CARSON CITY, NEVADAINSURANCE FUND
SCHEDULE OF REVENUES, EXPENSES,AND CHANGES IN NET POSITION - BUDGET AND ACTUAL
FOR THE YEAR ENDED JUNE 30, 2017(WITH COMPARATIVE ACTUAL AMOUNTS FOR THE YEAR ENDED JUNE 30, 2016)
FINALBUDGET ACTUAL VARIANCE 2016
Operating Revenues:Charges for services:
Administrative fees 1,785,000$ 1,792,429$ 7,429$ 1,771,883$
Operating Expenses:Salaries and wages 82,567 55,671 26,896 71,896 Employee benefits 40,298 43,196 (2,898) 35,944 Services and supplies 2,353,017 2,024,685 328,332 1,347,912 Depreciation 16,946 16,946 - 16,564
Total Operating Expenses 2,492,828 2,140,498 352,330 1,472,316
Operating Income (Loss) (707,828) (348,069) 359,759 299,567
Nonoperating Revenues (Expenses):Investment income 3,000 4,070 1,070 10,108 Miscellaneous 10,000 72,181 62,181 23,306 Gain (loss) on disposal of capital assets - (21,129) (21,129) (81,384)
Total Nonoperating Revenues(Expenses) 13,000 55,122 42,122 (47,970)
Income (Loss) Before Transfers (694,828) (292,947) 401,881 251,597
Capital Contributions:Capital grants - 488,750 488,750 -
Transfers in (out):General Fund 250,000 250,000 - -
Change in Net Position (444,828)$ 445,803 890,631$ 251,597
Net Position, July 1 881,562 629,965
Net Position, June 30 1,327,365$ 881,562$
222

See accompanying notes. 160
CARSON CITY, NEVADAINSURANCE FUND
SCHEDULE OF CASH FLOWS - BUDGET AND ACTUALFOR THE YEAR ENDED JUNE 30, 2017
(WITH COMPARATIVE ACTUAL AMOUNTS FOR THE YEAR ENDED JUNE 30, 2016)
FINALBUDGET ACTUAL VARIANCE 2016
CASH FLOWS FROM OPERATING ACTIVITIESCash received from other funds 1,785,000$ 1,800,068$ 15,068$ 1,763,329$ Cash payments for personnel costs (118,952) (123,259) (4,307) (134,911) Cash payments for services and supplies (2,353,017) (2,554,241) (201,224) (1,345,562) Miscellaneous cash received 10,000 72,181 62,181 23,306
Net Cash Provided (Used) byOperating Activities (676,969) (805,251) (128,282) 306,162
CASH FLOW FROM NONCAPITAL FINANCINGACTIVITIES
Transfer from other funds 250,000 250,000 - -
CASH FLOWS FROM CAPITAL AND RELATEDFINANCING ACTIVITIES
Acquisition of capital assets - (21,130) (21,130) (57,221) Subsidy from grant - 488,750 488,750 -
Net Cash provided (Used) by Capital and Related Financing Activities - 467,620 467,620 (57,221)
CASH FLOWS FROM INVESTING ACTIVITIESInvestment income 3,000 4,070 1,070 10,108
Net Increase (Decrease) in Cash and Cash Equivalents (423,969) (83,561) 340,408 259,049
Cash and Cash Equivalents, July 1 1,250,132 1,250,132 - 991,083
Cash and Cash Equivalents, June 30 826,163$ 1,166,571$ 340,408$ 1,250,132$
RECONCILIATION OF OPERATING INCOME (LOSS) TO NET CASH PROVIDED (USED)BY OPERATING ACTIVITIES:
Operating income (loss) (707,828)$ (348,069)$ 359,759$ 299,567$
Adjustments to reconcile operatingincome (loss) to net cash provided(used) by operating activities:
Depreciation 16,946 16,946 - 16,564 Nonoperating revenues 10,000 72,181 62,181 23,306 Changes in assets and liabilities:
(Increase) decrease in:Accounts receivable - 7,639 7,639 (8,554) Due from other governments - (488,750) (488,750) - Prepaid items - 308 308 2,833 Retirement deferred outflows - (17,515) (17,515) (2,865)
Increase (decrease) in:Accounts payable - 50,034 50,034 (5,743) Accrued salaries and benefits - (4,054) (4,054) 872 Due to other governments - (2,580) (2,580) 8,705 Deferred revenue - - - - Accrued compensated absences - (26,540) (26,540) (27,764) Other liabilities - (88,568) (88,568) (3,445) Net OPEB obligation 3,913 4,469 556 3,557 Net retirement obligation - 24,467 24,467 16,042 Retirement deferred inflows - (5,219) (5,219) (16,913)
Total Adjustments 30,859 (457,182) (488,041) 6,595
Net Cash Provided (Used) byOperating Activities (676,969)$ (805,251)$ (128,282)$ 306,162$
223

See accompanying notes. 161
CARSON CITY, NEVADAFLEET MANAGEMENT FUND
SCHEDULE OF REVENUES, EXPENSES,AND CHANGES IN NET POSITION - BUDGET AND ACTUAL
FOR THE YEAR ENDED JUNE 30, 2017(WITH COMPARATIVE ACTUAL AMOUNTS FOR THE YEAR ENDED JUNE 30, 2016)
FINALBUDGET ACTUAL VARIANCE 2016
Operating Revenues:Charges for services:
Administrative fees 1,794,989$ 1,797,883$ 2,894$ 1,754,928$
Operating Expenses:Salaries and wages 554,740 493,013 61,727 498,423 Employee benefits 274,323 280,248 (5,925) 229,010 Services and supplies 938,811 810,591 128,220 860,196 Depreciation 123,000 123,082 (82) 88,936
Total Operating Expenses 1,890,874 1,706,934 183,940 1,676,565
Operating Income (Loss) (95,885) 90,949 186,834 78,363
Nonoperating Revenues (Expenses):Investment income 4,000 1,489 (2,511) 4,823 Gain (loss) on disposal of capital assets - (43,171) (43,171) -
Total Nonoperating Revenues(Expenses) 4,000 (41,682) (45,682) 4,823
Income (Loss) Before Contributio (91,885) 49,267 141,152 83,186 Capital Contributions:
Capital assets - - - 7,162
Total Capital Contributions - - - 7,162
Transfers in (out):Ambulance Fund 31,020 31,020 - 31,020
Total Transfers 31,020 31,020 - 31,020
Change in Net Position (60,865)$ 80,287 141,152$ 121,368
Net Position, July 1 1,713,094 1,591,726
Net Position, June 30 1,793,381$ 1,713,094$
224

See accompanying notes. 162
CARSON CITY, NEVADAFLEET MANAGEMENT FUND
SCHEDULE OF CASH FLOWS - BUDGET AND ACTUALFOR THE YEAR ENDED JUNE 30, 2017
(WITH COMPARATIVE ACTUAL AMOUNTS FOR THE YEAR ENDED JUNE 30, 2016)(PAGE 1 OF 2)
FINALBUDGET ACTUAL VARIANCE 2016
CASH FLOWS FROM OPERATING ACTIVITIESCash received for services 1,794,989$ 1,797,883$ 2,894$ 1,754,928$ Cash payments for personnel costs (802,354) (797,999) 4,355 (706,608) Cash payments for services and supplies (938,811) (927,175) 11,636 (784,352)
Net Cash Provided (Used) byOperating Activities 53,824 72,709 18,885 263,968
CASH FLOWS FROM NONCAPITAL FINANCINGACTIVITIES
Transfer from other funds 31,020 31,020 - 31,020
CASH FLOWS FROM CAPITAL AND RELATEDFINANCING ACTIVITIES
Proceeds from sales of assets - 3,477 3,477 - Acquisition of capital assets (58,000) (55,379) 2,621 (153,697)
Net Cash Provided (Used) by Capital and Related Financing Activities (58,000) (51,902) 6,098 (153,697)
CASH FLOWS FROM INVESTING ACTIVITIESInvestment income 4,000 1,489 (2,511) 4,823
Net Increase (Decrease) in Cashand Cash Equivalents 30,844 53,316 22,472 146,114
Cash and Cash Equivalents, July 1 401,436 401,436 - 255,322
Cash and Cash Equivalents, June 30 432,280$ 454,752$ 22,472$ 401,436$
225

See accompanying notes. 163
CARSON CITY, NEVADAFLEET MANAGEMENT FUND
SCHEDULE OF CASH FLOWS - BUDGET AND ACTUALFOR THE YEAR ENDED JUNE 30, 2017
(WITH COMPARATIVE ACTUAL AMOUNTS FOR THE YEAR ENDED JUNE 30, 2016)(PAGE 2 OF 2)
FINALBUDGET ACTUAL VARIANCE 2016
RECONCILIATION OF OPERATING INCOME(LOSS) TO NET CASH PROVIDED (USED)BY OPERATING ACTIVITIES:
Operating income (loss) (95,885)$ 90,949$ 186,834$ 78,363$
Adjustments to reconcile operating income(loss) to net cash provided(used) by operating activities:
Depreciation 123,000 123,082 82 88,936 Changes in assets and liabilities:
(Increase) decrease in:Inventories - (53,933) (53,933) 42,813 Prepaid items - (1,515) (1,515) 166 Retirement deferred outflows - (97,666) (97,666) (16,791)
Increase (decrease) in:Accounts payable - (61,136) (61,136) 32,865 Accrued salaries and benefits - (19,375) (19,375) 6,793 Accrued compensated absences - (48,366) (48,366) 10,671 Net OPEB obligation 26,709 41,989 15,280 24,281 Net retirement obligation - 117,816 117,816 72,382 Retirement deferred inflows - (19,136) (19,136) (76,511)
Total Adjustments 149,709 (18,240) (167,949) 185,605
Net Cash Provided (Used) byOperating Activities 53,824$ 72,709$ 18,885$ 263,968$
NONCASH INVESTING, CAPITAL ANDFINANCING ACTIVITIES:
Contributed Capital Assets -$ -$ -$ 7,162$
226

FIDUCIARY FUNDS
Fiduciary Funds are used to account for assets held by the government in a trustee or agency capacity.
Investment Trust Fund - This Fund is used to account for the external investment pool administered by Carson City. The pool has one involuntary participant, the Carson City School District Debt Service Fund. These statements can be found in the City’s basic financial statements. Agency Funds are custodial in nature (assets equal liabilities) and do not involve measurement of results of operations. Agency Funds are merely clearing accounts and have no fund equity. The following information is presented to describe each of the City's Agency Funds: Eagle Valley Water District Fund - This Fund is used to account for
the collection and payment of ad valorem taxes on behalf of the District. Sub-Conservancy District Fund - This Fund is used to account for the
collection and payment of ad valorem taxes on behalf of the District. Fish and Game Fund - This Fund is used to account for monies
withdrawn from the wildlife account within the State General Fund and transferred to the City for disposition by the City's Advisory Board to manage wildlife.
Controller Trust Fund - This Fund is used to account for unclaimed
payroll warrants and accounts payable warrants during the required statutory period, which have been returned to the City until claimed or remitted to the State of Nevada Unclaimed Property Division.
State of Nevada Fund - This Fund is used to account for the collection
and payment of the State of Nevada's share of ad valorem taxes, District and Justice Court fees, marriage fees, or fees otherwise mandated by statute, and collected by the City.
Nevada Commission for the Reconstruction of the V & T Railway
Fund - This Fund is used to account for the collection and distribution of gifts, grants, and donations to reconstruct the Virginia and Truckee Railroad between Virginia City and Carson City.
227

This page intentionally left blank.
228

FIDUCIARY FUNDS Continued
Forfeiture Account Fund - This Fund is used to account for currency that is seized by the Sheriff’s Office and will remain in the Fund until the court determines if the currency is subject to forfeiture.
Carson City School District Debt Service Fund - This Fund is used to account for ad valorem taxes and interest earned thereon, specifically apportioned and appropriated for the retirement of long-term general obligation principal and interest of the School District.
Carson City School District Operating Fund - This Fund is used to account for the collection of and remittance to the school district of ad valorem taxes.
Neighborhood Improvement District – This Fund is used to account for the collection of special assessment taxes paid by the Downtown Neighborhood Improvement District for the purpose of paying for maintenance of the Downtown Streetscape Enhancement Project.
229

See accompanying notes. 164
BALANCE BALANCEJULY 1, 2016 ADDITIONS DELETIONS JUNE 30, 2017
EAGLE VALLEY WATER DISTRICT FUNDAssets:
Cash and investments 258$ 18,186$ 18,187$ 257$ Taxes receivable, delinquent 295 93 139 249
Total Assets 553$ 18,279$ 18,326$ 506$
Liabilities:Due to other governments 553$ 18,529$ 18,576$ 506$
SUB-CONSERVANCY DISTRICT FUNDAssets:
Cash and investments 1,200$ 908,777$ 908,377$ 1,600$ Taxes receivable, delinquent 6,149 1,939 4,171 3,917 Due from other governments 29,145 - 29,145 -
Total Assets 36,494$ 910,716$ 941,693$ 5,517$
Liabilities: Accounts payable 6,815$ 372,659$ 372,662$ 6,812$ Due to other governments 280 372,481 387,173 (14,412) Other liabilities 29,399 13,110 29,392 13,117
Total Liabilities 36,494$ 758,250$ 789,227$ 5,517$
FISH AND GAME FUNDAssets:
Cash and investments 1,995$ 2,540$ 2,148$ 2,387$
Liabilities:Accounts payable 777$ 1,479$ 2,148$ 108$ Due to other governments 1,218 2,540 1,479 2,279
Total Liabilities 1,995$ 4,019$ 3,627$ 2,387$
CONTROLLER TRUST FUNDAssets:
Cash and investments 16,809$ 36,669$ 10,597$ 42,881$
Liabilities: Accounts payable -$ 2,889$ 2,889$ -$ Due to other governments 16,809 34,974 8,902 42,881
Total Liabilities 16,809$ 37,863$ 11,791$ 42,881$
(PAGE 1 OF 3)
CARSON CITY, NEVADACOMBINING STATEMENT OF CHANGES IN
ASSETS AND LIABILITIES - ALL AGENCY FUNDSFOR THE YEAR ENDED JUNE 30, 2017
230

See accompanying notes. 165
BALANCE BALANCEJULY 1, 2016 ADDITIONS DELETIONS JUNE 30, 2017
STATE OF NEVADA FUNDAssets:
Cash and investments 485,227$ 4,618,085$ 4,401,992$ 701,320$ Taxes receivable, delinquent 35,008 10,985 23,831 22,162
Total Assets 520,235$ 4,629,070$ 4,425,823$ 723,482$
Liabilities:Accounts payable 20$ 2,095$ 2,111$ 4$ Due to other governments 520,215 5,300,593 5,097,330 723,478
Total Liabilities 520,235$ 5,302,688$ 5,099,441$ 723,482$
NEVADA COMMISSION FOR THERECONSTRUCTION OF THE V & TRAILWAY FUNDAssets:
Cash and investments 26,956$ 466,152$ 305,851$ 187,257$ Cash held by Commission 85,342 - 85,342 - Due from other governments 23,327 9,169 13,149 19,347
Total Assets 135,625$ 475,321$ 404,342$ 206,604$
Liabilities:Accounts payable 41,664$ 274,065$ 304,926$ 10,803$ Due to other governments 93,961 375,905 274,065 195,801
Total Liabilities 135,625$ 649,970$ 578,991$ 206,604$
FORFEITURE ACCOUNT FUNDAssets:
Cash and investments 28,161$ 15,950$ 23,239$ 20,872$
Liabilities:Accounts payable -$ 12,776$ 12,776$ - $ Due to other governments 28,161 14,322 21,611 20,872
Total Liabilities 28,161$ 27,098$ 34,387$ 20,872$
CARSON CITY SCHOOL DISTRICTDEBT SERVICE FUND
Assets:Taxes receivable, delinquent 91,216$ 27,230$ 61,311$ 57,135$
Liabilities:Accounts payable 45$ 59$ 104$ -$ Due to other governments 91,171 5,845,872 5,879,908 57,135
Total Liabilities 91,216$ 5,845,931$ 5,880,012$ 57,135$
CARSON CITY, NEVADA
(PAGE 2 OF 3)
COMBINING STATEMENT OF CHANGES INASSETS AND LIABILITIES - ALL AGENCY FUNDS
FOR THE YEAR ENDED JUNE 30, 2017
231

See accompanying notes. 166
BALANCE BALANCEJULY 1, 2016 ADDITIONS DELETIONS JUNE 30, 2017
CARSON CITY SCHOOL DISTRICTOPERATING FUND
Assets:Cash and investments 19,562$ 9,707,008$ 9,697,957$ 28,613$ Taxes receivable, delinquent 152,009 48,525 102,948 97,586
Total Assets 171,571$ 9,755,533$ 9,800,905$ 126,199$
Liabilities:Accounts payable 78$ 28,718$ 19,665$ 9,131$ Due to other governments 171,493 9,693,946 9,748,371 117,068
Total Liabilities 171,571$ 9,722,664$ 9,768,036$ 126,199$
DOWNTOWN NEIGHBORHOOD IMPROVEMENT DISTRICT (NID)
Assets:Cash and investments -$ 82,622$ 3,882$ 78,740$
Liabilities:Accounts payable -$ 3,683$ 3,683$ -$ Due to other governments - 82,423 3,683 78,740
Total Liabilities -$ 86,106$ 7,366$ 78,740$
TOTALS - ALL AGENCY FUNDSAssets:
Cash and investments 580,168$ 15,855,989$ 15,372,230$ 1,063,927$ Cash held by Commission 85,342 - 85,342 - Taxes receivable, delinquent 284,677 88,772 192,400 181,049 Due from other governments 52,472 9,169 42,294 19,347
Total Assets 1,002,659$ 15,953,930$ 15,692,266$ 1,264,323$
Liabilities:Accounts payable 49,399$ 698,423$ 720,964$ 26,858$ Due to other governments 923,861 21,741,585 21,441,098 1,224,348 Other liabilities 29,399 13,110 29,392 13,117
Total Liabilities 1,002,659$ 22,453,118$ 22,191,454$ 1,264,323$
(PAGE 3 OF 3)
CARSON CITY, NEVADACOMBINING STATEMENT OF CHANGES IN
ASSETS AND LIABILITIES - ALL AGENCY FUNDSFOR THE YEAR ENDED JUNE 30, 2017
232

STATISTICAL SECTION
233

CARSON CITY STATISTICAL SECTION
(UNAUDITED)
This part of the City’s comprehensive annual financial report presents detailed information as a context for understanding what the information in the financial statements, note disclosures, and required supplementary information says about the City’s overall financial health.
Section Contents Schedule #
Financial Trends 1.1 - 1.4 These schedules contain trend information to help the reader understand how the City’s financial performance and well-being have changed over time.
Revenue Capacity 2.1 - 2.4 These schedules contain information to help the reader assess the factors affecting the City’s ability to generate its property and sales taxes.
Debt Capacity 3.1 - 3.4 These schedules present information to help the reader assess the affordability of the City’s current levels of outstanding debt, and its ability to issue additional future debt.
Demographic and Economic Information 4.1 - 4.2 These schedules offer demographic and economic indicators to help the reader understand the environment within which the City’s financial activities take place and to help make comparisons over time and with other governments.
Operating Information 5.1 - 5.3 These schedules contain information about the City’s operations and resources to help the reader understand how the City’s financial information relates to the services the City provides and the activities it performs.
234

Sch
edul
e 1.
1
CA
RS
ON
CIT
YN
ET
PO
SIT
ION
BY
CO
MP
ON
EN
TL
AS
T T
EN
FIS
CA
L Y
EA
RS
(UN
AU
DIT
ED
)
2017
2016
2015
2014
2013
2012
2011
2010
2009
2008
GO
VE
RN
ME
NT
AL
AC
TIV
ITIE
SN
et in
vest
men
t in
capi
tal
asse
ts30
2,08
9,83
4$
299,
558,
400
$
29
3,23
6,17
4$
260,
795,
570
$
26
0,37
0,60
4$
259,
709,
061
$
23
0,50
2,49
2$
17
2,32
7,52
8$
142,
099,
041
$
13
1,33
8,11
2$
Res
tric
ted
10,0
81,6
46
13,0
49,4
82
8,22
7,11
1
14
,907
,036
15
,013
,156
15
,165
,751
16
,058
,661
20
,115
,371
18,7
59,5
5623
,302
,315
Unr
estr
icte
d(9
8,71
7,58
5)
(104
,344
,249
)
(9
5,56
5,72
2)
(27,
614,
698)
(2
2,47
1,32
0)
(23,
227,
661)
(1
6,82
9,47
0)
(14,
549,
896)
(4, 6
78,3
27)
2,41
7,11
2T
otal
Gov
ernm
enta
l Act
iviti
es
Net
Pos
ition
213,
453,
895
$
20
8,26
3,63
3$
205,
897,
563
$
24
8,08
7,90
8$
252,
912,
440
$
25
1,64
7,15
1$
229,
731,
683
$
177,
893,
003
$
15
6,18
0,27
0$
157,
057,
539
$
BU
SIN
ESS
-TY
PE
AC
TIV
ITIE
SN
et in
vest
men
t in
capi
tal
asse
ts93
,571
,145
$
94
,521
,657
$
95
,262
,713
$
93
,600
,537
$
92
,023
,344
$
92
,490
,506
$
92
,656
,159
$
90
,457
,625
$
89
,403
,212
$
87
,652
,903
$
R
estr
icte
d-
-
-
-
-
-
-
-
-
-
Unr
estr
icte
d7,
200,
009
202,
633
(3
,826
,793
)
5,
348,
056
7,84
9,91
9
7,
832,
105
3,47
6,23
0
6,
235,
987
11,0
02,9
7114
,666
,940
Tot
al B
usin
ess-
Typ
e A
ctiv
ities
N
et P
ositi
on10
0,77
1,15
4$
94,7
24,2
90$
91,4
35,9
20$
98,9
48,5
93$
99,8
73,2
63$
100,
322,
611
$
96
,132
,389
$
96
,693
,612
$
10
0,40
6,18
3$
102,
319,
843
$
PR
IMA
RY
GO
VE
RN
ME
NT
Net
inve
stm
ent i
n ca
pita
l as
sets
395,
660,
979
$
39
4,08
0,05
7$
388,
498,
887
$
35
4,39
6,10
7$
352,
393,
948
$
35
2,19
9,56
7$
323,
158,
651
$
262,
785,
153
$
23
1,50
2,25
3$
218,
991,
015
$
R
estr
icte
d10
,081
,646
13
,049
,482
8,
227,
111
14,9
07,0
36
15,0
13,1
56
15,1
65,7
51
16,0
58,6
61
20,1
15,3
7118
,759
,556
23,3
02,3
15U
nres
tric
ted
(91,
517,
576)
(1
04,1
41,6
16)
(99,
392,
515)
(2
2,26
6,64
2)
(14,
621,
401)
( 1
5,39
5,55
6)
(13,
353,
240)
(8
,313
,909
)6,
324,
644
17,0
84,0
52
Tot
al P
rim
ary
Gov
ernm
ent
Net
Pos
ition
314,
225,
049
$
30
2,98
7,92
3$
297,
333,
483
$
34
7,03
6,50
1$
352,
785,
703
$
35
1,96
9,76
2$
325,
864,
072
$
274,
586,
615
$
25
6,58
6,45
3$
259,
377,
382
$
Not
e: I
nfor
mat
ion
abov
e is
pre
sent
ed o
n th
e ac
cura
l bas
is o
f ac
coun
ting.
Acc
rual
-bas
is f
inan
cial
info
rmat
ion
for
the
city
gov
ernm
ent a
s a
who
le is
ava
ilabl
e in
the
Bas
ic F
inan
cial
Sta
tem
ents
.
FIS
CA
L Y
EA
R E
ND
ED
JU
NE
30,
167
235

Sch
edul
e 1.
2
Not
e: T
his
info
rmat
ion
is p
rese
nted
on
the
accr
ual b
asis
of
acco
unti
ng.
CA
RS
ON
CIT
YC
HA
NG
ES
IN
NE
T P
OS
ITIO
NL
AS
T T
EN
FIS
CA
L Y
EA
RS
(UN
AU
DIT
ED
)
2017
2016
2015
2014
2013
2012
2011
2010
2009
2008
EX
PE
NSE
S
Gov
ernm
enta
l Act
ivit
ies:
Gen
eral
gov
ernm
ent
14,8
87,4
43$
14,8
20,2
54$
14,3
32,0
92$
15,0
80,3
64$
13,2
70,4
90$
12,8
39,5
23$
12,7
10,1
14$
13,1
28,8
42$
13,9
19,7
89$
13,0
42,5
89$
Publ
ic s
afet
y34
,946
,511
34
,442
,723
33
,270
,317
32
,434
,444
31
,081
,304
30
,273
,949
28
,842
,714
30
,765
,050
28
,995
,649
27
,388
,924
Judi
cial
7,01
7,98
9
6,
241,
597
5,90
8,07
8
5,
471,
384
5,43
8,23
2
5,
213,
231
4,89
1,27
4
5,
301,
887
5,06
5,11
3
4,
526,
334
Publ
ic w
orks
9,90
4,41
8
9,
052,
258
9,90
3,83
9
9,
720,
781
8,61
6,73
9
9,
249,
322
8,18
8,83
4
9,
660,
646
8,20
0,51
7
10
,017
,131
Sani
tatio
n2,
060,
980
1,83
8,04
9
1,
876,
842
1,77
7,52
1
1,
730,
139
1,68
0,28
3
1,
655,
363
1,80
5,04
9
1,
753,
575
1,97
2,84
9
Hea
lth5,
998,
209
6,34
4,50
6
6,
197,
262
6,18
0,67
5
5,
451,
016
4,98
4,82
3
4,
349,
102
4,57
0,74
6
3,
563,
272
2,78
1,54
6
Wel
fare
2,16
4,90
8
2,
038,
500
2,01
3,87
5
2,
317,
891
2,02
8,67
7
2,
369,
073
2,35
9,99
8
2,
373,
611
2,14
3,40
4
2,
008,
154
Cul
ture
and
rec
reat
ion
9,59
5,54
1
9,
530,
025
9,56
2,09
2
9,
345,
624
9,08
4,41
5
8,
981,
258
8,71
9,94
7
9,
686,
659
8,99
5,60
1
9,
056,
223
Com
mun
ity s
uppo
rt1,
058,
025
597,
679
1,
067,
743
578,
988
70
4,50
0
3,38
6,72
4
1,
643,
988
3,92
2,07
6
2,
626,
657
991,
673
Air
port
548,
672
46
5,15
7
344,
845
33
3,52
1
388,
786
28
5,64
5
149,
667
25
7,96
9
51,5
05
124,
386
Eco
nom
ic O
ppor
tuni
ty90
,492
11
9,12
7
87,0
26
179,
513
18
6,69
5
304,
571
32
6,91
0
4,70
5,49
5
2,
255,
148
560,
255
Inte
res t
on
long
-ter
m d
ebt
3,08
9,77
7
3,
167,
238
3,53
5,87
0
3,
323,
887
3,51
3,96
6
3,
931,
487
4,04
7,09
1
4,
247,
956
3,94
7,95
1
3,
721,
332
Tot
al G
over
nmen
tal A
ctiv
ities
Exp
ense
s91
,362
,965
88
,657
,113
88
,099
,881
86
,744
,593
81
,494
,959
83
,499
,889
77
,885
,002
90
,425
,986
81
,518
,181
76
,191
,396
Bus
ines
s-ty
pe A
ctiv
itie
s:
Sew
er10
,249
,949
9,
596,
628
9,30
7,85
4
9,
135,
280
8,96
5,34
6
8,
389,
001
8,48
6,53
8
8,
568,
534
8,82
7,55
7
8,
196,
029
Wat
er13
,464
,964
13
,710
,079
13
,171
,346
12
,833
,407
11
,847
,582
12
,190
,492
12
,448
,336
11
,345
,020
10
,423
,075
9,
996,
906
Stor
mw
ater
Dra
inag
e1,
033,
393
1,15
9,63
2
1,
104,
191
1,28
8,35
7
1,
186,
768
1,19
9,99
0
1,
025,
278
1,19
8,01
6
1,
115,
129
880,
387
Am
bula
nce
3,54
4,83
3
3,
505,
024
3,27
0,22
1
3,
473,
925
3,20
3,88
2
4,
150,
587
4,31
1,73
1
4,
288,
925
4,65
7,63
7
3,
444,
369
Cem
eter
y22
7,79
2
233,
663
22
5,66
7
225,
515
19
1,88
8
193,
726
18
5,52
4
192,
330
16
2,70
6
206,
709
Bui
ldin
g Pe
rmits
1,10
3,82
8
1,
148,
900
642,
601
55
5,31
5
574,
273
46
4,02
2
439,
863
58
0,57
6
945,
159
1,
581,
943
Tot
al B
usin
ess-
type
Act
iviti
es E
xpen
ses
29,6
24,7
59
29,3
53,9
26
27,7
21,8
80
27,5
11,7
99
25,9
69,7
39
26,5
87,8
18
26,8
97,2
70
26,1
73,4
01
26,1
31,2
63
24,3
06,3
43
Tot
al P
rim
ary
Gov
ernm
ent E
xpen
ses
120,
987,
724
$
11
8,01
1,03
9$
115,
821,
761
$
11
4,25
6,39
2$
107,
464,
698
$
11
0,08
7,70
7$
104,
782,
272
$
116,
599,
387
$
10
7,64
9,44
4$
100,
497,
739
$
FIS
CA
L Y
EA
R E
ND
ED
JU
NE
30,
168
236
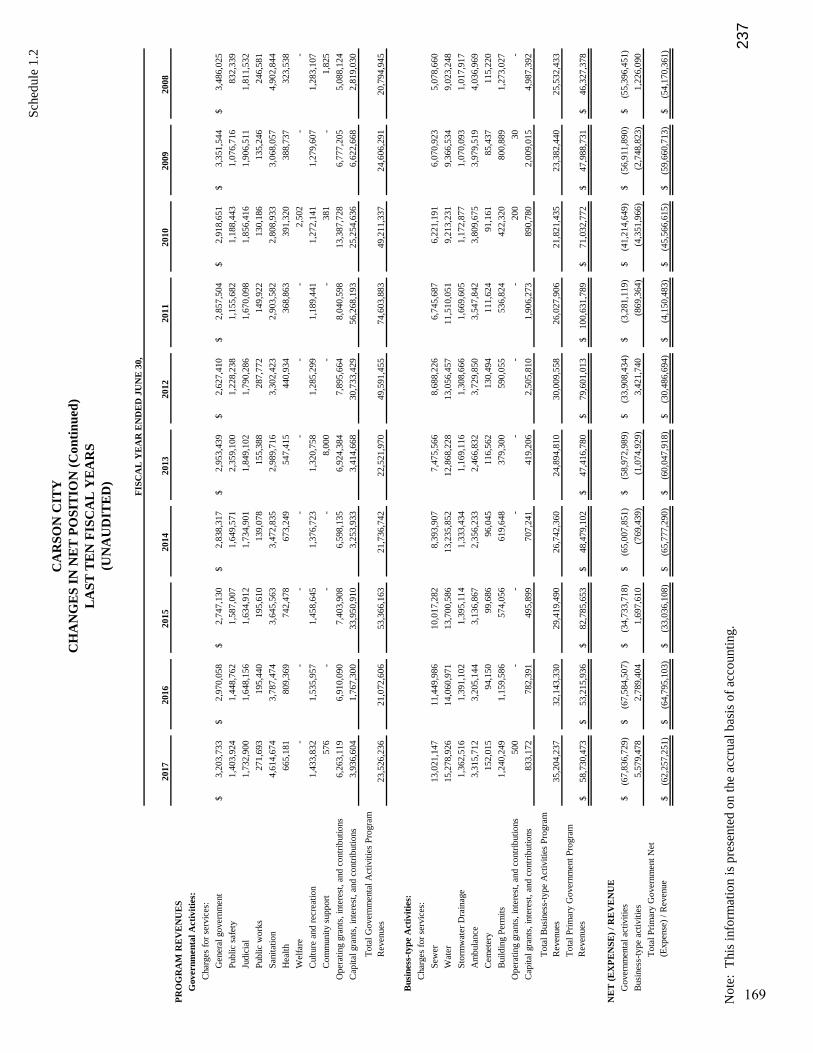
Sch
edul
e 1.
2
Not
e: T
his
info
rmat
ion
is p
rese
nted
on
the
accr
ual b
asis
of
acco
unti
ng.
CA
RS
ON
CIT
YC
HA
NG
ES
IN
NE
T P
OS
ITIO
N (
Con
tin
ued
)L
AS
T T
EN
FIS
CA
L Y
EA
RS
(UN
AU
DIT
ED
)
2017
2016
2015
2014
2013
2012
2011
2010
2009
2008
PR
OG
RA
M R
EV
EN
UE
S
Gov
ernm
enta
l Act
ivit
ies:
Cha
rges
for
ser
vice
s:
Gen
eral
gov
ernm
ent
3,20
3,73
3$
2,
970,
058
$
2,74
7,13
0$
2,
838,
317
$
2,95
3,43
9$
2,
627,
410
$
2,85
7,50
4$
2,
918,
651
$
3,35
1,54
4$
3,
486,
025
$
Publ
ic s
afet
y1,
403,
924
1,44
8,76
2
1,
587,
007
1,64
9,57
1
2,
359,
100
1,22
8,23
8
1,
155,
682
1,18
8,44
3
1,
076,
716
832,
339
Judi
cial
1,73
2,90
0
1,
648,
156
1,63
4,91
2
1,
734,
901
1,84
9,10
2
1,
790,
286
1,67
0,09
8
1,
856,
416
1,90
6,51
1
1,
811,
532
Publ
ic w
orks
271,
693
19
5,44
0
195,
610
13
9,07
8
155,
388
28
7,77
2
149,
922
13
0,18
6
135,
246
24
6,58
1
Sani
tatio
n4,
614,
674
3,78
7,47
4
3,
645,
563
3,47
2,83
5
2,
989,
716
3,30
2,42
3
2,
903,
582
2,80
8,93
3
3,
068,
057
4,90
2,84
4
Hea
lth66
5,18
1
809,
369
74
2,47
8
673,
249
54
7,41
5
440,
934
36
8,86
3
391,
320
38
8,73
7
323,
538
Wel
fare
- -
- -
- -
- 2,
502
-
-
Cul
ture
and
rec
reat
ion
1,43
3,83
2
1,
535,
957
1,45
8,64
5
1,
376,
723
1,32
0,75
8
1,
285,
299
1,18
9,44
1
1,
272,
141
1,27
9,60
7
1,
283,
107
Com
mun
ity s
uppo
rt57
6
- -
- 8,
000
-
- 38
1
- 1,
825
Ope
ratin
g gr
ants
, int
eres
t, an
d co
ntri
butio
ns6,
263,
119
6,91
0,09
0
7,
403,
908
6,59
8,13
5
6,
924,
384
7,89
5,66
4
8,
040,
598
13,3
87,7
28
6,77
7,20
5
5,
088,
124
Cap
ital g
rant
s, in
tere
st, a
nd c
ontr
ibut
ions
3,93
6,60
4
1,
767,
300
33,9
50,9
10
3,25
3,93
3
3,
414,
668
30,7
33,4
29
56,2
68,1
93
25,2
54,6
36
6,62
2,66
8
2,
819,
030
Tot
al G
over
nmen
tal A
ctiv
ities
Pro
gram
R
even
ues
23,5
26,2
36
21,0
72,6
06
53,3
66,1
63
21,7
36,7
42
22,5
21,9
70
49,5
91,4
55
74,6
03,8
83
49,2
11,3
37
24,6
06,2
91
20,7
94,9
45
Bus
ines
s-ty
pe A
ctiv
itie
s:
Cha
rges
for
ser
vice
s:
Sew
er13
,021
,147
11
,449
,986
10
,017
,282
8,
393,
907
7,47
5,56
6
8,
688,
226
6,74
5,68
7
6,
221,
191
6,07
0,92
3
5,
078,
660
Wat
er15
,278
,926
14
,060
,971
13
,700
,586
13
,235
,852
12
,868
,228
13
,056
,457
11
,510
,051
9,
213,
231
9,36
6,53
4
9,
023,
248
Stor
mw
ater
Dra
inag
e1,
362,
516
1,39
1,10
2
1,
395,
114
1,33
3,43
4
1,
169,
116
1,30
8,66
6
1,
669,
605
1,17
2,87
7
1,
070,
093
1,01
7,91
7
Am
bula
nce
3,31
5,71
2
3,
205,
144
3,13
6,86
7
2,
356,
233
2,46
6,83
2
3,
729,
850
3,54
7,84
2
3,
809,
675
3,97
9,51
9
4,
036,
969
Cem
eter
y15
2,01
5
94,1
50
99,6
86
96,0
45
116,
562
13
0,49
4
111,
624
91
,161
85
,437
11
5,22
0
Bui
ldin
g Pe
rmits
1,24
0,24
9
1,
159,
586
574,
056
61
9,64
8
379,
300
59
0,05
5
536,
824
42
2,32
0
800,
889
1,
273,
027
Ope
ratin
g gr
ants
, int
eres
t, an
d co
ntri
butio
ns50
0
- -
- -
- -
200
30
-
Cap
ital g
rant
s, in
tere
st, a
nd c
ontr
ibut
ions
833,
172
78
2,39
1
495,
899
70
7,24
1
419,
206
2,
505,
810
1,90
6,27
3
89
0,78
0
2,00
9,01
5
4,
987,
392
Tot
al B
usin
ess-
type
Act
iviti
es P
rogr
am
Rev
enue
s35
,204
,237
32
,143
,330
29
,419
,490
26
,742
,360
24
,894
,810
30
,009
,558
26
,027
,906
21
,821
,435
23
,382
,440
25
,532
,433
Tot
al P
rim
ary
Gov
ernm
ent P
rogr
am
Rev
enue
s58
,730
,473
$
53
,215
,936
$
82
,785
,653
$
48
,479
,102
$
47
,416
,780
$
79
,601
,013
$
10
0,63
1,78
9$
71
,032
,772
$
47
,988
,731
$
46
,327
,378
$
NE
T (
EX
PE
NSE
) / R
EV
EN
UE
Gov
ernm
enta
l act
iviti
es(6
7,83
6,72
9)$
(67,
584,
507)
$
(3
4,73
3,71
8)$
(65,
007,
851)
$
(5
8,97
2,98
9)$
(33,
908,
434)
$
(3
,281
,119
)$
(41,
214,
649)
$
(5
6,91
1,89
0)$
(55,
396,
451)
$
Bus
ines
s-ty
pe a
ctiv
ities
5,57
9,47
8
2,
789,
404
1,69
7,61
0
(7
69,4
39)
(1,0
74,9
29)
3,
421,
740
(869
,364
)
(4
,351
,966
)
(2,7
48,8
23)
1,
226,
090
Tot
al P
rim
ary
Gov
ernm
ent N
et
(Exp
ense
) / R
even
ue(6
2,25
7,25
1)$
(64,
795,
103)
$
(3
3,03
6,10
8)$
(65,
777,
290)
$
(6
0,04
7,91
8)$
(30,
486,
694)
$
(4
,150
,483
)$
(45,
566,
615)
$
(5
9,66
0,71
3)$
(54,
170,
361)
$
FIS
CA
L Y
EA
R E
ND
ED
JU
NE
30,
169
237

Sch
edul
e 1.
2
Not
e: T
his
info
rmat
ion
is p
rese
nted
on
the
accr
ual b
asis
of
acco
unti
ng.
CA
RS
ON
CIT
YC
HA
NG
ES
IN
NE
T P
OS
ITIO
N (
Con
tin
ued
)L
AS
T T
EN
FIS
CA
L Y
EA
RS
(UN
AU
DIT
ED
)
2017
2016
2015
2014
2013
2012
2011
2010
2009
2008
GE
NE
RA
L R
EV
EN
UE
S A
ND
OT
HE
R
CH
AN
GE
S IN
NE
T P
OSI
TIO
N
Gov
ernm
enta
l Act
ivit
ies:
Tax
es:
Prop
erty
taxe
s27
,522
,923
$
27
,166
,226
$
26
,661
,147
$
25
,726
,135
$
26
,381
,752
$
22
,773
,809
$
22
,144
,119
$
20
,555
,087
$
19
,362
,180
$
17
,542
,259
$
Sale
s ta
xes
7,72
1,47
2
7,
084,
666
6,29
8,57
4
4,
939,
639
4,79
8,62
0
4,
591,
472
4,51
8,98
8
4,
172,
071
4,72
1,31
7
5,
669,
448
Con
solid
ated
tax
27,4
26,2
95
24,8
46,8
86
22,9
93,9
75
20,7
33,7
24
19,8
25,1
35
19,0
16,1
95
18,2
86,1
54
17,4
77,3
68
19,9
69,5
86
23,4
42,8
72
Fran
chis
e ta
xes
4,97
0,90
4
5,
244,
176
5,44
6,48
0
5,
418,
344
5,00
3,98
9
5,
019,
809
4,97
7,69
7
5,
531,
976
5,62
3,23
8
5,
371,
215
Oth
er ta
xes
281,
063
27
0,24
0
130,
249
13
3,26
6
124,
158
15
7,26
9
158,
283
13
6,85
6
194,
508
3,
911,
193
Mot
or v
ehic
le f
uel t
ax5,
157,
033
5,04
7,35
8
4,
670,
983
4,53
8,99
0
4,
462,
870
4,49
5,25
4
4,
646,
688
4,99
2,32
2
4,
182,
742
1,33
0,61
6
Gra
nts
and
cont
ribu
tions
not
rest
rict
ed to
spe
cifi
c pr
ogra
ms
- -
- -
- -
- -
- 3,
312
Unr
estr
icte
d in
vest
men
t inc
ome
81,3
70
303,
823
20
6,82
8
228,
425
62
,846
27
5,03
5
408,
911
1,
132,
477
2,05
9,08
2
3,
614,
317
Gai
n on
sal
e of
cap
ital a
sset
s-
53,4
28
164,
799
-
- -
- -
- -
Mis
cella
neou
s re
venu
e27
2,56
9
245,
396
25
1,94
3
227,
982
18
1,73
3
214,
052
23
5,66
7
183,
639
21
8,37
0
305,
300
Tra
nsfe
rs(4
06,6
38)
(311
,622
)
(6
4,73
3)
(520
,602
)
(6
02,8
25)
(718
,993
)
(2
56,7
08)
(398
,481
)
(2
96,4
02)
3,00
0,09
2
Tot
al G
over
nmen
tal A
ctiv
ities
73,0
26,9
91
69,9
50,5
77
66,7
60,2
45
61,4
25,9
03
60,2
38,2
78
55,8
23,9
02
55,1
19,7
99
53,7
83,3
15
56,0
34,6
21
64,1
90,6
24
Bus
ines
s-ty
pe A
ctiv
itie
s:
Unr
estr
icte
d in
vest
men
t inc
ome
54,3
21
105,
117
37
,662
63
,812
22
,756
49
,489
51
,433
24
0,91
4
538,
761
1,
058,
683
Gai
n on
sal
e of
cap
ital a
sset
s6,
427
82
,227
48
,009
-
- -
- -
- -
Tra
nsfe
rs40
6,63
8
311,
622
64
,733
52
0,60
2
602,
825
71
8,99
3
256,
708
39
8,48
1
296,
402
(3
,000
,092
)
Tot
al B
usin
ess-
type
Act
iviti
es46
7,38
6
498,
966
15
0,40
4
584,
414
62
5,58
1
768,
482
30
8,14
1
639,
395
83
5,16
3
(1,9
41, 4
09)
Tot
al P
rim
ary
Gov
ernm
ent A
ctiv
ities
73,4
94,3
77$
70,4
49,5
43$
66,9
10,6
49$
62,0
10,3
17$
60,8
63,8
59$
56,5
92,3
84$
55,4
27,9
40$
54,4
22,7
10$
56,8
69, 7
84$
62,2
49,2
15$
CH
AN
GE
IN
NE
T P
OSI
TIO
N
Gov
ernm
enta
l act
iviti
es5,
190,
262
$
2,36
6,07
0$
32
,026
,527
$
(3
,581
,948
)$
1,26
5,28
9$
21
,915
,468
$
51
,838
,680
$
12
,568
,666
$
(8
77,2
69)
$
8,79
4,17
3$
Bus
ines
s-ty
pe a
ctiv
ities
6,04
6,86
4
3,
288,
370
1,84
8,01
4
(1
85,0
25)
(449
,348
)
4,
190,
222
(561
,223
)
(3
,712
,571
)
(1,9
13,6
60)
(7
15,3
19)
Tot
al P
rim
ary
Gov
ernm
ent C
hang
e in
N
et P
ositi
on11
,237
,126
$
5,
654,
440
$
33,8
74,5
41$
(3,7
66,9
73)
$
81
5,94
1$
26,1
05,6
90$
51,2
77,4
57$
8,85
6,09
5$
(2
,790
,929
)$
8,07
8,85
4$
FIS
CA
L Y
EA
R E
ND
ED
JU
NE
30,
170
238

Sch
edul
e 1.
3
CA
RS
ON
CIT
YF
UN
D B
AL
AN
CE
S, G
OV
ER
NM
EN
TA
L F
UN
DS
LA
ST
TE
N F
ISC
AL
YE
AR
S
GE
NE
RA
L F
UN
D20
1720
1620
1520
1420
1320
1220
1120
1020
0920
08
GA
SB 5
4 (a
)
Non
spen
dabl
e41
5,16
2$
37
,929
$
88
,563
$
28
7,38
3$
70
3,34
9$
26
9,31
7$
23
4,70
3$
-
$
-$
-$
Res
tric
ted
801,
898
794,
732
726,
536
507,
733
698,
926
854,
838
866,
931
-
-
-
Com
mitt
ed-
-
-
-
-
-
-
-
-
-
Ass
igne
d1,
732,
478
1,
312,
836
2,
855,
740
1,
453,
798
1,
597,
932
1,
036,
620
2,
962,
474
-
-
-
Una
ssig
ned
6,44
7,47
8
6,00
5,64
5
3,95
7,47
3
4,20
2,66
0
3,29
6,33
7
2,73
1,16
7
2,83
0,79
4
-
-
-
Pri
or t
o G
ASB
54
(a)
Res
erve
d-
-
-
-
-
-
-
1,16
4,96
2
877,
986
790,
253
Unr
eser
ved:
Des
igna
ted
-
-
-
-
-
-
-
3,
294,
193
7,
979,
901
5,
143,
029
Und
esig
nate
d-
-
-
-
-
-
-
2,02
4,04
4
2,62
8,35
7
8,38
3,70
1
Tot
al G
ener
al F
und
9,39
7,01
6$
8,15
1,14
2$
7,62
8,31
2$
6,45
1,57
4$
6,29
6,54
4$
4,89
1,94
2$
6,89
4,90
2$
6,48
3,19
9$
11,4
86,2
44$
14,3
16,9
83$
AL
L O
TH
ER
GO
VE
RN
ME
NT
AL
FU
ND
S
GA
SB 5
4 (a)
Non
spen
dabl
e39
,975
$
49
,683
$
64
,001
$
10
1,92
4$
64
,913
$
82,0
36$
24
,582
$
-
$
-$
-$
Res
tric
ted
10,2
33,2
47
13,6
86,4
99
21,8
85,9
85
11,8
35,4
35
11
,130
,067
10,8
71,6
88
12
,212
,046
-
-
-
Com
mitt
ed10
,044
6,
856
7,
726
11
,513
7,60
6
5,85
3
2,40
0,00
0
-
-
-
Ass
igne
d2,
586,
593
97
2,08
6
1,
278,
375
2,
693,
268
1,
082,
317
1,
223,
257
1,
926,
574
-
-
-
Una
ssig
ned
-
-
-
-
(6
,749
)
-
(1,9
43)
-
-
-
Pri
or t
o G
ASB
54
(a)
Res
erve
d -
-
-
-
-
-
-
20,0
76
7,74
2
15,2
58
Unr
eser
ved:
Des
igna
ted
in:
Spec
ial R
even
ue F
unds
-
-
-
-
-
-
-
5,
205,
792
10
,977
,085
14
,476
,430
Deb
t Ser
vice
Fun
ds-
-
-
-
-
-
1,03
6,66
1
1,14
0,23
8
1,25
9,32
9
Cap
ital P
roje
cts
Fund
s-
-
-
-
-
-
-
51,6
09
90,0
54
73,5
52
Und
esig
nate
d in
:
Spec
ial R
even
ue F
unds
-
-
-
-
-
-
-
15
,318
,046
12,0
81,9
31
13,8
89,4
08
Deb
t Ser
vice
Fun
ds-
-
-
-
-
-
-
12,3
84
196,
616
24,3
54
Cap
ital P
roje
cts
Fund
s-
-
-
-
-
-
-
2,72
9,01
4
777,
393
3,09
5,75
4
Tot
al A
ll O
ther
G
over
nmen
tal F
unds
12
,869
,859
$
14
,715
,124
$
23
,236
,087
$
14
,642
,140
$
12,2
78,1
54$
12
,182
,834
$
16,5
61,2
59$
24,3
73,5
82$
25
,271
,059
$
32
,834
,085
$
Not
e:
Flu
ctua
tions
in th
e ge
nera
l fun
d an
d al
l oth
er g
over
nmen
tal f
und
bala
nce
rest
rict
ed a
nd u
nres
tric
ted
amou
nts
are
expl
aine
d in
the
rele
vant
yea
r M
anag
emen
t's D
iscu
ssio
n an
d A
naly
sis.
T
his
info
rmat
ion
is p
rese
nted
on
the
mod
ifie
d ac
crua
l bas
is o
f ac
coun
ting.
(a)
(UN
AU
DIT
ED
)
Pri
or to
201
1 an
d th
e im
plem
enta
tion
of G
ASB
Sta
tem
ent N
o. 5
4, f
und
bala
nces
wer
e cl
assi
fied
as
Res
erve
d or
Unr
eser
ved.
Und
er G
ASB
Sta
tem
ent N
o. 5
4, f
und
bala
nces
are
cla
ssif
ied
as N
onsp
enda
ble,
Res
tric
ted,
Com
mitt
ed, A
ssig
ned
FIS
CA
L Y
EA
R E
ND
ED
JU
NE
30,
171
239

Sch
edul
e 1.
4
Not
e: T
his
info
rmat
ion
is p
rese
nted
on
the
mod
ifie
d ac
crua
l bas
is o
f ac
coun
ting
.
CA
RS
ON
CIT
YC
HA
NG
ES
IN
FU
ND
BA
LA
NC
ES
, GO
VE
RN
ME
NT
AL
FU
ND
SL
AS
T T
EN
FIS
CA
L Y
EA
RS
2017
2016
2015
2014
2013
2012
2011
2010
2009
2008
RE
VE
NU
ES
Tax
es38
,944
,791
$
37
,886
,252
$
36
,116
,924
$
33
,841
,031
$
33
,842
,019
$
30
,389
,857
$
29
,656
,665
$
28
,093
,025
$
26
,721
,962
$
26
,801
,548
$
Lic
ense
s an
d pe
rmits
6,77
2,10
8
6,94
1,76
5
7,02
3,94
3
7,13
3,13
3
6,74
2,83
5
6,65
7,14
3
6,78
2,24
7
7,34
0,78
8
7,37
7,73
7
7,08
9,74
6
Inte
rgov
ernm
enta
l rev
enue
s38
,489
,332
34
,111
,823
33
,641
,746
31
,402
,152
31
,361
,448
32
,832
,525
32
,902
,457
49
,672
,531
32
,332
,386
30
,876
,567
Cha
rges
for
ser
vice
s13
,190
,310
12
,618
,224
11
,899
,821
11
,582
,832
11
,049
,184
11
,885
,268
11
,153
,091
11
,467
,700
11
,215
,117
13
,322
,748
Fine
s an
d fo
rfei
ts79
0,94
0
72
5,89
5
85
9,27
7
89
6,53
7
94
4,93
7
90
1,39
4
77
3,51
9
80
2,40
2
1,
046,
329
1,
023,
459
Mis
cella
neou
s2,
070,
235
2,
889,
112
2,
538,
244
2,
269,
062
2,
007,
642
1,
756,
085
1,
716,
374
2,
188,
920
3,
430,
504
4,
565,
944
Tot
al R
even
ues
100,
257,
716
95,1
73,0
71
92,0
79,9
55
87,1
24,7
47
85,9
48,0
65
84,4
22,2
72
82,9
84,3
53
99,5
65,3
66
82,1
24,0
35
83,6
80,0
12
EX
PE
ND
ITU
RE
S
Gen
eral
gov
ernm
ent
15,4
40,9
66
15,7
94,0
00
15,4
97,9
72
15,0
43,4
87
14,2
40,6
94
13,9
52,0
64
14,2
31,1
16
15,0
05,0
13
14,6
80,9
18
14,5
14,2
53
Publ
ic s
afet
y31
,855
,937
31
,680
,370
30
,277
,531
28
,880
,330
28
,605
,267
27
,779
,133
27
,313
,128
28
,362
,786
26
,595
,429
25
,954
,382
Judi
cial
6,58
2,60
5
6,03
4,38
7
5,60
4,50
0
5,35
5,80
3
5,14
3,47
0
4,97
3,38
3
4,82
4,45
7
5,07
5,73
9
4,82
2,65
1
4,70
4,94
3
Publ
ic w
orks
9,17
3,71
8
8,68
9,68
9
8,54
3,96
7
8,05
3,10
8
7,25
1,58
5
8,48
7,96
5
7,82
1,03
4
19,9
17,9
94
20,6
42,2
66
17,0
79,9
50
Sani
tatio
n1,
840,
005
1,
664,
165
1,
677,
631
1,
579,
314
1,
558,
251
1,
485,
325
1,
542,
371
1,
673,
677
1,
734,
716
3,
386,
664
Hea
lth5,
166,
670
5,
562,
398
5,
421,
238
5,
154,
954
4,
741,
438
4,
332,
571
3,
798,
124
3,
960,
626
3,
001,
006
2,
627,
724
Wel
fare
2,15
1,04
2
2,02
4,63
2
2,01
0,39
8
1,95
6,93
2
2,01
4,08
3
2,36
7,03
8
2,34
4,15
4
2,35
9,46
7
2,12
7,71
0
2,01
1,35
0
Cul
ture
and
rec
reat
ion
7,51
0,50
9
7,89
2,74
7
7,71
5,34
1
7,34
7,42
4
7,35
4,48
2
7,36
5,12
9
7,29
6,03
0
13,3
81,3
80
11,2
17,6
27
15,5
94,1
91
Com
mun
ity s
uppo
rt73
3,72
8
65
5,95
2
89
7,17
2
61
5,76
5
75
7,71
4
3,
098,
628
1,
296,
951
3,
573,
553
2,
617,
465
57
0,91
6
Air
port
74,9
03
- -
- 45
,765
4,
234
47
,506
9,
144,
072
3,
107,
641
57
9,29
5
Eco
nom
ic o
ppor
tuni
ty90
,492
16
0,39
6
13
8,77
8
17
9,51
3
18
6,69
5
30
4,57
1
32
6,95
7
4,
742,
049
2,
275,
376
60
9,17
6
Cap
ital o
utla
y14
,803
,697
14
,524
,131
10
,109
,046
4,
538,
465
6,
144,
702
7,
757,
392
11
,231
,655
8,
028
1,
084,
955
4,
084,
369
Deb
t ser
vice
:
Prin
cipa
l5,
239,
300
4,
498,
100
4,
974,
700
4,
793,
200
5,
694,
368
4,
095,
917
3,
924,
674
3,
604,
885
3,
549,
588
3,
038,
832
Inte
rest
and
fis
cal c
harg
es3,
178,
466
3,
369,
056
3,
171,
918
3,
072,
875
4,
148,
852
3,
835,
852
4,
286,
892
3,
956,
052
3,
873,
919
3,
651,
174
Tot
al E
xpen
ditu
res
103,
842,
038
102,
550,
023
96,0
40,1
92
86,5
71,1
70
87,8
87,3
66
89,8
39,2
02
90,2
85,0
49
114,
765,
321
101,
331,
267
98,4
07,2
19
Exc
ess
(Def
icie
ncy)
of
Rev
enue
s O
ver
(Und
er)
Exp
endi
ture
s (3
,584
,322
)
(7,3
76,9
52)
(3
,960
,237
)
553,
577
(1,9
39,3
01)
(5
,416
,930
)
(7,3
00,6
96)
(1
5,19
9,95
5)
(1
9,20
7,23
2)
(1
4,72
7,20
7)
(UN
AU
DIT
ED
)
FIS
CA
L Y
EA
R E
ND
ED
JU
NE
30,
172
240

Sch
edul
e 1.
4
Not
e: T
his
info
rmat
ion
is p
rese
nted
on
the
mod
ifie
d ac
crua
l bas
is o
f ac
coun
ting
.
CA
RS
ON
CIT
YC
HA
NG
ES
IN
FU
ND
BA
LA
NC
ES
, GO
VE
RN
ME
NT
AL
FU
ND
S (
Con
tin
ued
)L
AS
T T
EN
FIS
CA
L Y
EA
RS
2017
2016
2015
2014
2013
2012
2011
2010
2009
2008
OT
HE
R F
INA
NC
ING
SOU
RC
ES
(USE
S)
Cap
ital a
sset
sal
es43
,552
73
,929
64
,812
-
13,0
97
10,5
45
3,53
5
- -
-
Cap
ital l
ease
s84
,845
10
,300
-
- -
- -
69,4
33
53,4
67
11,2
28
Bon
ds is
sued
3,42
5,29
3
- 13
,600
,000
-
- -
7,21
0,00
0
7,90
0,00
0
9,05
5,00
0
-
Not
es is
sued
- -
- 2,
651,
000
2,
269,
500
-
- -
- -
Paym
ent t
o re
fund
ed b
ond
escr
ow a
gent
(5,8
59,7
59)
(2
3,70
1,58
2)
(9
,418
,592
)
- (3
0,02
6,82
7)
- (7
,244
,702
)
- -
-
Ref
undi
ng b
onds
issu
ed5,
951,
000
21
,580
,000
8,
400,
000
-
30,7
67,2
00
- -
- -
-
Ref
undi
ng n
otes
issu
ed-
- -
- -
- -
- -
-
Prem
ium
on
refu
ndin
g bo
nds
issu
ed-
1,83
6,17
2
1,57
1,22
3
- 84
0,06
2
- 22
6,24
3
- -
-
Tra
nsfe
rs in
11,9
53,1
09
11,9
19,0
64
10,8
21,0
56
10,9
28,6
30
9,66
8,85
6
9,36
4,20
6
8,27
9,95
9
15,5
00,2
33
11,8
26,6
03
12,9
52,5
93
Tra
nsfe
rs o
ut(1
2,64
3,10
9)
(1
2,30
9,06
4)
(11,
307,
577)
(11,
614,
191)
(10,
092,
665)
(10,
339,
206)
(8,5
74,9
59)
(1
4,17
0,23
3)
(1
2,12
1,60
3)
(8
,763
,820
)
Prem
ium
on
bond
s is
sued
- -
- -
- -
- -
- -
Dis
coun
t on
bond
s is
sued
- -
- -
- -
- -
- -
Tot
al O
ther
Fin
anci
ng S
ourc
es (
Use
s)2,
954,
931
(5
91,1
81)
13,7
30,9
22
1,96
5,43
9
3,43
9,22
3
(964
,455
)
(9
9,92
4)
9,29
9,43
3
8,81
3,46
7
4,20
0,00
1
Net
Cha
nge
in F
und
Bal
ance
s(6
29,3
91)
$
(7,9
68,1
33)
$
9,
770,
685
$
2,
519,
016
$
1,
499,
922
$
(6
,381
,385
)$
(7,4
00,6
20)
$
(5
,900
,522
)$
(10,
393,
765)
$
(10,
527,
206)
$
9.45
%8.
94%
9.48
%9.
59%
12.0
4%9.
66%
10.3
9%8.
44%
9.18
%8.
74%
Deb
t ser
vice
as
a pe
rcen
tage
of
nonc
apita
l ex
pend
iture
s
(UN
AU
DIT
ED
)
FIS
CA
L Y
EA
R E
ND
ED
JU
NE
30,
173
241

Sch
edul
e 2.
1
CA
RS
ON
CIT
YA
SS
ES
SE
D A
ND
ES
TIM
AT
ED
AC
TU
AL
VA
LU
E O
F T
AX
AB
LE
PR
OP
ER
TY
LA
ST
TE
N F
ISC
AL
YE
AR
S
TO
TA
L
PE
RSO
NA
LP
ER
CE
NT
AG
E
FIS
CA
L Y
EA
RR
EA
L P
RO
PE
RT
Y A
SSE
SSE
D V
AL
UE
PR
OP
ER
TY
LE
SS:
TA
XA
BL
EE
STIM
AT
ED
OF
TA
XA
BL
ET
OT
AL
EN
DE
DA
SSE
SSE
DT
AX
EX
EM
PT
ASS
ESS
ED
AC
TU
AL
VA
LU
E T
OD
IRE
CT
JUN
E 3
0,R
ESI
DE
NT
IAL
CO
MM
ER
CIA
LIN
DU
STR
IAL
OT
HE
RV
AL
UE
PR
OP
ER
TY
VA
LU
EV
AL
UE
AC
TU
AL
VA
LU
ET
AX
RA
TE
(1)
2017
1,14
3,41
3,10
5$
511,
051,
223
$
84
,437
,524
$
83,5
17,2
86$
79
,293
,413
$
456,
557,
778
$
1,44
5,15
4,77
3$
4,
129,
013,
637
$
35.0
0%2.
1400
2016
1,10
6,92
5,70
4
495,
344,
116
75
,167
,547
36,0
56,8
08
70
,831
,634
410,
916,
956
1,37
3,40
8,85
3
3,
924,
025,
294
35.0
0%2.
1400
2015
988,
583,
791
514,
498,
082
70
,590
,643
33,2
35,0
70
69
,757
,391
389,
774,
295
1,28
6,89
0,68
2
3,
676,
830,
520
35.0
0%2.
1600
2014
935,
189,
789
495,
884,
820
70
,652
,606
26,0
31,9
84
69
,572
,163
358,
575,
304
1,23
8,75
6,05
8
3,
539,
303,
022
35.0
0%2.
1800
2013
1,01
6,45
4,81
4
510,
880,
941
80
,961
,017
25,8
25,5
04
68
,172
,306
320,
479,
554
1,38
1,81
5,02
8
3,
948,
042,
937
35.0
0%2.
1800
2012
1,13
6,66
4,05
6
554,
083,
272
90
,326
,979
30,1
74,8
83
71
,820
,430
376,
697,
685
1,50
6,37
1,93
5
4,
303,
919,
814
35.0
0%1.
7072
2011
1,29
6,75
5,93
1
627,
675,
034
10
5,36
7,92
6
34
,738
,957
79,4
06,8
76
45
5,80
1,18
9
1,
688,
143,
535
4,82
3,26
7,24
2
35
.00%
1.70
66
2010
1,43
4,76
4,12
8
660,
942,
065
10
4,14
5,75
4
25
,954
,361
83,8
61,1
20
48
2,59
4,79
6
1,
827,
072,
632
5,22
0,20
7,52
0
35
.00%
1.70
70
2009
1,42
6,05
2,05
4
631,
533,
390
99
,424
,981
30,3
83,7
65
87
,038
,009
431,
185,
202
1,84
3,24
6,99
7
5,
266,
419,
991
35.0
0%1.
7069
2008
1,20
6,80
0,49
9
547,
565,
065
81
,726
,034
48,6
75,2
99
86
,113
,782
358,
490,
827
1,61
2,38
9,85
2
4,
606,
828,
149
35.0
0%1.
5007
Sour
ce:
Car
son
City
Ass
esso
r
(1)
Per
hund
red
dolla
rs o
f as
sess
ed v
alua
tion.
(UN
AU
DIT
ED
)
Purs
uant
to N
RS
361.
227,
rea
l pro
pert
y is
val
ued
at ta
xabl
e va
lue,
det
erm
ined
by
calc
ulat
ing
the
full
cash
val
ue (
mar
ket v
alue
) of
land
and
est
imat
ed r
epla
cem
ent c
ost o
f im
prov
emen
ts le
ss a
ppro
pria
te d
epre
ciat
ion.
Tax
able
ass
esse
d va
lue
is 3
5% o
f es
timat
ed
actu
al v
alue
. R
eal p
rope
rty
is r
eapp
rais
ed a
t lea
st e
very
fiv
e ye
ars.
Pro
pert
y no
t rea
ppra
ised
is r
eval
ued
annu
ally
usi
ng v
ario
us a
ppro
ved
met
hods
.
174
242

Sch
edul
e 2.
2
CA
RS
ON
CIT
YD
IRE
CT
AN
D O
VE
RL
AP
PIN
G P
RO
PE
RT
Y T
AX
RA
TE
SL
AS
T T
EN
FIS
CA
L Y
EA
RS
(TA
X R
AT
E P
ER
$10
0 A
SS
ES
SE
D V
AL
UA
TIO
N)
2017
2016
2015
2014
2013
2012
2011
2010
2009
2008
CA
RSO
N C
ITY
DIR
EC
T R
AT
E
Ope
ratin
g R
ate
1.86
521.
8525
1.85
081.
8858
1.70
401.
2102
1.21
021.
2102
1.21
021.
2102
Vot
er A
ppro
ved
0.05
000.
0500
0.05
000.
0500
0.05
000.
0500
0.05
000.
0500
0.05
000.
0500
Leg
isla
tive
Ove
rrid
es0.
2248
0.23
750.
2592
0.24
420.
4260
0.44
700.
4464
0.44
680.
4467
0.24
05
Deb
t Ser
vice
0.00
000.
0000
0.00
000.
0000
0.00
000.
0000
0.00
000.
0000
0.00
000.
0000
Tot
al C
arso
n C
ity D
irec
t Rat
e2.
1400
2.14
002.
1600
2.18
002.
1800
1.70
721.
7066
1.70
701.
7069
1.50
07
OV
ER
LA
PP
ING
RA
TE
S
Car
son
City
Sch
ool D
istr
ict
1.18
001.
1800
1.18
001.
1800
1.18
001.
1800
1.18
001.
2200
1.22
001.
2200
Stat
e of
Nev
ada
0.17
000.
1700
0.17
000.
1700
0.17
000.
1700
0.17
000.
1700
0.17
000.
1700
Eag
le V
alle
y U
nder
grou
nd W
ater
0.00
000.
0000
0.00
000.
0000
0.00
000.
0000
0.00
100.
0009
0.00
090.
0011
Car
son
Val
ley
Gro
und
Wat
er B
asin
0.00
000.
0000
0.00
000.
0000
0.00
000.
0000
0.00
230.
0020
0.00
100.
0025
Sub-
Con
serv
ancy
0.03
000.
0300
0.03
000.
0300
0.03
000.
0300
0.03
000.
0300
0.03
000.
0300
Sier
ra F
ores
t Fir
e0.
0000
0.00
000.
0000
0.00
000.
1000
0.10
000.
1000
0.10
000.
1000
0.10
00
Tot
al O
verl
appi
ng R
ates
1.38
001.
3800
1.38
001.
3800
1.48
001.
4800
1.48
331.
5229
1.52
191.
5236
Tot
al C
arso
n C
ity P
rope
rty
Tax
Rat
e3.
5200
3.52
003.
5400
3.56
003.
6600
3.18
723.
1899
3.22
993.
2288
3.02
43
3.07
453.
0745
3.09
553.
1155
3.21
552.
7427
2.87
372.
8895
2.63
622.
8108
Sour
ce:
Nev
ada
Dep
artm
ent o
f T
axat
ion
(UN
AU
DIT
ED
)
RE
DE
VE
LO
PM
EN
T A
GE
NC
Y O
F C
AR
SON
C
ITY
FIS
CA
L Y
EA
R E
ND
ED
JU
NE
30,
175
243
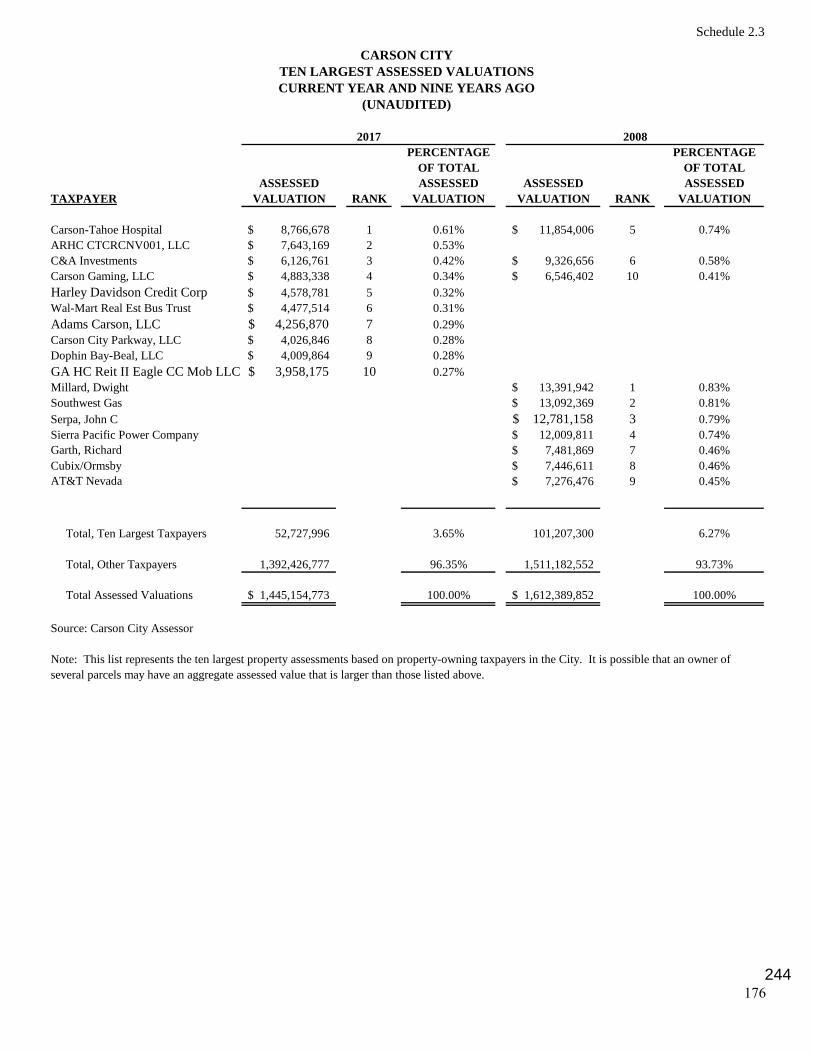
Schedule 2.3
CARSON CITYTEN LARGEST ASSESSED VALUATIONSCURRENT YEAR AND NINE YEARS AGO
PERCENTAGE PERCENTAGEOF TOTAL OF TOTAL
ASSESSED ASSESSED ASSESSED ASSESSEDTAXPAYER VALUATION RANK VALUATION VALUATION RANK VALUATION
Carson-Tahoe Hospital 8,766,678$ 1 0.61% 11,854,006$ 5 0.74%ARHC CTCRCNV001, LLC 7,643,169$ 2 0.53%C&A Investments 6,126,761$ 3 0.42% 9,326,656$ 6 0.58%Carson Gaming, LLC 4,883,338$ 4 0.34% 6,546,402$ 10 0.41%Harley Davidson Credit Corp 4,578,781$ 5 0.32%Wal-Mart Real Est Bus Trust 4,477,514$ 6 0.31%Adams Carson, LLC 4,256,870$ 7 0.29%Carson City Parkway, LLC 4,026,846$ 8 0.28%Dophin Bay-Beal, LLC 4,009,864$ 9 0.28%GA HC Reit II Eagle CC Mob LLC 3,958,175$ 10 0.27%Millard, Dwight 13,391,942$ 1 0.83%Southwest Gas 13,092,369$ 2 0.81%Serpa, John C 12,781,158$ 3 0.79%Sierra Pacific Power Company 12,009,811$ 4 0.74%Garth, Richard 7,481,869$ 7 0.46%Cubix/Ormsby 7,446,611$ 8 0.46%AT&T Nevada 7,276,476$ 9 0.45%
Total, Ten Largest Taxpayers 52,727,996 3.65% 101,207,300 6.27%
Total, Other Taxpayers 1,392,426,777 96.35% 1,511,182,552 93.73%
Total Assessed Valuations 1,445,154,773$ 100.00% 1,612,389,852$ 100.00%
Source: Carson City Assessor
Note: This list represents the ten largest property assessments based on property-owning taxpayers in the City. It is possible that an owner ofseveral parcels may have an aggregate assessed value that is larger than those listed above.
(UNAUDITED)
2017 2008
176244

Schedule 2.4
PROPERTY TAX LEVIES AND COLLECTIONSLAST TEN FISCAL YEARS
CURRENT YEAR TOTALS TO DATE
FISCAL YEAR TAXES TAX PERCENT OF DELINQUENT TAX TAX PERCENT OFENDED JUNE 30, LEVIED COLLECTIONS TAXES LEVIED COLLECTIONS COLLECTIONS TAXES LEVIED
2008 32,946 32,585 98.90% 361 32,946 100.00%
2009 35,529 34,860 98.12% 669 35,529 100.00%
2010 37,735 37,075 98.25% 660 37,735 100.00%
2011 39,448 38,714 98.14% 733 39,447 100.00%
2012 39,450 38,463 97.50% 987 39,450 100.00%
2013 40,823 40,082 98.18% 741 40,823 100.00%
2014 39,994 39,314 98.30% 677 39,991 99.99%
2015 41,063 40,489 98.60% 561 41,050 99.97%
2016 41,696 41,237 98.90% 414 41,651 99.89%
2017 42,164 41,916 99.41% - 41,916 99.41%
Source: Carson City Treasurer's Office
CARSON CITY
(AMOUNT EXPRESSED IN THOUSANDS)(UNAUDITED)
177245

Sch
edul
e 3.
1
CA
RS
ON
CIT
YR
AT
IOS
OF
OU
TS
TA
ND
ING
DE
BT
BY
TY
PE
LA
ST
TE
N F
ISC
AL
YE
AR
S(U
NA
UD
ITE
D)
AC
TIV
ITIE
S D
EB
T
BO
ND
SN
OT
ES
2017
63,2
09,4
63$
63,2
09,4
63$
1.53
%1,
171.
22$
15,3
84,2
00$
7,07
3,03
8$
65
,202
$
107,
398,
653
$
785,
800
$
193,
916,
356
$
8.06
%3,
593.
11$
2016
67,2
19,0
87
67,2
19,0
87
1.71
%1,
229.
59
15,9
70,5
00
3,36
1,30
0
10
,181
87,1
58,7
85
1,09
0,80
1
174,
810,
654
7.47
%3,
197.
68
2015
67,2
30,0
67
67,2
45,5
40
1.83
%1,
246.
00
17,1
59,1
00
3,89
5,80
0
-
78,2
25,5
19
1,38
9,70
0
167,
915,
659
6.98
%3,
111.
34
2014
56,3
56,9
23
56,3
56,9
23
1.59
%1,
016.
52
18,0
47,9
00
4,59
1,70
0
6,
081
78
,475
,307
1,
682,
100
15
9,16
0,01
1
6.
99%
2,87
0.80
2013
59,5
11,0
54
59,5
11,0
54
1.51
%1,
046.
46
18,8
97,0
00
2,55
4,80
0
25
,590
80,1
54,4
98
1,97
0,50
0
163,
113,
442
7.33
%2,
868.
23
2012
62,3
36,4
01
62,3
36,4
01
1.45
%1,
111.
07
19,4
80,7
00
1,36
0,36
7
43
,823
77,4
93,6
36
2,14
8,00
0
162,
862,
927
7.60
%2,
902.
82
2011
64,9
90,7
27
64,9
90,7
27
1.35
%1,
171.
26
20,2
22,1
00
2,21
2,55
8
67
,772
61,9
86,5
58
2,39
5,00
0
151,
874,
715
7.25
%2,
737.
07
2010
67,5
19,1
31
67,5
19,1
31
1.29
%1,
221.
54
20,8
66,0
00
3,01
8,92
8
99
,470
48,5
42,1
43
2,44
8,00
0
142,
493,
672
6.38
%2,
577.
95
2009
70,0
42,7
00
70,0
42,7
00
1.33
%1,
239.
56
13,4
27,6
00
3,25
9,64
4
10
9,18
2
50,4
84,5
97
- 13
7,32
3,72
3
6.16
%2,
430.
25
2008
72,4
62,4
54
72,4
62,4
54
1.57
%1,
258.
03
4,91
5,00
0
3,
847,
078
100,
363
53
,797
,713
-
135,
122,
608
5.
71%
2,34
5.88
2007
74,5
74,3
51
74,5
74,3
51
1.82
%1,
291.
93
5,14
0,00
0
4,
399,
013
120,
447
57
,120
,185
-
141,
353,
996
5.
83%
2,44
8.83
Not
es:
(1)
See
Sche
dule
2.1
for
est
imat
ed a
ctua
l pro
pert
y va
lue.
(2)
See
Sche
dule
4.1
for
pop
ulat
ion
and
pers
onal
inco
me
data
.
TY
PE
AC
TIV
ITIE
S
CA
PIT
AL
L
EA
SES
BU
SIN
ESS
PR
OP
RIE
TA
RY
OT
HE
R G
OV
ER
NM
EN
TA
L
FIS
CA
L
YE
AR
E
ND
ED
JU
NE
30,
GE
NE
RA
L
OB
LIG
AT
ION
B
ON
DS
TO
TA
L
GE
NE
RA
L
BO
ND
ED
D
EB
T
GE
NE
RA
L
OB
LIG
AT
ION
N
OT
ES
GE
NE
RA
L B
ON
DE
D D
EB
T
PE
R
CA
PIT
A (
2)
PE
RC
EN
T
OF
A
CT
UA
L
PR
OP
ER
TY
VA
LU
E
PE
R
CA
PIT
A (
2)R
EV
EN
UE
B
ON
DS
TO
TA
L
PR
IMA
RY
G
OV
ER
NM
EN
T
PE
RC
EN
T
OF
P
ER
SON
AL
IN
CO
ME
(2)
178
246

Schedule 3.2
GENERAL PRESENTLYOBLIGATION SELF-SUPPORTING
DEBT GENERAL PERCENT APPLICABLEOUTSTANDING OBLIGATION DEBT APPLICABLE (1) NET DEBT
NAME OF GOVERNMENT UNITDirect: City of Carson City: Governmental Activity Bonds(2) 63,209,463$ 63,209,463$ 100.00% - Revenue Bonds(3) 15,384,200 15,970,500 Notes Payable 7,073,038 7,073,038
Total Direct Debt 85,666,701 86,253,001 - Overlapping: Carson City School District 59,050,000 - 100.00% 59,050,000 Total General Obligation Direct and Overlapping Debt 144,716,701$ 86,253,001$ 59,050,000$
Source: Carson City Finance Office and Carson City School District
(1) Based on fiscal year 2015-16 assessed valuation in the respective jurisdiction.(2) Includes all govermental debt activities and amounts are net of related discounts, premiums and deferred refunding charges.(3) Revenue bonds are not general obligation, but are speical limited obligations payable solely from the pledged revenue.
CARSON CITY
(UNAUDITED)FISCAL YEAR ENDED JUNE 30, 2017
AND OVERLAPPING DEBTGENERAL OBLIGATION DIRECT
179247

Sch
edul
e 3.
3
LE
GA
L D
EB
T M
AR
GIN
IN
FO
RM
AT
ION
LA
ST
TE
N F
ISC
AL
YE
AR
S
Leg
al D
ebt
Mar
gin
Cal
cula
tion
for
Fis
cal Y
ear
End
ed J
une
30, 2
017
Ass
esse
d va
lue
of ta
xabl
e pr
oper
ty(1
)
Deb
t lim
it (1
5% o
f as
sess
ed v
alue
)
Deb
t app
licab
le to
lim
it:G
over
nmen
tal a
ctiv
ities
59,6
70,0
00$
Bus
ines
s-ty
pe a
ctiv
ities
105,
797,
430
Les
s: A
mou
nt a
vaila
ble
for
repa
ymen
t
of g
ener
al o
blig
atio
n de
bt(8
21,4
00)
Tot
al n
et d
ebt a
pplic
able
to li
mita
tion
Leg
al d
ebt m
argi
n
2017
2016
2015
2014
2013
2012
2011
2010
2009
2008
Deb
t lim
it22
6,79
0,98
9$
213,
697,
900
$
20
0,70
1,00
4$
192,
949,
840
$
21
4,83
3,13
9$
235,
045,
345
$
26
6,22
5,88
1$
288,
971,
603
$
28
9,55
2,28
8$
249,
494,
536
$
T
otal
net
deb
t sub
ject
to li
mita
tion
164,
646,
030
14
8,00
0,60
7
143,
734,
928
13
4,57
6,37
0
139,
259,
606
13
9,63
0,03
7
126,
777,
285
11
5,86
1,27
4
123,
586,
941
12
9,90
7,24
5
Leg
al D
ebt M
argi
n62
,144
,959
$
65
,697
,293
$
56
,966
,076
$
58
,373
,470
$
75
,573
,533
$
95
,415
,308
$
13
9,44
8,59
6$
173,
110,
329
$
16
5,96
5,34
7$
119,
587,
291
$
Tot
al n
et d
ebt s
ubje
ct to
lim
itatio
nas
a p
erce
ntag
e of
deb
t lim
it72
.6%
69.3
%71
.6%
69.7
%64
.8%
59.4
%47
.6%
40.1
%42
.7%
52.1
%
Not
e: T
he le
gal d
ebt l
imit
is s
et f
orth
in N
RS
266.
600.
(1)
Incl
udes
Red
evel
opm
ent A
utho
rity
am
ount
of
$47,
576,
211.
FIS
CA
L Y
EA
R E
ND
ED
JU
NE
30,
164,
646,
030
62
,144
,959
$
1,51
1,93
9,92
6$
CA
RS
ON
CIT
Y
(UN
AU
DIT
ED
)
226,
790,
989
180
248
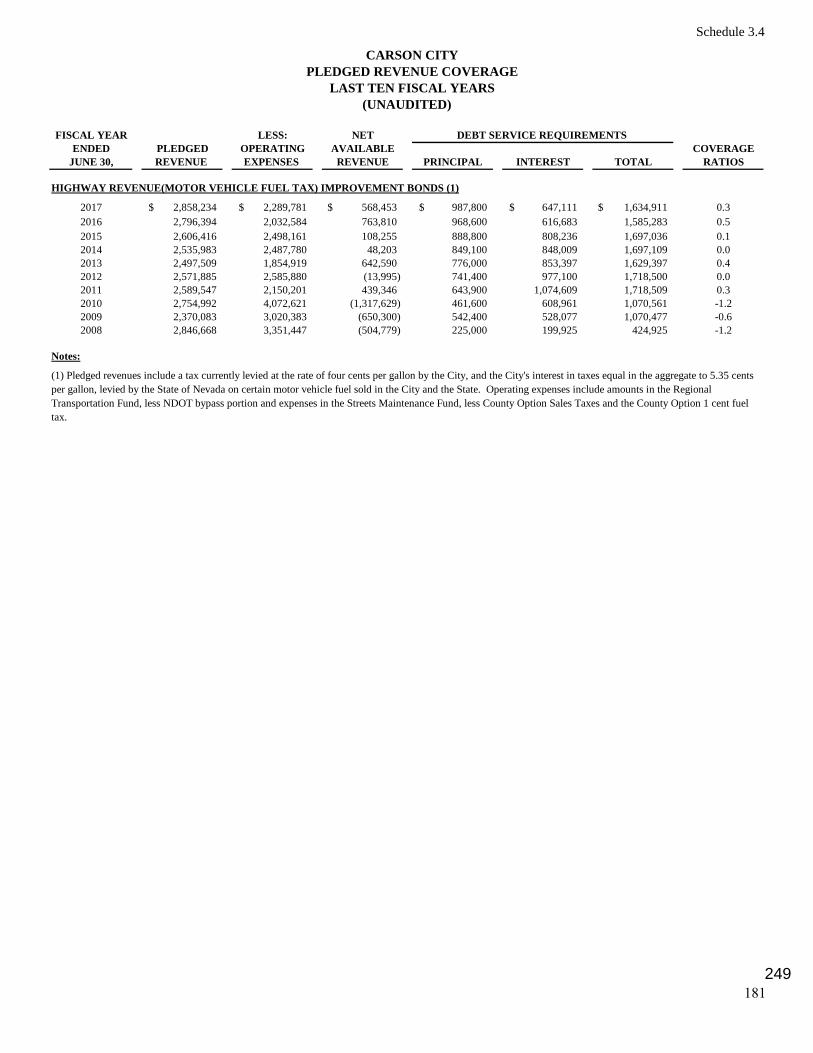
Schedule 3.4
CARSON CITYPLEDGED REVENUE COVERAGE
LAST TEN FISCAL YEARS
FISCAL YEAR LESS: NET DEBT SERVICE REQUIREMENTS ENDED PLEDGED OPERATING AVAILABLE COVERAGE
JUNE 30, REVENUE EXPENSES REVENUE PRINCIPAL INTEREST TOTAL RATIOS
HIGHWAY REVENUE(MOTOR VEHICLE FUEL TAX) IMPROVEMENT BONDS (1)
2017 2,858,234$ 2,289,781$ 568,453$ 987,800$ 647,111$ 1,634,911$ 0.32016 2,796,394 2,032,584 763,810 968,600 616,683 1,585,283 0.52015 2,606,416 2,498,161 108,255 888,800 808,236 1,697,036 0.12014 2,535,983 2,487,780 48,203 849,100 848,009 1,697,109 0.02013 2,497,509 1,854,919 642,590 776,000 853,397 1,629,397 0.42012 2,571,885 2,585,880 (13,995) 741,400 977,100 1,718,500 0.02011 2,589,547 2,150,201 439,346 643,900 1,074,609 1,718,509 0.32010 2,754,992 4,072,621 (1,317,629) 461,600 608,961 1,070,561 -1.22009 2,370,083 3,020,383 (650,300) 542,400 528,077 1,070,477 -0.62008 2,846,668 3,351,447 (504,779) 225,000 199,925 424,925 -1.2
Notes:
(UNAUDITED)
(1) Pledged revenues include a tax currently levied at the rate of four cents per gallon by the City, and the City's interest in taxes equal in the aggregate to 5.35 cents per gallon, levied by the State of Nevada on certain motor vehicle fuel sold in the City and the State. Operating expenses include amounts in the Regional Transportation Fund, less NDOT bypass portion and expenses in the Streets Maintenance Fund, less County Option Sales Taxes and the County Option 1 cent fuel tax.
181249

Sch
edul
e 4.
1
CA
RS
ON
CIT
YD
EM
OG
RA
PH
IC A
ND
EC
ON
OM
IC S
TA
TIS
TIC
SL
AS
T T
EN
FIS
CA
L Y
EA
RS
FIS
CA
L Y
EA
RC
ITY
AR
EA
TO
TA
LP
ER
CA
PIT
AP
UB
LIC
BU
SIN
ESS
TO
TA
LT
OT
AL
EN
DE
DP
OP
UL
AT
ION
(SQ
UA
RE
MIL
ES)
PE
RSO
NA
LP
ER
SON
AL
UN
EM
PL
OY
ME
NT
SCH
OO
LL
ICE
NSE
SC
ON
STR
UC
TIO
NC
ON
STR
UC
TIO
NJU
NE
30,
(1)
(6)
INC
OM
E (
3)IN
CO
ME
(3)
RA
TE
(4)
EN
RO
LL
ME
NT
(5)
ISSU
ED
(2)
PE
RM
ITS
(6)
VA
LU
E (
6)
2017
54,2
7314
7.00
2,44
5,73
3,00
0$
45,0
64$
4.6%
10,4
3856
913
5596
,537
,447
$
20
1653
,969
147.
002,
404,
851,
000
44
,560
6.
9%11
,615
541
1272
77,9
37,4
28
2015
54,6
6814
7.00
2,33
9,34
9,00
0
42,7
92
7.3%
11,7
4853
193
436
,780
,188
20
1455
,441
147.
002,
275,
631,
286
41
,046
9.
0%11
,425
553
1,02
940
,284
,101
20
1356
,869
147.
002,
225,
170,
232
39
,128
10
.1%
11,6
2462
078
822
,908
,525
20
1256
,105
147.
002,
142,
088,
900
38
,180
11
.7%
12,4
3276
681
846
,358
,861
20
1155
,488
147.
002,
094,
672,
000
37
,750
12
.5%
13,3
461,
042
939
42,2
09,7
40
2010
55,2
7414
7.00
2,23
3,74
1,00
0
40,4
09
13.8
%13
,582
934
276
16,9
55,0
05
2009
56,5
0614
7.00
2,22
8,37
8,00
0
40,2
33
11.5
%13
,532
967
242
64,1
72,5
62
2008
57,6
0014
7.00
2,36
4,85
0,00
0
42,5
70
6.7%
13,4
931,
242
295
74,8
01,1
57
NR
= N
ot r
epor
ted
Sour
ces:
(1)
Stat
e of
Nev
ada,
Dem
ogra
pher
's O
ffic
e es
tim
ated
, 198
6-20
09 a
nd 2
011-
2015
; Fin
al C
ensu
s in
form
atio
n av
aila
ble
for
2010
.(2
)C
ity
of C
arso
n C
ity,
Bus
ines
s L
icen
se D
ivis
ion
(3)
U.S
. Dep
artm
ent o
f C
omm
erce
, Bur
eau
of E
cono
mic
Ana
lysi
s, 2
005-
2013
, for
Car
son
Cit
y M
etro
polit
an A
rea;
Est
imat
ed f
or 2
014
and
2015
as
data
was
una
vaila
ble
at ti
me
of p
ublic
atio
n.(4
)St
ate
of N
evad
a, D
epar
tmen
t of
Em
ploy
men
t Tra
inin
g &
Reh
abili
tati
on f
or C
arso
n C
ity
Met
ropo
litan
Are
a(5
)In
clud
es e
lem
enta
ry, j
unio
r hi
gh, h
igh
scho
ol, a
nd c
omm
unit
y co
llege
enr
ollm
ent.
Info
rmat
ion
obta
ined
fro
m th
e C
arso
n C
ity
Scho
ol D
istr
ict a
nd W
este
rn N
evad
a C
olle
ge -
Car
son
Cit
y ca
mpu
s.(6
)C
ity
of C
arso
n C
ity,
Bui
ldin
g an
d Sa
fety
Dep
artm
ent
(UN
AU
DIT
ED
)
182
250

Schedule 4.2
CARSON CITYPRINCIPAL EMPLOYERS
CURRENT YEAR AND NINE YEARS AGO
PERCENTAGE PERCENTAGEOF TOTAL OF TOTALCOUNTY(2) COUNTY
EMPLOYER EMPLOYEES (1) RANK EMPLOYMENT EMPLOYEES (1) RANK EMPLOYMENT
Carson Tahoe Hospital 1000-1499 1 5.05% 1000-1499 1 3.49%Carson City School District 1000-1499 2 5.05% 1000-1499 2 3.24%City of Carson City 700-799 3 3.03% 700-799 3 2.42%State Department of Transportation 700-799 4 3.03% 600-699 4 2.12%Western Nevada College 500-599 5 2.22% 400-499 7 1.43%State Department of Corrections 400-499 6 1.82%State Department of Motor Vehicles 300-399 7 1.41% 300-399 9 1.22%Legislative Counsel Bureau 300-399 8 1.41%Click Bond Inc. 300-399 9 1.41%Casino Fandango 300-399 10 1.41% 400-499 6 1.46%Wal-Mart Supercenter 300-399 10 1.13%Chromalloy Nevada 400-499 8 1.36%Carson City Nugget 600-699 5 2.12%
Total Carson City Area Covered Employment 24,741 29,871
Notes:(1) Nevada Revised Statutes Chapter 612 stipulate that actual employment for individual employers may not be published.(2) The State of Nevada changed it's reporting requirements in 2008 - each division now reports information separately.
(UNAUDITED)
2017 2008
Source: Each of the two years reflect respective June information as compiled by the Nevada Department of Employment, Training, and Rehabilitation, Division of Labor Marketing.
183251

This page intentionally left blank.
252

Sch
edul
e 5.
1
CA
RS
ON
CIT
YF
UL
L-T
IME
EQ
UIV
AL
EN
T C
ITY
GO
VE
RN
ME
NT
EM
PL
OY
EE
S B
Y F
UN
CT
ION
LA
ST
TE
N F
ISC
AL
YE
AR
S
2017
2016
2015
2014
2013
2012
2011
2010
2009
2008
FU
NC
TIO
N:
Gen
eral
Gov
ernm
ent
109.
5010
7.50
106.
7510
2.48
100.
5510
1.00
104.
3510
8.10
108.
8012
3.35
Publ
ic S
afet
y24
0.70
229.
6022
8.10
228.
0022
8.80
227.
5522
8.25
254.
7525
6.85
259.
45
Judi
cial
36.0
044
.00
44.0
043
.00
42.7
544
.50
42.5
044
.05
45.3
045
.00
Publ
ic W
orks
50.6
050
.60
46.3
545
.45
43.9
545
.95
44.9
046
.10
53.1
558
.25
Sani
tatio
n10
.50
9.50
9.50
9.60
9.70
9.60
9.30
10.7
513
.35
13.0
5
Hea
lth36
.28
36.1
543
.85
37.7
537
.25
29.9
630
.00
30.0
020
.00
23.2
5
Wel
fare
5.47
4.95
4.95
4.00
4.00
4.00
4.00
5.00
3.00
2.00
Cul
ture
and
Rec
reat
ion
44.8
843
.88
44.8
844
.88
43.8
843
.88
43.8
848
.88
48.9
357
.82
Com
mun
ity S
uppo
rt0.
000.
000.
000.
000.
000.
000.
000.
000.
002.
00
Util
ities
51.0
551
.05
51.0
548
.45
48.8
552
.95
52.8
050
.90
48.1
347
.50
Oth
er0.
000.
000.
000.
000.
000.
000.
000.
000.
000.
00
T
otal
584.
9857
7.23
579.
4356
3.61
559.
7355
9.39
559.
9859
8.53
597.
5163
1.67
Sour
ce:
Cit
y of
Car
son
Cit
y Fi
nanc
e D
epar
tmen
t
(UN
AU
DIT
ED
)
FIS
CA
L Y
EA
R E
ND
ED
JU
NE
30,
184
253

Sche
dule
5.2
CA
RSO
N C
ITY
OP
ER
AT
ING
IN
DIC
AT
OR
S B
Y F
UN
CT
ION
/ P
RO
GR
AM
2017
2016
2015
2014
2013
2012
2011
2010
2009
2008
FU
NC
TIO
N /
PR
OG
RA
M:
Gen
eral
Gov
ern
men
t
Bus
ines
s lic
ense
s is
sued
(3)
569
541
531
553
620
788
818
934
967
1,24
2
Judi
cial
: (1
)
Mun
icip
al C
ourt
Cas
es F
iled:
Cri
min
al C
ases
:
Felo
ny d
eath
pen
alty
00
00
00
00
00
Felo
ny, c
rim
es a
gain
st p
erso
ns13
713
213
811
012
611
211
711
223
137
4
Felo
ny, c
rim
es a
gain
st p
rope
rty
238
182
200
170
194
171
230
196
467
228
Gro
ss m
isde
mea
nor,
cri
mes
aga
inst
per
sons
5058
4752
8154
5667
4364
Gro
ss m
isde
mea
nor,
cri
mes
aga
inst
pro
pert
y26
2212
2419
1123
1545
42
Mis
dem
eano
r, n
on-t
raff
ic1,
560
1,50
51,
553
1,38
61,
633
1,69
61,
473
1,72
62,
228
1,49
2
Tra
ffic
and
par
king
vio
latio
ns8,
975
8,63
49,
899
10,6
9212
,414
13,7
6911
,869
11,0
1219
,944
16,4
60
Civ
il C
ases
:
Gen
eral
1,04
265
574
81,
154
1,70
81,
952
2,24
92,
926
2,47
42,
514
Smal
l cla
ims
298
379
283
258
350
421
442
472
535
638
Lan
dlor
d/te
nant
(su
mm
ary
evic
tion)
835
959
893
1,28
11,
189
1,09
51,
126
954
1,16
51,
473
Req
uest
for
dom
estic
vio
lenc
e pr
otec
tive
orde
rs35
545
440
143
143
145
446
047
449
648
4
Req
uest
for
pro
tect
ion
orde
rs (
non-
dom
. vio
lenc
e)34
029
229
933
527
126
629
326
937
934
6
Pu
blic
Saf
ety
Pol
ice:
(5)
Num
ber
of s
wor
n po
lice
pers
onne
l and
off
icer
s95
9592
9292
9191
9999
98
Num
ber
of p
hysi
cal a
rres
ts3,
295
2,91
12,
865
2,14
02,
823
2,78
41,
925
2,62
12,
797
3,26
5
Num
ber
of tr
affi
c ac
cide
nts
549
485
434
427
358
474
250
832
973
1,03
5
Fire
: (6)
Num
ber
of f
iref
ight
ers
5858
5959
5960
5864
6464
Num
ber
of c
alls
ans
wer
ed10
,198
9,87
69,
465
8,50
38,
332
7,83
87,
620
7,46
67,
515
7,94
1
Num
ber
of f
ire
prev
entio
n in
spec
tions
1,33
71,
478
1,51
51,
410
638
1,26
81,
170
2,52
92,
029
2,09
0
Pu
blic
Wor
ks (
4)
Num
ber
of s
tree
t lig
hts
1,71
31,
713
1,72
31,
731
1,71
71,
702
1,77
61,
771
1,70
21,
723
(UN
AU
DIT
ED
)L
AST
TE
N F
ISC
AL
YE
AR
S
FIS
CA
L Y
EA
R E
ND
ED
JU
NE
30,
185
254

Sche
dule
5.2
CA
RSO
N C
ITY
OP
ER
AT
ING
IN
DIC
AT
OR
S B
Y F
UN
CT
ION
/ P
RO
GR
AM
(C
onti
nued
)
2017
2016
2015
2014
2013
2012
2011
2010
2009
2008
Cu
ltu
re a
nd
Rec
reat
ion
(7)
Num
ber
of p
artic
ipan
ts in
rec
reat
ion
spor
ts2,
924
2,67
82,
526
2,46
33,
184
7,68
87,
557
14,3
935,
302
7,95
0
Num
ber
of p
artic
ipan
ts in
spo
rts
tour
nam
ents
(8)
15,7
1510
,629
17,6
2517
,293
77,1
6456
,388
57,2
9158
,000
56,4
1056
,410
Ave
rage
num
ber
of c
hild
ren
enro
lled
in s
umm
er
pro
gram
s pe
r da
y14
516
717
517
217
816
560
733
926
526
2
Ave
rage
num
ber
of c
hild
ren
enro
lled
in la
tch
key
p
rogr
ams
per
day
212
259
287
246
239
239
204
202
289
265
Uti
litie
s (4
)
Sew
er:
Cus
tom
er c
ount
as
of J
une
3015
,600
15,5
0015
,435
15,5
1415
,476
15,4
4315
,041
15,3
7615
,414
15,3
79
Tot
al d
isch
arge
(in
thou
sand
s of
gal
lons
)1,
874,
714
1,58
4,70
01,
543,
299
1,45
0,90
01,
586,
030
1,59
0,54
71,
787,
778
1,74
1,89
41,
825,
000
1,86
9,40
3
Wat
er:
Cus
tom
er c
ount
as
of J
une
3017
,676
17,2
7216
,962
16,8
6016
,889
16,8
6216
,798
16,8
0416
,828
16,7
90
Tot
al c
onsu
mpt
ion
(in
thou
sand
s of
gal
lons
)3,
219,
786
3,24
5,84
53,
418,
789
3,58
9,08
53,
656,
071
3,52
5,55
33,
619,
591
3,55
7,24
84,
561,
914
4,07
7,83
7
Dev
elop
men
t Se
rvic
es (
2)
Bui
ldin
g pe
rmits
issu
ed1,
355
1,27
293
41,
029
788
818
939
276
242
295
NR
= N
ot r
epor
ted
Sour
ces:
(1)
Car
son
City
Mun
icip
al C
ourt
(2)
Car
son
City
Com
mun
ity D
evel
opm
ent D
epar
tmen
t
(3)
Car
son
City
Tre
asur
er's
Off
ice
(4)
Car
son
City
Pub
lic W
orks
(5)
Car
son
City
She
riff
's O
ffic
e
(6)
Car
son
City
Fir
e D
epar
tmen
t
(7)
Car
son
City
Par
ks &
Rec
reat
ion
(8)
"Par
ticip
ants
" as
of
fisc
al y
ear
ende
d 20
14 m
eans
pla
yers
and
coa
ches
. In
pre
viou
s ye
ars
this
fig
ure
also
incl
uded
est
imat
es f
or s
pect
ator
s.
FIS
CA
L Y
EA
R E
ND
ED
JU
NE
30,
(UN
AU
DIT
ED
)L
AST
TE
N F
ISC
AL
YE
AR
S
186
255

Sch
edul
e 5.
3
CA
RS
ON
CIT
YC
AP
ITA
L A
SS
ET
S S
TA
TIS
TIC
S B
Y F
UN
CT
ION
/ P
RO
GR
AM
LA
ST
TE
N F
ISC
AL
YE
AR
S(U
NA
UD
ITE
D)
2017
2016
2015
2014
2013
2012
2011
2010
2009
2008
FU
NC
TIO
N /
PR
OG
RA
M:
Gen
eral
Gov
ernm
ent
Cit
y ow
ned
faci
litie
s (1
)10
510
510
183
8180
8282
8282
Cit
y ow
ned
stru
ctur
es (
1)89
9285
8181
8181
8181
81N
umbe
r of
net
wor
ked
com
pute
rs (
5)73
469
371
759
359
559
558
056
555
065
0
Pub
lic
Safe
tyPo
lice:
(2)
Mar
ked
polic
e ve
hicl
es39
4241
4139
3940
3936
37Fi
re: (
3)
Fire
sta
tion
s4
44
44
43
33
3Fi
re e
ngin
es14
1414
1414
149
99
9
Pub
lic
Wor
ks (
1)Pa
ved
stre
ets
(mile
s)28
127
327
327
327
327
327
325
725
725
9
Cul
ture
and
Rec
reat
ion
(4)
Park
s:A
crea
ge o
f pa
rks
- de
velo
ped
785.
178
5.1
780.
578
0.5
780.
578
0.5
780.
578
0.5
780.
578
0.5
Acr
eage
of
park
s -
unde
velo
ped
7,33
2.0
7,33
2.0
436.
043
6.0
436.
043
6.0
436.
043
6.0
436.
043
6.0
Swim
min
g po
ols
- ou
tdoo
rs1
11
11
11
11
1Sw
imm
ing
pool
s -
indo
ors
33
33
33
33
33
Bal
l fie
lds
- lig
hted
1515
1616
1616
1616
1616
Bal
l fie
lds
- un
light
ed20
2019
1919
1919
1919
19T
enni
s co
urts
- li
ghte
d12
1212
1212
1212
1212
12T
enni
s co
urts
- u
nlig
hted
44
44
44
44
44
Bas
ketb
all c
ourt
s -
light
ed0
00
00
00
00
0B
aske
tbal
l cou
rts
- un
light
ed8
88
88
88
88
8C
omm
unit
y C
ente
rs2
21
11
11
11
1R
odeo
are
nas
11
11
11
11
11
Sand
vol
leyb
all c
ourt
s4
44
44
44
44
4
Uti
liti
es (
1)Se
wer
line
s (m
iles)
230.
0
22
6.0
228.
023
7.2
237.
223
7.2
236.
023
5.0
216.
621
6.6
Stor
m d
rain
s (m
iles)
93.0
93.0
92.0
94.4
94.4
94.4
94.0
93.9
77.0
76.4
Wat
er li
nes
(mile
s)31
.0
32
9.0
323.
033
0.0
330.
033
0.0
322.
032
0.8
297.
229
6.0
NR
= N
ot r
epor
ted
Sour
ces:
(1So
urce
s:(1
Sour
ces:
(1So
urce
s:(1
)C
arso
n C
ity
Faci
litie
s an
d Pu
blic
Wor
ks D
ivis
ions
(4)
Car
son
Cit
y Pa
rks
& R
ecr
(2)
Car
son
Cit
y (2
) C
arso
n C
ity
(2)
Car
son
Cit
y (2
) C
arso
n C
ity
Sher
iff's
Off
ice
(5)
Car
son
Cit
y In
form
atio
n T
(3)
Car
son
Cit
y (3
) C
arso
n C
ity
(3)
Car
son
Cit
y (3
) C
arso
n C
ity
Fire
Dep
artm
ent
FIS
CA
L Y
EA
R E
ND
ED
JU
NE
30,
187
256

COMPLIANCE SECTION
257

258

What inspires you, inspires us. Let’s talk. | eidebailly.com5441 Kietzke Ln., Ste. 150 | Reno, NV 89511-2094 | T 775.689.9100 | F 775.689.9299 | EOE
188
Independent Auditor’s Report on Internal Control over Financial Reporting and on Compliance and Other Matters Based on an Audit of Financial Statements
Performed in Accordance with Government Auditing Standards
To the Honorable Mayor and Members of the Board of Supervisors Carson City, Nevada
We have audited, in accordance with auditing standards generally accepted in the United States of America and the standards applicable to financial audits contained in Government Auditing Standards, issued by the Comptroller General of the United States, the financial statements of the governmental activities, the business-type activities, the aggregate discretely presented component units, each major fund, and the aggregate remaining fund information of Carson City, Nevada (the City), as of and for the year ended June 30, 2017, and the related notes to the financial statements, which collectively comprise the City’s basic financial statements, and have issued our report thereon dated November 30, 2017. Our report includes a reference to other auditors who audited the financial statements of the Airport Authority of Carson City, Nevada and the Carson City Culture and Tourism Authority, as described in our report on the City’s financial statements. This report does not include the results of the other auditors’ testing of internal control over financial reporting or compliance and other matters for the Airport Authority of Carson City, Nevada or the Carson City Culture and Tourism Authority that are reported on separately by those auditors.
Internal Control over Financial Reporting In planning and performing our audit of the financial statements, we considered the City's internal control over financial reporting (internal control) to determine the audit procedures that are appropriate in the circumstances for the purpose of expressing our opinions on the financial statements, but not for the purpose of expressing an opinion on the effectiveness of the City’s internal control. Accordingly, we do not express an opinion on the effectiveness of the City’s internal control.
Our consideration of internal control over financial reporting was for the limited purpose described in the preceding paragraph and was not designed to identify all deficiencies in internal control over financial reporting that might be material weaknesses or significant deficiencies and therefore, material weaknesses or significant deficiencies may exist that have not been identified. However, as described in the accompanying schedule of findings and questioned costs, we identified certain deficiencies in internal control that we consider to be material weaknesses.
A deficiency in internal control exists when the design or operation of a control does not allow management or employees, in the normal course of performing their assigned functions, to prevent, or detect and correct, misstatements on a timely basis. A material weakness is a deficiency, or a combination of deficiencies, in internal control, such that there is a reasonable possibility that a material misstatement
259

260

189
of the entity’s financial statements will not be prevented, or detected and corrected on a timely basis. We considered the deficiencies described in the accompanying schedule of findings and questioned costs as finding 2017-A and Finding 2017-B that we considered to be material weaknesses.
A significant deficiency is a deficiency, or a combination of deficiencies, in internal control that is less severe than a material weakness, yet important enough to merit attention by those charged with governance.
Compliance and Other Matters As part of obtaining reasonable assurance about whether the City's financial statements are free from material misstatement, we performed tests of its compliance with certain provisions of laws, regulations, contracts, and grant agreements, noncompliance with which could have a direct and material effect on the determination of financial statement amounts. However, providing an opinion on compliance with those provisions was not an objective of our audit, and accordingly, we do not express such an opinion. The results of our tests disclosed no instances of noncompliance or other matters that are required to be reported under Government Auditing Standards.
Carson City’s Response to Findings The City’s response to the findings identified in our audit is described in the accompanying schedule of findings and questioned costs. The City’s response was not subjected to the auditing procedures applied in the audit of the financial statements and, accordingly, we express no opinion on it.
Purpose of this Report The purpose of this report is solely to describe the scope of our testing of internal control and compliance and the result of that testing, and not to provide an opinion on the effectiveness of the entity’s internal control or on compliance. This report is an integral part of an audit performed in accordance with Government Auditing Standards in considering the entity’s internal control and compliance. Accordingly, this communication is not suitable for any other purpose.
Reno, Nevada November 30, 2017
261

262

What inspires you, inspires us. Let’s talk. | eidebailly.com5441 Kietzke Ln., Ste. 150 | Reno, NV 89511-2094 | T 775.689.9100 | F 775.689.9299 | EOE
190
Independent Auditor’s Report on Compliance for Each Major Federal Program and
Report on Internal Control Over Compliance Required by the Uniform Guidance To the Honorable Mayor and Members of the Board of Supervisors Carson City, Nevada Report on Compliance for Each Major Program We have audited Carson City, Nevada’s, (the City), compliance with the types of compliance requirements described in the OMB Compliance Supplement that could have a direct and material effect on each of the City’s major federal programs for the year ended June 30, 2017. The City’s major federal programs are identified in the Summary of Auditor’s Results section of the accompanying Schedule of Findings and Questioned Costs. The City’s basic financial statements include the operations of the Airport Authority of Carson City, a discretely presented component unit, which received $2,386,190 in federal awards which are not included in the City’s Schedule of Expenditures of Federal Awards for the year ended June 30, 2017. Our audit, as described below, did not include the operations of the Airport Authority of Carson City because the Airport Authority of Carson City engaged other auditors to perform an audit in accordance with the audit requirements of Title 2 U.S. Code of Federal Regulations Part 200, Uniform Administrative Requirements, Cost Principles, and Audit Requirements for Federal Awards (Uniform Guidance). Management’s Responsibility Management is responsible for compliance with federal statutes, regulations, and the terms and conditions of its federal awards applicable to its federal programs. Auditor’s Responsibility Our responsibility is to express an opinion on compliance for each of the City’s major federal programs based on our audit of the types of compliance requirements referred to above. We conducted our audit of compliance in accordance with auditing standards generally accepted in the United States of America; the standards applicable to financial audits contained in Government Auditing Standards, issued by the Comptroller General of the United States; and the audit requirements of Uniform Guidance. Those standards and Uniform Guidance require that we plan and perform the audit to obtain reasonable assurance about whether noncompliance with the types of compliance requirements referred to above that could have a direct and material effect on a major federal program occurred. An audit includes examining, on a test basis, evidence about the City’s compliance with those requirements and performing such other procedures as we considered necessary in the circumstances. We believe that our audit provides a reasonable basis for our opinion on compliance for each major federal program. However, our audit does not provide a legal determination of the City’s compliance.
263

264

191
Basis for Qualified Opinion on Highway Planning and Construction Cluster As described in the accompanying schedule of Findings and Questioned Costs, the City did not comply with requirements regarding CFDA 20.205 Highway Planning and Construction as described in finding number 2017-001 for Allowable Activities, Allowable Costs, Cash Management, Matching, Period of Performance, and Procurement requirements and finding number 2017-002 for Procurement, Suspension, and Debarment and Special Tests and Provisions. Compliance with such requirements is necessary, in our opinion, for the City to comply with the requirements applicable to that program.
Qualified Opinion on Highway Planning and Construction Cluster In our opinion, except for the noncompliance described in the Basis of Qualified Opinion paragraph, the City complied, in all material respects, with the compliance requirements referred to above that could have a direct and material effect on the Highway Planning and Construction Cluster for the year ended June 30, 2017.
Opinion on Each of the Other Major Federal Programs In our opinion, the City complied, in all material respects, with the compliance requirements referred to above that could have a direct and material effect on the other major federal programs identified in the summary of auditor’s results section of the accompanying Schedule of Findings and Questioned Costs for the year ended June 30, 2017.
Other Matter The City’s response to the noncompliance finding identified in our audit is described in the accompanying Schedule of Findings and Questioned Costs. The City’s response was not subjected to the auditing procedures applied in the audit of compliance and, accordingly, we express no opinion on the response.
Report on Internal Control Over Compliance Management of the City is responsible for establishing and maintaining effective internal control over compliance with the compliance requirements referred to above. In planning and performing our audit of compliance, we considered the City’s internal control over compliance with the types of requirements that could have a direct and material effect on a major federal program to determine the auditing procedures that are appropriate in the circumstances for the purpose of expressing an opinion on compliance for each major federal program and to test and report on internal control over compliance in accordance with Uniform Guidance, but not for the purpose of expressing an opinion on the effectiveness of internal control over compliance. Accordingly, we do not express an opinion on the effectiveness of the City’s internal control over compliance.
A deficiency in internal control over compliance exists when the design or operation of a control over compliance does not allow management or employees, in the normal course of performing their assigned functions, to prevent, or detect and correct, noncompliance with a type of compliance requirement of a federal program on a timely basis. A material weakness in internal control over compliance is a deficiency, or a combination of deficiencies, in internal control over compliance, such that there is a reasonable possibility that material noncompliance with a compliance requirement will not be prevented, or detected and corrected, on a timely basis. A significant deficiency in internal control over compliance is a deficiency, or a combination of deficiencies, in internal control over compliance with a type of compliance requirement of a federal program that is less severe than a material weakness in internal control over compliance, yet important enough to merit attention by those charged with governance.
Our consideration of internal control over compliance was for the limited purpose described in the first paragraph of this section and was not designed to identify all deficiencies in internal control that might be material weaknesses or significant deficiencies and therefore, material weaknesses and significant deficiencies may exist that were not identified. We identified certain deficiencies in internal control over compliance described in the accompanying Schedule of Findings and Questioned Costs as items 2017-001 and 2017-002 that we consider to be material weaknesses.
265

266

192
The City’s responses to the internal control over compliance findings identified in our audit are described in the accompanying Schedule of Findings and Questioned Costs. The City’s responses were not subjected to the auditing procedures applied in the audit of compliance and, accordingly, we express no opinion on the responses. The purpose of this report on internal control over compliance is solely to describe the scope of our testing of internal control over compliance and the results of that testing based on the requirements of the Uniform Guidance. Accordingly, this report is not suitable for any other purpose.
Reno, Nevada November 30, 2017
267

268

What inspires you, inspires us. Let’s talk. | eidebailly.com5441 Kietzke Ln., Ste. 150 | Reno, NV 89511-2094 | T 775.689.9100 | F 775.689.9299 | EOE
193
Auditor's Comments To the Honorable Mayor and Members of the Board of Supervisors Carson City, Nevada In connection with our audit of the financial statements of the governmental activities, the business-type activities, the aggregate discretely presented component units, each major fund, and the aggregate remaining fund information of Carson City, Nevada (the City) as of and for the year ended June 30, 2017, and the related notes to the financial statements, nothing came to our attention that caused us to believe that the City failed to comply with the specific requirements of Nevada Revised Statutes cited below. However, our audit was not directed primarily toward obtaining knowledge of such noncompliance. Accordingly, had we performed additional procedures, other matters may have come to our attention regarding the City’s noncompliance with the requirements of Nevada Revised Statutes cited below, insofar as they relate to accounting matters. Statue Compliance The required disclosure on compliance with Nevada Revised Statutes and the Nevada Administrative Code is contained in Note 2B to the financial statements. Progress on Prior Year Statute Compliance The City monitored all significant constraints during the year ended June 30, 2017. Prior Year Recommendations The status of the prior year audit findings is included in the Summary Schedule of Prior Audit Findings under separate cover. Current Year Recommendations The current year findings are included in the accompanying Schedule of Findings and Questioned Costs.
Reno, Nevada November 30, 2017
269

270

See accompanying notes to the Schedule of Expenditures of Federal Awards 194
FEDERAL FEDERAL PAYMENTSFEDERAL GRANTOR/ PASS-THROUGH CFDA AWARD EXPENSES/ TOGRANTOR/ PROGRAM TITLE NUMBER NUMBER EXPENDITURES SUBRECIPIENTS
U.S. Environmental Protection Agency
Passed through Nevada Department of Conservation & Natural Resources:Nonpoint Source Implementation Grants:
Ash Canyon Erosion Control & Sediment 66.460 DEP-S 17-023 8,653$ -$ Ash Canyon Erosion Control 66.460 DEP-S 16-028 10,000 -
Total Nonpoint Source Implementation Grants 18,653 -
Clean Water State Revolving Fund Cluster:Capitalization Grants for Clean Water State
Revolving Funds 66.458 CW1403 10,605,857 - Capitalization Grants for Clean Water State
Revolving Funds 66.458 CW1601 1,294,740 -
Total Clean Water State Revolving Fund Cluster 11,900,597 -
Drinking Water State Revolving Fund Cluster:Capitalization Grants for Drinking Water State
Revolving Funds 66.468 DW1405 552,742 -
Total U.S. Environmental Protection Agency 12,471,992 -
U. S. Institute of Museum and Library Services:
Passed through Nevada State Library and Archives:Grants to States - Bully Free Zone 45.310 LSTA 2016-01 4,600 - Grants to States - Mobile Makerspace 45.310 LSTA 2016-05 27,759 - Grants to States - Statewide Reading Program - Diversity in Action 45.310 LSTA 2016-20 DIA 2,100 -
Statewide Reading Program - Summer Reading Program 45.310 LSTA 2016-20 2,800 -
Total U.S. Institute of Museum and Library Services 37,259 -
U.S. Department of Agriculture:
Direct programs:Cooperative Patrol 10.Unknown 11-LE-11051360-232 5,613 -
Passed through Nevada Department of Health & Human Services:Special Supplemental Nutrition Program for Women, Infants,
and Children 10.557 7NV700NV7 199,366 -
Passed through Nevada State Controller:Forest Service - Schools and Roads Cluster
Schools and Roads - Grants to States 10.665 N/A 1,296 648
Total U.S. Department of Agriculture 206,275 648
CARSON CITYSCHEDULE OF EXPENDITURES OF FEDERAL AWARDS
FOR THE YEAR ENDED JUNE 30, 2017(PAGE 1 OF 6)
271

See accompanying notes to the Schedule of Expenditures of Federal Awards 195
FEDERAL FEDERAL PAYMENTSFEDERAL GRANTOR/ PASS-THROUGH CFDA AWARD EXPENSES/ TOGRANTOR/ PROGRAM TITLE NUMBER NUMBER EXPENDITURES SUBRECIPIENTS
U.S. Department of Health and Human Services:
Direct programs:Family Planning_Services 93.217 FPHPA096239-01-02 397,299$ -$ Family Planning_Services - Program Income 93.217 N/A 177,504 -
Total Family Planning_Services 574,803 -
Passed through Nevada Department of Health and Human Services:Public Health Emergency Preparedness 93.069 5U90TP000534-05 320,178 -
Public Health Preparedness - CDC - Ebola 93.074 3U90TP000534-03S2 22,113 -
Affordable Care Act (ACA) Personal Responsibility Education Program 93.092 1401/1501 NVPREP 57,966 -
Food and Drug Administration ResearchTrained Regulatory Staff Utilizing Behavior Change in Food
Safety Education 93.103 G-T-1611-03734 2,110 - Open and Transparent Government-Online Food Establishment
Inspections 93.103 G-MP-1611-03733 225 -
Total Food and Drug Administration Research 2,335 -
Project Grants and Cooperative Agreements for 5U52PS004681-02Tuberculosis Control Programs 93.116 5NU52PS004681-03-00 8,440 -
Affordable Care Act (ACA) Abstinence Education Program 93.235 1601 NVAEGP 80,072 -
Immunization Cooperative Agreements - NV Billing Implementation 93.268 1H23IP000943-01 31,828 - Immunization Cooperative Agreements 93.268 NH23IP000727-05-00 79,795 - Immunization Cooperative Agreements - Program Income 93.268 N/A 22,300 -
Total Immunization Cooperative Agreements 133,923 -
National State Based Tobacco Control Programs 93.305 1U58DP006009 71,355 -
Epidemiology and Laboratory Capacity for Infectious 5NU50CK000419.03-00Diseases (ELC) 93.323 3U50CK000419-02S1 34,185 -
The Affordable Care Act: Building Epidemiology, Laboratory, and Health Information Systems Capacity in the Epidemiologyand Laboratory Capacity for Infectious Disease (ELC) and Emerging 5U50CK000419.02Infections Program (EIP) Cooperative Agreements; PPHF 93.521 6NU50CK000419-03-01 17,470 -
PPHF Capacity Building Assistance to Strengthen Public Health Immunization Infrastructure and Performance financed in part by Prevention and Public Health Funds 93.539 NH23IP000727-05-00 28,585 -
Child Support Enforcement - Title IV - D 93.563 N/A 22,978 -
Community Services Block Grant 93.569 243.11 / 1164.06 136,678 -
Preventative Health and Health Services Block Grant 93.758 B01OT009040 8,627 -
Epidemiology & Laboratory Capacity (ELC) Program - Ebola Supplement 93.815 3U50CK000419.01S2 28,612 -
FOR THE YEAR ENDED JUNE 30, 2017(PAGE 2 OF 6)
CARSON CITYSCHEDULE OF EXPENDITURES OF FEDERAL AWARDS
272

See accompanying notes to the Schedule of Expenditures of Federal Awards 196
FEDERAL FEDERAL PAYMENTSFEDERAL GRANTOR/ PASS-THROUGH CFDA AWARD EXPENSES/ TOGRANTOR/ PROGRAM TITLE NUMBER NUMBER EXPENDITURES SUBRECIPIENTS
Public Health Preparedness - Assistant Secretary forPreparedness and Response -Ebola 93.817 1U3REP150510.01-00 30,124$ -$
National Bioterrorism Hospital Preparedness Program 93.889 5U90TP000534-04 161,336 -
X007HA00001-27HIV Care Formula Grants - Ryan White Title II 93.917 X07HA00001-26 85,575 -
HIV Prevention Activities_Health Department Based 93.940 5U62PS003654-05 18,139 -
HIV/AIDS and Surveillance Program 93.944 5NU62PS004024-05-00 3,400 -
Block Grants for Prevention and Treatment of Substance Abuse 2B08TI010039-15Tobacco 93.959 2B08TI010039-16 41,031 - Tobacco and Opioids 93.959 2B08TI010039-16 5,728 -
Total Block Grants for Prevention and Treatment of Substance Abuse 46,759 -
Preventive Health Services-Sexually Transmitted Diseases 5H25PS004376-03Control Grants-STD Prevention and Control 93.977 5NH25PS004376-04 16,348 -
B04MC28112Maternal and Child Health Services Block Grant to the States 93.994 B04MC29352 51,836 -
Total U.S. Department of Health and Human Services 1,961,837 -
U.S. Department of Housing and Urban Development:
Direct programs:Community Development Block Grants/ B-16-MC-32-0006
Entitlement Grants Cluster 14.218 B-15-MC-32-0006 131,372 55,277
Shelter Plus Care 14.238 N/A 42,832 -
Passed through Nevada Housing Division:Emergency Solutions Grant Program 14.231 E16-DC-32-0001 60,964 -
Total U.S. Department of Housing and Urban Development 235,168 55,277
U.S. Department of the Interior:
Direct programs:National Fire Plan - Wildland Urban Interface Community
Fire Assistance - "You Call - We Haul" program 15.228 L12AC20470 10,789 -
Southern Nevada Public Land Management 15.235 2710 (NVS00550) 34,347 - Southern Nevada Public Land Management 15.235 CR02 58 -
Total Southern Nevada Public Land Management Grants 34,405 -
BLM Law Enforcement Services 15.Unknown L13PA00209 5,000 -
Passed through Nevada Department of Conservation andNatural Resources - State Historic Preservation Office:
Historic Preservation Fund Grants-In-Aid - NAPC Forum Conference 15.904 32-16-141290(1) 8,477 - NAPC Camp Training Program 15.904 32-16-141290(1) 10,000 - Historic Structures Report NV State Prison 15.904 P15AS00020(1) 12,201 -
Total Historic Preservation Fund Grants-In-Aid 30,678 -
(PAGE 3 OF 6)
CARSON CITYSCHEDULE OF EXPENDITURES OF FEDERAL AWARDS
FOR THE YEAR ENDED JUNE 30, 2017
273

See accompanying notes to the Schedule of Expenditures of Federal Awards 197
FEDERAL FEDERAL PAYMENTSFEDERAL GRANTOR/ PASS-THROUGH CFDA AWARD EXPENSES/ TOGRANTOR/ PROGRAM TITLE NUMBER NUMBER EXPENDITURES SUBRECIPIENTS
Fish and Wildlife Cluster:Passed through Nevada Department of Wildlife
Wildlife Restoration and Basic Hunter Education 15.611 F15AF00340 7,831$ -$ (W-51-HS-06)
Total U.S. Department of the Interior 88,703 -
U.S. Department of Justice:
Passed through Nevada Office of the Attorney General:Sexual Assault Exam Program Support 16.588 2016-VAWA-37 37,295 -
Direct Programs:State Criminal Alien Assistance Program 16.606 N/A 6,624 -
Safe Streets Program 16.Unknown 281D-LV-C37135 8,164 -
School Resource Officer Program 16.710 2015-UM-WX-0049 123,269 -
Edward Byrne Memorial Justice Assistance Grant Program 16.738 2015-DJ-BX-0262 3,235 - Edward Byrne Memorial Justice Assistance Grant Program 16.738 2016-DJ-BX-0458 10,084 - Edward Byrne Memorial Justice Assistance Grant Program-
Cops and Kids Community Policing and Prevention 16.738 2014-DJ-BX-0053 382 -
Passed through Nevada Department of Public Safety:Edward Byrne Memorial Justice Assistance Grant Program 16.738 16-JAG-03 117,000 - Edward Byrne Memorial Justice Assistance Grant Program -
High In Plain Sight 16.738 14-JAG-36 3,850 - Edward Byrne Memorial Justice Assistance Grant Program -
Tri-Net 16.738 16-JAG-02 57,390 -
Total Edward Byrne Memorial Justice Assistance Grant Program 191,941 -
Passed through Nevada Department of Health and Human Services:Juvenile Justice and Delinquency Prevention _Allocation to States 16.540 N/A 2,051 -
Total U.S. Department of Justice 369,344 -
U.S. Department of Transportation:
Passed through Nevada State Emergency Response Commission:Interagency Hazardous Materials Public Sector
Training and Planning Grants - HMEP TrainingAttendance -Hazardous Materials Track - FireShowsWest
Conference 20.703 17-HMEP-01-01-16 390 -
Highway Safety Cluster:Passed through Nevada Department of Public Safety:
National Priority Safety Programs:Felony DUI Court 20.616 TS-2017-CC-DC-48 43,533 -
JF-2015-CCSO-00035National Priority Safety Programs 20.616 JF-2015-CCSO-00026 9,600 - Lidar Units and Citation Writing Devices 20.616 LFD-2017-CCSO-00003 13,368 -
Total National Priority Safety Programs 66,501 -
CARSON CITYSCHEDULE OF EXPENDITURES OF FEDERAL AWARDS
FOR THE YEAR ENDED JUNE 30, 2017(PAGE 4 OF 6)
274

See accompanying notes to the Schedule of Expenditures of Federal Awards 198
FEDERAL FEDERAL PAYMENTSFEDERAL GRANTOR/ PASS-THROUGH CFDA AWARD EXPENSES/ TOGRANTOR/ PROGRAM TITLE NUMBER NUMBER EXPENDITURES SUBRECIPIENTS
Highway Safety Cluster (Continued):Passed through Nevada Department of Public Safety:
State and Community Highway Safety- JF-2017-CCSO-00006Joining Forces 20.600 JF-2016-CCSO-00035 10,702$ -$
State and Community Highway Safety 20.600 LFD-2017-CCSO-00003 6,107 -
Total State and Community Highway Safety Grants 16,809 -
Total Highway Safety Cluster 83,310 -
Federal Transit Cluster:Direct programs:
Federal Transit - Formula Grants (Urbanized Area Formula Program) 20.507 NV-90-X077-00 325,232 -
Federal Transit - Formula Grants (Urbanized Area Formula Program) 20.507 NV-90-X075-00 5,811 -
Federal Transit - Formula Grants (Urbanized Area Formula Program) 20.507 NV-2016-007-00 685,670 -
Federal Transit - Formula Grants (Urbanized Area Formula Program) 20.507 NV-2017-002-00 61,784 -
Total Federal Transit Cluster 1,078,497 -
Transit Services Programs Cluster:Passed through Nevada Department of Transportation:
Enhanced Mobility for Seniors and Individuals withDisabilities - Enhance Mobility 20.513 NV-2016-005-00 68,272 -
Enhanced Mobility for Seniors and Individuals withDisabilities - Enhance Mobility 20.513 NV-2017-001-00 106,957 -
Total Transit Services Programs Cluster 175,229 -
Highway Planning and Construction Cluster:Passed through Nevada Department of Transportation:
Highway Planning and Construction -Unified Planning Work Program 20.205 PR107-16-804 360,968 -
Highway Planning and Construction -Safe Routes to School - Health 20.205 P449-12-802 97,356 -
Highway Planning and Construction -Carson City Freeway Multi-Use Path Project 20.205 P402-15-063 23,866 - Airport Road Improvements 20.205 P402-15-063 2,843 -
Highway Planning and Construction -Federal Highway Safety Improvement Program - FlashingYellow Arrows Project 20.205 PR569-14-063 382,275 -
Highway Planning and Construction -Federal Transportation Alternatives Program - Western Nevada College Sidewalk Project 20.205 PR165-14-063 51 -
Highway Planning and Construction -Silver Sage Drive Reconstruction Project 20.205 P191-17-063 2,546 -
Total Highway Planning and Construction 869,905 -
Recreational Trails Program - Ash Canyon Bridge 20.219 2014-06 3,843 -
Total Highway Planning and Construction Cluster 873,748 -
Total U.S. Department of Transportation 2,211,174 -
SCHEDULE OF EXPENDITURES OF FEDERAL AWARDSFOR THE YEAR ENDED JUNE 30, 2017
(PAGE 5 OF 6)
CARSON CITY
275

See accompanying notes to the Schedule of Expenditures of Federal Awards 199
FEDERAL FEDERAL PAYMENTSFEDERAL GRANTOR/ PASS-THROUGH CFDA AWARD EXPENSES/ TOGRANTOR/ PROGRAM TITLE NUMBER NUMBER EXPENDITURES SUBRECIPIENTS
U.S. Department of Homeland Security:
Direct program:ICE Gang Surge 21.Unknown N/A 1,345$ -$
Passed through Nevada Department of Public Safety:Pre-Disaster Mitigation 97.047 PDMC-PL-09-NV-2014-5 7,992 -
Passed through Nevada Division of Emergency Management:Disaster Grants - Public Assistance (Presidentially Declared Disasters)
2017 Nevada Flood 97.036 FEMA-4303-DR 224,854 -
Emergency Management Performance Grants 97.042 9704216 22,127 -
Homeland Security Grant Program 97.067 97067HL4 1,411 - Homeland Security Grant Program - Mass Care Shelter 97.067 97067HL5 170,486
Total Homeland Security Grant Programs 171,897 -
Total U.S. Department of Homeland Security 428,215 -
Total Expenditures of Federal Awards 18,009,967$ 55,925$
(PAGE 6 OF 6)
CARSON CITYSCHEDULE OF EXPENDITURES OF FEDERAL AWARDS
FOR THE YEAR ENDED JUNE 30, 2017
276

200
CARSON CITY NOTES TO THE SCHEDULE OF EXPENDITURES OF FEDERAL AWARDS
FOR THE YEAR ENDED JUNE 30, 2017
Note 1 - Basis of Presentation
The accompanying schedule of expenditures of federal awards includes the federal grant activity of Carson City, Nevada and is presented on the accrual basis of accounting. The information in this schedule is presented in accordance with the requirements of Uniform Guidance. Therefore, some amounts presented in this schedule may differ from amounts presented in, or used in the preparation of, the basic financial statements.
Note 2 – De Minimis Cost Rate
The City has not elected to use the 10% de minimis cost rate.
277

CARSON CITY, NEVADA SCHEDULE OF FINDINGS AND QUESTIONED COSTS
FOR THE YEAR ENDED JUNE 30, 2017
201
Section I – Summary of Auditor's Results
Financial Statements
Type of auditor’s report issued: Unmodified
Internal control over financial reporting: Material weaknesses identified? Yes Significant deficiencies identified not considered to be material weaknesses? None Reported
Noncompliance material to financial statements noted? No
Federal Awards
Internal control over major programs: Material weaknesses identified? Yes Significant deficiencies identified not considered to be material weaknesses? No
Type of auditor’s report issued on compliance for major programs: Unmodified for the major federal programs, Capitalization Grants for Clean Water State Revolving Funds and Disaster Grants - Public Assistance (Presidentially Declared Disasters) Qualified for the major federal program, Highway Planning and Construction Cluster
Any audit findings disclosed that are required to be reported in accordance with Uniform Guidance 2 CFR 200.516? Yes
Identification of major programs:
Name of Federal Program or Cluster CFDA Number Highway Planning and Construction Cluster 20.205 Capitalization Grants for Clean Water State Revolving Funds 66.458 Disaster Grants - Public Assistance (Presidentially Declared Disasters) 97.036
Dollar threshold used to distinguish between Type A and Type B programs: $750,000
Auditee qualified as a low-risk auditee? No
278

CARSON CITY, NEVADA SCHEDULE OF FINDINGS AND QUESTIONED COSTS
FOR THE YEAR ENDED JUNE 30, 2017
202
Section II - Financial Statement Findings 2017-A Cash Material Weakness Criteria: Management is responsible for establishing and maintaining an effective
system of internal control over financial reporting. An important component of an effective system of internal control over financial reporting includes ensuring cash is adequately evaluated, disclosed, and recognized, if applicable, in accordance with accepted accounting principles generally accepted in the United States of America (GAAP).
Condition: An adjustment of $558,662 was required to properly record cash and a
corresponding liability (i.e. funds held in trust) that was not previously disclosed or recognized in accordance with GAAP.
Cause: The City did not have adequate internal controls to ensure cash was
evaluated, disclosed, and recognized appropriately. Effect: Prior to adjustment, the City’s assets and liabilities were both overstated
$558,662. Recommendation: We recommend the City enhance internal controls to ensure cash is
evaluated, disclosed, and recognized appropriately. Views of Responsible Officials: Management agrees with this finding.
279

CARSON CITY, NEVADA SCHEDULE OF FINDINGS AND QUESTIONED COSTS
FOR THE YEAR ENDED JUNE 30, 2017
203
2017-B Funded Status and Funding Progress Material Weakness
Criteria: Management is responsible for establishing and maintaining an effective system of internal control over financial reporting. An important component of an effective system of internal control over financial reporting includes ensuring disclosure of the funded status and funding progress notes and the schedule of funding progress – other post employment benefits (RSI) are adequately evaluated, disclosed, and recognized, if applicable, in accordance with accepted accounting principles generally accepted in the United States of America (GAAP).
Condition: An adjustment of $1,211,219 was required to properly disclose the funded status and funding progress notes and the schedule of funding progress – other post employment benefits (RSI).
Cause: The City did not have adequate internal controls to ensure the disclosure of the funded status and funding progress notes and the schedule of Funding progress – other post employment benefits (RSI) was evaluated, disclosed, and recognized appropriately, if applicable.
Effect: Prior to adjustment, the City’s disclosure of the funded status and funding progress notes and the schedule of funding progress – other post employment benefits (RSI) were understated $1,211,219.
Recommendation: We recommend the City enhance internal controls to ensure the disclosure of the funded status and funding progress notes and the schedule of funding progress – other post employment benefits (RSI) are evaluated, disclosed, and recognized appropriately, if applicable.
Views of Responsible Officials: Management agrees with this finding.
280

CARSON CITY, NEVADA SCHEDULE OF FINDINGS AND QUESTIONED COSTS
FOR THE YEAR ENDED JUNE 30, 2017
204
Section III – Federal Award Findings and Questioned Costs Finding 2017-001: U.S. Department of Transportation Passed through Nevada Department of Transportation Highway Planning and Construction Cluster: Highway Planning and Construction, CFDA 20.205
Activities Allowed or Unallowed, Allowable Costs, Cash Management, Matching, Period of Performance, and Procurement Material Weakness in Internal Control over Compliance and Material Noncompliance
Grant Award Number: Affects the grant awards included under CFDA 20.205 Criteria: The OMB Compliance Supplement requires that non-Federal entities
receiving Federal awards establish and maintain internal control designed to reasonably ensure compliance with Federal laws, regulations, and program compliance requirements.
Condition: The Transportation Division of the Carson City Public Works Department
submits reimbursement requests to the pass-through entity, the Nevada Department of Transportation. During our testing of the reimbursement requests, we noted instances where payment was requested and received for expenses that had been previously submitted and reimbursed. In addition we noted instances where evidence of review and approval was not present for certain expenses submitted for reimbursement.
Cause: The Transportation Division of the Carson City Public Works Department
did not have adequate procedures in place to ensure that reimbursement requests were submitted for proper charges and internal controls that require review and approval of expenses submitted for reimbursement.
Effect: Inaccurate reimbursement requested may be submitted and incorrect funds
may be received. Questioned Costs: $6,919 projected to the population. Context/Sampling: A nonstatistical sample of 11 out of 70 transactions included in
reimbursement requests were selected for testing. Three of the transactions lacked evidence of the required review and approval. In addition two of the transactions had been previously submitted for reimbursement.
Repeat Finding from Prior Year: No Recommendation: We recommend the Transportation Division of the Carson City Public
Works Department enhance internal controls to ensure that reimbursement requests are submitted only for appropriate expenditures and that internal controls requiring review and approval are followed.
Views of Responsible Officials: Management of the Transportation Division agrees with this finding.
281

CARSON CITY, NEVADA SCHEDULE OF FINDINGS AND QUESTIONED COSTS
FOR THE YEAR ENDED JUNE 30, 2017
205
Finding 2017-002: U.S. Department of Transportation Nevada Department of Transportation Highway Planning and Construction Cluster: Highway Planning and Construction, CFDA 20.205
Procurement, Suspension, and Debarment and Special Tests and Provisions Material Weakness in Internal Control over Compliance and Material Noncompliance
Grant Award Number: Affects the grant awards included under CFDA 20.205
Criteria: The OMB Compliance Supplement requires competitive bidding when awarding construction contracts. In addition the City is required to have written policies and procedures for each method of procurement used to procure engineering and design services, accept indirect cost rates for consultants, and obtain a “Certificate of Final Indirect Costs” from consultants.
Condition: During our testing of the schedule, we noted instances where there was no competitive bid process used for awarding contracts. In addition, written policies and procedures for procurement of engineering and design services and “Certificates of Final Indirect Costs” were not available.
Cause: The City’s Finance Department did not have adequate procedures in place to ensure that all contracts entered into were in compliance with the applicable provisions.
Effect: The contractors were not subject to the provisions described in the OMB Compliance Supplement.
Questioned Costs: None reported.
Context/Sampling: A nonstatistical sample of 2 of the 4 contracts entered into were selected for testing. Neither of the contacts followed the applicable provisions.
Repeat Finding from Prior Year: No
Recommendation: We recommend the Transportation Division of the Carson City Public Works Department enhance internal controls to ensure that all contracts under Federal awards follow the applicable provisions.
Views of Responsible Officials: Management of the Transportation Division agrees with this finding.
282

See accompanying notes. 206
Flat Fixed Fees:Business license revenue adjusted base at June 30, 2016 1,187,370$
Adjustment to Base:Base1. Percentage increase (decrease) in population of the local government -0.0128%
2. Percentage increase in the Consumer Price Index for the year ending on December 31 next preceding the year for which the limit is being calculated 0.7295%
0.7167%
8,510
Adjusted Base at June 30, 2017 1,195,880
Actual Revenue Fiscal 2016-17 796,531
Amount Over (Under) Allowable Amount (399,349)$
FOR THE YEAR ENDED JUNE 30, 2017
CARSON CITY, NEVADASCHEDULE OF FEES IMPOSED
SUBJECT TO THE PROVISIONS OF NRS 354.5989LIMITATION OF FEES FOR BUSINESS LICENSES
283

This page intentionally left blank.
284

Management’s Response to Auditor’s Findings: Summary Schedule of Prior Audit Findings and Corrective Action Plan June 30, 2017
Prepared by Management of Carson City, Nevada
285

This page intentionally left blank.
286

Management’s Response to Auditor’s Findings: Summary Schedule of Prior Audit Findings and Corrective Action Plan June 30, 2017
Prepared by Management of: Carson City, Nevada
The following is a discussion of our corrective action plan in response to the findings noted by Eide Bailly LLP in the Schedule of Findings and Questioned Costs for the year ended June 30, 2017.
SECTION II – FINANCIAL STATEMENT FINDINGS
Finding 2017-A:
Finding Summary: Eide Bailly LLP proposed a material adjustment to the City’s annual 2017 financial statements that was identified as a material weakness in the City’s internal controls system.
Responsible Individuals: Jason Link, Chief Financial Officer
Corrective Action Plan: During the close of the 2017 fiscal year end there was a change in leadership of the finance department. Due to the staffing change, internal control procedures regarding preparation of the City’s financial statements were not followed. In subsequent years, we will ensure existing internal control procedures are followed.
Anticipated Completion Date: November 1, 2017
Finding 2017-B:
Finding Summary: Eide Bailly LLP proposed a change to the Notes and the Required Supplementary Information of the City’s annual 2017 financial statements that was identified as a material weakness in the City’s internal control system.
Responsible Individuals: Jason Link, Chief Financial Officer
Corrective Action Plan: The City has spoken with the actuary regarding the preparation of their report related to the unfunded actuarial accrued liability for other post-employment benefits. This discussion has resulted in a better understanding of the actuary’s report. The City will be implementing GASB Statement No. 75 in fiscal year 2018, which will change reporting requirements for other post-employment benefits. The City will ensure existing internal control procedures are followed.
Anticipated Completion Date: June 30, 2018
CARSON CITY, NEVADA CONSOLIDATED MUNICIPALITY AND STATE CAPITAL
287

SECTION III – FEDERAL AWARD FINDINGS AND QUESTIONS COSTS – CURRENT YEAR
Finding 2017-001: Federal Agency Name: U.S. Department of Transportation, passed through Nevada Department of
Transportation Program Name: Highway Planning and Construction Cluster CFDA # 20.205
Finding Summary: Eide Bailly, LLP discovered a weakness in internal controls related to instances where inaccurate reimbursement requests were submitted and funds were received resulting in an overpayment of $6,919 during the grant period.
Responsible Individual: Lucia Maloney, Transportation Manager
Corrective Action Plan: At the conclusion of the fiscal year 2016 audit, approximately December 2016, the Transportation Department streamlined and clarified their internal control procedures. One staff member maintained responsibility for drafting the reimbursement requests (Transportation Planner), and a second staff member maintained responsibility for reviewing/approving the reimbursement requests (Senior Transportation Planner). Additionally, the new process includes a review of the previous quarter’s invoices submitted to double-check that invoices will not be submitted twice.
Completion Date: January 1, 2017
Finding 2017-002: Federal Agency Name: U.S. Department of Transportation, passed through Nevada Department of
Transportation Program Name: Highway Planning and Construction Cluster CFDA # 20.205
Finding Summary: Eide Bailly, LLP discovered a material weakness in internal controls related to awarded construction contracts not subject to the provisions of the competitive bid process required by the OMB Compliance Supplement. This weakness in internal control procedures could result in an over-expenditure of necessary resources.
Responsible Individual: Lucia Maloney, Transportation Manager
Corrective Action Plan: Carson City now understands that Professional Services contracts may not be executed using its On-Call Professional Services (“SOQ”) List when projects are utilizing federally awarded dollars. Staff has improved internal processes for federally funded projects by drafting clarifying language within internal forms to be followed by all future projects from inception through contract execution. These internal forms will contain clear staff roles and responsibilities and will ensure federally funded projects requiring professional services are (1) quoted competitively, and (2) incorporate Certification from selected contractors of their compliance with FAR rates (providing “Certificates of Final Indirect Costs”) prior to contract execution.
Completion Date: February 1, 2018
288

SECTION III – FEDERAL AWARD FINDINGS AND QUESTIONS COSTS – PRIOR YEAR
Finding 2016-001: Federal Agency Name: U.S. Department of Transportation Program Name: Federal Transit Cluster CFDA # 20.507
Initial Fiscal Year Finding Occurred: 2016
Finding Summary: Eide Bailly, LLP discovered that no review was done at the department level prior to submittal for reimbursement, which had the potential of reporting inaccurate information to the federal Granting Agency.
Status: Not corrected. Employees at the Transportation Division have implemented the procedure; however, were unaware that evidence of the review was necessary. Our Corrective Action Plan and procedure has been updated to ensure that the reviewer initial and date a print out of the final form submitted.
Finding 2016-002: Federal Agency Name: U.S. Department of Transportation, passed through Nevada Department
of Transportation Program Name: Highway Planning and Construction Cluster CFDA # 20.205
Initial Fiscal Year Finding Occurred: 2016
Finding Summary: Eide Bailly, LLP discovered that the Transportation division of the Carson City Public Works Department did not have adequate procedures in place to ensure that reimbursement requests were submitted only after funds were disbursed.
Status: Corrected
Finding 2016-003: Federal Agency Name: U.S. Department of Transportation, passed through Nevada Department of
Transportation Program Name: Highway Planning and Construction Cluster CFDA # 20.205
Initial Fiscal Year Finding Occurred: 2016
Finding Summary: Eide Bailly, LLP discovered that the Finance Department did not have adequate procedures in place to ensure that the schedule of expenditures of federal awards accurately reports total federal awards expended for each individual federal program and cluster of programs.
Status: Corrected
289


Final Version: 12/04/15
STAFF REPORT
Report To: Audit Committee Meeting Date: 05/10/2018
Staff Contact: Jason Link, Chief Financial Officer
Agenda Title: For Possible Action: Discussion and direction to Staff regarding the work plan of the external auditor in conjunction with the annual audit of the Carson City Comprehensive Annual Financial Report for thefiscal year ended June 30, 2018 and make recommendations to the Board of Supervisors. (Jason Link, [email protected])
Staff Summary: Representatives from Piercy Bowler and City staff will be discussing the work plan of the annual audit of the Carson City Comprehensive Annual Financial Report for the fiscal year ended June 30, 2018.
Agenda Action: Formal Action/Motion Time Requested: 10 minutes
Proposed MotionWill depend on discussion and possible recommendations.
Board’s Strategic GoalEfficient Government
Previous Action N/A
Background/Issues & Analysis NRS 354.624 requires the City to provide for an annual audit of all its financial statements. The Carson City Comprehensive Annual Financial Report (CAFR) for the fiscal year ended June 30, 2018 will be prepared by the Finance Department and audited by the City’s independent (external) auditors, Piercy Bowler.
Representatives from Piercy Bowler will discuss their planned work plan for the fiscal year ending June 30, 2018.
The Audit Committee is charged with annually reviewing the audit scope and work plan of the internal auditor in conjunction with the external auditors plan to address the coordination of audit efforts to ensure the completeness of coverage, reduction of redundant efforts and the effective use of audit resources.
Applicable Statute, Code, Policy, Rule or Regulation NRS 354.624, Carson City Charter 3.075, Carson City Municipal Code 2.14.040(2)(c)
Financial InformationIs there a fiscal impact? Yes No
If yes, account name/number: 290

Staff Report Page 2
Is it currently budgeted? Yes No
Explanation of Fiscal Impact: N/A
Alternatives N/A
Board Action Taken:Motion: ______________________________ 1) _________________ Aye/Nay 2) _________________ ________
________________________________
___________________________ (Vote Recorded By)
291

Final Version: 12/04/15
STAFF REPORT
Report To: Audit Committee Meeting Date: 05/10/2018
Staff Contact: Jason Link, Chief Financial Officer
Agenda Title: For Possible Action: To accept and approve the Internal Auditor’s report and procedures related to the Public Guardian asset liquidation process and provide recommendations to the Board of Supervisors related to the audit findings. (Jason Link, [email protected])
Staff Summary: The Internal Auditor has completed a review of the Public Guardian asset liquidation process. Moss Adams will present their report to the Audit Committee for discussion and possible recommendations to the Board of Supervisors.
Agenda Action: Formal Action/Motion Time Requested: 15 minutes
Proposed MotionWill depend on discussion and possible recommendations.
Board’s Strategic GoalEfficient Government
Previous Action N/A
Background/Issues & Analysis The fiscal year 2018 internal audit plan approved by the Audit Committee contained a project to review to Carson City’s capital projects process.
Applicable Statute, Code, Policy, Rule or Regulation Carson City Charter 3.075, Carson City Municipal Code 2.14.040
Financial InformationIs there a fiscal impact? Yes No
If yes, account name/number:
Is it currently budgeted? Yes No
Explanation of Fiscal Impact:
Alternatives N/A
292

Staff Report Page 2
Board Action Taken:Motion: ______________________________ 1) _________________ Aye/Nay 2) _________________ ________
________________________________
___________________________ (Vote Recorded By)
293

FINAL REPORT FOR
CARSON CITY
Public Guardian Review Update
May 3, 2018
Moss Adams 999 Third Avenue, Suite 200
Seattle, WA 98104 (206)302-6500
294

Carson City Public Guardian Review Update
Table of Contents
I. Executive Summary 1
| Background, Scope, and Methodology 1
| Summary of implementation Status 1
| Recommendation Summary 2
II. Background, Scope, & Methodology 3
| Background 3
| Scope & Methodology 3
III. Status of Recommendations 4
| Administration 4
| Asset Processing 6
| Asset Liquidation 8
Appendix A: Policy Examples 11
295

Carson City Public Guardian Review Update 1
I . EXECUTIVE SUMMARY
BACKGROUND, SCOPE, AND METHODOLOGY
Carson City’s Public Guardian (the Department) provides guardianship services for adults who are legally
incapable of making their own decisions and have no willing or able next of kin to fulfill guardianship
services. Part of the Public Guardian’s role is to liquidate assets held by a ward, including homes, vehicles,
furniture, and other household items. Nevada Revised Statute (NRS) Chapter 159 defines requirements
related to the sale of the ward’s real and personal property. In the 2017 legislative session, the Nevada
legislature passed several reforms to the existing public guardianship process, impacting the
Department’s operations. These reforms largely did not impact the asset liquidation process.
The purpose of this review was to assess progress towards implementing the recommendations provided
in the 2017 Public Guardian Review and, where applicable, provide recommendations addressing
additional opportunities for improvement. The review was conducted in April 2018 and assessed progress
made between May 2017 and April 2018. Due to the relatively short audit period, the Public Guardian
only processed assets for one ward; the poor state of this ward’s residence resulted in destruction of all
assets except for the residence itself. Therefore, progress toward implementing several recommendations
could not be assessed at this time.
SUMMARY OF IMPLEMENTATION STATUS
The Department has made progress implementing the 13 recommendations provided in the 2017 review.
We determined that three of the tasks have been completed, four are in progress, and six are unable to be
assessed at this time, noted by the categorization undetermined. The implementation status of each
recommendation is summarized below, with numbering aligned with the items defined in the 2017
performance audit.
A D M I N I S T R A T I O N
# Recommendation Status
1 Establish regular reporting by the Public Guardian to the Board of Supervisors. Complete
2 Increase the efficiency of the Department through distributing responsibilities and ensuring essential software is up-to-date.
In progress
3 Develop an electronic document storage framework and process, and obtain adequate storage for paper files.
In progress
4 Develop policies and procedures describing the asset liquidation process and ensure proper internal controls are in place.
In progress
A S S E T P R O C E S S I N G
# Recommendation Status
5 Document the decision to forfeit, demolish, donate, or sell ward assets using photographs and narrative accounts.
Complete
296
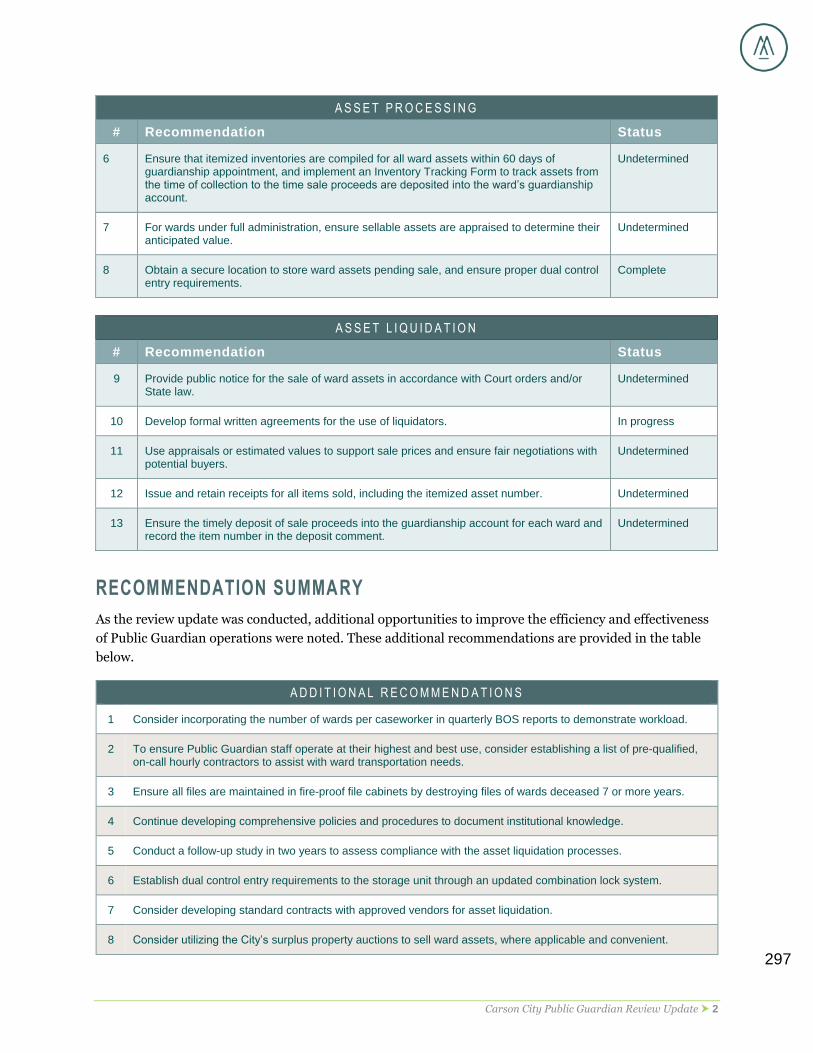
Carson City Public Guardian Review Update 2
A S S E T P R O C E S S I N G
# Recommendation Status
6 Ensure that itemized inventories are compiled for all ward assets within 60 days of guardianship appointment, and implement an Inventory Tracking Form to track assets from the time of collection to the time sale proceeds are deposited into the ward’s guardianship account.
Undetermined
7 For wards under full administration, ensure sellable assets are appraised to determine their anticipated value.
Undetermined
8 Obtain a secure location to store ward assets pending sale, and ensure proper dual control entry requirements.
Complete
A S S E T L I Q U I D A T I O N
# Recommendation Status
9 Provide public notice for the sale of ward assets in accordance with Court orders and/or State law.
Undetermined
10 Develop formal written agreements for the use of liquidators. In progress
11 Use appraisals or estimated values to support sale prices and ensure fair negotiations with potential buyers.
Undetermined
12 Issue and retain receipts for all items sold, including the itemized asset number. Undetermined
13 Ensure the timely deposit of sale proceeds into the guardianship account for each ward and record the item number in the deposit comment.
Undetermined
RECOMMENDATION SUMMARY
As the review update was conducted, additional opportunities to improve the efficiency and effectiveness
of Public Guardian operations were noted. These additional recommendations are provided in the table
below.
A D D I T I O N A L R E C O M M E N D A T I O N S
1 Consider incorporating the number of wards per caseworker in quarterly BOS reports to demonstrate workload.
2 To ensure Public Guardian staff operate at their highest and best use, consider establishing a list of pre-qualified, on-call hourly contractors to assist with ward transportation needs.
3 Ensure all files are maintained in fire-proof file cabinets by destroying files of wards deceased 7 or more years.
4 Continue developing comprehensive policies and procedures to document institutional knowledge.
5 Conduct a follow-up study in two years to assess compliance with the asset liquidation processes.
6 Establish dual control entry requirements to the storage unit through an updated combination lock system.
7 Consider developing standard contracts with approved vendors for asset liquidation.
8 Consider utilizing the City’s surplus property auctions to sell ward assets, where applicable and convenient.
297

Carson City Public Guardian Review Update 3
I I . BACKGROUND, SCOPE, & METHODOLOGY
BACKGROUND
The Department provides guardianship services for adults who are legally incapable of making their own
decisions. The Public Guardian arranges for medical and hospice care, manages finances, and attends to
other needs of Court-appointed wards. The Department currently has 75 active wards, with an additional
four cases pending. The Department has three FTEs, including the Public Guardian, Deputy Public
Guardian, and an account clerk. Two social work interns also provide support to the Department during
the academic year.
Public Guardian activities are primarily driven by Nevada State Law (NRS Chapters 159 and 253). These
laws were revised in the last legislative session due to heightened public scrutiny over guardianship
practices in the State. For example, under the prior law, the Public Guardian would receive temporary
guardianship after determining that an individual does not have willing and able next of kin to fulfill
guardianship services. Under the new law, the individual is appointed an attorney to facilitate the
guardianship process and works with the Public Guardian to grant full or summary administration.
Regulations regarding disposition of ward assets are largely unchanged.
Typically, wards are referred to the Public Guardian after they have moved into a residential care setting
and no longer have assets such as a home or vehicle. In the event that the ward is still in their home and
requires care in a facility, the Public Guardian has the authority and responsibility to liquidate assets such
as homes, vehicles, furniture, and other items that they can no longer use. Between April 2017 and May
2018, the Public Guardian received a referral for one ward who was still living in a residence, all other
wards were in a residential care setting or did not have assets.
SCOPE & METHODOLOGY
The purpose of this review was to assess progress towards implementing the recommendations provided
in the 2017 Public Guardian Review. This review was conducted in April 2018 and consisted of three
phases: 1) startup and ongoing management, 2) fact finding, and 3) reporting. To validate the completion
of prior recommendations, we interviewed Public Guardian staff and reviewed key documents from May
2017 to April 2018. During this time, the Public Guardian only processed assets for one ward, and the
poor state of this ward’s residence resulted in destruction of all assets except for the residence itself.
Therefore, progress toward implementing several recommendations could not be assessed at this time.
Based on interviews and document review, progress toward recommendation implementation was
assessed and, where applicable, additional recommendations were provided.
298

Carson City Public Guardian Review Update 4
I I I . STATUS OF RECOMMENDATIONS
ADMINISTRATION
A. OVERSIGHT OF PUBLIC GUARDIAN
F I N D I N G 1
Recommendation Establish regular reporting by the Public Guardian to the Board of Supervisors.
Status Complete
Additional Recommendations
1. Consider incorporating the number of wards per caseworker to demonstrate workload.
Beginning in September 2017, the Public Guardian provided quarterly reports to the Board of
Supervisors. These reports detail the current guardianship caseload, including the number of new
guardianships, type of administration, and fees charged. To help Supervisors understand the
Department’s workload, the Public Guardian should also consider incorporating the number of wards per
the number of case workers in quarterly reports. This information will help the Board understand the
Department’s caseload and determine if additional resources are required.
The Department’s current caseload is approximately a 33:1 ward-to-guardian ratio. Although the NRS
does not provide a maximum caseload per caseworker, several states, including Washington and Virginia,
have adopted a 20:1 ratio. Industry associations, such as the Council of Accreditation and the National
Guardianship Association, do not provide recommended ratios, but state that the caseload should be
small enough to enable caseworks to have contact with wards on a monthly basis, at a minimum.
Department staff report that, at a minimum, all wards are visited on a monthly basis.
B. OPERATIONAL EFFICIENCY
F I N D I N G 2
Recommendation Increase the efficiency of the Department through distributing responsibilities and ensuring essential software is up-to-date.
Status In progress
Additional Recommendations
2. To ensure Public Guardian staff operate at their highest and best use, consider establishing a list of pre-qualified, on-call hourly contractors to assist with ward transportation needs.
The Public Guardian and Deputy Public Guardian work closely together to manage the Department’s
caseload. In accordance with best practices, employees attend initial meetings, home inspections, and
other key activities together. Other activities, such as grocery shopping, doctor’s appointments, and
monthly visits are typically conducted independently. Department staff typically distribute tasks based on
the type of activity and time of day to accommodate their schedules. However, staff note that their day-to-
day workload fluctuates significantly as new wards are added to their caseload, wards require urgent
attention, and/or wards have appointments that are some distance away. To ensure that Department staff 299

Carson City Public Guardian Review Update 5
are able to utilize their time in the most efficient and effective manner, the Department should consider
establishing a registry of pre-qualified, on-call contractors to assist with straight-forward activities, such
as transporting clients to appointments and clearing out forfeited property.
The Public Guardian updated its accounting software, Quickbooks, to a recent version in Fall 2017. To
further streamline Department operations, the Public Guardian should consider purchasing system
additions, such as check writing capabilities. This feature is likely to improve efficiency and record-
keeping practices.
C. FILE MAINTENANCE
F I N D I N G 3
Recommendation Develop an electronic document storage framework and process, and obtain adequate storage for paper files.
Status In progress
Additional Recommendations
3. Ensure all files are maintained in fire-proof file cabinets by destroying files of wards deceased 7 or more years.
The Department has developed an electronic file structure on the City’s H: drive. However, staff report
that, due to the Department’s current caseload, files have not been fully transitioned to the electronic
system. Additionally, Department staff report that most communication regarding wards occurs on paper,
rather than electronically, and the Department has not established a workflow to ensure all paper
documents are scanned and electronically filed. The Department should ensure that key files are
maintained electronically for security purposes. At a minimum, the Public Guardian should maintain an
electronic copy of court documents, annual accountings, final accountings, and other key documents such
as monthly summary notes and external communications. Because Department staff have limited capacity
for administrative tasks, document scanning and filing could be performed by an intern or temporary
employee. The Department should fully transition to electronic filing to assist with records management
and retention.
Because the Department relies on paper files, document storage space is limited. Currently, the Public
Guardian has boxes of deceased ward files in the main office, not in a locked, fire safe cabinet. To protect
guardianship documents and ensure they are maintained for seven years in accordance with state law, the
Department should maintain all client files in fire-proof file cabinets. Also, the Department should destroy
files for wards deceased seven or more years, in accordance with State records retention requirements.
300

Carson City Public Guardian Review Update 6
D. POLICIES AND PROCEDURES
F I N D I N G 4
Recommendation Develop policies and procedures describing the asset liquidation process and ensure proper internal controls are in place.
Status In progress
Additional Recommendations
4. Continue developing comprehensive policies and procedures to document institutional knowledge.
The Public Guardian initiated policy development related to asset disposition. In addition to these
policies, the Public Guardian is also updating other operational policies to reflect recent, regulatory
changes. To assist with this effort, sample policy language is included in Appendix A.
Without comprehensive policies and procedures, the Department may not be performing processes
consistently and risks losing institutional knowledge. Additionally, there is a risk of noncompliance with
regulatory requirements. The Department should document policies and procedures to promote a smooth
transition to future Public Guardians, particularly given the Public Guardian’s anticipated retirement in
Summer 2018.
As noted in the 2017 report, policies should include, but not be limited to, the following elements:
Describe tracking requirements throughout the asset liquidation process
Establish agreements with experts in valuation to provide appraisal services
Specify dollar value threshold of items that family members can take without purchase
Establish where the Public Notice of Sale will occur and what information it should include
Establish agreements with liquidators to include a standard commission percentage, sales process,
and proper documentation of sale
Standardize the percent difference between the sales price and the appraised or estimated value of an
asset
Determine how long to retain an asset before donation (i.e., if the item cannot sell)
Appendix A includes sample policies for asset disposition.
ASSET PROCESSING
A. DOCUMENTATION OF ASSET EXISTENCE AND CONDITION
F I N D I N G 5
Recommendation Document decisions to forfeit, demolish, donate, or sell ward assets using photographs and narrative accounts.
Status Complete
301

Carson City Public Guardian Review Update 7
As noted in the introduction, over the course of the review period, the Department processed assets for
one ward. A review of this ward’s court petition and subsequent documentation demonstrated that the
Department adequately documented the state of the ward’s assets through pictures and narrative
accounts. The Department reported that this is their current practice, which is reflected in the process
map used as the basis for procedures.
B. INVENTORY OF SELLABLE ITEMS
F I N D I N G 6
Recommendation
Ensure that itemized inventories are compiled for all ward assets within 60 days of guardianship appointment, and implement an Inventory Tracking Form to track assets from the time of collection to the time sale proceeds are deposited into the ward’s guardianship account.
Status Undetermined
Additional Recommendations
5. Conduct a follow-up study in two years to assess compliance with the asset liquidation processes.
Progress on this recommendation was unable to be determined because our review was limited to one
case with assets. However, this ward’s home had a rodent infestation, rendering the limited assets within
the residence hazardous and unable to be salvaged and sold.
C. ASSET APPRAISAL
F I N D I N G 7
Recommendation For wards under full administration, ensure sellable assets are appraised to determine their anticipated value.
Status Undetermined
Additional Recommendations
5. Conduct a follow-up study in two years to assess compliance with the asset liquidation processes.
The Department established a contract with a local appraiser, which is negotiated and used on a case-by-
case basis. Progress on this recommendation was unable to be determined due to the absence of sold
assets during the audit period. Furthermore, most wards that fall under the Public Guardian’s care do not
have sufficient assets to require a formal appraisal.
D. ASSET STORAGE
F I N D I N G 8
Recommendation Obtain a secure location to store ward assets pending sale, and ensure proper dual control entry requirements.
Status Complete
302

Carson City Public Guardian Review Update 8
Additional Recommendations
6. Establish dual control entry requirements to the storage unit through an updated combination lock system.
In December 2017, the Public Guardian began renting a 10 x 10 storage unit at a local facility to store
assets pending sale. While the unit is relatively small, Department staff noted that it currently meets their
storage needs. Although Department policies require two or more employees to be present to enter the
storage unit, the current lock and key system does not prevent one employee from entering the unit alone.
In order to establish stronger controls, the Department should consider purchasing a combination lock
with four or more digits. One employee should be responsible for a portion of the combination, and
another employee should be responsible for the remaining digits in the combination. The full combination
may be kept in another secure location that requires two or more City employees to access. Given
upcoming staffing changes, this practice should be implemented to protect existing and new staff from
allegations of wrongdoing.
ASSET LIQUIDATION
A. ADVERTISEMENT OF SALE
F I N D I N G 9
Recommendation Provide public notice for the sale of all ward assets in accordance with Court orders and/or State law.
Status Undetermined
Additional Recommendations
5. Conduct a follow-up study in 2 years to assess compliance with asset liquidation processes.
Progress on this recommendation was unable to be determined due to the absence of sold assets during
the audit period.
B. USE OF LIQUIDATORS
F I N D I N G 1 0
Recommendation Develop formal written agreements for the use of liquidators.
Status In progress
Additional Recommendations
7. Consider developing standard contracts with approved vendors for asset liquidation.
8. Consider utilizing the City’s surplus property auctions to sell ward assets, where applicable and convenient.
The Public Guardian updated its list of liquidators, including brokers, real estate agents, auctioneers, and
specialty dealers. However, the Department has not established contracts that define terms of agreement
with liquidators. Department staff report that these agreements are typically negotiated on a case-by-case
basis with vendors on the approved list.
303

Carson City Public Guardian Review Update 9
The Public Guardian should consider leveraging the City’s surplus property auctions to sell ward assets,
where applicable and convenient. The City’s process for liquidating surplus property should follow similar
protocols for sale advertisements, liquidator agreements, and overall sales processes. Leveraging existing
City processes may help alleviate workload for the Department and support appropriate internal controls.
C. ENSURE MAXIMUM VALUE FOR ASSET
F I N D I N G 1 1
Recommendation Use appraisals or estimated values to support sale prices and ensure fair negotiations with potential buyers.
Status Undetermined
Additional Recommendations
5. Conduct a follow-up study in two years to assess compliance with the asset liquidation processes.
Progress on this recommendation was unable to be determined due to the absence of sold assets during
the audit period. The Department adopted a policy stating that goods valued at $500 or more must be
sold within 20% of the assessed value. However, compliance with the policy could not be assessed at this
time due to the lack of items sold during the audit period.
D. MAINTENANCE OF RECEIPTS
F I N D I N G 1 2
Recommendation Issue and retain receipts for all items sold, including the itemized asset number.
Status Undetermined
Additional Recommendations
5. Conduct a follow-up study in two years to assess compliance with the asset liquidation processes.
The Department maintains Bill of Sale books to be used for all future sales of ward assets and reports that
sales will only occur with a written receipt. However, progress on this recommendation was unable to be
determined due to the absence of sold assets during the audit period.
E. DEPOSITS OF SALE PROCEEDS
F I N D I N G 1 3
Recommendation Ensure the timely deposit of sale proceeds into the guardianship account for each ward and record the item number in the deposit comment.
Status Undetermined
Additional Recommendations
5. Conduct a follow-up study in two years to assess compliance with the asset liquidation processes.
304

Carson City Public Guardian Review Update 10
The Department sold one item, a motorhome, during the audit period. A review of the receipt, deposit,
and bank statement verified that the Department properly accounted for this sale in the ward’s bank
account. However, the utilization of the asset inventory tracking form, asset numbering, and
corresponding deposit slip could not be assessed, because the Department did not sell any additional
items during the audit period. Typically, the inventory tracking form would be used to record actions for
household items such as furniture, décor, jewelry, and collections.
305

Carson City Public Guardian Review Update 11
APPENDIX A: POLICY EXAMPLES
County of Santa Clara General Assistance: Chapter 16 Property
National Guardianship Association Standards of Practice: Standards 17-20
306

307

Final Version: 12/04/15
STAFF REPORT
Report To: Audit Committee Meeting Date: 05/10/2018
Staff Contact: Jason Link, Chief Financial Officer & Steve Ferguson, Audit Committee Chairman
Agenda Title: For Possible Action: To accept and approve the Internal Auditor’s report and procedures related to the capital projects process and provide recommendations to the Board of Supervisors related to the audit findings. (Jason Link, [email protected])
Staff Summary: The Internal Auditor has completed a review of Carson City’s capital projects process. MossAdams will present their report to the Audit Committee for discussion and possible recommendations to the Board of Supervisors.
Agenda Action: Formal Action/Motion Time Requested: 15 minutes
Proposed MotionWill depend on discussion and possible recommendations.
Board’s Strategic GoalEfficient Government
Previous Action N/A
Background/Issues & Analysis The fiscal year 2018 internal audit plan approved by the Audit Committee contained a project to review to Carson City’s capital projects process.
Applicable Statute, Code, Policy, Rule or Regulation Carson City Charter 3.075, Carson City Municipal Code 2.14.040
Financial InformationIs there a fiscal impact? Yes No
If yes, account name/number:
Is it currently budgeted? Yes No
Explanation of Fiscal Impact:
Alternatives N/A
308

Staff Report Page 2
Board Action Taken:Motion: ______________________________ 1) _________________ Aye/Nay 2) _________________ ________
________________________________
___________________________ (Vote Recorded By)
309

PROPRIETARY AND CONFIDENTIAL
FINAL REPORT FOR
CARSON CITY Capital Projects Process Review
May 2, 2018
Moss Adams 999 Third Ave, Suite 2800
Seattle, WA 98104 206-302-6500
310

Capital Projects Process Review Report for Carson City
Table of Contents
I. Executive Summary 1
| A. Background, Scope, and Approach 1
| B. Recommendations 1
II. Background, Scope, and Approach 2
| A. Background 2
| B. Scope and Approach 2
III. Commendations 3
IV. Recommendations 4
| 1. Capital Project Planning 4
| 2. Project Management Standardization 4
| 3. Document Signature Management 5
| 4. Capital Project Identifiers 6
| 5. Public Works Staff Payroll for Capital Projects 7
| 6. Documentation Standardization 7
| 7. Project Close-Out Procedures 7
| 8. Project Postmortem 8
Appendix A – Process Flowcharts 9
Appendix B – Documentation Tested 15
Appendix C – Project Management Manual Table of Contents 16
311

Capital Projects Process Review Report for Carson City 1
I . EXECUTIVE SUMMARY
A. BACKGROUND, SCOPE, AND APPROACH Carson City’s Public Works Department provides technical assistance and support for the City’s capital
projects. Capital projects are physical assets that have a useful life of 10 or more years and cost at least
$25,000. These projects are proposed by a variety of stakeholders including Board of Supervisors members, citizens, and City employees, and are approved by the Board of Supervisors annually.
This review was conducted to document, assess, and identify opportunities for improvement in the
processes surrounding the administration of the City’s capital projects. Documentation was reviewed for seven projects that were completed between FY 2015 and FY 2017. The review was conducted between
November 2017 and March 2018 and consisted of four phases: planning, fact finding, analysis, and
reporting.
B. RECOMMENDATIONS This review identified the following opportunities for improvement in the City’s capital projects processes:
1 Develop and utilize a scorecard that establishes objective criteria to assist in the evaluation of capital projects during the capital planning selection process.
2 Cultivate a Project Management Manual that provides standardized templates, checklists, forms, and best practice guidance.
3 Subscribe to Electronic Signature Services to expedite the contract approval process.
4 Utilize a single unique identifier for projects to ensure documentation clearly references each project.
5 Explore system support for staff payroll on capital projects to enable more efficient and effective tracking of Public Works staff time.
6 Clearly identify and separate capital project documents to properly track contract modifications.
7 Expand capital project close-out processes to include a review of project costs, deliverables, and required documentation
8 Create a project postmortem process to continuously improve capital project efficiencies.
312

Capital Projects Process Review Report for Carson City 2
I I . BACKGROUND, SCOPE, AND APPROACH
A. BACKGROUND The Carson City Public Works Department (the Department) provides technical assistance and support
for capital projects. Capital projects are defined as physical assets, constructed or purchased, that have a
useful life of 10 years or longer and cost $25,000 or more. Projects vary from year to year, but often include construction of water, sewer and storm drain facilities, streets, parks, bridges, and buildings. The
Department consists of seven divisions: Administrative, Transportation, Engineering, Water, Wastewater,
Operations, and Control Systems. Public Works manages capital project construction for all City departments.
Board of Supervisors members, citizens, and City staff have the ability to propose potential Capital
projects. Each project is reviewed by the Capital Improvement Project Review Committee, which is
composed of senior staff and the City Manager. The Review Committee develops a proposed Capital Improvement Plan (CIP), which receives final approval by the Board of Supervisors. Throughout the
development of this plan, several factors are considered, including City goals, policies, and funding
sources and availability, as determined by the Finance Department.
B. SCOPE AND APPROACH The purpose of this review is to document and assess the processes surrounding the administration of the
City’s capital projects, and identify opportunities for improvement. The review was conducted between
November 2017 and March 2018 and was performed in four phases: planning, fact finding, analysis, and
reporting. In the fact finding phase, we interviewed Carson City Public Works management and reviewed various relevant documents. Using this information, we drafted capital projects-related process flowcharts
(Appendix A), which were reviewed with the Department to validate the accuracy of the process
documentation. We also tested the documented processes by reviewing project documentation for a sample of seven capital works projects with the Public Works Document Control Specialist. This sample
was judgmentally selected from 25 capital projects completed between FY 2015 and FY 2017, with the goal
of assessing projects for each division, funding source, and budget. See Appendix B for a list of
documentation artifacts that were tested in this review. We reviewed a draft report with the Department and City management to validate facts and confirm the practicality of recommendations.
313

Capital Projects Process Review Report for Carson City 3
I I I . COMMENDATIONS Although the focus of the Capital Project Process Review was to identify opportunities for improvement, it
is important to acknowledge areas of strength that can be leveraged throughout the organization. The
Public Works Department should be commended for the following accomplishments:
Development of Policies and Procedures: The Public Works Department has continued to improve its internal policies and procedures in order to standardize Department processes. For example, the Project Initiation Procedure provides guidance on procedures to initiate projects managed by Public Works. There are also existing bid process procedures and vendor guides. Standard filing hierarchy has been established for document storage and archival, and increasingly consistent naming conventions are utilized.
Construction Management Documentation Manual: This document, last updated in 2017, provides the documentation requirements for construction projects, including project setup, project administration, testing, and quality control. The Manual outlines the expected filing system and structure, naming conventions, required documentation for projects, and examples of common forms and reports.
Implementation of Smartsheet Project Management Solution: The Public Works Department implemented and utilizes the cloud-based project management solution Smartsheet. This creates greater transparency and accountability within the Department, as well as a centralized way to plan, track, automate, and report on projects.
Continuous Improvement Culture: Carson City uses the third-party online bidding program Nevada Government Electronic Marketplace (NGEM) to facilitate bidder registration and solicitation publishing, as well as transact solicitations electronically. The City’s Purchasing and Contracts Division is working with the Public Works Department to implement the feature offered in NGEM that allows the bid documents to be created within the system.
We would like to commend Public Works staff and management for their willingness to assist us in this
review process.
314

Capital Projects Process Review Report for Carson City 4
IV. RECOMMENDATIONS
1. CAPITAL PROJECT PLANNING The City currently implements consensus-based processes among department leaders in order to develop
one-year and five-year Capital Improvement Plans (CIP). As part of the annual budget process, all
departments and funds are required to identify and submit a five-year capital improvement program to accomplish the City’s goals and objectives. The CIP committee, comprised of department heads
throughout the City, reviews each request and interviews each department regarding their request. The
role of this committee is to prioritize the CIP requests into a recommendation for the City Manager to consider. The committee members consider the City’s goals and objectives in determining the capital
spending priorities; however, there is no quantifiable scorecard utilized within this process.
1 RECOMMENDATION Develop and utilize a scorecard that establishes objective criteria to assist in the evaluation of capital projects during the capital planning selection process.
We recommend that objective criteria be developed to evaluate and prioritize capital projects to support a capital budget based on City-wide priorities, sound asset management practices, and projects where the greatest need and benefit is demonstrated. This would allow for proposed capital projects to be initially ranked based on objective criteria, and then the committee could focus on determining priority. While ultimately based on judgment, decisions still have to be defended on the merits of the pre-established criteria, thus ensuring that the capital projects that add the most value to the City are approved for funding regardless of which department proposes them. An objective prioritization process for selecting capital projects is fundamental in ensuring that the City uses its limited resources on the capital projects that will provide the most value to citizens.
2. PROJECT MANAGEMENT STANDARDIZATION The City maintains a Construction Management Documentation Manual, last revised in 2017, which applies to projects with state and federal funding and projects worth $50,000 and greater. This manual
provides guidance on how to consistently and uniformly process the documentation surrounding
construction projects, including Capital Projects. However, this Manual is not inclusive of other elements
necessary for overall project success, particularly from the perspective of Project Managers. A comprehensive project management manual would provide practical guidance and best practice
information on topics such as managing project planning, cost estimating, scope, budgeting, scheduling,
and types of changes. Additional topics include safety management and risk management resources for Project Managers.
The principle responsibility of any Project Manager is to deliver assigned projects on schedule, within
budget, and in accordance with the agreed upon scope of work. The scope of work is developed with input
from various stakeholders, who many have conflicting goals and priorities. Ultimately, Project Managers are responsible for managing stakeholder expectations and reconciling them with budget constraints.
315

Capital Projects Process Review Report for Carson City 5
Project Managers may delegate tasks to other project team members, but still retain the responsibility for
project success.
2 RECOMMENDATION Cultivate a Project Management Manual that provides standardized templates, checklists, forms, and best practice guidance.
To ensure that capital projects are managed consistently and that internal control requirements are met, we suggest that the City continue to evolve the Construction Management Documentation manual to expand beyond documentation and into other aspects of project management. A manual with project management procedures would serve as a central source of information for Project Managers, and should include the existing standardized templates, checklists, forms, and best practice guidance. The level of detail for capital projects may vary due to project costs, schedule, level of complexity, and information needs; a project management manual would provide guidance to project managers in managing the planning, design, and administration of capital projects. This manual should be regularly updated to provide project managers with the most current information necessary to properly execute projects. Appendix C includes a suggested table of contents for a project management manual.
3. DOCUMENT SIGNATURE MANAGEMENT Currently, the City processes hard-copy documents related to capital projects which require all parties to
print, sign, scan, and return documents. Multiple parties are involved (including the Board of
Supervisors; City Clerk; City Attorney’s Office; Contractors; Finance; and Public Works), and the Contracts Manager and Document Control Specialist are required to coordinate the gathering of these
signatures across multiple copies of documents. For example, after a contract is approved, the City Clerk
works to gather the required signatures from the Mayor and the members of the Board of Supervisors. At the same time, the Department Business Manager obtains the signatures from the Public Works Director
and coordinates with the City Attorney’s Office for the signature of the District Attorney. The City reports
that the signature gathering process typically takes two weeks to complete.
316

Capital Projects Process Review Report for Carson City 6
3 RECOMMENDATION Subscribe to Electronic Signature Services to expedite the contract approval process.
Allowing for electronic signatures can expedite an organization's approval procedure by capturing the electronic approvals made by individuals or departments. Therefore, the City should consider subscribing to an electronic signing solution that would allow the various parties involved in capital projects to approve and sign documents using digital certificates. Moving from paper-based to electronic document workflows increases efficiency and reduces costs. There are at least two statues applicable in Nevada that allow digital signatures – the Federal ESIGN Act of 2000 and Nevada’s State Revised Statute 719.240, adopted in 2001. A digital signature is not a valid substitute for a wet signature when there is a requirement for a record to be signed in the presence of a third party; however, for most of the contracts and documents submitted to the City, a digital, electronic, or typographic signature is sufficient.
4. CAPITAL PROJECT IDENTIFIERS Files for Capital Projects are notated by project number, which is the system-generated number created by the Finance department in SunGard (accounting system). The Project number is assigned during the
project initiation phase, after the Finance department processes the Project Request Form submitted by
the Project Manager. The Document Control Specialist creates the project folder and subfolders on the
network drive, utilizing the project number in the naming convention. Projects in Smartsheet also utilize the project number for tracking and reporting on projects. However, our testing revealed that some
documents related to the same project are referenced by Purchasing and Contracts using the contract
number, which is generated internally within that department during the bidding process. This creates two separate sets of unique identifiers used on different documents for individual Capital Project.
4 RECOMMENDATION Utilize a single unique identifier for projects to ensure documentation clearly references each project.
The Public Works Department and Purchasing and Contracts division should explore utilizing the Finance system-generated project number as the sole unique identifier in order to facilitate standardized naming conventions and ease of search. Choosing a single unique identifier allows for clear reference to each project, and establishes a distinct hierarchy and association of each of the subsequent contract numbers within projects. Project naming conventions for official projects names should also be concise, consistent, and descriptive in order to reduce confusion and streamline document searches.
317

Capital Projects Process Review Report for Carson City 7
5. PUBLIC WORKS STAFF PAYROLL FOR CAPITAL PROJECTS
Public Works staff currently record any time spent working on individual capital projects in spreadsheets
on the network drive, which are printed and approved by supervisors. Payroll time sheets are then sent to the Business Manager for payroll processing. The Financial Analyst compiles staff time spent on capital
projects and sends to the Finance Department for journal entry to move payroll charges to capital
projects.
5 RECOMMENDATION Explore system support for staff payroll on capital projects to enable more efficient and effective tracking of Public Works staff time.
We suggest that Public Works collaborate with the Finance department to explore potential ways to better track the Public Works staff payroll costs associated with capital projects. Any solution would need to consider the importance of tracking fully-loaded rates in order to track the full cost of staff time.
6. DOCUMENTATION STANDARDIZATION Currently, each capital project should have separate Bid Documents, Conformed Documents, and
Contract Documents. Conformed Documents should include revisions to the Bid Documents, completed
Bid Documents from the Contractor, and any other changes from the original Bid Documents. This is to allow for easy identification of any changes made or modified via addenda. The difference between these
types of documents is not currently captured in City policies and procedures. During testing of select
capital projects documentation, not all of these documents were separated and stored in the assigned locations.
6 RECOMMENDATION Clearly identify and separate capital project documents to properly track contract modifications.
It is important to clearly define what does, and does not, constitute each of the types of documents associated with a capital project; failure to properly designate the Contract Documents can be a significant contractual flaw. Collectively, the documents should be clearly separated by type for ease of reference, auditing, and other needs. The distinction and appropriate filing between these types of documents should be incorporated into documented City procedures.
7. PROJECT CLOSE-OUT PROCEDURES The current Public Works administrative close-out process for capital projects focuses primarily on document archival. There is currently no comprehensive close-out checklist, documented procedure, or
close-out approval process established. During our on-site testing, not all project documentation was
correctly filed within the Public Works network drive folder hierarchy, and some project artifacts
remained with the Purchasing and Contracts department. This was in part due to the fact that many of the projects were completed before or during the changes made to project documentation standardization.
318

Capital Projects Process Review Report for Carson City 8
7 RECOMMENDATION Expand capital project close-out processes to include a review of project costs, deliverables, and required documentation.
The Department would benefit from developing a template for capital project close-out. A more robust close-out procedure helps ensure that projects close out in a timely manner. Close-out procedures should include project post-mortem, comparing final outcomes to scope, cost outcomes, performance measures, and project objectives (such as milestones/targets). The close-out of the project should have a clearly defined trigger for action and include a review of costs and project deliverables. The close-out process can also include a review of contracts to verify reconciliation and to collect any recoverable funding. Finally, project managers should work with the Document Control Specialist to verify that all required documentation is filed and archived fully and correctly on the network drive.
8. PROJECT POSTMORTEM The documented Public Works capital projects close-out policies and procedures do not include a step to
identify, document, and review any lessons learned from individual projects. The Construction
Management Documentation Manual includes a list of close-out documentation that should be maintained; however, there is not a formalized process to conduct a post-project review.
8 RECOMMENDATION Create a project postmortem process to continuously improve capital project efficiencies.
Implementing a project postmortem process as part of project close-out for capital projects would support the capture of lessons learned and help identify opportunities for improvement for future projects. Lessons learned can include technical, managerial, and process aspects of the project. Project Managers should work with contractors, departments, and clients in order to ensure that relevant issues, including process changes, are documented and reviewed by relevant parties. Lessons learned should include the cause of issues, reasoning behind any corrective actions chosen, and any other specific issues that challenged the project/project team.
319

Capital Projects Process Review Report for Carson City 9
APPENDIX A – PROCESS FLOWCHARTS
Plan
ning
Beg
ins
Gen
eral
Fun
dsU
tility
Fun
dsC
IP P
lan
Cre
ated
CIP Planning
Departments maintain ongoing list of potential capital expenditure requests
throughout the year.
City CFO distributes multi-year CIP instructions to all city departments in October/
November.
Is it a new project?
Project Manager (PM) submits new project item to
City Engineer’s (CE) office for a cost estimate.
CE office provides cost estimate to Project
Manager.
Are the projects utility funds or general funds?
Departments submit capital expenditure requests to the Internal Finance Committee for review by the
end of November.
Finance Department creates financial projections of
available funds for upcoming fiscal year.
Finance allocates remaining money to Capital Projects
budget.
CIP Budget
Public Works (PW) Department Business
Manager (DBM) schedules series of planning meetings.
PMs submit CIP requests to PW Fiscal Analyst
(FA).
During planning meetings, discuss and
prioritize projects from all available sources.
Rank projects on list (not considering costs).
Prior Year Projects
Master Plan
Requests from Operations
Informal Project List
FA calculates forecast of available funding for
Utility Funds.
Unofficial Utility Fund CIP Budget
CIP Committee meets to review and validate CIP
plan draft via group consensus.
A
A
B
C
B C
C
Committee reviews each request and interviews each department regarding their
request.
Draft 1-Year CIP Plan
Draft 5-Year CIP Plan
Does CIP Committee reach consensus?
CIP Committee continues to discuss
and revise until reaching consensus.
CIP Committee provides recommendations to City
Manager.
City Manager’s Office schedules public meeting
to present draft CIP.
Are there changes due to public input?
Finance Department reviews and revises CIP.
City Manager’s Office sends recommended CIP
plan to Board of Supervisors.
No
Yes
General
Utility
No
Yes
Yes
No
The Board of Supervisors accepts, rejects or modifies the recommendation of major and minor capital project spending by the
City Manager.
D
320

Capital Projects Process Review Report for Carson City 10
Pre-
Des
ign
Des
ign
Pre-Design and Design
DCity Engineer meets with project and design teams
to identify project staffing and scheduling.
Project Manager (PM) fills out project request
form, sends it to PW Fiscal Analyst (FA).
FA reviews and sends form to Finance
Department.
Project Request Form
Finance confirms funding availability, sets
up project in finance systems, and generates a
project number.
SunGard
Finance notifies FA of processed project form and returns project
request form filled out with project number.
FA sends project information to Document Control Specialist (DCS).
DCS sets up new project in Smartsheet and folder on
network drive.
PM enters required project information
(budget, schedule) into Smartsheet.
PM holds project kickoff meeting with all
stakeholders.
Network Drive
Smartsheet
Design Engineer schedules design progress meetings and
identifies design-phase milestones.
PM tracks project status in
Smartsheet.
Smartsheet
PM puts all documents in the project folder.
Network Drive
Project design reaches approximately 90%
completion.
E
Are consultants required for the
design?
Project Manager (PM) fills out Contract Request
Form.
PM issues formal RFP to select consultant.
Contract Request Form
PM and Consultant finalize contract cost.
PM submits completed Contract Request Form
to Financial Analyst (FA).
Financial Analyst reviews and sends to Purchasing/Contract Administrator
(PCA)
PCA issues a contract to Design Consultant
PCA sends signed contract to FA and PM.
Is desired consultant on Statement of
Qualifications list?
PM contacts desired contractor(s) from the
Statement of Qualifications list.
RFP Selection Process
Statement of Qualifications
No
Yes
No
Yes
321

Capital Projects Process Review Report for Carson City 11
Bid
Doc
umen
t Pre
para
tion
Bid
Aw
ard
Bid Preparation & Bid-Award
Project Manager (PM) prepares the project bid documents for all
construction-related contracts.
PM notifies Document Control Specialist (DCS)
of bid documents.
DCS reviews the project bid documents and sends to
Purchasing/Contracts Administrator (PCA).
Network Drive
PCA reviews documents and adds contract
number and bid dates.
DCS conducts final review of bid documents; confirms accuracy with
PCA.
E DCS reviews and prepares draft bid
document.
Requires a Public Works Identifying (PWP) number from Labor Commission?
PCA applies for and acquires a PWP number.
PCA notifies PM, DCS, Fiscal Analyst (FA), and
City Engineer (CE) of draft bid document on network
drive.
PM approves bid documents.
Yes
No
PM schedules pre-bid meeting if needed.
PCA uploads bid document(s) to NGem
and submits advertisement request(s).
NGem
PCA receives sealed bid documents submitted via
NGem.
Public bid-opening meeting is held to open
and review received bids.
PCA checks required documents; updates
Bid Tab, scans in proposals.
PM reviews received bids, discusses with PW
Director/CE.
Do PW Director, City Engineer, and PM agree on recommended
bid?
Work with PM to identify best bid, discuss questions
with bidder.
Is re-bid necessary?
PM notifies PCA of recommended Bid with
Staff Summary.
PCA sends signed Contract Award to PM, CM, DCS, FA,
and AT.
PM, City Engineer, and Contractor rework project
budget or scope.
F
NoYes
PCA updates bid document(s) with any addendums.
PCA schedules bid-opening meeting
(reserves room; provides sign-in Sheet & Bid Tab).
DCS reviews proposals for
federal requirements.
PCA notifies PM, Construction Manager (CM), DCS, and
Accounting Technician (AT) of scanned documents.
Any proposal(s) rejected?
PCA notifies contractor,
identifying reason for rejection.
PCA updates website with
proposal status.
PM confirms account numbers and verifies
available budget amount with FA.
PM updates bid documents with
"Conformed" to create conformed documents.
PCA prepares Draft Board Action Form and emails to
CM, PM, and District Attorney (DA) for approval.
PCA finalizes Board Action Form and submits to Executive Office to be put on the Board of
Supervisors agenda.
Board of Supervisors
approves Contract Award.
Clerk gathers signatures from Mayor
and Board of Supervisors.
Awardee notarizes Contract & returns
with bond approval, licensing & insurance
information.
PCA verifies Contractor insurance
and licenses.
BM obtains PW Director signature & coordinates with DA
office for DA signature.
No
YesYesNo
PCA sends to Awardee, PM, Business Manager
(BM), DCS, CM, and FA.
If applicable, PCA notifies Labor Commission of contract award.
Board Action Form
322

Capital Projects Process Review Report for Carson City 12
Kic
koff
and
Proj
ect M
anag
emen
tPr
ojec
t Bud
get
Payr
oll
Vend
or/C
ontr
acto
r Pay
men
tConstruction Project and Financial Management
Inspector on site fills out daily report and
files to project folder.
F Are Material Testers required for project?
Construction Manager (CM) holds pre-construction
meeting with key project stakeholders.
Project Manager (PM) fills out Contract Request
Form.
PM contacts desired contractor(s) from the
Statement of Qualifications list.
Contract Request Form Statement of
Qualifications
PM and Contractor(s)
agree on contract cost.
PM submits completed Contract Request Form
to Financial Analyst (FA).
Financial Analyst reviews and sends to Purchasing/Contract Administrator
(PCA)
PCA issues a contract to
Tester.
PCA sends signed contract to FA, PM,
Construction Manager (CM), and DCS.
Standard Agenda
CM sends email requesting a Notice to Proceed to PCA.
PCA issues the Notice to Proceed to Contractor, CM, Project Manager (PM), and
Document Control Specialist (DCS).
Project Inspector takes “before” pictures of the
project site.
Network DriveProject
Pictures
City Engineer sends out reminders to update
project information every two weeks.
PM maintains and updates project information in
Smartsheet.
Smartsheet
FA creates report of project payroll expenses for Finance
Department.
PM tracks and updates changes to project
budget.
Finance Department creates Journal Entry
project payroll expenses.
SmartsheetNetwork
Drive
City Engineer holds bi-weekly staff meetings to
review project status.
FA reviews each project time sheet for completion.
FA copies project time to a summary spreadsheet and sends to Finance.
PM or Contractor sends project invoice to
Accounting Technician (AT).
AT gives invoice to CM to verify
amounts.
AT enters invoice into progress payment form
for Contractor and CM to sign.
AT processes the invoice for payment against Purchase Order (if
required).
AT saves scanned copy in contract folder and emails to
DCS.
Staff record time spent on capital projects,
biweekly.
Time-Entry Spreadsheet
FA creates monthly report on project budget
and sends to PM.
Is the invoice amount correct?
Network Drive
Reconciles with PM and
Contractor.
AT scans invoice and saves copy in Finance
folder.
No
Yes
Staff prints and signs payroll time sheets and
gives to Supervisor.
Supervisor reviews and signs time sheets.
Finance creates journal entry to move payroll
charges to project.
Payroll time sheet sent to Department Business Manager for payroll
processing.
Daily Field Inspection Report
Yes
No
323

Capital Projects Process Review Report for Carson City 13
Bef
ore
Bid
-O
peni
ngPo
st-B
id O
peni
ng a
nd D
urin
g C
onst
ruct
ion
Change Orders and Amendments
Change is made to project before bid-opening.
Bidder submits question during bid process.
The Purchasing/Contracts Administrator (PCA) updates bid
documents with change as an amendment.
The PCA updates the bid documents with answer(s) as an
amendment.
Change needs to be made to project.
PCA creates a staff report to present to Board of
Supervisors.
Design Change or On-Site Project Change?
Does proposed change go over contingency budget?
Project Inspector or CM talks to Contractor about
necessary changes and costs.
Contractor submits a Change Order Request to
CM.
DCS updates project documents with amendment and backup
documentation.
CM tracks change orders and amendments.
Does Board approve amendment?
CM works with Contractor to
modify change order or project
scope.
CM notifies Accounting Technician (AT), Fiscal
Analyst, and DCS of change order.
Does CM approve change order?
CM discuss with Contractor to revise change order or provides
additional information.
DCS issues change order to Contractor.
Designer discusses changes with
Construction Manager (CM).
CM issues field directive to
Contractor asking for work at set
cost.
Change Order or Field Directive?
PM updates project budget and status.
PM updates project budget and status.
Smartsheet
Document Control Specialist (DCS) updates project
documents field directive and backup documentation.
Smartsheet
Design
On-Site
Change Order
No
Yes
No
No
Field
Yes
AT processes change order.
PM prepares amendment with supporting documentation.
Yes
NGem NGem
Change Order Request
324

Capital Projects Process Review Report for Carson City 14
Subs
tant
ial C
ompl
etio
nFi
nal C
ompl
etio
nC
lose
-Out
War
rant
ies
Post-Construction, Close-Out, and Warranties
Project approaching substantial completion.
Construction Manager (CM) and Project Manager (PM) conduct
walkthrough with project stakeholders.
Identify remaining items and create
punchlist for Contractor.
Contractor completes punchlist within 30 days?
Final payment and retention are withheld.
Contractor submits As-Builts to CM or
Document Control Specialist (DCS).
DCS scans As-Builts, uploads to Network
Drive, and notifies PM.
PM requests Civil Designer convert As-
Builts into Record Drawings.
Civil Designer creates Record
Drawings.
Network Drive
DCS uploads Record Drawings to Network
Drive and uploads to FTP site.
Network Drive
GIS Asset Manager updates
City’s GIS Database.
GIS Database City Website
CM issues internal Project Completion Notice to Purchasing/
Contracts Manager (PCA), DCS, Accounting Technician (AT), Fiscal
Analyst (FA), and City Engineer (CE).
Record Drawings
As-Builts
AT completes the Final Payment Summary
report and Application & Certificate for
Payment.
City Engineer reviews to verify the projects ready for financial close-out.
Bi-Annually, DCS sends closeout requests to PM.
PM identifies or confirms any projects ready for
close-out.
DCS archives project folder on network drive.
Network Drive
Finance Department sends out active capital projects to City
Engineer.
Finance performs financial close-out.
CM tracks warranties for capital assets.
At 11 months after final completion, CM visits site and reviews items
under warranty.
Any issues with items under warranty?
CM prepares warranty request and submits to relevant organization.
CM tracks status of warranty
request.
CM emails Contractor to notify end of warranty period.
CM receives confirmation warranty
issue has been resolved.
No
No
Yes
G
G
If applicable, DCS compiles all close-
out documents and sends to
funding source (for Federal
funding).
If applicable, PCA notifies
Nevada Labor Commission of
completion.
PM updates project status in Smartsheet.
SunGard
PunchlistYes
Civil Designer notifies GIS Asset Manager of
new records.
AT prepares final payment and release of retention and obtains
CM and Contractor signature.
AT submits final payment and release of retention to Finance to
process payment.
SunGard
AT scans final
documents to contract folder.
Network Drive
Smartsheet
325
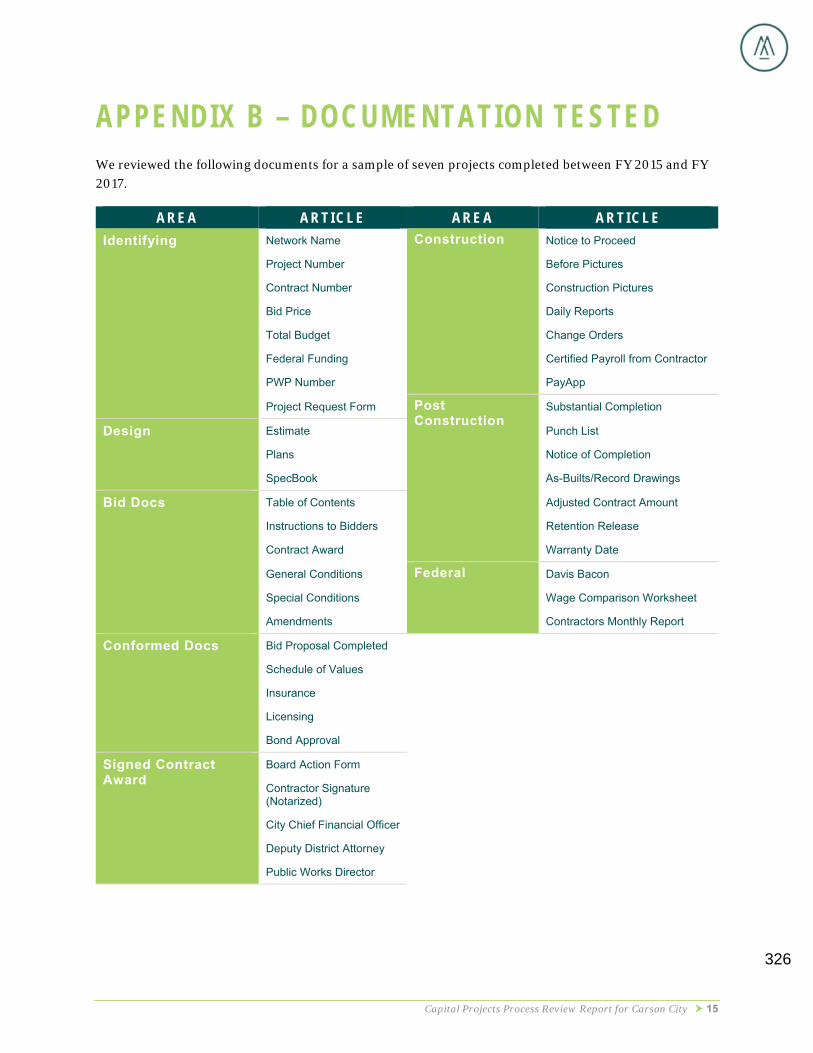
Capital Projects Process Review Report for Carson City 15
APPENDIX B – DOCUMENTATION TESTED We reviewed the following documents for a sample of seven projects completed between FY 2015 and FY
2017.
A R E A A R T I C L E A R E A A R T I C L E
Identifying Network Name Construction Notice to Proceed
Project Number Before Pictures
Contract Number Construction Pictures
Bid Price Daily Reports
Total Budget Change Orders
Federal Funding Certified Payroll from Contractor
PWP Number PayApp
Project Request Form Post Construction
Substantial Completion
Design Estimate Punch List
Plans Notice of Completion
SpecBook As-Builts/Record Drawings
Bid Docs Table of Contents Adjusted Contract Amount
Instructions to Bidders Retention Release
Contract Award Warranty Date
General Conditions Federal Davis Bacon
Special Conditions Wage Comparison Worksheet
Amendments Contractors Monthly Report
Conformed Docs Bid Proposal Completed
Schedule of Values
Insurance
Licensing
Bond Approval
Signed Contract Award
Board Action Form
Contractor Signature (Notarized)
City Chief Financial Officer
Deputy District Attorney
Public Works Director
326

Capital Projects Process Review Report for Carson City 16
APPENDIX C – PROJECT MANAGEMENT MANUAL TABLE OF CONTENTS
1. Introduction
1.1. Purpose
1.2. Assignment of Project Manager
1.3. Project Team
1.4. CIP Management
2. Project Life Cycle
2.1 General
2.2 Phases
3. Project Manager Responsibilities
3.1. Project Team
3.2. Issue Resolution
3.3. Development & Maintain Scope
3.4. Monitor Budget & Schedule
3.5. Prepare & Update Project Reports
3.6. Document Lessons Learned
4. Project Delivery Plan
4.1. Plan Development Procedure
4.2. Standard Outline
5. Scope Management
5.1 General
5.2 Scope Definition
5.3 Change Control Process
6. Schedule Management
6.1 Schedule Development
6.2 Baseline Schedule
6.3 Schedule Update
6.4 Schedule Monitoring
7. Cost Management
7.1 Budget Baseline
7.2 Reserves
8. Cost Estimating
8.1 General
8.2 Construction Cost
8.3 Resource Costs
8.4 Budget Adjustments
9. Internal Coordination Areas
9.1 Cost Estimate
9.2 Budgeting
9.3 Construction Management
9.4 Contracts
9.5 Drafting
9.6 Environmental
9.7 Facilities Planning
9.8 Geographic Information System
9.9 Information Systems
9.10 Legal
9.11 Operations & Support
9.12 Records Management
9.13 Safety
9.14 Warranties
10. Communications
10.1 Written Communication
10.2 Oral Communication
11. Risk Management
11.1 Risk Plan
11.2 Risk Analysis Strategy
11.3 Risk Response Strategy
11.4 Risk Monitoring and Management Strategy
12. Reporting
12.1 Status Reports
12.2 Budget Reports
13. Close-Out
13.1 General
13.2 Financial
14. Appendices
14.1 Templates
14.2 Forms
327

328


Final Version: 12/04/15
STAFF REPORT
Report To: Audit Committee Meeting Date: 05/10/2018
Staff Contact: Jason Link, Chief Financial Officer
Agenda Title: For Possible Action: Discussion and direction to Staff regarding the current Audit Work Program Update. (Jason Link, [email protected])
Staff Summary: Representatives from Moss Adams and City staff will be discussing and taking direction from the Audit Committee regarding the current work program.
Agenda Action: Formal Action/Motion Time Requested: 10 minutes
Proposed MotionWill depend on discussion and possible recommendations.
Board’s Strategic GoalEfficient Government
Previous Action N/A
Background/Issues & Analysis
Applicable Statute, Code, Policy, Rule or Regulation
Financial InformationIs there a fiscal impact? Yes No
If yes, account name/number:
Is it currently budgeted? Yes No
Explanation of Fiscal Impact: N/A
Alternatives N/A
329

Staff Report Page 2
Board Action Taken:Motion: ______________________________ 1) _________________ Aye/Nay 2) _________________ ________
________________________________
___________________________ (Vote Recorded By)
330

Carson City Internal Audit Status Report – Moss Adams 05-10-18 | 1
Date: May 10, 2018
To: Carson City Audit Committee
From: Mark Steranka
Subject: Internal Audit Status Report February 1, 2018 through April 30, 2018
_____
Schedule Status:
• Basic Internal Auditor Services: ongoing • Audit Findings Validation: ongoing • FWA Program Coordination: ongoing • Large Public Works Project Review: initiation November 2017 and
completion March 2018 • Grants Management Internal Controls Testing: initiation November 2017
and completion May 2018 • Public Guardian Follow Up: initiation April 2018 and completion April 2018
Budget Status through March 31, 2018:
• Basic Internal Auditor Services: expended $9,100.00 of $10,000 budget • Audit Findings Validation: expended $2,800.00 of $15,000 budget • FWA Program Coordination: expended $3,500.00 of $5,000 budget • Information Technology Internal Controls Testing: expended $14,962.50 of
$15,000 budget • Large Public Works Project Review: expended $28,350.00 of $30,000
budget • Grants Management Internal Controls Testing: expended $17,325.00 of
$30,000 budget • Public Guardian Follow Up: expended $0.00 of $5,000 budget
Activities for this Reporting Period:
• Basic Internal Auditor Services: managed internal audit program, prepared Audit Committee meeting materials, and attended Audit Committee meetings
• Audit Findings Validation: continued to maintain Audit Findings Tracking Report
• FWA Program Coordination: administered FWA program (two new reports) • Large Public Works Project Review: completed project and reviewed draft
report with City • Grants Management Internal Controls Testing: performed testing
331

Carson City Internal Audit Status Report – Moss Adams 05-10-18 | 2
Activities for the Next Reporting Period:
• Basic Internal Auditor Services: continue to manage internal audit program, prepare Audit Committee and BOS meeting materials, and attend Audit Committee and BOS meetings
• Audit Findings Validation: continue to maintain Audit Findings Tracking Report
• FWA Program Coordination: continue to administer FWA program • Large Public Works Project Review: none • Grants Management Internal Controls Testing: complete testing and
prepare report Issues:
• none
332

Final Version: 12/04/15
STAFF REPORT
Report To: Audit Committee Meeting Date: 05/10/2018
Staff Contact: Jason Link, Chief Financial Officer & Steve Ferguson, Audit Committee Chairman
Agenda Title: For Possible Action: Discussion and possible action to identify, discuss, and provide recommendations to the Board of Supervisors on projects to be performed by the Internal Auditor for the period ending June 30, 2019. (Jason Link, [email protected])
Staff Summary: Moss Adams will provide recommendations for future internal audits for the period ending June 30, 2019.
Agenda Action: Formal Action/Motion Time Requested: 20 minutes
Proposed MotionWill depend on the discussion and possible recommendations.
Board’s Strategic GoalEfficient Government
Previous Action Fiscal year 2018 internal audit program was approved by the Audit Committee on July 12, 2017. The program was approved by the Board of Supervisors on August 3, 2017.
Background/Issues & Analysis The Carson City Municipal Code 2.14.040 the Audit Committee to review and make recommendations to the Board of Supervisors regarding the annual financial audit, performance, compliance and efficiency audits, including specific issues of concern providing a higher level of accountability over the use of public funds and the adequacy of any city department or office performance measure for internal audit purposes.
The Audit Committee will provide input into the annual risk assessment plan, review and assess the steps necessary to minimize risk in the future and improve operating efficiencies; oversee the internal auditor’s creation and implementation of processes to identify potential fraud, waste and abuse of city resources and property and a findings report protocol.
Applicable Statute, Code, Policy, Rule or Regulation Carson City Charter Chapter 3.075, Carson City Municipal Code 2.14.040
333

Staff Report Page 2
Financial InformationIs there a fiscal impact? Yes No
If yes, account name/number: General Fund Internal Auditor / Professional Services
101-0800-415-03-09
Is it currently budgeted? Yes No
Explanation of Fiscal Impact: $110,000 has been budgeted for fiscal year 2019.
Alternatives N/A
Board Action Taken:Motion: ______________________________ 1) _________________ Aye/Nay 2) _________________ ________
________________________________
___________________________ (Vote Recorded By)
334

Carson CityFY 18-19 Internal Audit Program
Audit Committee MeetingMay 10, 2018
335

Overview
I. Introduction
II. Internal Audit Program Components
III. Internal Audit Program Review
IV. FY 18-19 Internal Audit Plan
2
336

3
I. Introduction
• The City retained Moss Adams LLP to serve as the designated City Auditor and conduct projects focusing on:
o Efficiency and effectiveness
o Management reviews
o Best practices
o Compliance
• Work is being completed under AICPA’s consultancy standardsand standards from the Institute of Internal Auditors (IIA)
337

4
Internal Audit
Risks Internal Controls Compliance Performance
Areas of Focus: accounting and financial reporting, asset management, capital programs, compliance, economics and funding, fraud, governance, human resources, internal controls, maintenance and operations, management, operations and service delivery, organization and staffing, processes and procedures, procurement, public safety, risk management, and technology
II. Internal Audit Program Components
338

5
III. Internal Audit Program Review
Project Results
• Risk Assessment Guided future projects
• Public Defender Study No action taken
• Eagle Valley Golf Study Resolved revenue issue
• Community Facilities Study 15 of 15 findings completed
• Fleet Efficiency Study 24 of 24 findings completed
• Fleet Utilization Study 12 of 12 findings completed
• FWA Program Development 16 reports to date339

6
III. Internal Audit Program Review (cont.)
Project Results
• Performance Metrics CMO implementing PMS
• Employee Efficiency Study 27 of 27 findings completed
• Internal Controls Review 42 of 42 findings completed
• Strategic Planning Plan adopted by BOS
• Policies/Procedures Update 5 of 5 findings completed
• Cash Handling Improvement City is implementing changes
• Payroll Testing 1 of 2 findings completed340

7
III. Internal Audit Program Review (cont.)
Project Results
• P-Card Testing 0 of 2 findings completed
• Small Works Projects Review 4 of 4 findings completed
• Public Guardian Review 12 of 13 findings completed
• Purchasing and AP Testing 8 of 12 findings completed
• HTE Access Testing 7 of 7 findings completed
• Large Public Works Projects Review 8 recommendations
• Small Public Works Follow Up 8 recommendations341

8
IV. FY 18-19 Internal Audit Plan – Potential Projects
1. Risk assessment2. AR internal controls testing3. Contracts review4. Fire OT study5. IT security (cybersecurity, penetration, phishing, training)6. Asset management efficiency study7. Ongoing Internal Auditor Services8. Audit Findings Validation9. FWA Program Coordination
342

The material appearing in this presentation is for informational purposes only and is not legal or accounting advice. Communication of this information is not intended to create, and receipt does not constitute, a legal relationship, including, but not limited to, an accountant-client relationship. Although these materials may have been prepared by professionals, they should not be used as a substitute for professional services. If legal, accounting, or other professional advice is required, the services of a professional should be sought.
9
343


Final Version: 12/04/15
STAFF REPORT
Report To: Audit Committee Meeting Date: 05/10/2018
Staff Contact: Jason Link, Chief Financial Officer
Agenda Title: Presentation Only: Presentation to inform the Audit Committee on the progress of Carson City’s Asset Management Program. (Dan Stucky; [email protected], Stephanie Hicks; [email protected], and Matt Lawton; [email protected])
Staff Summary: Staff will provide information to the Audit Committee regarding the progress of Carson City’s Asset Management Program.
Agenda Action: Other/Presentation Time Requested: 30 minutes
Proposed MotionN/A
Board’s Strategic GoalSustainable Infrastructure
Previous Action N/A
Background/Issues & Analysis Staff will present information to the Audit Committee regarding the progress of Carson City’s Asset Management Program, program objectives, and future funding needs.
Applicable Statute, Code, Policy, Rule or Regulation N/A
Financial InformationIs there a fiscal impact? Yes No
If yes, account name/number:
Is it currently budgeted? Yes No
Explanation of Fiscal Impact:
Alternatives N/A
344

Staff Report Page 2
Board Action Taken:Motion: ______________________________ 1) _________________ Aye/Nay 2) _________________ ________
________________________________
___________________________ (Vote Recorded By)
345

Carson City Asset Management Progress Report 2018
Carson City Public Works

Asset Management Program The Asset Management Program will
implement strategies with the fundamental goal of providing the following benefits: Developing a proactive maintenance and planning
strategy Minimizing risk and maximizing the effective useful
life of City assets Optimizing customer service Promoting data driven decisions and increasing
transparency

Asset Management Cycle
“Not a project, it is a program”

Facilities 2017 Objective - Quarterly Review of Condition
Assessments

Facilities 2017 Objective - Work Order
Management System (RT) and Power BI Dashboard

Facilities 2018 Objective - Roof Assessments
Last update in 2016 by Garland

Parks 2017 Objective – Inventory Park Facilities and Create
Smartsheet Database 2018 Objective – Complete Initial Condition Assessment

Reserve Study
2017 Objective – Initiate Reserve Study for general fund asset systems. Researched firms that provide these services Initial cost estimates from $150k - $250k
2018 Objective – Issue RFP to select firm to perform Reserve Study

Reserve Study
Achieving a sustainable funding level is attainable with smarter planning. Combining the capital with the O&M costs defines the annual sustainable funding needed to cost-effectively maintain, rehabilitate, and replace infrastructure assets.
Sustainable Funding Level

Sewer 2017 Objective – Complete Sanitary Sewer
Collection System Master Plan Identified a prioritized list of sewer CIPs Documented City inspection and condition
assessment workflows

Sewer 2018 Objective – Initiate Sewer Condition
Assessment Program Setup new CCTV van Train City staff in standardized
pipeline and manhole condition assessment rating system
Issue RFP to select sewer condition assessment contractor to supplement City staff
Estimate 5-7 years to assess the entire sewer system

Stormwater
2017 Objective – Complete GIS inventory pilot project 2018/2019 Objective – Complete full GIS inventory

Transportation
2017/2018 Objective –Update of Pavement Condition Assessment
2018 Objective – Street Ownership Mapping Updates
2018 Objective – Sign Inventory and Assessment System


GIS Strategic Plan Completed Q1 2018 VISION STATEMENT: GIS is the platform for mapping at the Speed of Business
and is the foundation for building a successful Asset Management strategy, enabling transparency throughout the organization where all staff and citizens are empowered to make data-driven decisions, evolving Carson City into a Smarter City.
Recommendations Develop Enterprise Asset Management Road Map Further Leverage Mobile GIS Solutions

Northern Nevada Asset Management User Group Evaluating enterprise software solutions Getting feedback on what is working for
others Participants & Software Platforms:
Washoe County: Dude Solutions Asset Essentials
City of Sparks: Accela Automation
City of Reno: Currently evaluating
TMWA: CityWorks
City of Fernley: Currently evaluating

Asset Management Software Current Considerations: Leveraging Asset Management
functionality within ERP system Internally evaluating Enterprise Asset
Management solutions: $100k - $500k
Internally evaluating “Best in breed” software solutions: $30k - $75k (plus integration costs)
2018 Objective – Hire external consultant for evaluation of Asset Management software solutions: estimated $75k
17

Employee Resources
Role of GIS consultants = 1.5 FTE to support GIS and Asset Management needs
2018 Objective – Hire FTE GIS Technician Shift consultants to take on more tasks in
support of Asset Management Need to consider future Asset
Management staffing beyond GIS support activities

Questions?
Carson City Asset Management Program Contacts Dan Stucky, City Engineer ○ [email protected] 775-283-7084
Stephanie Hicks, Real Property Manager ○ [email protected] 775-283-7904
Matt Lawton, Asset Manager ○ [email protected] 775-283-7394
19


![1¤]#v1!+ - Kurtzman Carson Consultants LLC](https://static.fdokumen.com/doc/165x107/633bb1444e0eba8d290dad24/1v1-kurtzman-carson-consultants-llc.jpg)

