Carpooling Platforms as Smart City Projects - MDPI
29
sustainability Article Carpooling Platforms as Smart City Projects: A Bibliometric Analysis and Systematic Literature Review Leonidas G. Anthopoulos * and Dimitrios N. Tzimos Citation: Anthopoulos, L.G.; Tzimos, D.N. Carpooling Platforms as Smart City Projects: A Bibliometric Analysis and Systematic Literature Review. Sustainability 2021, 13, 10680. https://doi.org/10.3390/ su131910680 Academic Editor: Manuela Tvaronaviciene Received: 9 August 2021 Accepted: 14 September 2021 Published: 26 September 2021 Publisher’s Note: MDPI stays neutral with regard to jurisdictional claims in published maps and institutional affil- iations. Copyright: © 2021 by the authors. Licensee MDPI, Basel, Switzerland. This article is an open access article distributed under the terms and conditions of the Creative Commons Attribution (CC BY) license (https:// creativecommons.org/licenses/by/ 4.0/). Department of Business Administration, University of Thessaly, GR41500 Larissa, Greece; [email protected] * Correspondence: [email protected] Abstract: Carpooling schemes for mutual cost benefits between the driver and the passengers has a long history. However, the convenience of driving alone, the increasing level of car ownership, and the difficulties in finding travelers with matching timing and routes keep car occupancy low. Technology is a key enabler of online platforms which facilitate the ride matching process and lead to an increase in carpooling services. Smart carpooling services may be an alternative and enrichment for mobility, which can help smart cities (SCs) reduce traffic congestion and gas emissions but require the appropriate architecture to support connection with the city infrastructure such as high-occupancy vehicle lanes, parking space, tolls, and the public transportation services. To better understand the evolution of carpooling platforms in SCs, bibliometric analysis of three separate specialized literature collections, combined with a systematic literature review, is performed. It is identified that smart carpooling platforms could generate additional value for participants and SCs. To deliver this value to an SC, a multi-sided platform business model is proposed, suitable for a carpooling service provider with multiple customer segments and partners. Finally, after examining the SC structure, a carpooling platform architecture is presented, which interconnects with the applicable smart city layers. Keywords: carpooling; business model; smart mobility; smart city; project; platform 1. Introduction The continuous increase in cities’ populations leads to a rise in the number of cars, which creates traffic, makes it difficult to find a parking space, negatively affects the quality of life, and increases fuel consumption and production of exhaust gases [1]. The problem is exacerbated by the low utilization of the car, as in most commutes it is used by one person, the driver [2]. Cities, taking advantage of the evolution of technology, are becoming smart, aiming to improve the quality of life in the urban environment. The internet empowers online platforms, which facilitate direct access to services and solves the problem of matching supply with demand. In the field of smart mobility, there is a shift from focus on objects and infrastructure to providing value to end users with integrated mobility services. In recent years, there has been a transition from private car ownership to mobility as a service (MaaS) with services like carpooling, ride-hailing, ridesharing, and carsharing [3,4]. Car ownership is under question due to challenges such as traffic, parking, and costs, while the alternatives of individual transportation through technology are increasing. The benefits from carpooling are important both from the participants’ perspective, who share the trip costs, and from the city’s perspective, where the traffic congestion, parking demand, and gas emissions are reduced. However, the integration of carpooling services in the context of smart cities appears limited. This paper extends [2] and its aim is to analyze the literature on the knowledge area resulting from the intersection of smart carpooling value generation, platform business models, and smart city platform Sustainability 2021, 13, 10680. https://doi.org/10.3390/su131910680 https://www.mdpi.com/journal/sustainability
-
Upload
khangminh22 -
Category
Documents
-
view
7 -
download
0
Transcript of Carpooling Platforms as Smart City Projects - MDPI
sustainability
Article
Carpooling Platforms as Smart City Projects: A BibliometricAnalysis and Systematic Literature Review
Leonidas G. Anthopoulos * and Dimitrios N. Tzimos
�����������������
Citation: Anthopoulos, L.G.;
Tzimos, D.N. Carpooling Platforms
as Smart City Projects: A Bibliometric
Analysis and Systematic Literature
Review. Sustainability 2021, 13, 10680.
https://doi.org/10.3390/
su131910680
Academic Editor:
Manuela Tvaronaviciene
Received: 9 August 2021
Accepted: 14 September 2021
Published: 26 September 2021
Publisher’s Note: MDPI stays neutral
with regard to jurisdictional claims in
published maps and institutional affil-
iations.
Copyright: © 2021 by the authors.
Licensee MDPI, Basel, Switzerland.
This article is an open access article
distributed under the terms and
conditions of the Creative Commons
Attribution (CC BY) license (https://
creativecommons.org/licenses/by/
4.0/).
Department of Business Administration, University of Thessaly, GR41500 Larissa, Greece; [email protected]* Correspondence: [email protected]
Abstract: Carpooling schemes for mutual cost benefits between the driver and the passengers hasa long history. However, the convenience of driving alone, the increasing level of car ownership,and the difficulties in finding travelers with matching timing and routes keep car occupancy low.Technology is a key enabler of online platforms which facilitate the ride matching process andlead to an increase in carpooling services. Smart carpooling services may be an alternative andenrichment for mobility, which can help smart cities (SCs) reduce traffic congestion and gas emissionsbut require the appropriate architecture to support connection with the city infrastructure such ashigh-occupancy vehicle lanes, parking space, tolls, and the public transportation services. To betterunderstand the evolution of carpooling platforms in SCs, bibliometric analysis of three separatespecialized literature collections, combined with a systematic literature review, is performed. Itis identified that smart carpooling platforms could generate additional value for participants andSCs. To deliver this value to an SC, a multi-sided platform business model is proposed, suitablefor a carpooling service provider with multiple customer segments and partners. Finally, afterexamining the SC structure, a carpooling platform architecture is presented, which interconnectswith the applicable smart city layers.
Keywords: carpooling; business model; smart mobility; smart city; project; platform
1. Introduction
The continuous increase in cities’ populations leads to a rise in the number of cars,which creates traffic, makes it difficult to find a parking space, negatively affects the qualityof life, and increases fuel consumption and production of exhaust gases [1]. The problem isexacerbated by the low utilization of the car, as in most commutes it is used by one person,the driver [2].
Cities, taking advantage of the evolution of technology, are becoming smart, aimingto improve the quality of life in the urban environment. The internet empowers onlineplatforms, which facilitate direct access to services and solves the problem of matchingsupply with demand.
In the field of smart mobility, there is a shift from focus on objects and infrastructureto providing value to end users with integrated mobility services. In recent years, there hasbeen a transition from private car ownership to mobility as a service (MaaS) with serviceslike carpooling, ride-hailing, ridesharing, and carsharing [3,4]. Car ownership is underquestion due to challenges such as traffic, parking, and costs, while the alternatives ofindividual transportation through technology are increasing.
The benefits from carpooling are important both from the participants’ perspective,who share the trip costs, and from the city’s perspective, where the traffic congestion,parking demand, and gas emissions are reduced. However, the integration of carpoolingservices in the context of smart cities appears limited. This paper extends [2] and itsaim is to analyze the literature on the knowledge area resulting from the intersection ofsmart carpooling value generation, platform business models, and smart city platform
Sustainability 2021, 13, 10680. https://doi.org/10.3390/su131910680 https://www.mdpi.com/journal/sustainability
Sustainability 2021, 13, 10680 2 of 29
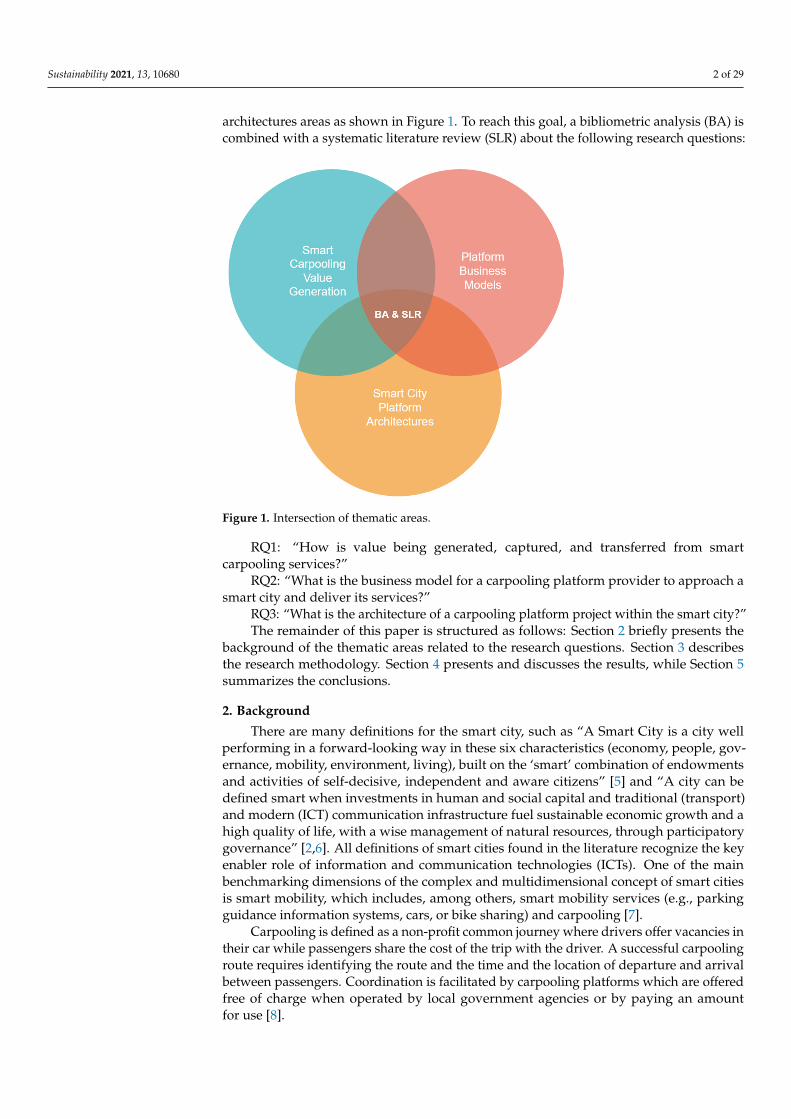
architectures areas as shown in Figure 1. To reach this goal, a bibliometric analysis (BA) iscombined with a systematic literature review (SLR) about the following research questions:
Sustainability 2021, 13, x FOR PEER REVIEW 2 of 31
is to analyze the literature on the knowledge area resulting from the intersection of smart carpooling value generation, platform business models, and smart city platform architec-tures areas as shown in Figure 1. To reach this goal, a bibliometric analysis (BA) is com-bined with a systematic literature review (SLR) about the following research questions:
RQ1: “How is value being generated, captured, and transferred from smart carpool-ing services?”
RQ2: “What is the business model for a carpooling platform provider to approach a smart city and deliver its services?”
RQ3: “What is the architecture of a carpooling platform project within the smart city?”
Figure 1. Intersection of thematic areas.
The remainder of this paper is structured as follows: Section 2 briefly presents the background of the thematic areas related to the research questions. Section 3 describes the research methodology. Section 4 presents and discusses the results, while Section 5 sum-marizes the conclusions.
2. Background There are many definitions for the smart city, such as “A Smart City is a city well
performing in a forward-looking way in these six characteristics (economy, people, gov-ernance, mobility, environment, living), built on the ‘smart’ combination of endowments and activities of self-decisive, independent and aware citizens” [5] and “A city can be de-fined smart when investments in human and social capital and traditional (transport) and modern (ICT) communication infrastructure fuel sustainable economic growth and a high quality of life, with a wise management of natural resources, through participatory gov-ernance” [2,6]. All definitions of smart cities found in the literature recognize the key en-abler role of information and communication technologies (ICTs). One of the main bench-marking dimensions of the complex and multidimensional concept of smart cities is smart mobility, which includes, among others, smart mobility services (e.g., parking guidance information systems, cars, or bike sharing) and carpooling [7].
Carpooling is defined as a non-profit common journey where drivers offer vacancies in their car while passengers share the cost of the trip with the driver. A successful car-pooling route requires identifying the route and the time and the location of departure
Figure 1. Intersection of thematic areas.
RQ1: “How is value being generated, captured, and transferred from smartcarpooling services?”
RQ2: “What is the business model for a carpooling platform provider to approach asmart city and deliver its services?”
RQ3: “What is the architecture of a carpooling platform project within the smart city?”The remainder of this paper is structured as follows: Section 2 briefly presents the
background of the thematic areas related to the research questions. Section 3 describesthe research methodology. Section 4 presents and discusses the results, while Section 5summarizes the conclusions.
2. Background
There are many definitions for the smart city, such as “A Smart City is a city wellperforming in a forward-looking way in these six characteristics (economy, people, gov-ernance, mobility, environment, living), built on the ‘smart’ combination of endowmentsand activities of self-decisive, independent and aware citizens” [5] and “A city can bedefined smart when investments in human and social capital and traditional (transport)and modern (ICT) communication infrastructure fuel sustainable economic growth and ahigh quality of life, with a wise management of natural resources, through participatorygovernance” [2,6]. All definitions of smart cities found in the literature recognize the keyenabler role of information and communication technologies (ICTs). One of the mainbenchmarking dimensions of the complex and multidimensional concept of smart citiesis smart mobility, which includes, among others, smart mobility services (e.g., parkingguidance information systems, cars, or bike sharing) and carpooling [7].
Carpooling is defined as a non-profit common journey where drivers offer vacancies intheir car while passengers share the cost of the trip with the driver. A successful carpoolingroute requires identifying the route and the time and the location of departure and arrivalbetween passengers. Coordination is facilitated by carpooling platforms which are offeredfree of charge when operated by local government agencies or by paying an amountfor use [8].
Sustainability 2021, 13, 10680 3 of 29
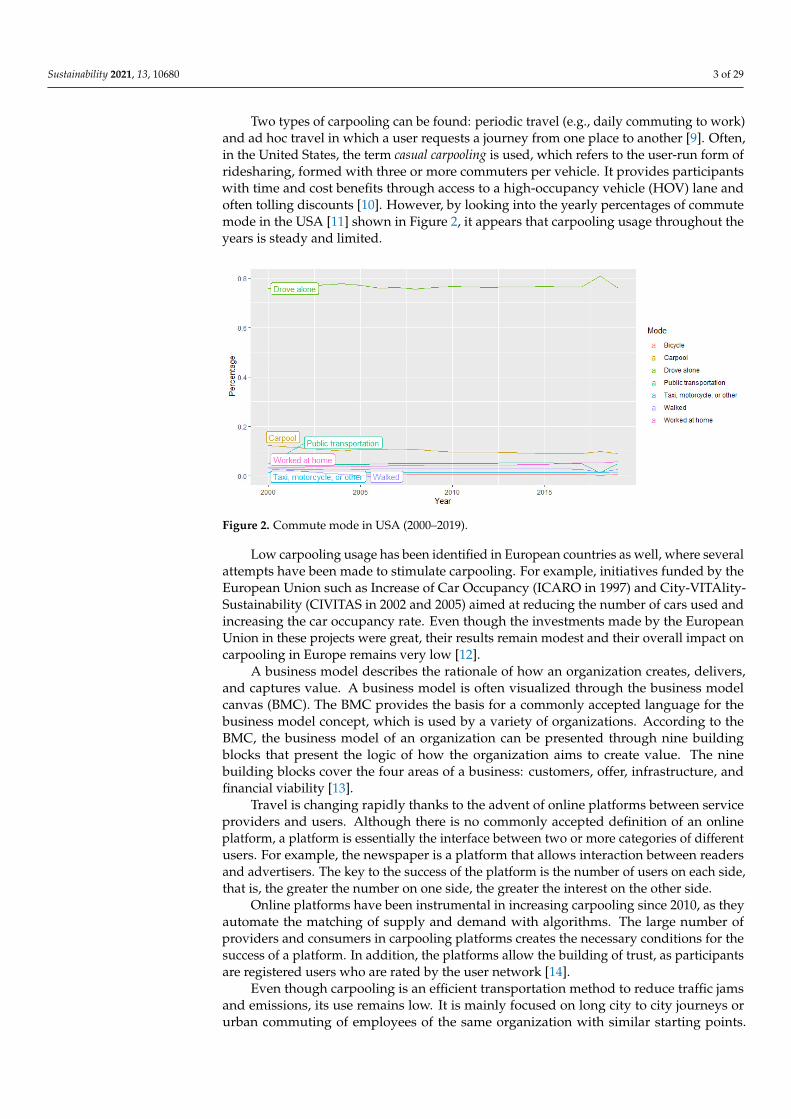
Two types of carpooling can be found: periodic travel (e.g., daily commuting to work)and ad hoc travel in which a user requests a journey from one place to another [9]. Often,in the United States, the term casual carpooling is used, which refers to the user-run form ofridesharing, formed with three or more commuters per vehicle. It provides participantswith time and cost benefits through access to a high-occupancy vehicle (HOV) lane andoften tolling discounts [10]. However, by looking into the yearly percentages of commutemode in the USA [11] shown in Figure 2, it appears that carpooling usage throughout theyears is steady and limited.
Sustainability 2021, 13, x FOR PEER REVIEW 3 of 31
and arrival between passengers. Coordination is facilitated by carpooling platforms which are offered free of charge when operated by local government agencies or by paying an amount for use [8].
Two types of carpooling can be found: periodic travel (e.g., daily commuting to work) and ad hoc travel in which a user requests a journey from one place to another [9]. Often, in the United States, the term casual carpooling is used, which refers to the user-run form of ridesharing, formed with three or more commuters per vehicle. It provides participants with time and cost benefits through access to a high-occupancy vehicle (HOV) lane and often tolling discounts [10]. However, by looking into the yearly percentages of commute mode in the USA [11] shown in Figure 2, it appears that carpooling usage throughout the years is steady and limited.
Figure 2. Commute mode in USA (2000–2019).
Low carpooling usage has been identified in European countries as well, where sev-eral attempts have been made to stimulate carpooling. For example, initiatives funded by the European Union such as Increase of Car Occupancy (ICARO in 1997) and City-VITAl-ity-Sustainability (CIVITAS in 2002 and 2005) aimed at reducing the number of cars used and increasing the car occupancy rate. Even though the investments made by the Euro-pean Union in these projects were great, their results remain modest and their overall impact on carpooling in Europe remains very low [12].
A business model describes the rationale of how an organization creates, delivers, and captures value. A business model is often visualized through the business model can-vas (BMC). The BMC provides the basis for a commonly accepted language for the busi-ness model concept, which is used by a variety of organizations. According to the BMC, the business model of an organization can be presented through nine building blocks that present the logic of how the organization aims to create value. The nine building blocks cover the four areas of a business: customers, offer, infrastructure, and financial viability [13].
Travel is changing rapidly thanks to the advent of online platforms between service providers and users. Although there is no commonly accepted definition of an online plat-form, a platform is essentially the interface between two or more categories of different users. For example, the newspaper is a platform that allows interaction between readers and advertisers. The key to the success of the platform is the number of users on each side, that is, the greater the number on one side, the greater the interest on the other side.
Online platforms have been instrumental in increasing carpooling since 2010, as they automate the matching of supply and demand with algorithms. The large number of pro-viders and consumers in carpooling platforms creates the necessary conditions for the
Figure 2. Commute mode in USA (2000–2019).
Low carpooling usage has been identified in European countries as well, where severalattempts have been made to stimulate carpooling. For example, initiatives funded by theEuropean Union such as Increase of Car Occupancy (ICARO in 1997) and City-VITAlity-Sustainability (CIVITAS in 2002 and 2005) aimed at reducing the number of cars used andincreasing the car occupancy rate. Even though the investments made by the EuropeanUnion in these projects were great, their results remain modest and their overall impact oncarpooling in Europe remains very low [12].
A business model describes the rationale of how an organization creates, delivers,and captures value. A business model is often visualized through the business modelcanvas (BMC). The BMC provides the basis for a commonly accepted language for thebusiness model concept, which is used by a variety of organizations. According to theBMC, the business model of an organization can be presented through nine buildingblocks that present the logic of how the organization aims to create value. The ninebuilding blocks cover the four areas of a business: customers, offer, infrastructure, andfinancial viability [13].
Travel is changing rapidly thanks to the advent of online platforms between serviceproviders and users. Although there is no commonly accepted definition of an onlineplatform, a platform is essentially the interface between two or more categories of differentusers. For example, the newspaper is a platform that allows interaction between readersand advertisers. The key to the success of the platform is the number of users on each side,that is, the greater the number on one side, the greater the interest on the other side.
Online platforms have been instrumental in increasing carpooling since 2010, as theyautomate the matching of supply and demand with algorithms. The large number ofproviders and consumers in carpooling platforms creates the necessary conditions for thesuccess of a platform. In addition, the platforms allow the building of trust, as participantsare registered users who are rated by the user network [14].
Even though carpooling is an efficient transportation method to reduce traffic jamsand emissions, its use remains low. It is mainly focused on long city to city journeys orurban commuting of employees of the same organization with similar starting points.
Sustainability 2021, 13, 10680 4 of 29
However, it appears that the digital technology is mature enough to boost carpooling byenabling easier ride matching and by providing incentives in smart cities.
From the literature review thus far, it is found that there is an extensive recent literaturefor the individual research areas, while literature for the smart carpooling platforms, theirbusiness models, and their architecture within the scope of smart city is limited.
3. Methodology
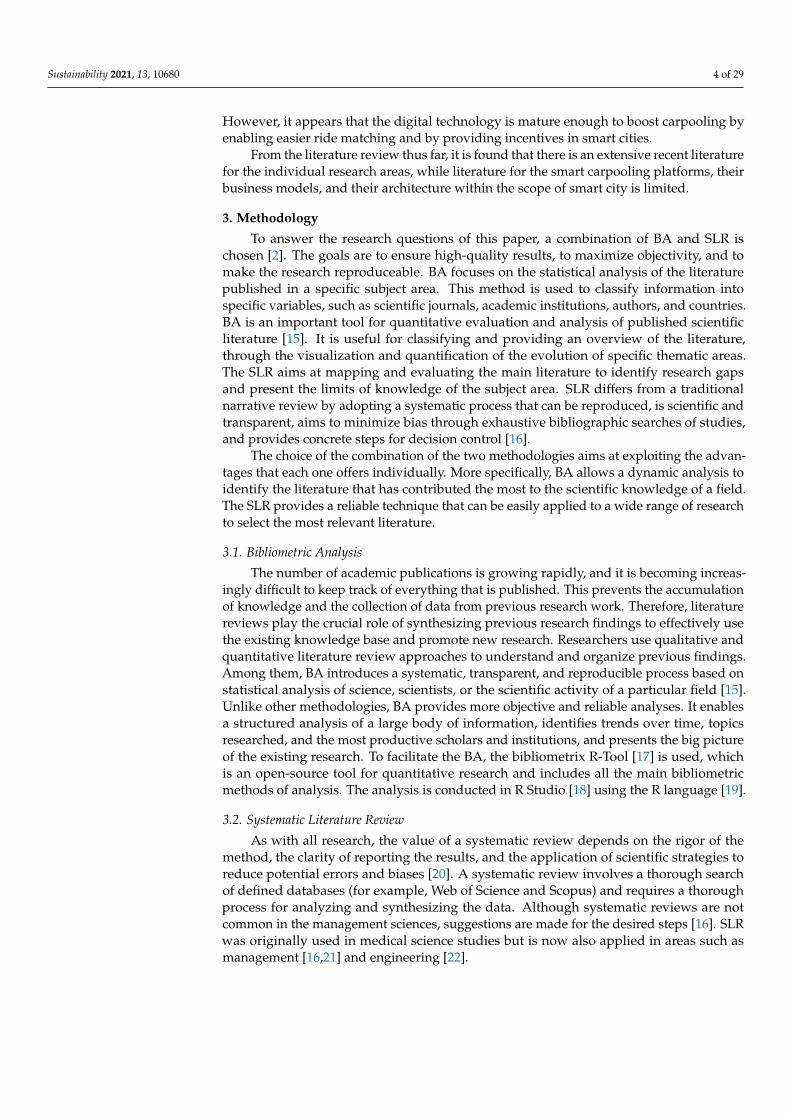
To answer the research questions of this paper, a combination of BA and SLR ischosen [2]. The goals are to ensure high-quality results, to maximize objectivity, and tomake the research reproduceable. BA focuses on the statistical analysis of the literaturepublished in a specific subject area. This method is used to classify information intospecific variables, such as scientific journals, academic institutions, authors, and countries.BA is an important tool for quantitative evaluation and analysis of published scientificliterature [15]. It is useful for classifying and providing an overview of the literature,through the visualization and quantification of the evolution of specific thematic areas.The SLR aims at mapping and evaluating the main literature to identify research gapsand present the limits of knowledge of the subject area. SLR differs from a traditionalnarrative review by adopting a systematic process that can be reproduced, is scientific andtransparent, aims to minimize bias through exhaustive bibliographic searches of studies,and provides concrete steps for decision control [16].
The choice of the combination of the two methodologies aims at exploiting the advan-tages that each one offers individually. More specifically, BA allows a dynamic analysis toidentify the literature that has contributed the most to the scientific knowledge of a field.The SLR provides a reliable technique that can be easily applied to a wide range of researchto select the most relevant literature.
3.1. Bibliometric Analysis
The number of academic publications is growing rapidly, and it is becoming increas-ingly difficult to keep track of everything that is published. This prevents the accumulationof knowledge and the collection of data from previous research work. Therefore, literaturereviews play the crucial role of synthesizing previous research findings to effectively usethe existing knowledge base and promote new research. Researchers use qualitative andquantitative literature review approaches to understand and organize previous findings.Among them, BA introduces a systematic, transparent, and reproducible process based onstatistical analysis of science, scientists, or the scientific activity of a particular field [15].Unlike other methodologies, BA provides more objective and reliable analyses. It enablesa structured analysis of a large body of information, identifies trends over time, topicsresearched, and the most productive scholars and institutions, and presents the big pictureof the existing research. To facilitate the BA, the bibliometrix R-Tool [17] is used, whichis an open-source tool for quantitative research and includes all the main bibliometricmethods of analysis. The analysis is conducted in R Studio [18] using the R language [19].
3.2. Systematic Literature Review
As with all research, the value of a systematic review depends on the rigor of themethod, the clarity of reporting the results, and the application of scientific strategies toreduce potential errors and biases [20]. A systematic review involves a thorough searchof defined databases (for example, Web of Science and Scopus) and requires a thoroughprocess for analyzing and synthesizing the data. Although systematic reviews are notcommon in the management sciences, suggestions are made for the desired steps [16]. SLRwas originally used in medical science studies but is now also applied in areas such asmanagement [16,21] and engineering [22].
Sustainability 2021, 13, 10680 5 of 29
3.3. Research Protocol
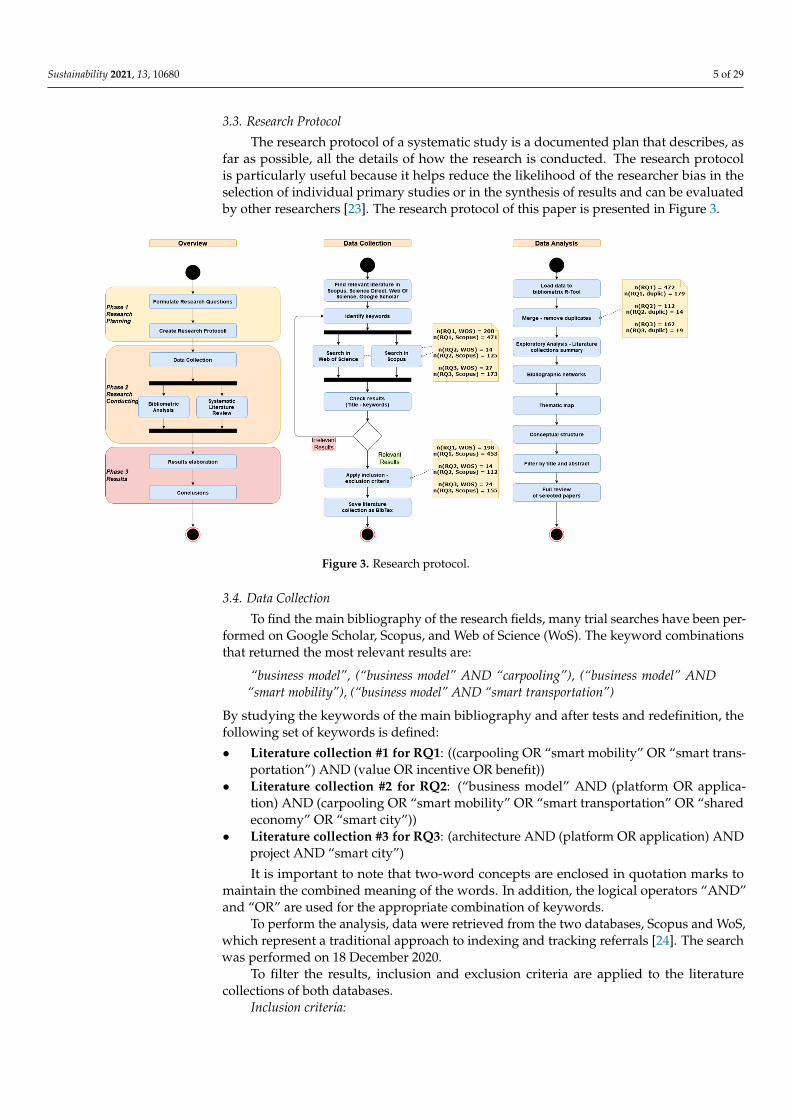
The research protocol of a systematic study is a documented plan that describes, asfar as possible, all the details of how the research is conducted. The research protocolis particularly useful because it helps reduce the likelihood of the researcher bias in theselection of individual primary studies or in the synthesis of results and can be evaluatedby other researchers [23]. The research protocol of this paper is presented in Figure 3.
Sustainability 2021, 13, x FOR PEER REVIEW 5 of 31
3.2. Systematic Literature Review As with all research, the value of a systematic review depends on the rigor of the
method, the clarity of reporting the results, and the application of scientific strategies to reduce potential errors and biases [20]. A systematic review involves a thorough search of defined databases (for example, Web of Science and Scopus) and requires a thorough pro-cess for analyzing and synthesizing the data. Although systematic reviews are not com-mon in the management sciences, suggestions are made for the desired steps [16]. SLR was originally used in medical science studies but is now also applied in areas such as management [16,21] and engineering [22].
3.3. Research Protocol The research protocol of a systematic study is a documented plan that describes, as
far as possible, all the details of how the research is conducted. The research protocol is particularly useful because it helps reduce the likelihood of the researcher bias in the se-lection of individual primary studies or in the synthesis of results and can be evaluated by other researchers [23]. The research protocol of this paper is presented in Figure 3.
Figure 3. Research protocol.
3.4. Data Collection To find the main bibliography of the research fields, many trial searches have been
performed on Google Scholar, Scopus, and Web of Science (WoS). The keyword combina-tions that returned the most relevant results are:
“business model”, (“business model” AND “carpooling”), (“business model” AND “smart mobility”), (“business model” AND “smart transportation”) By studying the keywords of the main bibliography and after tests and redefinition,
the following set of keywords is defined: • Literature collection #1 for RQ1: ((carpooling OR “smart mobility” OR “smart trans-
portation”) AND (value OR incentive OR benefit)) • Literature collection #2 for RQ2: (“business model” AND (platform OR application)
AND (carpooling OR “smart mobility” OR “smart transportation” OR “shared econ-omy” OR “smart city”))
• Literature collection #3 for RQ3: (architecture AND (platform OR application) AND project AND “smart city”)
Figure 3. Research protocol.
3.4. Data Collection
To find the main bibliography of the research fields, many trial searches have been per-formed on Google Scholar, Scopus, and Web of Science (WoS). The keyword combinationsthat returned the most relevant results are:
“business model”, (“business model” AND “carpooling”), (“business model” AND“smart mobility”), (“business model” AND “smart transportation”)
By studying the keywords of the main bibliography and after tests and redefinition, thefollowing set of keywords is defined:
• Literature collection #1 for RQ1: ((carpooling OR “smart mobility” OR “smart trans-portation”) AND (value OR incentive OR benefit))
• Literature collection #2 for RQ2: (“business model” AND (platform OR applica-tion) AND (carpooling OR “smart mobility” OR “smart transportation” OR “sharedeconomy” OR “smart city”))
• Literature collection #3 for RQ3: (architecture AND (platform OR application) ANDproject AND “smart city”)
It is important to note that two-word concepts are enclosed in quotation marks tomaintain the combined meaning of the words. In addition, the logical operators “AND”and “OR” are used for the appropriate combination of keywords.
To perform the analysis, data were retrieved from the two databases, Scopus and WoS,which represent a traditional approach to indexing and tracking referrals [24]. The searchwas performed on 18 December 2020.
To filter the results, inclusion and exclusion criteria are applied to the literaturecollections of both databases.
Inclusion criteria:
Sustainability 2021, 13, 10680 6 of 29
• Articles in scientific journals (articles)• Conference Papers• Reviews• Book chapters
Exclusion criteria:
• Conference reviews• Documents not written in English
The raw data are extracted from Scopus and WoS as BibTeX files, which are suitablefor bibliographic analysis, as they include all the basic information, such as title, authornames, summary, keywords, and references.
3.5. Data Analysis
The BibTeX files from each literature collection are loaded to R Studio with the bib-liometrix R-Tool [17]. Two bibliographic data-frames for each literature collection arecreated with document records and bibliographic metadata, such as author names, ti-tle, keywords, and other information. The two data-frames are merged and duplicatedocuments in both databases are removed from the results.
To summarize the main results, a table with the most important information is createdincluding details such as the annual scientific production, the most important articlesby number of citations, the most productive authors, the most productive countries, thenumber of citations per country, the most relevant sources, and the most relevant keywords.In addition, various co-authorship indicators appear. The author collaboration index iscalculated as the total number of articles per the total number of authors ratio. The co-authors per document index is calculated as the average number of co-authors per article.The collaboration index is calculated as the ratio of the total number of authors of multiplearticles and the total number of articles of multiple authors [25,26].
3.5.1. Bibliographic Networks
One of the most important techniques of BA is the network analysis. Various ap-proaches have been developed using different methods, such as co-word analysis whichuses the most important words or keywords in articles to study the conceptual structureof a research field. This method uses the actual content of the articles to create a measureof similarity. Co-word analysis produces semantic maps of a research field that facilitateits understanding.
To create networks, the properties of an article are linked together (e.g., author to journal, key-words to publication date). These links can be represented by a Document × Attribute matrix.An attribute of an article is the information associated with the article (e.g., authors, journal,keywords, citations). The connections of characteristics create bipartite Document × Attributenetworks that can be represented as two-dimensional networks. Various matrices can becomputed such as: Document × Citation, Document × Author, Document × Country,Document × Authors’ keyword [17].
3.5.2. Thematic Map
Co-word analysis creates keyword clusters, which are considered as themes. It isperformed using a word co-occurrence network to map and cluster terms extracted fromkeywords. The network can be obtained from a Document × Keyword matrix [17]. Eachcluster is considered as a theme with two parameters, the density and centrality. Theclusters can be used to classify topics and map them into a two-dimensional diagramnamed a strategic diagram, where on the x-axis is the centrality and on the y-axis is thedensity. The themes are classified as: motor themes in the upper-right quadrant, highlydeveloped and isolated themes in the upper-left quadrant, emerging or declining themesin the lower-left quadrant, and basic or transversal themes in the lower-right quadrant [27].
Sustainability 2021, 13, 10680 7 of 29
3.5.3. Conceptual Structure
Factorial analysis creates the conceptual map of a scientific field by performing multi-ple correspondence analysis and clustering of words or a summary of the articles includedin a bibliographic collection. The bibliometrix R-Tool performs multiple correspondenceanalysis (MCA) to draw a conceptual structure of the field and K-means clustering to iden-tify clusters of documents that express common concepts. In co-word analysis, MCA is ap-plied to a Document × Keyword matrix and the keywords are plotted on a two-dimensionalmap. The results are interpreted based on the relative positions of the points [17].
3.5.4. Full Review
The last phase involves filtering of the documents based on the relevance of the titleand the abstract to the research questions, the total number of citations, and citationsper year. For the selection of the most influential papers, the most referenced in theliterature collections are examined according to the same criteria as well. During thisphase, additional papers may be identified. Finally, a full review and taxonomy of the mostimportant papers for each knowledge area is performed.
4. Results4.1. Bibliometric Analysis
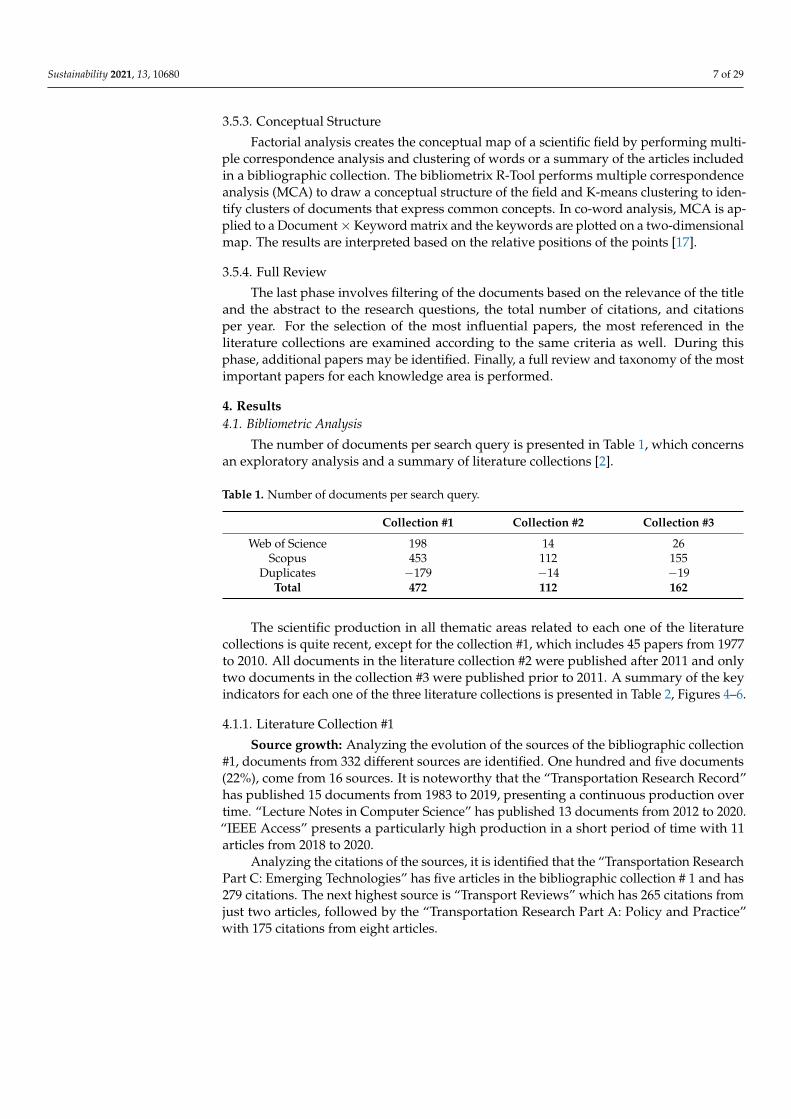
The number of documents per search query is presented in Table 1, which concernsan exploratory analysis and a summary of literature collections [2].
Table 1. Number of documents per search query.
Collection #1 Collection #2 Collection #3
Web of Science 198 14 26Scopus 453 112 155
Duplicates −179 −14 −19Total 472 112 162
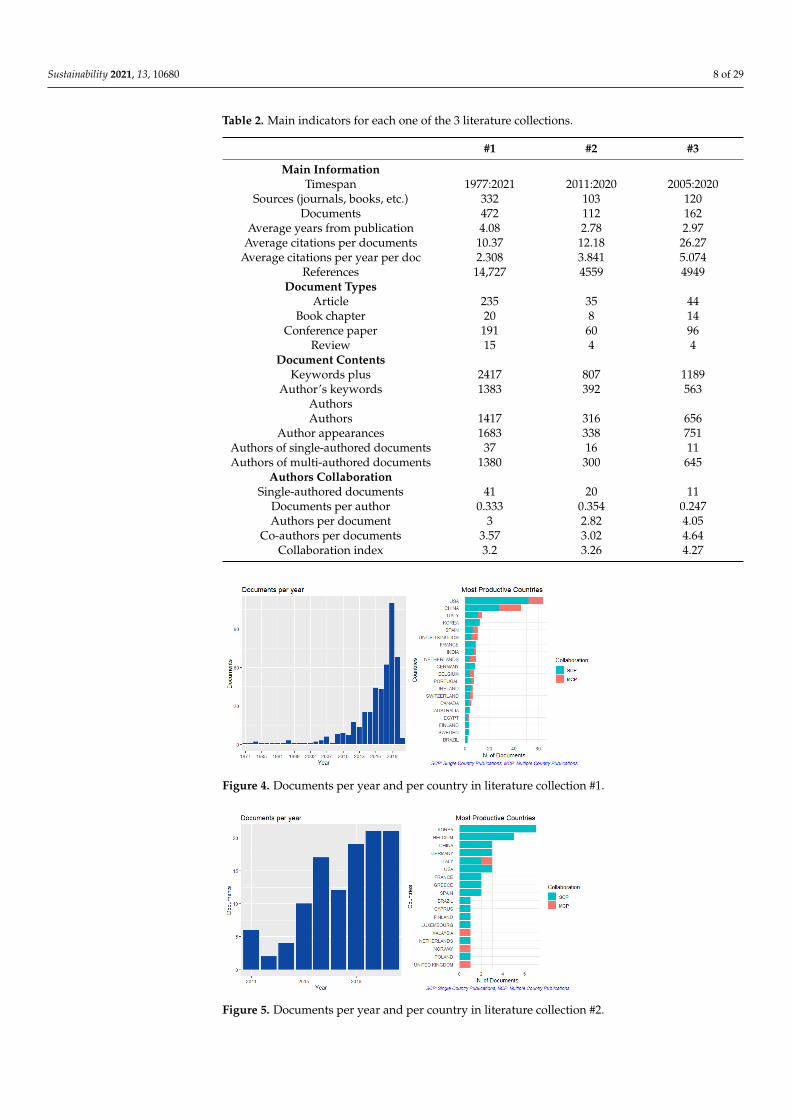
The scientific production in all thematic areas related to each one of the literaturecollections is quite recent, except for the collection #1, which includes 45 papers from 1977to 2010. All documents in the literature collection #2 were published after 2011 and onlytwo documents in the collection #3 were published prior to 2011. A summary of the keyindicators for each one of the three literature collections is presented in Table 2, Figures 4–6.
4.1.1. Literature Collection #1
Source growth: Analyzing the evolution of the sources of the bibliographic collection#1, documents from 332 different sources are identified. One hundred and five documents(22%), come from 16 sources. It is noteworthy that the “Transportation Research Record”has published 15 documents from 1983 to 2019, presenting a continuous production overtime. “Lecture Notes in Computer Science” has published 13 documents from 2012 to 2020.“IEEE Access” presents a particularly high production in a short period of time with 11articles from 2018 to 2020.
Analyzing the citations of the sources, it is identified that the “Transportation ResearchPart C: Emerging Technologies” has five articles in the bibliographic collection # 1 and has279 citations. The next highest source is “Transport Reviews” which has 265 citations fromjust two articles, followed by the “Transportation Research Part A: Policy and Practice”with 175 citations from eight articles.
Sustainability 2021, 13, 10680 8 of 29
Table 2. Main indicators for each one of the 3 literature collections.
#1 #2 #3
Main InformationTimespan 1977:2021 2011:2020 2005:2020
Sources (journals, books, etc.) 332 103 120Documents 472 112 162
Average years from publication 4.08 2.78 2.97Average citations per documents 10.37 12.18 26.27
Average citations per year per doc 2.308 3.841 5.074References 14,727 4559 4949
Document TypesArticle 235 35 44
Book chapter 20 8 14Conference paper 191 60 96
Review 15 4 4Document Contents
Keywords plus 2417 807 1189Author’s keywords 1383 392 563
AuthorsAuthors 1417 316 656
Author appearances 1683 338 751Authors of single-authored documents 37 16 11Authors of multi-authored documents 1380 300 645
Authors CollaborationSingle-authored documents 41 20 11
Documents per author 0.333 0.354 0.247Authors per document 3 2.82 4.05
Co-authors per documents 3.57 3.02 4.64Collaboration index 3.2 3.26 4.27
Sustainability 2021, 13, x FOR PEER REVIEW 8 of 31
Table 2. Main indicators for each one of the 3 literature collections.
#1 #2 #3 Main Information
Timespan 1977:2021 2011:2020 2005:2020 Sources (journals, books, etc.) 332 103 120
Documents 472 112 162 Average years from publication 4.08 2.78 2.97
Average citations per documents 10.37 12.18 26.27 Average citations per year per doc 2.308 3.841 5.074
References 14,727 4559 4949 Document Types
Article 235 35 44 Book chapter 20 8 14
Conference paper 191 60 96 Review 15 4 4
Document Contents Keywords plus 2417 807 1189
Author’s keywords 1383 392 563 Authors Authors 1417 316 656
Author appearances 1683 338 751 Authors of single-authored documents 37 16 11 Authors of multi-authored documents 1380 300 645
Authors Collaboration Single-authored documents 41 20 11
Documents per author 0.333 0.354 0.247 Authors per document 3 2.82 4.05
Co-authors per documents 3.57 3.02 4.64 Collaboration index 3.2 3.26 4.27
Figure 4. Documents per year and per country in literature collection #1. Figure 4. Documents per year and per country in literature collection #1.
Sustainability 2021, 13, x FOR PEER REVIEW 9 of 31
Figure 5. Documents per year and per country in literature collection #2.
Figure 6. Documents per year and per country in literature collection #3.
4.1.1. Literature Collection #1 Source growth: Analyzing the evolution of the sources of the bibliographic collection
#1, documents from 332 different sources are identified. One hundred and five documents (22%), come from 16 sources. It is noteworthy that the “Transportation Research Record” has published 15 documents from 1983 to 2019, presenting a continuous production over time. “Lecture Notes in Computer Science” has published 13 documents from 2012 to 2020. “IEEE Access” presents a particularly high production in a short period of time with 11 articles from 2018 to 2020.
Analyzing the citations of the sources, it is identified that the “Transportation Re-search Part C: Emerging Technologies” has five articles in the bibliographic collection # 1 and has 279 citations. The next highest source is “Transport Reviews” which has 265 cita-tions from just two articles, followed by the “Transportation Research Part A: Policy and Practice” with 175 citations from eight articles.
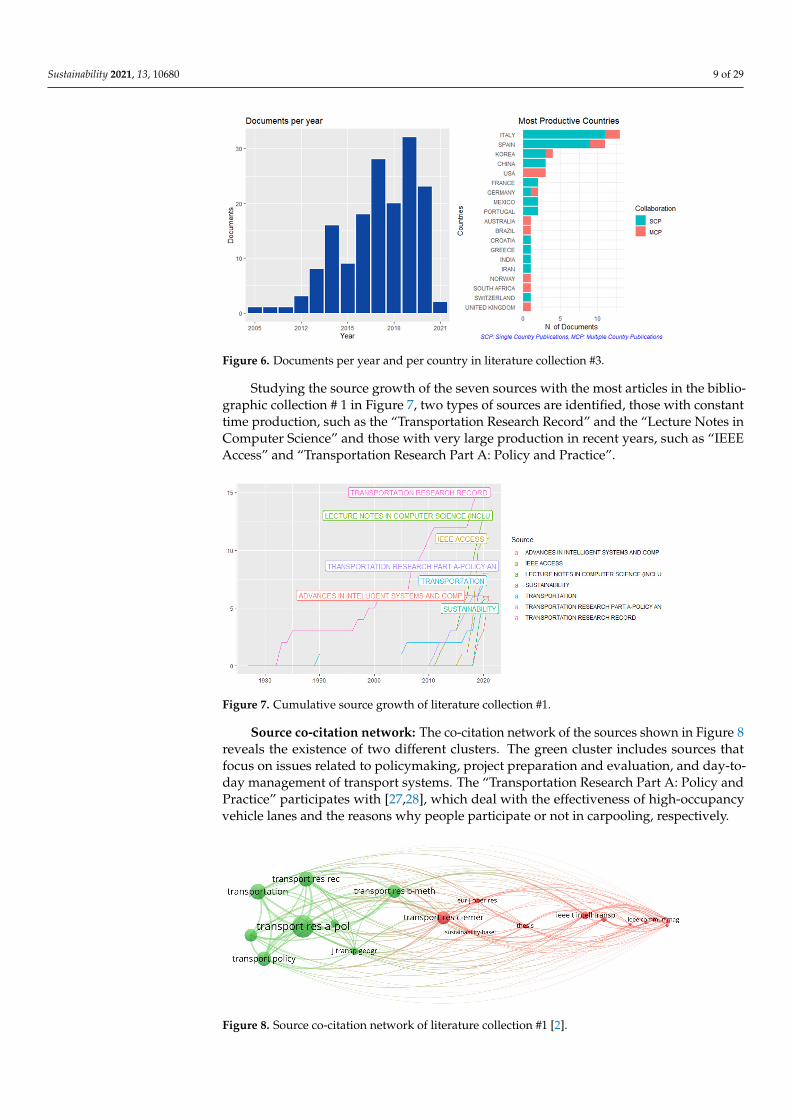
Studying the source growth of the seven sources with the most articles in the biblio-graphic collection # 1 in Figure 7, two types of sources are identified, those with constant time production, such as the “Transportation Research Record” and the “Lecture Notes in Computer Science” and those with very large production in recent years, such as “IEEE Access” and “Transportation Research Part A: Policy and Practice”.
Figure 5. Documents per year and per country in literature collection #2.
Sustainability 2021, 13, 10680 9 of 29
Sustainability 2021, 13, x FOR PEER REVIEW 9 of 31
Figure 5. Documents per year and per country in literature collection #2.
Figure 6. Documents per year and per country in literature collection #3.
4.1.1. Literature Collection #1 Source growth: Analyzing the evolution of the sources of the bibliographic collection
#1, documents from 332 different sources are identified. One hundred and five documents (22%), come from 16 sources. It is noteworthy that the “Transportation Research Record” has published 15 documents from 1983 to 2019, presenting a continuous production over time. “Lecture Notes in Computer Science” has published 13 documents from 2012 to 2020. “IEEE Access” presents a particularly high production in a short period of time with 11 articles from 2018 to 2020.
Analyzing the citations of the sources, it is identified that the “Transportation Re-search Part C: Emerging Technologies” has five articles in the bibliographic collection # 1 and has 279 citations. The next highest source is “Transport Reviews” which has 265 cita-tions from just two articles, followed by the “Transportation Research Part A: Policy and Practice” with 175 citations from eight articles.
Studying the source growth of the seven sources with the most articles in the biblio-graphic collection # 1 in Figure 7, two types of sources are identified, those with constant time production, such as the “Transportation Research Record” and the “Lecture Notes in Computer Science” and those with very large production in recent years, such as “IEEE Access” and “Transportation Research Part A: Policy and Practice”.
Figure 6. Documents per year and per country in literature collection #3.
Studying the source growth of the seven sources with the most articles in the biblio-graphic collection # 1 in Figure 7, two types of sources are identified, those with constanttime production, such as the “Transportation Research Record” and the “Lecture Notes inComputer Science” and those with very large production in recent years, such as “IEEEAccess” and “Transportation Research Part A: Policy and Practice”.
Sustainability 2021, 13, x FOR PEER REVIEW 10 of 31
Figure 7. Cumulative source growth of literature collection #1.
Source co-citation network: The co-citation network of the sources shown in Figure 8 reveals the existence of two different clusters. The green cluster includes sources that focus on issues related to policymaking, project preparation and evaluation, and day-to-day management of transport systems. The “Transportation Research Part A: Policy and Practice” participates with [27,28], which deal with the effectiveness of high-occupancy vehicle lanes and the reasons why people participate or not in carpooling, respectively.
The red cluster includes sources such as the “IEEE Transactions on Intelligent Trans-portation Systems”, the “European Journal of Operational Research”, and the “IEEE Com-munications Magazine”, which focus on information technology and decision making as the basis of smart mobility. “Transportation Research Part C: Emerging Technologies” is the most important source of the red cluster, as it is in the center of the two clusters at the same time, as citations are made from all the other sources. This is due to the paper [29], which has 242 citations and refers to the adoption rates of autonomous and shared auton-omous vehicles.
Figure 8. Source co-citation network of literature collection #1 [2].
Top keywords-co-occurrence network: To understand the interconnection and evo-lution of keywords in the documents of the bibliographic collection # 1, the co-occurrence network of the keywords in Figure 9 and the plot of Figure 10 are created. It is derived that the term “smart city” has been used the most. It appeared in documents in the litera-ture collection #1 starting from 2013, and since 2016 its appearance has been very frequent. Furthermore, the terms related to smart mobility, “smart mobility” and “smart transpor-tation”, appear in 2016 and their uses have been consistently high since then. The term “carpooling” is used from 2008 until 2020. It is noteworthy that in the literature collection #1 appear the terms “blockchain”, “big data”, and “internet of things”, a fact that describes the interaction of these thematic areas with smart cities and smart mobility.
Figure 7. Cumulative source growth of literature collection #1.
Source co-citation network: The co-citation network of the sources shown in Figure 8reveals the existence of two different clusters. The green cluster includes sources thatfocus on issues related to policymaking, project preparation and evaluation, and day-to-day management of transport systems. The “Transportation Research Part A: Policy andPractice” participates with [27,28], which deal with the effectiveness of high-occupancyvehicle lanes and the reasons why people participate or not in carpooling, respectively.
Sustainability 2021, 13, x FOR PEER REVIEW 10 of 31
Figure 7. Cumulative source growth of literature collection #1.
Source co-citation network: The co-citation network of the sources shown in Figure 8 reveals the existence of two different clusters. The green cluster includes sources that focus on issues related to policymaking, project preparation and evaluation, and day-to-day management of transport systems. The “Transportation Research Part A: Policy and Practice” participates with [27,28], which deal with the effectiveness of high-occupancy vehicle lanes and the reasons why people participate or not in carpooling, respectively.
The red cluster includes sources such as the “IEEE Transactions on Intelligent Trans-portation Systems”, the “European Journal of Operational Research”, and the “IEEE Com-munications Magazine”, which focus on information technology and decision making as the basis of smart mobility. “Transportation Research Part C: Emerging Technologies” is the most important source of the red cluster, as it is in the center of the two clusters at the same time, as citations are made from all the other sources. This is due to the paper [29], which has 242 citations and refers to the adoption rates of autonomous and shared auton-omous vehicles.
Figure 8. Source co-citation network of literature collection #1 [2].
Top keywords-co-occurrence network: To understand the interconnection and evo-lution of keywords in the documents of the bibliographic collection # 1, the co-occurrence network of the keywords in Figure 9 and the plot of Figure 10 are created. It is derived that the term “smart city” has been used the most. It appeared in documents in the litera-ture collection #1 starting from 2013, and since 2016 its appearance has been very frequent. Furthermore, the terms related to smart mobility, “smart mobility” and “smart transpor-tation”, appear in 2016 and their uses have been consistently high since then. The term “carpooling” is used from 2008 until 2020. It is noteworthy that in the literature collection #1 appear the terms “blockchain”, “big data”, and “internet of things”, a fact that describes the interaction of these thematic areas with smart cities and smart mobility.
Figure 8. Source co-citation network of literature collection #1 [2].
Sustainability 2021, 13, 10680 10 of 29
The red cluster includes sources such as the “IEEE Transactions on Intelligent Trans-portation Systems”, the “European Journal of Operational Research”, and the “IEEE Com-munications Magazine”, which focus on information technology and decision makingas the basis of smart mobility. “Transportation Research Part C: Emerging Technologies”is the most important source of the red cluster, as it is in the center of the two clustersat the same time, as citations are made from all the other sources. This is due to thepaper [29], which has 242 citations and refers to the adoption rates of autonomous andshared autonomous vehicles.
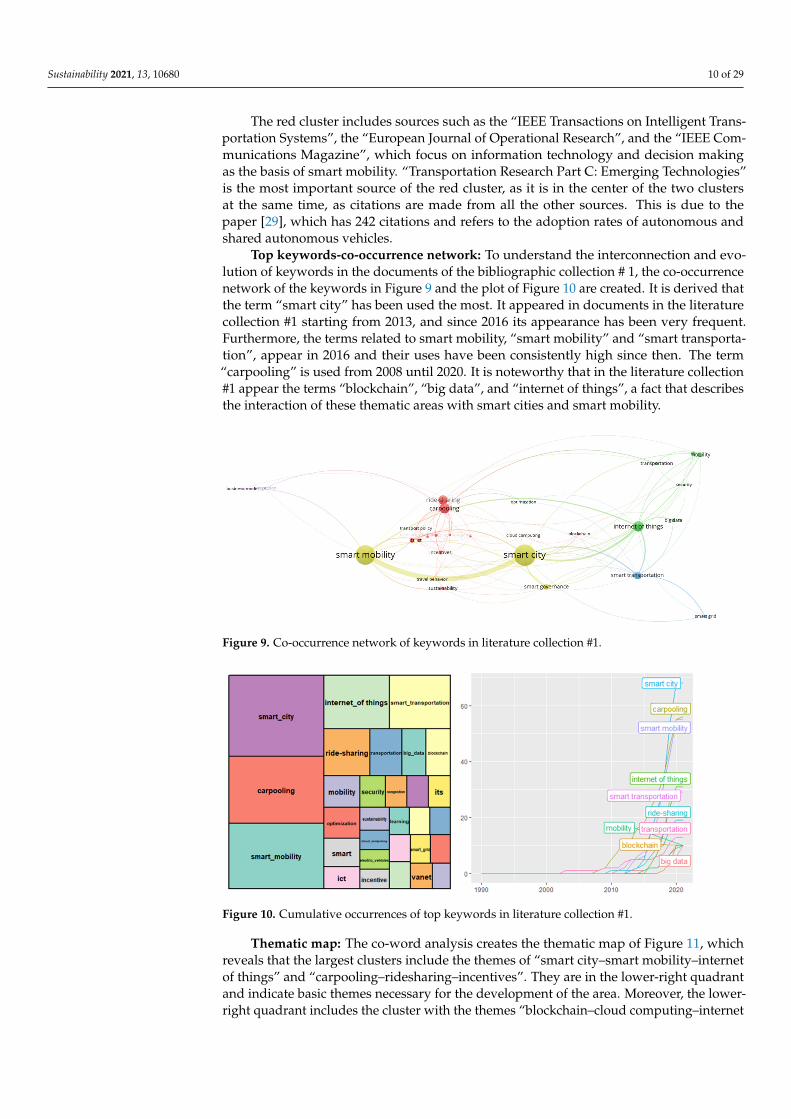
Top keywords-co-occurrence network: To understand the interconnection and evo-lution of keywords in the documents of the bibliographic collection # 1, the co-occurrencenetwork of the keywords in Figure 9 and the plot of Figure 10 are created. It is derived thatthe term “smart city” has been used the most. It appeared in documents in the literaturecollection #1 starting from 2013, and since 2016 its appearance has been very frequent.Furthermore, the terms related to smart mobility, “smart mobility” and “smart transporta-tion”, appear in 2016 and their uses have been consistently high since then. The term“carpooling” is used from 2008 until 2020. It is noteworthy that in the literature collection#1 appear the terms “blockchain”, “big data”, and “internet of things”, a fact that describesthe interaction of these thematic areas with smart cities and smart mobility.
Sustainability 2021, 13, x FOR PEER REVIEW 11 of 31
Figure 9. Co-occurrence network of keywords in literature collection #1.
Figure 10. Cumulative occurrences of top keywords in literature collection #1.
Thematic map: The co-word analysis creates the thematic map of Figure 11, which reveals that the largest clusters include the themes of “smart city–smart mobility–internet of things” and “carpooling–ridesharing–incentives”. They are in the lower-right quadrant and indicate basic themes necessary for the development of the area. Moreover, the lower-right quadrant includes the cluster with the themes “blockchain–cloud computing–inter-net of vehicles”. The upper-left quadrant, which represents the area of the isolated themes, includes the themes of the “congestion–high occupancy vehicle–HOV effectiveness”.
Figure 11. Thematic map of literature collection #1 [2].
Figure 9. Co-occurrence network of keywords in literature collection #1.
Sustainability 2021, 13, x FOR PEER REVIEW 11 of 31
Figure 9. Co-occurrence network of keywords in literature collection #1.
Figure 10. Cumulative occurrences of top keywords in literature collection #1.
Thematic map: The co-word analysis creates the thematic map of Figure 11, which reveals that the largest clusters include the themes of “smart city–smart mobility–internet of things” and “carpooling–ridesharing–incentives”. They are in the lower-right quadrant and indicate basic themes necessary for the development of the area. Moreover, the lower-right quadrant includes the cluster with the themes “blockchain–cloud computing–inter-net of vehicles”. The upper-left quadrant, which represents the area of the isolated themes, includes the themes of the “congestion–high occupancy vehicle–HOV effectiveness”.
Figure 11. Thematic map of literature collection #1 [2].
Figure 10. Cumulative occurrences of top keywords in literature collection #1.
Thematic map: The co-word analysis creates the thematic map of Figure 11, whichreveals that the largest clusters include the themes of “smart city–smart mobility–internetof things” and “carpooling–ridesharing–incentives”. They are in the lower-right quadrantand indicate basic themes necessary for the development of the area. Moreover, the lower-right quadrant includes the cluster with the themes “blockchain–cloud computing–internet
Sustainability 2021, 13, 10680 11 of 29
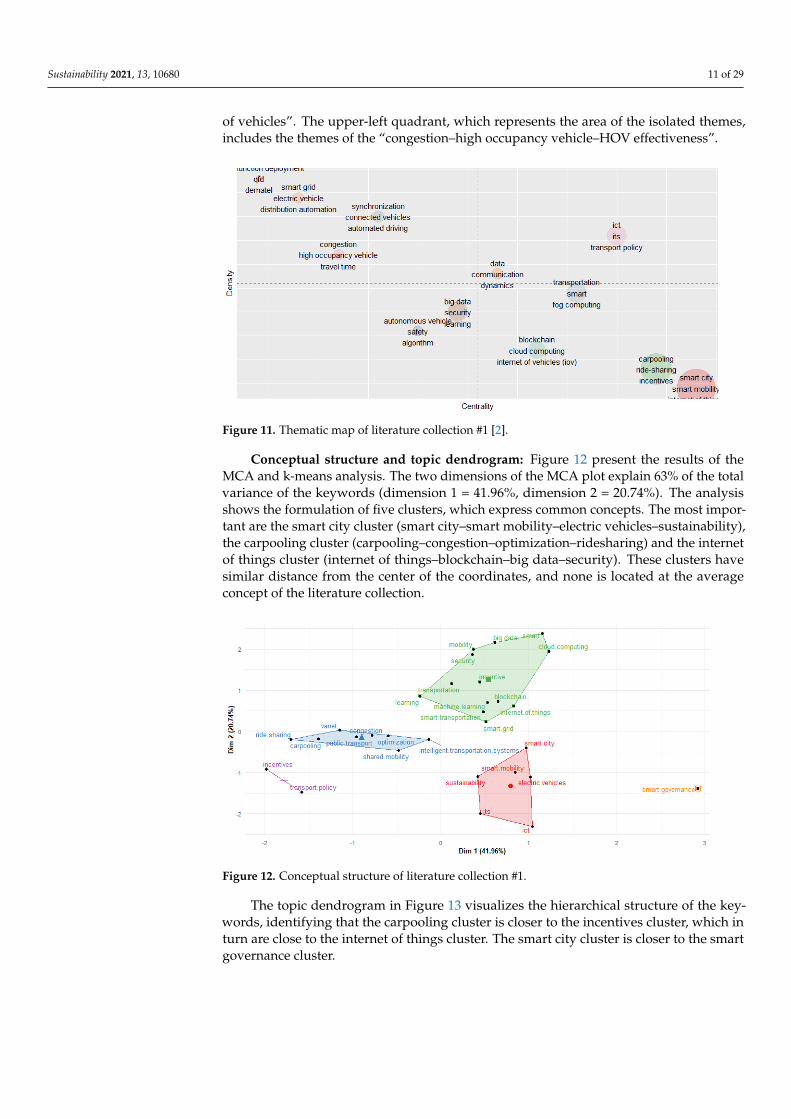
of vehicles”. The upper-left quadrant, which represents the area of the isolated themes,includes the themes of the “congestion–high occupancy vehicle–HOV effectiveness”.
Sustainability 2021, 13, x FOR PEER REVIEW 11 of 31
Figure 9. Co-occurrence network of keywords in literature collection #1.
Figure 10. Cumulative occurrences of top keywords in literature collection #1.
Thematic map: The co-word analysis creates the thematic map of Figure 11, which reveals that the largest clusters include the themes of “smart city–smart mobility–internet of things” and “carpooling–ridesharing–incentives”. They are in the lower-right quadrant and indicate basic themes necessary for the development of the area. Moreover, the lower-right quadrant includes the cluster with the themes “blockchain–cloud computing–inter-net of vehicles”. The upper-left quadrant, which represents the area of the isolated themes, includes the themes of the “congestion–high occupancy vehicle–HOV effectiveness”.
Figure 11. Thematic map of literature collection #1 [2]. Figure 11. Thematic map of literature collection #1 [2].
Conceptual structure and topic dendrogram: Figure 12 present the results of theMCA and k-means analysis. The two dimensions of the MCA plot explain 63% of the totalvariance of the keywords (dimension 1 = 41.96%, dimension 2 = 20.74%). The analysisshows the formulation of five clusters, which express common concepts. The most impor-tant are the smart city cluster (smart city–smart mobility–electric vehicles–sustainability),the carpooling cluster (carpooling–congestion–optimization–ridesharing) and the internetof things cluster (internet of things–blockchain–big data–security). These clusters havesimilar distance from the center of the coordinates, and none is located at the averageconcept of the literature collection.
Sustainability 2021, 13, x FOR PEER REVIEW 12 of 31
Conceptual structure and topic dendrogram: Figure 12 present the results of the MCA and k-means analysis. The two dimensions of the MCA plot explain 63% of the total variance of the keywords (dimension 1 = 41.96%, dimension 2 = 20.74%). The analysis shows the formulation of five clusters, which express common concepts. The most im-portant are the smart city cluster (smart city–smart mobility–electric vehicles–sustainabil-ity), the carpooling cluster (carpooling–congestion–optimization–ridesharing) and the in-ternet of things cluster (internet of things–blockchain–big data–security). These clusters have similar distance from the center of the coordinates, and none is located at the average concept of the literature collection.
The topic dendrogram in Figure 13 visualizes the hierarchical structure of the key-words, identifying that the carpooling cluster is closer to the incentives cluster, which in turn are close to the internet of things cluster. The smart city cluster is closer to the smart governance cluster.
Figure 12. Conceptual structure of literature collection #1.
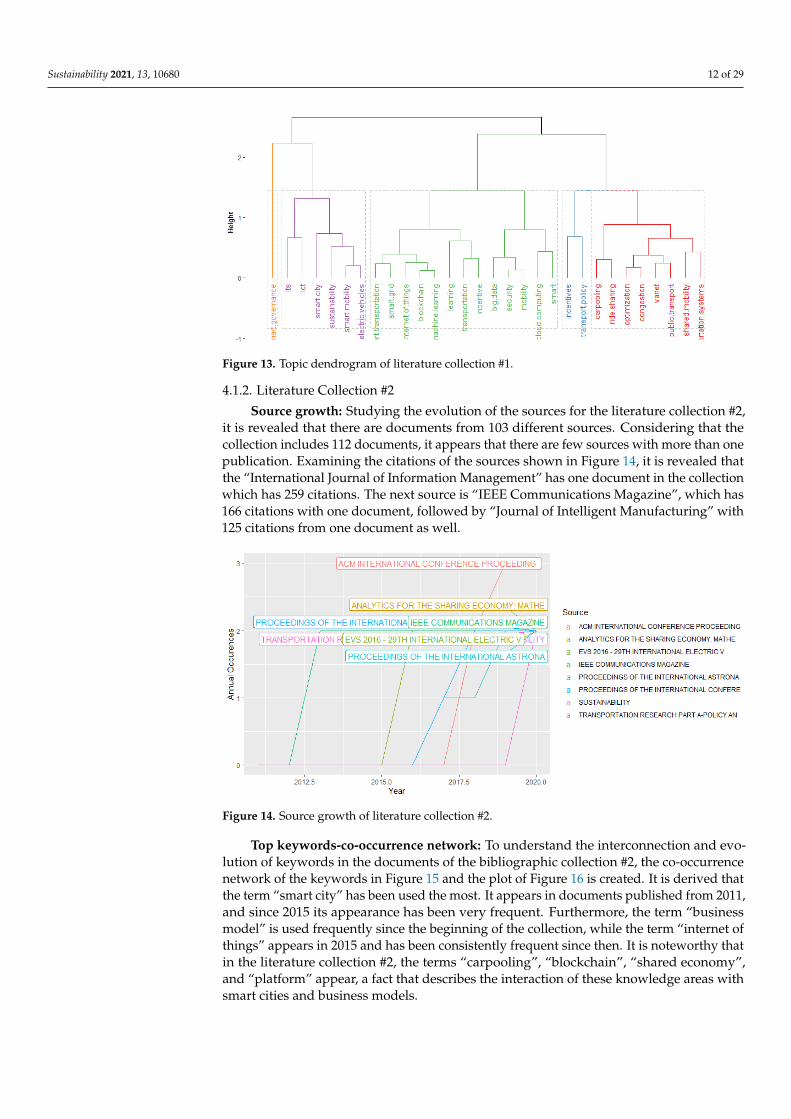
Figure 13. Topic dendrogram of literature collection #1.
4.1.2. Literature Collection #2 Source growth: Studying the evolution of the sources for the literature collection #2,
it is revealed that there are documents from 103 different sources. Considering that the collection includes 112 documents, it appears that there are few sources with more than one publication. Examining the citations of the sources shown in Figure 14, it is revealed that the “International Journal of Information Management” has one document in the col-lection which has 259 citations. The next source is “IEEE Communications Magazine”,
Figure 12. Conceptual structure of literature collection #1.
The topic dendrogram in Figure 13 visualizes the hierarchical structure of the key-words, identifying that the carpooling cluster is closer to the incentives cluster, which inturn are close to the internet of things cluster. The smart city cluster is closer to the smartgovernance cluster.
Sustainability 2021, 13, 10680 12 of 29
Sustainability 2021, 13, x FOR PEER REVIEW 12 of 31
Conceptual structure and topic dendrogram: Figure 12 present the results of the MCA and k-means analysis. The two dimensions of the MCA plot explain 63% of the total variance of the keywords (dimension 1 = 41.96%, dimension 2 = 20.74%). The analysis shows the formulation of five clusters, which express common concepts. The most im-portant are the smart city cluster (smart city–smart mobility–electric vehicles–sustainabil-ity), the carpooling cluster (carpooling–congestion–optimization–ridesharing) and the in-ternet of things cluster (internet of things–blockchain–big data–security). These clusters have similar distance from the center of the coordinates, and none is located at the average concept of the literature collection.
The topic dendrogram in Figure 13 visualizes the hierarchical structure of the key-words, identifying that the carpooling cluster is closer to the incentives cluster, which in turn are close to the internet of things cluster. The smart city cluster is closer to the smart governance cluster.
Figure 12. Conceptual structure of literature collection #1.
Figure 13. Topic dendrogram of literature collection #1.
4.1.2. Literature Collection #2 Source growth: Studying the evolution of the sources for the literature collection #2,
it is revealed that there are documents from 103 different sources. Considering that the collection includes 112 documents, it appears that there are few sources with more than one publication. Examining the citations of the sources shown in Figure 14, it is revealed that the “International Journal of Information Management” has one document in the col-lection which has 259 citations. The next source is “IEEE Communications Magazine”,
Figure 13. Topic dendrogram of literature collection #1.
4.1.2. Literature Collection #2
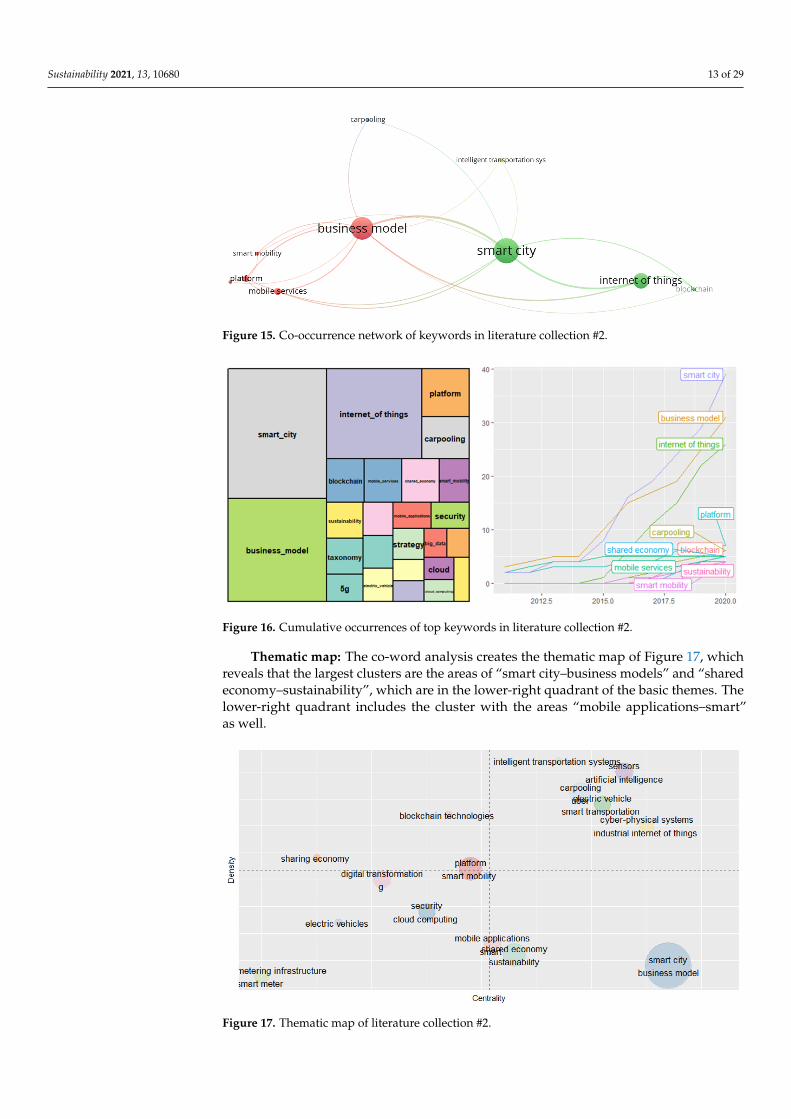
Source growth: Studying the evolution of the sources for the literature collection #2,it is revealed that there are documents from 103 different sources. Considering that thecollection includes 112 documents, it appears that there are few sources with more than onepublication. Examining the citations of the sources shown in Figure 14, it is revealed thatthe “International Journal of Information Management” has one document in the collectionwhich has 259 citations. The next source is “IEEE Communications Magazine”, which has166 citations with one document, followed by “Journal of Intelligent Manufacturing” with125 citations from one document as well.
Sustainability 2021, 13, x FOR PEER REVIEW 13 of 31
which has 166 citations with one document, followed by “Journal of Intelligent Manufac-turing” with 125 citations from one document as well.
Figure 14. Source growth of literature collection #2.
Top keywords-co-occurrence network: To understand the interconnection and evo-lution of keywords in the documents of the bibliographic collection #2, the co-occurrence network of the keywords in Figure 15 and the plot of Figure 16 is created. It is derived that the term “smart city” has been used the most. It appears in documents published from 2011, and since 2015 its appearance has been very frequent. Furthermore, the term “business model” is used frequently since the beginning of the collection, while the term “internet of things” appears in 2015 and has been consistently frequent since then. It is noteworthy that in the literature collection #2, the terms “carpooling”, “blockchain”, “shared economy”, and “platform” appear, a fact that describes the interaction of these knowledge areas with smart cities and business models.
Figure 15. Co-occurrence network of keywords in literature collection #2.
Figure 14. Source growth of literature collection #2.
Top keywords-co-occurrence network: To understand the interconnection and evo-lution of keywords in the documents of the bibliographic collection #2, the co-occurrencenetwork of the keywords in Figure 15 and the plot of Figure 16 is created. It is derived thatthe term “smart city” has been used the most. It appears in documents published from 2011,and since 2015 its appearance has been very frequent. Furthermore, the term “businessmodel” is used frequently since the beginning of the collection, while the term “internet ofthings” appears in 2015 and has been consistently frequent since then. It is noteworthy thatin the literature collection #2, the terms “carpooling”, “blockchain”, “shared economy”,and “platform” appear, a fact that describes the interaction of these knowledge areas withsmart cities and business models.
Sustainability 2021, 13, 10680 13 of 29
Sustainability 2021, 13, x FOR PEER REVIEW 13 of 31
which has 166 citations with one document, followed by “Journal of Intelligent Manufac-turing” with 125 citations from one document as well.
Figure 14. Source growth of literature collection #2.
Top keywords-co-occurrence network: To understand the interconnection and evo-lution of keywords in the documents of the bibliographic collection #2, the co-occurrence network of the keywords in Figure 15 and the plot of Figure 16 is created. It is derived that the term “smart city” has been used the most. It appears in documents published from 2011, and since 2015 its appearance has been very frequent. Furthermore, the term “business model” is used frequently since the beginning of the collection, while the term “internet of things” appears in 2015 and has been consistently frequent since then. It is noteworthy that in the literature collection #2, the terms “carpooling”, “blockchain”, “shared economy”, and “platform” appear, a fact that describes the interaction of these knowledge areas with smart cities and business models.
Figure 15. Co-occurrence network of keywords in literature collection #2. Figure 15. Co-occurrence network of keywords in literature collection #2.
Sustainability 2021, 13, x FOR PEER REVIEW 14 of 31
Figure 16. Cumulative occurrences of top keywords in literature collection #2.
Thematic map: The co-word analysis creates the thematic map of Figure 17, which reveals that the largest clusters are the areas of “smart city–business models” and “shared economy–sustainability”, which are in the lower-right quadrant of the basic themes. The lower-right quadrant includes the cluster with the areas “mobile applications–smart” as well.
Figure 17. Thematic map of literature collection #2.
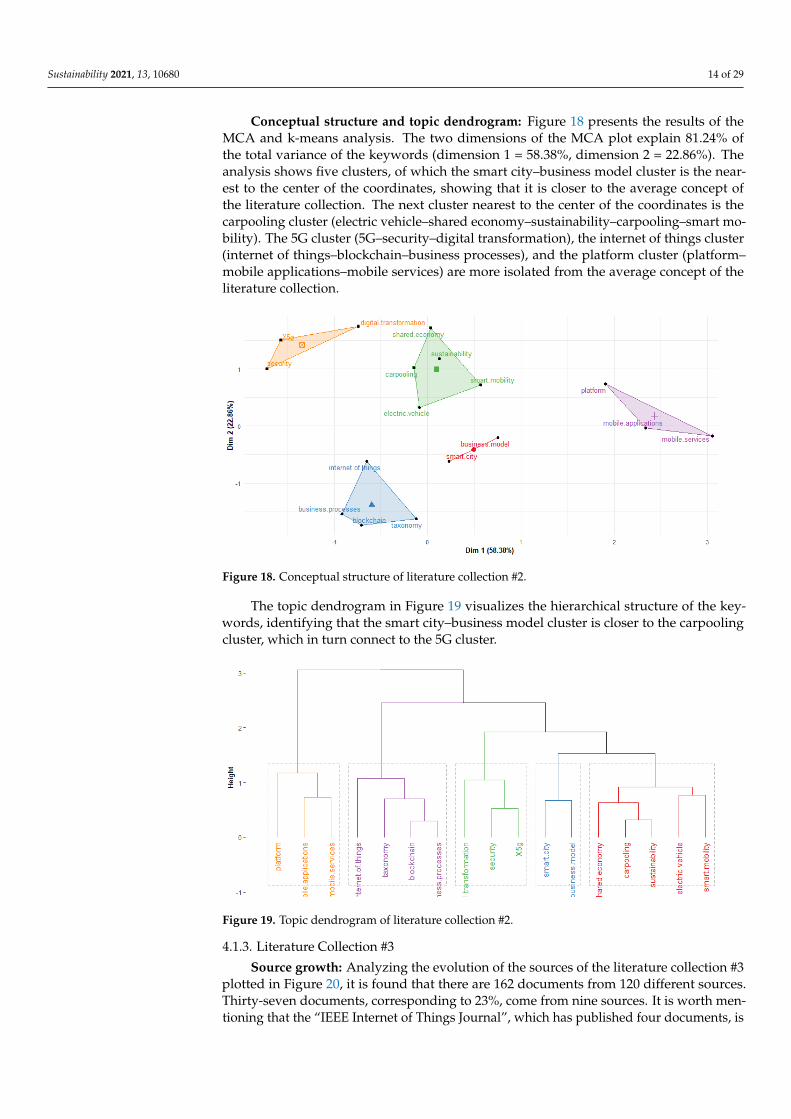
Conceptual structure and topic dendrogram: Figure 18 presents the results of the MCA and k-means analysis. The two dimensions of the MCA plot explain 81.24% of the total variance of the keywords (dimension 1 = 58.38%, dimension 2 = 22.86%). The analysis shows five clusters, of which the smart city–business model cluster is the nearest to the center of the coordinates, showing that it is closer to the average concept of the literature collection. The next cluster nearest to the center of the coordinates is the carpooling cluster (electric vehicle–shared economy–sustainability–carpooling–smart mobility). The 5G cluster (5G–security–digital transformation), the internet of things cluster (internet of things–blockchain–business processes), and the platform cluster (platform–mobile appli-cations–mobile services) are more isolated from the average concept of the literature col-lection.
The topic dendrogram in Figure 19 visualizes the hierarchical structure of the key-words, identifying that the smart city–business model cluster is closer to the carpooling cluster, which in turn connect to the 5G cluster.
Figure 16. Cumulative occurrences of top keywords in literature collection #2.
Thematic map: The co-word analysis creates the thematic map of Figure 17, whichreveals that the largest clusters are the areas of “smart city–business models” and “sharedeconomy–sustainability”, which are in the lower-right quadrant of the basic themes. Thelower-right quadrant includes the cluster with the areas “mobile applications–smart”as well.
Sustainability 2021, 13, x FOR PEER REVIEW 14 of 31
Figure 16. Cumulative occurrences of top keywords in literature collection #2.
Thematic map: The co-word analysis creates the thematic map of Figure 17, which reveals that the largest clusters are the areas of “smart city–business models” and “shared economy–sustainability”, which are in the lower-right quadrant of the basic themes. The lower-right quadrant includes the cluster with the areas “mobile applications–smart” as well.
Figure 17. Thematic map of literature collection #2.
Conceptual structure and topic dendrogram: Figure 18 presents the results of the MCA and k-means analysis. The two dimensions of the MCA plot explain 81.24% of the total variance of the keywords (dimension 1 = 58.38%, dimension 2 = 22.86%). The analysis shows five clusters, of which the smart city–business model cluster is the nearest to the center of the coordinates, showing that it is closer to the average concept of the literature collection. The next cluster nearest to the center of the coordinates is the carpooling cluster (electric vehicle–shared economy–sustainability–carpooling–smart mobility). The 5G cluster (5G–security–digital transformation), the internet of things cluster (internet of things–blockchain–business processes), and the platform cluster (platform–mobile appli-cations–mobile services) are more isolated from the average concept of the literature col-lection.
The topic dendrogram in Figure 19 visualizes the hierarchical structure of the key-words, identifying that the smart city–business model cluster is closer to the carpooling cluster, which in turn connect to the 5G cluster.
Figure 17. Thematic map of literature collection #2.
Sustainability 2021, 13, 10680 14 of 29
Conceptual structure and topic dendrogram: Figure 18 presents the results of theMCA and k-means analysis. The two dimensions of the MCA plot explain 81.24% ofthe total variance of the keywords (dimension 1 = 58.38%, dimension 2 = 22.86%). Theanalysis shows five clusters, of which the smart city–business model cluster is the near-est to the center of the coordinates, showing that it is closer to the average concept ofthe literature collection. The next cluster nearest to the center of the coordinates is thecarpooling cluster (electric vehicle–shared economy–sustainability–carpooling–smart mo-bility). The 5G cluster (5G–security–digital transformation), the internet of things cluster(internet of things–blockchain–business processes), and the platform cluster (platform–mobile applications–mobile services) are more isolated from the average concept of theliterature collection.
Sustainability 2021, 13, x FOR PEER REVIEW 15 of 31
Figure 18. Conceptual structure of literature collection #2.
Figure 19. Topic dendrogram of literature collection #2.
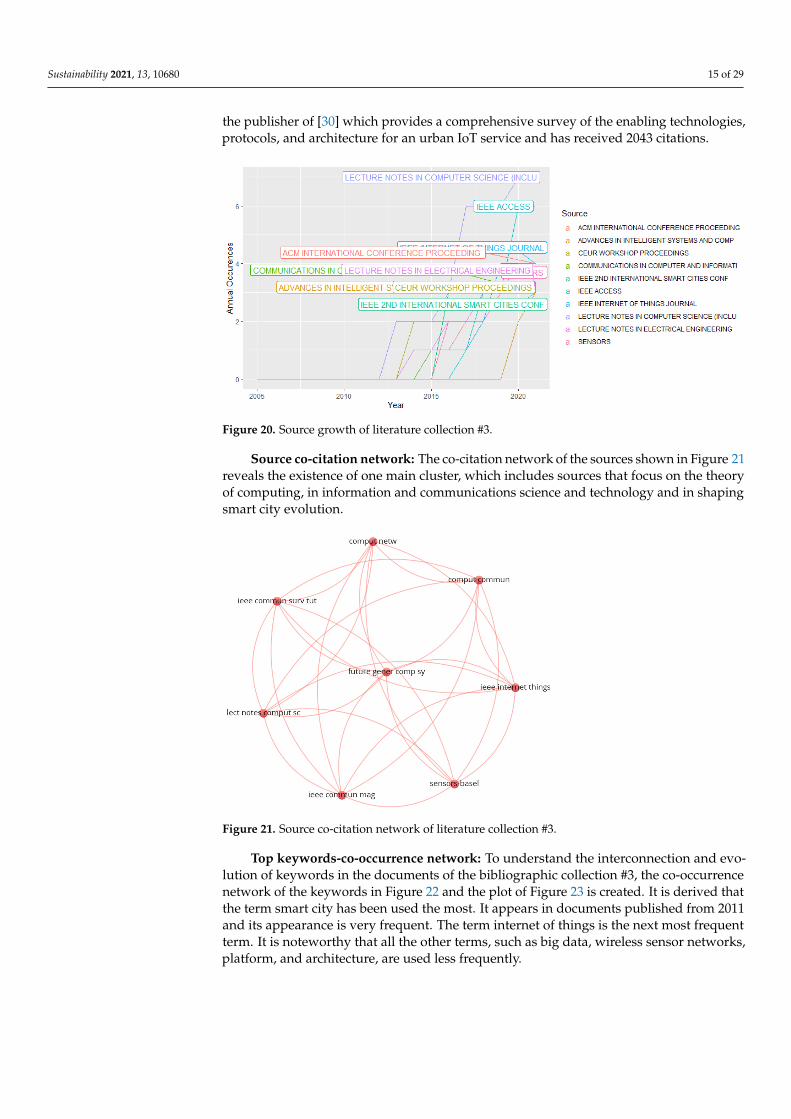
4.1.3. Literature Collection #3 Source growth: Analyzing the evolution of the sources of the literature collection #3
plotted in Figure 20, it is found that there are 162 documents from 120 different sources. Thirty-seven documents, corresponding to 23%, come from nine sources. It is worth men-tioning that the “IEEE Internet of Things Journal”, which has published four documents, is the publisher of [30] which provides a comprehensive survey of the enabling technolo-gies, protocols, and architecture for an urban IoT service and has received 2043 citations.
Figure 18. Conceptual structure of literature collection #2.
The topic dendrogram in Figure 19 visualizes the hierarchical structure of the key-words, identifying that the smart city–business model cluster is closer to the carpoolingcluster, which in turn connect to the 5G cluster.
Sustainability 2021, 13, x FOR PEER REVIEW 15 of 31
Figure 18. Conceptual structure of literature collection #2.
Figure 19. Topic dendrogram of literature collection #2.
4.1.3. Literature Collection #3 Source growth: Analyzing the evolution of the sources of the literature collection #3
plotted in Figure 20, it is found that there are 162 documents from 120 different sources. Thirty-seven documents, corresponding to 23%, come from nine sources. It is worth men-tioning that the “IEEE Internet of Things Journal”, which has published four documents, is the publisher of [30] which provides a comprehensive survey of the enabling technolo-gies, protocols, and architecture for an urban IoT service and has received 2043 citations.
Figure 19. Topic dendrogram of literature collection #2.
4.1.3. Literature Collection #3
Source growth: Analyzing the evolution of the sources of the literature collection #3plotted in Figure 20, it is found that there are 162 documents from 120 different sources.Thirty-seven documents, corresponding to 23%, come from nine sources. It is worth men-tioning that the “IEEE Internet of Things Journal”, which has published four documents, is
Sustainability 2021, 13, 10680 15 of 29
the publisher of [30] which provides a comprehensive survey of the enabling technologies,protocols, and architecture for an urban IoT service and has received 2043 citations.
Sustainability 2021, 13, x FOR PEER REVIEW 16 of 31
Figure 20. Source growth of literature collection #3.
Source co-citation network: The co-citation network of the sources shown in Figure 21 reveals the existence of one main cluster, which includes sources that focus on the the-ory of computing, in information and communications science and technology and in shaping smart city evolution.
Figure 21. Source co-citation network of literature collection #3.
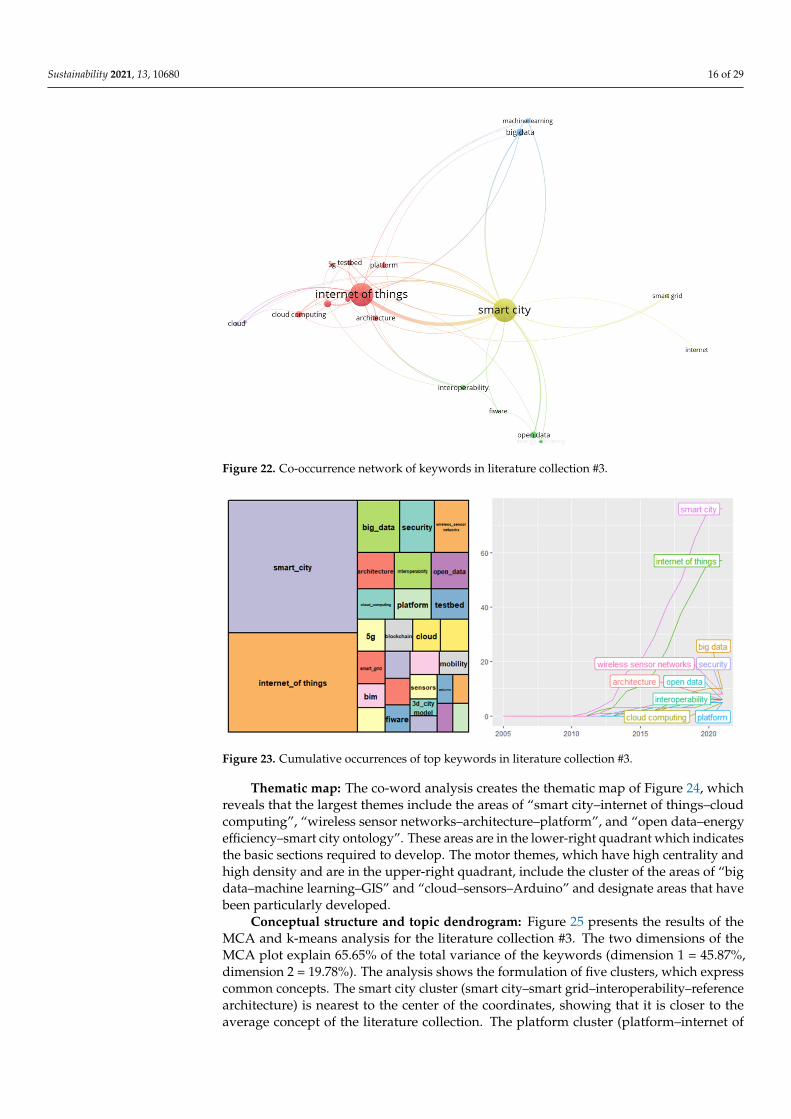
Top keywords-co-occurrence network: To understand the interconnection and evo-lution of keywords in the documents of the bibliographic collection #3, the co-occurrence network of the keywords in Figure 22 and the plot of Figure 23 is created. It is derived that the term smart city has been used the most. It appears in documents published from 2011 and its appearance is very frequent. The term internet of things is the next most fre-quent term. It is noteworthy that all the other terms, such as big data, wireless sensor networks, platform, and architecture, are used less frequently.
Figure 20. Source growth of literature collection #3.
Source co-citation network: The co-citation network of the sources shown in Figure 21reveals the existence of one main cluster, which includes sources that focus on the theoryof computing, in information and communications science and technology and in shapingsmart city evolution.
Sustainability 2021, 13, x FOR PEER REVIEW 16 of 31
Figure 20. Source growth of literature collection #3.
Source co-citation network: The co-citation network of the sources shown in Figure 21 reveals the existence of one main cluster, which includes sources that focus on the the-ory of computing, in information and communications science and technology and in shaping smart city evolution.
Figure 21. Source co-citation network of literature collection #3.
Top keywords-co-occurrence network: To understand the interconnection and evo-lution of keywords in the documents of the bibliographic collection #3, the co-occurrence network of the keywords in Figure 22 and the plot of Figure 23 is created. It is derived that the term smart city has been used the most. It appears in documents published from 2011 and its appearance is very frequent. The term internet of things is the next most fre-quent term. It is noteworthy that all the other terms, such as big data, wireless sensor networks, platform, and architecture, are used less frequently.
Figure 21. Source co-citation network of literature collection #3.
Top keywords-co-occurrence network: To understand the interconnection and evo-lution of keywords in the documents of the bibliographic collection #3, the co-occurrencenetwork of the keywords in Figure 22 and the plot of Figure 23 is created. It is derived thatthe term smart city has been used the most. It appears in documents published from 2011and its appearance is very frequent. The term internet of things is the next most frequentterm. It is noteworthy that all the other terms, such as big data, wireless sensor networks,platform, and architecture, are used less frequently.
Sustainability 2021, 13, 10680 16 of 29Sustainability 2021, 13, x FOR PEER REVIEW 17 of 31
Figure 22. Co-occurrence network of keywords in literature collection #3.
Figure 23. Cumulative occurrences of top keywords in literature collection #3.
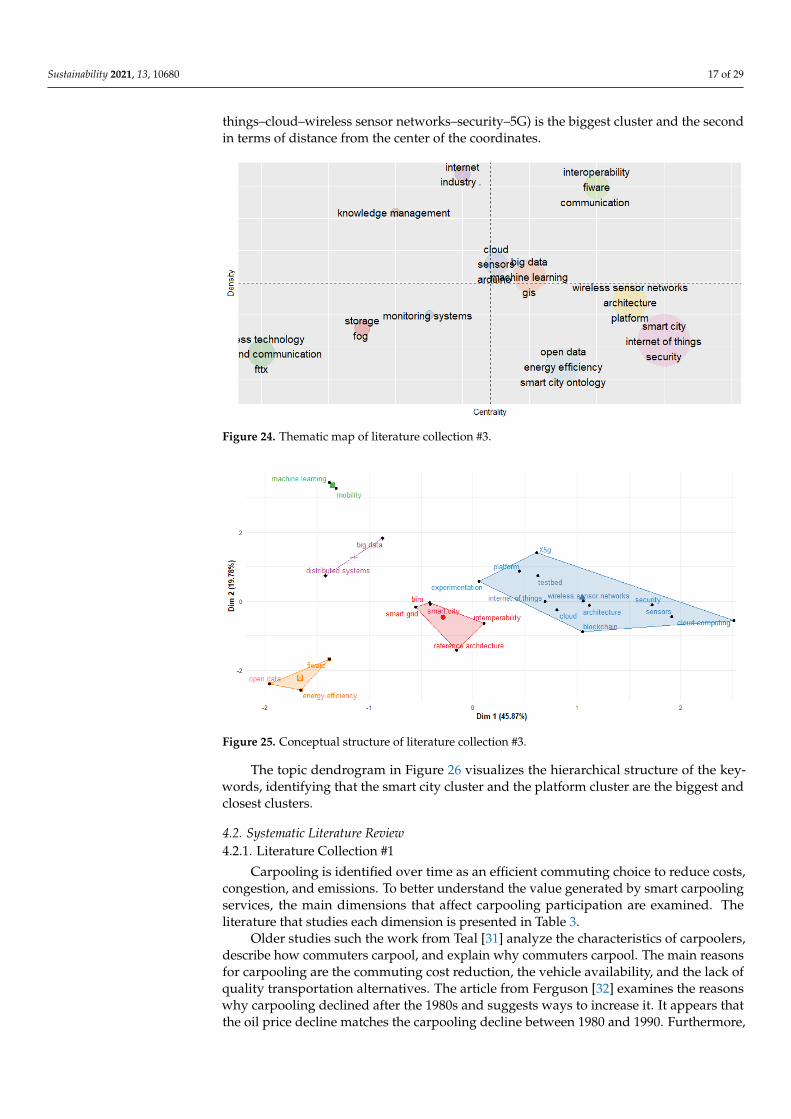
Thematic map: The co-word analysis creates the thematic map of Figure 24, which reveals that the largest themes include the areas of “smart city–internet of things–cloud computing”, “wireless sensor networks–architecture–platform”, and “open data–energy efficiency–smart city ontology”. These areas are in the lower-right quadrant which indi-cates the basic sections required to develop. The motor themes, which have high centrality and high density and are in the upper-right quadrant, include the cluster of the areas of “big data–machine learning–GIS” and “cloud–sensors–Arduino” and designate areas that have been particularly developed.
Figure 22. Co-occurrence network of keywords in literature collection #3.
Sustainability 2021, 13, x FOR PEER REVIEW 17 of 31
Figure 22. Co-occurrence network of keywords in literature collection #3.
Figure 23. Cumulative occurrences of top keywords in literature collection #3.
Thematic map: The co-word analysis creates the thematic map of Figure 24, which reveals that the largest themes include the areas of “smart city–internet of things–cloud computing”, “wireless sensor networks–architecture–platform”, and “open data–energy efficiency–smart city ontology”. These areas are in the lower-right quadrant which indi-cates the basic sections required to develop. The motor themes, which have high centrality and high density and are in the upper-right quadrant, include the cluster of the areas of “big data–machine learning–GIS” and “cloud–sensors–Arduino” and designate areas that have been particularly developed.
Figure 23. Cumulative occurrences of top keywords in literature collection #3.
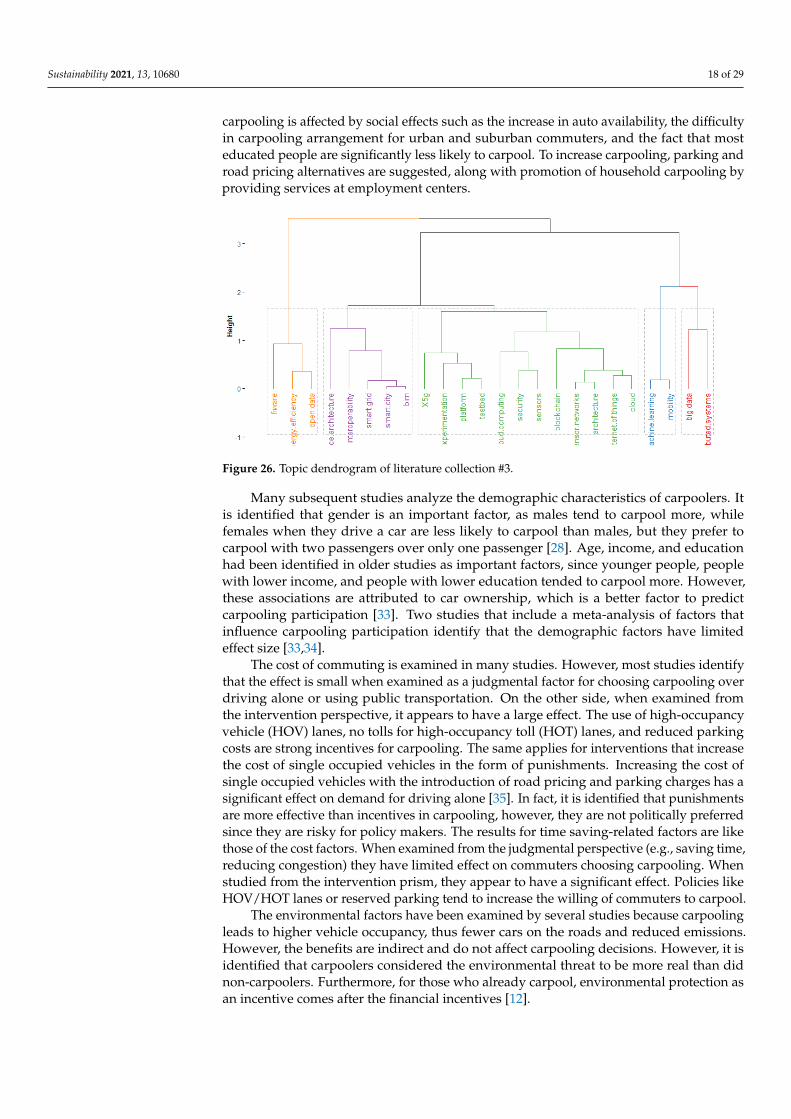
Thematic map: The co-word analysis creates the thematic map of Figure 24, whichreveals that the largest themes include the areas of “smart city–internet of things–cloudcomputing”, “wireless sensor networks–architecture–platform”, and “open data–energyefficiency–smart city ontology”. These areas are in the lower-right quadrant which indicatesthe basic sections required to develop. The motor themes, which have high centrality andhigh density and are in the upper-right quadrant, include the cluster of the areas of “bigdata–machine learning–GIS” and “cloud–sensors–Arduino” and designate areas that havebeen particularly developed.
Conceptual structure and topic dendrogram: Figure 25 presents the results of theMCA and k-means analysis for the literature collection #3. The two dimensions of theMCA plot explain 65.65% of the total variance of the keywords (dimension 1 = 45.87%,dimension 2 = 19.78%). The analysis shows the formulation of five clusters, which expresscommon concepts. The smart city cluster (smart city–smart grid–interoperability–referencearchitecture) is nearest to the center of the coordinates, showing that it is closer to theaverage concept of the literature collection. The platform cluster (platform–internet of
Sustainability 2021, 13, 10680 17 of 29
things–cloud–wireless sensor networks–security–5G) is the biggest cluster and the secondin terms of distance from the center of the coordinates.
Sustainability 2021, 13, x FOR PEER REVIEW 18 of 31
Figure 24. Thematic map of literature collection #3.
Conceptual structure and topic dendrogram: Figure 25 presents the results of the MCA and k-means analysis for the literature collection #3. The two dimensions of the MCA plot explain 65.65% of the total variance of the keywords (dimension 1 = 45.87%, dimension 2 = 19.78%). The analysis shows the formulation of five clusters, which express common concepts. The smart city cluster (smart city–smart grid–interoperability–refer-ence architecture) is nearest to the center of the coordinates, showing that it is closer to the average concept of the literature collection. The platform cluster (platform–internet of things–cloud–wireless sensor networks–security–5G) is the biggest cluster and the second in terms of distance from the center of the coordinates.
The topic dendrogram in Figure 26 visualizes the hierarchical structure of the key-words, identifying that the smart city cluster and the platform cluster are the biggest and closest clusters.
Figure 25. Conceptual structure of literature collection #3.
Figure 24. Thematic map of literature collection #3.
Sustainability 2021, 13, x FOR PEER REVIEW 18 of 31
Figure 24. Thematic map of literature collection #3.
Conceptual structure and topic dendrogram: Figure 25 presents the results of the MCA and k-means analysis for the literature collection #3. The two dimensions of the MCA plot explain 65.65% of the total variance of the keywords (dimension 1 = 45.87%, dimension 2 = 19.78%). The analysis shows the formulation of five clusters, which express common concepts. The smart city cluster (smart city–smart grid–interoperability–refer-ence architecture) is nearest to the center of the coordinates, showing that it is closer to the average concept of the literature collection. The platform cluster (platform–internet of things–cloud–wireless sensor networks–security–5G) is the biggest cluster and the second in terms of distance from the center of the coordinates.
The topic dendrogram in Figure 26 visualizes the hierarchical structure of the key-words, identifying that the smart city cluster and the platform cluster are the biggest and closest clusters.
Figure 25. Conceptual structure of literature collection #3. Figure 25. Conceptual structure of literature collection #3.
The topic dendrogram in Figure 26 visualizes the hierarchical structure of the key-words, identifying that the smart city cluster and the platform cluster are the biggest andclosest clusters.
4.2. Systematic Literature Review4.2.1. Literature Collection #1
Carpooling is identified over time as an efficient commuting choice to reduce costs,congestion, and emissions. To better understand the value generated by smart carpoolingservices, the main dimensions that affect carpooling participation are examined. Theliterature that studies each dimension is presented in Table 3.
Older studies such the work from Teal [31] analyze the characteristics of carpoolers,describe how commuters carpool, and explain why commuters carpool. The main reasonsfor carpooling are the commuting cost reduction, the vehicle availability, and the lack ofquality transportation alternatives. The article from Ferguson [32] examines the reasonswhy carpooling declined after the 1980s and suggests ways to increase it. It appears thatthe oil price decline matches the carpooling decline between 1980 and 1990. Furthermore,
Sustainability 2021, 13, 10680 18 of 29
carpooling is affected by social effects such as the increase in auto availability, the difficultyin carpooling arrangement for urban and suburban commuters, and the fact that mosteducated people are significantly less likely to carpool. To increase carpooling, parking androad pricing alternatives are suggested, along with promotion of household carpooling byproviding services at employment centers.
Sustainability 2021, 13, x FOR PEER REVIEW 19 of 31
Figure 26. Topic dendrogram of literature collection #3.
4.2. Systematic Literature Review 4.2.1. Literature Collection #1
Carpooling is identified over time as an efficient commuting choice to reduce costs, congestion, and emissions. To better understand the value generated by smart carpooling services, the main dimensions that affect carpooling participation are examined. The lit-erature that studies each dimension is presented in Table 3.
Older studies such the work from Teal [31] analyze the characteristics of carpoolers, describe how commuters carpool, and explain why commuters carpool. The main reasons for carpooling are the commuting cost reduction, the vehicle availability, and the lack of quality transportation alternatives. The article from Ferguson [32] examines the reasons why carpooling declined after the 1980s and suggests ways to increase it. It appears that the oil price decline matches the carpooling decline between 1980 and 1990. Furthermore, carpooling is affected by social effects such as the increase in auto availability, the diffi-culty in carpooling arrangement for urban and suburban commuters, and the fact that most educated people are significantly less likely to carpool. To increase carpooling, park-ing and road pricing alternatives are suggested, along with promotion of household car-pooling by providing services at employment centers.
Many subsequent studies analyze the demographic characteristics of carpoolers. It is identified that gender is an important factor, as males tend to carpool more, while females when they drive a car are less likely to carpool than males, but they prefer to carpool with two passengers over only one passenger [28]. Age, income, and education had been iden-tified in older studies as important factors, since younger people, people with lower in-come, and people with lower education tended to carpool more. However, these associa-tions are attributed to car ownership, which is a better factor to predict carpooling partic-ipation [33]. Two studies that include a meta-analysis of factors that influence carpooling participation identify that the demographic factors have limited effect size [33,34].
The cost of commuting is examined in many studies. However, most studies identify that the effect is small when examined as a judgmental factor for choosing carpooling over driving alone or using public transportation. On the other side, when examined from the intervention perspective, it appears to have a large effect. The use of high-occupancy ve-hicle (HOV) lanes, no tolls for high-occupancy toll (HOT) lanes, and reduced parking costs are strong incentives for carpooling. The same applies for interventions that increase the cost of single occupied vehicles in the form of punishments. Increasing the cost of single occupied vehicles with the introduction of road pricing and parking charges has a signif-icant effect on demand for driving alone [35]. In fact, it is identified that punishments are more effective than incentives in carpooling, however, they are not politically preferred since they are risky for policy makers. The results for time saving-related factors are like
Figure 26. Topic dendrogram of literature collection #3.
Many subsequent studies analyze the demographic characteristics of carpoolers. Itis identified that gender is an important factor, as males tend to carpool more, whilefemales when they drive a car are less likely to carpool than males, but they prefer tocarpool with two passengers over only one passenger [28]. Age, income, and educationhad been identified in older studies as important factors, since younger people, peoplewith lower income, and people with lower education tended to carpool more. However,these associations are attributed to car ownership, which is a better factor to predictcarpooling participation [33]. Two studies that include a meta-analysis of factors thatinfluence carpooling participation identify that the demographic factors have limitedeffect size [33,34].
The cost of commuting is examined in many studies. However, most studies identifythat the effect is small when examined as a judgmental factor for choosing carpooling overdriving alone or using public transportation. On the other side, when examined fromthe intervention perspective, it appears to have a large effect. The use of high-occupancyvehicle (HOV) lanes, no tolls for high-occupancy toll (HOT) lanes, and reduced parkingcosts are strong incentives for carpooling. The same applies for interventions that increasethe cost of single occupied vehicles in the form of punishments. Increasing the cost ofsingle occupied vehicles with the introduction of road pricing and parking charges has asignificant effect on demand for driving alone [35]. In fact, it is identified that punishmentsare more effective than incentives in carpooling, however, they are not politically preferredsince they are risky for policy makers. The results for time saving-related factors are likethose of the cost factors. When examined from the judgmental perspective (e.g., saving time,reducing congestion) they have limited effect on commuters choosing carpooling. Whenstudied from the intervention prism, they appear to have a significant effect. Policies likeHOV/HOT lanes or reserved parking tend to increase the willing of commuters to carpool.
The environmental factors have been examined by several studies because carpoolingleads to higher vehicle occupancy, thus fewer cars on the roads and reduced emissions.However, the benefits are indirect and do not affect carpooling decisions. However, it isidentified that carpoolers considered the environmental threat to be more real than didnon-carpoolers. Furthermore, for those who already carpool, environmental protection asan incentive comes after the financial incentives [12].
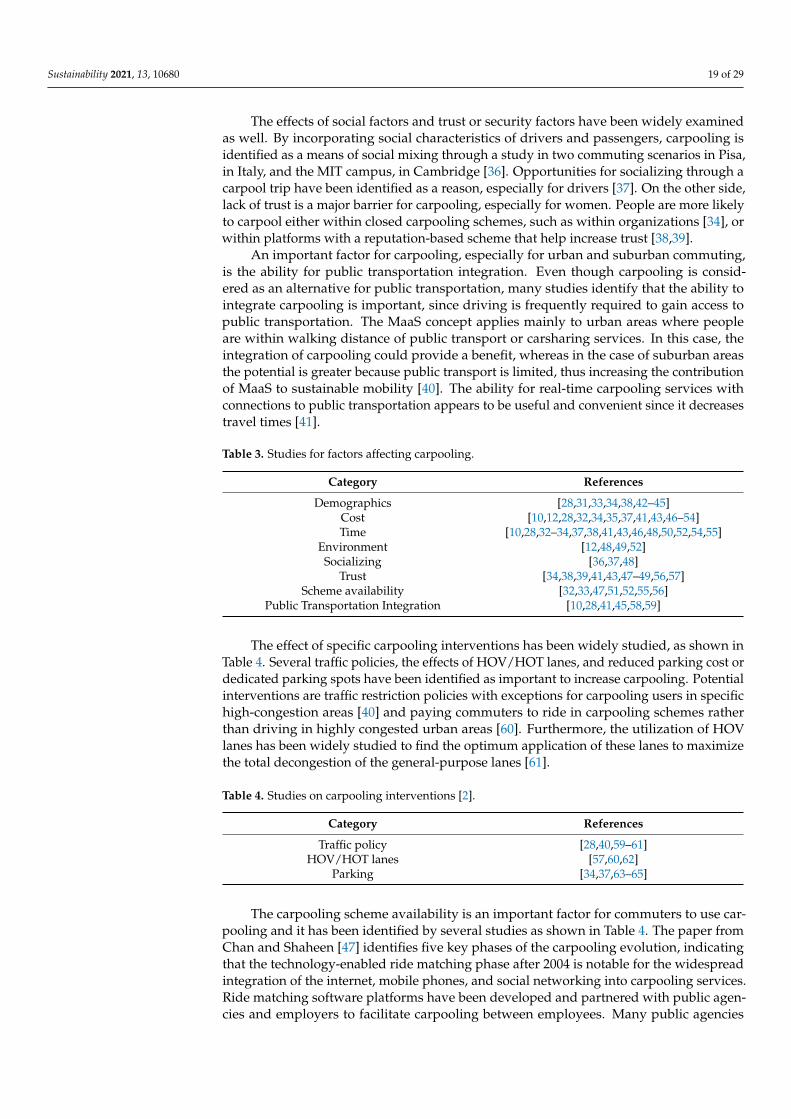
Sustainability 2021, 13, 10680 19 of 29
The effects of social factors and trust or security factors have been widely examinedas well. By incorporating social characteristics of drivers and passengers, carpooling isidentified as a means of social mixing through a study in two commuting scenarios in Pisa,in Italy, and the MIT campus, in Cambridge [36]. Opportunities for socializing through acarpool trip have been identified as a reason, especially for drivers [37]. On the other side,lack of trust is a major barrier for carpooling, especially for women. People are more likelyto carpool either within closed carpooling schemes, such as within organizations [34], orwithin platforms with a reputation-based scheme that help increase trust [38,39].
An important factor for carpooling, especially for urban and suburban commuting,is the ability for public transportation integration. Even though carpooling is consid-ered as an alternative for public transportation, many studies identify that the ability tointegrate carpooling is important, since driving is frequently required to gain access topublic transportation. The MaaS concept applies mainly to urban areas where peopleare within walking distance of public transport or carsharing services. In this case, theintegration of carpooling could provide a benefit, whereas in the case of suburban areasthe potential is greater because public transport is limited, thus increasing the contributionof MaaS to sustainable mobility [40]. The ability for real-time carpooling services withconnections to public transportation appears to be useful and convenient since it decreasestravel times [41].
Table 3. Studies for factors affecting carpooling.
Category References
Demographics [28,31,33,34,38,42–45]Cost [10,12,28,32,34,35,37,41,43,46–54]Time [10,28,32–34,37,38,41,43,46,48,50,52,54,55]
Environment [12,48,49,52]Socializing [36,37,48]
Trust [34,38,39,41,43,47–49,56,57]Scheme availability [32,33,47,51,52,55,56]
Public Transportation Integration [10,28,41,45,58,59]
The effect of specific carpooling interventions has been widely studied, as shown inTable 4. Several traffic policies, the effects of HOV/HOT lanes, and reduced parking cost ordedicated parking spots have been identified as important to increase carpooling. Potentialinterventions are traffic restriction policies with exceptions for carpooling users in specifichigh-congestion areas [40] and paying commuters to ride in carpooling schemes ratherthan driving in highly congested urban areas [60]. Furthermore, the utilization of HOVlanes has been widely studied to find the optimum application of these lanes to maximizethe total decongestion of the general-purpose lanes [61].
Table 4. Studies on carpooling interventions [2].
Category References
Traffic policy [28,40,59–61]HOV/HOT lanes [57,60,62]
Parking [34,37,63–65]
The carpooling scheme availability is an important factor for commuters to use car-pooling and it has been identified by several studies as shown in Table 4. The paper fromChan and Shaheen [47] identifies five key phases of the carpooling evolution, indicatingthat the technology-enabled ride matching phase after 2004 is notable for the widespreadintegration of the internet, mobile phones, and social networking into carpooling services.Ride matching software platforms have been developed and partnered with public agen-cies and employers to facilitate carpooling between employees. Many public agencies
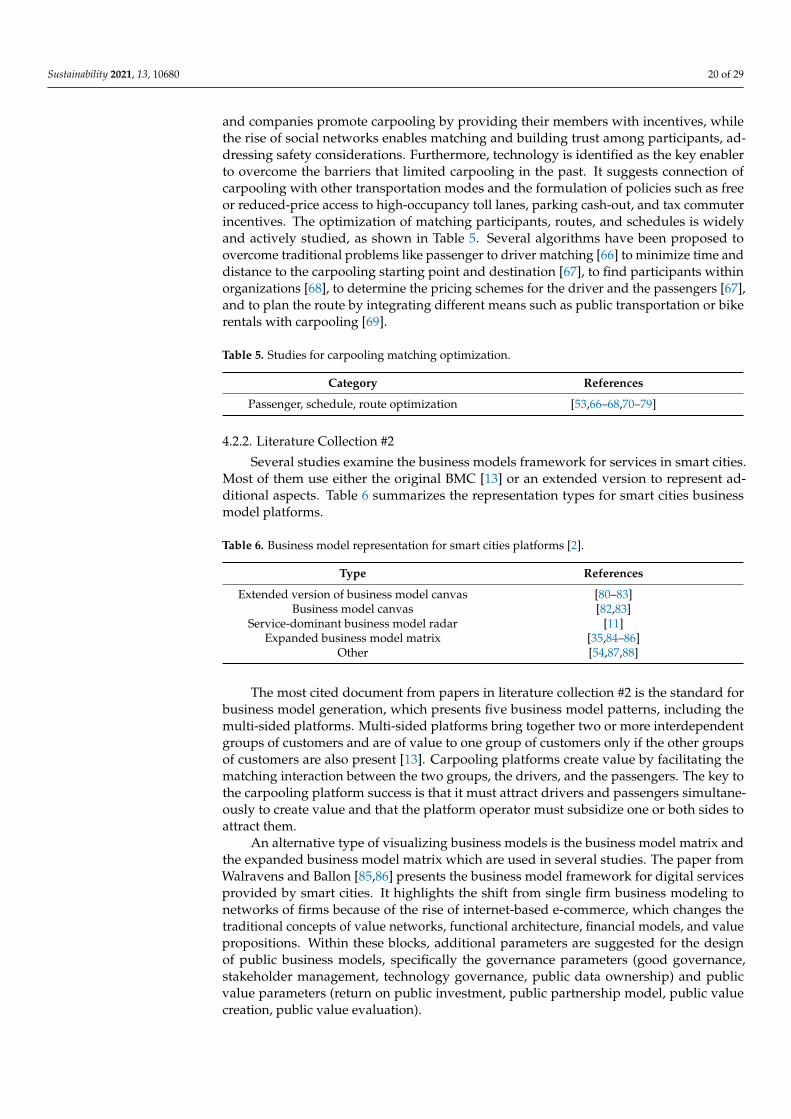
Sustainability 2021, 13, 10680 20 of 29
and companies promote carpooling by providing their members with incentives, whilethe rise of social networks enables matching and building trust among participants, ad-dressing safety considerations. Furthermore, technology is identified as the key enablerto overcome the barriers that limited carpooling in the past. It suggests connection ofcarpooling with other transportation modes and the formulation of policies such as freeor reduced-price access to high-occupancy toll lanes, parking cash-out, and tax commuterincentives. The optimization of matching participants, routes, and schedules is widelyand actively studied, as shown in Table 5. Several algorithms have been proposed toovercome traditional problems like passenger to driver matching [66] to minimize time anddistance to the carpooling starting point and destination [67], to find participants withinorganizations [68], to determine the pricing schemes for the driver and the passengers [67],and to plan the route by integrating different means such as public transportation or bikerentals with carpooling [69].
Table 5. Studies for carpooling matching optimization.
Category References
Passenger, schedule, route optimization [53,66–68,70–79]
4.2.2. Literature Collection #2
Several studies examine the business models framework for services in smart cities.Most of them use either the original BMC [13] or an extended version to represent ad-ditional aspects. Table 6 summarizes the representation types for smart cities businessmodel platforms.
Table 6. Business model representation for smart cities platforms [2].
Type References
Extended version of business model canvas [80–83]Business model canvas [82,83]
Service-dominant business model radar [11]Expanded business model matrix [35,84–86]
Other [54,87,88]
The most cited document from papers in literature collection #2 is the standard forbusiness model generation, which presents five business model patterns, including themulti-sided platforms. Multi-sided platforms bring together two or more interdependentgroups of customers and are of value to one group of customers only if the other groupsof customers are also present [13]. Carpooling platforms create value by facilitating thematching interaction between the two groups, the drivers, and the passengers. The key tothe carpooling platform success is that it must attract drivers and passengers simultane-ously to create value and that the platform operator must subsidize one or both sides toattract them.
An alternative type of visualizing business models is the business model matrix andthe expanded business model matrix which are used in several studies. The paper fromWalravens and Ballon [85,86] presents the business model framework for digital servicesprovided by smart cities. It highlights the shift from single firm business modeling tonetworks of firms because of the rise of internet-based e-commerce, which changes thetraditional concepts of value networks, functional architecture, financial models, and valuepropositions. Within these blocks, additional parameters are suggested for the designof public business models, specifically the governance parameters (good governance,stakeholder management, technology governance, public data ownership) and publicvalue parameters (return on public investment, public partnership model, public valuecreation, public value evaluation).
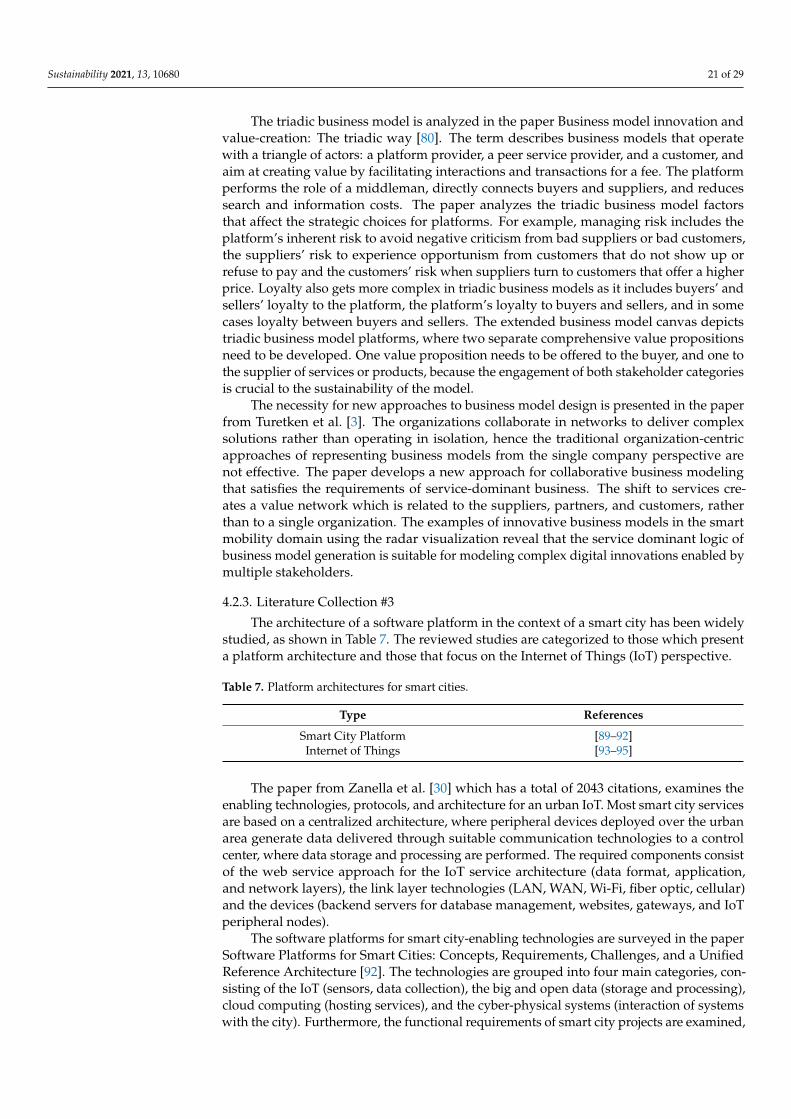
Sustainability 2021, 13, 10680 21 of 29
The triadic business model is analyzed in the paper Business model innovation andvalue-creation: The triadic way [80]. The term describes business models that operatewith a triangle of actors: a platform provider, a peer service provider, and a customer, andaim at creating value by facilitating interactions and transactions for a fee. The platformperforms the role of a middleman, directly connects buyers and suppliers, and reducessearch and information costs. The paper analyzes the triadic business model factorsthat affect the strategic choices for platforms. For example, managing risk includes theplatform’s inherent risk to avoid negative criticism from bad suppliers or bad customers,the suppliers’ risk to experience opportunism from customers that do not show up orrefuse to pay and the customers’ risk when suppliers turn to customers that offer a higherprice. Loyalty also gets more complex in triadic business models as it includes buyers’ andsellers’ loyalty to the platform, the platform’s loyalty to buyers and sellers, and in somecases loyalty between buyers and sellers. The extended business model canvas depictstriadic business model platforms, where two separate comprehensive value propositionsneed to be developed. One value proposition needs to be offered to the buyer, and one tothe supplier of services or products, because the engagement of both stakeholder categoriesis crucial to the sustainability of the model.
The necessity for new approaches to business model design is presented in the paperfrom Turetken et al. [3]. The organizations collaborate in networks to deliver complexsolutions rather than operating in isolation, hence the traditional organization-centricapproaches of representing business models from the single company perspective arenot effective. The paper develops a new approach for collaborative business modelingthat satisfies the requirements of service-dominant business. The shift to services cre-ates a value network which is related to the suppliers, partners, and customers, ratherthan to a single organization. The examples of innovative business models in the smartmobility domain using the radar visualization reveal that the service dominant logic ofbusiness model generation is suitable for modeling complex digital innovations enabled bymultiple stakeholders.
4.2.3. Literature Collection #3
The architecture of a software platform in the context of a smart city has been widelystudied, as shown in Table 7. The reviewed studies are categorized to those which presenta platform architecture and those that focus on the Internet of Things (IoT) perspective.
Table 7. Platform architectures for smart cities.
Type References
Smart City Platform [89–92]Internet of Things [93–95]
The paper from Zanella et al. [30] which has a total of 2043 citations, examines theenabling technologies, protocols, and architecture for an urban IoT. Most smart city servicesare based on a centralized architecture, where peripheral devices deployed over the urbanarea generate data delivered through suitable communication technologies to a controlcenter, where data storage and processing are performed. The required components consistof the web service approach for the IoT service architecture (data format, application,and network layers), the link layer technologies (LAN, WAN, Wi-Fi, fiber optic, cellular)and the devices (backend servers for database management, websites, gateways, and IoTperipheral nodes).
The software platforms for smart city-enabling technologies are surveyed in the paperSoftware Platforms for Smart Cities: Concepts, Requirements, Challenges, and a UnifiedReference Architecture [92]. The technologies are grouped into four main categories, con-sisting of the IoT (sensors, data collection), the big and open data (storage and processing),cloud computing (hosting services), and the cyber-physical systems (interaction of systemswith the city). Furthermore, the functional requirements of smart city projects are examined,
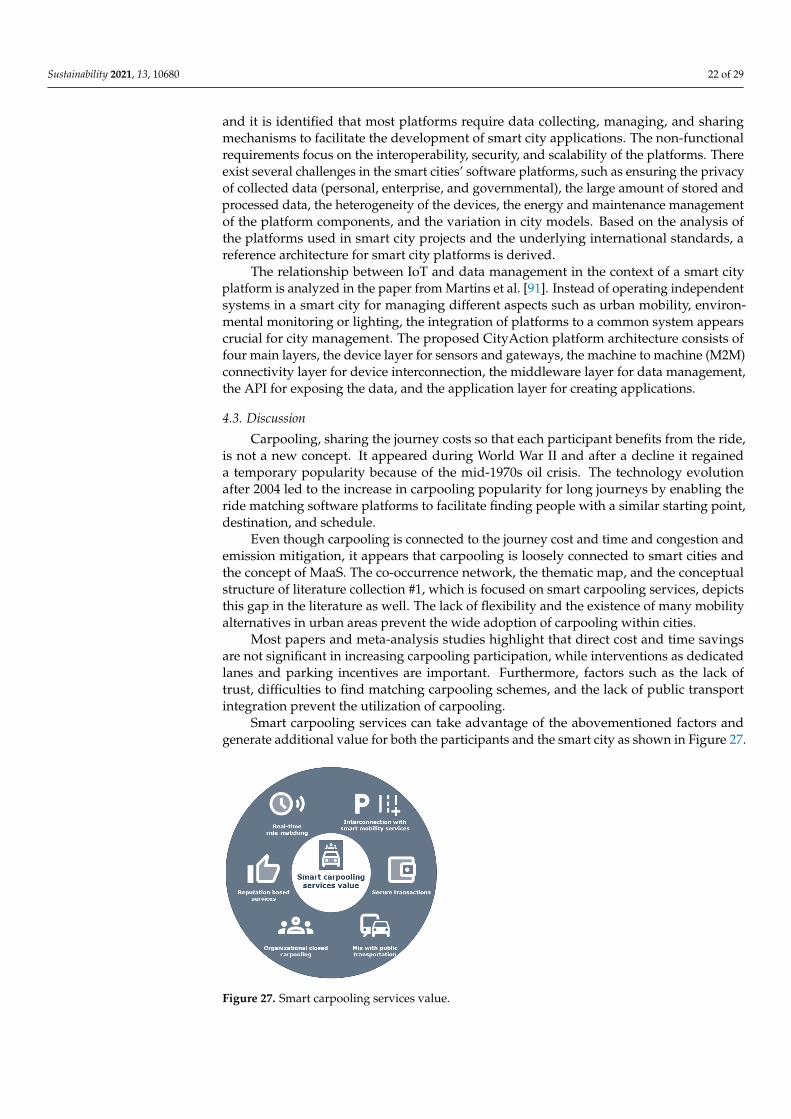
Sustainability 2021, 13, 10680 22 of 29
and it is identified that most platforms require data collecting, managing, and sharingmechanisms to facilitate the development of smart city applications. The non-functionalrequirements focus on the interoperability, security, and scalability of the platforms. Thereexist several challenges in the smart cities’ software platforms, such as ensuring the privacyof collected data (personal, enterprise, and governmental), the large amount of stored andprocessed data, the heterogeneity of the devices, the energy and maintenance managementof the platform components, and the variation in city models. Based on the analysis ofthe platforms used in smart city projects and the underlying international standards, areference architecture for smart city platforms is derived.
The relationship between IoT and data management in the context of a smart cityplatform is analyzed in the paper from Martins et al. [91]. Instead of operating independentsystems in a smart city for managing different aspects such as urban mobility, environ-mental monitoring or lighting, the integration of platforms to a common system appearscrucial for city management. The proposed CityAction platform architecture consists offour main layers, the device layer for sensors and gateways, the machine to machine (M2M)connectivity layer for device interconnection, the middleware layer for data management,the API for exposing the data, and the application layer for creating applications.
4.3. Discussion
Carpooling, sharing the journey costs so that each participant benefits from the ride,is not a new concept. It appeared during World War II and after a decline it regaineda temporary popularity because of the mid-1970s oil crisis. The technology evolutionafter 2004 led to the increase in carpooling popularity for long journeys by enabling theride matching software platforms to facilitate finding people with a similar starting point,destination, and schedule.
Even though carpooling is connected to the journey cost and time and congestion andemission mitigation, it appears that carpooling is loosely connected to smart cities andthe concept of MaaS. The co-occurrence network, the thematic map, and the conceptualstructure of literature collection #1, which is focused on smart carpooling services, depictsthis gap in the literature as well. The lack of flexibility and the existence of many mobilityalternatives in urban areas prevent the wide adoption of carpooling within cities.
Most papers and meta-analysis studies highlight that direct cost and time savingsare not significant in increasing carpooling participation, while interventions as dedicatedlanes and parking incentives are important. Furthermore, factors such as the lack oftrust, difficulties to find matching carpooling schemes, and the lack of public transportintegration prevent the utilization of carpooling.
Smart carpooling services can take advantage of the abovementioned factors andgenerate additional value for both the participants and the smart city as shown in Figure 27.
Sustainability 2021, 13, x FOR PEER REVIEW 24 of 31
Smart carpooling services can take advantage of the abovementioned factors and generate additional value for both the participants and the smart city as shown in Figure 27.
Figure 27. Smart carpooling services value.
The generated value could be enumerated as the following: • Real-time ride matching is more possible as the user base gets larger. This is feasible
by using matching techniques and appropriate processing of the big data stemming from citizen mobility in the context of smart cities.
• The IoT facilitates the interconnection of carpooling vehicles with other smart city mobility services like parking and access to dedicated lanes, which are proven car-pooling incentives.
• Reputation-based services and social networks help improve trust between carpool-ing participants and reduce safety concerns.
• Organizational closed carpooling helps alleviate the inconvenience of traveling with strangers.
• Technologies such as the blockchain enable secure transactions between participants. • Smart transportation and the MaaS concept enable route planning using a mix of car-
pooling and other transportation methods. The BA and the SLR of literature collection #2, which is focused on business models
for platform providers, emphasize the strong connection of the business model to the smart city and reveals the trend for sustainable business models in the context of a shared economy. The traditional approach, of the single organization business model innovation, is not effective for platforms that engage multiple stakeholders in the smart city frame-work. The generated value for multiple sides requires the main BMC building blocks to be examined from multiple angles. The main sides involved in the smart carpooling ser-vice are drivers, passengers, and connected smart city service providers, such as parking and lanes administrators. Based on the value generated from a smart carpooling platform, an indicative BMC for a smart carpooling platform is proposed in Figure 28. The triadic business model representation could also be an appropriate approach, with car owners representing the suppliers and passengers representing the customers, however, in this case, most canvas building blocks would appear similar.
Figure 27. Smart carpooling services value.
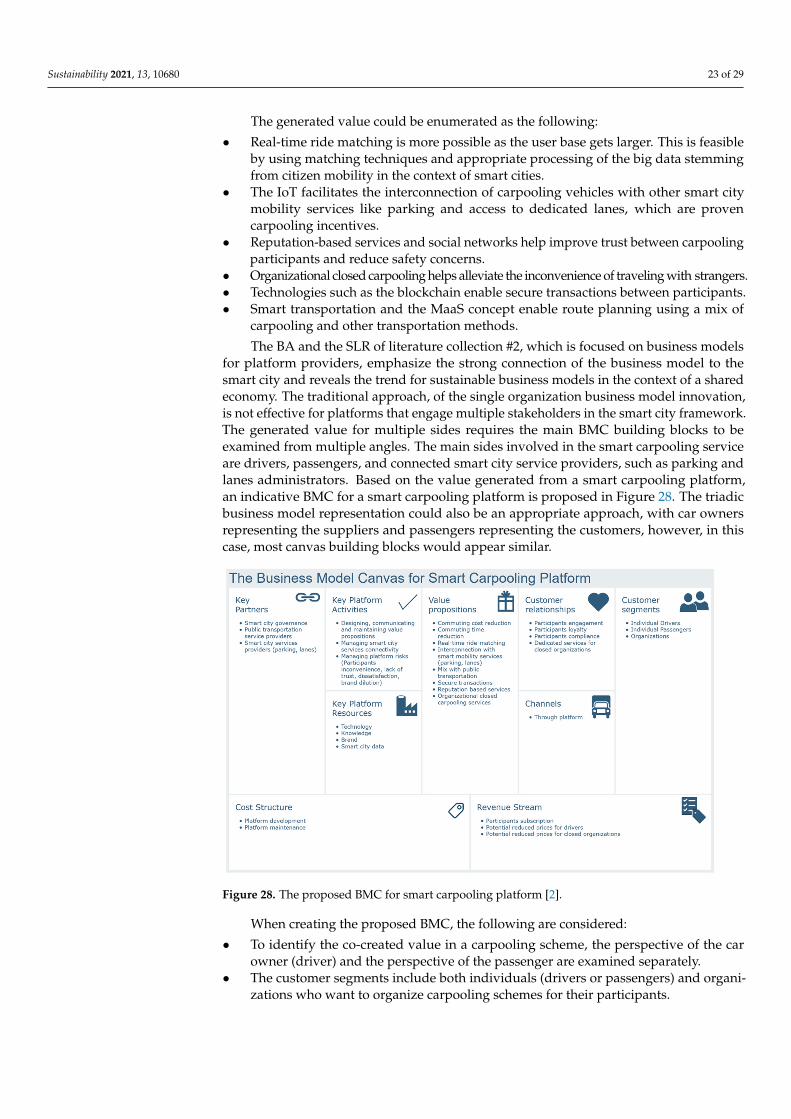
Sustainability 2021, 13, 10680 23 of 29
The generated value could be enumerated as the following:
• Real-time ride matching is more possible as the user base gets larger. This is feasibleby using matching techniques and appropriate processing of the big data stemmingfrom citizen mobility in the context of smart cities.
• The IoT facilitates the interconnection of carpooling vehicles with other smart citymobility services like parking and access to dedicated lanes, which are provencarpooling incentives.
• Reputation-based services and social networks help improve trust between carpoolingparticipants and reduce safety concerns.
• Organizational closed carpooling helps alleviate the inconvenience of traveling with strangers.• Technologies such as the blockchain enable secure transactions between participants.• Smart transportation and the MaaS concept enable route planning using a mix of
carpooling and other transportation methods.
The BA and the SLR of literature collection #2, which is focused on business modelsfor platform providers, emphasize the strong connection of the business model to thesmart city and reveals the trend for sustainable business models in the context of a sharedeconomy. The traditional approach, of the single organization business model innovation,is not effective for platforms that engage multiple stakeholders in the smart city framework.The generated value for multiple sides requires the main BMC building blocks to beexamined from multiple angles. The main sides involved in the smart carpooling serviceare drivers, passengers, and connected smart city service providers, such as parking andlanes administrators. Based on the value generated from a smart carpooling platform,an indicative BMC for a smart carpooling platform is proposed in Figure 28. The triadicbusiness model representation could also be an appropriate approach, with car ownersrepresenting the suppliers and passengers representing the customers, however, in thiscase, most canvas building blocks would appear similar.
Sustainability 2021, 13, x FOR PEER REVIEW 25 of 31
Figure 28. The proposed BMC for smart carpooling platform [2].
When creating the proposed BMC, the following are considered: • To identify the co-created value in a carpooling scheme, the perspective of the car
owner (driver) and the perspective of the passenger are examined separately. • The customer segments include both individuals (drivers or passengers) and organ-
izations who want to organize carpooling schemes for their participants. • The smart city governance and the service providers are considered as partners.
However, the smart city could be a candidate organization who wants to introduce carpooling for the citizens, and, in this case, it should be added to the customer seg-ments.
• The revenue streams must be considered for each customer segment separately, while the participants’ transactions for the trip cost sharing are considered part of the platform operation.
• The risks are added to the key platform activities and must be examined thoroughly for both the platform provider and for the participants. The BA of the literature collection #3 highlights that a carpooling platform in a smart
city context involves multiple technological aspects such as the IoT, cloud computing, the wireless sensor networks, the interoperability, and 5G. The SLR reveals that smart cities, which integrate data from multiple services, share a similar unified architecture at the core, that enables the development of different applications, instead of developing inde-pendent services. This unified structure includes the following layers: • The city infrastructure. • The sensors that collect the data depicting the conditions of the infrastructure. • The connectivity and network services for the data transmission. • The data management, including storage, processing, and sharing. • The applications for end users such as smart city citizens or governance organiza-
tions. In case the smart city follows the abovementioned structure, the smart carpooling
platform may be built as an application on top of the data management layer. However, in case the smart city lacks a unified structure, the platform must integrate directly into the corresponding layer or create any missing layers. The proposed architecture of a smart carpooling platform, which can generate the identified value, is presented in Figure 29.
Figure 28. The proposed BMC for smart carpooling platform [2].
When creating the proposed BMC, the following are considered:
• To identify the co-created value in a carpooling scheme, the perspective of the carowner (driver) and the perspective of the passenger are examined separately.
• The customer segments include both individuals (drivers or passengers) and organi-zations who want to organize carpooling schemes for their participants.
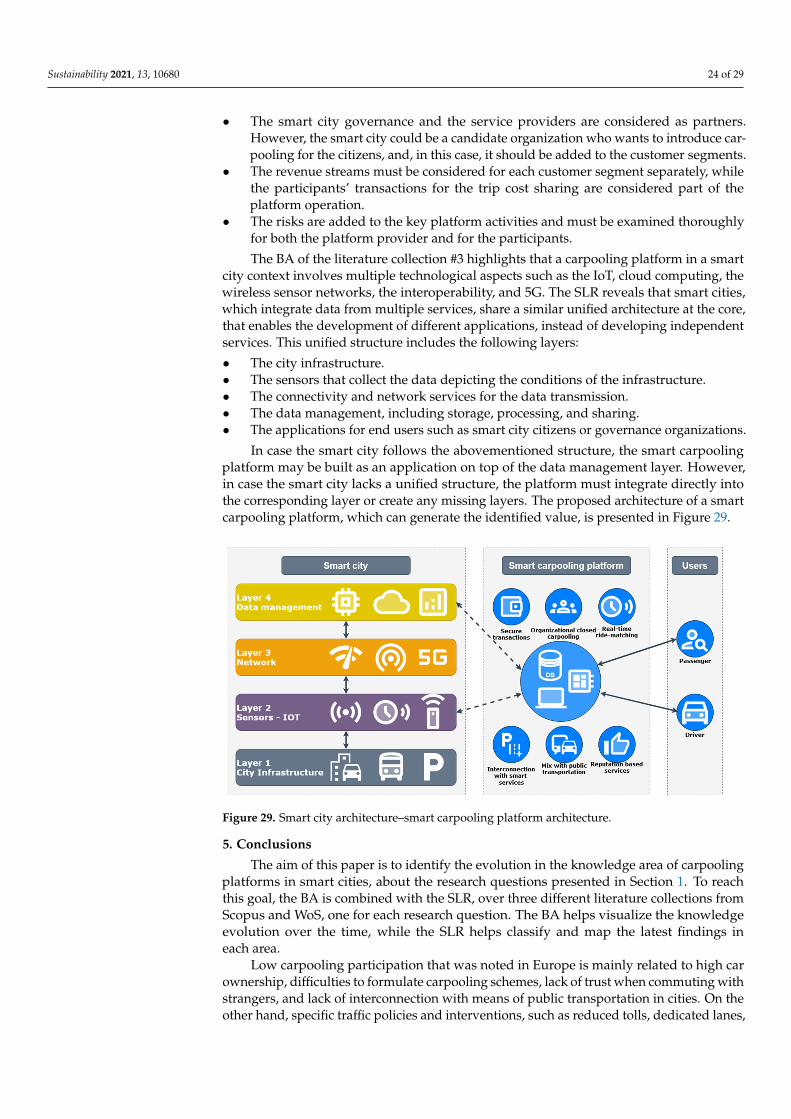
Sustainability 2021, 13, 10680 24 of 29
• The smart city governance and the service providers are considered as partners.However, the smart city could be a candidate organization who wants to introduce car-pooling for the citizens, and, in this case, it should be added to the customer segments.
• The revenue streams must be considered for each customer segment separately, whilethe participants’ transactions for the trip cost sharing are considered part of theplatform operation.
• The risks are added to the key platform activities and must be examined thoroughlyfor both the platform provider and for the participants.
The BA of the literature collection #3 highlights that a carpooling platform in a smartcity context involves multiple technological aspects such as the IoT, cloud computing, thewireless sensor networks, the interoperability, and 5G. The SLR reveals that smart cities,which integrate data from multiple services, share a similar unified architecture at the core,that enables the development of different applications, instead of developing independentservices. This unified structure includes the following layers:
• The city infrastructure.• The sensors that collect the data depicting the conditions of the infrastructure.• The connectivity and network services for the data transmission.• The data management, including storage, processing, and sharing.• The applications for end users such as smart city citizens or governance organizations.
In case the smart city follows the abovementioned structure, the smart carpoolingplatform may be built as an application on top of the data management layer. However,in case the smart city lacks a unified structure, the platform must integrate directly intothe corresponding layer or create any missing layers. The proposed architecture of a smartcarpooling platform, which can generate the identified value, is presented in Figure 29.
Sustainability 2021, 13, x FOR PEER REVIEW 26 of 31
Figure 29. Smart city architecture–smart carpooling platform architecture.
5. Conclusions The aim of this paper is to identify the evolution in the knowledge area of carpooling
platforms in smart cities, about the research questions presented in Section 1. To reach this goal, the BA is combined with the SLR, over three different literature collections from Scopus and WoS, one for each research question. The BA helps visualize the knowledge evolution over the time, while the SLR helps classify and map the latest findings in each area.
Low carpooling participation that was noted in Europe is mainly related to high car ownership, difficulties to formulate carpooling schemes, lack of trust when commuting with strangers, and lack of interconnection with means of public transportation in cities. On the other hand, specific traffic policies and interventions, such as reduced tolls, dedi-cated lanes, or parking spots, tend to increase carpooling. Furthermore, the utilization of ride matching, and route optimization technologies combined with social networks help reduce the barriers for participating in carpooling. Smart carpooling services generate ad-ditional value by enabling real-time ride matching, providing interconnection with city mobility services (tolls, parking) and public transportation, ensuring secure transactions among participants, incorporating reputation services, and offering organization-dedi-cated carpooling.
Smart carpooling services require the existence of a platform to bring together two interdependent groups, the drivers, who are usually the car owners, and the passengers. The success of a platform depends on the existence of many participants on both sides, while certain incentives are required to attract users to each side. Considering the identi-fied proposed value, additional sides appear in the context of a smart city such as the city itself or other organizations. Furthermore, the partner segment may include the city gov-ernance, public transportation, and other service providers. After examining the appro-priate types of business model representations for smart cities platforms, a multi-sided platform BMC is presented, including the value proposition and the other building blocks.
The literature for the smart city platform architectures reveals that most studies share a common structure consisting of specific layers, the infrastructure, the sensors, the net-work, the data management, and the end user applications. This architecture enables the development of applications on top of the data management layer, instead of creating in-dependent services. However, a different approach is required for cities that have not es-tablished a complete architecture. The proposed architecture of a carpooling platform pro-vider integrates the appropriate interactions with the smart city layers, to identify the re-quired direct connections and any missing layers that must be created.
The combination of the BA with the SLR aims to minimize bias and improve the quality of literature data. However, limitations may appear based on the selection of the
Figure 29. Smart city architecture–smart carpooling platform architecture.
5. Conclusions
The aim of this paper is to identify the evolution in the knowledge area of carpoolingplatforms in smart cities, about the research questions presented in Section 1. To reachthis goal, the BA is combined with the SLR, over three different literature collections fromScopus and WoS, one for each research question. The BA helps visualize the knowledgeevolution over the time, while the SLR helps classify and map the latest findings ineach area.
Low carpooling participation that was noted in Europe is mainly related to high carownership, difficulties to formulate carpooling schemes, lack of trust when commuting withstrangers, and lack of interconnection with means of public transportation in cities. On theother hand, specific traffic policies and interventions, such as reduced tolls, dedicated lanes,
Sustainability 2021, 13, 10680 25 of 29
or parking spots, tend to increase carpooling. Furthermore, the utilization of ride matching,and route optimization technologies combined with social networks help reduce the barri-ers for participating in carpooling. Smart carpooling services generate additional value byenabling real-time ride matching, providing interconnection with city mobility services(tolls, parking) and public transportation, ensuring secure transactions among participants,incorporating reputation services, and offering organization-dedicated carpooling.
Smart carpooling services require the existence of a platform to bring together twointerdependent groups, the drivers, who are usually the car owners, and the passengers.The success of a platform depends on the existence of many participants on both sides,while certain incentives are required to attract users to each side. Considering the identifiedproposed value, additional sides appear in the context of a smart city such as the city itselfor other organizations. Furthermore, the partner segment may include the city governance,public transportation, and other service providers. After examining the appropriate typesof business model representations for smart cities platforms, a multi-sided platform BMCis presented, including the value proposition and the other building blocks.
The literature for the smart city platform architectures reveals that most studiesshare a common structure consisting of specific layers, the infrastructure, the sensors, thenetwork, the data management, and the end user applications. This architecture enablesthe development of applications on top of the data management layer, instead of creatingindependent services. However, a different approach is required for cities that have notestablished a complete architecture. The proposed architecture of a carpooling platformprovider integrates the appropriate interactions with the smart city layers, to identify therequired direct connections and any missing layers that must be created.
The combination of the BA with the SLR aims to minimize bias and improve thequality of literature data. However, limitations may appear based on the selection of thedatabases used to export data and the search terms, the decisions in the BA regardingdata cleaning, stemming of the keywords, minimum frequencies of keywords, number ofclusters, minimum appearance in networks, and number of top sources. Furthermore, theselection process of the most important documents for full review is based on qualitativecriteria of relevancy to the research questions which is subject to bias.
To further minimize bias and improve the reproducibility of the combination of theBA with the SLR, the selection of the most important documents for full review may beautomated during data analysis, by applying selection criteria to papers based on a combi-nation of parameters such as number of citations, contribution to cluster formulation, andsimilarity of the thematic areas to the terms used in the title and abstract. Moreover, somefuture thoughts concern the analysis of carpooling usage in different countries and regionsand correlating such performance with the existence and use of corresponding platforms.
Author Contributions: Conceptualization, L.G.A.; methodology, L.G.A. and D.N.T.; software, D.N.T.;validation, L.G.A. and D.N.T.; formal analysis, D.N.T.; investigation, D.N.T.; resources, D.N.T.; datacuration, D.N.T.; writing—original draft preparation, L.G.A. and D.N.T.; writing—review and editing,L.G.A. and D.N.T.; visualization, L.G.A. and D.N.T.; supervision, L.G.A.; project administration,L.G.A.; funding acquisition, L.G.A. Both authors have read and agreed to the published version ofthe manuscript.
Funding: This research received no external funding.
Institutional Review Board Statement: Not applicable.
Informed Consent Statement: Not applicable.
Data Availability Statement: Not applicable.
Acknowledgments: This is the extension of the article published as Leonidas Anthopoulos andDimitrios Tzimos 2021. Carpooling Platforms in Smart Cities for COVID-19 Pandemic: A BibliometricAnalysis. Companion Volume of the Web Conference 2021. Association for Computing Machinery,New York, NY, USA, 661–666. DOI: https://doi.org/10.1145/3442442.3453471 (accessed on 8 Auguest2021) © 2021 International World Wide Web Conference Committee, published under Creative
Sustainability 2021, 13, 10680 26 of 29
Commons CC By 4.0 License. The context of this paper was conceptualized together with Amel Atour,during the workshop on “Digital Innovation and Smart Ecological Services” that was held on 27–28November 2017 in Nice, France at the Smart City Centre lab of the Université Cote d’Azur, CNRS,GREDEG. Moreover, parts of this paper were developed during an MSc Thesis of the PostgraduateProgram in Project and Programme Management at the University of Thessaly, Greece.
Conflicts of Interest: The authors declare no conflict of interest.
References1. Chehabeddine, M.; Tvaronaviciene, M. Securing regional development. Insights Reg. Dev. 2020, 2, 430–442. [CrossRef]2. Anthopoulos, L.; Tzimos, D. Carpooling platforms in smart cities for COVID-19 pandemic: A bibliometric analysis. In Companion
Proceedings of the Web Conference 2021; Association for Computing Machinery: New York, NY, USA, 2021; pp. 661–666. [CrossRef]3. Turetken, O.; Grefen, P.; Gilsing, R.; Adali, O.E. Service-Dominant Business Model Design for Digital Innovation in Smart Mobility.
Bus. Inf. Syst. Eng. 2019, 61, 9–29. [CrossRef]4. Yunus, E.; Susilo, D.; Riyadi, S.; Indrasari, M.; Putranto, T.D. The effectiveness marketing strategy for ride-sharing transportation:
Intersecting social media, technology, and innovation. Entrep. Sustain. Issues 2019, 7, 1424–1434. [CrossRef]5. Giffinger, R.; Fertner, C.; Kramar, H.; Kalasek, R.; Milanovic, N.; Meijers, E. Smart Cities—Ranking of European Medium-Sized Cities;
Vienna University of Technology: Vienna, Austria, 2007.6. Caragliu, A.; Del Bo, C.; Nijkamp, P. Smart Cities in Europe. J. Urban Technol. 2011, 18, 65–82. [CrossRef]7. Anthopoulos, L.; Attour, A. Smart Transportation Applications’ Business Models: A Comparison. In Proceedings of the
Companion Volume of the WWW ’18: The Web Conference 2018, Lyon, France, 23–27 April 2018; International World Wide WebConferences Steering Committee: Geneva, Switzerland, 2018; pp. 927–928. [CrossRef]
8. Guyader, H.; Piscicelli, L. Business model diversification in the sharing economy: The case of GoMore. J. Clean. Prod. 2019, 215,1059–1069. [CrossRef]
9. Mouftah, H.T.; Erol-Kantarci, M. Smart Grid: Networking, Data Management, and Business Models; CRC Press: Boca Raton,FL, USA, 2016.
10. Shaheen, S.A.; Chan, N.D.; Gaynor, T. Casual carpooling in the San Francisco Bay Area: Understanding user characteristics,behaviors, and motivations. Transp. Policy 2016, 51, 165–173. [CrossRef]
11. United States Department Of Transportation. Bureau Of Transportation Statistics. Commute Mode by Percentage; 2019. Availableonline: https://www.bts.gov/commute-mode (accessed on 8 August 2021).
12. Delhomme, P.; Gheorghiu, A. Comparing French carpoolers and non-carpoolers: Which factors contribute the most to carpooling?Transp. Res. Part D Transp. Environ. 2016, 42, 1–15. [CrossRef]
13. Osterwalder, A.; Pigneur, Y.; Clark, T. Business Model Generation: A Handbook for Visionaries, Game Changers, and Challengers; Wiley:Hoboken, NJ, USA, 2010.
14. Montero, J.J. Regulating Transport Platforms: The Case of Carpooling in Europe. In The Governance of Smart Transportation Systems;Finger, M., Audouin, M., Eds.; Springer International Publishing: Cham, Switzerland, 2019; pp. 13–35. [CrossRef]
15. Pritchard, A. Statistical bibliography or bibliometrics? J. Doc. 1969, 25, 348–349.16. Tranfield, D.; Denyer, D.; Smart, P. Towards a Methodology for Developing Evidence-Informed Management Knowledge by
Means of Systematic Review. Br. J. Manag. 2003, 14, 207–222. [CrossRef]17. Aria, M.; Cuccurullo, C. bibliometrix: An R-tool for comprehensive science mapping analysis. J. Informetr. 2017, 11,
959–975. [CrossRef]18. RStudio Team. RStudio: Integrated Development for R. RStudio; PBC: Boston, MA, USA, 2020; Available online: http://www.rstudio.
com/ (accessed on 8 August 2021).19. R Core Team. R: A Language and Environment for Statistical Computing; R Foundation for Statistical Computing: Vienna, Austria,
2017; Available online: https://www.R-project.org/ (accessed on 8 August 2021).20. Moher, D.; Liberati, A.; Tetzlaff, J.; Altman, D.G.; The PRISMA Group. Reprint—Preferred Reporting Items for Systematic
Reviews and Meta-Analyses: The PRISMA Statement. Phys. Ther. 2009, 89, 873–880. [CrossRef]21. Denyer, D.; Tranfield, D. Producing a systematic review. In The Sage Handbook of Organizational Research Methods; SAGE Publications
Ltd.: Thousand Oaks, CA, USA, 2009; pp. 671–689. Available online: https://psycnet.apa.org/record/2010-00924-039 (accessedon 8 August 2021).
22. Kitchenham, B.A.; Charters, S.M. Guidelines for Performing Systematic Literature Reviews in Software Engineering; Technical reportNo. EBSE-2007-01; 2007.
23. Kitchenham, B.A.; Budgen, D.; Brereton, P. Evidence-Based Software Engineering and Systematic Reviews; CRC Press: Boca Raton, FL,USA, 2016.
24. Chapman, K.; Ellinger, A.E. An evaluation of Web of Science, Scopus and Google Scholar citations in operations management. Int.J. Logist. Manag. 2019, 30, 1039–1053. [CrossRef]
25. Koseoglu, M.A. Growth and structure of authorship and co-authorship network in the strategic management realm: Evidencefrom the Strategic Management Journal. BRQ Bus. Res. Q. 2016, 19, 153–170. [CrossRef]
26. Cobo, M.J.; López-Herrera, A.G.; Herrera-Viedma, E.; Herrera, F. An approach for detecting, quantifying, and visualizing theevolution of a research field: A practical application to the Fuzzy Sets Theory field. J. Informetr. 2011, 5, 146–166. [CrossRef]
Sustainability 2021, 13, 10680 27 of 29
27. Dahlgren, J. High occupancy vehicle lanes: Not always more effective than general purpose lanes. Transp. Res. Part A Policy Pract.1998, 32, 99–114. [CrossRef]
28. Monchambert, G. Why do (or don’t) people carpool for long distance trips? A discrete choice experiment in France. Transp. Res.Part A Policy Pract. 2020, 132, 911–931. [CrossRef]
29. Bansal, P.; Kockelman, K.M.; Singh, A. Assessing public opinions of and interest in new vehicle technologies: An Austinperspective. Transp. Res. Part C Emerg. Technol. 2016, 67, 1–14. [CrossRef]
30. Zanella, A.; Bui, N.; Castellani, A.; Vangelista, L.; Zorzi, M. Internet of Things for Smart Cities. IEEE Internet Things J. 2014, 1,22–32. [CrossRef]
31. Teal, R.F. Carpooling: Who, how and why. Transp. Res. Part A Gen. 1987, 21, 203–214. [CrossRef]32. Ferguson, E. The rise and fall of the American carpool: 1970–1990. Transportation 1997, 24, 349–376. [CrossRef]33. Neoh, J.G.; Chipulu, M.; Marshall, A. What encourages people to carpool? An evaluation of factors with meta-analysis.
Transportation 2017, 44, 423–447. [CrossRef]34. Olsson, L.E.; Maier, R.; Friman, M. Why Do They Ride with Others? Meta-Analysis of Factors Influencing Travelers to Carpool.
Sustainability 2019, 11, 2414. [CrossRef]35. Washbrook, K.; Haider, W.; Jaccard, M. Estimating commuter mode choice: A discrete choice analysis of the impact of road
pricing and parking charges. Transportation 2006, 33, 621–639. [CrossRef]36. Librino, F.; Renda, M.E.; Santi, P.; Martelli, F.; Resta, G.; Duarte, F.; Ratti, C.; Zhao, J. Home-work carpooling for social mixing.
Transportation 2020, 47, 2671–2701. [CrossRef]37. Park, Y.; Chen, N.; Akar, G. Who is Interested in Carpooling and Why: The Importance of Individual Characteristics, Role
Preferences and Carpool Markets. Transp. Res. Rec. J. Transp. Res. Board 2018, 2672, 708–718. [CrossRef]38. Bruglieri, M.; Ciccarelli, D.; Colorni, A.; Luè, A. PoliUniPool: A carpooling system for universities. Procedia Soc. Behav. Sci. 2011,
20, 558–567. [CrossRef]39. Wu, M.; Neill, S. Trust transfer and the intention to use app-enabled carpooling service. Asia Pac. J. Mark. Logist. 2020, 33,
1498–1512. [CrossRef]40. Wright, S.; Nelson, J.D.; Cottrill, C.D. MaaS for the suburban market: Incorporating carpooling in the mix. Transp. Res. Part A
Policy Pract. 2020, 131, 206–218. [CrossRef]41. Carrese, S.; Giacchetti, T.; Patella, S.M.; Petrelli, M. Real time ridesharing: Understanding user behavior and policies impact:
Carpooling service case study in Lazio Region, Italy. In Proceedings of the 5th IEEE International Conference on Models andTechnologies for Intelligent Transportation Systems (MT-ITS), Napoli, Italy, 26–28 June 2017; pp. 721–726. [CrossRef]
42. Blumenberg, E.; Smart, M. Brother can you Spare a Ride? Carpooling in Immigrant Neighbourhoods. Urban Stud. 2014, 51,1871–1890. [CrossRef]
43. Correia, G.; Viegas, J.M. Carpooling and carpool clubs: Clarifying concepts and assessing value enhancement possibilities througha Stated Preference web survey in Lisbon, Portugal. Transp. Res. Part A Policy Pract. 2011, 45, 81–90. [CrossRef]
44. Molina, J.A.; Giménez-Nadal, J.I.; Velilla, J. Sustainable Commuting: Results from a Social Approach and International Evidenceon Carpooling. Sustainability 2020, 12, 9587. [CrossRef]
45. Neoh, J.G.; Chipulu, M.; Marshall, A.; Tewkesbury, A. How commuters’ motivations to drive relate to propensity to carpool:Evidence from the United Kingdom and the United States. Transp. Res. Part A Policy Pract. 2018, 110, 128–148. [CrossRef]
46. Canning, P.E.; Hughes, S.J.; Hellawell, E.E.; Gatersleben, B.C.M.; Fairhead, C.J. Reasons for participating in formal employer-ledcarpool schemes as perceived by their users. Transp. Plan. Technol. 2010, 33, 733–745. [CrossRef]
47. Chan, N.D.; Shaheen, S.A. Ridesharing in North America: Past, Present, and Future. Transp. Rev. 2012, 32, 93–112. [CrossRef]48. Ciasullo, M.V.; Troisi, O.; Loia, F.; Maione, G. Carpooling: Travelers’ perceptions from a big data analysis. TQM J. 2018, 30,
554–571. [CrossRef]49. Do, M.; Jung, H. The Socio-Economic Benefits of Sharing Economy: Colleague-Based Carpooling Service in Korea. J. Open Innov.
Technol. Mark. Complex. 2018, 4, 40. [CrossRef]50. Huang, K.; Liu, Z.; Kim, I.; Zhang, Y.; Zhu, T. Analysis of the Influencing Factors of Carpooling Schemes. IEEE Intell. Transp. Syst.
Mag. 2019, 11, 200–208. [CrossRef]51. Kaplowitz, S.A.; Slabosky, A. Trying to Increase Carpooling at a Major U.S. University: A Survey and an Intervention. Sustain. J.
Rec. 2018, 11, 74–80. [CrossRef]52. Li, J.; Embry, P.; Mattingly, S.P.; Sadabadi, K.F.; Rasmidatta, I.; Burris, M.W. Who Chooses to Carpool and Why? Examination of
Texas Carpoolers. Transp. Res. Rec. J. Transp. Res. Board 2007, 2021, 110–117. [CrossRef]53. Liu, X.; Yan, X.; Liu, F.; Wang, R.; Leng, Y. A trip-specific model for fuel saving estimation and subsidy policy making of carpooling
based on empirical data. Appl. Energy 2019, 240, 295–311. [CrossRef]54. Malodia, S.; Singla, H. A study of carpooling behaviour using a stated preference web survey in selected cities of India. Transp.
Plan. Technol. 2016, 39, 538–550. [CrossRef]55. Pinto, G.A.; Vieira, K.C.; Carvalho, E.G.; Sugano, J.Y. Applying the lazy user theory to understand the motivations for choosing
carpooling over public transport. Sustain. Prod. Consum. 2019, 20, 243–252. [CrossRef]56. Li, R.; Liu, Z.; Zhang, R. Studying the benefits of carpooling in an urban area using automatic vehicle identification data. Transp.
Res. Part C Emerg. Technol. 2018, 93, 367–380. [CrossRef]
Sustainability 2021, 13, 10680 28 of 29
57. Kristal, A.S.; Whillans, A.V. What we can learn from five naturalistic field experiments that failed to shift commuter behaviour.Nat. Hum. Behav. 2020, 4, 169–176. [CrossRef] [PubMed]
58. Wu, C.; Shankari, K.; Kamar, E.; Katz, R.; Culler, D.; Papadimitriou, C.; Horvitz, E.; Bayen, A. Optimizing the diamond lane:A more tractable carpool problem and algorithms. In Proceedings of the IEEE 19th International Conference on IntelligentTransportation Systems (ITSC), Rio de Janeiro, Brazil, 1–4 November 2016; pp. 1389–1396. [CrossRef]
59. Wei, X.; Yu, W.; Wang, W.; Zhao, D.; Hua, X. Optimization and Comparative Analysis of Traffic Restriction Policy by JointlyConsidering Carpool Exemptions. Sustainability 2020, 12, 7734. [CrossRef]
60. Minett, P.; Niles, J.; Lee, R.; Bogue, B.; Schaefer, M.D. Congestion-clearing payments to passengers. Transp. Res. Procedia 2020, 45,668–675. [CrossRef]
61. Hughes, J.E.; Kaffine, D. When should drivers be encouraged to carpool in hov lanes? Carpooling in hov lanes. Econ. Inq. 2019,57, 667–684. [CrossRef]
62. Banerjee, D.; Srivastava, B. Promoting Carpooling with Distributed Schedule Coordination and Incentive Alignment of Contacts.In Proceedings of the IEEE 18th International Conference on Intelligent Transportation Systems, Washington, DC, USA, 15–18September 2015; pp. 1837–1842. [CrossRef]
63. Burris, M.; Alemazkoor, N.; Benz, R.; Wood, N.S. The impact of HOT lanes on carpools. Res. Transp. Econ. 2014, 44,43–51. [CrossRef]
64. Arellano-Verdejo, J.; Alonso-Pecina, F.; Alba, E.; Guzmán Arenas, A. Optimal allocation of public parking spots in a smart city:Problem characterisation and first algorithms. J. Exp. Theor. Artif. Intell. 2019, 31, 575–597. [CrossRef]
65. Shen, T.; Hua, K.; Liu, J. Optimized Public Parking Location Modelling for Green Intelligent Transportation System Using GeneticAlgorithms. IEEE Access 2019, 7, 176870–176883. [CrossRef]
66. Liu, X.; Titheridge, H.; Yan, X.; Wang, R.; Tan, W.; Chen, D.; Zhang, J. A passenger-to-driver matching model for commutercarpooling: Case study and sensitivity analysis. Transp. Res. Part C Emerg. Technol. 2020, 117, 102702. [CrossRef]
67. Xiao, Q.; He, R.; Ma, C.; Zhang, W. Evaluation of urban taxi-carpooling matching schemes based on entropy weight fuzzymatter-element. Appl. Soft Comput. 2019, 81, 105493. [CrossRef]
68. Chen, W.; Mes, M.; Schutten, M.; Quint, J. A Ride-Sharing Problem with Meeting Points and Return Restrictions. Transp. Sci. 2019,53, 401–426. [CrossRef]
69. Zhang, W.; He, R.; Chen, Y.; Gao, M.; Ma, C. Research on Taxi Pricing Model and Optimization for Carpooling Detour Problem. J.Adv. Transp. 2019, 2019, 1–11. [CrossRef]
70. Jamal, J.; Rizzoli, A.E.; Montemanni, R.; Huber, D. Tour Planning and Ride Matching for an Urban Social Carpooling Service.MATEC Web Conf. 2016, 81, 04010. [CrossRef]
71. Hsieh, F.-S.; Zhan, F.-M.; Guo, Y.-H. A solution methodology for carpooling systems based on double auctions and cooperativecoevolutionary particle swarms. Appl. Intell. 2019, 49, 741–763. [CrossRef]
72. Huang, S.-C.; Jiau, M.-K.; Liu, Y.-P. An Ant Path-Oriented Carpooling Allocation Approach to Optimize the Carpool ServiceProblem with Time Windows. IEEE Syst. J. 2019, 13, 994–1005. [CrossRef]
73. Jadhao, R.B.; Patil, J.M. Recommendation system for carpooling and regular taxicab services. In Proceedings of the InternationalConference on Inventive Systems and Control (ICISC), Coimbatore, India, 19–20 January 2017; pp. 1–8. [CrossRef]
74. Jiang, S.; Chen, W.; Li, Z.; Yu, H. Short-Term Demand Prediction Method for Online Car-Hailing Services Based on a Least SquaresSupport Vector Machine. IEEE Access 2019, 7, 11882–11891. [CrossRef]
75. Tafreshian, A.; Masoud, N.; Yin, Y. Frontiers in Service Science: Ride Matching for Peer-to-Peer Ride Sharing: A Review andFuture Directions. Serv. Sci. 2020, 12, 44–60. [CrossRef]
76. Xia, J.; Curtin, K.M.; Li, W.; Zhao, Y. A New Model for a Carpool Matching Service. PLoS ONE 2015, 10, e0129257. [CrossRef]77. Xia, X.; Liu, H.; Li, J.; Liu, X.; Zhu, R.; Zong, C. Carpooling Algorithm with the Common Departure. In Proceedings of the
IEEE International Conferences on Ubiquitous Computing & Communications (IUCC) and Data Science and ComputationalIntelligence (DSCI) and Smart Computing, Networking and Services (SmartCNS), Shenyang, China, 21–23 October 2019;pp. 513–520. [CrossRef]
78. Zhang, D.; Li, Y.; Zhang, F.; Lu, M.; Liu, Y.; He, T. coRide: Carpool service with a win-win fare model for large-scale taxicabnetworks. In Proceedings of the 11th ACM Conference on Embedded Networked Sensor Systems—SenSys ’13, Rome, Italy,11–15 November 2013; pp. 1–14. [CrossRef]
79. Andreassen, T.W.; Lervik-Olsen, L.; Snyder, H.; Van Riel, A.C.R.; Sweeney, J.C.; Van Vaerenbergh, Y. Business model innovationand value-creation: The triadic way. J. Serv. Manag. 2018, 29, 883–906. [CrossRef]
80. Díaz-Díaz, R.; Muñoz, L.; Pérez-González, D. The Business Model Evaluation Tool for Smart Cities: Application to SmartSantander Use Cases. Energies 2017, 10, 262. [CrossRef]
81. Díaz-Díaz, R.; Muñoz, L.; Pérez-González, D. Business model analysis of public services operating in the smart city ecosystem:The case of SmartSantander. Future Gener. Comput. Syst. 2017, 76, 198–214. [CrossRef]
82. Timeus, K.; Vinaixa, J.; Pardo-Bosch, F. Creating business models for smart cities: A practical framework. Public Manag. Rev. 2020,22, 726–745. [CrossRef]
83. Abbate, T.; Cesaroni, F.; Cinici, M.C.; Villari, M. Business models for developing smart cities. A fuzzy set qualitative comparativeanalysis of an IoT platform. Technol. Forecast. Soc. Chang. 2019, 142, 183–193. [CrossRef]
Sustainability 2021, 13, 10680 29 of 29
84. Anthopoulos, L.; Fitsilis, P.; Ziozias, C. What is the Source of Smart City Value? A Business Model Analysis. Int. J. Electron. Gov.Res. 2016, 12, 56–76. [CrossRef]
85. Walravens, N. Qualitative indicators for smart city business models: The case of mobile services and applications. Telecommun.Policy 2015, 39, 218–240. [CrossRef]
86. Walravens, N.; Ballon, P. Platform business models for smart cities: From control and value to governance and public value. IEEECommun. Mag. 2013, 51, 72–79. [CrossRef]
87. Walravens, N. Mobile Business and the Smart City: Developing a Business Model Framework to Include Public Design Parametersfor Mobile City Services. J. Theor. Appl. Electron. Commer. Res. 2012, 7, 21–22. [CrossRef]
88. Callon, M.; Courtial, J.-P.; Turner, W.A.; Bauin, S. From translations to problematic networks: An introduction to co-word analysis.Soc. Sci. Inf. 1983, 22, 191–235. [CrossRef]
89. Mulligan, C.E.; Olsson, M. Architectural implications of smart city business models: An evolutionary perspective. IEEE Commun.Mag. 2013, 51, 80–85. [CrossRef]
90. Badii, C.; Bellini, P.; Difino, A.; Nesi, P. Sii-Mobility: An IoT/IoE Architecture to Enhance Smart City Mobility and TransportationServices. Sensors 2018, 19, 1. [CrossRef] [PubMed]
91. Martins, P.; Albuquerque, D.; Wanzeller, C.; Caldeira, F.; Tomé, P.; Sá, F. CityAction a Smart-City Platform Architecture. InAdvances in Information and Communication; Arai, K., Bhatia, R., Eds.; Springer International Publishing: Cham, Switzerland, 2020;Volume 69, pp. 217–236. [CrossRef]
92. Pop, E.; Puscoci, S. Considerations Regarding E-services development platforms for Smart Cities. In Proceedings of the 12thInternational Conference on Electronics, Computers and Artificial Intelligence (ECAI), Bucharest, Romania, 25–27 June 2020; pp.1–5. [CrossRef]
93. Santana, E.F.Z.; Chaves, A.P.; Gerosa, M.A.; Kon, F.; Milojicic, D.S. Software Platforms for Smart Cities: Concepts, Requirements,Challenges, and a Unified Reference Architecture. ACM Comput. Surv. 2018, 50, 1–37. [CrossRef]
94. Abreu, D.P.; Velasquez, K.; Curado, M.; Monteiro, E. A resilient Internet of Things architecture for smart cities. Ann. Telecommun.2017, 72, 19–30. [CrossRef]
95. Sanchez, L.; Muñoz, L.; Galache, J.A.; Sotres, P.; Santana, J.R.; Gutierrez, V.; Ramdhany, R.; Gluhak, A.; Krco, S.;Theodoridis, E.; et al. SmartSantander: IoT experimentation over a smart city testbed. Comput. Netw. 2014, 61, 217–238.[CrossRef]