CARLSON-THESIS-2017.pdf - Scholarly Works @ SHSU
37
INFLUENCE OF AMBIENT TEMPERATURE AND RELATIVE HUMIDITY ON YOUNG PERFORMANCE HORSES _____________ A Thesis Presented to The Faculty of the Department of Agricultural Sciences and Engineering Technology Sam Houston State University _____________ In Partial Fulfillment of the Requirements for the Degree of Master of Science _____________ by Kelly S. Carlson May, 2017
-
Upload
khangminh22 -
Category
Documents
-
view
4 -
download
0
Transcript of CARLSON-THESIS-2017.pdf - Scholarly Works @ SHSU

INFLUENCE OF AMBIENT TEMPERATURE AND RELATIVE HUMIDITY ON YOUNG
PERFORMANCE HORSES
_____________
A Thesis
Presented to
The Faculty of the Department of Agricultural Sciences and Engineering Technology
Sam Houston State University
_____________
In Partial Fulfillment
of the Requirements for the Degree of
Master of Science
_____________
by
Kelly S. Carlson
May, 2017

INFLUENCE OF AMBIENT TEMPERATURE AND RELATIVE HUMIDITY ON YOUNG
PERFORMANCE HORSES
by
Kelly S. Carlson
______________
APPROVED: Kyle Stutts, PhD Thesis Director Jessica Leatherwood, PhD Committee Member Mark Anderson, PhD Committee Member John Pascarella, PhD Dean, College of Science and Engineering Technology

iii
DEDICATION
I would like to dedicate this to my mother and father, for all their time, money,
and energy spent on me. They taught me to never give up, even when times get rough,
and to chase my dreams no matter what. I am forever grateful for their encouragement
and guidance throughout everything I endure in life.
iv
ABSTRACT
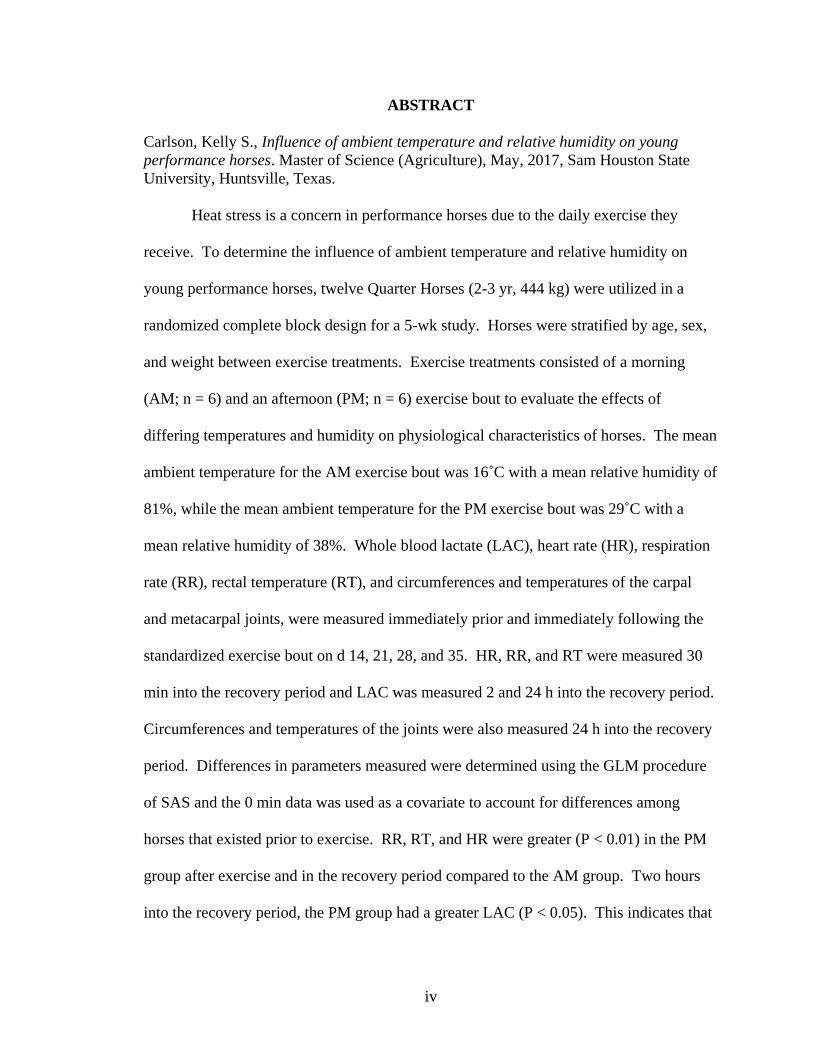
Carlson, Kelly S., Influence of ambient temperature and relative humidity on young performance horses. Master of Science (Agriculture), May, 2017, Sam Houston State University, Huntsville, Texas.
Heat stress is a concern in performance horses due to the daily exercise they
receive. To determine the influence of ambient temperature and relative humidity on
young performance horses, twelve Quarter Horses (2-3 yr, 444 kg) were utilized in a
randomized complete block design for a 5-wk study. Horses were stratified by age, sex,
and weight between exercise treatments. Exercise treatments consisted of a morning
(AM; n = 6) and an afternoon (PM; n = 6) exercise bout to evaluate the effects of
differing temperatures and humidity on physiological characteristics of horses. The mean
ambient temperature for the AM exercise bout was 16˚C with a mean relative humidity of
81%, while the mean ambient temperature for the PM exercise bout was 29˚C with a
mean relative humidity of 38%. Whole blood lactate (LAC), heart rate (HR), respiration
rate (RR), rectal temperature (RT), and circumferences and temperatures of the carpal
and metacarpal joints, were measured immediately prior and immediately following the
standardized exercise bout on d 14, 21, 28, and 35. HR, RR, and RT were measured 30
min into the recovery period and LAC was measured 2 and 24 h into the recovery period.
Circumferences and temperatures of the joints were also measured 24 h into the recovery
period. Differences in parameters measured were determined using the GLM procedure
of SAS and the 0 min data was used as a covariate to account for differences among
horses that existed prior to exercise. RR, RT, and HR were greater (P < 0.01) in the PM
group after exercise and in the recovery period compared to the AM group. Two hours
into the recovery period, the PM group had a greater LAC (P < 0.05). This indicates that
v
the horses may have had an impaired ability to dissipate heat during the recovery period
due to the higher ambient temperatures. Understanding the physiological responses of
horses during recovery at different ambient temperatures, may enable industry
professionals to modify daily exercise regimens to allow the equine athlete to perform at
their full potential and prevent injury or harm to the animal.
KEY WORDS: Equine, Exercise, Heat stress, Lactate, Inflammation

vi
ACKNOWLEDGEMENTS
I would like to thank my committee chair, Dr. Kyle J. Stutts, for being extremely
patient with me while working on this thesis and throughout my graduate career. He has
been a large part in my growth at Sam Houston State University.
I would also like to express gratitude and appreciation toward Dr. Jessica L.
Leatherwood for her endless support toward this research project as well as throughout
my college and graduate endeavors. I would also like to thank Dr. Mark J. Anderson, for
his contribution to this research. Their guidance and dedication to this project was most
valued.
I would also like to recognize the Sam Houston State University College of
Sciences Dean, Dr. John B. Pascarella, the Dean of Graduate Studies, Dr. Kenneth E.
Hendrickson, and the Chair of the Department of Agricultural Sciences and Engineering
Technology, Dr. Stanley F. Kelley for facilitating my research.
Finally, I would like to thank my friends, fellow graduate students, student
workers, and the students of the Equine Behavior and Training class for their help with
my research. I am grateful for their assistance and support throughout the entire research
project.

vii
TABLE OF CONTENTS
Page
DEDICATION ................................................................................................................... iii
ABSTRACT ....................................................................................................................... iv
ACKNOWLEDGEMENTS ............................................................................................... vi
TABLE OF CONTENTS .................................................................................................. vii
LIST OF TABLES ........................................................................................................... viii
CHAPTER
I INTRODUCTION AND LITERATURE REVIEW .............................................. 1
II MATERIALS AND METHODS ............................................................................ 7
III RESULTS ............................................................................................................. 11
IV DISCUSSION ....................................................................................................... 19
REFERENCES ................................................................................................................. 23
VITA ................................................................................................................................. 26

viii
LIST OF TABLES
Table Page
1 Mean heart rate (bpm) of horses obtained using a heart rate monitor (Polar
USA) before and after completing a standardized exercise test (SET) and in
the recovery period following the SET. ................................................................ 11
2 Mean respiration rate (bpm) of horses before and after completing a
standardized exercise test (SET) and in the recovery period following the
SET. ...................................................................................................................... 12
3 Mean rectal temperature (˚C) of horses before and after completing a
standardized exercise test (SET) and in the recovery period following the
SET. ...................................................................................................................... 13
4 Mean whole blood lactate (mMol/L) of horses measured using a portable
lactate analyzer prior to the standardized exercise test (SET), immediately
following the SET, 2 h into the recovery period, and 24 h into the recovery
period by exercise group. ...................................................................................... 13
5 Mean lactate dehydrogenase concentration (U/L) of horses prior to the
standardized exercise test (SET), immediately following the SET, 2 h into the
recovery period, and 24 h into the recovery period by exercise group. ................ 14
6 Mean joint circumferences of the front and rear carpal and metacarpal joints
in horses prior to the standardized exercise test (SET) and immediately
following the SET by exercise group. ................................................................... 15
7 Mean joint circumferences of the front and rear carpal and metacarpal joints
in horses prior to the standardized exercise test (SET), immediately following

ix
the SET, and after application of TuffRock Poultice (treatment) to the joints
of the left limbs for 24 h. ...................................................................................... 16
8 Mean temperature as determined by a thermal imaging camera (FLIR
Systems; Wilsonville, OR) of the front and rear carpal and metacarpal joints
in horses prior to the standardized exercise test (SET), immediately following
the SET, and after application of TuffRock Poulice (treatment) onto the joints
of the left limbs for 24 h. ...................................................................................... 17
1
CHAPTER I
INTRODUCTION AND LITERATURE REVIEW
Introduction
In recent years, equine futurities have awarded over $10 million each year to
young performance horses, predominately in Texas. Texas is home to more than 1
million horses, with the total impact of the horse industry exceeding $11 billion annually.
The pressure placed on the young equine athlete has resulted in problems related to
fatigue. Problems such as heat stress, loss of stamina, and injury have become a serious
concern among trainers. Insufficient attention has been given to the young performance
horse’s training programs without the use of a treadmill in a controlled environment. In
recent studies, controlled environments have been used to determine proper training
programs to simulate the exercise protocol (Linder et al., 2010; Rammerstorfer et al.,
1997).
Training of the young performance horse does not usually occur in a controlled
environment. The development of daily training strategies under low temperatures and
high humidity may prevent or delay the career ending injuries in the young equine. Heat
production associated with strenuous exercise must be matched by adequate heat
dissipation or it can result in life-threating hyperthermia. This balance is accomplished
by different mechanisms depending on species. A particular problem for horses when
compared to humans is that horses are capable of prolonged exercise at higher metabolic
rates, but have a lower surface area to mass ratio (Hodgson et al., 1993). Characterizing
physiological responses of horses to exercise regimens can help the trainer prepare the
equine athlete to perform at their full potential. Physiological responses to training are

2
not well understood by trainers, veterinarians, or horse owners (Rammerstorfer et al.,
1997). Therefore, investigation of physiological responses will benefit the equine
industry at both the basic scientific and applied levels.
This research has significant relevance to the health and well-being of all horses
entering performance training. Previous literature has focused on mature exercising
horses in controlled environmental conditions. However, demonstrating the effects of
ambient temperature and relative humidity within a common training environment can
provide valuable recommendations to industry professionals and veterinarians. Being
able to assist in preparing the equine athlete to perform to their potential in competitive
events can give them an edge in competition. This study provides the initial data to
establish an exercise model to alter physiological responses and has the potential to be the
standard method to exercise horses in the future.
Literature Review
Previous studies have demonstrated the effects of ambient temperature and
humidity on thermoregulatory responses in a laboratory setting, with exercise tests
conducted utilizing a temperature-controlled environment and a high speed treadmill
(Williams et al., 2002). Exercise conducted on an indoor treadmill may not always
reflect the outdoor environment, where horses train daily and compete (Hargreaves et al.,
1999). Indoor studies have not evaluated the effect of radiant heat load during exercise or
the loss of the cooling surface area due to the saddle and saddle pads which may
adversely affect thermoregulation (Foreman et al., 1995). In addition, the cooling effect
of the horse moving through the air in contrast to fans in front of the treadmill, as well as
the effects of the terrain, can influence the physiological response (Geor et al., 1996).

3
Athletic performance testing in horses is usually based upon testing in human athletic
performance. Human athletes perform a series of monitored tests to best find an exercise
protocol to fit that individual. This is now mimicked in the equine industry to find an
exercise approach to each workout (Allen et al, 2016). However, no testing has focused
significantly on how temperature and humidity play a role in the exercise bout. It is
important that horses be evaluated in a training setting taking into account some or all of
these factors in order to complement laboratory experiments.
Thermoregulation may limit exercise performance under hot and humid
conditions. Hargreaves at al. (1999) reported increased packed cell volume, heart rate,
respiratory rate, and total protein in mature horses in hot (31.3 ± 0.9°C), humid (67 ± 3%)
conditions when compared to cool (17.6 ± 0.4°C), dry (47 ± 3%) conditions. Research
conducted in humans concerning the response of exercising in hot, humid conditions has
indicated increases in plasma packed cell volume, increased body temperature at rest and
during exercise, increased exercising heart rate, improved skin blood flow, an increased
stroke volume, lowered distribution of cardiac output between skin and muscle capillary
beds, and lowered threshold for onset of sweating (Art and Lekeux, 1995; Marlin et al.,
1999). The effects of exercise and heat stress together place the cardiovascular and
thermoregulatory systems under severe pressure (Williams et al., 2002). This causes the
thermoregulatory systems of the body to adapt to surrounding environmental conditions.
However, rapid transition in extreme environments must result in an acclimation response
which would allow the horse to cope with the changing conditions (Marlin et al., 1999).
In contrast, data is limited concerning the acclimation effects of young horses to high
ambient temperatures and humidity. Human acclimation involves physiological and
4
biochemical adaptations, while acclimation of horses appears to result in a progressive
reduction in thermal and cardiovascular demands (Geor et al., 1996; Marlin et al., 1999).
Exercise can be associated with an increase in blood lactate concentrations in
horses, as it is used regularly to assess the level of fitness in the sport horse (Harris and
Snow, 1992). The anaerobic threshold is supposed to identify the maximal intensity of
exercise and the intensity to achieve maximum lactate is believed to be optimal to
improve endurance in horses (Linder, 2010). It is well documented that blood lactate is
dependent on factors such as intensity, duration, and frequency of exercise (Lindner et
al., 2009). According to Harris and Snow (1992) blood lactate concentration will peak at
the end of exercise. Lactate concentrations range from 0.5-1 mMol/L at rest and,
depending on the exercise, can reach 2-4 mMol/L. The anaerobic threshold of blood
lactate frequently used is 4 mMol/L. Some racehorses have been noted to reach up to 10
mMol/L. After the anaerobic threshold is reached, lactate production increases and is
harder to remove (Allen et al, 2016). However, studies comparing blood lactate
concentrations to environmental conditions relating to thermoregulatory responses are
scarce.
Heart rate, respiration rate, and rectal temperature are key indicators of the impact
of exercise performance. Vitals in equines increase due to heat load and
cardiorespiratory demands on the animal. Heart rate and respiration rate indicate the
fitness of the animal as well as the intensity of the exercise they are performing.
Repeated measurements of these vitals can determine an increase in fitness during a
training program (Allen et al, 2016). Rectal temperature at rest or before exercise should
be 37.5˚C to 38.6˚C. When temperatures are significantly greater than that after exercise
5
there is an indicator of heat stress on the horse. This may also be a sign of a longer and
more intense recovery period.
Inflammation in equine can be an indication of the recovery status from exercise.
This inflammation could be due to the intensity of the exercise or soft tissue damage from
the training program. Inflammation can appear in as little as minutes after exercise, but
could take up to 24h to be evident. An injured joint can be protected by inflammation to
start the healing process. Taking circumference measurements of the joints in all four
limbs is an easy and noninvasive indicator of inflammation. A better understanding of
why there is inflammation after exercise or in recovery can help us make better training
programs to fit each individual horse.
Previous work has demonstrated ambient temperature and relative humidity
influence common physiological parameters associated with exercise (Lindinger et
al.,1995). However, studies are limited in evaluating young horses in actual training
conditions rather than in a laboratory setting. In addition, mean ambient temperatures in
prior studies have ranged from 31.3-33 °C with a mean relative humidity of 46%. Local
ambient temperatures (Huntsville, TX) range from 19 °C with a mean relative humidity
of 90% during the morning to a temperature of 35 °C with a mean relative humidity of
30% in the afternoon during the spring and summer months. Therefore, not only will this
study provide information relating to an exercising protocol for different combinations of
temperature and humidity, but it will also provide information relating to heat stress in
the equine athlete. This study will also provide enough information to provide equine
athlete trainers proper knowledge of when to exercise their horses to minimize the effects
of heat stress.

6
Objectives
The long term goal of our work is to elucidate potential dietary strategies that can
be utilized to improve energetic efficiency in young horses in training. The immediate
goals of this research were to characterize thermal and cardiorespiratory responses of
young horses to submaximal exercise under different combinations of temperature and
humidity, and to investigate the physiological response to exercise and recovery
following an exercise protocol by quantification of plasma lactate. Lastly, we will
examine heat related stress during exercise by utilizing blood lactate concentration as an
indicator.

7
CHAPTER II
MATERIALS AND METHODS
All care, handling, and sampling of horses was approved by the Sam Houston
State University Institutional Animal Care and Use Committee (Protocol Number: 16-04-
06-1027-3-01).
Twelve clinically healthy 2- and 3-year-old Quarter Horses were utilized in a
randomized complete block design for a 5-wk study. Horses were stratified by age, sex,
and BW between exercise treatments. Exercise treatments consisted of a morning (AM;
n = 6) and an afternoon (PM; n = 6) exercise bout in order to evaluate the effects of
differing temperatures and relative humidity. This study was conducted in conjunction
with the Equine Behavior and Training Course (EQSC 4391). Horses were housed in
individual 3 x 3 m stalls with ad libitum access to water and fed a diet consisting of a
commercial pelleted concentrate (Cargill Inc., Minneapolis, MN) and coastal
Bermudagrass hay formulated to meet nutritional requirements for young horses in
training.
Horses were subjected to a pretrial exercise regimen (d 0-13) to establish a
baseline physiological response as well as to standardize the level of fitness across
experimental units. The pretrial regimen consisted of a thirty-minute aerobic (heart rate
below 150 bpm) workout during the EQSC 4391 class time (1300 h) in the Priefert 6
Horse Free Walker (Priefert, Mount Pleasant, TX). On d 14, 21, 28, and 35 the exercise
protocol consisted of an anaerobic (heart rate above 150 bpm) AM and PM workout. On
all other days of the study the horses were exercised at an aerobic pace for 1 h during the
Equine Behavior and Training Course (EQSC 4391). The horses were subjected to this

8
exercise bout once per week for 4 consecutive wk after the adaptation period, and each
wk, horses were rotated from the AM to PM exercise bout and from the PM to AM
exercise bout. This schedule allowed the horses to experience the AM workout twice and
the PM workout twice during the 4-wk period to account for differences in the ambient
temperature and relative humidity. During the exercise bouts, horses were equipped with
on-board heart rate monitors (Polar USA, Lake Success, NY) to evaluate intensity of
exercise, speed, and distance traveled. All exercise was conducted at the SHSU Indoor
Riding Facility (Huntsville, TX) in a Priefert 6 Horse Free Walker with a diameter of
22.05 m.
On d 14, 21, 28, and 35, horses in both the AM and PM groups were subjected to
a standardized exercise test (SET) to put the horses in an anaerobic physiological state.
The SET began with a 2 min walk at 5.6 km/h, traveling to the left and then right for 1
min each. Then, the horses completed a 3 min trot at 11.3 km/h, traveling to the left and
then right for 1.5 min each. Next, the horses began a 5 min extended trot at 16.9 km/h,
traveling to the left and then right for 2.5 min each. The horses then sped up to a 10 min
lope at 20.9 km/h, traveling to the left and then right for 5 min each. Lastly, the horses
ended with a 10 min extended lope at 24.1 km/h, traveling to the left and then right for 5
min each. Every week the SET increased by 1 min per gait, for a total of 5 additional
min, to account for any increase in fitness level in the horses.
Respiration rate and rectal temperature were collected prior to and immediately
following the SET, as well as 30 min after the SET in the recovery period. Heart rate was
collected prior to and following the SET, as well as during the SET at 2 min, 4 min, 6
min, 12 min, 18 min, and 24 min. Heart rate was also collected at 30 min after the SET

9
in the recovery period. Heart rate and respiration rate were taken by the same technician
each week during the study. Lastly, blood samples were obtained via jugular
venipuncture immediately before and after the SET, as well as at 2 and 24 h into the
recovery period. Plasma lactate was determined at baseline and during exercise utilizing
a portable lactate analyzer (Lactate Plus, Sport Resource Group Inc, Minneapolis MN)
and samples were also stored at -20 °C for later lactate dehydrogenase analysis by a
certified laboratory (Texas Veterinary Medical Diagnostic Laboratory, College Station,
TX).
To evaluate inflammation in the joints due to exercise, circumference and
temperature of the carpal and metacarpal joints were measured prior to and immediately
following the SET. Circumference was measured with a soft tape measure and
temperature was measured using a FLIR thermal imaging camera on all four limbs.
Immediately following the measurements taken after the SET, TuffRock Poultice
(TuffRock Pty Limited, Weston NSW, Australia) was applied to left limbs of all horses
completely covering the carpal and metacarpal joints. The poultice was applied by the
same person each week of the study to be sure the application was consistent. The
TuffRock Poultice remained on the horses’ limbs for 24h after application. The poultice
was then brushed off the limbs and measurements of the carpal and metacarpal joints
were obtained with a soft tape measure and the FLIR thermal imaging camera on all four
limbs.
Statistical Analysis
The GLM procedure of SAS was used to determine differences in the onset values
(before exercise) between the AM and PM groups. For measurements obtained after the

10
standardized exercise test, the GLM procedure in SAS was used with the corresponding
onset value (before exercise) as a covariate to account for differences in initial heat load
prior to exercise. For the measurements comparing the inflammation in limbs, the GLM
procedure in SAS was used to determine differences in the limb over time.
11
CHAPTER III
RESULTS
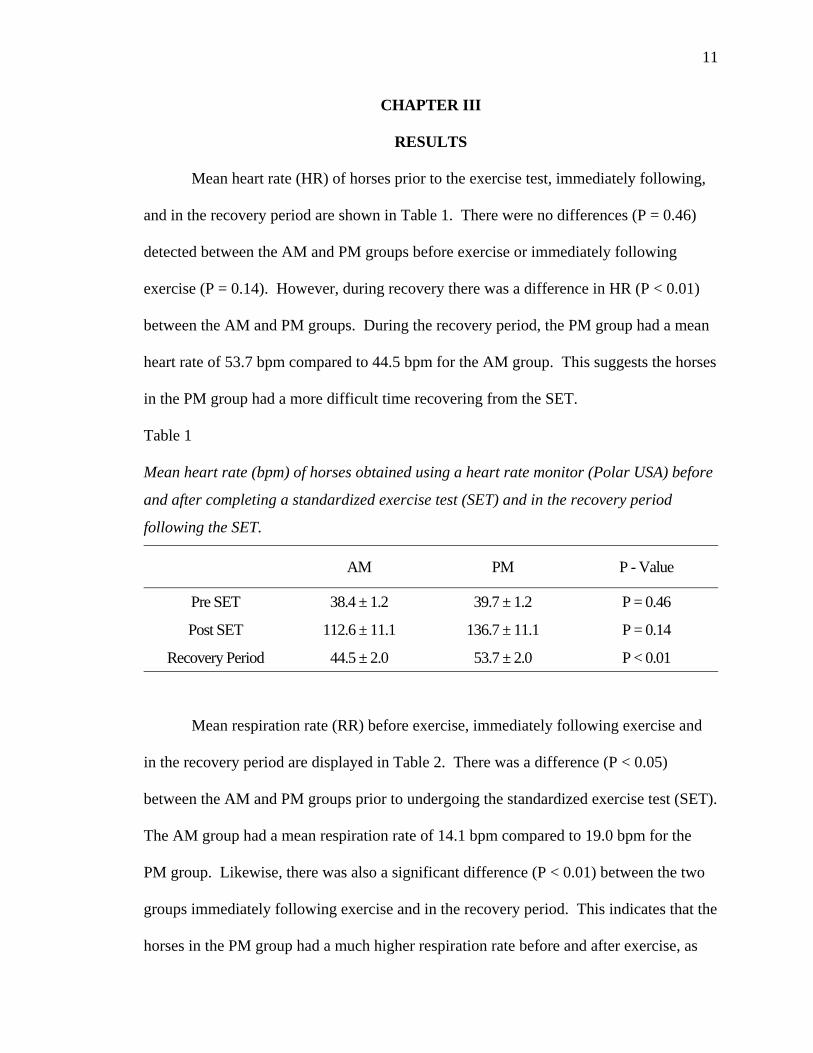
Mean heart rate (HR) of horses prior to the exercise test, immediately following,
and in the recovery period are shown in Table 1. There were no differences (P = 0.46)
detected between the AM and PM groups before exercise or immediately following
exercise (P = 0.14). However, during recovery there was a difference in HR (P < 0.01)
between the AM and PM groups. During the recovery period, the PM group had a mean
heart rate of 53.7 bpm compared to 44.5 bpm for the AM group. This suggests the horses
in the PM group had a more difficult time recovering from the SET.
Table 1
Mean heart rate (bpm) of horses obtained using a heart rate monitor (Polar USA) before
and after completing a standardized exercise test (SET) and in the recovery period
following the SET.
AM PM P - Value
Pre SET 38.4 ± 1.2 39.7 ± 1.2 P = 0.46
Post SET 112.6 ± 11.1 136.7 ± 11.1 P = 0.14
Recovery Period 44.5 ± 2.0 53.7 ± 2.0 P < 0.01
Mean respiration rate (RR) before exercise, immediately following exercise and
in the recovery period are displayed in Table 2. There was a difference (P < 0.05)
between the AM and PM groups prior to undergoing the standardized exercise test (SET).
The AM group had a mean respiration rate of 14.1 bpm compared to 19.0 bpm for the
PM group. Likewise, there was also a significant difference (P < 0.01) between the two
groups immediately following exercise and in the recovery period. This indicates that the
horses in the PM group had a much higher respiration rate before and after exercise, as

12
well as in the recovery period, and could not recover from the SET as quickly as the AM
group due to the elevated temperature in the afternoon. This also shows that the PM
exercise group’s respiratory system had to work harder in order to complete the test.
Table 2
Mean respiration rate (bpm) of horses before and after completing a standardized
exercise test (SET) and in the recovery period following the SET.
AM PM P - Value
Pre SET 14.1 ± 1.7 19.0 ± 1.7 P < 0.05
Post SET 70.6 ± 5.0 97.8 ± 5.0 P < 0.01
Recovery Period 23.2 ± 3.1 41.4 ± 3.1 P < 0.01
Mean rectal temperature (RT) before and after the SET, as well as in the recovery
period are displayed in Table 3. There were no differences (P = 0.96) detected between
the AM and PM groups before exercise. However, there was a difference (P < 0.01)
between the AM and PM groups immediately following exercise and in the recovery
period. The PM group had a mean rectal temperature of 39.7 ˚C compared to 39.2 ˚C for
the AM group after the standardized exercise test (SET), and the PM group had a mean
rectal temperature of 38.6 ˚C compared to 38.3 ˚C for the AM group in the recovery
period. This indicates that the horses in the PM group had a greater body temperature
and it took them significantly longer to recover from the exercise.

13
Table 3
Mean rectal temperature (˚C) of horses before and after completing a standardized
exercise test (SET) and in the recovery period following the SET.
AM PM P - Value
Pre SET 37.4 ± 0.1 37.4 ± 0.1 P = 0.96
Post SET 39.2 ± 0.1 39.7 ± 0.1 P < 0.01
Recovery Period 38.3 ± 0.1 38.6 ± 0.1 P < 0.01
Mean serum lactate concentration was obtained before and after exercise, as well
as in the recovery period at 2 h and 24 h and are shown in Table 4. There were no
differences detected between the AM and PM groups prior to exercise (P = 0.61) or
following exercise (P = 0.19). However, there was a difference (P < 0.05) between the
two groups at 2 h of recovery. The AM group had almost returned to normal 2 h after
exercise, and the PM group had elevated concentrations of lactate during the recovery
period. This suggests that the horses in the PM group had a more difficult time
exercising and performing as well as recovering from the SET.
Table 4
Mean whole blood lactate (mMol/L) of horses measured using a portable lactate analyzer
prior to the standardized exercise test (SET), immediately following the SET, 2 h into the
recovery period, and 24 h into the recovery period by exercise group.
AM PM P – Value
Pre SET 0.5 ± 0.5 0.6 ± 0.5 P = 0.61
Post SET 3.3 ± 0.4 4.1 ± 0.4 P = 0.19
2 h Recovery 0.7 ± 0.1 1.2 ± 0.1 P < 0.05
24 h Recovery 0.6 ± 0.1 0.6 ± 0.1 P = 0.82

14
Lactate dehydrogenase was measured in blood samples collected immediately
before and after exercise, after exercise, 2 h after exercise, and 24 h after exercise.
Samples were analyzed by the Texas Veterinary Medical Diagnostic Lab (College
Station, TX) and results are shown in Table 5. There were no differences between the
AM and PM group after exercise, 2 h in the recovery period, or 24 h into the recovery
period. However, there was a difference (P < 0.01) between the AM and PM groups
before the SET. The AM exercise group had a greater lactate dehydrogenase
concentration (251.0 U/L ± 10.8) compared to the PM group (200.3 U/L ± 10.8). This
suggests that the horses in the AM group started with a higher lactate dehydrogenase
concentration; however, it increased immediately after exercise and was still increased 2
h into the recovery period. The lactate dehydrogenase concentration for the PM group
was lower prior to the SET compared to the AM group but increased to a similar
concentration after exercise and remained at a similar concentration 24 h into the
recovery period.
Table 5
Mean lactate dehydrogenase concentration (U/L) of horses prior to the standardized
exercise test (SET), immediately following the SET, 2 h into the recovery period, and 24 h
into the recovery period by exercise group.
AM PM P - Value
Pre SET 251.0 ± 10.8 200.3 ± 10.8 P < 0.01
Post SET 264.4 ± 9.4 281.0 ± 9.4 P = 0.25
2 h Recovery 262.4 ± 20.6 274.6 ± 20.6 P = 0.69
24 h Recovery 217.0 ± 12.5 218.1 ± 11.3 P = 0.95

15
The mean circumferences of the carpal and metacarpal joints before and after
exercise are shown in Table 6. There were no differences detected on the front carpal
joints prior to (P = 0.17) or after exercise (P = 0.15). There were also no differences
detected on the front metacarpal joints (P = 0.31) before exercise. However, there was a
difference in the circumference of the front metacarpal joints (P < 0.05) immediately after
exercise. There was a difference in the circumference of the rear carpal joints before
exercise, even though there were no differences (P = 0.34) after exercise. Alternatively,
there were no differences in circumference of the rear metacarpal joints (P = 0.82) prior
to exercise; however, there was a difference (P < 0.05) in the circumference of the rear
metacarpal joints after exercise was completed.
Table 6
Mean joint circumferences of the front and rear carpal and metacarpal joints in horses
prior to the standardized exercise test (SET) and immediately following the SET by
exercise group.
AM PM P – Value
Front Carpal
Pre SET 30.9 ± 0.1 30.6 ± 0.1 P = 0.17
Post SET 30.8 ± 0.1 30.5 ± 0.1 P = 0.15
Front Metacarpal
Pre SET 26.6 ± 0.1 26.7 ±0.1 P = 0.31
Post SET 26.4 ± 0.1 26.0 ± 0.1 P < 0.05
Rear Carpal
Pre SET 38.1 ± 0.3 37.2 ± 0.3 P < 0.05
Post SET 38.0 ± 0.2 37.7 ± 0.2 P = 0.34
Rear Metacarpal
Pre SET 28.5 ± 0.1 28.5 ± 0.1 P = 0.82
Post SET 28.4 ± 0.1 28.0 ± 0.1 P < 0.05

16
The mean joint circumferences of the carpal and metacarpal joints associated with
the application of the Tuff Rock Poultice (treatment) are shown in Table 7. There were
no differences between treated and control joints during the 24-h period on the front and
rear carpal and front metacarpal joints. However, there was a difference (P < 0.01)
between the treatment and control on the rear metacarpal joints. Prior to the standardized
exercise test (SET), the treated rear metacarpal joint was 28.8 cm compared to 28.3 cm of
the control. After the SET the treated rear metacarpal joint was greater in circumference
(28.4 cm) compared to the control (27.9 cm). After the application of the TuffRock
Poultice in the 24 h recovery period the circumference was still greater (28.9 cm)
compared to the control (28.4 cm). This indicates that the TuffRock Poultice did not
have any effects on reducing inflammation.
Table 7
Mean joint circumferences of the front and rear carpal and metacarpal joints in horses
prior to the standardized exercise test (SET), immediately following the SET, and after
application of TuffRock Poultice (treatment) to the joints of the left limbs for 24 h.
Treatment Control P – Value
Front Carpal
Pre SET 30.9 ± 0.2 30.7 ± 0.2 P = 0.53
Post SET 30.7 ± 0.2 30.7 ± 0.2 P = 0.53
24 h 30.7 ± 0.2 30.4 ± 0.2 P = 0.53
Front Metacarpal
Pre SET 26.7 ± 0.1 26.7 ± 0.1 P = 0.43
Post SET 26.1 ± 0.1 26.3 ± 0.1 P = 0.43
24 h 26.6 ± 0.1 26.7 ± 0.1 P = 0.43
Rear Carpal
Pre SET 38.0 ± 0.3 37.5 ± 0.3 P = 0.18
(continued)

17
Treatment Control P – Value
Post SET 38.1 ± 0.3 37.7 ± 0.3 P = 0.18
24 h 37.7 ± 0.3 37.6 ± 0.3 P = 0.18
Rear Metacarpal
Pre SET 28.8 ± 0.2 28.3 ± 0.2 P < 0.01
Post SET 28.4 ± 0.2 27.9 ± 0.2 P < 0.01
24 h 28.9 ± 0.2 28.4 ± 0.2 P < 0.01
The mean temperatures of the carpal and metacarpal joints measured with the
FLIR thermal imaging camera before exercise, after exercise, and 24 h following exercise
are displayed in Table 8. There were no differences detected between joints of the
treatment and control legs. However, there were differences (P < 0.01) in joint
temperatures between the treatment and control legs over the three different time periods.
Table 8
Mean temperature as determined by a thermal imaging camera (FLIR Systems;
Wilsonville, OR) of the front and rear carpal and metacarpal joints in horses prior to the
standardized exercise test (SET), immediately following the SET, and after application of
TuffRock Poulice (treatment) onto the joints of the left limbs for 24 h.
Treatment Control P – Value
Front Carpal
Pre SET 28.3 ± 1.0 28.2 ± 1.0 P = 0.89
Post SET 30.2 ± 1.0 30.5 ± 1.0 P = 0.89
24 h 28.3 ± 1.0 28.2 ± 1.0 P = 0.89
Front Metacarpal
Pre SET 27.2 ± 1.2 27.3 ± 1.2 P = 0.93
Post SET 29.3 ± 1.2 29.5 ± 1.2 P = 0.93
24 h 27.2 ± 1.2 27.0 ± 1.2 P = 0.93
(continued)

18
Treatment Control P – Value
Rear Carpal
Pre SET 31.3 ± 0.9 31.0 ± 0.9 P = 0.51
Post SET 32.9 ± 0.9 32.9 ± 0.9 P = 0.51
24 h 31.1 ± 0.9 30.6 ± 0.9 P = 0.51
Rear Metacarpal
Pre SET 28.6 ± 1.1 28.4 ± 1.1 P = 0.75
Post SET 30.3 ± 1.1 30.5 ± 1.1 P = 0.75
24 h 28.6 ± 1.1 28.1 ± 1.1 P = 0.75

19
CHAPTER IV
DISCUSSION
Previous studies have focused on the mature Quarter Horse and training methods
for older horses in competitions. However, minimal studies have focused on the training
and exercising aspects of the younger Quarter Horse, especially in differing combinations
of ambient temperature and humidity. Heart rate (HR), respiration rate (RR), rectal
temperature (RT), lactate concentration (LAC), and inflammation are all key factors in
determining the fitness levels of horses. Hargreaves et al. (1999) also found that
thermoregulation limits exercise performance in horses and reported that heart rate,
respiratory rate, and rectal temperature increase during hot and humid conditions
compared to cool and dry conditions in mature Quarter Horses. After exercise during the
hot and humid conditions, HR, RR, and RT were all above normal parameters, which is
similar to the results of the PM exercise group in the current study. In the study by
Hargreaves et al. (1999) the vitals after exercise during the cool and dry conditions are
again similar to the vitals of the AM exercise group in the current study. The vitals HR,
RR, and RT were all greater in the PM group after exercise and into the recovery period
compared to the AM group. Therefore, our study determined that it was more difficult
for the horses to complete and recover from the PM exercise bout due to the elevated
ambient temperature.
The PM exercise group had a significantly greater RT compared to the AM group
after exercise. This was also observed in the recovery period where the PM exercise
group had a greater RT than the AM group. According to Kahn et al (2005), rectal
temperatures from both groups after exercise, as well as in the recovery period are above

20
normal range for horses (37.7 ± 0.5 ˚C). To help prevent greater body temperature,
horses will dissipate heat via evaporative cooling by increasing their respiration rate and
sweating (Holcomb et al, 2013). Therefore, it was more difficult for the afternoon group
to dissipate heat and it took longer for them to recover from the exercise, due to the
elevated ambient temperature and the associated relative humidity. As a result of
exercise, respiration rate increased after exercise and in the recovery period for both the
AM and PM groups. The PM group had a significantly greater RR compared to the AM
group immediately after exercise and into the recovery period. The normal range
reported for horses at rest under thermoneutral conditions is between 10 and 14 bpm
(Kahn et al., 2005). In extreme conditions a horse’s RR can reach 180 bpm when
undergoing strenuous exercise on a treadmill in a climate controlled room at 30˚C and
80% relative humidity (Marlin et al., 1999). This indicates that the horses in the PM
group had a greater RR compared to the AM group due to decreased heat dissipation as a
result of the temperature and humidity combination experienced during the PM exercise
bout.
Lactate concentrations can determine the aerobic-anaerobic threshold to identify
the maximum intensity of exercise (Linder, 2010). The PM group had a numerically
greater lactate concentration that exceeded the anaerobic threshold of 4.0 mMol/L
compared to the AM group after exercise. Similar results were observed 2 h into the
recovery period, with the PM group having a greater lactate concentration compared to
the AM group. In other studies (Linder, 2010) the anaerobic threshold as indicated by the
lactate concentration of 4.0 mMol/L, was reached after exercising for 26 min. In the
current study the PM group reached the anaerobic threshold when measured immediately

21
after exercise and the AM group did not. This suggests that once horses have reached the
anaerobic threshold of 4.0 mMol/L, the recovery time increases for the horses to return to
baseline values.
Lastly, inflammation in the limbs is a good indicator of soft tissue injury and an
extended recovery time. According to Pascoe (2016), inflammation will occur when a
ligament or tendon fails from repetitive stress. In the current study, there was no
inflammation present after exercise, which is an indication that the horses were in the
proper condition to be undergoing strenuous exercise. Application of the TuffRock
Poultice appeared to have no beneficial effects in terms of reducing swelling in joints.
Joint circumferences were not different between joints treated with the poultice and those
that were not. When the temperatures of the joints were measured using a thermal
imaging camera, there was an increase in temperature after exercise and then a decrease
in temperature 24 h into the recovery period following exercise. This occurred in both
the treated and control joints, indicating that the horses’ joints had increased blood flow
from the exercise bout resulting in an elevated temperature. There were no differences in
circumference of joints treated with poultice and those that were not at 24 h into the
recovery period, indicating the poultice did not have an effect on reducing inflammation
at 24 h into the recovery period. It is possible that there may have been differences in
joint circumference due to inflammation at 12 h into the recovery period; however joint
circumference was not measured at that time. Therefore, more research is needed to
determine if the poultice is effective in reducing inflammation and the length of time
required for the poultice to be effective.

22
Implications
Vitals, inflammation and whole blood lactate are good indicators of the horse’s
physiological response to exercise and heat stress. In the current study, elevated ambient
temperatures, even with lower humidity were more challenging for young horses to
tolerate during exercise. This was caused by the impaired ability to dissipate heat from
the submaximal exercise due to the elevated temperature. The prolonged increased heart
rate and respiration rate in the PM group also indicates that the horses had a more
difficult time recovering from the exercise due to the higher temperatures.
Better understanding the roles of temperature and humidity on the physiological
response in young performance horses during exercise can help develop better training
programs to fit the needs of these equine. Based on the results of this study, young,
performance horses should undergo training during the portion of the day when ambient
temperatures are lowest, or training can occur during greater ambient temperatures if the
length and rigor of the training session is decreased to compensate for the elevated
temperature.

23
REFERENCES
Allen, K.J., E. van Erck-Wesergren, and S.H. Franklin. (2016). Exercise testing in the
equine athlete. Equine Vet Educ. 28:89-98.
Art, T. and P. Lekeux. (1995). Respiratory adjustments in unacclimated horses exercised
under hot, humid conditions. Equine Vet. J. 18:289-293.
Foreman, J.H., T.L. Grubb, G.J. Benson, L.P. Frey, R.A. Foglia, and R.L. Griffin. (1995).
Physiological effects of shortening steeplechase in a 3-day event. Equine Vet. J.
20:73-77.
Geor, R.J., L.J. McCutcheon, and M.I. Lindinger. (1996). Adaptations to daily exercise in
hot and humid ambient conditions in trained Thoroughbred horses. Equine Vet. J.
22:63-68.
Hargreaves, B.J., D.S. Kronfeld, and J.R. Naylor. (1999). Ambient temperature and
relative humidity influenced packed cell volume, total plasma protein and other
variables in horses during an incremental submaximal field exercise test. Equine
Vet. J. 31:314-318.
Harris, P. and D.H. Snow. (1992). Plasma potassium and lactate concentration in
thoroughbred horse during exercise of varying intensity. Equine Vet. J. 23:220-
225.
Hodgson, D.R., L.J. McCutcheon, S.K. Byrd, W.S. Brown, W.M. Bayly, G.L.
Brengelmann, and P.D. Gollnick. (1993). Dissipation of metabolic heat in the
horse during exercise. J. Appl. Physiol. 74:1161-1170.

24
Holcomb, K.E., C.B. Tucker, and C.L. Stull. (2013). Physiological, behavioral, and
serological responses of horses to shaded or unshaded pens in a hot, sunny
environment. J. Anim. Sci. 91:5926-5936.
Kahn, C.M., S. Line, and D.G. Allen. 2005. The Merck veterinary manual. Merck
Rathway, NJ.
Lindner, A., H. Mosen, S. Kissenbeck, H. Fuhrmann, and H.P. Sallmann. (2009). Effect
of blood lactate-guided conditioning of horses with exercises of differing
durations and intensities on heart rate and biochemical blood variables. J. Anim.
Sci. 87:3211-3217.
Lindner, A.E. (2010). Maximal lactate steady state during exercise in blood in horses. J.
Anim. Sci. 88:2038-2044.
Lindinger, M.I., R.J. Geor, G.L. Ecker, and L.J. McCutcheon. (1995). Plasma volume and
ions during exercise in cool, dry; hot, dry; and hot, humid conditions. Equine
Vet. J. 20:133-139.
Marlin, D.J., C.M. Scott, R.C. Schroter, R.C. Harris, P.A. Harris, C.A. Roberts, and P.C.
Mills. (1999). Physiological responses of horses to a treadmill simulated speed
and endurance test in high heat and humidity before and after humid heat
acclimation. Equine Vet. J. 31:31-42.
Pascoe, E. and E. Davidson. (2016). On the injured list. Practical Horsemen. 44(6), 62.
Rammerstorfer, C., G.D. Potter, T.A. Cudd, P.G. Gibbs, D.D. Varner, and D.D.
Householder. (1997). Physiological responses of mature quarter horses to reining
training when fed conventional and fat-supplemented diets. J. Equine Vet. Sci.
18:175-179.

25
Williams, R.J., D.J. Marlin, N. Smith, R.C. Harris, W. Haresign, and M.C. Morel. (2002).
Effects of cool and hot humid environmental conditions on neuroendocrine
responses of horses to treadmill exercise. Vet. J. 164:54-63.

26
VITA
Kelly S. Carlson
Education
Sam Houston State University, Huntsville, TX
Master of Science in Agriculture May 2017
Advisor: Kyle J. Stutts, Ph.D. Sam Houston State University, Huntsville, TX
Bachelors of Science in Agricultural Business May 2015 Teaching Experience Graduate Teaching Assistant
Department of Agricultural Sciences and Engineering Technology, Sam Houston State
University
Equine Behavior and Training Fall 2015-Fall 2016
Assisted in coordination of laboratory training and curriculum for students.
Application of initial handling, halter breaking, leading, and lunging.
Instructed on topics such as the steps of desensitizing and riding.
Further developed horsemanship skills and effective communication between the horse and rider.
Equine Reproduction and Foaling Fall 2015-Fall 2016
Assisted students with data collection for foaling project.
Educated students on the signs of foaling and stages of parturition.
Cared for mare and foal immediately following birth.
Instructed on foal handling and assisted students with obtaining foal growth measurements.
Equine Science Fall 2015-Fall 2016
Responsible for instructing, monitoring, and grading students based on the
curriculum presented for each class.

27
Topics included: history, breeds, identification, selection, behavior, nutrition, reproduction, health, facilities, activities, and equine business.
Provided students with basic information required for successful selection, ownership, care, and enjoyment of horses.
Equine Selection and Evaluation Fall 2015-Fall 2016
Responsible for monitoring and grading students based on the curriculum presented for each class.
Instructed basic selection of demonstration horses required for successful note taking and evaluation for placing a class
Prepared horse judging classes for students to test their knowledge
Whitetail Deer and Fawn Research Summer 2016-Present Responsible for the care and maintenance of white-tailed does and
their fawns
Responsible for the initial fawn care after birth
Cared for bottle-fed fawns including: collecting, tagging, preparing bottles and feeding, cleaning pens, and assisting in the measuring of fawns
Related Experience
Chinese Horsemanship Program Summer 2016
Instructor for the American Quarter Horse Association in China at three farms (Unbridled China, Inner Mongolia at Brother Fortune, and YeHe Farm) to approximately 10-40 participants per clinic.
Topics included both foundation and advanced horsemanship skills.
Undergraduate Research Program Spring 2013 Conducted research on horses related to exercise protocols
Presented research at the Southern Section meeting of the American Society of Animal Science in San Antonio, Texas as well as at the Undergraduate Research Symposium at Sam Houston State University
Skills
Equine
Student instruction and horsemanship

28
Cervids Care and maintenance of white-tailed deer
Microsoft Office Applications
Word, Excel, PowerPoint