Can Pickle Juice Sport and enlyten SportsStrip gain market ...
32
Can Pickle Juice Sport and enlyten SportsStrip gain market share in the National Football League, even though Gatorade is an official sponsor?
-
Upload
khangminh22 -
Category
Documents
-
view
3 -
download
0
Transcript of Can Pickle Juice Sport and enlyten SportsStrip gain market ...

Can Pickle Juice Sport and enlyten SportsStrip gain market share in the National Football League, even though Gatorade is an official sponsor?

2Market Analysisc h a p t e r 2
25
Any athlete or hardcore personal trainer knows that maintaining sufficient levels of electrolytes is one key to a successful workout. If the level drops too low, fatigue kicks in, and the person tires more quickly. Electrolyte replacement gives a boost of energy, greater stamina, and recovery from an exercise regimen.
For many years, Gatorade held the dominant position in the electrolyte replacement marketplace. The company’s products
held the advantages of being first, the most visible, and the most closely connected with athletic programs at all levels. The ritual of pouring Gatorade on the winning coach of a major football game places the product at the level of being practically a cultural symbol of success.
Such a lucrative market was bound to attract competitors. At first, similar products reached the market. One of the more notable, POwErAdE, was developed
Electrolyte Nation

26 part 1 MArKETING FOUNdATION
by the Coca-Cola company. The product is designed to offer more nutrients than Gatorade, in a wide variety of flavors.
recently, however, two new forms of electrolyte delivery have been made available. The first is simple pickle juice. Pickle Juice Sport advertises that golden pickle juice contains 30 times the amount of electrolytes as POwErAdE and 15 times more than Gatorade. Of course, the primary drawback is taste. Even with this disadvantage, however, the company’s sales continue to climb.
Another new option is enlyten™ Electrolyte SportStrips™. The company’s marketing materials claim that the strips “are a fast, easy and effective way to replace lost electrolytes during athletic performance!” Enlyten SportsStrips replace the electrolytes bodies lose while exercising through buccal (cheek to gum) absorption. The company’s web site notes that this mode of absorption is vastly different from all other electrolyte delivery predecessors. Gastric absorption is bypassed, and the electrolytes are directly absorbed into the body. The company also claims that using Electrolyte SportsStrips helps avoid the
overhydration that often accompanies the excessive consumption of sports drinks.
what could be simpler? Just pop a strip in your mouth, let it dissolve, and enjoy the different flavors (the original was orange). No more feeling full from excessive amounts of sports drinks that are much slower to provide the performance enhancement that any athlete needs immediately. Naturally, Gatorade’s marketing team had to respond. Since Gatorade is the official sports drink of the National Football League, the company quickly managed to get a league memo sent out stating that no other form of electrolyte replacement could be endorsed by any team. Still, at least 10 teams quietly note that players do use SportsStrips.
will Pickle Juice Sport and enlyten SportsStrips succeed in a marketplace in which every high school, college, and professional coach and trainer already knows about Gatorade and POwErAdE? The owners of both companies clearly believe they can. It will take time combined with a great deal of consumer information and marketing programs to gain a foothold in this inviting marketplace.
Understanding the market in which a good or service will be offered is a key ingredient in mar-keting success. Such an understanding will be largely derived from a market analysis. A market analysis program includes examining environmental factors, the competition, the position the firm’s products occupy in the marketplace, and the customers who purchase the product. This chapter studies each of these factors.
This chapter also reviews the ways in which the marketing department helps a company’s leaders estimate demand for a product as well as for the industry in which the firm operates. Finally, the chapter closes with a presentation of how to estimate contribution margins and break-even points, which are used to evaluate marketing programs and to help make decisions about future marketing efforts.
Market Analysis
A market analysis involves studying a company’s customers and competitors along with the overall industry and environment. From these analyses, the marketing team can identify who to target, what products to market, and the best promotional approach to influence the attitudes
Chapter Overview

chapter 2 Market Analysis 27
and purchase behaviors of potential customers. Typically, a market analysis program consists of the following:
• Environmental analysis• Competitive/industry analysis• Analysis of product positioning• Market segment analysis• Customer analysis
An examination of the past reveals the ways in which market analyses changed the land-scape for various products and had an impact on the ways people live. A market analysis encouraged Starbucks’s owner to capitalize on the changing consumer behaviors and attitudes and helped the company find a niche in the highly competitive coffee market. JCPenney moved into the private labeling of jeans when a market analysis revealed changing consumer attitudes toward store brands just as national brands such as Levi’s were losing their luster. A market anal-ysis may have saved Harley-Davidson. Facing financial ruin and bankruptcy, Harley-Davidson’s leadership used governmental assistance to complete a market analysis to better understand the motorcycle market and how to compete effectively against foreign motorcycle manufacturers.1
Environmental Analysis
An effective market analysis begins with an environmental analysis. This includes monitoring all of the external variables that have an impact on a particular industry. An environmental analysis is a key component in the strategic management process as well. Both include assessment of many factors, including
• political forces,• social forces,• economic forces,• technological forces, and• semicontrollable forces.
Many political forces come from laws, regulations, and regulatory agencies, such as the Occupational Safety and Health Administration (OSHA), the Environmental Protection Agency (EPA), laws regarding discrimination, and the many laws and agencies that oversee marketing activities, including the Federal Trade Commission (FTC). Courts often influence marketing and business through decisions regarding product safety and reliability and fair advertising and pro-motion tactics and in protecting the interests of various groups. Political forces also include the ways in which government influences an economy; taxes companies, products, and individuals; and provides subsidies and loans to various organizations. At times, the government even com-petes with private enterprise (U.S. Postal Service vs. FedEx and UPS).
The social forces that have an impact on business include changing demographics or pop-ulation characteristics, shifting cultural and subcultural trends, and rising educational levels. Demographic trends include the aging of the population as the baby boomer generation retires as well as shifting locations of populations away from core parts of cities to the suburbs and from the northern and eastern United States to more southern and western states. Other demo-graphics that influence marketing are the size and composition of family units, including single-parent households and mixed families. Also, the racial distribution in an area affects marketing patterns, such as when Hispanic families move into new regions, towns, and cities. A wide vari-ety of cultural trends affect marketing and business.
Economic forces are all the factors that have an impact on a product’s market in a given region. This would include levels of economic growth, employment, unemployment, and infla-tion as well as the cost of living in an area.

part 1 MArKETING FOUNdATION 28
The prices and availability of raw materials needed to produce a good or a service are also economic forces. For example, an increase in fuel costs triggers increases in transportation costs and an increase in raw material costs for a number of chemicals, plastics, and other products that are made from petroleum. When the costs are passed on to other members of the channel of distribution, then each succeeding level in the channel is affected. Company leaders consider the impact of a price change on a finished product as well as price elasticity. The greater the elasticity, the more managers are concerned about increasing the price of the product. In the short term, consumers may turn to competitor products with a lower price; in the long run, buyers may search for suitable substitutes.
Technological forces include new products cre-ated by technology as well as product improve-ments and improvement in production methods. Technology also has an impact on the ways in which marketing materials can be delivered and on market-ing jobs and occupations. Consider, for example, the ways in which technology has changed the methods for creating interesting and attention-getting Internet and television commercials.
Semicontrollable forces create an impact on a company; however, the company’s leaders are able to respond and exert some influence in return.
Semicontrollable forces include the local community, suppliers, financial institutions, stock-holders, and unions. The community can be influenced through fair and reasonable manage-ment practices, such as hiring, firing, promotion, and pay programs. The local community may also be influenced by marketing tactics and public relations activities. Suppliers and unions are both influenced through bargaining methods and tactics. Financial institutions and stockholders may be influenced by effective record keeping and “clean” company finances. Table 2.1 summarizes the various forces examined in an environmental analysis.
Looking Fit Tanning SalonAn effective market analysis examines the various forces operating within a particular compa-ny’s environment. Consider the environmental analysis conducted by Looking Fit in the tanning salon industry.2 Statistics indicate that over the past 10 years the tanning industry has more than doubled, with 60% of the growth coming from current salon owners expanding or opening new outlets. The average salon has approximately 2,400 customers and a minimum of 10 pieces of tanning equipment. Typically, salons provide three to five levels of tanning with six basic tan-ning beds, two premium units, and one upgrade or stand-up unit.
In conducting this environmental analysis, it is important to consider any political or legal factors that may have an impact. For the indoor tanning industry, California is considering a law that would make it illegal for anyone under the age of 18 to tan without a doctor’s or sur-geon’s prescription. Currently, California prohibits 14- to 18-year-olds from using indoor tanning salons without parental consent. Michigan, New Hampshire, North Carolina, and other states are also proposing legislation that would require parental consent for anyone 18 or under to tan in a salon.
In terms of social forces, tanning has become a lifestyle for a large segment of people in the United States. Many of these individuals go to indoor tanning salons because they provide a controlled and relaxed atmosphere. They expect salon operators to provide professional
Baby boomers are an important market
segment that requires an understanding of attitudes, opinions,
interests, and lifestyles.

chapter 2 Market Analysis 29
advice on tanning as well as skin care products that will enhance their tans and personal appearance.
Demographically, the majority of individuals using indoor tanning are between 18 and 49 years of age, with 70% being females. Within this group, 53% are women between the ages of 20 and 39. Industry analysis indicates, however, that there has also been a steady growth in the number of women from 40 to 49 years of age who tan. The fastest-grow-ing segment is younger females, ages 16 to 19. While men account for only 30% of the tanning market, they have shown an increasing interest in professional skin care products in addition to tanning.
Tanning involves spending disposable income that is not used for necessities, such as food, clothing, and shelter. Therefore, local economic conditions would create an impact. An easy service to stop using in hard economic times would be personal tanning.
A new technological trend in the industry is sun-less products that provide an immediate cosmetic, tanned look without any ultraviolet (UV) exposure. Sunless products have become important to salon owners because they offer salons a new way to build business and increase profits. Sunless products are especially attractive to a specific market segment that in the past had not used tanning salons. These are individuals who have difficulty in getting a tan or an even tan, whether through indoor tanning beds or outside in the sun.
Finally, salon owners would consider any semicontrollable forces that may affect com-panies. These include local communities and zoning ordinances, suppliers of tanning prod-ucts, and banks and financial institutions that may offer funding and other services to salon owners.
what caused the tanning salon industry to expand in the past decade?
Table 2.1 Environmental Forces
Political Forces Social Forces
Laws and regulations Changing demographics
Courts and judgments Cultural trends and changes
Taxes and subsidies rising educational levels
Governmental competition
Economic Forces Technological Forces
Economic conditions (inflation) New products
Price and availability of raw materials Product improvements
Improvements in product methods
Semicontrollable Forces
Local community Suppliers
Financial institutions Stockholders
Labor unions retailers or channel members

part 1 MArKETING FOUNdATION 30
STOP AND THINK _____________________________________
1. Besides limiting tanning to young people, what other laws or regulatory agencies would be concerned with tanning salons?
2. Is having a rich, dark tan as socially desirable as it was 20 years ago? why or why not?
3. How could court judgments regarding skin cancer affect the industry and the Looking Fit Tanning Salon?
4. How has technology changed the nature of the tanning business?
5. when a tanning salon is located next to a massage or tattoo parlor, does the location affect perception in the local community? why or why not?
Competitive/Industry Analysis
While they vary in terms of economic structure, companies in all industries engage in competi-tion, unless the company is authorized by a government entity to be a monopoly. When the marketing team does not closely watch industry trends, it can fail to recognize opportunities and may lose customers to competitors who are more in tune with what is going on in the marketplace and with changes in customer preferences. This means that a competitive analysis involves constant surveillance of ongoing and anticipated industry trends. Such an analysis is critical to maintaining a strong, competitive position.
Levels of CompetitionMarketing managers must spend a great deal of time considering all the forms of competition that affect a market, a prod-uct, and individual consumers. A competi-tive analysis begins with identifying the various levels of competition.
Consider Figure 2.1 and the competi-tors that sell clothing from the viewpoint of Target stores. The most direct com-petitors are the discount stores offering clothes similar to Target, such as Kmart and Wal-Mart. At the next level are depart-ment stores. These retailers sell clothes, but typically, they are higher priced and of higher quality. As shown, competitors at this level include Dillard’s, JCPenney, Belk, and Sears. The third level consists of cloth-ing specialty retailers that focus on one or more brand name lines or types of clothing, such as Rave, Talbots, Banana Republic, Abercrombie & Fitch, Lane Bryant, and Old Navy. The fourth layer would be all the other retail stores competing for the consumer’s dollars. Instead of purchasing clothes, for instance, an individual could purchase something from Best Buy, Office Depot, or Bass Pro Shops.
Kmart
TargetWal-Mart
Sears
Department Stores
JCPenney
Belk
Dillard’s
Abercrombie & Fitch
Specialty Stores
Rave
Talbots
BananaRepublic
Old Navy
LaneBryant
GapBestBuy
Other Types of Retail Stores
BassPro
Shops
Office Depot
Figure 2.1 Levels of Competition for Clothing at Target

chapter 2 Market Analysis 31
Investigation of CompetitorsOnce competitors have been identified, some questions that should be investigated include:
• What are the competition’s strengths and weaknesses?• What product-positioning strategies do the competitors use?• What is the target market for each competitor?• Who are the customers in each market?• Why do individuals buy from a competitor? What makes a competitor’s product unique
or attractive?• What types of marketing programs do the competitors use?• How does the competition promote and/or advertise products?• What competitive advantage do they seem to possess or promote?
Considerable information can be gathered about competitors without hiring a spy or using espionage. Figure 2.2 lists some of the typical available sources. It helps to learn everything pos-sible in order to accurately predict or quickly react to actions by other competing companies.
Each competitor’s Web site reveals a tremendous amount of information about the company and its products, personnel, marketing approach, and positioning strategy. Many marketing teams find it useful to monitor these Web sites for new information and marketplace trends.
Another source is the competition’s advertisements. Most marketing departments maintain files of competitor print ads and ads from other media. While Web site materials and advertise-ments are designed to present the competitor in its best light, remember that this is the same information that a company’s customers and others see.
what stores carry clothes that are similar to those at Target?
Figure 2.2
Sources of Competitive Information
web sites•
Advertisements•
News articles•
Trade and professional •associations
Online forums and •blogs
Competing products •and locations
Customers•
Salespeople•

part 1 MArKETING FOUNdATION 32
Additional sources of information include media articles, trade and professional journals, and online forums and blogs. These sources help the marketing team to view the competition as others see them. While some of these sources strive to remain neutral, others provide informa-tion based on personal opinions and experiences.
Some company leaders believe it is important to purchase a competitor’s product and reverse engineer it in order to see how the item is made. Also, when a competitor has a retail outlet, many marketing managers send someone to visit the store on a regular basis. The goal is to understand how the competitor displays merchandise and to find out what in-store marketing techniques are being used. In-store visits also provide information about how the competitor’s salespeople deal with customers.
The other two sources of information are from internal sources: customers and salespeople. When a marketing leader deploys a field sales force or uses other types of salespeople, they meet customers and prospects on a regular basis. Salespeople can learn a great deal about the competition while dealing with customers. A salesperson may be the first to discover a competi-tor’s new product, new marketing campaign, or new promotion. Customers are often willing to talk about how they view competing brands. Those who have actually purchased competing brands may offer even more helpful comparisons.
In conducting a competitive analysis, Table 2.2 can be a useful tabulating form. You will need to modify the factors in the left column to fit the product being sold. The column headings can also be altered to fit the circumstances, and the competitors should be identified by name.
Analyzing the competition helps a company’s leaders comprehend how the organization is perceived by customers. The analysis assists the marketing team in understanding how a firm’s brand and products are viewed and may reveal any unique benefits the company can provide to customers. It can also identify areas in which the company might be able to outperform the competition.
Our Position Our Brand Relative Competitor Competitor Competitor Relative to Relative to Importance to Factor A B C Competition Competition Customers
Product benefits
Product quality
Price
Selection
Customer service
reliability
Expertise
reputation/image
Locations
Appearance
Sales methods
Advertising
Marketing
Table 2.2 Analysis of Competitors

chapter 2 Market Analysis 33
A competitive rivalry can bring out the best in a company. Without competition to drive excellence and continuous improvement, company employees may become complacent. There may not be a driving need to improve or develop new products. As long as customers can choose from among at least two brands, however, competition and rivalry exist. Competition can also help educate customers about a product category. Although each competitor empha-sizes its particular brand’s attributes and benefits, such a process may actually simultaneously present the benefits that are available from other brands in the industry.3
Analysis of Product Positioning
Consumers and businesses normally have several brands from which to choose in a product cat-egory. Most products are in the mature stage of the product life cycle, which means competition is intense. Brands are often perceived as being highly similar, which in marketing terms is called brand parity. When brand parity is present, no distinctive attributes make any brand stand out. The opposite of brand parity is brand equity, which is a situation in which a company’s goods and services are perceived to be different and better.
To survive a competitive environment and to achieve brand equity, marketing professionals examine the position each product holds in the marketplace. Doing so makes it possible to find out if a product holds a unique place in the minds of consumers. Then, the marketing team can change, refine, or accentuate the position. Two methods are used to develop a positioning strat-egy. The first is product differentiation, and the second is through market segmentation.
In the wine industry, which would be most likely, brand parity or brand equity?

part 1 MArKETING FOUNdATION 34
The Nature of Product PositioningProduct positioning involves the place a good or service occupies (1) in the minds of consumers and (2) relative to the competition. Although what people in the company think of its products is important, it is what consumers think that determines purchase behaviors. In developing the positioning statement, four components should be considered:4
1. The target audience
2. The good or service
3. The frame of reference or category
4. The point of differentiation or uniqueness
Since positioning involves the mental location of a product in the minds of consumers, posi-tioning begins by defining the target audience. The good or service is then placed in a frame of reference or category, such as beverages, compact cars, designer clothes, or breakfast foods. The third component involves determining whether or not a product is generally perceived as being different or unique in the reference or category. This may be achieved by the product being viewed, for example, as the uncola among beverages (7 Up) or the nonmeat item among breakfast foods.
Positioning StrategiesUnless the product is completely new, it is beneficial to understand the current place a product holds in the minds of customers before developing a product-positioning strategy. This can be accomplished through market surveys and other data collection methods. There are seven pri-mary positioning positions, as listed in Figure 2.3.5
When positioning by attribute, the brand will be marketed as having a unique and supe-rior feature. In the automotive industry, BMW stresses engineering and handling, while Volvo stresses safety.
Positioning by use or application is similar to attribute positioning. Instead of emphasiz-ing a particular attribute, however, the ways to use the product are stressed. When a signifi-cant decline in home baking began to take place, ARM & HAMMER repositioned its baking soda as a deodorizer to be used in a refrigerator, in carpet-cleaning products, and even in dental care.
Occasionally, a brand may be positioned relative to competitors. This positioning strategy works best when a lesser known brand can be compared with a strong, well-known brand. Many years ago, the rental car company Avis was not often recognized. The company’s advertis-ing agency developed a campaign to reposition the brand against the industry leader, Hertz. In a series of advertisements, Avis was compared to Hertz. The ads admitted the company was not the industry leader but instead stated, “We try harder.” A similar campaign was used by Chrysler when it faced potential bankruptcy. The company admitted it was not the industry leader, but because it was not, the focus turned to other aspects, such as quality.
Two closely related positioning strategies are by product user or by product class. The goal of a product user strategy is to position the product as being superior for a given product user. For instance, Johnson & Johnson touted its famous baby shampoo for individuals who washed their hair frequently and, as a result, needed something mild. When Apple first developed com-puters, the products were positioned as being best suited for educational institutions, which were the product’s users.
When marketing efforts feature a product class, the brand is positioned as being best or superior in that particular set, or class, of products. For instance, Morningstar Farms has devel-oped an entire range of meatless products for breakfast meals. The Morningstar Farms brand is promoted as the best meatless breakfast food for vegetarians as well as for individuals who are concerned about cholesterol in traditional breakfast meats, such as bacon and sausage. Several years ago, the leaders of the orange juice industry attempted to change orange juice from being
Figure 2.3
Product-Positioning Strategies
Attributes•
Use or application•
Competitors•
Product user•
Product class•
Price/quality •relationship
Cultural symbol•

chapter 2 Market Analysis 35
viewed as only a breakfast drink to an anytime beverage, moving the product into a wider prod-uct class that included soft drinks and energy drinks.
Price/quality positioning involves convincing consumers they are getting more for their money. Wal-Mart has achieved success using the price-quality positioning strategy, featuring the “everyday low price” motto for years. Recently, however, when sales at Wal-Mart slowed, the company began offering better-quality products and higher-reputation brand names to appeal to higher-income individuals. The challenge will be to maintain the “everyday low price” posi-tion even as more expensive items fill the shelves.
The final product-positioning strategy is probably the most difficult to attain. It is difficult to incorporate a cultural symbol within a positioning strategy. Chevrolet has, for years, attempted to achieve the position of being as American as baseball, hot dogs, and apple pie. As a new generation matures, however, new cultural symbols are rare. McDonald’s may have had its sta-tus as a cultural symbol reinforced when characters on the popular television program Grey’s Anatomy used the nicknames McDreamy and McSteamy.
In summary, the key to successful product positioning is finding a position a brand can occupy that is either unique or superior. It is better to be viewed as “the best” in a small pond than be viewed as “just another brand” in a large pond. A brand will be purchased when con-sumers feel that it offers some advantage or differentiation from the others.
STOP AND THINK _____________________________________
Consider the following positioning statement by Highland Financial Services: “To working women with incomes over $75,000, Highland Financial Services is the life insurance company with 125 years of experience providing AAA, insured life insurance investments.”6
1. what is the target market in this statement?
2. what is the basic product for the company?
3. what product category or frame of reference is mentioned in this statement?
4. what unique feature is being described?
5. which positioning strategy best fits Highland Financial Services? defend your choice.
Perceptual MappingPerceptual mapping can be used to investigate and determine the optimal product-positioning strategy for a product. A perceptual map typically uses two axes that are key variables regarding how a product or company is viewed. Perceptual mapping may include more axes; however, the most common approach is to use two or three. It is almost impossible to visualize more than three components.
Figure 2.4 is a perceptual map for the new Starbucks Frappuccino blended beverage before it was introduced. In this case, the two critical purchase criteria for a drink are price and per-ceived quality. Starbucks believed the new Frappuccino drink would compete most directly with Jamba Juice. Company research indicated that the Frappuccino drink was perceived as having slightly higher quality with a slightly lower price.
Perceptual mapping provides a useful tool for assessing product positioning because it iden-tifies important purchase criteria and provides a visualization of where a brand stands in relation to competitors. Remember that if the perceptual map is to be beneficial, it must be based on the views that consumers have of the various brands within a product industry. It also must be based on the decision criteria that are used to determine the brand to be purchased.
Perceptual maps assist a marketing team in determining how to proceed in strengthening or changing a product’s position. The team may choose to emphasize price, quality, or the price/quality relationship.

part 1 MArKETING FOUNdATION 36
Product DifferentiationAs noted earlier, the opposite of brand parity is brand equity. Product differentiation attempts to create this difference in perception. When brand parity exists, marketing departments are often forced to compete based on price. When a high level of brand equity exists, the mar-keting team can focus on unique differences and advantages. Price may or may not play a role. Product differentiation can be created in two ways: (1) through an actual difference or (2) by creating the perception that there is a difference.
The airline industry, where a great deal of brand parity exists, serves as an example. Midwest Airlines has developed a new strategy in which
the company emphasizes that it offers more direct flights combined with a more luxurious travel experience—complete with wider leather seats (two per side rather than three) and freshly baked cookies, with an aroma that fills the entire cabin, near the end of the journey.
Product differentiation is also important in business-to-business markets. Manufacturers of aluminum sheets used for cans have recently created growth opportunities through product dif-ferentiation. With the rising number of specialty drinks on the market, can manufacturers have developed containers in various sizes to meet this market niche. Another form of product differ-entiation that is now developing is in aluminum bottles, which were designed to compete with other types of containers. Aluminum bottles have been widely accepted in Japan, where they were first offered, and are now being introduced in other parts of the world.7
Market Segment Analysis
Every product and company has a specific customer base from which to draw. Market segmen-tation involves categorizing customers into groups and identifying the characteristics of each of these groups. Using this information, a firm’s management team can design product features and benefits that will be most attractive to the particular market segment and develop marketing materials that are more likely to resonate with them.
Figure 2.5 identifies the typical methods used to segment the consumer market. Most mar-keters understand demographics, and as a result, demographics are often used as segmentation strategies. There are many viable categories of segments solely based on age, gender, ethnic background, and so forth. Many marketers stop at that point. They go no further in understand-ing the various segments. As a result, the marketing plan is based on a demographic profile and not on a segment’s psychographic, behavioral, or geographic profile.
Psychographic segmentation examines mental characteristics and predispositions that are connected to purchasing habits. For example, the personality of someone who sees himself as being “macho” or “manly” may be connected to sales of products such as clothing, cologne, and other personal grooming items. The lifestyle of long-distance runners as a group ties them to purchases of sports equipment, energy drinks, and so forth, regardless of gender. A commonly used marketing technique known as AIO (activities, interests, opinions) identifies sets of con-sumers with common psychological characteristics that may in turn be used as target markets. A market segment is viable when
• a distinct group can be identified,• members of the group have money to spend, and• members of the group are willing to spend money on a specific good or service.
Low Price
StarbucksFrappuccino
High Price
PerceivedHigh
Quality
PerceivedLow
Quality
Jamba JuiceOrange Julius
Italian soda
Soft drinksSlurpees
Milkshakes
Figure 2.4 Positioning of Starbucks Frappuccino Blended Beverage

chapter 2 Market Analysis 37
Behavioral segmentation identifies segments by how consumers use a product, the benefits they derive from that product, and how often the product is purchased or used. A simple prod-uct such as chewing gum may be targeted at people who chew gum to help them quit smoking or people who chew gum because it calms them or tastes good, and its consumers may be cat-egorized as heavy, moderate, or light users.
Geographic segmentation targets the location of a company or the locations of potential buyers. Geographic segmentation strategies are often used in conjunction with other methods of identifying target markets. For example, geodemographic segmentation seeks out groups of consumers with identifiable demographic characteristics within a specific geographic region, such as male hunters in Deep South states.
Segmentation in the Exercise IndustryOften the marketing team is tempted to focus on who purchases a particular product rather than why. Answering the “why” question, however, may lead to a better understanding of the “who,” that is, the various segments. To illustrate, consider the fitness industry and the question “Why do individuals exercise?” The typical responses are likely to be
• to lose weight,• to maintain a healthy body,• to build muscle mass,• to prevent or counter a medical problem,• for enjoyment, and• to meet people.
Once the question “why” has been answered, the marketing group can proceed to describe each segment in terms of its demographic profile, psychographic composition, behavior, and possibly geographic location.
Consider the first group, individuals who exercise to lose weight. Demographically, the seg-ment consists primarily of females, the middle-aged, and the middle-income group. In terms of psychographics, these individuals typically have sedentary lifestyles and do not participate in any type of sports or athletic activities. They tend to be socially oriented and as a result are concerned about physical appearance. They may be fashion conscious and want to lose weight
Figure 2.5
Consumer Segmentation
Demographics• – gender, age, income, ethnicity, generational cohorts
Psychographics• – personality, lifestyles, activities, interests, opinions
Behavioral• – benefit, usage rate, occasion
Geographic• – city, county, state, region, country
Asking the question “why” provides a better understanding of the reasons women prefer group experiences rather than individual exercises.

part 1 MArKETING FOUNdATION 38
to look good in the newest fashions. They often enjoy shopping and especially like to shop for clothes and other personal items.
Notice that when the question “why” was answered, it resulted in a behavioral segmenta-tion approach. The benefit this segment desires is loss of weight. In terms of occasion, the desire to lose weight is often the result of a New Year’s resolution and due to overeating and lack of physical activity over the holidays. Most of these individuals are light to medium users of a fit-ness center. Their goal is to lose weight. Most are not regular users and never will be. They have a specific weight loss goal and, as a result, a time frame for usage.
The same approach can be used for each of the six segments identified through answers to the question “why.” The composition of each segment varies considerably. For instance, while there are some women who exercise to build muscle mass or tone muscles, most tend to be men. Individuals who exercise to prevent or counter a medical problem tend to be older and exercise only because they have been told to do so by a physician. They see exercise as a means of prolonging life, preventing a medical problem, or as a response to a medical problem. Someone who has experienced a heart attack may decide to start working out on a regular basis to prevent future attacks. Therefore, it helps to describe each segment using all four segmenta-tion categories. Creating effective marketing plans requires a richer understanding of each mar-ket segment than demographic variables alone will yield.
Business-to-business segmentation is performed in a similar fashion. Demographic or fir-mographic factors would include such variables as the number of employees, sales volume, and the number of locations. Firm psychographics include a business’s “personality,” the way the company conducts business, how decisions are made as well as the firm’s culture, growth orientation, and customer focus. Behavioral variables consist of the benefits a company derives from a product, the quantity purchased, the frequency of purchases, the timing of purchases, and the occasions for which the product is purchased. Geographic segmentation refers to the geographic location of the business. Businesses often cluster around customers and suppliers. When an automobile factory is built, a number of businesses will locate in close proximity to provide the parts needed by the automobile manufacturer. Likewise, a large number of compa-nies have located offices in Bentonville, Arkansas, to sell to Wal-Mart.
Identifying the Most Profitable SegmentsOnce the marketing segmentation is complete, the firm’s marketing managers must decide which segment or segments to pursue. Figure 2.6 provides a list of the major criteria. While all of the factors are important, the first factor is critical. The product being sold must match well with the benefits sought by the particular market segment being targeted (product/market match).
International House of Pancakes (IHOP) offers affordable meals in a family-oriented atmo-sphere. As such, the company serves three primary market segments. The first consists of low- to middle-income families with little or no education beyond high school. The secondary market is single adults, area employers that surround each IHOP restaurant, truck drivers, and transit travelers with similar income and educational levels as the first target. The third market is made up of individuals who work night hours or late evening hours and have the desire or need to eat meals during the night.
Once it is clear that the benefits offered by a company’s product match the needs and wants of a particular market segment or segments, it becomes essential to examine the size of the market segment, its sales potential, and its growth potential. The market segment must be large enough for the company to earn a sufficient profit. The larger the target segment, the higher the sales potential, and the higher the future growth rate, the more attractive the market segment.
If the market segment is viable from the standpoint of size and growth, then the analysis turns to the company’s ability to effectively reach the target segment. The marketing team nor-mally seeks to find out whether the company can reach the segment effectively with market-ing messages and how responsive the members will be. Not all segments are reachable. For instance, a competitor may control the channel or be so large in a particular region that it is not economically feasible for any new entrant. A competitor’s customer base may be so loyal that they will not listen to a new company’s marketing message.
Figure 2.6
Identifying the Most Profitable Segments
Product/market •match
Segment size•
Sales potential•
Growth potential•
reachability•
responsiveness•
retention potential•
Level of competition•

chapter 2 Market Analysis 39
Company leaders also examine the retention potential and the lifetime value of potential customers. Reaching customers with a message and persuading them to make an initial pur-chase is only part of the battle. The cost of acquiring a new customer is much higher than the cost of retaining a current customer. This makes it absolutely essential to retain customers when-ever possible. It is hard to survive when a company must continually acquire new customers.
The final factor to be considered is the degree of competition. The more intense the competi-tion within a segment, the less attractive it is. Most markets are now in the mature stage of the product life cycle. Consequently, a company cannot afford to give up customers and market share. Most competitors fight vigorously to prevent the loss of customers.
Customer Analysis
A customer analysis should be designed to provide companies with an in-depth understanding of customers. The more a company’s marketing team knows about the firm’s customers, the bet-ter it can serve them. Again, collecting demographic information about customers may not be enough. Marketing professionals try to understand customers from psychological, sociological, and behavioral viewpoints.
Types of CustomersTo begin the customer analysis process, the marketing team thinks about the various types of customers that the firm can reach. The most common type of customer is the consumer. Even manufacturers that do not sell directly to consumers need to understand them. Products must be designed to meet consumer needs. Most manufacturers prepare some marketing materials for end users in order to pull the product through the channel, and most retailers expect manufac-turers to help promote products.
In addition to consumers, many companies also sell to other businesses. This is not a func-tion of the distribution channel. Instead, this market consists of the other businesses that con-sume the good or service. If the business simply resells the product, then it is the channel of distribution. The final type of customer group to be considered is nonprofit organizations. Nonprofits include various levels of government. Schools, hospitals, and charitable organiza-tions such as the Red Cross are nonprofits.
Managers in every business organization make decisions about how to handle the Internet and whether the company will sell products directly. While offering merchandise from the Internet provides direct access to customers and increases profit potential, it also has potential pitfalls. A product being sold by other channel members causes the marketing team to give careful consideration to the impact Internet selling may have on those wholesalers and retail-ers. Purchases made over the Internet mean lost sales for channel members. This may create an adverse situation where the channel members reduce efforts to sell the company’s products. To keep this from happening, some companies offer product information over the Internet but then refer potential customers to a channel member for the purchase.
The Ws of Customer AnalysisThe goal of a customer analysis is to collect detailed information about customers in order to develop effective marketing plans. Typically, a customer analysis involves answering the ques-tions “who,” “where,” “when,” “what,” and “how.” Finding out “who” provides a demographic and psychographic profile of customers. Sometimes one target market is served, while in others, the goal is to reach multiple target markets. The marketing team will develop a profile for each type of customer that requires a different marketing approach. For example, when demograph-ics are used, it may be that the product benefits sought by the 18- to 30-year-old female target market are substantially different from the benefits sought by females 31 to 45 years of age. In that case, the two segments should be described separately.

part 1 MArKETING FOUNdATION 40
The “where” question identifies the location or locations in which products are purchased. For an item purchased in a retail store, which types of retail stores? Is it primarily purchased at discount stores or department stores? In addition, what other products typically are purchased with it? The answers can be especially helpful in the placement of the product in the store, in various geographic areas, and in creating tie-in promotions with various retailers.
Serious consideration must also be given to the Internet. Are online sales feasible? If so, what other sites does a person visit before and after purchasing or examining the product? The pur-pose of asking “where” is to determine not only where the product is purchased but also what other types of products are purchased or examined with it.
“When” involves determining the most likely times a product is purchased. This informa-tion can be extremely valuable in the timing of a marketing campaign. While a product such as candy may be purchased all year, there are spikes in sales at Halloween, Christmas, and Easter. The question of when is often closely tied to the question of where. For instance, if a product is placed in a point-of-purchase (POP) display at the end of a retail aisle during a holiday, sales may be greater than if the POP display is used during nonholidays.
The “what” is a crucial issue. What are customers purchasing? In most cases, rather than the product’s attributes, it is the benefits those attributes deliver. Most people have no idea what chemicals are used in cosmetics; however, they do know how a particular brand of cosmetic makes them feel and how it enhances beauty. Few people can tell you how automobiles run, yet they can tell you how it makes them feel to be seen in a sleek red convertible. Ford’s leader-ship understood this concept when the company offered the “retro” Mustang in 2005, which looked like the first Mustangs built in the 1960s. While young people purchased the car, the target market for the retro Mustang was baby boomers, who were teenagers in the 1960s. Many owned Mustangs or idealized those who did. The car immediately resonated with this target market because it brought back their “youth” and gave them an opportunity to feel like a teen-ager again. To this market, the purchase was not a car but rather reliving of their teenage years.
where are consumers likely to go to purchase
carpeting for their homes?

chapter 2 Market Analysis 41
Consumer Buying Decision Making
The “how” of a customer analysis involves examining how purchases are made. It is not just the method of payment: cash or credit. It is the entire process. Figure 2.7 identifies the steps in the consumer buying decision-making process. The purpose of a customer analysis is to examine each step with the goal of understanding how consumers arrive at purchasing decisions.
Problem RecognitionIn the first step, the problem recognition stage, the question of “what,” as noted previously, helps describe what triggers the problem or need. A need may emerge from something as simple as running out of a product, such as toothpaste, or it may be more complex. Someone might see that a neighbor has just purchased a new stereo system. To keep pace or to maintain the impression that the person is successful, she may wish to purchase a similar or better stereo system.
Internal Information SearchWhen a problem or desire is triggered, the consumer first conducts an internal search in which he examines personal internal knowledge structures while seeking a solution. If the person was satisfied with his last purchase of a brand, then the search process will typically be very short. If the same person was dissatisfied with the last brand or desires something new, then he will give more thought to possible solutions and brands. If a consumer feels neutral about the last pur-chase, then the individual is likely to spend at least some time thinking about other brands.
When considering an internal search for information, two concepts are important: share of mind and share of heart. Share of mind deals with brand recall and whether or not the brand is typically located in customers’ minds. Share of heart reflects attitudes or feelings toward a com-pany’s brands and the consumer’s willingness to purchase the brand. A brand may create a high share of mind so it is readily recalled but still have a low share of heart because the brand cre-ates a neutral or negative reaction so that the product is not considered as a viable alternative.
Share of mind can be measured by asking consumers to name the first two or three brands that come to mind when a product category is suggested, such as toothpaste. Share of heart is measured by asking consumers which brand they would prefer. The idea is to be high in both share of mind and share of heart. Usually only one or two firms per industry achieve such
ProblemRecognition
InformationSearch
Evaluation ofAlternatives
PostpurchaseEvaluation
PurchaseDecision
Figure 2.7 Consumer Decision-Making Process

part 1 MArKETING FOUNdATION 42
a status. It is more common for a brand to score considerably higher in share of mind than in share of heart. As greater brand par-ity creeps into product industries, however, less distance separates brands in terms of share of heart.
Figure 2.8 displays the results of a mar-keting analysis of pizza restaurants in a Midwestern city. Respondents were asked to name the first two pizza restaurants that came to mind. They were then asked to identify their top choice. Notice that Pizza Hut had the highest share of mind, with a score around 80%; Johnny’s was second, and Domino’s third. All three had share of mind scores of 50% or higher. Much lower were Fox’s and Cici’s.
Before interpreting the concept of share of heart, notice the dotted line. It represents the point where share of mind equals share of heart. If a brand was located on the line that would mean that every person who
mentioned it as one of the top of mind brands also chose it as their top choice. The local pizza res-taurant, Johnny’s, is almost in this position. Of the individuals who named it as top of mind, most (236 of the 280) also said it was their top choice. Notice Fox’s has a very low share of mind, cited by only 15% of the sample. Most people do not think about it in their list of top two. If they did, however, it was almost always their top choice since about 11% of the sample said it was their pre-ferred restaurant. Of the brands mentioned for this particular location, Domino’s has the weakest position. The company has a relatively high share of mind, but an extremely low share of heart.
A perceptual map presents a wealth of information about the position a brand occupies in the minds and hearts of consumers. Figure 2.8 suggests that Domino’s marketing team may need to develop a plan aimed at increasing loyalty since less than 5% said it was their top choice, yet over 50% cited it as one of their two top of mind brands. Fox’s Pizza, however, should create a plan to increase awareness.
The concept of share of mind continues to be important when investigating business-to-business markets and the company’s distribution channel. A few years ago, Mazda’s marketing group concluded that share of mind was crucial for its branding rebirth campaign. Mazda had few stand-alone dealerships. Most of the time, the cars were featured in dual or multiple dealer-ships, with Mazda being the No. 2 player or lower. To increase emphasis of the Mazda brand name at these dealerships, Mazda offered dealerships three different but closely tied incen-tives. Dealerships could earn up to 3% of the sticker price for each vehicle sold if the dealership (1) improved sales, (2) improved customer service, and (3) improved facility design. If the dealer-ship only met one or two of the three, then the incentive was reduced accordingly to 1% or 2%, respectively. That meant a dealership selling 500 Mazda vehicles a year with an average sticker price of $20,000 could earn an extra $300,000 per year if the company met all three incentives.8
Customer service plays a crucial role in share of heart. In many instances, entry-level work-ers and their supervisors have the greatest impact on these feelings. A customer evaluating Pizza Hut is most likely going to consider the closest local outlet rather than the entire chain when expressing positive or negative feelings. Someone who is treated well by the local unit on a con-sistent basis is most likely to have a positive share of heart response.
External Information SearchWhen a consumer cannot satisfy a need with a good or service identified in an internal search, the individual conducts an external search for additional information. External sources typically include
Share of Heart
Shar
e of
Min
d100
100
Pizza Hut
Domino’s
CiCi’s
Johnny’s
Fox’s
50
50
Figure 2.8 Share of Mind/Heart of Pizza Restaurants

chapter 2 Market Analysis 43
• family and friends, or word-of-mouth information;
• magazine and newspaper articles;• visits to stores;• surfing the Internet; and• examining advertisements and other
marketing materials.
Each of these may be given a different weight in the mind of the shopper. Some have more credibility and have more impact than others.
Evaluation of AlternativesThe next step in the decision-making pro-cess is the evaluation of the alternatives. This includes alternative products as well as alter-native brands within a product category. Understanding how consumers conduct the evaluation helps in developing an effective marketing campaign. Consumers often use one of three methods or combinations of the three methods. The methods are (1) affect referral, (2) the evoked set, and (3) the multi-attribute method.
In the affect referral method, consumers choose the brand (or product) that they like or about which they hold the most positive feelings. The term affect refers to the affective compo-nent of an attitude, which is the feeling or emotional component. Consumers choose the brands for which they have the highest positive emotions.
The second method is the evoked set method. This method models circumstances in which a consumer chooses a brand from a set of brands that are viewed as acceptable. The acceptable brands constitute the evoked set. In many product categories, consumers have two or three brands that are viewed as up to standard and often as being of comparable quality. For certain products, such as restaurants, being part of the evoked set is important, because only brands in the evoked set are considered.
Two other sets of products or brands exist, the inept set and the inert set. The inept set holds the brands the consumer will not purchase. Normally, this occurs because of a bad per-sonal experience. The inert set contains the brands the consumer knows little or nothing about. Consumers have neither positive nor negative attitudes about the brand, because they know little about it.
The final method of evaluation, the multi-attribute approach, is the most complex. The approach matches high-involvement purchases and socially visible products. In this method, the consumer’s attitude toward the product is determined by9
• the brand’s performance on product or brand attributes and• the importance of each attribute to the consumer.
The concept is that an individual evaluates alternatives based on several key attributes, knowing that it is highly unlikely that one brand will score the highest on all attributes. Thus, the person considers how important each attribute is, how well each brand scores on each attribute, and which brand performs the best overall.
Understanding the information search process helps in two primary ways. First, by examin-ing the internal search process, marketers can discover the mental processes that occur when individuals search for solutions to problems they have just recognized. Second, by studying the external search process, marketers have better knowledge about where consumers search for additional information.
For your community, which pizza places would have the highest scores for share of mind? what about share of heart?

part 1 MArKETING FOUNdATION 44
The Purchase DecisionThe fourth step is the purchase decision. It is useful to understand that many factors may influence the final decision. In-store signage, promotions, and other factors may alter the final decision. Knowing about them may help pre-vent the competition from winning a brand’s customers.
Postpurchase EvaluationPostpurchase evaluations are the final key step. In a nutshell, if a customer is satisfied, then retention becomes easier. If she is not, then a firm’s marketing department may make use of customer recovery programs or damage control measures. Understanding how consumers eval-uate a product after it is purchased is critical in providing goods and services that yield higher levels of customer satisfaction.
Demand and Market Potential
Thus far, this chapter has focused on the behavioral side of market analysis. This section is devoted to the numerical side. Many times, the marketing department may be asked to provide demand estimates and contribution margin projections. The most common methods used to calculate these estimates are described next.
Understanding DemandThree terms are commonly used when discussing demand: (1) market potential, (2) market demand, and (3) company or brand demand. Market potential consists of the total number of individuals (or businesses) that could potentially purchase a particular product. It is the maximum number of potential customers. Market demand is the total current existing demand for a product, which is the sum of all brands sold within a product industry. Company or brand demand is the demand for a particular company’s brand, and it is often referred to as market share.
To illustrate the differences in these terms, consider the demand for personal computers in China. The following statistics apply to Chinese households, based on per capita income, national wealth, and other factors:
Market potential = 101 million households that might want personal computers.
Market demand = 27 million households that have purchased personal computers.
Company demand = Demand for one brand (e.g., Apple in China) (or market share)
= 10 million
27 million (Apple’s Market Share)
= 37% of the Chinese market.
One additional factor may also be considered, called the penetration rate. It is calculated as follows:
Penetration rate = Market demand = 27 million = 27%. Market potential 101 million
when someone chooses a place to eat, why is it important for a
restaurant to be in the consumer’s evoked set?

chapter 2 Market Analysis 45
Many factors can influence the pen-etration rate for a product and how quickly market demand grows (see Figure 2.9). Market research can be used to identify how strongly each factor is influencing market potential and increasing market demand. This type of analysis can be used to develop a marketing approach that will increase the number of users of the prod-uct or the primary demand for the product with the goal of increasing the current mar-ket demand until it reaches the full market potential point.
Market Potential FactorsFigure 2.9 suggests that market penetration is affected by the number of individuals or households that are aware (or unaware) of a product. The greater the level of awareness for a product, normally the higher the penetration rate will be.
Product availability often becomes an issue early in the release of a new product. Consumers may be aware of a product but do not buy one because it is not available. This can also be the case in international expansion, especially when distribution channels in the new country are not fully developed.
The third factor that influences market penetration is the lack of attractive benefits. If indi-viduals do not understand a product’s benefits or do not see them as more attractive than the benefits of what they currently use, then it is unlikely they will purchase the new product. Closely tied to the lack of attractive benefits is the availability of substitutes. As an example, consider the unique, tangible benefits that cell phones offer when compared with landline phones (mobility, low long-distance charges). At the same time, consumers who are home-bound and those who do not make long-distance calls may not see any real new benefits from cell phones and probably will not buy them.
The final factor influencing market penetration is the availability of resources. In some coun-tries, available resources are a major factor for high-tech products such as personal computers and cell phones. While consumers in poorer countries may wish to buy cell phones or personal com-puters, their incomes may not be high enough to purchase both. Thus, while personal computers may be desirable, many individuals who live in poverty can only afford to purchase cell phones, because of the lower price, especially when a cell phone can be a substitute for a landline phone.
Estimating Demand
Few marketing managers are asked to calculate market potential, market demand, and rate of market penetration. The information is normally provided by trade associations, marketing research companies, and research institutions. Most marketing departments will, however, be asked to calculate company or brand demand.
Brand demand is used for a wide variety of purposes, such as for developing budgets, pro-duction levels, staffing levels, and stocking units. Figure 2.10 lists the primary methods of esti-mating the demand for a particular brand.
Customer surveys are used in industries where the number of buyers is relatively small. For instance, Boeing often uses customer surveys to evaluate the demand for jet aircraft. Producing each airplane is expensive and time-consuming. Boeing’s marketing team obtains estimates about how many aircraft are required, which sizes, and when the various buyers anticipate plac-ing orders. The same type of survey can be used by companies that build jet engines or other components of an aircraft. These types of surveys are relatively accurate in business-to-business
Lacks financial resources
Lacks attractive benefits
Availability of substitutes
Product not available
Unaware of product
Market potential
Market demandCurrent market demand
Figure 2.9 Factors Influencing Market Penetration Rate
Figure 2.10
Methods of Estimating Demand
Customer surveys•
Sales force estimates•
Executive opinions•
Quantitative methods•– Trend projections– Moving averages– Exponential
smoothing– regression analysis

part 1 MArKETING FOUNdATION 46
markets, where there are a limited number of customers and projections of future needs are relatively stable.
For consumer good companies and other types of high-volume sales situations, a sales force estimate is often used. The sales force estimates future sales when this method is employed. Normally, a 1- or 2-year prediction is made. When asking members of the sales force for esti-mates, researchers must be careful about how the information is gathered and how it is used to avoid a bias in the estimates. When the estimates are used to set sales quotas, salespeople tend to provide lower numbers so that the quotas are less difficult to reach. When the estimates are not used for quotas, then salespeople might be more optimistic and suggest higher numbers. Many companies use the latter method and then adjust the sales estimates with a set reduction percentage, knowing that salespeople tend to inflate what they believe they will sell. That is, a salesperson who sold 3,000 units this year may project that he can sell 4,000 next year.
A third approach is executive opinion. This method avoids some of the pitfalls of the sales force estimate since experts and/or executives are asked their opinion. Typically, this method employs the Delphi technique to arrive at the final demand estimate. The Delphi method involves receiving an initial estimate from each executive. The first batch is then sent back to the group. Members are asked to reevaluate their initial estimate and send in a new one based on a review of what the other executives submitted. This iterative process continues until all the executives agree on a specific number or range for the forecast. The advantage of the execu-tive opinion approach is that company leaders often have the most specific knowledge about the market. It may, however, be hard to recruit executives to participate, especially because the Delphi method may be viewed as being time-consuming.
Quantitative MethodsFor current products on the market, quantitative methods can be used. These base future projection on past sales histories. They work well for relatively stable markets. They are not as effective when markets experience high levels of fluctuation or when they are not stable. Quantitative methods are also less accurate when significant changes in sales are related to extraneous environmental events.
Trend projections take past sales figures and use them to predict the future. If there is a steady rise in sales over time, then a clear trend exists and future predictions should be relatively accurate. For instance, if over the past 10 years of sales, data show a steady increase of about 1.35% per year, then it can be assumed that sales for the next year will also rise by 1.35%. The more past demand has fluctuated, the less reliable using a trend projection becomes.
The moving average method makes a prediction based on average sales over past periods. The researcher can set the number of periods to use, such as over the past 3 years. If sales in the past 3 years have been $1.5 mil-lion, $1.7 million, and $1.2 million, the moving average would be the total of these three sales figures divided by 3, resulting in a prediction of $1.46 million for the upcoming year. This method works better than the trend projection if sales have fluctuated some during the past years but the fluctuations are not great. The number of periods in the moving average can be adjusted to allow for normal business or eco-nomic cycles.
Exponential smoothing is used when the past years’ data indicate little variation and no identi-fiable trends. It involves adjusting the prediction by a calculation that accounts for any variance in the last period’s forecast. Exponential smoothing works well in situations where demand remains stable over time.
which of the quantitative methods
of projecting sales would be appropriate
for forecasting sales of children’s shoes?

chapter 2 Market Analysis 47
The final quantitative method is regression analysis. Regression analysis may be used to identify variables that have an impact on demand. The types of variables vary depending on the product being sold. The list of variables may include national statistics such as the inflation rate or the consumer price index (CPI), state variables such as per capita income or the number of housing starts, and company statistics such as the size of the advertising budget, the number of sales calls by the sales staff, and the price of the product. Other variables may be competitive factors such as the price the primary competitors charge for the product, the number of retail outlets where the product is sold, and the size of the shelf space allotted by retailers. The pur-pose of a regression analysis is to incorporate all of the variables that the researcher believes may have an impact on the demand for a product. It is a much more sophisticated form of fore-casting and is often more accurate than the other quantitative methods.
Contribution Margin and Break-Even Point
Two other calculations marketing managers are often asked to make are contribution margin and break-even. These two numbers have many different applications but involve the same basic concepts. The contribution margin is a number that represents the additional revenue that money spent on a marketing program adds to the company’s financial position as compared with the costs of the program. For example, if a company spends $10,000 on a booth at a trade show and the projections are that the booth generated $15,000 in new business revenues, then the following calculation would result:
Contribution margin = Additional revenues − Costs
= $15,000 − $10,000
= $5,000.
Contribution margins may also be calculated for individual products or units. For example, if a restaurant owner adds French fries to the menu and calculates that each serving of fries costs 75 cents to produce and is sold at a price of $1.25 per serving, the contribution margin is as follows:
Contribution margin = Additional revenue per unit − Cost per unit
= $1.25 − $0.75
= $0.50 per serving.
A break-even point is the number of units that must be sold to cover both the fixed and the variable costs involved in producing a product or the number of additional units that must be sold to cover the costs of a marketing program. In the French fries example above, the fixed costs are those associated with buying the frying machine. If the machine cost $1,600, that is the fixed cost number. The variable costs are those associated with the ingredients (sliced potatoes, cooking oil). The break-even point is calculated as follows:
Break-even point = Fixed cost
Contribution margin (Price per unit – Variable cost per unit)
= $1,600
$0.50
= 3,200 units of French fries must be sold to break even.
In introducing new products, marketing managers often calculate break-even points. These help in determining whether a particular product should be offered. The same is true for adding marketing programs. In such situations, a company’s leadership examines how many additional units must be sold in order to cover the costs of the proposed marketing program.
Contribution margin calculations and break-even point analyses are tools designed to assist the marketing team in spending dollars wisely. While the numbers are valuable, they must always be considered within the context of other marketing activities.
part 1 MArKETING FOUNdATION 48
Careers in MarketingCareers in marketing vary widely. The primary categories include advertising, marketing research, product or brand management, public relations, sales, and sales promotions. Within each of the categories are a number of different types of jobs.
AdvertisingAdvertising consists of a broad field with individuals employed in an array of industries. Most jobs in advertising are with advertising agencies. Some firms employ advertis-ing experts to oversee in-house responsibilities, while others completely manage all advertising efforts. Some of the most common jobs in advertising include the following:
Account executive—handles all aspects of an •account and represents the advertising firm with cli-ents. Responsibilities include coordinating the plan-ning, creating, production, and implementation of an advertising campaign. Most account executives are also required to make new contacts and solicit new accounts. This job involves a variety of management skills, because the executive directs the activities of most of the other individuals in the agency.Media planner—determines the best mix of tradi-•tional and nontraditional media to use for advertis-ing campaigns, matching media with the company’s target market.
Media buyer—is responsible for purchasing media •space and time.Copywriter, creative illustrator—are responsible for •the creative aspect of advertising. They design ads and write copy.Traffic manager—is responsible for coordinating •the in-house activities of an advertising agency for the various campaigns and creative work being done. The traffic manager oversees the selection of personnel to work on various accounts and moni-tors all the work being done to ensure deadlines are met, which requires a number of managerial skills.
To prepare for careers in these areas, standard marketing courses are the starting point. A media planner and buyer may also take courses in communication to better under-stand the media. Copywriters and creatives often receive training in creative writing, art, music, and even theater or drama. A traffic manager will employ skills learned in accounting courses and will also have a marketing degree.
Marketing ResearchMarketing researchers work with marketing managers or in independent research firms to conduct various types of research on consumer and business-to-business buyer behav-iors. They design research projects, collect data, analyze data, and report findings to marketing managers. Researchers also collect data on market activities on an ongoing basis, such as the Nielsen media-rating reports. Marketing researchers may work for advertising agencies, marketing research firms, or corporations. In addition to marketing knowledge, these positions require solid statistical skills as well as training in the various types of research methods.
Product or Brand ManagementProduct or brand managers are responsible for managing a particular product category, such as the beverage category for a particular company, or managing a particular brand, such as Nabisco. They are responsible for the oversight of all
YOuRCAREER

chapter 2 Market Analysis 49
aspects of brand or product management, including product modifications, package design, advertising, and sales promo-tions. The success or failure of a brand or product category rests on the shoulders of this individual.
Larger companies, such as Kraft, Procter & Gamble, and 3M, normally have a number of positions under the product or brand manager. These include market analysts, assistant managers, and individuals in charge of specific brands within a product category. Such companies also employ individuals who are responsible for managing a specific brand for a spe-cific client, such as managing the Oscar Mayer brand for the Wal-Mart or Target account.
Brand and product managers usually need a number of years of marketing experience as well as a broad knowledge of both marketing and management.
Public RelationsThe standard jobs in public relations are with specialized companies that provide public relations services. Many orga-nizations and companies also have a public relations officer or staff. The responsibilities of the public relations depart-ment are to interact with the various constituencies of the organization, deal with the media, and promote the organi-zation in a positive way. Public relations individuals work closely with any sponsorships or cause- or event-related mar-keting efforts. Most jobs in public relations require a degree in journalism or communications, although some individuals with marketing degrees work in the public relations field.
SalesThere are more career opportunities in sales for individuals with marketing degrees than in any other area of market-ing. Sales positions vary widely from retail sales to corporate sales. Most sales positions are in the business-to-business and channels sectors. Salespeople call on large retail accounts, such as Wal-Mart, Best Buy, or JCPenney. They also call on manufacturers, such as General Electric and Sony, to sell raw materials and component parts. Salespeople are seen
in almost every industry, including nonprofit organizations. The responsibilities of salespeople vary depending on the size of the accounts. For all salespeople, the primary goal is to encourage someone to make a purchase. Salespeople are on the revenue-generating side of a business. This means the income potential is normally higher than for other market-ing types of jobs. This is especially true if commissions are paid on sales. Sales training consists of marketing courses, training in effective human interaction, and product- or company-specific knowledge.
Sales PromotionsSales promotions include both consumer promotions and trade promotions. In large companies, these responsibilities are divided. In smaller companies, they are often combined. The sales promotion manager selects the proper sales pro-motions to accomplish specific brand, product, or corporate objectives. This individual is responsible for overseeing the creation of the promotion, the advertising of the promo-tion, and its implementation. Most sales promotions efforts are geared to specific targets, and because results are usu-ally measurable, sales promotions jobs have a high degree of accountability. Sales promotion positions involve managerial activities such as planning and control processes and require marketing knowledge.
International CareersAs companies become more global, the need for marketers who can assist in international marketing will continue to rise. All the careers presented here are available in interna-tional firms and advertising agencies. In addition, the posi-tion of cultural assimilator, the primary person responsible for making sure every marketing activity matches the cultural and language specifics of a particular country, is present in a variety of international companies. Training for careers in international marketing includes marketing courses, foreign language classes, plus country-specific knowledge regarding cultural issues and cultural sensitivity.

part 1 MArKETING FOUNdATION 50
Chapter Summary
Market analysis involves studying company customers and competitors along with the overall industry and envi-ronment. The average market analysis program consists of analyses of the environment, competition, product positioning, market segments, and customers.
An environmental analysis is normally composed of studies of political, social, economic, technological, and semicontrollable forces. Each must be understood to help assess the potential impact on current and future activities.
A competitive analysis begins with understanding all the levels of competition that a product and a company face. Then, an investigation of competitors reveals more specific information to which the marketing team can form a response.
Product positioning helps the marketing team under-stand the place a good or service holds in the minds of consumers and relative to the competition. Four com-ponents should be considered: (1) the target audience, (2) the good or service, (3) the frame of reference or cat-egory, and (4) the point of differentiation or uniqueness. Then, a positioning strategy can be employed based on the product’s attributes, uses or applications, competitors, product users, product class, the price/quality relationship, or through a cultural symbol approach. Perceptual map-ping is helpful in understanding product positioning.
Market segments can be identified through the demo-graphic, psychographic, behavioral, and geographic
characteristics of consumer markets. The most profitable segments are identified using variables such as the prod-uct-market match, segment size, sales potential, growth potential, reachability, responsiveness, retention poten-tial, and levels of competition. It is also crucial to identify viable business-to-business segments.
Customers may be analyzed by type, where three categories exist: (1) consumers, (2) other businesses, and (3) nonprofit organizations. Applying the steps of the buy-ing decision-making process can help the marketing team identify key opportunities to present and promote goods and services. Share of mind and share of heart are desired brand characteristics.
Many times the marketing team will be asked to estimate demand. This may be accomplished by studying market potential, market demand, and company or brand demand. It is helpful to identify the factors that will influence the mar-ket penetration rate of a company and its products. Demand is estimated using customer surveys, sales force estimates, executive opinions, and various quantitative methods.
Contribution margin and break-even analyses are designed to help the marketing team understand the values of various marketing activities. These techniques point to times when a marketing program has been suc-cessful and when it has not; however, the simple figures must always be used in the context of evaluation of the entire short- and long-term marketing program.
Chapter Terms
Brand equity (p. 33)Brand parity (p. 33)Economic forces (p. 27)Market analysis (p. 26)Market segmentation (p. 36)Political forces (p. 27)Product differentiation (p. 36)
Product positioning (p. 34)Semicontrollable forces (p. 28)Share of heart (p. 41)Share of mind (p. 41)Social forces (p. 27)Technological forces (p. 28)
Review Questions
1. Define market analysis. What analyses are a part of a market analysis program?
2. What forces are identified as part of an analysis of the company’s environment?
3. Describe the levels of competition various products and companies face.
4. Define product positioning and brand parity. How are the concepts related?
5. What types of product-positioning strategies are used by marketing managers?
6. Explain the nature of perceptual mapping.
7. Name the factors that are used to identify consumer market segments.
8. Name the factors that are used to identify profitable market segments.
9. Describe the Ws of customer analysis.
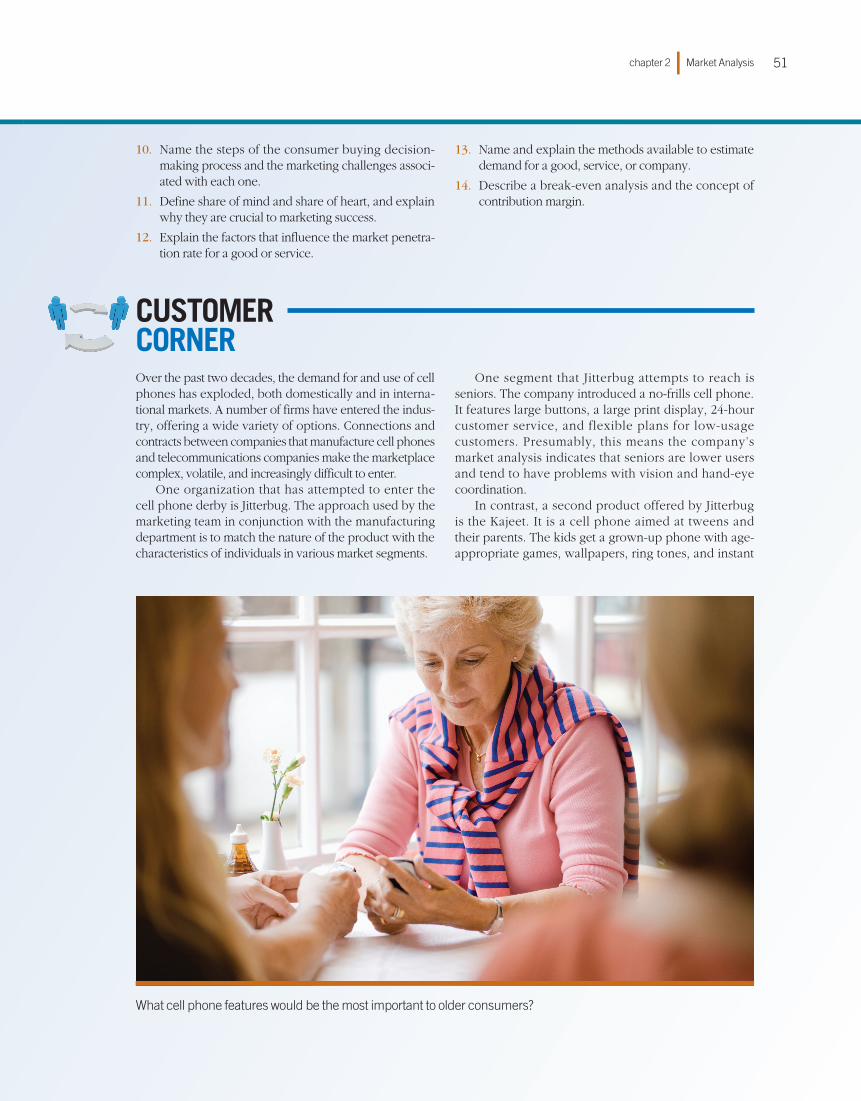
chapter 2 Market Analysis 51
CuSTOMER CORNEROver the past two decades, the demand for and use of cell phones has exploded, both domestically and in interna-tional markets. A number of firms have entered the indus-try, offering a wide variety of options. Connections and contracts between companies that manufacture cell phones and telecommunications companies make the marketplace complex, volatile, and increasingly difficult to enter.
One organization that has attempted to enter the cell phone derby is Jitterbug. The approach used by the marketing team in conjunction with the manufacturing department is to match the nature of the product with the characteristics of individuals in various market segments.
One segment that Jitterbug attempts to reach is seniors. The company introduced a no-frills cell phone. It features large buttons, a large print display, 24-hour customer service, and flexible plans for low-usage customers. Presumably, this means the company’s market analysis indicates that seniors are lower users and tend to have problems with vision and hand-eye coordination.
In contrast, a second product offered by Jitterbug is the Kajeet. It is a cell phone aimed at tweens and their parents. The kids get a grown-up phone with age-appropriate games, wallpapers, ring tones, and instant
10. Name the steps of the consumer buying decision-making process and the marketing challenges associ-ated with each one.
11. Define share of mind and share of heart, and explain why they are crucial to marketing success.
12. Explain the factors that influence the market penetra-tion rate for a good or service.
13. Name and explain the methods available to estimate demand for a good, service, or company.
14. Describe a break-even analysis and the concept of contribution margin.
what cell phone features would be the most important to older consumers?

part 1 MArKETING FOUNdATION 52
1. Describe an environmental analysis on these three lev-els, for these three types of companies:
A local radio station•A regional chain of radio stations operating in four •western statesA national radio network•
2. You are a member of the marketing department for a manufacturer of recliners and other closely related fur-niture products, such as living room chairs that do not recline. You have been assigned by your supervisor to gather competitive information on all your company’s relevant competitors. Describe how you will go about completing this task in terms of identifying the levels of competition and how exactly you will gather com-petitive information.
3. The Roughneck Well Drilling Company is in the busi-ness of drilling for water, oil, and natural gas. Identify the consumer markets that are available to the com-pany. Identify the business-to-business market seg-ments for the company. Are there any nonprofit organizations that also may be reached? If so, which ones?
4. Walk through the steps of the consumer buying deci-sion-making process for a company’s line of lipstick products. Draw a perceptual map that explains the lip-stick’s position in the industry and as part of an exter-nal information search by an individual consumer. Apply the following concepts to the analysis:• Share of mind• Share of heart• Affect referral• Evoked set• Inept set• Inert set
5. Explain the following concepts:• Market potential• Market demand• Company or brand demand
Apply the concepts to the following products:
• MP3 players for automobiles• Global positioning systems (GPS) for combination
cell phone/personal computer products• Long-term care insurance (nursing home cost cov-
erage) for the elderly• Diet centers for women
6. Table 2.3 provides sales data for Thomas Enterprises from 2000 to 2008. Using the quantitative forecast-ing methods of trend analysis, moving averages, and exponential smoothing, forecast sales for 2009.a. For trend analysis, run a simple regression analy-
sis with sales as the Y or dependent variable and the year as the X or independent variable. The beta coefficient for the X variable will be the trend of the sales data. To predict sales in 2009, add the beta coefficient to the 2008 sales figure.
b. For moving averages, use a 4-year moving aver-age. Add the sales for 2005 through 2008, and divide by 4. The answer will be the forecast for 2009.
c. For exponential smoothing, use a smoothing coef-ficient of 0.3. The sales prediction for the 2008 year using exponential smoothing was $879,235. To forecast sales for 2009, use the following formula:
2009 Sales = (2008 Actual sales × 0.7) + (2008 Forecast × 0.3).
Discussion and Critical Thinking Questions
messaging. Parents can turn the phone off at certain times of the day and control who pays for what.
For wealthier individuals who are pressed for time, Jitterbug offers the Voce. This phone costs $200 a month and is a leather or gold-plated Motorola cell phone. The fee includes annual upgrades and access to a virtual per-sonal assistant that is available 24 hours a day to sched-ule appointments, make reservations, and handle other tasks.10
1. Using the information from this chapter, describe the market segments Jitterbug is attempting to reach as well as those it is not.
2. Explain the concepts of market potential, market demand, and company demand as they apply to cell phones and to the various brands mentioned in this Customer Corner.
3. Develop a set of talking points for supervisors working with individual salespeople who will explain the various products to customers.
4. Create a set of ideas about advertisements and promotions that would be sent along to creatives and those in the promotions department to help them develop specific marketing materials for each product and each market segment.
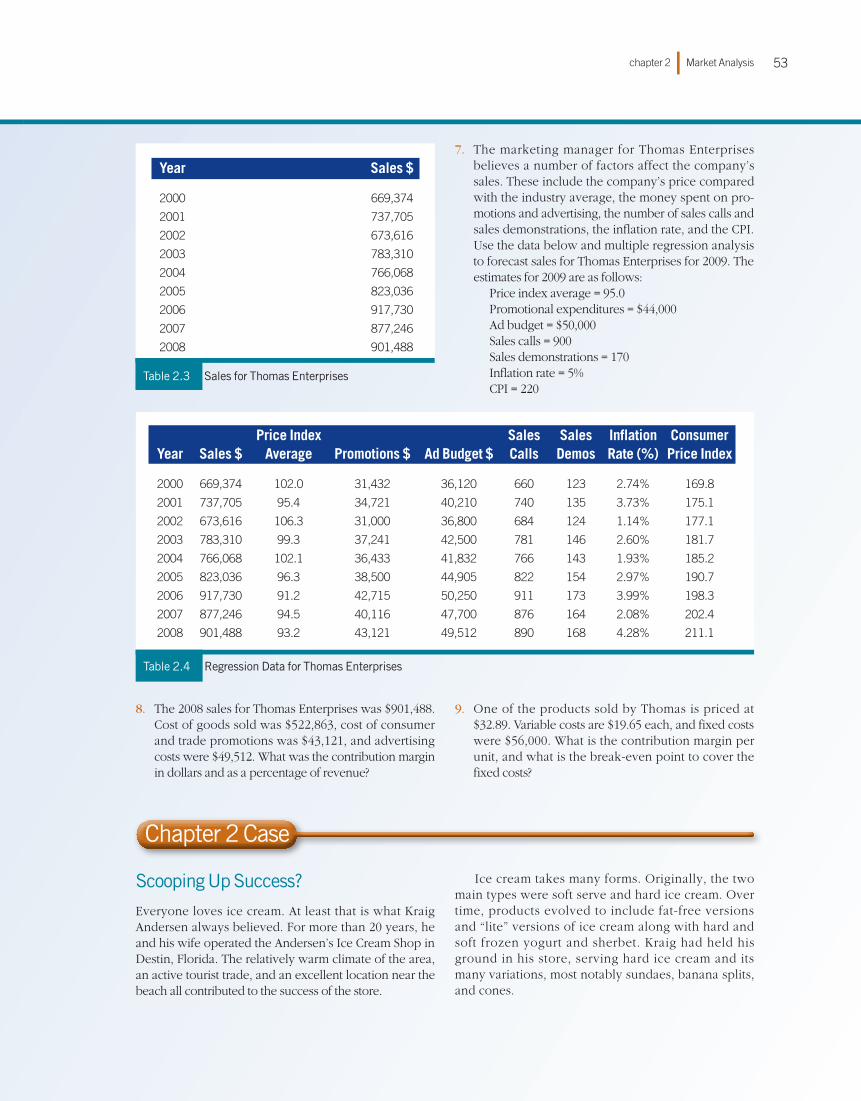
chapter 2 Market Analysis 53
Chapter 2 Case
Table 2.4 Regression Data for Thomas Enterprises
Price Index Sales Sales Inflation Consumer Year Sales $ Average Promotions $ Ad Budget $ Calls Demos Rate (%) Price Index
2000 669,374 102.0 31,432 36,120 660 123 2.74% 169.8
2001 737,705 95.4 34,721 40,210 740 135 3.73% 175.1
2002 673,616 106.3 31,000 36,800 684 124 1.14% 177.1
2003 783,310 99.3 37,241 42,500 781 146 2.60% 181.7
2004 766,068 102.1 36,433 41,832 766 143 1.93% 185.2
2005 823,036 96.3 38,500 44,905 822 154 2.97% 190.7
2006 917,730 91.2 42,715 50,250 911 173 3.99% 198.3
2007 877,246 94.5 40,116 47,700 876 164 2.08% 202.4
2008 901,488 93.2 43,121 49,512 890 168 4.28% 211.1
7. The marketing manager for Thomas Enterprises believes a number of factors affect the company’s sales. These include the company’s price compared with the industry average, the money spent on pro-motions and advertising, the number of sales calls and sales demonstrations, the inflation rate, and the CPI. Use the data below and multiple regression analysis to forecast sales for Thomas Enterprises for 2009. The estimates for 2009 are as follows: Price index average = 95.0 Promotional expenditures = $44,000 Ad budget = $50,000 Sales calls = 900 Sales demonstrations = 170 Inflation rate = 5% CPI = 220
Table 2.3 Sales for Thomas Enterprises
Year Sales $
2000 669,374
2001 737,705
2002 673,616
2003 783,310
2004 766,068
2005 823,036
2006 917,730
2007 877,246
2008 901,488
8. The 2008 sales for Thomas Enterprises was $901,488. Cost of goods sold was $522,863, cost of consumer and trade promotions was $43,121, and advertising costs were $49,512. What was the contribution margin in dollars and as a percentage of revenue?
9. One of the products sold by Thomas is priced at $32.89. Variable costs are $19.65 each, and fixed costs were $56,000. What is the contribution margin per unit, and what is the break-even point to cover the fixed costs?
Scooping Up Success?
Everyone loves ice cream. At least that is what Kraig Andersen always believed. For more than 20 years, he and his wife operated the Andersen’s Ice Cream Shop in Destin, Florida. The relatively warm climate of the area, an active tourist trade, and an excellent location near the beach all contributed to the success of the store.
Ice cream takes many forms. Originally, the two main types were soft serve and hard ice cream. Over time, products evolved to include fat-free versions and “lite” versions of ice cream along with hard and soft frozen yogurt and sherbet. Kraig had held his ground in his store, serving hard ice cream and its many variations, most notably sundaes, banana splits, and cones.

part 1 MArKETING FOUNdATION 54
How important is an area’s climate and location to the success of an ice cream shop?
In 2005, Destin experienced a glancing blow from a major hurricane. The Andersen’s Ice Cream Shop endured major water damage, and the building’s roof was com-pletely destroyed. Although his insurance settlement did not fully cover the damages, Kraig repaired his building and reopened the business, only to suffer a major heart attack 1 year later. He concluded it was time to sell the business.
Several prospective buyers were shown the store. Many asked if they could keep the same name or if they would need to find a new brand. Others asked for statis-tics on sales and profits over the past 10 years, but espe-cially before and after the hurricane. Some wondered if most of the business came from the locals or if tourists provided the major source of revenue. They also asked about ages: Were most of the customers families with children, or did a wider variety of people visit the shop?
One prospect noted that an ice cream shop in the Hilton Head area of South Carolina, offered hard ice cream with a twist: each person was able to “customize”
his or her ice cream with a wide variety of toppings that were set out in a smorgasbord-type arrangement. Everything was available, from nuts to sprinkles to jelly beans, along with all types of toppings (strawberry, choc-olate, pineapple, and 10 others) and whipped cream and cherries to top things off. This buyer wondered if a simi-lar addition to Andersen’s Ice Cream Shop would create greater revenues.
Kraig responded that his business was based on more than just the products. It was the entire ice-cream-buying experience that kept people coming back. The store was brightly lit and clean, with music from the 1950s and 1960s playing softly in the background. People sat in booths similar to ice cream parlors from the past. He believed that nostalgia played a major role in his return business and that word of mouth brought in new customers.
Many prospective buyers noted that ice cream was available in grocery stores, fast-food outlets such as McDonald’s and Wendy’s, and convenience stores with soft serve dispensers and that recently a Braum’s Dairy Store had just opened down the street. The Braum’s chain offered all varieties of ice cream plus meals, such as ham-burgers and other fast-food-type items. These buyers wondered if the shop would be able to compete with all these other outlets.
Kraig noted his longstanding ties in the community of Destin. His store sponsored many local sports teams, including Little League Baseball, basketball, and soccer youth programs; bowling teams; and an adult coed soft-ball team. He had made a point of distributing discount and free sample coupons for people to use following Wednesday night church services by giving the coupons to the local clergy. His store also provided cakes and ice cream for birthday parties and to local businesses when special events took place.
The final buyer to visit, and the one that made an offer, said his decision was based not on speculation but on market analysis. The buyer noted that some things would be left the same while others would need to be updated and changed. Reluctantly, Kraig handed over the keys to the building and began his retirement.
1. Assess the environment surrounding the Andersen’s Ice Cream Shop.
2. Assess the industry and competitors that the new buyer of the Andersen’s Ice Cream Shop probably considered.
3. Explain the role that customer service may have played in the past success of the store using the following terms: brand parity, brand equity, prod-uct positioning, perceptual mapping, and product differentiation.

chapter 2 Market Analysis 55
Go to www.sagepub.com/clow for additional exercises and study resources. Select Chapter 2, Market Analysis for chapter-specific activities.
4. Outline the market segments Andersen’s Ice Cream currently served as well as potential new segments if they exist. If not, explain why there are no new segments to be tapped.
5. Which model of buying behavior best suits an analysis of Andersen’s Ice Cream Shop: affect referral, evoked set, or multi-attribute?
6. Explain how the concepts of market potential, market demand, and company demand would enter into the decision to buy the Andersen’s Ice Cream Shop.