
CaixaBank + Bankia - CNMV
37
Creating value for all stakeholders 18 September 2020 CaixaBank + Bankia
-
Upload
khangminh22 -
Category
Documents
-
view
0 -
download
0
Transcript of CaixaBank + Bankia - CNMV

Creating value for all stakeholders
18 September 2020
CaixaBank + Bankia
2
The information contained in this presentation may not be used as the basis to enter into any contract oragreement and nothing herein constitutes an offer, invitation or recommendation to engage in investment in theshares, or any other financial instrument, of CaixaBank, S.A. (“CaixaBank”), especially in the United States, theUnited Kingdom, Canada, Japan, Australia or any other country where the purchase and sale of these shares isprohibited under applicable legislation. The distribution of this presentation in certain jurisdictions may berestricted by law. Consequently, persons to which this presentation is distributed must inform themselves aboutand observe such restrictions. By receiving this presentation the recipient agrees to observe any such restrictions.
This presentation may include forward-looking statements, projections, objectives, estimates and forecasts whichhave not been verified by an independent entity, and the accuracy, completeness or correctness thereof shouldnot be relied upon. Forward looking statements, projections, objectives, estimates and forecasts are generallyidentifiable by the use of the words “ may,”“ will,”“ should,”“ plan,”“ expect,”“ anticipate,”“ estimate,”“ believe,”“intend,”“ project,” or the negative of these words or other variations on these words or comparable terminology.All forecasts and other statements included in this presentation that are not statements of historical fact,including, without limitation, those regarding the financial position, business strategy, management plans andobjectives for future operations of CaixaBank (which term includes its subsidiaries and investees) and run-ratemetrics, are forward-looking statements. These forward-looking statements involve known and unknown risks,uncertainties and other factors, which may cause actual results, performance or achievements of CaixaBank, orindustry results, to be materially different from those expressed or implied by these forward-looking statements.These forward-looking statements are based on numerous assumptions regarding CaixaBank’s present and futurebusiness strategies and the environment in which CaixaBank expects to operate in the future, which may not befulfilled. Due to such uncertainties and risks, recipients are cautioned not to place undue reliance on such forwardlooking statements as a prediction of actual results. All forward-looking statements and other statements hereinare only as of the date of this presentation.
None of CaixaBank nor any of its affiliates, advisors or representatives, nor any of their respective directors,officers, employees or agents, shall bear any liability (in negligence or otherwise) for any loss arising from any useof this presentation or its contents, or otherwise in connection herewith, and they do not undertake any obligationto provide the recipients with access to additional information or to update this presentation or to correct anyinaccuracies in the information contained or referred to herein. To the extent available, the industry and marketdata contained in this presentation has come from official or third-party sources. Third-party industry publications,studies and surveys generally state that the data contained therein have been obtained from sources believed tobe reliable, but that there is no guarantee of the accuracy or completeness of such data. In addition, certain of theindustry and market data contained in this presentation come from CaixaBank’s own internal research andestimates based on the knowledge and experience of CaixaBank’s management in the market in which CaixaBankoperates. Certain information contained herein is based on CaixaBank’s management information and estimatesand has not been audited or reviewed by CaixaBank’s auditors. Recipients should not place undue reliance on thisinformation. The financial information included herein has not been reviewed for accuracy or completeness and,
as such, should not be relied upon. Certain financial and statistical information contained in the presentation issubject to rounding adjustments. Accordingly, any discrepancies between the totals and the sums of the amountslisted are due to rounding.
Neither this presentation nor the historical performance of CaixaBank’s management team constitute a guaranteeof the future performance of CaixaBank and there can be no assurance that CaixaBank’s management team will besuccessful in implementing the investment strategy of CaixaBank. In addition to the financial information preparedunder IFRS, this presentation may include certain alternative performance measures (“APMs”) as defined in theGuidelines on Alternative Performance Measures issued by the European Securities and Markets Authority on 5October 2015. An APM is a financial measure of historical or future financial performance, financial position, orcash flows, other than a financial measure defined or specified in the applicable financial reporting framework.CaixaBank believes that there are certain APMs, which are used by the Group’s management in making financial,operational and planning decisions, which provide useful financial information that should be considered inaddition to the financial statements prepared in accordance with the accounting regulations that applies (IFRS EU),in assessing its performance. These APMs are consistent with the main indicators used by the community ofanalysts and investors in the capital markets.
The proposed transaction relates to the securities of CaixaBank and Bankia, S.A. (“Bankia”), both companiesincorporated in Spain. Information distributed in connection with the proposed transaction and the relatedshareholder vote is subject to Spanish disclosure requirements that are different from those of the United States.Financial statements and financial information included herein are prepared in accordance with Spanishaccounting standards that may not be comparable to the financial statements or financial information of UnitedStates companies.
It may be difficult for you to enforce your rights and any claim you may have arising under the U.S. federalsecurities laws in respect of the proposed transaction, since the companies are located in Spain and some or all oftheir officers and directors are residents of Spain. You may not be able to sue the companies or their officers ordirectors in a Spanish court for violations of the U.S. securities laws. Finally, it may be difficult to compel thecompanies and their affiliates to subject themselves to a U.S. court's judgment.
You should be aware that the companies may purchase shares otherwise than under the proposed transaction,such as in open market or privately negotiated purchases, at any time during the pendency of the proposedtransaction.
The ordinary shares of CaixaBank have not been and are not intended to be registered under the U.S. SecuritiesAct of 1933, as amended, and may not be offered or sold in the United States of America except pursuant to anapplicable exemption from the registration requirements of such Act.
Disclaimer
3
Contents
II. Proposed transaction: description, impacts & timetable
III. Key takeaways
I.Strategic rationale
4
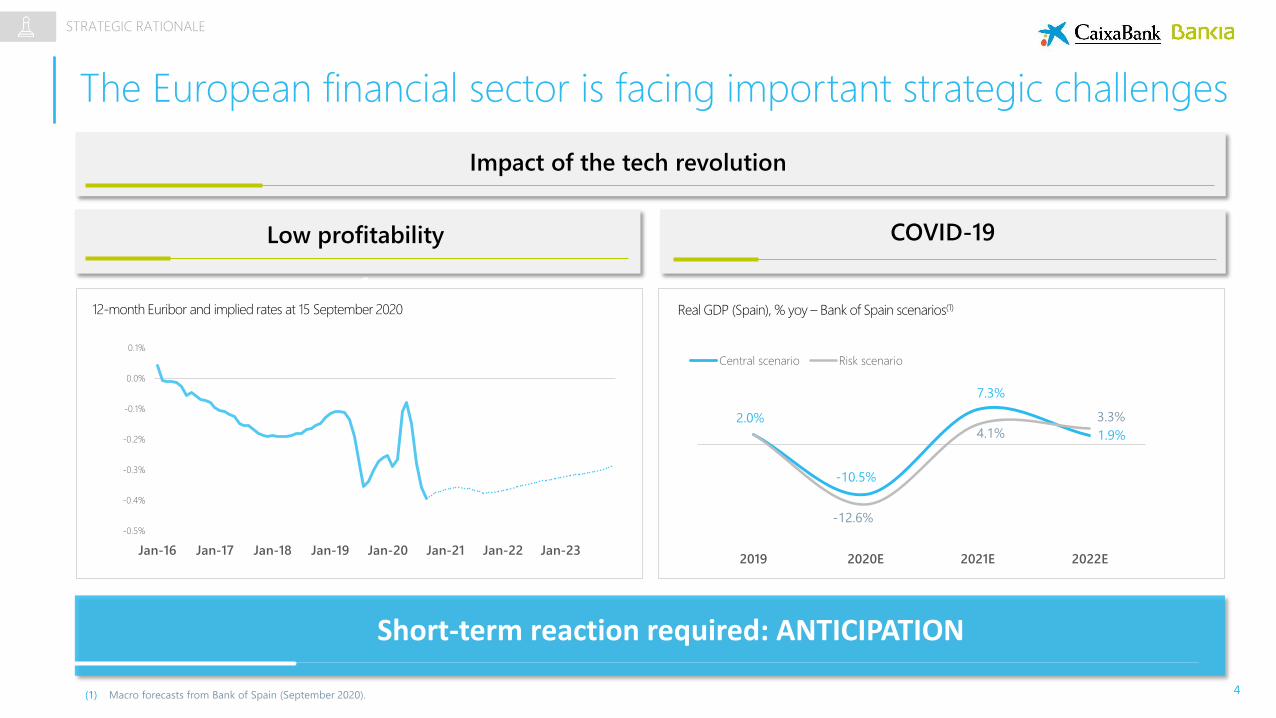
The European financial sector is facing important strategic challenges
(1) Macro forecasts from Bank of Spain (September 2020).
STRATEGIC RATIONALE
Impact of the tech revolution
Low profitability COVID-19
2.0%
-10.5%
7.3%
1.9%
-12.6%
4.1%
3.3%
2019 2020E 2021E 2022E
Central scenario Risk scenario
-0.5%
-0.4%
-0.3%
-0.2%
-0.1%
0.0%
0.1%
Jan-16 Jan-17 Jan-18 Jan-19 Jan-20 Jan-21 Jan-22 Jan-23
12-month Euribor and implied rates at 15 September 2020 Real GDP (Spain), % yoy – Bank of Spain scenarios(1)
Short-term reaction required: ANTICIPATION
5
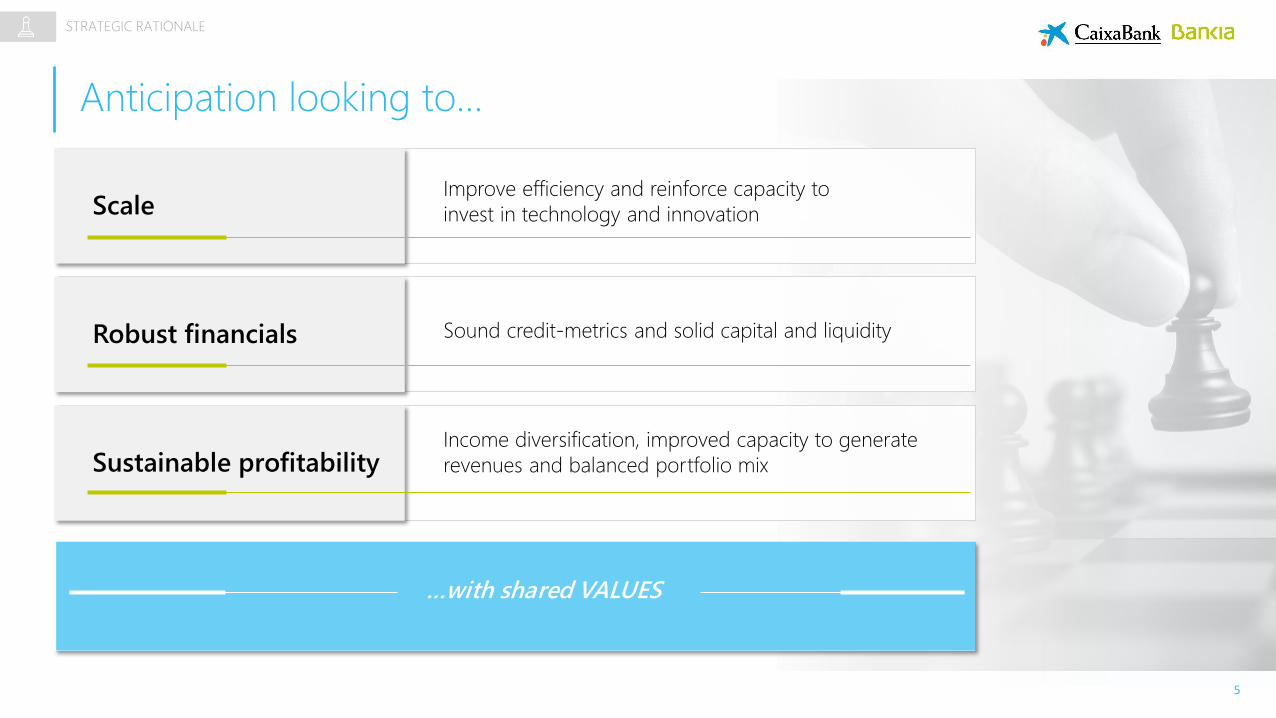
Anticipation looking to…
Scale
Robust financials
Sustainable profitability
Sound credit-metrics and solid capital and liquidity
Improve efficiency and reinforce capacity to
invest in technology and innovation
Income diversification, improved capacity to generate
revenues and balanced portfolio mix
…with shared VALUES
STRATEGIC RATIONALE
6
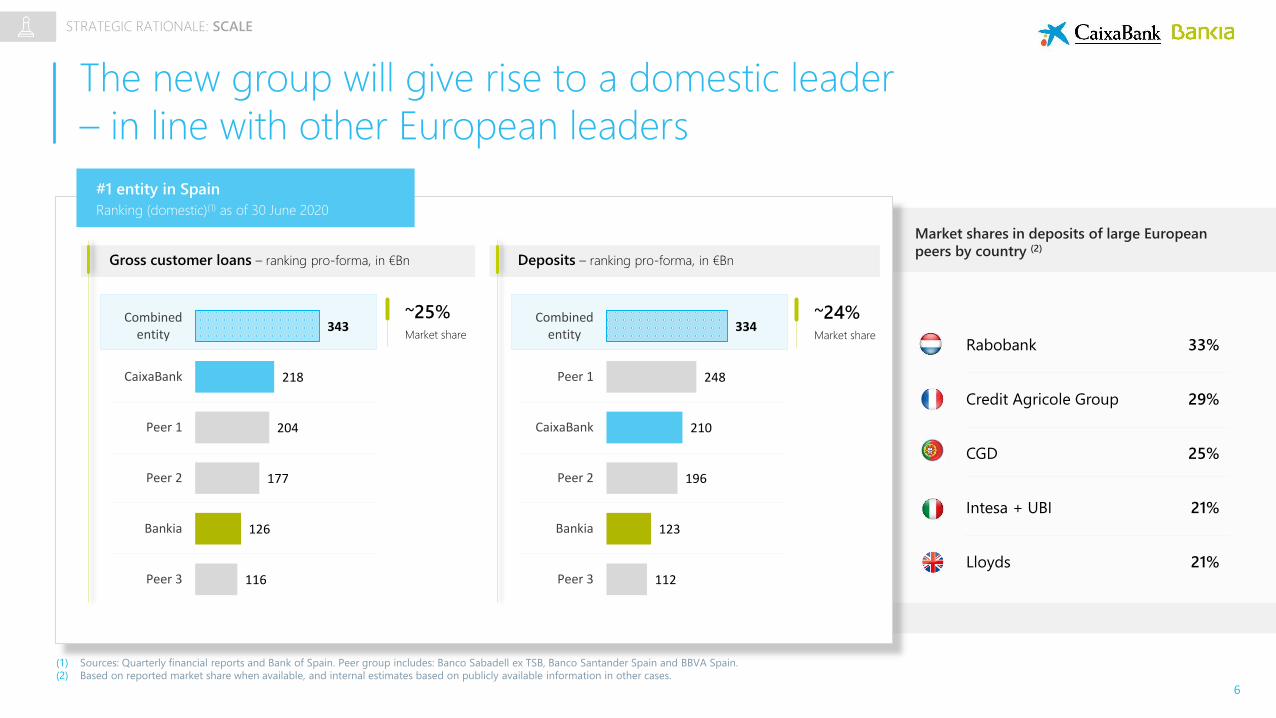
The new group will give rise to a domestic leader
– in line with other European leaders
Gross customer loans – ranking pro-forma, in €Bn
#1 entity in Spain
Ranking (domestic)(1) as of 30 June 2020
116
126
177
204
218
343
Peer 3
Bankia
Peer 2
Peer 1
CaixaBank
Combinedentity
~25%Market share
Deposits – ranking pro-forma, in €Bn
112
123
196
210
248
334
Peer 3
Bankia
Peer 2
CaixaBank
Peer 1
Combinedentity
~24%Market share
Market shares in deposits of large European
peers by country (2)
Rabobank 33%
Credit Agricole Group 29%
CGD 25%
Intesa + UBI 21%
Lloyds 21%
(1) Sources: Quarterly financial reports and Bank of Spain. Peer group includes: Banco Sabadell ex TSB, Banco Santander Spain and BBVA Spain.
(2) Based on reported market share when available, and internal estimates based on publicly available information in other cases.
STRATEGIC RATIONALE: SCALE
7
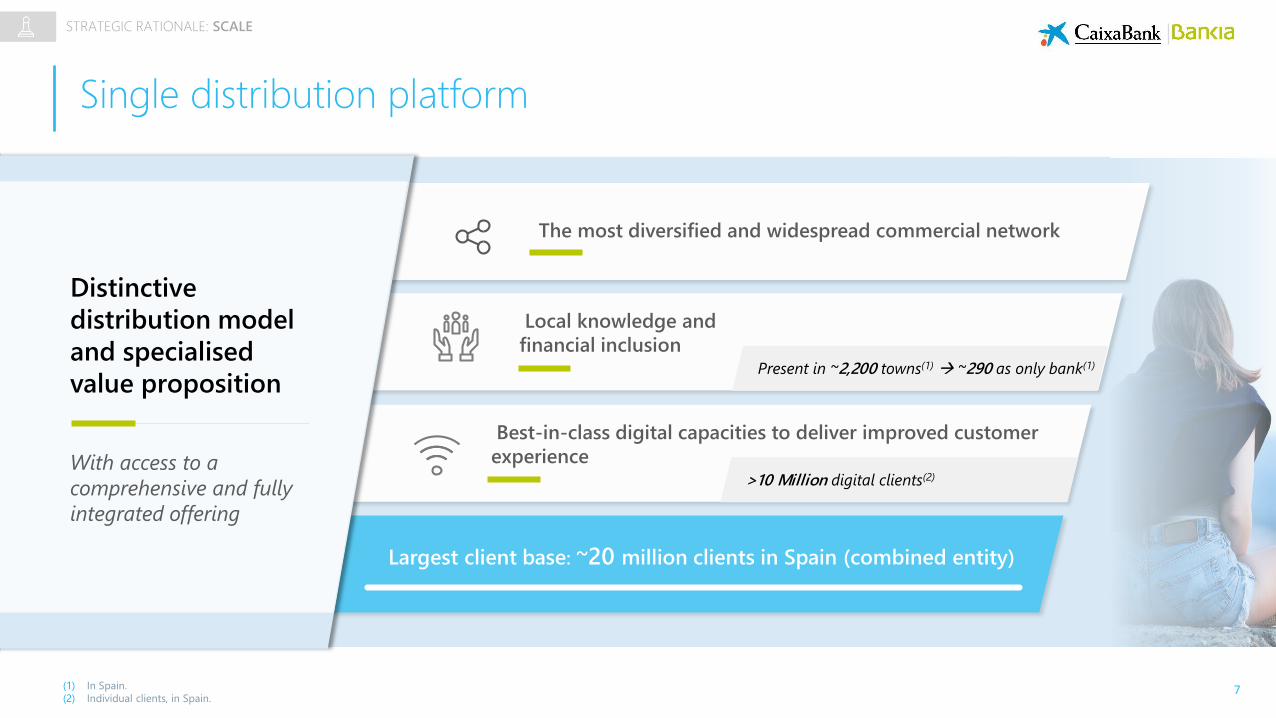
Single distribution platform
The most diversified and widespread commercial network
Local knowledge and
financial inclusion
Best-in-class digital capacities to deliver improved customer
experience
Present in ~2,200 towns(1) ~290 as only bank(1)
>10 Million digital clients(2)
(1) In Spain.
(2) Individual clients, in Spain.
With access to a
comprehensive and fully
integrated offering
Distinctive
distribution model
and specialised
value proposition
Largest client base: ~20 million clients in Spain (combined entity)
STRATEGIC RATIONALE: SCALE
8
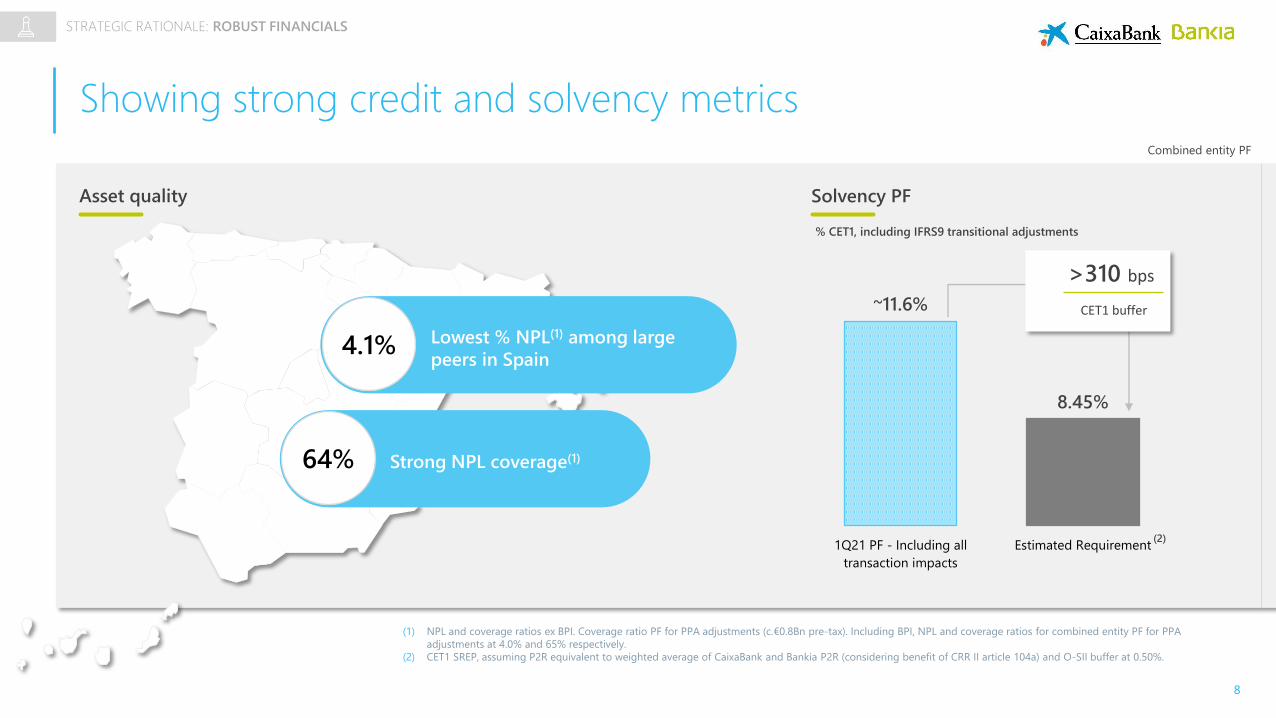
Showing strong credit and solvency metrics
4.1%
64%
Lowest % NPL(1) among large
peers in Spain
Strong NPL coverage(1)
Asset quality Solvency PF
~11.6%
8.45%
1Q21 PF - Including all
transaction impacts
Estimated Requirement
(1) NPL and coverage ratios ex BPI. Coverage ratio PF for PPA adjustments (c.€0.8Bn pre-tax). Including BPI, NPL and coverage ratios for combined entity PF for PPA
adjustments at 4.0% and 65% respectively.
(2) CET1 SREP, assuming P2R equivalent to weighted average of CaixaBank and Bankia P2R (considering benefit of CRR II article 104a) and O-SII buffer at 0.50%.
(2)
% CET1, including IFRS9 transitional adjustments
>310 bps
CET1 buffer
Combined entity PF
STRATEGIC RATIONALE: ROBUST FINANCIALS
9
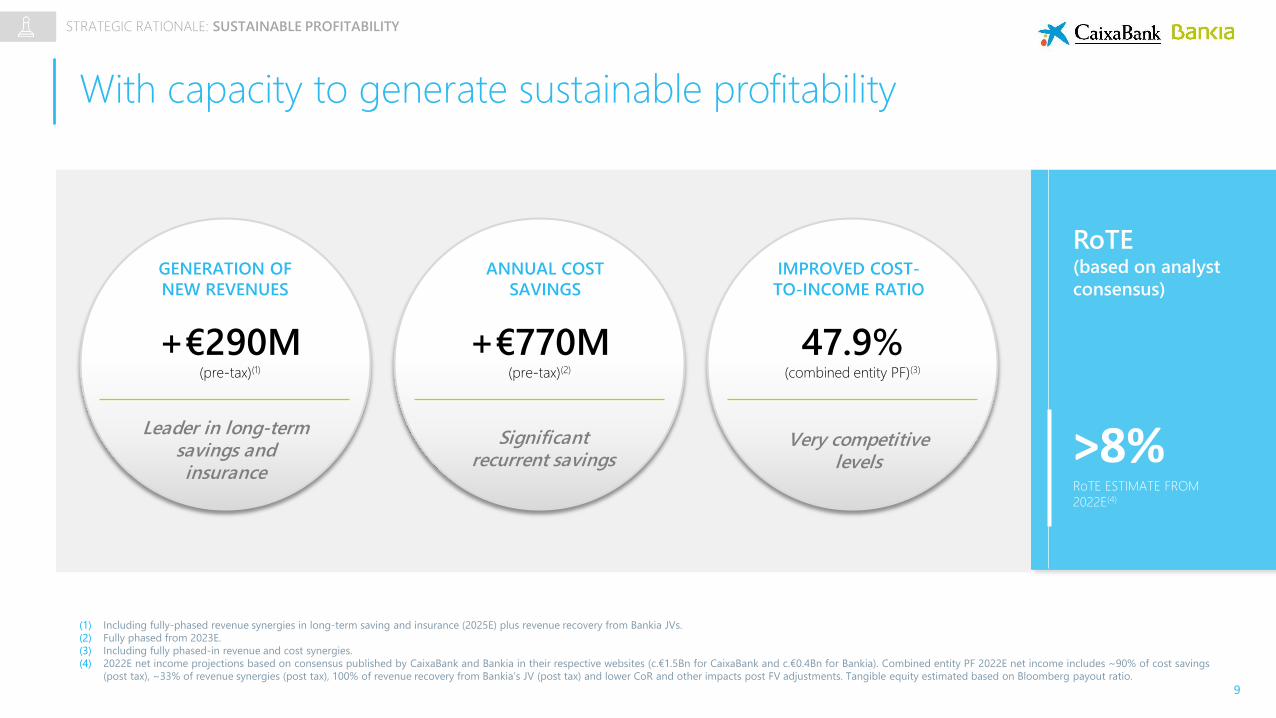
With capacity to generate sustainable profitability
STRATEGIC RATIONALE: SUSTAINABLE PROFITABILITY
RoTE(based on analyst
consensus)
RoTE ESTIMATE FROM
2022E(4)
>8%
GENERATION OF
NEW REVENUES
ANNUAL COST
SAVINGS
IMPROVED COST-
TO-INCOME RATIO
+€770M(pre-tax)(2)
+€290M(pre-tax)(1)
47.9%(combined entity PF)(3)
Leader in long-term savings and insurance
Significant recurrent savings
Very competitive levels
(1) Including fully-phased revenue synergies in long-term saving and insurance (2025E) plus revenue recovery from Bankia JVs.
(2) Fully phased from 2023E.
(3) Including fully phased-in revenue and cost synergies.
(4) 2022E net income projections based on consensus published by CaixaBank and Bankia in their respective websites (c.€1.5Bn for CaixaBank and c.€0.4Bn for Bankia). Combined entity PF 2022E net income includes ~90% of cost savings
(post tax), ~33% of revenue synergies (post tax), 100% of revenue recovery from Bankia’s JV (post tax) and lower CoR and other impacts post FV adjustments. Tangible equity estimated based on Bloomberg payout ratio.
10
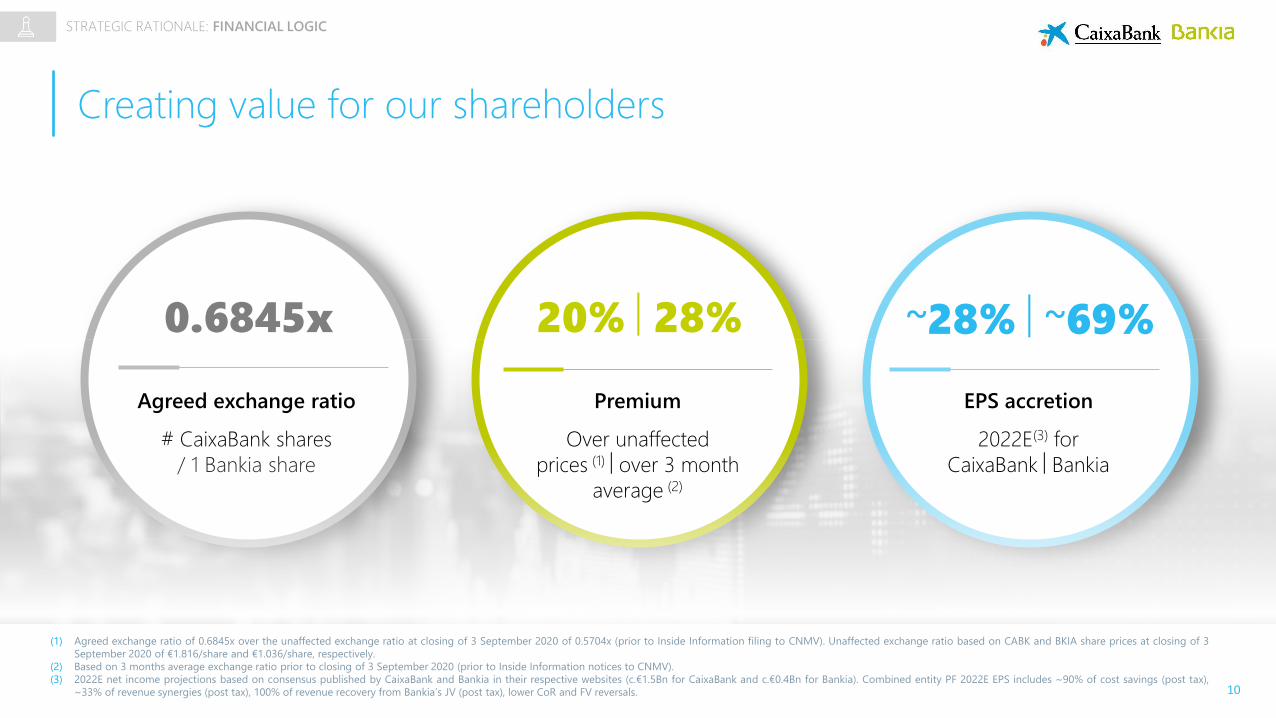
Creating value for our shareholders
STRATEGIC RATIONALE: FINANCIAL LOGIC
Agreed exchange ratio
# CaixaBank shares
/ 1 Bankia share
0.6845x 20% 28% ~28% ~69%
Premium
Over unaffected
prices (1) over 3 month
average (2)
EPS accretion
2022E(3) for
CaixaBank Bankia
(1) Agreed exchange ratio of 0.6845x over the unaffected exchange ratio at closing of 3 September 2020 of 0.5704x (prior to Inside Information filing to CNMV). Unaffected exchange ratio based on CABK and BKIA share prices at closing of 3
September 2020 of €1.816/share and €1.036/share, respectively.
(2) Based on 3 months average exchange ratio prior to closing of 3 September 2020 (prior to Inside Information notices to CNMV).
(3) 2022E net income projections based on consensus published by CaixaBank and Bankia in their respective websites (c.€1.5Bn for CaixaBank and c.€0.4Bn for Bankia). Combined entity PF 2022E EPS includes ~90% of cost savings (post tax),
~33% of revenue synergies (post tax), 100% of revenue recovery from Bankia’s JV (post tax), lower CoR and FV reversals.
11
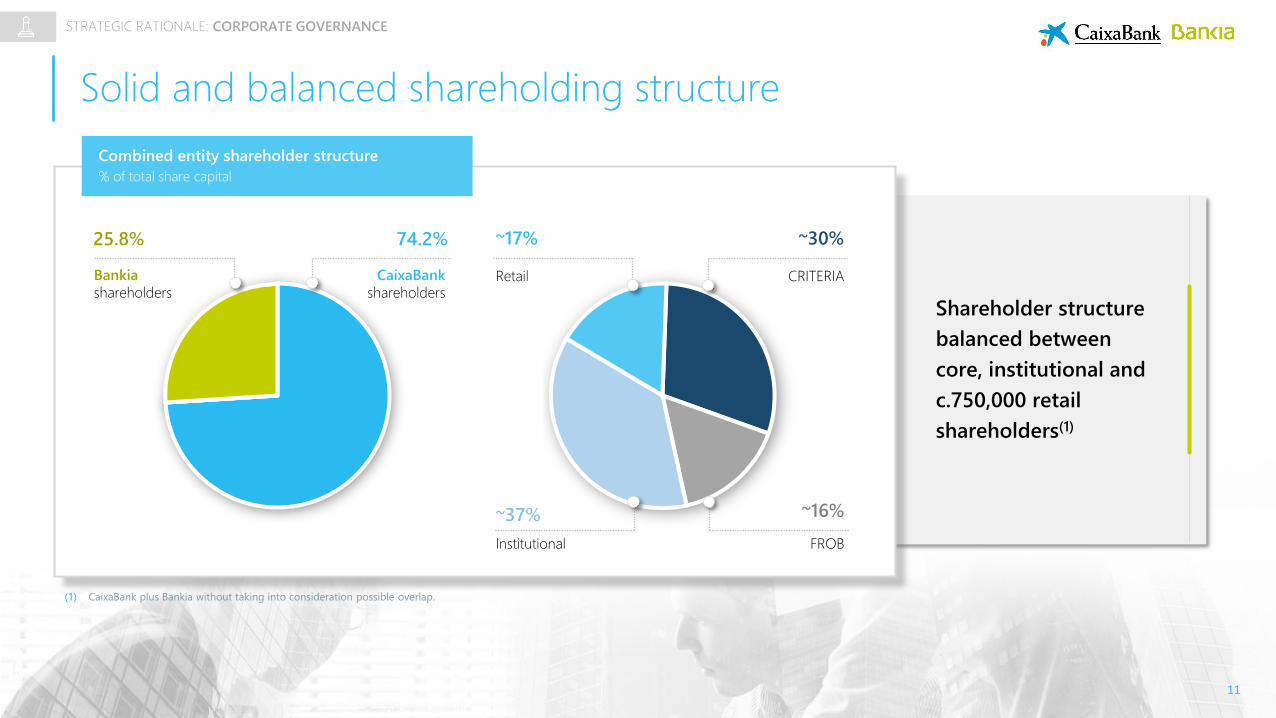
Solid and balanced shareholding structure
Shareholder structure
balanced between
core, institutional and
c.750,000 retail
shareholders(1)
Combined entity shareholder structure
% of total share capital
25.8% 74.2%
CaixaBank
shareholders
Bankia
shareholders
~17% ~30%
CRITERIARetail
~16%
FROB
~37%
Institutional
(1) CaixaBank plus Bankia without taking into consideration possible overlap.
STRATEGIC RATIONALE: CORPORATE GOVERNANCE
12
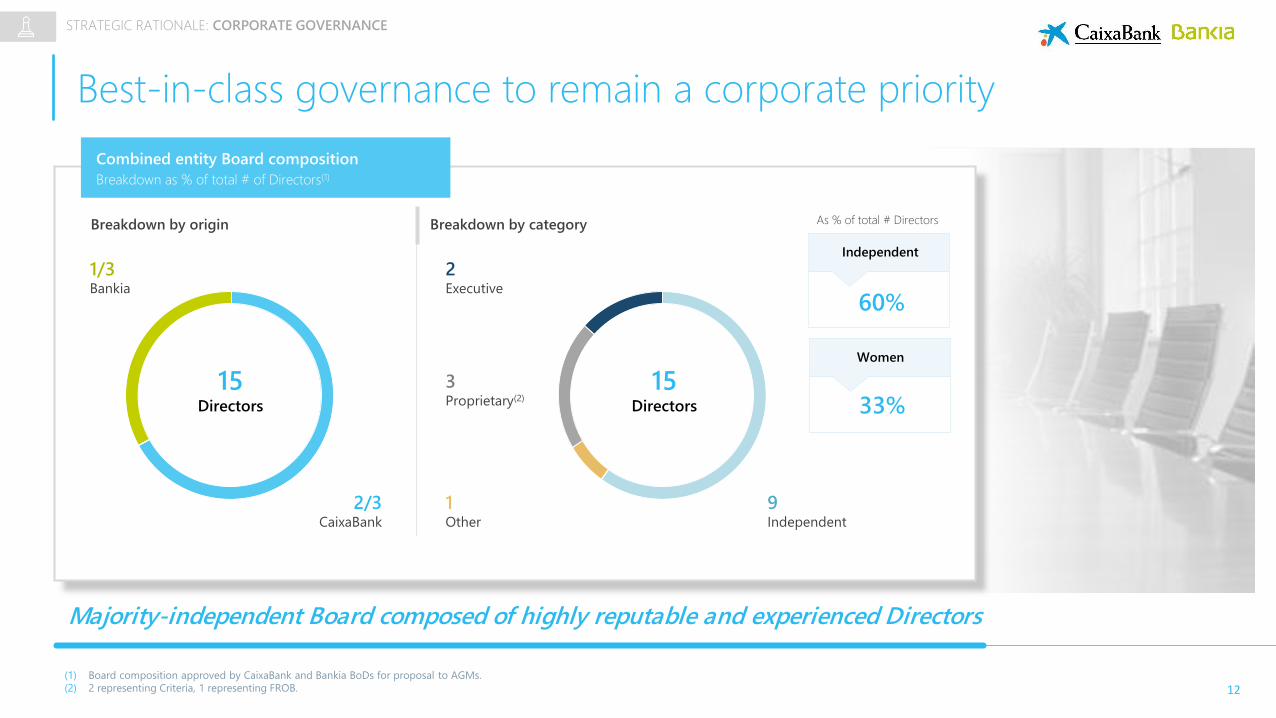
Best-in-class governance to remain a corporate priority
(1) Board composition approved by CaixaBank and Bankia BoDs for proposal to AGMs.
(2) 2 representing Criteria, 1 representing FROB.
Majority-independent Board composed of highly reputable and experienced Directors
STRATEGIC RATIONALE: CORPORATE GOVERNANCE
Combined entity Board composition
Breakdown as % of total # of Directors(1)
15Directors
Breakdown by origin
1/3Bankia
2/3CaixaBank
Breakdown by category
9Independent
2Executive
3Proprietary(2)
1Other
15Directors
Independent
Women
60%
33%
As % of total # Directors
13
Corporate governance – other issues
CaixaBank will remain as the brand
Registered address to be in Valencia
Joint operational HQ in Barcelona and Madrid
STRATEGIC RATIONALE: CORPORATE GOVERNANCE
14
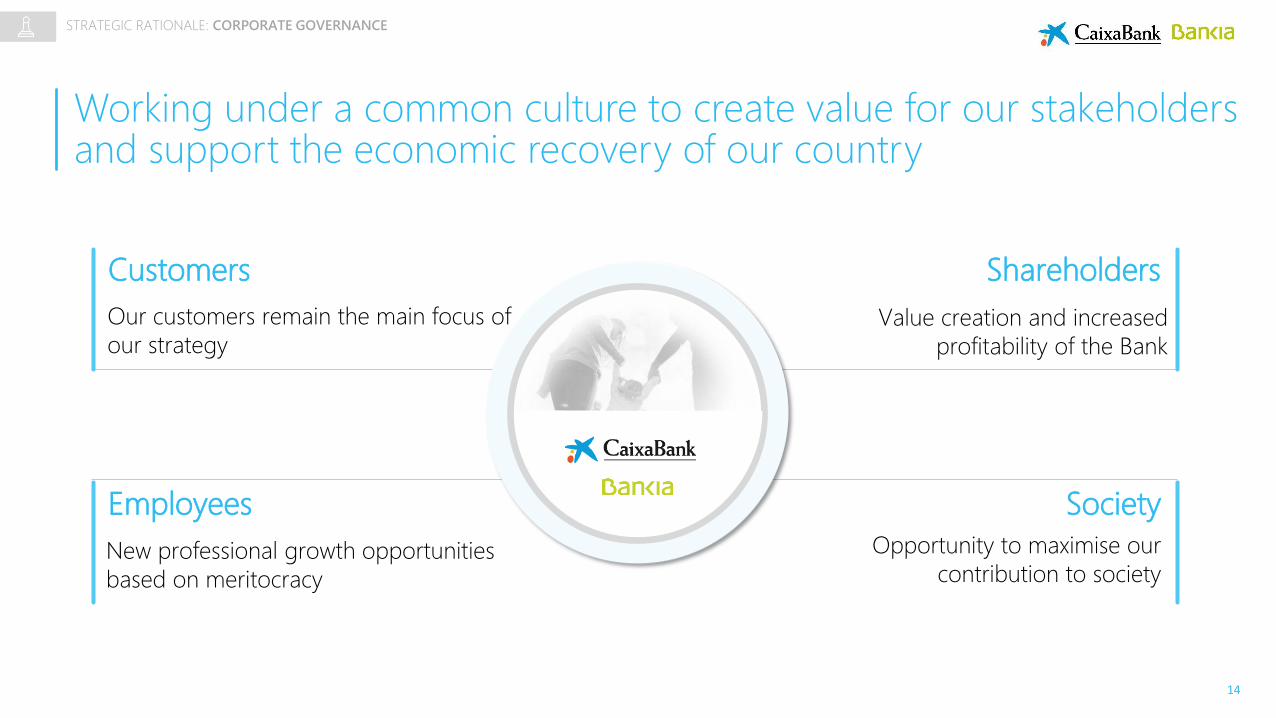
Working under a common culture to create value for our stakeholders and support the economic recovery of our country
Customers
Employees
Shareholders
Society
Our customers remain the main focus of
our strategyValue creation and increased
profitability of the Bank
New professional growth opportunities
based on meritocracy
Opportunity to maximise our
contribution to society
STRATEGIC RATIONALE: CORPORATE GOVERNANCE
15
Contents
I. Strategic rationale
III. Key takeaways
II.Proposed transaction: description, impacts & timetable
16
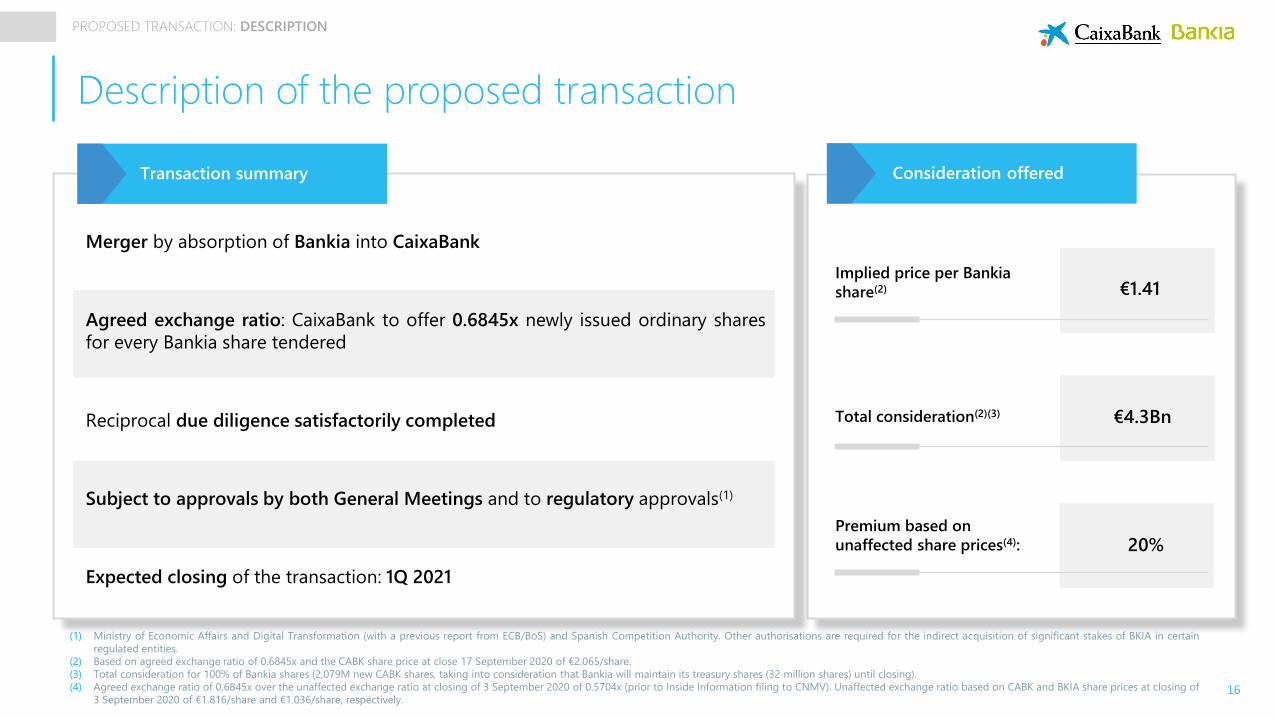
Description of the proposed transaction
Merger by absorption of Bankia into CaixaBank
Agreed exchange ratio: CaixaBank to offer 0.6845x newly issued ordinary shares
for every Bankia share tendered
Reciprocal due diligence satisfactorily completed
Subject to approvals by both General Meetings and to regulatory approvals(1)
Expected closing of the transaction: 1Q 2021
Transaction summary
(1) Ministry of Economic Affairs and Digital Transformation (with a previous report from ECB/BoS) and Spanish Competition Authority. Other authorisations are required for the indirect acquisition of significant stakes of BKIA in certain
regulated entities.
(2) Based on agreed exchange ratio of 0.6845x and the CABK share price at close 17 September 2020 of €2.065/share.
(3) Total consideration for 100% of Bankia shares (2,079M new CABK shares, taking into consideration that Bankia will maintain its treasury shares (32 million shares) until closing).
(4) Agreed exchange ratio of 0.6845x over the unaffected exchange ratio at closing of 3 September 2020 of 0.5704x (prior to Inside Information filing to CNMV). Unaffected exchange ratio based on CABK and BKIA share prices at closing of
3 September 2020 of €1.816/share and €1.036/share, respectively.
PROPOSED TRANSACTION: DESCRIPTION
Consideration offered
Implied price per Bankia
share(2) €1.41
Premium based on
unaffected share prices(4): 20%
Total consideration(2)(3) €4.3Bn
17
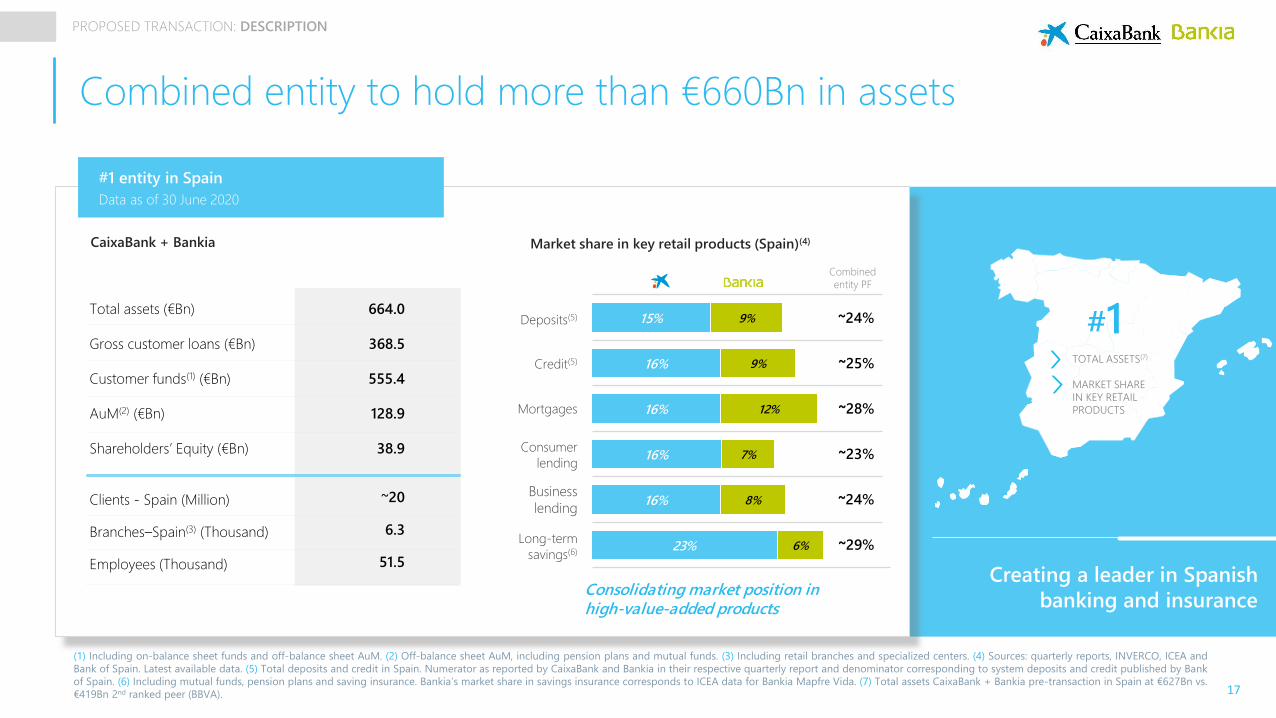
Combined entity to hold more than €660Bn in assets
Creating a leader in Spanish
banking and insurance
#1 entity in Spain
Data as of 30 June 2020
CaixaBank + Bankia
Total assets (€Bn)
Gross customer loans (€Bn)
Customer funds(1) (€Bn)
AuM(2) (€Bn)
Shareholders’ Equity (€Bn)
Clients - Spain (Million)
Branches–Spain(3) (Thousand)
Employees (Thousand)
664.0
368.5
555.4
128.9
38.9
~20
6.3
51.5
(1) Including on-balance sheet funds and off-balance sheet AuM. (2) Off-balance sheet AuM, including pension plans and mutual funds. (3) Including retail branches and specialized centers. (4) Sources: quarterly reports, INVERCO, ICEA and
Bank of Spain. Latest available data. (5) Total deposits and credit in Spain. Numerator as reported by CaixaBank and Bankia in their respective quarterly report and denominator corresponding to system deposits and credit published by Bank
of Spain. (6) Including mutual funds, pension plans and saving insurance. Bankia’s market share in savings insurance corresponds to ICEA data for Bankia Mapfre Vida. (7) Total assets CaixaBank + Bankia pre-transaction in Spain at €627Bn vs.
€419Bn 2nd ranked peer (BBVA).
Consumer
lending
Deposits(5)
Credit(5)
Long-term
savings(6)
Market share in key retail products (Spain)(4)
23%
16%
16%
16%
16%
15%
6%
8%
7%
12%
9%
9%
Business
lending
Combined
entity PF
Consolidating market position in high-value-added products
Mortgages
#1TOTAL ASSETS(7)
MARKET SHARE
IN KEY RETAIL
PRODUCTS
~24%
~25%
~23%
~24%
~29%
~28%
PROPOSED TRANSACTION: DESCRIPTION
18
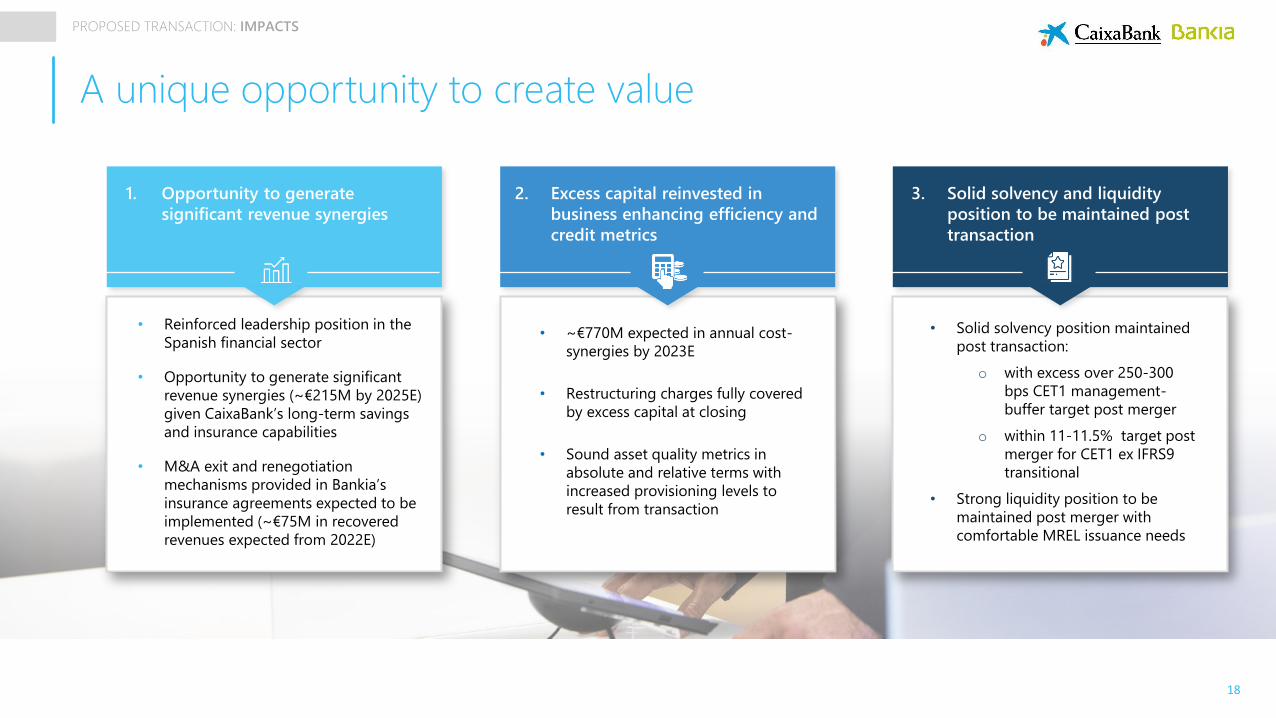
A unique opportunity to create value
1. Opportunity to generate
significant revenue synergies
• Reinforced leadership position in the
Spanish financial sector
• Opportunity to generate significant
revenue synergies (~€215M by 2025E)
given CaixaBank’s long-term savings
and insurance capabilities
• M&A exit and renegotiation
mechanisms provided in Bankia’s
insurance agreements expected to be
implemented (~€75M in recovered
revenues expected from 2022E)
2. Excess capital reinvested in
business enhancing efficiency and
credit metrics
• ~€770M expected in annual cost-
synergies by 2023E
• Restructuring charges fully covered
by excess capital at closing
• Sound asset quality metrics in
absolute and relative terms with
increased provisioning levels to
result from transaction
3. Solid solvency and liquidity
position to be maintained post
transaction
• Solid solvency position maintained
post transaction:
o with excess over 250-300
bps CET1 management-
buffer target post merger
o within 11-11.5% target post
merger for CET1 ex IFRS9
transitional
• Strong liquidity position to be
maintained post merger with
comfortable MREL issuance needs
PROPOSED TRANSACTION: IMPACTS
19
2025E revenue
synergies in long-
term savings
– annual pre-tax
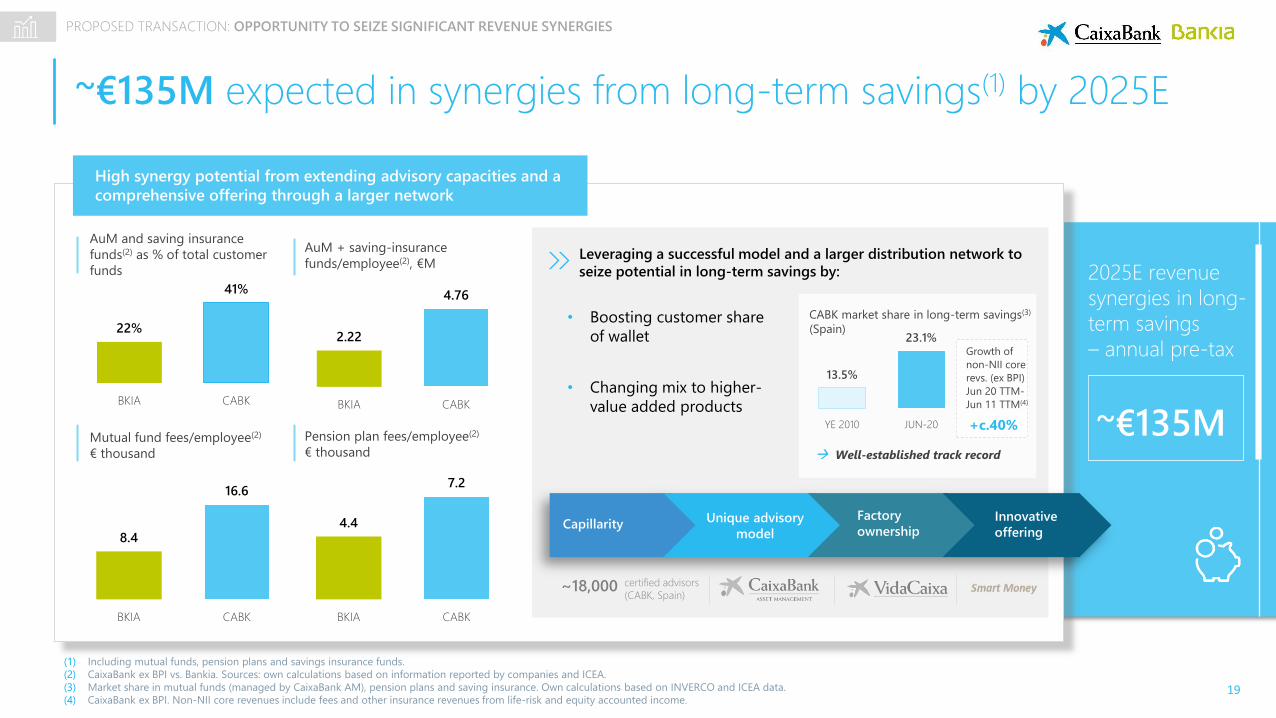
~€135M expected in synergies from long-term savings(1) by 2025E
High synergy potential from extending advisory capacities and a
comprehensive offering through a larger network
Mutual fund fees/employee(2)
€ thousand
8.4
16.6
BKIA CABK
Pension plan fees/employee(2)
€ thousand
4.4
7.2
BKIA CABK
AuM and saving insurance
funds(2) as % of total customer
funds
22%
41%
BKIA CABK
AuM + saving-insurance
funds/employee(2), €M
2.22
4.76
BKIA CABK
Unique advisory
modelCapillarity
Factory
ownershipInnovative
offering
~18,000 certified advisors
(CABK, Spain)
• Boosting customer share
of wallet
• Changing mix to higher-
value added products
Leveraging a successful model and a larger distribution network to
seize potential in long-term savings by:
13.5%
23.1%
YE 2010 JUN-20
CABK market share in long-term savings(3)
(Spain)
Well-established track record
~€135M
(1) Including mutual funds, pension plans and savings insurance funds.
(2) CaixaBank ex BPI vs. Bankia. Sources: own calculations based on information reported by companies and ICEA.
(3) Market share in mutual funds (managed by CaixaBank AM), pension plans and saving insurance. Own calculations based on INVERCO and ICEA data.
(4) CaixaBank ex BPI. Non-NII core revenues include fees and other insurance revenues from life-risk and equity accounted income.
Growth of
non-NII core
revs. (ex BPI)
Jun 20 TTM-
Jun 11 TTM(4)
+c.40%
PROPOSED TRANSACTION: OPPORTUNITY TO SEIZE SIGNIFICANT REVENUE SYNERGIES
20
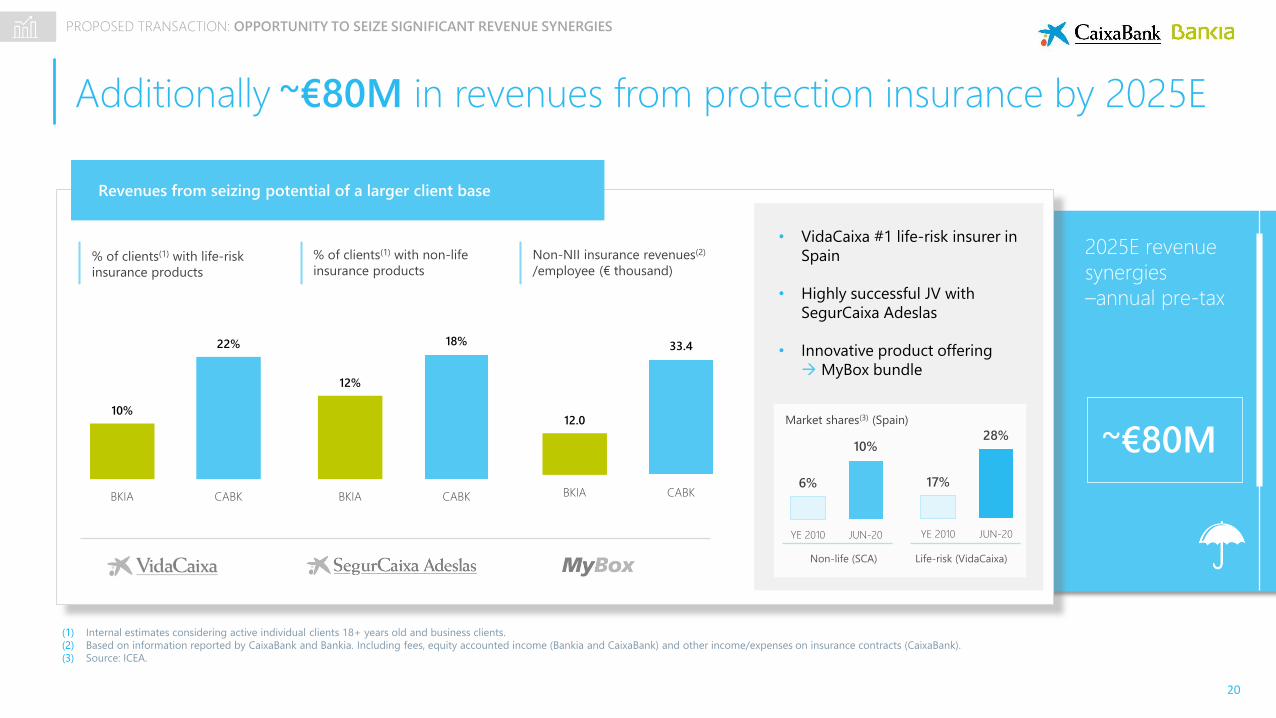
~€80M
2025E revenue
synergies
–annual pre-tax
(1) Internal estimates considering active individual clients 18+ years old and business clients.
(2) Based on information reported by CaixaBank and Bankia. Including fees, equity accounted income (Bankia and CaixaBank) and other income/expenses on insurance contracts (CaixaBank).
(3) Source: ICEA.
Additionally ~€80M in revenues from protection insurance by 2025E
10%
22%
BKIA CABK
% of clients(1) with life-risk
insurance products
12%
18%
BKIA CABK
% of clients(1) with non-life
insurance products
12.0
33.4
BKIA CABK
Non-NII insurance revenues(2)
/employee (€ thousand)
Revenues from seizing potential of a larger client base
• VidaCaixa #1 life-risk insurer in
Spain
• Highly successful JV with
SegurCaixa Adeslas
• Innovative product offering
MyBox bundle
6%
10%
YE 2010 JUN-20
Market shares(3) (Spain)
PROPOSED TRANSACTION: OPPORTUNITY TO SEIZE SIGNIFICANT REVENUE SYNERGIES
17%
28%
YE 2010 JUN-20
Non-life (SCA) Life-risk (VidaCaixa)
21
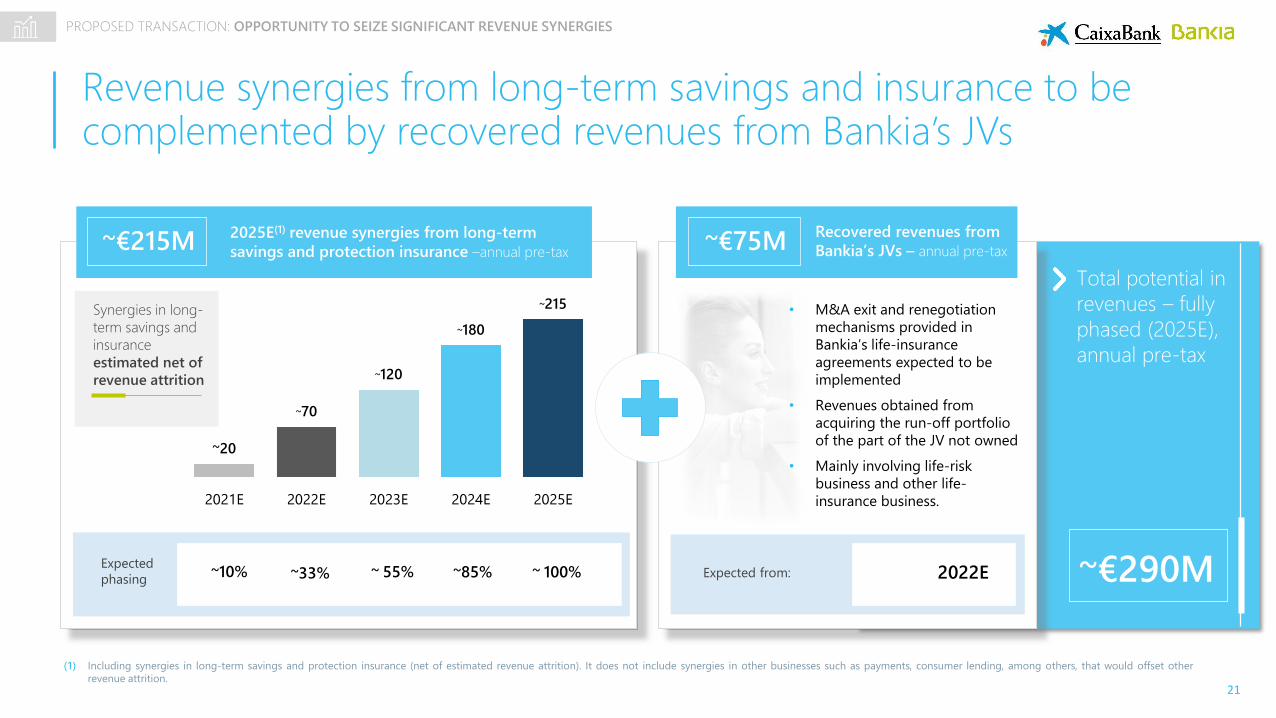
Revenue synergies from long-term savings and insurance to be complemented by recovered revenues from Bankia’s JVs
(1) Including synergies in long-term savings and protection insurance (net of estimated revenue attrition). It does not include synergies in other businesses such as payments, consumer lending, among others, that would offset other
revenue attrition.
Total potential in
revenues – fully
phased (2025E),
annual pre-tax
~€290M
2025E(1) revenue synergies from long-term
savings and protection insurance –annual pre-tax~€215M ~€75M
Recovered revenues from
Bankia’s JVs – annual pre-tax
~ 55% ~ 100% 2022EExpected from:~85%~33%Expected
phasing~10%
Synergies in long-
term savings and
insurance
estimated net of
revenue attrition
~20
~70
~120
~180
~215
2021E 2022E 2023E 2024E 2025E
• M&A exit and renegotiation
mechanisms provided in
Bankia’s life-insurance
agreements expected to be
implemented
• Revenues obtained from
acquiring the run-off portfolio
of the part of the JV not owned
• Mainly involving life-risk
business and other life-
insurance business.
PROPOSED TRANSACTION: OPPORTUNITY TO SEIZE SIGNIFICANT REVENUE SYNERGIES
22
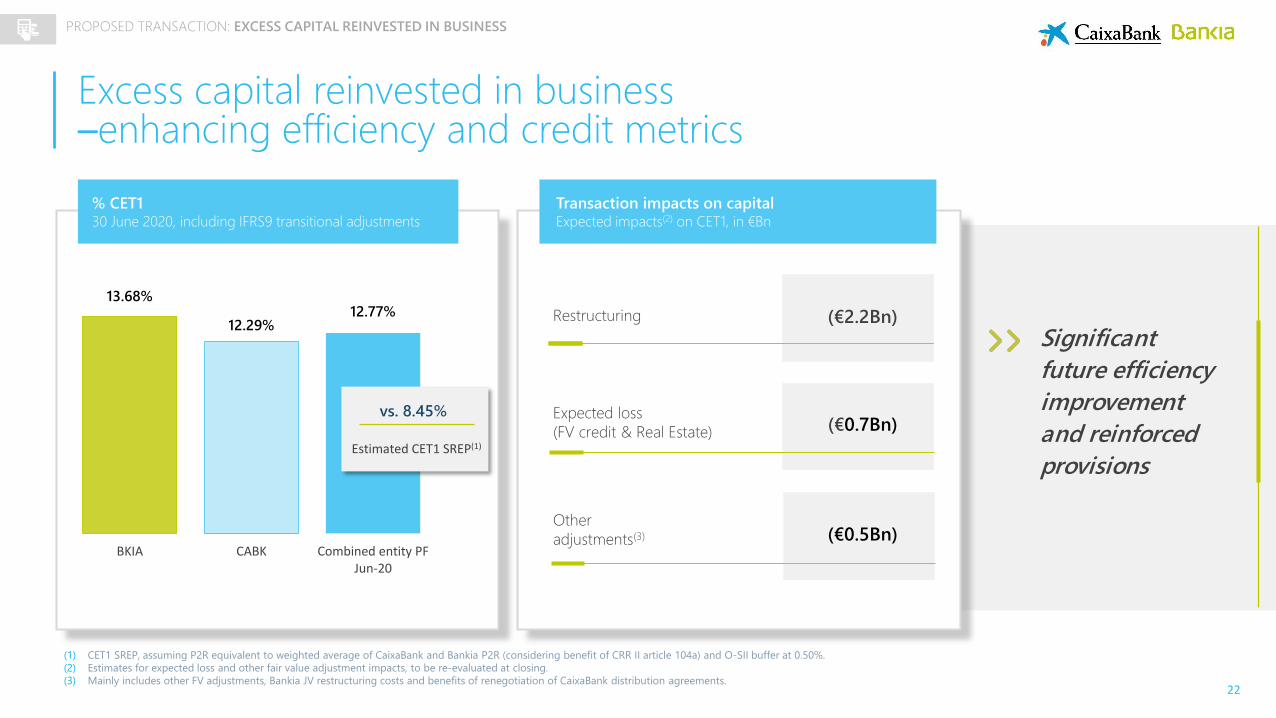
Excess capital reinvested in business –enhancing efficiency and credit metrics
13.68%
12.29%12.77%
BKIA CABK Combined entity PFJun-20
% CET130 June 2020, including IFRS9 transitional adjustments
vs. 8.45%
Estimated CET1 SREP(1)
(1) CET1 SREP, assuming P2R equivalent to weighted average of CaixaBank and Bankia P2R (considering benefit of CRR II article 104a) and O-SII buffer at 0.50%.
(2) Estimates for expected loss and other fair value adjustment impacts, to be re-evaluated at closing.
(3) Mainly includes other FV adjustments, Bankia JV restructuring costs and benefits of renegotiation of CaixaBank distribution agreements.
Transaction impacts on capitalExpected impacts(2) on CET1, in €Bn
Restructuring
Expected loss
(FV credit & Real Estate)
Other
adjustments(3)
(€2.2Bn)
(€0.5Bn)
(€0.7Bn)
Significant
future efficiency
improvement
and reinforced
provisions
PROPOSED TRANSACTION: EXCESS CAPITAL REINVESTED IN BUSINESS
23
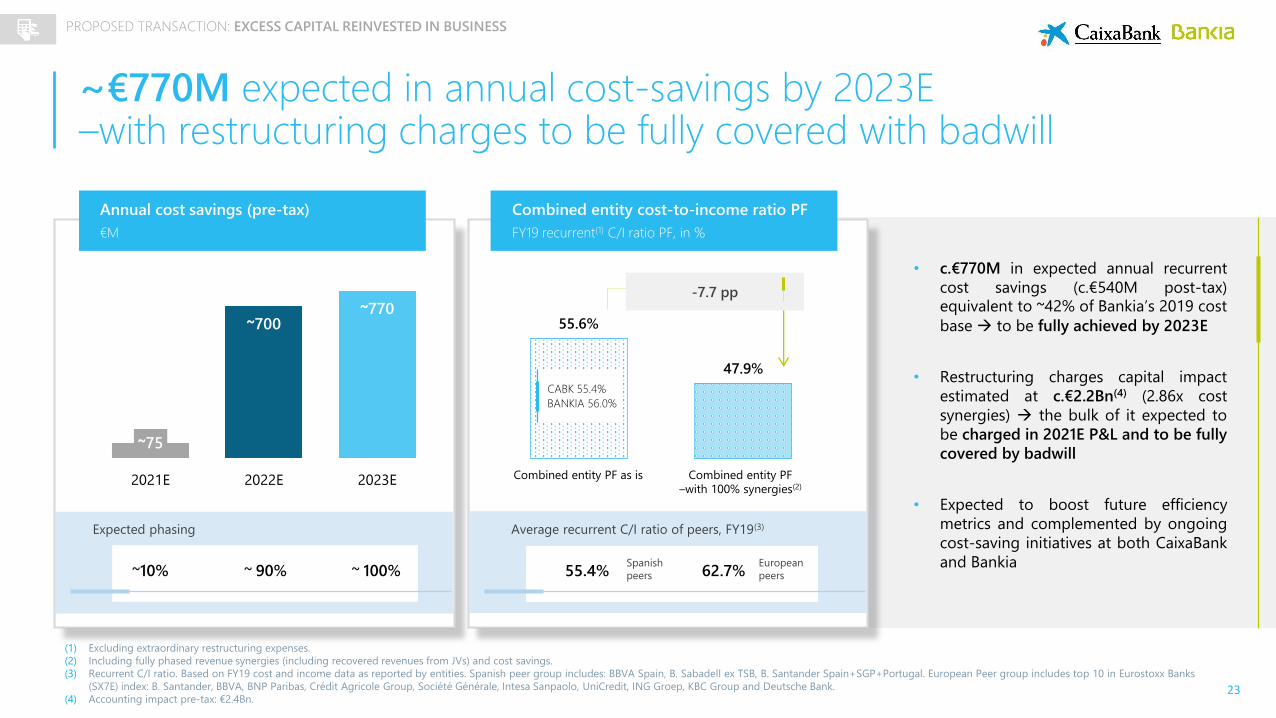
~€770M expected in annual cost-savings by 2023E –with restructuring charges to be fully covered with badwill
~71%
Annual cost savings (pre-tax)
€M
~75
~700~770
2021E 2022E 2023E
Combined entity cost-to-income ratio PF
FY19 recurrent(1) C/I ratio PF, in %
(1) Excluding extraordinary restructuring expenses.
(2) Including fully phased revenue synergies (including recovered revenues from JVs) and cost savings.
(3) Recurrent C/I ratio. Based on FY19 cost and income data as reported by entities. Spanish peer group includes: BBVA Spain, B. Sabadell ex TSB, B. Santander Spain+SGP+Portugal. European Peer group includes top 10 in Eurostoxx Banks
(SX7E) index: B. Santander, BBVA, BNP Paribas, Crédit Agricole Group, Société Générale, Intesa Sanpaolo, UniCredit, ING Groep, KBC Group and Deutsche Bank.
(4) Accounting impact pre-tax: €2.4Bn.
Expected phasing
~10% ~ 90% ~ 100%
55.6%
47.9%
-7.7 pp
• c.€770M in expected annual recurrent
cost savings (c.€540M post-tax)equivalent to ~42% of Bankia’s 2019 cost
base to be fully achieved by 2023E
• Restructuring charges capital impact
estimated at c.€2.2Bn(4) (2.86x cost
synergies) the bulk of it expected to
be charged in 2021E P&L and to be fully
covered by badwill
• Expected to boost future efficiency
metrics and complemented by ongoing
cost-saving initiatives at both CaixaBank
and Bankia
Average recurrent C/I ratio of peers, FY19(3)
55.4% 62.7%Spanish
peers
European
peers
Combined entity PF as is Combined entity PF
–with 100% synergies(2)
CABK 55.4%
BANKIA 56.0%
PROPOSED TRANSACTION: EXCESS CAPITAL REINVESTED IN BUSINESS
24
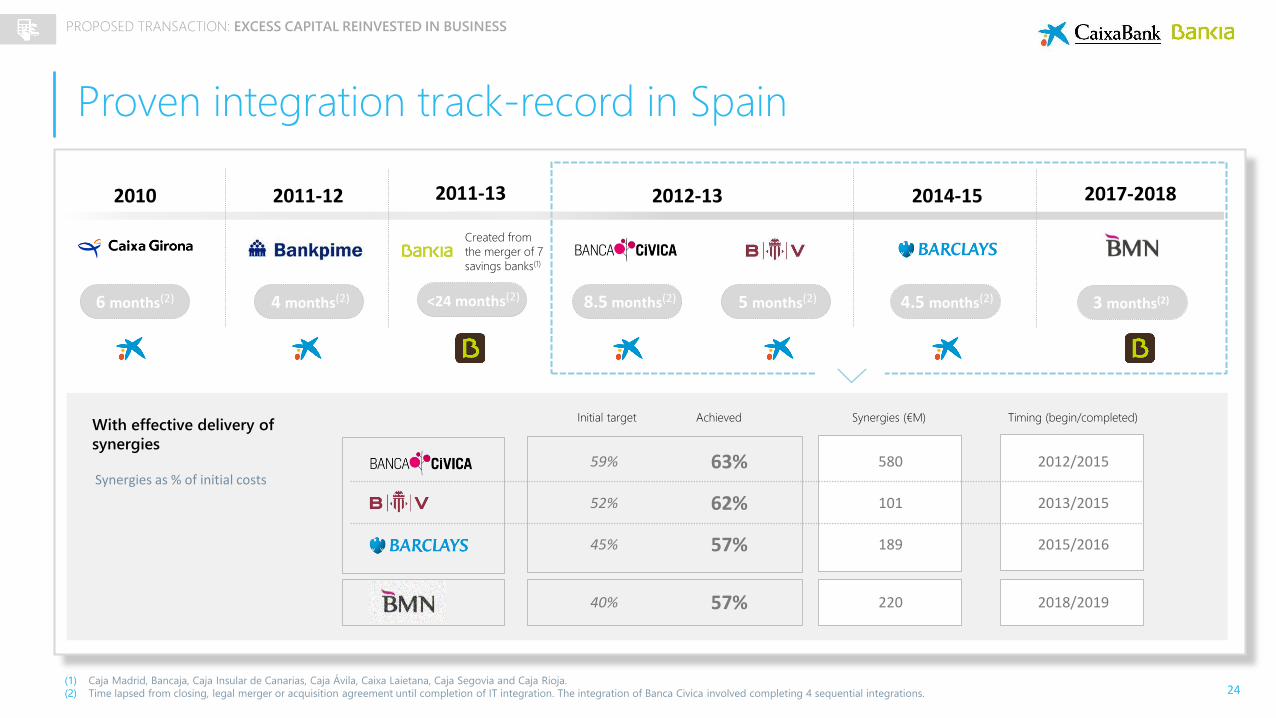
2010 2011-12 2012-13 2014-15
Proven integration track-record in Spain
With effective delivery of
synergies
(1) Caja Madrid, Bancaja, Caja Insular de Canarias, Caja Ávila, Caixa Laietana, Caja Segovia and Caja Rioja.
(2) Time lapsed from closing, legal merger or acquisition agreement until completion of IT integration. The integration of Banca Civica involved completing 4 sequential integrations.
2017-2018
59% 63% 580 2012/2015
52% 62% 101 2013/2015
45% 57% 189 2015/2016
40% 57% 220 2018/2019
6 months(2) 4 months(2) 8.5 months(2) 5 months(2)
Synergies as % of initial costs
4.5 months(2) 3 months(2)
Initial target Achieved Synergies (€M) Timing (begin/completed)
2011-13
<24 months(2)
Created from
the merger of 7
savings banks(1)
PROPOSED TRANSACTION: EXCESS CAPITAL REINVESTED IN BUSINESS
25
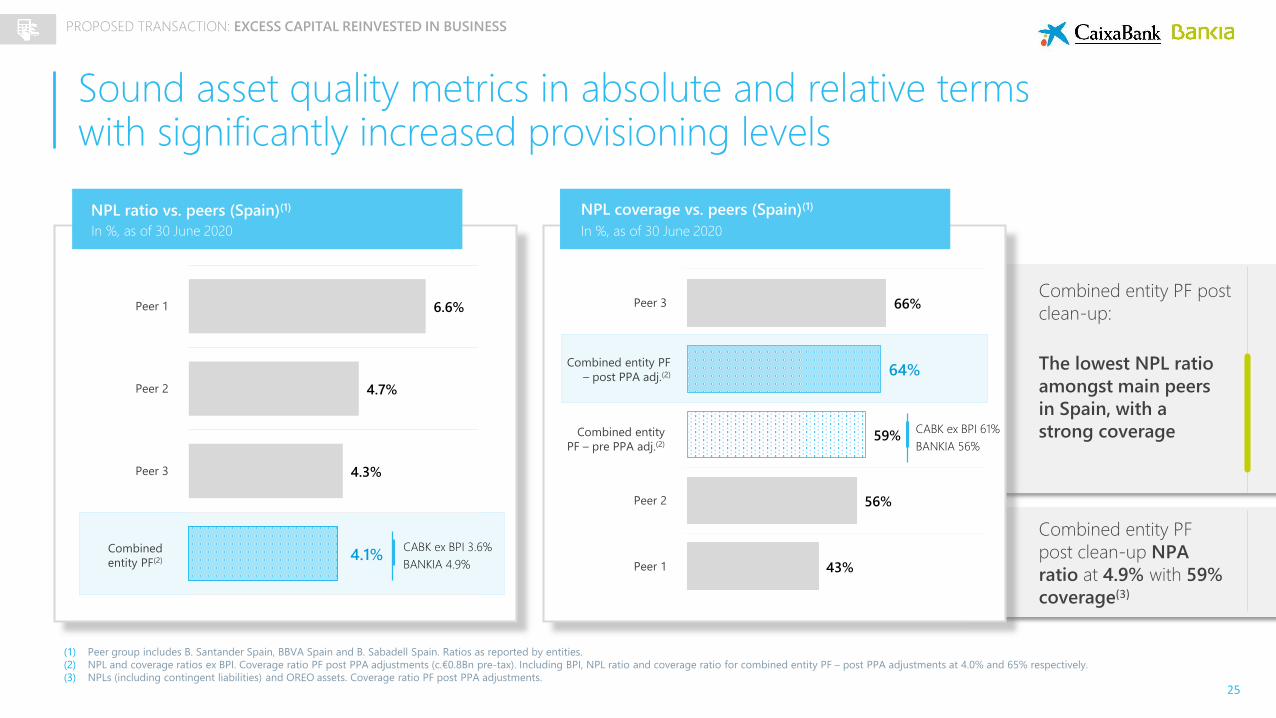
Sound asset quality metrics in absolute and relative termswith significantly increased provisioning levels
The lowest NPL ratio
amongst main peers
in Spain, with a
strong coverage
NPL ratio vs. peers (Spain)(1) NPL coverage vs. peers (Spain)(1)
In %, as of 30 June 2020 In %, as of 30 June 2020
CABK ex BPI 61%
BANKIA 56%
Combined entity
PF – pre PPA adj.(2)
Combined entity PF
post clean-up NPA
ratio at 4.9% with 59%
coverage(3)
Combined entity PF
– post PPA adj.(2)
Combined
entity PF(2)
CABK ex BPI 3.6%
BANKIA 4.9%
66%
64%
59%
56%
43%
Peer 3
Peer 2
Peer 14.1%
4.3%
4.7%
6.6%
Peer 3
Peer 2
Peer 1Combined entity PF post
clean-up:
(1) Peer group includes B. Santander Spain, BBVA Spain and B. Sabadell Spain. Ratios as reported by entities.
(2) NPL and coverage ratios ex BPI. Coverage ratio PF post PPA adjustments (c.€0.8Bn pre-tax). Including BPI, NPL ratio and coverage ratio for combined entity PF – post PPA adjustments at 4.0% and 65% respectively.
(3) NPLs (including contingent liabilities) and OREO assets. Coverage ratio PF post PPA adjustments.
PROPOSED TRANSACTION: EXCESS CAPITAL REINVESTED IN BUSINESS
26
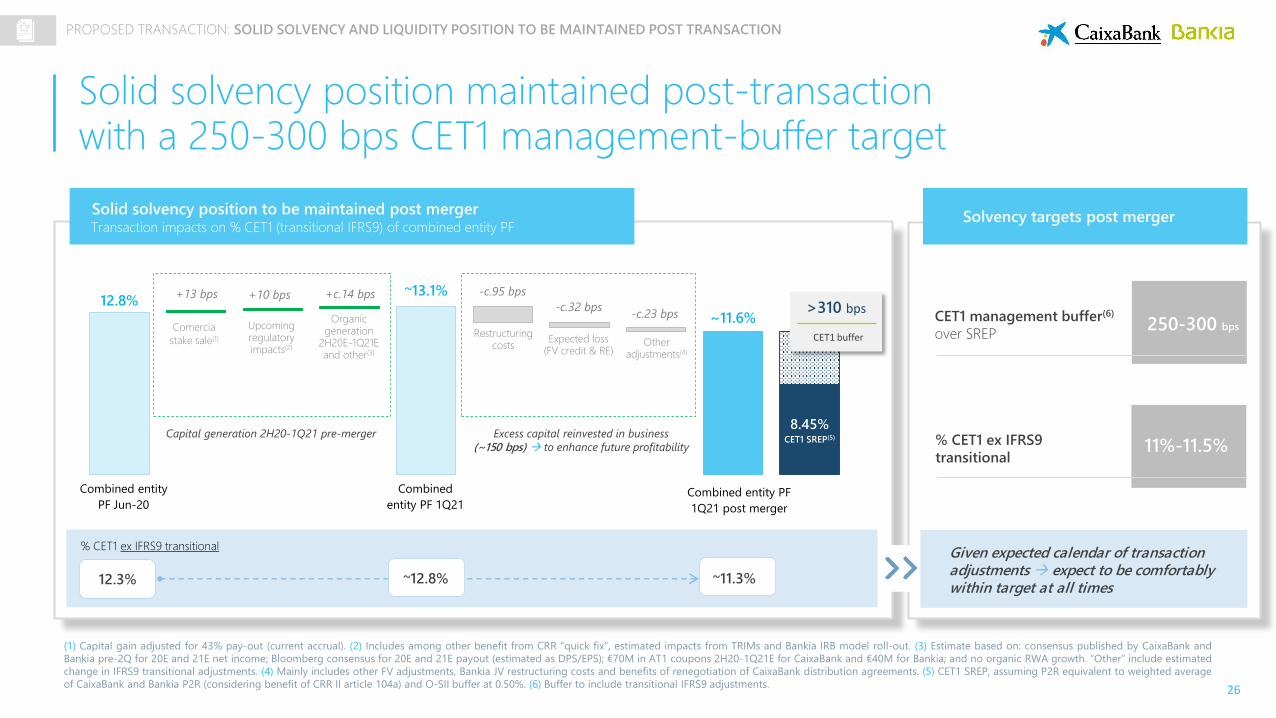
Solid solvency position maintained post-transaction with a 250-300 bps CET1 management-buffer target
(1) Capital gain adjusted for 43% pay-out (current accrual). (2) Includes among other benefit from CRR “quick fix”, estimated impacts from TRIMs and Bankia IRB model roll-out. (3) Estimate based on: consensus published by CaixaBank and
Bankia pre-2Q for 20E and 21E net income; Bloomberg consensus for 20E and 21E payout (estimated as DPS/EPS); €70M in AT1 coupons 2H20-1Q21E for CaixaBank and €40M for Bankia; and no organic RWA growth. “Other” include estimated
change in IFRS9 transitional adjustments. (4) Mainly includes other FV adjustments, Bankia JV restructuring costs and benefits of renegotiation of CaixaBank distribution agreements. (5) CET1 SREP, assuming P2R equivalent to weighted average
of CaixaBank and Bankia P2R (considering benefit of CRR II article 104a) and O-SII buffer at 0.50%. (6) Buffer to include transitional IFRS9 adjustments.
Solid solvency position to be maintained post mergerTransaction impacts on % CET1 (transitional IFRS9) of combined entity PF
~11.3%
% CET1 ex IFRS9 transitional
12.3%
Given expected calendar of transaction adjustments expect to be comfortably within target at all times
CET1 management buffer(6)
over SREP
11%-11.5%% CET1 ex IFRS9
transitional
250-300 bps
Solvency targets post merger
12.8%~13.1%
~11.6%
8.45%CET1 SREP(5)
-c.95 bps
Restructuring costs
+c.14 bps
Other adjustments(4)
-c.32 bps
Expected loss (FV credit & RE)
Comercia
stake sale(1)
Upcoming regulatory impacts(2)
+13 bps +10 bps
Combined entity
PF Jun-20Combined entity PF
1Q21 post merger
-c.23 bpsOrganic generation
2H20E-1Q21E and other(3)
Combined
entity PF 1Q21
>310 bps
CET1 buffer
Excess capital reinvested in business
(~150 bps) to enhance future profitability
Capital generation 2H20-1Q21 pre-merger
~12.8%
PROPOSED TRANSACTION: SOLID SOLVENCY AND LIQUIDITY POSITION TO BE MAINTAINED POST TRANSACTION
27
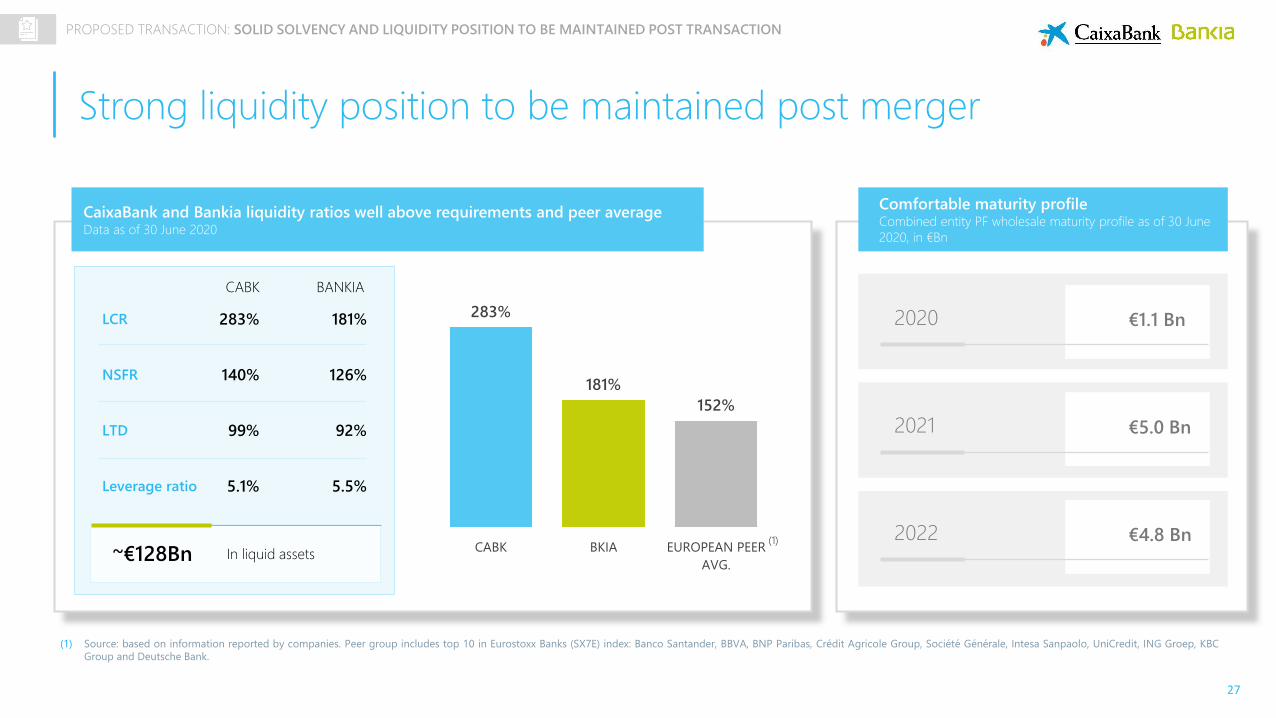
Strong liquidity position to be maintained post merger
(1) Source: based on information reported by companies. Peer group includes top 10 in Eurostoxx Banks (SX7E) index: Banco Santander, BBVA, BNP Paribas, Crédit Agricole Group, Société Générale, Intesa Sanpaolo, UniCredit, ING Groep, KBC
Group and Deutsche Bank.
CaixaBank and Bankia liquidity ratios well above requirements and peer averageData as of 30 June 2020
283%
181%
152%
CABK BKIA EUROPEAN PEER
AVG.
CABK BANKIA
(1)
Comfortable maturity profileCombined entity PF wholesale maturity profile as of 30 June
2020, in €Bn
LCR 283% 181%
NSFR 140% 126%
LTD 99% 92%
~€128Bn In liquid assets
2020 €1.1 Bn
2021 €5.0 Bn
2022 €4.8 Bn
Leverage ratio 5.1% 5.5%
PROPOSED TRANSACTION: SOLID SOLVENCY AND LIQUIDITY POSITION TO BE MAINTAINED POST TRANSACTION
28
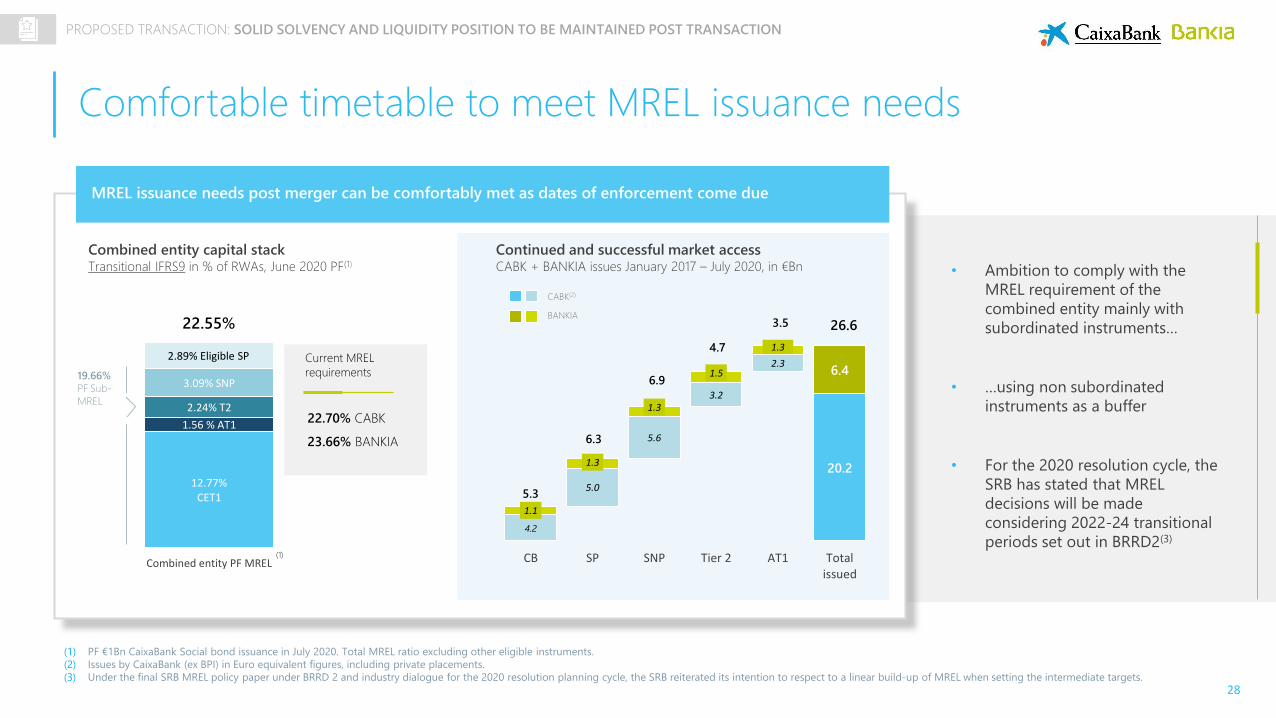
Comfortable timetable to meet MREL issuance needs
(1) PF €1Bn CaixaBank Social bond issuance in July 2020. Total MREL ratio excluding other eligible instruments.
(2) Issues by CaixaBank (ex BPI) in Euro equivalent figures, including private placements.
(3) Under the final SRB MREL policy paper under BRRD 2 and industry dialogue for the 2020 resolution planning cycle, the SRB reiterated its intention to respect to a linear build-up of MREL when setting the intermediate targets.
MREL issuance needs post merger can be comfortably met as dates of enforcement come due
12.77% CET1
1.56 % AT1
2.24% T2
3.09% SNP
2.89% Eligible SP
Combined entity PF MREL
19.66%
PF Sub-
MREL
Current MREL
requirements
22.70% CABK
23.66% BANKIA
(1)
• Ambition to comply with the
MREL requirement of the
combined entity mainly with
subordinated instruments…
• …using non subordinated
instruments as a buffer
• For the 2020 resolution cycle, the
SRB has stated that MREL
decisions will be made
considering 2022-24 transitional
periods set out in BRRD2(3)
Combined entity capital stackTransitional IFRS9 in % of RWAs, June 2020 PF(1)
22.55%
4.2
20.2
5.0
5.6
3.2
2.3
1.1
1.3
1.3
1.5
1.3
6.4
5.3
6.3
6.9
4.7
3.5 26.6
CB SP SNP Tier 2 AT1 Totalissued
Continued and successful market accessCABK + BANKIA issues January 2017 – July 2020, in €Bn
CABK(2)
BANKIA
PROPOSED TRANSACTION: SOLID SOLVENCY AND LIQUIDITY POSITION TO BE MAINTAINED POST TRANSACTION
29
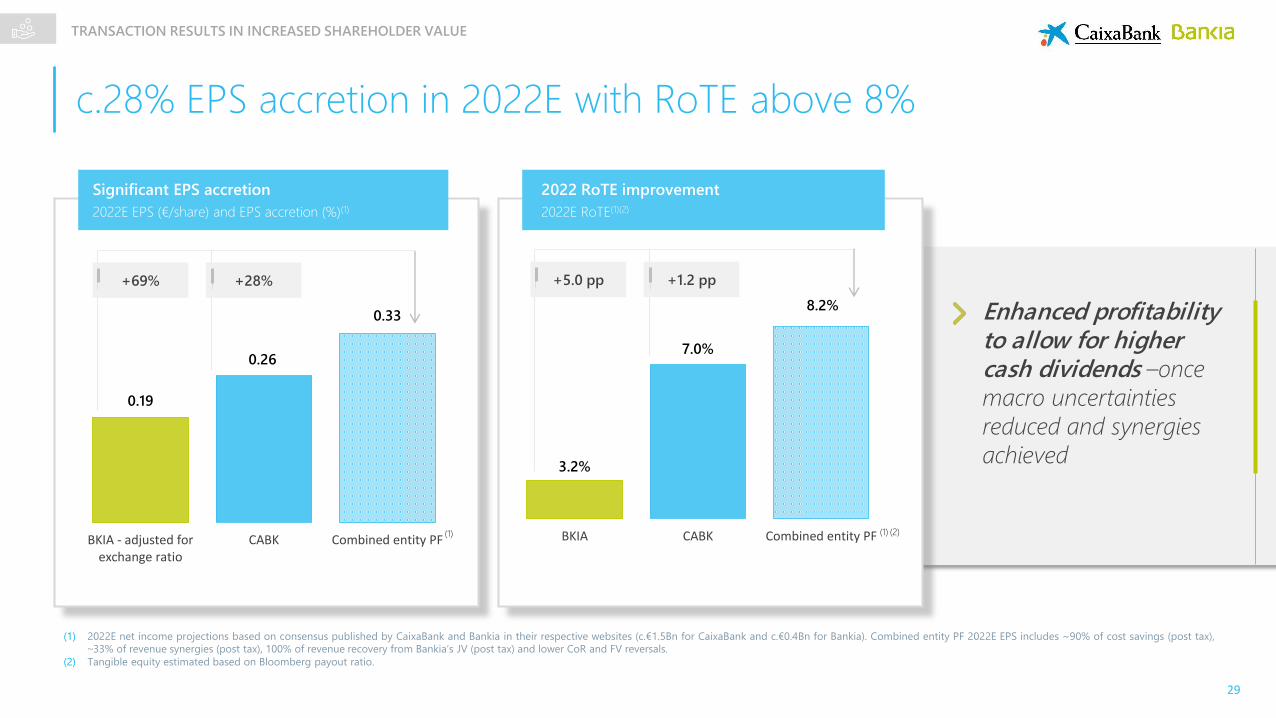
c.28% EPS accretion in 2022E with RoTE above 8%
TRANSACTION RESULTS IN INCREASED SHAREHOLDER VALUE
(1) 2022E net income projections based on consensus published by CaixaBank and Bankia in their respective websites (c.€1.5Bn for CaixaBank and c.€0.4Bn for Bankia). Combined entity PF 2022E EPS includes ~90% of cost savings (post tax),
~33% of revenue synergies (post tax), 100% of revenue recovery from Bankia’s JV (post tax) and lower CoR and FV reversals.
(2) Tangible equity estimated based on Bloomberg payout ratio.
Enhanced profitability to allow for higher cash dividends –once
macro uncertainties
reduced and synergies
achieved
Significant EPS accretion
2022E EPS (€/share) and EPS accretion (%)(1)
2022 RoTE improvement
2022E RoTE(1)(2)
0.19
0.26
0.33
BKIA - adjusted forexchange ratio
CABK Combined entity PF(1)
+28%+69%
3.2%
7.0%
8.2%
BKIA CABK Combined entity PF
+1.2 pp+5.0 pp
(1) (2)
30
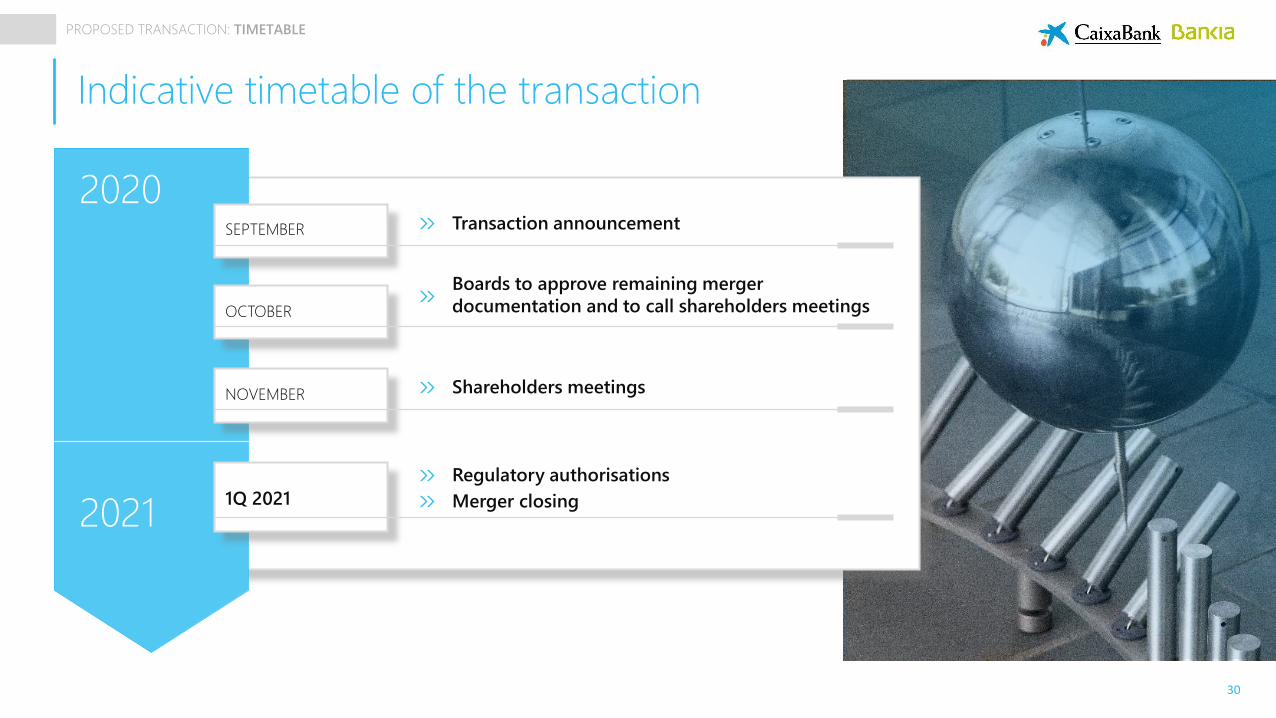
Indicative timetable of the transaction
2020
20211Q 2021 Merger closing
SEPTEMBER Transaction announcement
Boards to approve remaining merger
documentation and to call shareholders meetingsOCTOBER
NOVEMBER Shareholders meetings
Regulatory authorisations
PROPOSED TRANSACTION: TIMETABLE
31
Contents
I. Strategic rationale
III.Key takeaways
II. Proposed transaction: description, impacts & timetable
32
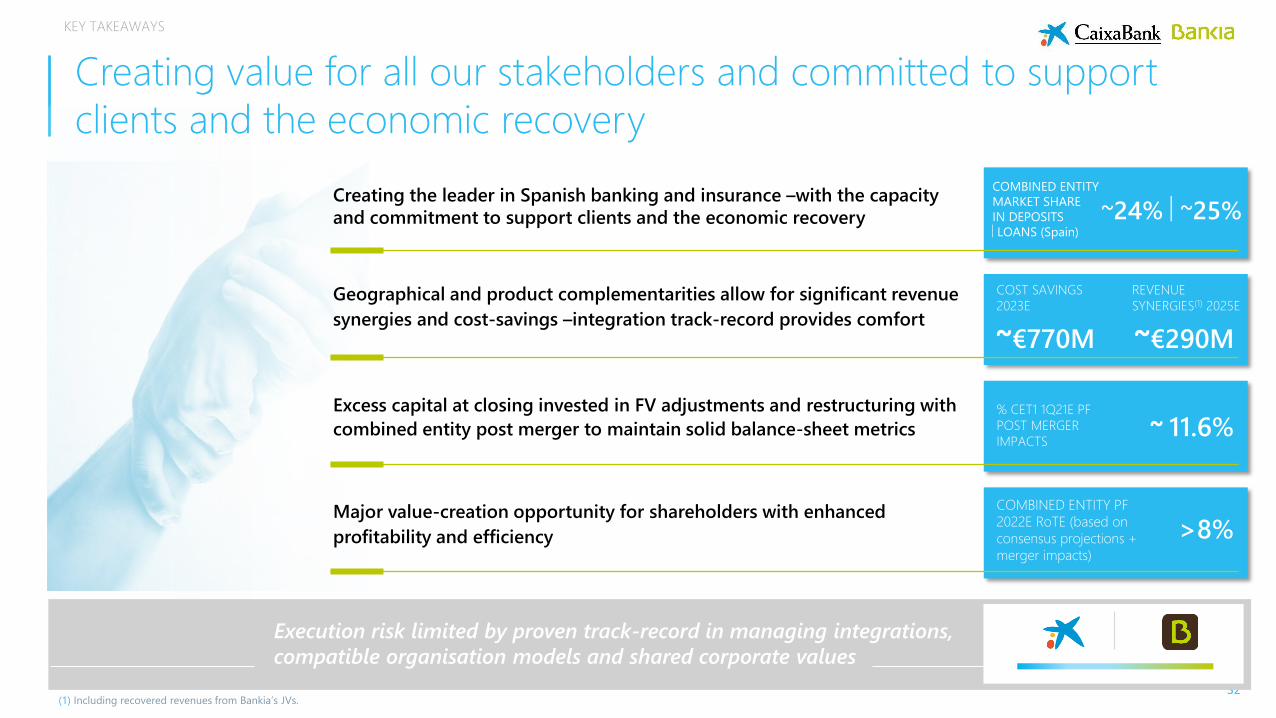
KEY TAKEAWAYS
Creating value for all our stakeholders and committed to support
clients and the economic recovery
Creating the leader in Spanish banking and insurance –with the capacity
and commitment to support clients and the economic recovery
Geographical and product complementarities allow for significant revenue
synergies and cost-savings –integration track-record provides comfort
Excess capital at closing invested in FV adjustments and restructuring with
combined entity post merger to maintain solid balance-sheet metrics
Major value-creation opportunity for shareholders with enhanced
profitability and efficiency
Execution risk limited by proven track-record in managing integrations,
compatible organisation models and shared corporate values
~24% ~25%COMBINED ENTITY
MARKET SHARE
IN DEPOSITS
LOANS (Spain)
~€770M
COST SAVINGS
2023E
REVENUE
SYNERGIES(1) 2025E
~€290M
~ 11.6%% CET1 1Q21E PF
POST MERGER
IMPACTS
COMBINED ENTITY PF
2022E RoTE (based on
consensus projections +
merger impacts)
>8%
(1) Including recovered revenues from Bankia’s JVs.
33
APPENDIX
APPENDIX: Glossary
34
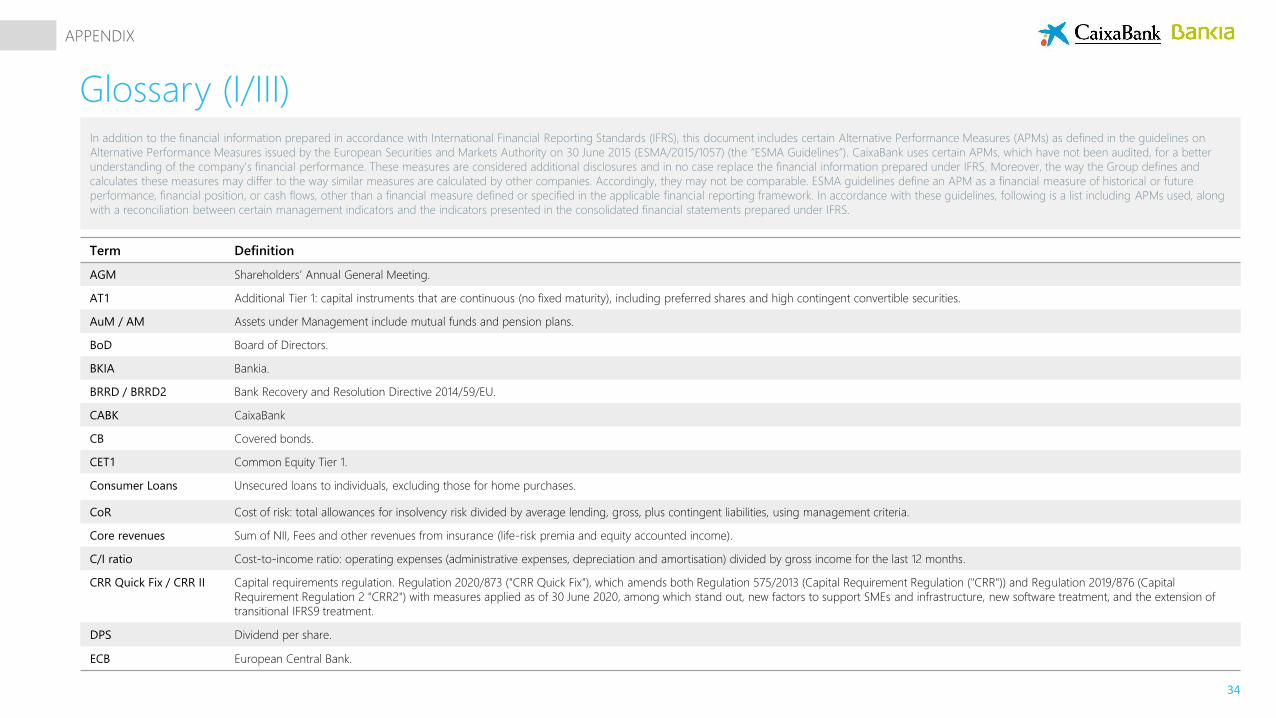
Glossary (I/III)In addition to the financial information prepared in accordance with International Financial Reporting Standards (IFRS), this document includes certain Alternative Performance Measures (APMs) as defined in the guidelines on
Alternative Performance Measures issued by the European Securities and Markets Authority on 30 June 2015 (ESMA/2015/1057) (the “ESMA Guidelines”). CaixaBank uses certain APMs, which have not been audited, for a better
understanding of the company's financial performance. These measures are considered additional disclosures and in no case replace the financial information prepared under IFRS. Moreover, the way the Group defines and
calculates these measures may differ to the way similar measures are calculated by other companies. Accordingly, they may not be comparable. ESMA guidelines define an APM as a financial measure of historical or future
performance, financial position, or cash flows, other than a financial measure defined or specified in the applicable financial reporting framework. In accordance with these guidelines, following is a list including APMs used, along
with a reconciliation between certain management indicators and the indicators presented in the consolidated financial statements prepared under IFRS.
Term Definition
AGM Shareholders’ Annual General Meeting.
AT1 Additional Tier 1: capital instruments that are continuous (no fixed maturity), including preferred shares and high contingent convertible securities.
AuM / AM Assets under Management include mutual funds and pension plans.
BoD Board of Directors.
BKIA Bankia.
BRRD / BRRD2 Bank Recovery and Resolution Directive 2014/59/EU.
CABK CaixaBank
CB Covered bonds.
CET1 Common Equity Tier 1.
Consumer Loans Unsecured loans to individuals, excluding those for home purchases.
CoR Cost of risk: total allowances for insolvency risk divided by average lending, gross, plus contingent liabilities, using management criteria.
Core revenues Sum of NII, Fees and other revenues from insurance (life-risk premia and equity accounted income).
C/I ratio Cost-to-income ratio: operating expenses (administrative expenses, depreciation and amortisation) divided by gross income for the last 12 months.
CRR Quick Fix / CRR II Capital requirements regulation. Regulation 2020/873 ("CRR Quick Fix"), which amends both Regulation 575/2013 (Capital Requirement Regulation ("CRR")) and Regulation 2019/876 (Capital
Requirement Regulation 2 "CRR2") with measures applied as of 30 June 2020, among which stand out, new factors to support SMEs and infrastructure, new software treatment, and the extension of
transitional IFRS9 treatment.
DPS Dividend per share.
ECB European Central Bank.
APPENDIX
35
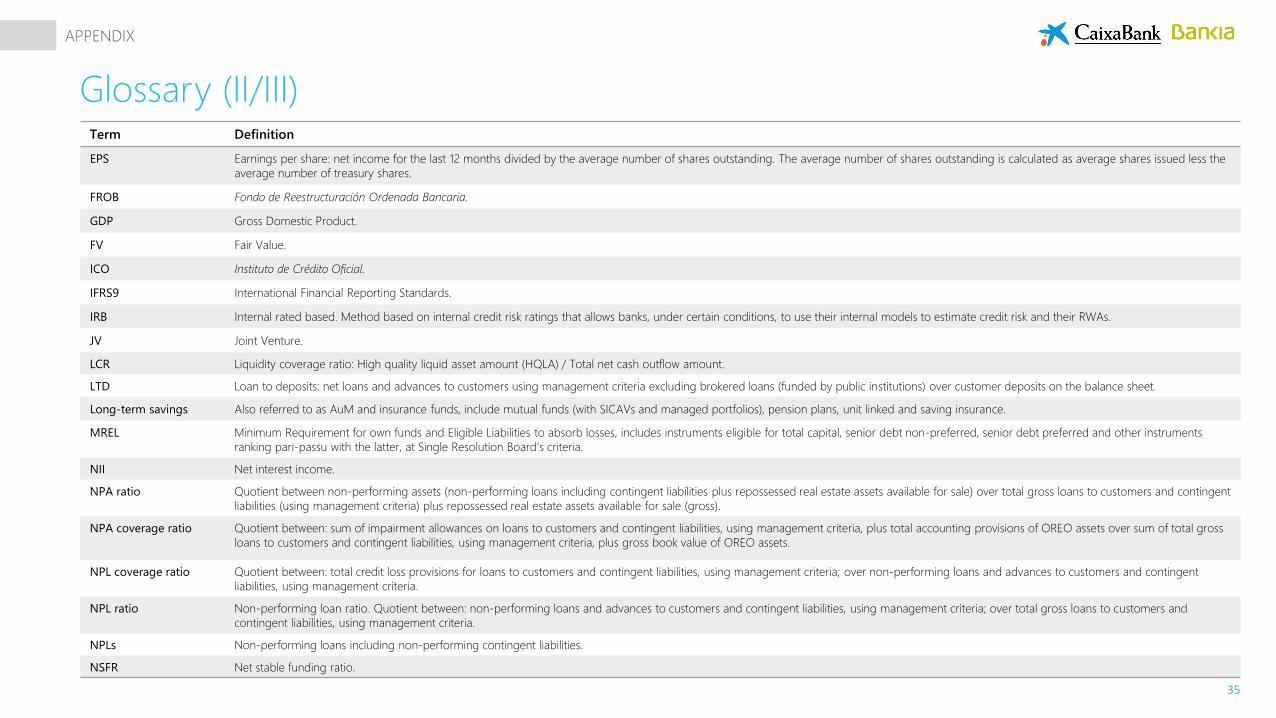
Glossary (II/III)Term Definition
EPS Earnings per share: net income for the last 12 months divided by the average number of shares outstanding. The average number of shares outstanding is calculated as average shares issued less the
average number of treasury shares.
FROB Fondo de Reestructuración Ordenada Bancaria.
GDP Gross Domestic Product.
FV Fair Value.
ICO Instituto de Crédito Oficial.
IFRS9 International Financial Reporting Standards.
IRB Internal rated based. Method based on internal credit risk ratings that allows banks, under certain conditions, to use their internal models to estimate credit risk and their RWAs.
JV Joint Venture.
LCR Liquidity coverage ratio: High quality liquid asset amount (HQLA) / Total net cash outflow amount.
LTD Loan to deposits: net loans and advances to customers using management criteria excluding brokered loans (funded by public institutions) over customer deposits on the balance sheet.
Long-term savings Also referred to as AuM and insurance funds, include mutual funds (with SICAVs and managed portfolios), pension plans, unit linked and saving insurance.
MREL Minimum Requirement for own funds and Eligible Liabilities to absorb losses, includes instruments eligible for total capital, senior debt non-preferred, senior debt preferred and other instruments
ranking pari-passu with the latter, at Single Resolution Board’s criteria.
NII Net interest income.
NPA ratio Quotient between non-performing assets (non-performing loans including contingent liabilities plus repossessed real estate assets available for sale) over total gross loans to customers and contingent
liabilities (using management criteria) plus repossessed real estate assets available for sale (gross).
NPA coverage ratio Quotient between: sum of impairment allowances on loans to customers and contingent liabilities, using management criteria, plus total accounting provisions of OREO assets over sum of total gross
loans to customers and contingent liabilities, using management criteria, plus gross book value of OREO assets.
NPL coverage ratio Quotient between: total credit loss provisions for loans to customers and contingent liabilities, using management criteria; over non-performing loans and advances to customers and contingent
liabilities, using management criteria.
NPL ratio Non-performing loan ratio. Quotient between: non-performing loans and advances to customers and contingent liabilities, using management criteria; over total gross loans to customers and
contingent liabilities, using management criteria.
NPLs Non-performing loans including non-performing contingent liabilities.
NSFR Net stable funding ratio.
APPENDIX
36
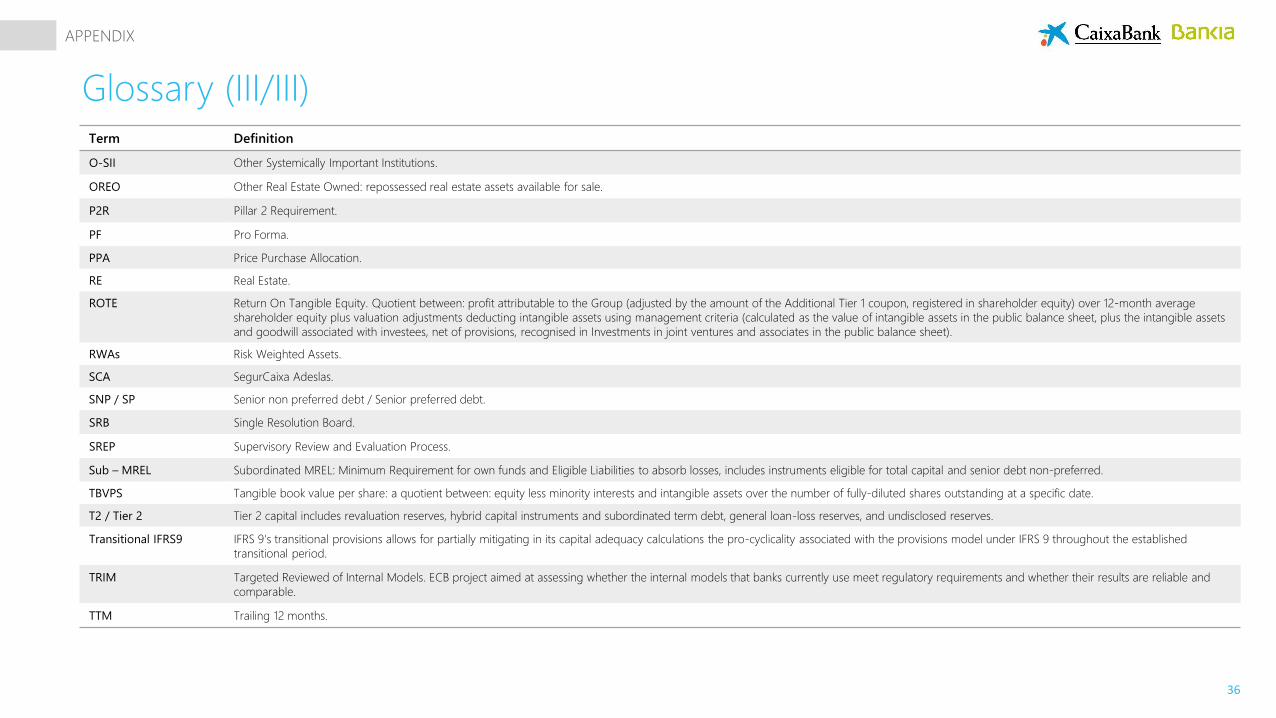
Glossary (III/III)Term Definition
O-SII Other Systemically Important Institutions.
OREO Other Real Estate Owned: repossessed real estate assets available for sale.
P2R Pillar 2 Requirement.
PF Pro Forma.
PPA Price Purchase Allocation.
RE Real Estate.
ROTE Return On Tangible Equity. Quotient between: profit attributable to the Group (adjusted by the amount of the Additional Tier 1 coupon, registered in shareholder equity) over 12-month average
shareholder equity plus valuation adjustments deducting intangible assets using management criteria (calculated as the value of intangible assets in the public balance sheet, plus the intangible assets
and goodwill associated with investees, net of provisions, recognised in Investments in joint ventures and associates in the public balance sheet).
RWAs Risk Weighted Assets.
SCA SegurCaixa Adeslas.
SNP / SP Senior non preferred debt / Senior preferred debt.
SRB Single Resolution Board.
SREP Supervisory Review and Evaluation Process.
Sub – MREL Subordinated MREL: Minimum Requirement for own funds and Eligible Liabilities to absorb losses, includes instruments eligible for total capital and senior debt non-preferred.
TBVPS Tangible book value per share: a quotient between: equity less minority interests and intangible assets over the number of fully-diluted shares outstanding at a specific date.
T2 / Tier 2 Tier 2 capital includes revaluation reserves, hybrid capital instruments and subordinated term debt, general loan-loss reserves, and undisclosed reserves.
Transitional IFRS9 IFRS 9's transitional provisions allows for partially mitigating in its capital adequacy calculations the pro-cyclicality associated with the provisions model under IFRS 9 throughout the established
transitional period.
TRIM Targeted Reviewed of Internal Models. ECB project aimed at assessing whether the internal models that banks currently use meet regulatory requirements and whether their results are reliable and
comparable.
TTM Trailing 12 months.
APPENDIX

+34 93 411 75 03
+34 91 423 94 20
www.CaixaBank.com www.Bankia.com