
Soil organism influence on ecosystem-level processes – bypassing the ecological hierarchy?

BYPASSING PROGRESSIVE TAXATION: FRAUD AND BASE EROSION IN THE
SPANISH INCOME TAX (1970-2001)
Sara Torregrosa Hetland
Document de treball de l’IEB 2015/31
Tax Systems Analysis

Documents de Treball de l’IEB 2015/31
BYPASSING PROGRESSIVE TAXATION:
FRAUD AND BASE EROSION IN THE
SPANISH INCOME TAX (1970-2001)
Sara Torregrosa
The IEB research program in Tax Systems Analysis aims at promoting high quality
research in the field of taxation, taking into account not only the traditional approach to
optimal taxation, but also administrative issues and the decentralization or globalization
context. The ultimate aim of the program is to generate socially useful knowledge in
this field. Special emphasis is put on empirical research, and on the analysis of the
Spanish Tax System. The program enjoys the support from the IEB-Foundation.
The Barcelona Institute of Economics (IEB) is a research centre at the University of
Barcelona (UB) which specializes in the field of applied economics. The IEB is a
foundation funded by the following institutions: Applus, Abertis, Ajuntament de
Barcelona, Diputació de Barcelona, Gas Natural, La Caixa and Universitat de
Barcelona.
Postal Address:
Institut d’Economia de Barcelona
Facultat d’Economia i Empresa
Universitat de Barcelona
C/John M Keynes, 1-11
(08034) Barcelona, Spain
Tel.: + 34 93 403 46 46
http://www.ieb.ub.edu
The IEB working papers represent ongoing research that is circulated to encourage
discussion and has not undergone a peer review process. Any opinions expressed here
are those of the author(s) and not those of IEB.
Documents de Treball de l’IEB 2015/31
BYPASSING PROGRESSIVE TAXATION:
FRAUD AND BASE EROSION IN THE
SPANISH INCOME TAX (1970-2001) *
Sara Torregrosa
ABSTRACT: In this paper I estimate under-assessment of incomes in the Personal Income
Tax during the years following its introduction in Spain. The methodology combines an analysis
of discrepancy with National Accounts and an econometric exercise, which follows and slightly
modifies the Feldman and Slemrod (2007) procedure, based on the relation of reported
charitable donations with the composition of income in tax micro-data.
Both calculations show that concealment of income differed substantially across sources and
levels, with better compliance at the bottom of the distribution of taxpayers. Because of this,
fraud made the tax less progressive than it was on paper. Compliance improved over the next
decades, but the overall levels were still far from those attained in developed countries, because
of lack of administrative capacity or political will to enforce the new regulation. In this way,
general, comprehensive income taxation was hardly a reality 20 years after its introduction.
MAIN RESULT: Widespread evasion and avoidance in non-wage incomes severely affected
the Spanish personal income tax during its first years in force, limiting both revenue and the
redistributive effects of taxation.
JEL Codes: H23, H24, H26, N44
Keywords: Tax evasion, base erosion, under-reporting, progressivity, personal income tax
Sara Torregrosa
University of Barcelona
Departament of Economic History and Institutions
690 Avda. Diagonal, 08034 Barcelona, Spain
E-mail: [email protected]
* This paper is part of my PhD dissertation project “Tax system and redistribution: the Spanish fiscal transition (1960-
1990)”, under the supervision of Alfonso Herranz Loncán and Alejandro Esteller Moré, to whom I am most grateful for
their help. I acknowledge financial support from the Spanish Ministry of Education’s scholarship program Formación del
Profesorado Universitario and the Research Project ECO2012-39169-C03-03. I also thank the comments by Miguel Artola,
Nadja Dwenger, Sergio Espuelas, Alessia Matano, Fernando Rodrigo and Emmanuel Saez, who hosted me at UC Berkeley
while developing this research. I benefited from discussion by seminar participants at the University of Barcelona, UC
Berkeley, UC Davis, UC Irvine, the Public University of Navarra, the University of Valencia, the University of Zaragoza,
the EHS conference in Wolverhampton University and the University of Umeå. All remaining errors are my own.
1 Introduction
Personal income taxation was at the centre of developed countries’ tax systems in the second half
of the 20th Century. It provided a significant share of revenues and occupied a pivotal place in
the tax debate. In theory, it was designed to follow the “ability to pay” principle, and for that
reason rested on two pillars: generality (affecting all citizens over a given income threshold) and
comprehensive income definition. These traits made it something different from Ancien Regime
taxation, the realm of privileges, and also from 19th Century factor taxes, which targeted each
revenue source independently. Generality and a comprehensive income definition, together with
the consideration of personal circumstances in the tax, make it possible to introduce effective
progressivity and redistribution.
However, in the presence of fraud and base erosion, practice might differ considerably from
theory. That was the sense of Gunnar Myrdal’s tough critique of the Swedish income tax in 1978.
He argued that high marginal tax rates created incentives to avoid and evade taxes, and hence
equity –specially horizontal equity– was not at place. According to Bjorklund et al. (1995), this
opinion influenced his society’s views and drove towards reform in 1991.
A corollary to Myrdal’s argument was that formal progressivity did not translate itself into
redistribution from rich to poor. The Spanish economist Fuentes Quintana thought likewise. He
had been a strong advocate of tax reform in the preceding decades, pushing for a central place of a
progressive income tax in the system. It was under his guidance that this model was introduced in
Spain in 1977-78, when the country was transitioning into democracy. However, in the following
years Fuentes was very critical of the result, specially in relation to persistent evasion, and became
a proponent of the flat tax in the 1980s.
One may or may not share this proposal as a solution for evasion. But the concern about fraud
–in a broad sense– was and is crucial, since it carries negative consequences on the tax system and
society in many dimensions. On the one hand, it reduces tax revenue, imposing heavier spending
constraints on the government. It also represents a cost for society because of the effort spent
in otherwise unproductive concealment and punishment activities. Horizontal inequity, on the
other hand, is likely to erode the perceived legitimacy of the tax system. Finally, fraud also affects
vertical equity, if the ability to evade (and maybe the propensity) changes along the income scale.
In this paper, I focus on the last issue.
What do we know about how tax evasion is actually distributed? Economic theory has at-
tempted to model the individual decision on whether or not to evade as a choice of the taxpayer
in face of risk. In the classical “deterrence model” of Allingham and Sandmo (1972), the individ-
ual under-reports her income to a certain extent, to minimize the tax bill, taking into account the
possibility of being caught and the heaviness of the sanction. Related literature has abounded on
the relation between marginal tax rates, the income level and evasion. Conclusions are dependent
on the specific assumptions about the nature of risk aversion, but tend to point towards higher
incentives to evade at higher levels of income and maybe also in front of higher tax rates; since
2
these tend to grow with income, which of the two forces prevails is an empirical question.1
However, these models were shown to predict much higher levels of non-compliance than
found in reality. In response to that, further work paid attention to other possible determinants
of the reporting behaviour, such as tax morale (Andreoni et al., 1998; Luttmer and Singhal, 2014);
the importance of withholding at source and third-party information reporting has been recently
underlined as a key factor by Kleven et al. (2011). What about the relation of those with income
levels? We do not know much about how tax morale can differ across the income schedule, but,
by contrast, it is well known that some kinds of revenue are subject to much stricter control than
others, and having distinct distributions: income from labour versus income from capital.
The empirical literature has provided us with several analyses pointing towards a possi-
ble positive impact of income on under-reporting, but with considerable uncertainty because of
econometric issues. The seminal work of Clotfelter (1983) for the US and those of Valdes (1982)
and Raymond-Bara (1987) for Spain found high-income taxpayers to under-report more, but the
effect of income was difficult to disentangle from the effect of marginal tax rates because of the
intense correlation between both.2 Indeed, Feinstein (1991) contradicted Clotfelter in not finding
a significant effect of income on the reporting behaviour.3
Work addressed to study the distribution of fraud has also suggested a rate of under-reporting
increasing with income. For the US, the data have been available thanks to the Tax Compliance
Measurement Program (later on, the National Research Program), providing samples of randomly
audited tax returns. Using them, Johns and Slemrod (2010) found evasion to reach maximums
in the top percentiles. This was partially a result of the composition of incomes, but not ex-
clusively.4 Similar conclusions were obtained by Feldman and Slemrod (2007), who estimated
under-reporting with un-audited data:5 it was increasing with income levels for self-employment
non-farm income and for capital income. The analyses closest to mine are Alm et al. (1991); Mat-
saganis and Flevotomou (2010) and Benedek and Lelkes (2011); specially the first one, which
estimates total tax base erosion for the case of Jamaica in 1983. To my knowledge, an analysis of
the distribution of evasion across the income scale has not yet been undertaken in Spain, although
we have some intuitions from studies that will be reviewed in the following section.
1In Allingham and Sandmo (1972)’s paper, the income level would increase evasion (i.e., the percentage of income
non-reported) if relative risk aversion is decreasing with income. The impact of the tax rate was found to be ambiguous
in the case of decreasing absolute risk aversion (DARA, the most accepted possibility). Yitzhaki (1974) contemplated the
common case where the sanction depends of the evaded tax – as opposed to the under-reported income in Allingham and
Sandmo (1972)’s model. His specification does not change the expected effect of income, while it does alter the impact
of the tax rate, that would now decrease evasion, in presence of DARA. (Allingham and Sandmo’s results also stated that
with DARA the absolute level of reported income will only increase when the sanction is a factor at least equal to 1).
2In spite of this, Raymond-Bara blamed the tax rates and thus made strong policy recommendations.
3This kind of empirical analyses have also analysed the effect of other factors, such as age, education level, marital
status... The discussion of those is out of the scope of this paper.
4Bishop et al. (2000) used the same kind of data for the 1980s, estimating the changes in the indices of inequality caused
by including evaded income. They found that vertical equity was affected, although less than horizontal equity.
5Their methodology will be reviewed and closely replicated in section 4.2 of this paper.
3
My preliminary hypothesis is that evasion in a broad sense (income concealment) was higher
at the top of the income scale, and that, therefore, the tax was less progressive de facto than de jure.
This would stem from the easier avoidance and non-reporting of capital incomes, while wages
and salaries were most likely withheld at source. If the theoretical models are right, incentives to
evade more at higher income levels or tax rates would push in the same direction.
The paper also proposes a methodological innovation, slightly modifying Feldman and Slem-
rod (2007)’s model to estimate evasion across filers by income source. Because the estimation is
based on the relationship between reported incomes and deducted donations, the regression is
performed using a restricted sample (those who itemized donations in a given year). The reason
to do this is that the results of a baseline estimation may be biased in a context were donation
behaviour is not as widespread as in the United States: in this case, a two-step procedure a la
Heckman (1979) might provide better results. This is the first time that such an approach is taken
in the tax evasion literature.
The rest of the paper is organized as follows. In section 2 I review previous work about tax
evasion in Spain, while some aggregate data about compliance and inspection is presented in
section 3. I next explain the methodology applied to estimate tax evasion in the personal income
tax between 1971 and 2001 (section 4) and show the results obtained and the impact of evasion
on progressivity (section 5). Finally, a general summary and some conclusions are presented in
section 6.
2 Previous estimates of income tax evasion
Spain usually scores high among European countries in studies about the underground economy:
Schneider (2009)’s estimates of 16%-23% of GDP make the country rank third in his sample in
2009, only after Greece and Italy. National studies generally agree about an increasing shadow
economy during the eighties, with a peak around 1993-95, and its inability to fall below 15% of
GDP thereafter (Pickhardt and Sarda, 2015).
Tax fraud is directly related to this phenomenon, though not equivalent. Some attempts have
been made to estimate evasion in several taxes in the country, such as the Corporation tax (Truy-
ols, 1994; Almunia and Lopez-Rodriguez, 2012) or the Value added tax (Dıaz and Romero, 1994;
Gomez de Enterrıa et al., 1998). In this paper, however, the focus is on personal income taxation,
where evasion has been known to be widespread. Gota Losada (1970) underlined this issue in a
classic study about the first such tax (the Contribucion General sobre la Renta introduced in 1932),
with data on the fraud discovered by the tax inspection between the forties and the sixties. The
problem was addressed in further reports by the Spanish Institute for Fiscal Studies (Instituto de
Estudios Fiscales, 1973), but has remained one of the main unresolved issues in the system af-
ter the 1978 reform, which introduced the modern Personal Income Tax (Fuentes Quintana, 1990;
Comın, Francisco, 1994).
There are some estimations available. Albi (1975) studied the year 1971 (which corresponds
to the Impuesto General sobre la Renta de las Personas Fısicas, introduced in 1964). He calculated that
total under-reporting of income tax bases amounted to 78% of the aggregate tax base declared
4
that year (which meant 33% of Spain’s GDP). 6 The so-called personal income tax in Spain was,
until 1978, a super-tax: it only affected those whose income exceeded a high threshold (under
which incomes were taxed by factor taxes –“impuestos de producto”–, targeted at different kinds
of revenue separately). Albi’s calculation uses the whole group of factor taxes as a reference,
adding up their respective tax bases, so his result is not comparable to the specific collection of
the income tax per se: this was a negligible part of the total, as we shall see. The most important
of those factor taxes during the seventies was the Labour tax (Impuesto sobre los rendimientos del
trabajo personal), which can be fairly considered the main real precedent to the current PIT. Fraud
in this labour tax was estimated by Santos Penas (1975) to be around 56% for the years 1964-72
(also in terms of base under-reporting).7
In the process of introduction of the modern personal income tax, Alcaide (1980; 1981) per-
formed some analyses on compliance. He shows that around 20% of the obliged households filed
a return in 1977, going up to around 59% two years later. In both cases, however, ratios were de-
creasing with income, which points towards significant under-reporting: reported incomes were
around 21% of real estimated household revenues in 1977, and 61% in 1979.8
Under the modern Impuesto sobre la Renta de las Personas Fısicas, concern for this issue has
not diminished. Fuentes Quintana (1990) shows how 27.5% of a random sample of returns from
1979 were found fraudulent by inspectors, with the percentage of tax evaders increasing with
income, which supports the initial hypothesis in this paper. During the 1980s, a Commission was
appointed by the government to estimate evasion in several taxes. The PIT study group yielded
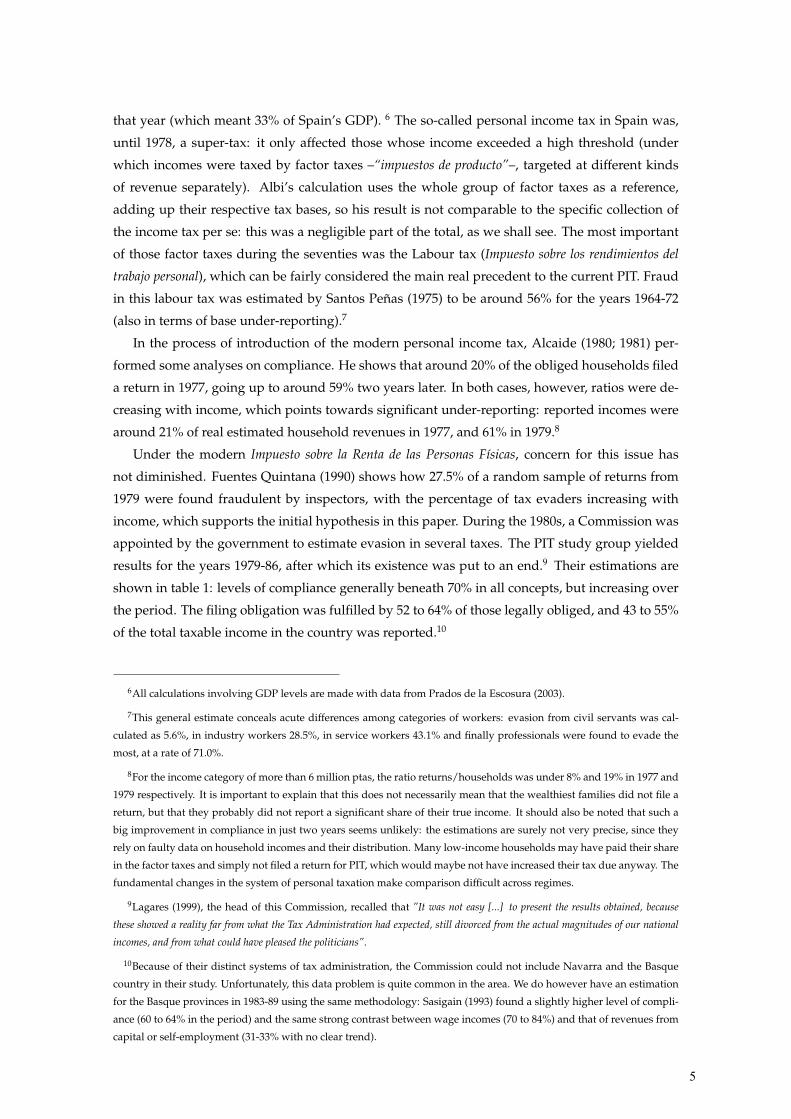
results for the years 1979-86, after which its existence was put to an end.9 Their estimations are
shown in table 1: levels of compliance generally beneath 70% in all concepts, but increasing over
the period. The filing obligation was fulfilled by 52 to 64% of those legally obliged, and 43 to 55%
of the total taxable income in the country was reported.10
6All calculations involving GDP levels are made with data from Prados de la Escosura (2003).
7This general estimate conceals acute differences among categories of workers: evasion from civil servants was cal-
culated as 5.6%, in industry workers 28.5%, in service workers 43.1% and finally professionals were found to evade the
most, at a rate of 71.0%.
8For the income category of more than 6 million ptas, the ratio returns/households was under 8% and 19% in 1977 and
1979 respectively. It is important to explain that this does not necessarily mean that the wealthiest families did not file a
return, but that they probably did not report a significant share of their true income. It should also be noted that such a
big improvement in compliance in just two years seems unlikely: the estimations are surely not very precise, since they
rely on faulty data on household incomes and their distribution. Many low-income households may have paid their share
in the factor taxes and simply not filed a return for PIT, which would maybe not have increased their tax due anyway. The
fundamental changes in the system of personal taxation make comparison difficult across regimes.
9Lagares (1999), the head of this Commission, recalled that ”It was not easy [...] to present the results obtained, because
these showed a reality far from what the Tax Administration had expected, still divorced from the actual magnitudes of our national
incomes, and from what could have pleased the politicians”.
10Because of their distinct systems of tax administration, the Commission could not include Navarra and the Basque
country in their study. Unfortunately, this data problem is quite common in the area. We do however have an estimation
for the Basque provinces in 1983-89 using the same methodology: Sasigain (1993) found a slightly higher level of compli-
ance (60 to 64% in the period) and the same strong contrast between wage incomes (70 to 84%) and that of revenues from
capital or self-employment (31-33% with no clear trend).
5
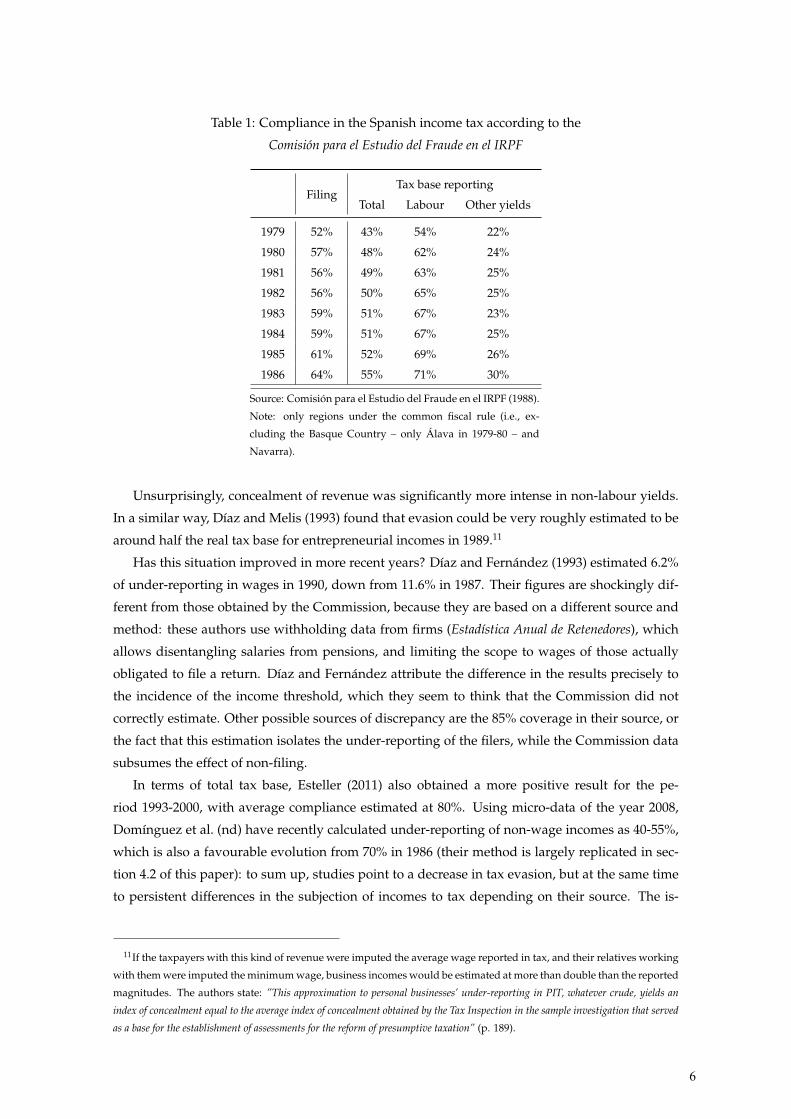
Table 1: Compliance in the Spanish income tax according to the
Comision para el Estudio del Fraude en el IRPF
FilingTax base reporting
Total Labour Other yields
1979 52% 43% 54% 22%
1980 57% 48% 62% 24%
1981 56% 49% 63% 25%
1982 56% 50% 65% 25%
1983 59% 51% 67% 23%
1984 59% 51% 67% 25%
1985 61% 52% 69% 26%
1986 64% 55% 71% 30%
Source: Comision para el Estudio del Fraude en el IRPF (1988).
Note: only regions under the common fiscal rule (i.e., ex-
cluding the Basque Country – only Alava in 1979-80 – and
Navarra).
Unsurprisingly, concealment of revenue was significantly more intense in non-labour yields.
In a similar way, Dıaz and Melis (1993) found that evasion could be very roughly estimated to be
around half the real tax base for entrepreneurial incomes in 1989.11
Has this situation improved in more recent years? Dıaz and Fernandez (1993) estimated 6.2%
of under-reporting in wages in 1990, down from 11.6% in 1987. Their figures are shockingly dif-
ferent from those obtained by the Commission, because they are based on a different source and
method: these authors use withholding data from firms (Estadıstica Anual de Retenedores), which
allows disentangling salaries from pensions, and limiting the scope to wages of those actually
obligated to file a return. Dıaz and Fernandez attribute the difference in the results precisely to
the incidence of the income threshold, which they seem to think that the Commission did not
correctly estimate. Other possible sources of discrepancy are the 85% coverage in their source, or
the fact that this estimation isolates the under-reporting of the filers, while the Commission data
subsumes the effect of non-filing.
In terms of total tax base, Esteller (2011) also obtained a more positive result for the pe-
riod 1993-2000, with average compliance estimated at 80%. Using micro-data of the year 2008,
Domınguez et al. (nd) have recently calculated under-reporting of non-wage incomes as 40-55%,
which is also a favourable evolution from 70% in 1986 (their method is largely replicated in sec-
tion 4.2 of this paper): to sum up, studies point to a decrease in tax evasion, but at the same time
to persistent differences in the subjection of incomes to tax depending on their source. The is-
11If the taxpayers with this kind of revenue were imputed the average wage reported in tax, and their relatives working
with them were imputed the minimum wage, business incomes would be estimated at more than double than the reported
magnitudes. The authors state: ”This approximation to personal businesses’ under-reporting in PIT, whatever crude, yields an
index of concealment equal to the average index of concealment obtained by the Tax Inspection in the sample investigation that served
as a base for the establishment of assessments for the reform of presumptive taxation” (p. 189).
6
sue deserves further attention, since it violates basic principles of fiscal equity while affecting tax
revenue.
3 The struggle for compliance in Spain
The path towards general income taxation in Spain was slow and painful. Initially, the threshold
was very high,12 and there was also persistent lack of compliance. Table 2 represents this evolu-
tion by showing the number of returns, and of those returns with positive tax due, and puts them
in relation to the number of inhabitants and households in the country.13 Columns (8) and (9) are
more illustrative of generality than (5) and (6), because these taxes were during almost the whole
period conceived as family taxation, and implied until 1989 joint compulsory filing for married
couples.
Table 2: Generality of personal income taxation in Spain
PeriodReturns
Positive Pos/Adults
Ret/ Pos/ House- Ret/ Pos/
tax due returns adults adults holds (Hh.) (Hh.)
(1) (2) (3=1/2) (4) (5=1/4) (6=2/4) (7) (8=1/7) (9=2/7)
1933-54 19 6.7 54.6% 16,794 0.1% 0.0% 6,124 0.3% 0.1%
1955-67 211 64.5 31.4% 19,383 0.7% 0.2% 7,779 2.7% 0.8%
1968-79 956 76.6 6.9% 22,129 1.4% 0.1% 9,508 9.6% 0.8%
1980-90 7,641 6,019.7 75.3% 24,530 31.9% 17.7% 11,140 68.2% 53.2%
1991-00 13,776 11,285.8 81.4% 27,981 49.2% 40.2% 12,310 111.8% 91.4%
All data are expressed in thousands and averaged over the periods given by the first column. ’Hh’= Households.
Note: since 1983, the number of returns corresponds only to the regions under the common fiscal rule (i.e., excluding
the Basque Country and Navarra).
Source: author’s calculations with data about number of returns from Gota Losada (1970); Valdes (1982); Ministerio
de Hacienda (1980, 1981), IEF-BADESPE and PIT microdata. For households, INE (series historicas) and Household
Budget Surveys, interpolated. For adults, Alvaredo and Saez (2009), tables in Appendix (population over 20, exclud-
ing regions with special regimes).
In figure 1 I plot the series of tax filers and taxpayers over the total number of households,
for the period 1933-1990 (again, the number of tax filers is that of tax returns, while ‘taxpayers’
refers only to those who had positive tax due as a result of filing). Filing gradually became more
and more widespread until the late 1980s, when the process was quite complete. Several turning
points correspond to major reforms in the tax in 1954, 1967 and 1978. The line of effective tax-
12Under this threshold, individuals were subjected to factor taxation, which was in general not progressive, as was
consistent with the conservatism of the political regime.
13Under the old tax regime, returns with no positive tax due correspond to individuals who did not pay any personal
income tax in addition to factor taxation (although they were required to file); column (2) therefore represents more closely
the concept of ‘taxpayer’ than column (1). For the modern tax (after 1979), it is important not to mistake “positive tax due”
with “positive differential tax due” (“cuota diferencial a pagar”): column (2) still represents the number of effective taxpay-
ers, not only those who had to pay an additional quantity during the filing season as a result of insufficient withholding.
7
payers (in red) runs parallel to that of filers in the first decades, but then drops very significantly
in 1967. During the period of the IGRPF, indeed (that is, until 1978), this tax was filed by an
increasing number of taxpayers, but only under 10% of those who filed actually paid some tax:
all others had already fulfilled their obligations with the factor taxes. This meant, among other
things, that revenue collection through the IGRPF was insignificant, and its progressive rates did
not generally apply. The reform in personal taxation during the sixties therefore did not really
have a redistributive impact, as it was presented at the time – it might actually have had just the
opposite effect.
Figure 1: Generality in Spanish personal income taxation
0,0%
0,1%
1,0%
10,0%
100,0%
19
33
19
36
19
39
19
42
19
45
19
48
19
51
19
54
19
57
19
60
19
63
19
66
19
69
19
72
19
75
19
78
19
81
19
84
19
87
19
90
Ge
ne
ralit
y o
f th
e ta
x: r
etu
rns
/ h
ou
seh
old
s
Returns / Households Positive returns / Households
Sources: same as table 2. The blue line (Returns/Households) represents the extension of fil-
ing, while the red one (Positive returns/Household), that of effective payment of the personal
income tax.
Under the modern PIT, on the other hand, 80-90% of tax filers had positive tax due, which was
translated to 50-60% of households (since 55-85% filed a tax return). During the nineties, the tax
attained generality, with returns outnumbering households (separate taxation of married couples
was introduced as an option in 1989-91). In the first decade of its existence, nonetheless, there was
still considerable distance to 100%. As we shall see, this does not only reflect the legal threshold,
but also to failure to comply with the system.
The results of the tax inspection activity can shed further light on evasion. It should be kept
in mind, however, that these data show in all cases a lower bound, and their trends do not nec-
essarily coincide with those of actual fraud (since resources and efficiency in tax inspection also
play a role in the outcome). In figure 2 I depict the relative importance of uncovered tax fraud in
the precedents of PIT. Evaded tax due is shown as a percentage of total tax liquidated in the cor-
responding year (this does not mean that all uncovered tax was eventually paid): it stands near
50% of revenue, showing that it should have been indeed a big concern. The relative decrease
in the sixties is associated, according to Gota Losada (1970), with the use of presumptive assess-
8
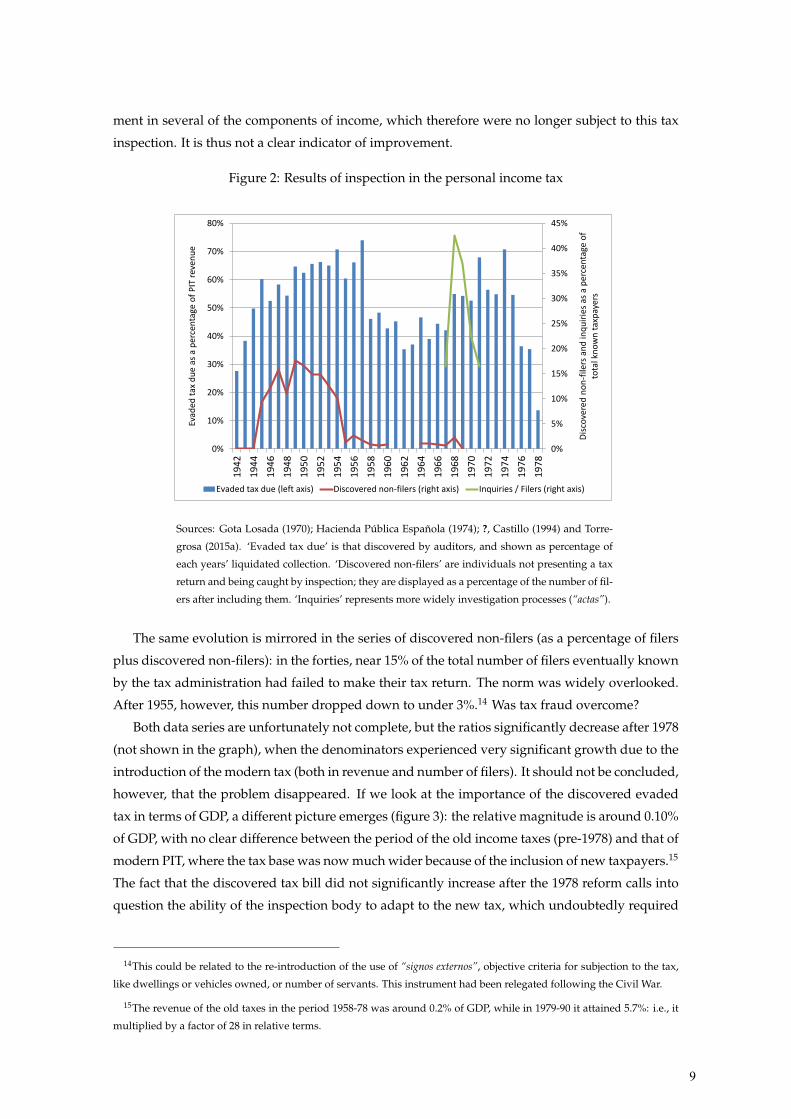
ment in several of the components of income, which therefore were no longer subject to this tax
inspection. It is thus not a clear indicator of improvement.
Figure 2: Results of inspection in the personal income tax
0%
5%
10%
15%
20%
25%
30%
35%
40%
45%
0%
10%
20%
30%
40%
50%
60%
70%
80%
19
42
19
44
19
46
19
48
19
50
19
52
19
54
19
56
19
58
19
60
19
62
19
64
19
66
19
68
19
70
19
72
19
74
19
76
19
78
Dis
cove
red
no
n-f
ilers
an
d in
qu
irie
s as
a p
erce
nta
ge o
f to
tal k
no
wn
tax
pay
ers
Evad
ed t
ax d
ue
as a
per
cen
tage
of
PIT
rev
enu
e
Evaded tax due (left axis) Discovered non-filers (right axis) Inquiries / Filers (right axis)
Sources: Gota Losada (1970); Hacienda Publica Espanola (1974); ?, Castillo (1994) and Torre-
grosa (2015a). ‘Evaded tax due’ is that discovered by auditors, and shown as percentage of
each years’ liquidated collection. ‘Discovered non-filers’ are individuals not presenting a tax
return and being caught by inspection; they are displayed as a percentage of the number of fil-
ers after including them. ‘Inquiries’ represents more widely investigation processes (“actas”).
The same evolution is mirrored in the series of discovered non-filers (as a percentage of filers
plus discovered non-filers): in the forties, near 15% of the total number of filers eventually known
by the tax administration had failed to make their tax return. The norm was widely overlooked.
After 1955, however, this number dropped down to under 3%.14 Was tax fraud overcome?
Both data series are unfortunately not complete, but the ratios significantly decrease after 1978
(not shown in the graph), when the denominators experienced very significant growth due to the
introduction of the modern tax (both in revenue and number of filers). It should not be concluded,
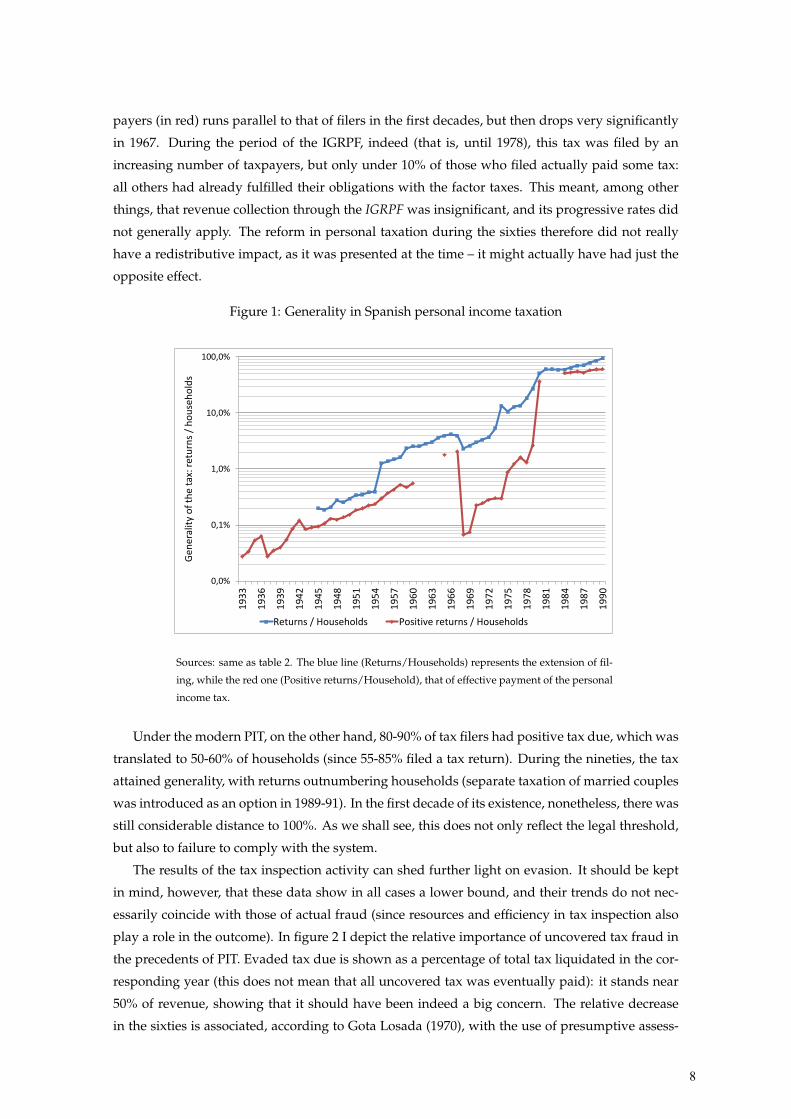
however, that the problem disappeared. If we look at the importance of the discovered evaded
tax in terms of GDP, a different picture emerges (figure 3): the relative magnitude is around 0.10%
of GDP, with no clear difference between the period of the old income taxes (pre-1978) and that of
modern PIT, where the tax base was now much wider because of the inclusion of new taxpayers.15
The fact that the discovered tax bill did not significantly increase after the 1978 reform calls into
question the ability of the inspection body to adapt to the new tax, which undoubtedly required
14This could be related to the re-introduction of the use of “signos externos”, objective criteria for subjection to the tax,
like dwellings or vehicles owned, or number of servants. This instrument had been relegated following the Civil War.
15The revenue of the old taxes in the period 1958-78 was around 0.2% of GDP, while in 1979-90 it attained 5.7%: i.e., it
multiplied by a factor of 28 in relative terms.
9
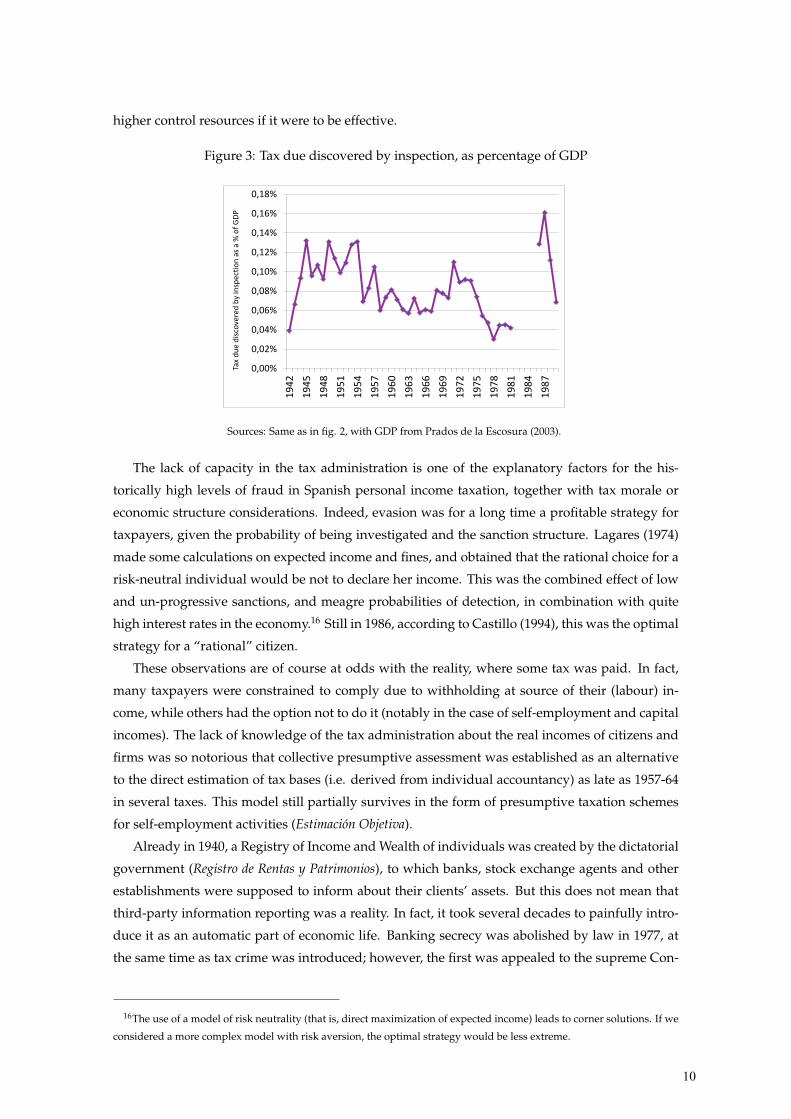
higher control resources if it were to be effective.
Figure 3: Tax due discovered by inspection, as percentage of GDP
0,00%
0,02%
0,04%
0,06%
0,08%
0,10%
0,12%
0,14%
0,16%
0,18%
19
42
19
45
19
48
19
51
19
54
19
57
19
60
19
63
19
66
19
69
19
72
19
75
19
78
19
81
19
84
19
87
Tax
du
e d
isco
vere
d b
y in
spec
tio
n a
s a
% o
f G
DP
Sources: Same as in fig. 2, with GDP from Prados de la Escosura (2003).
The lack of capacity in the tax administration is one of the explanatory factors for the his-
torically high levels of fraud in Spanish personal income taxation, together with tax morale or
economic structure considerations. Indeed, evasion was for a long time a profitable strategy for
taxpayers, given the probability of being investigated and the sanction structure. Lagares (1974)
made some calculations on expected income and fines, and obtained that the rational choice for a
risk-neutral individual would be not to declare her income. This was the combined effect of low
and un-progressive sanctions, and meagre probabilities of detection, in combination with quite
high interest rates in the economy.16 Still in 1986, according to Castillo (1994), this was the optimal
strategy for a “rational” citizen.
These observations are of course at odds with the reality, where some tax was paid. In fact,
many taxpayers were constrained to comply due to withholding at source of their (labour) in-
come, while others had the option not to do it (notably in the case of self-employment and capital
incomes). The lack of knowledge of the tax administration about the real incomes of citizens and
firms was so notorious that collective presumptive assessment was established as an alternative
to the direct estimation of tax bases (i.e. derived from individual accountancy) as late as 1957-64
in several taxes. This model still partially survives in the form of presumptive taxation schemes
for self-employment activities (Estimacion Objetiva).
Already in 1940, a Registry of Income and Wealth of individuals was created by the dictatorial
government (Registro de Rentas y Patrimonios), to which banks, stock exchange agents and other
establishments were supposed to inform about their clients’ assets. But this does not mean that
third-party information reporting was a reality. In fact, it took several decades to painfully intro-
duce it as an automatic part of economic life. Banking secrecy was abolished by law in 1977, at
the same time as tax crime was introduced; however, the first was appealed to the supreme Con-
16The use of a model of risk neutrality (that is, direct maximization of expected income) leads to corner solutions. If we
considered a more complex model with risk aversion, the optimal strategy would be less extreme.
10
stitutional Court, paralysing its application for years, while the second had very limited practical
results up to at least 1990 (Castillo, 1994).
Some improvements came about during the eighties. The introduction of VAT in 1986 was
expected to foster compliance, given the incentives of the different parties involved to report
economic activity in order to request refunds (according to the results in table 1, this was at least
partly effective). At the same time, in 1985 a new law introduced the withholding and reporting of
financial revenues by the financial institutions. The legislators acknowledged the disproportion-
ate weight of labour income in the aggregate tax base, which was a result of unequal compliance.
The immediate effects of this reform, however, were not outstanding. The banking sector found
ways to avoid fiscal transparency, with the creation of several opaque instruments that had con-
siderable success during the second half of the decade (notably, the “primas unicas” and “cesiones
de credito”).17 It is remarkable that the State issued one also opaque public debt asset, the Pagares
del Tesoro, which it swapped in 1991 for another kind of anonymous debt (Deuda Publica Especial)
granting complete impunity.18 In this way, the government conceded amnesty to black money, in
exchange of finance under market price.
At the same time, reinforcement of the tax administration was taking place, with the prolif-
eration of new offices around the territory, a reform of the structure of tax inspection in 1986
(Pan-Montojo, 2007; Castillo, 1994), and a general process of computerization. Finally, the body
was given higher autonomy in 1991 with the creation of the AEAT (Agencia Estatal de la Admin-
istracion Tributaria), which was expected to bring higher efficiency with a more flexible operation
than that of the public sector in general.19 In spite of that, Onrubia (2007; 2012) shows how in-
sufficiencies in terms of personnel and organisation prevailed during the last decades of the 20th
Century and are significant even today, compared with other Western European countries.
There was no withholding at all in rental incomes until very recently. A law in 1998 established
the obligation of tenants to withhold part of their payments, as a response to widespread non-
reporting of these incomes. But the mechanism is not general, since the obligation only concerns
legal entities and not individuals or households (due to the associated compliance costs to the
withholder). Rents of housing between individuals are therefore still lacking automatic control.
Indeed, shifting of income from financial to fixed assets in the aftermath of the reforms of the
middle 1980s was suggested by Castillo (1994) as one of the elements contributing to the first
housing bubble of 1986-89.
17Descriptions and some data on these assets can be found in Esteve (1990) and Castillo (1994).
18The identity of the holders would only be known to the government at the time of expiration, in 1997, when the tax
crime could no longer be prosecuted. On these events, see Lopez-Laborda and Sauco (2003).
19Notably, the ability of granting higher salaries to inspectors, to fight the draining of qualified personnel towards the
private sector which was an acute phenomenon in the 1980s.
11
4 An estimation of the incidence of tax evasion
In the empirical part of this paper, I estimate under-reporting of income tax bases in the country
for selected years between 1971 and 2001, following two different methodologies. While both of
them have their shortcomings, a joint examination of the results might reinforce their plausibil-
ity. The following section compares my estimates with those of previous works and international
cases. I also attempt to go one step further and approximate the impact of fraud on the progres-
sivity of the tax.
Under-assessment of incomes for tax purposes arises in at least three distinct ways, and all
three will be considered in this paper (and, from now on, generally referred to jointly as ”income
under-assessment” or ”income concealment”; also as tax evasion in a broad sense). The first
one is the existence of non-filers: individuals who were legally obliged to pay taxes and file the
corresponding tax return, but failed to do so. As we have seen in section 3, this was a problem of
considerable magnitude in Spain during most of the 20th Century. Unfortunately, there is hardly
any available information on them (for the US case, see Erard and Ho, 2001).
The other ways for income to escape taxation are legal under-valuation and (illegal) under-
reporting by taxpayers. Both are jointly studied here, since they are difficult to disentangle from
the available data. Of course, only under-reporting is fraud from a legal point of view, while the
first entails no punishable behaviour. It does, however, limit the capacity of the income tax to be
precisely a general contribution falling on all kinds of income equally. I consider this issue to be
an expression of a base-voidening strategy by taxpayers, where the state implicitly recognises its
incapacity to tax certain revenues.20
In the Spanish case, legal under-valuation arises notably in self-employment activities under
certain threshold, which can make use of presumptive standard estimation, and in imputed in-
comes of owner-occupied housing (included in the tax base as a percentage of the cadastral value
of the dwellings). Both procedures are known to have greatly under-assessed market values.21
Under-valuation of certain revenues, of course, affects equity among taxpayers because they all
have different weights in each citizen’s total income.
The privileged treatment of capital incomes is a related phenomenon, which grew propelled
by international and specially European integration, as e.g. Perez Royo (1990) explains.22 Grad-
ually, capital incomes have been offered tax advantages, culminating in the dualization of PIT,
20This definition includes tax allowances, exemptions and reductions, but not tax credits, which are deducted from the
tax bill instead of the base. These instruments can be thought of as similar, but have normally clearly different distributive
effects, with tax credits being potentially more progressive.
21Regarding housing, the percentage was first set at 3% and downgraded to 2% in 1988; currently 1.1% is applied if the
cadastral value was assessed after 1994. Naredo (1993) found that undervaluation with respect to market values increased
during the eighties (in a context of growing housing prices), and applied correction factors ranging in 1982 from 2.48 to
3.42 for urban properties and 6.7-8.4 for rural ones. Duran-Cabre and Esteller-More (2010) calculated that cadastral values
were 20-30% of market values in the period 1987-2001.
22“A minimally realistic position [...] will have to acknowledge that the trend of our legislation, mainly since the Law 14/85 and
RD 2027/85, towards an increasingly effective control and taxation of capital incomes, whose last steps have been taken with R.
Decree-Laws 1/89 and 5/89, will to some extent have to be retraced”.
12
which exceeds our time range. Procedures for the total or partial exemption of these incomes
impact on our estimates, while they may be covered only indirectly and unprecisely. Also, be-
cause of the special treatment given to collective investment institutions, mobile capital incomes
could be shifted to a considerable extent into these arrangements, thereby lowering the burden
on the “personal income” of their recipients (Carbajo Vasco, 1991 reviews these special regimes,
which were deepened in 1985 and 1992). Income shifting might be detected by the econometric
equations in subsection 4.2, though they are much less likely to be captured by the discrepancy
exercise of subsection 4.1.
4.1 The discrepancy approach
The international literature has attempted to measure under-reporting with the comparison be-
tween tax returns and household surveys or national accounting. This approach has been widely
applied in Italy, where tax evasion issues are also acute (Bernardi and Bernasconi, 1997; Fiorio
and D’Amuri, 2005; Marino and Zizza, 2012); and also in some tax gap estimations performed by
states in the US (as cited by Alm and Borders, 2014). The intuition behind it is that the incentive to
conceal income in a tax return is not present at an anonymous interview, so the answers to the lat-
ter would be more honest (which does not preclude possible errors). In this sense, the difference
between both sources would indicate lack of generality in the taxation of income. It is important
to keep in mind, as has been said, that this difference is not only illegal fraud, but also avoidance
and other escapes from taxation in a broad sense – including incomprehensive legal definitions of
the tax base, which can be difficult or impossible to discern. Offshore unreported revenues will
not show up in this calculation, to the extent that they are not present either in National Accounts
(on this source of evasion, see e.g. Zucman, 2013; Johannesen, 2014).
The data used here comes from two sources. One is the PIT returns micro-data provided by the
Spanish Institute for Fiscal Studies (IEF), which offers a 2% randomised sample of all taxpayers in
each year since 1982.23 The other arises from the Household Budget Surveys (from now on, HBSs)
undertaken by the Spanish Statistical Institute (INE). The comparison of both databases poses
several challenges. Firstly, income data in HBSs are known to be also widely under-assessed;
therefore, a previous adjustment to the magnitudes in the National Accounts is required (see
Torregrosa, 2015b).24 On the other hand, incomes in the HBSs are always given in net terms, so
gross revenues can only be obtained after imputation of the tax paid; something which was also
23The design has changed in the later years, being more complex since 1999.
24A scaling-up procedure was implemented, using different factors by income source. This prior adjustment will di-
rectly affect the levels of the ratios obtained (which would be higher relative to the raw HBS data), but only indirectly their
variation across income levels, by affecting the relative ranking of households. Because the same factor was used to all
income of a certain kind irrespective of the income level of the recipient, incomes might be under-estimated in high ranks
and therefore the ratios would suffer from upward biases (because of known non-response among affluent households).
It should also be taken into account, however, that were item non-reporting is an issue in the HBS, factorization is not a
completely correct adjustment methodology (imputation should go along). This additional problem entails a downward
bias on the compliance ratios for incomes where item non-reporting in the HBSs is significant. This could be the case for
capital incomes.
13

tackled in previous work (Torregrosa, 2015a). Other adjustments in the homogenization of the
data are explained in the methodological Appendix A.
The categories of income to be analysed need to be identifiable in both databases. This restricts
the analysis to four components: labour income, capital income, self-employment income and the
total sum of household revenues.25 Several non-monetary items are included in the taxable base:
imputed income from owner-occupied housing (in capital income), in-kind compensation (labour
income) and self-supply (self-employment income).
The aggregate composition of incomes of taxpayers in both sources serves as an indication of
total evasion in a very broad sense. Figure 4 reflects the compliance ratio obtained by dividing
the reported magnitudes by the real estimated flows of household incomes of each kind. In 1990,
over-reporting of Labour incomes has been obtained, which likely arises because of the total being
underestimated in the HBS data; this figure has thus been adapted to 100% and the other ratios
have been adjusted accordingly.26
Figure 4: Compliance ratios by income source (obliged taxpayers)
Sources: author’s calculations with aggregated tax data of 1971 from Di-
reccion General de Tributos (1980), p. 34; tax return micro-data 1982 and
1990 from IEF; household budget surveys from INE, adjusted in Torregrosa
(2015b; 2015a) using aggregate magnitudes from INE (1979; 1993).
Calculations for 1971 are undertaken under the assumption that the share of income of
each kind accruing to the households over the threshold is the same as in the HBS of
1973-74.
Labour and total ratios for 1982 are approximated by adding subjected pensions to the
denominator (data from Ministerio de Trabajo, 1991) and using their distribution by
deciles given in Bandres (1993).
25Labour income includes pensions in 1990, but they are not available in the HBSs in previous years. Pensions are thus
added from other sources for the aggregate discrepancy in 1982, while pensioners are dropped for the calculations of
under-reporting by levels. See the methodological appendix for details.
26Recall note 24 on the adjustment procedure applied in Torregrosa (2015b): how high incomes might have been under-
adjusted, and low incomes over-adjusted (this entails that the income share of non-taxpayers appears bigger in our
corrected-HBS data than it actually was, thus pushing the compliance ratios up). It is also possible that the problem
arises because of imperfect matching between the survey and the tax database.
14

It can be seen that labour incomes were the most correctly reported, already in 1971, but spe-
cially since the eighties.27 On the other hand, capital incomes show the most deceiving behaviour,
while self-employment starts as the kind evading the most but experiences a very significant im-
provement. The total tax base shows a significant increase, but lack of compliance was still calling
for concern in the last decade of the 20th Century.
These ratios subsume the impact of non-filing (which was specially acute in 1971), under-
valuation and under-reporting. In the rest of the paper, I attempt to concentrate only on the last
two aspects. However, non-filers cannot be directly excluded from the HBS sample, because we
do not know who they were exactly. Therefore, my procedure relies on re-weighting this survey
sample to match the population of effective tax filers (i.e., that of the tax database), by region, mar-
ital status, and labour market status (active versus pensioner). In this way, the weighted averages
of the survey data will reflect the values of those who did file their returns. This procedure, of
course, is only an approximation, which may be biased if inside each category the differences in
income between filers and non-filers are significant.28
A comparison of the distribution of the tax bases, shown in figure 5, indicates that the incomes
reported to the tax authorities were more concentrated than incomes in the survey. In the lower-
middle range there is an ‘excess mass’ of tax data observations, which would correspond to higher
income taxpayers under-reporting their incomes (and as a consequence, implying an ‘excess’ of
survey observations at the top). At the bottom of the distribution, there are also more observations
from the survey, which would signal to the impact of non-filers not completely adjusted by the
re-weighting procedure.
Figure 5: Comparing the distributions in the tax and survey data
Source: author’s calculations with IEF panel data and HBSs.
The survey data have been re-weighted to match the population of effective filers.
To calculate the compliance ratios by income levels, I follow Matsaganis et al. (2010). Under-
27The 17% compliance estimated in 1971 might indicate that most wages accrued to taxpayers who failed to make a
return, but this does not imply that they weren’t paying the corresponding labour tax, which was supposed to be withheld
at source. Recall that the declared tax base data here is only for the “general” tax, not a comprehensive one for all the range
of factor taxes.
28If non-filers have lower incomes than filers inside a given combined category, the estimated compliance will be upward
biased (because mean incomes in the re-weighted survey will be underestimated), and the other way around.
15
reporting is calculated for each income source separately, as a ratio of the means in each database
for each region. The underlying hypothesis here is thus that any difference between taxpayers at
different income levels arises because of their location and the composition of their income:
Csk =YRsk
YSsk(1)
where Csk stands for compliance ratio of income source s at region k, YR represents average
income reported in the tax returns and YS average income reported in the HBSs.29
Once these compliance ratios are obtained, they are used to make an estimation of the real
incomes of taxpayers in the tax-return database, at the individual level (applying the average
compliance behaviour):
YEisk =YRsk
Csk(2)
where YEisk represents the real estimated income from source s of individual i, living in region
k.30
Compliance behaviour by income level can then be calculated as:
Csj =YRsj
YEsj(3)
Csj will differ from that in equation (1) in that the first assumed equal behaviour by source and
income level, with no re-ranking, while this alternative calculation assumes equal behaviour by
source and region, with the possibility of considerable re-ranking caused by the reporting deci-
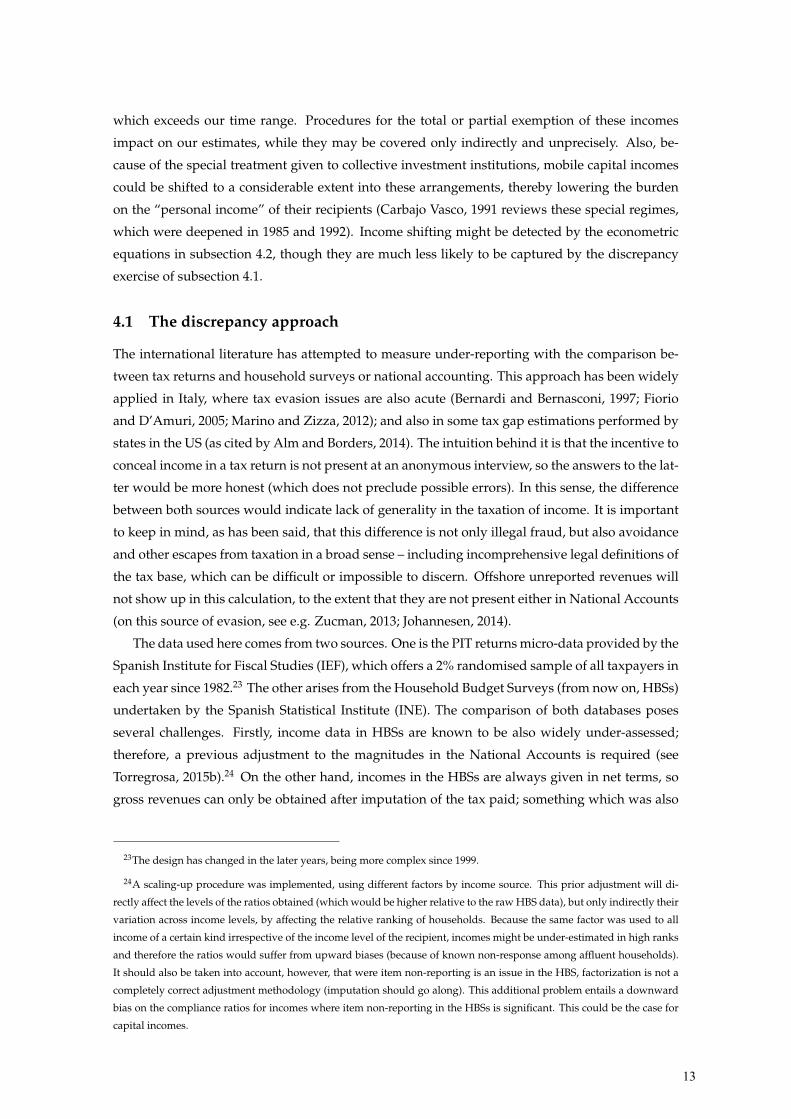
sion. Figure 6 shows the results of these calculations.
Figure 6: Estimated compliance ratios by income deciles
Source: author’s calculations with IEF panel data and HBSs (re-weighted). Following Matsaganis et al. (2010).
Again, in the case of income from labour we do not find any detectable under-reporting (as
would be expected from their higher control). In both years we can see as well a decrease in
29Of course, it may be argued that different income levels behave differently even inside a given income source. There-
fore, in Appendix B I show an alternative calculation following the earlier work of Fiorio and D’Amuri (2005), who directly
estimate these ratios by income levels. This procedure, however, will be biased if the reporting decision causes significant
re-ranking between the observations, to the extent that they changed their quantile.
30When the income of a given category is negative, it is multiplied by the compliance ratio instead of divided, thus
assuming symmetric behaviour.
16
total compliance with income, with behaviour worsening significantly in the top decile, where
it is estimated at 60-80%. Self-employment and specially capital incomes had worse compliance
levels, which are driving the total because of the changing composition of tax bases across income
levels.31
There is an improvement between both years in the total and self-employment compliance
rates. The exception is the persistent sheltering of capital incomes (a part of which is channelled
as legal under-valuation procedures). When interpreting the results, it should also be kept in mind
that high incomes are possibly under-adjusted in the survey data, because of the use of a single
factor for each kind of income (these factors should probably increasing with income to confront
the higher reluctance to participate or give accurate answers of higher-income households). This
means that compliance ratios are likely over-estimated in the upper part of the distribution, while
the opposite effect would be found at the base.
The different rates obtained for the income deciles are likely to have had a very relevant impact
on the progressivity of the tax, as we will see in section 5 (horizontal equity would of course
also be affected). Even though equity would also be deteriorated if the lowest deciles under-
reported the most, the fact that it is the top that specially escaped taxation would make fraud
more worrisome, since the 10% of wealthiest taxpayers concentrated (as well as today) a much
higher percentage of the total taxable base than their share in population. The leaking of a third
of their incomes was therefore a vast obstacle for the revenue capacity of the tax – and the fiscal
system in general, of which it was an important pillar.
4.2 Econometrics: too generous to be true?
The second estimation follows Feldman and Slemrod (2007) and Domınguez et al. (nd), who ap-
plied the formers’ framework to the Spanish PIT in 2008. The method is based on Pissarides and
Weber (1989)’s insight about relative under-reporting in household surveys: the self-employed
were shown to be untruthful reporters of their income, because of their seemingly higher ex-
penditure in food relative to the (reliable) wage-earners. The truthful category in Feldman and
Slemrod’s elaboration is no longer a type of individual (like the self-employed versus the wage
earners in Pissarides and Weber, 1989), but an income source: labour; and the “consumption”
item, that might be related to the level of income but in principle not to its composition, is here
charitable donations. We may think of many characteristics which determine the income share
that an individual wishes to give to others, but it is plausible that this decision is not influenced
by whether the income was obtained as wages, self-employment revenues, or interests.
If we accept these assumptions, we can estimate an equation of the following form:
lnDONATIONSi = α+ βln(Li + k2MCi + k3FCi + k4SEi + k7Ni + k8Oi) + γXi + ui, (4)
where Xi is a vector of taxpayer characteristics including her age, marital status, number of
31Some compliance ratios over 1 were obtained for labour incomes (and have been adjusted to 1). These indicate that
the re-weighting applied does not fully account for the impact of non-filers, which would have lower incomes than filers
in the given categories.
17
dependants, region of residence, city size, type of tax return, wealth dummy, differential tax due
before the deduction for donations, and investment in housing.32 L stands for labour income,
MC for income from movable capital, FC income from fixed capital, SE from self-employment,
N represents negative incomes of all kinds and O other incomes (mostly irregular ones). Rev-
enues from different sources are always defined as broadly as possible from the data (i.e., they are
meant to represent the total yield, net of costs of obtainment but not of other tax allowances). The
coefficients of interest are the k: 1/k indicates the compliance ratio of each component of income
(labour income is taken to be fully reported, and therefore has no corresponding k).33
Again, it should be noted that the coefficients k subsume two different kinds of under-asses-
sment of incomes: actual evasion and legal understatement, arising from tax code’s rules. This
can be potentially important, as we have previously mentioned, in fixed capital and economic
activities under presumptive assessment.34
Notice that, in contrast to Feldman and Slemrod (2007)’s estimation and other similar works,
there is no variable representing the ‘price’ of the donation. This is because in Spain charitable
contributions are treated as a tax credit (a given percentage of the donation is deducted from the
tax bill), and not as a deduction from the taxable base, which implies that they are not affected by
different marginal tax rates.
Another potential issue is the possibility that the taxpayers over-report their donations so as to
obtain an excessive tax credit. Indeed, Slemrod (1989) found an average overestimation of 7.2%
in audited tax returns in the US. It would be a problem for our estimation if propensity to this
behaviour were related to the composition of an individual’s income. But this is not clear; in fact,
Feldman and Slemrod argue that it would not be rational in combination with an under-reporting
of income, because it could trigger the attention of the tax administration. It is as well possible
that the apparent higher charitable inclinations of wealthy taxpayers arise partly because they
have better control on their donations and report them more accurately. If this were the case,
our calculation would over-estimate fraud (given the correlation between the level of income and
certain changes in its composition).35
The biggest problem, however, seems to be the possibility of sample selection bias, if we apply
32Age is not available as such in 1982, so a dummy variable for being retired is used as an approximation. The type of
tax return is included for years after 1989, when the option of separate filing for couples was introduced.
33Following Domınguez et al. (nd), an alternative estimation has been performed for 2001, where pensions are taken to
be the only fully compliant income source. In our case, however, there is no significant change in the coefficients, and the
behaviour of wage incomes cannot be statistically distinguished from that of pensions (this is similar to the later results
in Domınguez et al., 2015 for 2005-2007). These calculations are available upon request.
34In 1982 we cannot include these incomes separately in the estimations, because all tax returns with explicit charitable
donations were done in the “ordinary” model, which does not include the possibility of presumptive assessment. For
2001, on the contrary, we introduce them separately in the equation, as Domınguez et al. (nd) did.
35However, the direction of the bias is difficult to establish. Fack and Landais (2013) find that, in France, wage earners
and low income taxpayers tended to over-report their donations to a greater extent (given their having less capacity to
under-report incomes or abuse other deductions). If this were the case in our data too, the results would be an under-
estimation. Informal conversation with a tax adviser in Barcelona suggested that these deductions are not very prone to
evasion because of their low quantitative importance.
18
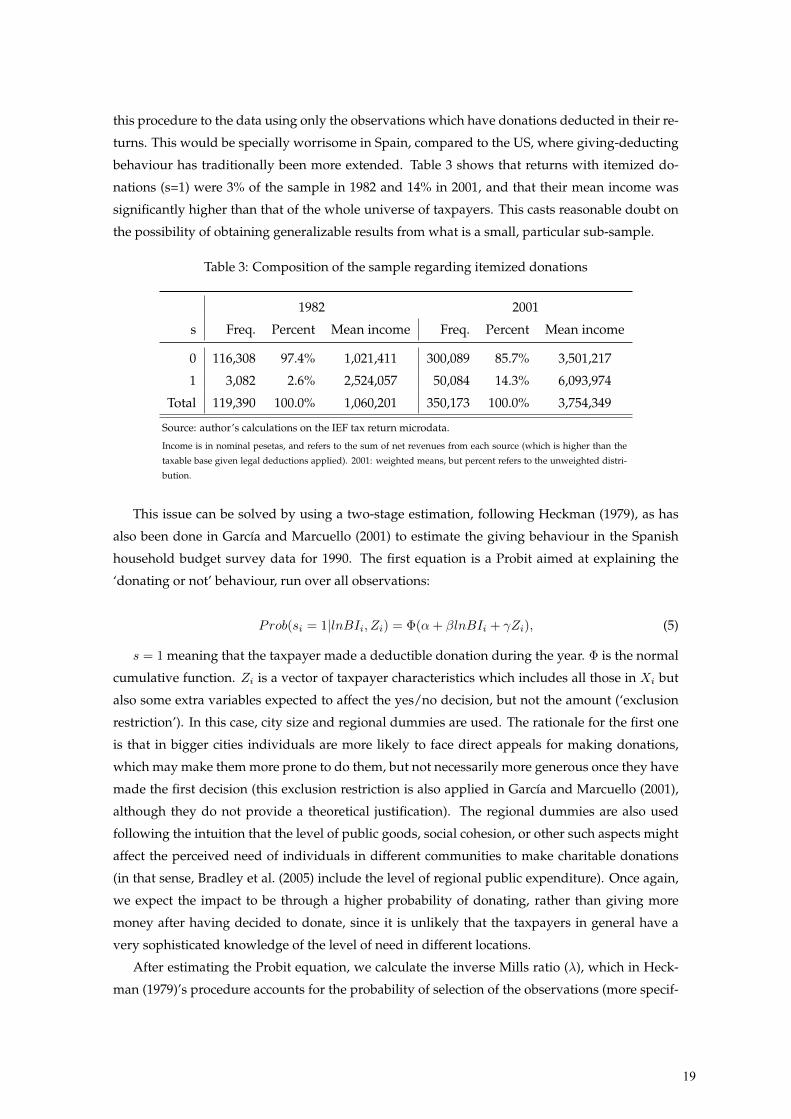
this procedure to the data using only the observations which have donations deducted in their re-
turns. This would be specially worrisome in Spain, compared to the US, where giving-deducting
behaviour has traditionally been more extended. Table 3 shows that returns with itemized do-
nations (s=1) were 3% of the sample in 1982 and 14% in 2001, and that their mean income was
significantly higher than that of the whole universe of taxpayers. This casts reasonable doubt on
the possibility of obtaining generalizable results from what is a small, particular sub-sample.
Table 3: Composition of the sample regarding itemized donations
1982 2001
s Freq. Percent Mean income Freq. Percent Mean income
0 116,308 97.4% 1,021,411 300,089 85.7% 3,501,217
1 3,082 2.6% 2,524,057 50,084 14.3% 6,093,974
Total 119,390 100.0% 1,060,201 350,173 100.0% 3,754,349
Source: author’s calculations on the IEF tax return microdata.
Income is in nominal pesetas, and refers to the sum of net revenues from each source (which is higher than the
taxable base given legal deductions applied). 2001: weighted means, but percent refers to the unweighted distri-
bution.
This issue can be solved by using a two-stage estimation, following Heckman (1979), as has
also been done in Garcıa and Marcuello (2001) to estimate the giving behaviour in the Spanish
household budget survey data for 1990. The first equation is a Probit aimed at explaining the
‘donating or not’ behaviour, run over all observations:
Prob(si = 1|lnBIi, Zi) = Φ(α+ βlnBIi + γZi), (5)
s = 1 meaning that the taxpayer made a deductible donation during the year. Φ is the normal
cumulative function. Zi is a vector of taxpayer characteristics which includes all those in Xi but
also some extra variables expected to affect the yes/no decision, but not the amount (‘exclusion
restriction’). In this case, city size and regional dummies are used. The rationale for the first one
is that in bigger cities individuals are more likely to face direct appeals for making donations,
which may make them more prone to do them, but not necessarily more generous once they have
made the first decision (this exclusion restriction is also applied in Garcıa and Marcuello (2001),
although they do not provide a theoretical justification). The regional dummies are also used
following the intuition that the level of public goods, social cohesion, or other such aspects might
affect the perceived need of individuals in different communities to make charitable donations
(in that sense, Bradley et al. (2005) include the level of regional public expenditure). Once again,
we expect the impact to be through a higher probability of donating, rather than giving more
money after having decided to donate, since it is unlikely that the taxpayers in general have a
very sophisticated knowledge of the level of need in different locations.
After estimating the Probit equation, we calculate the inverse Mills ratio (λ), which in Heck-
man (1979)’s procedure accounts for the probability of selection of the observations (more specif-
19

ically, the ‘nonselection hazard’):
λi =φ(α+ βlnBIi + γZi)
Φ(α+ βlnBIi + γZi), (6)
where φ and Φ are the normal density function and normal cumulative function of the pre-
dicted values in the probit estimation. This new variable λ is included in the second equation, to
correct the bias arising from the truncation of the sample (here, we only use the observations with
s = 1):36
lnDONATIONSi = α+βln(Li + k2MCi + k3FCi + k4SEi + k5Ni + k6Oi) + γXi + δλi +ui, (7)
I apply this methodology to the analysis of the years 1982 and 2001. Other years have data
problems that preclude successful estimation.37 The number of variables and observations avail-
able increases between the two years, and some features of the tax had changed (namely, im-
puted income from owner-occupied housing is no longer included in the taxable base for the
first dwelling, and a non-taxable threshold was introduced). In the year 2001 we can separately
estimate compliance for different kinds of self-employment income categories, according to the
assessment procedure (accountancy-based or presumptive).
Table 4 shows some indicators of the goodness-of-fit of the probit equations. The overall per-
formance is good, even though predicting accuracy is low for observations with s=1. This is not
surprising in such an unbalanced sample, according to Greene (2003). It points to the estimated
probabilities being generally low. There might be a problem of omitted variable bias because
of not including educational level (not available in the tax data), which has been shown to be
significant in related studies, including Garcıa and Marcuello (2001) for Spain. This feature is,
however, expected to be highly correlated with income and other variables in the model, which
would reduce the extent of problem. In any case, the results have to be read with caution.
Table 5 presents the estimated coefficients. They are generally not at odds with other studies
of charitable donations (Domınguez et al., nd; Brooks, 2003; Garcıa and Marcuello, 2001; Backus,
2010; Bradley et al., 2005). The income elasticity of donations is lower than one. Demographic
variables have the expected signs: older taxpayers and women are more likely to donate, and
also those with children. Investment in housing (not shown because of space considerations)
36In principle, a Tobit estimation is another option to deal with this problem. The condition for this strategy, however,
is that the two decisions (to give or not to give, and what amount to donate in the first case) are essentially affected in
the same direction by the same factors. This is not necessarily true, and in fact different signs are obtained for some
variables in the two stages of the estimation, suggesting that there are two qualitatively different decisions involved for
the taxpayer. This was found also by Garcıa and Marcuello (2001).
37Namely, very low number of observations from 1985 to 1991 because deductible donations were restricted, and from
1992 to 1998 the inability to correctly calculate the quantities donated because of the existence of different percentages of
deduction (in the micro-data, only the quantity deducted is available, which represented 10-15-20-25% of the donation,
depending on the year). A new panel begins in 1999, but in the first two years the variable ‘age’ is missing for many
observations. I have also estimated the models for 1983: the results are similar to those in 1982 and therefore serve as a
reassurance. Compliance, however, seems slightly higher, which points to the low precision of these early data estimates
because of the low number of observations.
20
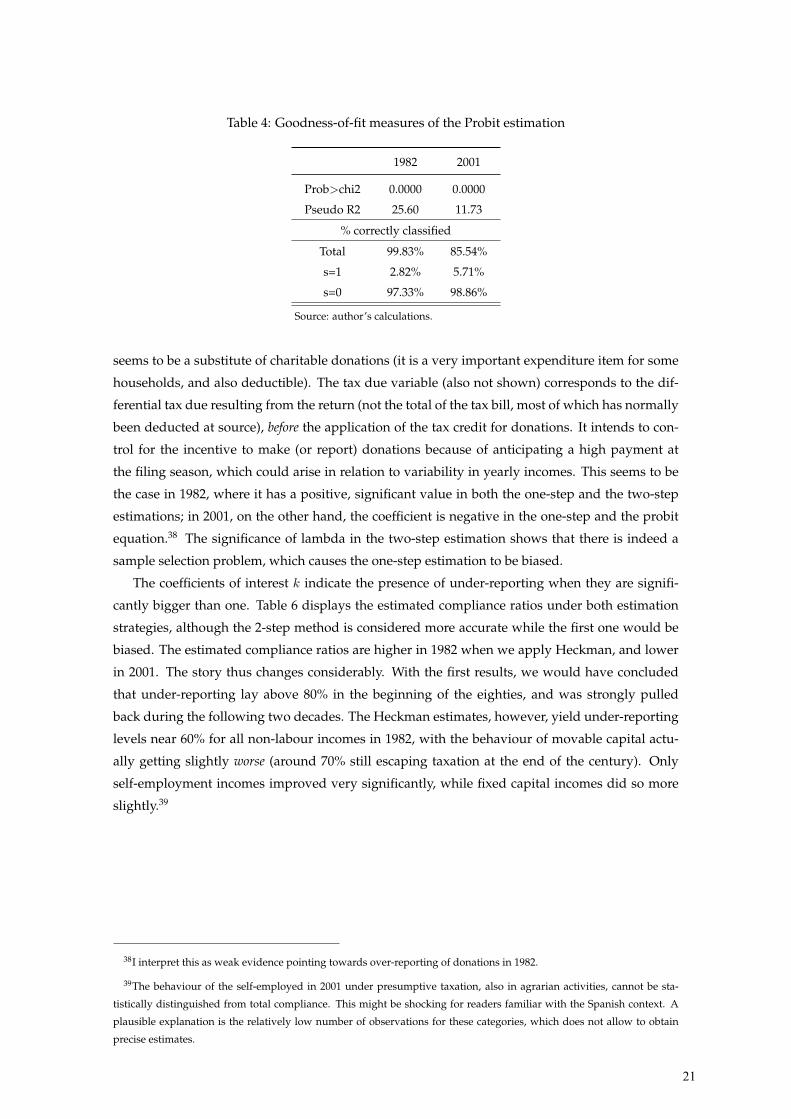
Table 4: Goodness-of-fit measures of the Probit estimation
1982 2001
Prob>chi2 0.0000 0.0000
Pseudo R2 25.60 11.73
% correctly classified
Total 99.83% 85.54%
s=1 2.82% 5.71%
s=0 97.33% 98.86%
Source: author’s calculations.
seems to be a substitute of charitable donations (it is a very important expenditure item for some
households, and also deductible). The tax due variable (also not shown) corresponds to the dif-
ferential tax due resulting from the return (not the total of the tax bill, most of which has normally
been deducted at source), before the application of the tax credit for donations. It intends to con-
trol for the incentive to make (or report) donations because of anticipating a high payment at
the filing season, which could arise in relation to variability in yearly incomes. This seems to be
the case in 1982, where it has a positive, significant value in both the one-step and the two-step
estimations; in 2001, on the other hand, the coefficient is negative in the one-step and the probit
equation.38 The significance of lambda in the two-step estimation shows that there is indeed a
sample selection problem, which causes the one-step estimation to be biased.
The coefficients of interest k indicate the presence of under-reporting when they are signifi-
cantly bigger than one. Table 6 displays the estimated compliance ratios under both estimation
strategies, although the 2-step method is considered more accurate while the first one would be
biased. The estimated compliance ratios are higher in 1982 when we apply Heckman, and lower
in 2001. The story thus changes considerably. With the first results, we would have concluded
that under-reporting lay above 80% in the beginning of the eighties, and was strongly pulled
back during the following two decades. The Heckman estimates, however, yield under-reporting
levels near 60% for all non-labour incomes in 1982, with the behaviour of movable capital actu-
ally getting slightly worse (around 70% still escaping taxation at the end of the century). Only
self-employment incomes improved very significantly, while fixed capital incomes did so more
slightly.39
38I interpret this as weak evidence pointing towards over-reporting of donations in 1982.
39The behaviour of the self-employed in 2001 under presumptive taxation, also in agrarian activities, cannot be sta-
tistically distinguished from total compliance. This might be shocking for readers familiar with the Spanish context. A
plausible explanation is the relatively low number of observations for these categories, which does not allow to obtain
precise estimates.
21
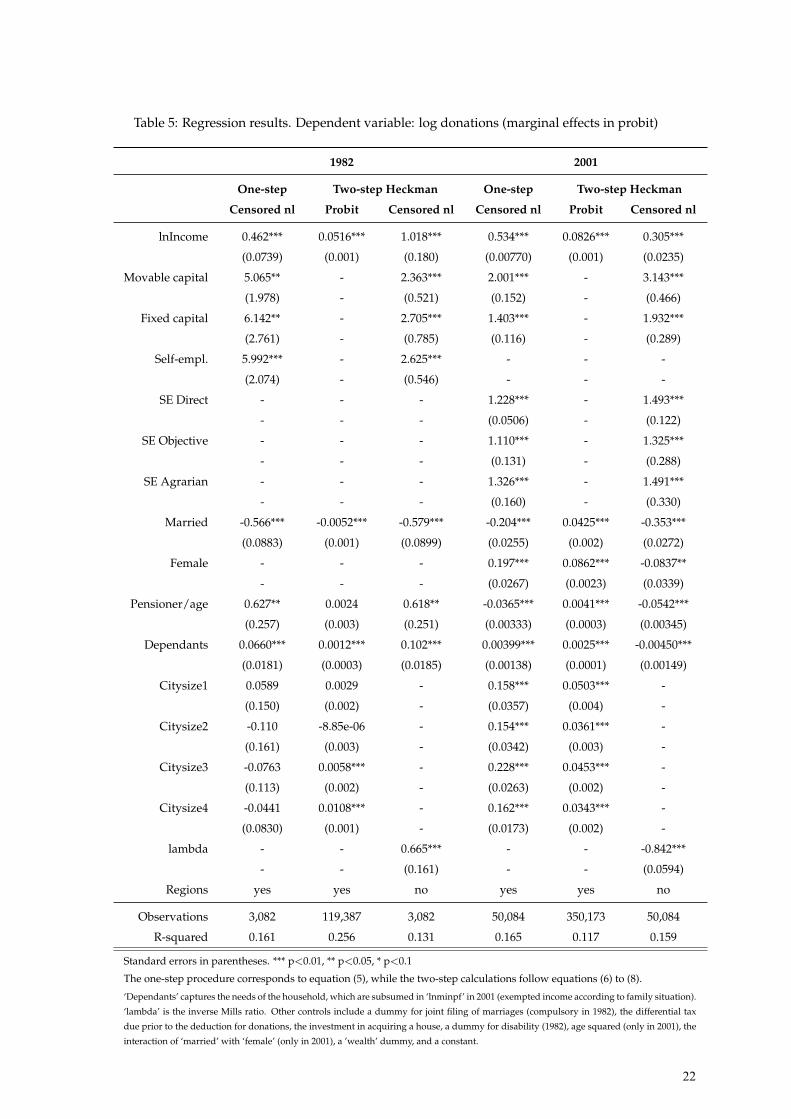
Table 5: Regression results. Dependent variable: log donations (marginal effects in probit)
1982 2001
One-step Two-step Heckman One-step Two-step Heckman
Censored nl Probit Censored nl Censored nl Probit Censored nl
lnIncome 0.462*** 0.0516*** 1.018*** 0.534*** 0.0826*** 0.305***
(0.0739) (0.001) (0.180) (0.00770) (0.001) (0.0235)
Movable capital 5.065** - 2.363*** 2.001*** - 3.143***
(1.978) - (0.521) (0.152) - (0.466)
Fixed capital 6.142** - 2.705*** 1.403*** - 1.932***
(2.761) - (0.785) (0.116) - (0.289)
Self-empl. 5.992*** - 2.625*** - - -
(2.074) - (0.546) - - -
SE Direct - - - 1.228*** - 1.493***
- - - (0.0506) - (0.122)
SE Objective - - - 1.110*** - 1.325***
- - - (0.131) - (0.288)
SE Agrarian - - - 1.326*** - 1.491***
- - - (0.160) - (0.330)
Married -0.566*** -0.0052*** -0.579*** -0.204*** 0.0425*** -0.353***
(0.0883) (0.001) (0.0899) (0.0255) (0.002) (0.0272)
Female - - - 0.197*** 0.0862*** -0.0837**
- - - (0.0267) (0.0023) (0.0339)
Pensioner/age 0.627** 0.0024 0.618** -0.0365*** 0.0041*** -0.0542***
(0.257) (0.003) (0.251) (0.00333) (0.0003) (0.00345)
Dependants 0.0660*** 0.0012*** 0.102*** 0.00399*** 0.0025*** -0.00450***
(0.0181) (0.0003) (0.0185) (0.00138) (0.0001) (0.00149)
Citysize1 0.0589 0.0029 - 0.158*** 0.0503*** -
(0.150) (0.002) - (0.0357) (0.004) -
Citysize2 -0.110 -8.85e-06 - 0.154*** 0.0361*** -
(0.161) (0.003) - (0.0342) (0.003) -
Citysize3 -0.0763 0.0058*** - 0.228*** 0.0453*** -
(0.113) (0.002) - (0.0263) (0.002) -
Citysize4 -0.0441 0.0108*** - 0.162*** 0.0343*** -
(0.0830) (0.001) - (0.0173) (0.002) -
lambda - - 0.665*** - - -0.842***
- - (0.161) - - (0.0594)
Regions yes yes no yes yes no
Observations 3,082 119,387 3,082 50,084 350,173 50,084
R-squared 0.161 0.256 0.131 0.165 0.117 0.159
Standard errors in parentheses. *** p<0.01, ** p<0.05, * p<0.1
The one-step procedure corresponds to equation (5), while the two-step calculations follow equations (6) to (8).
‘Dependants’ captures the needs of the household, which are subsumed in ‘lnminpf’ in 2001 (exempted income according to family situation).
‘lambda’ is the inverse Mills ratio. Other controls include a dummy for joint filing of marriages (compulsory in 1982), the differential tax
due prior to the deduction for donations, the investment in acquiring a house, a dummy for disability (1982), age squared (only in 2001), the
interaction of ‘married’ with ‘female’ (only in 2001), a ’wealth’ dummy, and a constant.
22
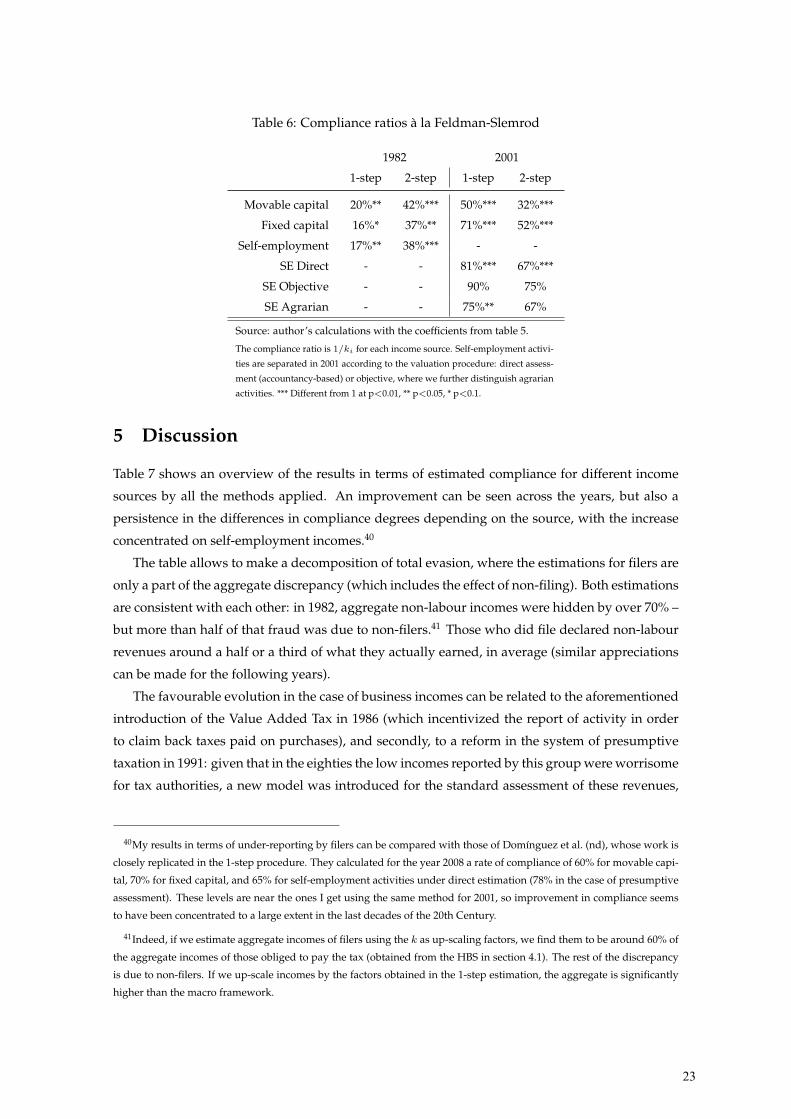
Table 6: Compliance ratios a la Feldman-Slemrod
1982 2001
1-step 2-step 1-step 2-step
Movable capital 20%** 42%*** 50%*** 32%***
Fixed capital 16%* 37%** 71%*** 52%***
Self-employment 17%** 38%*** - -
SE Direct - - 81%*** 67%***
SE Objective - - 90% 75%
SE Agrarian - - 75%** 67%
Source: author’s calculations with the coefficients from table 5.
The compliance ratio is 1/ki for each income source. Self-employment activi-
ties are separated in 2001 according to the valuation procedure: direct assess-
ment (accountancy-based) or objective, where we further distinguish agrarian
activities. *** Different from 1 at p<0.01, ** p<0.05, * p<0.1.
5 Discussion
Table 7 shows an overview of the results in terms of estimated compliance for different income
sources by all the methods applied. An improvement can be seen across the years, but also a
persistence in the differences in compliance degrees depending on the source, with the increase
concentrated on self-employment incomes.40
The table allows to make a decomposition of total evasion, where the estimations for filers are
only a part of the aggregate discrepancy (which includes the effect of non-filing). Both estimations
are consistent with each other: in 1982, aggregate non-labour incomes were hidden by over 70% –
but more than half of that fraud was due to non-filers.41 Those who did file declared non-labour
revenues around a half or a third of what they actually earned, in average (similar appreciations
can be made for the following years).
The favourable evolution in the case of business incomes can be related to the aforementioned
introduction of the Value Added Tax in 1986 (which incentivized the report of activity in order
to claim back taxes paid on purchases), and secondly, to a reform in the system of presumptive
taxation in 1991: given that in the eighties the low incomes reported by this group were worrisome
for tax authorities, a new model was introduced for the standard assessment of these revenues,
40My results in terms of under-reporting by filers can be compared with those of Domınguez et al. (nd), whose work is
closely replicated in the 1-step procedure. They calculated for the year 2008 a rate of compliance of 60% for movable capi-
tal, 70% for fixed capital, and 65% for self-employment activities under direct estimation (78% in the case of presumptive
assessment). These levels are near the ones I get using the same method for 2001, so improvement in compliance seems
to have been concentrated to a large extent in the last decades of the 20th Century.
41Indeed, if we estimate aggregate incomes of filers using the k as up-scaling factors, we find them to be around 60% of
the aggregate incomes of those obliged to pay the tax (obtained from the HBS in section 4.1). The rest of the discrepancy
is due to non-filers. If we up-scale incomes by the factors obtained in the 1-step estimation, the aggregate is significantly
higher than the macro framework.
23
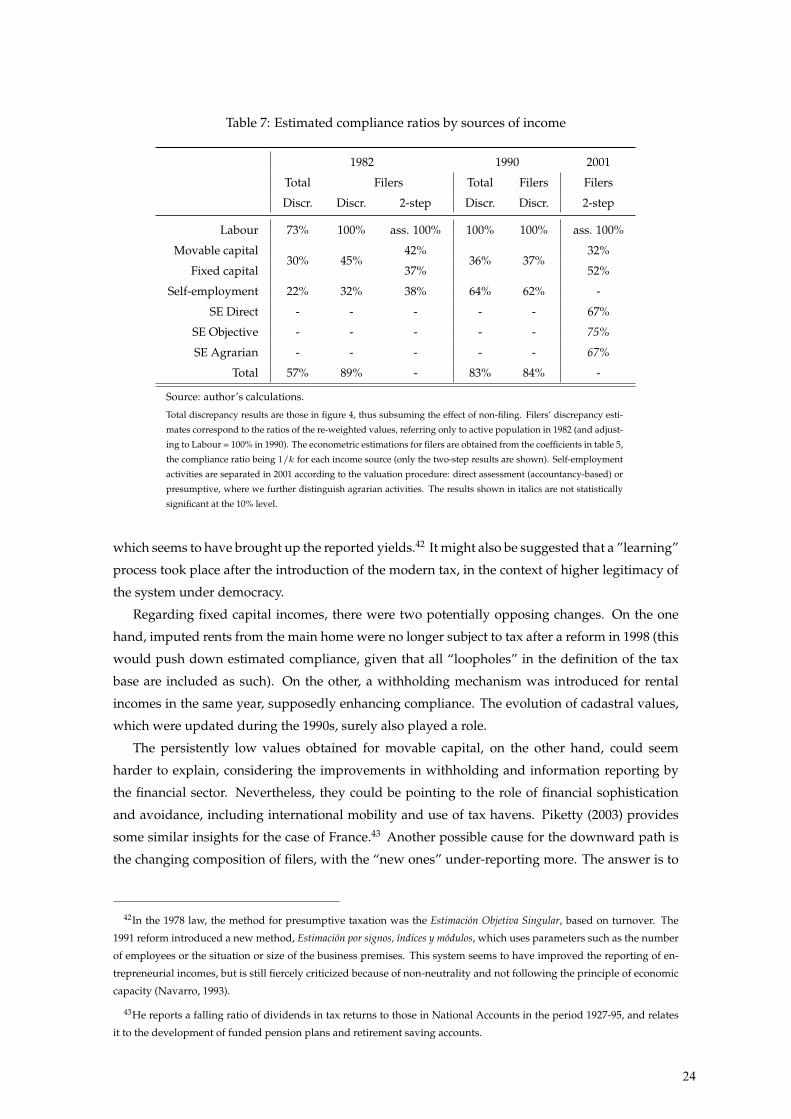
Table 7: Estimated compliance ratios by sources of income
1982 1990 2001
Total Filers Total Filers Filers
Discr. Discr. 2-step Discr. Discr. 2-step
Labour 73% 100% ass. 100% 100% 100% ass. 100%
Movable capital30% 45%
42%36% 37%
32%
Fixed capital 37% 52%
Self-employment 22% 32% 38% 64% 62% -
SE Direct - - - - - 67%
SE Objective - - - - - 75%
SE Agrarian - - - - - 67%
Total 57% 89% - 83% 84% -
Source: author’s calculations.
Total discrepancy results are those in figure 4, thus subsuming the effect of non-filing. Filers’ discrepancy esti-
mates correspond to the ratios of the re-weighted values, referring only to active population in 1982 (and adjust-
ing to Labour = 100% in 1990). The econometric estimations for filers are obtained from the coefficients in table 5,
the compliance ratio being 1/k for each income source (only the two-step results are shown). Self-employment
activities are separated in 2001 according to the valuation procedure: direct assessment (accountancy-based) or
presumptive, where we further distinguish agrarian activities. The results shown in italics are not statistically
significant at the 10% level.
which seems to have brought up the reported yields.42 It might also be suggested that a ”learning”
process took place after the introduction of the modern tax, in the context of higher legitimacy of
the system under democracy.
Regarding fixed capital incomes, there were two potentially opposing changes. On the one
hand, imputed rents from the main home were no longer subject to tax after a reform in 1998 (this
would push down estimated compliance, given that all “loopholes” in the definition of the tax
base are included as such). On the other, a withholding mechanism was introduced for rental
incomes in the same year, supposedly enhancing compliance. The evolution of cadastral values,
which were updated during the 1990s, surely also played a role.
The persistently low values obtained for movable capital, on the other hand, could seem
harder to explain, considering the improvements in withholding and information reporting by
the financial sector. Nevertheless, they could be pointing to the role of financial sophistication
and avoidance, including international mobility and use of tax havens. Piketty (2003) provides
some similar insights for the case of France.43 Another possible cause for the downward path is
the changing composition of filers, with the “new ones” under-reporting more. The answer is to
42In the 1978 law, the method for presumptive taxation was the Estimacion Objetiva Singular, based on turnover. The
1991 reform introduced a new method, Estimacion por signos, ındices y modulos, which uses parameters such as the number
of employees or the situation or size of the business premises. This system seems to have improved the reporting of en-
trepreneurial incomes, but is still fiercely criticized because of non-neutrality and not following the principle of economic
capacity (Navarro, 1993).
43He reports a falling ratio of dividends in tax returns to those in National Accounts in the period 1927-95, and relates
it to the development of funded pension plans and retirement saving accounts.
24
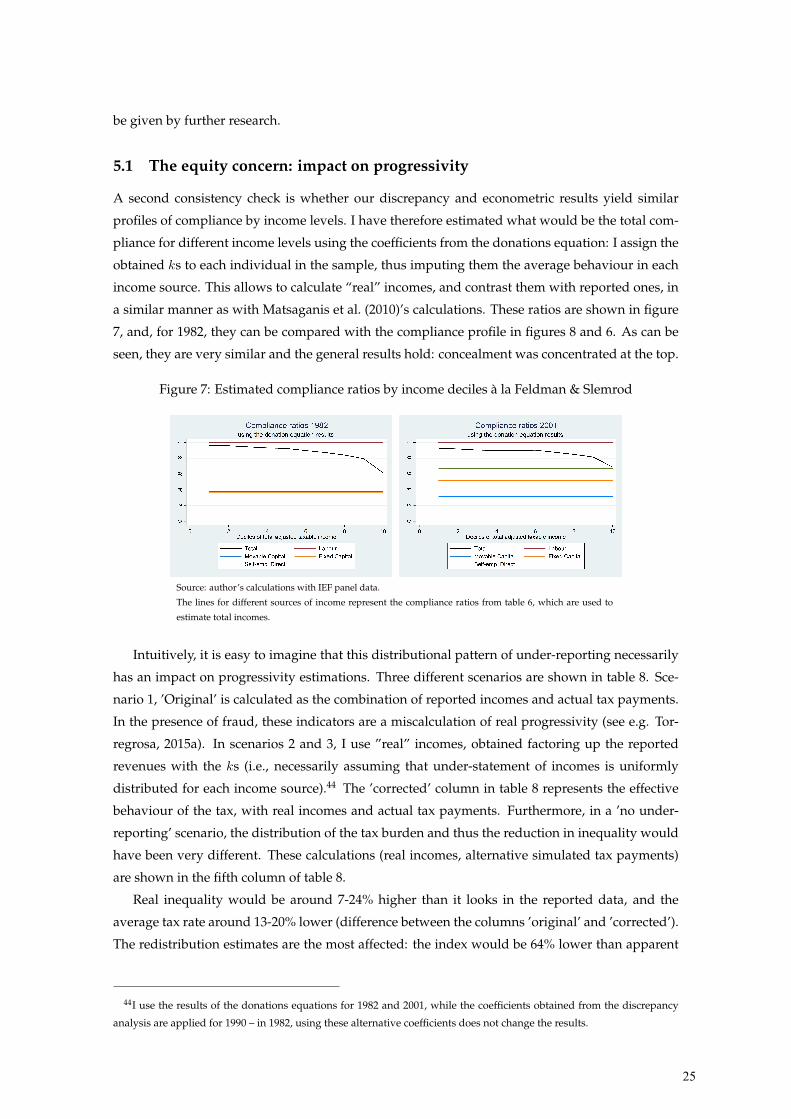
be given by further research.
5.1 The equity concern: impact on progressivity
A second consistency check is whether our discrepancy and econometric results yield similar
profiles of compliance by income levels. I have therefore estimated what would be the total com-
pliance for different income levels using the coefficients from the donations equation: I assign the
obtained ks to each individual in the sample, thus imputing them the average behaviour in each
income source. This allows to calculate “real” incomes, and contrast them with reported ones, in
a similar manner as with Matsaganis et al. (2010)’s calculations. These ratios are shown in figure
7, and, for 1982, they can be compared with the compliance profile in figures 8 and 6. As can be
seen, they are very similar and the general results hold: concealment was concentrated at the top.
Figure 7: Estimated compliance ratios by income deciles a la Feldman & Slemrod
Source: author’s calculations with IEF panel data.
The lines for different sources of income represent the compliance ratios from table 6, which are used to
estimate total incomes.
Intuitively, it is easy to imagine that this distributional pattern of under-reporting necessarily
has an impact on progressivity estimations. Three different scenarios are shown in table 8. Sce-
nario 1, ’Original’ is calculated as the combination of reported incomes and actual tax payments.
In the presence of fraud, these indicators are a miscalculation of real progressivity (see e.g. Tor-
regrosa, 2015a). In scenarios 2 and 3, I use ”real” incomes, obtained factoring up the reported
revenues with the ks (i.e., necessarily assuming that under-statement of incomes is uniformly
distributed for each income source).44 The ’corrected’ column in table 8 represents the effective
behaviour of the tax, with real incomes and actual tax payments. Furthermore, in a ’no under-
reporting’ scenario, the distribution of the tax burden and thus the reduction in inequality would
have been very different. These calculations (real incomes, alternative simulated tax payments)
are shown in the fifth column of table 8.
Real inequality would be around 7-24% higher than it looks in the reported data, and the
average tax rate around 13-20% lower (difference between the columns ’original’ and ’corrected’).
The redistribution estimates are the most affected: the index would be 64% lower than apparent
44I use the results of the donations equations for 1982 and 2001, while the coefficients obtained from the discrepancy
analysis are applied for 1990 – in 1982, using these alternative coefficients does not change the results.
25
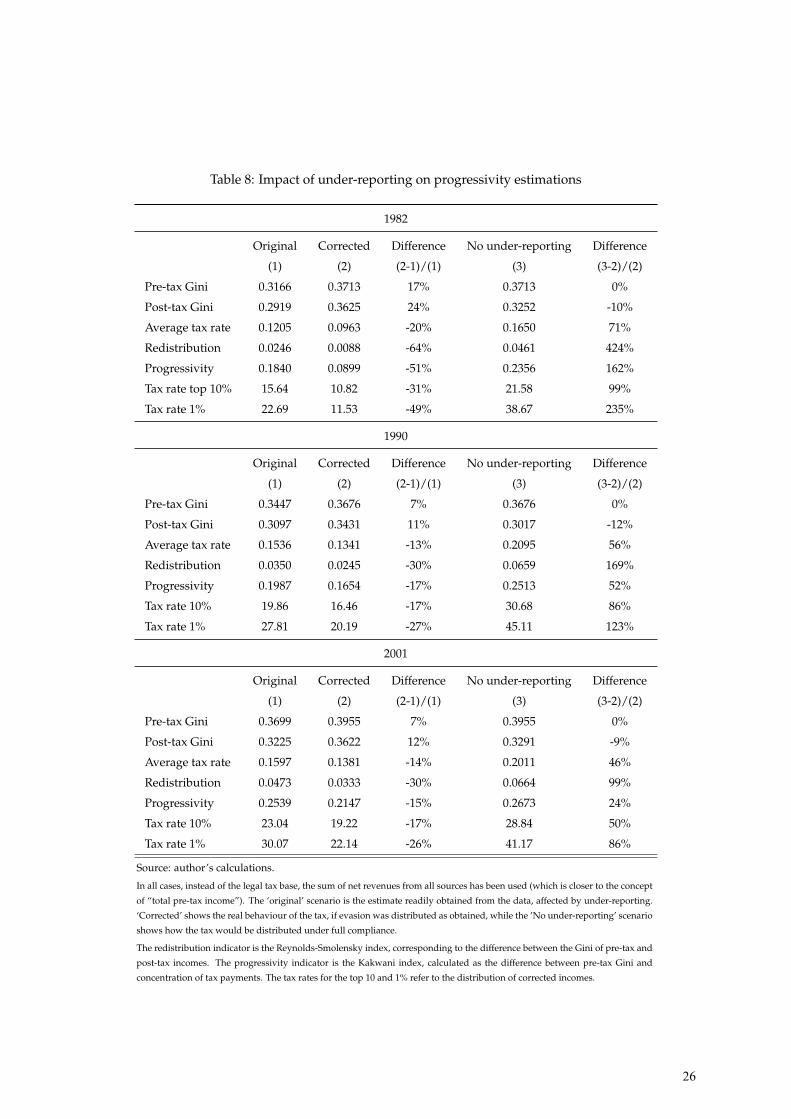
Table 8: Impact of under-reporting on progressivity estimations
1982
Original Corrected Difference No under-reporting Difference
(1) (2) (2-1)/(1) (3) (3-2)/(2)
Pre-tax Gini 0.3166 0.3713 17% 0.3713 0%
Post-tax Gini 0.2919 0.3625 24% 0.3252 -10%
Average tax rate 0.1205 0.0963 -20% 0.1650 71%
Redistribution 0.0246 0.0088 -64% 0.0461 424%
Progressivity 0.1840 0.0899 -51% 0.2356 162%
Tax rate top 10% 15.64 10.82 -31% 21.58 99%
Tax rate 1% 22.69 11.53 -49% 38.67 235%
1990
Original Corrected Difference No under-reporting Difference
(1) (2) (2-1)/(1) (3) (3-2)/(2)
Pre-tax Gini 0.3447 0.3676 7% 0.3676 0%
Post-tax Gini 0.3097 0.3431 11% 0.3017 -12%
Average tax rate 0.1536 0.1341 -13% 0.2095 56%
Redistribution 0.0350 0.0245 -30% 0.0659 169%
Progressivity 0.1987 0.1654 -17% 0.2513 52%
Tax rate 10% 19.86 16.46 -17% 30.68 86%
Tax rate 1% 27.81 20.19 -27% 45.11 123%
2001
Original Corrected Difference No under-reporting Difference
(1) (2) (2-1)/(1) (3) (3-2)/(2)
Pre-tax Gini 0.3699 0.3955 7% 0.3955 0%
Post-tax Gini 0.3225 0.3622 12% 0.3291 -9%
Average tax rate 0.1597 0.1381 -14% 0.2011 46%
Redistribution 0.0473 0.0333 -30% 0.0664 99%
Progressivity 0.2539 0.2147 -15% 0.2673 24%
Tax rate 10% 23.04 19.22 -17% 28.84 50%
Tax rate 1% 30.07 22.14 -26% 41.17 86%
Source: author’s calculations.
In all cases, instead of the legal tax base, the sum of net revenues from all sources has been used (which is closer to the concept
of “total pre-tax income”). The ‘original’ scenario is the estimate readily obtained from the data, affected by under-reporting.
‘Corrected’ shows the real behaviour of the tax, if evasion was distributed as obtained, while the ’No under-reporting’ scenario
shows how the tax would be distributed under full compliance.
The redistribution indicator is the Reynolds-Smolensky index, corresponding to the difference between the Gini of pre-tax and
post-tax incomes. The progressivity indicator is the Kakwani index, calculated as the difference between pre-tax Gini and
concentration of tax payments. The tax rates for the top 10 and 1% refer to the distribution of corrected incomes.
26
in 1982, and 30% in 1990/2001; while progressivity was 51-15% overestimated respectively. This
is a very significant impact, which would be a lower bound if under-reporting were increasing
within income source. On the other hand, the negative impact has also clearly decreased between
both estimations, following the changes in the distributional patterns of fraud.
Without evasion, the personal income tax would behave in a notably different way. The ’no
under-reporting’ column shows that, as expected from the progressive rate schedule, the taxation
of high incomes would have been much more intense if the spirit of the law had been followed.45
The Spanish tax system has been historically criticized for applying high legal rates on narrow
tax bases; to a certain extent the appreciation seems to hold as late as the end of the 20th Century.
Differences are very intense, again specially in the first year shown, but still in 2001 redistribution
would have been doubled if income sheltering were eradicated.46
5.2 An international comparison
Placing the Spanish experience in international perspective might shed some further light. Table
9 presents rates of evasion (1 - compliance) taken from many different studies. The estimates of
total tax base concealment in Spain during our time period are higher than many other available
in the literature, which correspond to more developed countries or later periods. Our case appears
close, however, to the results for Italy in 1991-94 and Chile in 1996, and also to the US estimates
for the 1980s, obtained through the discrepancy method (i.e., subsuming the effect of non-filing
and exemptions).
Evasion rates for self-employment incomes are always higher than those of dependent labour
incomes or the general tax base. The behaviour in Spain does not stand out a lot in this respect.
Rates of 70-80% are also found among small informal business suppliers in the US, suggesting that
a significant part of the difference between countries could be due to the business structure. Small
enterprises are more frequently informal, and also often taxed following presumptive methods:
this regime, as has been said, historically under-estimated these revenues in the Spanish PIT.
Similar systems exist in developing countries and also in places like France or Belgium, although
they tend to loose importance. Presumptive methods are not applied, or very marginally, in
developed economies where businesses are deemed capable of managing a basic accountancy.
This element, therefore, clearly affects the comparison of Spain with countries such as Sweden or
the US.
The process of salarization and the growing size of enterprises therefore seem important de-
terminants of the increased compliance in developed countries. And indeed, both these indicators
45In 2001, the existence of a special treatment for long-term capital gains has been considered a tax privilege, and thus
the ’no fraud’ scenario locates these revenues together will all the rest (i.e., I do not distinguish between the ’Base General’
and the ’Base Especial’, and apply the general, progressive tax schedule to the total – the ’Base Especial’ had a 18% uniform
tax rate). The quantitative incidence of this choice, however, is very limited.
46Of course, such a result is highly implausible. The exercise serves as an indication of the intensity of the distortion,
and not as a credible policy objective. The estimated tax gap in terms of tax liability lies between 2.4 and 3.3% of GDP – a
lower-bound, since it does not include the Basque Country nor Navarra.
27

Table 9: A comparison of Personal Income Tax evasion estimates across countries
Study Country Year
Evasion as % of...
Tax liabilityTax base
Total Self-empl.
This study Spain
1982* 42% 38% 78-62%
1990 36% 17% 36-...%
2001 29-17%** ...-33%
Esteller (2011) Spain 1993-2000 20%
Domınguez et al. (2015) Spain 2005 24%
Domınguez et al. (nd) Spain 2008 35-22%
Klepper and Nagin (1989) US 1982 32-74-48%**
Internal Revenue Service (1996) US
1985 14% 31% 35-73-31%**
1988 13% 26% 32-81-32%***
1992 13% 32-81-32%***
Feldman and Slemrod (2007) US 1999 35-74-78%***
Johns and Slemrod (2010) US 2001 18% 11% 43%
Black et al. (2012) US 2006 23% 56%
Kleven et al. (2011) Denmark 2007 2% 2% 37%****
Galbiati and Zanella (2012) Italy 1987 46%
Bernardi and Bernasconi (1997) Italy 1991 26% 63%
Bernardi (1996) Italy 1994 23% 60%
Fiorio and D’Amuri (2005) Italy 2000 78-8%
Marino and Zizza (2012) Italy 2004 14% 56%
Albarea et al. (2015) Italy 2010 7% 24%
Matsaganis et al. (2010) Italy 2002 21% 11%
Matsaganis and Flevotomou (2010) Greece 2004 26% 10% 24%
Artavanis et al. (2015) Greece 2003-09 43%
Leventi et al. (2013) Greece 2005-09 30% 12% 43%
Benedek and Lelkes (2011) Hungary 2005 16-20% 9-13% 67%
Engel et al. (1999) Chile 1996 54% 23%
Jimenez et al. (2010)
Chile 2003 46%
Ecuador 2005 58%
El Salvador 2005 36%
Guatemala 2006 70%
Mexico 2004 38%
Peru 2006 33%
Argentina 2005 50%
Income tax evasion is presented as % of the estimated total in each case. Most of these studies apply different variants of the discrepancy
method. The estimates for the US and Denmark, on the other hand, are based on audit data (except for Feldman & Slemrod, 2007), as
well as those from Galbiati and Zanella, 2012. Numbers in italics refer to total evasion (including non-filing and underpayment). The
tax liability calculations of this study refer exclusively to filers.
* 1982 refers only to the active population.
** The first figure includes the effect of the reduced tax rate on long-term capital gains.
*** Refers respectively to Non-farm proprietor income, Informal supplier income and Farm income.
**** Refers to all self-reported income, as opposed to that subject to third-party information.
28
were comparatively low in Spain at the start of the period, but tended to increase over time. The
share of employed workers over the workforce, according to the OECD database, was around
75% in Spain in the middle of the 1970s and grew up to near 85% thirty years later, converg-
ing significantly with its level in richer economies (at around 90%). This evolution entails that
the share of incomes that lacks accurate third-party control is decreasing. In the framework of
Kleven et al. (2015), the size of businesses is also important, because it makes collusion difficult
and generates more accurate accountancy. Firm size was indeed growing in Spain during this pe-
riod, with small and medium enterprises decreasing considerably as a share of total employment
(from 92% in 1986 to 79% in 1998).47
The previous appreciation with respect to labour and self-employment incomes cannot be eas-
ily extended to capital yields. It is difficult to find examples to make a comparison, since not many
works provide with estimates for capital incomes escaping taxation. In the case of discrepancy
work, it is normally difficult to obtain an adequate comparable magnitude. The extent to which
the above-mentioned processes also affected capital incomes in different countries is unknown,
and in any case they have been potentially counteracted by increasing capital mobility, avoidance
schemes and development of tax privileges, which can be seen as a “white-collar” substitute for
outright evasion.
6 Final comments
Tax evasion is a very popular topic in the Spanish public debate today. Folk wisdom has it that
it is still very pervasive, and unequally distributed – concentrating among the rich and the self-
employed. Its existence would render the tax system unfair, and there is much claim for fighting
against it, specially under the zeitgeist brought about by the economic crisis. What is the origin of
these impressions?
This paper has reviewed the slow and twisted path toward generality in income taxation in the
country. The principle that all citizens should contribute according to their economic capacities
was not followed for a long time. During most of the 20th Century, personal taxation was only di-
rected at the very rich households, so for most of the income scale there was no progressivity (and
hardly at the top, given acute non-filing). With the reforms in the seventies and the introduction of
the modern tax in 1978, the nature of the problem changed: the tax was now supposed to capture
all incomes and treat them equally; but resistances were hard. A high percentage of individuals
did not even file a tax return, and those who did reported incomes well below their real value on
average. The new tax was severely affected by lack of compliance and low legal valuations, in
spite of several administrative and legislative developments during the next decades.
I have estimated under-assessment of incomes in tax returns, including non-filing, legal under-
valuation and under-reporting by filers. Discrepancy between macro aggregates gives us an ap-
47Which is nevertheless still a high value compared to developed countries; see Tafunell, 2005, p. 721, where the figure
for Germany is 65% in 1986, similar to other central-northern European countries. The contrast is specially acute when we
focus on the share of microenterprises, with less than 10 employees (over 40% of total employment in Spain versus 18%
in Germany in 1986).
29
proximation to the total impact of these elements, which lies around 42% evasion in 1982 for the
total tax base, and ranging from 27% in wages to around 70-80% in other yields – with a decrease
in self-employment incomes to around 36% in 1990. As a second step, restricting the attention to
the behaviour of filers, I try to assess how reporting compliance changed across income sources
and the income scale. To do that, I have followed two proposals in the literature. The first is
a discrepancy analysis between tax return microdata and survey data (after adjusting these to
National Accounts for each income source), following Matsaganis et al. (2010)’s approach.
The second method is an econometric estimation with tax return micro-data, exploiting the re-
lation between reported charitable donations and the composition of income (under the assump-
tion that donations should not be affected by the latter, only by its level). This idea was developed
by Feldman and Slemrod (2007) and applied to Spain for 2008 by Domınguez et al. (nd). Nev-
ertheless, here I have slightly modified the procedure to correct for a plausible sample selection
problem using Heckman’s estimation method, because returns with charitable donations are a
small –and distinct – part of the total.
The discrepancy analysis shows very high levels of compliance in labour incomes, while they
were much lower for self-employment and, specially, capital yields. As a result both of composi-
tion and of differing rates of compliance across deciles within income source, evasion in the total
tax base is found to be increasing as we move towards the top of the income distribution. The
donation equations confirm the different behaviours of incomes from disparate sources. Taking
labour as fully compliant, all other yields would only be reported at near 40% of their real value
in 1982. Nineteen years later, at our second estimation, compliance had gone up slightly in fixed
capital incomes (lying now at 52%), and specially for self-employment activities (67%), but down
in the case of movable capital (32%).
Because of the varying composition of incomes across the society’s income distribution, we
expected a negative impact of these results on progressivity. Thus, the estimations we get from
the reported data concerning redistribution and progressivity would be upwards biased. This
is confirmed by a back-of-the-envelope calculation that gives an estimate of that bias as around
60-30% for the redistribution index and between 15 and 50% for the progressivity indicator, de-
pending on the year. The results seem to confirm Comın’s insight that, at least for some time, “the
regressivity of the tax system, however, has not been banished in practice, because fraud is still very flagrant
in incomes with no withholding at source. Widespread evasion in high-income taxpayers and non-labour
revenues has made PIT a tax on labour incomes” (Comın et al., 1995).
The bad news is that undermined progressivity of PIT, which was – and is – the only real
progressive tax with some weight in the system, calls into question the image of the ensemble of
taxation and the joint tax-and-transfer scheme. Escaping from contributions has proven pervasive
in the country. The good news, however, is that efforts to reduce it, despite being slow, have
reaped some rewards, specially with regards to self-employment incomes. A lot is left to be done,
judging by the results in this paper and the ones from Domınguez et al. (nd), but at least we know
where the big tax gaps are.
Further work would benefit from access to audit data, as has been possible in the US, allowing
the development of rich research in the area (Bishop et al., 2000; Feldman and Slemrod, 2007; Johns
and Slemrod, 2010), and also in Denmark (Kleven et al., 2011). This would provide much more
30
precise estimations. They are without a doubt interesting not only for economic history, but also
for societal awareness and policy design.
Bibliography
Albarea, A., M. Bernasconi, C. D. Novi, A. Marenzi, D. Rizzi, and F. Zantomio (2015). Accounting
for tax evasion profiles and tax expenditures in microsimulation modelling. The BETAMOD
model for personal income taxes in Italy. Working Papers 2015:24, Department of Economics,
University of Venice ”Ca’ Foscari”.
Albi, E. (1975). Impuesto sobre la renta y equidad: el caso espanol. Madrid: Instituto de Estudios
Fiscales.
Alcaide, A. (1980). Analisis estadıstico del Impuesto General sobre la Renta de las Personas Fısicas
en Espana. Hacienda Publica Espanola 64, 17–72.
Alcaide, A. (1981). Analisis del IRPF en 1979. Distribucion de contribuyentes por niveles de renta
y regiones geograficas. Hacienda Publica Espanola 72, 215–241.
Allingham, M. G. and A. Sandmo (1972). Income tax evasion: a theoretical analysis. Journal of
Public Economics 1, 323–338.
Alm, J., R. Bahl, and M. N. Murray (1991). Tax Base Erosion in Developing Countries. Economic
Development and Cultural Change 39(4), 849–72.
Alm, J. and K. Borders (2014). Estimating the ”Tax Gap” at the State Level: The Case of Georgia’s
Personal Income Tax. Public Budgeting & Finance 34(4), 61–79.
Almunia, M. and D. Lopez-Rodriguez (2012). The Efficiency Costs of Tax Enforcement: Evidence
from a Panel of Spanish Firms. MPRA Paper 44153.
Alvaredo, F. and E. Saez (2009). Income and wealth concentration in Spain from a historical and
fiscal perspective. Journal of the European Economic Association 7, 1140–1167.
Andreoni, J., B. Erard, and J. Feinstein (1998, June). Tax Compliance. Journal of Economic Litera-
ture 36(2), 818–860.
Artavanis, N. T., A. Morse, and M. Tsoutsoura (2015). Tax Evasion Across Industries: Soft Credit
Evidence from Greece. NBER Working Paper 21552.
Backus, P. (2010). Is charity a homogeneous good? The warwick economics research paper series
(twerps), University of Warwick, Department of Economics.
Bandres, E. (1993). La eficacia redistributiva de los gastos sociales. una aplicacion al caso espanol
(1980-1990). In I Simposio sobre Igualdad y Distribucion de la Renta y Riqueza, Volume VII, Sector
Publico y Redistribucion, pp. 123–172. Madrid: Fundacion Argentaria.
Benedek, D. and O. Lelkes (2011). The distributional implications of income under-reporting in
hungary. Fiscal Studies 32(4), 539–60.
31

Bernardi, L. (1996). L’irpef: un’introduzione al dibattito. In A. Fossati and S. Giannini (Eds.), I
nuovi sistemi tributari, pp. 17–48. Milano: Angeli.
Bernardi, L. and M. Bernasconi (1997). L’evasione fiscale in Italia: evidenze empiriche. Il fisco 38,
19–36.
Bishop, J., J. Formby, and P. Lambert (2000). Redistribution through the income tax: the vertical
and horizontal effects of non compliance and tax evasion. Public Finance Review 28(4), 335–350.
Bjorklund, A., M. Palme, and I. Svensson (1995). Tax Reforms and Income Distribution: An
Assessment Using Different Income Concepts. Swedish Economic Policy Review 2, 229–266.
Black, T., K. Bloomquist, E. Emblom, A. Johns, A. Plumley, and E. Stuk (2012). Federal tax com-
pliance research: tax year 2006 tax gap estimation. Research, Analysis and Statistics Working
Paper, IRS.
Bradley, R., S. Holden, and R. McClelland (2005). A Robust Estimation of the Effects of Taxation
on Charitable Contributions. Contemporary Economic Policy 23, 545–554.
Brooks, A. C. (2003). Charitable giving to humanitarian organizations in Spain. Hacienda Publica
Espanola 165(2), 9–24.
Carbajo Vasco, D. (1991). La nueva fiscalidad de las instituciones de inversion colectiva. Impuestos,
Revista de Doctrina, Legislacion y Jurisprudencia 7, 193–201.
Castillo, J. (1994). El fraude fiscal en Espana. Granada: Comares.
Clotfelter, C. T. (1983). Tax Evasion and Tax Rates: An Analysis of Individual Returns. The Review
of Economics and Statistics 65(3), 363–373.
Comın, Francisco (1994). El fraude fiscal en la Historia: un planteamiento de sus fases. Hacienda
Publica Espanola I, 31–46.
Comision para el Estudio del Fraude en el IRPF (1988). Evaluacion final del fraude en el IRPF en
los ejercicios 1979 a 1986. Technical report, Instituto de Estudios Fiscales, Madrid.
Comın, F., J. Pan-Montojo, J. Pro, R. Vallejo, and J. Zafra (1995). La practica fiscal en la Espana
contemporanea. Una historia de la Administracion tributaria (1800-1990). Memoria al Instituto de
Estudios Fiscales. Madrid.
Dıaz, C. and R. Fernandez (1993). El fraude en las rentas del trabajo. Documentos de Trabajo
6/93, Instituto de Estudios Fiscales.
Dıaz, C. and F. Melis (1993). La distribucion sectorial y personal de la renta de las empresas
personales. In I Simposio sobre igualdad y distribucion de la renta y la riqueza, Volume II, Madrid,
pp. 171–198. Fundacion Argentaria.
Dıaz, C. and D. Romero (1994). Evolucion del fraude sobre el valor anadido. Serie 1986-1992.
Papeles de Trabajo 4, Instituto de Estudios Fiscales, Madrid.
32
Direccion General de Tributos (1980). Boletın de la Direccion General de Tributos. Madrid: Direccion
General de Tributos, Ministerio de Hacienda.
Domınguez, F., J. Lopez, and F. Rodrigo (n.d.). El hueco que deja el diablo: una estimacion del
fraude en el IRPF con microdatos tributarios. Revista de Economıa Aplicada (forthcoming).
Domınguez, F., J. Lopez, and F. Rodrigo (2015). Fraude en el IRPF por fuentes de renta, 2005-2008:
del impuesto sintetico al impuesto dual. Studies on the Spanish Economy eee2015-14, FEDEA.
Duran-Cabre, J. M. and A. Esteller-More (2010). Tax Data For Wealth Concentration Analysis: An
Application To Spanish Wealth Tax. Review of Income and Wealth 56(3), 620–631.
Engel, E., A. Galetovic, and C. Raddatz (1999). Taxes and income distribution in Chile: some
unpleasant redistributive arithmetic. Journal of Development Economics 59(1), 155–192.
Erard, B. and C.-C. Ho (2001). Searching for ghosts: who are the nonfilers and how much tax do
they owe? Journal of Public Economics 81, 25–50.
Esteller, A. (2011). Is the tax administration just a money machine? Empirical evidence on redis-
tributive politics. Economics of Governance 12(3), 275–299.
Esteve, N. (1990). Analisis del fraude fiscal procedente de las polizas de seguros de prima unica y
las cesiones de credito. Documentos de trabajo 20, Secretarıa de Estado de Hacienda, Madrid.
Fack, G. and C. Landais (2013). The effect of tax enforcement on tax elasticities: Evidence from
charitable contributions in France. Economics Working Papers 1406, Department of Economics
and Business, Universitat Pompeu Fabra.
Feinstein, J. (1991). An Econometric Analysis of Income Tax Evasion and its Detection. Rand
Journal of Economics 22, 14–35.
Feldman, N. E. and J. Slemrod (2007). Estimating tax noncompliance with evidence from unau-
dited tax returns. The Economic Journal 117(518), 327–352.
Fiorio, C. V. and F. D’Amuri (2005). Workers’ Tax Evasion in Italy. Giornale degli Economisti 64(2-3),
247–270.
Fuentes Quintana, E. (1990). Las reformas tributarias en Espana. Teorıa, historia y propuestas.
Barcelona: Crıtica.
Galbiati, R. and G. Zanella (2012). The tax evasion social multiplier: Evidence from italy. Journal
of Public Economics 96(5), 485–494.
Garcıa, I. and C. Marcuello (2001). A Household Model of Charitable Contributions and Tax
Incentives. Annals of Public and Cooperative Economics 72(2), 159–181.
Gomez de Enterrıa, P., F. Melis, and D. Romero (1998). Evaluacion del cumplimiento en el IVA:
revision de las estimaciones anos 1990 a 1994. Papeles de Trabajo 18, Instituto de Estudios
Fiscales, Madrid.
33
Gota Losada, A. (1970). La realidad de la imposicion personal sobre la renta. Hacienda Publica
Espanola 3, 17–41.
Greene, W. (2003). Econometric Analysis. Pearson Education.
Hacienda Publica Espanola (1974). Datos estadısticos del IGRPF. Hacienda Publica Espanola 30.
Heckman, J. (1979). Sample selection bias as a specification error. Econometrica 47(1), 153–61.
Instituto de Estudios Fiscales (1973). Informe sobre el sistema tributario espanol (2002 ed.). Madrid.
Instituto Nacional de Estadıstica (1979). Contabilidad Nacional de Espana. Base 1970. Anos 1964-1976,
1977 provisional y avance de 1978. Madrid: INE.
Instituto Nacional de Estadıstica (1993). Contabilidad Nacional de Espana. Serie Enlazada 1964-1991.
Base 1986. Madrid: INE.
Internal Revenue Service (1996). Federal Tax Compliance Research: Individual Income Tax Gap
Estimates for 1985, 1988, and 1992. Publication 1415 (rev. 4-96), IRS, Washington, DC.
Jimenez, J., J. Gomez-Sabaini, and A. Podesta (2010). Evasion y equidad en America Latina.
Documentos de proyectos, ECLAC.
Johannesen, N. (2014). Tax evasion and Swiss bank deposits. Journal of Public Economics 111(C),
46–62.
Johns, A. and J. Slemrod (2010). The Distribution of Income Tax Noncompliance. National Tax
Journal 63, 397–418.
Klepper, S. and D. Nagin (1989). The anatomy of tax evasion. Journal of Law, Economics, and
Organization 5(1), 1–24.
Kleven, H. J., M. B. Knudsen, C. T. Kreiner, S. Pedersen, and E. Saez (2011). Unwilling or Unable
to Cheat? Evidence from a Randomized Tax Audit Experiment in Denmark. Econometrica 79(3),
651–692.
Kleven, H. J., C. T. Kreiner, and E. Saez (2015). Why Can Modern Governments Tax So Much? An
Agency Model of Firms as Fiscal Intermediaries.
Lagares, J. (1974). Hacia una teorıa de la evasion tributaria. Hacienda Publica Espanola 28, 37–54.
Lagares, M. J. (1999). La Hacienda publica en las Facultades de Ciencias Economicas y en la so-
ciedad espanola durante la segunda mitad del siglo XX. In E. Fuentes Quintana (Ed.), Economıa
y economistas espanoles, Volume 7, pp. 571–617. Barcelona: Galaxia Gutenberg.
Leventi, C., M. Matsaganis, and M. Flevotomouc (2013). Distributional Implications of Tax Eva-
sion and the Crisis in Greece. Working Paper EM17/13, EUROMOD.
Lopez-Laborda, J. and F. R. Sauco (2003). Tax Amnesties and Income Tax Compliance: The Case
of Spain. Fiscal Studies 24(1), 73–96.
Luttmer, E. F. and M. Singhal (2014). Tax Morale. Journal of Economic Perspectives 28(4), 149–68.
34
Marino, M. R. and R. Zizza (2012). The personal income tax evasion in Italy : an estimate by
taxpayer’s type. In M. Pickhardt and A. Prinz (Eds.), Tax Evasion And The Shadow Economy, pp.
33–60. Cheltenham, UK: Edward Elgar.
Matsaganis, M., D. Benedek, M. Flevotomou, O. Lelkes, D. Mantovani, and S. Nienadowska
(2010). Distributional implications of income tax evasion in Greece, Hungary and Italy. MPRA
Working Paper 21465.
Matsaganis, M. and M. Flevotomou (2010). Distributional implications of income tax evasion in
Greece. Technical report, Hellenic Observatory Papers on Greece and Southeast Europe.
Ministerio de Hacienda (1980). Memoria de la Reforma Tributaria. Madrid: Ministerio de Hacienda.
Ministerio de Hacienda (1981). Memoria de la Reforma Tributaria. Madrid: Ministerio de Hacienda.
Ministerio de Trabajo (1991). Anuario de Estadısticas Laborales. Madrid: Ministerio de Trabajo.
Naredo, J. (1993). Composicion y distribucion de la riqueza de los hogares espanoles. In I Simposio
sobre Igualdad y Distribucion de la Renta y la Riqueza, pp. 7–80. Madrid: Fundacion Argentaria.
Navarro, A. (1993). La adecuacion del metodo de estimacion objetiva de la base imponible por
signos, ındices y modulos a los principios de Justicia Tributaria. Palau 14. Revista Valenciana de
Hacienda Publica (21), 69–100.
Onrubia, J. (2007). The Reform of the Tax Administration in Spain. In J. Martınez-Vazquez (Ed.),
Fiscal Reform in Spain: Accomplishments and Challenges, Number January, pp. 484–531. Chel-
tenham (UK) and Northampton (Massachusetts): E. Elgar.
Onrubia, J. (2012). La reforma de la administracion tributaria: mitos y realidades. In Foro Fiscal
IEB.
Pan-Montojo, J. (2007). Los inspectores de Hacienda en Espana: una mirada historica. Madrid: Centro
de Estudios Financieros.
Pickhardt, M. and J. Sarda (2015). Size and causes of the underground economy in Spain: a
correction of the record and new evidence from the MCDR approach. European Journal of Law
and Economics 39(2), 403–429.
Piketty, T. (2003). Income Inequality in France, 1901–1998. Journal of Political Economy 111(5),
1004–1042.
Pissarides, C. A. and G. Weber (1989). An Expenditure-Based Estimate of Britain’s Black Economy.
Journal of Public Economics 39(1), 17–32.
Prados de la Escosura, L. (2003). El progreso economico de Espana (1850-2000). Bilbao: Fundacion
BBVA.
Perez Royo, F. (1990). Armonizacion de la fiscalidad sobre el ahorro. Las consecuencias para
el sistema tributario espanol de la Directiva sobre liberalizacion de movimientos de capitales.
Hacienda Publica Espanola I/1990, 111–123.
35
Raymond-Bara, J. (1987). Tipos impositivos y evasion fiscal en Espana: un analisis empırico.
Papeles de Economıa Espanola 30-31, 154–169.
Santos Penas, J. (1975). Presion impositiva sobre las rentas de trabajo en Espana. Hacienda Publica
Espanola 37, 41–60.
Sasigain, F. (1993). Aproximacion al fraude en el Impuesto sobre la Renta de las Personas Fısicas
en el Paıs Vasco. Ekonomiaz: Revista vasca de Economıa 25, 251–292.
Schneider, F. (2009). The Size of the Shadow Economy in 21 OECD Countries ( in % of ” official “
GDP ) using the MIMIC and currency demand approach. Technical report.
Slemrod, J. (1989). Are Estimated Tax Elasticities Really Just Tax Evasion Elasticities? The Case of
Charitable Contributions. The Review of Economics and Statistics 71(3), 19–36.
Tafunell, X. (2005). Empresa y bolsa. In A. Carreras and X. Tafunell (Eds.), Estadısticas Historicas
de Espana. Siglos XIX-XX (2nd ed.)., pp. 707–833. Bilbao: Fundacion BBVA.
Torregrosa, S. (2015a). Did Democracy bring Redistribution? Insights from the Spanish tax system
(1960-1990). European Review of Economic History 3(19), 294–315.
Torregrosa, S. (2015b). Sticky income inequality in the Spanish transition (1973-1990). Revista de
Historia Economica / Journal of Iberian and Latin American Economic History FirstView, 1–42.
Truyols, M. (1994). El Impuesto sobre Sociedades en terminos de Contabilidad Nacional. Hacienda
Publica Espanola 130, 127–50.
Valdes, T. (1982). Los metodos de analisis discriminante como herramienta al servicio de la in-
speccion fiscal. Monografıas, Instituto de Estudios Fiscales, Madrid.
Yitzhaki, S. (1974). A note on ‘income tax evasion: a theoretical analysis’. Journal of Public Eco-
nomics 3(2), 201–202.
Zucman, G. (2013). The Missing Wealth of Nations: Are Europe and the US net Debtors or net
Creditors? The Quarterly journal of economics 128(3), 1321–1364.
36
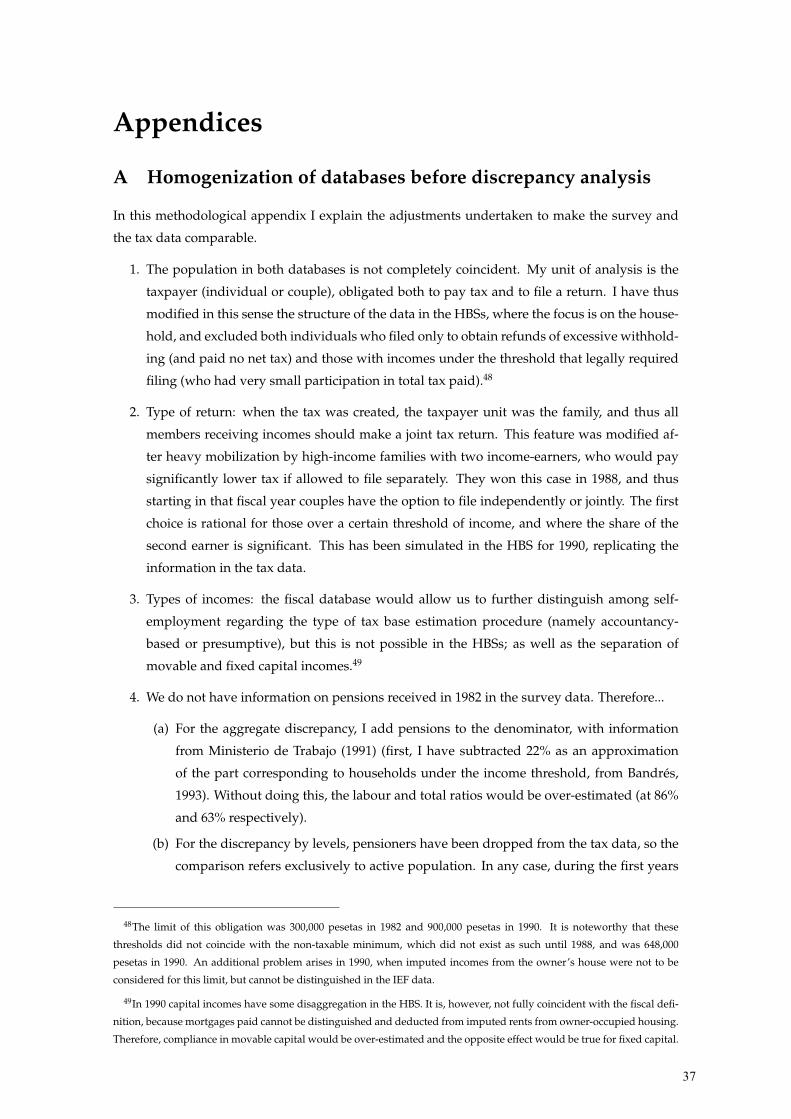
Appendices
A Homogenization of databases before discrepancy analysis
In this methodological appendix I explain the adjustments undertaken to make the survey and
the tax data comparable.
1. The population in both databases is not completely coincident. My unit of analysis is the
taxpayer (individual or couple), obligated both to pay tax and to file a return. I have thus
modified in this sense the structure of the data in the HBSs, where the focus is on the house-
hold, and excluded both individuals who filed only to obtain refunds of excessive withhold-
ing (and paid no net tax) and those with incomes under the threshold that legally required
filing (who had very small participation in total tax paid).48
2. Type of return: when the tax was created, the taxpayer unit was the family, and thus all
members receiving incomes should make a joint tax return. This feature was modified af-
ter heavy mobilization by high-income families with two income-earners, who would pay
significantly lower tax if allowed to file separately. They won this case in 1988, and thus
starting in that fiscal year couples have the option to file independently or jointly. The first
choice is rational for those over a certain threshold of income, and where the share of the
second earner is significant. This has been simulated in the HBS for 1990, replicating the
information in the tax data.
3. Types of incomes: the fiscal database would allow us to further distinguish among self-
employment regarding the type of tax base estimation procedure (namely accountancy-
based or presumptive), but this is not possible in the HBSs; as well as the separation of
movable and fixed capital incomes.49
4. We do not have information on pensions received in 1982 in the survey data. Therefore...
(a) For the aggregate discrepancy, I add pensions to the denominator, with information
from Ministerio de Trabajo (1991) (first, I have subtracted 22% as an approximation
of the part corresponding to households under the income threshold, from Bandres,
1993). Without doing this, the labour and total ratios would be over-estimated (at 86%
and 63% respectively).
(b) For the discrepancy by levels, pensioners have been dropped from the tax data, so the
comparison refers exclusively to active population. In any case, during the first years
48The limit of this obligation was 300,000 pesetas in 1982 and 900,000 pesetas in 1990. It is noteworthy that these
thresholds did not coincide with the non-taxable minimum, which did not exist as such until 1988, and was 648,000
pesetas in 1990. An additional problem arises in 1990, when imputed incomes from the owner’s house were not to be
considered for this limit, but cannot be distinguished in the IEF data.
49In 1990 capital incomes have some disaggregation in the HBS. It is, however, not fully coincident with the fiscal defi-
nition, because mortgages paid cannot be distinguished and deducted from imputed rents from owner-occupied housing.
Therefore, compliance in movable capital would be over-estimated and the opposite effect would be true for fixed capital.
37
after the introduction of the tax there was certain discussion as to whether public bene-
fits should be included in the base, which was finally set at the supreme national court:
unemployment and disability pensions were excluded in 1983 and 1986 respectively,
while regular old age pensions were subject to tax. Recall, however, that these revenues
were paid by the state and withheld at source, so fraud in them is not expected.
5. Negative values in self-employment and capital incomes in the 1982 tax data have been
changed to 0 before the comparison, to avoid potential bias given that there are no negative
values in the HBS observations.
6. In order to obtain averages for the filing population, the HBS sample has been re-weighted
to match the characteristics of the tax data sample, with respect to region, marital status and
labour market status.
7. The averages are then calculated over all observations in each income-region category. This
means that partial non-reporting of certain incomes is subsumed with their under-reporting.
The alternative procedure, using only the observations with each kind of income, would
entail assuming that partial non-reporting is non-existent.
B Alternative discrepancy: by income levels
In the text, discrepancy by income levels has been obtained as a result of a composition effect,
after comparing the means for type-region combinations. Earlier works on the sort, however,
calculated the compliance ratios directly comparing the means of type-level combinations, thus
assuming that there is no re-ranking as a result of income under-reporting. This is the case of
Fiorio and D’Amuri (2005), whose calculation corresponds to:
Csj =YRsj
YSsj(8)
where Csj stands for compliance ratio of income source s at income level j, YR represents average
income reported in the tax returns and YS average income reported in the HBSs. Csj is expected
to be lower than one, indicating the existence of evasion.
The results of these calculations, by deciles, are shown in figure 8. They display something
like a U shape for self-employment, and also for capital incomes in 1990. The total tax base is not
shown to be significantly under-reported for any income level in 1990 (presumably a result of the
previously mentioned under-adjustment in the HBS).
This procedure would be unreliable in the presence of significant re-ranking: if taxpayers get
ordered differently because of their reporting behaviour, to the extent that they changed their
quantile, it is not consistent to compare the two distributions directly. Such was the motivation
of the Matsaganis et al. (2010) approach. The extent of re-ranking and the validity of the assump-
tions underlying both procedures rests, however, unknown. Reality probably lies somewhere in
between.
38

Figure 8: Estimated compliance ratios by income deciles a la Fiorio & d’Amuri
Source: author’s calculations with IEF panel data and HBSs (re-weighted). Following Fiorio & d’Amuri (2005).
39
Documents de Treball de l’IEB
2011
2011/1, Oppedisano, V; Turati, G.: "What are the causes of educational inequalities and of their evolution over time
in Europe? Evidence from PISA"
2011/2, Dahlberg, M; Edmark, K; Lundqvist, H.: "Ethnic diversity and preferences for redistribution"
2011/3, Canova, L.; Vaglio, A.: "Why do educated mothers matter? A model of parental help”
2011/4, Delgado, F.J.; Lago-Peñas, S.; Mayor, M.: “On the determinants of local tax rates: new evidence from
Spain”
2011/5, Piolatto, A.; Schuett, F.: “A model of music piracy with popularity-dependent copying costs”
2011/6, Duch, N.; García-Estévez, J.; Parellada, M.: “Universities and regional economic growth in Spanish
regions”
2011/7, Duch, N.; García-Estévez, J.: “Do universities affect firms’ location decisions? Evidence from Spain”
2011/8, Dahlberg, M.; Mörk, E.: “Is there an election cycle in public employment? Separating time effects from
election year effects”
2011/9, Costas-Pérez, E.; Solé-Ollé, A.; Sorribas-Navarro, P.: “Corruption scandals, press reporting, and
accountability. Evidence from Spanish mayors”
2011/10, Choi, A.; Calero, J.; Escardíbul, J.O.: “Hell to touch the sky? Private tutoring and academic achievement
in Korea”
2011/11, Mira Godinho, M.; Cartaxo, R.: “University patenting, licensing and technology transfer: how
organizational context and available resources determine performance”
2011/12, Duch-Brown, N.; García-Quevedo, J.; Montolio, D.: “The link between public support and private R&D
effort: What is the optimal subsidy?”
2011/13, Breuillé, M.L.; Duran-Vigneron, P.; Samson, A.L.: “To assemble to resemble? A study of tax disparities
among French municipalities”
2011/14, McCann, P.; Ortega-Argilés, R.: “Smart specialisation, regional growth and applications to EU cohesion
policy”
2011/15, Montolio, D.; Trillas, F.: “Regulatory federalism and industrial policy in broadband telecommunications”
2011/16, Pelegrín, A.; Bolancé, C.: “Offshoring and company characteristics: some evidence from the analysis of
Spanish firm data”
2011/17, Lin, C.: “Give me your wired and your highly skilled: measuring the impact of immigration policy on
employers and shareholders”
2011/18, Bianchini, L.; Revelli, F.: “Green polities: urban environmental performance and government popularity”
2011/19, López Real, J.: “Family reunification or point-based immigration system? The case of the U.S. and
Mexico”
2011/20, Bogliacino, F.; Piva, M.; Vivarelli, M.: “The impact of R&D on employment in Europe: a firm-level
analysis”
2011/21, Tonello, M.: “Mechanisms of peer interactions between native and non-native students: rejection or
integration?”
2011/22, García-Quevedo, J.; Mas-Verdú, F.; Montolio, D.: “What type of innovative firms acquire knowledge
intensive services and from which suppliers?”
2011/23, Banal-Estañol, A.; Macho-Stadler, I.; Pérez-Castrillo, D.: “Research output from university-industry
collaborative projects”
2011/24, Ligthart, J.E.; Van Oudheusden, P.: “In government we trust: the role of fiscal decentralization”
2011/25, Mongrain, S.; Wilson, J.D.: “Tax competition with heterogeneous capital mobility”
2011/26, Caruso, R.; Costa, J.; Ricciuti, R.: “The probability of military rule in Africa, 1970-2007”
2011/27, Solé-Ollé, A.; Viladecans-Marsal, E.: “Local spending and the housing boom”
2011/28, Simón, H.; Ramos, R.; Sanromá, E.: “Occupational mobility of immigrants in a low skilled economy. The
Spanish case”
2011/29, Piolatto, A.; Trotin, G.: “Optimal tax enforcement under prospect theory”
2011/30, Montolio, D; Piolatto, A.: “Financing public education when altruistic agents have retirement concerns”
2011/31, García-Quevedo, J.; Pellegrino, G.; Vivarelli, M.: “The determinants of YICs’ R&D activity”
2011/32, Goodspeed, T.J.: “Corruption, accountability, and decentralization: theory and evidence from Mexico”
2011/33, Pedraja, F.; Cordero, J.M.: “Analysis of alternative proposals to reform the Spanish intergovernmental
transfer system for municipalities”
2011/34, Jofre-Monseny, J.; Sorribas-Navarro, P.; Vázquez-Grenno, J.: “Welfare spending and ethnic
heterogeneity: evidence from a massive immigration wave”
2011/35, Lyytikäinen, T.: “Tax competition among local governments: evidence from a property tax reform in
Finland”
2011/36, Brülhart, M.; Schmidheiny, K.: “Estimating the Rivalness of State-Level Inward FDI”
2011/37, García-Pérez, J.I.; Hidalgo-Hidalgo, M.; Robles-Zurita, J.A.: “Does grade retention affect achievement?
Some evidence from Pisa”
2011/38, Boffa, f.; Panzar. J.: “Bottleneck co-ownership as a regulatory alternative”
Documents de Treball de l’IEB
2011/39, González-Val, R.; Olmo, J.: “Growth in a cross-section of cities: location, increasing returns or random
growth?”
2011/40, Anesi, V.; De Donder, P.: “Voting under the threat of secession: accommodation vs. repression”
2011/41, Di Pietro, G.; Mora, T.: “The effect of the l’Aquila earthquake on labour market outcomes”
2011/42, Brueckner, J.K.; Neumark, D.: “Beaches, sunshine, and public-sector pay: theory and evidence on
amenities and rent extraction by government workers”
2011/43, Cortés, D.: “Decentralization of government and contracting with the private sector”
2011/44, Turati, G.; Montolio, D.; Piacenza, M.: “Fiscal decentralisation, private school funding, and students’
achievements. A tale from two Roman catholic countries”
2012
2012/1, Montolio, D.; Trujillo, E.: "What drives investment in telecommunications? The role of regulation, firms’
internationalization and market knowledge"
2012/2, Giesen, K.; Suedekum, J.: "The size distribution across all “cities”: a unifying approach"
2012/3, Foremny, D.; Riedel, N.: "Business taxes and the electoral cycle"
2012/4, García-Estévez, J.; Duch-Brown, N.: "Student graduation: to what extent does university expenditure
matter?"
2012/5, Durán-Cabré, J.M.; Esteller-Moré, A.; Salvadori, L.: "Empirical evidence on horizontal competition in
tax enforcement"
2012/6, Pickering, A.C.; Rockey, J.: "Ideology and the growth of US state government"
2012/7, Vergolini, L.; Zanini, N.: "How does aid matter? The effect of financial aid on university enrolment
decisions"
2012/8, Backus, P.: "Gibrat’s law and legacy for non-profit organisations: a non-parametric analysis"
2012/9, Jofre-Monseny, J.; Marín-López, R.; Viladecans-Marsal, E.: "What underlies localization and
urbanization economies? Evidence from the location of new firms"
2012/10, Mantovani, A.; Vandekerckhove, J.: "The strategic interplay between bundling and merging in
complementary markets"
2012/11, Garcia-López, M.A.: "Urban spatial structure, suburbanization and transportation in Barcelona"
2012/12, Revelli, F.: "Business taxation and economic performance in hierarchical government structures"
2012/13, Arqué-Castells, P.; Mohnen, P.: "Sunk costs, extensive R&D subsidies and permanent inducement
effects"
2012/14, Boffa, F.; Piolatto, A.; Ponzetto, G.: "Centralization and accountability: theory and evidence from the
Clean Air Act"
2012/15, Cheshire, P.C.; Hilber, C.A.L.; Kaplanis, I.: "Land use regulation and productivity – land matters:
evidence from a UK supermarket chain"
2012/16, Choi, A.; Calero, J.: "The contribution of the disabled to the attainment of the Europe 2020 strategy
headline targets"
2012/17, Silva, J.I.; Vázquez-Grenno, J.: "The ins and outs of unemployment in a two-tier labor market"
2012/18, González-Val, R.; Lanaspa, L.; Sanz, F.: "New evidence on Gibrat’s law for cities"
2012/19, Vázquez-Grenno, J.: "Job search methods in times of crisis: native and immigrant strategies in Spain"
2012/20, Lessmann, C.: "Regional inequality and decentralization – an empirical analysis"
2012/21, Nuevo-Chiquero, A.: "Trends in shotgun marriages: the pill, the will or the cost?"
2012/22, Piil Damm, A.: "Neighborhood quality and labor market outcomes: evidence from quasi-random
neighborhood assignment of immigrants"
2012/23, Ploeckl, F.: "Space, settlements, towns: the influence of geography and market access on settlement
distribution and urbanization"
2012/24, Algan, Y.; Hémet, C.; Laitin, D.: "Diversity and local public goods: a natural experiment with exogenous
residential allocation"
2012/25, Martinez, D.; Sjögren, T.: "Vertical externalities with lump-sum taxes: how much difference does
unemployment make?"
2012/26, Cubel, M.; Sanchez-Pages, S.: "The effect of within-group inequality in a conflict against a unitary threat"
2012/27, Andini, M.; De Blasio, G.; Duranton, G.; Strange, W.C.: "Marshallian labor market pooling: evidence
from Italy"
2012/28, Solé-Ollé, A.; Viladecans-Marsal, E.: "Do political parties matter for local land use policies?"
2012/29, Buonanno, P.; Durante, R.; Prarolo, G.; Vanin, P.: "Poor institutions, rich mines: resource curse and the
origins of the Sicilian mafia"
2012/30, Anghel, B.; Cabrales, A.; Carro, J.M.: "Evaluating a bilingual education program in Spain: the impact
beyond foreign language learning"
2012/31, Curto-Grau, M.; Solé-Ollé, A.; Sorribas-Navarro, P.: "Partisan targeting of inter-governmental transfers
& state interference in local elections: evidence from Spain"
Documents de Treball de l’IEB
2012/32, Kappeler, A.; Solé-Ollé, A.; Stephan, A.; Välilä, T.: "Does fiscal decentralization foster regional
investment in productive infrastructure?"
2012/33, Rizzo, L.; Zanardi, A.: "Single vs double ballot and party coalitions: the impact on fiscal policy. Evidence
from Italy"
2012/34, Ramachandran, R.: "Language use in education and primary schooling attainment: evidence from a
natural experiment in Ethiopia"
2012/35, Rothstein, J.: "Teacher quality policy when supply matters"
2012/36, Ahlfeldt, G.M.: "The hidden dimensions of urbanity"
2012/37, Mora, T.; Gil, J.; Sicras-Mainar, A.: "The influence of BMI, obesity and overweight on medical costs: a
panel data approach"
2012/38, Pelegrín, A.; García-Quevedo, J.: "Which firms are involved in foreign vertical integration?"
2012/39, Agasisti, T.; Longobardi, S.: "Inequality in education: can Italian disadvantaged students close the gap? A
focus on resilience in the Italian school system"
2013
2013/1, Sánchez-Vidal, M.; González-Val, R.; Viladecans-Marsal, E.: "Sequential city growth in the US: does age
matter?"
2013/2, Hortas Rico, M.: "Sprawl, blight and the role of urban containment policies. Evidence from US cities"
2013/3, Lampón, J.F.; Cabanelas-Lorenzo, P-; Lago-Peñas, S.: "Why firms relocate their production overseas?
The answer lies inside: corporate, logistic and technological determinants"
2013/4, Montolio, D.; Planells, S.: "Does tourism boost criminal activity? Evidence from a top touristic country"
2013/5, Garcia-López, M.A.; Holl, A.; Viladecans-Marsal, E.: "Suburbanization and highways: when the Romans,
the Bourbons and the first cars still shape Spanish cities"
2013/6, Bosch, N.; Espasa, M.; Montolio, D.: "Should large Spanish municipalities be financially compensated?
Costs and benefits of being a capital/central municipality"
2013/7, Escardíbul, J.O.; Mora, T.: "Teacher gender and student performance in mathematics. Evidence from
Catalonia"
2013/8, Arqué-Castells, P.; Viladecans-Marsal, E.: "Banking towards development: evidence from the Spanish
banking expansion plan"
2013/9, Asensio, J.; Gómez-Lobo, A.; Matas, A.: "How effective are policies to reduce gasoline consumption?
Evaluating a quasi-natural experiment in Spain"
2013/10, Jofre-Monseny, J.: "The effects of unemployment benefits on migration in lagging regions"
2013/11, Segarra, A.; García-Quevedo, J.; Teruel, M.: "Financial constraints and the failure of innovation
projects"
2013/12, Jerrim, J.; Choi, A.: "The mathematics skills of school children: How does England compare to the high
performing East Asian jurisdictions?"
2013/13, González-Val, R.; Tirado-Fabregat, D.A.; Viladecans-Marsal, E.: "Market potential and city growth:
Spain 1860-1960"
2013/14, Lundqvist, H.: "Is it worth it? On the returns to holding political office"
2013/15, Ahlfeldt, G.M.; Maennig, W.: "Homevoters vs. leasevoters: a spatial analysis of airport effects"
2013/16, Lampón, J.F.; Lago-Peñas, S.: "Factors behind international relocation and changes in production
geography in the European automobile components industry"
2013/17, Guío, J.M.; Choi, A.: "Evolution of the school failure risk during the 2000 decade in Spain: analysis of
Pisa results with a two-level logistic mode"
2013/18, Dahlby, B.; Rodden, J.: "A political economy model of the vertical fiscal gap and vertical fiscal
imbalances in a federation"
2013/19, Acacia, F.; Cubel, M.: "Strategic voting and happiness"
2013/20, Hellerstein, J.K.; Kutzbach, M.J.; Neumark, D.: "Do labor market networks have an important spatial
dimension?"
2013/21, Pellegrino, G.; Savona, M.: "Is money all? Financing versus knowledge and demand constraints to
innovation"
2013/22, Lin, J.: "Regional resilience"
2013/23, Costa-Campi, M.T.; Duch-Brown, N.; García-Quevedo, J.: "R&D drivers and obstacles to innovation in
the energy industry"
2013/24, Huisman, R.; Stradnic, V.; Westgaard, S.: "Renewable energy and electricity prices: indirect empirical
evidence from hydro power"
2013/25, Dargaud, E.; Mantovani, A.; Reggiani, C.: "The fight against cartels: a transatlantic perspective"
2013/26, Lambertini, L.; Mantovani, A.: "Feedback equilibria in a dynamic renewable resource oligopoly: pre-
emption, voracity and exhaustion"

Documents de Treball de l’IEB
2013/27, Feld, L.P.; Kalb, A.; Moessinger, M.D.; Osterloh, S.: "Sovereign bond market reactions to fiscal rules
and no-bailout clauses – the Swiss experience"
2013/28, Hilber, C.A.L.; Vermeulen, W.: "The impact of supply constraints on house prices in England"
2013/29, Revelli, F.: "Tax limits and local democracy"
2013/30, Wang, R.; Wang, W.: "Dress-up contest: a dark side of fiscal decentralization"
2013/31, Dargaud, E.; Mantovani, A.; Reggiani, C.: "The fight against cartels: a transatlantic perspective"
2013/32, Saarimaa, T.; Tukiainen, J.: "Local representation and strategic voting: evidence from electoral boundary
reforms"
2013/33, Agasisti, T.; Murtinu, S.: "Are we wasting public money? No! The effects of grants on Italian university
students’ performances"
2013/34, Flacher, D.; Harari-Kermadec, H.; Moulin, L.: "Financing higher education: a contributory scheme"
2013/35, Carozzi, F.; Repetto, L.: "Sending the pork home: birth town bias in transfers to Italian municipalities"
2013/36, Coad, A.; Frankish, J.S.; Roberts, R.G.; Storey, D.J.: "New venture survival and growth: Does the fog
lift?"
2013/37, Giulietti, M.; Grossi, L.; Waterson, M.: "Revenues from storage in a competitive electricity market:
Empirical evidence from Great Britain"
2014
2014/1, Montolio, D.; Planells-Struse, S.: "When police patrols matter. The effect of police proximity on citizens’
crime risk perception"
2014/2, Garcia-López, M.A.; Solé-Ollé, A.; Viladecans-Marsal, E.: "Do land use policies follow road
construction?"
2014/3, Piolatto, A.; Rablen, M.D.: "Prospect theory and tax evasion: a reconsideration of the Yitzhaki puzzle"
2014/4, Cuberes, D.; González-Val, R.: "The effect of the Spanish Reconquest on Iberian Cities"
2014/5, Durán-Cabré, J.M.; Esteller-Moré, E.: "Tax professionals' view of the Spanish tax system: efficiency,
equity and tax planning"
2014/6, Cubel, M.; Sanchez-Pages, S.: "Difference-form group contests"
2014/7, Del Rey, E.; Racionero, M.: "Choosing the type of income-contingent loan: risk-sharing versus risk-
pooling"
2014/8, Torregrosa Hetland, S.: "A fiscal revolution? Progressivity in the Spanish tax system, 1960-1990"
2014/9, Piolatto, A.: "Itemised deductions: a device to reduce tax evasion"
2014/10, Costa, M.T.; García-Quevedo, J.; Segarra, A.: "Energy efficiency determinants: an empirical analysis of
Spanish innovative firms"
2014/11, García-Quevedo, J.; Pellegrino, G.; Savona, M.: "Reviving demand-pull perspectives: the effect of
demand uncertainty and stagnancy on R&D strategy"
2014/12, Calero, J.; Escardíbul, J.O.: "Barriers to non-formal professional training in Spain in periods of economic
growth and crisis. An analysis with special attention to the effect of the previous human capital of workers"
2014/13, Cubel, M.; Sanchez-Pages, S.: "Gender differences and stereotypes in the beauty"
2014/14, Piolatto, A.; Schuett, F.: "Media competition and electoral politics"
2014/15, Montolio, D.; Trillas, F.; Trujillo-Baute, E.: "Regulatory environment and firm performance in EU
telecommunications services"
2014/16, Lopez-Rodriguez, J.; Martinez, D.: "Beyond the R&D effects on innovation: the contribution of non-
R&D activities to TFP growth in the EU"
2014/17, González-Val, R.: "Cross-sectional growth in US cities from 1990 to 2000"
2014/18, Vona, F.; Nicolli, F.: "Energy market liberalization and renewable energy policies in OECD countries"
2014/19, Curto-Grau, M.: "Voters’ responsiveness to public employment policies"
2014/20, Duro, J.A.; Teixidó-Figueras, J.; Padilla, E.: "The causal factors of international inequality in co2
emissions per capita: a regression-based inequality decomposition analysis"
2014/21, Fleten, S.E.; Huisman, R.; Kilic, M.; Pennings, E.; Westgaard, S.: "Electricity futures prices: time
varying sensitivity to fundamentals"
2014/22, Afcha, S.; García-Quevedo, J,: "The impact of R&D subsidies on R&D employment composition"
2014/23, Mir-Artigues, P.; del Río, P.: "Combining tariffs, investment subsidies and soft loans in a renewable
electricity deployment policy"
2014/24, Romero-Jordán, D.; del Río, P.; Peñasco, C.: "Household electricity demand in Spanish regions. Public
policy implications"
2014/25, Salinas, P.: "The effect of decentralization on educational outcomes: real autonomy matters!"
2014/26, Solé-Ollé, A.; Sorribas-Navarro, P.: "Does corruption erode trust in government? Evidence from a recent
surge of local scandals in Spain"
2014/27, Costas-Pérez, E.: "Political corruption and voter turnout: mobilization or disaffection?"
Documents de Treball de l’IEB
2014/28, Cubel, M.; Nuevo-Chiquero, A.; Sanchez-Pages, S.; Vidal-Fernandez, M.: "Do personality traits affect
productivity? Evidence from the LAB"
2014/29, Teresa Costa, M.T.; Trujillo-Baute, E.: "Retail price effects of feed-in tariff regulation"
2014/30, Kilic, M.; Trujillo-Baute, E.: "The stabilizing effect of hydro reservoir levels on intraday power prices
under wind forecast errors"
2014/31, Costa-Campi, M.T.; Duch-Brown, N.: "The diffusion of patented oil and gas technology with
environmental uses: a forward patent citation analysis"
2014/32, Ramos, R.; Sanromá, E.; Simón, H.: "Public-private sector wage differentials by type of contract:
evidence from Spain"
2014/33, Backus, P.; Esteller-Moré, A.: "Is income redistribution a form of insurance, a public good or both?"
2014/34, Huisman, R.; Trujillo-Baute, E.: "Costs of power supply flexibility: the indirect impact of a Spanish
policy change"
2014/35, Jerrim, J.; Choi, A.; Simancas Rodríguez, R.: "Two-sample two-stage least squares (TSTSLS) estimates
of earnings mobility: how consistent are they?"
2014/36, Mantovani, A.; Tarola, O.; Vergari, C.: "Hedonic quality, social norms, and environmental campaigns"
2014/37, Ferraresi, M.; Galmarini, U.; Rizzo, L.: "Local infrastructures and externalities: Does the size matter?"
2014/38, Ferraresi, M.; Rizzo, L.; Zanardi, A.: "Policy outcomes of single and double-ballot elections"
2015
2015/1, Foremny, D.; Freier, R.; Moessinger, M-D.; Yeter, M.: "Overlapping political budget cycles in the
legislative and the executive"
2015/2, Colombo, L.; Galmarini, U.: "Optimality and distortionary lobbying: regulating tobacco consumption"
2015/3, Pellegrino, G.: "Barriers to innovation: Can firm age help lower them?"
2015/4, Hémet, C.: "Diversity and employment prospects: neighbors matter!"
2015/5, Cubel, M.; Sanchez-Pages, S.: "An axiomatization of difference-form contest success functions"
2015/6, Choi, A.; Jerrim, J.: "The use (and misuse) of Pisa in guiding policy reform: the case of Spain"
2015/7, Durán-Cabré, J.M.; Esteller-Moré, A.; Salvadori, L.: "Empirical evidence on tax cooperation between
sub-central administrations"
2015/8, Batalla-Bejerano, J.; Trujillo-Baute, E.: "Analysing the sensitivity of electricity system operational costs
to deviations in supply and demand"
2015/9, Salvadori, L.: "Does tax enforcement counteract the negative effects of terrorism? A case study of the
Basque Country"
2015/10, Montolio, D.; Planells-Struse, S.: "How time shapes crime: the temporal impacts of football matches on
crime"
2015/11, Piolatto, A.: "Online booking and information: competition and welfare consequences of review
aggregators"
2015/12, Boffa, F.; Pingali, V.; Sala, F.: "Strategic investment in merchant transmission: the impact of capacity
utilization rules"
2015/13, Slemrod, J.: "Tax administration and tax systems"
2015/14, Arqué-Castells, P.; Cartaxo, R.M.; García-Quevedo, J.; Mira Godinho, M.: "How inventor royalty
shares affect patenting and income in Portugal and Spain"
2015/15, Montolio, D.; Planells-Struse, S.: "Measuring the negative externalities of a private leisure activity:
hooligans and pickpockets around the stadium"
2015/16, Batalla-Bejerano, J.; Costa-Campi, M.T.; Trujillo-Baute, E.: "Unexpected consequences of
liberalisation: metering, losses, load profiles and cost settlement in Spain’s electricity system"
2015/17, Batalla-Bejerano, J.; Trujillo-Baute, E.: "Impacts of intermittent renewable generation on electricity
system costs"
2015/18, Costa-Campi, M.T.; Paniagua, J.; Trujillo-Baute, E.: "Are energy market integrations a green light for
FDI?"
2015/19, Jofre-Monseny, J.; Sánchez-Vidal, M.; Viladecans-Marsal, E.: "Big plant closures and agglomeration
economies"
2015/20, Garcia-López, M.A.; Hémet, C.; Viladecans-Marsal, E.: "How does transportation shape
intrametropolitan growth? An answer from the regional express rail"
2015/21, Esteller-Moré, A.; Galmarini, U.; Rizzo, L.: "Fiscal equalization under political pressures"
2015/22, Escardíbul, J.O.; Afcha, S.: "Determinants of doctorate holders’ job satisfaction. An analysis by
employment sector and type of satisfaction in Spain"
2015/23, Aidt, T.; Asatryan, Z.; Badalyan, L.; Heinemann, F.: "Vote buying or (political) business (cycles) as
usual?"
2015/24, Albæk, K.: "A test of the ‘lose it or use it’ hypothesis in labour markets around the world"
2015/25, Angelucci, C.; Russo, A.: "Petty corruption and citizen feedback"

Documents de Treball de l’IEB
2015/26, Moriconi, S.; Picard, P.M.; Zanaj, S.: "Commodity taxation and regulatory competition"
2015/27, Brekke, K.R.; Garcia Pires, A.J.; Schindler, D.; Schjelderup, G.: "Capital taxation and imperfect
competition: ACE vs. CBIT"
2015/28, Redonda, A.: "Market structure, the functional form of demand and the sensitivity of the vertical reaction
function"
2015/29, Ramos, R.; Sanromá, E.; Simón, H.: "An analysis of wage differentials between full-and part-time
workers in Spain"
2015/30, Garcia-López, M.A.; Pasidis, I.; Viladecans-Marsal, E.: "Express delivery to the suburbs the effects of
transportation in Europe’s heterogeneous cities"

Tax Systems Analysis
Copyright © 2022 FDOKUMEN