by C. W. Smith with a section on
69
SA(IR)-243 UNITED STATES DEPARTMENT OF THE INTERIOR GEOLOGICAL SURVEY SAUDI ARABIAN MISSION PROJECT REPORT 243 ANCIENT MINES OF THE FARAH GARAN AREA, SOUTHWESTERN SAUDI ARABIA by C. W. Smith with a section on RECONNAISSANCE GEOPHYSICAL EXPLORATION J. S. Geological Survey OPEN FILE REPORT 7f~4fS& This report is preliminary4* not been edited or reviewed fcr o o- u AW L°^! raUywlthGe ' loSi<>ai H. Richard Blan&andards or nomenclature PREPARED FOR DIRECTORATE GENERAL OF MINERAL RESOURCES MINISTRY OF PETROLEUM AND MINERAL RESOURCES JIDDAH, SAUDI ARABIA 1979
-
Upload
khangminh22 -
Category
Documents
-
view
1 -
download
0
Transcript of by C. W. Smith with a section on
SA(IR)-243
UNITED STATES DEPARTMENT OF THE INTERIOR
GEOLOGICAL SURVEYSAUDI ARABIAN MISSION
PROJECT REPORT 243
ANCIENT MINES OF THE FARAH GARAN AREA,
SOUTHWESTERN SAUDI ARABIA
by
C. W. Smith
with a section on
RECONNAISSANCE GEOPHYSICAL EXPLORATIONJ. S. Geological Survey
OPEN FILE REPORT 7f~4fS& This report is preliminary4* not been edited or reviewed fcr
o o- u AW L°^!raUywlthGe 'loSi<>ai H. Richard Blan&andards or nomenclature
PREPARED FOR
DIRECTORATE GENERAL OF MINERAL RESOURCES
MINISTRY OF PETROLEUM AND MINERAL RESOURCES
JIDDAH, SAUDI ARABIA
1979
U. S. GEOLOGICAL SURVEY
SAUDI ARABIAN PROJECT REPORT 243
ANCIENT MINES OF THE FARAH GARAN AREA,
SOUTHWESTERN SAUDI ARABIA
by
C. W. Smith
with a section on
RECONNAISSANCE GEOPHYSICAL EXPLORATION
by
H. Richard Blank
»» « «HW«^
U. S. Geological SurveyOPEN FIL2 RE "CRT
This report is ^rc n ' rr.inarr and has no i * -.; oditeu o- revievec Tor coiuonuity wiU: Q olcgical Survey standards or nomenclature
U.S. Geological Survey Jiddah, Saudi Arabia
1979
This report is preliminary and has not been edited or reviewed for conformity with U.S. Geological Survey standards and nomenclature.
CONTENTS
Page
ABSTRACT................................................. 1
INTRODUCTION............................................. 2
REGIONAL GEOLOGIC SETTING................................ 4
FARAH GARAN MINE .................................^....... 7
Introduction........................................ 7
Geology............................................. 8
Structure........................................... 9
Mineral deposits.................................... 10
Sulfide deposits ............................... 10
North workings............................ 11
Central workings.......................... 11
South workings............................ 12
Gold-quartz veins.............................. 12
Sampling of gossans and veins.................. 12
Sulfide deposits .......................... 13
Gold-quartz veins......................... 13
Rock sampling for trace metal analysis.............. 15
Conclusions and recommendations..................... 15
AL ASHYAB................................................ 18
Introduction........................................ 18
Geology............................................. 19
Structure........................................... 21
Alteration.......................................... 21
Metallization....................................... 22
Page
Rock sampling for trace metal analysis.............. 23
Copper......................................... 23
Zinc........................................... 23
Conclusions and recommendations..................... 26
AL ASHARFAT.............................................. 27
Introduction........................................ 27
Geology and structure............................... 27
Metallization....................................... 29
Assay results.................................. 29
Conclusions and recommendations..................... 30
LEJOURAH................................................. 30
Introduction........................................ 30
Geology............................................. 30
Structure and metallization......................... 32
Assay results.................................. 32
Conclusions and recommendations..................... 33
HEMAIR................................................... 33
Introduction........................................ 33
Geology............................................. 35
Structure, metallization, and alteration............ 35
Assay results.................................. 36
Conclusions and recommendations..................... 36
PRELIMINARY STUDIES OF THE HEMAIR-AL ASHARFAT REGION..... 36
Introduction........................................ 36
The Hemair-Ethel region............................. 37
Geology........................................ 37
Metallization and alteration................... 37
ii
Page
Rock sampling for trace metal analysis......... 38
Unnamed workings............................... 39
Ethel workings................................. 39
Assay results.................................. 39
Conclusions and recommendations................ 39
The East Al Ashyab area............................. 40
Geology........................................ 40
Assay results.................................. 40
Conclusions and recommendations................ 41
RECONNAISSANCE GEOPHYSICAL EXPLORATION................... 43
Introduction........................................ 4 3
Al Ashyab surveys................................... 4 3
Self-potential................................. 43
Results................................... 45
Turam.......................................... 4 7
Results................................... 47
Conclusions.................................... 49
Farah Garan surveys................................. 50
Self-potential................................. 50
Results ................................... 51
Turam.......................................... 5 3
Results................................... 54
Conclusions............................... 55
REFERENCES CITED......................................... 56
ILLUSTRATIONS
Figure 1. Index map of western Saudi Arabia showing
location of the Farah Garan area............ 3
iii
Page
Figure 2. Geologic map of the Farah Garan-Kutam area... 6
3. Geologic map of the Farah Garan ancient
mine.................................. Facing 8
4. Sample locality map, Farah Garan ancient
mine................................ Facing 12
5. Copper content of rock samples, Farah
Garan ancient mine.................. Facing 16
6. Zinc content of rock samples, Farah
Garan ancient mine.................. Facing 16
7. Vertical sections along proposed drill
holes FG 1, 2, 3, and 4, Farah Garan
ancient mine.............................. 17
8. Geologic map of Al Ashyab area.............. 20
9. Copper content of rock samples, Al Ashyab... 24
10. Zinc content of rock samples, Al Ashyab..... 25
11. Geologic and sample map of Al Asharfat...... 28
12. Geologic and sample map of Lejourah......... 31
13. Sketch geologic and sample map of Hemair.... 34
14. Geologic and sample map of the Hemair-
Asharfat region..................... Facing 38
15. Self-potential map, Jabal Al Ashyab area., in pocket
16. Turam reduced-amplitude equiratio map,
660 Hz, Jabal Al Ashyab area............ in pocket
17. Turam reduced-amplitude equiratio map,
220 Hz, Jabal Al Ashyab area............ in pocket
18. Turam equiphase map, 660 Hz, Jabal Al
Ashyab area............................. in pocketiv
Page
Figure 19. Turam equiphase map, 220 Hz, Jabal Al
Ashyab area............................. in pocket
20. Reduced-amplitude ratio and relative
phase angle profiles, line 17S,
Jabal Al Ashyab area.................... in pocket
21. Self-potential map, Farah Garan area...... in pocket
22. Turam reduced-amplitude equiratio map
and ratio profiles, 220 Hz, Farah
Garan area.............................. in pocket
23. Turam reduced-amplitude equiratio map and
ratio profiles, 660 Hz, Farah Garan area. . . in pocket
24. Turam equiphase map and phase profiles,
660 Hz, Farah Garan area................ in pocket
25. Turam equiphase map and phase profiles,
220 Hz, Farah Garan area................ in pocket
Table
Table 1. Semi-quantitative spectrographic analyses
of samples................................. 14
v
ANCIENT MINES OF THE FARAH GARAN AREA,
SOUTHWESTERN SAUDI ARABIA
by
C.W. Smith
ABSTRACT
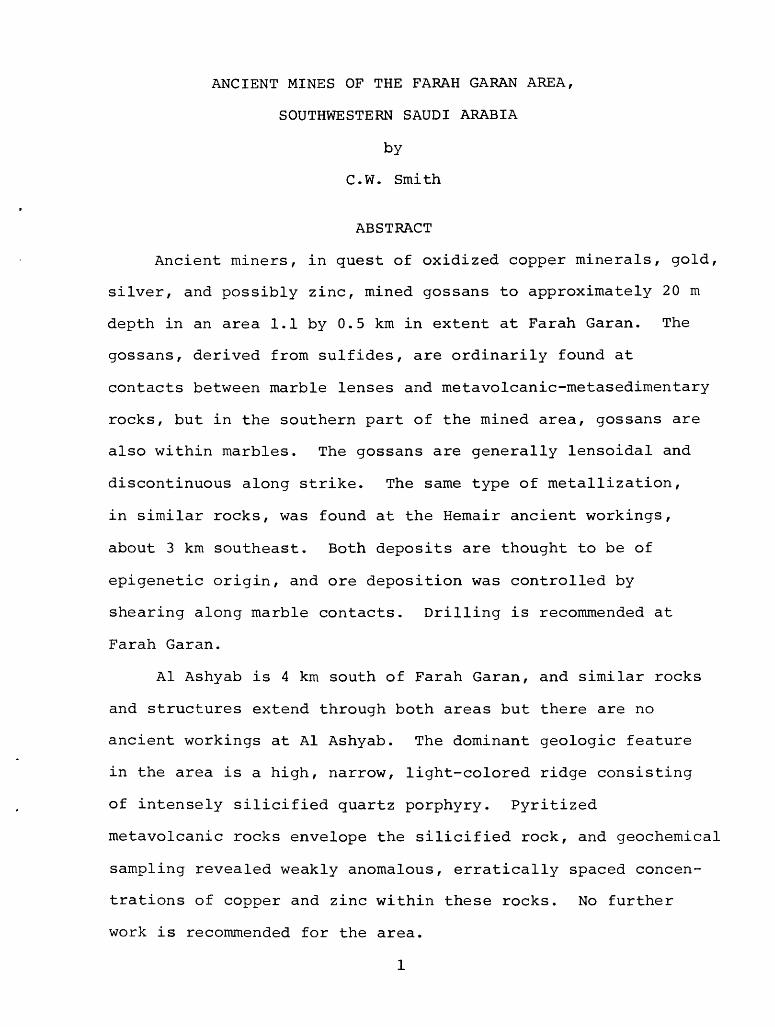
Ancient miners, in quest of oxidized copper minerals, gold,
silver, and possibly zinc, mined gossans to approximately 20 m
depth in an area 1.1 by 0.5 km in extent at Farah Garan. The
gossans, derived from sulfides, are ordinarily found at
contacts between marble lenses and metavolcanic-metasedimentary
rocks, but in the southern part of the mined area, gossans are
also within marbles. The gossans are generally lensoidal and
discontinuous along strike. The same type of metallization,
in similar rocks, was found at the Hemair ancient workings,
about 3 km southeast. Both deposits are thought to be of
epigenetic origin, and ore deposition was controlled by
shearing along marble contacts. Drilling is recommended at
Farah Garan.
Al Ashyab is 4 km south of Farah Garan, and similar rocks
and structures extend through both areas but there are no
ancient workings at Al Ashyab. The dominant geologic feature
in the area is a high, narrow, light-colored ridge consisting
of intensely silicified quartz porphyry. Pyritized
metavolcanic rocks envelope the silicified rock, and geochemical
sampling revealed weakly anomalous, erratically spaced concen
trations of copper and zinc within these rocks. No further
work is recommended for the area.
1
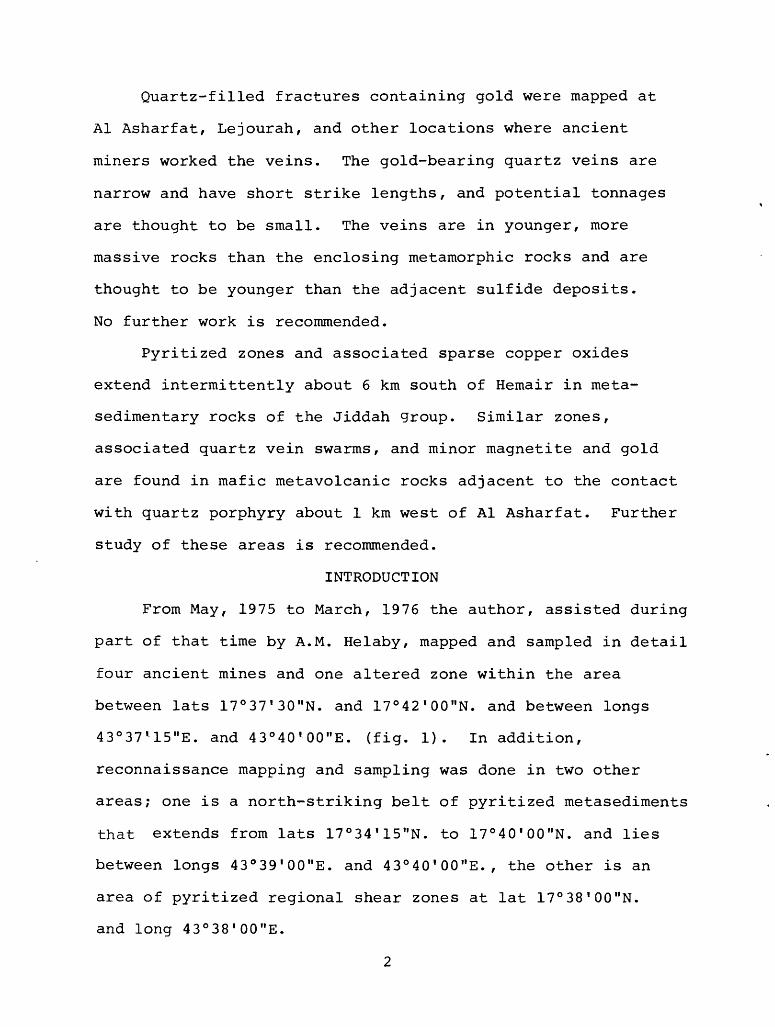
Quartz-filled fractures containing gold were mapped at
Al Asharfat, Lejourah, and other locations where ancient
miners worked the veins. The gold-bearing quartz veins are
narrow and have short strike lengths, and potential tonnages
are thought to be small. The veins are in younger, more
massive rocks than the enclosing metamorphic rocks and are
thought to be younger than the adjacent sulfide deposits.
No further work is recommended.
Pyritized zones and associated sparse copper oxides
extend intermittently about 6 km south of Hemair in meta-
sedimentary rocks of the Jiddah group. Similar zones,
associated quartz vein swarms, and minor magnetite and gold
are found in mafic metavolcanic rocks adjacent to the contact
with quartz porphyry about 1 km west of Al Asharfat. Further
study of these areas is recommended.
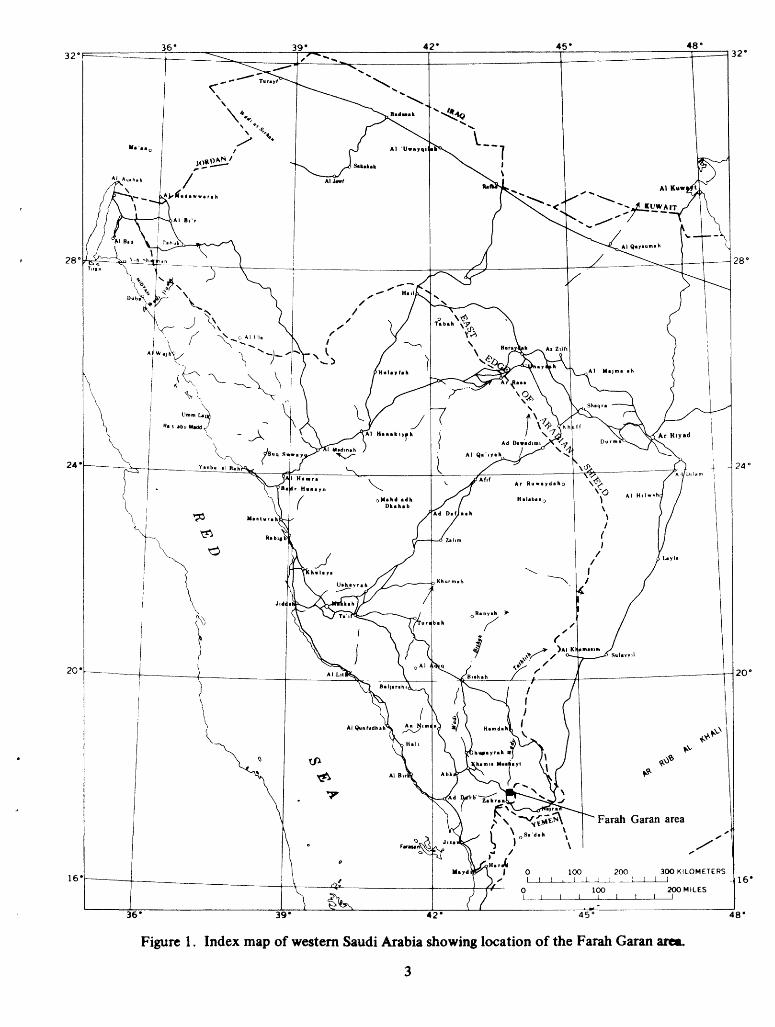
INTRODUCTION
From May, 1975 to March, 1976 the author, assisted during
part of that time by A.M. Helaby, mapped and sampled in detail
four ancient mines and one altered zone within the area
between lats 17°37 I 30"N. and 17°42'00"N. and between longs
43°37 1 15"E. and 43°40'00"E. (fig. 1). In addition,
reconnaissance mapping and sampling was done in two other
areas; one is a north-striking belt of pyritized metasediments
that extends from lats 17°34'15"N. to 17 0 40'00"N. and lies
between longs 43°39'00"E. and 43°40'00"E., the other is an
area of pyritized regional shear zones at lat 17°38'00"N.
and long 43°38 I 00"E.
2
32° q 2'
20'-____
16
36* 39' 42* 45 e
Figure 1. Index map of western Saudi Arabia showing location of the Farah Garan area.
3
48°
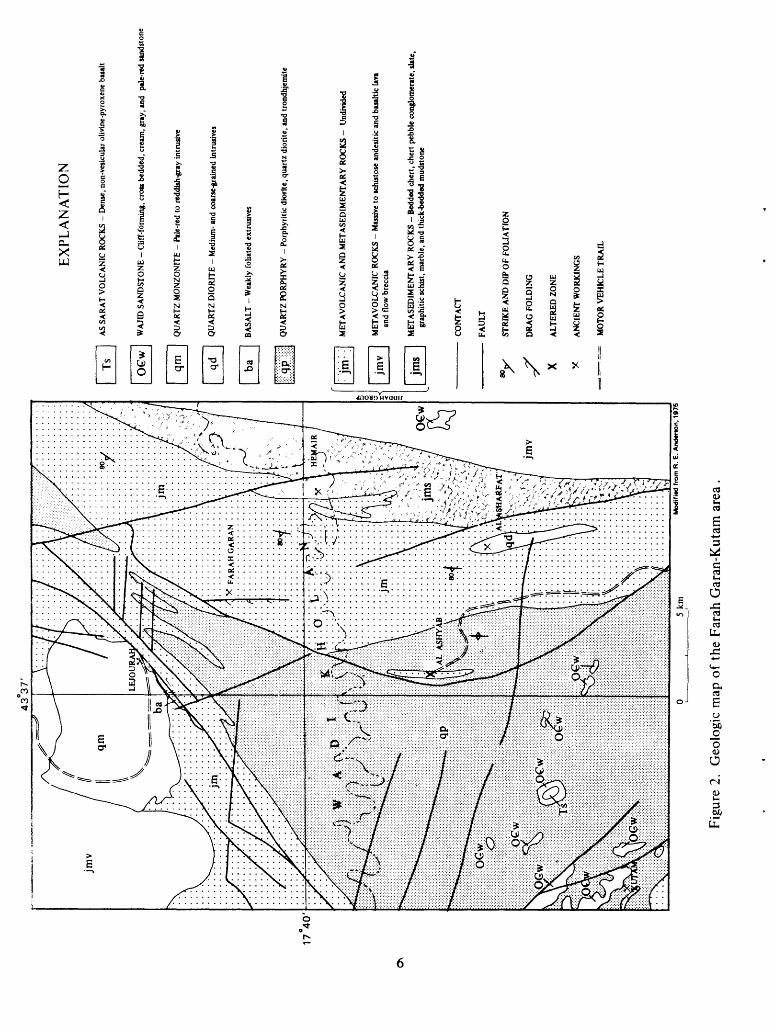
R.E. Anderson, U.S. Geological Survey (USGS), mapped the geol
ogy of the Mayza quadrangle, including the Farah Garan area, in
1974. He re-discovered the ancient workings at Farah Garan
and recognized the altered zone at Al Ashyab. In his report
the Farah Garan area was given the name of Wadi Al Maslulah
area (Anderson, 1978). Rock unit names assigned by
Anderson have been retained for the most part in the present
report, and although we are not in complete agreement on the
origin of the large body of quartzose rock (qp) which covers
much of the study area (fig. 2), the name of quartz porphyry
has been retained for the sake of simplicity.
H.R. Blank and USGS geophysical crew conducted ground
geophysical surveys, using Turam electromagnetic and self-
potential methods, during the period November, 1975 to March,
1976. Their findings are reported in the section of this report
covering geophysical surveys.
This investigation is one of a series of mineral deposit
studies conducted by the U.S. Geological Survey, made in
accordance with a work agreement with the Ministry of
Petroleum and Mineral Resources, Kingdom of Saudi Arabia.
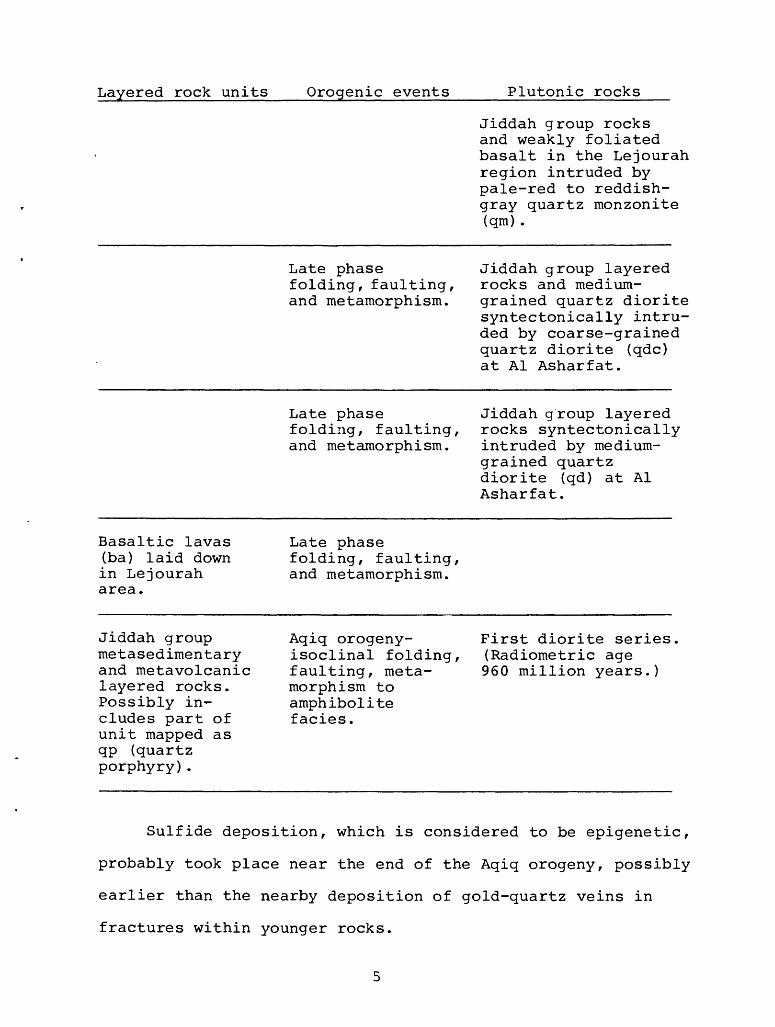
REGIONAL GEOLOGIC SETTING
The layered rocks of the area, the erogenic events that
affected them, and the plutonic rocks associated with or that
followed orogenies, are summarized in the following hypothetical
sequence of geologic events in the Farah Garan area, from
oldest at the bottom to youngest at the top. Data are in part
from Greenwood and others (1976).
Layered rock units Orogenic events Plutonic rocks
Jiddah group rocks and weakly foliated basalt in the Lejourah region intruded by pale-red to reddish- gray quartz monzonite (qm) .
Late phase folding, faulting, and metamorphism.
Jiddah group layered rocks and medium- grained quartz diorite syntectonically intru ded by coarse-grained quartz diorite (qdc) at Al Asharfat.
Late phase folding, faulting, and metamorphism.
Jiddah group layered rocks syntectonically intruded by medium- grained quartz diorite (qd) at Al Asharfat.
Basaltic lavas (ba) laid down in Lejourah area.
Late phase folding, faulting, and metamorphism.
Jiddah group metasedimentary and metavolcanic layered rocks. Possibly in cludes part of unit mapped as qp (quartz porphyry).
Aqiq orogeny- isoclinal folding, faulting, meta morphism to amphibolite facies.
First diorite series. (Radiometric age 960 million years.)
Sulfide deposition, which is considered to be epigenetic,
probably took place near the end of the Aqiq orogeny, possibly
earlier than the nearby deposition of gold-quartz veins in
fractures within younger rocks.
43
37'
EX
PLA
NA
TIO
N
AS
SAR
AT
VO
LC
AN
IC R
OC
KS
- D
ense
, non
-ves
icul
ar o
livin
e-py
roxe
ne b
asal
t
WA
JID
SA
ND
STO
NE
- C
liff-
form
ing,
cro
ss b
edde
d, c
ream
, gra
y, a
nd
pale
-red
san
dsto
ne
17 4
0'
QU
AR
TZ
MO
NZ
ON
ITE
- P
ale-
red
to r
eddi
sh-g
ray
intr
usiv
e
qd
QU
AR
TZ
DIO
RIT
E -
Med
ium
- an
d co
arse
-gra
ined
int
rusi
ves
"
FAR
AH
GA
RA
N
. .
.
ha
BA
SAL
T -
Wea
kly
folia
ted
extr
usiv
es
qp g
:;:
QU
AR
TZ
PO
RPH
YR
Y -
Por
phyr
itic
dior
ite,
qua
rtz
dior
ite, a
nd t
rond
hjem
ite
MET
AV
OLC
AN
1C A
ND
ME
TA
SED
IME
NT
AR
Y R
OC
KS -
Und
ivid
ed
ME
TA
VO
LC
AN
IC R
OC
KS - M
assi
ve t
o sc
hist
pse
ande
sitic
and
bas
ahk
lava
an
d fl
ow b
recc
ia
ME
TA
SED
IME
NT
AR
Y R
OC
KS - B
edde
d ch
ert,
cher
t pe
bble
con
glom
erat
e, s
late
, gr
aphi
tic s
chis
t, m
arbl
e, a
nd th
ick-
bedd
ed m
udst
one
CO
NT
AC
T
FAU
LT
STR
IKE
AN
D D
IP O
F FO
LIA
TIO
N
y
DR
AG
FO
LD
ING
X
AL
TE
RE
D Z
ON
E
X
AN
CIE
NT
WO
RK
ING
S
MO
TO
R V
EH
ICL
E T
RA
IL
5km
Mod
ified
fro
m R
. E
. A
nd
mo
n.
1975
Figu
re 2
. G
eolo
gic
map
of
the
Fara
h G
aran
-Kut
am a
rea
.

FARAH GARAN MINE
Introduction
The ancient mining, milling, and smelting site of Farah
Garan is at lat 17°41'00"N. / long 43°38'15"W. at an elevation
of about 2000 m. The ancient workings were re-discovered in
1974 by R.E. Anderson, and he and T.H. Kiilsgaard later
examined the area and sampled mineralized outcrops.
Excavations by the ancient miners consisting of open cuts
that average about 2 m in width extend discontinuously for
1.1 km (fig. 3). Some of the open cuts may have reached
depths in excess of 20 m along ore shoots. About 5000 tons of
slag is in piles near the north end of the mapped area.
The mine area is drained by two tributaries of Wadi Kholan,
and local relief is as much as 100 m. The northern part is
only moderately rugged and drained by a tributary that flows
west. The southern part is drained by a tributary that flows
south and has deeply incised the rocks of the region so that
access is difficult even on foot.
In May, 1975, an area 1.1 by 0.5 km was mapped by plane
table at a scale of 1:2000 by the author and A.M. Helaby. A
topographic base of the same area was compiled photogrammetrically
by C.M. Robins. Geochemical rock chip samples were taken at
10 m intervals on lines 50 m apart. Color photographs on a
scale of about 1:12,000 and 1:20,000 aided in mapping.
Geology
The Farah Garan deposit is in metavolcanic and
metasedimentary rocks of the Jiddah group. The western part
of the mapped area is underlain by metavolcanic rocks of
intermediate composition which contain marble lenses, whereas
rocks in the eastern part are principally calcareous meta-
sediments containing locally distributed graphitic schists
(fig. 3). Metasediments are in contact with intrusive mafic
volcanic rock of probable andesitic composition on the eastern
edge of the mapped area.
Metavolcanic rocks are mainly green-gray quartz-chlorite
schist that is interlayered with subordinate, more mafic,
dark-green, feldspar-bearing schist. The quartz-chlorite
schist, which is probably of dacitic composition, is
characterized by clear quartz crystals as much as 3 mm in
diameter, commonly shows good slaty cleavage, and is not
obviously layered. The mafic, feldspar-bearing schist contains
layers of volcanic breccia and massive lava/ which are locally
interlayered with volcanic rocks of intermediate composition
and with metasedimentary rocks. Andesite dikes intrude the
metasedimentary rocks near the central workings. Sills or
layers of a fine-grained rock of intermediate composition
containing blue-gray quartz crystals (qp, fig. 2) were noted
locally on both the eastern and western edges of the deposit
but were not mapped separately. These rocks are undoubtedly
outliers of the large mass of quartz porphyry that crops out
a few hundred meters west of the ancient workings.
8
Metasedimentary rocks include marble, calcareous siltstones,
graywacke and graphitic schists, all of which are interlayered
with metavolcanic rocks. The marble is fine grained,
brown-weathering, and is in beds a few centimeters to more than
20 m thick. The layers of graphitic schist are commonly less
than 5 m thick and are lensoidal. The various layers of graphite
schist range from slightly graphitic to almost pure graphite.
All rocks have been metamorphosed to greenschist or
amphibolite regional metamorphic facies. Chlorite and white
mica form a well developed foliation that masks much of the
original texture in all rocks, metasedimentary and metavolcanic
alike. Typically, these rocks in thin section show strongly
foliated fine-grained chlorite, epidote, white mica, and
scattered ilmenite.
Structure
All rocks in the area were intensely folded isoclinally
and now strike north and dip steeply west. Lenses of more
competent marble were sheared only along their contacts.
Later movement along a N.20°E.-striking regional fault caused
local drag folding around fold axes that plunge 60° and bear
S.40-60°E. Rotation and strike-slip displacement along the
same fault then caused metavolcanic rocks to the west, which
strike N.20°E., to be faulted against north-striking meta
sedimentary rocks on the east. A system of faults striking
N.40-60°W. are the latest structures in the immediate area.
These faults were later invaded by aplite dikes.
Mineral deposits
Mineral deposits at Farah Garan are of two types:
zinc-copper sulfides and associated gold and silver along
sheared contacts adjacent to marble lenses; and gold-quartz
veins in shear zones not associated with marble lenses. Both
types are thought to be of epigenetic origin, but age
relationships between the two are not clear. The sulfide
deposits are far more extensive.
Sulfide deposits
No sulfides were seen during the examination, except for
minor pyrite found in quartz. All sulfides near the surface
have been oxidized to form geothite, hematite, manganese
oxides, copper carbonate, and zinc silicate within siliceous,
cellular gossans along sheared contacts of marble lenses. In
places, sulfides locally replaced marble and have undergone
oxidation to form finely cellular, slightly siliceous
medium-brown to maroon gossans composed mainly of iron
oxides. Some small areas of gossan are heavily stained by
copper oxides. Zinc minerals are ordinarily not visible in
the field but assays of gossans indicate that zinc is ubiquitous
Microscopic and X-ray diffraction studies of gossans, made by
the USGS laboratories in Jiddah, have detected hemimorphite
(H2 Zn 2 si°5) ' Appreciable gold and silver were found in some
of the gossan samples but the mineral form or association of
these metals is not known. Lead minerals were not observed,
even though some samples contained moderate amounts of lead.
10
Ancient workings in sulfide gossans are grouped in three
zones, mainly the northern, central, and southern part of the
area (fig. 3).
North workings.--Pits and open stopes have been sunk on
gossans to depths as much as 20 m on both contacts of a marble
lens that extends about 600 m N.20°E. and dips 65°W. The
stopes average about 2 m in width and follow gossans averaging
0.4 m in width. In some stopes, two or more gossans lie
parallel, but the average width of mineralized rock on either
contact probably does not exceed 2.0 m. Small workings within
the marble lens reveal locally gossanized zones along fractures,
The central part of the marble lens has undergone
fracturing, cavity filling, and partial replacement by milky
quartz and calcite, and large parts of the lens are composed
of these minerals. Quartz and calcite contain very minor
amounts of cubic pyrite and no gold or silver. At least some
of the quartz and calcite was deposited prior to the sulfides,
as is revealed by the cross-cutting relationship of sulfide
gossans to quartz.
The marble lens pinches and becomes discontinuous to the
southwest and is accompanied by other lenses not exceeding 2 m
in width.
Central workings. The largest stope in the central
workings is 60 m long, 6 m wide, and 5 m deep, and reveals
several discontinuous gossans in sheared metasedimentary rocks
at the west contact of a marble lens. Other shallower, rubble-
filled stopes on strike to the north indicate a sulfide zone,
11
which possibly extends 250 m in that direction. The marble
lens pinches about 50 m south of the large stope, but
quartz-filled shears continue south to an inclined shaft
that shows copper-stained quartz. The entire sulfide zone is
thus about 450 m long. Parallel marble lenses that have
sheared, gossanized contacts indicate possible sulfide
metallization intermittently across a 100 m width in this area.
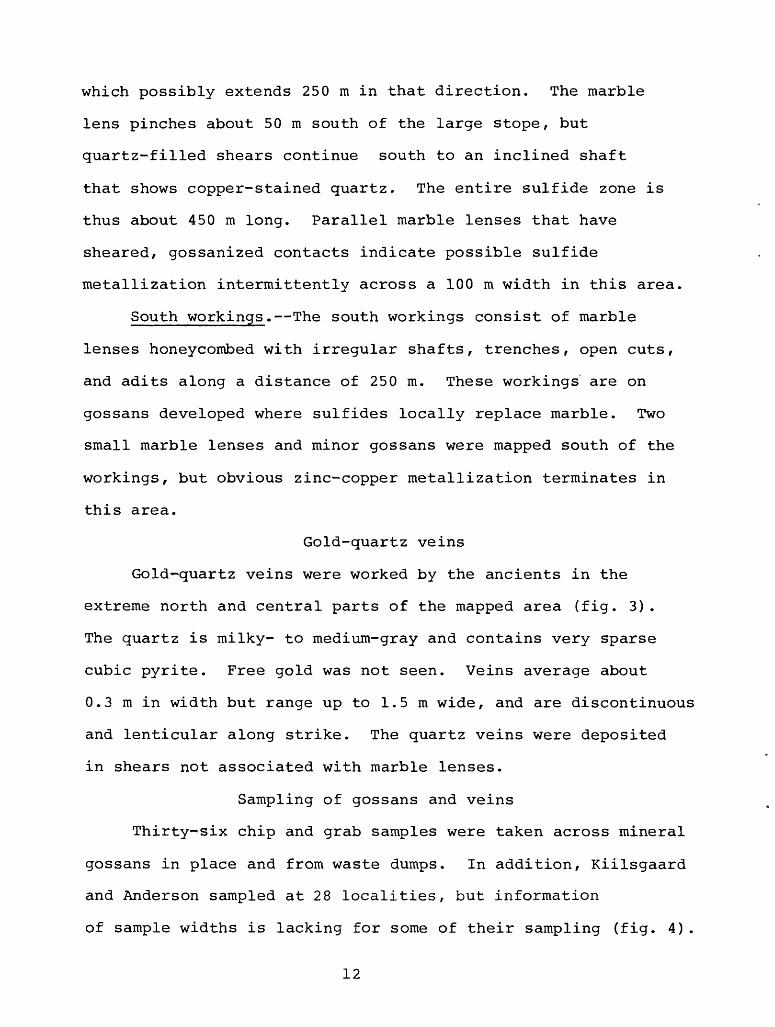
South workings. The south workings consist of marble
lenses honeycombed with irregular shafts, trenches, open cuts,
and adits along a distance of 250 m. These workings are on
gossans developed where sulfides locally replace marble. Two
small marble lenses and minor gossans were mapped south of the
workings, but obvious zinc-copper metallization terminates in
this area.
Gold-quartz veins
Gold-quartz veins were worked by the ancients in the
extreme north and central parts of the mapped area (fig. 3).
The quartz is milky- to medium-gray and contains very sparse
cubic pyrite. Free gold was not seen. Veins average about
0.3 m in width but range up to 1.5 m wide, and are discontinuous
and lenticular along strike. The quartz veins were deposited
in shears not associated with marble lenses.
Sampling of gossans and veins
Thirty-six chip and grab samples were taken across mineral
gossans in place and from waste dumps. In addition, Kiilsgaard
and Anderson sampled at 28 localities, but information
of sample widths is lacking for some of their sampling (fig. 4).
12
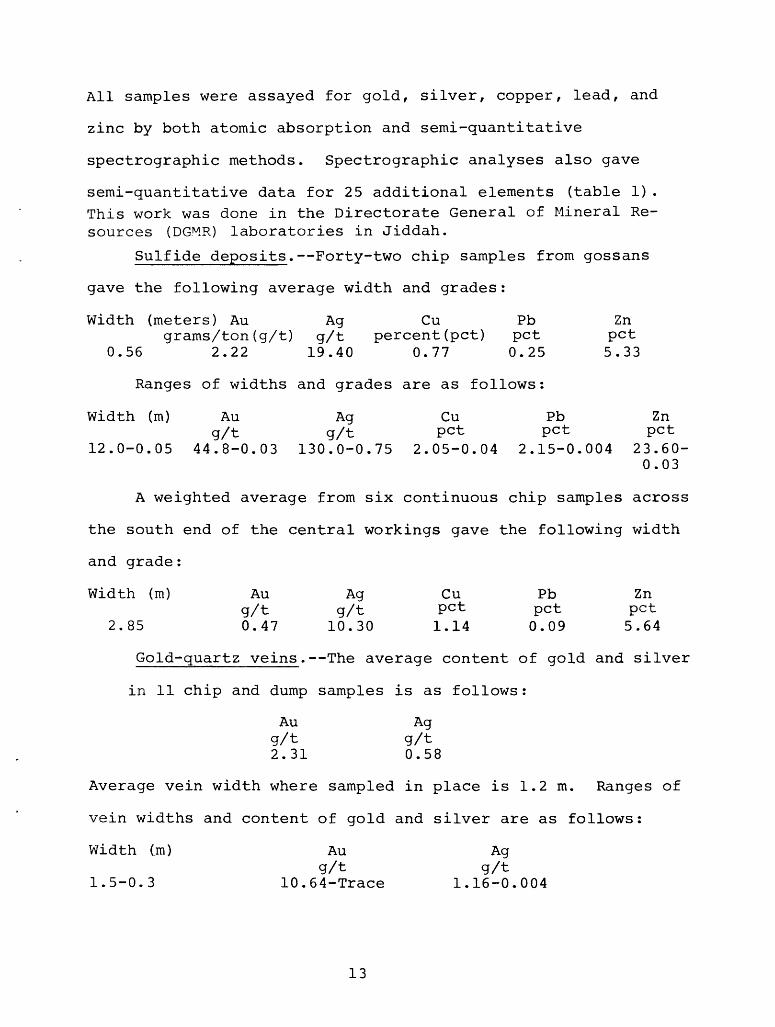
All samples were assayed for gold, silver, copper, lead, and
zinc by both atomic absorption and semi-quantitative
spectrographic methods. Spectrographic analyses also gave
semi-quantitative data for 25 additional elements (table 1). This work was done in the Directorate General of Mineral Re sources (DG.MR) laboratories in Jiddah.
Sulfide deposits. Forty-two chip samples from gossans
gave the following average width and grades:
Width (meters) Au Ag Cu Pb Zngrams/ton(g/t) g/t percent(pet) pet pet
0.56 2.22 19.40 0.77 0.25 5.33
Ranges of widths and grades are as follows:
Width (m) Au Ag Cu Pb Zn g/t g/t pet pet pet
12.0-0.05 44.8-0.03 130.0-0.75 2.05-0.04 2.15-0.004 23.60-0.03
A weighted average from six continuous chip samples across
the south end of the central workings gave the following width
and grade:
Width (m) Au Ag Cu Pb Zng/t g/t Pct pet pet
2.85 0.47 10.30 1.14 0.09 5.64
Gold-quartz veins. The average content of gold and silver
in 11 chip and dump samples is as follows:
Au Agg/t g/t2.31 0.58
Average vein width where sampled in place is 1.2 m. Ranges of
vein widths and content of gold and silver are as follows:
Width Cm) Au Agg/t g/t
1.5-0.3 10.64-Trace 1.16-0.004
13
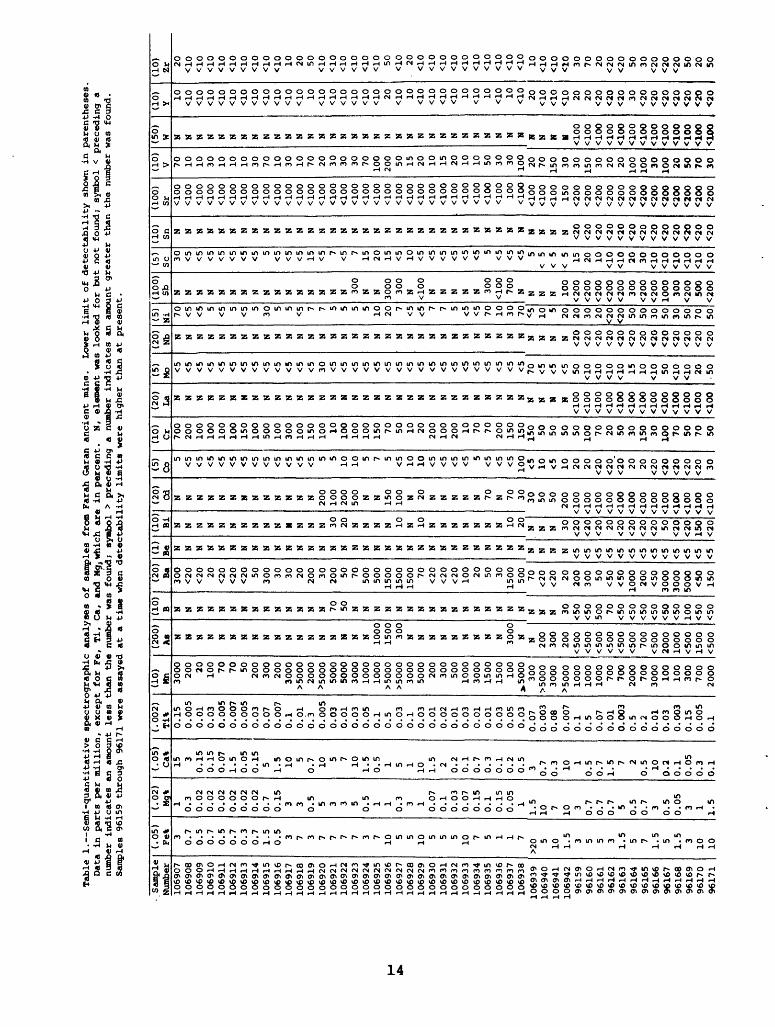
Table
1. Semi-quantitative sp
ectr
ographic analyses of
sa
mple
s from Farah Garan ancient
mine.
Lower
limit
of detectability
shown
in p
aren
thes
es.
Data in
pa
rts
per
mill
ion,
except for
Fe,
Ti,
Ca,
and
Mg, which are
in per
cent
. N, element
was
look
ed fo
r bu
t not
foun
d; sy
mbol
< pr
eced
ing
a number in
dica
tes
an am
ount
le
ss than the
number was
foun
d; sy
mbol
> pr
eced
ing
a number in
dica
tes
an amount
grea
ter
than the
numb
er was
foun
d.
Samples
96159
through
96171
were as
saye
d at a
time wh
en de
tect
abil
ity
limi
ts we
re higher than at
pr
esen
t.
Sa
mple
Nu
mber
106907
1069
0810
6909
106910
1069
1110
6912
1069
1310
6914
106915
106916
1069
1710
6918
1069
1910
6920
1069
2110
6922
1069
2310
6924
106925
1069
26106927
1069
2810
6929
1069
30106931
1069
3210
6933
1069
3410
6935
1069
36106937
106938
1069
3910
6940
1069
41106942
96159
9616
096161
96162
96163
96164
96165
96166
96167
96168
96169
96170
96171
(.05)
Fe% 3
0.7
0.5
0.7
0.5
0.7
0.3
0.7
1.5
0.5 3 7 3 7 7 7 7 3 7 10
5 5 10 5 5 510 7 5 1 1 7
>20 510 1.
5 3 5 5 31.5 5 7
1.5 5
1.5 3
10 10
(.02)
Mg%
10.3
0.02
0.02
0.02
0.02
0.02
0.02
0.7
0.15 3 3 0.5 5 3 3 5
0.5 1 1 0.3 3 1 0.07
0.1
0.03
0.07
0.15
0.1
0.15
0.05 1
1.5
10 7 103 0.7
0.7
0.7 5 0.5
0.7 3 0.5
0.05 3 1
1.5
(.05)
Ca%
15 30.15
0.15
0.07
1.5
0.05
0.15 5 1.5 105
0.7 105 710 1.5
0.5 1 5 1
10 1.5 2 0.2
0.1
0.7
0.3
0.1
0.2
0.5
3 0.7
0.3 101
0.5
0.7
1.5 7 2
0.5 10
0.2
0.1
0.05
0.3
0.1
(.002)
Ti%
0.15
0.005
0.01
0.03
0.005
0.007
0.005
0.03
0.07
0.007
0.1
0.01
0.3
0.005
0.03
0.01
0.03
0.05
0.1
0.5
0.03
0.1
0.03
0.01
0.02
0.01
0.03
0.01
0.01
0.03
0.05
0.03
0.07
0.003
0.08
0.00
70.
10.
50.07
0.01
0.00
30.5
0.2
0.01
0.03
0.003
0.15
0.005
0.1
(10)
Mn 3000 200 20 100 70 70 50
200
300
200
3000
>500
020
00>500
050
0050
0030
0010
0010
00>5000
>5000
3000
5000 200
300
500
1000
3000
1500
1500 100
>5000
300
>5000
3000
>500
010
0010
0010
00 700
700
2000 700
3000 100
100
300
700
2000
(200)
As N N N N N N N N N N N N N N N N N N 1000
1500 300
N N N N N N N N N 3000
N N 200
300
200
<500
<500
<500
<500
<500
<500 700
<500
2000
1000
<500
1500
<500
(10)
B N N N N N N N N N N N N N N 70 50 N N N N N N N N N N N N N N N N N N N 30<50
<50
500 70
<50
<50
<50
<50
<50
<50
100
<50
<50
(20)
Ba 300
<20
<20 20
<20
<20
<20 50
300 30 30 20 200 30 200 50 70 500
500
1500
1500
1500 70
<20
<20
<20
100 20 50 30
1500 500
70<20
<20 20
200
300 50
<50
<50
1000 200
<50
3000
3000
5000
<50
150
(1)
Be N N N N N N N N N N N N N N N N N N N N N N N N N N N N N N N N N N N N <5 <5 <5 <5 <5 <5 <5 <5 <5 <5 <5 <5 <5
(10)
Bi N N N N N N N N N N M N N N 30
20 N N N N 10N 10 N N N N N N N 10
20
N N N 30<20
<20
<20 20
<20
<20
<20
<20 50
<20
<20
150
<20
(20)
Cd N N N N N N N N N N N N N200
100
200
500N N 150
100 N 20 N N N N N 70 N 70 30 30 50 50
200
<100
aOO
aOO
<100
<100
<100
aoo
aOO
aoo
aoo
aoo
aoo
aoo
(5)
Co5
<5 <5 <5 <5 <5 <5 <5 <5 <5 <5 <5 <55 5
10 105 7 5
<5 10 10 <5 <5 <5 <55
<5 <5 <5 100
<5 10 <5 10 20 20<20
<20
<20~ 20 20
<20
<20
<20
<20
<20 30
(10)
Cr 700
200
100
100
100
100
150
100
500
100
300
100
150
100 10 100
100
100
150 70 50 10 20 200
100
200 10 70 70 200
150
150
150 50 50 50 50
100 70 20 50 30 150 30
100 70 50 70 50
(20)
La N N N N N N N N N N N N N N N N N N N N N N N N N N N N N N N N N N N N
<100
<100
<100
<100
<100
<100
<100
<100
<100
<100
<100
<100
<100
(5)
Mo<5 <5 <5 <5 <5 <5 <5 <5 <5 <5 <5 <5 <5 30 <5 <5 <5 <5 <5 <5 <5 <5 <5 <5 <5 <5 <5 <5 <5 <5 <5 <5 70 <5 <5 <5 50
<10
<10
<10
<10 15 10
<10 50
<10
<10 20 ^50
(20)
Nb N N N N N N N N N N N N N N N N N N N N N N N N N N N N N N N N N N N N <20
<20
<20
<20
<20
<20
<20
<20
<20
<20
<20
<20
<20
(5)
Ni70 <5 <55
<55
<55
305 5
<5 7 7 5 5 5 510 20 7 <5 <57 7 5
<5 <5 70 10 30 70 <5 105
20 20 30 20 <20
<20 50 50 30 50 30 50 70 50
(100
) Sb N N N N N N N N N N N N N N N N 30
0N N 3000 300
N <100 N N N N N 300
aoo
700
N N N N 100
<200
<200
<200
<200
<200 300
<200
<200
1000 300
<200 500
<200
(5)
Sc30 <5 <5 <5 <5 <5 <5 <55
<5 <5 <5 15 <57 <57 15 20 15 <5 10 <5 <5 <5 <5 <5 <55
<5 <5 <5 5<
5<
5<
5 15 20 10 ao
<10 20 30
<10
<10
<10
<10
<10
<10
(10)
Sn N N N N N N N N N N N N N N N N N N N N N N N N N N N N N N N N N N N N <20
<20
<20
<20
<20
<20
<20
<20
<20
<20
<20
<20
<20
(100)
Sr aoo
aoo
aoo
aoo
aoo
<100
<100
<100
aoo
aoo
aoo
<100
aoo
aoo
<100
aoo
aoo
aoo
aoo
aoo
aoo
aoo
aoo
aoo
aoo
aoo
aoo
aoo
aoo
aoo
100
aoo
<100
aoo
aoo
150
<200
<200
<200
<200
<200
<200
<200
<200
<200
<200
<200
<200
<200
(10)
V 70 10 10 30 10 10 10 30 70 10 30 10 70 20 30 30 30 70 100
200 50 15 20 10 15 20 10 10 50 30 30
100
20 70 150 30 30 150 30 20 20
100
100 30 100 20 50 70 30
(50)
H N N N N N N N N N N N N N N N N N N N N N N N N N N N N N N N N N N N M <100
aoo
aoo
aoo
<100
<100
<100
<100
<100
<100
<100
<100
<100
(10) y 10 ao ao ao
<10
<10
ao ao
<10
ao ao
ao 10 ao ao
ao ao ao ao 20 ao 10 ao ao ao ao 10 ao 10 ao 10 ao 20
<10
<10
<10 20 20
<20
<20
<20 30 <20
<20
<20
<20
<20
<20
<20
(10)
Zr20
<10
ao ao
<10
<10
ao <10
<10
<10 10 20 50 ao
<10
<10
ao <10
<10 50
<10
- 20 ao ao
ao ao ao ao
<10
<10
<10
<10
10<10
<10
<10 30 70 20
<20
<20 50 30
<20
<20
<20 50 20 50
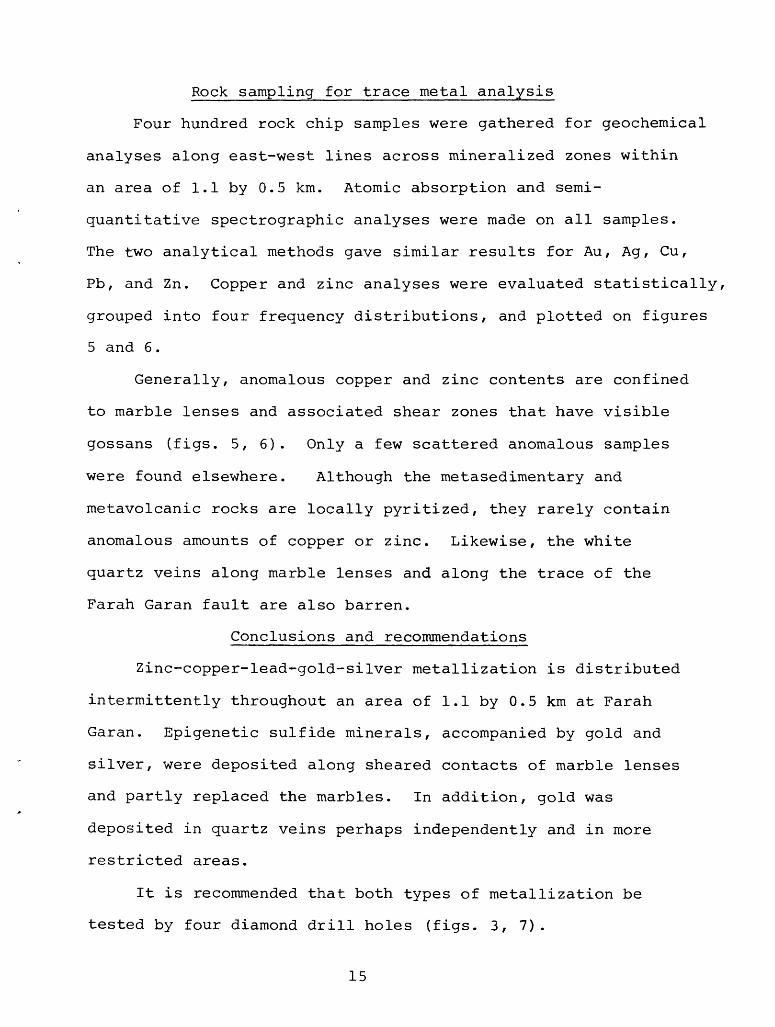
Rock sampling for trace metal analysis
Four hundred rock chip samples were gathered for geochemical
analyses along east-west lines across mineralized zones within
an area of 1.1 by 0.5 km. Atomic absorption and semi-
quantitative spectrographic analyses were made on all samples.
The two analytical methods gave similar results for Au, Ag, Cu,
Pb, and Zn. Copper and zinc analyses were evaluated statistically,
grouped into four frequency distributions, and plotted on figures
5 and 6.
Generally, anomalous copper and zinc contents are confined
to marble lenses and associated shear zones that have visible
gossans (figs. 5, 6). Only a few scattered anomalous samples
were found elsewhere. Although the metasedimentary and
metavolcanic rocks are locally pyritized, they rarely contain
anomalous amounts of copper or zinc. Likewise, the white
quartz veins along marble lenses and along the trace of the
Farah Garan fault are also barren.
Conclusions and recommendations
Zinc-copper-lead-gold-silver metallization is distributed
intermittently throughout an area of 1.1 by 0.5 km at Farah
Garan. Epigenetic sulfide minerals, accompanied by gold and
silver, were deposited along sheared contacts of marble lenses
and partly replaced the marbles. In addition, gold was
deposited in quartz veins perhaps independently and in more
restricted areas.
It is recommended that both types of metallization be
tested by four diamond drill holes (figs. 3, 7).
15
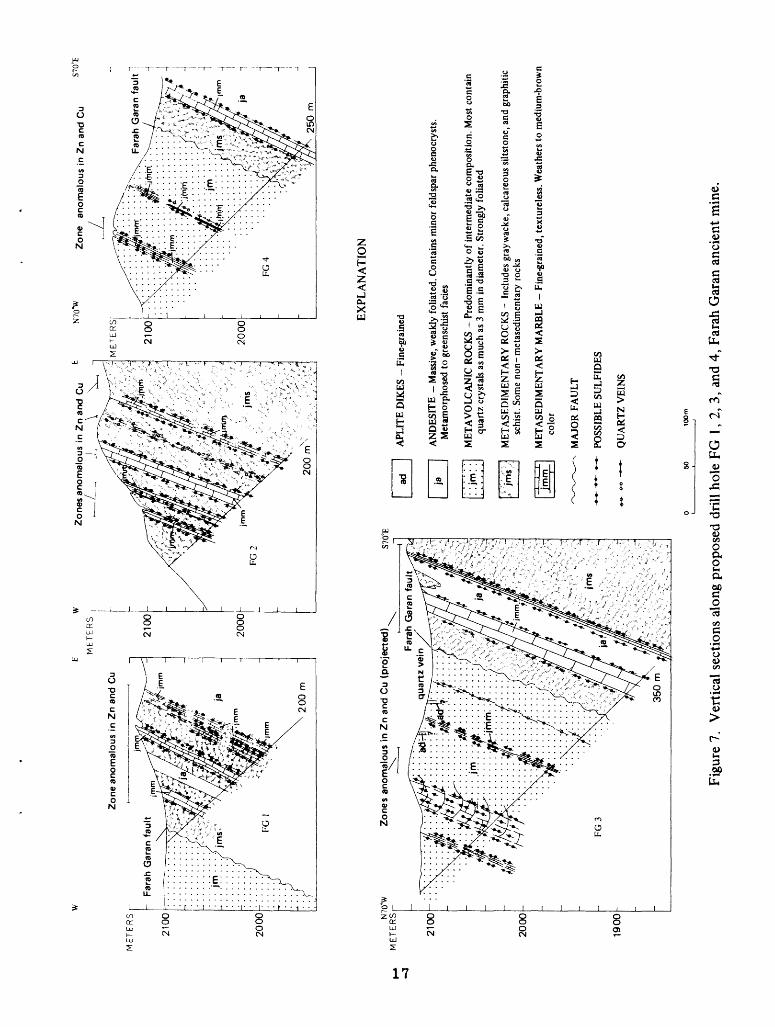
Drill hole FG-1 is planned to intersect the downward
projection of gossans exposed in the large central workings.
In addition the hole will explore at depth a zone 100 m wide
where other gossans were mapped at contacts with marble lenses;
samples of these rocks contain anomalous amounts of zinc and
copper, and geophysical studies found a 400 millivolt, negative,
self-potential anomaly. Proposed length of the drill hole is
200 m.
FG-2 is planned to intersect the downward projection of
copper-zinc metallization found at the south workings and also
to explore the continuation at depth of other gossans associated
with marble lenses across a zone 100 m wide. The south
extension of the self-potential anomaly would also be explored.
In addition, this drill hole may provide information concerning
the shape and plunge of folded marble lenses and their effect
on sulfide deposition. Its proposed depth is 200 m.
FG-3 is laid out to intersect drag-folded marble lenses
locally replaced by sulfide. In addition, it would explore the
projection of other thin marble lenses and a gold-quartz vein
worked by the ancients. Geophysical studies outlined a
negative self-potential anomaly trending along the hanging
wall of the Farah Garan fault. The drill hole would intersect
this anomalous zone and penetrate the Farah Garan fault. If
continued to 350-400 m depth, it would also explore
metallization projected 250 m below the surface at the central
workings.
16
Zo
ne
an
om
alo
us
in Z
n a
nd C
u
ME
TE
RS
r
21
00
20
00
-
E w
ME
TE
RS
2100-
Zo
ne
s a
no
ma
lou
s in
Zn a
nd C
uN
70°W
20
00
Zo
ne
a
no
ma
lou
s in
Zn
and
Cu
7 M
ET
ER
S
21
00
20
00
-
N7Q
°W
ME
TE
RS
p
21
00
-
2000-
19
00
Zo
ne
s anom
alo
us
in Z
n a
nd C
u (p
roje
cted)
Far
ah G
aran
fa
ult
qu
art
z ve
in
EX
PLA
NA
TIO
N
AN
DES
ITE
Mas
sive,
wea
kly
folia
ted.
Con
tain
s m
inor
fel
dspa
r ph
enoc
ryst
s. M
etam
orph
osed
to g
reen
schi
st f
acie
s
ME
TA
VO
LC
AN
IC R
OC
KS
- P
redo
min
antly
of
inte
rmed
iate
com
posi
tion.
Mos
t co
ntai
n
ad
APL
ITE
DIK
ES - F
ine-
grai
ned
quar
tz c
ryst
als
as m
uch
as 3
mm
in
diam
eter
. St
rong
ly f
olia
ted
ME
TA
SED
IME
NT
AR
Y R
OC
KS
- In
clud
es g
rayw
acke
, cal
care
ous
silts
tone
, and
gra
phiti
c sc
hist
. So
me
non-
met
ased
imen
tary
roc
ks
ME
TA
SED
IME
NT
AR
Y M
AR
BL
E -
Fin
e-gr
aine
d, t
extu
rele
ss. W
eath
ers
to m
ediu
m-b
row
n co
lor
MA
JOR
FA
UL
T
POSS
IBL
E S
UL
FID
ES
QU
AR
TZ
VE
INS
50
100n
Figu
re 7
. V
ertic
al s
ectio
ns a
long
pro
pose
d dr
ill h
ole
FG 1
,2,3
, an
d 4,
Far
ah G
aran
anc
ient
min
e.
FG-4 is planned to intersect the downward projection of
metallization found at the north workings and also to further
test the self-potential anomaly trending parallel to the
hanging wall of the Farah Garan fault. It would also explore
the northerly projection of metallization found along sheared
contacts of marble lenses at the central workings. The hole
is estimated to be 250 m in length.
The four proposed drill holes would aggregate about
1050 m in length and would adequately test metallization at
depth. Depending upon results, the drilling program could be
expanded if desirable.
AL ASHYAB
Introduction
Al Ashyab was recognized as having possible mineral
potential by R.E. Anderson during his mapping of the Mayza
quadrangle. An inspection of the area was later made by
T.H. Kiilsgaard and Anderson. The area of interest is at
lat 17°30'13"N. and long 43°37 I 11"E. and is accessible by
4-wheel drive vehicle via a Bedouin truck-trail leading from
the Najran-Khamis Mushayt highway (fig. 2).
Work in the area by the author during November 1975, and
February 1976, assisted by A.M. Helaby, consisted of laying
out a base line, rock chip sampling on a 25 and 50 m grid, and
geologic mapping on an aerial photographic base at a scale of
1:5000.
Al Ashyab is named from a prominent north-south ridge rising
120 m from the valley floor. There are no ancient workings in
the area.18
Geology
The oldest rocks at Al Ashyab are interbedded meta-
sedimentary and metavolcanic rocks of the Jiddah group
(figs. 2, 8). Metasedimentary rocks are sparse and consist of
shaly, calcareous rocks in lenses as much as 4 m wide interlayered
with silicic to intermediate tuffs and flows that contain quartz
crystals to 3 mm in diameter and with dark-green mafic volcanics^
which in places contain feldspar phenocrysts. All rocks have
been metamorphosed to the greenschist or amphibolite facies.
In thin section the intermediate metavolcanic rocks are
quartz-sericite schist and the mafic metavolcanics are
chlorite-epidote-quartz schist that contain finely scattered
ilmenite. The shaly-calcareous metasedimentary rocks display
fluffy chlorite on fresh surfaces, and in thin section are fine
grained chlorite-epidote-quartz schist containing a little
coarse-grained ilmenite. The rocks are similar to those mapped
at Farah Garan, 4 km north. They occupy the valley floors at
Al Ashyab.
Metasedimentary and metavolcanic rocks of the Jiddah group
were syntectonically intruded by quartz porphyry in thin sills
and probably are interlayered with flows and tuffs of the same
rocks. The quartz porphyry is part of a large mass that extends
south to Kutam and well north of Farah Garan (fig. 2). It
contains blue-gray quartz phenocrysts as much as 1 cm in
diameter in a fine-grained groundmass of garnet-bearing
sericite~quartz-chlorite schist. Evidence for intrusive origin
consists of dikes and thin sills of quartz porphyry within the
19
Hi
EXPLANATION
ALLUVIUM
QUARTZ PORPHYRY - Siliceous to intermediate rocks. Gametiferous, strongly foliated. Blue quartz phenocrysts as much as 1 cm in diameter
MET A VOLCANIC ROCKS - Flows or tuffs of r-afic composition
META VOLCANIC ROCKS - Flows or tuffs of intennediate composition. Non-layered. Quartz crystals as much as 3 mm in diameter
METASEDIMENTARY ROCKS - Mostly calcareous, strongly chloritized
SILICIFIED QUARTZ PORPHYRY
QUARTZ VEIN
CONTACT - Dashed where location is uncertain
FAULT SHOWING DIP
STRIKE AND DIP OF CI.EAVAGE
A ROCK CAIRN FOR GEOCHEMIC ALAND GEOPHYSICAL GRID
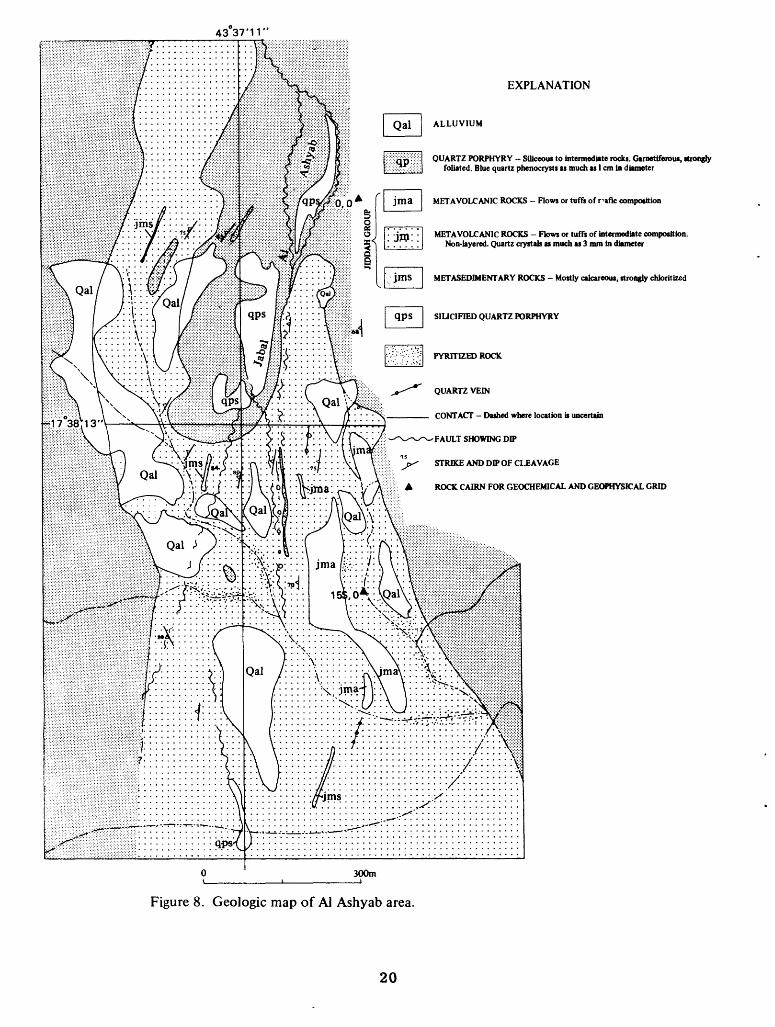
Figure 8. Geologic map of Al Ashyab area.
20
same rock type. Some outcrops show evidence of.extrusive
origin, however, and quartz porphyry appears to lie in
conformable contact with layered metavolcanic rocks. The
quartz porphyry occupies the high valley walls and the central
ridge within the mapped area.
Structure
All rocks were isoclinally folded and sheared. Layering
and strong foliation strike north and dip steeply west.
Regional shears extend north and south outside of the mapped
area and diverge around a large silicified mass of quartz
porphyry at Jabal Al Ashyab, indicating that at least part of
the shearing is post-silicification.
Some of the silicified rocks are sheared, although little
horizontal displacement has taken place. In the south-central
part of the mapped area, a major north-south shear zone has
been intruded by quartz porphyry, indicating that some of the
shearing is pre-quartz porphyry, and was later silicified.
Consequently, the regional shears are thought to have been
active over a long time period.
Complimentary east-trending faults of little displacement
are reflected by drainage systems. They are younger than the
northerly shearing and in places are intruded by fine-grained
mafic dikes.
Alteration
In the northern part of the mapped area, quartz porphyry
has been almost totally silicified along the general northerly
shear direction for a distance of approximately 600 m, forming
21
a high, narrow ridge (fig. 8). Quartz phenocrysts are visible
within the silicified zone, indicating that the original rock
was quartz porphyry. In thin section the rock exhibits granular
quartz and relicts of muscovite and epidote from an earlier
generation of alteration minerals. Very fine pyrite is
sparsely disseminated throughout the quartz.
A zone of quartz-sericite alteration extends out from the
silicified mass at least 200 m to the west and north, but only
a few meters to the east and south. Limits of the quartz-sericite
mass are not shown on figure 8 because of the difficulty in
mapping gradational boundaries. In thin section the rock is
fine-grained quartz-sericite-chlorite schist that contains very
fine-grained pyrite crosscutting foliation.
Metallization
Two types of metallization were recognized in the
south^-central part of the Al Ashyab area: prominent pyritization
within metavolcanic rocks and quartz veins containing minute
copper stains.
Pyritized metavolcanics are best exposed in the wadi
bottoms (fig. 8). Within these areas, disseminated cubic pyrite
as much as 0.5 cm across is weathered to hematite. The greatest
concentrations of pyrite appear to be along major shear zones,
especially along the north-northeast striking shear in the
southwest part of the area. Drainages crosscutting this zone
display intensely pyritized metavolcanic rocks. One chips sam
ple from this area contained 0.26 percent zinc. No other indi
cation of metallization was seen.
22
A north-striking quartz-carbonate vein was mapped in the
south-central part of the area. The vein is as much as 3 m
wide and consists mainly of milky quartz and lesser brown-
weathering calcite. The quartz contains very sparse cubic
pyrite, and vein selvages show very weak copper staining.
Chip samples from the vein indicate low concentrations of all
metals.
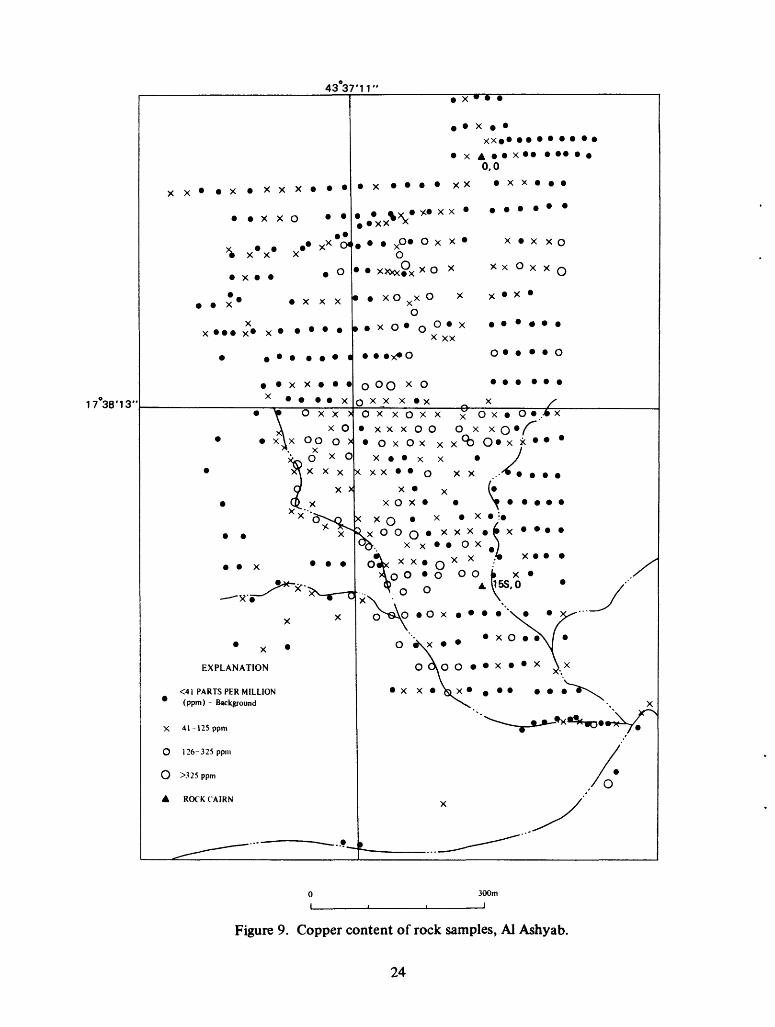
Rock sampling for trace metal analysis
Rock chip samples were taken at 556 sites on a grid whose
spacing was 25 m in the south and 50 m in the north and that
covered an area of 1 km by 0.5 km (figs. 9, 10). Samples were
analyzed for gold, silver, copper, lead, and zinc by both atomic
absorption and semi-quantitative methods. Analytical data for
copper and zinc were grouped statistically and their frequency
distribution determined.
Copper
Copper content below 41 ppm is considered to be background,
and amounts greater than 325 ppm are considered to be anomalous.
The quartz porphyry, including the silicified ridge, is
generally low in copper. A poorly defined, weakly anomalous
zone coincides with pyritized metavolcanics south and east of
the silicified ridge, but anomalous values are scattered. A
pyritized shear zone sampled at the extreme south contains no
anomalous copper.
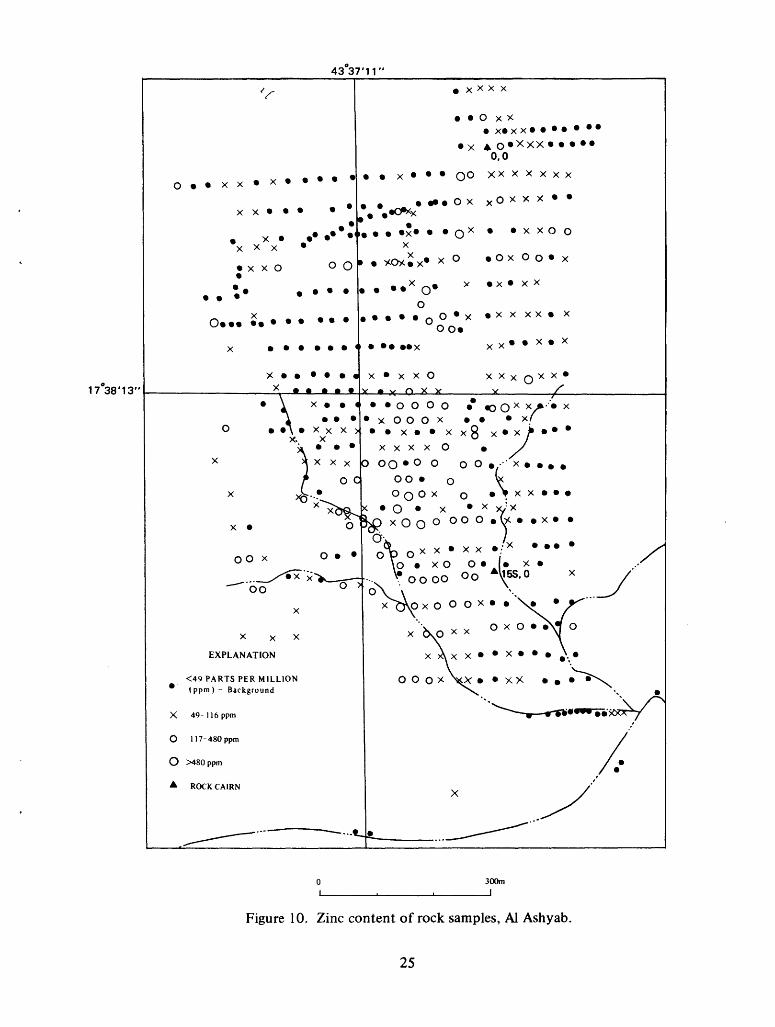
Zinc
Zinc content of less than 49 ppm is considered to be
background, and amounts greater than 480 ppm are anomalous.
23
4337"M"
17 38'13"
x x x
x x o
x * xx O<^ X X X
. x. °
* x x x
x x x0 x
x x x ax
> O X X >
A x ° x\x OO o >
)* V
Sfe 0 X 0 xV x x x
O X >
Q. xx v"'-^o"*-^o
x*
X
^x-f-^*~*'^-*-~V
X X
x EXPLANATION
<41 PARTS PER MILLION * (ppm) - Background
X 41 -125 ppm
O 126- 3 25 ppm
O >325 ppm
A ROCK CAIRN
___ - " - * ^*~-~~~~^
01
X w
x
X A x 0,0
> »xx x
, xo» o x x x x0
XXxx^ X O x X x O x
xO xxO x x«x»
xo» 0 °* x X XX
QXXX»X XOxxoxx xOx»O» xxxOO Oxxo*/^ OxOx xx^ O» x x
x x x J xxx»»o xx ..- /»
x x ( XOX» ^
x x o x x *>i x OOO* xxx »PX**^. x x O x \
0Vxx. o xX X *xTo O O OOfc x»
,^ 0 o ^^5S-°x\ \ \O^QAO o x \»
\ X O *O ^X
o a o o x x
X
5_ ^^-
300m1 1 1
X O
x 0
o
/x
^r
/ -xs""
\I *
VX
* ̂x'^D0*^/^
//os
Figure 9. Copper content of rock samples, AI Ashyab.
24
4337'11"
17 38'13"
V
O««xx« x ****
. 'V * ?
% xV * [
X X 0 0 O
X J
\ X 4
4 O ̂ X X X >
x. x X * *
X ^ X X X
/ 0 C
*-xV.*^1K
X O
00 x 0
,.__/^x~ xV """""bo ° *
X
x x xFVPI ANATIONd/\r L,f\Ftt\ 1 Iv/IN
<49 PARTS PER MILLION(ppm) - Background
X 49- 116 ppm
O 11 7- 480 ppm
O >480ppm
A ROCK CAIRN
^ "" ~~ ----t.^ """ "
0 1
x x x x
O X X v« v v * * *
^VW J\ ^\ ^ ^ ^
X A O» X XX 0,0
OX X OXXX««>t, .«0*x
:» * Q X * *XXOOX
. *OX X X« x 0 .OX 0 0 « X
O
oo«« ««X x X x * X
V NX V <^ V V w ^». V y A. W XAV^ XAX C\ X A w
y v O X v v /"
oooo «*«oO x x > ' x xOOOX X.' X X xg X«X>«**
x x x x o y^ooo*°o oo >< ».
00 o tOQOX o «\ x x
x O x x x/: xJsDxOo 0 000,U««x«
o\> o xx - xx /" * X\0 X O O X ..'
.... VooOO Oo A^S.O x /
°\ \ X .. ^x C^P x 0 0 0 x \- r~
x'^ x x ° X ° *W°
o o o x \x x x "X^ \ /^
7/ x y
^^~-! ____ _____^^^
300m 1
Figure 10. Zinc content of rock samples, Al Ashyab.
25
Most of the quartz porphyry, including the silicified
ridge, does not contain anomalous zinc. However, anomalous
zinc samples are more numerous and more closely grouped than
are those anomalous in copper. Samples with higher zinc
contents are concentrated within the pyritized shear zone south
of the ridge, as are those of high copper content.
Other anomalous samples are widely scattered and do not
appear to be significant.
Conclusions and recommendations
Al Ashyab is 4 km south of Farah Garan and similar rocks
extend through the two areas, except that the marble lenses
mapped at Farah Garan are less common at Al Ashyab. Folds,
faults, and quartz veins strike north and dip steeply west in
both areas. Identical metavolcanic rocks are altered to
quartz-sericite-chlorite schist and are pyritized within shear
zones at both places. Strongly silicified quartz porphyry
occurs only at Al Ashyab.
At Farah Garan, visible copper- and zinc-bearing minerals
are confined to sheared, gossanized contacts with marble lenses,
and geochemical studies confirm this relationship. Pyritized
quartz-sericite alteration zones contain no anomalous amounts
of copper or zinc. At Al Ashyab, the metavolcanic rocks
affected by quartz-sericite-pyrite alteration are strongly
anomalous in copper and zinc in closely confined areas, whereas
weakly anomalous zones are broader and poorly defined. The
silicified quartz porphyry is not anomalous in either metal.
26
Metallization in both areas is believed to be epigenetic
and related to shears within metavolcanic rocks but at Al
Ashyab, visible zinc-copper metallization is lacking, and the
erratically spaced, moderately anomalous mineralized zones
encountered in geochemical studies suggest that economic
mineral deposits probably are not present at depth.
No further work is recommended for the area.
AL ASHARFAT
Introduction
The Al Asharfat ancient workings are at lat 17 0 37'00"N.,
long 43°39'00"E. and are accessible via a Bedouin truck-trail
(fig. 2). They consist of 10 shallow workings along a distance
of approximately 1.5 km. The largest working is 50 m long and
8 m deep at the deepest part. A sorting area with a few
grinding stones is adjacent to the largest workings. Most of
the workings are partly filled with mine waste.
The author, assisted by A.M. Helaby, sampled veins and
dumps and mapped the area using aerial photographs during
February 1976.
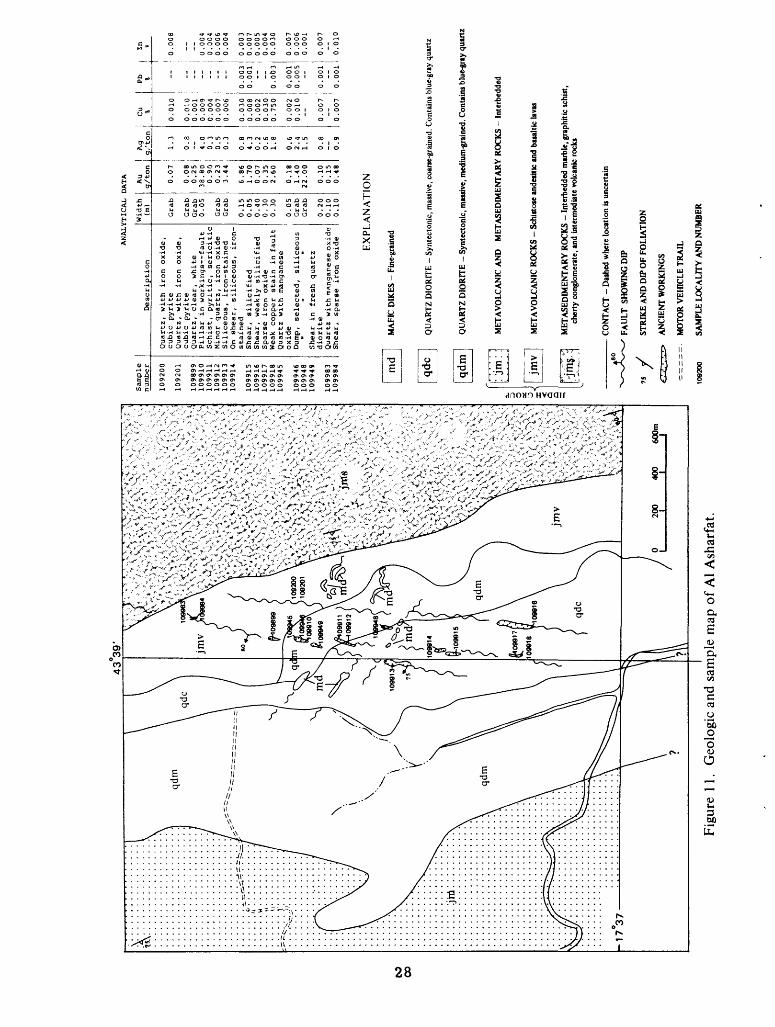
Geology and structure
Rocks of the Jiddah group here are isoclinally folded,
faulted, and strongly foliated, and are intruded by two
syntectonic phases of quartz diorite. All rocks are cut by
faults which strike N.10°E. and dip steeply west. The latest
faults, which strike N.50°W., are filled by fine-grained
mafic dikes (fig. 11).
27
43 3
9'
to 00
AN
AL
YT
ICA
L
DA
TA
Sample
number
109200
109201
109899
109910
109911
109912
109913
109914
109915
109916
109917
109918
109945
109946
109948
109949
109983
109984
Description
Quartz,
with ir
on oxide,
cubi
c py
rite
Quar
tz,
with ir
on oxide,
cubic
pyri
teQu
artz
, cl
ear,
white
Pill
ar in
workings--f ault
Schi
st,
pyri
tic,
sericitic
Minor
quar
tz,
iron oxide
On shear, siliceous, ir
on-
stained
Shea
r, silicified
Shear, weakly silicified
Spar
se ir
on oxide
Weak copper st
ain
in fau
ltQuartz with manganese
oxide
Dump,
selected,
siliceous
n
«Shear
in fr
esh
quartz
diorite
Quartz with manganese oxide
Shea
r, sp
arse
iron oxide
Width
(m)
Grab
Grab
Grab
0.05
Grab
Grab
0.15
0.05
0.40
0.30
0.30
0.05
Grab
Grab
0.20
0.10
0.10
Au
g/ton
0.07
0.08
0.25
38.80
0.90
0.23
3.44
6.86
1.70
0.07
0.35
2.60
0.18
1.40
22.00
0.10
0.15
0.48
M
3, 'to
n
1.3
0.8
4.0
0.3
0.5
0.3
0.8
4.3
0.2
0.6
1.8
0.6
2.4
1.5
0.8
0.9
Cu
%
0.010
0.010
0.001
0.009
0.004
0.007
0.006
0.030
0.008
0.002
0.030
0.750
0.002
0.010
0.007
0.007
Pb » _ -- --
0.003
0.001
-- 0.003
0.001
0.005
0.001
0.001
Zn a
0.00
__ --0.00
0.00
0.00
0.00
0.00
0.00
0.00
0.00
0.03
0.00
0.00
0.00
0.00
0.01
EX
PL
AN
AT
ION
md
I M
AFI
C D
IKES
- F
ine-
grai
ned
qdc
QU
AR
TZ D
IOR
ITE
- Sy
ntec
toni
c, m
assi
ve, c
oars
e-gr
aine
d. C
onta
ins
blue
-gra
y qu
artz
qd
m
QU
AR
TZ D
IOR
ITE
- S
ynte
cton
ic, m
assi
ve, m
ediu
m-g
rain
ed. C
onta
ins
blue
-gra
y qu
artz
jmv
MET
AV
OLC
AN
IC A
ND
M
ETA
SED
IMEN
TARY
RO
CKS
- In
terb
edde
d
MET
A V
OLC
AN
IC R
OCK
S -
Schi
stos
e an
dest
tic a
nd b
asal
tic la
vas
MET
ASE
DIM
ENTA
RY R
OCK
S -
Inte
rbed
ded
mar
ble,
gra
phiti
c sc
hist
, ch
erty
con
glom
erat
e, a
nd in
term
edia
te v
olca
nic
rock
s
CON
TACT
- D
ashe
d w
here
loca
tion
is un
certa
in
FAU
LT S
HO
WIN
G D
IP
/
STR
IKE
AN
D D
IP O
F FO
LIA
TIO
N
<H!3
7r^>
A
NCI
ENT
WO
RKIN
GS
- =
= =
=
MO
TOR
VEH
ICLE
TR
AIL
1092
00
SAM
PLE
LOCA
LFTY
AN
D N
UM
BER
Figu
re 1
1.
Geo
logi
c an
d sa
mpl
e m
ap o
f A
l A
shar
fat.
The intrusive rocks are massive and less foliated than the
enclosing metavolcanics. Both phases of quartz diorite contain
subhedral, blue-gray quartz intergrown with plagioclase,
amphibole, fine-grained biotite, and scattered ilmenite. The
later phase, which intrudes the earlier, is petrographically
similar but coarser grained.
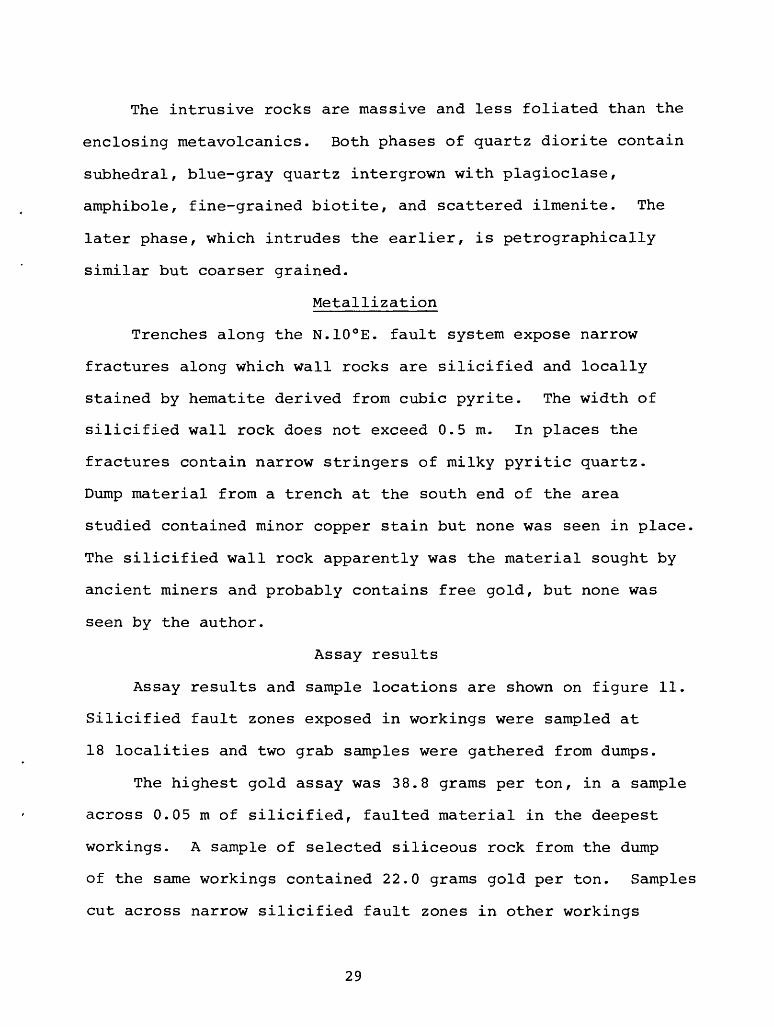
Metallization
Trenches along the N.10°E. fault system expose narrow
fractures along which wall rocks are silicified and locally
stained by hematite derived from cubic pyrite. The width of
silicified wall rock does not exceed 0.5 m. In places the
fractures contain narrow stringers of milky pyritic quartz.
Dump material from a trench at the south end of the area
studied contained minor copper stain but none was seen in place.
The silicified wall rock apparently was the material sought by
ancient miners and probably contains free gold, but none was
seen by the author.
Assay results
Assay results and sample locations are shown on figure 11.
Silicified fault zones exposed in workings were sampled at
18 localities and two grab samples were gathered from dumps.
The highest gold assay was 38.8 grams per ton, in a sample
across 0.05 m of silicified, faulted material in the deepest
workings. A sample of selected siliceous rock from the dump
of the same workings contained 22.0 grams gold per ton. Samples
cut across narrow silicified fault zones in other workings
29
assayed as much as 6.86 grams gold per ton. No significant
amounts of silver, copper, lead, or zinc were found in the
samples.
Conclusions and recommendations
Ancient miners worked gold deposits to shallow depths in
the Al Asharfat region, where gold occurs in narrow, silicified
zones bordering faults. Potential gold reserves of the area are
small and no further study is recommended.
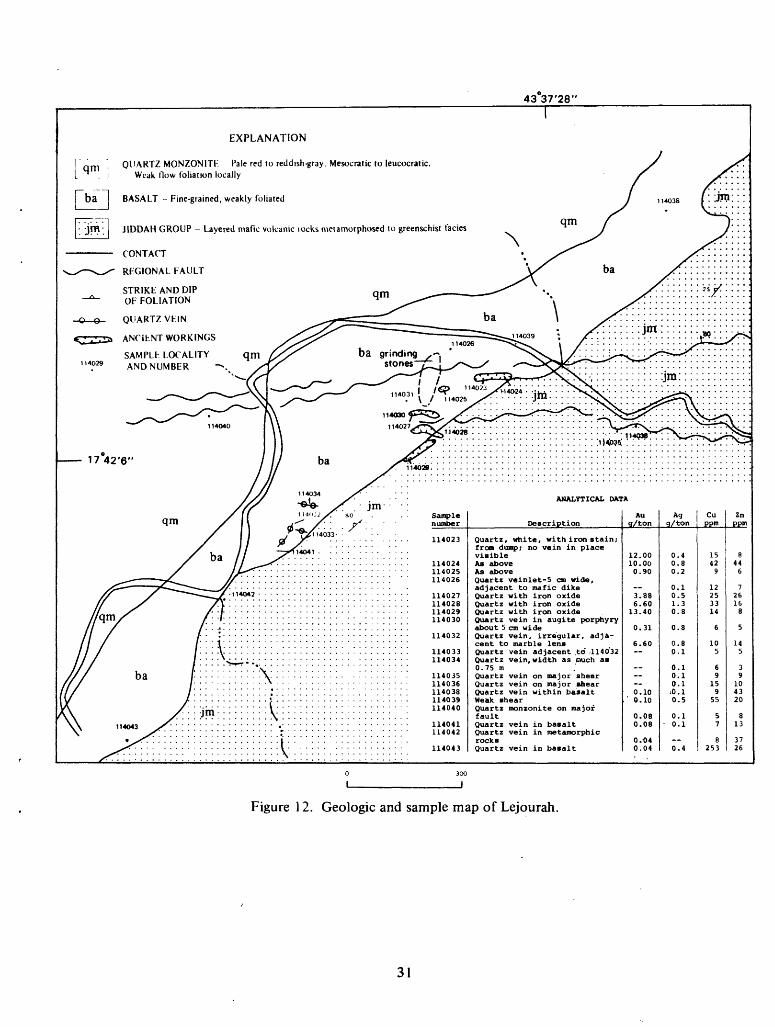
LEJOURAH
Introduction
Lejourah is accessible by motor vehicle via a Bedouin
truck trail that passes through the village of Talhah and
joins the Khamis Mushayt-Najran highway nearby (fig. 2). Five
ancient workings within a small area are at lat 17 0 42'6"N.,
long 43°37 I 28"E. in relatively flat terrain. They are filled
with mine waste, and no bedrock is exposed in them. A great
number of grinding stones and sorting piles are near the workings,
The area was mapped in February 1976 on color photographs
at a scale of approximately 1:12,600, and dumps, sorting piles,
and a few unmined quartz veins were sampled.
Geology
Volcanic rocks of the Jiddah group, principally interlayered
basalt and andesite, are isoclinally folded, sheared, strongly
foliated, and metamorphosed to greenschist facies in the mine
area (fig. 12). Foliation and layering strike N.45°E. and dip
steeply northwest. Later basalt flows are massive, weakly
foliated, and cut by quartz veinlets that contain associated
30
43 37'28"
qm
EXPLANATION
QUARTZ MONZONITE Pale red to reddish-gray. Mesocratic to leucocratic. Weak flow foliation locally
OS BASALT - Fine-grained, weakly foliated
; JIDDAH GROUP - Layered mafic volcanic locks metamorphosed to greenschist tacies
CONTACT
REGIONAL FAULT
STRIKE AND DIP OF FOLIATION
QUARTZ VEIN
ANCibNT WORKINGS
ba grinding, stones *~
Sample number
114023
114024114025114026
114027114028114029114030
114032
114033114034
114035114036114038114039114040
114041114042
114043
Description
Quartz, white, with iron stain;from dump; no vein in placevisibleAs aboveAs aboveQuartz veinlet-5 cm wide,adjacent to mafic dikeQuartz with iron oxideQuartz with iron oxideQuartz with iron oxideQuartz vein in augite porphyryabout 5 cm wideQuartz vein, irregular, adjacent to marble lensQuartz vein adjacent to 1140'32Quartz vein, width as ouch as0.75 mQuartz vein on major shearQuartz vein on major shearQuartz vein within basaltWeak shearQUartz monzonite on majorfaultQuartz vein in basaltQuartz vein in raetaroorphicrocksQuartz vein in basalt
Au g/ton
12.0010.000.90
--3.886.60
13.40
0.31
6.60
-0.10
' 0.10
0.080.08
0.040.04
Ag g/ton
0.40.80.2
0.10.51.30.8
0.8
0.80.1
0.10.10.1iO.l0.5
0.1 0.1
--0.4
Cu ppm
15429
12253314
6
105
69
159
55
57
8253
Znppm
8446
726168
5
145
39
104320
813
3726
300
I
Figure 12. Geologic and sample map of Lejourah.
31
ilmenite. The youngest rock is a pale-pink to gray, medium-
to coarse-grained quartz monzonite pluton that intrudes the
basalt to the northwest.
Structure and metallization
Regional faults that strike slightly north of east and
dip steeply north transect all rocks. Ancient workings are
within basalt along the trace of fault zones and on the contact
between basalt and metavolcanic rocks. The open cuts are small,
and the orebodies worked apparently had short strike lengths.
Piles of sorted quartz on waste dumps must represent the
material the ancients were mining. The quartz is milky and iron
stained, and contains sparsely scattered free gold in grains as
much as 0.5 mm across. The gold occurs typically in small
clusters of chloritic material. Cubic pyrite is also disseminated
sparsely within the quartz.
Unmined quartz veins deposited as fracture fillings in
basalt were mapped about 250 m southwest of the workings. The
veins average 0.4 m in width and have strike lengths of only a
few meters.
Assay results
Sample locations, descriptions, and analyses are shown on
figure 12. Among vein samples only sample 114032, cut
across an irregular quartz vein, contained gold in significant
amounts, 6.60 grams per ton. Samples from other quartz veins
and faulted zones contained only negligible gold. Of six
samples collected from sorting piles, the richest contained
13.40 grams per ton and the poorest 0.90 grams per ton. The
32
average grade of these six samples is 7.80 grams gold per ton.
No other metals were found in significant amounts.
Conclusions and recommendations
Ancient miners at Lejourah worked gold-bearing veins in
small open cuts within an area 150 by 500 m. Quartz from
sorting piles near the open cuts bears visible free gold.
The numerous grinding stones confined to a small area adjacent
to the ancient workings indicate that the gold veins were
intensively worked.
Geologic mapping and sampling of the ancient mine sites
indicate that the possibility of finding extensions of the
gold-bearing quartz veins is remote. Even though free gold
was found in quartz on dumps, and significant gold was found in
sampling, the potential tonnage of ore is too small to merit
further consideration.
HEMAIR
Introduction
The Hemair ancient mining site is on the steep valley walls
of Wadi Kholan at lat 17 0 40'00"N., long 43°39 I 00"E., where a
line of workings trends nearly due south and extends
intermittently more than 500 m. The workings are very narrow,
averaging less than a meter in width, but some are extremely
deep where ancient miners evidently followed ore shoots. Mine
dumps have been completely eroded away.
The nearest approach to Hemair via land vehicle is from
Al Ashyab, about 5 km southwest (fig. 2). The area was reached
by helicopter in February 1976, at which time mineral outcrops
were mapped by use of Brunton and tape and were sampled.33
65 ̂
fold noses?
, work ings interconnected?
white quartz on sheared contact of calcareous lens
/
,workings 1m deep'114013
,114014eo .^workings about 0.5m wide,
very sparse copper stain
75 w" 114015Jnr stope about 4m deep.
on quartz vein?
stope 4-5 m deep, average 0.75m wide-/ M//N14016
deep stope, interconnecting?^
/ ^-114017
ffir~\ 14018
deep stope average 0.75m wide
/ open cut very deep stope average 0.75m wide
interconnects with stope to north
graphitic schist-65
\ 'S intensely folded; isolated
blocks of marble
EXPLANATION
MARBLE
QUARTZ VEIN
FAULT SHOWING DIP
STRIKE AND DIP OF FOLIATION
0- STRIKE OF VERTICAL FOLIATION
<SS ANCIENT WORKINGS
114019 SAMPLE LOCALITY AND NUMBER
65
oc
sparse copper stain on walls . of trench 5-6m deep /
74*XXY^ /shallow workings on shear; / sparse copper stain on walls '
114008 /
gray-green sericite schist with abundant fine-grained pyrite
mine, very deep
114011-& / °w_ / __
50 METERS
Samplenumber
114005114006114007114008114009
114010114011114012*114013114014
114015114016114017114018114019
114020114021114022
Widthmet
0.6.1.0.0.
1.2.0.1.0.
0.0.0.0.0.
0.0.0.
:ers
.45
.00
.00,50.50
0000.10.50.50
,05,1045,45,75
,15.45.30
Aua/1.0.0.0.
42.
0.0.0.0.0.
1.0.3.2.6.
0.3.0.
>_t
.00,17.17.17.40
,32.17.17.17.08
.40
.20
.20
.50
.60
.50
.88
.04
Aga/6.1.0.9.
160.
11.1.0.1.1.
31.14.70.16.30.
8.8.3.
/t
.20
.30
.70
.80
.00
.10
.70
.40
.00
.20
.80
.80
.00
.50
.00
.50
.00
.20
Cupercent
0.340.0050.010.101.42
2.650.040.0040.0090.007
0.320.732.350.191.25
0.030.180.02
Pbpei
0.0.0.0.0.
0.0.0.0.0.
0,0.2.0.0.
0.0,0
rcent
.90
.003
.002
.40,99
.24
.02
.001
.or
.003
.70
.14
.00
.48
.78
.03
.41
.14
Znpei
3.0.0.0.1.
0.0.0.0.0.
0.0.1,0.0.
0.0,0
rcent
.75
.02,004.08.85
.60,09.001.004.009
,51.14.50.36.94
.09
.20
.09
* Not shown on map
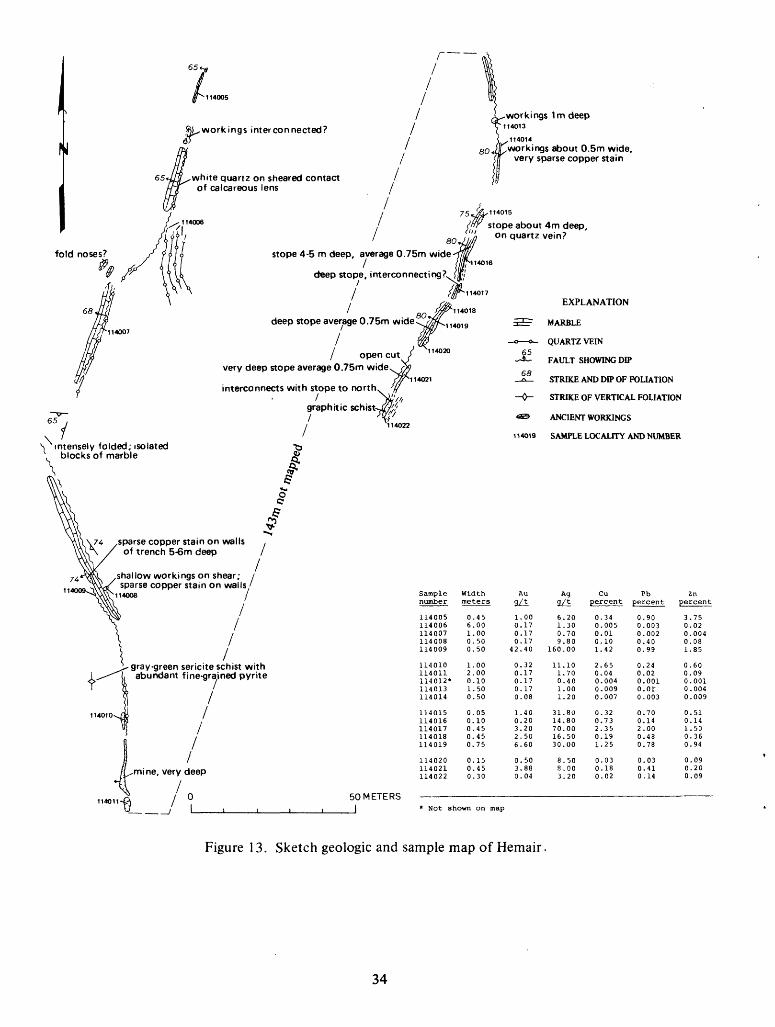
Figure 13. Sketch geologic and sample map of Hemair.
34
Geology
Metasedimentary and metavolcanic rocks of intermediate
composition and assigned to the Jiddah group were isoclinally
folded, faulted, and metamorphosed to greenschist facies within
the Hemair region. Metasedimentary rocks consist of fine-grained,
nonbedded, brown-weathering marble, graphitic schist, and
calcareous siltstone. These rocks are interbedded with massive
metavolcanics containing crystals of clear quartz as much as
3 mm in diameter. The metavolcanics are part of the same rock
unit as that mapped at Farah Garan and Al Ashyab.
Structure, metallization, and alteration
Foliation and layering of the metasedimentary rocks strike
north and dip steeply west. The rocks, particularly the
marble-graphite contacts, were sheared by a regional fault along
bedding planes. The shear zone was then weakly silicified and
the enclosing metavolcanic rocks were pyritized. Copper, lead,
and zinc sulfides with accompanying gold and silver were then
deposited. Milky quartz was later deposited within the main
shear zone and along subordinate shears. Slight post-
silicification movement along the major fault weakly brecciated
the silicified zones (fig. 13).
Sheared, silicified, and metallized rock along the fault
averages less than one meter in width and is absent in the center
of the mapped area where the fault is expressed only by thin
fractures. Gossans are best developed on sheared contacts of
marble, where they are sparsely copper stained. Silicification
is stronger at the south end of the area, where black, flinty,
35
fine-grained, siliceous material may be silicified graphitic
rock.
Assay results
Eighteen continuous chip samples were cut across the
metallized fault and their positions are indicated on figure 13.
Analyses of gold, silver, copper, lead, and zinc indicate that
metal is erratically distributed along the fault zone. Ranges
of metal contents and sample widths are as follows:
Width (m) Au Ag Cu Pb Zn g/t g/t pet pet pet
5.0-0.05 42.40-Trace 70.00-0.40 2.65-0.004 2.00-0.001 3.75-0.001
Average width and assays are as follows:
Width (m) Au Ag Cu Pb Zng/t g/t pet pet pet
0.82 3.50 20.9 0.54 0.40 0.57
Conclusions and recommendations
Rock formations, structure, content of sulfides and
precious metals , and ore contacts at the Hemair deposit are
in many respects similar to those of Farah Garan, 3 km northwest,
and these deposits are probably genetically related. The Hemair
deposits themselves are small and merit no further investigation,
but the general area contains rocks and structures favorable for
ore deposition and warrants additional study.
PRELIMINARY STUDIES OF THE HEMAIR-AL ASHARFAT REGION
Introduction
During January and February of 1976 the author mapped and
sampled by reconnaissance methods a belt of metasediments
extending south from Hemair, as well as shear zones parallel
to the contact between quartz porphyry and mafic metavolcanics
36
(fig. 2). Several small ancient workings were found and
examined. Mapping was done on low-level, color aerial
photographs.
The Hemair-Ethel region
Geology
A belt of metasedimentary rocks of the Jiddah group extends
south through Hemair and passes under Wajid Sandstone near the
Ethel mine (fig. 14). The rocks include black to brown, massive,
fine-grained marble, cherty conglomerate, graywacke, calcareous
mudstone, and graphitic sediments. The sedimentary rocks are
interbedded with layered quartz crystal tuffs, massive
unlayered quartz crystal metavolcanic lavas, and metavolcanic
flow breccias. Many of the metasedimentary rocks contain
graphite and associated cubic pyrite. The metasediments strike
north and dip steeply west. They are in contact with
thick-bedded andesitic to basaltic metavolcanics on the east and
with mafic metavolcanic flows and interbedded thin metasedimentary
rocks on the west.
Metallization and alteration
Quartz crystal metavolcanics and calcareous metasediments
are pyritized, sericitized, and weakly silicified in broad zones
along the belt of metasedimentary rocks. Fine-grained cubic
pyrite is heavily disseminated in some zones and is probably
not genetically related to the more coarse-grained pyrite
associated with graphitic rocks. The pyrite is generally found
in strongly sheared zones. Weathered pyritized rocks are
unevenly stained by iron oxide.
37
A small ancient workings named Degarth is adjacent to a
marble lens about 1 km east of Al Asharfat (fig. 14). The
open cut is 9 m long, 4 m wide and 4 m deep and is on sheared
and pyritized metavolcanic rock containing copper carbonates
and copper pitch. Pyritization extends at least 1 km north
of the open cut, and within the pyritized rock, sparse copper
carbonates were noted along thin fractures and small amounts
of copper-stained float rock were found in wadis. Strongly
pyritized rocks extend at least 1 km south of Degarth, and
small amounts of chalcopyrite were found in sparsely copper
stained, calcareous rock. Farther south, rocks are pyritized
locally but no copper minerals were found.
Rock sampling for trace metal analysis
Preliminary rock chip sampling for geochemical study was
done at 35 locations along a length of about 6 km of the belt
of metasedimentary rocks. Locations were chosen to represent
all rock types; however, pyritized shear zones were especially
tested. Sample localities and their respective descriptions
and grades are shown on figure 14.
Three samples anomalous in copper and zinc were taken from
sites where copper minerals were locally visible. Samples from
north of Degarth, where copper minerals also are locally visible,
contained copper and zinc in amounts just above background.
Samples from the region south of Degarth contained moderately
anomalous amounts of copper and zinc in two samples each.
38
Unnamed workings
At lat 17°36 I 15"N. / long 43°40'20"E. (fig. 14), veins
and veinlets of milky quartz in mafic metavolcanic rocks strike
north, dip steeply west, and are about 5 m wide. Shallow ancient
workings on the east contact of the quartz veins are about
200 m apart, but quartz is discontinuous between the two workings
Three samples taken across the quartz vein in workings
contained no significant amounts of metals.
Ethel workings
Massive veins and narrow stringers of milky quartz were
worked in shallow open cuts by ancient miners at lat 17 0 33'50"N.,
long 43°40 I 10"E. (fig. 14). The vein system strikes north, dips
steeply west, and ranges from massive quartz as much as 4 m wide
to a series of narrow stringers along a strike distance of about
200 m. The quartz is unevenly stained by iron oxides derived
from pyrite. Workings are along selvages of massive quartz
within swarms of quartz veinlets.
Assay results
Six samples were cut across massive quartz and quartz
veins within workings. One sample from a selvage of a massive
quartz vein contained 1.64 grams of gold per ton. The remaining
samples contained negligible amounts of valuable metals.
Conclusions and recommendations
Sparsely copper-stained, pyritized shear zones within
interbedded metavolcanic and metasedimentary rocks occur in an
area about 3 km south of the Hemair deposit. The intervening
area has not been studied. It is recommended that more detailed
39
studies be made of the metasedimentary and interbedded meta-
volcanic rocks and of their genetic relation to sulfide deposits
in the area. The small quartz veins merit no further study.
The East Al Ashyab area
Geology
About 1.5 km southeast of Al Ashyab at lat 17°38 I 00"N.,
long 43°38 I 00"E., a series of lensoidal, weakly folded quartz
veins strike north and dip steeply west. They are within
strongly foliated mafic metavolcanic rocks of the Jiddah group
near the contact with quartz porphyry (fig. 14). The entire
vein swarm is about 0.5 km wide by 2 km long, but the veins are
discontinuous along strike. The quartz veins locally contain
specular hematite, in places contain sparse copper staining in
vein selvages, and are barren of sulfides. Strongly sheared
metavolcanic rocks are pyritized in parallel zones. Bands of
magnetite as much as 0.1 m wide and a few meters long are
parallel to foliation within metavolcanics near the contact with
quartz porphyry at a point 0.5 km south of the vein swarm.
About 2 km farther south, a small, deep ancient working on the
contact between metavolcanics and quartz porphyry exposes a blue
to gray quartz vein as much as 0.45 m wide. The vein contains
sparse crystalline pyrite and a little gold.
Assay results
Quartz veins were sampled thoroughly to test for precious
metal content. Assays indicate no significant amounts of either
gold or silver in the quartz vein swarm. Some samples of
pyritized sericite schist in the same area have high contents
40
of copper and zinc (fig. 14). Two samples of quartz vein from
ancient workings contained 14.0 grams of gold and 1.3 grams of
silver per ton, and 22.0 grams of gold and 1.0 gram of silver
per ton, respectively.
Conclusions and recommendations
The area studied is a very small part of an extensive
contact zone between mafic metavolcanic rocks of the Jiddah
group and a large body of quartz porphyry. Although many of
the sampling data are negative, positive factors include:
1. Sparse copper staining in vein selvages.
2. Scattered anomalous copper-zinc contents in samples
from pyritized shear zones.
3. Magnetite in thin bands along foliation.
4. Significant gold analyses in quartz from ancient
workings.
The large quartz porphyry mass was interpreted by Anderson
as being intrusive into rocks of the Jiddah group (Anderson, in
prep.), but the present author believes that much of it is
interlayered with the Jiddah group and is extrusive, in part
perhaps tuff. It is obvious that the origin of the quartz
porphyry is important in respect to the genesis of sulfide
deposits in the area and to a logical approach to exploring for
them. Therefore, it is recommended that this and other contact
zones of quartz porphyry be studied in detail in order to clarify
contact relationships if possible; gathering of further data on
metallization could be done concurrently with such a study.
41

RECONNAISSANCE GEOPHYSICAL EXPLORATION
by
H. Richard Blank
Introduction
In late 1975 and early 1976 a limited program of
geophysical work was carried out at Al Ashyab and Farah
Garan by the combined USGS/DGMR Geophysics section, in
support of base metal exploration by C.W. Smith. The work
consisted of approximately 35.2 line-km of self-potential (SP)
surveys and 9.0 line-km of Turam electromagnetic surveys.
Altogether about one crew-month was spent in the field, about
two-thirds of which time was at Al Ashyab. Production at both
locations was hampered to some extent by the ruggedness of the
terrain.
The geophysical surveys were essentially reconnaissance
in scope and aimed at identifying the gross electrical
characteristics of the altered zones. It was intended to
follow up this work at a later time with additional surveys
to delineate specific drilling targets if warranted by the
combined results of the integrated exploration program. To
date, however, the work reported here remains the only
geophysical prospection in either area.
Al Ashyab surveys
Self-potential
The Jabal Al Ashyab altered zone was the first target
surveyed. Smith's camp immediately south of the Jabal served
43
as a base of operations for the field party. The SP survey
was made during November 1975 under conditions of high
surface aridity (there had been no rains in the recent past).
Readings were taken at 50-m intervals along east-west traverse
lines laid out by tape and compass normal to Smith's surveyed
base line.
Initially the three-pot (leapfrog) method was used, but
because of the need for greater accuracy it was decided to
switch to the two-pot (fixed pot, moving pot) method, keeping
one pot stationary on the base line. Traverse lines were
then tied together by surveying the base line with one pot
fixed at station (0,0) . To facilitate the measurements an
auxiliary base line 0.5 km long was established west of Jabal
Al Ashyab and exactly 0.5 km west of Smith's line. The
measuring device used was a BRGM model RUE electronic milli-
voltmeter. Although this type of instrument has a very high
input impedance, and differences of potential can be read with
an accuracy of + 0.2 millivolt in all operating environments,
line-closure errors were in some cases as high as 20 millivolts
Pot potentials were compared several times each day and pot
polarization drifts can account for at most a few millivolts
generally less than 1 millivolt of uncertainty at any time
during the survey. Excessive closure errors occurred with
both the two-pot and three-pot methods, and their origin has
not been unequivocally determined. It seems likely to be
related to rapid dessication of the immediate electrode environ
ment, which was watered some hours prior to each traverse and
44
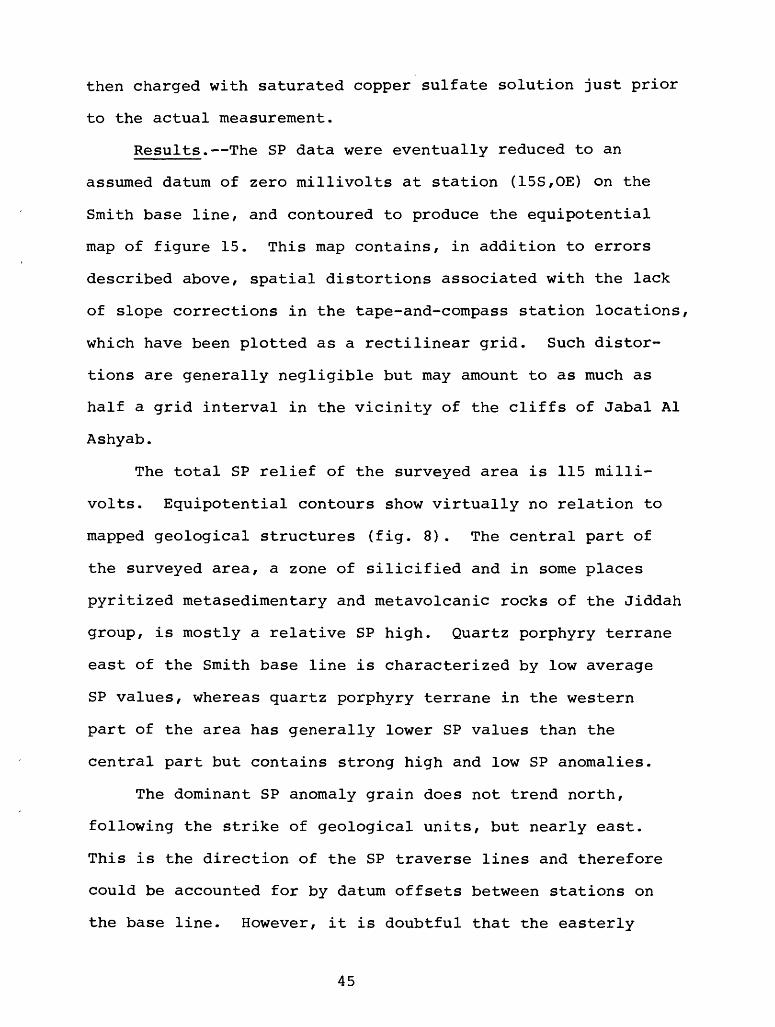
then charged with saturated copper sulfate solution just prior
to the actual measurement.
Results. The SP data were eventually reduced to an
assumed datum of zero millivolts at station (15S,OE) on the
Smith base line, and contoured to produce the equipotential
map of figure 15. This map contains, in addition to errors
described above, spatial distortions associated with the lack
of slope corrections in the tape-and-compass station locations,
which have been plotted as a rectilinear grid. Such distor
tions are generally negligible but may amount to as much as
half a grid interval in the vicinity of the cliffs of Jabal Al
Ashyab.
The total SP relief of the surveyed area is 115 milli
volts. Equipotential contours show virtually no relation to
mapped geological structures (fig. 8). The central part of
the surveyed area, a zone of silicified and in some places
pyritized metasedimentary and metavolcanic rocks of the Jiddah
group, is mostly a relative SP high. Quartz porphyry terrane
east of the Smith base line is characterized by low average
SP values, whereas quartz porphyry terrane in the western
part of the area has generally lower SP values than the
central part but contains strong high and low SP anomalies.
The dominant SP anomaly grain does not trend north,
following the strike of geological units, but nearly east.
This is the direction of the SP traverse lines and therefore
could be accounted for by datum offsets between stations on
the base line. However, it is doubtful that the easterly
45
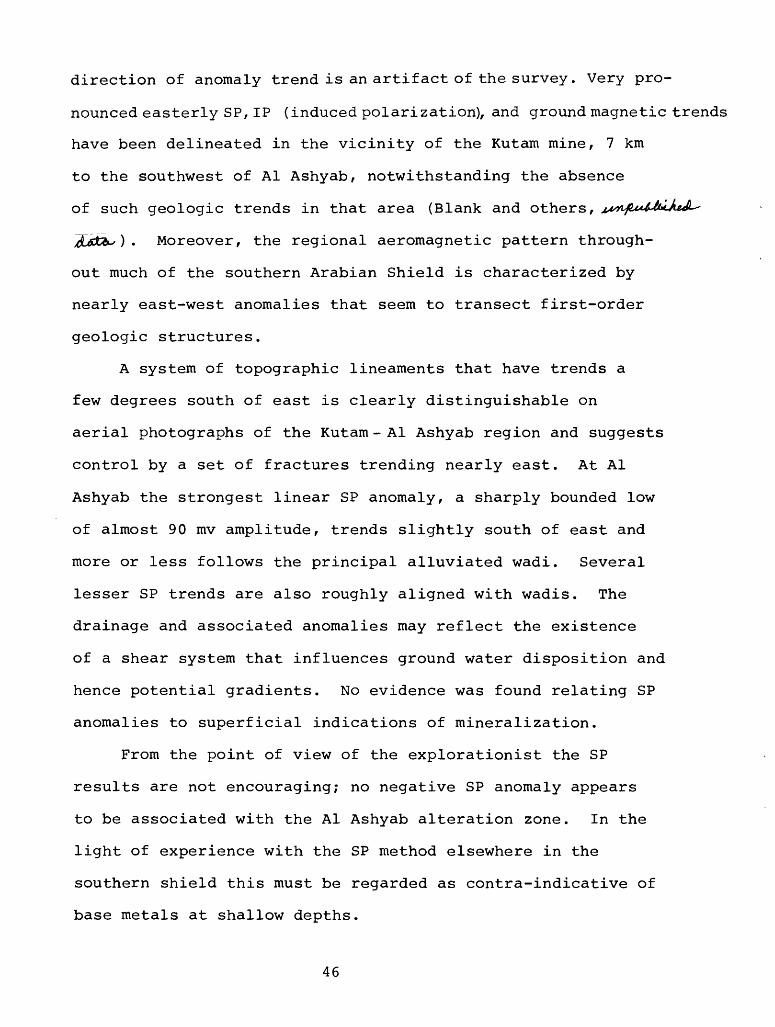
direction of anomaly trend is an artifact of the survey. Very pro
nounced easterly SP, IP (induced polarization), and ground magnetic trends
have been delineated in the vicinity of the Kutam mine, 7 km
to the southwest of Al Ashyab, notwithstanding the absence
of such geologic trends in that area (Blank and others,
) . Moreover, the regional aeromagnetic pattern through
out much of the southern Arabian Shield is characterized by
nearly east-west anomalies that seem to transect first-order
geologic structures.
A system of topographic lineaments that have trends a
few degrees south of east is clearly distinguishable on
aerial photographs of the Kutam - Al Ashyab region and suggests
control by a set of fractures trending nearly east. At Al
Ashyab the strongest linear SP anomaly, a sharply bounded low
of almost 90 mv amplitude, trends slightly south of east and
more or less follows the principal alluviated wadi. Several
lesser SP trends are also roughly aligned with wadis. The
drainage and associated anomalies may reflect the existence
of a shear system that influences ground water disposition and
hence potential gradients. No evidence was found relating SP
anomalies to superficial indications of mineralization.
From the point of view of the explorationist the SP
results are not encouraging; no negative SP anomaly appears
to be associated with the Al Ashyab alteration zone. In the
light of experience with the SP method elsewhere in the
southern shield this must be regarded as contra-indicative of
base metals at shallow depths.
46
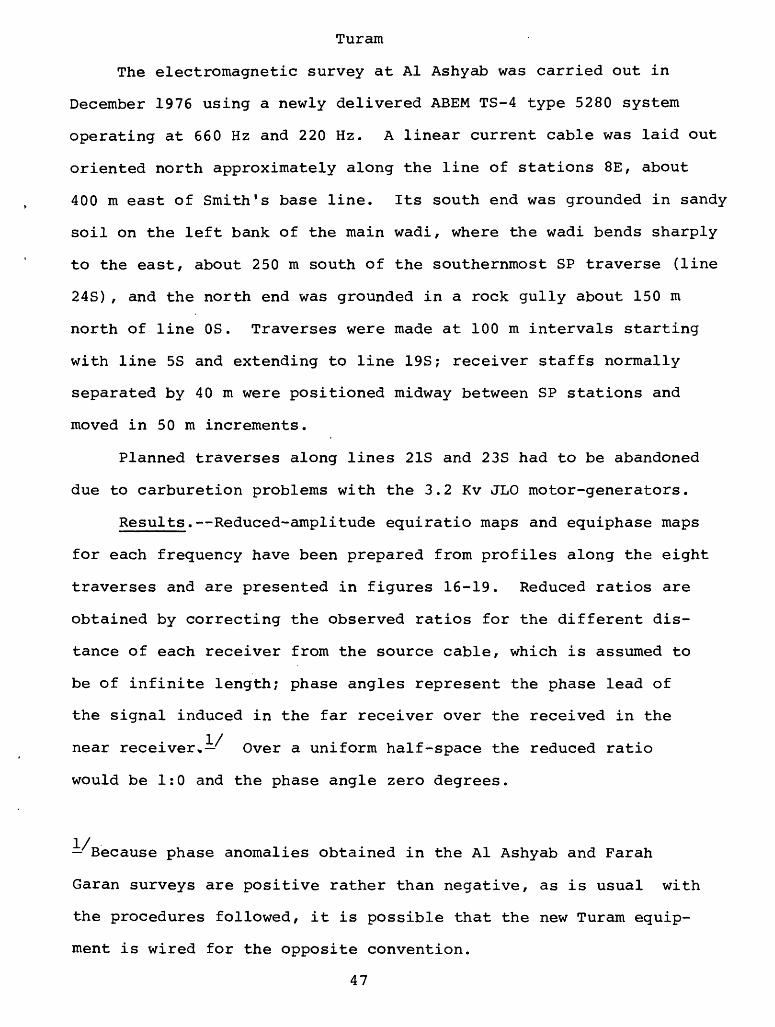
Turam
The electromagnetic survey at Al Ashyab was carried out in
December 1976 using a newly delivered ABEM TS-4 type 5280 system
operating at 660 Hz and 220 Hz. A linear current cable was laid out
oriented north approximately along the line of stations 8E, about
400 m east of Smith's base line. Its south end was grounded in sandy
soil on the left bank of the main wadi, where the wadi bends sharply
to the east, about 250 m south of the southernmost SP traverse (line
24S), and the north end was grounded in a rock gully about 150 m
north of line OS. Traverses were made at 100 m intervals starting
with line 5S and extending to line 19S; receiver staffs normally
separated by 40 m were positioned midway between SP stations and
moved in 50 m increments.
Planned traverses along lines 21S and 23S had to be abandoned
due to carburetion problems with the 3.2 Kv JLO motor-generators.
Results. Reduced-amplitude equiratio maps and equiphase maps
for each frequency have been prepared from profiles along the eight
traverses and are presented in figures 16-19. Reduced ratios are
obtained by correcting the observed ratios for the different dis
tance of each receiver from the source cable, which is assumed to
be of infinite length; phase angles represent the phase lead of
the signal induced in the far receiver over the received in the
near receiver, Over a uniform half-space the reduced ratio
would be 1:0 and the phase angle zero degrees.
Because phase anomalies obtained in the Al Ashyab and Farah
Garan surveys are positive rather than negative, as is usual with
the procedures followed, it is possible that the new Turam equip
ment is wired for the opposite convention.
47
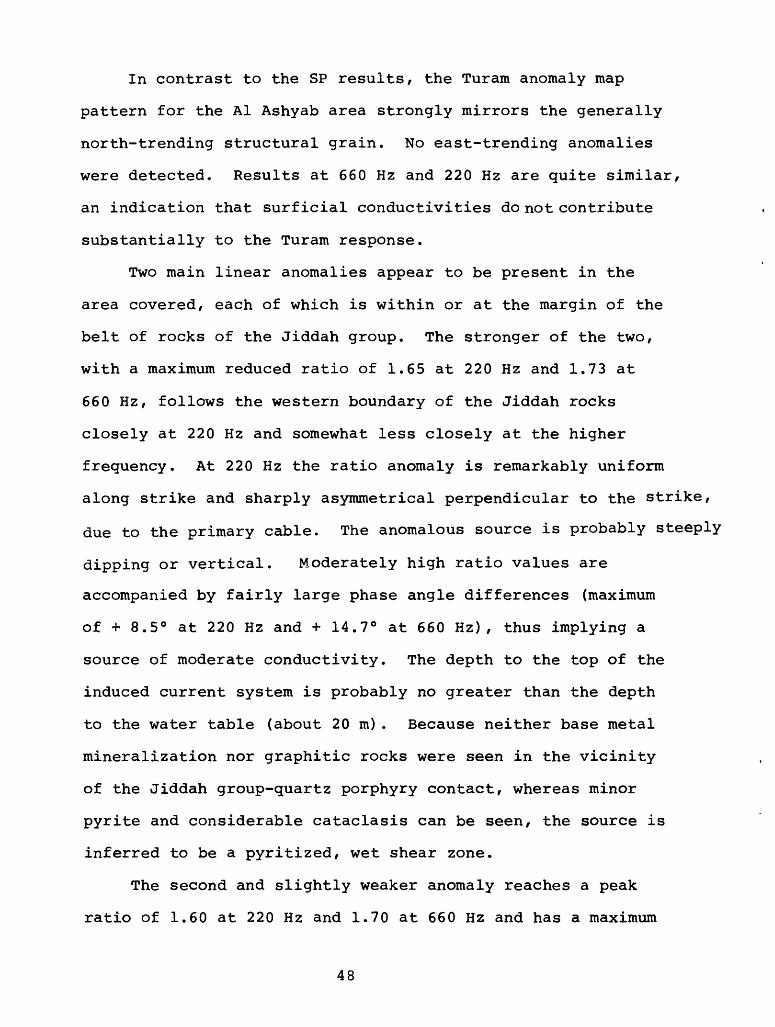
In contrast to the SP results, the Turam anomaly map
pattern for the Al Ashyab area strongly mirrors the generally
north-trending structural grain. No east-trending anomalies
were detected. Results at 660 Hz and 220 Hz are quite similar,
an indication that surficial conductivities do not contribute
substantially to the Turam response.
Two main linear anomalies appear to be present in the
area covered, each of which is within or at the margin of the
belt of rocks of the Jiddah group. The stronger of the two,
with a maximum reduced ratio of 1.65 at 220 Hz and 1.73 at
660 Hz, follows the western boundary of the Jiddah rocks
closely at 220 Hz and somewhat less closely at the higher
frequency. At 220 Hz the ratio anomaly is remarkably uniform
along strike and sharply asymmetrical perpendicular to the strike,
due to the primary cable. The anomalous source is probably steeply
dipping or vertical. Moderately high ratio values are
accompanied by fairly large phase angle differences (maximum
of + 8.5° at 220 Hz and + 14.7° at 660 Hz), thus implying a
source of moderate conductivity. The depth to the top of the
induced current system is probably no greater than the depth
to the water table (about 20 m). Because neither base metal
mineralization nor graphitic rocks were seen in the vicinity
of the Jiddah group-quartz porphyry contact, whereas minor
pyrite and considerable cataclasis can be seen, the source is
inferred to be a pyritized, wet shear zone.
The second and slightly weaker anomaly reaches a peak
ratio of 1.60 at 220 Hz and 1.70 at 660 Hz and has a maximum
48
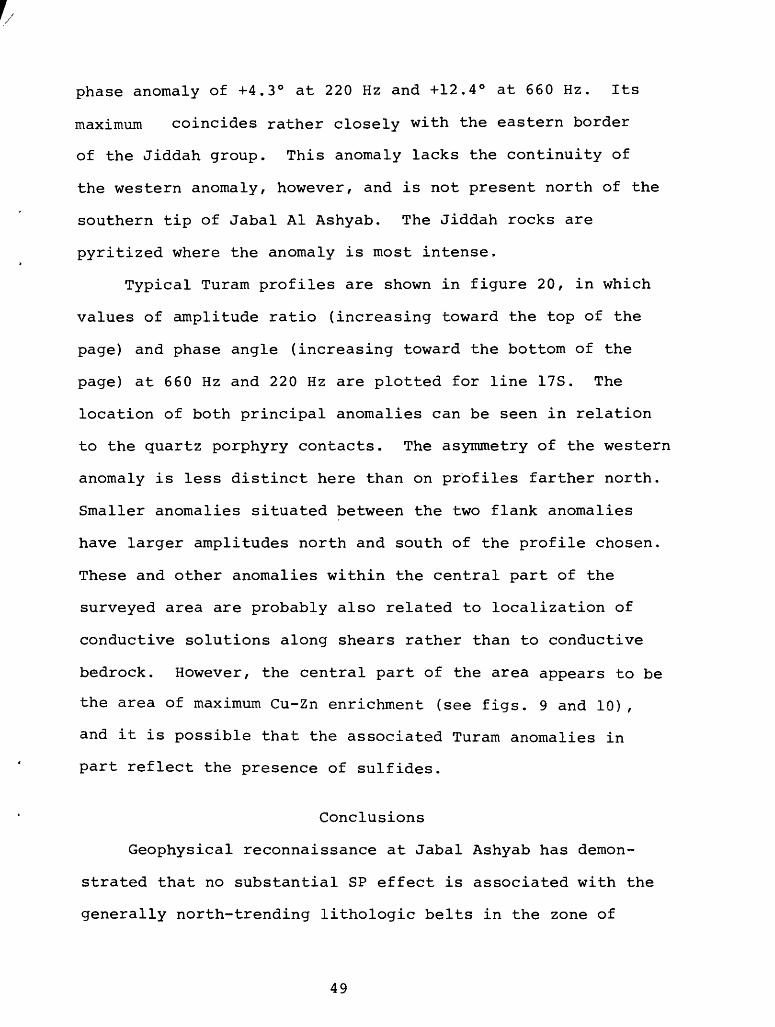
phase anomaly of +4.3° at 220 Hz and +12.4° at 660 Hz. Its
maximum coincides rather closely with the eastern border
of the Jiddah group. This anomaly lacks the continuity of
the western anomaly, however, and is not present north of the
southern tip of Jabal Al Ashyab. The Jiddah rocks are
pyritized where the anomaly is most intense.
Typical Turam profiles are shown in figure 20, in which
values of amplitude ratio (increasing toward the top of the
page) and phase angle (increasing toward the bottom of the
page) at 660 Hz and 220 Hz are plotted for line 17S. The
location of both principal anomalies can be seen in relation
to the quartz porphyry contacts. The asymmetry of the western
anomaly is less distinct here than on profiles farther north.
Smaller anomalies situated between the two flank anomalies
have larger amplitudes north and south of the profile chosen.
These and other anomalies within the central part of the
surveyed area are probably also related to localization of
conductive solutions along shears rather than to conductive
bedrock. However, the central part of the area appears to be
the area of maximum Cu-Zn enrichment (see figs. 9 and 10),
and it is possible that the associated Turam anomalies in
part reflect the presence of sulfides.
Conclusions
Geophysical reconnaissance at Jabal Ashyab has demon
strated that no substantial SP effect is associated with the
generally north-trending lithologic belts in the zone of
49
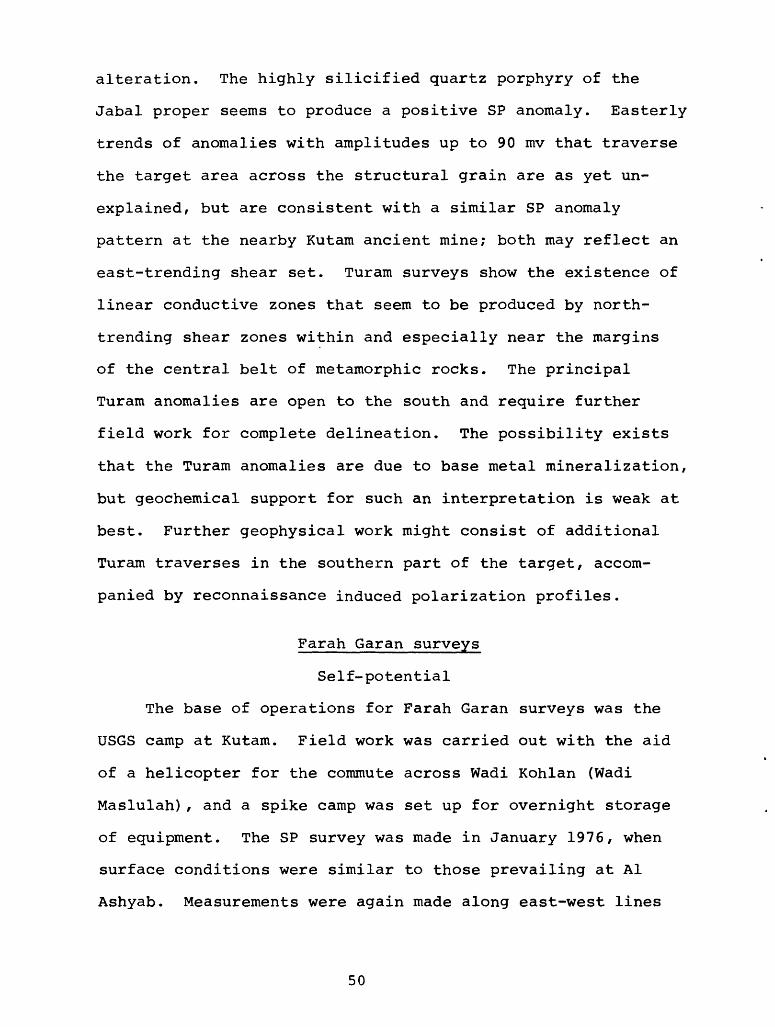
alteration. The highly silicified quartz porphyry of the
Jabal proper seems to produce a positive SP anomaly. Easterly
trends of anomalies with amplitudes up to 90 mv that traverse
the target area across the structural grain are as yet un
explained, but are consistent with a similar SP anomaly
pattern at the nearby Kutam ancient mine; both may reflect an
east-trending shear set. Turam surveys show the existence of
linear conductive zones that seem to be produced by north-
trending shear zones within and especially near the margins
of the central belt of metamorphic rocks. The principal
Turam anomalies are open to the south and require further
field work for complete delineation. The possibility exists
that the Turam anomalies are due to base metal mineralization,
but geochemical support for such an interpretation is weak at
best. Further geophysical work might consist of additional
Turam traverses in the southern part of the target, accom
panied by reconnaissance induced polarization profiles.
Farah Garan surveys
Self-potential
The base of operations for Farah Garan surveys was the
USGS camp at Kutam. Field work was carried out with the aid
of a helicopter for the commute across Wadi Kohlan (Wadi
Maslulah), and a spike camp was set up for overnight storage
of equipment. The SP survey was made in January 1976, when
surface conditions were similar to those prevailing at Al
Ashyab. Measurements were again made along east-west lines
50
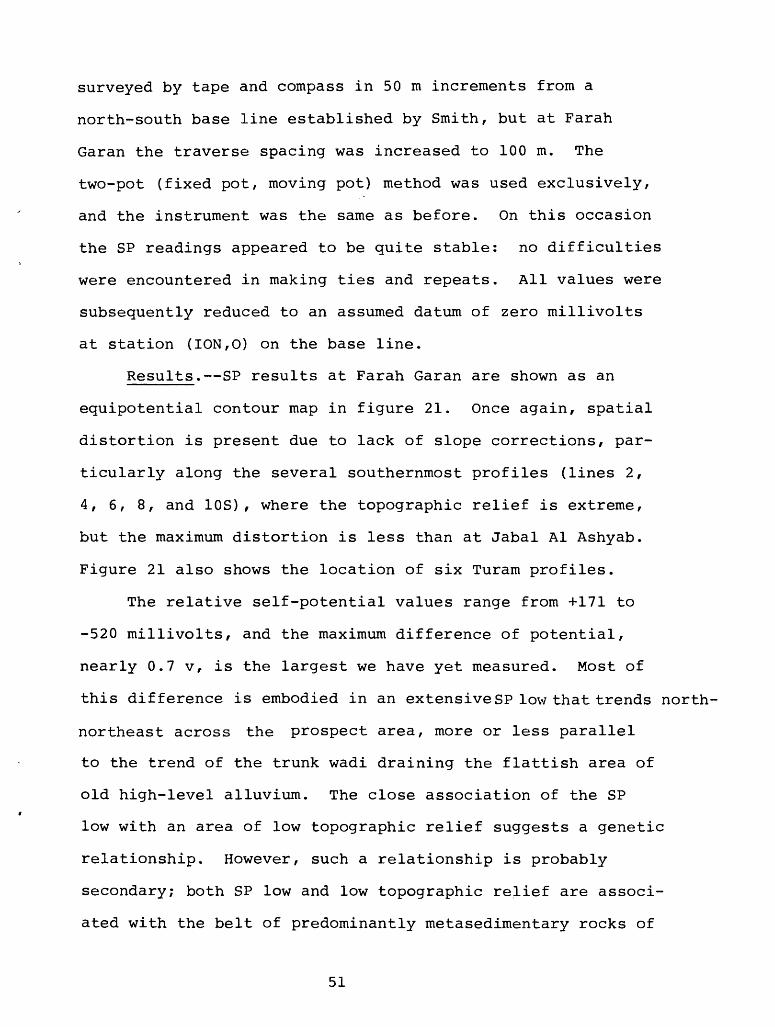
surveyed by tape and compass in 50 m increments from a
north-south base line established by Smith, but at Farah
Garan the traverse spacing was increased to 100 m. The
two-pot (fixed pot, moving pot) method was used exclusively,
and the instrument was the same as before. On this occasion
the SP readings appeared to be quite stable: no difficulties
were encountered in making ties and repeats. All values were
subsequently reduced to an assumed datum of zero millivolts
at station (ION,O) on the base line.
Results. SP results at Farah Garan are shown as an
equipotential contour map in figure 21. Once again, spatial
distortion is present due to lack of slope corrections, par
ticularly along the several southernmost profiles (lines 2,
4, 6, 8, and 10S), where the topographic relief is extreme,
but the maximum distortion is less than at Jabal Al Ashyab.
Figure 21 also shows the location of six Turam profiles.
The relative self-potential values range from +171 to
-520 millivolts, and the maximum difference of potential,
nearly 0.7 v f is the largest we have yet measured. Most of
this difference is embodied in an extensive SP low that trends north-
northeast across the prospect area, more or less parallel
to the trend of the trunk wadi draining the flattish area of
old high-level alluvium. The close association of the SP
low with an area of low topographic relief suggests a genetic
relationship. However, such a relationship is probably
secondary; both SP low and low topographic relief are associ
ated with the belt of predominantly metasedimentary rocks of
51
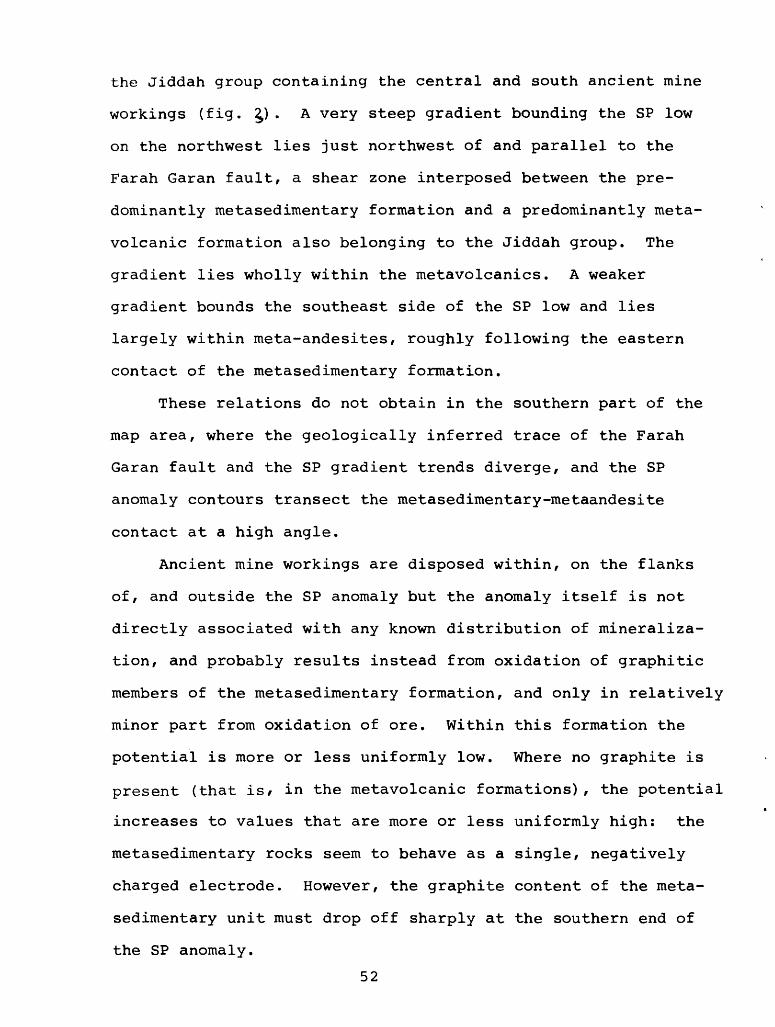
the Jiddah group containing the central and south ancient mine
workings (fig. £). A very steep gradient bounding the SP low
on the northwest lies just northwest of and parallel to the
Farah Garan fault, a shear zone interposed between the pre
dominantly metasedimentary formation and a predominantly meta-
volcanic formation also belonging to the Jiddah group. The
gradient lies wholly within the metavolcanics. A weaker
gradient bounds the southeast side of the SP low and lies
largely within meta-andesites , roughly following the eastern
contact of the metasedimentary formation.
These relations do not obtain in the southern part of the
map area, where the geologically inferred trace of the Farah
Garan fault and the SP gradient trends diverge, and the SP
anomaly contours transect the metasedimentary-metaandesite
contact at a high angle.
Ancient mine workings are disposed within, on the flanks
of, and outside the SP anomaly but the anomaly itself is not
directly associated with any known distribution of mineraliza
tion, and probably results instead from oxidation of graphitic
members of the metasedimentary formation, and only in relatively
minor part from oxidation of ore. Within this formation the
potential is more or less uniformly low. Where no graphite is
present (that is/ in the metavolcanic formations), the potential
increases to values that are more or less uniformly high: the
metasedimentary rocks seem to behave as a single, negatively
charged electrode. However, the graphite content of the meta
sedimentary unit must drop off sharply at the southern end of
the SP anomaly.
52
Inspection of the SP map shows that there are in fact a
number of discrete minima within the principal low. In most
cases the shapes of these minima are not well represented by
the contours because of the wide traverse spacing (100 m),
and therefore their geologic association is difficult to
judge. Some or all may result from oxidation of local con
centrations of sulfides. However, it is equally likely that
they too are produced by graphite.
Two sets of northerly SP trends seen on the equipotential
map may reflect the influence of secondary structural elements
auxiliary to the Farah Garan fault. The more westerly of the
two extends south from Smith's base line and is closely associ
ated with the central and south ancient workings. The more
easterly set is not associated with any known mineralization
but extends into an area not yet mapped. It may coincide in
part with a strong Turam anomaly found on the traverse of line
A, although the validity of the latter anomaly is suspect (see
next section). In any case the area covered by both sets of
northerly SP trends should probably be thoroughly prospected.
Turam
The six reconnaissance Turam lines labelled A-F in figure
21 were surveyed in February 1976 as a test of the Farah Garan
shear zone. A source cable 2.3 km in length was laid out on
a bearing of 023°, about 100 m offset from the first station
on the traverse lines. The Turam system was again the new ABEM
TS-4. Grounding at the southwest end was accomplished easily
53
in wet sands of a rock-walled wadi tributary to Wadi Kohlan,
and the north-northeast electrode was buried with much more
difficulty in a rocky gully. In spite of the relatively short
length of the traverse lines, it was not possible to obtain an
accurate null in all cases at their eastern extremities due to
loss of signal strength.
Results. The Turam data are shown as combined contour
maps of reduced amplitude ratio and relative phase angle in
figures 22-25. Plot points on the traverses are very approxi
mate owing both to lack of slope correction, which particularly
affects position on lines E and F where the terrane falls off
quite rapidly towards Wadi Kohlan, and to the fact that the
line was oriented by hand-held Brunton compass as the receivers
were advanced from station to station by the length of the
standard 40 m connecting cable. Also the rendering of contour
lines from widely spaced traverse data is hazardous. Neverthe
less, the inductive response of the target area can be quali-
tively evaluated.
The anomaly at the eastern end of line A is the strongest
recorded but because of the weakness of the signal received it
is possibly in error, as stated previously. This aside, two
major Turam anomalies were delineated. The more intense anomaly
appears on both lines A and B, and opens to the north, whereas
the weaker of the two is apparently centered on line D. These
anomalies are colinear but discrete. The current concentra
tions are located on or just east of the Farah Garan fault; the
northern anomaly and perhaps both anomalies, are directly associ-
54
ated with layers of graphitic schist in the metasedimentary
formation. For line A the association was established by
successively halving the receiver separation, until it was
revealed that the anomaly source coincides with a near-vertical
bed of graphitic schist 5-10 m thick with surface outcrops.
Therefore the anomaly is caused either by the graphite or by
concealed sulfides in the graphitic zone its source could be
no deeper than about 20 m or approximately the depth to the
base of the zone of oxidation (or water table).
Rocks traversed in the vicinity of the ancient workings
did not produce any appreciable disturbance of the Turam field.
Metavolcanic rocks west of the Farah Garan fault produce
almost no reponse even where mineralized.
Conclusions. The combination of highly conductive graphite
beds and sulfide mineralization is a particularly difficult
challenge for geophysical investigations, and on the basis of
work to date, the possibility of sulfide contributions to
either the Turam or the SP anomalies cannot be ruled out
entirely. On the other hand the outlook is not favorable.
It must be considered likely that both effects are produced
by the graphite schist component of the predominantly meta
sedimentary formation of the Jiddah group.
A Turam survey at closer traverse spacing might provide
better evidence on the relation of inductive anomalies to
geochemical anomalies and to mappable graphitic units. If
preliminary drilling results are encouraging, consideration
55
should be given to completing the Turam or another electro
magnetic survey, and to carrying out a mise-a-la-masse IP
(induced polarization) survey.
REFERENCES CITED
Anderson, R. E., 1978, Geology of the Mayza quadrangle, sheet
17/43 B, Kingdom of Saudi Arabia: Saudi Arabian Director
ate General of Mineral Resources Geologic Map GM-31,
scale 1:100,000.
Greenwood, W. R., Hadley, D. G., Anderson, R. E., Fleck, R. J.,
and Schmidt, D. L., 1976, Late Proterozoic cratonization
in southwestern Saudi Arabia: Royal Society of London
Philosophical Transactions, A, v. 280, p. 517-527.
56
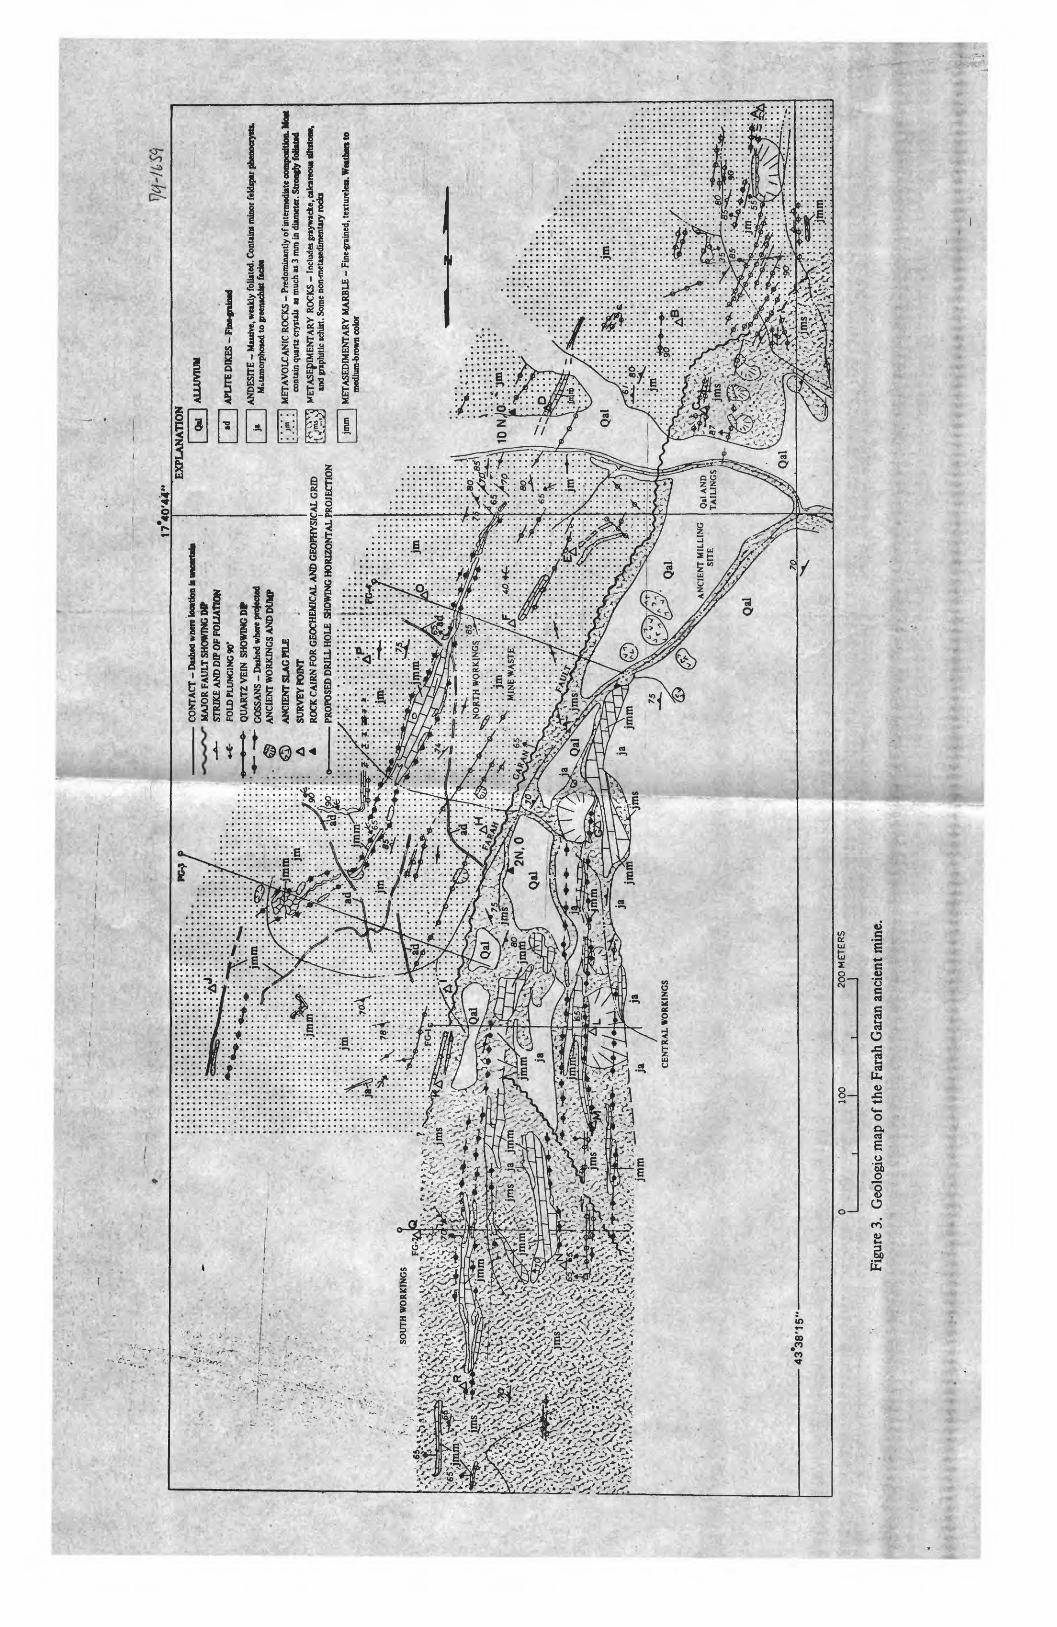
CON
TACT
- D
ashe
d w
nen
loca
tion
fc M
AJO
R FA
ULT
SH
OW
ING
DIP
-o-
STR
IKE
AN
D D
IP O
F FO
LIA
TIO
N«-
-
FOLD
PLU
NG
ING
90'
e
e o
-
QU
AR
TZ V
EIN
SH
OW
ING
Ds?
GO
SSA
NS - D
ashe
d w
here
pro
ject
ed
AN
CIEN
T W
ORK
ING
S A
ND
DU
MP
AN
CIEN
T SL
AG
PIL
E A
SU
RV
EY P
OIN
T
AN
DES
rTE -
Mas
sive,
wea
kly
folia
ted.
Con
tain
s m
inor
feld
spar
phe
nocr
yita
.M
etam
orph
osed
to g
reen
achi
tt fa
cial
MET
AV
OLC
AN
IC R
OCK
S -
Pred
omin
antly
of i
nter
med
iate
com
petit
ion.
Moa
tco
ntai
n qu
artz
cry
stals
as m
uch
as 3
mm
in d
iam
eter
. Stro
ngly
foBa
tMl
MET
ASE
DIM
ENTA
RY R
OCK
S -
Incl
udes
gra
ywac
ke, c
alca
reou
s aflt
ttone
.RO
CK C
AIR
N F
OR
GEO
CHEM
ICA
L A
ND
GEO
PHY
SICA
L G
RID
and
grap
hitic
sch
ist.
Som
e no
n-m
etas
edim
enta
ry ro
cks
PRO
POSE
D D
RIL
L H
OLE
SH
OW
ING
HO
RIZO
NTA
L PR
OJE
CTIO
N
MET
ASE
DIM
ENTA
RY M
ARB
LE - F
ine-
grai
ned,
text
urel
en. W
eath
en to
S^Q
alN
<»>J
ins>
(cP
^£&
^
Figu
re 3
. G
eolo
gic
map
of t
he F
arah
Gar
an a
ncie
nt m
ine.
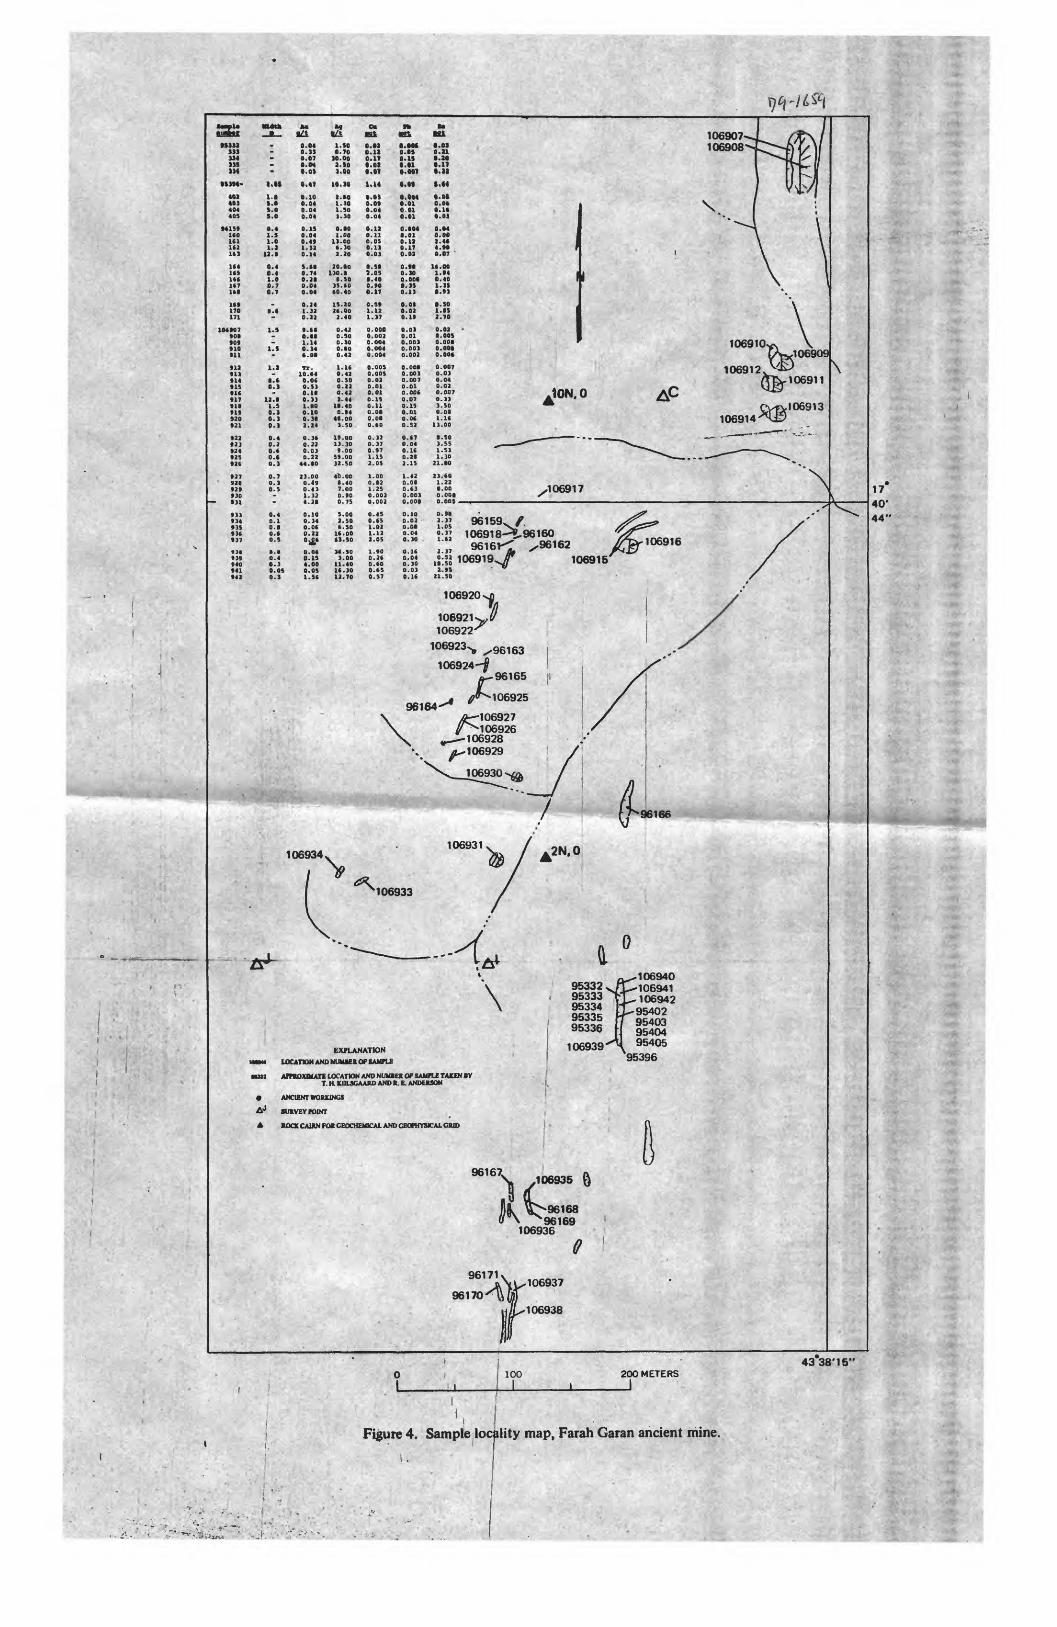
»! 8-fauc
u1114ISi«i»-»>i94DS
SI
fl(2tl
14ts»t17tl
tl7071
0701 011011121114ISIf1711112021
222)242S2f
27212*1011
1)14ISIt17
Jt)!404142
> »m
t.ot1.0S.OS.OS.O
0.4
1.01.2
12.1
0.40.41.00.70.7
.t.f-
l.S
Il.S
.04
.11
.07
.M
.01
.«1
.10
.04
.04
.04
.IS
.41
.12
.14
.tl
.74
.21
.04
.04
.24
.11
.22
.ft
.It
.14
.14t.ot
l.a Tr.10.44
i.« o.ofo.i o.s)
12.1l.S0.10.10.1
0.40.2O.fO.f0.1 4
0.7 20.1O.S
_-
0.40.1O.Io.tO.S
t.t0.40.)o.os0.1
.11
.1)
.10
.10
.11
.24
.If
.22
.0)
.22
.10
.00
.49
.4)
.12
.21
.10
.14
.Of
.22j£f
.04
.IS
.00
.OS
.Sf
l.SO0.70
10.002. SO1.00
10,10
1.401.10l.SO1.10
0.10
11.004.102.20
20.101)0.1
t.SOIS. 40tO. 40
IS. 20at. oo2.40
0.42o.so0.10o.to0.42
l.lf0.42O.SO0.220.421.44
11.400.14
41.00l.SO
11.0011.101.00
SI. 0011.50
40.004.407.000.100.7S
S.OO2. SOf.SOit .00
2 .ia110}01
14
010»0404
12 11OS110)
SIOS
.40
.10
.17
.SI
.12
.17
.000
.004
.004
.004
.DOS
.OOS
.02
.01
.01
.IS
.11 0
.01 0
.01
.60
.12
.17
.97
.IS
.OS
.00
.12
.25
.002
.002
.45
.fS
.02
.12tl.SO 2. OS
14. SO l.*0 01.00 0.24 0
11.40 O.fO 0it. 10 o.ts o12.70 0.57 0
01ai a* 11 ai 4
t04 U01
040044
.SO
.IS
.70
.02
.OOS
.001
.001
.004)
.007
.0)
.04
.02
.007
.))
.so
.01
.If
.00
.so
.55
.51
.10
.10
106907106908
,_... _ION 0 «»*"» »» AC
106910
106912 V ^
106914
\
,106917
96159.. f NJT '
j|» 1069192..1S
21. SO
1OfiQ1fi IlKKMD
106920'J10692V 106922
106923,
106924-f
96164
96165
106925
,£ -106927 4?^106926
106928
1 06934106931
106933
(L0
AJ
EXPLANATION
LOCATION AND NUMBER OF SAMPLE
APPROXIMATE LOCATION AND NUMBER OF SAMPLE TAKEN BY T. H KlILSCAARD AND R. E. ANDERSON
ANCIENT WORKINGS
SURVEY POINT - . "* " ^:
ROCK CAIRN FOR CEOCHEMICAL AND GEOPHYSICAL GRID
95332.95333953349533595336
106939'
&96169
106936
9
1740' 44'
4338*16*
100I
200 METERS
Figure 4. Sample locality map, Farah Garan ancient mine.
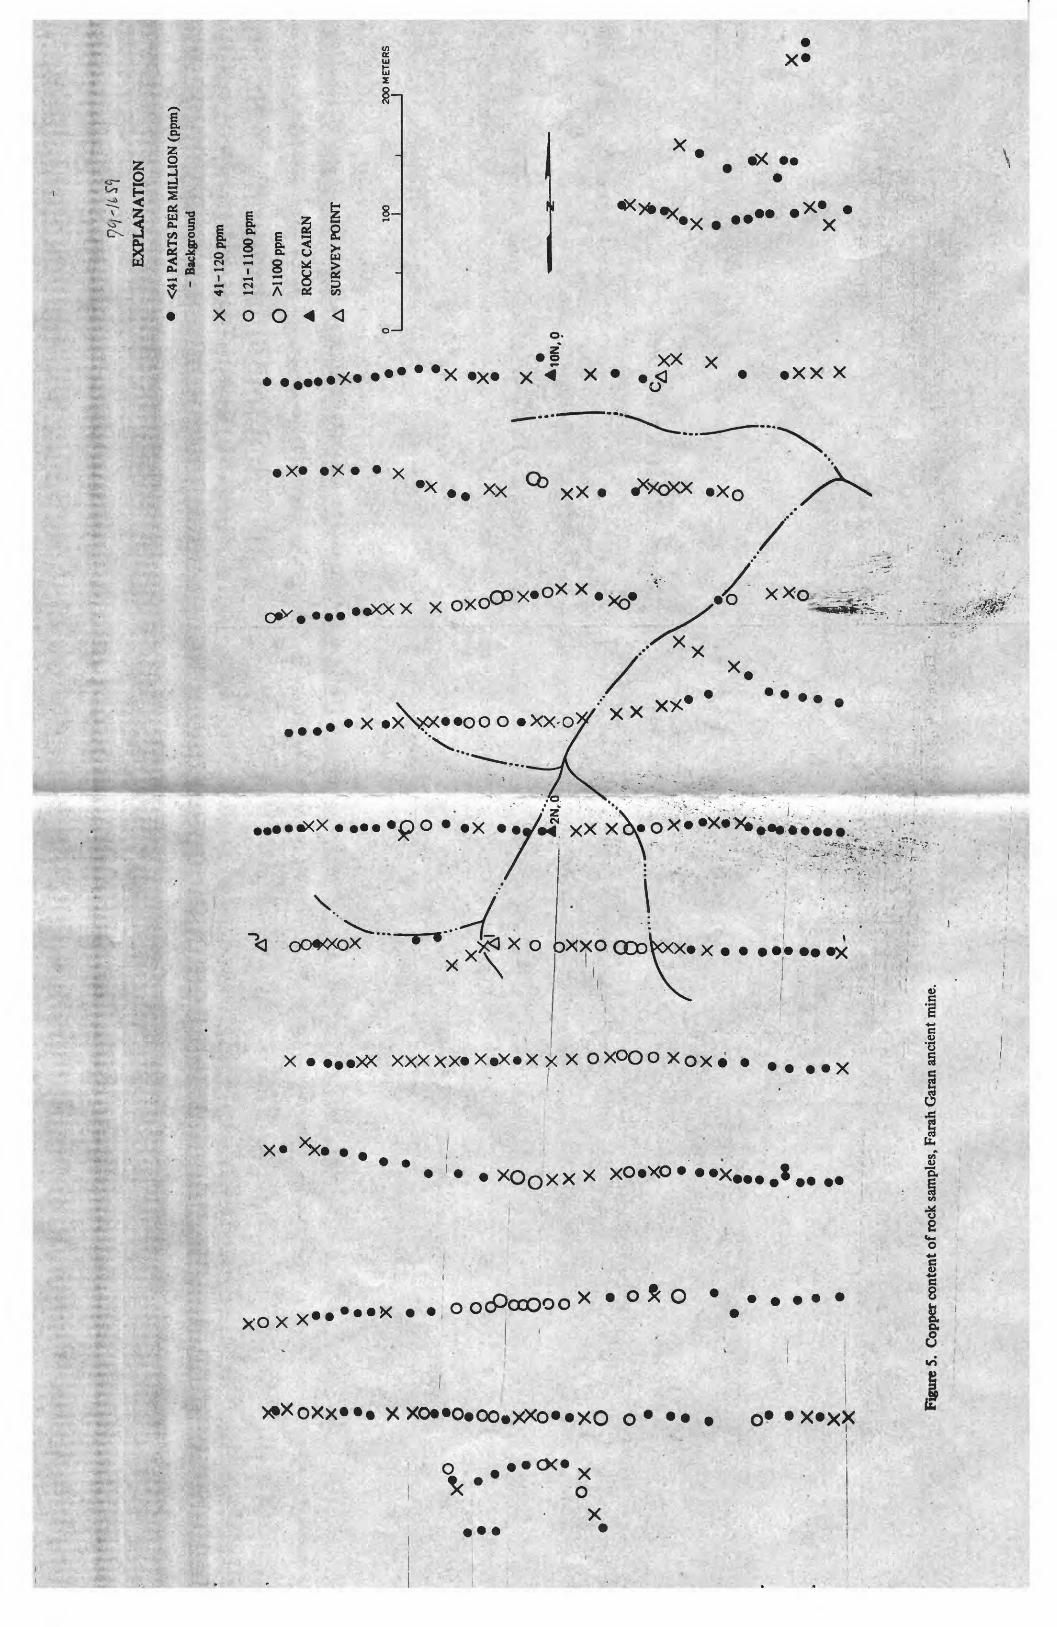
EX
PLA
NA
TIO
N
<41
PAR
TS P
ER M
ILLI
ON
(pp
m)
- B
ackg
roun
d
XV
O y
X O
Xx
x
X
X
x^
~ J -
.
.X
*°
0
00
0
1 &
-5
! -i
J
o v
°x
x
x»
°
0
o
r o
0-
o
X
*
x
X^F
£̂ _"__
g 0 x X X X o 1 0 X :~
X 0 1 X
X
X X X 1^
«^ X X o % o X o X - ; X
AJ
f\ g x
/o V i
X
'.
X/>
l"*^^^
/\l
^^.
X o~~
~o
X x
. .--
' o 8 A" X Q ^ ! j.
,(
w'
i i ft-; x
\.
>o o X
-. i.
X
41-
120
ppm
O
121-
llOO
ppm
O
¥,
^
O
>1 1
00 p
pm
<
X
0
A
RO
CK
CA
IRN
*
*
J
X
v
A
SUR
VEY
PO
INT
-. ^*
y
! 0
*X
y
A
0 10
0 20
0 M
ETER
S
rx
x
i i
i i
i
/ .
x x*
:!
/ :
o x
j ;
o x
I/O
0
x
XI.
-7
o Q
^
/ 5
« p
\ xx.
' '
"**^
^ A
A
v
1 ""
" "'"
\s
S^^.
vj
A
1
X / ^
X
X
X *
./
^v
!
*^P
^ I
y
^^
*^ <L
/
X ;
- i
' X
X
\ v
X
X
ye;
x \
I x
x
>«
I
x
/**
, . ?
vx
I
v
x
iV
X
\ A
£
s .x
\
I
-i-V
:"
5 N
j
. s
? '
x
: ^
^
* /
y
X
IV J
1
*9
\ /
x *
" i«
.*
' i '
'
' i. '
. , .
1
X
X
Jr'v
/
,.?
-V
>.;
^
Figu
re S
. C
oppe
r con
tent
of r
ock
sam
ples
, Far
ah G
aran
anc
ient
min
e.
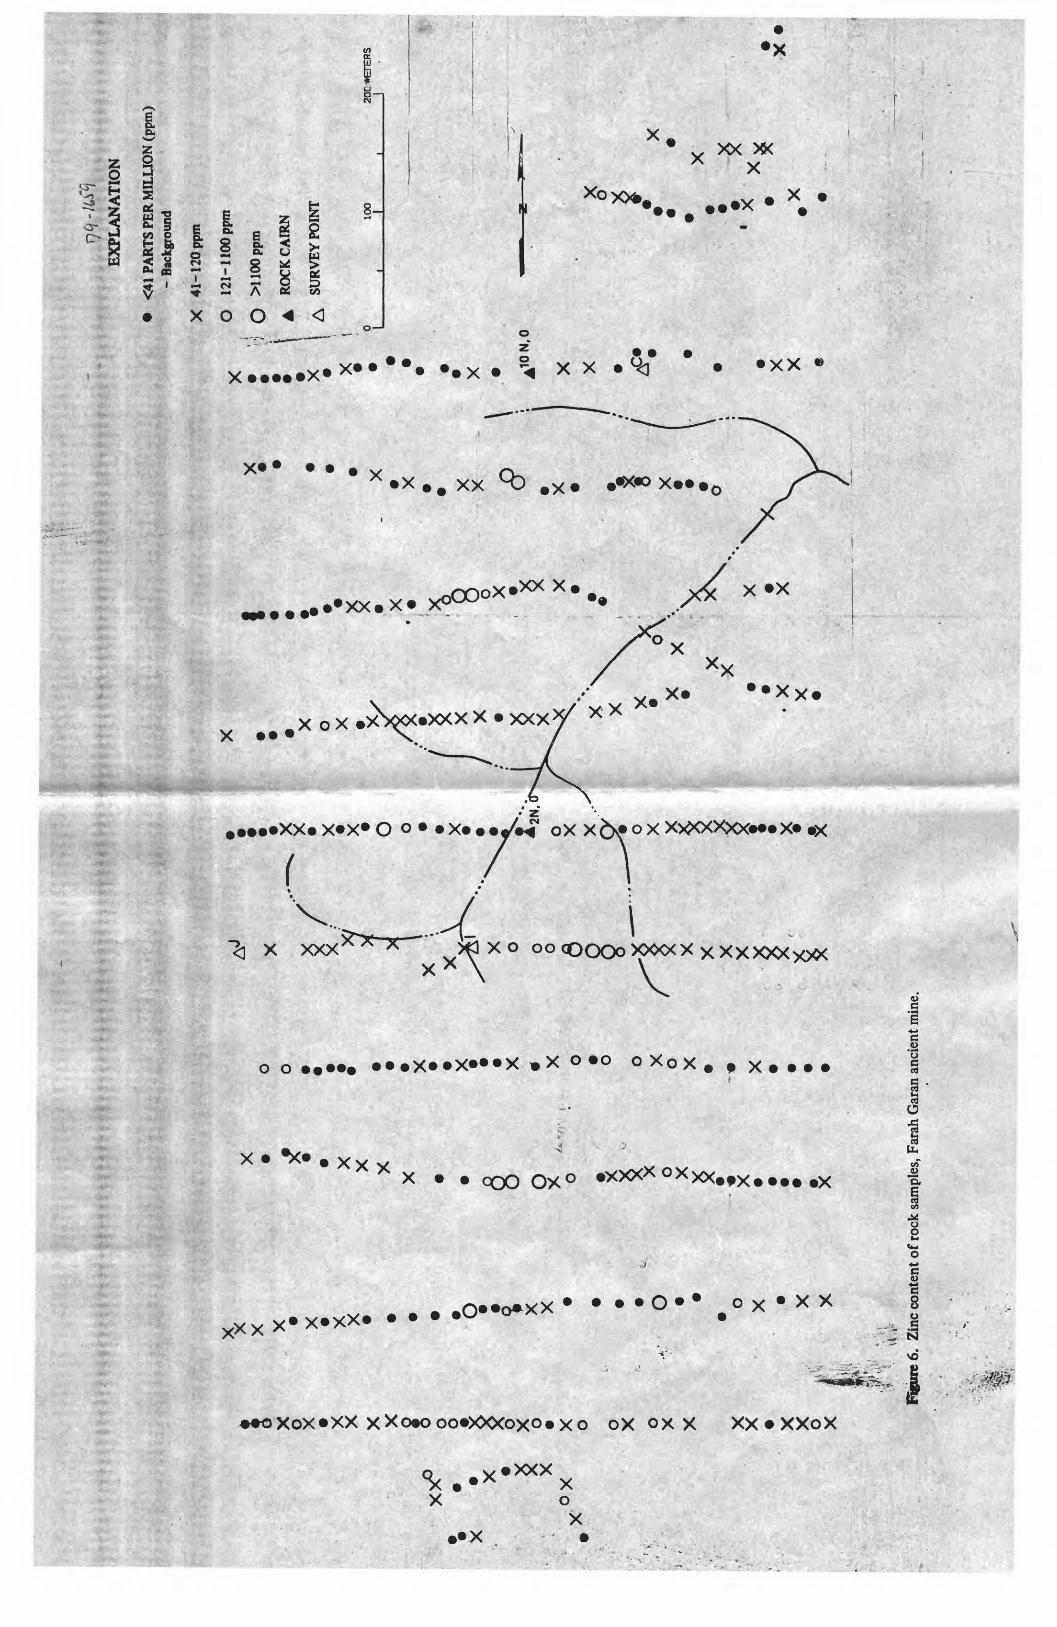
xx°
X X
OX
! X o
X X
X X
X o o A O X o X o o X o X X
X X
X o X
X X X
X o X
X O o
X X
X
X
X X o X o ft X
o
X X ft
o o X X o o X o X "
X
X X X X X
EX
PLA
NA
TIO
N
<41
PAR
TS P
ER M
ILLI
ON
(pp
m)
- B
ackg
roun
d
X
41-1
20 p
pm
O
121-
1100
ppm
] O
>H
OO
ppm
A
RO
CK
CA
IRN
A
SUR
VEY
PO
INT
100
2DC
*ET
ER
S I_
______|_
______I
X
X
: x*
>x ~
-
X
Figu
re 6
. Zi
nc c
onte
nt o
f roc
k sa
mpl
es, F
arah
Gar
an a
ncie
nt m
ine.
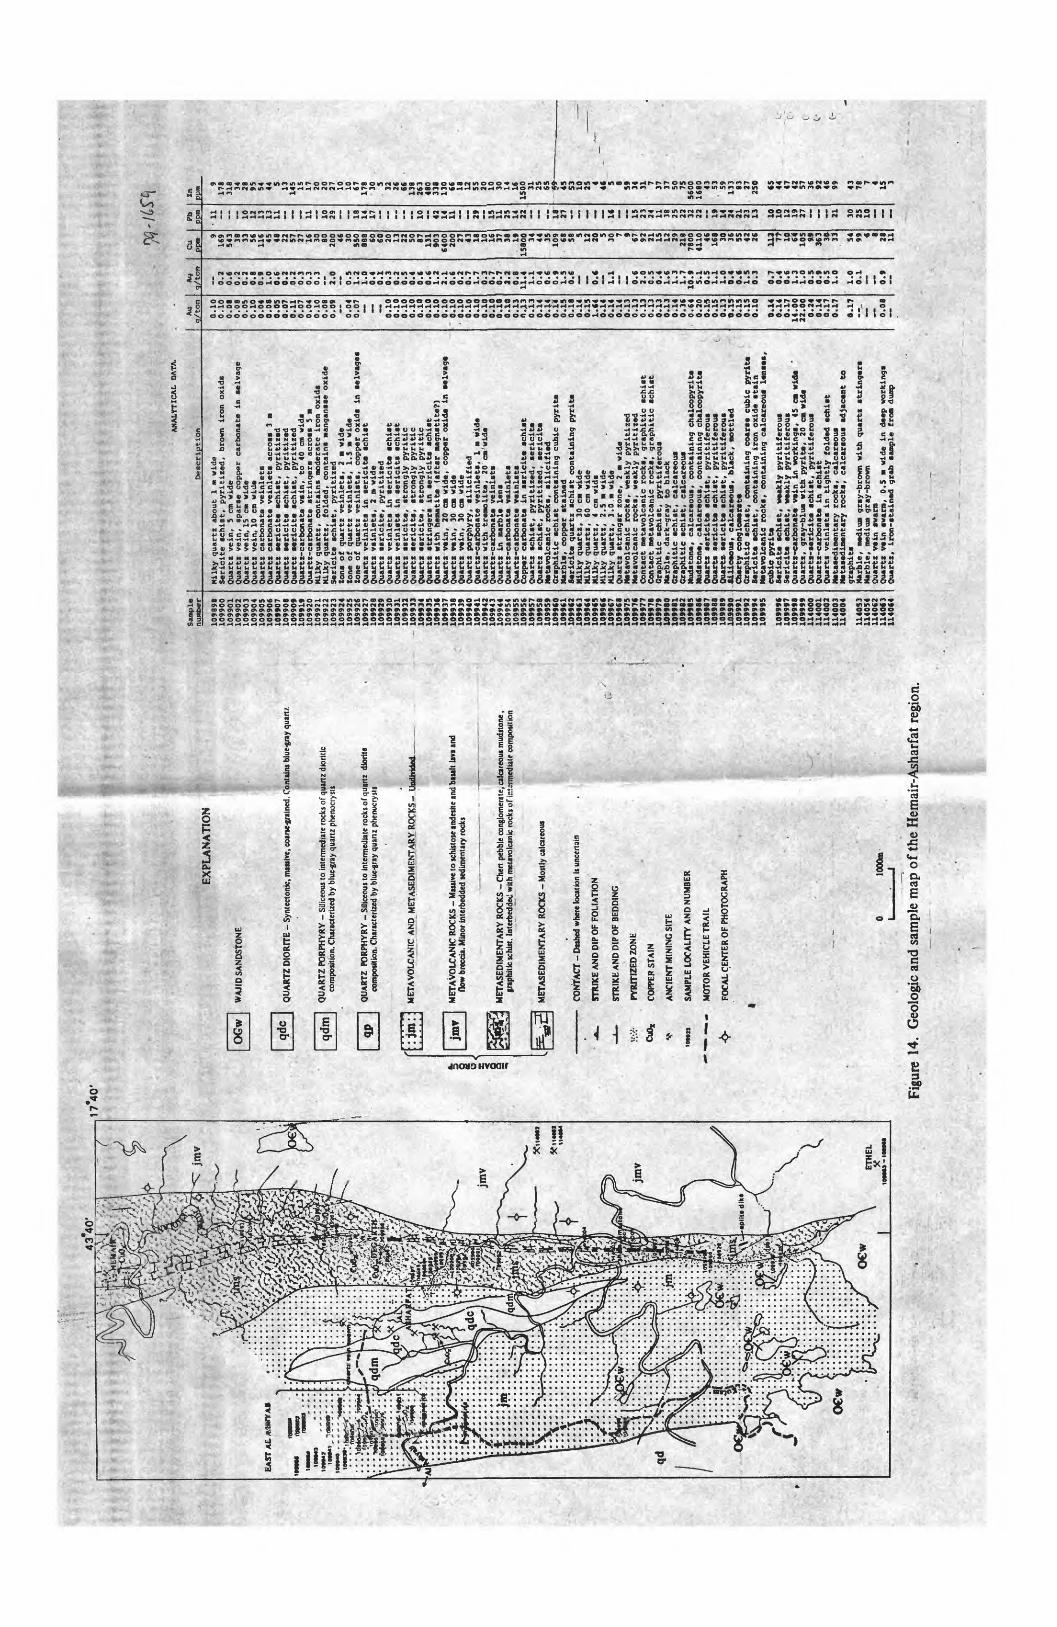
4340'
17
40
'
QUA
RTZ
DIO
RITE
- S
ynte
cton
ic, m
issiv
e, co
ane-
griin
ed. C
onta
ins b
lue-g
ray
quar
t/.
EXPL
AN
ATI
ON
OG
W
WAJ
ID S
ANDS
TONE
Qd
m
QU
ART
Z PO
RPH
YRY
- S
ilice
ous
to in
term
edia
te r
ocks
of q
uartz
dio
ritic
"
com
posi
tion.
Cha
ract
eriz
ed b
y bl
ue-g
ray
quar
tz p
heno
crvs
ts
QUAR
TZ P
ORP
HY
RY -
Silic
eous
to I
nter
med
iate
roc
ks o
f qua
rtz d
iorit
eco
mpo
sitio
n. C
hara
cter
ized
by b
lue-
gray
qua
nz p
heno
crys
is
:: ME
TAVO
LCAN
IC A
ND M
ETAS
EDIM
ENTA
RY R
OCKS
-_un
dMdo
d,___
_
MET
AVO
LCAN
IC R
OCK
S -
Mas
sive t
o sc
hist
ose a
ndes
ite a
nd b
asal
t lav
a an
dflo
w b
recc
ia. M
inor
inte
rbed
ded
sedi
men
tary
roc
ks
CuOx
MET
ASED
IMEN
TARY
RO
CKS -
Cher
t pe
bble
cong
lom
erat
e, ca
lcare
ous m
udst
one,
gr
aphi
tic sc
hist.
Int
erbe
ddeU
with
meu
volc
anic
roc
ks o
f ir.t
iraied
iate
com
posit
ion
MET
ASED
IMEN
TARY
RO
CKS -
Mos
tly c
alca
reou
s
CONT
ACT
- Da
shed
whe
re lo
catio
n Is
unce
rtai
n
STRI
KE
AND
DIP
OF
FOLI
ATIO
N
STRI
KE
AND
DIP
OF
BEDD
ING
PYRI
TIZE
D ZO
NE
COPP
ER S
TAIN
ANCI
ENT
MIN
ING
SIT
E
SAM
PLE
LOCA
LITY
AND
NUM
BER
MOT
OR V
EHIC
LE T
RAIL
FOCA
L CE
NTER
OF
PHO
TOG
RAPH
AN
AL
YT
ICA
L
DA
TA
.
1000
m
Samp
le
numb
er
109891
109900
1099
01109902
109903
109904
109905
109906
109907
109908
109909
109919
109920
109921
109922
109923
109924
109925
109926
109927
109928
109929
109930
109931
109932
109933
109934
1099
35109936
109937
1099
38109939
109940
1099
41109942
109943
109944
109954
109955
109956
1099
57109958
1099
59
1099
CO109961
1099C2
1099
631099(4
1099
C51Q
99CC
109967
109968
1099
7510997C
1099
77109978
1099
7910
9980
1099
81109982
1099
1510998C
109987
109988
109989
103930
1099
91109992
109994
1099
95
1099
9C10
9997
109998
109999
114000
114001
114002
1140
03114004
114053
114054
114062
1140
63114064
Desc
ript
ion
Milk
y quartz ab
out
1 * wi
deSe
rici
te schist,
pyritized, br
own
iron
ox
ids
Quar
tz vein,
5 cm
wid
eQuartz vein,
sparse co
pper
ca
rbon
ate
in se
lvag
eQu
artz
ve
in, IS cm
wid
eQu
artz
vein, 10 cm wid
eQu
artz
ca
rbon
ate
vein
lets
Quar
tz ca
rbon
ate
vein
lets
across 3
Quar
tz se
rici
te schist,
pyri
tize
dQu
artz
se
rici
te schist,
pyri
tize
dQu
artz
se
rici
te sc
hist,
pyri
tize
dQu
artz
-car
bona
te vsin,
to 40
cm wid
sQu
artz
-csr
bona
te st
ring
ers
across 5
Milk
y quartz,
cont
ains
mo
dera
te ir
on ox
ids
Milk
y qu
artz
, fo
lded
, co
ntai
ns m
anga
nsse
oxide
Seri
cite
sc
hist
, py
riti
zed
Ions
of
quartz veinlets,
2 wi
delone o
f quartz veinlets,
1.5
wi
delone o
f qu
artz
veinlsts,
copp
er o
xids
in
se
lvag
esQuartz ve
inle
ts in
se
rici
te sc
hist
Quartz v
sinlets, 2
t» wide
Quartz ssricite,
pyri
tize
dQuartz ve
inle
ts in
se
rici
te sc
hist
Quartz ve
inls
ts in
se
rici
ts schist
Quartz ssricite,
stro
ngly
py
riti
cQuartz sericits,
stro
ngly
pyritic
Quarts ssricite,
stro
ngly
pyritic
Quartz st
ring
ers
in se
rici
ts sc
hist
Quartz with
hema
tite
(aftsr m
agnstite?)
Quartz vein,
20 cm wide, co
pper
ox
ide
in se
lvag
eQuartz ve
in,
30 cm wid
eQuartz vein,
30 cm wide
Quartz porphyry,
sili
cifi
edQuartz-carbonate veinlets,
1 m Wi
deQuartz with
trem
olit
e, 20
cm'wide
Quar
tz-c
arbo
nate
ve
inls
tsQuartz in
ma
rble
lens
Quartz-carbonate ve
lnle
tsQuartz-carbonate ve
inls
tsCo
pper
car
bona
te in
ss
rici
te schist
Quartz sc
hist
, pyritized, se
rici
teQuartz schist,
pyri
tize
d, se
rici
teMetavolcanic ro
cks,
silicified
Grap
hiti
c sc
hist
containing cu
bic
pyri
te
Marb
le,
copp
er stained
Seri
cite
quartz schist containing pyrite
Milk
y quartz,
30 cm wid
eMi
lky
quartz,
60 cm
wide
Milk
y quartz,
4 cm
wid
sMi
lky
quar
tz,
2.5 m wide
Milk
y quartz,
3.0.
m wi
deQu
artz
st
ring
sr zo
ne,
2 m wide
Meta
volc
anic
ro
cks,
we
akly
py
riti
zed
Meta
volc
anic
ro
cks,
weakly py
riti
zed
Cont
act
meta
volc
anic
rocks, gr
aphi
tic
schi
stCo
ntac
t me
tavo
lcan
ic ro
cks,
gr
aphi
tic
schi
stGraphitic
schi
st,
pyri
tife
rous
Marb
le,
dark
-gra
y to
bl
ack
Grap
hiti
c schist,
calc
areo
usGr
aphi
tic
schist,
calc
areo
usMudstone,
calc
areo
us,
containing ch
alco
pyri
teMu
ds ton
e, ca
lcar
eous
, containing chalcopyrite
Quar
tz se
rici
te sc
hist
, pyritiferous
Quar
ts se
rici
te schist,
pyritiferous
(Qu
arts
- se
rici
te schist,
pyri
tife
rous
Sili
ceou
s, ca
lcar
eous
, bl
ack,
mo
ttle
dCh
erty
con
glom
erat
eGr
sphi
tio
schist,
containing co
arse
cu
bic
pyrite
'Se
rici
te sc
hist
, containing ir
on o
xide
st
ain
Metavolcanic rocks, containing ca
lcar
eous
lenses,
cubi
c pyrite
Seri
cite
sch
ist,
weakly
pyritiferous
Seri
cite
schist,
weakly py
riti
fero
usQu
arts
-car
bona
te ve
in in
wo
rkin
gs,
45 cm wid
eQuartz,
gray
-blu
e with p
yrite, 20
cm wid
eQu
arts
-ser
icit
e schist,
pyri
tife
rous
Quar
tz-c
arbo
nate
in
sc
hist
Quartz ve
inls
ts in ti
ghtl
y fo
lded
sc
hist
Meta
sedi
ment
ary
rocks, ca
lcar
eous
Meta
sedi
ment
ary
rocks, calcarsous ad
jace
nt to
grap
hits
Marble,
medi
um g
ray-brown
with
qua
rtz
stri
nger
sMa
rble
, me
dium
gray-brown
Quartz vein sw
arm
Quartz vein swarm, 0.
5 m
wide
in
de
ep workings
Quar
tz,
iron-stained gr
ab sa
mple
fr
om dum
p
Auq/
ton
a. 10
0.10
0.08
0.08
0.05
0.10
0.04
0.08
0.05
0.07
0.11
0.07
0.04
0.10
0.08
0.09 0.04
0.07 ~ 0.10
0.10
0.10
0.10
0.10
0.10
0.10
0.10
0.10
0.10
0.10
0.10
0.10
0.10
0.10
0.10
0.13
0..13
0.13
0.14
0.*4
0.14
0.15
0.18
0.14
0.15
1.C4
0.14
0.14
0.14
0.13
0.13
0.13
0.13
0.13
0.13
0.14
0.36
0.64
0.20
0.14
0.15
0.13
fl.13
0.15
0.15
0.10
0.14
0.14
0.17
14.0
022
.00
0.24
0.14
0.17
0.17
0.17
- __
0.
08--
**
q/to
n
__ 0.2
0.6
0.2
0.2
0.8
0.9
1.0
0.6
0.2
0.2
0.3
0.3
0.3
-- 2.0
0.5
1.2
1.0
0.4
O.X
0.3
0.2
b.s
0.4
0.6
0.6
1.2
2.1
0.6
0.2
0.7
1.7
0.3
0.7
0.7
2.2
0.8
11.4 1.1
0.4
0.6
0.9
1.5
0.6~ o.c" 1.
1« ~ 0.
62.
0C.
S0.
41.
61.3
1.7
10.9 5.1
0.5
1.1
1.0
0.4
O.C
1.5
0.3
0.7
0.4
0.6
1.3
1.0
0.5
0.9
0.5
1.0
1.0
0.1
0.
9
Cujp»
916
954
3 38 33 56 116 45 48 22 57 27 16 30 80 200 46 30 550
888 60 60 20 13 22 SO 87 131
903
6400 200 27 43 18 10 16 37 38
. 19
15800 34 44 35
109 68 58 5 12
20 5 30 7 9 67 92 21 IS 12 29 218
7800
4110 46 168 30 36 55 42 26 112 7t 10 64 105 9* 363 30 33 54 99 « 8
28 11
Pb ppn
11 ~ -- 10 12 13 13 11 11 10 29 - 18 14 17 -
-- -- 10 -- 42 14 11 29
15 11 25 14 22 18 27 _ 1C 15 23 24 11 38 25 22 32 22 -- 19 14 24 21 23 13 10 10 12 19 27 -- 21 30 25 10 ~ ~
Zn ppm 9
178
318 34 28 95 54 44 5 13 145 15 17 20 20 27 10 10 67 178 30
.5 32 26 66
13
8263
480
338
130 66 18 12 55 20 10 30 14 16
1500 31 25 65 59
______
45 53 10
n% 4
*-
46
5 8 59 34 31 7 37 37 50 7556
001680 43
. 53 59
133 83 27 250 CS 44
(.47
V
42
* 57
c
36 ;
92
<-'46
(
99
t-
43 78 7 4 IS3
Figu
re 1
4. G
eolo
gic
and
sam
ple
map
of t
he H
emai
r-A
shar
fat r
egio
n.