SAI PRASAD A J V Analytical Standardization of Ayurvedic Formulation JAPER
Upload
khangminh22Category
view
0download
0
The Borneol Cycle of Cytochrome P450cam and
Evolution of the Enzyme for New Applications
by
Brinda Prasad
M.Sc., University of Pune, 2006 B.Sc., Osmania University, 2004
Thesis Submitted in Partial Fulfillment
of the Requirements for the Degree of
Doctor of Philosophy
in the
Department of Chemistry
Faculty of Science
Brinda Prasad 2013
SIMON FRASER UNIVERSITY
Summer 2013
All rights reserved. However, in accordance with the Copyright Act of Canada, this work may
be reproduced, without authorization, under the conditions for “Fair Dealing.” Therefore, limited reproduction of this work for the
purposes of private study, research, criticism, review and news reporting is likely to be in accordance with the law, particularly if cited appropriately.
ii
Approval
Name: Brinda Prasad
Degree: Doctor of Philosophy (Chemistry)
Title of Thesis: The Borneol Cycle of Cytochrome P450cam and Evolution of the enzyme for new applications
Examining Committee:
Chair: Dr. Michael H. Eikerling, Position
Dr. Erika Plettner Senior Supervisor Professor
Dr. David Vocadlo Supervisor Professor
Dr. Dipankar Sen Supervisor Professor
Dr. Daniel B. Leznoff Internal Examiner Professor Department of Chemistry
Lindsay Eltis External Examiner Professor Department of Chemistry University of British Columbia
Date Defended/Approved: April 10, 2013

iii
Partial Copyright Licence
iv
Abstract
Cytochrome P450cam isolated from the soil bacterium Pseudomonas putida
catalyses the hydroxylation of camphor to 5-exo-hydroxy camphor and further to 5-
ketocamphor. Unexpectedly, we have also observed the formation of the reduction
product, borneol in our enzymatic assays performed under shunt conditions using meta-
chloro perbenzoic acid (m-CPBA) or with the complete P450 system under low O2
conditions. Under shunt conditions using m-CPBA, borneol was the major product. To
further demonstrate the origin of Hexo in borneol, we monitored the bioconversion of
camphor in deuterated buffer (pD = 7.4) under shunt conditions using m-CPBA as the
oxidant and mono-deuterated borneol at C-2 was detected. We demonstrate that the
source of electrons for this reduction reaction is water and not the nicotinamide cofactor.
When 17O labeled buffer was used in the reaction mixture, labeled hydrogen peroxide
(H217O2) formed. We propose a novel reduction mechanism for P450cam, discuss its
generality and also the ecological implications of this reaction for P. putida and E. coli.
To accommodate unnatural substrates in the active site, a mutant library of
P450cam was constructed by Sequence Saturation Mutagenesis (SeSaM). With an
objective to identify mutants from SeSaM library that would dehalogenate the chlorinated
pesticide endosulfan, the library was screened with 3-chloroindole as a substrate and
the active clone(s) were identified by isatin/indigo formation. The mutant
(E156G/V247F/V253G/F256S) was the most active in the conversion of 3-chloroindole
to isatin, (KM = 250 µM) compared to the WT enzyme (which did not accept 3-
chloroindole). The mutant also degrades endosulfan and endosulfan diol to
pthalaldialdehyde under shunt conditions using m-CPBA. We propose a mechanism for
the dechlorination of endosulfan and the formation of pthalaldialdehyde with mutant
(E156G/V247F/V253G/F256S) of P450cam.
Keywords: peroxide shunt; camphor; borneol; SeSaM; endosulfan; pthalaldialdehyde

v
Dedication
To my parents and my husband
for their love and encouragement

vi
Acknowledgements
I am grateful to my senior supervisor, Dr. Erika Plettner for the support and
encouragement in my research. I am thankful to her for trusting me and giving enormous
opportunities to learn the novel techniques. I would like to thank my supervisors, Dr.
David Vocadlo and Dr. Dipankar Sen for their ideas and valuable suggestions. I also
thank Dr. Daniel B. Leznoff and Dr. Lindsay Eltis for being my thesis examiners.
I am grateful to Dr. Andrew Lewis for teaching me to run my NMR samples and
for all the support and encouragement with my research projects. Many thanks to Dr.
Ulrich Schwaneberg at RWTH University, Aachen, Germany for allowing me to work in
his laboratory and learn the SeSaM technique.
I am thankful to Dr. Carlos Castillo for teaching me the basic microbiological
techniques during the start of my research. Mr. Jason Nardella and Ms. Parisa Ebrahimi
are thanked for their valuable support and friendly conversations. In addition, I would like
to thank all the past and present group members: Dr. Yongmei Gong, Dr. Anoma
Mudalige, Dr. Hao Chen, Dr. Yang Yu, Mr. Derrick J. Mah, Ms. Linda Cameron, Ms.
Yulia Rozen, Mr. Govardhana reddy Pinneli, Mr. Abdul Rehman and the lovely co-op
students for their support. I am indebted to thank all my friends, especially Swati Vartak,
Saswati Chakladar, Sankar Mohan, Cynthia Gershome, Tirtadipa Pradhan, Ketaki
Athani, Manku Rana, Aarati Sriram and Vidhya Ramanathan for their timely help. I would
like to thank Dr. A. Parameswaran’s family for being so supportive to me in the tough
times of my research.
I am grateful to my parents, Amrutha Prasad and Nagaraja R. Prasad for their
continued encouragement which helped me to finish my thesis. My heartfelt thanks to
my husband, Mr. Magesh Rao for his understanding and patience with my completion
without which I could not have accomplished so far.

vii
Table of Contents
Approval .......................................................................................................................... ii Partial Copyright Licence ............................................................................................... iii Abstract .......................................................................................................................... iv Dedication ....................................................................................................................... v Acknowledgements ........................................................................................................ vi Table of Contents .......................................................................................................... vii List of Tables .................................................................................................................. xi List of Schemes and Figures ......................................................................................... xiii List of Acronyms and Abbreviations ..............................................................................xxi
1. Introduction .......................................................................................................... 1 1.1. Cytochrome P450s: Importance and Classification ................................................. 1 1.2. Catalytic cycle of P450s ......................................................................................... 3
1.2.1. Peroxide shunt ............................................................................................ 5 1.2.2. Other reactions ........................................................................................... 6
1.2.2.1. Alkene epoxidation ....................................................................... 7 1.2.2.2. Dealkylation reactions ................................................................... 8 1.2.2.3. Dehydrogenation reactions ........................................................... 8 1.2.2.4. Baeyer Villiger oxidation ............................................................... 9 1.2.2.5. P450 as an aromatase ................................................................ 10 1.2.2.6. Dehalogenation reactions ........................................................... 11 1.2.2.7. Oxidative decarbonylation .......................................................... 11 1.2.2.8. Biosynthesis of cyanogenic glucosides ....................................... 12
1.3. Structural aspects ................................................................................................. 12 1.4. Protein Engineering with P450cam ......................................................................... 17
1.4.1. Alkanes ..................................................................................................... 17 1.4.2. Polychlorinated and aromatic pollutants .................................................... 18
1.5. Other P450s ......................................................................................................... 19 1.6. Recent advances in the use of P450s: ................................................................. 22 1.7. Reactivity of P450cam ............................................................................................ 24 1.8. Objectives of my thesis ......................................................................................... 26 1.9. Thesis layout ........................................................................................................ 26
2. Identification of Camphor Oxidation and Reduction Products in Pseudomonas Putida. New Activity of the Cytochrome P450cam System ....... 27
2.1. Abstract ................................................................................................................ 28 2.2. Introduction .......................................................................................................... 29 2.3. Materials and Methods ......................................................................................... 30
2.3.1. General methods and chemicals. .............................................................. 30 2.3.2. D(+) camphor purification .......................................................................... 31 2.3.3. NMR ......................................................................................................... 32 2.3.4. Protein production (from P. putida)160, 177 and the purification steps ........... 32 2.3.5. In vivo Assays with P. putida ..................................................................... 33

viii
2.3.6. In vitro Assays with Isolated P450cam, PdR, and PdX Complex ................. 33 2.3.7. Toxicity Assays of Tetracycline, DMSO, Camphor, and Borneol
against P. putida and E. coli ...................................................................... 34 2.3.8. IC50 Experiments with Camphor and Borneol against E. coli ..................... 35
2.4. Results ................................................................................................................. 36 2.4.1. Analysis of Products Formed in P. putida Culture with (1R)-(+)-
Camphor During in vivo Assays with Purified P450cam System .................. 36 2.4.2. In vitro assays with the partially purified P450cam, PdR and PdX
system: ..................................................................................................... 38 2.4.3. Enzymatic assays involving borneol as the substrate ................................ 41 2.4.4. Toxicity Assays for Camphor and Borneol ................................................. 41
2.5. Discussion ............................................................................................................ 42 2.6. Summary .............................................................................................................. 44 2.7. Supplementary information ................................................................................... 45
3. The Borneol Cycle of Cytochrome P450cam: Mechanism and Advantages to Pseudomonas Putida ................................................................ 46
3.1. Abstract ................................................................................................................ 47 3.2. Introduction .......................................................................................................... 48 3.3. Materials and Methods ......................................................................................... 49
3.3.1. General ..................................................................................................... 49 3.3.1.1. Materials ..................................................................................... 49 3.3.1.2. Methods...................................................................................... 50 3.3.1.3. Protein expression and purification ............................................. 51 3.3.1.4. Determination of new P450cam extinction coefficient .................... 52
3.3.2. Description of Enzymatic Assays .............................................................. 53 3.3.2.1. Assays with recombinant proteins............................................... 53 3.3.2.2. Steady-state kinetics................................................................... 53 3.3.2.3. Assays in D2O buffer .................................................................. 54 3.3.2.4. Assays with human P450 (CYP3A4). .......................................... 55 3.3.2.5. Assays with dithionite ................................................................. 55 3.3.2.6. Alignment of cytochromes P450 and superposition of
CYP101A1 (P450cam) and CYP3A4 ............................................ 55 3.3.2.7. The effect of camphor, borneol and DMSO on the
expression of P450cam, PdX, and PdR ........................................ 56 3.4. Results and Discussion ........................................................................................ 57
3.4.1. Reaction conditions leading to formation of borneol .................................. 57 3.4.2. Source of the 2-H in borneol. .................................................................... 59
3.4.2.1. Assays with other shunting agents .............................................. 61 3.4.2.2. 17O NMR of H2O2 ........................................................................ 62
3.4.3. Dependence of the H2O2 (17O) chemical shift on pH .................................. 64
3.4.4. Kinetic Isotope Effects (KIE) ...................................................................... 65 3.4.5. Determination of KM and kcat for borneol formation .................................... 66 3.4.6. Reduction Mechanism ............................................................................... 69 3.4.7. Thermodynamic calculations in hydroxylation and the borneol cycle ......... 71 3.4.8. Control experiments with reactive O2 species/quenchers: ......................... 79 3.4.9. Role of oxygen in the borneol cycle ........................................................... 82

ix
3.4.10. Toxicity assays of borneol, hydrogen peroxide with E. coli and P. putida ........................................................................................................ 84
3.4.11. Adaptive advantage of the borneol cycle to P. putida ................................ 86 3.5. Conclusions of this chapter ................................................................................... 90
4. Screening of Cytochrome P450cam SeSaM library with 3-chloroindole as the substrate to identify the dehalogenated metabolites of Endosulfan .......................................................................................................... 92
4.1. Introduction .......................................................................................................... 92 4.2. Materials and Methods ......................................................................................... 95
4.2.1. Experimental ............................................................................................. 95 4.2.2. SeSaM methodology ................................................................................. 96 4.2.3. Cloning of SeSaM libraries ........................................................................ 97 4.2.4. Preparation of 3-chloroindole .................................................................... 97 4.2.5. IC50 experiments with 3-chloroindole and endosulfan ................................ 98 4.2.6. Screening of 3-chloroindole with the SeSaM library using additives .......... 98 4.2.7. Protein expression with the selected clone(s):........................................... 99 4.2.8. In vitro assays with the mutated and the wild type P450cam proteins .......... 99 4.2.9. Determination of Cl- and H2O2 in the enzymatic assays by 35Cl and
17O NMR: ................................................................................................ 100 4.2.10. Steady-state kinetic assays for indole and 3-chloroindole
hydroxylation with the P450cam mutant(s):................................................ 100 4.2.11. Determination of Fe-CO absorbance at 450 nm ...................................... 100 4.2.12. MOE simulations ..................................................................................... 100 4.2.13. Screening of the SeSaM library with endosulfan as the substrate ........... 101 4.2.14. Transformation of the selected mutant in P. putida (ATCC 17453) 262 ..... 101 4.2.15. Biodegradation of endosulfan using P450cam SeSaM library .................... 102 4.2.16. In vitro assays with endosulfan as the substrate ..................................... 103 4.2.17. Biodegradation of endosulfan diol using P450cam mutant
(E156G/V247F/V253G/F256S) ............................................................... 103 4.2.18. In vitro assays with endosulfan diol as the substrate ............................... 104
4.3. Results ............................................................................................................... 104 4.3.1. Identification of active mutants for the hydroxylation of 3-
chloroindole ............................................................................................ 104 4.3.2. Steady-state kinetic analysis of the isolated mutants: .............................. 107 4.3.3. Proposed hypothesis for the formation of isatin: ...................................... 108 4.3.4. Screening of SeSaM library with endosulfan as the substrate: ................ 109 4.3.5. Biodegradation of endosulfan diol using the P450cam mutant (IND1)
isolated from 3-chloroindole screen:........................................................ 109 4.3.6. Biodegradation of endosulfan using the P450cam mutant
V247F/D297N/K314E (ES7) isolated from endosulfan screen:................ 111 4.3.7. Isolation and identification of metabolites obtained from the in vivo
and in vitro assays of endosulfan diol biodegradation: ............................ 112 4.3.8. Proposed mechanism in the biodegradation of endosulfan and the
formation of phthaldialdehyde: ................................................................ 114 4.3.9. Docking of 3-chloroindole in the active site of P450cam: ........................... 118 4.3.10. Docking of endosulfan diol in the active site of P450cam: ......................... 120 4.3.11. Docking of endosulfan dialdehyde in the active site of P450cam: .............. 122

x
4.4. Discussion .......................................................................................................... 125 4.5. Conclusions: ....................................................................................................... 126 4.6. Supplementary information ................................................................................. 128
4.6.1. Sequence Saturation Mutagenesis (SeSaM) ........................................... 128 4.6.1.1. Step 1 of SeSaM: ..................................................................... 128 4.6.1.2. Step 2 of SeSaM: Universal base addition ............................... 130 4.6.1.3. Step 3 of SeSaM: Full length gene synthesis ............................ 130 4.6.1.4. Step 4: Replacement of degenerate base ................................. 130
4.7. Supplementary Tables and Figures .................................................................... 132
5. Future work ....................................................................................................... 148
6. References ........................................................................................................ 153

xi
List of Tables
Table 1.1. Classic reactions reported for P450s ........................................................ 3
Table 1.2. Selected reactions of P450s to explain the versatility of the enzyme ..................................................................................................... 9
Table 1.3. P450cam mutants and their corresponding substrates (camphor analogues, alkanes) ............................................................................... 18
Table 1.4. P450cam mutants that accept halogenated and polycyclic aromatic mutants .................................................................................................. 19
Table 2.1. Assays with P450:PdR:PdX complex isolated from Pseudomonas putida ..................................................................................................... 40
Table 3.1 Calculated and literature values of P450cam extinction coefficients at selected wavelengths. ........................................................................ 53
Table 3.2. Assays with recombinant proteins. Formation of borneol, 5-exo-hydroxy camphor and 5-ketocamphor under various conditions. ............ 59
Table 3.3. Formation of 2-D-borneol and 5-ketocamphor in D2O buffer, with the full P450cam system and with the shunted P450cam. ........................... 61
Table 3.4. Formation of borneol and hydrogen peroxide from the P450 catalytic cycle using other shunt agents .................................................. 62
Table 3.5. Assays with recombinant P450cam under selected temperatures. Formation of borneol and D-borneol under shunt conditions with the addition of m-CPBA. ......................................................................... 66
Table 3.6. Assays with recombinant P450cam, shunted with m-CPBA in H2O and D2O at selected temperatures. Formation of H2O2 or D2O2. ............. 66
Table 3.7. Tests for involvement of free reactive oxygen species: formation of borneol, 5-ketocamphor and H2O2. ......................................................... 81
Table 4.1. Active mutants isolated by screening the P450cam SeSaM library with 3-chloroindole. ............................................................................... 105
Table 4.2. Active mutants isolated by screening the P450cam SeSaM library with 3-chloroindole. ............................................................................... 107
Table 4.3. Steady-state kinetic assays with the three most active mutants towards 3-chloroindole oxidation. ......................................................... 108
Table 4.S1. The results from SeSaM library validation ............................................ 147

xii
Table 4.S2. List of mutants obtained from the endosulfan screen with their sequences ............................................................................................ 147
xiii
List of Schemes and Figures
Scheme 1: The incorporation of oxygen in a non-activated hydrocarbon to form an alcohol ......................................................................................... 1
Figure 1.1. Catalytic cycle of cytochrome P450. The cycle, from species 1 to 8, shows the accepted pathway by which P450s couple the reduction of O2 to the oxidation of an organic substrate, represented here by RH. The bold horizontal lines on either side of Fe represent the porphyrin moiety. Path “a” shows the direct formation of the high-valent FeIV-oxo-porphyrin radical cation species (Compound I, Cpd I) by oxidants such as m-CPBA. Paths “b”-“c” represent uncoupling of O2 reduction from the oxidation of organic substrate. Intermediates 5, 6 and 7 participate in the substrate oxidation reactions shown. ........................................................ 5
Figure 1.2 The possible mechanisms of formation of Compounds I, II and ES from compound 0 by homolytic and heterolytic cleavage of the peroxo complex 6. When R=H in 6, the complex is known as Compound 0. ............................................................................................ 6
Figure 1.3. Two possible mechanisms by which (A) Compound 0 or (B) Compound I can epoxidise an alkene. ...................................................... 7
Figure 1.4. The desaturation of valproic acid catalysed by P4502B1 and its mechanism. .............................................................................................. 8
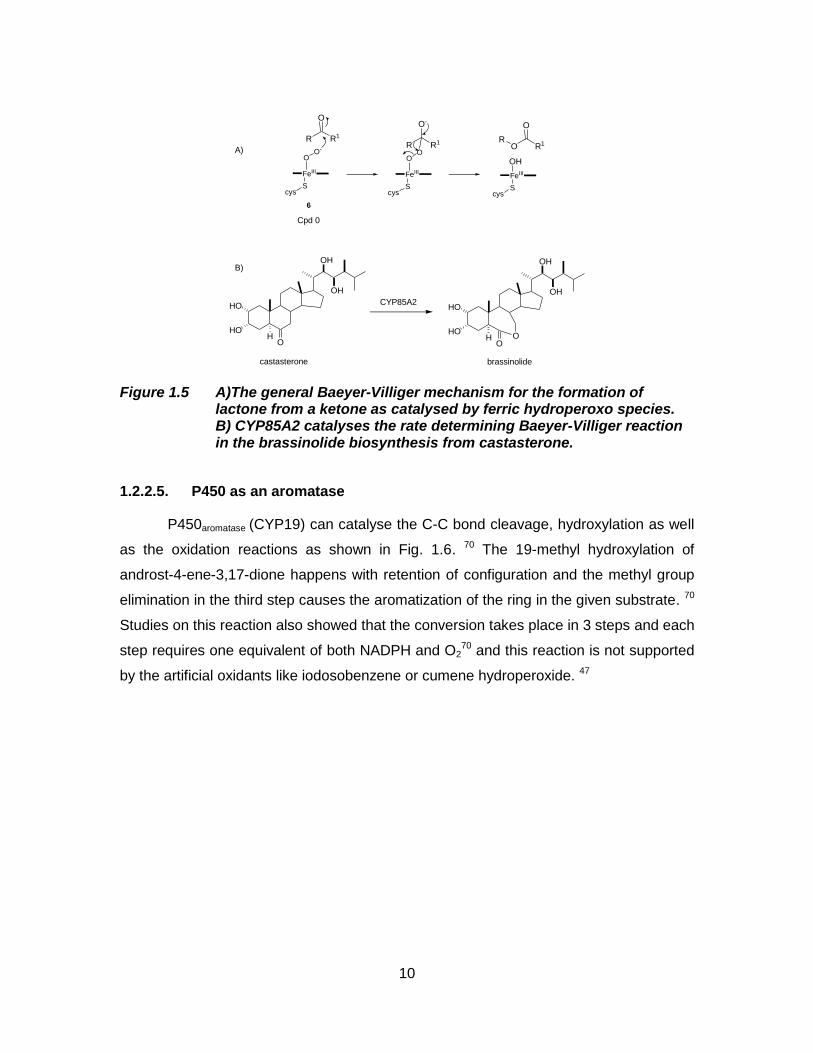
Figure 1.5 A)The general Baeyer-Villiger mechanism for the formation of lactone from a ketone as catalysed by ferric hydroperoxo species. B) CYP85A2 catalyses the rate determining Baeyer-Villiger reaction in the brassinolide biosynthesis from castasterone. .................. 10
Figure 1.6. The 19-methyl hydroxylation of androst-4-ene-3, 17-dione, formation of diol and the aromatisation of the ring as catalysed by human placenta aromatase. ................................................................... 11
Figure 1.7. P450cam (CYP101) catalyses the reductive dehalogenation of hexachloroethane ................................................................................... 11
Figure 1.8. Biosynthesis of linomarin and lotanstralin in cassava. ............................ 12
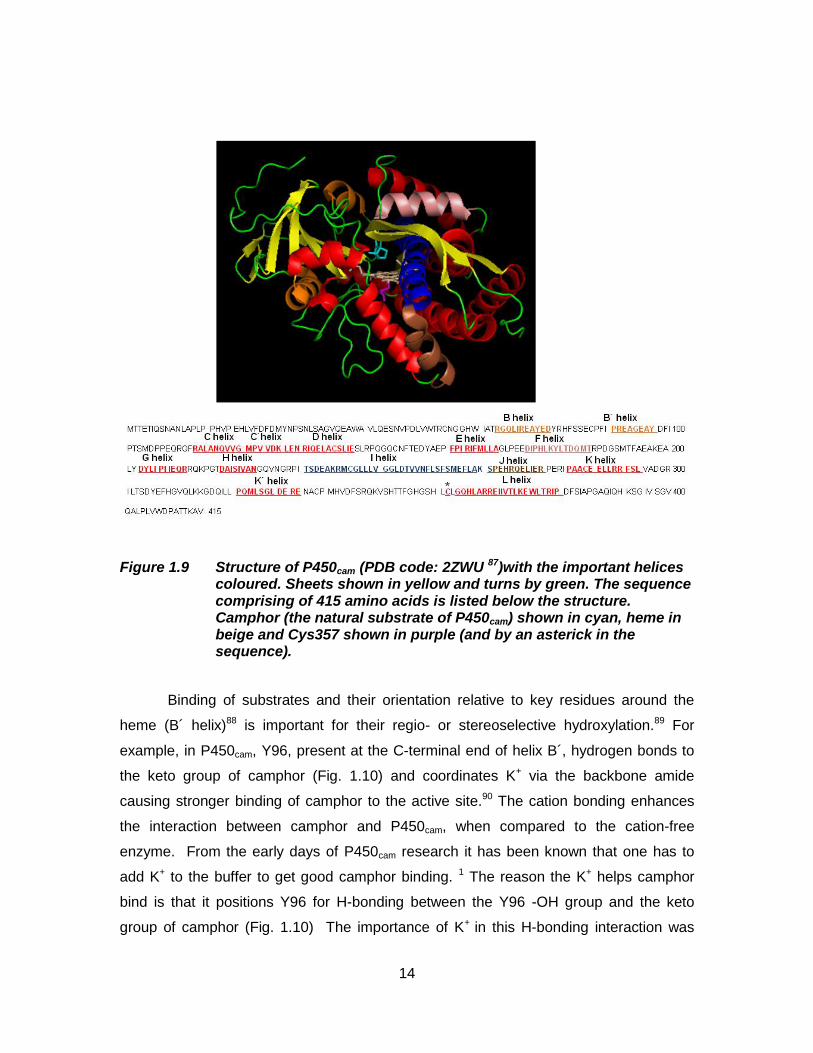
Figure 1.9 Structure of P450cam (PDB code: 2ZWU 87)with the important helices coloured. Sheets shown in yellow and turns by green. The sequence comprising of 415 amino acids is listed below the structure. Camphor (the natural substrate of P450cam) shown in cyan, heme in beige and Cys357 shown in purple (and by an asterick in the sequence). ....................................................................... 14

xiv
Figure 1.10. The hydrogen bond co-ordination between Y96 (present on B´ helix) and camphor (shown in cyan). PDB code 2ZWU 87 taken for studies. ................................................................................................... 15
Figure 1.11. T252 present in the I-helix (coloured by blue) of P450cam (A) helps in the proton shuttle mechanism and is substituted by N242 in P450cin (B). PDB code 2ZWU 87 taken for studies. ................................. 16
Figure 1.12 The hydrophobic residues present in the substrate binding pocket of P450cam. PDB code 2ZWU 87 taken for studies. ................................. 17
Figure 1.13. The biosynthesis of plant hormones, secondary metabolites (8´-hydroxyabscisic acid, glycyrrhizin) in plants by P450s ............................ 20
Figure 1.14. The synthesis of 20-hydroxyecdysone from cholesterol. ......................... 21
Figure 1.15. Conversion of chlorzoxazone by an engineered CYP102 variant ............ 21
Figure 2.1. The hydroxylation reaction of camphor: Formation of 5-exo-hydroxycamphor and 5-ketocamphor...................................................... 29
Figure 2.2. Borneol (12), the reduction product of camphor and isoborneol. Borneol is formed in P. putida but not isoborneol. ................................... 30
Figure 2.3. Time course quantities of 5-ketocamphor and borneol from an induced culture of Pseudomonas putida under aerated and non-aerated conditions. ................................................................................. 38
Figure 2.4. Toxicity assays for camphor and borneol in two strains of bacteria: ATCC 17453 of P. putida (a) and E. coli (b). ........................................... 42
Figure 2.5. IC50 experiments on Escherichia coli with varying concentrations of camphor and borneol. ............................................................................. 42
Supplementary figure 2.S1. The SDS-PAGE gel analysis of the proteins (P450cam, PdR and PdX) obtained after purification from anion-exchange (DE-52) column. Lanes 1, and 5 are molecular markers; Lane 2 is the BSA standard. Lanes 3, 4, 6, and 7 are the fractions collected from the DE-52 column. The arrows show the approximate positions where we expect P450cam (47 kDa), PdR (46 kDa) and PdX (12 kDa) to appear. .................................................... 45
Figure 3.1 Under highly oxygenated conditions, P450cam hydroxylates camphor (9) to 5-exo-hydroxy camphor (10) and further to 5-ketocamphor (11), whereas under low oxygen conditions, P450cam
reduces camphor to borneol (12). Details of the high O2 cycle are shown in Fig. 1.1 and the details of the low O2 cycle are shown in Fig. 3.6. .................................................................................................. 49

xv
Figure 3.2. 2H NMR of the 2-D-borneol obtained from the recombinant proteins incubated in 50 mM deuterated phosphate buffer (pD = 7.4) with camphor and m-CPBA. The extracted product was backwashed with H2O. ............................................................................ 60
Figure 3.3. 17O NMR spectrum of the incubation mixture in 17O phosphate buffer (pH 6.3) containing: a) camphor, recombinant P450cam and m-CPBA, b) camphor and recombinant P450cam (m-CPBA absent), c) camphor and m-CPBA (enzyme absent), and d) m-CPBA and recombinant P450cam (substrate absent). The peaks at 0 ppm and 178 ppm correspond to H2
17O and H217O2, respectively. ......................... 63
Figure 3.4. 17O NMR spectra of the incubation mixture under shunt conditions using 1 mM m-CPBA in 17O phosphate buffer (final pH 6.3) containing 1 mM substrate camphor and recombinant P450cam: a) before and b) after addition of catalase (1 unit). The peak at 178 ppm corresponds to H2
17O2 and that at 0 ppm is due to H217O. ............... 64
Figure 3.5. 17O NMR spectra of H217O2 (obtained by electrolysis of H2
17O) buffered at a) pH 10, b) pH 3, and c) pH 9. ............................................. 65
Figure 3.6 a) Michaelis-Menten kinetics for borneol and b) 5-ketocamphor formation, under shunt conditions (with m-CPBA). To ensure a constant high O2 concentration for the 5-ketocamphor formation kinetics, reactions were run in vials fitted with septa and pressurized with pure O2. ....................................................................... 68
Figure 3.7 The proposed reduction mechanism and the Born-Haber estimates. a) Proposed reduction mechanism of P450cam that accounts for the simultaneous formation of borneol (12) and H2O2 in a 1:1 stoichiometry. b) Born-Haber estimates of the reduction mechanism. ............................................................................................ 70
Figure 3.8 a) Summary of the borneol cycle steps and of the net reaction b) Possible routes by which the borneol cycle could end. ........................... 74

xvi
Figure 3.9. Alignment of microbial cytochromes P450 against P450cam (upper portion) and of vertebrate class II P450s, also against P450cam (lower portion). Microbial sequences used: gamma prot 1 = marine gamma proteobacterium HTCC2207 (ZP_01225512), Novo ar CYP = Novosphingbium aromaticivorans CYP 101D2 (PDB 3NV6), Sphingo echi = Sphingomonas echinoides ATCC14820 (ZP_10341012), Novo CYP 101D1 = a camphor hydroxylase from Novosphingobium aromaticivorans DSM 12444 (PDB 3LXI), Sphing chlor = Sphingomonas chlorophenolicum camphor hydroxylase (ZP_10341012), Azospir B510 = Azospirillium sp. B510 (YP_003451823), Azospir = (BAI74843), P450 Burk H160 = Burkholderia sp. H160 (ZP_03264429), P450 Burk MCO-3 Burkholderia cenocepacia MC0-3= (YP_001774494), Sping Witt R = Sphingomonas wittichii RW1 (YP_001262244), Citromicrobi = Citromicrobium bathyomarinum JL354 (ZP_06860768), Novo CYP 101 = Novosphingobium aromaticivorans DSM12444 CYP 101C1 (PDB 3OFT_C), Sping E 14820 = Sphingomonas echinoides ATCC 14820 (ZP_10339023), gamma prot 2 = marine gamma proteobacterium NOR51-B (ZP_04956740), Sphingomonas = Sphingomonas sp. KC8 (ZP_09138048), Sphing chl L = Sphingobium chlorophenolicum L-1 (YP_004553185), P450 nor = Cytochrome P450nor from Fusarium oxysporum (BAA03390). Vertebrate P450s: Cyp lan
deme = lanosterol 14- demethylase isoform 1 precursor Homo sapiens (NP_000777), CYP 2C9 = human liver limonene hydroxylase (P11712), CYP 4A11 Homo sapiens (NP_000769),
CYP 4F12 = fatty acyl -hydroxylase Homo sapiens (NP_076433), CYP 4F2 = leukotriene-B(4) omega-hydroxylase 1 precursor Homo sapiens (NP_001073), CYP 3A5 form 1 = CYP 3A5 isoform 1 Homo sapiens (NP_000768), CYP 3A4 = CYP 3A4 isoform 1 Homo sapiens (NP_059488), CYP26B1 = retinoic acid hydroxylase Homo sapiens (NP_063938). .............................................. 77
Figure 3.10 Superposition of P450cam and P450 3A4. a) Top row: superimposed ribbon diagrams of P450cam (1DZ4) and CYP3A4 (1TQN). P450cam is shown with red helices and yellow sheets, whereas CYP3A4 is shown all in pink. The porphyrin for P450cam is shown in gray and the one for CYP3A4, in brown. The two views are orthogonal to each other. The substrate access channel (SAC) is marked, as is Helix I, the central pillar of the fold. b) Lower row: superimposed active sites of P450cam and CYP3A4. The porphyrin of P450cam is shown in gray, the one for CYP3A4 in brown. The camphor ligand of P450cam is shown in green. Residues from the two proteins are red (P450cam) and pink (CYP3A4). The two views are orthogonal to each other......................... 78

xvii
Figure 3.11. Sites in P450cam and in CYP3A4 with camphor docked. A) Oxygen binding site in P450cam (residues shown in red), with superimposed residues in CYP3A4 shown in pink. The porphyrin of P450cam is gray, and the one for CYP3A4 is brown. B) Water channel in P450cam (residues shown in red), with superimposed residues in CYP 3A4 shown in pink. The view in a) and b) are from a similar angle, to emphasize the closeness of the O2 binding site and the water channel in P450cam. C) and D) Camphor docked into the active site of CYP3A4 (orthogonal views). The H-bond from Arg 105 to the camphor ketone can be seen in the lower right portion of D). ...................................................................................................... 83
Figure 3.12. IC50 determination of a) H2O2 and b) of a 1:1 (molar) mixture of borneol and H2O2 against E. coli, a species of bacterium that lacks cytochrome P450.................................................................................... 85
Figure 3.13. Effect of 16 h incubation of stationary E. coli (a) and P. putida (b) cultures with borneol: H2O2 (1:1), borneol, or H2O2 (1 mM). .................... 86
Figure 3.14. a) Outline of the experiment used to determine the effect of camphor and borneol on P450cam, PdX and PdR expression. b) The effect of camphor, borneol and DMSO on the P450 expression by P. putida (ATCC 17453). The concentration of P450cam was obtained from the Soret peak absorbances and was normalized against the number of colony forming units/mL. The absorbances at 392 nm and 410 nm correspond to the substrate containing and free P450cam Soret band. Points represent the
average S. E. of three replicates. ......................................................... 87
Figure 3.15. The effect of camphor, borneol and DMSO on the PdX expression by Pseudomonas putida (ATCC 17453). The concentration of PdX was obtained from the absorbance at 325 nm that corresponds to the Fe2S2 cluster of PdX and was normalized against the number
of colony forming units/mL. Points represent the average S. E. of three replicates. ...................................................................................... 88
Figure 3.16. The effect of camphor, borneol and DMSO on the PdR expression by Pseudomonas putida (ATCC 17453). The concentration of PdR was obtained from the absorbance at 454 nm that corresponds to the flavin moiety of PdR and was normalized against the number
of colony forming units/mL. Points represent the average S. E. of three replicates. ...................................................................................... 89
Figure 4.1. Endosulfan and its metabolites reported in the literature......................... 95
Figure 4.2. A) HPLC of isatin produced in the in vitro assays with P450cam mutant IND1 (Table 4.2), 3-chloroindole under shunt conditions B) Gas chromatogram and C) Mass spectrum of enzyme-produced isatin purified by HPLC ......................................................................... 106

xviii
Figure 4.3. Proposed mechanism for the formation of isatin from 3-chloroindole, catalysed by P450 compound I ........................................ 109
Figure 4.4. Biodegradation of endosulfan diol by the P450cam mutant IND1 and the formation of metabolites endosulfan dialdehyde and the M+1 = 135 compound in the treatments. Treatment: P450cam mutant IND1 in plasmid pALXtreme-1a transformed in P. putida ATCC 17453. Control: Wild-type P450cam in plasmid pALXtreme-1a transformed in P. putida ATCC 17453. ..................................................................... 111
Figure 4.5. Biodegradation of endosulfan by the isolated mutant ES7 and the formation of metabolites endosulfan diol and the M+1 = 135 compound in the treatments. Treatment: P450cam mutant ES7 in plasmid pALXtreme-1a transformed in P. putida ATCC 17453. Control: Wild-type P450cam in plasmid pALXtreme-1a transformed in P. putida ATCC 17453. ..................................................................... 112
Figure 4.6. Gas chromatogram and mass spectrum of phthaldialdehyde isolated from the in vitro and in vivo assays with P450cam mutants (see above) and endosulfan diol as the substrate ................................. 113
Figure 4.7 Gas chromatogram and mass spectrum of silylated 3-hydroxy phthaldialdehyde isolated from the in vitro and in vivo assays with P450cam mutants (see above) and endosulfan diol as the substrate ...... 114
Figure 4.8. Stage 1 in the metabolism of endosulfan. Formation of metabolites 3-9. ....................................................................................................... 115
Figure 4.9. Stage 2 in endosulfan metabolism: Biodegradation of endosulfan dialdehyde. ........................................................................................... 116
Figure 4.10. Stage 3 in endosulfan metabolism. Formation of phthaldialdehyde. ..... 117
Figure 4.11. A) The 35Cl NMR spectrum of the incubation mixture containing i) endosulfan diol, mutant IND1, and m-CPBA. ii) mutant IND1 and m-CPBA (diol absent). iii) diol and m-CPBA (mutant IND1 absent). iv) diol and IND1 (m-CPBA absent). The peak at 0 ppm corresponds to aq. Cl-, and the peak at -10 ppm is a synthetic peak (ERETIC2) with an area equal to that observed for an external sample of 10 mM NaCl in D2O. B) 17O NMR spectrum of the incubation mixture in 17O phosphate buffer containing: i) endosulfan diol, mutant IND1, and m-CPBA. Ii) mutant IND1 and m-CPBA (diol absent). Iii) diol and m-CPBA (mutant IND1 absent). Iv) diol and IND1 (m-CPBA absent). The peak at 175 ppm corresponds to H2
17O2. ......................................................................... 118
xix
Figure 4.12. A) Graphical representation of the distances from C-2 and C-3 to Fe in the poses of 3-chloroindole obtained after docking 3-chloroindole in the active site of IND1. B) Graphical representation of the distances from C-2 and C-3 to Fe and the poses of 3-chloroindole obtained after docking 3-chloroindole in the active site of WT P450cam. ..................................................................................... 119
Figure 4.13 A) 3-chloroindole docked in the wild-type P450cam (pose 3 from the Fig. 4.10 B selected). B) 3-chloroindole docked in the mutant IND1 (pose 5 from the Fig. 4.10 A selected). The porphyrin is shown in black, 3-chloroindole in green and the amino acid residues in yellow. .................................................................................................. 120
Figure 4.14. A) Graphical representation of the distances of C-2, C-3, C-8 and C-9 to Fe in the poses of endosulfan diol obtained after docking it in the active site of IND1. B) Graphical representation of the distances of C-2, C-3, C-8 and C-9 to Fe in the poses of endosulfan diol obtained after docking it in the active site of WT P450cam. ............................................................................................... 121
Figure 4.15 A) Endosulfan diol docked in the wild-type P450cam. B) Endosulfan diol docked in the mutant IND 1 (pose 19 selected from 4.11 B). The porphyrin is shown in black, 3-chloroindole in green and the amino acid residues in yellow. .............................................................. 122
Figure 4.16 A) Graphical representation of the distances of C-2, C-3, C-8 and C-9 to Fe in the poses of endosulfan dialdehyde obtained after docking it in the active site of IND1. B) Graphical representation of the distances of C-2, C-3, C-8 and C-9 to Fe in the poses of endosulfan dialdehyde obtained after docking it in the active site of WT P450cam. ......................................................................................... 124
Supplementary figure 4.S1. Steps involved in SeSaM library preparation. ......... 132
Supplementary figure 4.S2. The vector map of pALXtreme-1a, an inhouse pET(+28a) vector ................................................................................ 133
Supplementary figure 4.S3. 0.8% agarose gel analysis of culture PCR for the randomly picked clones from MEGAWHOP step 2 reaction. The positive clones are shown by circles. Lanes 11, 19 and 25 represent the DNA marker with molecular weights ranging from 0.25-6 kbp. ................................................................................ 134
Supplementary figure 4.S4. Determination of Fe-CO absorbance at 450 nm a) The Soret peak of P450cam was detected at 410 nm b) P450cam was reduced by Na2S2O4 and the intensity of Soret peak was reduced. c) CO was bubbled in the reduced protein for ~ 2 min and the absorption of Fe(II)-CO was recorded. ..................................... 135

xx
Supplementary figure 4.S5. Transformation of SeSaM P450cam mutant library in BL21(DE3) cells and further screening with 3-chloroindole. ................................................................................ 136
Supplementary figure 4.S6. IC50 experiments on Escherichia coli using varying concentrations of 3-chloroindole and endosulfan...................... 137
Supplementary figure 4.S7. 1H NMR of isatin ...................................................... 138
Supplementary figure 4.S8. 13C NMR of isatin ..................................................... 139
Supplementary figure 4.S9. Steady state kinetic analysis for 3-chloroindole oxidation and formation of isatin ........................................................... 140
Supplementary figure 4.S10. In vitro assay results with endosulfan diol as the substrate under shunt conditions using m-CPBA and detection of metabolites by GC-MS. Endosulfan dialdehyde was detected as a major product. ................................................................................ 141
Supplementary figure 4.S11. Transformation of the mutant P450CAM plasmid isolated from 3-chloroindole screen in P. putida. The cytochrome P450cam hydroxylase operon present on the CAM plasmid of P. putida is responsible for the camphor degradation pathway ................. 142
Supplementary figure 4.S12. Experimental design and apparatus for the endosulfan biodegradation experiment with mutant-transformed P. putida. ................................................................................ 143
Supplementary figure 4.S13. 1H NMR of pure pthalaldialdehyde obtained from in vitro assays and the biodegradation studies. ............................ 144
Supplementary figure 4.S14. 13C NMR of pure pthalaldialdehyde obtained from in vitro assays and the biodegradation studies. ............................ 145
Supplementary figure 4.S15. 1H NMR of 3-hydroxy pthalaldialdehyde obtained from in vitro assays and the biodegradation studies. .............. 146

xxi
List of Acronyms and Abbreviations
ABA Abscicic acid
ANOVA Analysis of variance
ATCC American Type Culture Collection
BHT butylated hydroxytoluene
BLAST Basic Local Alignment Search Tool
BL Brassinolide
BSTFA N,O-Bis(trimethylsilyl)trifluoroacetamide
BVMOs Baeyer-Villiger Monooxygenases
Cpd I Compound I or iron-oxo species
Cpd II Compound II
CFU Colony forming units
CHP Cumene hydro-peroxide
CYPs Cytochrome P450s
CS Castasterone
7-dc 7-dehydrocholesterol
DE Diethylaminoethyl cellulose
DMSO Dimethyl sulphoxide
DTT Dithiothreitol
E. coli Escherichia coli
EDTA Ethylene diamine tetraacetic acid
EI Electron impact
FAD Flavine adenine dinucleotide
Fld FMN-containing flavodoxin
FMN Flavin mononucleotide
FMOs FAD-dependent Monooxygenases
GC-MS Gas-Chromatography Mass spectrometry
KIE Kinetic isotope effect
IPTG Isopropyl-β-D-1-thiogalactopyranoside
LB Luria Broth
m-CPBA meta-chloro perbenzoic acid
xxii
MOE Molecular Operating Environment
MOPS 3-(N-morpholino)-propane sulfonic acid
NADH Nicotinamide adenine dinucleotide
NBP γ-(4-Nitro benzyl) pyridine
NIH National Institute of Health
PCR Polymerase Chain Reaction
PdR Putidaredoxin reductase
PdX Putidaredoxin
PeCB Pentachloro benzene
ppm parts per million
P. putida Pseudomonas putida
PTFE Polytetra fluroethylene
rP450 Recombinant P450
SDS-PAGE Sodium dodecyl sulphate-polyacrylamide gel electrophoresis
SeSaM Sequence Saturation Mutagenesis
SOD Superoxide Dismutase
TdT Deoxynucleotidyl terminal transferase
Tris Tris(hydroxymethyl)aminomethane
TLC Thin Layer Chromatography
Tyr Tyrosine
Y96 Tyrosine 96
WT Wild-type

1
1. Introduction
1.1. Cytochrome P450s: Importance and Classification
Cytochromes P450 are heme-thiolate proteins that catalyze numerous reactions. All
cytochromes P450 (CYPs) have the iron protoporphyrin IX (heme) coordinated to the
thiolate of a conserved cysteine residue. 1 In prokaryotes and eukaryotes, more than 400
P450’s have been identified and studied for their unique mechanism of inserting oxygen into
a non-activated C-H bond of aliphatic or alicyclic substrates 2-4 (Table 1.1). While breaking of
carbon and hydrogen bonds requires high temperature and pressure, the enzyme
successfully drives this uphill reaction (~350 kJ/mol) 5 by reducing oxygen from air to water
and subsequently oxidizing the hydrocarbon (Scheme 1).
Scheme 1: The incorporation of oxygen in a non-activated hydrocarbon to form an alcohol
Recent studies have been extended to other reactions, such as aromatic 6 (Table 1.2, entry
1) and aliphatic hydroxylation, 7 epoxidation 8 (Table 1.2, entry 2), 9 NIH shift (which occurs
when aromatic substrates are hydroxylated via an epoxy intermediate) (Table 1.2, entry 1),
10 sulfur oxidation, 11 aromatization, 12 oxidative demethylation 13, 14 N- and O-dealkylations 15
(Table 1.2). The active sites of these enzymes are hydrophobic 16,17 and have a Fe-
protoporphyrin IX as the prosthetic group, with Fe axially coordinated to the -SH of a
conserved cysteine residue. 18
There are two classifications of the cytochromes P450. One classifies the enzymes
according to their electron transfer partners and/or the need for dioxygen. 19 The other
classification groups the cytochromes P450 (CYPs) according to their degree of sequence
identity (http://drnelson.uthsc.edu/CytochromeP450.html). 20 Based on the electron transfer
partners, P450s are divided into three classes: I, II and III. 21
R-H + O2 + 2H++ 2e- R-OH + H2O

2
Class I P450s: The class I P450s are primarily found in cytosol of bacteria and in
mitochondria, use NAD(P)H as the source of electrons and two electron transfer partners: an
iron sulfur protein (such as putidaredoxin (PdX) or adrenodoxin) and, a FAD-containing
reductase of the iron sulfur protein (such as putidaredoxin reductase (PdR) or adrenodoxin
reductase). 22,23 The iron sulfur protein in these cases interacts with P450 for the transfer of
electrons from NAD(P)H. 24 Examples include the P450cam isolated from Pseudomonas
putida (CYP101A1), 25 P450terp (CYP108A1), 26 P450scc (CYP 11A1) 27 (Table 1.1, entries 1-
3).
Class II P450s (microsomal P450s): The class II P450s have a reductase (a FAD/FMN
dependent electron-transfer partners), and they use NADPH as the cofactor. Class II P450s
are found primarily in the endoplasmic reticulum (Table 1.1, entries 4-5) with the exception
of cytochrome P450BM3 (CYP102A2), isolated from Bacillus megaterium. 28 P450BM3 occurs
as a fusion protein with the P450 and reductase domains on the same polypeptide chain,
making it the most active hydroxylation catalyst known to date (Table 1.1, entry 4). 29
Class III P450’s: The class III P450s do not catalyse monooxygenation reactions and do
not require the electron transfer partners. 19 Instead, these enzymes accept
hydroperoxides as substrates. Allene oxide synthase (CYP74A), 30 thromboxane
synthase (CYP5A1),31 and prostacyclin synthase32 belong to this category (Table 1.1,
entry 6).
Nebert et.al. 33 classified the CYPs based on their amino acid sequence similarity. This
classification suggests that any two CYPs with a sequence identity greater than 40%
belong to a single CYP family, and CYPs with a sequence identity greater than 55%
belong to a subfamily. 33 The clan system approach, introduced by Nelson et. al. 34 was
then used to classify CYPs based on their sequence similarity. Based on the hypothesis
that CYPs are of monophyletic origin, the CYP families are placed into a single clan and
new CYPs with same sequence similarity are placed in the same clan. As of 2011, there
are 16000 CYP genes that are partially classified into classes B and E. 35 CYP101A1
(P450cam), isolated from Pseudomonas putida belongs to class B, which includes some
of the cytochromes P450 from prokaryotes and fungi. 35 In CYP101A1, CYP represents
the abbreviation of P450 gene, the number 101 represents the family, the letter ‘A’
denotes the subfamily and the last numeral denotes the number of the gene that

3
encodes the protein. As another example, class E is sub-divided into 10 groups that
includes vertebrates, plants, arthropods, some fungi and some prokaryotes. 35
Table 1.1. Classic reactions reported for P450s
Entry
Class
CYP Reported reaction
1 I P450cam
(CYP101A1) O
+ O2 + 2e- + 2H+
O
OH + H2O
2 I P450terp
(CYP108A1)
HOHO
HOH2C
+ O2 + 2e- + 2H+ + H2O
3 I P450cin (CYP176A) O
+ O2 + 2H++ 2e-
O
HO + H2O
4 II P450BM3
(CYP102A1) OH
O10
OH
O10
OH
+ O2 + 2e- + 2H+ + H2O
5 II P450
(CYP2E1/1A2/3A4)
OH
NH
O
CH3
+ O2 + 2e- + 2H+
OH
NH
O
CH3
OH
O
N
O
CH3
+ H2O+
6 III CYP74A HO
HO
HO
OOH O
HO
+O
1.2. Catalytic cycle of P450s
The resting state of the enzyme (1) contains hexacoordinated heme, with a water
molecule bound to the axial position opposite to the cysteine thiolate. The substrate (in
the case of P450cam, camphor) displaces the coordinated water molecule to form a
pentacoordinated ferric-substrate complex (2). 36 This causes a change in the spin state
4
from low spin (S=1/2) to high spin (S=5/2) 37 and increases the heme-iron reduction
potential by 130 mV, 36 which makes the first step in the catalytic cycle (electron transfer
to the heme), more favourable than in the absence of bound substrate. In the class I
P450s, the substrate-bound ferric complex accepts electrons from the pyridine
nucleotide cofactor NAD(P)H, via its redox partner(s) to form the ferrous species (3). 38
(3) binds to oxygen to form the superoxo species (4) which accepts a second electron
and a proton, to form the hydroperoxo species (also known as Compound 0) (6). 39
Following proton transfer, compound 0 (6) loses a water molecule to form the high valent
iron-oxoporphyrin moiety (Fe(IV)=O Por+.), known as compound I (7). 40-43 Hydroxylation
occurs when compound I abstracts a hydrogen atom from the substrate, forming a
carbon radical and Fe(IV)-OH (8) and an alcohol then forms by a rebound mechanism
(Fig. 1.1). 44 There has been a long search to identify and characterize the most reactive
species in the catalytic cycle 45 and recently, Rittle and Green have provided strong
evidence for the existence of compound I (Cpd I) by EPR experiments. 46 Though Cpd I
was reported as the reactive species responsible for the insertion of oxygen in a
substrate, the ferric hydroperoxo species (Cpd 0) (6) has also been determined to be
reactive in hydroxylation and epoxidation reactions. 47,48 The peroxo species (5) has
been reported to be active in Baeyer-Villiger reactions. 49
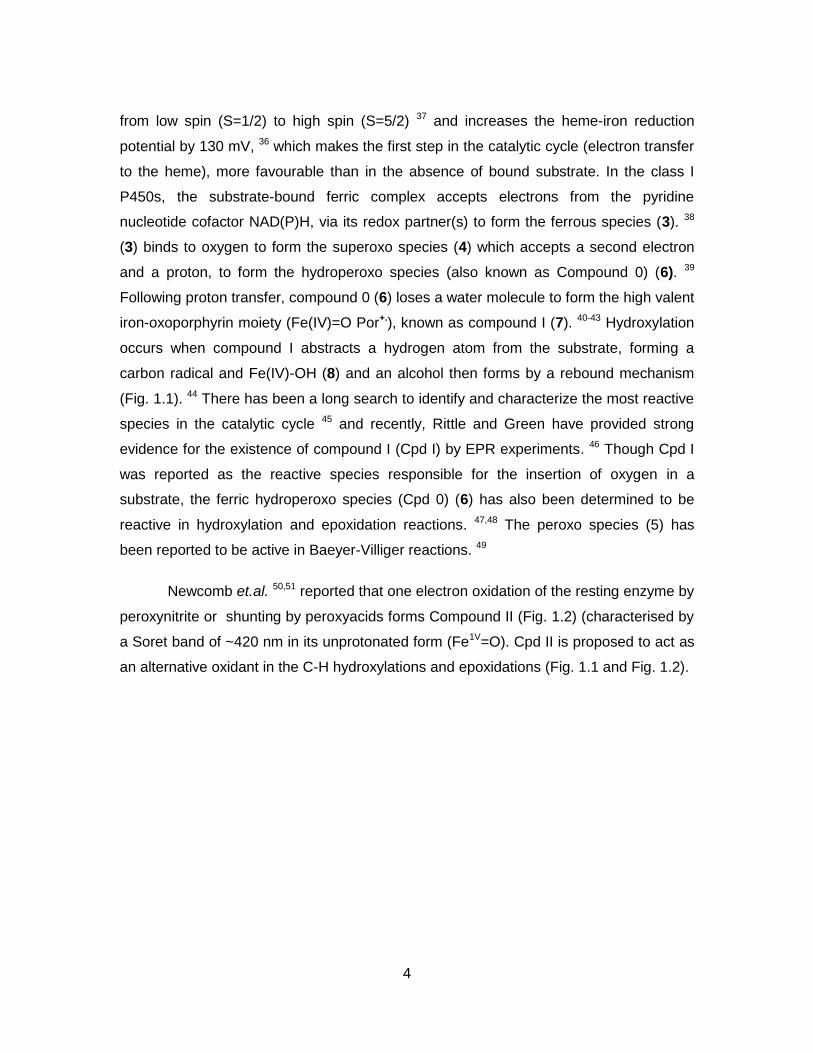
Newcomb et.al. 50,51 reported that one electron oxidation of the resting enzyme by
peroxynitrite or shunting by peroxyacids forms Compound II (Fig. 1.2) (characterised by
a Soret band of ~420 nm in its unprotonated form (Fe1V=O). Cpd II is proposed to act as
an alternative oxidant in the C-H hydroxylations and epoxidations (Fig. 1.1 and Fig. 1.2).

5
FeIII
S
OH H
cys 1
R-HFeIII
Scys
2
R-H
e-
FeII
Scys
3
FeIII
Scys
4
R-H
O2
e-
OO-.
FeIII
Scys
5
R-H OO-
H+FeIII
Scys
6
R-H
OOH
H2O
H+
FeIII
S
OR H
cys 8
H2O
ROH
5 - ketocamphor
(2nd round)
FeIV
Scys
7
R-H OH+
H2O2
2H+ + 2e-
H2O
[O]
a
b
c
O2-.
d
Cpd 0
Cpd I
R-H
R
R
R
R
R
R
R
R
O
O
R1R
O
OR1R+ FeIII
S
OH H
cys 8
FeIII
S
OHH
cys8+
Hydroxylation by a rebound mechanism
Figure 1.1. Catalytic cycle of cytochrome P450. The cycle, from species 1 to 8, shows the accepted pathway by which P450s couple the reduction of O2 to the oxidation of an organic substrate, represented here by RH. The bold horizontal lines on either side of Fe represent the porphyrin moiety. Path “a” shows the direct formation of the high-valent FeIV-oxo-porphyrin radical cation species (Compound I, Cpd I) by oxidants such as m-CPBA. Paths “b”-“c” represent uncoupling of O2 reduction from the oxidation of organic substrate. Intermediates 5, 6 and 7 participate in the substrate oxidation reactions shown.
1.2.1. Peroxide shunt
Recent reports show that Cpd I (7, Fig. 1.1) can also be generated in a shunt pathway of
the catalytic cycle using artificial oxidants like alkyl hydroperoxides,52 iodosobenzene,53
H2O254 or m-CPBA. 55 This eliminates the need to transfer electrons from NAD(P)H for

6
the reduction of O2 in the catalytic cycle. The reaction between the resting ferric state of
P450 with alkyl/acyl hydroperoxide forms alkyl/acyl hydroperoxo species (FeIII-OOR or
Cpd 0) which splits either heterolytically to form Cpd I (path a, Fig. 1.2) and alcohol/acid
or homolytically (path b, Fig. 1.2) to Compound II (Cpd II) and a neutral organic
hydroxyl/acid radical depending on the pH or the heme environments.56 (Fig. 1.2)
Figure 1.2 The possible mechanisms of formation of Compounds I, II and ES from compound 0 by homolytic and heterolytic cleavage of the peroxo complex 6. When R=H in 6, the complex is known as Compound 0.
1.2.2. Other reactions
Cytochrome P450s have been reported to catalyse reactions other than C-H
hydroxylations. A few examples are listed below and also in Table 1.2.
FeIII
S
cys6
O
O
Cpd 0
R H+
aFeIV
S
cys7
O
Cpd I
FeIV
S
cys
O
Cpd II
b
R = alkyl or
O
e- from Y96/
Y75FeIV
S
cys
O Tyr.
Cpd-ES
FeIII
S
cys6
O
O
Cpd 0
R H+

7
1.2.2.1. Alkene epoxidation
There are two intermediates in the P450 catalytic cycle that can epoxidise an
alkene: compound 0 (6) or compound I (7). A) The epoxidation of an alkene by a
hydroperoxo species in a concerted mechanism is shown in Fig. 1.3 (A). B) The
oxidation of trichloroethylene to trichloroethylene epoxide (Fig. 1.3 (B)) can open and
rearrange to trichloroacetaldehyde. 57
Cl
Cl Cl
H
FeIV
Scys
O
Cpd I
Cl
Cl Cl
H
.
FeIV
Scys
O
1e- oxidation
Cl
Cl Cl
H
FeIII
Scys
O
+Cl- migration
Cl
Cl
H
FeIII
Scys
O
+
Cl
Cl
FeIII
Scys
Cl
O
H
FeIII
Scys
6
OO
Cpd 0
H
FeIII
Scys
OO
H
FeIII
Scys
O-
O
7
A)
B)
Cl
H+
FeIII
Scys
OH
O
Figure 1.3. Two possible mechanisms by which (A) Compound 0 or (B) Compound I can epoxidise an alkene.
The epoxidation of p-cymene is catalysed by three different P450s (CYP1A2,
2D6 and 2A6), and the resulting intermediate undergoes an NIH shift to yield thymol58
(Table 1.2, entry 1). CYP2D6 epoxidises linalool to linalool 6,7-epoxide which then
rearranges within the enzyme’s active site to yield tetrahydropyran product (a) or
tetrahydrofuran product (b) (Table 1.2, entry 2). 42

8
1.2.2.2. Dealkylation reactions
CYP2A6 catalyzes the dealkylation of N,N-dimethyl nitrosamine by hydroxylating
one of the pendant methyl groups. This hemiaminal hydrolyses to formaldehyde which is
further oxidized to formic acid (Table 1.2, entry 3). 59
Similarly, CYP2D6 demethylates
anisole (entry 4) to form phenol. 60
1.2.2.3. Dehydrogenation reactions
The oxidation of alcohols to ketones and the conversion of saturated to
unsaturated hydrocarbons come under this category of reactions. The conversion of 2-n-
propyl-pentanoic acid (valproic acid) to 2-n-propyl-2(E)-pentenoic acid is catalysed by
P4502B1 in human liver microsomes61 (Fig. 1.4). Further reported desaturation reactions
include the conversion of lindane (1,2,3,4,5,6-hexachlorocyclohexane) to 1,2,3,4,5,6-
hexachlorocyclohexene by P450, 62 desaturation of ergosterol by yeast microsomes63
and oxidation of dihydronaphtalene to naphthalene. 64 Desaturation reactions are also
reported in non-heme iron enzymes, 65 fatty acid desaturases 66 and CYPs probably use
a similar mechanism.
CO2H
Pr
CO2H
Pr
valproic acid 2-n-propyl-2(E)-pentenoic acid
P4502B1
CO2H
Pr
FeV
Scys
O
Cpd I
H
CO2H
Pr
FeV
Scys
OH
.
H
CO2H
Pr
FeIII
Scys
OH H
Figure 1.4. The desaturation of valproic acid catalysed by P4502B1 and its mechanism.
9
Table 1.2. Selected reactions of P450s to explain the versatility of the enzyme
Entry Type of reaction Reference
1
Arene epoxidation and NIH shift of p-cymene to thymol
CYP1A2/2D6/2A6 OHO
H CYP1A2/2D6/2A6
58
2
Epoxidation of linalool and the formation of rearranged products
HO CH3
Linalool
O
HO
+O
HO
HO CH3
O
:a
a
:
b
a b
CYP 2D6 CYP 2D6
42
3
Nitrosamine dealkylation to formaldehyde
N
N
H3C CH3
O
CYP2A6 C
O
HHC
O
OHHCYP2A6
59
4
Oxidative demethylation of anisole
OCH3OCH2OH OH
+C
O
HHCYP2D6 CYP2D6
60
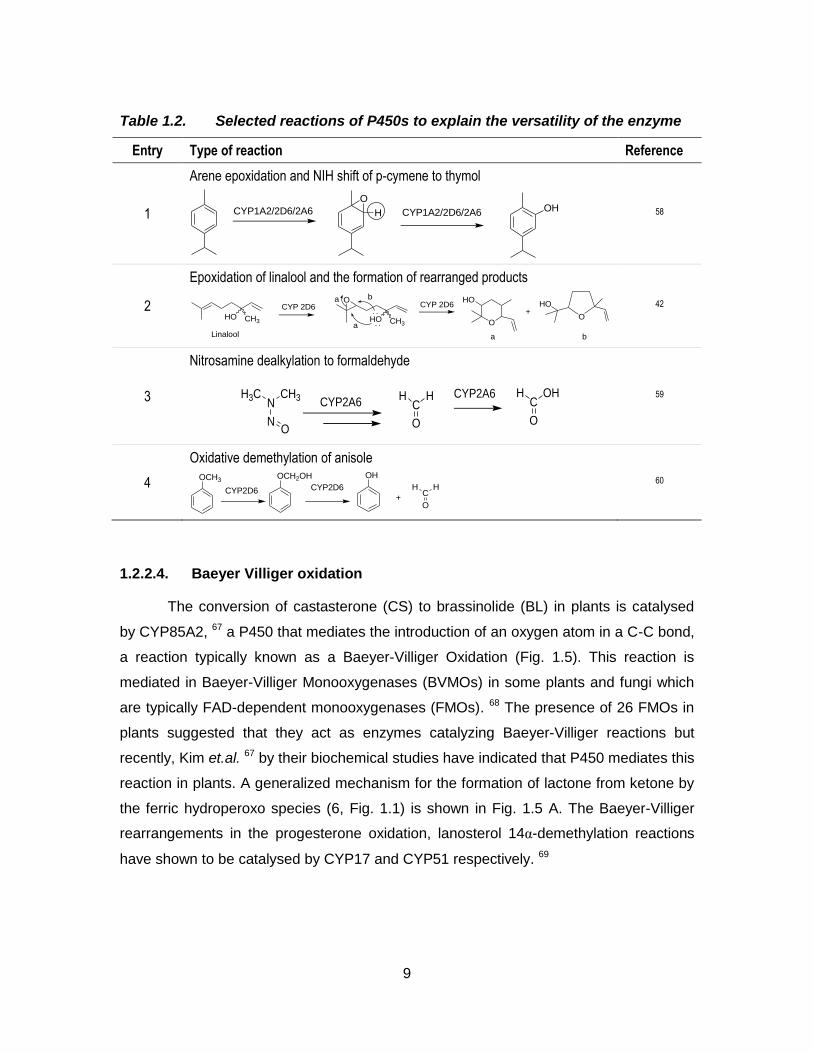
1.2.2.4. Baeyer Villiger oxidation
The conversion of castasterone (CS) to brassinolide (BL) in plants is catalysed
by CYP85A2, 67 a P450 that mediates the introduction of an oxygen atom in a C-C bond,
a reaction typically known as a Baeyer-Villiger Oxidation (Fig. 1.5). This reaction is
mediated in Baeyer-Villiger Monooxygenases (BVMOs) in some plants and fungi which
are typically FAD-dependent monooxygenases (FMOs). 68 The presence of 26 FMOs in
plants suggested that they act as enzymes catalyzing Baeyer-Villiger reactions but
recently, Kim et.al. 67 by their biochemical studies have indicated that P450 mediates this
reaction in plants. A generalized mechanism for the formation of lactone from ketone by
the ferric hydroperoxo species (6, Fig. 1.1) is shown in Fig. 1.5 A. The Baeyer-Villiger
rearrangements in the progesterone oxidation, lanosterol 14α-demethylation reactions
have shown to be catalysed by CYP17 and CYP51 respectively. 69
10
R
O
R1
FeIII
Scys
6
OO-
Cpd 0
R
O-
R1
FeIII
Scys
OO
O
O
R1
FeIII
Scys
R
OH
HO
HOH
O
OH
OH
CYP85A2HO
HOH
O
OH
OH
O
castasterone brassinolide
A)
B)
Figure 1.5 A)The general Baeyer-Villiger mechanism for the formation of lactone from a ketone as catalysed by ferric hydroperoxo species. B) CYP85A2 catalyses the rate determining Baeyer-Villiger reaction in the brassinolide biosynthesis from castasterone.
1.2.2.5. P450 as an aromatase
P450aromatase (CYP19) can catalyse the C-C bond cleavage, hydroxylation as well
as the oxidation reactions as shown in Fig. 1.6. 70 The 19-methyl hydroxylation of
androst-4-ene-3,17-dione happens with retention of configuration and the methyl group
elimination in the third step causes the aromatization of the ring in the given substrate. 70
Studies on this reaction also showed that the conversion takes place in 3 steps and each
step requires one equivalent of both NADPH and O270 and this reaction is not supported
by the artificial oxidants like iodosobenzene or cumene hydroperoxide. 47

11
O
O
H
NADPH
O2
O
HOH
H
O
O H
NADPH
O2
NADPHO2
HO
+ CH
O
-O
androst-4-ene-3,17-dione
Figure 1.6. The 19-methyl hydroxylation of androst-4-ene-3, 17-dione, formation of diol and the aromatisation of the ring as catalysed by human placenta aromatase.
1.2.2.6. Dehalogenation reactions
CYP101 (cytochrome P450cam), known for the 5-exo-hydroxylation of camphor is
also known for the reductive dehalogenation of haloaliphatic compounds. 71 P450
1A2/yeast heterologous system was also shown to dehalogenate hexachloroethane to
tetrachloroethylene and pentachloroethane72 as shown in Fig. 1.7.
Cl
Cl Cl
Cl
ClCl
Cl
Cl
Cl
Cl
P450cam
Figure 1.7. P450cam (CYP101) catalyses the reductive dehalogenation of hexachloroethane
1.2.2.7. Oxidative decarbonylation
P450hyd catalyses the conversion of aldehydes to hydrocarbons, with the release
of CO2 but this enzyme was not identified. 73 Qiu et.al. have identified P450hyd as
CYP4G1 in Drosophila melanogaster and is fused with NADPH-P450 reductase in
oenocytes. 74 Previously, decarbonylase was reported to be identified only in
cyanobacteria that uses a nonheme diiron enzyme. 75,76,77 The current studies with
Drosophila and CYP4G2 in housefly proved that the aldehyde decarbonylation occurs by
an unique radical mechanism that is different from what occurs in cyanobacteria. 74

12
1.2.2.8. Biosynthesis of cyanogenic glucosides
Cyanogenic glucosides (CNglcs) are amino acid derived natural products that are
stored in the plant vacuoles. Dhurrin, the aromatic cyanogenic glucoside is present in
millet and its biosynthesis involves the P450s, CYP79A1 and CYP71E1. Jorgenson et.al.
have identified CYP71E7 in cassava crop that catalyses the conversion of Ile- and Val-
derived oximes to their corresponding cyanohydrins. The cyanohydrins in the later steps
lead to the formation of the CNglcs, known as lotaustralin and linamarin. (Fig. 1.8)
R
NH2HOOC
R=H: L-valineR=CH3, L-isoleucine
CYP79D1, CYP79D2R
NHO
oxime
R
NCOH
CYP71E7
cyanohydrin
UGT functional homologue
R
CNGlu-O
R=H, linamarinR=CH3, lotaustralin
Figure 1.8. Biosynthesis of linomarin and lotanstralin in cassava.
1.3. Structural aspects
The structure and catalytic cycle of CYPs have been studied extensively. The
catalytic cycle (Fig. 1.1) was first mapped with P450cam. The cycle begins with the resting
state of the enzyme (1, Fig. 1.1), in which a water molecule is believed to be bound to
the second axial position on Fe (the first position being occupied by the cysteine
thiolate). This state can be detected by UV-visible spectroscopy, because the heme
Soret band appears at 392 nm in the resting state of P450cam. 78 Upon displacement of
water by the substrate, the geometry around Fe becomes square pyramidal and the
Soret band shifts to 410 nm. 78 This shift of the Soret band occurs in many other CYPs
and has been used to detect the formation of the enzyme-substrate complex. The
substrate-bound complex, in the series of steps as shown in Fig. 1.1 forms the iron-oxo
species intermediate (7, Fig. 1.1) which has a heme Soret band at 370 nm. 79
The crystal structure of the P450cam (CYP101A1) monooxygenase18 isolated from the
soil bacterium Pseudomonas putida was the first to be solved by T. Poulos in 198780 and
became the prototype for several P450 structures. Crystal structures of P450BM3
13
(CYP102),81 P450terp (CYP108),82 P450eryF (CYP107A)83 CYP17A1,84 CYP2C9, CYP3B4
and many others (beyond the scope of this introduction)85 have been solved. The
structural fold of the P450 superfamily, especially the regions closest to the heme are
highly conserved, although the sequence similarity of this region between the different
classes is only 20%.1 The structure of P450 mainly consists of a helical rich region and a
beta sheet rich region, with most of the helices and sheets lying in planes perpendicular
to the heme.17,18,80 The C-terminal residues of the polypeptide cover the inner core of the
heme, with the helices I and L fencing the heme core on both sides, whereas the N-
terminal helices surround the C-terminus. Helices I and L (Fig 1.9) surrounding the
porphyrin fold are highly conserved in all P450s.1 The heme thiolate ligand, Cys 357 in
the case of P450cam, is crucial for regulating the redox potentials in the entire catalytic
cycle.86
14
Figure 1.9 Structure of P450cam (PDB code: 2ZWU 87)with the important helices coloured. Sheets shown in yellow and turns by green. The sequence comprising of 415 amino acids is listed below the structure. Camphor (the natural substrate of P450cam) shown in cyan, heme in beige and Cys357 shown in purple (and by an asterick in the sequence).
Binding of substrates and their orientation relative to key residues around the
heme (B´ helix)88 is important for their regio- or stereoselective hydroxylation.89 For
example, in P450cam, Y96, present at the C-terminal end of helix B´, hydrogen bonds to
the keto group of camphor (Fig. 1.10) and coordinates K+ via the backbone amide
causing stronger binding of camphor to the active site.90 The cation bonding enhances
the interaction between camphor and P450cam, when compared to the cation-free
enzyme. From the early days of P450cam research it has been known that one has to
add K+ to the buffer to get good camphor binding. 1 The reason the K+ helps camphor
bind is that it positions Y96 for H-bonding between the Y96 -OH group and the keto
group of camphor (Fig. 1.10) The importance of K+ in this H-bonding interaction was

15
further proven in the mutagenesis studies by Di Promo et.al., in which the substrate-
induced spin state conversion (which is a consequence of strong substrate binding) was
lowered after the conversion of Y96 to Phenylalanine. 91
Figure 1.10. The hydrogen bond co-ordination between Y96 (present on B´ helix) and camphor (shown in cyan). PDB code 2ZWU 87 taken for studies.
During the formation of compound I (7, Fig. 1.1) in the catalytic cycle (Fig. 1.1),
the hydroperoxo species (6, Fig. 1.1) needs to be protonated distally, to achieve its
heterolytic cleavage. The proton for this process comes from a proton shuttle between
Thr252 and Glu366 in the case of P450cam.92 The two residues hold in place three water
molecules that connect the interior of P450cam to the surface of the protein. In P450BM3,
the proton shuttle93 is between Thr268 and Glu409 and in peroxidases, the proton
shuttle is between His105 and Glu183 residues.94 95
Replacement of T252 with alanine/valine/leucine caused uncoupling of the electrons
from redox partners, reducing the hydroxylation efficiency in P450cam,96,97 whereas the
mutation of T252 to serine produced a catalytically active enzyme.98 Mutant T252A was
found to epoxidise 5-methylenyl camphor, presumably through the formation of the
hydroperoxo species (6, Fig. 1.1).99 This key residue (T252) is absent in P450cin which
catalyses the hydroxylation of 1, 8 cineole (Table 1.1, entry 3). In P450cin, N242 in the I-
helix acts as a substitute for the proton shuttle T252 of P450cam (Fig. 1.11).100

16
Figure 1.11. T252 present in the I-helix (coloured by blue) of P450cam (A) helps in the proton shuttle mechanism and is substituted by N242 in P450cin (B). PDB code 2ZWU 87 taken for studies.
The axial ligand in P450cam, cysteine 357 is supposed to control the P450
reactivity. 86 The Cysteine pocket in P450cam encompasses L358, G359, Q360 which
stabilise the heme-bound C357 by three hydrogen bonds. 101 The Cys pocket is also
present in the other P450s (P450terp, P450BM3, etc.) etc suggesting the importance of the
hydrogen bonding network close to the active site. These hydrogen bonds control the
reduction potential at the iron centre. Galinato et.al. have shown that the mutants, L358P
and Q360L showed decreased reduction potentials due to the disruption of the H-
bonding network. 101
In non-P450-type heme proteins, such as peroxidises, globins, histidine is
present in the place of Cys and the replacement of C357H deactivates P450s. 102 The
mutation from cysteine to selenocysteine in P450cam decreased the catalytic activity by ~
2 fold. One reason could be that more electron donating nature of the selenocysteine
could speed up the formation of compound I but slow its reactivity with the substrate. 86
The camphor is oriented in the active site of P450cam by a hydrogen bond with
the phenolic moiety of tyrosine 96 (Fig. 1.12) and by weak hydrophobic interactions with
L244, T101, V247, V253, V295 and F87. 1 Therefore many efforts to engineer P450cam,
to accept new substrates, have focused on the residues that line the substrate binding
pocket above the heme. (Fig. 1.12)

17
Leu 244
Val 247
Thr 252
Val 253Thr 101
Figure 1.12 The hydrophobic residues present in the substrate binding pocket of P450cam. PDB code 2ZWU 87 taken for studies.
1.4. Protein Engineering with P450cam
The hydroxylation of D-(+)-camphor, by CYP101A1 and its redox partners,
occurs regio- and stereoselectively at the 5-exo position, giving 5-exo-hydroxy camphor
on the first round of catalysis (Table 1.1, entry 1) and 5-ketocamphor on the second
round of catalysis.103 There have been recent advances in altering the active site
residues, surrounding the heme, to bind camphor-like analogues, alkanes, and
polychlorinated substrates (Tables 1.3 and 1.4) 39,104,105 Table (1.3) includes some of the
mutants of P450cam studied by Wong et.al. 106-108 for various substrates.
1.4.1. Alkanes
The wild-type P450cam enzyme does not accept linear alkanes, but the substrate
specificity can be changed from camphor to linear alkanes reducing the active site
volume with bulky amino acid substitutions (V247 to L247)109 (Fig. 1.12; Table 1.3 entry 1)
Replacement of Y96 by F, W or A disrupts the hydrogen bond between Y96 and
camphor, and this decreases the extent of hydroxylation of camphor.110 These
replacements also adapted the active site to bind other monoterpenes, alkanes and
other substrates (Table 1.3, all entries).105,111

18
Table 1.3. P450cam mutants and their corresponding substrates (camphor analogues, alkanes)
Mutant Substrate Efficiency in mutant
F87W/Y96F/T101L/V247L Butane turn-over of 750 min-1 while the WT enzyme had a turn-over of 0.4 min-1 106.
Y96F/V247L Pentane 44.5% NADH coupling compared to WT (1.1%)107,109
Y96A Diphenylmethane turnover of 360 min-1 while the WT showed no activity112,113
F87A/Y96F Phenanthrene turnover of 374 min-1 while the WT had low turnover of <0.01 min-1. 111,114
1.4.2. Polychlorinated and aromatic pollutants
Polychlorinated compounds have shown to be hazardous to the environment due to their
persistence and lack of biodegradation.115 Common problems in degradation of these
compounds include their lipid solubility, chemical inertness and the carcinogenic effects.
116 Introduction of a hydroxyl group is believed to increase the solubility, which in turn
enhances degradability.117 For example, polychlorinated phenol is more degradable by
microorganisms than pentachlorobenzene (PeCB).118 The degradation of PeCB,
polyaromatic hydrocarbons and other recalcitrant pollutants is a challenge because
these compounds are often difficult to oxidise. Therefore, the quest for P450s that can
degrade such pollutants has involved active site redesign by directed evolution and other
methods.
In general, replacement of F87, Y96 and V247 residues in P450cam (with W, F
and L) has been found to be important for the degradation of chlorinated substituents,
though the activity decreases with the increasing number of chlorinated substituents. For
example, the mutant F87W/Y96F/T101A/L244A/V247L can oxidise PeCB to
pentachlorophenol more effectively than the WT.119 More examples of degradation of
pollutants, chlorinated compounds by mutant P450cam are listed in Table 1.4.

19
Table 1.4. P450cam mutants that accept halogenated and polycyclic aromatic mutants
Mutant Substrate Efficiency in mutant
Y96A Phenylcyclohexane turnover of 5 s-1. 120
Y96F Benzocycloarenes 35-70% NADH coupling compared to WT (10-15%) 121
F87W/Y96F/T101A/ L244A/V247L
Pentachlorobenzene 24.2 ± 0.85% NADH coupling compared to WT (1.1 ± 0.3%) 122
Y96F, Y96F/L244A, Y96F/T101V
1,2,3,4,5,6 hexachloro-cyclohexane (gammaxene)
NADH coupling of 12-15% while the WT showed no activity. 123
F87W/Y96F/V247L 1,3,5 trichlorobenzene NADH coupling of 57% 124
1.5. Other P450s
Cytochrome P450 (CYPs) have undergone extensive evolutionary diversification
and today, CYP proteins are arranged into 10 classes and 267 families. In plants, P450s
are responsible for the biosynthesis of alkaloids, terpenoids, lipids, cyanogenic
glycosides, plant hormones and ~ 5000 P450 genes have been stored in the database.
125 CYP51G and CYP710A are responsible for sterol biosynthesis and CYP97 family
functions for the biosynthesis of xanthophylls, which are components in photosynthesis.
126 The catabolism of abscicic acid (ABA), a phytophormone responsible in stomatal
closure, to 8-hydroxy abscicic acid is catalysed by CYP707A (Fig. 1.13 (a)). 127
CYP711A is responsible for the biosynthesis of 5-deoxystrigol from β-carotene (Fig. 1.13
(b)). 128 Glycyrrhizzin, a secondary metabolite in plants that has anti-inflammatory
properties and forms from β-amyrin after oxidation by CYP88D6 (Fig. 1.13 (c)). 129
CYP76B1, a plant P450 from Jerusalem artichoke (Helianthus tuberosus) converts
herbicides to less lipophilc metabolites, reducing the concentration of the toxic pollutants
in soil. 130

20
O
OO
O
5-Deoxystrigol
-caroteneCYP711A
OCOOH
OH
OCOOH
OH
OH
(+)-Abscisic acid
CYP707A
8'-hydroxyabscisic acid
HO
CYP88D6,
CYP72A154
HO
HOOC
O
-amyrin Glycyrrhetinic acid
Glycyrrhizin
a)
b)
c)
Figure 1.13. The biosynthesis of plant hormones, secondary metabolites (8´-hydroxyabscisic acid, glycyrrhizin) in plants by P450s
The biosynthesis of 20-hydroxyecdysone (20E), an insect hormone responsible
for metamorphosis, begins with cholesterol. The conversion of cholesterol to 7-
dehydrocholesterol (7-dC) is catalysed by Rieske oxygenase 131 and the conversion of 7-
dC to a ketodiol might be performed by a P450, although has not been proved by
researchers. The next four hydroxylation steps from the ketodiol to the insect hormone is
catalysed by insect P450s (CYP306A1, CYP302A1, CYP315A1 and CYP314A1) (Fig.
1.14). 132

21
HO
Rieskeoxygenase
HO
cholesterol7-dehydrocholesterol (7dC)
HOH
O
OH
P450 ?
2, 22, 25-trideoxyecdysone (ketodiol)HO
HO
OH
HO
OH
OH
OH
20-hydroxyecdysone
CYP306A1, CYP302A1CYP315A1 and CYP314A1
Figure 1.14. The synthesis of 20-hydroxyecdysone from cholesterol.
Some of the human P450s are known for their high substrate promiscuity but
have low substrate turn over. 55 Recent attempts in altering the substrate specificity of
the bacterial CYPs to have human P450-like activity was successful for a few
researchers. Human P450s have been expressed in E. coli, yeast and insects for
industrial applications. Propanolol was prepared by engineered P450BM3 and
chlorzoxazone, a substrate for mammalian P450s was shown to be oxidized by the
engineered CYP102 variant (Fig. 1.15) 133
N
O
Cl
CYP102A7N
O
Cl
HO
chlorzoxazone 6-hydroxychlorzoxazone
Figure 1.15. Conversion of chlorzoxazone by an engineered CYP102 variant
22
Kumar et.al. 134 have shown the transformation of progesterone by a CYP2B1
variant and this enzyme was evolved for improved efficiency towards testosterone and
7-benzyloxyresorufin. In contrast to the bacterial enzymes discussed so far, P450s from
animals are more difficult to study because of their lower stability ex vivo, and this is due
to their association with membranes. Nonetheless, they catalyze a similar collection of
reactions than the bacterial enzymes. The microsomal class II P450s are poor
biocatalysts due to their low stability135 and, therefore, P450BM3 was engineered to act on
human P450 substrates of nutritional or pharmaceutical interest: coumarin, phenacetin
and ethoxyresorufin.136 Recombinant human P450s CYP1A1, CYP1A2 and CYP1B1
catalyse the hydroxylation of resveratol, to give piceatannol. 55
1.6. Recent advances in the use of P450s:
P450s have a wide range of applications in catalysis but the common limitations
include the poor stability of the enzyme, poor coupling of the enzyme to the redox
partners or the regeneration of the cofactor. Studies on engineering the heme domain by
various mutagenesis methods have resulted in improved activity towards various
unnatural substrates and improved stability as well. A few recent advances in the
application of P450s and the limitations are stated below.
a) Replacement of the nicotinamide cofactor: P450s need a supply of
electrons from the cofactor NAD(P)H during the catalytic cycle.1 The industrial
application of the enzyme becomes difficult due to the cost of NADH or NADPH and
also, the electron transfer from NAD(P)H to P450 needs the expression of one or more
redox partners, which makes these reactions complicated and costly. 137 Cofactor
recycling, the conversion of NAD(P)+ to NAD(P)H by a dehydrogenase makes the
product isolation difficult. 138 Surrogate cofactors, like N-benzyl-1,4-
dihydronicotinamide139 and the rhodium complex ([Cp*Rh(bpy)(H2O)]2+) have been
employed by researchers, but the process showed gradual loss of activity of the
enzyme. 140 In electrochemical methods, cobalt (III) sepulchrate and a platinum electrode
were employed for the hydroxylation activity by Estabrook et.al. and this method had
CoIII sepulchrate aggregation as a drawback. 141

23
The peroxide shunt (Fig. 1.2) is a short-cut pathway in the catalytic cycle in which
artificial oxidants like cumene-hydroperoxide or m-CPBA shunt the P450 directly from
the resting state to Cpd I (7, Fig. 1.1). The shunt pathway does not require the reduction
of O2 and therefore, NAD(P)H is not required. Arnold and coworkers employed this
pathway for improved activity towards naphthalene and various other substrates using
engineered P450BM3. 142
Jensen et.al 143,144 have reported an entirely different approach of light driven
hydroxylation for CYP 79A1, by substituting the cofactor with sunlight. The electron
transfer was mediated from the photosystem I to the CYP using the electron acceptors,
FdX and FMN-containing flavodoxin (Fld). This approach favoured them two-fold higher
turnover rate for CYP79A1.
b) Directed evolution and screening methods. Directed evolution is a well known
methodology to engineer enzymes for improved activity towards unnatural substrates. 145
Arnold et.al. have reported the improved reactivities of a variety of P450BM3 mutants
towards alkanes (ranging from propane to decane).146,147 The WT P450BM3 showed very
low activity towards the cycloalkanes, and cyclododecane was not accepted as a
substrate at all. 148
P450BM3 efficiently catalyses 1º carbon hydroxylations due to the F87 residue
which is positioned just above the porphyrin and helps in substrate positioning relative to
the heme. 149 Mutation of these residues has been proven to disrupt the hydrophobic
pocket but increases the active site volume, such that the pocket accepts unnatural
susbtrates like naphthalene, 150 terpenes, 151 styrene, 152 indole 153 etc. The F87 residue
was used as a template to create two libraries containing 1,500 and 2,500 clones to
screen for the hydroxylation of β-ionone using NADPH assay. 154 A combination of the
mutants F87A/A328 (F/I/L/V) and F87V/A328 (F/I/L/V) were tested for the activity on
cyclooctane, cyclodecane and cyclododecane, and the mutant F87A/A328V was able to
oxidise the bulky substrate cyclododecane to 46%. 148 A P450 propane monooxygenase
(P450PMO R2) was made from P450BM3 by several rounds of directed evolution by Arnold
and coworkers. P450PMO R2 oxidised haloalkanes like chloromethane, bromomethane,
iodomethane to formaldehyde establishing its activity as a potent dehalogenase. 147
Similarly, the epoxidation of alkenes (styrene) was screened using γ-(4-Nitro-

24
benzyl)pyridine (NBP) and the product, styrene epoxide formed a purple dye when
reacted with NBP. 155
c) Reaction conditions for in vitro use of P450s: Hydrophobic substrates
sometimes need to be delivered to P450s in organic solvents (such as DMSO) which
these enzymes do not tolerate. 156 To overcome this problem, three approaches have
been used. First, biphasic solvent systems have been used for CYP102A1 and CYP2D6
catalysis with dextromethorphan as the substrate 157 Second, the Auclair group has
reported the use of organic solvents (acetone, acetonitrile, DMSO) with lyophilised
CYP3A4 for testosterone hydroxylation.158 Third, ionic liquids (e.g. 3-ethyl 1-imidazolium
chloride) have been found to be good substitutes for organic cosolvents for P450BM3
catalysis by Schwaneberg et.al.159
Due to the remarkable catalytic abilities of cytochromes P450, their study and
practical development is of interest to many researchers. Aliphatic and aromatic
hydroxylation of substrates in chemical synthesis need high temperatures sometimes
and P450s show promising abilities in their catalysis with regio- and steroselectivity. I
have discussed barriers to the implementation of cytochromes P450 for practical
applications. First, P450s either accept many substrates, with only moderate selectivity
or a very narrow range with high selectivity. Both extremes can be problematic in the use
of P450s for synthetic or environmental applications. Second, P450s require a
nicotinamide cofactor and an electron transfer system under natural conditions. As
discussed above, these ancillary factors complicate and increase the cost of P450-
based catalytic conditions. Substrate acceptance and specificity has been addressed by
mutation of wild-type P450 in the cavity above the heme (Fig. 1.13), whereas the
ancillary factors have been replaced by artificial oxidants that bypass the need for O2
reduction in the catalytic cycle. The problem of substrate promiscuity, improvement in
catalysis approached by mutagenesis continues to be a study for many researchers.
1.7. Reactivity of P450cam
The hydroxylation of D(+)-camphor at the 5-exo position, 39 is the first reaction of
the camphor degradation pathway in strain ATCC 17453 of Pseudomonas putida, a

25
common soil bacterium. 160 The formation of 5-exo-hydroxycamphor has been studied in
great detail 4,16,36,38,39 (see section 1.4), but several researchers have noticed that
P450cam also produces 5-ketocamphor, presumably by a second hydroxylation of 5-exo-
hydroxy camphor. 161 Such multiple oxidations on a single carbon of the substrate have
been documented in other CYPs, most notably steroid-metabolizing CYP51. 162
In our laboratory, the formation of borneol was observed by both Plettner
(unpublished) and later by Rojubally et al. 163 in experiments with recombinant P450cam,
PdX and PdR. Even when P450cam was chemically linked to PdX, traces of borneol
formed. Experiments with the PdR alone showed that PdR is not responsible for
reducing camphor to borneol. PdX, alone did not produce borneol as well. Borneol
formed only in the presence of P450cam. 163 A preliminary experiment by Rojubally, in
which crude P450cam/PdX/PdR from P. putida was incubated in H2O with NADD revealed
no labelled borneol. In contrast, when the same enzyme preparation was dialyzed
against a D2O buffer, and NADH was used, 2-D borneol formed. 163 The mechanism of
this reaction was not known.

26
1.8. Objectives of my thesis
A) Redox reactions of P450cam and formation of borneol: The first objective of my
thesis was to elucidate the mechanism by which the enzyme P450cam forms the
reduction product, bormeol.
B) Degradation of endosulfan, by P450cam: The second objective of my thesis was to
prepare a mutant library using Sequence Saturation Mutagenesis (SeSaM), and screen
the library for mutants that can dehalogenate either 3-chloroindole or endosulfan.
1.9. Thesis layout
This thesis has five chapters. This first chapter introduced CYP chemistry, the
catalytic reactions and my objectives. The second chapter describes the early work I did,
based on A. Rojubally’s results that had not been published in a journal at the time I
started. This work was published in J. Chem. Ecol. 164 and focused on the conditions
under which borneol formed in vivo in P. putida, as well as on the effect of borneol on
the growth of P. putida. The third chapter describes my work on the elucidation of the
borneol formation mechanism. The fourth chapter describes the SeSaM of P450cam and
the identification of a mutant that dehalogenates both 3-chloroindole and endosulfan.
The fifth chapter describes the conclusions from this work and some suggestions of
future experiments that should be done to further elucidate the borneol formation
mechanism and the mechanism of endosulfan dehalogenation.

27
2. Identification of Camphor Oxidation and Reduction Products in Pseudomonas Putida. New Activity of the Cytochrome P450cam System
This chapter is reproduced in part, with editorial changes suggested by the examination
committee, from “Identification of camphor oxidation and reduction products in
Pseudomonas putida. New activity of the cytochrome P450cam system” published in the
Journal of Chemical Ecology, 2011, 37(6), 657-667.
Brinda Prasada, Adina Rojuballyb and Erika Plettnera
a Department of Chemistry, Simon Fraser University, 8888 University Drive, Burnaby,
BC, Canada – V5A 1S6.
b Research associate, BC Cancer Agency, Vancouver, BC, Canada
Author Contributions:
B. Prasad performed experiments with the purified P450cam system, with
camphor/borneol toxicity and wrote the paper. A. Rojubally performed the standard
syntheses and time course experiments with P. putida.

28
2.1. Abstract
P450 enzymes are known for their hydroxylation reactions of non-activated C-H
bonds. For example, P450cam from Pseudomonas putida oxidizes camphor to 5-exo-
hydroxy camphor and further to 5-ketocamphor. This hydroxylation reaction proceeds via
a catalytic cycle in which the reduction of dioxygen (O2) is coupled to the oxidation of the
substrate. We have observed that under conditions of low oxygen, P. putida and isolated
P450cam produce the reduction product of camphor, borneol. In this paper, we outline the
formation of borneol, when the catalytic cycle has low oxygen (O2 ≤ 2 mg/L, ≤ 63 µM) or
when the catalytic cycle is shunted by artificial oxidants like m-chloro perbenzoic acid,
cumene hydroperoxide etc. We also tested the toxicity of camphor and borneol with P.
putida and E. coli. We have found that borneol is less toxic than camphor to P. putida,
but more toxic to E. coli. We discuss a potential ecological advantage of the camphor
reduction reaction for P. putida.

29
2.2. Introduction
Cytochrome P450cam isolated from the soil bacterium Pseudomonas putida 165, 166
is a heme monoxygenase 3,167 which is known to catalyse the hydroxylation of camphor
9 to 5-exo-hydroxycamphor 10 168,169 and further to 5-ketocamphor 11.170 (Fig. 2.1) The
P450cam needs two electron transfer proteins, putidaredoxin (PdX) and putidaredoxin
reductase (PdR) 25 for its catalytic activity. 171,172 The catalytic cycle of the enzyme has
evolved to couple the highly favourable reduction of O2 to the unfavourable oxidation of
the hydrocarbon substrate. A key intermediate in the catalytic cycle, the iron-oxo species
(Fe(IV)=O Por+.) (7, Fig. 1.1) also known as Cpd I, is supposed to be the most reactive
species 173 and is also believed to form via a shunt pathway, 50,174 when artificial oxidants
such as iodosobenzene, cumene hydro-peroxide 55 or meta chloro perbenzoic acid (m-
CPBA) are used (Fig. 1.1). 175
We have identified 5-exo-hydroxycamphor 10 and 5-ketocamphor 11 (Figure 2.1)
in our enzymatic assays performed with the purified proteins isolated from the soil
bacterium P. putida. In this paper, we describe the identification of a third product:
borneol 12, using the shunt as well as the regular catalytic conditions. This finding is
surprising, because borneol, a reduction product of camphor, formed under conditions
that are not considered to be reducing. Also surprisingly, isoborneol (Fig. 2.2) was not
detected.
O2 H2O
NADH NAD+
O
OH
10P450cam
PdX, PdR
O
9
O2 H2O
NADH NAD+
O
O11P450cam
PdX, PdR
Figure 2.1. The hydroxylation reaction of camphor: Formation of 5-exo-hydroxycamphor and 5-ketocamphor

30
We have found that cytochrome P450cam produces borneol and we describe the
conditions under which it forms in vivo and in vitro. We have compared the toxicity of
camphor and borneol against strain ATCC 17453 of P. putida (which contains the CAM
plasmid) and against E. coli, a bacterium that lacks cytochrome P450. The results suggest
that the formation of borneol from camphor may confer an advantage to P. putida.
Borneol (12) Isoborneol
Figure 2.2. Borneol (12), the reduction product of camphor and isoborneol. Borneol is formed in P. putida but not isoborneol.
2.3. Materials and Methods
2.3.1. General methods and chemicals.
All solvents were distilled prior to use. Reduced nicotine adenine dinucleotide
(NADH), dithiothreitol (DTT), lysozyme, DNase, RNase, Vitamin B1, riboflavin, δ-
aminolevulinic acid, hydrogen peroxide (used for assays), protease inhibitors leupeptin,
aprotinin and 4-(2-aminoethyl)-benzenesulfonyl fluoride were purchased from Sigma. m-
chloro perbenzoic acid was purified by known methods and used for assays. 176 Other
shunting agents, cumene hydro-peroxide (CHP), sodium periodate (NaIO4), calcium
hypochlorite (bleach) were used as received. Gas chromatography was performed on a
Hewlett Packard 5890 GC, equipped with a flame ionization detector and a 30-m SPB-5
column (Supelco, 0.25 mm ID; 0.25 µm film thickness).
The instrument was programmed as follows: 80 °C (5 min), 10 °C min-1 to 200 °C
(4 min), 50 °C min-1 to 250 °C (20 min); head pressure 15 psi; total flow through the
column 1.7 mL min-1. Gas chromatography/mass spectrometry (GC-MS) was carried out
on a Varian Saturn 2000 MS equipped with a 30-m SPB-5 column (Supelco, 0.25 mm
ID; 0.25 µm film thickness) and the column was programmed as follows: 45 °C (0.5
min), 7 °C min-1 to 120 °C (1 min), 50 °C min-1 to 260 °C (3 min). Electron impact spectra

31
were obtained at an emission current of 30 µA, scanning from 50 to 365 amu, with ion
storage (SIS mode) 49-375, trap temperature 170 °C and transfer line 250 °C. For high
sensitivity measurements, electron impact spectra were obtained with ion storage (SIS
mode) 90-170. The volume injected into the GC-MS was always 1 L. Calibration lines
were obtained for camphor, borneol, 5-exo-hydroxycamphor and 5-ketocamphor, using
standards (borneol and D(+)-camphor, Sigma-Aldrich; 5-exo-hydroxycamphor and 5-
ketocamphor were standards prepared by A. Rojubally). The limits of borneol detection
with these two programs were: 1200 pg/L (50-365 amu scanning program) and 20
pg/L (“high sensitivity” 90-170 amu scanning program).
UV/Vis spectra were obtained on a Cary 300 Bio UV-visible double beam
instrument. NADH utilization rates and hydrogen peroxide formation were measured on
a thermostatted Hach DR/4000 U spectrophotometer. Activity assays were carried out at
22 °C. Electrophoresis was performed on polyacrylamide gels (14%, 29:1) with 0.5%
SDS (SDS-PAGE). The samples were reduced by treatment with DTT (31 mg/mL)
before loading on gels. Gels were stained with Coomasie Brilliant Blue R (Sigma).
Sonication was done on a Branson Ultrasonic sonicator. Centrifugations were carried out
with a Beckmann Avanti J-26 XPI centrifuge, equipped with a JLA 8.1000 rotor.
The buffers used were : lysis (20 mM phosphate buffer (K+), pH 7.4 with 1 mM
camphor; T-100 (50 mM Tris, 100 mM KCl, pH 7.4); T-400 (50 mM Tris, 400 mM KCl, pH
7.4); Substrate-free P450 was prepared by passing the substrate bound enzyme over a
Sephadex G-10 column equilibrated with 100 mM MOPS (pH 7.0).
2.3.2. D(+) camphor purification
D(+) camphor (Sigma) contained ~5% of borneol as confirmed by GC-MS in
comparison with borneol standard (Sigma). The camphor was recrystallised from
ethanol/water and then purified on silica gel with a hexane: ethyl acetate gradient (from
1:0 (30 fractions, 8 mL) to 99:1 (5 fractions), to 4:1 (8 fractions)). The lowest amounts of
borneol that can be detected by GC-MS by the high-sensitivity measurements is 20 pg,
as detected from the calibration line. The D(+) camphor was pure as analysed by GC-
MS (and had no traces of borneol) as measured from the high sensitivity mass spectral
measurements with ion storage (SIS mode) 90-170 (see above). Mass spectrum (EI):

32
m/z (% of base peak) 153 (M+1, 6), 152 (M˙+, 8), 137(7), 108 (66), 95 (100), 69 (15), 67
(55), 55 (28). MS (CI, isobutene): m/z (% of base peak) 153 (M+1, 100), 137 (2), 135 (6),
108 (10), 95 (3), 81 (10), 69 (12), 67 (20). Other products, 5-ketocamphor and 5-
exohydroxy camphor were characterized by NMR and GC-MS in comparison with the
prepared standards.
2.3.3. NMR
The proton and the carbon nuclear magnetic resonance spectra were run on a
Varian 500 MHz instrument. The chemical shifts (δ) for all compounds are listed in parts
per million using NMR solvent as an internal reference. The coupling constants (J) are
listed in Hertz (Hz).
2.3.4. Protein production (from P. putida)160, 177 and the purification steps
P450cam, PdR and PdX were isolated from the P. putida ATCC 17453. The P.
putida were grown in nutrient broth (Gibco) containing 0.5 mg mL-1 of 1-(R)- camphor
with shaking (250 rpm) to A600 = 0.9 - 1.0. Cells from 2 L of culture were lysed in 50 mL
of 20 mM potassium phosphate, pH 7.4, 1 mM camphor. The cell suspension was made
10 mM in EDTA (pH 7.4), lysozyme (100 mg L-1), camphor (1 mM in ethanol) added and
stirred for 30 minutes at 4 °C. The suspension was sonicated with 50% duty cycle for 10
minutes, 10 mM with MgSO4, DNase (2 mg, Sigma), RNase (10 mg, Sigma) were added
and stirred for 30 min at 4 °C. The lysate was sonicated for 5 minutes and homogenized
in a tissue homogenizer with a Teflon pestle. The homogenized cells were then
harvested by centrifugation (7000 × g, 30 min), dialysed with frequent changes of 20 mM
potassium phosphate, pH 7.4 containing 1 mM camphor for further purification by
ammonium sulphate precipitation. The dialysed lysate of P. putida was subjected to a
20% ammonium sulphate cut to remove the cell debris. The 20% supernatant was then
carried forward to 55% ammonium sulphate saturation to isolate the proteins. All these
three proteins were isolated in the above step and were further purified by DE-52 column
using a linear gradient with buffer T-100 to T-400, 1 mM camphor, 1 mM β-
mercaptoethanol at 1 mL min-1. The fractions with high absorbances at λ392 (in the case
of P450), λ 454 (in the case of PdR), λ 325 (in the case of PdX) were pooled, checked with

33
SDS-PAGE (Supplementary Fig. S1) before proceeding with gel-filtration
chromatography. The collected fractions were concentrated in an Amicon ultrafiltration
cell equipped with a 10kDa membrane (Millipore Corporation, Billerica, MA, USA) and
the concentrate (containing P450, PdR and PdX) was loaded onto a S-100 column,
eluted with T-100 buffer, 1 mM sucrose, 1 mM camphor at 1 mL min-1. The selected
fractions containing A392/ A280 ~ 0.14, A454/A280 ~ 0.11, A325/A280 ~ 0.25 were analysed by
SDS-PAGE for molecular weight determination. The accurate concentrations of the
proteins (PdR and PdX) could not measured even after further purifications. This
partially purified P450cam system was used for the assays (see below).
2.3.5. In vivo Assays with P. putida
To monitor the conversion of camphor to metabolites by the induction of P450
under aerated and non-aerated conditions, P. putida ATCC 17453 strain was grown for 7
generations in two replicates without camphor. Aliquots (20 µl) of the 7th generation
cultures (both aerated and non-aerated) were inoculated into 100 ml of nutrient broth
medium in a 250 ml flask. This 8th generation of log phase culture was treated with 0.77
g of camphor delivered in DMSO and the absorbances at 280, 392, and 410 nM were
recorded at 0 min (immediately after adding camphor), 5 min, 30 min, 60 min, 120 min,
180 min, 240 min, and 8 h under both aerated and non-aerated conditions. At every
time point, the sample was centrifuged to collect the pellet and the supernatant. The
supernatants from the different time points were extracted with CHCl3/indanone (7.2 μM)
for the extraction of the product(s) and the substrate. Indanone was our internal standard
for the quantification of products by GC-MS. A second extraction of the aqueous phase
with 0.7 ml of CHCl3/indanone followed. The combined organic layers were dried over
MgSO4 and analyzed by GC-MS.
2.3.6. In vitro Assays with Isolated P450cam, PdR, and PdX Complex
In vitro enzymatic assays were performed in 2 ml of 50 mM phosphate buffer
(100 mM K+) (pH 7.4). The buffer was sparged with charcoal filtered air/oxygen or argon
(both Sigma-Aldrich) prior to use. The proteins could not be separated by the two
columns we ran, and the approximate concentrations of the ferric P450 (with camphor),
PdR, and PdX were determined by their extinction coefficients ε392 =104 mM-1 cm-1, ε454 =

34
10.0 mM-1 cm-1, and ε325 =15.6 mM-1cm-1. 160 The reaction mixture contained
approximately 1.5 µM P450cam, 2.5 µM PdR, 5 µM PdX, and the substrate camphor (2.5
mM). NADH consumption was initiated by the addition of 2.5 µl NADH stock (200 mM)
and monitored for 10 min at 340 nm. The experiment was performed in four replicates,
and three controls were run in parallel with the treatments: 1) blank: without enzyme but
all other reactants added; 2) enzyme and the substrate added to the buffer without
NADH; and 3) NADH and the enzyme added without camphor. The reaction was
stopped by the addition of 1 ml CHCl3/indanone (7.2 µM) for the extraction of the
product(s) and the substrate. Indanone was our internal standard to quantify products by
GC-MS. A second extraction of the aqueous phase with 0.7 ml of CHCl3/indanone
followed. The combined organic layers were dried over MgSO4 and analyzed by GC-MS.
In assays involving m-CPBA as a shunt agent for the catalytic cycle, the reaction
mixture contained 1.5 µM P450cam, m-CPBA (1 mM), and substrate camphor (1 mM).
The experiment was performed in four replicates, and three controls were run in parallel
with the treatments: 1) blank: without enzyme but all other reactants added; 2) enzyme
and the substrate added to the buffer without m-CPBA; and 3) m-CPBA and the enzyme
added without camphor. The reaction mixture was incubated for 15 min at 22 °C and
extracted in the same way as above. The dried organic layers were analyzed by GC-MS.
In assays involving borneol as the substrate and m-CPBA as a shunt agent for
the catalytic cycle, the reaction mixture contained 2 µM P450cam, m-CPBA (1 mM), and
substrate (1 mM). The experiment was performed in four replicates, and three controls
were run in parallel with the treatments: 1) blank: without enzyme but all other reactants
added; 2) enzyme and the substrate added to the buffer without m-CPBA; and 3) m-
CPBA and the enzyme added without borneol. The reaction mixture was incubated for
30 min at 22 °C and extracted in the same way as above. The dried organic layers were
analyzed by GC-MS.
2.3.7. Toxicity Assays of Tetracycline, DMSO, Camphor, and Borneol against P. putida and E. coli
Cultures of the strains ATCC 17453 of P. putida and XL-1-blue of E. coli were
grown overnight, and then were used to inoculate 2×250 ml growing cultures, which
were grown at 300 rpm with good aeration until an O.D. of 0.1 was reached. An aliquot
35
(5 ml) of each of these cultures was transferred separately to Falcon tubes in three
replicates, to each of which either camphor, borneol, or tetracycline was added to a final
concentration of 1 mM. Dimethyl sulfoxide (DMSO), the solvent used for preparing
stocks, was also used as one of the controls. Cultures were grown for 1 h and incubated
overnight at 4 °C. They were diluted 103×, 104×, 105×, 106×, 108× in three replicates and
then plated on non-antibiotic LB-agar plates in two replicates (20 and 50 µl) and were
incubated overnight at 27 °C. Colonies were counted after overnight incubation. The
toxicities of camphor and borneol to the two strains were assessed by measuring the
reduction of cell density [colony forming units (CFU)/ml]. To obtain CFU/ml, colonies
were grown on agar plates and the numbers of colonies were divided by the volume
plated. This, when divided by the dilution factor, gives the CFU/ml in the original sample.
We compared P. putida with the CAM plasmid to E. coli, a species of bacterium known
to not contain any P450 genes. 178 A comparison of the relative toxicity between borneol
and camphor on E. coli was determined by a one-way ANOVA test (Vander Waerden
test) with JMP starter software (Cary, NC, USA) with significance determined at α =
0.05. The distribution of the data was checked with JMP software and the normal
hypothesis was rejected. Therefore, a non-parametric method was used for the analysis.
Tukey-Kramer pairwise comparisons were performed to test the effects of camphor and
borneol relative to DMSO; Wilcoxon and Vander Waerden comparisons were used to
test the effects of camphor and borneol directly.
2.3.8. IC50 Experiments with Camphor and Borneol against E. coli
Two growing cultures (250 ml each) were inoculated with an overnight grown
culture of XL-1-blue of E. coli and then grown at 300 rpm with good aeration until a O.D.
of 0.1 was reached. An aliquot (5 ml) of this culture was transferred to Falcon tubes to
which either borneol or camphor was added in varying concentrations. The final
concentrations of these compounds ranged from 0.5 nM to 1 µM. Dimethyl sulfoxide
(DMSO), the solvent used for preparing stocks, was also used as one of the controls.
Cultures were grown for 1 h and incubated overnight at 4 °C. They were diluted 104×
and 105× in three replicates and then plated on non-antibiotic LB-agar plates in two
replicates (20 and 50 µl) and incubated overnight at 37°C. The concentration of colony
forming units (CFU/ml) was calculated the next day, depending on the number of

36
colonies. The IC50 was calculated by graphing CFU/ml vs. the logarithm of concentration
of compounds. 179
2.4. Results
2.4.1. Analysis of Products Formed in P. putida Culture with (1R)-(+)-Camphor During in vivo Assays with Purified P450cam
System
In vivo production of borneol and 5-ketocamphor was monitored under aerated
and non-aerated conditions in growing P. putida cultures that had been treated with
camphor. The quantities of borneol under both aerated and non-aerated conditions
increased in the first 180 minutes and later, the rate of borneol formation was higher
under non-aerated conditions than under aerated conditions (Fig. 2.3). Borneol detected
under poorly aerated conditions was identified by chiral stationary phase GC-FID with a
retention time of 29.8 min and compared to the retention times of two products of sodium
borohydride reduced (1R)-(+)-camphor, borneol (12), and isoborneol. Isoborneol, eluted
from the cycloSyl B column with a retention time of 25.8 min. This confirms that borneol
is the only reduction product detected in the P. putida culture. 180

37

38
Figure 2.3. Time course quantities of 5-ketocamphor and borneol from an induced culture of Pseudomonas putida under aerated and non-aerated conditions.
2.4.2. In vitro assays with the partially purified P450cam, PdR and PdX system:
To determine whether P450cam is involved in the formation of 10, 11 and 12,
(Figures 2.1 and 2.2) experiments were performed using partially purified P450cam and its
redox partners, obtained from P. putida induced with camphor.
The reaction mixture contained approximately 1.5 µM P450cam, 2.5 µM PdR, 5
µM PdX, and the substrate camphor (2.5 mM). The first unexpected result was that
these proteins cannot be separated during the purification process. We therefore used
this partially purified P450cam system in our in vitro assays.
Under oxygenated conditions, (when the assay buffer was sparged with oxygen
or air), the enzyme complex catalysed the oxidation of camphor to 5-ketocamphor (as
the major product) and reduction to borneol (minor product) (Table 2.1). When there was
insufficient oxygen for the catalysis, (when the assay buffer was sparged with argon),
surprisingly, borneol formed and 5-ketocamphor was not detected. Under these
conditions, when the enzymatic pathway was shunted in the presence of m-CPBA and
cofactor NADH was added, the amount of 5-ketocamphor formed was the same as that
of borneol. In this assay, the concentration of 5-ketocamphor formed was less when
compared to the oxygenated conditions. When hydrogen peroxide was used in the place
of m-CPBA under similar conditions, ketocamphor was not detected and less borneol
was formed (Table 2.1). In the absence of cofactor in the above mentioned conditions
and when m-CPBA was used as a shunt agent, 5-ketocamphor was not detected and
surprisingly, more borneol was formed than with H2O2. This illustrates that the cofactor
NADH is not involved in the formation of borneol. Further verification that NADH is not
necessary for borneol formation came when NADD was added to the assay reaction
mixture containing substrate camphor and the enzyme preparation: deuterated borneol
was not detected by GC-MS. 180 Hydrogen peroxide, when added to the system, appears
to be inhibitory, giving lower amounts of borneol. Taken together, these observations

39
suggest that borneol forms under conditions when the bacteria begin to be stressed by
low oxygen levels, but are still metabolizing camphor.

40
Table 2.1. Assays with P450:PdR:PdX complex isolated from Pseudomonas putida
Enzymatic assay Products (nmol min-1 µmol-1 P450)
NADH consumed
(nmol min-1 µmol -1
P450)
H2O2 formed
(nmol min-1
µmol -1 P450)
Borneol (12)
5-ketocamphor (11)
O2a
2.4 ± 2
207± 27
763 ± 181
N/d
Airb
65 ± 7
484 ± 121
1303 ± 484
13.6 ± 9
Argonc
20 ± 8
N/d
N/d
15.9 ± 8
Argon + m-CPBA +
NADHd
24 ± 8
32 ± 4
3 ± 1
ND
O2a
N/d
272 ± 36
606 ± 10
N/d
Argon+m-CPBAe
71 ± 48
N/d
N/A
ND
Argon + NADH +H2O2
f
7 ± 5
N/d
ND
ND
Values are average of 4 replicates ± S.E. N/A = Not Available; ND=Not Determined; N/d = Not detected; The reaction mixture contained approximately 1.5 µM P450cam, 2.5 µM PdR, 5 µM PdX, and the substrate camphor (2.5 mM). NADH consumption was initiated by the addition of 2.5 µl NADH stock (200 mM) and monitored for 10 min at 340 nm. a Oxygen was sparged into the buffer for enzymatic assays
b (Charcoal filtered) air was sparged into the buffer for enzymatic assays
c The buffer was sparged with argon for the assays
d The buffer was sparged with argon in the shunt pathway (m-CPBA) and the cofactor was added.
e The buffer was sparged with argon in the shunt pathway. The cofactor NADH was not added to
the reaction mixture. f The buffer was sparged with argon in the shunt pathway (H2O2 ) and the cofactor NADH was added

41
2.4.3. Enzymatic assays involving borneol as the substrate
The enzymatic assays involving borneol as the substrate were done under shunt
conditions and the products formed were monitored by GC-MS. The conversion of
borneol to camphor and further to 5-exo-hydroxycamphor was detected, which shows
that this formation of borneol is a reversible reaction. The concentration of camphor was
33±1.6 nmol/min/µmol P450 and 5-exo-hydroxycamphor was 50±1.6 nmol/min/µmol
P450. This illustrates that P. putida can convert borneol back to camphor. Borneol was
detected as the only reduction product of camphor and therefore, isoborneol was not
chosen as a substrate for these enzymatic assays.
2.4.4. Toxicity Assays for Camphor and Borneol
To test for a potential adaptive value for the conversion of camphor to borneol,
we compared the relative toxicities of camphor, borneol, and tetracycline on P. putida
and on E. coli. The ANOVA on mean cell densities for each species revealed an effect
of treatment (P. putida: P = 0.0056 and F = 4.403; E. coli: P < 0.001 and F = 8.632).
Tukey-Kramer pairwise comparisons of the toxicity of the substrates to P. putida
revealed no significant differences in cell densities following monoterpene treatment
relative to DMSO, suggesting that neither camphor nor borneol were toxic to P. putida
(Fig. 2.4a) (DMSO/camphor pair, P = 0.3926; DMSO/borneol pair, P = 0.9807; and
camphor/borneol pair, P = 0.6288). In contrast, treatment with tetracycline did cause a
reduction in cell density relative to DMSO (Fig. 2.4a) (DMSO/tetracycline pair, P =
0.0069; camphor/tetracycline pair, P = 0.3196; and borneol/tetracycline pair, P =
0.0218). Wilcoxon and Vander Waerden tests revealed that camphor was more toxic
than borneol to P. putida (Fig. 2.4a) (P = 0.025, N=3). Tukey-Kramer pairwise
comparisons of the toxicity of the substrates to E. coli revealed that camphor, borneol,
and tetracycline were all toxic to E. coli relative to DMSO (Fig. 2.4b) (DMSO/camphor
pair, P < 0.001; DMSO/borneol pair, P < 0.001; DMSO/tetracycline pair, P < 0.001;
camphor/borneol pair, P = 0.9997; camphor/tetracycline pair, P = 0.9995; and
borneol/tetracycline pair, P = 1.0). Wilcoxon and Vander Waerden comparisons revealed
that while both monoterpenes were toxic to E. coli, borneol was more toxic than camphor
(P = 0.035, N=3). In addition to this, the IC50 of borneol with growing cultures of E. coli

42
ranged from 14.3 nM to 20 nM, whereas the IC50 of camphor ranged from 19 nM to 42
nM (Fig. 2.5).
a) b)
Figure 2.4. Toxicity assays for camphor and borneol in two strains of bacteria: ATCC 17453 of P. putida (a) and E. coli (b).
-1 0 1 2 3 4
1.0×10³
2.0×10³
3.0×10³
Camphor concentration [log10 (nM)]
Cel
l d
ensi
ty(C
FU
/mL
)
-1 0 1 2 3 4
5.0×10²
1.0×10³
1.5×10³
2.0×10³
2.5×10³
3.0×10³
3.5×10³
Borneol concentration [log10 (nM)]
Cel
l d
ensi
ty (
CF
U/m
l)
Figure 2.5. IC50 experiments on Escherichia coli with varying concentrations of camphor and borneol.
2.5. Discussion
Hydroxylation of camphor is catalyzed by the P450cam complex with its redox
partners PdR and PdX. 181,182 The P450 reduces O2 with electrons from NADH and

43
incorporates one oxygen atom into product. 183 Here we have observed that, in addition
to the known camphor oxidation products 5-exo-hydroxycamphor (10) and 5-
ketocamphor (11), a reduction product, borneol (12), forms during P450cam catalysis. The
distribution of products appears to be dependent on the reaction conditions. Under well
oxygenated conditions, 5-ketocamphor (11) is the major product, whereas under poorly
aerated conditions, borneol (12) is the major product. One way in which borneol could
form is via reduction of the 2-keto group of camphor with NADH, but NADH does not
react directly with camphor.
Previous studies may have missed the formation of borneol, because various
camphor-derived compounds that elute after camphor like borneol, isoborneol (Figure
2.2), and 5-exo-hydroxycamphor elute closely on non-polar GC columns typically used
for this analysis. Furthermore, the mass spectra of the oxygenated bornyl-based
monoterpenes (9, 10, 11, 12 and isoborneol) are very similar, because of a strong
tendency to fragment to ions with m/z of 108, 95, 81, and 67. From studies with 17O-
labeled camphor, we know that none of these ions contain oxygen. 184 The products of
camphor oxidation and the reduction product, borneol were detected in the early stages
of metabolism, up to ~6 h of culture. Further metabolism of borneol to 5-exo-hydroxy
borneol (12) was observed in the non-aerated conditions, which suggests that the
reduction to borneol and its further hydroxylation to (12) occurs in the intact bacterium.
To test for a potential adaptive value for this reaction, we compared the relative toxicity
of camphor and borneol on P. putida and on E. coli. This experiment suggested that
camphor is toxic to both E. coli and P. putida, whereas borneol is more toxic than
camphor to E. coli. Therefore, formation of borneol may confer an advantage to strains
of P. putida that metabolize camphor and are competing with other bacteria that do not
metabolize camphor. Under conditions of low oxygen, borneol forms from camphor, and
this compound is less toxic than camphor itself to P. putida but more toxic to P450-free
bacteria such as E. coli.
We are not aware whether E. coli and P. putida compete with each other
ecologically (Scifinder search for whether the organisms E. coli and P. putida compete
with each another in nature yielded no references). We know that P. putida, for example,
exists in soil and in sink sludge 185 (from where the camphor metabolizing strain of P.
putida was originally isolated). E. coli is a widespread enteric bacterium, but can also
44
exist outside of vertebrate organisms (in soil or in water), as some past tragic incidents
with drinking water in rural areas have demonstrated. 186
Bacterial P450’s have been widely studied in the past for their ecological
functions in the detoxification of both natural and artificial toxicants. For example, P450
BM3 from Bacillus megaterium hydroxylates fatty acids, fatty amides, and alcohols at the
-1, -2, or -3 positions, making them less amphiphilic (Narhi and Fulco, 1986). P450
isolated from the actinomycete Nonomuraea recticatena IFO 14525, catalyzes the
hydroxylation of oleanolic acid, a toxic triterpene. 187 P450s from members of the order
Actinomycetales catalyze pentachlorophenol dehalogenation and the degradation of
sulphonyl-urea herbicides. 188
2.6. Summary
In summary, we have identified the reduction product borneol by using the
substrate camphor and purified P. putida proteins. The source of electrons for the
reduction reaction was not the nicotinamide cofactor. This gave us a thought of exploring
the reduction mechanism even further to discover the side product of the reduction
reaction in addition to borneol. Although P450cam was a well studied enzyme, the
reduction reaction was not reported previously. The source of electrons for this reduction
reaction and our proposed mechanism are described in the third chapter.

45
2.7. Supplementary information
Supplementary figure 2.S1. The SDS-PAGE gel analysis of the proteins (P450cam, PdR and PdX) obtained after purification from anion-exchange (DE-52) column. Lanes 1, and 5 are molecular markers; Lane 2 is the BSA standard. Lanes 3, 4, 6, and 7 are the fractions collected from the DE-52 column. The arrows show the approximate positions where we expect P450cam (47 kDa), PdR (46 kDa) and PdX (12 kDa) to appear.

46
3. The Borneol Cycle of Cytochrome P450cam: Mechanism and Advantages to Pseudomonas Putida
This chapter is reproduced in part, with editorial changes suggested by the
examination committee, from “Water Oxidation by a Cytochrome P450. Mechanism and
function of the reaction” published in PloS One 2013, 8(4): e61897.
Brinda Prasada, Derrick J. Maha, Andrew R. Lewisa, Erika Plettnera
aDepartment of Chemistry, Simon Fraser University, Burnaby, BC, Canada - V5A 1S6
Author contributions
B. Prasad purified the proteins PdR and PdX, performed all the enzymatic
assays, the NMR experiments, and wrote the paper. D. Mah performed experiments in
determination of the new extinction coefficient for P450cam. A. Lewis optimised the 17O
NMR conditions and worked together with B. Prasad in designing the 17O NMR
experiments. E. Plettner planned the project and worked on elucidating the reduction
mechanism.
47
3.1. Abstract
P450cam (CYP101A1) is a bacterial monooxygenase that catalyzes the oxidation
of camphor, the first committed step in camphor degradation, with simultaneous
reduction of oxygen (O2). We report that P450cam catalysis is controlled by oxygen levels:
at high O2 concentration, P450cam catalyzes the known oxidation reaction, whereas at
low O2 concentration the enzyme catalyzes the reduction of camphor to borneol. We
confirmed, using 17O and 2H NMR, that the hydrogen atom added to camphor comes
from water, which is oxidized to hydrogen peroxide (H2O2). This is the first time a
cytochrome P450 has been observed to catalyze oxidation of water to H2O2, a difficult
reaction to catalyze due to its high barrier. The reduction of camphor and simultaneous
oxidation of water are likely catalyzed by the iron-oxo intermediate of P450cam, and we
present a plausible mechanism that accounts for the 1:1 borneol:H2O2 stoichiometry we
observed. This reaction has an adaptive value to bacteria that express this camphor
catabolism pathway, which requires O2, for two reasons: 1) the borneol and H2O2
mixture generated is toxic to other bacteria and 2) borneol down-regulates the
expression of P450cam and its electron transfer partners. Since the reaction described
here only occurs under low O2 conditions, the down-regulation only occurs when O2 is
scarce.

48
3.2. Introduction
P450cam (CYP101A1), enables a strain of Pseudomonas putida (a soil bacterium)
to use (1R)-(+)-camphor 9 (Fig. 2.1) as a carbon source, and oxidises at the 5th position
to give 5-exo-hydroxycamphor 10 and 5-ketocamphor 11 (Fig. 2.1) 189. Here we
describe how P450cam can also reduce camphor to borneol 12 (Fig. 3.1) under low O2
conditions, and how borneol regulates the expression of the P450cam system. Catalytic
water oxidation is difficult to achieve, because the reaction is endothermic and has a
large barrier. 190-192 To our knowledge, this is the first description of a cytochrome P450
oxidizing water.
We have observed that at low oxygen concentration, regardless of whether
compound I (7, Fig. 1.1) forms via reduction of O2 or by shunting with oxidants, P450cam
not only produces the oxidation products 5-exo-hydroxy camphor (10) or 5-ketocamphor
(11), but can also reduce camphor to borneol (12) (Fig. 3.1) 193. We have interpreted this
reaction to give P. putida an ecological advantage over other non-camphor metabolising
bacteria because borneol is bactericidal to non-P450 containing bacteria, but not to P.
putida 193. In this chapter, the mechanism of the camphor reduction reaction and the
regulatory effect of the product, borneol, on the expression of P450cam will be discussed.

49
Figure 3.1 Under highly oxygenated conditions, P450cam hydroxylates camphor (9) to 5-exo-hydroxy camphor (10) and further to 5-ketocamphor (11), whereas under low oxygen conditions, P450cam reduces camphor to borneol (12). Details of the high O2 cycle are shown in Fig. 1.1 and the details of the low O2 cycle are shown in Fig. 3.6.
3.3. Materials and Methods
3.3.1. General
3.3.1.1. Materials
All solvents were distilled prior to use. Nicotine adenine dinucleotide, reduced
(NADH), Dithiothreitol (DTT), lysozyme, DNase, RNase, Vitamin B1, riboflavin, 5-
aminolevulinic acid, hydrogen peroxide (used for assays), protease inhibitors leupeptin,
aprotinin, and 4-(2-aminoethyl)-benzenesulfonyl fluoride, butylated hydroxytoluene
(BHT), cytochrome P450 CYP3A4 (C-4982), superoxide dismutase (S5639), catalase
(C-1345), glucose oxidase (G-2133) were purchased from Sigma.

50
Ethylenediaminetetraacetic acid (EDTA) was purchased from Fisher Scientific. Ferrous
sulphate (FeSO4) was purchased from Allied Chemical, Canada. Gas
chromatography/mass spectrometry (GC-MS) was carried out on a Varian Saturn 2000
MS equipped with a 30-m SPB-5 column (Supelco, 0.25 mm ID; 0.25 µm film thickness)
and the column was programmed as follows: 45 °C (0.5 min), 7 °C min-1 to 120 °C (1
min), 50 °C min-1 to 260 °C (3 min). Electron impact (EI) spectra were obtained at an
emission current of 30 µA, scanning from 50 to 365 amu, with ion storage (SIS mode)
49-375, trap temperature 170 °C and transfer line 250 °C. UV/Vis spectra were obtained
on a Cary 300 Bio UV-visible double beam instrument. NADH utilization rates and
hydrogen peroxide formation were measured on a thermostatted Hach DR/4000 U
spectrophotometer. Activity assays were carried out at 22 °C. Electrophoresis was
performed on polyacrylamide gels (14%, 29:1) with 0.5% SDS (SDS-PAGE). The
samples were reduced by treating with 1 µL of DTT stock (31 mg/mL) before loading on
gels. Gels were stained with Coomassie Brilliant Blue R (Sigma). Sonication was done
using a Branson Ultrasonic sonicator. Centrifugations were carried out with a Beckmann
Avanti J-26 XPI centrifuge, equipped with a JLA 8.1000 rotor.
The buffers used were: lysis (20 mM phosphate buffer (K+), pH 7.4 with 1 mM
camphor; T-100 (50 mM Tris, 100 mM KCl, pH 7.4); T-400 (50 mM Tris, 400 mM KCl, pH
7.4). Buffers for nickel columns were: rinse buffer (20 mM Tris, pH 8.0); low imidazole
buffer (5 mM imidazole, 20 mM Tris, 0.5 M NaCl, pH 8.0); strip buffer (0.1 M
Ethylenediaminetetraacetic acid (EDTA)), 0.5 M NaCl, pH 8.0). For P450cam purifications,
all buffers contained 1 mM camphor. Substrate-free P450 was prepared by passing the
substrate bound enzyme over a Sephadex G-10 column equilibrated with 100 mM 3-(N-
morpholino) propane sulfonic acid (MOPS, pH 7.0).
3.3.1.2. Methods
Deuterium (2H) NMR spectra were recorded on a Bruker AVANCE II 600 MHz
spectrometer (operating at 92.124 MHz). A Bruker 5 mm TCI cryoprobe was used with
samples maintained at a temperature of 298 K. 2H field-locking and field sweep were
turned off. Samples were contained in 3 mm diameter MATCH nmr tubes filled to 40 mm
(volume ca. 185 µL). Acquisition details: 10,240 transients summed, spectral width 15
ppm, transmitter offset 6.5 ppm, 11054 complex points acquired, 15 degree pulse with

51
recycle delay of 1 s between transients, no decoupling of 1H during FID acquisition.
Acquisition time was 14.2 h per spectrum.
The 17O NMR spectra were run on a Bruker AVANCE III 500 MHz NMR
spectrometer (operating at 67.808 MHz) equipped with a Bruker 5 mm TBO probe and
samples were maintained at a temperature of 298 K. Samples were contained in 5 mm
diameter nmr tubes filled to 50 mm (volume ca. 600 µL). Acquisition details: 1,000 or
25,000 transients summed, spectral width 503 ppm, 17O transmitter offset 50 ppm, 1H
transmitter offset 4.78 ppm, 32768 complex points acquired, 90 degree pulse with
recycle delay of 1 s between transients, and inverse-gated WALTZ-16 composite pulse
decoupling of 1H during FID acquisition. Acquisition time was 12 min per spectrum or
300 min (when catalase was present). The chemical shifts (δ) for all compounds are
listed in parts per million using the NMR solvent as an internal reference (H217O (δ=0
ppm) or 4.78 ppm for 2H).
3.3.1.3. Protein expression and purification
E. coli strain BL21 (DE3) (Novagen) containing the appropriate plasmid 163 were
grown in Luria Broth-ampicillin (LB-amp) medium at 37 °C with shaking (250 rpm) to A600
= 0.9 - 1.0 163. At this point, cells were harvested by centrifugation, resuspended in fresh
LB-ampicillin medium, and after 2 h of growth, IPTG (240 mg L-1) and trace additives
were added. The cultures, except for PdR, were grown for 12 h at 27 °C (PdR was
grown for 6 h). The cells were harvested by centrifugation (30 min, 7000 × g) and stored
at -85 °C until lysis. Additives were: FeCl2 (0.1 µM), 5-aminolevulinic acid (1 mM),
Vitamin B1 (10 µM) for P450; FeCl2 (0.1 µM) and Na2S.9H2O (0.1 µM) for redoxin;
riboflavin (1 mM) for reductase.
The lysis steps of P450 and PdR remained the same as described for P. putida
160 except that 1 mM camphor was added to the buffer in which P450 culture was lysed.
The dialysed lysate of P450, or PdR was individually subjected to a 20% ammonium
sulphate cut to remove the cell debris. The 20% supernatant was then carried forward to
45% ammonium sulphate saturation to isolate the protein. The 20-45% pellet was
resuspended in T-100 buffer (50 mM Tris, 100 mM KCl, pH 7.4), camphor (1 mM) was
added in the case of P450 and purified by DE-52 (anion exchange column) using a
linear gradient with buffer T-100 to T-400, 1 mM camphor and 1 mM β-mercapto ethanol

52
(P450 only) at 1 mL min-1. The fractions with high absorbances at λ392 (in the case of
P450), λ454 (in the case of PdR) were checked with SDS-PAGE. The collected fractions
were pooled and concentrated using an Amicon ultrafiltration cell equipped with a YM-10
membrane and the concentrated protein was individually loaded onto a S-100 column,
eluted with T-100 buffer, 1 mM sucrose, 1 mM camphor (P450 only) at 1 mL min-1. SDS-
polyacrylamide gel electrophoresis showed a single band for P450 and PdR.
In the case of PdX, cells from 2 L of culture were lysed in lysis buffer (0.25 M
NaCl, 20 mM Tris/HCl, pH 8.0). Lysozyme (10 mg mL-1), DNase (2 mg, Sigma), and
RNase (10 mg, Sigma) were added and the solution was stirred for 30 min at 4 °C. The
lysate was sonicated with 50% duty cycle for 10 minutes, stirred for 10 min at 4 °C, and
homogenized with a pestle. The homogenized cells were then harvested by
centrifugation (10500 × g, 30 min) and dialysed with frequent changes of lysis buffer
followed by further purification by ammonium sulphate precipitation. The dialysed lysate
was subjected to a 20% ammonium sulphate cut to remove the cell debris. The 20%
supernatant was then carried forward to 90% ammonium sulphate saturation overnight
to isolate the protein. The 20-90% pellet was resuspended in 5 mL of rinse buffer (20
mM Tris HCl, pH 8.5), dialysed against this buffer for 3 h and harvested at 5000 rpm for
5 min. The dialysed supernatant was loaded on a ~5 cm Ni2+-His bind column and eluted
with strip buffer (10 mL × 3), low imidazole buffer (10 mL × 2), high imidazole buffer (10
mL × 4). The fractions with A280/A325 < 5.0 were pooled, dialysed with 100 mM Tris, 100
mM KCl, pH 7.4 and the concentrated PdX protein was frozen to -85 °C. The
concentrations of ferric P450 (with camphor), PdR and PdX were determined by their
extinction coefficients (ε392 = 68.5 mM-1 cm-1, ε454 = 10 mM-1 cm-1, ε325=15.6 mM-1cm-1
respectively).
3.3.1.4. Determination of new P450cam extinction coefficient
The extinction coefficient of 280nm can be predicted from specific amino acid
residues 194, 5 tryptophan residues 195, 9 tyrosine residues 196 and 8 cysteine residues
197. This value was determined to be 41.91 mM-1cm-1 and with the addition of hemin at
280nm (22.5mM-1cm-1) 198, the predicted value was 64.41 mM-1cm-1, which is similar to the
literature value of P450cam 194. Using the literature value of P450cam at 280nm, 63.3 mM-

53
1cm-1 194, 392nm value was calculated using Beer-Lambert Law and was found to be 68.6
mM-1cm-1 and 410nm value was calculated to be 71.1 mM-1cm-1.
Table 3.1 Calculated and literature values of P450cam extinction coefficients at selected wavelengths.
Wavelength (nm) Calculated extinction
coefficient, (mM-1cm-1)
Literature extinction
coefficient, (mM-1cm-1) 2
280 64.4 63.3
392 68.6 102
410 71.1 86.5
3.3.2. Description of Enzymatic Assays
3.3.2.1. Assays with recombinant proteins
Enzymatic assays were performed in 1 mL of 50 mM phosphate buffer (100 mM
K+) (pH = 7.4) bubbled with air/oxygen. The reaction mixture contained 200 nM P450cam,
200 nM PdR, 1000 nM PdX and the substrate camphor (1 mM). NADH consumption was
initiated by the addition of 0.625 mM NADH and monitored for ten minutes at 340 nm.
The reaction was stopped by the addition of 1 mL 7.2 µM indanone in CHCl3 for the
extraction of the product(s) and the substrate. Indanone was the internal standard for the
quantitation of products by gas chromatography / mass spectrometry (GC-MS). A
second extraction of the aqueous phase with 0.7 mL of CHCl3 / indanone followed. The
combined organic layers were dried over MgSO4 and analysed by GC-MS.
In assays involving m-CPBA as a shunt agent for the catalytic cycle, the reaction
mixture contained P450cam (180 nM), m-CPBA (1 mM), and the substrate camphor (1
mM). The reaction mixture was incubated for 15 minutes at 22 °C and extracted as
described previously. The dried organic layers were analysed by GC-MS.
3.3.2.2. Steady-state kinetics
Enzymatic assays were performed under shunt conditions (as mentioned above)
to determine the KM and kcat for formation of borneol and 5-ketocamphor in normal and

54
D2O buffers. 1 mL of 50 mM phosphate buffer (100 mM K+, pH = 7.4 or pD 7.4)
contained camphor at varied concentrations ranging from 30 µM to 2500 µM, and 180
nM P450cam. 1 mM shunt agent (m-CPBA) was added to the reaction mixtures containing
camphor concentrations 500 µM to 2500 µM and to the rest of the concentrations, m-
CPBA was optimised to a 1:1 ratio with the substrate concentration to avoid the
destruction of the heme in P450. The reactions for 5-ketocamphor formation were
carried out using vials fitted with PTFE septa and pressurized with pure O2. The reaction
mixtures were incubated for 20 minutes at room temperature and extracted with
CHCl3/indanone and analysed by GC-MS. The kcat and KM were estimated from the non-
linear regression using Graph pad Prism 4.
3.3.2.3. Assays in D2O buffer
Assays were performed in 1 mL 50 mM phosphate buffer (made from D2O) of pD
7.4. The pH of the buffer was adjusted according to the equation: pD = pH meter reading
+ 0.4. 199. For assays with the complete P450cam system, the reaction mixture contained:
P450cam (180 nM), PdX (900 nM), PdR (180 nM), NADH (0.6 mM), camphor (1.2 mM),
and O2 was bubbled into the mixture. For assays with shunted P450cam, the reaction
mixture included camphor (1.25 mM), m-CPBA (1 mM), and P450cam (180 nM).
Reactions were incubated at 22 °C. The reaction was stopped by the addition of 1 mL
7.2 µM indanone in CHCl3 for the extraction of the product(s) and the substrate. A
second extraction of the aqueous layer was done with 0.7 mL of CHCl3/indanone. The
combined organic layers were dried over MgSO4 and analysed by GC-MS.
Table 3.3 shows the result of assays with the full system and the shunted P450.
For 2H NMR, 34 µg of 12D (2-D-borneol) were collected from pooled extracts of assays
that had been run in D2O. The sample was dissolved in CHCl3 (300 µL) and 200 µL of
the solution was transferred to a 3 mm Bruker MATCH nmr tube.
Assays with shunted P450cam were also performed at 0 °C, 5 °C, 10 °C, 15 °C in
1 mL of Ar-sparged, 50 mM phosphate buffer, in D2O or H2O, at pD or pH 7.4. Mixtures
contained 200 nM P450cam, camphor (1.25 mM), and m-CPBA (1 mM). Samples were
collected after 30, 60, 120 and 360 min and checked by GC-MS for the formation of
products. Controls contained the reaction mixtures in the absence of the substrate,
enzyme or shunt agent.

55
3.3.2.4. Assays with human P450 (CYP3A4).
To test whether a different camphor-metabolizing P450 is also able to reduce
camphor to borneol under low oxygenation, we reacted a human cytochrome P450,
(CYP3A4) containing NADPH and the cognate reductase with camphor under shunt
conditions. For shunt, the enzymatic assays were performed in 1 mL 50 mM phosphate
buffer (150 mM K+) of pH 7.4. The reaction mixture included the substrate camphor (1.25
mM), m-CPBA (1 mM), and human P450 CYP3A4 (0.5 pmol). The reaction mixture was
incubated for 20 min at 22 °C. Controls contained the reaction mixtures in the absence
of the substrate, enzyme or shunt agent. The reaction was stopped by the addition of 1
mL 7.2 µM indanone in CHCl3 for the extraction of the product(s) and the substrate. A
second extraction of the aqueous layer was done with 0.7 mL of CHCl3/indanone. The
combined organic layers were dried over MgSO4 and analysed by GC-MS.
3.3.2.5. Assays with dithionite
To test whether the reduced form of P450cam reduces camphor, P450cam (180
nM) was incubated in 1 ml phosphate buffer (50 mM, 150 mM K+) with camphor (1 mM)
and dithionite (1 mM). The reaction was stopped, extracted and analyzed as described
above in section 3.3.2.1. Reduced P450cam, alone with camphor or with its redox
partners and camphor, did not generate borneol in detectable amounts.
3.3.2.6. Alignment of cytochromes P450 and superposition of CYP101A1 (P450cam) and CYP3A4
A search, using the Basic Local Alignment Search Tool (BLAST) on the National
Center for Biotechnology (NCBI) web site
(http://www.ncbi.nlm.nih.gov/sutils/blink.cgi?mode=query) was performed, using the
P450cam protein sequence as the reference. The search was done among all non-
redundant GenBank CDS translations+PDB+SwissProt+PIR+PRF excluding
environmental samples from WGS projects, using BLASTP 2.2.26+.
The BLAST search of the P450cam protein sequence revealed related CYPs (19,
with 40% sequence identity, and 50 with 30 but < 40% sequence identity), all from
soil and marine bacteria. Protein sequences (16 in total) were then chosen, along with
P450nor, a distant fungal CYP from Fusarium oxysporum (locus1XQD_A), that was not

56
detected in the BLAST search and that catalyzes the reduction of nitric oxide. 200 These
protein sequences were then subjected to exhaustive pairwise alignment, using
Neighbor-joining phylogeny in SECentral (Align Plus 4.0, Scientific and Educational
Software, Durham, NC, USA). The result of this alignment is shown in the upper portion
of Fig 3.8.
It is important to note that the DT pair (251 and 252) and E366 in P450cam are
highly conserved among these CYPs. These are the residues known to hold the water
molecules above the porphyrin. In addition, the O2 tunnel is conserved, with hydrophobic
residues. For example, F (163 in P450cam) is highly conserved, A167 in P450cam is either
A, V, I, M or L in the others (19 related CYPs with ≥ 40% sequence identity), I220 in
P450cam is I, V, F or M in the others (19 related CYPs with ≥ 40% sequence identity),
A219 in P450cam is A, L, V, M or F in the others (19 related CYPs with ≥ 40% sequence
identity) and L245 in P450cam is L, V or I in the others (19 related CYPs with ≥ 40%
sequence identity). Hydrophobic residues from the crevasse in P450cam, that are also
hydrophobic in all the others, include the residues that align with L257, M261, P278,
I281, L371 and L375 of P450cam. Thus, it is possible that the water oxidation, coupled to
the reduction of an organic substrate, is widespread among bacteria in the environment.
A similar exhaustive pairwise alignment was done with eight vertebrate class II P450s
and P450cam as the reference and the results are in the lower portion of Fig. 3.8. To
superimpose the three dimensional structures of P450cam and CYP3A4, the structures
were visualized, superimposed and docked in Molecular Operating Environment (MOE).
Briefly, the PDB structures were opened in MOE and prepared by calculating the
protonation of each residue at pH 7.0, 300K and 0.1 M salt, and assigning charges
according to the default settings under “Compute|Protonate 3D”. For superposition, the
two proteins were first aligned, using the “Align” protocol, then they were superimposed,
with P450cam as the reference, with “all residues” and “accent secondary structure
matches” selected. The results from superposition are discussed in the section 3.4.7.
3.3.2.7. The effect of camphor, borneol and DMSO on the expression of P450cam, PdX, and PdR
To study the effect of borneol on the induction of the P450cam system, we grew P.
putida for 7 generations at 27 °C without camphor under aerated conditions, and then
divided the culture into three equal portions. Camphor (0.03g in 300 µL DMSO), borneol

57
(0.03g in 300 µL DMSO) or the control (DMSO), was added to one of the three portions,
and the cultures were incubated at 27 °C. Samples collected at regular intervals up to 4
h were harvested at 10,000 × g for 90 seconds at 4 °C. The entire experiment was
performed in 3 replicates. Cultures induced with camphor were divided into three
portions after 60 minutes and borneol (0.015g in 300 µL DMSO), DMSO, or no
compound/solvent was added to one of the three portions (Fig. 3.13a). Lysis of the
cultures was performed as described previously163. The clarified lysate samples obtained
at regular time intervals were scanned from 200-700 nm and the concentrations of
P450cam, PdR, and PdX were obtained from the characteristic absorbances. The
extinction coefficients we have determined for purified P450cam (Table 3.1) were used to
estimate the concentration of P450cam in the lysates. In order to correct for the increase
in absorbance due to bacterial growth, the enzyme concentration was divided by the
number of colony forming units obtained for that time point.
Using Graphpad prism software, the Kruskal-Wallis test was chosen to compare the
effects of 5 groups (camphor, borneol, DMSO, camphor + borneol, camphor + DMSO)
and ANOVA (Tukey-Kramer test) was performed within each time series of the three
replicates for each treatment.
3.4. Results and Discussion
3.4.1. Reaction conditions leading to formation of borneol
We have observed that borneol forms as a major product of P450cam at low O2
concentration (O2 ≤ 2 mg/L, ≤ 63 µM, as measured by O2 meter) (concentration of O2 in
water under normal ambient conditions, 1 atm is ca. 10 mg/L) 201. In vivo, this occurs
when cultures are poorly aerated 193 and, in vitro, this occurs when the buffer is sparged
with argon in an open vial. In contrast, the known oxidation products 10 and 11 (Fig. 3.1)
form at high O2 concentration (~9 mg/L = 284 µM). In vivo, this occurs when cultures are
well aerated and, in vitro, this occurs when pure O2 is bubbled into the buffer (Fig. 3.1).
To map the mechanism of the reduction, we have performed experiments with the
recombinant proteins (P450cam, PdX, and PdR), isolated from expression in E. coli
(Table 3.2). Assays were carried out in phosphate buffer (50 mM phosphate, 150 mM

58
K+, pH 7.4), with NADH and camphor. Our extinction coefficient values were used for the
calculation of the enzyme concentration (Table 3.1). Under high oxygenation (with pure
O2 bubbled into the buffer), we observed 5-exo-hydroxy camphor as a major product
(Table 3.2, entry 1). Similar experiments under mid-range oxygenated conditions (O2 ≤ 5
mg/L) yielded borneol as the only product (Table 3.2 entry 2). The formation of borneol
under these conditions was 34-fold less compared to 5-exo-hydroxy camphor that
formed under high oxygenated conditions and this could be because of the slower
formation of iron-oxo species (compound I).
Under poor buffer oxygenation, in the absence of NADH, P450cam shunted with
m-CPBA (Fig. 1.1, pathway “i”) reduced camphor to borneol (Table 3.2 entries 3 and 4).
The observation that borneol formed in the absence of NADH indicates that NADH is not
the source of electrons for the reduction reaction. Furthermore, shunted P450cam under
high buffer oxygenation gave more 5-ketocamphor than borneol (Table 3.2 entry 5),
indicating that O2 levels are important in the regulation of the reaction platform followed
by the enzyme.

59
Table 3.2. Assays with recombinant proteins. Formation of borneol, 5-exo-hydroxy camphor and 5-ketocamphor under various conditions.
Values are the average of 4 replicates ± S.E. 50 mM potassium phosphate buffer (pH 7.4) was used for all the assays. Experimental details are included in the supporting information. ND = Not Detected; N/A = Not Applicable 1 The reaction mixture contained recombinant P450cam, PdR and PdX and NADH. Oxygen (99%)
was bubbled into the buffer for 60 seconds before the assay. The 4e- uncoupling was calculated
by taking the difference between the total NADH required and observed. 2 The reaction mixture
contained recombinant P450cam, PdR, PdX, and NADH. Air (charcoal filtered) was bubbled into the buffer before the assay.
3 The assay was performed using recombinant P450cam and m-CPBA
as a shunt agent. 4 The buffer was sparged with argon (99%).
5 The buffer was treated with
oxygen (99% pure, Sigma Aldrich) and assays were performed using camphor.
3.4.2. Source of the 2-H in borneol.
The source of the hydrogen attached to C-2 of borneol was further investigated in
assays using deuterated phosphate buffer (50 mM phosphate in D2O, 150 mM K+, pD
7.4). Using recombinant proteins (P450cam, PdR, and PdX), under mid-range oxygenated
conditions (with air), we detected the enzymatic conversion of camphor to 2-D-borneol
12D (Fig. 3.2) using 2H NMR.
Enzymatic
assay
Products
(nmol min-1nmol-1 P450) NADH
consumed
(nmol min-1
nmol -1 P450)
H2O2 formed
(nmol min-1
nmol -1 P450)
4e- uncoupling
(nmol min-1
nmol-1 P450) Borneol 5-keto
camphor
5-exo-
hydroxy
camphor
O21 7.5 ± 4 20 ± 5 950 ± 465 1331 ± 270 ND 660 ± 235
air2 28 ± 9 ND ND 335 ± 13 297 ± 103 80 ± 10
rP450+
m-CPBA3 249 ± 28 ND ND N/A 291 ± 29 N/A
Ar + rP450+
m- CPBA3,4 404 ± 19 16 ± 4 ND N/A 444 ± 16 N/A
O2 + rP450+
m-CPBA3,5 173 ± 39 354 ± 12 ND N/A 204 ± 17 N/A
1
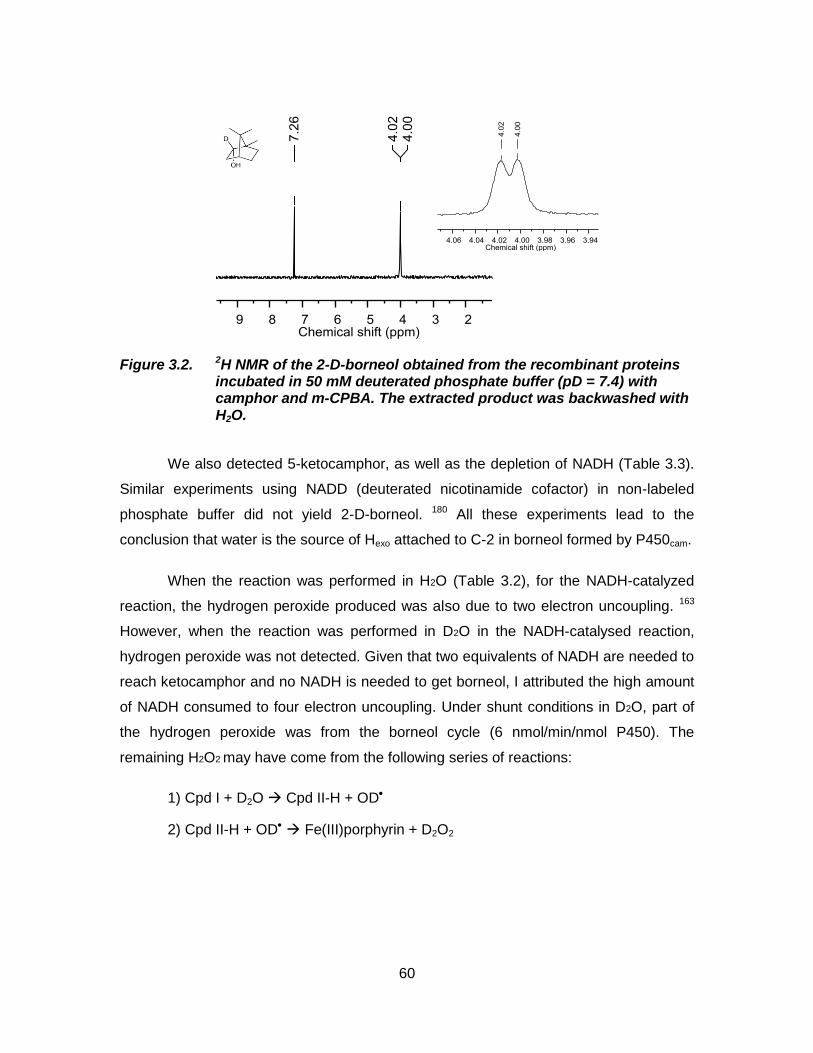
60
Figure 3.2. 2H NMR of the 2-D-borneol obtained from the recombinant proteins incubated in 50 mM deuterated phosphate buffer (pD = 7.4) with camphor and m-CPBA. The extracted product was backwashed with H2O.
We also detected 5-ketocamphor, as well as the depletion of NADH (Table 3.3).
Similar experiments using NADD (deuterated nicotinamide cofactor) in non-labeled
phosphate buffer did not yield 2-D-borneol. 180 All these experiments lead to the
conclusion that water is the source of Hexo attached to C-2 in borneol formed by P450cam.
When the reaction was performed in H2O (Table 3.2), for the NADH-catalyzed
reaction, the hydrogen peroxide produced was also due to two electron uncoupling. 163
However, when the reaction was performed in D2O in the NADH-catalysed reaction,
hydrogen peroxide was not detected. Given that two equivalents of NADH are needed to
reach ketocamphor and no NADH is needed to get borneol, I attributed the high amount
of NADH consumed to four electron uncoupling. Under shunt conditions in D2O, part of
the hydrogen peroxide was from the borneol cycle (6 nmol/min/nmol P450). The
remaining H2O2 may have come from the following series of reactions:
1) Cpd I + D2O Cpd II-H + OD
2) Cpd II-H + OD Fe(III)porphyrin + D2O2

61
Table 3.3. Formation of 2-D-borneol and 5-ketocamphor in D2O buffer, with the full P450cam system and with the shunted P450cam.
Assay condition
D-borneol
(nmol min-1
nmol-1 P450)
5-ketocamphor
(nmol min-1
nmol-1 P450)
NADH
consumed (nmol
min-1 nmol-1
P450)
H2O2 (nmol min-1
nmol-1 P450)
rP450cam + rPdX +
rPdR + NADH +
camphor (pD=7.4)1, 2
6 ± 3 53 ± 24 562 ± 230 ND
rP450cam + m-CPBA +
camphor (pD=7.4)1, 3 6 ± 3 ND N/A 57.4 ± 10.4
3.4.2.1. Assays with other shunting agents
Enzymatic assays were performed in 50 mM phosphate buffer (150 mM K+, pH
7.4), with recombinant P450cam (180 nM), substrate camphor (1.25 mM) and one of the
shunt agents (cumene hydroperoxide, sodium periodate, m-CPBA or calcium
hypochlorite (bleach)) added at a final concentration of 1 mM.
The reaction was stopped by the addition of 1 mL 7.2 µM indanone in CHCl3 for
the extraction of the product(s) and the substrate. A second extraction of the aqueous
layer was done with 0.7 mL of CHCl3/indanone. The combined organic layers were dried
over MgSO4 and analysed by GC-MS (Table 3.4).
The borneol cycle is independent of how Cpd I is generated: through the
reduction of O2 or the shunt pathway (Fig. 1.1). Borneol formation was seen with all the
shunt agents tested (m-CPBA, cumene hydroperoxide, periodate and bleach; Table 3.4).

62
Table 3.4. Formation of borneol and hydrogen peroxide from the P450 catalytic cycle using other shunt agents
Shunt agent
Borneol (nmol
min-1
nmol-1
P450)1
Hydrogen Peroxide
(nmol min-1
nmol-1
P450)1
P value2
Cumene hydroperoxide 428 ± 285 518 ± 105 0.1
Sodium periodate (NaIO4) 750 ± 183 697 ± 285 0.9
Calcium hypochlorite (bleach) 775 ± 283 988 ± 122 0.3
r-P450cam + m-CPBA (table 3.2,
entry 3) 249 ± 28 291 ± 29 0.1
Ar + rP450cam + m-CPBA (table
3.2, entry 4) 404 ± 19 444 ± 16 1.1
O2 + rP450cam + m-CPBA (table
3.2, entry 5) 173 ± 39 204 ± 17 0.87
3.4.2.2. 17O NMR of H2O2
If camphor is reduced to borneol by electrons from water, then water should be
oxidized to hydrogen peroxide. We observed H2O2 along with borneol, approximately in
a 1:1 stoichiometric ratio when P450cam was shunted with m-CPBA (Table 3.2, entries 3-
5) or with other oxidants (Table 3.4).
We prepared H217O 184 (Supplementary information) and incubated the reaction
mixture containing 1 mM camphor, 1 mM m-CPBA and recombinant P450cam (0.1 µM) in
17O phosphate buffer (50 mM, 150 mM K+, pH 7.4 made with H217O) for 12 h to detect
the formation of H217O2. To this assay mixture, P450cam (0.02 µM) and m-CPBA (0.2 mM)
were added at 2 h intervals, to form detectable amounts of H217O2. A new resonance was
observed at 178 ppm in the 17O NMR spectrum, (Fig. 3.3 (a)) which matched the
chemical shift of H217O2 reported in the literature 202 and of our prepared standard 184.
Controls (in the absence of m-CPBA, enzyme or substrate) were run simultaneously,
and this resonance was not detected (Figs. 3.3(b), 3.3(c) and 3.3(d)), which led us to
conclude that the new peak could not have come from the hydrolysis of m-CPBA.

63
~ 10 a
b
c
d
Figure 3.3. 17O NMR spectrum of the incubation mixture in 17O phosphate buffer (pH 6.3) containing: a) camphor, recombinant P450cam and m-CPBA, b) camphor and recombinant P450cam (m-CPBA absent), c) camphor and m-CPBA (enzyme absent), and d) m-CPBA and recombinant P450cam (substrate absent). The peaks at 0 ppm and 178 ppm correspond to H2
17O and H217O2, respectively.
When catalase (an enzyme that disproportionates H2O2 to water and O2) was
added to the reaction mixture, the resonance at 178 ppm disappeared (Figure 3.4),
confirming that the 178 ppm resonance is due to H217O2.

64
Figure 3.4. 17O NMR spectra of the incubation mixture under shunt conditions using 1 mM m-CPBA in 17O phosphate buffer (final pH 6.3) containing 1 mM substrate camphor and recombinant P450cam: a) before and b) after addition of catalase (1 unit). The peak at 178 ppm corresponds to H2
17O2 and that at 0 ppm is due to H217O.
3.4.3. Dependence of the H2O2 (17O) chemical shift on pH
We observed that the pH of the assay mixtures dropped from 7.4 to 6.3 after 30
minutes of incubation. The pKa of m-CPBA is 7.6 203. The drop in pH likely comes from the
meta-chlorobenzoic acid formed during the shunt reaction. Chemical shifts in 17O NMR are
reported to be dependent on pH and temperature 204. The chemical shift of the H217O2
standard prepared by the electrolysis of phosphate buffer (made from H217O) was 178 ppm
(at a final pH 3.9). The prepared standard was buffered to different pH values ranging from
3-10 and the chemical shift remained constant from pH 3-8 (Figure 3.5). At pH 10, the
chemical shift changed to 194 ppm, due to the formation of HO-O- (Figure 3.5). The
hydrogen peroxide formed during the borneol cycle had a chemical shift of 178 ppm,
matching the chemical shift of fully protonated H217O2.

65
Figure 3.5. 17O NMR spectra of H217O2 (obtained by electrolysis of H2
17O) buffered at a) pH 10, b) pH 3, and c) pH 9.
3.4.4. Kinetic Isotope Effects (KIE)
The reaction catalyzed by P450cam, shunted with m-CPBA in D2O, gave 2-D-
borneol at a much slower rate than the same reaction performed in normal water. A
large kinetic isotope effect (kH/kD) of ~50 (Table 3.5) was observed in borneol formation
and the ratio of the rates remained the same at all temperatures. The magnitude and
temperature independence of the 1H/2H kinetic isotope effect (KIE) of suggests that
hydrogen transfer through tunnelling could occur at the rate-determining step in the
reduction of camphor to borneol 205-207.

66
Table 3.5. Assays with recombinant P450cam under selected temperatures. Formation of borneol and D-borneol under shunt conditions with the addition of m-CPBA.
Temperature
(°C)
vH (nmol of borneol/min/nmol
P450)1
vD (nmol of D-
borneol/min/nmol P450)1 vH/vD2
0 148 ± 5 2.5 ± 0.5 59.2 ± 1.9
5 128 ± 18 2.2 ± 0.8 58.2 ± 20.8
10 147 ± 39 2.5 ± 0.8 58.8 ± 20.8
15 166 ± 32 2.8 ± 0.3 59.3 ± 13.6
20 244 ± 33 4.3 ± 0.5 56.7 ± 10.1
1 Data represent the average ± S.E. of 4 replicates.
2 Ratios were calculated from the averages.
The random errors were calculated by the formula ( ) wherein F denotes vH/vD, x and y denote vH and vD. ∆F, ∆x and ∆y denote their corresponding errors.
In contrast, the KIE (1H/2H) for hydrogen peroxide formation are much smaller,
suggesting that this product does not form at the rate-limiting step (Table 3.6).
Table 3.6. Assays with recombinant P450cam, shunted with m-CPBA in H2O and D2O at selected temperatures. Formation of H2O2 or D2O2.
Temperature
(°C)
vH (nmol of H2O2/min/nmol
P450)1
vD (nmol of D2O2/min/nmol
P450)1 vH/vD
0 266 ± 112 138 ± 16 1.9 ± 0.8
5 647 ± 93 106 ± 6 6.1± 0.9
10 589 ± 104 178 ± 31 3.3 ± 0.8
15 363 ± 105 178 ± 31 2 ± 0.6
20 183 ± 14 57 ± 10 3.2 ± 0.6
1 Values are average of 4 replicates ± S.E.
3.4.5. Determination of KM and kcat for borneol formation
Borneol formation under shunt conditions is saturable, with a KM = 699 ± 88 µM
and kcat = 426 ± 20 min-1 for camphor (Fig. 3.6a). Similarly, ketocamphor formation under

67
oxygenated shunt conditions is saturable with a KM = 83 ± 10 µM and kcat = 461 ± 14
min-1 for camphor (Fig. 3.6b).
In D2O buffers, the formation of D-borneol was saturable with a KM = 802 ± 107
µM and kcat = 9 ± 0.4 min-1 for camphor (Fig. 3.6a). Ketocamphor formation under
oxygenated shunt conditions is saturable with KM = 118 ± 6 µM and a similar kcat = 465 ±
6 min-1 for camphor. Therefore, borneol formation requires oxidation of P450cam, either
through shunting or through intermediates 2 to 7 of the catalytic cycle (Fig. 1.1).
Therefore, compound I (Cpd I) must be involved in both borneol and ketocamphor
formation (Fig. 3.1). It is interesting to note that the KM for ketocamphor formation under
high O2 concentration is 9-fold lower (see above) than that for borneol formation under
low O2 concentration. This suggests that camphor binding and possibly positioning might
be affected by O2 concentrations. Surprisingly, the kcat is the same for both reactions,
even though there appears to be a larger barrier in the borneol cycle than in the normal
oxidation reaction. This larger-than-expected kcat suggests that, consistent with the
observed KIE, H-atom tunneling is occurring in the borneol cycle. Under high O2
concentrations using D2O as the solvent, 5-ketocamphor (table 3.3) was detected as the
only product suggesting that deuterium atoms from the solvent do not participate in the
reaction. Steady-state kinetic assays for ketocamphor formation in D2O buffers resulted
in similar kcat as in H2O buffers. In contrast, a 60-fold decrease in kcat (with a similar KM)
was detected for borneol formation (Fig. 3.6). This illustrates that the solvent molecules
participate only in the borneol formation, but not in ketocamphor formation.

68
Figure 3.6 a) Michaelis-Menten kinetics for borneol and b) 5-ketocamphor formation, under shunt conditions (with m-CPBA). To ensure a constant high O2 concentration for the 5-ketocamphor formation kinetics, reactions were run in vials fitted with septa and pressurized with pure O2.

69
3.4.6. Reduction Mechanism
We propose that water reduces and protonates Cpd I as a first step in the
borneol cycle, giving protonated Cpd II 13 and a hydroxyl radical (OH) (Fig. 3.7). The
formation of OH in water has been estimated from electrochemical data 208, and the
formation of species 13 from Cpd I has been estimated at ∆G° = -410 kJ/mol 209.
Therefore, the first step of the proposed reduction mechanism (Steps I and II, Fig. 3.7)
involves the abstraction of a hydrogen atom from water by Cpd I to form the Fe(IV)-OH
complex 13 (Fig. 3.7), which is favourable (∆H ~ -160 kJ/mol) (Fig. 3.7). Three water
molecules are known to be poised above the Fe-porphyrin and are held in place by
hydrogen bonds to Thr 252, Asp 251 and Glu 366 210, so it is plausible that Cpd I could
attack water instead of camphor. Next, we propose that the hydroxyl radical combines
with the water molecule to yield hydrogen peroxide and a hydrogen atom (Step III, Fig.
3.7). By our estimate, this step is highly unfavourable (∆H° 570 kJ/mol, section 3.4.7).
Simultaneous transfer of the hydrogen atom from step III to the carbonyl group of
camphor forms a borneol radical (Step IV, Fig. 3.7). A non-strained ketone such as
acetone reacting with a hydrogen atom has a potential of approximately -2 V (∆G° is
+173 kJ/mol) 211. However, because camphor is quite a strained ketone, and that strain
is relieved by the reduction, we have estimated this reaction to be slightly favourable
(∆H° ~ -79 8 kJ/mol, section 3.4.7). Finally, the transfer of a hydrogen atom from
protonated Cpd II to the borneol radical forms borneol and Cpd I (Steps V and VI, Fig.
3.7) (∆H° 13 kJ/mol), completing the “borneol cycle”. The net reaction is endothermic,
with ∆H° 305 8 kJ/mol (section 3.4.7, Fig. 3.7).

70
Figure 3.7 The proposed reduction mechanism and the Born-Haber estimates. a) Proposed reduction mechanism of P450cam that accounts for the simultaneous formation of borneol (12) and H2O2 in a 1:1 stoichiometry. b) Born-Haber estimates of the reduction mechanism.

71
3.4.7. Thermodynamic calculations in hydroxylation and the borneol cycle
The mechanism presented in Fig. 3.7 was divided into six steps, and the
contribution from each step was calculated using literature data, if available (Fig. 3.8).
For the estimation of the heat of formation of borneol (see step IV below), calculations
were done on the MOPAC interface of Chem 3D (v. 11), using the AM-1 method, the
closed shell (restricted) wave function, the optimizer EF and water as solvent. All atoms
were allowed to move freely, to a minimum RMS of 0.1. Heats of formation were
estimated, using that program, for both camphor in water and borneol in water.
Step I: H2O(l) H(aq) + OH
(aq)
The reduction potential of OH + H+ + e- H2O(l) has been estimated by
Koppenol and Liebman as o = 2.59 0.04 V. This yields a ∆Go value of -250 4 kJ/mol.
Step I is the reverse, or 250 4 kJ/mol 208.
Step II: Cpd I + H Cpd II-H (= protonated Cpd II, 13, Fig. 3.7)
The properties of Cpd II-H have been estimated by Green, Dawson and Gray.
Based on the one-electron reduction potential of Cpd I (oI = 1.3 0.1) and the pKa of
Cpd II-H, they estimated the ∆Go dissociation of Cpd II Cpd I + H to be 98 4
kcal/mol (= 410 17 kJ/mol). Step II is the reverse, or -410 17 kJ/mol 209
Step III: OH + H2O H2O2 + H
We have estimated this as follows: From Koppenol and Liebman we know that
Step I is 250 kJ/mol. The heat of formation of H2O(l) is -285.8 kJ/mole. 212 The heat of
formation of H is listed as +218 kJ/mol. 212 Therefore, based on the energy of Step I,
and assuming that most of this energy comes from enthalpy contributions, 5 we estimate
the heat of formation of OH(aq) as -253.8 kJ/mol.
This value now enables us to estimate the ∆Ho for Step III, using the listed heat
of formation for H2O2 of -187.8 kJ/mol 212 and this works out to be +569.8 kJ/mol.
Step IV: Camphor + H borneol radical

72
For this step, we first had to estimate the heat of formation of the borneol radical.
The heat of formation of camphor has been measured as -76.3 0.6 kcal/mol = -319 2
kJ/mol. 213 The heat of formation of borneol has not been measured, to our knowledge
and, therefore, we estimated it from the heat of formation of camphor combined with
semi-empirical calculations. Both, camphor and borneol were energy minimized, and
their heats of formation were estimated, as described in the general section above. For
camphor, we obtained “Hf” = -47.89 kcal/mol (-200.3 kJ/mol) and for borneol we obtained
“Hf” = -66.68 kcal/mol (-278.9 kJ/mol). These results make sense, since camphor is a
strained ketone, and this strain is somewhat relieved in borneol. Also, both compounds
were energy-minimized in water, and borneol should be better solvated than camphor.
The difference between these two calculated values is: “∆Hf” = -78.6 kJ/mol. In our
experience with that software, these estimates have errors of approximately 4 kJ/mol.
Therefore, borneol should be 78.6 kJ/mol more stable than camphor, which gives us a
∆Ho(borneol) = ∆Ho(camphor) – 78.6 kJ/mol -398 6 kJ/mol.
Now the ∆Hf of the borneol radical can be estimated from the following equation:
Borneol borneol radical + H
which is a C-H bond dissociation reaction. Detailed listings of C-H bond
dissociation energies have been compiled by Blanksby and Ellison. 5 They list primary C-
H bond dissociation energies as 423 2 kJ/mol and secondary C-H bond dissociation as
392 kJ/mol. We have chosen the higher value to get an upper estimate because the C-H
that is to the OH group in borneol should be more polarized than a hydrocarbon C-H
and, therefore, slightly more difficult to break homolytically.
From the values for borneol (-398 6 kJ/mol) and H (218 kJ/mol) we estimate
that the borneol radical has ∆Ho -180 8 kJ/mol.
Now the ∆Ho of Step IV can be estimated from camphor (-319 2 kJ/mol), H
(218 kJ/mol) and borneol radical (-180 8 kJ/mol), and this gives ∆Ho = -79 10 kJ/mol.
Step V: is the reverse of Step II and, therefore has a ∆Ho 410 17 kJ/mol,
provided entropy contributions are negligible.
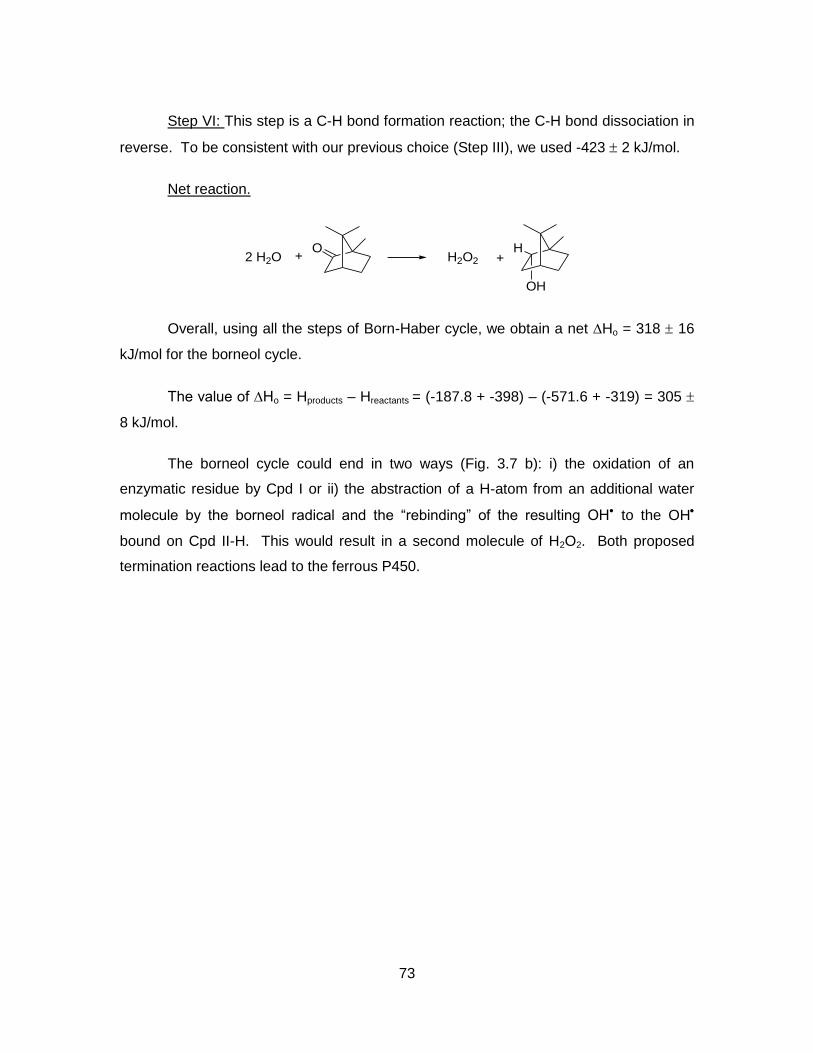
73
Step VI: This step is a C-H bond formation reaction; the C-H bond dissociation in
reverse. To be consistent with our previous choice (Step III), we used -423 2 kJ/mol.
Net reaction.
O+ H2O2 +
OH
H2 H2O
Overall, using all the steps of Born-Haber cycle, we obtain a net ∆Ho = 318 16
kJ/mol for the borneol cycle.
The value of ∆Ho = Hproducts – Hreactants = (-187.8 + -398) – (-571.6 + -319) = 305
8 kJ/mol.
The borneol cycle could end in two ways (Fig. 3.7 b): i) the oxidation of an
enzymatic residue by Cpd I or ii) the abstraction of a H-atom from an additional water
molecule by the borneol radical and the “rebinding” of the resulting OH to the OH
bound on Cpd II-H. This would result in a second molecule of H2O2. Both proposed
termination reactions lead to the ferrous P450.

74
H2O H OH + 250 kJ/mol
CpdI H+
+
CpdII-H - 410 kJ/mol
OH + H2O H2O2 + H + 570 kJ/mol
OH+
OH
- 79 +/- 8 kJ/mol
CpdII-H CpdI H+ + 410 kJ/mol
OH
H+
OH
H- 423 kJ/mol
Net reaction:
O+ H2O2 +
OH
H+ 305 +/- 8 kJ/mol (direct)+ 318 +/- 16 kJ/mol (B-H cycle)
(I)
(II)
(III)
(IV)
(V)
(VI)
a.
b.O
Fe (IV)
Scys
O.+
O H
Thr252
H
HHO
OH
7
12
P450 residue
Fe (III)
Scys
P450 residue-OHborneolH2O2
Fe (IV)
S
O
cys14
O HO H
Thr252
O
H
O
H
H
.
H
OH
Fe (III)
Scys
O H
H
12
2 H2O
2 H2O2
Figure 3.8 a) Summary of the borneol cycle steps and of the net reaction b) Possible routes by which the borneol cycle could end.

75
The involvement of OH-radicals in H2O2 formation has been proposed previously
for electrolytic catalysts that oxidize water to O2 (via an intermediate peroxide) 190 and
also for a recently discovered water oxidation catalyst that produces H2O2 during
electrolysis. 191,192 Interestingly, the latter MnOx catalyst stops the water oxidation
process at H2O2, because the peroxide is solvated and stabilized by hydrogen bonding
to ethylamine and/or water in the electrolyte. 191,192 Analogously, here we propose that
hydrogen bonding within the water cluster in the hydrophobic P450cam active site is
essential for stabilization of the various reactive intermediates and of the H2O2 formed.
The turnover numbers with regard to H2O2 formation we have observed are ~ 7, whereas
the electrocatalytic systems give turnover numbers of 20-1500 for complete water
oxidation to O2. 190 This difference arises because P450cam only has access to thermal
energy to perform this “uphill” reaction, whereas the electrocatalytic systems are run at
overpotentials. 190-192
The proposed mechanism accounts for our observation that borneol and
hydrogen peroxide form in a 1:1 stoichiometric ratio, provided 2-electron uncoupling is
negligible (Tables 3.2 and 3.4). Given that Cpd I appears to be involved in the borneol
cycle, our previous 193 and current data also suggest that Cpd I might be regulated by O2
levels: under high oxygenation, Cpd I sequentially hydroxylates camphor to 10, or 10 to
11 (Fig. 3.1). Under poor oxygenation, Cpd I enters the borneol cycle that couples the
oxidation of water to H2O2 to the simultaneous reduction of camphor to borneol (Fig.
3.1).
In assays with CYP3A4 (a human cytochrome P450) (section 3.3.2.4) under
shunt conditions, 5-exo-hydroxy camphor formed as a major product. There were no
detectable amounts of borneol, suggesting that the reduction cycle is specific to bacterial
enzymes such as P450cam (section 3.3.2.6). One possible explanation is that CYP3A4
exhibits cooperativity with certain substrates 214 and is allosterically activated with others
215. Shunting with m-CPBA, the enzyme produced 18.6 ± 0.6 µmol/min/µmol P450 of 5-
exo-hydroxy camphor, but no detectable borneol. Therefore, the borneol formation
reaction is not general to camphor-metabolizing cytochromes P450.
A BLAST search against the P450cam sequence revealed many other bacterial
cytochromes P450 that show sequence identities for the three residues that hold a set of

76
water molecules above the porphyrin (Asp 251, Thr 252 and Glu 366 in P450cam, Fig.
3.9), as well as for the hydrophobic residues that are involved in O2 binding (see below
and section 3.3.2.6).

77
Figure 3.9. Alignment of microbial cytochromes P450 against P450cam (upper portion) and of vertebrate class II P450s, also against P450cam (lower portion). Microbial sequences used: gamma prot 1 = marine gamma proteobacterium HTCC2207 (ZP_01225512), Novo ar CYP = Novosphingbium aromaticivorans CYP 101D2 (PDB 3NV6), Sphingo echi = Sphingomonas echinoides ATCC14820 (ZP_10341012), Novo CYP 101D1 = a camphor hydroxylase from Novosphingobium aromaticivorans DSM 12444 (PDB 3LXI), Sphing chlor = Sphingomonas chlorophenolicum camphor hydroxylase (ZP_10341012), Azospir B510 = Azospirillium sp. B510 (YP_003451823), Azospir = (BAI74843), P450 Burk H160 = Burkholderia sp. H160 (ZP_03264429), P450 Burk MCO-3 Burkholderia cenocepacia MC0-3= (YP_001774494), Sping Witt R = Sphingomonas wittichii RW1 (YP_001262244), Citromicrobi = Citromicrobium bathyomarinum JL354 (ZP_06860768), Novo CYP 101 = Novosphingobium aromaticivorans DSM12444 CYP 101C1 (PDB 3OFT_C), Sping E 14820 = Sphingomonas echinoides ATCC 14820 (ZP_10339023), gamma prot 2 = marine gamma proteobacterium NOR51-B (ZP_04956740), Sphingomonas = Sphingomonas sp. KC8 (ZP_09138048), Sphing chl L = Sphingobium chlorophenolicum L-1 (YP_004553185), P450 nor = Cytochrome P450nor from Fusarium oxysporum (BAA03390).
Vertebrate P450s: Cyp lan deme = lanosterol 14- demethylase isoform 1 precursor Homo sapiens (NP_000777), CYP 2C9 = human liver limonene hydroxylase (P11712), CYP 4A11 Homo sapiens
(NP_000769), CYP 4F12 = fatty acyl -hydroxylase Homo sapiens (NP_076433), CYP 4F2 = leukotriene-B(4) omega-hydroxylase 1 precursor Homo sapiens (NP_001073), CYP 3A5 form 1 = CYP 3A5 isoform 1 Homo sapiens (NP_000768), CYP 3A4 = CYP 3A4 isoform 1 Homo sapiens (NP_059488), CYP26B1 = retinoic acid hydroxylase Homo sapiens (NP_063938).
Superposition of P450cam (1DZ4, 38 on CYP3A4 (1TZN, 216 reveals that the active
site of CYP3A4 is much larger and more polar than that of P450cam. In P450cam, camphor
is surrounded by closely packed hydrophobic residues, which could form a cage around
the reactive intermediates. (Fig. 3.10) The only water in the active site of the camphor-
bound structure is in the water channel between Glu 366 and Thr 252, whereas the
CYP3A4 active site can hold numerous water molecules in the absence of a ligand (Fig.
3.10). Docking of camphor into the active site of CYP 3A4 reveals the camphor bound
near the porphyrin, capped by five phenylalanine residues and surrounded by Arg 212,

78
Ser 119, Ile 120, Ile 301 and H-bonded to Arg 105 (Fig. 3.10). This more open
arrangement may not provide the necessary stabilization for water oxidation to occur.
Furthermore, the different positioning of the camphor within the active site may also
preclude its utilization as an electron acceptor during the water oxidation and, therefore,
the reaction was not observed in CYP3A4.
Figure 3.10 Superposition of P450cam and P450 3A4. a) Top row: superimposed ribbon diagrams of P450cam (1DZ4) and CYP3A4 (1TQN). P450cam is shown with red helices and yellow sheets, whereas CYP3A4 is shown all in pink. The porphyrin for P450cam is shown in gray and the one for CYP3A4, in brown. The two views are orthogonal to each other. The substrate access channel (SAC) is marked, as is Helix I, the central pillar of the fold. b) Lower row: superimposed active sites of P450cam and CYP3A4. The porphyrin of P450cam is shown in gray, the one for CYP3A4 in brown. The camphor ligand of P450cam is shown in green. Residues from the two proteins are red (P450cam) and pink (CYP3A4). The two views are orthogonal to each other.
Amunom et.al. have stated that mammalian P450s can reduce 4-hydroxynonenal
to 1,4-dihydroxynonenal under low oxygen conditions, 217 similar to our results presented
in this paper. However, differences in the reacting mechanisms can be associated to the
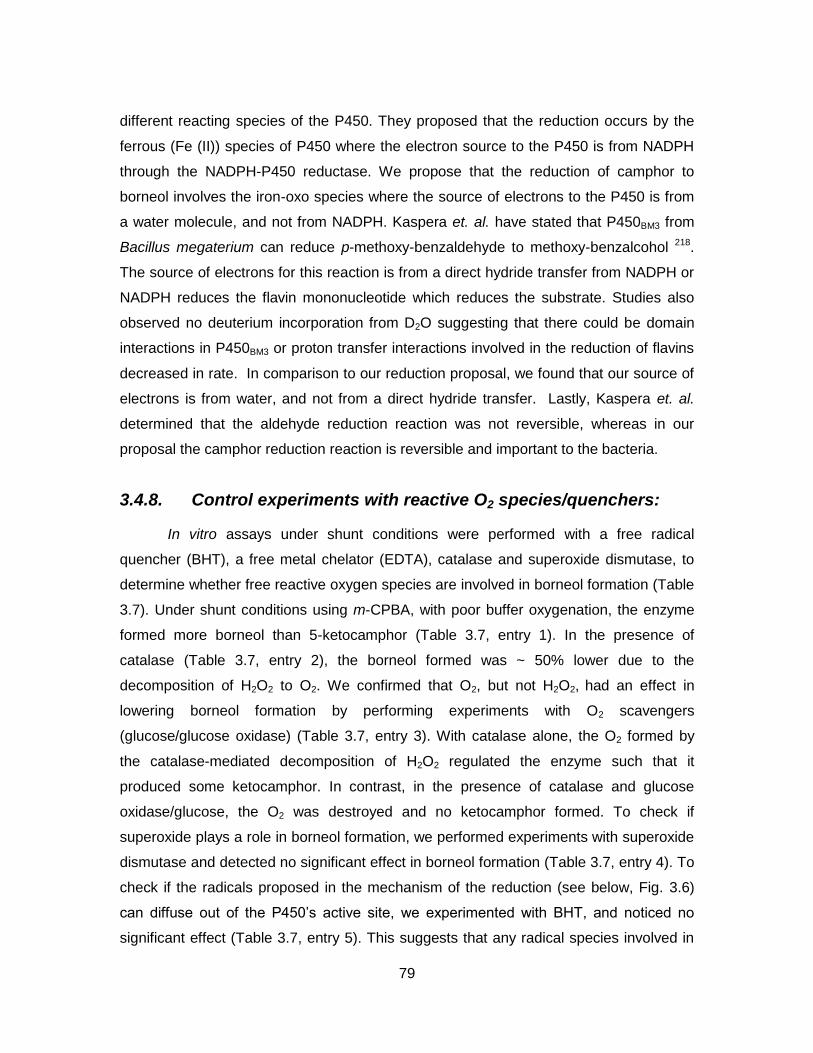
79
different reacting species of the P450. They proposed that the reduction occurs by the
ferrous (Fe (II)) species of P450 where the electron source to the P450 is from NADPH
through the NADPH-P450 reductase. We propose that the reduction of camphor to
borneol involves the iron-oxo species where the source of electrons to the P450 is from
a water molecule, and not from NADPH. Kaspera et. al. have stated that P450BM3 from
Bacillus megaterium can reduce p-methoxy-benzaldehyde to methoxy-benzalcohol 218.
The source of electrons for this reaction is from a direct hydride transfer from NADPH or
NADPH reduces the flavin mononucleotide which reduces the substrate. Studies also
observed no deuterium incorporation from D2O suggesting that there could be domain
interactions in P450BM3 or proton transfer interactions involved in the reduction of flavins
decreased in rate. In comparison to our reduction proposal, we found that our source of
electrons is from water, and not from a direct hydride transfer. Lastly, Kaspera et. al.
determined that the aldehyde reduction reaction was not reversible, whereas in our
proposal the camphor reduction reaction is reversible and important to the bacteria.
3.4.8. Control experiments with reactive O2 species/quenchers:
In vitro assays under shunt conditions were performed with a free radical
quencher (BHT), a free metal chelator (EDTA), catalase and superoxide dismutase, to
determine whether free reactive oxygen species are involved in borneol formation (Table
3.7). Under shunt conditions using m-CPBA, with poor buffer oxygenation, the enzyme
formed more borneol than 5-ketocamphor (Table 3.7, entry 1). In the presence of
catalase (Table 3.7, entry 2), the borneol formed was ~ 50% lower due to the
decomposition of H2O2 to O2. We confirmed that O2, but not H2O2, had an effect in
lowering borneol formation by performing experiments with O2 scavengers
(glucose/glucose oxidase) (Table 3.7, entry 3). With catalase alone, the O2 formed by
the catalase-mediated decomposition of H2O2 regulated the enzyme such that it
produced some ketocamphor. In contrast, in the presence of catalase and glucose
oxidase/glucose, the O2 was destroyed and no ketocamphor formed. To check if
superoxide plays a role in borneol formation, we performed experiments with superoxide
dismutase and detected no significant effect in borneol formation (Table 3.7, entry 4). To
check if the radicals proposed in the mechanism of the reduction (see below, Fig. 3.6)
can diffuse out of the P450’s active site, we experimented with BHT, and noticed no
significant effect (Table 3.7, entry 5). This suggests that any radical species involved in

80
the borneol cycle do not exist long enough to diffuse out of the active site of P450cam. To
test if a metal impurity plays a role in our assays under shunt conditions, experiments
were performed with EDTA, and we detected no effect on borneol formation (Table 3.7,
entry 6). To check if free iron (outside of active site) plays a role in reduction reaction,
experiments were performed with ferrous sulphate and m-CPBA, in the absence of
P450cam and we did not detect borneol or 5-ketocamphor formation (Table 3.7, entry 7).
These experiments suggest that the reduction of camphor to borneol is catalysed by
P450cam alone, does not involve any adventitious metal species outside of the P450
active site and does not involve the diffusion of reactive oxygen species, other than the
product H2O2, out of the active site.

81
Table 3.7. Tests for involvement of free reactive oxygen species: formation of borneol, 5-ketocamphor and H2O2.
Enzymatic assay
Products
(nmol min-1nmol-1 P450) Borneol: 5-
ketocamphor
H2O2 formed
(nmol min-1 nmol -
1 P450) Borneol 5-keto camphor
Ar + rP450+ m-
CPBA1 443 ± 41 21 ± 2 23 ± 3 494 ± 16
Ar + rP450+ m-
CPBA + catalase2 246 ± 20 18 ± 1 13 ± 0.6 ND
Ar + rP450+ m-
CPBA +
glucose/glucose
oxidase3
469 ± 16 ND N/A ND
Ar + rP450+ m-
CPBA + superoxide
dismutase4
398 ± 10 ND N/A 428 ± 34
Ar + rP450+ m-
CPBA + BHT5 454 ± 28 25 ± 6 20 ± 4 478 ± 22
Ar + rP450+ m-
CPBA + EDTA6 438 ± 34 19 ± 6 29 ± 8 412 ± 33
Ar + FeSO4 + m-
CPBA7 ND ND N/A ND
1
Values are the average of 4 replicates ± S.E. 50 mM potassium phosphate buffer (pH 7.4) was used for all the assays and was sparged with argon (99%). Camphor was the substrate in all assays. Experimental details are included in the supporting information. ND = Not Detected; N/A = Not Applicable 1 The assay was performed using recombinant P450cam and m-CPBA as a shunt agent.
2 The
assay was performed using recombinant P450cam, m-CPBA and catalase. 3 The assay was
performed using recombinant P450cam, m-CPBA and glucose/glucose oxidase. 4 The assay was
performed using recombinant P450cam, m-CPBA and superoxide dismutase. 5 The assay was
performed using recombinant P450cam, m-CPBA and butylated hydroxytoluene. 6 The assay was
performed using recombinant P450cam, m-CPBA and EDTA. 5 The assay was performed using
recombinant P450cam, m-CPBA and butylated hydroxytoluene. 6 The assay was performed using
recombinant P450cam, m-CPBA and EDTA. 7 The assay was performed using m-CPBA and
ferrous sulphate.

82
3.4.9. Role of oxygen in the borneol cycle
The reaction path taken by P450cam (camphor oxidation vs. borneol cycle, Fig.
1b) is controlled by oxygen concentration. Oxygen could exert its effect in two ways: 1)
by affecting the interaction of P450 with its redox partners, or 2) by directly interacting
with P450. Our results demonstrate that the former cannot be the case, because the
effect was seen in the absence of PdX and PdR (Table 3.2). Therefore, P450cam must
bind O2 not only for catalysis, but also for allosteric regulation.
Recently, cytochrome P450 2E1 has been shown to form endoperoxide
rearrangement products when reacted with 1,1,2,2-tetramethylcyclopropane 219. This
suggests that there must be O2 bound in that enzyme near the active site, which reacts
with the rearranged radical formed by H-atom abstraction from 1,1,2,2-
tetramethylcyclopropane. Cytochromes P450 are known to be allosterically regulated by
their substrates or co-substrates 220. Studies with other O2-utilizing enzymes, such as
diiron monooxygenases 221, laccase 222 and amine oxidase 223 have revealed that O2 can
be bound in hydrophobic tunnels that are separated from the access channel for the
other substrates of these enzymes. In P450cam, a hydrophobic O2 entry channel and two
O2 binding cavities have been identified in Xe-treated crystals 88. Two Xe atoms are
bound near the porphyrin edge in a hydrophobic pocket lined by F163, A167, heme allyl,
I220, A219, C242 and L245. The other two Xe atoms appear bound in a crevasse lined
by L371, T370, L257, M261, water and S260 (first Xe) and I275, K372, T376, L375,
L371, P278 and I281 (second Xe). The putative O2 binding site in P450cam is located
near the edge of the porphyrin, near the water channel (Fig. 3.11).
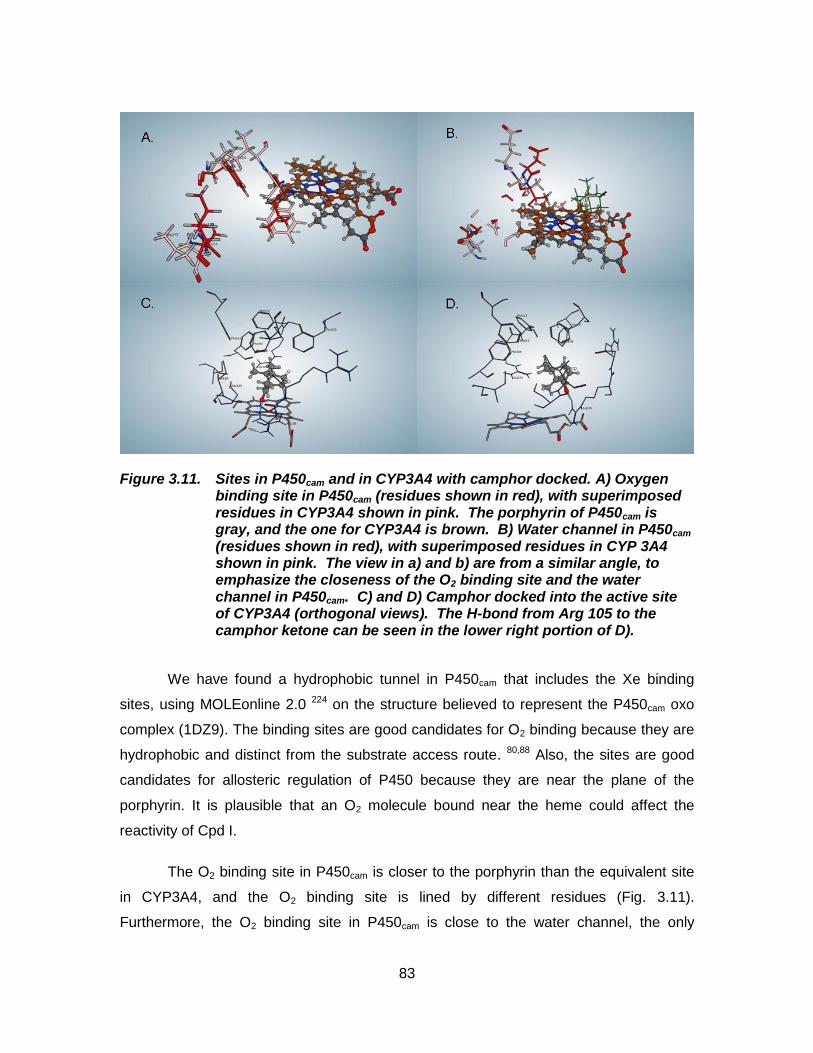
83
Figure 3.11. Sites in P450cam and in CYP3A4 with camphor docked. A) Oxygen binding site in P450cam (residues shown in red), with superimposed residues in CYP3A4 shown in pink. The porphyrin of P450cam is gray, and the one for CYP3A4 is brown. B) Water channel in P450cam (residues shown in red), with superimposed residues in CYP 3A4 shown in pink. The view in a) and b) are from a similar angle, to emphasize the closeness of the O2 binding site and the water channel in P450cam. C) and D) Camphor docked into the active site of CYP3A4 (orthogonal views). The H-bond from Arg 105 to the camphor ketone can be seen in the lower right portion of D).
We have found a hydrophobic tunnel in P450cam that includes the Xe binding
sites, using MOLEonline 2.0 224 on the structure believed to represent the P450cam oxo
complex (1DZ9). The binding sites are good candidates for O2 binding because they are
hydrophobic and distinct from the substrate access route. 80,88 Also, the sites are good
candidates for allosteric regulation of P450 because they are near the plane of the
porphyrin. It is plausible that an O2 molecule bound near the heme could affect the
reactivity of Cpd I.
The O2 binding site in P450cam is closer to the porphyrin than the equivalent site
in CYP3A4, and the O2 binding site is lined by different residues (Fig. 3.11).
Furthermore, the O2 binding site in P450cam is close to the water channel, the only

84
source of water in the camphor-filled active site of P450cam. It is reasonable to
hypothesize that the O2 site, the porphyrin, the water channel and the tightly held
camphor, all of which are near each other, could affect each other by allosteric effects in
P450cam.
There are two ways the cycle could end. Cpd I might oxidize a nearby enzymatic
residue or, alternatively, the borneol radical might abstract a H-atom from water, giving
borneol and OH, and the hydroxyl radical could rebind with the OH bound in Cpd II-H,
to give a second H2O2 and the ferric enzyme (Fig. 3.8b).
3.4.10. Toxicity assays of borneol, hydrogen peroxide with E. coli and P. putida
Previously we have determined the effect of borneol and camphor on the growth
of P. putida and E. coli. 193 To determine the effects of hydrogen peroxide, we have
tested the toxicity of H2O2 and a 1:1 stoichiometric mixture of borneol and H2O2 on both
P. putida and E. coli, a bacterium that lacks cytochrome P450 178 (Figs. 3.12 and 3.13).
The borneol/H2O2 mixture was lethal to E. coli and slightly toxic to P. putida (Figs. 3.12
and 3.13). The latter observation prompted us to explore whether borneol affects the
expression of the P450cam system. The IC50 of hydrogen peroxide and of a 1:1 mixture of
borneol and hydrogen peroxide were determined for E. coli as described in chapter 2 by
graphing CFU/ml vs. the logarithm of concentration of compounds (section 2.3.8) and
found to be 7 nM and 17 nM, respectively whereas H2O2 was found to be less toxic to P.
putida (IC50 was found to be 48 nM (Fig. 3.12)). In comparison, the IC50 of borneol alone
was 19.3 nM for E. coli. 193

85
Figure 3.12. IC50 determination of a) H2O2 and b) of a 1:1 (molar) mixture of borneol and H2O2 against E. coli, a species of bacterium that lacks cytochrome P450.
The effect of borneol:H2O2 (1:1 molar ratio), borneol, or H2O2 on the survival of P.
putida (strain ATCC 17453) and E. coli (strain XL-1 BL) with the stationary cultures of
these two strains was performed in the same way as described previously 193.
The mean cell densities of E. coli and P. putida stationary cultures that had been
incubated with borneol, H2O2 or a 1:1 mixture of borneol and H2O2 for 16 h, revealed a
significant effect of treatment (ANOVA for P. putida, P < 0.0001; F = 8.93 and for E. coli,
P < 0.0001; F = 12.07). Turkey-Kramer pairwise comparisons of borneol, hydrogen
peroxide, 1:1 mixture of borneol + hydrogen peroxide, and the control (dimethyl
sulphoxide, DMSO) for each bacterial species revealed that hydrogen peroxide or the
1:1 mixture of borneol + hydrogen peroxide are bacteriostatic to P. putida
(DMSO/hydrogen peroxide: P < 0.01; DMSO/borneol: P < 0.01; DMSO/borneol +
hydrogen peroxide: P < 0.01). In contrast, borneol, hydrogen peroxide and the 1:1
mixture were highly toxic (DMSO/hydrogen peroxide: P < 0.01; DMSO/borneol: P < 0.01;
DMSO/borneol + hydrogen peroxide: P < 0.01) to E. coli (no colonies were observed,
Fig. 3.13). This difference in the toxicity of the borneol cycle products on the producer,
compared to a bacterial species that lacks P450, may be an adaptive advantage for P.
putida during times of low aeration, when camphor resources cannot be metabolized but
borneol has been produced.

86
Figure 3.13. Effect of 16 h incubation of stationary E. coli (a) and P. putida (b) cultures with borneol: H2O2 (1:1), borneol, or H2O2 (1 mM).
3.4.11. Adaptive advantage of the borneol cycle to P. putida
The camphor metabolism pathway, of which P450cam catalyzes the first step, is
encoded on the CAM plasmid under the control of the Cam repressor. This repressor
dissociates from the upstream control region of the Cam operon upon binding of
camphor, ensuring that the entire operon is expressed when camphor is present. 182
We detected a steep increase in the characteristic absorption bands of P450cam,
PdR, and PdX only in the culture induced with camphor, about 80 min after initial
induction with camphor. Absorptions plummeted approximately 60 min after the addition
of borneol to camphor-induced culture(s) (Fig. 3.14). This decrease in P450, PdR, and
PdX expression must be due to the borneol addition, because the camphor-induced
cultures that did not receive borneol expressed significantly higher levels of P450, PdR
and PdX/CFU/mL than the borneol-treated cultures (Figs. 3.14, 3.15 and 3.16)

87
Figure 3.14. a) Outline of the experiment used to determine the effect of camphor and borneol on P450cam, PdX and PdR expression. b) The effect of camphor, borneol and DMSO on the P450 expression by P. putida (ATCC 17453). The concentration of P450cam was obtained from the Soret peak absorbances and was normalized against the number of colony forming units/mL. The absorbances at 392 nm and 410 nm correspond to the substrate containing and free P450cam Soret band.
Points represent the average S. E. of three replicates.
88
Figure 3.15. The effect of camphor, borneol and DMSO on the PdX expression by Pseudomonas putida (ATCC 17453). The concentration of PdX was obtained from the absorbance at 325 nm that corresponds to the Fe2S2 cluster of PdX and was normalized against the number of
colony forming units/mL. Points represent the average S. E. of three replicates.

89
Figure 3.16. The effect of camphor, borneol and DMSO on the PdR expression by Pseudomonas putida (ATCC 17453). The concentration of PdR was obtained from the absorbance at 454 nm that corresponds to the flavin moiety of PdR and was normalized against the number of
colony forming units/mL. Points represent the average S. E. of three replicates.
Using Graphpad prism software, the Kruskal-Wallis test was chosen to compare
the effects of 5 groups (camphor, borneol, DMSO, camphor + borneol, camphor +
DMSO). The effect of camphor was significant on the expression of P450cam after 80
minutes (P < 0.01). The DMSO treatments differed significantly at each time point after
induction from the camphor-induced treatments (P < 0.01).
ANOVA (Tukey-Kramer test) was performed within each time series of the three
replicates for each treatment. Camphor showed a significant effect of increasing the
P450 expression (P < 0.01), 80 min after its addition to the culture (marked * in Fig.
3.14). The addition of DMSO to the camphor-induced cultures did not have any effect (P
> 0.01 within the DMSO series). The addition of borneol to the camphor-induced culture
showed a significant decrease in expression 80 minutes after its addition to the
camphor-induced culture (marked # in Fig. 3.13) (P < 0.01). In the borneol and camphor-
treated cultures, the normalized P450cam levels 120 min. after borneol addition were

90
close to the background expression at 0 minutes (Fig. 3.14). The results for PdX and
PdR are shown below in Figures 3.15 and 3.16.
The borneol down-regulation of P450cam, PdX, and PdR might be advantageous
to P. putida during periods of low soil aeration. Because the camphor degradation
pathway requires four O2/camphor (to reach 5-hydroxy-3,4,4-trimethyl-2-heptenedioic
acid--lactone), and the P450cam-catalyzed oxidation is the first committed step 225, it is
advantageous to regulate camphor metabolism at the first step. When aeration
increases, low levels of P450cam convert borneol back to camphor 193, and this frees the
Cam operon from borneol down-regulation.
3.5. Conclusions of this chapter
We describe the borneol cycle of P450cam, a cycle that occurs at low O2
concentration. The cycle connects to the known catalytic cycle via Cpd I which is
regulated by O2 levels: at low O2 concentration, Cpd I oxidises water, whereas at high O2
concentration, Cpd I oxidises camphor.
The Cpd I-catalyzed reaction of P450cam proposed here (Fig. 3.6) is independent
of the redox partner proteins (PdX and PdR) and of how Cpd I forms (O2 reduction or
shunt). The reaction occurs both in vitro (this paper) and in vivo 193. We show here that
P450cam couples the oxidation of water to H2O2 and the reduction of camphor to borneol.
We have presented evidence that: i) water is the source of the 2-H in the borneol; ii)
water is oxidized to form H2O2 when camphor is reduced; and iii) the transfer of an H
atom from water to C-2 of camphor occurs at a rate-limiting step in the borneol cycle and
involves tunneling. We propose that the reactivity of Cpd I is regulated by O2
concentration, and we have located a potential access channel where O2 might bind to
P450cam to exert its allosteric control.
The borneol and H2O2 formed serve several ecological functions. First, borneol
and H2O2 are not very toxic to P. putida, whereas the combination is lethal to bacteria
such as E. coli which do not contain any P450 193, and this may give P. putida an
advantage in bacterial communities. Secondly camphor induces the expression of P450,
PdX, and PdR, whereas borneol decreases the expression of these gene products in P.

91
putida. These features of the P450cam may protect the bacteria from excessive exposure
to borneol and reactive oxygen species during prolonged periods of low oxygen
concentration.

92
4. Screening of Cytochrome P450cam SeSaM library with 3-chloroindole as the substrate to identify the dehalogenated metabolites of Endosulfan
4.1. Introduction
Endosulfan is a hexachlorinated cyclodiene pesticide used extensively in
horticulture. 226 Due to its high toxicity, it has been banned in most countries around the
world. 227 Nonetheless, it is still being used in India on rice, oilseeds and pulses as of
2013. 228 Endosulfan exists as a pair of isomers, α and β, in the ratio of 7:3. 229 (1, Fig.
4.1) It has been termed a “priority pollutant,” because its half-life in the soil is 4-6
months. 230,231 in comparison to low-persistent pollutants, malathion and carbaryl, with
half-lives of 5-8 days. 232,233 The reason endosulfan is so persistent is that it is difficult to
biodegrade. 234
Biodegradation of endosulfan begins with the oxidation of the sulfite to the sulfate
(Fig. 4.1, 2). The sulfate can be either singly or doubly hydrolyzed, yielding endosulfan
diol (3) or the monosulfate (4). The monosulfate can cyclise to give ether (5). The diol (3)
can be either singly or doubly oxidized to yield the mono- or dialdehyde (6 and 7,
respectively). Monoaldehyde (6) can form hemiacetal (8), and this can be oxidized
further to lactone (9). The diol, dialdehyde and lactone are less toxic to aquatic
organisms235 than endosulfan. However, the sulfate is more toxic than endosulfan in all
toxicity studies. 235, 236 The biodegradation process has been studied with fungi
(Asperigillus niger, Cladosporium oxysporum), 237 enriched microorganisms
(Ochrobacterum sp., Arthrobacter sp., Bulkholderia sp.), 238 soil bacteria, mixed microbial
cultures, 239 enzymes (e.g. Mycobacterium tuberculosis ESD) 240 by using endosulfan as
an only sulfur source or carbon source for microbes, and endosulfan diol was detected
as the major product. 241,242
It is important to note that all of the metabolites reported so far (1-9, Fig. 4.1) still
have the hexachlorinated bicyclic nucleus of the original pesticide intact. The
degradation of endosulfan with less than normal or no accumulation of the toxic sulfate,

93
has been targeted before, 243 but the enzymatic degradation of the chlorinated end of
endosulfan has not been accomplished according to our knowledge. Cytochrome P450s
catalyse the oxidation of hydrocarbons, among many other reactions. 244 The wild-type
P450cam (CYP101A1) hydroxylates camphor at the 5th position to form 5-exo-hydroxy
camphor and 5-ketocamphor. 164 The crystal structure of P450cam with camphor bound
has revealed that camphor is bound with the 5-exo C-H bond poised very precisely
above the iron porphyrin. 80,1,38 We tested wild type P450cam with endosulfan, because of
the structural resemblance, but found that only compounds (2, 3, 6, 7 and 9) were
formed (see below), suggesting that P450cam can accommodate endosulfan in its active
site but does not position the polychlorinated end above the porphyrin, which is a
necessary requisite for oxidation. We therefore hypothesized that mutating the active
site of P450cam could lead to correct positioning of endosulfan for oxidation at the
chlorinated end.
Mutagenesis studies of P450cam have been reported for various substrates
(section 1.6). For example, mutating Y96, a residue that hydrogen bonds to camphor
and thereby positions it, resulted in mutants that accept substrates such as alkanes,
106,107 α-pinene, 245 polychlorinated benzenes, 124 diphenylmethane. 105 In general,
replacement of F87, Y96 and V247 residues in P450cam (with W, F and L) has been
found to be important for the degradation of chlorinated substrates, though the activity
decreases with the number of chlorinated substituents. For example, the mutant
F87W/Y96F/T101A/L244A/V247L can oxidise pentachlorobenzene to pentachlorophenol
more effectively than the WT.119 Chlorinated cyclodienes are not among the substrates
oxidized by cytochrome P450cam mutants that have been reported.
We targeted to mutate the active site of P450cam to dehalogenate the
hexachlorinated end of endosulfan, the diol or the dialdehyde. There are two approaches
to altering the substrate selectivity of an enzyme: 1) targeted alteration based on
structural models of the enzyme 107 or 2) directed evolution.246 Directed evolution is a
strategy to alter the properties of a protein by multiple random mutation of the
corresponding gene, followed by a selection. In general, a directed evolution approach is
comprised of three steps: 247 a) random mutagenesis of the gene, 248 b) amplification of
the mutated library and c) screening for the variants.

94
For random mutagenesis of the gene, there are 3 options: 1) error-prone PCR,249
2) multi-template PCR 250 and 3) Sequence Saturation Mutagenesis (SeSaM).251,252,253,254
We chose SeSaM because it can achieve up to 16.7% of consecutive nucleotide
exchanges which is remarkable (as opposed to recurring isolated mutations (hot-spots)
obtained with the first two methods). 255 The challenge with large libraries of mutants is
the identification of mutants with the desired activity. Various selection/screening
methods have been reported for large libraries of mutants. The colorimetric/fluorimetric
assays, in which the product, styrene oxide is converted to a colored or a fluorescent
dye, by reaction with gamma-(4-nitrobenzyl)pyridine (NBP) , is an easy method of
detection, reported with cytochrome P450 BM-3 variant 139-3.256 One limitation of this
assay is that the colorimetric agent (for e. g., hydrazines used for ketone detection) may
be inhibitory to P450 reactivity. In a different selection method (survival screen), bacteria
that are expressing the enzyme are selected on media that contains the substrate of
interest. The selection process can be improved in this case if the given substrate is
toxic to bacteria and the metabolites of the substrate are less toxic than the substrate
itself. But this process is not useful if the substrate is bactericidal to bacteria or the
product(s) formed is (are) more toxic than the substrate itself, which can result in no
growth of bacteria.
In this work, we used two approaches to screen the SeSaM library for endosulfan
dehalogenation: 1) a combination of both pre-selection and colorimetric assays to find
P450 mutants from the SeSaM library that can dechlorinate 3-chloroindole and 2) a
survival screen with endosulfan itself. We chose 3-chloroindole because indole has been
reported to be hydroxylated by P450s at the 3rd position to form the colored dyes, isatin
and indigo. 257 In our case, formation of isatin and indigo from 3-chloroindole was
evidence of dehalogenation of substrate. We hypothesized that some active clones from
the 3-chloroindole screen would also dehalogenate endosulfan. In addition to this, the
library was also screened on minimal media with endosulfan as the only carbon source.
In this case, the transformants that harboured an endosulfan-degrading P450cam mutant
grew. The library preparation, screening and identification of the active variants for
endosulfan degradation are described in the following sections of this chapter.

95
ClCl
Cl
ClCl
Cl
O
O
S O
Osulfate diester
2
ClCl
Cl
ClCl
Cl
OH
OH
diol
3
ClCl
Cl
ClCl
Cl
OH
O
monoaldehyde
6
ClCl
Cl
ClCl
Cl
O
OH
monoaldehydehemiacetal
8
ClCl
Cl
ClCl
Cl
O
O
dialdehyde
7
ClCl
Cl
ClCl
Cl
O
O
lactone
9
ClCl
ClCl
Cl
O
O
SO
Cl
ClCl
ClCl
Cl
Cl O
O S O
1
ClCl
Cl
ClCl
Cl
OSO3H
OH
monosulfate
4
ClCl
Cl
ClCl
Cl
O
endosulfan ether
5
Figure 4.1. Endosulfan and its metabolites reported in the literature.
4.2. Materials and Methods
4.2.1. Experimental
The chemicals were of analytical grade and purchased from Sigma-Aldrich
Chemie (Taufkirchen Germany), Applichem (Darmstadt, Germany) or Carl Roth
(Karlsruhe, Germany). The nucleotide analog dPTP was purchased from Jena
Biosciences (Jena, Germany) and dPTPαS and dGTPαS were generously provided by

96
Biolog Life Science Institute (Bremen, Germany). All other nucleotides were purchased
from Fermentas (St. Leon-Rot, Germany). Taq DNA-Polymerase was obtained from
Qiagen (Hilden, Germany). All other DNA-polymerases, the terminal
deoxynucleotidyltransferase (TdT) were obtained from New England Biolabs (Frankfurt,
Germany). DNA was quantified using a NanoDrop photometer (NanoDrop Technologies,
Wilmington, DE, USA). The PCR reactions were performed in 0.2 ml thin-walled PCR
tubes from Sarstedt (Nuembrecht, Germany) using a Mastercycler gradient PCR-
machine from Eppendorf (Hamburg, Germany). Volumes higher than 50 µl were
distributed in multiple tubes. m-Chloro perbenzoic acid (m-CPBA) was purchased from
Sigma-Aldrich and purified by reported methods. 176 Centrifugations were carried out
with a Beckmann Avanti J-26 XPI centrifuge (Mississauga, ON, Canada), equipped with
a JLA 8.1000 rotor.
The 35Cl NMR spectra were run on a Bruker AVANCE III 500 MHz NMR
spectrometer (operating at 67.808 MHz) equipped with a Bruker 5 mm TBO probe and
samples were maintained at a temperature of 298 K. Samples were contained in 5 mm
diameter nmr tubes filled to 50 mm (volume ca. 600 µL). Acquisition time was 12 min per
spectrum or 300 min (when catalase was present). The chemical shifts (δ) for all
compounds are listed in parts per million using 10 mM NaCl in D2O as an internal
reference. The 17O NMR spectra were run in the same way as described in the section
3.3.1.2
4.2.2. SeSaM methodology
To explore the complete protein sequence, Schwaneberg et.al. have developed a
novel technique called Sequence Saturation Mutagenesis (SeSaM). SeSaM is an
economical random mutagenesis method which can be accomplished in 2-3 days to
generate a mutant library. SeSaM is comprised of 4 steps (Supplementary figure S1). 1)
a pool of DNA fragments with random lengths is generated, 2) a universal base is added
at the 3’ termini of the DNA fragments, using Deoxynucleotidyl terminal transferase
(TdT). 3) Elongation of the DNA fragments to the full length genes and, finally, 4)
Replacement of the universal bases by the standard nucleotides (Details are in the
Supporting information and SeSaM library validation shown in table S1).

97
4.2.3. Cloning of SeSaM libraries
Restriction sites (EcoR1 and Hind III) were incorporated in the mutant libraries of
the step 4 reactions by PCR, for cloning the libraries into the pALXtreme-1a vector (an
inhouse pET (+28a) vector) (Supplementary figure S2). The ligation mix was
transformed in chemically competent DH5α cells and plated on LB-agar/kanamycin
plates. 258 Thirty colonies from the transformation reaction were picked randomly and
checked by high-throughput PCR. The PCR products were run on 0.8% agarose gel to
check the presence of inserts, and it was observed that only one clone contained the
insert (1.5 kb), prompting us to use a different library cloning strategy. The culture of the
positive clone (1 µl) was inoculated into 2 mL of TYM 505/Kan medium, grown overnight
at 37 °C and the plasmid was isolated using the Nucleospin plasmid kit (Macherey-
Nagel, Dueren, Germany). Taking this whole plasmid as a template, the P450cam SeSaM
library acted as a megaprimer in a PCR, described as MEGAWHOP.259 The PCR
products were digested by DpnI, to eliminate the methylated template plasmid. To check
DpnI digestion efficiency, a 50 µl PCR reaction mixture (containing the megaprimer,
template plasmid, dNTPS, Pfus enzyme and buffer) was taken as a control and digested
with 10U of DpnI overnight. Colonies were not observed on this control plate which
suggested that the MEGAWHOP and the DpnI digestion processes worked efficiently.
Twelve clones each from the library were checked (Supplementary figure S3) for the
presence of the insert (by culture and PCR), and the positive clones were grown in
LB/kan medium overnight. The isolated plasmids from these clones were sequenced at
Eurofins MWG Operon, Germany. The SeSaM library was checked with the sequenced
clones (table S1) and glycerol stocks of the library were made for further experiments
with endosulfan.
4.2.4. Preparation of 3-chloroindole
The 3-chloroindole was prepared from indole (Sigma Aldrich, CAS # 120-72-9) in
two steps as reported previously. 260
N-chloro indole. To 0.585 g (1 mmol) of indole, 500 mL of n-pentane, 125 mL of
sodium hypochlorite and 125 mL of water were added and stirred at 0 oC for 3 h. The
organic layer was separated and the aqueous layer was extracted with an additional 100

98
mL of n-pentane. The combined organic layer(s) were dried over K2CO3. Pentane was
distilled under vacuum and the oily residue was stored at 4 oC.
3-chloro indole. To the oily residue in a 2 L flask, 500 mL of n-butanol and 7.5 g
of K2CO3 were added, and the reaction was refluxed for 2 h. The alcohol was removed
under reduced pressure and to this, 200 mL of water and 200 mL of CHCl3 were added.
The layers were separated and the chloroform layer was dried over K2CO3 and distilled
under vacuum. The oily residue was purified by column chromatography using
chloroform as the solvent and the isolated product (70.1 mg, yield 70%) was
characterized by NMR. 1H NMR analysis (chemical shift in δ): 8.08 (NH proton), 7.03-
7.73 (m, 5H, C(2)H and aromatic H). Alternatively, ~ 50 mg of the oily residue was
purified by preparative TLC using chloroform as the developing solvent and monitored
under U.V. The 3-chloroindole band was cut out and dissolved in ethyl acetate for ~45
minutes. Silica was filtered under gravity and the solvent was evaporated under vacuum
to give 3-chloroindole (5 mg).
4.2.5. IC50 experiments with 3-chloroindole and endosulfan
Overnight grown culture of BL21 cells acted as an inoculum for 20 mL of LB
medium (with no antibiotics). The culture was grown at 37 °C for an hour until the O.D.
was 0.1. The culture was then diluted 1000× and to 3 mL of this diluted culture, 3-
chloroindole or endosulfan was added in varying concentrations (from 5 µM to 300 µM
for 3-chloroindole and from 70 nM to 300 µM for endosulfan). This step was performed in
3 replicates. The cultures with the mentioned compounds were grown at 37 °C for an
hour and kept at 4 °C overnight. An aliquot (20 µL) of each replicate was plated on LB-
agar/non-antibiotic plates the next day and incubated overnight at 37 °C. The next day,
colonies were counted, and IC50 values were obtained using Graphpad prism software.
Subsequent screening protocols were conducted at 2x IC50 values for 3-chloroindole and
IC90 values for endosulfan.
4.2.6. Screening of 3-chloroindole with the SeSaM library using additives
The MEGAWHOP products (libraries and the wild type P450cam) and the empty
vector (pALXtreme-1a) (2 µl) were transformed in BL21-(DE3), plated on LB-agar

99
(kanamycin) plates supplemented with IPTG (80 µM), 3-chloroindole (12 µM), δ-amino
levulinic acid (1 mM), vitamin B1 (10 µM), FeCl2 (0.1 µM) and m-chloro perbenzoic acid
(m-CPBA, 0.3 µM). The m-CPBA allows the cytochrome to form the Fe-oxo form
(Compound I), without reducing O2. This is known as the peroxide shunt. 137 Plates
were incubated overnight at 37 °C. The active clones were identified by the blue colour
(indigo) or orange colour (isatin) and the plasmids were isolated from colored colonies,
to check for the presence of the inserts. Sequencing of the isolated plasmids was
perfomed at Macrogen, Korea.
4.2.7. Protein expression with the selected clone(s):
The clone(s) with the P450cam insert was/were grown individually in 2 mL LB/Kan
at 37 °C overnight with good aeration and the culture(s) were harvested at 10,000 rpm
for a minute at RT the next day. To the pellet, 2 mL of fresh LB/Kan medium was added
and grown for 2-3 h at 37 °C. Supplements, IPTG (80 µM), 5-amino levulinic acid (1
mM), vitamin B1 (10 µM), FeCl2 (0.1 µM) were added and the protein expression was
carried forward at 27 °C for 16h. The lysis and the protein purification steps were
performed as described in section 3.3.1.3.
In addition, a 12 L culture of the desired clone was grown and the protein
expression, lysis and the purification steps were performed as described in section
3.3.1.3 and the purified protein was used for the in vitro assays and steady-state
kinetics.
4.2.8. In vitro assays with the mutated and the wild type P450cam proteins
Enzymatic assays were performed with the P450cam mutant(s) (180 nM), 1 mM
endosulfan/3-chloroindole, 1 mM m-CPBA in 1 mL phosphate buffer (K+) (pH 7.4) and
three controls (in the absence of the substrate, shunt agent or the enzyme) were run in
parallel and the reaction mixtures incubated for 15 minutes at RT. Extraction was
performed with CHCl3/indanone (7.2 M, internal standard), 164 the extract was dried with
MgSO4 and the presence of the metabolites was checked by GC-MS. Metabolites
formed were compared to their respective standards.

100
4.2.9. Determination of Cl- and H2O2 in the enzymatic assays by 35Cl and 17O NMR:
Enzymatic assays were performed in 1 mL 50 mM phosphate buffer (made from
D2O) of pD 7.4. The pH of the buffer was adjusted according to the equation: pD = pH
meter reading + 0.4. 199. The reaction mixture contained endosulfan diol (200 µM),
P450cam (180 nM) and m-CPBA (200 nM). Reactions were incubated at 22 °C for 15
minutes. Controls (in the absence of shunt or the enzyme or the substrate) were run
simultaneously and the 35Cl spectra were run as mentioned in the methods section. For
17O NMR studies, the reaction mixture was prepared as described in section 3.4.2.2.
4.2.10. Steady-state kinetic assays for indole and 3-chloroindole hydroxylation with the P450cam mutant(s):
Steady state kinetic assays were performed in 1 mL phosphate buffer (50 mM,
150 mM K+), pH 7.4 with varying amounts of 3-chloroindole (substrate concentrations
varied from 20 µM to 1 mM), 1 mM m-CPBA, 180 nM mutant P450cam and the reaction
mixtures were monitored for 15 minutes at 246 nm for the formation of isatin. The
concentrations of the product, isatin were estimated using the extinction coefficient (2.3
mM-1 cm-1) as reported previously. 261 The determinations of Vmax, KM were done using
nonlinear regression with Graphpad Prism software. HPLC analysis was performed by a
reversed-phase C18 HPLC column using an isocratic solution of ACN:H2O (70:30). The
flow rate was 1 mL/min and λmax was set to 247 nm for the separation of isatin and 3-
chloroindole.
4.2.11. Determination of Fe-CO absorbance at 450 nm
To 1 mL phosphate buffer (50 mM, 150 mM K+, pH 7.4), mutant P450cam (180
nM), dithionite (1 mM) added, and to this reduced enzyme, carbon monoxide (99% pure,
SIGMA) was bubbled for 2 minutes (Supplementary figure S4).
4.2.12. MOE simulations
Docking simulations were performed using Molecular Operating Environment
(MOE, Chemical Computing Group, Montreal, Canada). Crystal structure information of
P450cam (CYP101A1) was obtained from Protein Data Bank and substrate bound

101
P450cam with PDB code 2ZWU 87 was used for the docking studies [with the ferric form
of the enzyme]. The protein was imported into MOE as a PDB structure, each residue
protonated at pH 7, 300 K and 0.1 M salt and the charges were assigned according to
the default settings under “Compute|Protonate 3D”. Ligands (3-chloroindole and
endosulfan) were constructed in MOE using “builder” and imported into the MOE
database as “.mdb” files. Prior to docking, camphor was deleted and potential docking
sites were identified on the protein (by setting “all atoms” (protein + heme) as the
receptor) using the option “site finder”. Dummy atoms were placed at each site targeted
for docking and these dummy atoms were markers used by the docking algorithm.
Ligands were docked using an induced fit protocol and all atoms of the P450 polypeptide
and the porphyrin chosen as the receptor. Triangle matcher was used for placement,
rescored by London dG, forcefield for refinement, rescored using GBVI/WSA dG; a
maximum of 30 poses were retained. Of the retained poses, the one with the reactive
centre (the 2-3 bond in 3-chloroindole and C=C bond in endosulfan) closest to Fe (an
arbitrary distance of 5 Å fixed) was selected for further studies.
4.2.13. Screening of the SeSaM library with endosulfan as the substrate
The SeSaM library glycerol stock (10 µL) was inoculated into 3 mL LB/kan
medium and grown overnight at 37 °C. The culture was diluted 106 with LB medium
and 20 µL was plated on mimimal media plates/kanamycin (with no carbon source). To
the treatment plates, the measured IC90 concentration of endosulfan (250 µM), m-CPBA
(0.3 µM), δ-amino-levulinic acid (1 mM), FeCl2 (0.1 µM), Vitamin B1 (10 µM), IPTG (100
µM) were added and three controls (in the absence of substrate/IPTG/shunt (m-CPBA))
were maintained for the experiment. The experiment was performed in 3 replicates and
the plates were incubated at 27 °C overnight. Plasmids isolated from the clones were
checked for the presence of P450cam insert using PCR (Terra PCR direct polymerase
mix, Clontech laboratories, CA). Sequencing was performed at Macrogen, Korea.
4.2.14. Transformation of the selected mutant in P. putida (ATCC 17453) 262
The mutant that most actively catalyzed 3-chloroindole oxidation was
transformed into P. putida (ATCC 17453), the strain that harbors the CAM plasmid. This
102
CAM plasmid encodes the early steps of the camphor degradation pathway, and
includes the two redox partners of the wild-type P450cam. 4,38,103 As a control, wild-type
P450cam in the same pET vector was also transformed into P. putida. The ATCC 17453
strain was grown overnight in LB medium at 27 °C at 250 rpm. 500 µL of this culture
acted as an inoculum for 10 mL fresh broth and grown for 3-4 h until the cell density was
109/mL. The cells were kept on ice for 20 minutes, harvested and resuspended in 1/10
volume of CaCl2. Plasmid DNA (3 µL) isolated from the previous step was added and the
cell/DNA mixture was incubated at 4 °C for 60 minutes and subjected to a heat pulse at
42 °C for 2 min, diluted 10× with LB medium and incubated at 30 °C for an hour. The
culture was harvested and the pellet was resuspended in 50 µL LB medium, plated on
LB/kan plates and grown overnight at 30 °C. The clones obtained were checked for the
presence of P450 insert using PCR (Terra PCR direct polymerase mix, Clontech
laboratories, CA).
4.2.15. Biodegradation of endosulfan using P450cam SeSaM library
The transformed P. putida (ATCC 17453) from the previous step was inoculated
in regular broth (Difco nutrient broth) and incubated overnight at 30 °C. The bacteria
acted as an inoculum for 1 L of fresh nutrient broth until the O.D. was 0.7-0.9. The
culture was harvested at 7000×g at RT for 30 minutes and the pellet was suspended in
60 mL M9 minimal medium (Na2HPO4.7H2O, KH2PO4, NaCl, MgSO4, CaCl2, and NH4Cl)
and 10 mL of the suspended pellet was distributed equally in the treatment and the
control flasks. Controls (in the absence of the substrate, boiled bacteria, and
transformed wild-type P. putida) were run in parallel. Cultures were treated with:
endosulfan (100 µM, 1 mL), supplements needed for the protein expression (IPTG (100
mM, 80 µL), FeCl2 (2g/mL, 10 µL), 5-aminolevulinic acid (500 mM, 180 µL), vitamin B1
(10 µM) and camphor (0.8 M, 600 µL)) for induction of the CAM pathway. 160,263
The flasks were covered by a cork that held a Porapak (Waters Corporation,
MA, USA) column in the middle. The cultures were incubated for a week, and culture
samples were collected every 24h. Porapak columns were exchanged every 24h, rinsed
with 500 µL CHCl3 twice and the eluents were checked for the presence of endosulfan
and its volatile metabolites by GC-MS. Culture samples (1 mL) collected every 24h were
harvested at 10,000×g for a minute and the supernatants were extracted with CHCl3 (1

103
mL). The aqueous layers were back-extracted with CHCl3 and the organic layers were
dried over Na2SO4 and analyzed by GC-MS.
4.2.16. In vitro assays with endosulfan as the substrate
In vitro enzymatic assays were performed with 1 mL phosphate buffer (50 mM
150 mM K+, pH 7.4) that contained P450cam (1.5 µM), m-CPBA (1 mM), substrate
endosulfan (1 mM) in four replicates. The buffer was sparged with O2 or argon prior to
the assay. Three controls (without enzyme, without substrate and without shunt) were
run in parallel with the treatments. The reaction mixture was incubated for 15 minutes at
22 °C and extracted in the same way as above. The dried organic layers were analysed
by GC-MS.
4.2.17. Biodegradation of endosulfan diol using P450cam mutant (E156G/V247F/V253G/F256S)
The active mutant from 3-chloroindole epoxidation
(E156G/V247F/V253G/F256S) was transformed in P. putida (ATCC 17453), inoculated
in regular broth (Difco nutrient broth) and incubated overnight at 30 °C. The bacteria
acted as an inoculam for 1 L fresh nutrient broth medium until the O.D. was 0.7-0.9. The
culture was harvested at 6000 rpm (Beckmann Avanti centrifuge, JLA 8.1 rotor) at RT for
30 minutes and the pellet was suspended in 60 mL M9 minimal medium
(Na2HPO4.7H2O, KH2PO4, NaCl, MgSO4, CaCl2, and NH4Cl) and 10 mL of the
suspended pellet was distributed equally in the treatment and the control flasks. In
addition to this, the wild-type P. putida gene was cloned in pET vector and transformed
in P. putida (ATCC 17453). The transformed WT bacteria were grown in the same
fashion as above and acted as a control to check the background activity of enzymes
from P450cam operon. In addition, two more controls were performed: a) the transformed
P. putida culture (with the mutant) was boiled and treated with camphor b) P. putida was
not transformed with either mutant or WT P450cam and checked for degradation with
endosulfan.
Endosulfan diol was added at IC90 concentration to the growing P. putida cultures
(1 mM, 100 µL), supplements needed for the protein expression (IPTG (100 mM, 80 µL),
FeCl2 (2g/mL, 10 µL), 5-aminolevulinic acid (500 mM, 180 µL), vitamin B1 (10 µM) and
104
camphor (0.8 M, 600 µL)) for induction of the CAM pathway. The cultures were
incubated for 3 days and samples collected every 24h. The culture flasks were fitted with
a Porapak column to trap any volatile compounds that form from the diol metabolism.
Porapak columns were exchanged every 24h and rinsed with 500 µL CHCl3 twice and
the eluents were checked for the presence of endosulfan diol and its metabolites by GC-
MS. Samples (1 mL) collected every 12 h were harvested at 10,000×g for a minute and
the supernatants were extracted with CHCl3 (1 mL). The aqueous layers were back-
extracted with CHCl3 and the organic layers were dried over Na2SO4 and analysed by
GC-MS.
4.2.18. In vitro assays with endosulfan diol as the substrate
In vitro enzymatic assays were performed in 1 mL phosphate buffer (50 mM 150
mM K+, pH 7.4) that contained P450cam (1.5 µM), m-CPBA (1 mM), substrate endosulfan
diol (1 mM) in four replicates. Endosulfan diol was detected as the major product in the
degradation of endosulfan and was reported to be less toxic. To avoid the toxic effects of
endosulfan at its higher concentrations, the diol was used for further studies. The buffer
was sparged with O2 or argon prior to the assay. Three controls (without enzyme,
without substrate and without shunt) were run in parallel with the treatments. The
reaction mixture was incubated for 15 minutes at 22 °C and extracted in the same way
as above. The organic extracts were silylated using BSTFA to check for the presence of
volatile intermediates and analysed by GC-MS. The dried organic layers were analysed
by GC-MS.
4.3. Results
4.3.1. Identification of active mutants for the hydroxylation of 3-chloroindole
The mutant P450cam library (~ 106 variants)246 with a mutation frequency
(substitution/base: 3×10⁻³) was screened with 3-chloroindole (10), as described in
section (4.2.6) of the experimental section (Supplementary Fig. S5). We have found that
3-chloroindole was toxic to bacteria (IC50 6 µM) (Supplementary Fig. S6), and the
corresponding “indigo-assay” products (isatin and indigo) were less toxic to the bacteria.

105
To estimate the number of hits obtained in this selection process, I also plated
the cells transformed with the library onto LB-agar/kanamycin control plates that did not
have 3-chloroindole or any other additives (section 4.2.6). The transformation and
selection process was performed twice and the results are shown in Table 4.1.
Table 4.1. Active mutants isolated by screening the P450cam SeSaM library with 3-chloroindole.
Transformation Control plates
(CFU/mL)
Treatment
(CFU/mL)
Survival
rate (%)
Pink
colonies
# of clones taken
for sequencing
1 (7.6 ± 1.0)×105 1200 ± 120 0.15 8 8
2 (7.2 ± 0.6)×105 1000 ± 100 0.13 4 4
Screening of the mutant library (with approximately 3 mutations/clone, based on
the sequencing results of 12 clones) with 12 µM 3-chloroindole (2× the IC50
concentration) under shunt conditions, using m-CPBA resulted in ~30 colonies per plate
out of which at least 15 were pink or blue colored, due to the formation of isatin (11) or
indigo, respectively. In the absence of shunt or the expression additives, and with the
wild-type control, the colonies formed (~ 5-7) were only white. Plasmids isolated from the
12 pink and two white colonies were sequenced. I was looking for mutants that formed
isatin (pink colored colonies) and the sequencing results of those mutants are listed in
Table 4.1.
In vitro assays were performed with all the sequenced mutants, and isatin was
detected as a major product with a few mutants (Table 4.2). The colonies that showed
white colour on the plates during the screening process did not show enzymatic activity
in these assays. Isatin from these reactions was isolated by reverse-phase HPLC and
analyzed by GC-MS (Fig. 4.2), 1H and 13C NMR (Supporting Fig. S7 and S8). The
compound matched an authentic isatin standard (Fig. 4.2).
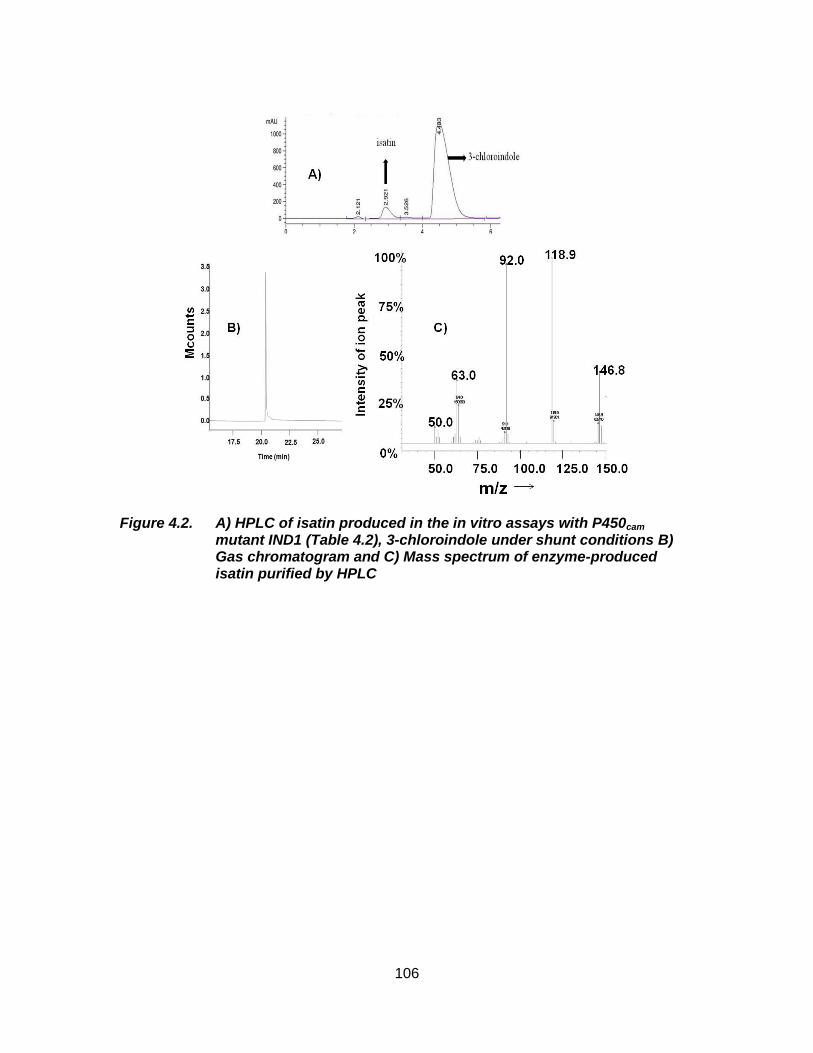
106
Figure 4.2. A) HPLC of isatin produced in the in vitro assays with P450cam mutant IND1 (Table 4.2), 3-chloroindole under shunt conditions B) Gas chromatogram and C) Mass spectrum of enzyme-produced isatin purified by HPLC

107
Table 4.2. Active mutants isolated by screening the P450cam SeSaM library with 3-chloroindole.
Clone
Name
P450cam Mutant Rate of isatin production
(nmol/min/nmol of P450cam)a
IND1 E156G/V247F/V253G/F256S 156 2
IND2 G60S/Y75H 132 1
IND3 D97F/P122L/Q183L/L244Q/ 114 5
IND4 G120A/G248S/D297H/Y179H 97 7
IND5 Y179H 72 10
IND6 G93C/K314R/L319M 69 8
WT Wild type ND b
a
Mean S. E. of 4 technical replicates. b Not detected.
4.3.2. Steady-state kinetic analysis of the isolated mutants:
The amounts of isatin formed were highest for the mutants IND1, IND2 and
IND3. The rates of 3-chloroindole hydroxylation were measured with the selected
mutants and normalized for the nmol of P450cam taken in the reaction (Table 4.3,
Supplementary Fig. S9). The IND1 mutant had a lower KM, but similar kcat/KM compared
to the other mutants.
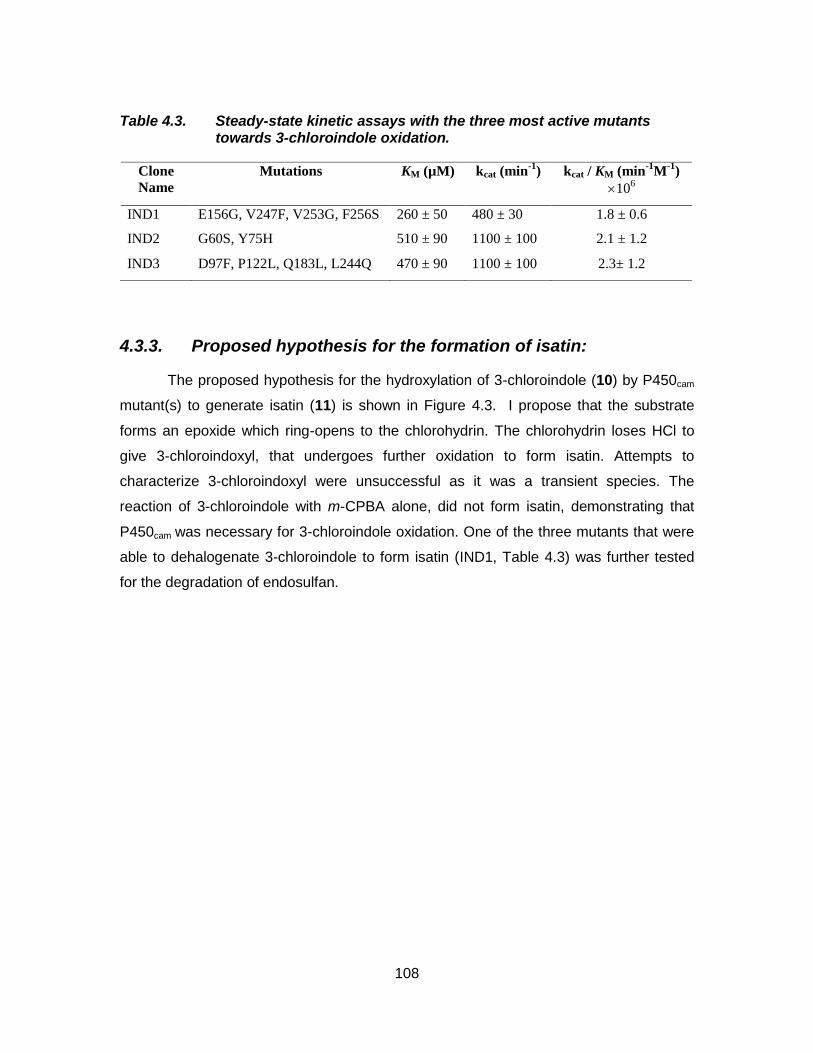
108
Table 4.3. Steady-state kinetic assays with the three most active mutants towards 3-chloroindole oxidation.
Clone
Name
Mutations KM (µM) kcat (min-1
) kcat / KM (min-1
M-1
)
106
IND1 E156G, V247F, V253G, F256S 260 ± 50 480 ± 30 1.8 ± 0.6
IND2 G60S, Y75H 510 ± 90 1100 ± 100 2.1 ± 1.2
IND3 D97F, P122L, Q183L, L244Q 470 ± 90 1100 ± 100 2.3± 1.2
4.3.3. Proposed hypothesis for the formation of isatin:
The proposed hypothesis for the hydroxylation of 3-chloroindole (10) by P450cam
mutant(s) to generate isatin (11) is shown in Figure 4.3. I propose that the substrate
forms an epoxide which ring-opens to the chlorohydrin. The chlorohydrin loses HCl to
give 3-chloroindoxyl, that undergoes further oxidation to form isatin. Attempts to
characterize 3-chloroindoxyl were unsuccessful as it was a transient species. The
reaction of 3-chloroindole with m-CPBA alone, did not form isatin, demonstrating that
P450cam was necessary for 3-chloroindole oxidation. One of the three mutants that were
able to dehalogenate 3-chloroindole to form isatin (IND1, Table 4.3) was further tested
for the degradation of endosulfan.

109
NH
Cl
3-chloroindole
NH
Cl
O H+
N
Cl
OH
N
O
+ HCl
N
O
P450cam mutant
OHNH
O
O
Isatin
10
11
P450cam mutant
Figure 4.3. Proposed mechanism for the formation of isatin from 3-chloroindole, catalysed by P450 compound I
4.3.4. Screening of SeSaM library with endosulfan as the substrate:
As an alternate screen, the SeSaM library was grown with endosulfan at IC90
concentration and the mutants that survived were able to metabolise endosulfan. Seven
mutants survived in each of the treatment plates, and 2 mutants survived in each of the
control plates that lacked either the shunt or the expression additives. In the control
plates with no substrate/shunt or additives, (9.2 ± 0.2)×105 CFU/mL were obtained
whereas, in the treatment plates, 300 ± 10 CFU/mL were obtained. Seven mutants that
survived were randomnly picked for sequencing and the mutant, K314E/V247F/D297N
(ES7) that produced higher amounts of endosulfan dialdehyde in the in vitro assays was
carried forward for the biodegradation studies (see below) (table S2).
4.3.5. Biodegradation of endosulfan diol using the P450cam mutant (IND1) isolated from 3-chloroindole screen:
To test if the mutant IND1 (Table 4.3) dehalogenates endosulfan, two sets of
assays were performed: 1) in vitro with the purified recombinant mutant P450cam, and 2)
in vivo with transformed P. putida.
1) The in vitro assays were performed with the purified recombinant mutant
P450cam, endosulfan diol as a substrate under the shunt conditions. When the buffer was
sparged with oxygen, endosulfan dialdehyde was detected as a major product
(Supplementary Fig. S10) in the treatments. In the silylated organic extracts, a new
metabolite with a M.+ 224 was detected after 30 minutes of incubation exclusively in the

110
treatments. When the buffer was sparged with argon, endosulfan dialdehyde was
detected and in addition to this, a new metabolite with a M+1 135 (Supplementary Fig.
S10), and in the trimethylsilylated organic extracts, a new metabolite with a M.+ 224 were
detected after 30 minutes of incubation exclusively in the treatments, prompting us to
characterize the metabolite and study the involvement of P450cam in its formation (see
below, section 4.3.7).
2) For the in vivo biodegradation studies with endosulfan diol, the mutant IND1
(Table 4.3) isolated from 3-chloroindole screen was transformed into P. putida by the
reported protocol (Supplementary Fig. S11) (section 4.2.14). The soil bacterium P.
putida utilizes camphor as a carbon source and the genetic information for camphor
degradation is encoded on a CAM plasmid, which is controlled by the Cam repressor.
Camphor induces the production of P450cam and its redox partners (PdX, PdR), when
the repressor dissociates from the upstream region of the CAM operon. P450cam needs
these redox partners (in the absence of shunt agent) for its catalytic activity. The reason
for transforming the mutant IND1 (Table 4.3) into P. putida was to check if endosulfan
can be degraded by P450 in the presence of its redox partners.
Endosulfan dialdehyde was identified as the major metabolite in the treatments
and in addition, endosulfan monoaldehyde, endosulfan lactone were also detected as
minor metabolites. The metabolites were identified in comparison to the retention times
of synthetic standards. Endosulfan monoaldehyde and dialdehyde were also detected in
the controls (non-transformed and transformed P. putida cultures). In addition, a new
metabolite with a M+1 135, described above (Fig. S10) was detected exclusively in the
treatments, within 12h of incubation, exclusively in the treatments, and the titer of this
compound increased with time. The diol titer decreased by 70% in 3 days of incubation
in the treatments and only by 30 % in the controls. The 30% decrease in diol titer in the
WT-transformed control bacteria was due to formation of endosulfan monoaldehyde,
dialdehyde and lactone (Fig. 4.4).

111
Figure 4.4. Biodegradation of endosulfan diol by the P450cam mutant IND1 and the formation of metabolites endosulfan dialdehyde and the M+1 = 135 compound in the treatments. Treatment: P450cam mutant IND1 in plasmid pALXtreme-1a transformed in P. putida ATCC 17453. Control: Wild-type P450cam in plasmid pALXtreme-1a transformed in P. putida ATCC 17453.
4.3.6. Biodegradation of endosulfan using the P450cam mutant V247F/D297N/K314E (ES7) isolated from endosulfan screen:
In the previous section, I have described how the P450cam mutant IND1 also
accepts endosulfan diol as a substrate. In this section, I describe how the most active
mutant from the endosulfan screen (see section 4.3.4, Table S2) was tested in vivo in
the same manner. Briefly, the mutant ES7 isolated from endosulfan screen was
transformed in P. putida and the biodegradation studies were carried out in the same
way as described in the previous section with endosulfan as a substrate. Endosulfan diol
was detected as the main product, along with endosulfan dialdehyde. After 3 days of
incubation, the new metabolite with M+1 135 formed, and the progress was monitored
for 7 days of incubation (Figure 4.5). The formation of the new metabolite was 2× slower

112
with this mutant than with mutant IND1. After 7 days, the cultures were harvested and
the extraction, purification of the oily residue by column chromatography to isolate the
M+1 = 135 compound were performed as described below.
Figure 4.5. Biodegradation of endosulfan by the isolated mutant ES7 and the formation of metabolites endosulfan diol and the M+1 = 135 compound in the treatments. Treatment: P450cam mutant ES7 in plasmid pALXtreme-1a transformed in P. putida ATCC 17453. Control: Wild-type P450cam in plasmid pALXtreme-1a transformed in P. putida ATCC 17453.
4.3.7. Isolation and identification of metabolites obtained from the in vivo and in vitro assays of endosulfan diol biodegradation:
The cultures (from sections 4.3.5 and 4.3.6) were harvested and the supernatants were
extracted with chloroform. The organic extracts were dried over sodium sulfate and
concentrated under vacuum. The oily residue (~ 100 mg) was purified by column
chromatography using hexane: EtOAc (3:1) and the fractions (30-72) monitored by TLC
were concentrated to give a yellow solid.

113
The mass spectrum of the yellow solid showed the fragmentation peaks 134.8,
117.8, 105 and 76 (Fig. 4.6). The 1H NMR showed a signal at 10.5 ppm (2H)
corresponding to aldehyde protons, two signals at 7.99 ppm (2H) and 7.78 ppm (2H)
corresponding to aromatic protons (Supplementary Fig. S13). The 13C NMR showed a
signal at 192.3 ppm (aldehyde carbons), 136.2 ppm, 133.2 and 131 corresponding to
aromatic carbons (Supplementary Fig. S14). By elemental analysis, this solid was shown
to have 71.3% carbon, 4.47% hydrogen and 23% oxygen proving the molecular formula
to be C8H6O2. These data are consistent with phthaldialdehyde.
Figure 4.6. Gas chromatogram and mass spectrum of phthaldialdehyde isolated from the in vitro and in vivo assays with P450cam mutants (see above) and endosulfan diol as the substrate
In addition to phthaldialdehyde, the TLC analysis of the oily residue also showed
a red-colored spot that was initially predicted to be a phenolic intermediate. This
metabolite was isolated by the preparative TLC using the solvent system,
hexane:acetone (2:1) and trimethylsilylated by BSTFA for GC-MS analysis. The non-
derivatized phenol is not volatile enough for gas chromatographic analysis, but the
trimethylsilyl ether is. The mass spectrum of this trimethylsilylated intermediate showed
the fragmentation peaks 224.5, 209.5, 153 and 75.2 (Fig. 4.7). NMR showed a signal at

114
9.6 ppm (2H), 7.42 (d, 1H), 6.37 (dd, 1H) and 6.20 (d, 1H). (Supplementary Fig. S15).
14.6 14.7 14.8 14.9 15.0 15.1
Time (min)
100
200
300
400
500
600
209.5
224.5
75.2
0%
25%
50%
75%
100%
kcounts
50 100 150 200
m/z
Inte
nsity o
f io
n p
eak
Figure 4.7 Gas chromatogram and mass spectrum of silylated 3-hydroxy phthaldialdehyde isolated from the in vitro and in vivo assays with P450cam mutants (see above) and endosulfan diol as the substrate
4.3.8. Proposed mechanism in the biodegradation of endosulfan and the formation of phthaldialdehyde:
The proposed mechanism for the formation of phthaldialdehyde from endosulfan
is shown in Figs. 4.8, 4.9 and 4.10. We propose that endosulfan forms sulphate (2) by
P450 oxidation, which is hydrolysed to endosulfan diol (3). Endosulfan dialdehyde (7)
forms after the double oxidation of the diol by P450cam (Stage 1, Fig. 4.8).

115
ClCl
Cl
ClCl
Cl
O
O
SO
Stage 1 endosulfan metabolism
ClCl
Cl
ClCl
Cl
O
O
S
O
[O]P450
ClCl
Cl
ClCl
Cl
O
O
S O
O
ClCl
Cl
ClCl
Cl O S
O
O
O-OH
ClCl
Cl
ClCl
ClO
ClCl
Cl
ClCl
Cl
OH
OH
endosulfan
sulfate diester
sulfate momoester ether
diol
ClCl
Cl
ClCl
Cl
OH
OH
diol
[O]P450
ClCl
Cl
ClCl
Cl
OH
O
ClCl
Cl
ClCl
Cl
O
OH
monoaldehyde monoaldehydehemiacetal
[O] P450 [O] P450
ClCl
Cl
ClCl
Cl
O
O
ClCl
Cl
ClCl
Cl
O
O
lactonedialdehyde
1 H2O
2 H2O
1
2
3
3 6 8
7 9
4 5
Figure 4.8. Stage 1 in the metabolism of endosulfan. Formation of metabolites 3-9.
Epoxidation of dialdehyde (7) at the chlorinated end generates (12), which
immediately gets protonated to generate (13). Attack of water on (13) and simultaneous
release of HCl generates the strained, probably unstable species (14), that rearranges to
the more stable intermediate (15). Intermediate (16), that forms from (15) after further
hydrolysis and release of HCl, undergoes decarboxylation, to form (17) that releases a
molecule of HCl to form (18) (Stage 2, Fig. 4.9).

116
ClCl
Cl
ClCl
Cl
O
O
dialdehyde
Stage 2 endosulfan metabolism
[O]P450 mutant
ClCl
Cl
ClCl
ClO
O
OH+
ClCl
Cl
ClCl
ClO
O
HO
H2O
ClCl
Cl
ClCl
Cl
O
O
HO
HO
ClCl
Cl
ClO
O
OO
Very strainedProbably unstable
-O
Cl O
OClCl
Cl
O
H2O
Cl ClOH
HO
Cl O
OCl
O
O
HO
H+
CO2
HO
Cl O
OCl
OH
HO
Cl O
O
O
O
Cl O
O
O
H
HCl
HCl
O
O
O
O
2 HCl
2 HCl
7 12
1415
16 17
1819
13
Figure 4.9. Stage 2 in endosulfan metabolism: Biodegradation of endosulfan dialdehyde.
Intermediate 18 can eliminate an additional HCl, to give diketone 19, which would
need to be reduced. We have recently reported that P450cam oxidizes two molecules of
water to hydrogen peroxide, with the simultaneous reduction of camphor to borneol
(Prasad et. al. PLoS One, in press). We propose that (19) can be reduced by three
rounds of reduction, each with concomittant oxidation of two molecules of water to H2O2,
to form phthaldialdehyde (25). I hypothesize that this process of ketone to alcohol
reduction with simultaneous formation of hydrogen peroxide (Stage 3, Fig. 4.10) is
similar to the borneol cycle described in chapter 3 of this thesis. Consistent with this

117
hypothesis, phenolic intermediates (22) and (23), which are tautomers of (20) and (21),
respectively, have recently been isolated together (data not shown). The phenolic
intermediate, (23) has been purified and characterised by GC-MS (Fig. 4.7) and 1H NMR
(Supplementary Fig. S15). If the pathway shown in Figs. 4.8, 4.9 and 4.10 is correct,
then endosulfan diol degradation should give two inorganic products: Cl- (6 equivalents
per endosulfan diol converted to either 22, 23 or 25) and H2O2.
O
O
O
O
H2O2
HO
O
O
O
HO
O
O
HO
H2O2
HO
O
O
HO
H
HO
O
O
HO
O
O
O
O
OH2O2
HO
O
O
H
O
O
2H2O2H2O
2H2O
19
20 21
23
23 24 25
22
Figure 4.10. Stage 3 in endosulfan metabolism. Formation of phthaldialdehyde.
The release of chloride ions during the biodegradation of endosulfan diol was
monitored by 35Cl, and the results suggested that a signal for Cl- (0 ppm) was observed
in the treatments, but missing in all controls (Fig. 4.11 A). The formation of H2O2, in the
conversion of (19) to (25) was detected in the treatments and missing in the controls
(Fig. 4.11 B).

118
Figure 4.11. A) The 35Cl NMR spectrum of the incubation mixture containing i) endosulfan diol, mutant IND1, and m-CPBA. ii) mutant IND1 and m-CPBA (diol absent). iii) diol and m-CPBA (mutant IND1 absent). iv) diol and IND1 (m-CPBA absent). The peak at 0 ppm corresponds to aq. Cl-, and the peak at -10 ppm is a synthetic peak (ERETIC2) with an area equal to that observed for an external sample of 10 mM NaCl in D2O. B) 17O NMR spectrum of the incubation mixture in 17O phosphate buffer containing: i) endosulfan diol, mutant IND1, and m-CPBA. Ii) mutant IND1 and m-CPBA (diol absent). Iii) diol and m-CPBA (mutant IND1 absent). Iv) diol and IND1 (m-CPBA absent). The peak at 175 ppm corresponds to H2
17O2.
4.3.9. Docking of 3-chloroindole in the active site of P450cam:
To verify whether 3-chloroindole fits into the active sites of the mutants better
than wild-type P450cam, in silico docking calculations were performed. First, 3-
chloroindole was docked in the active site of P450cam (WT as well as the mutant IND1).
V247, V253 and F256 can be seen close to the active site heme (Fig. 4.13) (section 1.4).
The WT enzyme showed no activity with 3-chloroindole hydroxylation in the in vitro
assays (Table 4.1), and the docking suggests that 3-chloro indole is wedged in between
F256 and L244. The ‘NH’ of 3-chloroindole is poised exactly above the Fe, which may
cause it to coordinate and inhibit catalytic turnover. Even during the screening, some
colonies remained colourless, which suggests that WT or the mutations present farther
from the active site of the enzyme had low activity with 3-chloroindole hydroxylation
(Table 4.1).
The proposed mechanism for the formation of isatin (Fig. 4.3) suggested that the
C-2 or C-3 of 3-chloroindole should be close to Fe for getting oxidised. The poses
obtained after docking 3-chloroindole in the active site of IND1 suggested that at least 5

119
of them had the C-2 close to Fe and 6 poses had the C-3 close to Fe (the distance from
C-2 to Fe and C-3 to Fe was around 5 Ǻ). We hypothesise that compound I is
responsible for the epoxidation of 3-chloroindole (Fig. 4.3) and the docking results
suggested that both C-2 or C-3 have a chance to get attacked for the formation of 3-
indoxyl (Fig. 4.3), that further results in the formation of isatin. The poses obtained after
docking 3-chloroindole in the active site of WT suggested that only one of them had the
C-2 close to Fe and the rest of poses were much farther, giving less chance for the
compound I to attack the substrate at the C2-C3 bond (Fig. 4.12).
0
2
4
6
8
10
12
1 2 3 4 5 6 7 8 9 10 11 12 13 14 15 16 17 18 19 20
Dis
tan
ce f
rom
C-3
of
3-
ch
loro
ind
ole
to
Fe
Pose
0
2
4
6
8
10
12
1 2 3 4 5 6 7 8 9 10 11 12 13 14 15 16 17 18 19 20
Dis
tan
ce f
rom
C-2
of
3-
ch
loro
ind
ole
to
Fe
Pose
0
2
4
6
8
10
12
1 2 3 4 5 6 7 8 9 10 11 12 13 14 15 16 17 18 19 20
Dis
tan
ce f
rom
C-2
of
3-
ch
loro
ind
ole
to
Fe
Pose
0
2
4
6
8
10
12
1 2 3 4 5 6 7 8 9 10 11 12 13 14 15 16 17 18 19 20
Dis
tan
ce f
rom
C-3
of
3-
ch
loro
ind
ole
to
Fe
Pose
A)
B)
Figure 4.12. A) Graphical representation of the distances from C-2 and C-3 to Fe in the poses of 3-chloroindole obtained after docking 3-chloroindole in the active site of IND1. B) Graphical representation of the distances from C-2 and C-3 to Fe and the poses of 3-chloroindole obtained after docking 3-chloroindole in the active site of WT P450cam.
The mutations V247F, F256S and V253G in IND1 create a more open cavity
above the porphyrin in the active site than the cavity seen in WT P450cam. For example,
it is interesting to note that in the model of the mutant, F247 and the 3-chloroindole are
exactly orthogonal (Fig. 4.13), suggesting that a sp2C-H/π interaction now plays a role in
positioning 3-chloroindole above the porphyrin.

120
Figure 4.13 A) 3-chloroindole docked in the wild-type P450cam (pose 3 from the Fig. 4.10 B selected). B) 3-chloroindole docked in the mutant IND1 (pose 5 from the Fig. 4.10 A selected). The porphyrin is shown in black, 3-chloroindole in green and the amino acid residues in yellow.
4.3.10. Docking of endosulfan diol in the active site of P450cam:
Endosulfan diol was docked into the WT and the mutant, IND1 (isolated from 3-
chloroindole screen). The poses obtained after docking endosulfan diol in the active site
of IND1 suggested that at least 12 of them had the C-2 close to Fe and 3 poses had the
C-3 close to Fe (the distance from C-2 to Fe and C-3 to Fe was around 5 Ǻ) (Fig. 4.14
A). The poses obtained after docking the diol in the active site of WT suggested that only
5 of them had the C-2 close to Fe and 14-15 poses had the C-8 and C-9 close to Fe.
(Fig. 4.14 B). In the proposed biodegradation mechanism (Figs. 4.8, 4.9 and 4.10), the
epoxidation of endosulfan dialdehyde (7, stage 2, Fig. 4.9) is necessary for the further
dechlorination steps. With the docking results, we hypothesise that the mutant IND1 can
position the endosulfan diol with the chlorinated end sufficiently close to Fe for
epoxidation, the first step in the proposed biodegradation. In contrast, the WT enzyme
appears to position endosulfan diol such that only the hydroxyl groups and close enough
to Fe for oxidation (Figs. 4.14 and Fig. 4.15).

121
0
2
4
6
8
1 2 3 4 5 6 7 8 9 10 11 12 13 14 15 16 17 18 19 20
Dis
tan
ce f
rom
C-2
of
en
do
su
lfan
dio
l to
Fe
Pose
012345678
1 2 3 4 5 6 7 8 9 10 11 12 13 14 15 16 17 18 19 20Dis
tan
ce f
rom
C-3
of
en
do
su
lfan
dio
l to
Fe
Pose
0
1
2
3
4
5
6
7
8
9
1 2 3 4 5 6 7 8 9 10 11 12 13 14 15 16 17 18 19 20
Dis
tan
ce f
rom
C-8
of
en
do
su
lfan
dio
l to
Fe
Pose
0
1
2
3
4
5
6
7
8
9
1 2 3 4 5 6 7 8 9 10 11 12 13 14 15 16 17 18 19 20
Dis
tan
ce f
rom
C-9
of
en
do
su
lfan
dio
l to
Fe
Pose
A)
ClCl
Cl
ClCl
Cl
OH
OH
12
3 45
6
7
8
9
0
2
4
6
8
10
1 2 3 4 5 6 7 8 9 10 11 12 13 14 15 16 17 18 19 20Dis
tan
ce f
rom
C-2
of
en
do
su
lfan
dio
l to
Fe
Pose
0
2
4
6
8
10
1 2 3 4 5 6 7 8 9 10 11 12 13 14 15 16 17 18 19 20Dis
tan
ce f
rom
C-3
of
en
do
su
lfan
dio
l to
Fe
Pose
0
2
4
6
8
10
1 2 3 4 5 6 7 8 9 10 11 12 13 14 15 16 17 18 19 20
Dis
tan
ce f
rom
C-8
of
en
do
su
lfan
dio
l to
Fe
Pose
0
2
4
6
8
10
1 2 3 4 5 6 7 8 9 10 11 12 13 14 15 16 17 18 19 20Dis
tan
ce f
rom
C-9
of
en
do
su
lfan
dio
l to
Fe
Pose
B)
Figure 4.14. A) Graphical representation of the distances of C-2, C-3, C-8 and C-9 to Fe in the poses of endosulfan diol obtained after docking it in the active site of IND1. B) Graphical representation of the distances of C-2, C-3, C-8 and C-9 to Fe in the poses of endosulfan diol obtained after docking it in the active site of WT P450cam.

122
Figure 4.15 A) Endosulfan diol docked in the wild-type P450cam. B) Endosulfan diol docked in the mutant IND 1 (pose 19 selected from 4.11 B). The porphyrin is shown in black, 3-chloroindole in green and the amino acid residues in yellow.
4.3.11. Docking of endosulfan dialdehyde in the active site of P450cam:
Endosulfan dialdehyde was also docked into the WT and the mutant, IND1
(isolated from 3-chloroindole screen). The poses obtained after docking endosulfan
dialdehyde in the active site of IND1 suggested that at least 9 of them had the C-2 close
to Fe and 10 poses had the C-3 close to Fe (the distance from C-2 to Fe and C-3 to Fe
was around 5 Ǻ) (Fig. 4.16 A). The poses obtained after docking the dialdehyde in the
active site of WT suggested that only 1 of them had the C-2 close to Fe and 3 poses had
the C-8 and C-9 close to Fe (Fig. 4.16 B). The docking results from dialdehyde clearly

123
suggest that the mutant IND1 can position the dialdehyde sufficiently close to Fe for
epoxidation. The C-8 and C-9 of endosulfan dialdehyde in IND1 mutant are farther from
Fe, than the C-8 and C-9 of the diol, which suggests a reason why endosulfan diacid is
not formed by this mutant.

124
0
2
4
6
8
10
1 3 5 7 9 11 13 15 17 19Dis
tan
ce f
rom
C-2
of
en
do
su
lfan
dia
ldeh
yd
e
to F
e
Pose
0
2
4
6
8
1 3 5 7 9 11 13 15 17 19Dis
tan
ce f
rom
C-3
of
en
do
su
lfan
d
iald
eh
yd
e t
o F
e
Pose
0
2
4
6
8
10
12
1 3 5 7 9 11 13 15 17 19
Dis
tan
ce f
rom
C-8
of
en
do
su
lfan
d
iald
eh
yd
e t
o F
e
Pose
0
2
4
6
8
10
1 3 5 7 9 11 13 15 17 19
Dis
tan
ce f
rom
C-9
of
en
do
su
lfan
d
iald
eh
yd
e t
o F
e
Pose
A)
ClCl
ClCl
Cl
O
O
Cl
89
2
3
endosulfan dialdehyde
0
2
4
6
8
10
12
1 3 6 8 10 12 14 16 18 20
Dis
tan
ce f
rom
C-2
of
en
do
su
lfan
d
iald
eh
yd
e t
o F
e
Pose
0
2
4
6
8
10
1 3 6 8 10 12 14 16 18 20Dis
tan
ce f
rom
C-3
o
f een
do
su
lfan
d
iald
eh
yd
e t
o F
e
Pose
0
2
4
6
8
10
1 3 6 8 10 12 14 16 18 20
Dis
tan
ce f
rom
C-8
o
f een
do
su
lfan
d
iald
eh
yd
e t
o F
e
Pose
0
5
10
15
1 3 6 8 10 12 14 16 18 20
Dis
tan
ce f
rom
C-9
o
f en
do
su
lfan
d
iald
eh
yd
e l
to
Fe
Pose
B)
Figure 4.16 A) Graphical representation of the distances of C-2, C-3, C-8 and C-9 to Fe in the poses of endosulfan dialdehyde obtained after docking it in the active site of IND1. B) Graphical representation of the distances of C-2, C-3, C-8 and C-9 to Fe in the poses of endosulfan dialdehyde obtained after docking it in the active site of WT P450cam.
The consecutive deprotonations after epoxidation and rearrangement, may occur
in co-operation with Gln 322, His 355 and Lys 344, present close to the active site.
Similar docking results were observed for the mutant, ES7 and the lower catalytic turn-

125
over observed in this case may be due to D297N mutation, that disrupts the hydrogen
bond between the carboxylate group of D297 to one of the heme propionate groups. 264
4.4. Discussion
One of the main difficulties in the applications of P450cam remains its poor affinity
for unnatural substrates. 265 The catalytic cycle involves the expulsion of the axially
coordinated water molecule from the heme iron upon substrate binding. 16 Poor
substrate binding causes an incomplete spin transition of the heme in the active site,
which decreases the catalytic efficiency of the enzyme. 266 Therefore, there is a need for
engineering the active site of the enzyme to enhance the substrate binding affinity, which
then enhances the catalytic turn-over of the enzyme. Researchers have attempted to
design P450cam variants by either increasing the active site volume for larger substrate
molecules, 267 or enhancing the substrate binding affinity by complementary non-
covalent interactions between the substrate and the suitable amino acid side-chains in
the active site. 266 It has been reported before that the substrates that do not fit well into
the P450cam active site, either because they are too small and do not fill the cavity or
because they are too large and cannot position above the Fe, are not turned over 106
(section 1.4)
Previous literature suggests that the wild-type P450cam has no activity towards
indole. 268 Site-directed mutagenesis of P450cam active site was attempted before by
researchers to obtain activity towards indole. 257 The amino acids, F87, Y96, T101 and
L244 in the active site of the enzyme were mutated, and the mutants were assayed with
indole and various substituted indoles, 257,269 (section 1.4) but not 3-chloroindole. The
hydrophobic residue V247, present above heme (section 1.4), was mutated to leucine, to
change the shape of the cavity above heme and detect oxidation of a variety of
unnatural substrates that include α-pinene, aromatic halides, short-chain alkanes.
107,109,147,270 Here, we report a novel mutation (V247F) that can alter the activity of
P450cam towards dehalogenation of endosulfan. This mutation was also observed in the
mutant isolated from endosulfan screen which prompted us to use IND1 for further in
vivo studies with endosulfan diol. The additional mutations in IND1, V253 to a smaller
glycine and F256S create space in the active site and a different positioning of

126
endosulfan diol above the porphyrin. The results of the activity assays and in silico
docking experiments are consistent with the interpretation that both 3-chloroindole and
endosulfan were well positioned in the mutant active site for turn-over.
The mutant (ES7) isolated from the endosulfan screen had 2× lower activity with
the diol (section 4.3.6). The carboxylate group of D297 side chain is reported to have
specific interactions with one of the heme propionate groups and the mutation, D297M is
reported to have reduced oxidation activity with butane and propane. 107 The residue
K314 is not present in the substrate binding cavity and this mutation, K314E has not
been reported before. However, it is of interest to note that I found K314 mutations in
two of the mutants I isolated (ES7 from the endosulfan screen and G93C/K314R/L319M
from the 3-chloroindole screen) Further studies are necessary to verify if these mutations
play a role in the dehalogenation.
The reductive dehalogenation of haloalkanes was reported for P450cam. 271 Here,
I have reported a series of new mutants, two of which were very active in the
dehalogenation of the pesticide endosulfan or its main halogenated metabolites,
endosulfan diol and endosulfan dialdehyde. The products I identified, phthaldialdehyde
and 3-hydroxyphthaldialdehyde indicate that dehalogenation of the endosulfan
halogenated core is complete. The two mutants of P450cam described here may one day
be helpful in the bioremediation of endosulfan or its halogenated metabolites, which are
toxic and reclacitrant pollutants. 226,272-274
4.5. Conclusions:
In conclusion, we have generated a SeSaM library for P450cam and generated
variants that can dehalogenate 3-chloroindole, giving isatin as the major initial product
and indigo after overnight oxidation. Indirubin was not detected in our assays. Kinetic
assays were performed with the selected mutants that showed the highest hydroxylation
activity with 3-chloroindole. SeSaM library preparation for P450cam and screening studies
with 3-chloroindole are novel.
Selected mutants from 3-chloroindole screening were tested for endosulfan
degradation. Alternatively, the mutant library was also screened with endosulfan at its

127
IC90 concentration to generate variants that can metabolize it. Our results suggested that
the mutants ES7 and IND1 formed endosulfan diol first, then endosulfan dialdehyde, and
this was further degraded to phthaldialdehyde under low oxygenation and 3-
hydroxyphthaldialdehyde under high oxygenation. Importantly, the full degradation, from
endosulfan diol to the phthalaldehydes was observed in vivo and also in vitro with the
purified and shunted mutants. We propose that the initial step of dehalogenation is the
epoxidation of the alkene moiety in the halogenated portion of endosulfan dialdehyde.
Opening of the epoxide results in a series of chloride eliminations and rearrangements
that eventually leave the six carbons of the endosulfan bicycle as the six carbons of 4,5-
dioxocyclohexa-2,6-diene-1,2-dicarbaldehyde (o-quinone 19). This compound, we
propose, is reduced and dehydrated stepwise, to give the phthaldialdehyde metabolites
observed. The latter steps provide two interesting links to chapter 3 of this thesis. First,
the proposed reduction reactions, from o-quinone 19 to the phthaldialdehydes, do not
require any addition of a nicotinamide cofactor. Consistent with proposed borneol cycle
in chapter 3, when endosulfan diol was reacted in vitro with the mutant and a shunting
agent in H217O, labelled H2O2 was formed. Second, the O2 control of the reduction
reaction was preserved: the fully reduced and dehydrated product, phthaldialdehyde,
formed preferentially under low oxygenation, whereas the phenolic products formed
preferencially under high oxygenation.

128
4.6. Supplementary information
Screening of Cytochrome P450cam SeSaM library with 3-
chloroindole as the substrate to identify the dehalogenated
metabolites of Endosulfan
4.6.1. Sequence Saturation Mutagenesis (SeSaM)
SeSaM is a simple and economical random mutagenesis method which can be
accomplished in 2-3 days to generate a mutant library. 253 SeSaM is comprised of 4
steps: 1) generation of a pool of DNA fragments with random length, 2) addition of a
universal base using Deoxynucleotidyl terminal transferase (TdT) at the 3’ termini of the
DNA fragments, 3) elongation of the DNA fragments to the full-length genes, and 4)
replacement of the universal bases by the standard nucleotides.
4.6.1.1. Step 1 of SeSaM:
a) Generation of templates for SeSaM (preliminary step):
Before fragment generation, two templates (forward and reverse), to which bio-
SeSaM primers would bind, was generated. (Supplementary Fig. S1) A 50 µl PCR-
mixture for the forward template (FT) reaction contained: 1x Phusion HF Buffer; (New
England Biolabs); 0.2 mM of each dNTP; 12.5 pmol of each primer (SeSaM Fcam,
P450cam R), 2.5 U of Phusion polymerase (New England Biolabs) and 50 ng of wild-type
CAM plasmid isolated from Pseudomonas putida ATCC 17453 (which contains the
P450cam gene) as a template. A 50 µl PCR-mixture for the reverse template (RT) reaction
contained 12.5 pmol of the primers (SeSaM Rcam and P450cam F) and the rest same as
stated above: PCR program: 98 °C, 30 sec (1 cycle); 98 °C, 10 sec; 60°C, 30 sec; 72 °C,
45 sec (25 cycles); 72 °C, 5 min (1 cycle).

129
b) Generating a fragment pool with random length distribution:
To generate a homogenous distribution of DNA fragments, the templates (FT and
FR) were linearly amplified individually with the appropriate forward and reverse primers
(as stated above) and with varying percentages of both standard (dATP, dGTP) and α-
phosphorothioate nucleotides (dATPαS and dGTP αS), SeSaM Taq polymerase (2 U)
and SeSaM Taq buffer (10x). The phosphorothioate bond is susceptible to iodine
cleavage in alkaline solution and the cleavage of the PCR products generated a library
of fragments upstream of the α-phosphorothioate nucleotides. The fragment library is
denoted with the appropriate ‘αS’ analogue of the nucleotide. If dATPαS is used, it
generates a ‘A’ library. Furthermore, if forward template with dATPαS is used, it
generated a FTA library. Similarly, FTG, RTA and RTG libraries were also generated.
Homogenous distribution of fragments and absence of uncleaved PCR products in the
libraries (after iodine cleavage) was necessary to proceed with the further steps. The
distribution of fragments in the libraries was checked on a 0.8% agarose gel (40 min, 96
V) to establish the appropriate percentages of dATPαS and dGTP αS.
c) Generating a fragment pool with random length distribution using bioSeSaM
primers:
A second PCR reaction was performed with a biotinylated forward primer and
non-biotinylated reverse primer in the presence of standard nucleotides, appropriate
percentages of α-phosphorothioate nucleotides, SeSaM Taq buffer (10X) and SeSaM
Taq polymerase (2U) with both forward and reverse templates individually (When
forward template was used, bioSeSaM F and P450cam R were used as primers and when
reverse template was used, bioSeSaM R and P450cam F were used as primers)
(Supplementary Fig. S1). The PCR products from the libraries were column purified
using the Nucleospin kit to remove the unelongated primers (elution with 80 µl elution
buffer). 10 µl of 10x Qiagen Taq buffer was added to provide alkaline conditions,
followed by addition of 10 µl of cleavage solution (20 mM iodine in 99 % ethanol). The
cleavage reaction was vortexed immediately after setup, and incubated (at 70 °C for 1
h). Biotinylated-DNA fragments were subsequently isolated using magnetic streptavidin
beads (M-PVA SAV1, Chemagen, Baesweiler, Germany). For a better yield of single
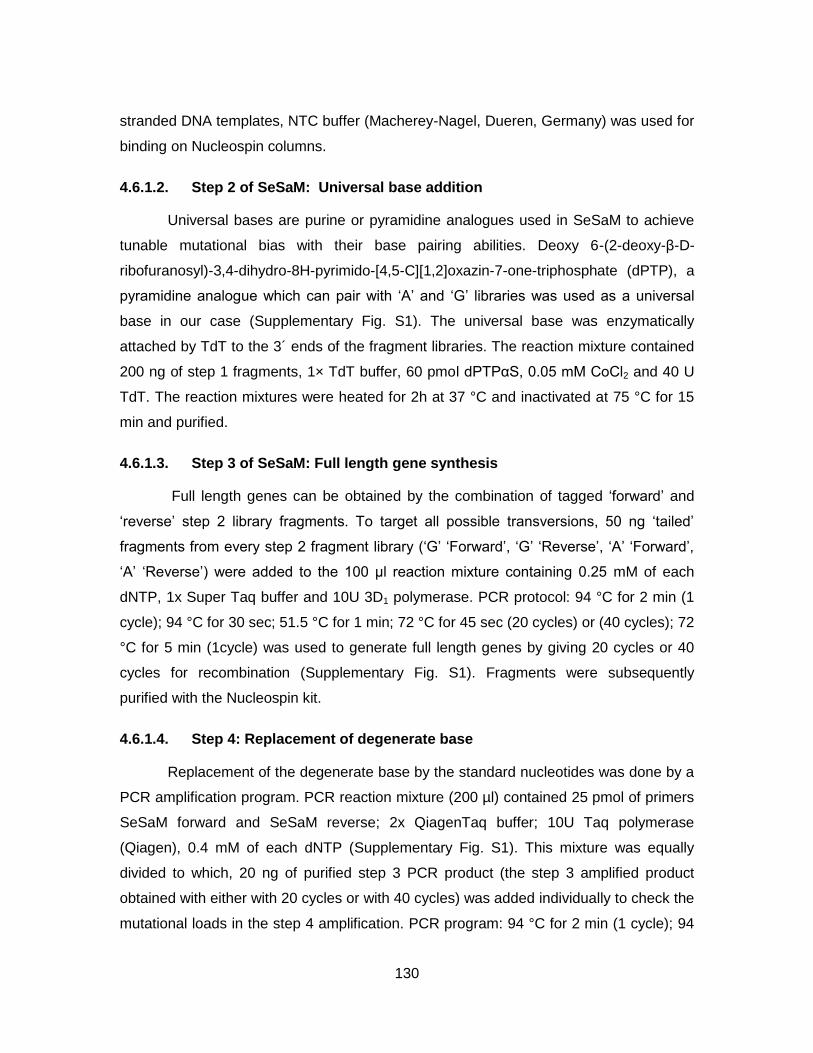
130
stranded DNA templates, NTC buffer (Macherey-Nagel, Dueren, Germany) was used for
binding on Nucleospin columns.
4.6.1.2. Step 2 of SeSaM: Universal base addition
Universal bases are purine or pyramidine analogues used in SeSaM to achieve
tunable mutational bias with their base pairing abilities. Deoxy 6-(2-deoxy-β-D-
ribofuranosyl)-3,4-dihydro-8H-pyrimido-[4,5-C][1,2]oxazin-7-one-triphosphate (dPTP), a
pyramidine analogue which can pair with ‘A’ and ‘G’ libraries was used as a universal
base in our case (Supplementary Fig. S1). The universal base was enzymatically
attached by TdT to the 3´ ends of the fragment libraries. The reaction mixture contained
200 ng of step 1 fragments, 1× TdT buffer, 60 pmol dPTPαS, 0.05 mM CoCl2 and 40 U
TdT. The reaction mixtures were heated for 2h at 37 °C and inactivated at 75 °C for 15
min and purified.
4.6.1.3. Step 3 of SeSaM: Full length gene synthesis
Full length genes can be obtained by the combination of tagged ‘forward’ and
‘reverse’ step 2 library fragments. To target all possible transversions, 50 ng ‘tailed’
fragments from every step 2 fragment library (‘G’ ‘Forward’, ‘G’ ‘Reverse’, ‘A’ ‘Forward’,
‘A’ ‘Reverse’) were added to the 100 µl reaction mixture containing 0.25 mM of each
dNTP, 1x Super Taq buffer and 10U 3D1 polymerase. PCR protocol: 94 °C for 2 min (1
cycle); 94 °C for 30 sec; 51.5 °C for 1 min; 72 °C for 45 sec (20 cycles) or (40 cycles); 72
°C for 5 min (1cycle) was used to generate full length genes by giving 20 cycles or 40
cycles for recombination (Supplementary Fig. S1). Fragments were subsequently
purified with the Nucleospin kit.
4.6.1.4. Step 4: Replacement of degenerate base
Replacement of the degenerate base by the standard nucleotides was done by a
PCR amplification program. PCR reaction mixture (200 µl) contained 25 pmol of primers
SeSaM forward and SeSaM reverse; 2x QiagenTaq buffer; 10U Taq polymerase
(Qiagen), 0.4 mM of each dNTP (Supplementary Fig. S1). This mixture was equally
divided to which, 20 ng of purified step 3 PCR product (the step 3 amplified product
obtained with either with 20 cycles or with 40 cycles) was added individually to check the
mutational loads in the step 4 amplification. PCR program: 94 °C for 2 min (1 cycle); 94

131
°C for 30 sec; 59.5 °C for 30 sec; 72 °C for 30 sec (20 cycles); 72 °C for 5 min (1 cycle).
The resulting PCR products representing the final mutant library was gel extracted for
cloning.

132
4.7. Supplementary Tables and Figures
Supplementary figure 4.S1. Steps involved in SeSaM library preparation.

133
Supplementary figure 4.S2. The vector map of pALXtreme-1a, an inhouse pET(+28a) vector

134
Supplementary figure 4.S3. 0.8% agarose gel analysis of culture PCR for the randomly picked clones from MEGAWHOP step 2 reaction. The
positive clones are shown by circles. Lanes 11, 19 and 25 represent the DNA marker with molecular weights ranging from 0.25-6 kbp.

135
Supplementary figure 4.S4. Determination of Fe-CO absorbance at 450 nm a) The Soret peak of P450cam was detected at 410 nm b) P450cam was reduced by Na2S2O4 and the intensity of Soret peak was reduced. c) CO was bubbled in the reduced protein for ~ 2 min and the absorption of Fe(II)-CO was recorded.

136
Supplementary figure 4.S5. Transformation of SeSaM P450cam mutant library in BL21(DE3) cells and further screening with 3-chloroindole.

137
Supplementary figure 4.S6. IC50 experiments on Escherichia coli using varying concentrations of 3-chloroindole and endosulfan

138
NH
O
O
N
O
OH
90%10%
Supplementary figure 4.S7. 1H NMR of isatin
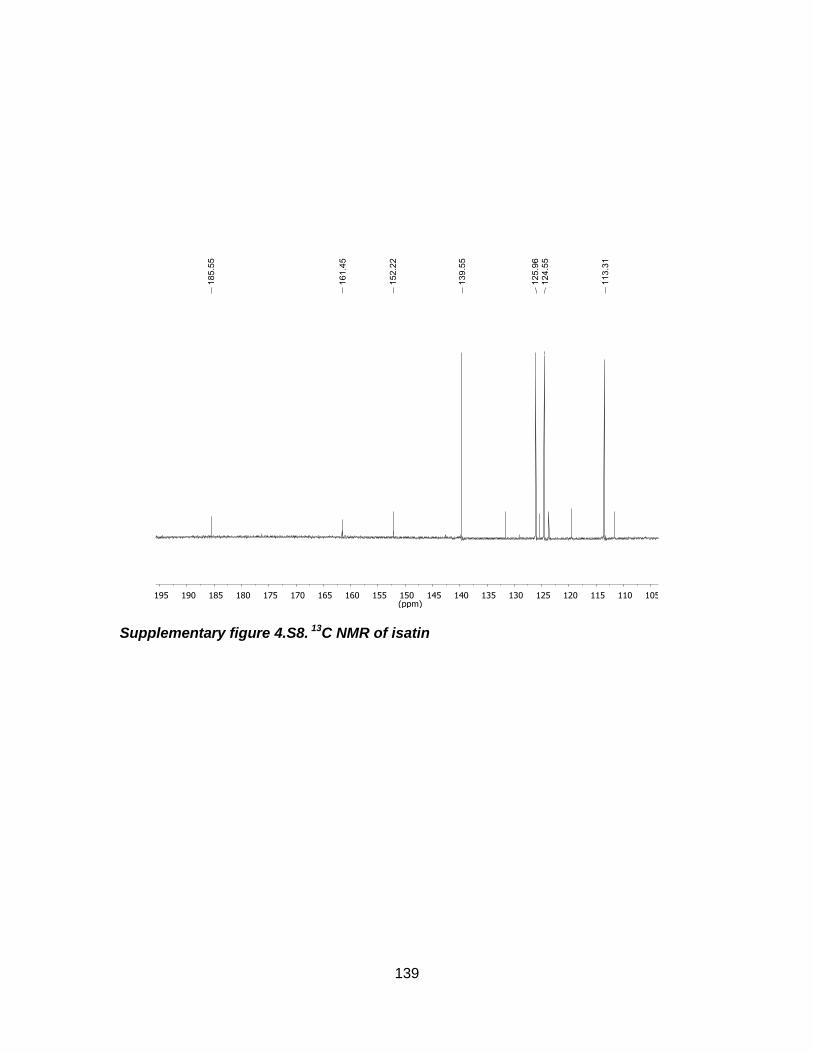
139
Supplementary figure 4.S8. 13C NMR of isatin

140
Supplementary figure 4.S9. Steady state kinetic analysis for 3-chloroindole oxidation and formation of isatin
141
50
134.8
60 70 80 90 100 110 120 130
m/z
0%
25%
50%
75%
100%
105
Inte
ns
ity o
f io
n p
ea
k
10 12.5 15 17.5 20 22.5 Time (min)
0
100
200
300
400
500
Kc
ou
nts
ClCl
Cl
ClCl
Cl
OH
OHClCl
Cl
ClCl
Cl
O
O
O
O
H
H
Supplementary figure 4.S10. In vitro assay results with endosulfan diol as the substrate under shunt conditions using m-CPBA and detection of metabolites by GC-MS. Endosulfan dialdehyde was detected as a major product.

142
Transformation in P. putida
E156G/V247F/V253G/F256S
LB-agar/ plates
and incubated at
27 C
Supplementary figure 4.S11. Transformation of the mutant P450CAM plasmid isolated from 3-chloroindole screen in P. putida. The cytochrome P450cam hydroxylase operon present on the CAM plasmid of P. putida is responsible for the camphor degradation pathway

143
Supplementary figure 4.S12. Experimental design and apparatus for the endosulfan biodegradation experiment with mutant-transformed P. putida.

144
Supplementary figure 4.S13. 1H NMR of pure pthalaldialdehyde obtained from in vitro assays and the biodegradation studies.

145
Supplementary figure 4.S14. 13C NMR of pure pthalaldialdehyde obtained from in vitro assays and the biodegradation studies.

146
Supplementary figure 4.S15. 1H NMR of 3-hydroxy pthalaldialdehyde obtained from in vitro assays and the biodegradation studies.

147
Table 4.S1. The results from SeSaM library validation
Aspect Value
Mutation frequency (substitution/base) 2.7 × 10⁻³
Ts/Tv (Transition/transversion) 0.6
% consecutive mutations in the sequenced clones 25
Fraction of stop codons 0.08
Fraction of Gly/Pro 0.16
% WT 0
a 12 clones were randomly sequenced from both ends using T7 promoter and T7 terminator as primers.
Table 4.S2. List of mutants obtained from the endosulfan screen with their sequences
Screen Clone Sequence Endosulfan dialdehyde (nmol/min/nmol P450)
Endosulfan
ES1
ES2
ES3
ES4
ES5
ES6
ES7
T56A/ N116H/D297N
F292S/A296V/K314E/P321T
Q108R/R290Q/I318N
S221R/I281N
A296P
G120S
V247F/D297N/K314E
22 ± 4
25 ± 3
11 ± 4
15 ± 3
12 ± 4
12 ± 1
52 ± 3
148
5. Future work
A) Experiments to prove the proposed reduction mechanism for the formation of
borneol (borneol cycle):
The proposed reduction mechanism (Fig. 3.7) suggests that water present in the
active site of the enzyme is responsible for formation of borneol and H2O2. The isotope
labeled experiments (Fig. 3.2) and the steady-state kinetics (Fig. 3.6) in H2O and D2O
were performed to verify borneol formation. The formation of hydrogen peroxide was
verified by 17O NMR. The hypothesis shown in Fig. 3.7 involves compound I as an
important intermediate in the borneol cycle. Although this mechanism is supported by
NMR and kinetics experiments, a few more experiments can be planned for future
studies.
i) Characterisation of compounds I and II, that form in the borneol cycle:
The first question that needs to be addressed is how one could verify if borneol
cycle occurs in the active site of the enzyme. This question can’t be answered by just the
formation of products: borneol and H2O2. The involvement of compound I and compound
II-H in the mechanism has not been shown experimentally, and observing these reactive
intermediates would provide more evidence for the proposed mechanism.
The initial attempts to verify the shunt pathway was performed by Egawa et.al. 275
in which the substrate free P450cam and m-CPBA were mixed and rapid-scan stopped-
flow studies were performed. The weak band at 694 nm and a blue-shifted Soret peak at
367 nm were assigned to a porphyrin π-cation radical. Recent attempts to characterize
compound I by stopped-flow kinetics were performed by Green et.al. 46 In their
experiments, the compound I was characterized 35 ms after mixing the ferric CYP119 (a
P450 isolated from Sulfolobus solfataricus) and m-CPBA at 4 °C.
The important question that could be addressed with similar stopped-flow kinetics
is how the presence or absence of O2 affects the formation of compounds I or II. Recall
that at high O2 concentrations in the buffer, more hydroxylation products form (Fig. 3.1),
whereas under anoxic conditions, the borneol cycle takes place (Figs. 3.1, 3.7). The two

149
reactions differ in the reaction of compound I: for hydroxylation compound I abstracts a
H atom from the substrate, giving an alkyl radical and compound II-H. The hydroxylation
product then forms by a rebound mechanism, in which the OH radical (effecively
coordinated to Fe in compound II-H) joins with the carbon radical to furnish the alcohol.
In the borneol cycle, compound I abstracts a H atom from water and then proceeds
through the cycle as described in Chapter 3 (Fig. 3.7). The hydroxylation reaction was
monitored by stopped-flow kinetics. 79,276 Similar experiments can also be performed for
borneol cycle to characterize the compound I and compound II by UV-Visible
spectroscopy (stopped flow kinetics) and elucidate the low O2 cycle mechanism. The
main difficulty for this experiment includes the capturing of compound I and II-H
intermediates as the lifespan of compound I is expected to be 35-100 ms.
ii) EPR experiments to identify the radical intermediates that form in borneol cycle:
The EPR characterization of compound-ES (Fig. 1.2) was performed by
Schünemann et.al. 277 In their experiment, the reaction mixture containing the substrate-
free P450cam and m-CPBA were freeze-quenched at -110 °C after a reaction time of 8
ms. Green et.al. have also reported the EPR measurements of compound I for CYP119
(a P450 isolated from Sulfolobus solfataricus). 278,46 For this, the reaction mixture
containing CYP119 and m-CPBA were freeze-quenched ˂25K and the formation of a
new paramagnetic radical was assigned to compound I.
Similar experiments can also be planned with freeze-quenched P450cam, m-
CPBA and camphor to check for the formation of compounds I and II. One difficulty
could be the overlapping signals between protein radical, compound I and m-
chlorobenzoic radical and their assignments.
iii) Monitoring of borneol cycle by UV-Visible spectroscopy:
The reaction between m-CPBA and the resting P450 forms compound I, and its
formation can be monitored by UV-Visible spectroscopy or by extraction and
derivatization with BSTFA, followed by GC-MS quantitation to check for the formation of
meta-chloro benzoic acid. If the borneol cycle occurs by the proposed mechanism (Fig.
3.7), very little m-CPBA will be used for the reaction as the compound I is regenerated.
In that case, the excess m-CPBA may overlap signals with m-chloro benzoic acid, which

150
may cause difficulty in monitoring the reaction by UV spectroscopy. Monitoring by
BSTFA derivatization and GC-MS will show the presence or absence of m-chlorobenzoic
acid, provided the acid can be extracted quantitatively from the aqueous buffer.
iv) Energy-calculations of the intermediates of borneol cycle:
The thermodynamical calculations of the intermediates of borneol cycle (shown
in Fig. 3.8) are estimates only. The energy estimates can be known better if the
intermediates of the borneol cycle (Fig. 3.7) are simulated, using validated ab initio
protocols. For now, only rough estimates were provided from the electrochemical data
279 and Gaussian calculations.
B) Endosulfan dehalogenation:
Phthaldialdehyde, formed in the biodegradation process, was characterized by
1H and 13C NMR. The phenolic intermediate (23) was also characterized recently. Still,
additional experiments need to be performed to confirm that the phthaldialdehyde
formed was indeed derived from endsulfan diol.
i) If the phenolic intermediate (23) is indeed an intermediate during the
biodegradation process, enzymatic assays can be performed with the mutant IND1
under shunt conditions to verify if it and phthaldialdehyde form (also see v below). If the
experiment is run in D2O, and 23 froms from 19 (Figs. 4.9 and 4.10) and
phthaldialdehyde (25) forms trom 23 by a reduction akin to the borneol cycle described
in Chapter 3, then compound 23 should be deuterated at the 4-position and
phthaldialdehyde should be dideuteriated at the 4 and 5 positions (see v below).
ii) The release of CO2 in the biodegradation can be verified by 13C studies by
labeling endosulfan dialdehyde. The Schematic representation of the reaction is shown
below.
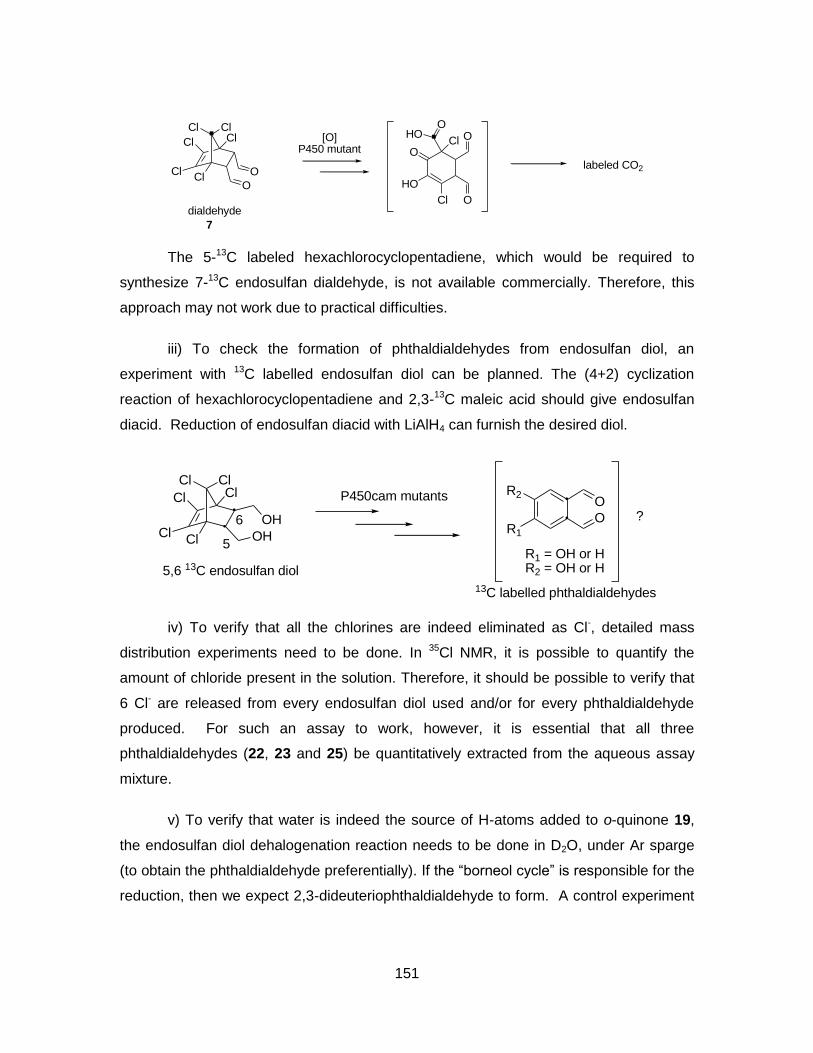
151
ClCl
Cl
ClCl
Cl
O
O
dialdehyde
[O]P450 mutant
HO
Cl O
OCl
O
O
HO
labeled CO2
7
. .
The 5-13C labeled hexachlorocyclopentadiene, which would be required to
synthesize 7-13C endosulfan dialdehyde, is not available commercially. Therefore, this
approach may not work due to practical difficulties.
iii) To check the formation of phthaldialdehydes from endosulfan diol, an
experiment with 13C labelled endosulfan diol can be planned. The (4+2) cyclization
reaction of hexachlorocyclopentadiene and 2,3-13C maleic acid should give endosulfan
diacid. Reduction of endosulfan diacid with LiAlH4 can furnish the desired diol.
ClClCl
Cl
Cl
Cl OH
OH
5
6
5,6 13C endosulfan diol
P450cam mutants O
OR1
R2
R1 = OH or HR2 = OH or H
13C labelled phthaldialdehydes
?
iv) To verify that all the chlorines are indeed eliminated as Cl-, detailed mass
distribution experiments need to be done. In 35Cl NMR, it is possible to quantify the
amount of chloride present in the solution. Therefore, it should be possible to verify that
6 Cl- are released from every endosulfan diol used and/or for every phthaldialdehyde
produced. For such an assay to work, however, it is essential that all three
phthaldialdehydes (22, 23 and 25) be quantitatively extracted from the aqueous assay
mixture.
v) To verify that water is indeed the source of H-atoms added to o-quinone 19,
the endosulfan diol dehalogenation reaction needs to be done in D2O, under Ar sparge
(to obtain the phthaldialdehyde preferentially). If the “borneol cycle” is responsible for the
reduction, then we expect 2,3-dideuteriophthaldialdehyde to form. A control experiment

152
could be done with the P450 mutant, PdX, PdR and NADD. If the “borneol cycle” is
active, then we do not expect to see deuteriated phthaldialdehyde in these controls.
ClClCl
Cl
Cl
Cl OH
OH
5
6
P450cam mutants O
OR1
R2
R1 = DR2 = D
D2O bufferAr sparge
?
vi) Monitoring of the biodegradation reaction: If the UV/visible peak absorbances
of the intermediates (23 and 25) are known and if distinct, then this reaction can also be
studied by stopped-flow kinetics.
vii) To further verify the mechanism of endosulfan dehalogenation, steady-state
kinetics need to be done in normal and D2O buffers, under O2 pressure and under Ar
pressure, just as was done in Chapter 3. This will help us check for O2 dependence of
the reduction steps and provide indirect evidence that a process similar to the borneol
cycle occurs in the dehalogenation mutants as well.
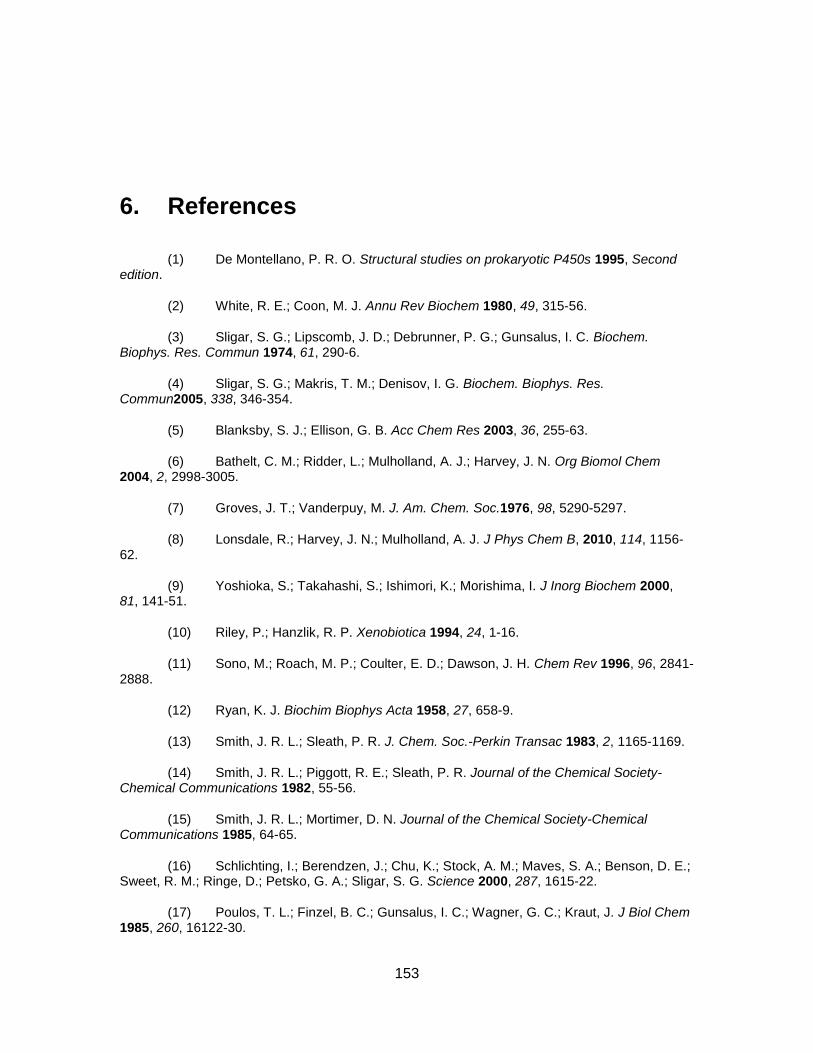
153
6. References
(1) De Montellano, P. R. O. Structural studies on prokaryotic P450s 1995, Second edition.
(2) White, R. E.; Coon, M. J. Annu Rev Biochem 1980, 49, 315-56.
(3) Sligar, S. G.; Lipscomb, J. D.; Debrunner, P. G.; Gunsalus, I. C. Biochem. Biophys. Res. Commun 1974, 61, 290-6.
(4) Sligar, S. G.; Makris, T. M.; Denisov, I. G. Biochem. Biophys. Res. Commun2005, 338, 346-354.
(5) Blanksby, S. J.; Ellison, G. B. Acc Chem Res 2003, 36, 255-63.
(6) Bathelt, C. M.; Ridder, L.; Mulholland, A. J.; Harvey, J. N. Org Biomol Chem 2004, 2, 2998-3005.
(7) Groves, J. T.; Vanderpuy, M. J. Am. Chem. Soc.1976, 98, 5290-5297.
(8) Lonsdale, R.; Harvey, J. N.; Mulholland, A. J. J Phys Chem B, 2010, 114, 1156-62.
(9) Yoshioka, S.; Takahashi, S.; Ishimori, K.; Morishima, I. J Inorg Biochem 2000, 81, 141-51.
(10) Riley, P.; Hanzlik, R. P. Xenobiotica 1994, 24, 1-16.
(11) Sono, M.; Roach, M. P.; Coulter, E. D.; Dawson, J. H. Chem Rev 1996, 96, 2841-2888.
(12) Ryan, K. J. Biochim Biophys Acta 1958, 27, 658-9.
(13) Smith, J. R. L.; Sleath, P. R. J. Chem. Soc.-Perkin Transac 1983, 2, 1165-1169.
(14) Smith, J. R. L.; Piggott, R. E.; Sleath, P. R. Journal of the Chemical Society-Chemical Communications 1982, 55-56.
(15) Smith, J. R. L.; Mortimer, D. N. Journal of the Chemical Society-Chemical Communications 1985, 64-65.
(16) Schlichting, I.; Berendzen, J.; Chu, K.; Stock, A. M.; Maves, S. A.; Benson, D. E.; Sweet, R. M.; Ringe, D.; Petsko, G. A.; Sligar, S. G. Science 2000, 287, 1615-22.
(17) Poulos, T. L.; Finzel, B. C.; Gunsalus, I. C.; Wagner, G. C.; Kraut, J. J Biol Chem 1985, 260, 16122-30.

154
(18) Poulos, T. L.; Finzel, B. C.; Howard, A. J. Biochemistry 1986, 25, 5314-22.
(19) Lewis, D. F.; Hlavica, P. Biochim Biophys Acta 2000, 1460, 353-74.
(20) Nelson, D. R. Hum Genomics 2009, 4, 59-65.
(21) Holden, M.; Mayhew, M.; Bunk, D.; Roitberg, A.; Vilker, V. J Biol Chem 1997, 272, 21720-5.
(22) Roome, P. W., Jr.; Philley, J. C.; Peterson, J. A. J Biol Chem 1983, 258, 2593-8.
(23) Roome, P. W.; Peterson, J. A. Arch Biochem Biophys 1988, 266, 41-50.
(24) Tyson, C. A.; Lipscomb, J. D.; Gunsalus, I. C. J Biol Chem 1972, 247, 5777-84.
(25) Katagiri, M.; Ganguli, B. N.; Gunsalus, I. C. J. Biol. Chem 1968, 243, 3543-6.
(26) Fruetel, J. A.; Mackman, R. L.; Peterson, J. A.; Ortiz de Montellano, P. R. J Biol Chem 1994, 269, 28815-21.
(27) Adamovich, T. B.; Pikuleva, I. A.; Chashchin, V. L.; Usanov, S. A. Biochim Biophys Acta 1989, 996, 247-53.
(28) Matson, R. S.; Hare, R. S.; Fulco, A. J. Biochim Biophys Acta 1977, 487, 487-94.
(29) Narhi, L. O.; Fulco, A. J. J Biol Chem 1986, 261, 7160-9.
(30) Cho, K. B.; Lai, W.; Hamberg, M.; Raman, C. S.; Shaik, S. Arch Biochem Biophys, 2011, 507, 14-25.
(31) Haurand, M.; Ullrich, V. J Biol Chem 1985, 260, 15059-67.
(32) Miyata, A.; Hara, S.; Yokoyama, C.; Inoue, H.; Ullrich, V.; Tanabe, T. Biochem Biophys Res Commun 1994, 200, 1728-34.
(33) Nebert, D. W.; Adesnik, M.; Coon, M. J.; Estabrook, R. W.; Gonzalez, F. J.; Guengerich, F. P.; Gunsalus, I. C.; Johnson, E. F.; Kemper, B.; Levin, W.; et al. DNA 1987, 6, 1-11.
(34) Nelson, D. R. Methods Mol Biol 1998, 107, 15-24.
(35) Gotoh, O. Biol Pharm Bull, 2012, 35, 812-7.
(36) Sligar, S. G.; Gunsalus, I. C. Proc Natl Acad Sci U S A 1976, 73, 1078-82.
(37) Guallar, V.; Friesner, R. A. J Am Chem Soc 2004, 126, 8501-8.
(38) Schlichting, I.; Berendzen, J.; Chu, K.; Stock, A. M.; Maves, S. A.; Benson, D. E.; Sweet, B. M.; Ringe, D.; Petsko, G. A.; Sligar, S. G. Science 2000, 287, 1615-1622.
(39) Davydov, R.; Makris, T. M.; Kofman, V.; Werst, D. E.; Sligar, S. G.; Hoffman, B. M. J Am Chem Soc 2001, 123, 1403-15.

155
(40) Sligar, S. G. Science, 2010, 330, 924-5.
(41) Luthra, A.; Denisov, I. G.; Sligar, S. G. Arch Biochem Biophys, 2011, 507, 26-35.
(42) Guengerich, F. P.; Isin, E. M. Acta Chimica Slovenica 2008, 55, 7-19.
(43) Shaik, S.; Cohen, S.; Wang, Y.; Chen, H.; Kumar, D.; Thiel, W. Chem Rev, 2010, 110, 949-1017.
(44) Newcomb, M.; Toy, P. H. Acc Chem Res 2000, 33, 449-55.
(45) Altun, A.; Shaik, S.; Thiel, W. J. Am. Chem. Soc.2007, 129, 8978-8987.
(46) Rittle, J.; Green, M. T. Science, 2010, 330, 933-7.
(47) Akhtar, M.; Wright, J. N. Nat Prod Rep 1991, 8, 527-51.
(48) Cryle, M. J.; De Voss, J. J. Angew Chem Int Ed Engl 2006, 45, 8221-3.
(49) Ortiz de Montellano, P. R.; Nelson, S. D. Arch Biochem Biophys, 2011, 507, 95-110.
(50) Newcomb, M.; Zhang, R.; Chandrasena, R. E.; Halgrimson, J. A.; Horner, J. H.; Makris, T. M.; Sligar, S. G. J Am Chem Soc 2006, 128, 4580-1.
(51) Newcomb, M.; Halgrimson, J. A.; Horner, J. H.; Wasinger, E. C.; Chen, L. X.; Sligar, S. G. Proc Natl Acad Sci U S A 2008, 105, 8179-84.
(52) Chefson, A.; Zhao, J.; Auclair, K. Chembiochem 2006, 7, 916-9.
(53) Kim, S. J.; Latifi, R.; Kang, H. Y.; Nam, W.; de Visser, S. P. Chem Commun (Camb) 2009, 1562-4.
(54) Pratt, J. M.; Ridd, T. I.; King, L. J. Journal of the Chemical Society-Chemical Communications 1995, 2297-2298.
(55) Chefson, A.; Auclair, K. Mol Biosyst 2006, 2, 462-9.
(56) Spolitak, T.; Dawson, J. H.; Ballou, D. P. J Biol Chem 2005, 280, 20300-9.
(57) Miller, R. E.; Guengerich, F. P. Biochemistry 1982, 21, 1090-1097.
(58) Meesters, R. J.; Duisken, M.; Hollender, J. Xenobiotica 2009, 39, 663-71.
(59) Chowdhury, G.; Calcutt, M. W.; Guengerich, F. P. J Biol Chem, 2010, 285, 8031-44.
(60) Smith, J. R. L.; Sleath, P. R. J. Chem. Soc.-Perkin Transac 1983, 2, 621-628.
(61) Rettie, A. E.; Rettenmeier, A. W.; Howald, W. N.; Baillie, T. A. Science 1987, 235, 890-893.

156
(62) Chadwick, R. W.; Chuang, L. T.; Williams, K. Pesticide Biochemistry and Physiology 1975, 5, 575-586.
(63) Hata, S.; Nishino, T.; Katsuki, H.; Aoyama, Y.; Yoshida, Y. Biochem. Biophys. Res. Commun1983, 116, 162-166.
(64) Boyd, D. R.; Sharma, N. D.; Agarwal, R.; Mcmordie, R. A. S.; Bessems, J. G. M.; Vanommen, B.; Vanbladeren, P. J. Chemical Research in Toxicology 1993, 6, 808-812.
(65) Bigi, M. A.; Reed, S. A.; White, M. C. Nat Chem, 2011, 3, 216-22.
(66) Behrouzian, B.; Buist, P. H. Prostaglandins Leukot Essent Fatty Acids 2003, 68, 107-12.
(67) Kim, T. W.; Hwang, J. Y.; Kim, Y. S.; Joo, S. H.; Chang, S. C.; Lee, J. S.; Takatsuto, S.; Kim, S. K. Plant Cell 2005, 17, 2397-2412.
(68) Roberts, S. M.; Wan, P. W. H. Journal of Molecular Catalysis B-Enzymatic 1998, 4, 111-136.
(69) Fraaije, M. W.; Kamerbeek, N. M.; van Berkel, W. J.; Janssen, D. B. FEBS Lett 2002, 518, 43-7.
(70) Tan, L.; Muto, N. Eur J Biochem 1986, 156, 243-50.
(71) Walsh, M. E.; Kyritsis, P.; Eady, N. A. J.; Hill, H. A. O.; Wong, L. L. European Journal of Biochemistry 2000, 267, 5815-5820.
(72) Yanagita, K.; Sagami, I.; Shimizu, T. Archives of Biochemistry and Biophysics 1997, 346, 269-276.
(73) Reed, J. R.; Vanderwel, D.; Choi, S.; Pomonis, J. G.; Reitz, R. C.; Blomquist, G. J. Proc Natl Acad Sci U S A 1994, 91, 10000-4.
(74) Qiu, Y.; Tittiger, C.; Wicker-Thomas, C.; Le Goff, G.; Young, S.; Wajnberg, E.; Fricaux, T.; Taquet, N.; Blomquist, G. J.; Feyereisen, R. Proc Natl Acad Sci U S A, 109, 14858-63.
(75) Schirmer, A.; Rude, M. A.; Li, X.; Popova, E.; del Cardayre, S. B. Science
2010, 329, 559-62.
(76) Warui, D. M.; Li, N.; Norgaard, H.; Krebs, C.; Bollinger, J. M., Jr.; Booker, S. J. J Am Chem Soc, 2011, 133, 3316-9.
(77) Das, D.; Eser, B. E.; Han, J.; Sciore, A.; Marsh, E. N. Angew Chem Int Ed Engl, 2011, 50, 7148-52.
(78) Ahmet Altun, S. S. a. W. T. J.A.C.S. 2007, 129, 8978-8987.
(79) Davydov, R.; Macdonald, I. D. G.; Makris, T. M.; Sligar, S. G.; Hoffman, B. M. J. Am. Chem. Soc.1999, 121, 10654-10655.
157
(80) Poulos, T. L.; Finzel, B. C.; Howard, A. J. J Mol Biol 1987, 195, 687-700.
(81) Ravichandran, K. G.; Boddupalli, S. S.; Hasermann, C. A.; Peterson, J. A.; Deisenhofer, J. Science 1993, 261, 731-6.
(82) Hasemann, C. A.; Ravichandran, K. G.; Peterson, J. A.; Deisenhofer, J. J Mol Biol 1994, 236, 1169-85.
(83) Cupp-Vickery, J. R.; Li, H.; Poulos, T. L. Proteins 1994, 20, 197-201.
(84) DeVore, N. M.; Scott, E. E. Nature, 2012, 482, 116-9.
(85) Wester, M. R.; Yano, J. K.; Schoch, G. A.; Yang, C.; Griffin, K. J.; Stout, C. D.; Johnson, E. F. J Biol Chem 2004, 279, 35630-7.
(86) Aldag, C.; Gromov, I. A.; Garcia-Rubio, I.; von Koenig, K.; Schlichting, I.; Jaun, B.; Hilvert, D. Proc Natl Acad Sci U S A 2009, 106, 5481-6.
(87) Sakurai, K.; Shimada, H.; Hayashi, T.; Tsukihara, T. Acta Crystallogr Sect F Struct Biol Cryst Commun 2009, 65, 80-3.
(88) Wade, R. C.; Winn, P. J.; Schlichting, I.; Sudarko J Inorg Biochem 2004, 98, 1175-82.
(89) Raag, R.; Poulos, T. L. Biochemistry 1989, 28, 917-22.
(90) Di Primo, C.; Hui Bon Hoa, G.; Douzou, P.; Sligar, S. Eur J Biochem 1990, 193, 383-6.
(91) Di Primo, C.; Hui Bon Hoa, G.; Douzou, P.; Sligar, S. J Biol Chem 1990, 265, 5361-3.
(92) Harris, D. L.; Loew, G. H. J Am Chem Soc 1994, 116, 11671-4.
(93) Munro, A. W.; Leys, D. G.; McLean, K. J.; Marshall, K. R.; Ost, T. W.; Daff, S.; Miles, C. S.; Chapman, S. K.; Lysek, D. A.; Moser, C. C.; Page, C. C.; Dutton, P. L. Trends Biochem Sci 2002, 27, 250-7.
(94) Efimov, I.; Badyal, S. K.; Metcalfe, C. L.; Macdonald, I.; Gumiero, A.; Raven, E. L.; Moody, P. C. J Am Chem Soc, 2011, 133, 15376-83.
(95) Morozov, A. N.; D'Cunha, C.; Alvarez, C. A.; Chatfield, D. C. Biophys J, 2011, 100, 1066-75.
(96) Raag, R.; Poulos, T. L. Biochemistry 1989, 28, 7586-92.
(97) Raag, R.; Martinis, S. A.; Sligar, S. G.; Poulos, T. L. Biochemistry 1991, 30, 11420-9.
(98) Imai, M.; Shimada, H.; Watanabe, Y.; Matsushima-Hibiya, Y.; Makino, R.; Koga, H.; Horiuchi, T.; Ishimura, Y. Proc Natl Acad Sci U S A 1989, 86, 7823-7.

158
(99) Jin, S.; Makris, T. M.; Bryson, T. A.; Sligar, S. G.; Dawson, J. H. J Am Chem Soc 2003, 125, 3406-7.
(100) Meharenna, Y. T.; Li, H.; Hawkes, D. B.; Pearson, A. G.; De Voss, J.; Poulos, T. L. Biochemistry 2004, 43, 9487-94.
(101) Galinato, M. G.; Spolitak, T.; Ballou, D. P.; Lehnert, N. Biochemistry, 2011, 50, 1053-69.
(102) Yoshioka, S.; Takahashi, S.; Hori, H.; Ishimori, K.; Morishima, I. Eur J Biochem 2001, 268, 252-9.
(103) Davydov, R.; Makris, T. M.; Kofman, V.; Werst, D. E.; Sligar, S. G.; Hoffman, B. M. J. Am. Chem. Soc.2001, 123, 1403-1415.
(104) Dietrich, M.; Do, T. A.; Schmid, R. D.; Pleiss, J.; Urlacher, V. B. J Biotechnol 2009, 139, 115-7.
(105) Speight, R. E.; Hancock, F. E.; Winkel, C.; Bevinakatti, H. S.; Sarkar, M.; Flitsch, S. L.; Turner, N. J. Tetrahedron-Asymmetry 2004, 15, 2829-2831.
(106) Bell, S. G.; Stevenson, J. A.; Boyd, H. D.; Campbell, S.; Riddle, A. D.; Orton, E. L.; Wong, L. L. Chemical Communications 2002, 490-491.
(107) Bell, S. G.; Orton, E.; Boyd, H.; Stevenson, J. A.; Riddle, A.; Campbell, S.; Wong, L. L. Dalton Transactions 2003, 2133-2140.
(108) Wong, T. S.; Wu, N.; Roccatano, D.; Zacharias, M.; Schwaneberg, U. Journal of Biomolecular Screening 2005, 10, 246-252.
(109) Stevenson, J. A.; Bearpark, J. K.; Wong, L. L. New Journal of Chemistry 1998, 22, 551-552.
(110) Dunn, A. R.; Dmochowski, I. J.; Bilwes, A. M.; Gray, H. B.; Crane, B. R. Proc Natl Acad Sci U S A 2001, 98, 12420-5.
(111) Harford-Cross, C. F.; Carmichael, A. B.; Allan, F. K.; England, P. A.; Rouch, D. A.; Wong, L. L. Protein Eng 2000, 13, 121-8.
(112) Fowler, S. M.; England, P. A.; Westlake, A. C. G.; Rouch, D. R.; Nickerson, D. P.; Blunt, C.; Braybrook, D.; West, S.; Wong, L. L.; Flitsch, S. L. Journal of the Chemical Society-Chemical Communications 1994, 2761-2762.
(113) Hoffmann, G.; Bonsch, K.; Greiner-Stoffele, T.; Ballschmiter, M. Protein Engineering Design & Selection 2011, 24, 439-446.
(114) Sowden, R. J.; Yasmin, S.; Rees, N. H.; Bell, S. G.; Wong, L. L. Org Biomol Chem 2005, 3, 57-64.
(115) Carpenter, D. O. Int J Occup Med Environ Health 1998, 11, 291-303.
(116) Fetzner, S.; Lingens, F. Microbiol Rev 1994, 58, 641-85.

159
(117) Lee, P. H.; Ong, S. K.; Golchin, J.; Nelson, G. L. Water Res 2001, 35, 3941-9.
(118) Radehaus, P. M.; Schmidt, S. K. Appl Environ Microbiol 1992, 58, 2879-85.
(119) Xu, F.; Bell, S. G.; Rao, Z.; Wong, L. L. Protein Engineering Design & Selection 2007, 20, 473-480.
(120) England, P. A.; Rouch, D. A.; Westlake, A. C. G.; Bell, S. G.; Nickerson, D. P.; Webberley, M.; Flitsch, S. L.; Wong, L. L. Chemical Communications 1996, 357-358.
(121) Mayhew, M. P.; Roitberg, A. E.; Tewari, Y.; Holden, M. J.; Vanderah, D. J.; Vilker, V. L. New Journal of Chemistry 2002, 26, 35-42.
(122) Xu, F.; Bell, S. G.; Rao, Z.; Wong, L. L. Protein Eng Des Sel 2007, 20, 473-80.
(123) Sen, S.; Manna, S. K.; Mazumdar, S. Indian Journal of Chemistry Section a-Inorganic Bio-Inorganic Physical Theoretical & Analytical Chemistry 2011, 50, 438-446.
(124) Jones, J. P.; O'Hare, E. J.; Wong, L. L. Chemical Communications 2000, 247-248.
(125) Nelson, D.; Werck-Reichhart, D. Plant J, 2011, 66, 194-211.
(126) Mizutani, M.; Ohta, D. Annu Rev Plant Biol, 2010, 61, 291-315.
(127) Saito, S.; Hirai, N.; Matsumoto, C.; Ohigashi, H.; Ohta, D.; Sakata, K.; Mizutani, M. Plant Physiol 2004, 134, 1439-49.
(128) Booker, J.; Sieberer, T.; Wright, W.; Williamson, L.; Willett, B.; Stirnberg, P.; Turnbull, C.; Srinivasan, M.; Goddard, P.; Leyser, O. Dev Cell 2005, 8, 443-9.
(129) Seki, H.; Ohyama, K.; Sawai, S.; Mizutani, M.; Ohnishi, T.; Sudo, H.; Akashi, T.; Aoki, T.; Saito, K.; Muranaka, T. Proc Natl Acad Sci U S A 2008, 105, 14204-9.
(130) Morant, M.; Bak, S.; Moller, B. L.; Werck-Reichhart, D. Curr Opin Biotechnol 2003, 14, 151-62.
(131) Yoshiyama, T.; Namiki, T.; Mita, K.; Kataoka, H.; Niwa, R. Development 2006, 133, 2565-74.
(132) Gilbert, L. I.; Warren, J. T. Vitam Horm 2005, 73, 31-57.
(133) Otey, C. R.; Bandara, G.; Lalonde, J.; Takahashi, K.; Arnold, F. H. Biotechnol Bioeng 2006, 93, 494-9.
(134) Kumar, S.; Scott, E. E.; Liu, H.; Halpert, J. R. J Biol Chem 2003, 278, 17178-84.
(135) Yun, C. H.; Kim, K. H.; Kim, D. H.; Jung, H. C.; Pan, J. G. Trends Biotechnol 2007, 25, 289-98.
(136) Park, S. H.; Kim, D. H.; Kim, D.; Jung, H. C.; Pan, J. G.; Ahn, T.; Yun, C. H. Drug Metab Dispos, 38, 732-9.

160
(137) Chefson, A.; Zhao, J.; Auclair, K. Chembiochem 2006, 7, 916-919.
(138) van der Donk, W. A.; Zhao, H. Curr Opin Biotechnol 2003, 14, 421-6.
(139) Ryan, J. D.; Fish, R. H.; Clark, D. S. Chembiochem 2008, 9, 2579-82.
(140) O'Reilly, E.; Kohler, V.; Flitsch, S. L.; Turner, N. J. Chem Commun (Camb), 2011, 47, 2490-501.
(141) Faulkner, K. M.; Shet, M. S.; Fisher, C. W.; Estabrook, R. W. Proc Natl Acad Sci U S A 1995, 92, 7705-9.
(142) Cirino, P. C.; Arnold, F. H. Angew Chem Int Ed Engl 2003, 42, 3299-301.
(143) Jensen, K.; Johnston, J. B.; de Montellano, P. R. O.; Moller, B. L. Biotechnology Letters 2012, 34, 239-245.
(144) Jensen, K.; Jensen, P. E.; Moller, B. L. Acs Chemical Biology 2011, 6, 533-539.
(145) O'Reilly, E.; Kohler, V.; Flitsch, S. L.; Turner, N. J. Chemical Communications 2011, 47, 2490-2501.
(146) Cirino, P. C.; Arnold, F. H. Curr Opin Chem Biol 2002, 6, 130-5.
(147) Fasan, R.; Chen, M. M.; Crook, N. C.; Arnold, F. H. Angew Chem Int Ed Engl 2007, 46, 8414-8.
(148) Weber, E.; Seifert, A.; Antonovici, M.; Geinitz, C.; Pleiss, J.; Urlacher, V. B. Chem Commun (Camb), 2011, 47, 944-6.
(149) Carmichael, A. B.; Wong, L. L. Eur J Biochem 2001, 268, 3117-25.
(150) Misawa, N.; Nodate, M.; Otomatsu, T.; Shimizu, K.; Kaido, C.; Kikuta, M.; Ideno, A.; Ikenaga, H.; Ogawa, J.; Shimizu, S.; Shindo, K. Appl Microbiol Biotechnol, 2011, 90, 147-57.
(151) Zhang, K.; El Damaty, S.; Fasan, R. J Am Chem Soc, 2011, 133, 3242-5.
(152) Huang, W. C.; Cullis, P. M.; Raven, E. L.; Roberts, G. C. Metallomics, 2011, 3, 410-6.
(153) Huang, W. C.; Westlake, A. C.; Marechal, J. D.; Joyce, M. G.; Moody, P. C.; Roberts, G. C. J Mol Biol 2007, 373, 633-51.
(154) Urlacher, V. B.; Makhsumkhanov, A.; Schmid, R. D. Appl Microbiol Biotechnol 2006, 70, 53-9.
(155) Alcalde, M.; Farinas, E. T.; Arnold, F. H. J Biomol Screen 2004, 9, 141-6.
(156) Kumar, S.; Sun, L.; Liu, H.; Muralidhara, B. K.; Halpert, J. R. Protein Eng Des Sel 2006, 19, 547-54.
(157) Zhao, J.; Tan, E.; Ferras, J.; Auclair, K. Biotechnol Bioeng 2007, 98, 508-13.

161
(158) Chefson, A.; Auclair, K. Chembiochem 2007, 8, 1189-97.
(159) Tee, K. L.; Roccatano, D.; Stolte, S.; Arning, J.; Bernd, J.; Schwaneberg, U. Green Chemistry 2008, 10, 117-123.
(160) Gunsalus, I. C.; Wagner, G. C. Methods Enzymol 1978, 52, 166-88.
(161) Kim, D.; Heo, Y. S.; de Montellano, P. R. O. Archives of Biochemistry and Biophysics 2008, 474, 150-156.
(162) Hata, S.; Oda, Y.; Nishino, T.; Katsuki, H.; Aoyama, Y.; Yoshida, Y.; Nagai, J. Journal of Biochemistry 1983, 94, 501-510.
(163) Rojubally, A., Hua Cheng, S. , Foreman, C. , Huang, J. , Agnes, G. , Plettner, E. Biocatalysis and Biotransformation 2007, 25, 301-317.
(164) Prasad, B.; Rojubally, A.; Plettner, E. Journal of Chemical Ecology 2011, 37, 657-667.
(165) Davydov, R.; Makris, T. M.; Kofman, V.; Werst, D. E.; Sligar, S. G.; Hoffman, B. M. J. Am. Chem. Soc 2001, 123, 1403-15.
(166) Sligar, S. G.; Gunsalus, I. C. Proc. Natl. Acad. Sci. U S A 1976, 73, 1078-82.
(167) Sono, M.; Roach, M. P.; Coulter, E. D.; Dawson, J. H. Chem. Rev 1996, 96, 2841-2888.
(168) Altun, A.; Shaik, S.; Thiel, W. J. Am. Chem. Soc 2007, 129, 8978-87.
(169) Sibbesen, O.; De Voss, J. J.; Montellano, P. R. J. Biol. Chem 1996, 271, 22462-9.
(170) Auclair, K.; Moenne-Loccoz, P.; Ortiz de Montellano, P. R. J. Am. Chem. Soc 2001, 123, 4877-85.
(171) Lipscomb, J. D.; Sligar, S. G.; Namtvedt, M. J.; Gunsalus, I. C. J. Biol. Chem 1976, 251, 1116-24.
(172) Pochapsky, S. S.; Pochapsky, T. C.; Wei, J. W. Biochemistry 2003, 42, 5649-56.
(173) Makris, T. M.; von Koenig, K.; Schlichting, I.; Sligar, S. G. J Inorg Biochem 2006, 100, 507-18.
(174) Schunemann, V.; Lendzian, F.; Jung, C.; Contzen, J.; Barra, A. L.; Sligar, S. G.; Trautwein, A. X. J. Biol. Chem. 2004, 279, 10919-10930.
(175) Egawa, T.; Shimada, H.; Ishimura, Y. Biochem. Biophys. Res. Commun 1994, 201, 1464-9.
(176) Aggarwal, V. K.; Gultekin, Z.; Grainger, R. S.; Adams, H.; Spargo, P. L. J. Chem. Soc.-Perkin Transac 1 1998, 2771-2781.
(177) O'Keeffe, D. H.; Ebel, R. E.; Peterson, J. A. Methods Enzymol 1978, 52, 151-6.
162
(178) Cryle, M. J.; Stok, J. E.; De Voss, J. J. Aus. J. Chem. 2003, 56, 749-762.
(179) Vrzal, R.; Starha, P.; Dvorak, Z.; Travnicek, Z. J Inorg Biochem 2010, 104, 1130-2.
(180) A.Rojubally Ph.D. Thesis, Simon Fraser University 2007.
(181) Shimada, H.; Nagano, S.; Hori, H.; Ishimura, Y. J. Inorg. Biochem.2001, 83, 255-260.
(182) Gunsalus, I. C.; Sligar, S. G. Biochimie 1976, 58, 143-7.
(183) Guengerich, F. P.; MacDonald, T. L. FASEB J 1990, 4, 2453-9.
(184) Prasad, B.; Lewis, A. R.; Plettner, E. Anal Chem 2011, 83, 231-9.
(185) Shen, H.; Wang, Y. T. Appl. Environ. Microbiol. 1995, 61, 2754-8.
(186) Winfield, M. D.; Groisman, E. A. Appl. Environ. Microbiol. 2003, 69, 3687-94.
(187) Kinoshita, K.; Yang, Y.; Koyama, K.; Takahashi, K.; Nishino, H. Phytomedicine 1999, 6, 73-7.
(188) Munro, A. W.; Lindsay, J. G. Mol Microbiol 1996, 20, 1115-25.
(189) Harada, K.; Sakurai, K.; Ikemura, K.; Ogura, T.; Hirota, S.; Shimada, H.; Hayashi, T. J Am Chem Soc 2008, 130, 432-3.
(190) Dau, H.; Limberg, C.; Reier, T.; Risch, M.; Roggan, S.; Strasser, P. Chemcatchem 2010, 2, 724-761.
(191) Izgorodin, A.; Winther-Jensen, O.; MacFarlane, D. R. Aust. J. Chem. 2012, 65, 638-642.
(192) Zhou, F. L.; Izgorodin, A.; Hocking, R. K.; Spiccia, L.; MacFarlane, D. R. Advanced Energy Materials 2012, 2, 1013-1021.
(193) Prasad, B.; Rojubally, A.; Plettner, E. J Chem Ecol, 2011, 37, 657-67.
(194) Pace, C. N.; Vajdos, F.; Fee, L.; Grimsley, G.; Gray, T. Protein Sci 1995, 4, 2411-23.
(195) Prasad, S.; Mazumdar, S.; Mitra, S. FEBS Lett 2000, 477, 157-60.
(196) Janig, G. R.; Makower, A.; Rabe, H.; Friedrich, J.; Ruckpaul, K. Biomed Biochim Acta 1984, 43, K17-24.
(197) Nickerson, D. P.; Wong, L. L. Protein Eng 1997, 10, 1357-61.
(198) Thompson, A. M.; Reddi, A. R.; Shi, X.; Goldbeck, R. A.; Moenne-Loccoz, P.; Gibney, B. R.; Holman, T. R. Biochemistry 2007, 46, 14629-37.

163
(199) Chaen, S.; Yamamoto, N.; Shirakawa, I.; Sugi, H. Biochim Biophys Acta 2001, 1506, 218-23.
(200) Oshima, R.; Fushinobu, S.; Su, F.; Zhang, L.; Takaya, N.; Shoun, H. J Mol Biol 2004, 342, 207-17.
(201) Truesdale, G. A.; Downing, A. L. Nature 1954, 173, 1236-1236.
(202) Casny, M.; Rehder, D.; Schmidt, H.; Vilter, H.; Conte, V. J Inorg Biochem 2000, 80, 157-60.
(203) Wolak, M.; van Eldik, R. Chemistry 2007, 13, 4873-83.
(204) Boykin, D. W.; Baumstark, A. L. Abstracts of Papers of the American Chemical Society 1991, 201, 172-ORGN.
(205) Cha, Y.; Murray, C. J.; Klinman, J. P. Science 1989, 243, 1325-30.
(206) Huskey, W. P.; Schowen, R. L. J. Am. Chem. Soc.1983, 105, 5704-5706.
(207) Nagel, Z. D.; Klinman, J. P. Chemical Reviews 2006, 106, 3095-3118.
(208) Koppenol, W. H.; Liebman, J. F. J. Phys. Chem. 1984, 88, 99-101.
(209) Green, M. T.; Dawson, J. H.; Gray, H. B. Science 2004, 304, 1653-6.
(210) Hishiki, T.; Shimada, H.; Nagano, S.; Egawa, T.; Kanamori, Y.; Makino, R.; Park, S. Y.; Adachi, S.; Shiro, Y.; Ishimura, Y. J Biochem 2000, 128, 965-74.
(211) Wardman, P. J. Phys. Chem. Ref. Data 1989, 18, 1637-1755.
(212) Castellan, G. W. Physical Chemistry 1983, 3rd Ed., p381.
(213) Steele, W. V. J. Chem. thermodyn 1977, 9, 311-314.
(214) Denisov, I. G.; Baas, B. J.; Grinkova, Y. V.; Sligar, S. G. J Biol Chem 2007, 282, 7066-76.
(215) Woods, C. M.; Fernandez, C.; Kunze, K. L.; Atkins, W. M. Biochemistry, 2011, 50, 10041-51.
(216) Yano, J. K.; Wester, M. R.; Schoch, G. A.; Griffin, K. J.; Stout, C. D.; Johnson, E. F. J Biol Chem 2004, 279, 38091-4.
(217) Amunom, I.; Dieter, L. J.; Tamasi, V.; Cai, J.; Conklin, D. J.; Srivastava, S.; Martin, M. V.; Guengerich, F. P.; Prough, R. A. Chem Res Toxicol, 2011, 24, 1223-30.
(218) Kaspera, R.; Sahele, T.; Lakatos, K.; Totah, R. A. Biochem Biophys Res Commun, 2012, 418, 464-8.
(219) Cooper, H. L.; Groves, J. T. Arch Biochem Biophys, 2011, 507, 111-8.
(220) Hlavica, P.; Lewis, D. F. Eur J Biochem 2001, 268, 4817-32.

164
(221) Song, W. J.; Gucinski, G.; Sazinsky, M. H.; Lippard, S. J. Proc Natl Acad Sci U S A, 2011, 108, 14795-800.
(222) Kallio, J. P.; Rouvinen, J.; Kruus, K.; Hakulinen, N. Biochemistry, 2011, 50, 4396-8.
(223) Johnson, B. J.; Cohen, J.; Welford, R. W.; Pearson, A. R.; Schulten, K.; Klinman, J. P.; Wilmot, C. M. J Biol Chem 2007, 282, 17767-76.
(224) Petrek, M.; Kosinova, P.; Koca, J.; Otyepka, M. Structure 2007, 15, 1357-63.
(225) Taylor, D. G.; Trudgill, P. W. J Bacteriol 1986, 165, 489-97.
(226) Balayiannis, G. P.; Anastassiadis, M.; Anagnostopoulos, H. Bull Environ Contam Toxicol 2009, 83(6), 780-782.
(227) Bajaj, A.; Pathak, A.; Mudiam, M. R.; Mayilraj, S.; Manickam, N. J Appl Microbiol 2010, 109, 2135-43.
(228) Sutherland, T. D.; Weir, K. M.; Lacey, M. J.; Horne, I.; Russell, R. J.; Oakeshott, J. G. J Appl Microbiol 2002, 92, 541-8.
(229) Shivaramaiah, H. M.; Sanchez-Bayo, F.; Al-Rifai, J.; Kennedy, I. R. J Environ Sci Health B 2005, 40, 711-20.
(230) Paul, V.; Balasubramaniam, E.; Kazi, M. Eur J Pharmacol 1994, 270, 1-7.
(231) Palma, P.; Palma, V. L.; Matos, C.; Fernandes, R. M.; Bohn, A.; Soares, A. M.; Barbosa, I. R. Chemosphere 2009, 74, 676-81.
(232) Liu, D.; Thomson, K.; Strachan, W. M. Bull Environ Contam Toxicol 1981, 27, 412-7.
(233) Nigg, H. N.; Reinert, J. A.; Stamper, J. H.; Fitzpatrick, G. E. Bull Environ Contam Toxicol 1981, 26, 267-72.
(234) Palma, P.; Palma, V. L.; Fernandes, R. M.; Soares, A. M.; Barbosa, I. R. Ecotoxicol Environ Saf 2009, 72, 344-50.
(235) Kwon, G. S.; Sohn, H. Y.; Shin, K. S.; Kim, E.; Seo, B. I. Appl Microbiol Biotechnol 2005, 67, 845-50.
(236) Stanley, K. A.; Curtis, L. R.; Simonich, S. L.; Tanguay, R. L. Aquat Toxicol 2009, 95, 355-61.
(237) Mukherjee, I.; Mittal, A. Bull Environ Contam Toxicol 2005, 75, 1034-40.
(238) Siddique, T.; Okeke, B. C.; Arshad, M.; Frankenberger, W. T., Jr. J Environ Qual 2003, 32, 47-54.
(239) Kumar, M.; Philip, L. J Environ Sci Health B 2006, 41, 81-96.

165
(240) Sutherland, T. D.; Horne, I.; Russell, R. J.; Oakeshott, J. G. Appl Environ Microbiol 2002, 68, 6237-45.
(241) Awasthi, N.; Manickam, N.; Kumar, A. Bull Environ Contam Toxicol 1997, 59, 928-34.
(242) Kullman, S. W.; Matsumura, F. Appl Environ Microbiol 1996, 62, 593-600.
(243) Weber, J.; Halsall, C. J.; Muir, D.; Teixeira, C.; Small, J.; Solomon, K.; Hermanson, M.; Hung, H.; Bidleman, T. Sci Total Environ 2010, 408(15), 2966-84
(244) Chefson, A.; Auclair, K. Molecular Biosystems 2006, 2, 462-469.
(245) Bell, S. G.; Chen, X.; Sowden, R. J.; Xu, F.; Williams, J. N.; Wong, L. L.; Rao, Z. J Am Chem Soc 2003, 125, 705-14.
(246) Wong, T. S.; Roccatano, D.; Zacharias, M.; Schwaneberg, U. J Mol Biol 2006, 355, 858-71.
(247) Arnold, F. H.; Wintrode, P. L.; Miyazaki, K.; Gershenson, A. Trends Biochem Sci 2001, 26, 100-6.
(248) Wong, T. S.; Zhurina, D.; Schwaneberg, U. Comb Chem High Throughput Screen 2006, 9, 271-88.
(249) Cirino, P. C.; Mayer, K. M.; Umeno, D. Methods Mol Biol 2003, 231, 3-9.
(250) Kanagawa, T. J Biosci Bioeng 2003, 96, 317-23.
(251) Wong, T. S.; Roccatano, D.; Loakes, D.; Tee, K. L.; Schenk, A.; Hauer, B.; Schwaneberg, U. Biotechnol J 2008, 3, 74-82.
(252) Wong, T. S.; Tee, K. L.; Hauer, B.; Schwaneberg, U. Nucleic Acids Res 2004, 32, e26.
(253) Wong, T. S.; Tee, K. L.; Hauer, B.; Schwaneberg, U. Anal Biochem 2005, 341, 187-9.
(254) Mundhada, H. Ph. D. dissertation, Jacobs University, Bremen 2011.
(255) Mundhada, H.; Marienhagen, J.; Scacioc, A.; Schenk, A.; Roccatano, D.; Schwaneberg, U. Chembiochem, 2011, 12, 1595-601.
(256) Alcalde, M.; Farinas, E. T.; Arnold, F. H. J Biomol Screen 2004, 9, 141-6.
(257) Gillam, E. M.; Notley, L. M.; Cai, H.; De Voss, J. J.; Guengerich, F. P. Biochemistry 2000, 39, 13817-24.
(258) Inoue, H.; Nojima, H.; Okayama, H. Gene 1990, 96, 23-8.
(259) Miyazaki, K. Methods Mol Biol 2003, 231, 23-8.
(260) Derosa, M.; Alonso, J. L. T. Journal of Organic Chemistry 1978, 43, 2639-2643.

166
(261) Hamaue, N.; Yamazaki, N.; Minami, M.; Endo, T.; Hirahuji, M.; Monma, Y.; Togashi, H. Gen Pharmacol 1998, 30, 387-91.
(262) Chakrabarty, A. M.; Mylroie, J. R.; Friello, D. A.; Vacca, J. G. Proc Natl Acad Sci U S A 1975, 72, 3647-51.
(263) Yu, C.; Gunsalus, I. C. Biochem Biophys Res Commun 1970, 40, 1431-6.
(264) Chen, X.; Christopher, A.; Jones, J. P.; Bell, S. G.; Guo, Q.; Xu, F.; Rao, Z.; Wong, L. L. J Biol Chem 2002, 277, 37519-26.
(265) Guengerich, F. P. Arch Biochem Biophys 2003, 409, 59-71.
(266) Manna, S. K.; Mazumdar, S. Dalton Trans, 2010, 39, 3115-23.
(267) Wu, Z. L.; Podust, L. M.; Guengerich, F. P. J Biol Chem 2005, 280, 41090-100.
(268) Chowdhury, G.; Dostalek, M.; Hsu, E. L.; Nguyen, L. P.; Stec, D. F.; Bradfield, C. A.; Guengerich, F. P. Chem Res Toxicol 2009, 22, 1905-12.
(269) Nakamura, K.; Martin, M. V.; Guengerich, F. P. Arch Biochem Biophys 2001, 395, 25-31.
(270) Lai, W.; Chen, H.; Cohen, S.; Shaik, S. J. Phys. Chem. Letters 2011, 2, 2229-2235.
(271) Li, S.; Wackett, L. P. Biochemistry 1993, 32, 9355-61.
(272) Amin, A. E.; Abdalla, G. A. Vet Hum Toxicol 1995, 37, 113-6.
(273) Arshad, M.; Hussain, S.; Saleem, M. J Appl Microbiol 2008, 104, 364-70.
(274) Ballesteros, M. L.; Durando, P. E.; Nores, M. L.; Diaz, M. P.; Bistoni, M. A.; Wunderlin, D. A. Environ Pollut 2009, 157, 1573-80.
(275) Egawa, T.; Shimada, H.; Ishimura, Y. Biochem. Biophys. Res. Commun1994, 201, 1464-1469.
(276) Gelb, M. H.; Heimbrook, D. C.; Malkonen, P.; Sligar, S. G. Biochemistry 1982, 21, 370-377.
(277) V. Schunemann, F. L., C. Jung, J. Contzen, A. Laure Barra, S.G. Sligar, A. X. Trautwein J. Biol. Chem. 2004, 279, 10919-10930
(278) Park, S. Y.; Yamane, K.; Adachi, S.; Shiro, Y.; Weiss, K. E.; Sligar, S. G. Acta Crystallogr D Biol Crystallogr 2000, 56, 1173-5.
(279) Koppenol, W. H. J Am Chem Soc 2007, 129, 9686-90.
Copyright © 2022 FDOKUMEN