Building resilience to natural disasters in our states and ...
120
Building resilience to natural disasters in our states and territories
-
Upload
khangminh22 -
Category
Documents
-
view
0 -
download
0
Transcript of Building resilience to natural disasters in our states and ...
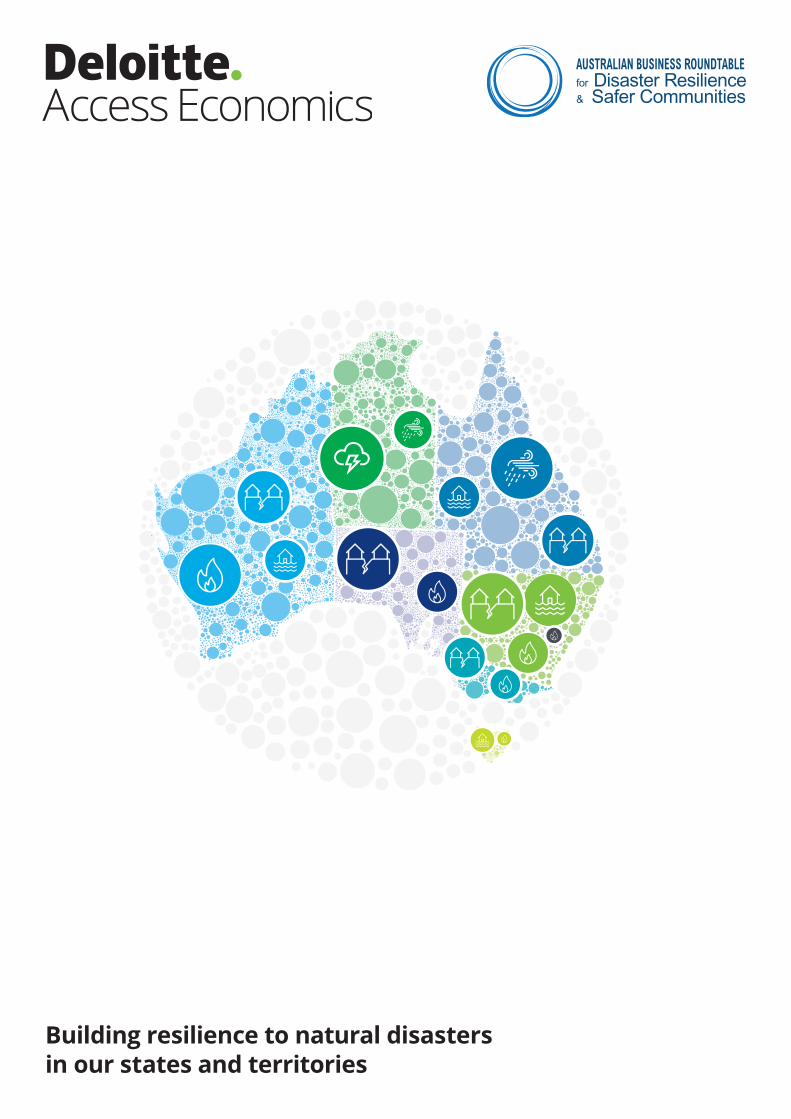
Building resilience to natural disasters in our states and territories
i
About the Australian Business Roundtable for Disaster Resilience & Safer Communities
An unprecedented number of floods, storms and bushfires across Australia in recent years has devastated life and property. Since forming in 2012, the Australian Business Roundtable for Disaster Resilience & Safer Communities (the Roundtable) has been working to build a country better equipped to handle Australia’s extreme weather events.
The Roundtable was formed by the chief executive officers (CEOs) of Australian Red Cross, Insurance Australia Group (IAG), Investa Property Group, Munich Re, Optus and Westpac Group. The current CEOs – who are, respectively, Ms Judy Slatyer, Mr Peter Harmer, Mr Jonathan Callaghan, Mr Ralph Ronnenberg, Mr Paul O’Sullivan and Mr Brian Hartzer – are each committed to continuing the Roundtable’s work.
In 2011, the Australian Governments, National Strategy for Disaster Resilience called for greater collaboration between governments, businesses and communities to reduce Australia’s vulnerability to natural disasters. In response, the Roundtable commissioned Deloitte Access Economics to write its first ground-breaking research report Building our Nation’s Resilience to Natural Disasters, released in 2013.
Five reports now exist, building on that original intent. Building an Open Platform for Natural Disaster Resilience Decisions (2014), showed how an open source platform containing crucial data would lead to better decisions and reduced exposure to natural disasters.
Building Resilient Infrastructure (2016) looked at how resilience could be better integrated into decision-making for new infrastructure. The Economic Cost of the Social Impact of Natural Disasters (2016) looked at how natural disasters impact mental health, domestic violence and other social issues. It developed, for the first time, a comprehensive estimate of the total economic cost of natural disasters in Australia.
This report builds on the previous four by assessing the resilience of our states and territories to natural disasters. It examines the distinct circumstances that face the states and territories, the role of each state and territory government and how resilience can be collectively built by more effective collaboration between government, business and community groups.

iiCover image: Risk types most affecting state populations, estimates from ICA (iLEAD), SGS Economics and ABS data (Appendix C).
Above: Victorian bushfires, 2009 (Australian Red Cross)
iii
CEO statement
All Australians have a role in ensuring we are optimally prepared for natural disasters, led by all levels of government in collaboration with communities, businesses and the not-for-profit sector. This is a national challenge that requires everyone to develop and deliver solutions.
State, territory and local governments are central in addressing this national challenge. Recognising this, our most recent report, Building Resilience to Natural Disasters in our States and Territories, drills down into how each state and territory is currently managing natural disaster risks and, specifically, how they are collaborating with community groups, businesses and other jurisdictions to address these risks.
This report finds that the total economic cost of natural disasters is growing and will reach $39 billion per year by 2050. These costs include significant, and often long-term, social impacts, including death and injury and impacts on employment, education, community networks, health and wellbeing. More than nine million Australians have been impacted by a natural disaster or extreme weather event in the past 30 years. The number of people affected annually is expected to grow as the intensity and, in some areas, the frequency, of events increases.
Each state and territory faces different natural hazards which impacts the total cost of natural disasters in each jurisdiction as well as which tools will best build and foster resilience.
Without mitigating action, the total cost of natural disasters in each state is expected to increase by more than 2.5 times between now and 2050, after adjusting for inflation. As previous reports from the Roundtable showed, targeted investments in physical (such as infrastructure) and community (such as preparedness programs) resilience measures are predicted to significantly lessen this increase in costs.
In addition to reducing the impact of disasters, building resilience delivers additional social and economic benefits. These include jobs, new skills, investment, higher business and community confidence and consumer benefits arising from lower insurance premiums, for example. Meanwhile, community resilience programs strengthen bonds between communities and neighbourhoods long term.
State and territory governments are responsible for crucial aspects of disaster resilience including emergency management, environmental protection, land use planning, developing regulations and health and education. They also have direct relationships with local governments who identify and manage risks within communities. Each Roundtable member organisation has worked directly with communities impacted by natural disasters. Each brings unique insight and expertise to the Roundtable’s shared view that collaboration across governments, together with the business and community sectors, is needed to develop and deliver the best resilience solutions.

iv
Judy SlatyerCEOAustralian Red Cross
Ralph RonnenbergManaging DirectorMunich Holdings of Australasia Pty Ltd
Peter HarmerManaging Director and CEOIAG
Paul O’SullivanChairmanOptus
Jonathan CallaghanCEOInvesta Property Group
Brian HartzerManaging Director and CEOWestpac Group
The Roundtable re-asserts the recommendations of its previous reports that more investment is needed in pre-disaster resilience measures to lessen recovery costs.
This report provides more detail about where disaster impacts are being felt and identifies the changes required beyond funding. Policy settings and frameworks are equally important. For example:
• Natural disaster risks should be considered for new land releases, infrastructure and developments in growing population centres
• Recognised risks should be mitigated early in planning phases
• Roads, bridges and other critical infrastructure should be built or repaired to withstand natural disaster risks
• Governments should embed disaster resilience as an essential component of their responsibilities to citizens.
It is also vital that funding is directed towards the projects and communities where it will have the most impact.
As such, the Roundtable is calling on governments to work with us to co-design a way to prioritise and assess the most effective resilience projects and locations.
Roundtable members are united in their commitment to work with governments to find solutions to build more resilient communities and a safer Australia.
Building resilience to natural disasters in our states and territories | November 2017
v
Contents
Glossary 1
Executive summary 7
1 Introduction 12
1.1 Structure of this report 13
2 The cost of natural disasters in our states and territories 16
2.1 Quantifying natural disaster costs 16
2.2 Total economic cost of natural disasters in Australia 19
2.3 Total economic cost by state and territory 23
2.4 Recovery costs to government 26
2.5 Implications 28
3 The case for building resilience 30
3.1 The case for building resilience 30
3.2 The double dividend of building resilience 30
3.3 Physical measures – Building resilient infrastructure 31
3.4 Community measures – Building resilient communities 41
3.5 Embedding resilience in decision-making 45
4 The role of the states in building disaster resilience 48
4.1 State roles and responsibilities for disaster resilience 48
4.2 Infrastructure 51
4.3 Land use planning 52
4.4 Building controls 53
4.5 Emergency management 53
4.6 Data collection and provision 54
4.7 Community awareness 56
vi
5 Lessons from state and territory government initiatives 58
5.1 Overview of resilience in the states and territories 58
5.2 Governance arrangements 59
5.3 Funding for disaster resilience 61
5.4 Collaboration with local government and the private sector 62
5.5 Common barriers in building resilience 66
5.6 State disaster context and key arrangements 66
5.7 Queensland 68
5.8 New South Wales 72
5.9 Victoria 76
5.10 Western Australia 80
5.11 South Australia 84
5.12 Northern Territory 86
5.13 Tasmania 90
5.14 Australian Capital Territory 94
6 Recommendations 96
References 99
Appendix A: The long-term social impacts of natural disasters 103
Appendix B: Methodology for estimating total economic costs 105
Appendix C: Population at risk of natural disasters 108
Appendix D: Resilience funding by state 111
Limitation of our work 112
Building resilience to natural disasters in our states and territories | November 2017
1
AdaptationThe adjustment in natural or human systems in response to actual or expected climatic stimuli or their effects, which moderates harm or exploits beneficial opportunities (The United Nations Office for Disaster Risk Reduction, 2016).
Affected personsPeople requiring immediate assistance during an emergency, i.e. requiring basic survival needs such as food, water, shelter, sanitation and immediate medical assistance. Total affected persons is the sum of injured, homeless and affected persons (EM-DAT International Disaster Database).
Average annual damage (AAD)Each flood causes a different amount of flood damage to a flood prone area. AAD is the average damage per year that would occur in a nominated development situation from flooding over a very long period of time.
Direct tangible costsThose incurred as a result of the hazard event and have a market value such as damage to properties, infrastructure, vehicles and crops (Bureau of Transport Economics, 2001).
Disaster risk reductionThe practice of reducing disaster risks through systematic efforts to analyse and manage the causal factors, including initiatives to reduce exposure to hazards and the vulnerability of people and property, judiciously manage land and the environment, and improve preparedness (United Nations, 2009).
Discount rateApplied in cost-benefit analysis to reflect that a dollar received in the future is worth less than a dollar today. Present values allow for decisions to be made in the present about initiatives that have costs and benefits in the future.
In this report, a real discount rate of 7% is used in line with Australian Treasury recommendations.
Glossary
Double DividendAn investment which can provide two types of benefits. In the context of resilience, investment may reduce costs of a natural disaster, as well as improve economic growth and wellbeing through a number of co-benefits that occur even in the absence of a disaster.
Economic costThere are varying definitions however this report defines total economic cost as including (direct and indirect) tangible and intangible costs.
Foundational dataBase layers of locational information used to assess natural disaster risk, among other purposes. This encompasses exposure data (assets at risk, population and community demographics) and, geographic data (geological, topographic and weather information).
Hazard dataHazard-specific information on the risks of different disaster types, providing contextual data about the history of events and the risk profile for locations.
Impact dataData on the potential and actual impacts associated with natural disasters, including information on historical costs and damage, and current and predicted future value at risk.
Intangible costsCaptures direct and indirect damages that cannot be easily priced such as death and injury, on health and wellbeing impacts and community connectedness. Intangible costs include the opportunity cost of the next best alternative use of the resource that is foregone. For instance, if time is spent in hospital due to injury caused by a natural disaster, the opportunity cost could include lost wages.
2
MitigationMeasures taken before a disaster aimed at decreasing or eliminating its impact on society and the environment (COAG, 2011). For climate change, mitigation refers to actions to address the causes, usually involving actions to reduce anthropogenic emissions of greenhouse gases that contribute to the warming of the atmosphere. This is not the definition of mitigation used in this report.
Natural disastersNaturally occurring rapid onset events that cause a serious disruption to a community or region (Productivity Commission, 2014).
In this report, natural disasters include bushfires, cyclones, earthquakes, floods, severe thunderstorms or storm surges and hail. While outside the scope of the analysis, heatwaves are also considered as for many states they are a key consideration in disaster risk reduction planning.
PreparednessA set of actions, knowledge and skills used to reduce the impacts of disasters (Australian Red Cross, 2015).
PreventionTo hinder, deter or mitigate disasters, while maintaining readiness to deal with them (Prosser and Peters, 2010).
RecoveryThe coordinated process of supporting disaster-affected communities to rebuild physical infrastructure and restore emotional, social, economic and physical wellbeing (Emergency Management Australia, 2015).
ResilienceThe ability of a system, community or society exposed to hazards to resist, absorb, adjust to and recover from their effects in a timely and efficient manner, including initiatives to preserve and restore essential structures and functions (United Nations, 2009).
This paper focuses on resilience that deals with ‘resisting’ or actions taken before a disaster to reduce its impact.
ResponseTo respond rapidly and decisively to a disaster and manage its immediate consequences (Prosser and Peters, 2010).
Social capitalSocial networks together with shared norms, values and understandings that facilitate cooperation within or among groups (Organisation of Economic Co-operation and Development, 2007).
Social impactThe effect of natural disasters impact people's health and wellbeing of individuals and families, and/or the effect on the social fabric of affected communities.
Building resilience to natural disasters in our states and territories | November 2017
3
AAD Annual average damage
ABCB Australian Building Codes Board
ABS Australian Bureau of Statistics
ACT Australian Capital Territory
AEP Annual exceedance probability
ANZEMCAustralia-New Zealand Emergency Management Committee
BAL Bushfire attack level
BCR Benefit cost ratio
BNHCRCBushfire and Natural Hazards Cooperative Research Centre
BOM Bureau of Meteorology
CBA Cost-benefit analysis
CBD Central business district
CEO Chief Executive Officer
CFA Country Fire Authority
COAG Council of Australian Governments
COP Common operating picture
CPP Community Protection Planning
Acronyms
CRC Cooperative Research Centres
CRIP Community Resilience Innovation Program
CSIROCommonwealth Scientific and Industrial Research Organisation
DAE Deloitte Access Economics
DTCM Deemed to comply manual
DRR Disaster risk reduction
ELVA Emotional literacy through visual arts
ESA Emergency Services Agency
GDP Gross domestic product
GSP Gross state product
IAG Insurance Australia Group
IPPC Intergovernmental Panel on Climate Change
LCCSC Law, Crime and Community Safety Council
LGA Local Government Area
MSC Mitigation standing committee
NDRP Natural Disaster Resilience Program
NDRRANatural Disaster Relief and Recovery Arrangements
4
NERAGNational Emergency Risks Assessment Guidelines
NSDR National Strategy for Disaster Resilience
NPA National Partnership Agreement
NPV Net present value
NSW New South Wales
NT Northern Territory
OECDOrganisation of Economic Co-operation and development
OEM Office of Emergency Management
PC Productivity Commission
PIA Planning Institute of Australia
PV Present value
QAO Queensland Audit Office
QLD Queensland
QRA Queensland Reconstruction Authority
RCCF Regional capability community fund
RFS Rural Fire Service
SA South Australia
SEMC State Emergency Management Committees
SEMCCSecurity and Emergency Management Committee of Cabinet
SEMSOGSecurity and Emergency Management Officials Group
SES State Emergency Services
SPOT Single point of truth
SPP State Planning Policy
TAS Tasmania
TISN Trusted information sharing network
TSNDRATasmanian state natural disaster risk assessment
UN United Nations
UNISDRUnited Nations Office for Disaster Risk Reduction
VHP Voluntary house purchase
VIC Victoria
WA Western Australia
Building resilience to natural disasters in our states and territories | November 2017
5
Companion reports
• The Economic Cost of the Social Impact of Natural Disasters (2016) expanded on Building our Nation’s Resilience to Natural Disasters by valuing some of the broader social impacts of natural disasters to better understand the total cost of such disasters in Australia.
The Roundtable’s reports have informed a growing national awareness of the need for resilience measures due to the increasing prevalence and cost of natural disasters.
For example, following the release of Building our Nation’s Resilience to Natural Disasters, the Australian Government asked the Productivity Commission (PC) to undertake a public inquiry into the efficacy of Australia’s natural disaster funding arrangements.
The inquiry’s key recommendations supported those in our 2013 and 2014 reports.
To this end, the Australian Government Public Data Policy Statement released in 2015 commits the Government to specific actions designed to optimise the use and reuse of public data; to release non-sensitive data as open by default; and to collaborate with the private and research sectors to extend the value of public data for the benefit of the Australian public.
The reports also support ongoing progress by the Australian Government in improving infrastructure planning and prioritisation, including in response to the PC inquiry into public infrastructure in 2014.
For example, Infrastructure Australia is now tasked with developing and implementing a national best practice framework to evaluate projects, including “a robust and consistent methodology for cost-benefit analyses for all economic and social infrastructure”.
This report builds on four companion reports commissioned by the Australian Business Roundtable for Disaster Resilience & Safer Communities. In brief:
• Building our Nation’s Resilience to Natural Disasters (2013) reviewed the economics of mitigating disaster risks facing Australian communities. It identified opportunities for greater coordination between governments, businesses and communities in managing pre-disaster resilience, including carefully targeted mitigation investments. The report offered three key recommendations:
– Improve coordination of pre-disaster resilience by appointing a National Resilience Advisor and establishing a Business and Community Advisory Group
– Commit to long-term annual consolidated funding for pre-disaster resilience
– Identify and prioritise pre-disaster investment activities that deliver a positive net impact on future budget outlays.
• Building an Open Platform for Natural Disaster Resilience Decisions (2014) provided an overview of natural disaster data and research in Australia, and reinforced the need for better coordination and transparency of disaster risk and resilience information. The report recommended adopting an approach to drive three outcomes:
– Efficient and open – deliver a national platform for foundational data
– Transparent and available – remove barriers to accessing data and research
– Enabling effective decision-making – establish a prioritisation framework.
• Building Resilient Infrastructure (2016) investigated the decision-making process for new ‘hard’ infrastructure assets in light of disaster risks, including the various Australian and state guidelines for comparing project options through cost-benefit analysis. It built the case for embedding resilience considerations into this process, and offers practical steps to do so.
6
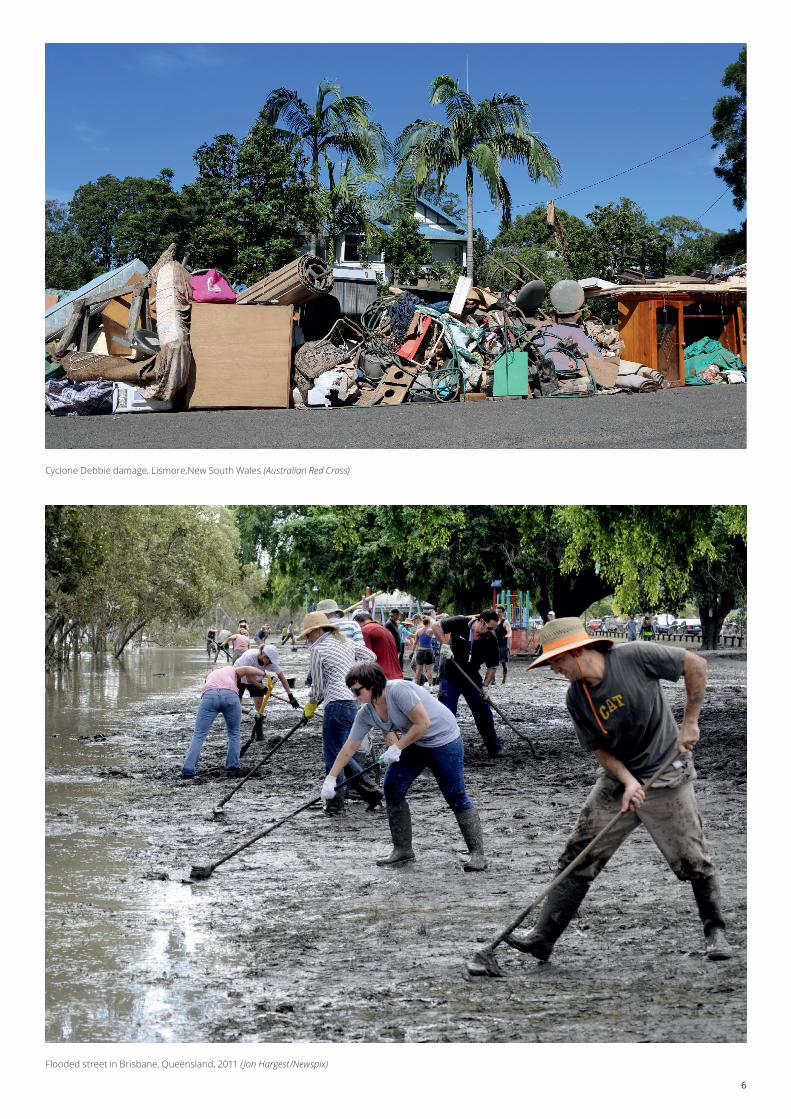
Cyclone Debbie damage, Lismore,New South Wales (Australian Red Cross)
Flooded street in Brisbane, Queensland, 2011 ( Jon Hargest/Newspix)
Building resilience to natural disasters in our states and territories | November 2017
7
Executive summary
Australia is exposed to natural disasters that impact infrastructure, essential services and communities. Over the past 30 years, these disasters have resulted in billions of dollars in tangible costs, as well as intangible costs such as deaths, injuries and impacts on health and wellbeing. More than nine million Australians have been impacted by a natural disaster or extreme weather event in the past 30 years.
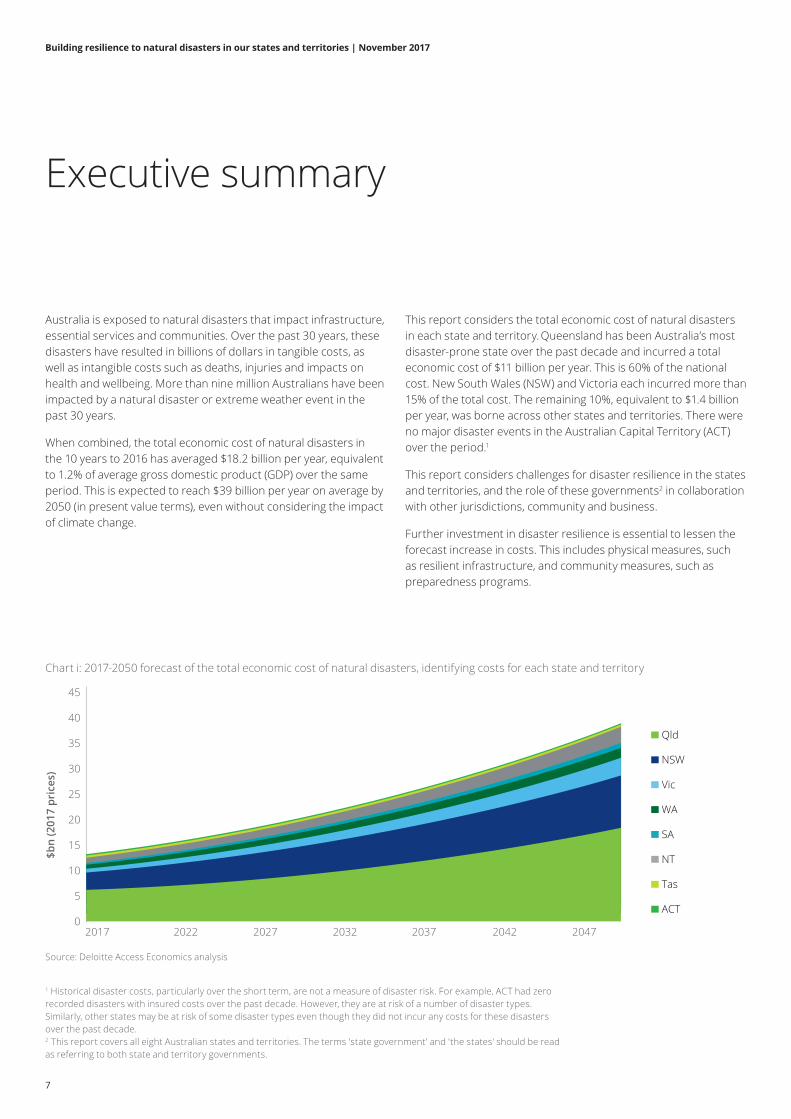
When combined, the total economic cost of natural disasters in the 10 years to 2016 has averaged $18.2 billion per year, equivalent to 1.2% of average gross domestic product (GDP) over the same period. This is expected to reach $39 billion per year on average by 2050 (in present value terms), even without considering the impact of climate change.
This report considers the total economic cost of natural disasters in each state and territory. Queensland has been Australia’s most disaster-prone state over the past decade and incurred a total economic cost of $11 billion per year. This is 60% of the national cost. New South Wales (NSW) and Victoria each incurred more than 15% of the total cost. The remaining 10%, equivalent to $1.4 billion per year, was borne across other states and territories. There were no major disaster events in the Australian Capital Territory (ACT) over the period.1
This report considers challenges for disaster resilience in the states and territories, and the role of these governments2 in collaboration with other jurisdictions, community and business.
Further investment in disaster resilience is essential to lessen the forecast increase in costs. This includes physical measures, such as resilient infrastructure, and community measures, such as preparedness programs.
Chart i: 2017-2050 forecast of the total economic cost of natural disasters, identifying costs for each state and territory
Source: Deloitte Access Economics analysis
1 Historical disaster costs, particularly over the short term, are not a measure of disaster risk. For example, ACT had zero recorded disasters with insured costs over the past decade. However, they are at risk of a number of disaster types. Similarly, other states may be at risk of some disaster types even though they did not incur any costs for these disasters over the past decade. 2 This report covers all eight Australian states and territories. The terms 'state government' and 'the states' should be read as referring to both state and territory governments.
$bn
(201
7 pr
ices
)
Qld
NSW
Vic
WA
SA
NT
Tas
ACT
2017 2022 2027 2032 2037 2042 20470
5
10
15
20
25
30
35
40
45
8
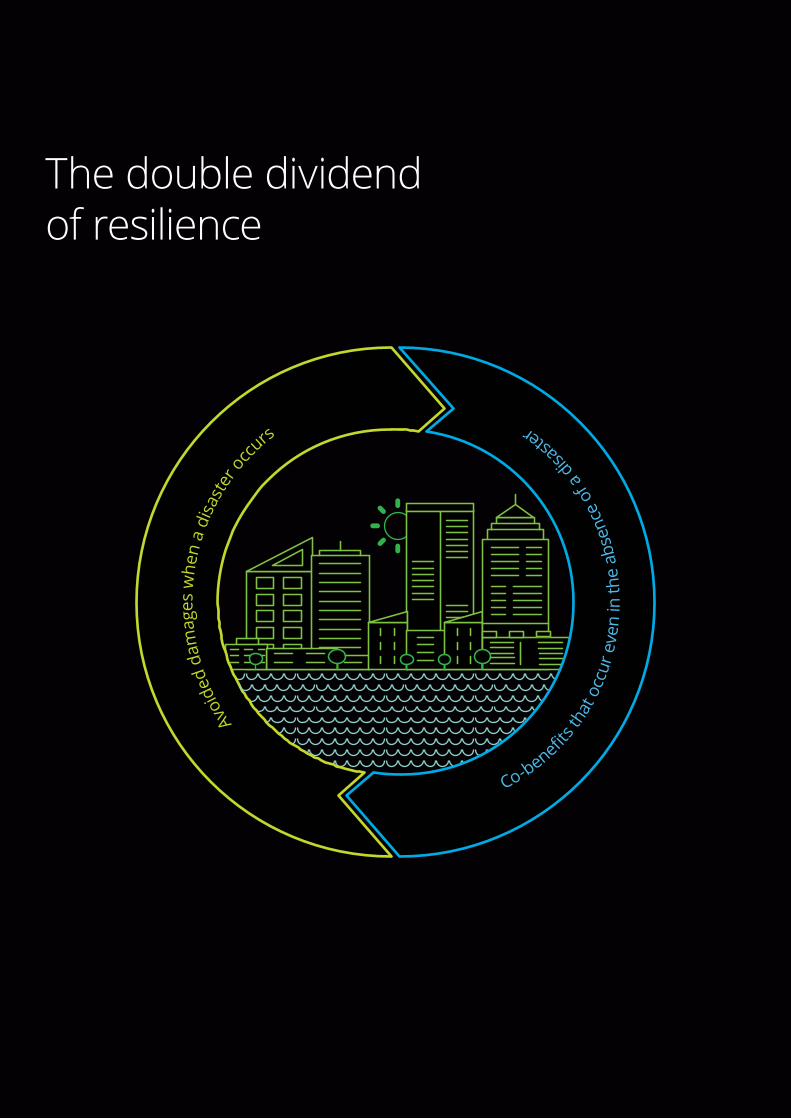
Investment in disaster resilience yields a double dividend. First, in the avoided impacts of disasters when they occur. And second, in the broader co-benefits that arise even in the absence of a disaster.
For infrastructure investments, for example, co-benefits may include employment opportunities, improved service reliability, greater business confidence and incentives for innovation. Such co-benefits support economic growth and social capital in Australian communities.
This double dividend is a crucial part of the business case for well-designed resilience investment. It is also a compelling reason to integrate disaster resilience into investments that may not be specifically targeting risk reduction. Australia is currently investing in infrastructure to service its growing and urbanising population, and these projects could be harnessing the net benefits of the double dividend by integrating resilience into early planning.
State and local governments play a major role in how a community responds to natural disasters. As well as emergency management and disaster recovery, they influence prevention and preparedness through data collection and provision, infrastructure and land use planning, building codes and community initiatives.
This report explores how the states and territories can more effectively drive resilience within their jurisdictions. This includes legislation and planning, physical infrastructure, community measures and partnerships with the private and not-for-profit sector.
Each part of Australia faces different natural disaster risks and socioeconomic circumstances, and thus has a different approach to resilience. This report considers the key levers states use to influence resilience, and profiles best practice policies and programs that could be applied elsewhere.
The report observes common barriers facing state governments when it comes to prioritising resilience, leveraging investment, demonstrating its net benefits and integrating resilience more broadly across portfolios. Our recommendations aim to address some of these barriers.
State and territories are looking to better understand resilience to integrate it across land use planning, building and infrastructure decisions. To this end, each has recently completed state-wide disaster risk assessments to improve baseline information. Reporting against the Sendai Framework indicators will also improve awareness of state and national trends and impacts.
The next challenge for state governments will be using this information to develop coordinated strategies for disaster resilience, including clear responsibilities for each agency involved.
State governments need to work collaboratively with local government, who are responsible for local planning, assets and services. Better collaboration will also help the states to better understand and address local vulnerability. State governments should also leverage private sector and community expertise to drive solutions and create safer communities.
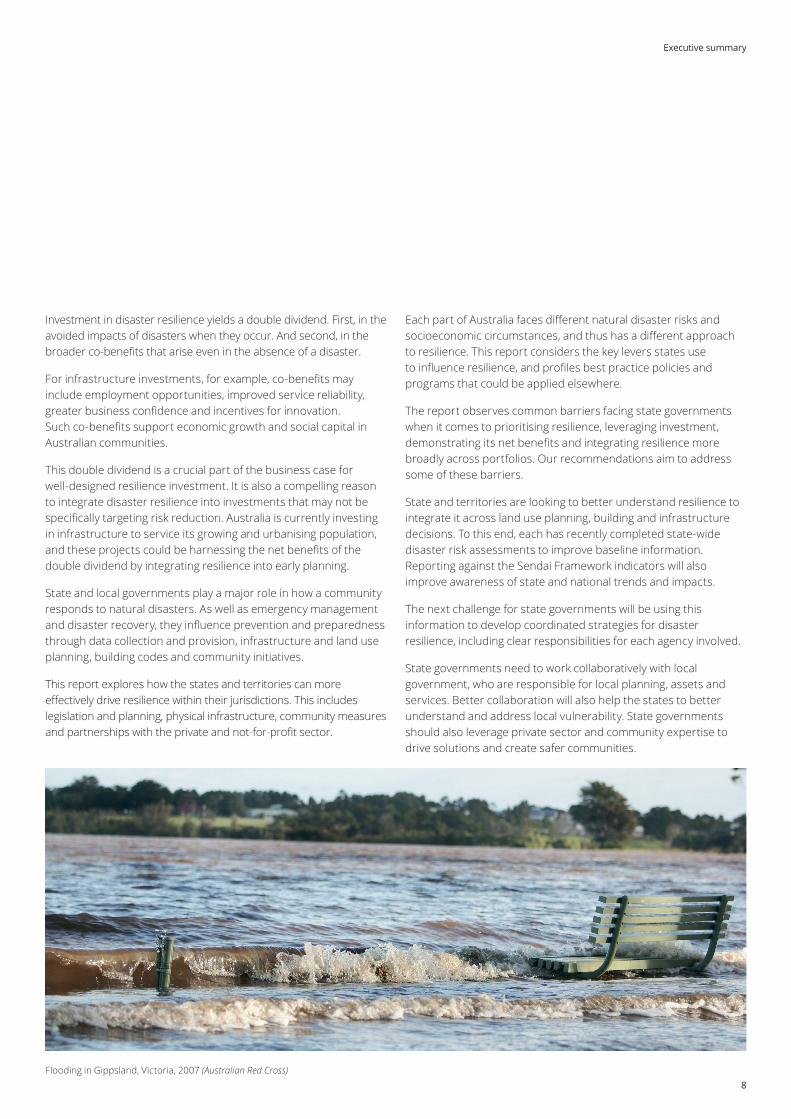
Flooding in Gippsland, Victoria, 2007 (Australian Red Cross)
Executive summary
Building resilience to natural disasters in our states and territories | November 2017
9
2To this end, the report offers four recommendations.
Embed resilience across all aspects of policy and decision-making
By increasing coordination and mainstreaming resilience policy and planning, state governments can mitigate the forecast increase in natural disaster costs.
Disaster resilience is built through a broad set of mitigation measures and policies. States should take the opportunity that exists to mainstream resilience across portfolios beyond emergency management.
Addressing resilience in planning, land use and building controls presents the biggest opportunity to embed resilience. Greater economic benefits result from considering resilience in development phases, rather than retrofitting after natural disasters have occurred.
State, district and local emergency management committees are well placed to drive a collaborative approach. Responsibilities should be clearly outlined by these committees to ensure resilience is integrated and states use all the levers at their disposal to mitigate disaster impacts.
Meanwhile, business and not-for-profit groups should be engaged more directly for input into decision making and the development of resilience policies, including through these committees.
Prioritise resilience investments by considering the broader economic and social benefits that result
Shifting the funding balance from recovery to resilience involves smarter planning and investment. The process of prioritisation should consider an investment's potential to deliver 'co-benefits', including economic growth and community connectedness.
Governments face competing budget priorities and funding constraints, so resilience investment must be prioritised to where it can be most effective.
The Roundtable has previously advocated for cost-benefit analysis to inform resilient investment decisions. This report builds on that by exploring the additional benefits, or double dividend, that can be achieved by resilience investment.
A double dividend includes an investment's 'co-benefits', such as improved business and consumer confidence. Co-benefits are more difficult to measure and, as such, have rarely been adequately factored in to decisions. However, they are crucial to local economies and communities and should be evaluated as such.
The benefits of resilience measures should be considered in full and reviewed on a case-by-case basis so investment can be better prioritised and the value of both physical and community measures can be better communicated.
Funds specifically allocated to resilience remain limited in contrast to recovery costs. Thus, it is crucial to prioritise investments that lessen future disaster costs as well as deliver co-benefits to communities.
1
10
3 Improve understanding of disaster risks and costs to society
Consistent and publicly available data on disaster risks, costs, impacts and on public investment in recovery and resilience would improve awareness and planning.
There has been significant improvement in data for some hazard types in recent years, such as state-wide flood maps in Queensland and NSW, and bushfire mapping in Victoria. However, there are still limitations associated with the availability, consistency and usability of data relevant to natural disaster risks.
Limited comprehensive data is available on disaster events, economic costs, affected people, assets and essential services – despite the requirement for these data to be included in Sendai Framework reporting from 2019.
Government spending on both recovery and resilience is not collated and remains difficult to monitor. Recovery expenditure data at the local, state or federal level is not comprehensive given that only a small share is claimable under the Natural Disaster Relief and Recovery Arrangements. As the Productivity Commission found in 2014, natural disasters have become a growing unfunded liability for governments.
State resilience investment face similar monitoring problems. While there is some funding explicitly for resilience under co-funding arrangements, states invest in resilience outside of these arrangements, which makes it difficult to demonstrate the value-add of these investments and their impact on mitigating future disaster costs.
While the variability and volatility of natural disasters does make fiscal planning difficult, greater visibility around data and expenditure is needed so governments can better manage recovery costs and capitalise on the savings associated with resilience investment.
4 Collaborate and coordinate to build resilience and address the long-term costs of natural disasters
Governments, business, community and not-for-profit groups need to work together to drive resilience and reduce the socioeconomic impacts of natural disasters.
The impacts of natural disasters are felt by individuals, businesses, governments and communities – and across government portfolios. Thus, a cross-sector collaborative process is needed to mitigate the impact of natural disasters.
Leveraging local knowledge can lead to more targeted and better-informed infrastructure and planning decisions, as well as more effective awareness, education and engagement programs Community-driven solutions are already being used to effectively build resilience. These programs tend to be well-aligned to community needs and capabilities which reduces the burden on individual stakeholders.
Engaging business, community and not-for-profit groups in local emergency management resilience planning should be fostered. It drives collective buy-in, innovation, sustained resourcing and accelerates change to ultimately make communities safer.
Deloitte Access Economics
Executive summary
Building resilience to natural disasters in our states and territories | November 2017
11
The double dividend of resilience
Avoi
ded
dam
ages
whe
n a
disa
ster
occu
rs
Co-benef ts t
hat o
ccur
eve
n in
the
abse
nce
of a
dis
aster
12
1 Introduction
Key points • State and territories are at the forefront of natural disaster impacts as they manage emergency response efforts, most public infrastructure and services vulnerable to natural disasters.
• Beyond emergency management, nearly all other state government portfolios also influence resilience to natural disasters through their policies and decision-making.
• Governments face competing budget priorities and funding constraints. Resilience investment needs to be prioritised and efficiently allocated to respond to identifed disaster risks.
• As well as greater investment, this report focuses on the other levers that states and territories can use to drive resilience as part of a whole-of-nation approach.
Australia is vulnerable to natural disasters including cyclones, floods, storms, bushfires and earthquakes. Such disasters are having increased financial and social impacts on individuals, communities and businesses. As well as large upfront recovery costs, natural disasters have long-term impacts on the wellbeing of communities and individuals.
When devastating natural disasters occur, new mitigation measures are often accelerated. Yet efforts remain heavily focussed on post-disaster recovery rather than pre-disaster prevention and preparedness.
In recent years, awareness of disaster risks and impacts has significantly increased and it is recognised that a whole-of-nation approach is needed to build resilience. Yet different parts of Australia are affected in different ways. Each faces its own risk profile and has differing capabilities to withstand, adapt to, or avoid impacts.
State and territory governments3 are on the frontline when natural disasters occur, alongside local government. Beyond the emergency management response, they manage most public infrastructure and deliver the services that are most vulnerable to disasters, such as transport and hospitals, and are responsible for land use planning. State government also shares funding responsibility with the federal government for disaster relief and recovery.
As such, natural disasters can impose major fiscal shocks on state government budgets. Meanwhile, the flow-on effects of disasters for businesses and communities dampen state economies over the medium to longer term.
This report explores how the states and territories can drive resilience within their jurisdictions, including through legislation and planning, physical infrastructure and community measures, and partnerships with the private and not-for-profit sector.
3 Referred to collectively as ‘state governments’ in this report
1 Introduction
Building resilience to natural disasters in our states and territories | November 2017
13
The mechanisms for building resilience differ between each state and territory, as does their motivation to become more resilient. Each faces its own exposure and vulnerability, underpinned by disaster risks, demographics, infrastructure and other local circumstances. Approaches vary, yet there remains a common imperative to reduce exposure to natural disasters. Several opportunities exist to share best practice and drive greater coordination.
In identifying these opportunities, this report explores a better way forward. It reviews the governance and policy mechanisms in each state and showcases measures that have successfully improved disaster awareness, mitigated disaster risk and made communities safer. It also considers a number of common challenges and the role of collaboration with business and local governments to drive greater resilience.
The Roundtable’s previous reports showed that building resilience to natural disasters reduces the future cost of recovery. This report demonstrates the ‘double dividend’, or additional benefits, from investing in disaster resilience.
The first dividend is the avoidance of tangible and intangible damage after disasters occur, including long-term social impacts. The second dividend are the ‘co-benefits’ for the economy that arise even in the absence of a disaster. These co-benefits include greater service reliability, higher levels of financial stability improved business confidence, community connectedness and growth.
The report seeks to raise awareness of the barriers to building resilience across Australia and makes recommendations to engender faster and more holistic change.
1.1 Structure of this reportThis report is structured as follows:
• Chapter 2 reviews the total cost of natural disasters in 2016 and compares the distribution of impacts between states and territories. The total costs are forecast to 2050 and highlights the need for greater resilience
• Chapter 3 considers the double dividend and builds the case for investing in pre-disaster resilience through both physical and community measures
• Chapter 4 considers the role of states, territories, and other stakeholders in building disaster resilience
• Chapter 5 evaluates common barriers to building resilience in our states and territories and considers the disaster risks, costs and key initiatives in each state and territory
• Chapter 6 makes recommendations for further building disaster resilience.
14
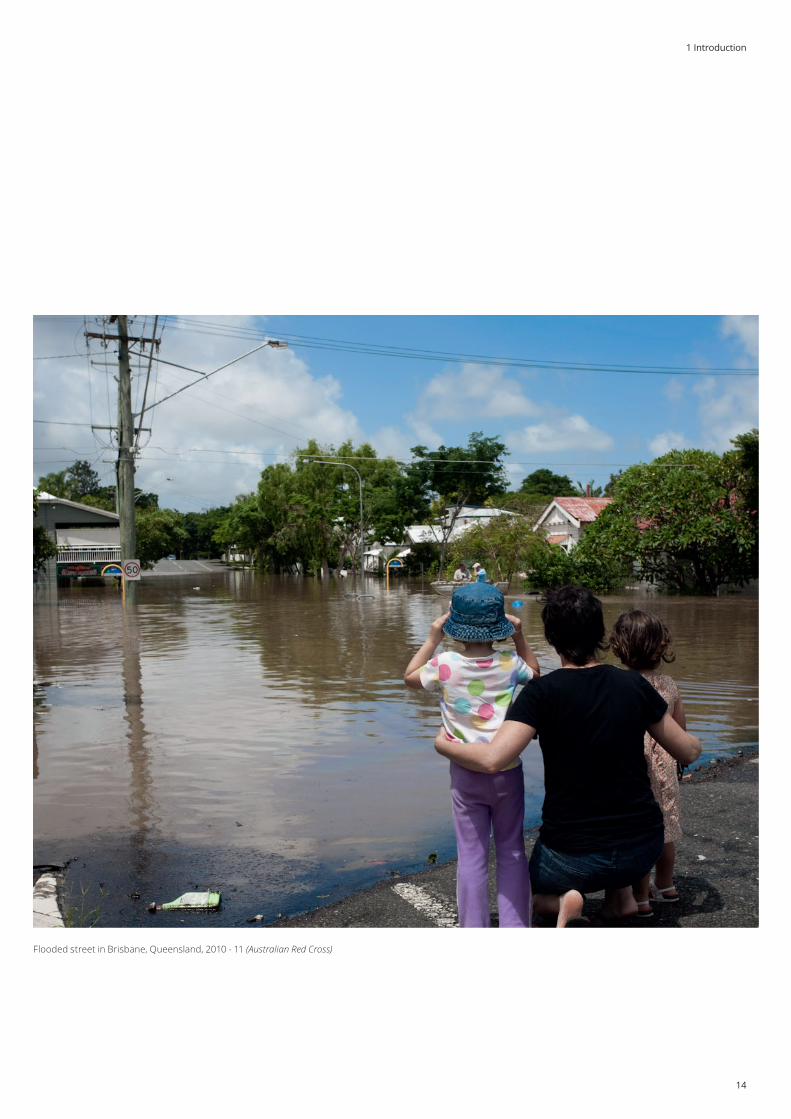
Flooded street in Brisbane, Queensland, 2010 - 11 (Australian Red Cross)
1 Introduction
Building resilience to natural disasters in our states and territories | November 2017
15
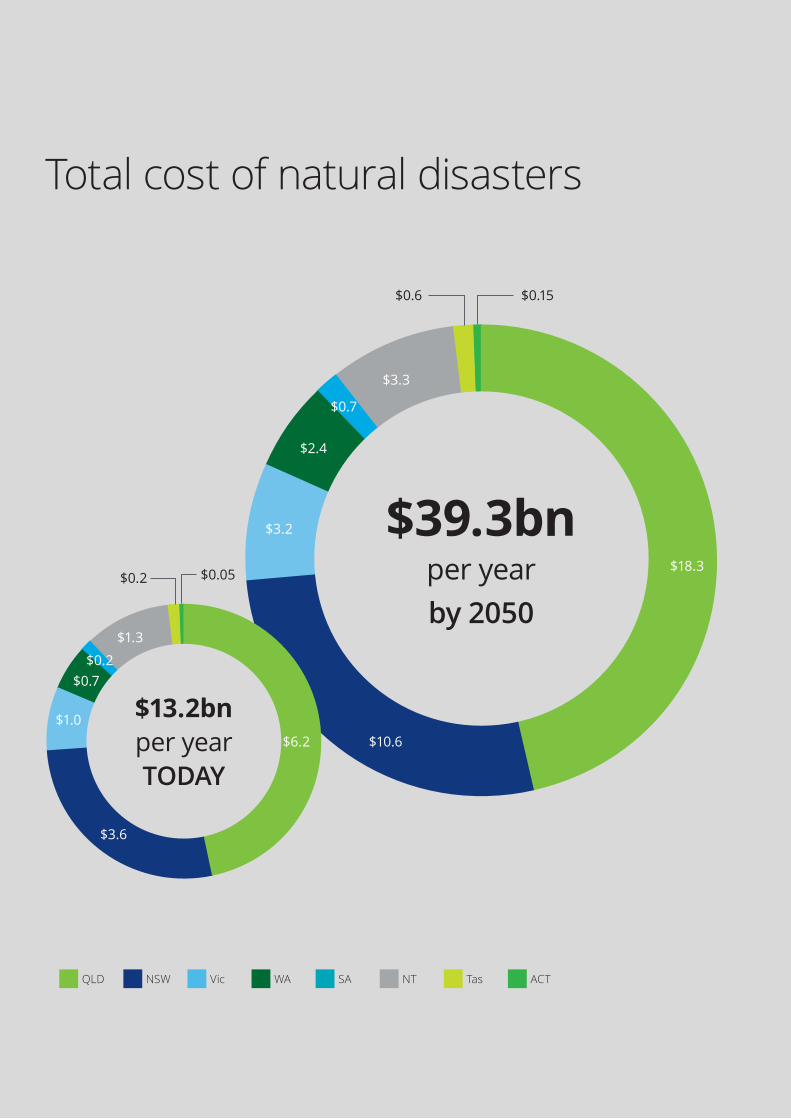
Total cost of natural disasters
$39.3bn per year by 2050
$13.2bn per year TODAY
$6.2
$18.3
$10.6
$3.2
$2.4
$0.7
$3.3
$0.6 $0.15
$3.6
$1.0
$0.7$0.2
$1.3
$0.05
QLD NSW Vic WA SA NT Tas ACT
$0.2
16
2 The cost of natural disasters in our states and territories
Key points • In the 10 years to 2016, the total economic cost of natural disasters averaged $18.2 billion per year, equivalent to 1.2% of GDP over the same period.
• By 2050, the total economic cost of natural disasters is forecast to increase to $39.3 billion per year.
• Beyond direct tangible costs, natural disasters have wide-ranging intangible costs. These are often long-term social impacts on communities, such as impacts on health and wellbeing, employment and community networks.
• The costs of natural disasters vary substantially between states, according to the type, frequency and intensity of disasters, among other factors.
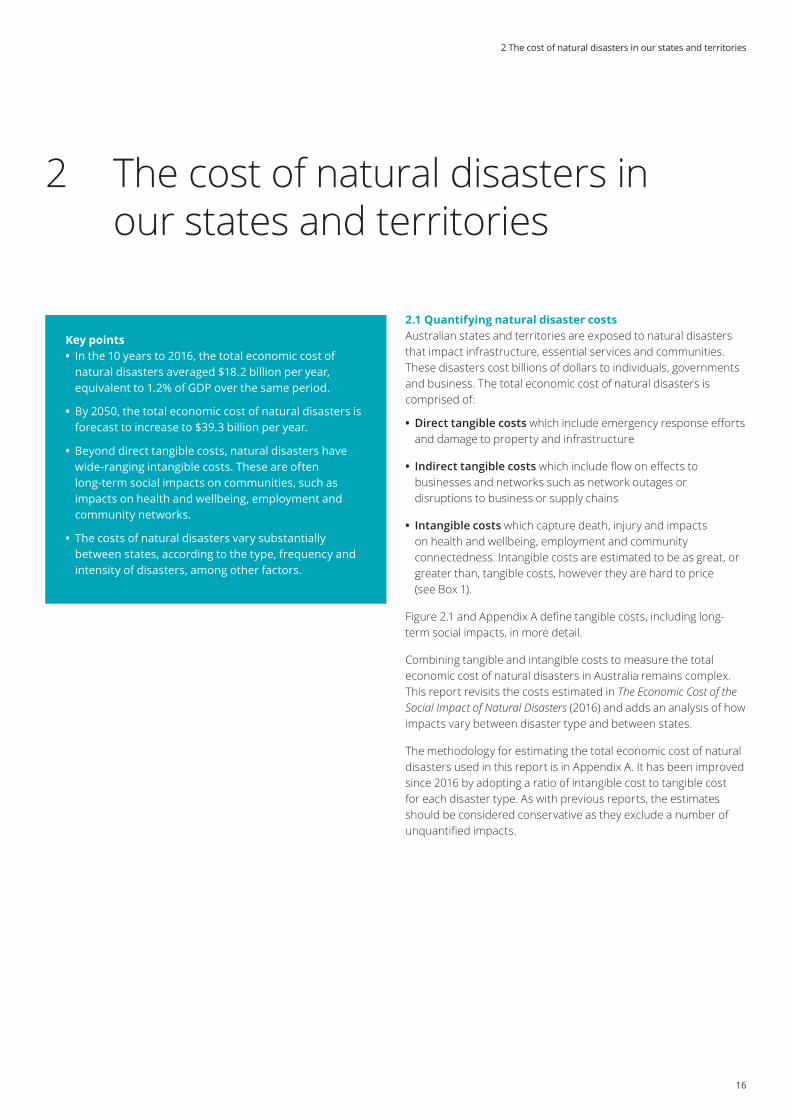
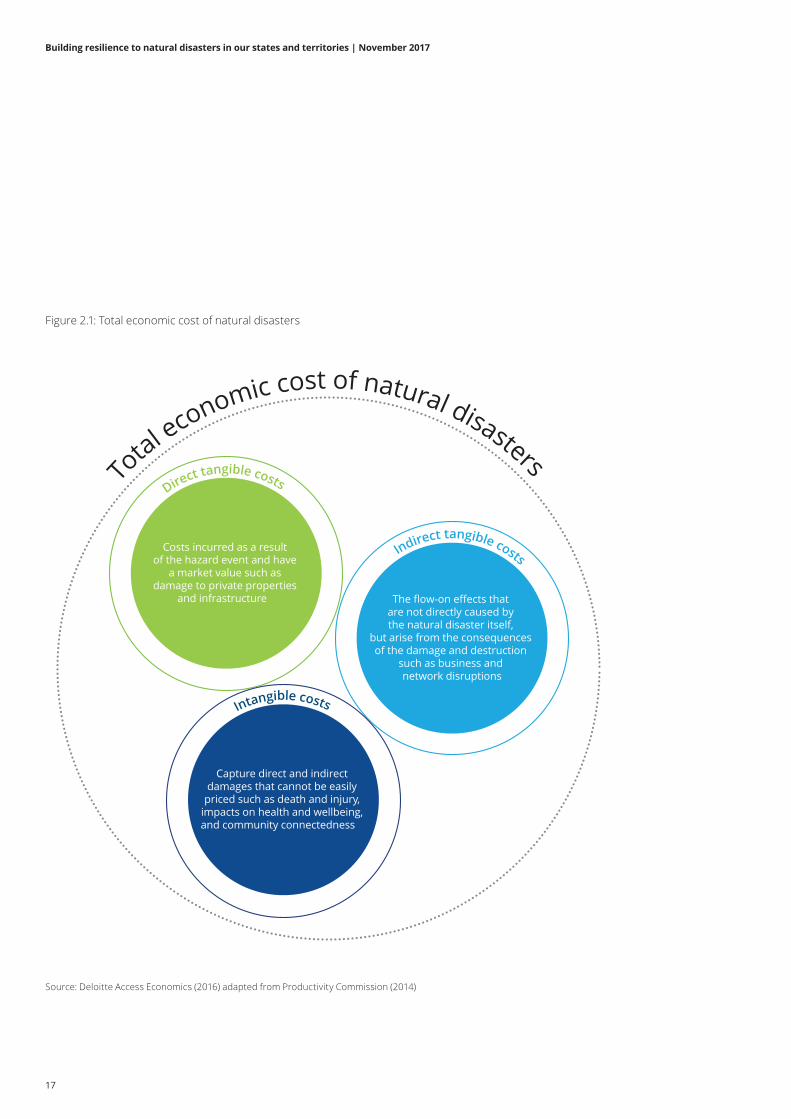
2.1 Quantifying natural disaster costsAustralian states and territories are exposed to natural disasters that impact infrastructure, essential services and communities. These disasters cost billions of dollars to individuals, governments and business. The total economic cost of natural disasters is comprised of:
• Direct tangible costs which include emergency response efforts and damage to property and infrastructure
• Indirect tangible costs which include flow on effects to businesses and networks such as network outages or disruptions to business or supply chains
• Intangible costs which capture death, injury and impacts on health and wellbeing, employment and community connectedness. Intangible costs are estimated to be as great, or greater than, tangible costs, however they are hard to price (see Box 1).
Figure 2.1 and Appendix A define tangible costs, including long-term social impacts, in more detail.
Combining tangible and intangible costs to measure the total economic cost of natural disasters in Australia remains complex. This report revisits the costs estimated in The Economic Cost of the Social Impact of Natural Disasters (2016) and adds an analysis of how impacts vary between disaster type and between states.
The methodology for estimating the total economic cost of natural disasters used in this report is in Appendix A. It has been improved since 2016 by adopting a ratio of intangible cost to tangible cost for each disaster type. As with previous reports, the estimates should be considered conservative as they exclude a number of unquantified impacts.
2 The cost of natural disasters in our states and territories
Building resilience to natural disasters in our states and territories | November 2017
17
Costs incurred as a result
of the hazard event and have a market value such as
damage to private properties and infrastructure The flow-on effects that
are not directly caused by the natural disaster itself,
but arise from the consequences of the damage and destruction
such as business and network disruptions
Capture direct and indirect damages that cannot be easily
priced such as death and injury, impacts on health and wellbeing, and community connectedness
Direct tangible costs
Indirect tangible costs
Intangible costs
Total economic cost of natural disasters
Figure 2.1: Total economic cost of natural disasters
Source: Deloitte Access Economics (2016) adapted from Productivity Commission (2014)
18
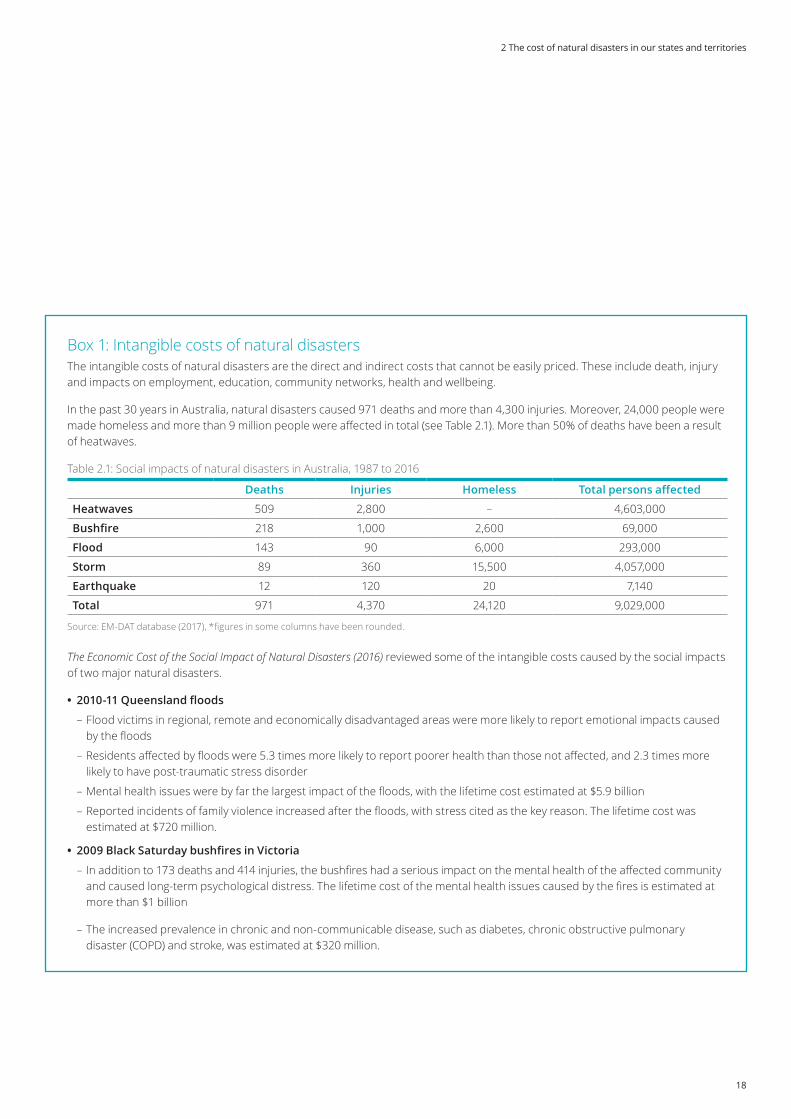
Box 1: Intangible costs of natural disastersThe intangible costs of natural disasters are the direct and indirect costs that cannot be easily priced. These include death, injury and impacts on employment, education, community networks, health and wellbeing.
In the past 30 years in Australia, natural disasters caused 971 deaths and more than 4,300 injuries. Moreover, 24,000 people were made homeless and more than 9 million people were affected in total (see Table 2.1). More than 50% of deaths have been a result of heatwaves.
Table 2.1: Social impacts of natural disasters in Australia, 1987 to 2016
Deaths Injuries Homeless Total persons affected
Heatwaves 509 2,800 – 4,603,000
Bushfire 218 1,000 2,600 69,000
Flood 143 90 6,000 293,000
Storm 89 360 15,500 4,057,000
Earthquake 12 120 20 7,140
Total 971 4,370 24,120 9,029,000
Source: EM-DAT database (2017), *figures in some columns have been rounded.
The Economic Cost of the Social Impact of Natural Disasters (2016) reviewed some of the intangible costs caused by the social impacts of two major natural disasters.
• 2010-11 Queensland floods
– Flood victims in regional, remote and economically disadvantaged areas were more likely to report emotional impacts caused by the floods
– Residents affected by floods were 5.3 times more likely to report poorer health than those not affected, and 2.3 times more likely to have post-traumatic stress disorder
– Mental health issues were by far the largest impact of the floods, with the lifetime cost estimated at $5.9 billion
– Reported incidents of family violence increased after the floods, with stress cited as the key reason. The lifetime cost was estimated at $720 million.
• 2009 Black Saturday bushfires in Victoria
– In addition to 173 deaths and 414 injuries, the bushfires had a serious impact on the mental health of the affected community and caused long-term psychological distress. The lifetime cost of the mental health issues caused by the fires is estimated at more than $1 billion
– The increased prevalence in chronic and non-communicable disease, such as diabetes, chronic obstructive pulmonary disaster (COPD) and stroke, was estimated at $320 million.
2 The cost of natural disasters in our states and territories

Building resilience to natural disasters in our states and territories | November 2017
19
2.2 Total economic cost of natural disasters in AustraliaThe intensity and frequency of natural disasters varies substantially year to year, as does their distribution and impact (Chart 2.1). According to the Insurance Council of Australia (ICA, 2017), Australia has had an average of five disasters per year in the past 30 years, where insured losses exceeded $10 million. Further, an average of two events per year have had insured costs of more than $500 million (in 2017 prices).
Some of the most destructive disasters have occurred in recent years. These are:
• 2011: the Queensland floods and Tropical Cyclone Yasi contributed to Australia’s most costly year for natural disasters, and, at $5.1 billion, more than 60% of the insured cost of natural disasters that year. The floods led to 36 deaths and property damage costs of $1.5 billion (Queensland Floods Commission of Inquiry, 2012). Cyclone Yasi claimed one life and also incurred property damage costs of $1.5 billion
• 2013: Tropical Cyclone Oswald cost $1.5 billion in insured costs
• 2015: Tropical Cyclone Marcia and a cluster of east coast lows (extra-tropical cyclones) cost $2.9 billion in insured costs
• 2017: Cyclone Debbie in Queensland and New South Wales (NSW) cost an estimated $1.5 billion in insured losses, with this total expected to rise further.4
But insured costs are just one part of the tangible and intangible costs associated with natural disasters.5 In the same 30 years there were 971 fatalities and over 4,300 injuries associated with natural disasters in Australia (see Box 1).
Combining both tangible and intangible costs, the total economic cost of natural disasters in Australia over the past decade is estimated to average $18.2 billion per year, equivalent to 1.2% of Gross Domestic Product (GDP).6
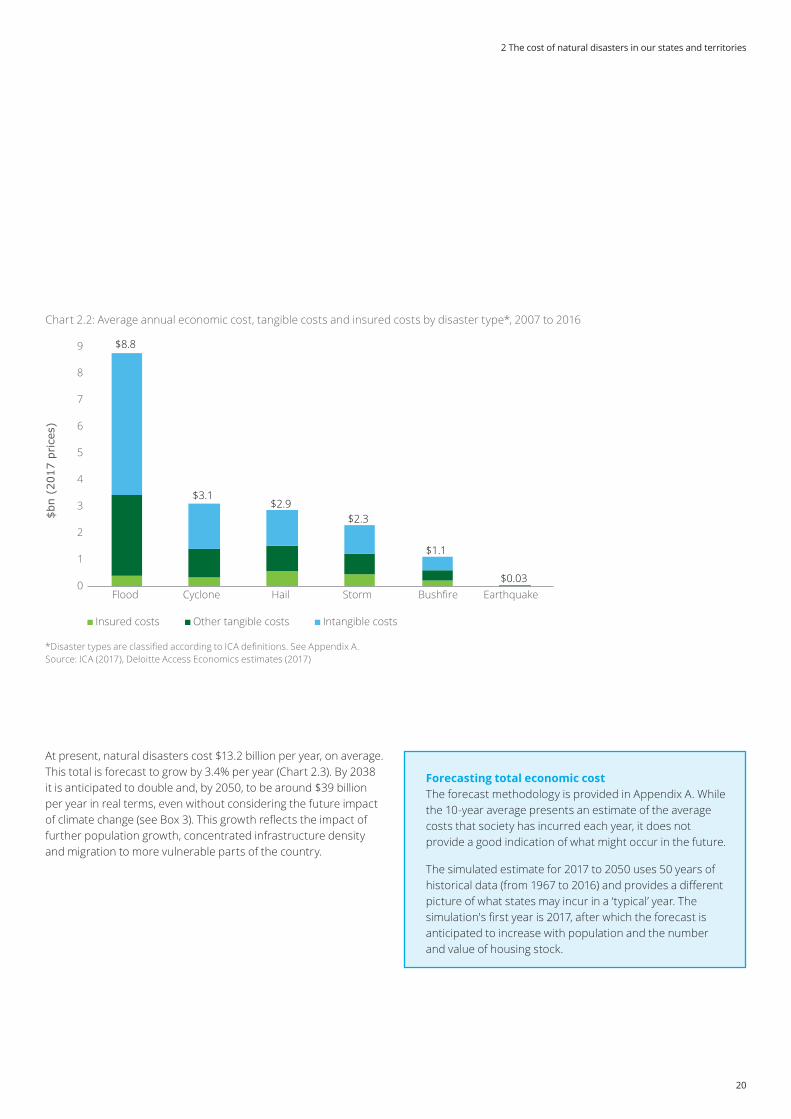
Floods and cyclones have been the most costly (Chart 2.2). While insured costs have been similar across disaster types, floods and cyclones have large impacts not captured by insured losses. For all disaster types, most of the costs are not captured by estimates of insured loses alone. Data are not available to include heatwaves in total economic cost estimates, however it is acknowledged they have a big impact on communities (see Box 2).
4 Preliminary estimates only. Data for 2017 are not yet available. 5 Costs to insurers are influenced by the uptake of insurance. Residential flood insurance, for example, has only been common in east coast states since 2011. 6 This is a 10-year average and reflects total economic cost at a point in time. It does not capture the variability in disaster costs from year-to-year which could be well above or well below this historical average. Similarly, it presents historical data on economic cost rather than an estimate of risk that Australia may be exposed to for various disaster types.
Chart 2.1: Historic insured costs of natural disasters, Australia, 1987-2016 (2017 prices)
Source: ICA (2017)
Tota
l ins
ured
cos
t ($b
n) (2
017
pric
es)
0
1
2
3
4
5
6
1987 1992 1997 2002 2007 2012
2015Cylone Marcia
2011Queenslandfloods and
Cyclone Yasi2007
NSW east coast low (severe
storms, flash flooding and high winds)
1999 Eastern Sydney
hailstorm 1989Newcastle earthquake
20
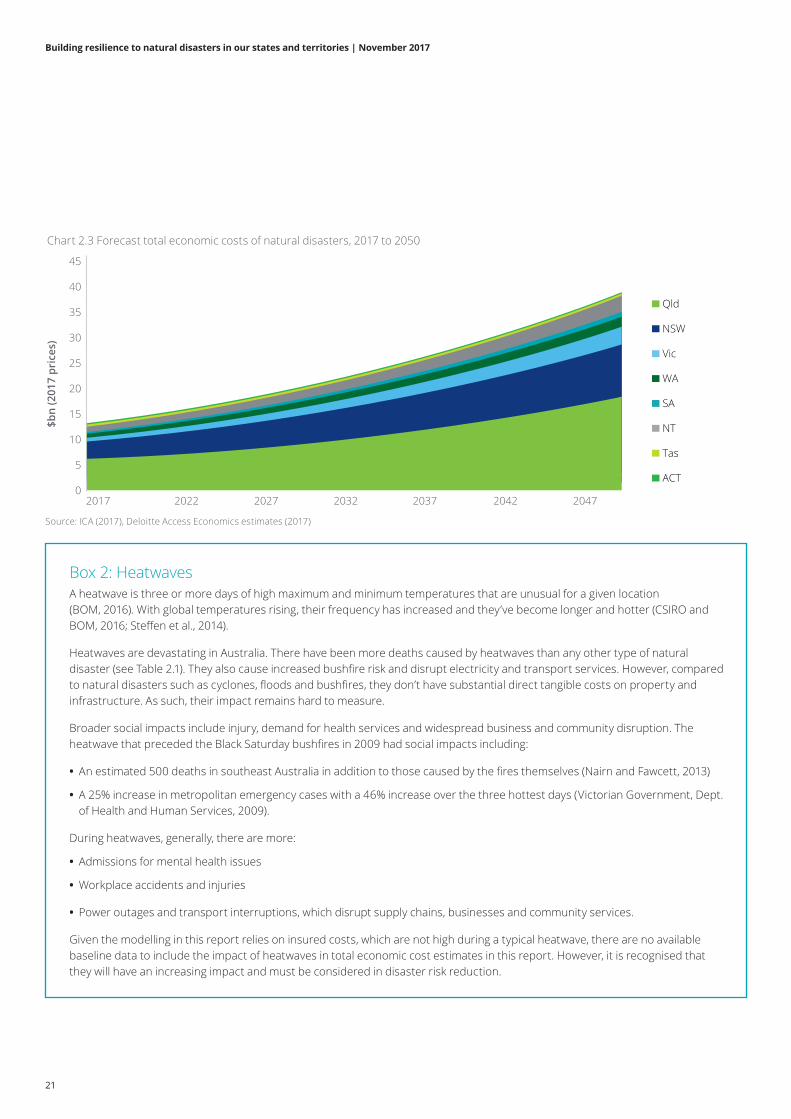
At present, natural disasters cost $13.2 billion per year, on average. This total is forecast to grow by 3.4% per year (Chart 2.3). By 2038 it is anticipated to double and, by 2050, to be around $39 billion per year in real terms, even without considering the future impact of climate change (see Box 3). This growth reflects the impact of further population growth, concentrated infrastructure density and migration to more vulnerable parts of the country.
Forecasting total economic costThe forecast methodology is provided in Appendix A. While the 10-year average presents an estimate of the average costs that society has incurred each year, it does not provide a good indication of what might occur in the future.
The simulated estimate for 2017 to 2050 uses 50 years of historical data (from 1967 to 2016) and provides a different picture of what states may incur in a ‘typical’ year. The simulation's first year is 2017, after which the forecast is anticipated to increase with population and the number and value of housing stock.
Chart 2.2: Average annual economic cost, tangible costs and insured costs by disaster type*, 2007 to 2016
*Disaster types are classified according to ICA definitions. See Appendix A. Source: ICA (2017), Deloitte Access Economics estimates (2017)
$bn
(201
7 pr
ices
)
0
1
2
3
4
5
6
7
8
9
Flood Cyclone Hail Storm Bushfire Earthquake
Insured costs Other tangible costs Intangible costs
$8.8
$3.1 $2.9
$2.3
$1.1
$0.03
2 The cost of natural disasters in our states and territories
Building resilience to natural disasters in our states and territories | November 2017
21
Chart 2.3 Forecast total economic costs of natural disasters, 2017 to 2050
Source: ICA (2017), Deloitte Access Economics estimates (2017)
$bn
(201
7 pr
ices
)
Qld
NSW
Vic
WA
SA
NT
Tas
ACT
2017 2022 2027 2032 2037 2042 20470
5
10
15
20
25
30
35
40
45
Box 2: HeatwavesA heatwave is three or more days of high maximum and minimum temperatures that are unusual for a given location (BOM, 2016). With global temperatures rising, their frequency has increased and they’ve become longer and hotter (CSIRO and BOM, 2016; Steffen et al., 2014).
Heatwaves are devastating in Australia. There have been more deaths caused by heatwaves than any other type of natural disaster (see Table 2.1). They also cause increased bushfire risk and disrupt electricity and transport services. However, compared to natural disasters such as cyclones, floods and bushfires, they don’t have substantial direct tangible costs on property and infrastructure. As such, their impact remains hard to measure.
Broader social impacts include injury, demand for health services and widespread business and community disruption. The heatwave that preceded the Black Saturday bushfires in 2009 had social impacts including:
• An estimated 500 deaths in southeast Australia in addition to those caused by the fires themselves (Nairn and Fawcett, 2013)
• A 25% increase in metropolitan emergency cases with a 46% increase over the three hottest days (Victorian Government, Dept. of Health and Human Services, 2009).
During heatwaves, generally, there are more:
• Admissions for mental health issues
• Workplace accidents and injuries
• Power outages and transport interruptions, which disrupt supply chains, businesses and community services.
Given the modelling in this report relies on insured costs, which are not high during a typical heatwave, there are no available baseline data to include the impact of heatwaves in total economic cost estimates in this report. However, it is recognised that they will have an increasing impact and must be considered in disaster risk reduction.

22
Box 3: The impact of climate change on natural disasters in AustraliaThe Intergovernmental Panel on Climate Change (IPCC) released its Fifth Assessment Report into climate change in 2014. The contribution of the Australasian working group reaffirmed that climate change will increase the severity and rate of natural disasters in Australia. It states there will be “increased frequency and intensity of flood damage to settlements and infrastructure in Australia”, an increase in “the number of days with…extreme fire weather” and “greater frequency and intensity of droughts”.
In 2016, CSIRO and the Bureau of Meteorology (BOM) stated “the duration, frequency and intensity of extreme heat events have increased across large parts of Australia” (State of the Climate Assessment, CSIRO/BOM). Moreover, the CSIRO recently concluded that climate change will increase the frequency and severity of natural disasters (CSIRO, 2015).
Shifts in the geographic distribution of natural disasters are also likely (CSIRO, 2015). The climatological distribution of rainfall will change, which translates to a change in catchment hydrology. Climate change will thus change the frequency and severity of river flood risks in Australia, but not in a uniform way. Some river floods will increase in severity and frequency while others will lessen.
The 2016 United Nations Climate Change Conference in Marrakesh affirmed the commitment of member nations to the "full implementation” of the Paris Agreement. The agreement, which began in November 2016, aims to keep the global temperature rise this century to less than two degrees Celsius above pre-industrial levels (United Nations, 2016). Despite this commitment, rises in global temperatures and sea levels are still expected to cause more frequent and intense weather events.
While the science has advanced, it remains difficult for experts to model the timing, location and intensity of disaster events in response to climate variability and change. For this reason, the forecasts in this report conservatively exclude any increases in the economic cost of natural disasters due to climate change.
East coast low, Narrabeen, NSW, 2016 (Australian Red Cross)
2 The cost of natural disasters in our states and territories
Building resilience to natural disasters in our states and territories | November 2017
23
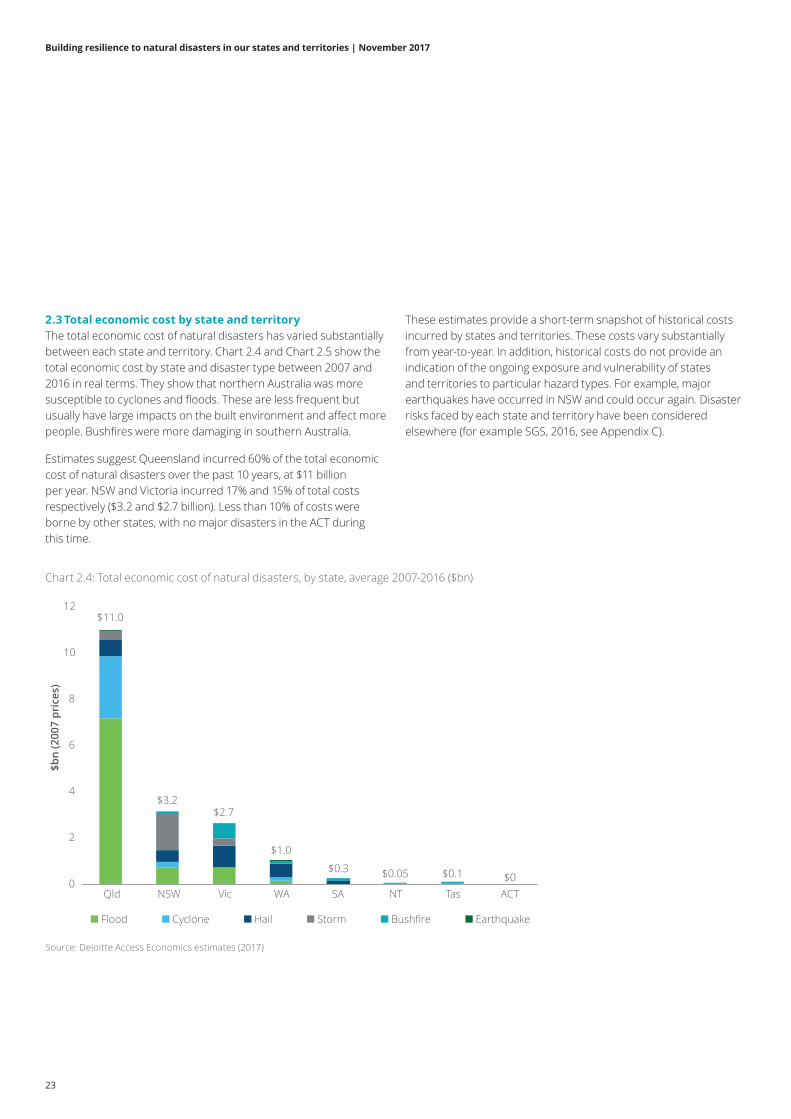
2.3 Total economic cost by state and territoryThe total economic cost of natural disasters has varied substantially between each state and territory. Chart 2.4 and Chart 2.5 show the total economic cost by state and disaster type between 2007 and 2016 in real terms. They show that northern Australia was more susceptible to cyclones and floods. These are less frequent but usually have large impacts on the built environment and affect more people. Bushfires were more damaging in southern Australia.
Estimates suggest Queensland incurred 60% of the total economic cost of natural disasters over the past 10 years, at $11 billion per year. NSW and Victoria incurred 17% and 15% of total costs respectively ($3.2 and $2.7 billion). Less than 10% of costs were borne by other states, with no major disasters in the ACT during this time.
Chart 2.4: Total economic cost of natural disasters, by state, average 2007-2016 ($bn)
These estimates provide a short-term snapshot of historical costs incurred by states and territories. These costs vary substantially from year-to-year. In addition, historical costs do not provide an indication of the ongoing exposure and vulnerability of states and territories to particular hazard types. For example, major earthquakes have occurred in NSW and could occur again. Disaster risks faced by each state and territory have been considered elsewhere (for example SGS, 2016, see Appendix C).
Source: Deloitte Access Economics estimates (2017)
Flood Storm Cyclone Earthquake Bushfire Hail
0
2
4
6
8
10
12 $11.0
$3.2$2.7
$1.0
$0.3 $0.05 $0.1 $0Qld NSW Vic WA SA NT Tas ACT
$bn
(200
7 pr
ices
)
24
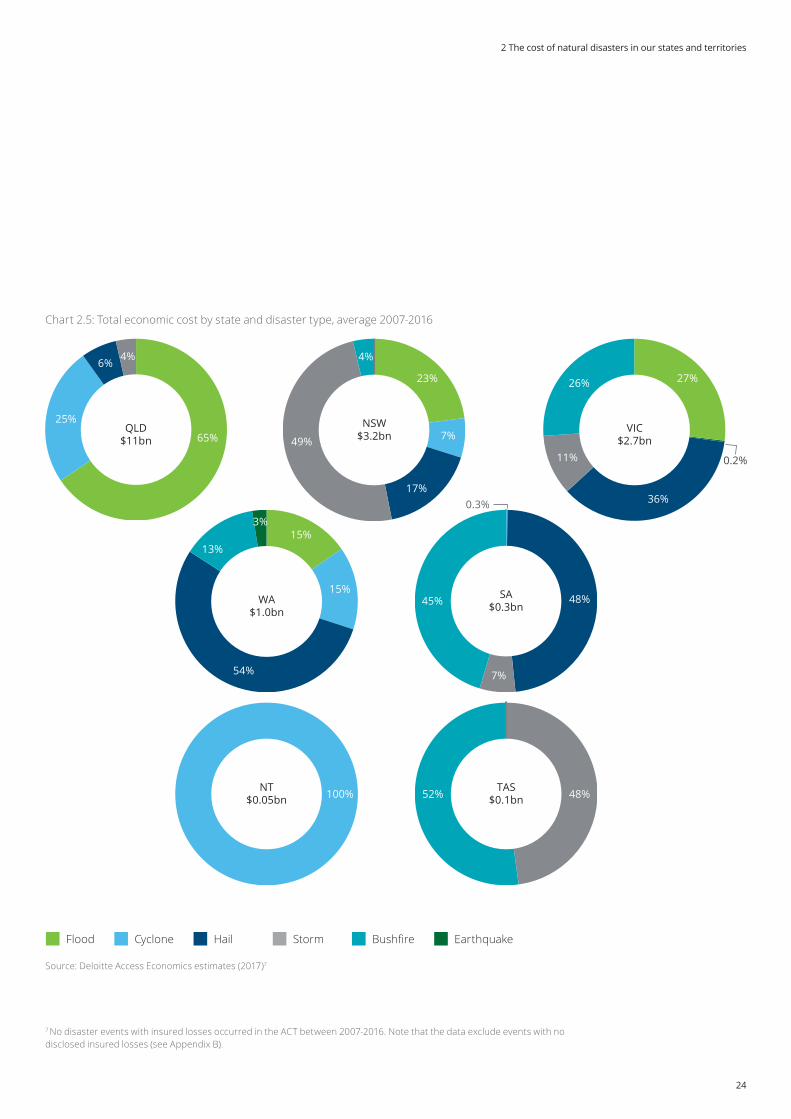
Chart 2.5: Total economic cost by state and disaster type, average 2007-2016
65%
25%
6% 4%
QLD$11bn
15%3%
13%
WA$1.0bn
54%
15%
0.3%
48%SA$0.3bn
7%
45%
NT$0.05bn 100% TAS
$0.1bn 48%52%
Source: Deloitte Access Economics estimates (2017)7
Flood Cyclone Hail Storm Bushfire Earthquake
7 No disaster events with insured losses occurred in the ACT between 2007-2016. Note that the data exclude events with no disclosed insured losses (see Appendix B).
7%
23%
49%
4%
NSW$3.2bn
17%
0.2%
27%
11%
26%
VIC$2.7bn
36%
2 The cost of natural disasters in our states and territories
Building resilience to natural disasters in our states and territories | November 2017
25
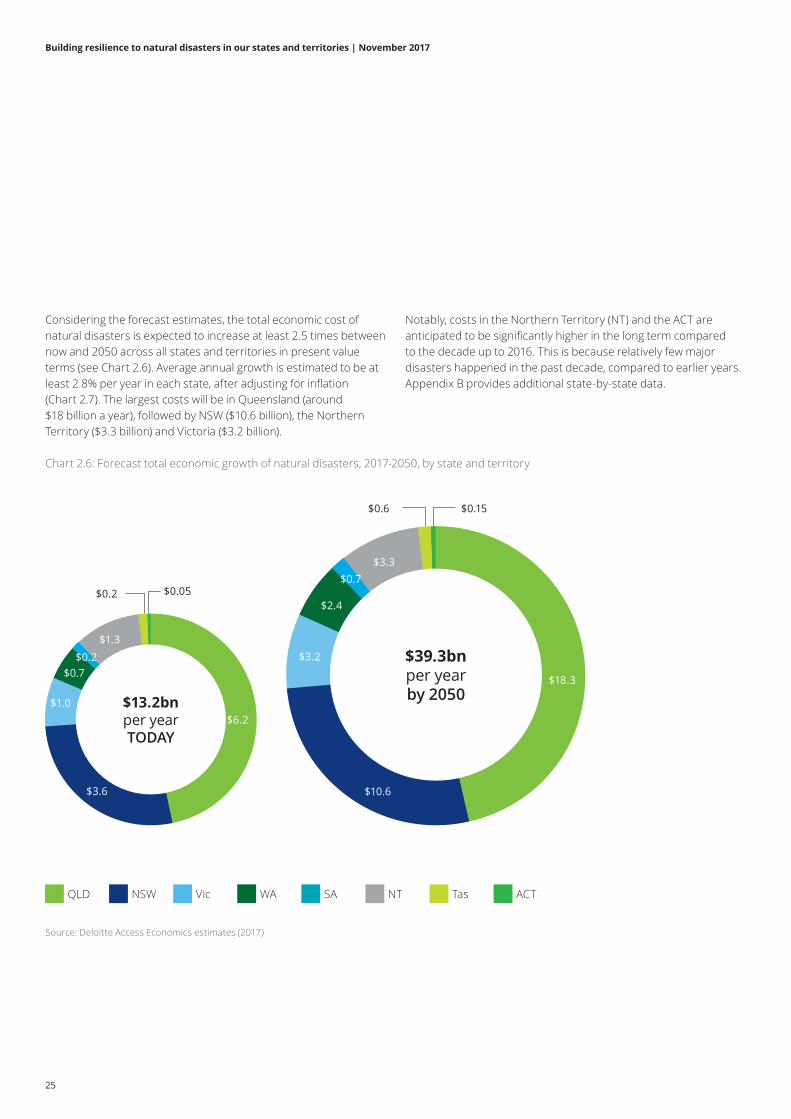
Considering the forecast estimates, the total economic cost of natural disasters is expected to increase at least 2.5 times between now and 2050 across all states and territories in present value terms (see Chart 2.6). Average annual growth is estimated to be at least 2.8% per year in each state, after adjusting for inflation (Chart 2.7). The largest costs will be in Queensland (around $18 billion a year), followed by NSW ($10.6 billion), the Northern Territory ($3.3 billion) and Victoria ($3.2 billion).
Notably, costs in the Northern Territory (NT) and the ACT are anticipated to be significantly higher in the long term compared to the decade up to 2016. This is because relatively few major disasters happened in the past decade, compared to earlier years. Appendix B provides additional state-by-state data.
Chart 2.6: Forecast total economic growth of natural disasters, 2017-2050, by state and territory
Source: Deloitte Access Economics estimates (2017)
QLD NSW Vic WA SA NT Tas ACT
$39.3bn per year by 2050
$18.3
$10.6
$3.2
$2.4
$0.7$3.3
$0.6 $0.15
$13.2bn per year TODAY
$6.2
$3.6
$1.0
$0.7$0.2
$1.3
$0.05$0.2
26
2.4 Recovery costs to governmentA significant portion of the total economic cost is in relief and recovery expenditure by Australian and state governments. Currently, the main mechanism for recovery support is the Natural Disaster Relief and Recovery Arrangements (NDRRA) – a cost-sharing approach to manage the individual, community recovery costs after large disasters. Much of this funding is for restoring essential public infrastructure. In addition, Australian Government Disaster Recovery Payments, delivered through Centrelink, provide emergency assistance to those in need.
Because only some recovery expenditure falls under cost-sharing arrangements, there is no comprehensive data on state-by-state recovery costs. The Productivity Commission (PC), in 2014 estimated that the Australian Government pays approximately 60% of recovery costs, compared to 40% paid by state and territory governments.
Between 2010 and 2013, the Australian and state governments spent $7 billion and $4 billion respectively directly on recovery.8 This is around 10% of the total economic cost of natural disasters estimated for this period ($114.7 billion).
This excludes the other indirect costs to governments captured in total economic cost, including indirect tangible costs and intangible costs that arise over the medium and longer term. For example, when a natural disaster occurs, governments may lose taxation revenue if business continuity and employment are affected, and face increased outlays on health and social services.
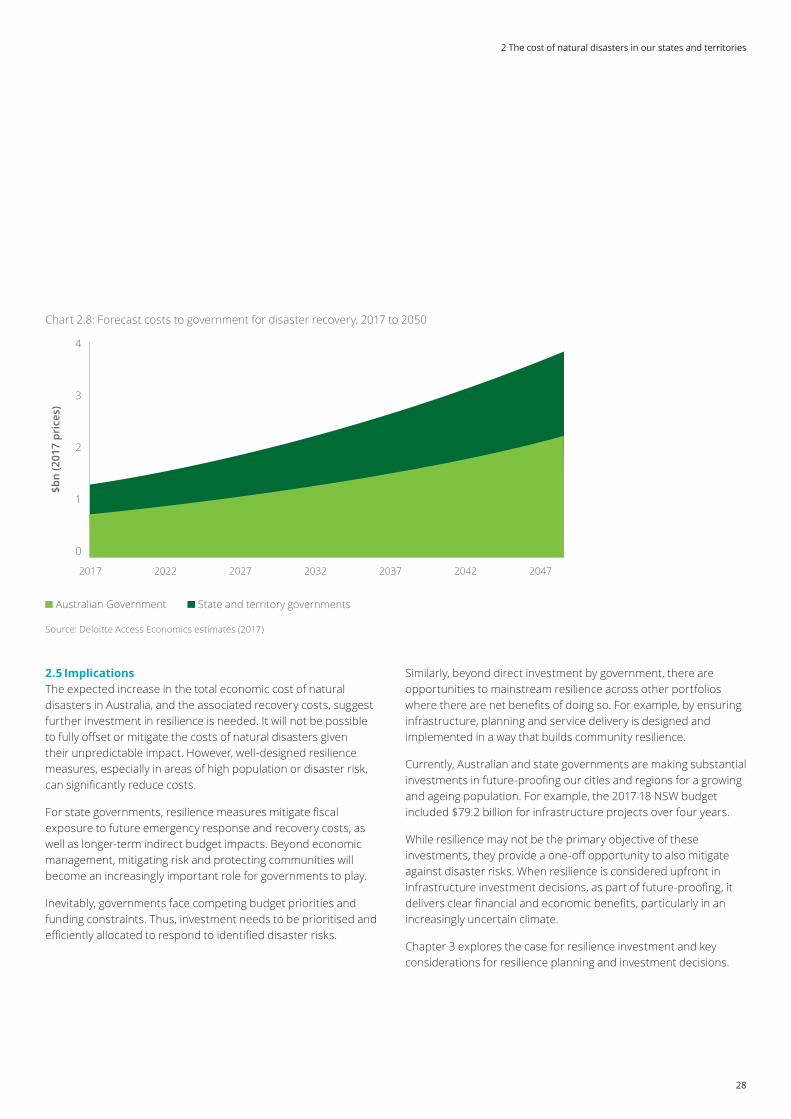
Assuming government funding as a share of total economic costs remains constant to 2050, it is anticipated governments could face an average of $3.8 billion per year in direct recovery costs in real terms. Of this, an estimated $1.6 billion would be borne by state and territory governments. After emergency response costs are also considered, this direct expenditure is expected to be higher. The projected trend is shown in Chart 2.8.
This is an average cost that smooths the potential impact of a significant one-off disaster, which would have a greater short-term financial impact. For example, rebuilding after the Queensland floods and cyclones in 2010-11 cost an estimated $7.1 billion in 2011-12 alone (Queensland Government Budget Paper, 2014).
7 The PC (2014) acknowledge that this excludes some eligible funding for recovery which will occur following the disaster events. Data for more recent years are not publicly available.
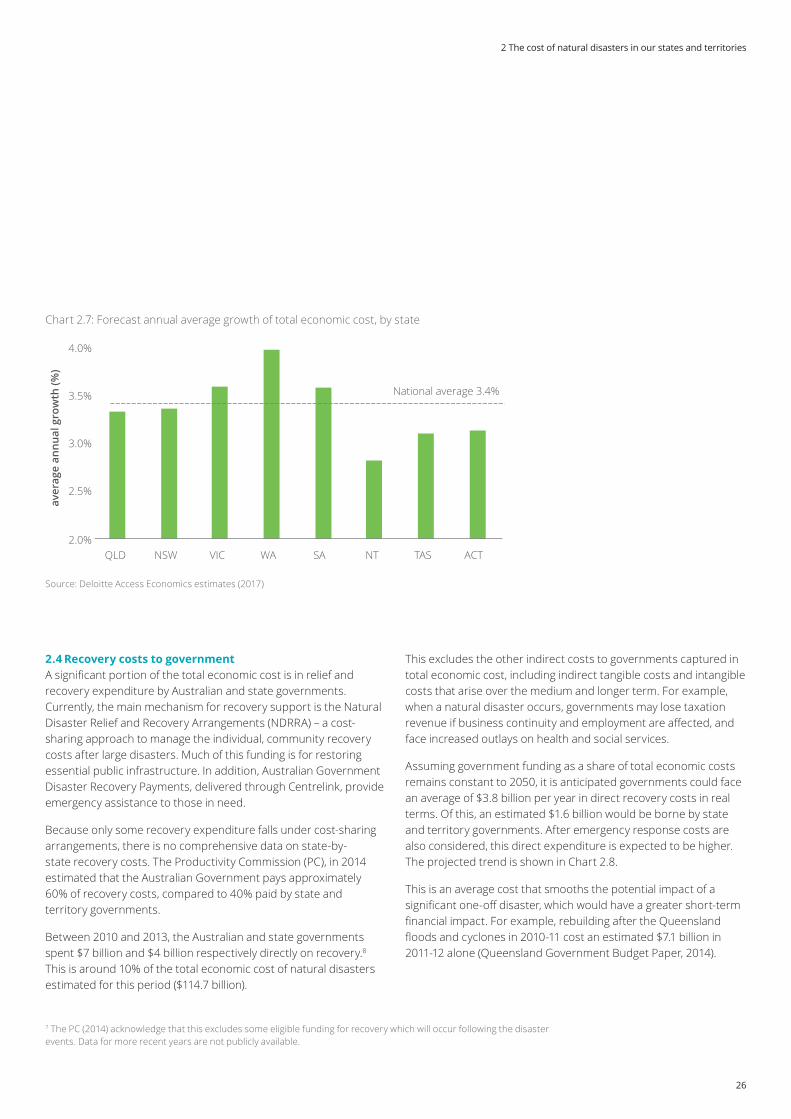
Chart 2.7: Forecast annual average growth of total economic cost, by state
Source: Deloitte Access Economics estimates (2017)
2.0%
2.5%
3.0%
3.5%
4.0%
QLD NSW VIC WA SA NT
National average 3.4%
TAS ACT
aver
age
annu
al g
row
th (%
) 2 The cost of natural disasters in our states and territories
Building resilience to natural disasters in our states and territories | November 2017
27
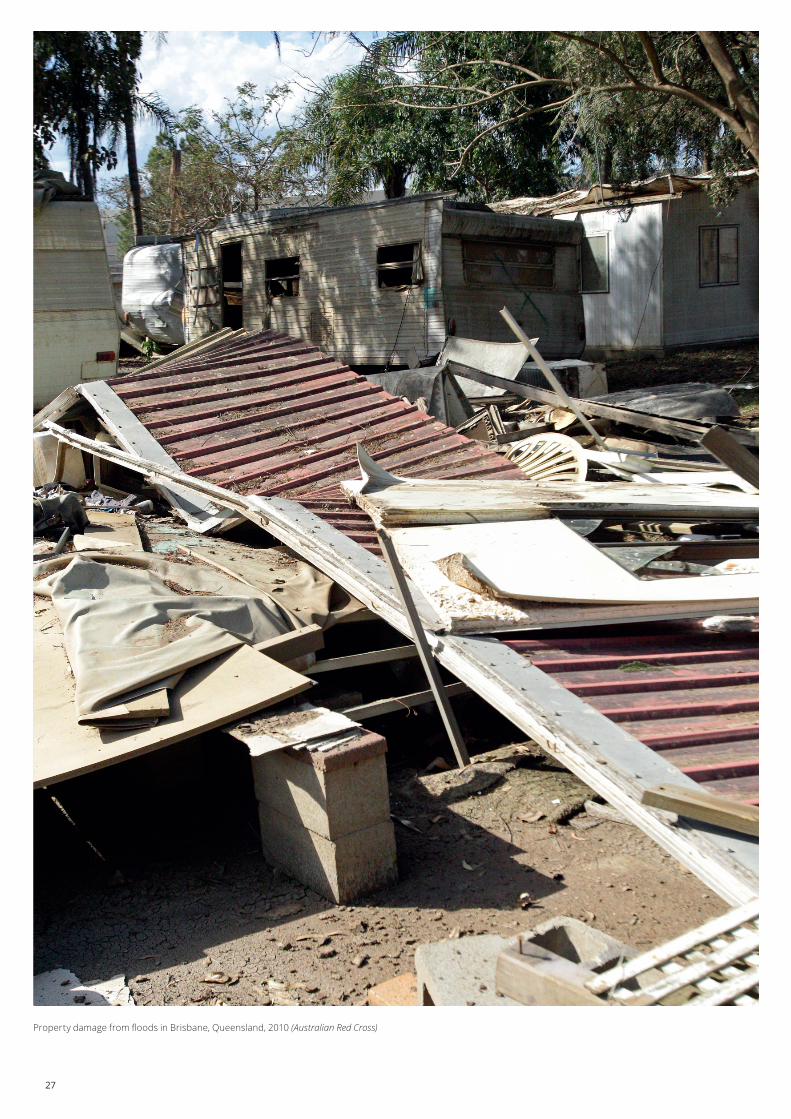
Property damage from floods in Brisbane, Queensland, 2010 (Australian Red Cross)
28
Chart 2.8: Forecast costs to government for disaster recovery, 2017 to 2050
Source: Deloitte Access Economics estimates (2017)
0
1
2
3
4
$bn
(201
7 pr
ices
)
5
2017 2027 2032 2037 2042 20472022
Australian Government State and territory governments
2.5 ImplicationsThe expected increase in the total economic cost of natural disasters in Australia, and the associated recovery costs, suggest further investment in resilience is needed. It will not be possible to fully offset or mitigate the costs of natural disasters given their unpredictable impact. However, well-designed resilience measures, especially in areas of high population or disaster risk, can significantly reduce costs.
For state governments, resilience measures mitigate fiscal exposure to future emergency response and recovery costs, as well as longer-term indirect budget impacts. Beyond economic management, mitigating risk and protecting communities will become an increasingly important role for governments to play.
Inevitably, governments face competing budget priorities and funding constraints. Thus, investment needs to be prioritised and efficiently allocated to respond to identified disaster risks.
Similarly, beyond direct investment by government, there are opportunities to mainstream resilience across other portfolios where there are net benefits of doing so. For example, by ensuring infrastructure, planning and service delivery is designed and implemented in a way that builds community resilience.
Currently, Australian and state governments are making substantial investments in future-proofing our cities and regions for a growing and ageing population. For example, the 2017-18 NSW budget included $79.2 billion for infrastructure projects over four years.
While resilience may not be the primary objective of these investments, they provide a one-off opportunity to also mitigate against disaster risks. When resilience is considered upfront in infrastructure investment decisions, as part of future-proofing, it delivers clear financial and economic benefits, particularly in an increasingly uncertain climate.
Chapter 3 explores the case for resilience investment and key considerations for resilience planning and investment decisions.
2 The cost of natural disasters in our states and territories
4
3
2
1
0
Building resilience to natural disasters in our states and territories | November 2017
29
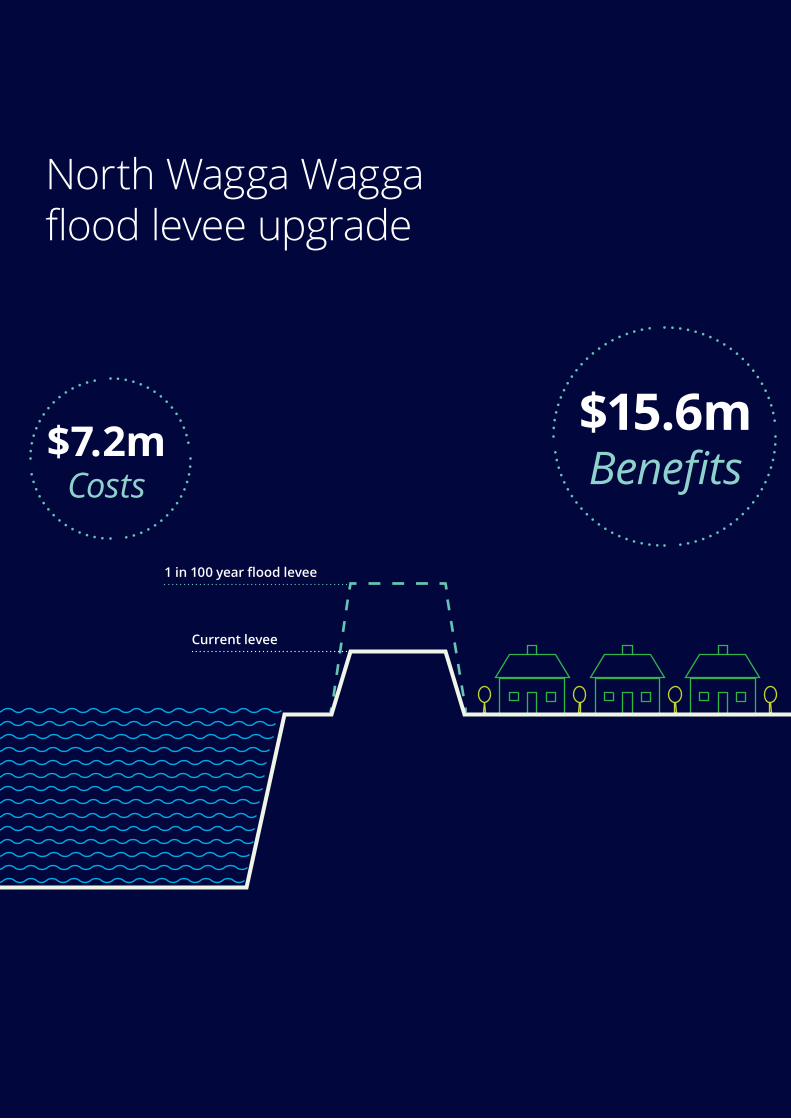
North Wagga Wagga flood levee upgrade
Current levee
1 in 100 year flood levee
$7.2m Costs
$15.6m Benefits
30
3 The case for building resilience
Key points • There is often a robust business case for investing in resilience measures, including both infrastructure and community preparedness.
• Investing in resilience yields a double dividend. First, it reduces the cost of natural disaster events, and second, it drives social and economic ‘co-benefts’ that arise even in the absence of a disaster.
• The net benefts, and the case for investing in resilience, is greater when investments harness a double dividend.
• Resilience should be embedded in the location, design and construction of infrastructure to foster a skills legacy in resilience in the Australian planning and building industries.
• Funding resilience measures can be challenging for councils, who are major local asset owners. Co-funding from state and federal governments is often available for recovery after disasters but is harder to secure for pre-disaster mitigation work.
• Governments can also look to partnerships with the private sector for funding resilience.
3.1 The case for building resilience The total economic cost of natural disasters in Australia is increasing. As previous Roundtable reports have shown, investing in resilience can lessen or prevent losses to individuals, businesses and communities. Current Australian and state government spending on direct recovery from disasters is around $2.75 billion per year, compared to funding directly for natural disaster resilience of approximately $100 million per year.9
These investments cover a range of physical and community measures:
• Physical measures influence land use, infrastructure and building development. These measures affect where people live and the exposure of the assets they depend on
• Community measures include awareness raising and preparedness programs that help the community to withstand, adapt and respond to disasters when they occur.
The upfront costs of these measures is the biggest barrier to greater investment. Local councils are responsible for many of the assets vulnerable to disasters and often lack the finances to implement resilience measures, even where they have demonstrated net benefits. Similarly, state and federal governments have competing funding priorities. Both government and business are faced with complex decisions about how to mitigate risks in a way that maximises community wellbeing.
This chapter demonstrates the costs and benefits of resilience investment, and sheds light on a broader set of co-benefits that also arise.
3.2 The double dividend of building resilienceInvestments in resilience have two kinds of benefits and both should be considered when looking at the full value of an investment.
The first benefit of resilience investment is the reduction in future natural disaster costs. That is, if resilience is higher, losses (and thus costs) are avoided. These costs are both tangible and intangible, with a big share of direct tangible costs borne by governments.
“Governments over-invest in post-disaster reconstruction and under-invest in mitigation that would limit the impact of natural disasters in the first place. As such, natural disaster costs have become a growing, unfunded liability for governments.”
Productivity Commission (2014)
9 Recovery and resilience funding are hard to measure and not consistently reported. The PC (2014) estimated funding for recovery at $11 billion in the four years to 2012-13, equivalent to $2.75 billion per year. Funding primarily targeted towards resilience is considered in Section 5.3. This section estimates resilience funding of $104 million per year over the past four years, yet other investments are made outside these programs..
3 The case for building resilience
Building resilience to natural disasters in our states and territories | November 2017
31
While governments do budget for emergency response, most other recovery costs are an unfunded liability that must be met when a disaster occurs. This is usually at the expense of other planned activities. Avoiding future disaster costs provides governments with greater fiscal stability.
The second benefit of resilience investment, are ‘co-benefits’ that accrue even in the absence of a natural disaster. Such co-benefits support economic growth and social capital in Australian communities and are an important driver of regional investment decisions. They may include:
• Short-term employment
• Regional growth associated with investment
• Lower insurance premiums
• Improved business and consumer confidence
• More reliable services
• More connected communities
• Higher levels of skills and technical expertise.
The nature of such co-benefits varies. Investment in a flood levee, for example, to decrease the threat of flooding, can improve business confidence in a region. Investment in resilient telecommunications platforms can improve service reliability. Both retrofits and the construction of new infrastructure bring new skills to a region and community programs can enhance social cohesion. There are also the direct and indirect employment benefits and opportunities for innovation that arise from these local investments.
Thus, this combination of avoided losses and co-benefits yields a ‘double dividend’ from resilience investment.
Currently in Australia, governments are investing significantly in new infrastructure to service our growing and urbanising population. For example, the Australian government has committed $75 billion over 10 years to transport infrastructure (DIRD, 2017). Mandating, or enabling, resilience to be included as part of current infrastructure planning is likely to harness the double dividend. That is, these projects can service the growing population (their primary objective) as well as help to avoid future losses during disasters (the co-benefit).
There is an opportunity to build an Australian legacy in the standards and skills around the practice of embedding resilience in planning, locating and designing infrastructure. Over time, this will help to make resilience planning a mainstream practice. It will likely strengthen business confidence in investing in resilience and ultimately reduce the burden on taxpayers.
Community programs – even those that do not explicitly address disaster preparedness – tend to increase community resilience, and should be encouraged. For example, community programs in Adelaide lessened the emotional and mental health impacts that may have otherwise been experienced after natural disasters (BNHCRC, 2015).
The net benefits of resilience measures planned or underway in Australia are described in the next section.
3.3 Physical measures – Building resilient infrastructure3.3.1 MitigateA key opportunity to build resilience is in adapting physical structures such as building levees or drainage channels or retrofitting buildings.
Because councils are responsible for many local assets, mitigation measures often require co-funding. But while state and federal governments offer recovery funding after disasters, it is rarely available for pre-disaster mitigation measures.
Often, funding is via small, competitive grants targeting resilience, or in response to a specific disaster event. For example, in 2015 the NT government allocated $50 million to infrastructure resilience in Darwin and Alice Springs in response to repeated flood damage.
Without co-funding from government, businesses or residents, it is unlikely such mitigation measures will be undertaken, even when they demonstrate clear long-term benefits.
The mitigation investment examples in this chapter demonstrate net benefits. Launceston City Council in Tasmania has recently upgraded its levee system, while the Wagga Wagga flood levee and Warragamba dam in NSW have planned upgrades to their existing flood levees (yet-to-be fully funded) to mitigate losses from future floods.
32
North Wagga flood levee upgradeFlooding is a significant risk in Wagga Wagga in the NSW Riverina. As such, the Wagga Wagga City Council has committed to upgrading its flood levees: its Main CBD levee to protect against a one in 100-year flood (1% AEP) and the North Wagga levee against a one in 20-year flood (5% AEP).
ProjectNorth Wagga levee upgrade (one in 100-year level)
FundingProposed local, state and federal government contributions. Local government funding with special rate variation.
Avoided losses$8.5 million (BCR: 2.2)
Examples of co-benefits • Short-term employment boost during construction • Increased land values • Reduced insurance premiums • Increased business confidence
In October 2017, work began on the Main City levee funded by a special rate variation by Council ($7.75 million), state government grants ($4.1 million) and federal government ($10 million under the Community Development Grants Program) (Wagga Wagga City Council, 2017).
The North Wagga upgrade will be part of stage three of the project, however its final level of protection is yet to be determined. While a one in 20-year level of protection has been approved, subsequent analysis in 2015 recommended a one in 100-year level (NSW Public Works, 2015).
Annual Exceedance ProbabilityAnnual Exceedance Probability (AEP) is the probability of a level of flooding being equalled or exceeded, at least once, in any given year. The probability is expressed as a percentage. For example, a large flood which is calculated to have a 1% chance to occur in any one year, is described as 1% AEP. This is known as a one in 100-year event.
This does not imply the event will only occur once in 100 years but that there is a one in 100 chance it will happen in any year.
The terminology around disaster risks is often misunderstood and creates a barrier to building resilience.
For example, the Office of the Chief Scientist (2017) in Queensland acknowledged that in Australia 1% AEP is often used for planning purposes (such as adding height to buildings), regardless of the potential consequences of a flood. The office recommended that community decision-making be better informed on acceptable flood risks and consider both the chance of a flood happening and its potential consequences.
To build resilience, it is important that risk is communicated in a way that is readily understood.
3 The case for building resilience
Building resilience to natural disasters in our states and territories | November 2017
33
North Wagga flood levee upgrade (cont.) The one in 100-year option is anticipated to cost $7.2 million and deliver $15.6 million in benefits over 30 years associated with a reduction in average annual damage from $1.3 million to $157,000 (in 2017 prices).
Co-benefits of the upgradeEven if there is no flood, benefits occur. The council stated “land values, property development and the ability to obtain competitively priced property insurance have all been negatively impacted by the deficiencies in the current levels of flood protection afforded to the city” (Wagga Wagga City Council, 2014).
An early environmental assessment (GHD, 2013) concluded it “would provide a positive impact through a minor short-term increase in employment opportunities and procurement of local goods and services". NSW Public Works, meanwhile, noted the upgrade should decrease insurance premiums and foster confidence in the region.
Wagga Wagga City Council Mayor Rod Kendall said it “will give an instant confidence boost to people who...want to invest in that building infrastructure and extend their businesses into the CBD” (ABC News, 2016).
Table 3.1: Summary of net benefits, 2017 dollars, 7% discount rate
Present value costs ($m) $7.2
Present value benefits ($m) $15.6
Net present value ($m) $8.5
Benefit-to-cost ratio (BCR) 2.2
Source: NSW Public Works (2015), Deloitte Access Economics analysis (2017)
The proposed infrastructure is expected to yield benefits of $2.20 for every $1 spent. This economic assessment excludes the additional benefits to the local economy likely to result – including jobs, investment confidence and consumer benefits. It also excludes the costs of the social impacts if a flood was to devastate the community.
34
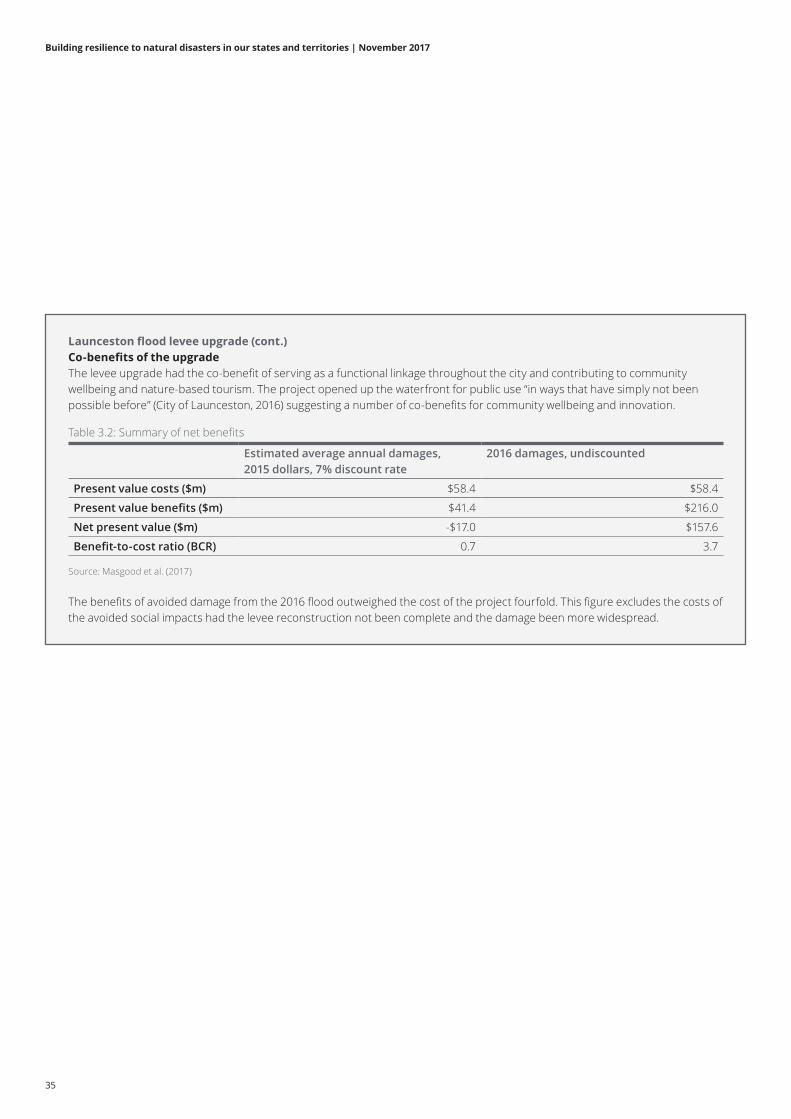
Launceston flood levee upgradeLaunceston City Council in Tasmania has upgraded its flood levee system to protect against a one in 200-year flooding event.
ProjectLevee upgrade
FundingEqual local, state and federal government contributions
Avoided losses$157.6 million in 2016 (BCR: 3.7)
Examples of co-benefits • Functional linkage for city • Facilitates increased tourism • Community use of space on waterfront
Launceston has had 36 floods since its establishment and levees have been used since the 1960s as a way to mitigate flood risk. A series of levee upgrades were undertaken between 2010 and 2014 to protect against a one in 200-year event. The upgrade cost $58 million over five years – more than double the original estimate - due to increased construction and land acquisition costs (Maqsood et al., 2017). The cost was equally shared between council, state and federal governments.
The Bushfire and Natural Hazards CRC estimated the upgrade would save $2.9 million per year in avoided damages. These included avoided residential losses such as:
• Repair costs
• Loss of contents
• Rental income loss
• Clean-up costs
• The cost of fatalities.
They also included avoided non-residential losses such as building repair costs, loss of inventory, loss of livestock, loss of income, the costs of clean-up and loss of turnover (Masgood et al., 2017).
With the costs exacerbated, the project costs were found to exceed the benefits at a 7% discount rate, although a lower (4%) discount rate would find the project viable.
In 2016, a flood gauged somewhere between a one in 50 and one in 100-year event occurred, with the levee limiting its damage. Avoided damages following this event alone were $216 million as a result of the upgrade (Masgood et al., 2017).
3 The case for building resilience
Building resilience to natural disasters in our states and territories | November 2017
35
Launceston flood levee upgrade (cont.)Co-benefits of the upgradeThe levee upgrade had the co-benefit of serving as a functional linkage throughout the city and contributing to community wellbeing and nature-based tourism. The project opened up the waterfront for public use “in ways that have simply not been possible before” (City of Launceston, 2016) suggesting a number of co-benefits for community wellbeing and innovation.
Table 3.2: Summary of net benefits
Estimated average annual damages, 2015 dollars, 7% discount rate
2016 damages, undiscounted
Present value costs ($m) $58.4 $58.4
Present value benefits ($m) $41.4 $216.0
Net present value ($m) -$17.0 $157.6
Benefit-to-cost ratio (BCR) 0.7 3.7
Source: Masgood et al. (2017)
The benefits of avoided damage from the 2016 flood outweighed the cost of the project fourfold. This figure excludes the costs of the avoided social impacts had the levee reconstruction not been complete and the damage been more widespread.
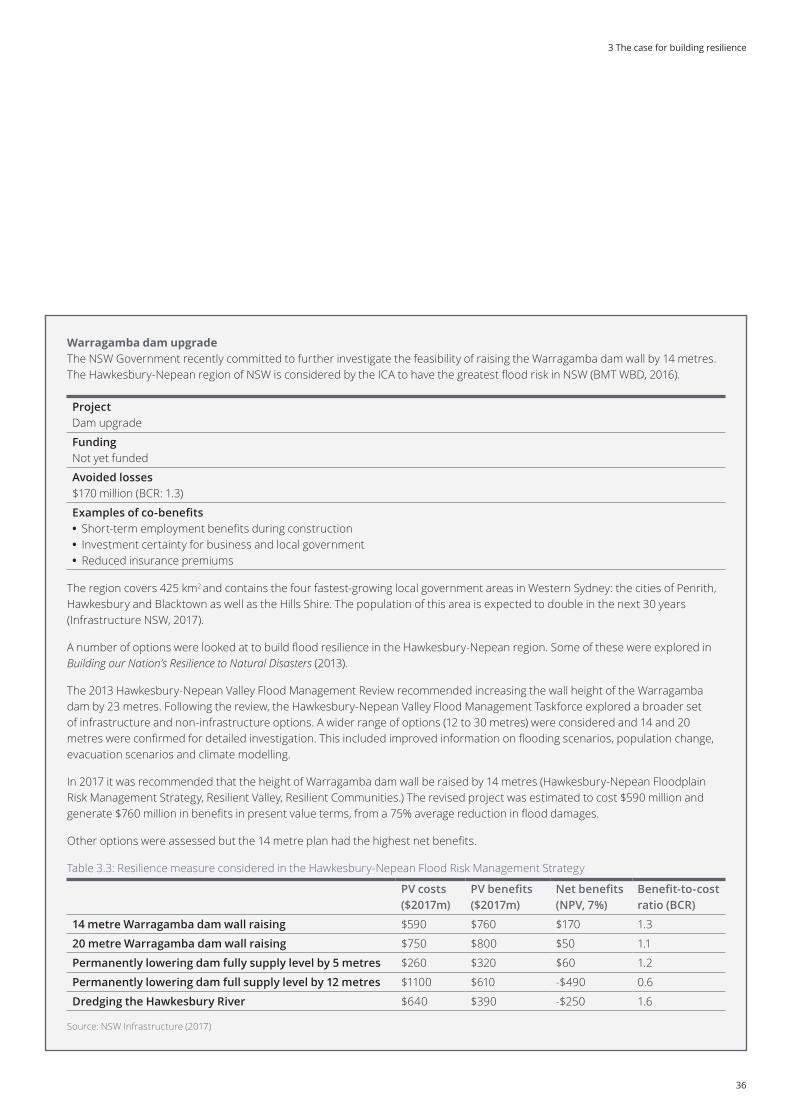
36
Warragamba dam upgradeThe NSW Government recently committed to further investigate the feasibility of raising the Warragamba dam wall by 14 metres. The Hawkesbury-Nepean region of NSW is considered by the ICA to have the greatest flood risk in NSW (BMT WBD, 2016).
ProjectDam upgrade
FundingNot yet funded
Avoided losses$170 million (BCR: 1.3)
Examples of co-benefits • Short-term employment benefits during construction • Investment certainty for business and local government • Reduced insurance premiums
The region covers 425 km2 and contains the four fastest-growing local government areas in Western Sydney: the cities of Penrith, Hawkesbury and Blacktown as well as the Hills Shire. The population of this area is expected to double in the next 30 years (Infrastructure NSW, 2017).
A number of options were looked at to build flood resilience in the Hawkesbury-Nepean region. Some of these were explored in Building our Nation’s Resilience to Natural Disasters (2013).
The 2013 Hawkesbury-Nepean Valley Flood Management Review recommended increasing the wall height of the Warragamba dam by 23 metres. Following the review, the Hawkesbury-Nepean Valley Flood Management Taskforce explored a broader set of infrastructure and non-infrastructure options. A wider range of options (12 to 30 metres) were considered and 14 and 20 metres were confirmed for detailed investigation. This included improved information on flooding scenarios, population change, evacuation scenarios and climate modelling.
In 2017 it was recommended that the height of Warragamba dam wall be raised by 14 metres (Hawkesbury-Nepean Floodplain Risk Management Strategy, Resilient Valley, Resilient Communities.) The revised project was estimated to cost $590 million and generate $760 million in benefits in present value terms, from a 75% average reduction in flood damages.
Other options were assessed but the 14 metre plan had the highest net benefits.
Table 3.3: Resilience measure considered in the Hawkesbury-Nepean Flood Risk Management Strategy
PV costs ($2017m)
PV benefits ($2017m)
Net benefits (NPV, 7%)
Benefit-to-cost ratio (BCR)
14 metre Warragamba dam wall raising $590 $760 $170 1.3
20 metre Warragamba dam wall raising $750 $800 $50 1.1
Permanently lowering dam fully supply level by 5 metres $260 $320 $60 1.2
Permanently lowering dam full supply level by 12 metres $1100 $610 -$490 0.6
Dredging the Hawkesbury River $640 $390 -$250 1.6
Source: NSW Infrastructure (2017)
3 The case for building resilience
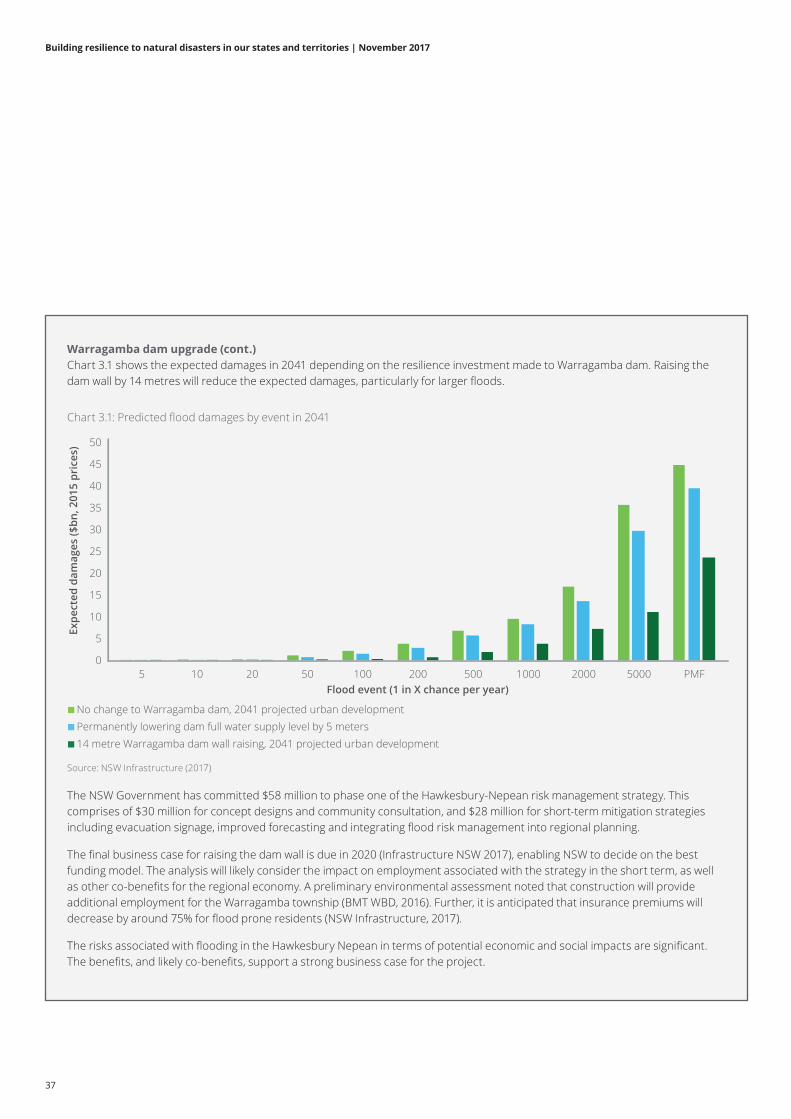
Building resilience to natural disasters in our states and territories | November 2017
37
The NSW Government has committed $58 million to phase one of the Hawkesbury-Nepean risk management strategy. This comprises of $30 million for concept designs and community consultation, and $28 million for short-term mitigation strategies including evacuation signage, improved forecasting and integrating flood risk management into regional planning.
The final business case for raising the dam wall is due in 2020 (Infrastructure NSW 2017), enabling NSW to decide on the best funding model. The analysis will likely consider the impact on employment associated with the strategy in the short term, as well as other co-benefits for the regional economy. A preliminary environmental assessment noted that construction will provide additional employment for the Warragamba township (BMT WBD, 2016). Further, it is anticipated that insurance premiums will decrease by around 75% for flood prone residents (NSW Infrastructure, 2017).
The risks associated with flooding in the Hawkesbury Nepean in terms of potential economic and social impacts are significant. The benefits, and likely co-benefits, support a strong business case for the project.
Chart 3.1: Predicted flood damages by event in 2041
Source: NSW Infrastructure (2017)
0
5
10
15
20
25
30
35
40
45
50
5 10 20 50 100 200 500 1000 2000 5000 PMF
No change to Warragamba dam, 2041 projected urban developmentPermanently lowering dam full water supply level by 5 meters14 metre Warragamba dam wall raising, 2041 projected urban development
Expe
cted
dam
ages
($bn
, 201
5 pr
ices
)
Flood event (1 in X chance per year)
Warragamba dam upgrade (cont.)Chart 3.1 shows the expected damages in 2041 depending on the resilience investment made to Warragamba dam. Raising the dam wall by 14 metres will reduce the expected damages, particularly for larger floods.
38
Box 4: Risk of earthquakes in Australian citiesThe 1989 Newcastle earthquake (magnitude 5.6 on the Richter scale) claimed 13 lives and caused widespread damage, particularly to unreinforced masonry. The total economic cost was estimated at $18.7 billion in 2015 prices (Deloitte Access Economics, 2016).
There is a perception that Australian cities are not at significant risk from earthquakes due to their location away from tectonic plate boundaries. However, although Australia is not on the edge of a plate, the continent does experience earthquakes because the Indo-Australian plate is being pushed north and is colliding with the Eurasian, Philippine and Pacific plates. Adelaide has the highest earthquake hazard level of the Australian capital cities (Geoscience, Australia 2017).
Moderate earthquakes at the level of the Newcastle earthquake occur every two years. Large earthquakes of magnitude six or more occur every five years on average (Munich Re, 2015). While most large earthquakes to date have been in remote and largely unpopulated areas, where the next earthquake will hit is very difficult to predict. Further, Australia's exposure is high, especially from unreinforced masonry buildings and soft-storey construction.
If a 6.2 magnitude earthquake hit Sydney (analogous to the 2011 Christchurch earthquake), Munich Re simulates the potential insured losses would exceed $40 billion. This excludes costs associated with demand surge pricing. Applying the approach used in this report (see Appendix B), this suggests the total economic cost of an earthquake in Sydney could reach $280 billion.
However, earthquake resilience could be improved in Australian cities.
While building codes for structural design were introduced in the 1990s, their impact on earthquake resilience is questionable. Most buildings were built before 1990 and their very low replacement rate (Griffith and Lucas 2016) means only a portion are likely built to code.
Even for those built to comply with relevant standards (Standard AS1170.4), there remains a concern that codes may not be adequate to mitigate risks (Goldsworthy et al., 2015). The extent to which the codes lower the ultimate damage to buildings, especially during severe events, is unclear.
In addition, building codes do not cover non-structural elements exposed to earthquake damage. The 2016 Kaikoura earthquake in New Zealand (magnitude 7.8) highlighted what happens when the internal fitout of homes – such as air-conditioning units, ceiling panels and sprinkler systems – are inadequate. Much of the insured damage from this event related to non-structural damage (IBANZ, 2017).
“Even though the probability of a large earthquake striking close to the CBD of one of the capital cities is low, the damage from such an event is likely to be catastrophic, given the vulnerability of many existing structures, even ones designed in accordance with the current Australian design standards.”Goldsworthy et al. (2015)
3 The case for building resilience
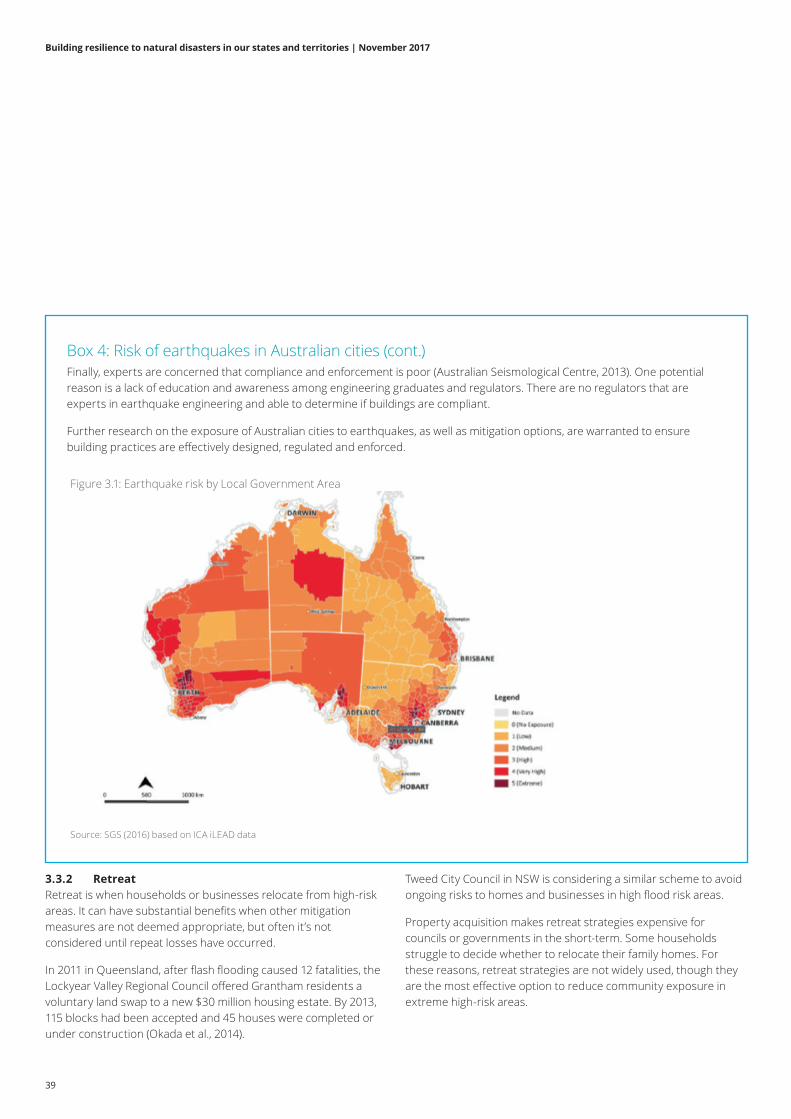
Building resilience to natural disasters in our states and territories | November 2017
39
3.3.2 RetreatRetreat is when households or businesses relocate from high-risk areas. It can have substantial benefits when other mitigation measures are not deemed appropriate, but often it’s not considered until repeat losses have occurred.
In 2011 in Queensland, after flash flooding caused 12 fatalities, the Lockyear Valley Regional Council offered Grantham residents a voluntary land swap to a new $30 million housing estate. By 2013, 115 blocks had been accepted and 45 houses were completed or under construction (Okada et al., 2014).
Tweed City Council in NSW is considering a similar scheme to avoid ongoing risks to homes and businesses in high flood risk areas.
Property acquisition makes retreat strategies expensive for councils or governments in the short-term. Some households struggle to decide whether to relocate their family homes. For these reasons, retreat strategies are not widely used, though they are the most effective option to reduce community exposure in extreme high-risk areas.
Box 4: Risk of earthquakes in Australian cities (cont.)Finally, experts are concerned that compliance and enforcement is poor (Australian Seismological Centre, 2013). One potential reason is a lack of education and awareness among engineering graduates and regulators. There are no regulators that are experts in earthquake engineering and able to determine if buildings are compliant.
Further research on the exposure of Australian cities to earthquakes, as well as mitigation options, are warranted to ensure building practices are effectively designed, regulated and enforced.
Figure 3.1: Earthquake risk by Local Government Area
Source: SGS (2016) based on ICA iLEAD data

40
Tweed Shire Council voluntary house purchase (VHP)Tweed Shire Council has assessed the potential expansion of its voluntary house purchase (VHP) scheme to an additional eight properties. The Council is also looking at including businesses in the scheme after flooding in 2017.
ProjectVoluntary house purchase
FundingLocal government funds and grants via the NSW Office of Environment and Heritage (OEH)
Avoided losses$0.2 million (BCR 1.1)
Examples of co-benefits • Short-term construction jobs • Community resilience • Business investment certainty
In response to repeat floods, Tweed Shire Council enabled strategic retreat from flood-prone areas through a program in Murwillumbah. Introduced in 1989, all but four owners elected to have their properties acquired by the Council. The program was cofunded by the NSW OEH (Tweed Shire Council, 2017).
In 2014, it was recommended that eight additional properties be acquired. The proposal was anticipated to cost $2.8 million and generate benefits of $3 million with a benefit cost ratio (BCR) of 1.1. A proposal to acquire 29 properties was deemed unviable - BCR 0.6 (BMT WMB, 2014).
Floods in March 2017 caused widespread damage to properties in Murwillumbah and surrounding areas - including about 180 businesses (Tweed Shire Council, 2017). As such, the Council will consider expanding the acquisition to all 29 properties and may extend it to businesses too (Tweed Shire Council, 2017). To do so, the Council is applying for OEH state floodplain management grants.
Analysis of the 2017 floods may demonstrate that the program’s expansion is viable. Yet several benefits are intangible, such as community safety, and are more difficult to monetise. For example, relocating businesses to less flood-prone areas would reduce flood impacts. However, it would also improve regional investment outcomes (Tweed Shire Council, 2017) and provide short-term construction jobs, greater community resilience and business confidence - that is, a double dividend outcome.
Tangible and intangible disaster impacts should be considered together, as well as the co-benefits of resilience initiatives. If not, the benefits of interventions such as retreat are likely to be underestimated and under adopted.
Table 3.4: Comparison of retreat options in Murwillumbah
Proposed expansion (8 houses) Proposed expansion (29 houses)
Present value costs ($m) 2.8 10.3
Present value benefits ($m) 3.0 5.6
Net present value ($m) 0.2 -4.7
Benefit-to-cost ratio (BCR) 1.1 0.6
Source: BMT WMB (2014)
Local councils need to work closely with their communities and other jurisdictions when considering retreat as a solution and find adequate funding.
3 The case for building resilience
Building resilience to natural disasters in our states and territories | November 2017
41
3.4 Community measures – Building resilient communitiesPhysical resilience measures can significantly reduce disaster impacts but they can’t stop them from happening. The remaining impacts, however, can be lessened by community measures.
These include awareness activities that enable individuals, businesses and governments, including emergency services, to be better prepared when a disaster occurs, such as:
• Early warning systems
• Community education sessions
• Emergency and evacuation planning and kits
• House and property maintenance.
Many of these measures are relatively inexpensive and are often sustained by volunteers. However, because their benefits are indirect, and accrue over time as behaviour is modified, they are difficult to measure. Their significant net benefits are broadly acknowledged (PC, 2015 and Gibbs et al., 2015) as is their role as an important complement to physical measures.
Community measures are particularly beneficial in high-risk areas or in areas with transient or growing populations, where new residents may not be familiar with appropriate responses to natural disasters.
They are also important in low socioeconomic areas where there are social barriers to resilience. After Hurricane Katrina caused floods in New Orleans in 2005, areas in the north-east corner of the city recovered faster than elsewhere, despite lower average income and no evidence of special government assistance. The north-east repopulated at a rate of 90% compared to the southeast, which had a re-population rate of less than 35%. The difference is attributed to strong local community leaders who encouraged social bonding programs (Aldrich, 2014).
Alongside other mitigation measures, community awareness initiatives were found to be of relatively high value in avoiding losses in tropical cyclone areas (Urbis, 2015) in Australia.
Several Australian states run bushfire resilience programs, some of which engage the private and community sectors such as the Victorian Community Fireguard Program and South Australia’s Community Fire Safe Groups. Given the scale of bushfires - the Black Saturday fires burnt 4,500km2 of land in Victoria - it would be difficult to implement emergency services activities without community engagement.
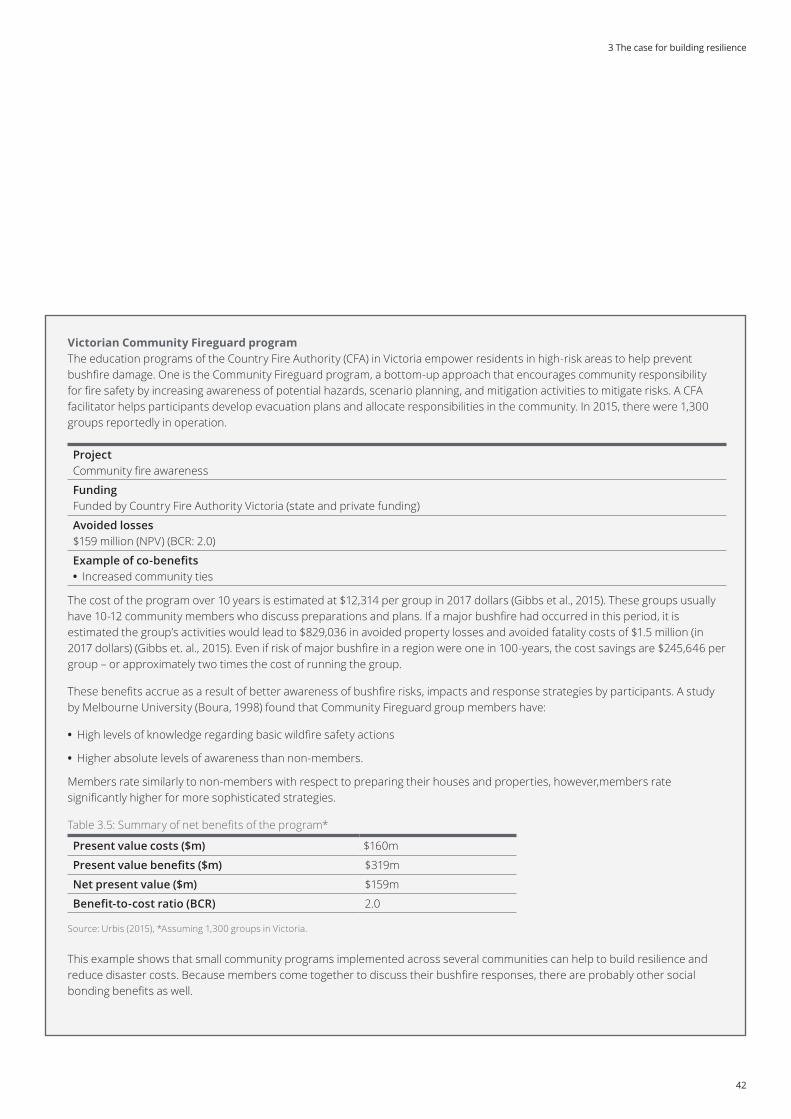
42
Victorian Community Fireguard programThe education programs of the Country Fire Authority (CFA) in Victoria empower residents in high-risk areas to help prevent bushfire damage. One is the Community Fireguard program, a bottom-up approach that encourages community responsibility for fire safety by increasing awareness of potential hazards, scenario planning, and mitigation activities to mitigate risks. A CFA facilitator helps participants develop evacuation plans and allocate responsibilities in the community. In 2015, there were 1,300 groups reportedly in operation.
ProjectCommunity fire awareness
FundingFunded by Country Fire Authority Victoria (state and private funding)
Avoided losses$159 million (NPV) (BCR: 2.0)
Example of co-benefits • Increased community ties
The cost of the program over 10 years is estimated at $12,314 per group in 2017 dollars (Gibbs et al., 2015). These groups usually have 10-12 community members who discuss preparations and plans. If a major bushfire had occurred in this period, it is estimated the group’s activities would lead to $829,036 in avoided property losses and avoided fatality costs of $1.5 million (in 2017 dollars) (Gibbs et. al., 2015). Even if risk of major bushfire in a region were one in 100-years, the cost savings are $245,646 per group – or approximately two times the cost of running the group.
These benefits accrue as a result of better awareness of bushfire risks, impacts and response strategies by participants. A study by Melbourne University (Boura, 1998) found that Community Fireguard group members have:
• High levels of knowledge regarding basic wildfire safety actions
• Higher absolute levels of awareness than non-members.
Members rate similarly to non-members with respect to preparing their houses and properties, however,members rate significantly higher for more sophisticated strategies.
Table 3.5: Summary of net benefits of the program*
Present value costs ($m) $160m
Present value benefits ($m) $319m
Net present value ($m) $159m
Benefit-to-cost ratio (BCR) 2.0
Source: Urbis (2015), *Assuming 1,300 groups in Victoria.
This example shows that small community programs implemented across several communities can help to build resilience and reduce disaster costs. Because members come together to discuss their bushfire responses, there are probably other social bonding benefits as well.
3 The case for building resilience
Building resilience to natural disasters in our states and territories | November 2017
43
South Australian Community Fire SafeThe broader resilience benefits of community initiatives should not be ignored when considering resilience projects.
ProjectCommunity fire awareness
FundingSouth Australian Country Fire Service (state funded)
Avoided losses$107 million
Example of co-benefits • Increased community ties
The South Australia Country Fire Service co-ordinates the Community Fire Safe program. It encourages residents in high-risk areas to form small groups and work together to prepare and protect their families and properties from bushfires. Some of the preparation includes:
• Making plans with more vulnerable community members
• Establishing telephone trees to communicate during bushfires
• Organising neighbourhood working bees to prepare properties
• Buying fire equipment in bulk, including protective clothing.
In January 2015, the Adelaide Hills’ most destructive fire in 30 years broke out at Sampson Flat, burning 12,569 hectares of public and private land. Members of the Community Fire Safe program were 6.7 times more likely to have a bushfire response plan since becoming a member than prior to being a member (Bushfire and Natural Hazards CRC, 2015).
Though it hasn’t been evaluated, assuming the same costs and benefits as Victoria’s community fireguard program suggests the SA program has net benefits of approximately $107 million (with 876 groups across the state).
The most common reason for participation was concern about bushfire safety (90%) (Bushfire and Natural Hazards, 2015). There have been co-benefits too, including increased social interaction, with 77% of members joining the program to connect with neighbours.

44
Tropical cyclone community programEducation and preparedness programs, as well as household actions, are often very successful community resilience measures.
To demonstrate, Urbis (2015) assessed the effects of using community awareness programs to mitigate damage from cyclones in North Queensland.
ProjectCommunity awareness programs
FundingTo be determined
Avoided losses$304-$765 per household
Examples of co-benefits • Reduction in minor damage claims • Strengthened community networks
They assessed educational programs on matters including minor water damage, loose shade cloths and unfixed objects in gardens, as well as minimising fencing damage during a cyclone (Urbis, 2015). Minor claims like these are a significant cause of damage during cyclones. They were estimated to make up 86% of total claims for Tropical Cyclone Yasi and comprised 29% of the total insured cost (Smith and Henderson, 2015).
The proposed program costs between $55 and $136 per household and has accrued between $440 to $820 in benefits (Urbis, 2015). Benefits are measured in avoided losses as a result of the mitigation measure, using estimates from James Cook University’s Cyclone Testing Station. The analysis suggests a net benefit of between $304 and $765 per household.
Table 3.6: Summary of net benefits of the program
Summary of net benefits per household
Cost per household ($) $55-$136
Benefits per household ($) $440-$820
Net present value ($) $304-$765
Benefit-to-cost ratio (BCR) 3.2-14.9
Source: Urbis (2015)
3 The case for building resilience
Building resilience to natural disasters in our states and territories | November 2017
45
3.5 Embedding resilience in decision-makingThese case studies are evidence of the economic benefits of building resilience. The quantified benefits are underestimated as they exclude the avoided intangible losses associated with disasters and the co-benefits that occur even in the absence of a disaster.
The case studies highlight key lessons for accelerating the uptake of resilience measures. These are:
• Harness local knowledge on resilience opportunities Local communities are best placed to advise on resilience
opportunities. While physical vulnerability to disasters can be determined by engineers and planners, social vulnerability to natural disasters is more complex and depends on a range of socioeconomic factors (Harwood, 2014). Better collaboration and consultation could accelerate the adoption of initiatives.
• Encourage an integrated approach Physical preparedness can only mitigate part of the disaster risk.
Community measures remain essential to ensuring people can respond and recovery quickly. An integrated approach can ensure businesses and communities take responsibility for residual risks. For example, surveys before and after the Lismore flood levee was constructed in 2005 found the number of businesses with flood action plans fell from 97% in 2003 to 78% in 2017 (Risk Frontiers, 2017), suggesting engagement is needed even after infrastructure is built.
• Use appropriate cost-benefit analysis (CBA) methods to prioritise investment
Funding for resilience is scarce and requires strong evidence to ensure solutions are cost-effective and achieve long-term benefits.
• Consider the co-benefits beyond avoided losses Mandating, or enabling, investments to consider opportunities
for resilience can ensure the double dividend is harnessed.
• Mainstream resilience into planning, land use and building requirements
The difficulty and high-upfront cost of adaptive measures, such as retrofitting buildings or retreating from vulnerable locations, emphasises the need to ensure resilience is considered in planning and land use decisions. Addressing resilience earlier will save money long-term.
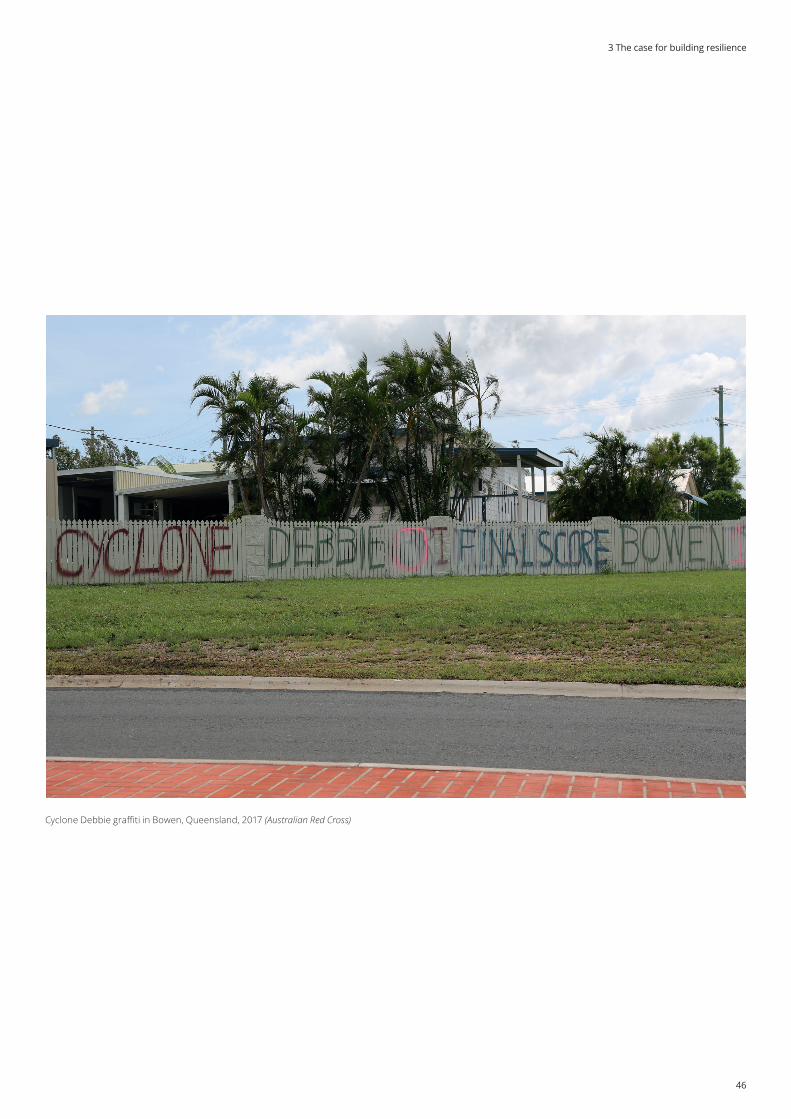
46
Cyclone Debbie graffiti in Bowen, Queensland, 2017 (Australian Red Cross)
3 The case for building resilience
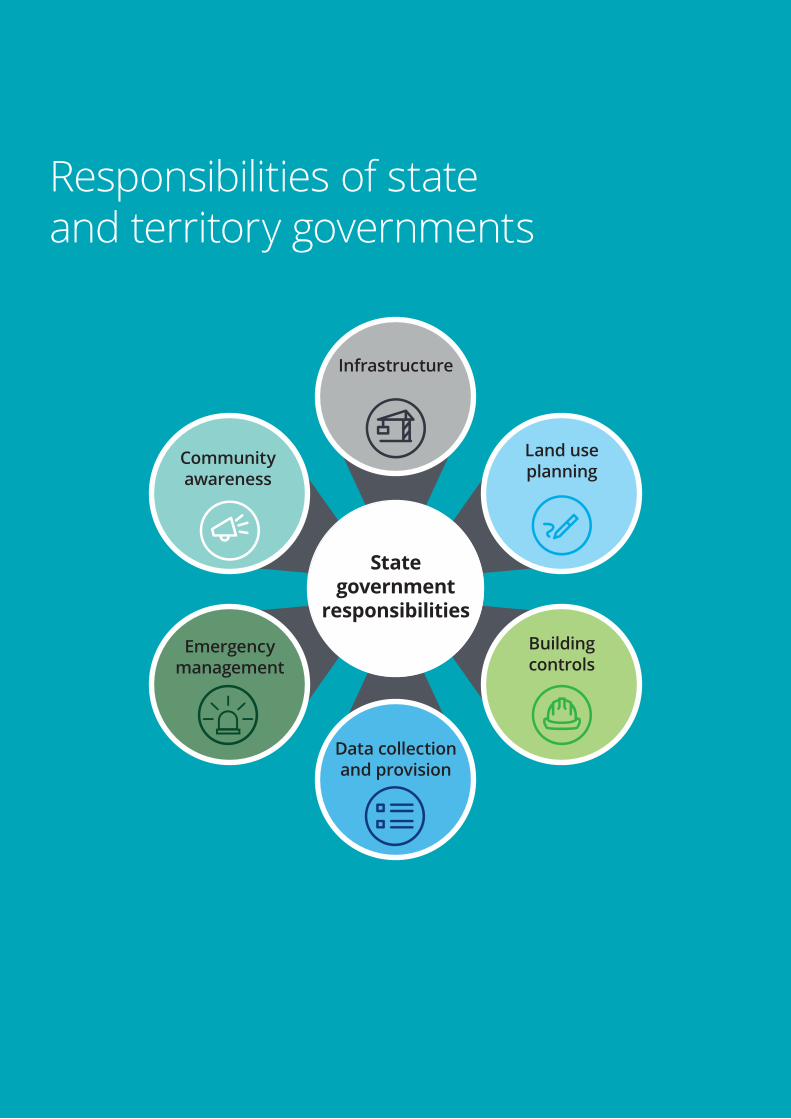
Building resilience to natural disasters in our states and territories | November 2017
47
Land use planning
Building controls
Data collection and provision
Community awareness
Emergency management
Infrastructure
State government
responsibilities
Responsibilities of state and territory governments
48
4 The role of the states in building disaster resilience
Key points • State governments are responsible for emergency management and natural disaster prevention and preparedness through data collection and provision, infrastructure and land use planning, building codes and community initiatives.
• State governments directly fund disaster resilience under the Natural Disaster Resilience Program (NDRP) with federal co-funding.
• Beyond direct funding, policy settings also influence resilience. Yet state infrastructure planning requirements typically make little reference to resilience.
• Working together, state and local governments and the private sector can leverage existing capabilities to drive resilience.
• State and territory governments face barriers to building resilience including short-term policy cycles as well as limited funding and community buy-in.
“State and territory governments deliver a broad range of services, administer a significant body of legislation and manage a substantial number of assets and infrastructure, including assets and infrastructure of national significance.”COAG National Strategy for Disaster Resilience (2012)
Natural disasters are a significant cost for state governments. Direct impacts after a disaster include damage to public assets and the disruption of services. Indirect impacts include disruption to business and family life, productivity loss and increased costs to health services which have flow-on fiscal impacts.
Recovery costs are often unfinanced and state governments must direct resources away from other projects to finance them. As well as upfront costs to government, indirect impacts cost state economies in the medium to longer term. Disasters are a large unfunded liability for government.
Resilience investment can reduce this liability and minimise disruption when a disaster occurs. But there is also a broad set of policies and programs – within and outside emergency management agencies – that play an important role in promoting resilience among communities and business.
4.1 State roles and responsibilities for disaster resilienceAll levels of government play a role in disaster resilience. In 2009, the National Partnership Agreement (NPA) for Natural Disaster Resilience established a whole-of-nation approach recognising that a coordinated and cooperative effort was needed to withstand and recover from natural disasters. Subsequently, the National Strategy for Disaster Resilience (NSDR) was adopted by the Council of Australian Governments (COAG) in 2011. The strategy provides high-level guidance to government, business, community and the not-for-profit sectors.
More recent agreements have confirmed this joint responsibility too, including the Australian Government’s Critical Infrastructure Resilience Strategy (2015) and the National Climate Change Adaptation Action Plan.
4 The role of the states in building disaster resilience
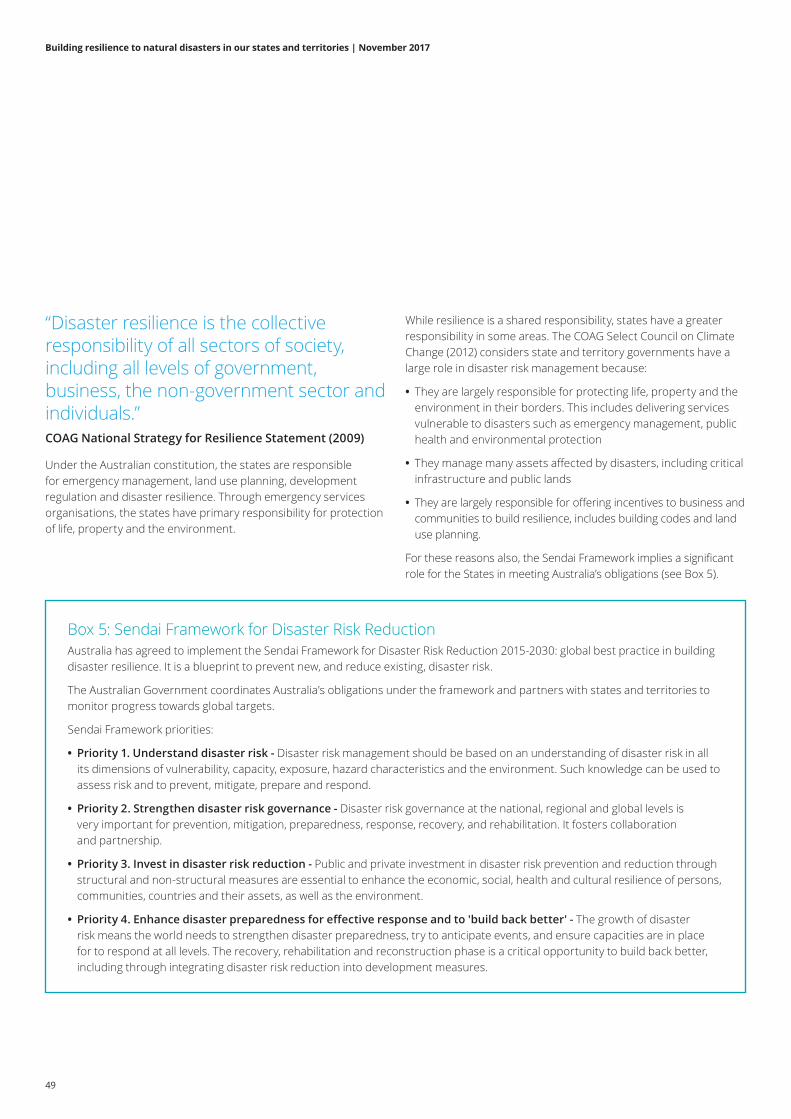
Building resilience to natural disasters in our states and territories | November 2017
49
“Disaster resilience is the collective responsibility of all sectors of society, including all levels of government, business, the non-government sector and individuals.” COAG National Strategy for Resilience Statement (2009)
Under the Australian constitution, the states are responsible for emergency management, land use planning, development regulation and disaster resilience. Through emergency services organisations, the states have primary responsibility for protection of life, property and the environment.
Box 5: Sendai Framework for Disaster Risk ReductionAustralia has agreed to implement the Sendai Framework for Disaster Risk Reduction 2015-2030: global best practice in building disaster resilience. It is a blueprint to prevent new, and reduce existing, disaster risk.
The Australian Government coordinates Australia’s obligations under the framework and partners with states and territories to monitor progress towards global targets.
Sendai Framework priorities:
• Priority 1. Understand disaster risk - Disaster risk management should be based on an understanding of disaster risk in all its dimensions of vulnerability, capacity, exposure, hazard characteristics and the environment. Such knowledge can be used to assess risk and to prevent, mitigate, prepare and respond.
• Priority 2. Strengthen disaster risk governance - Disaster risk governance at the national, regional and global levels is very important for prevention, mitigation, preparedness, response, recovery, and rehabilitation. It fosters collaboration and partnership.
• Priority 3. Invest in disaster risk reduction - Public and private investment in disaster risk prevention and reduction through structural and non-structural measures are essential to enhance the economic, social, health and cultural resilience of persons, communities, countries and their assets, as well as the environment.
• Priority 4. Enhance disaster preparedness for effective response and to 'build back better' - The growth of disaster risk means the world needs to strengthen disaster preparedness, try to anticipate events, and ensure capacities are in place for to respond at all levels. The recovery, rehabilitation and reconstruction phase is a critical opportunity to build back better, including through integrating disaster risk reduction into development measures.
While resilience is a shared responsibility, states have a greater responsibility in some areas. The COAG Select Council on Climate Change (2012) considers state and territory governments have a large role in disaster risk management because:
• They are largely responsible for protecting life, property and the environment in their borders. This includes delivering services vulnerable to disasters such as emergency management, public health and environmental protection
• They manage many assets affected by disasters, including critical infrastructure and public lands
• They are largely responsible for offering incentives to business and communities to build resilience, includes building codes and land use planning.
For these reasons also, the Sendai Framework implies a significant role for the States in meeting Australia’s obligations (see Box 5).
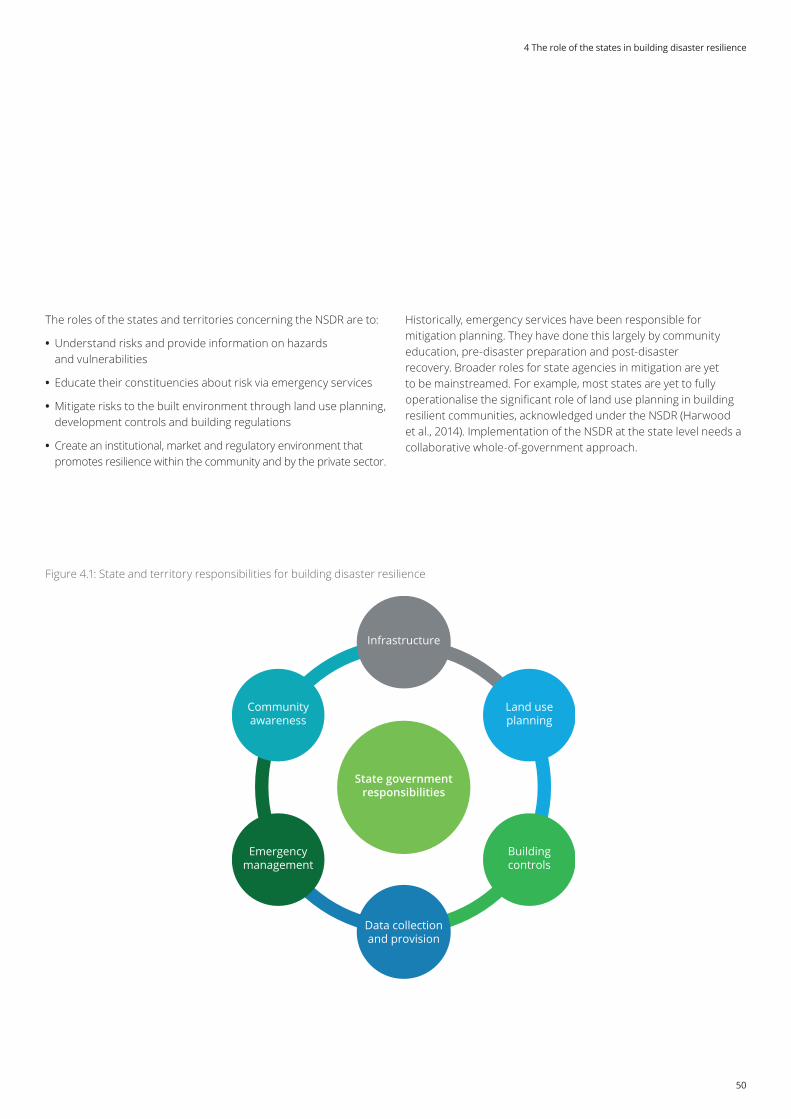
50
The roles of the states and territories concerning the NSDR are to:
• Understand risks and provide information on hazards and vulnerabilities
• Educate their constituencies about risk via emergency services
• Mitigate risks to the built environment through land use planning, development controls and building regulations
• Create an institutional, market and regulatory environment that promotes resilience within the community and by the private sector.
Historically, emergency services have been responsible for mitigation planning. They have done this largely by community education, pre-disaster preparation and post-disaster recovery. Broader roles for state agencies in mitigation are yet to be mainstreamed. For example, most states are yet to fully operationalise the significant role of land use planning in building resilient communities, acknowledged under the NSDR (Harwood et al., 2014). Implementation of the NSDR at the state level needs a collaborative whole-of-government approach.
Figure 4.1: State and territory responsibilities for building disaster resilience
State government responsibilities
Community awareness
Emergency management
Building controls
Data collection and provision
Land use planning
Infrastructure
4 The role of the states in building disaster resilience
Building resilience to natural disasters in our states and territories | November 2017
51
A summary of state responsibilities for disaster resilience and areas where mitigation strategies could be developed is provided in Figure 4.1.
4.2 InfrastructureStates fund and/or approve development of new infrastructure or modifications to existing infrastructure to mitigate risk. Table 4.1 shows some examples, including levees and seawalls. Given that funding to retrofit infrastructure is limited, mitigation is best considered by states when considering funds and approvals for new infrastructure.
Table 4.1: Examples of mitigation infrastructure
Peril Infrastructure
Flood
Dams are barriers built across waterways to control the flow of water down rivers and creeks.
Levees are artificially raised embankments or walls to reduce water overflow from a river or creek.
BushfireVegetation management through controlled burning or pre-emptive cutting of bushland. Moving overhead electricity lines underground.
StormSeawalls are barriers to prevent tides and waves from causing erosion and coastal flooding.
Source: Andrews et al. (2016)
At present, state infrastructure planning requirements typically make little reference to resilience or how it should be achieved. It is assumed building codes provide adequate standards, however there are often more cost-effective options to build a more resilient structure.
The Roundtable report, Building Our Nation’s Resilience to Natural Disasters (2016), gives practical guidance on integrating resilience into infrastructure planning and approval. State-wide risk assessments are a useful first step for states to integrate disaster resilience into infrastructure decisions and are currently underway or complete in all states and territories.
In addition to setting the rules for private infrastructure investment, it is the states that fund critical infrastructure such as energy, water and transport and health. Natural disasters can cause major disruptions to this infrastructure.
The Australian Government has taken a leadership role in ensuring critical infrastructure is resilient. The Critical Infrastructure Resilience Strategy (2015) is a nationally consistent guide to constructing and protecting resilient infrastructure. The government also operates a Trusted Information Sharing Network (TISN) for business and government to share information on infrastructure vulnerabilities.
Each state has a role in developing resilience strategies for its own critical infrastructure. Victoria, for example, released a Critical infrastructure Resilience Strategy in 2017 which sets out specific responsibilities for each government agency as well as for other owners of critical infrastructure.
Infrastructure mitigation in QueenslandIn 2013, Cyclone Oswald damaged infrastructure that had already been damaged (and restored) after disasters in 2011 and 2012. In 2013 the Australian and Queensland governments undertook an $80 million program to restore local infrastructure to a more resilient standard.
The program reduced the impact of subsequent disasters on the 71 restored assets. In subsequent cyclone events only two assets sustained severe damage, while 82% received no damage and 10% had superficial damage. While $16 million of the $80 million was spent to enhance resilience, more than $22 million was saved in restoration costs.
Source: Framework for Betterment (QRA, 2015)
52
4.3 Land use planning
“Land use planning systems are yet to fully embrace their role in mitigating the risks to loss of life, property damage and destruction of vital infrastructure arising from natural hazards and climate change.”Harwood et al. (2014)
Land use planning is state governments' strongest tool to mitigate natural disaster risk. Planning frameworks can identify land with vulnerabilities and ensure these risks are considered in decisions. Consideration may then be given to development conditions, engineering requirements, the exclusion of certain activities and no-build zones in high-risk areas.
Such decisions have a big impact on where communities live and work and, thus, how exposed they are to future disasters. After development has begun, land use rights cannot be changed, even if new knowledge becomes available.
Australia’s population is growing and urbanising rapidly. Between 2017 and 2031, three-quarters of population growth will be in Sydney, Melbourne, Brisbane and Perth (ABS, 2016), pushing their boundaries into new areas. With disaster costs expected to reach $39 billion a year by 2050, it is important to get land use planning right, particularly in newly urbanised areas.
State and local land use planning regulation makes limited reference to natural disaster risk. There are many other competing factors at play when zoning land, for example political pressures and the need for affordable housing. But a range of tools exist to help governments manage natural disaster risk, including (PC, 2014):
• Prohibitions or controls on land use and development in areas of high risk, through the application of zones
• Prescribed minimum floor levels above applicable flood levels
• Required buffer zones between bushland or coastlines and residential areas
• Required building materials such as fire retardant materials
• Provision of adequate drainage in new developments.
Nonetheless, it is concerning that development continues to be approved in high-risk areas and that, in some instances, good local government decisions are overturned (PC, 2014).
Similarly, there is limited best practice resilience guidance for people who work in planning. In 2013, the Land Use Planning and Building Codes Taskforce established within the Australia-New Zealand Emergency Management Committee (ANZEMC) reviewed land use and building codes to develop a roadmap for integrated legislation, partnerships and training. The PC inquiry (2014) recommended state and territory governments prioritise implementation of this roadmap.
Around 85% of the Australian population now lives in coastal regions. These areas are of immense economic, social and environmental importance to the nation. Perhaps as a result, almost all states pro-actively consider natural hazards in their coastal planning and management strategies. For example, coastal planning policies in Western Australia that specify new buildings and infrastructure be built at a minimum distance from the coastline. However, these planning frameworks primarily relate to sea-level rise rather than natural disaster threats.
Local government plays a critical role in enforcing state zoning decisions. Councils assess development applications and consider if areas are appropriate for development based on the state classification of the land.
To improve guidance for planners, the Planning Institute of Australia released a report, National Land Use Planning Guidelines for Disaster Resilient Communities, to mainstream disaster resilience into Australian planning practice (PIA, 2017).
“Responsibility ultimately rests with state governments to clearly articulate the state-wide natural disaster risk appetite in planning policy frameworks and the embedded trade-offs, guide local governments’ interpretation and implementation of these policies, and ensure that local planning schemes and development decisions are consistent with state planning policy.”PC Inquiry into natural disaster funding (2014)
4 The role of the states in building disaster resilience
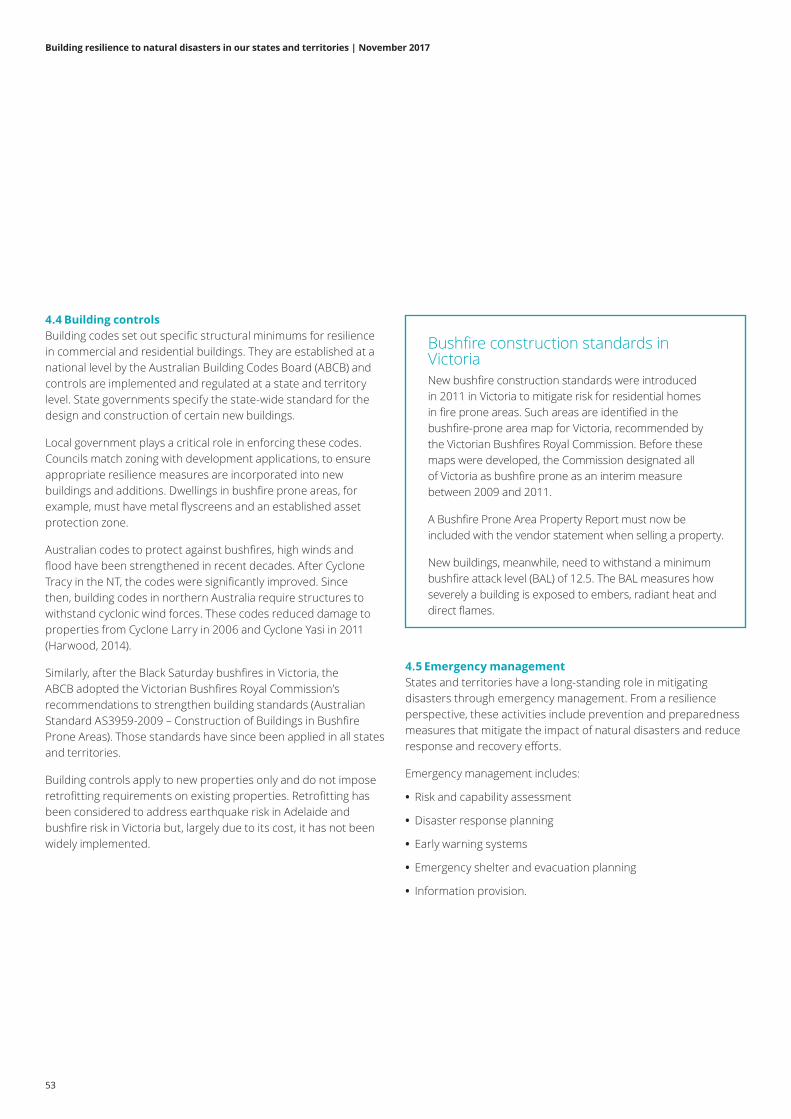
Building resilience to natural disasters in our states and territories | November 2017
53
4.4 Building controlsBuilding codes set out specific structural minimums for resilience in commercial and residential buildings. They are established at a national level by the Australian Building Codes Board (ABCB) and controls are implemented and regulated at a state and territory level. State governments specify the state-wide standard for the design and construction of certain new buildings.
Local government plays a critical role in enforcing these codes. Councils match zoning with development applications, to ensure appropriate resilience measures are incorporated into new buildings and additions. Dwellings in bushfire prone areas, for example, must have metal flyscreens and an established asset protection zone.
Australian codes to protect against bushfires, high winds and flood have been strengthened in recent decades. After Cyclone Tracy in the NT, the codes were significantly improved. Since then, building codes in northern Australia require structures to withstand cyclonic wind forces. These codes reduced damage to properties from Cyclone Larry in 2006 and Cyclone Yasi in 2011 (Harwood, 2014).
Similarly, after the Black Saturday bushfires in Victoria, the ABCB adopted the Victorian Bushfires Royal Commission’s recommendations to strengthen building standards (Australian Standard AS3959-2009 – Construction of Buildings in Bushfire Prone Areas). Those standards have since been applied in all states and territories.
Building controls apply to new properties only and do not impose retrofitting requirements on existing properties. Retrofitting has been considered to address earthquake risk in Adelaide and bushfire risk in Victoria but, largely due to its cost, it has not been widely implemented.
Bushfire construction standards in VictoriaNew bushfire construction standards were introduced in 2011 in Victoria to mitigate risk for residential homes in fire prone areas. Such areas are identified in the bushfire-prone area map for Victoria, recommended by the Victorian Bushfires Royal Commission. Before these maps were developed, the Commission designated all of Victoria as bushfire prone as an interim measure between 2009 and 2011.
A Bushfire Prone Area Property Report must now be included with the vendor statement when selling a property.
New buildings, meanwhile, need to withstand a minimum bushfire attack level (BAL) of 12.5. The BAL measures how severely a building is exposed to embers, radiant heat and direct flames.
4.5 Emergency managementStates and territories have a long-standing role in mitigating disasters through emergency management. From a resilience perspective, these activities include prevention and preparedness measures that mitigate the impact of natural disasters and reduce response and recovery efforts.
Emergency management includes:
• Risk and capability assessment
• Disaster response planning
• Early warning systems
• Emergency shelter and evacuation planning
• Information provision.
54
All jurisdictions have a state emergency management committee, (SEMC) or equivalent, to coordinate emergency services with other agencies and local government. This includes sharing risk, vulnerability and treatment options. In recent years, governments have made a significant effort to shift emergency services management towards preparedness and resilience.
Risk assessment and planning are key emergency management activities. This includes regular monitoring of state vulnerability, post-disaster impact reviews and resilience recommendations. Following the National Emergency Risks Assessment Guidelines (NERAG), all states have a role in undertaking state-wide risk assessments and emergency management planning at the state, regional and local level.
To effectively mitigate against disasters, agencies are increasingly trying to understand regional capabilities and the vulnerability of communities to disasters. In many cases, local communities and businesses are already engaged in emergency management and place-based planning.
State wide risk assessmentsThe NDRP requires each state profile its hazards via a state-wide risk assessment. Each state did this in 2009, providing a profile of natural disaster risks across Australia.
An update to the NDRP in 2015 decided these risk assessments would be reviewed, and publicly released, in June 2017. The latest assessments cover all hazards and capabilities, as well as risks.
Most states have widened the definition of ‘hazard’ to include more disaster risks. For example, Tasmania now includes heatwaves and coastal inundation.
4.6 Data collection and provision
“While several states are now publishing hazard-related data in portals that can be accessed by the public, there is little consistency in what data is available, how it is developed, licensing conditions and how it is made available.”
Insurance Council of Australia (2016)
As Building an Open Platform for Natural Disaster Resilience Decisions (2014) showed, natural hazard data should be publicly available to better inform decisions and research across emergency management, land use planning and insurance. Having well-informed individuals who are empowered to make decisions is part of a socially inclusive and responsible society.
These data include:
• Foundational data such as asset location, population and topography
• Hazard data such as bushfire and flood mapping
• Historical impact data such as insured losses, deaths and injuries.
The data are currently collected by all levels of government, academics and the private sector. State and territory governments are a particularly important source of hazard data, such as flood and bushfire mapping.
Hazard data is used by a broad audience, including:
• Insurers, to assess and price risk
• Consumers and the community, to understand their exposure and where best to build
• State and local governments, to plan resilience initiatives.
4 The role of the states in building disaster resilience
Building resilience to natural disasters in our states and territories | November 2017
55
Flood data access programsThere has been recent improvements in the collection and public provision of flood maps. A number of states have developed, or are developing, detailed and publicly available flood maps.
The NSW flood data access program aims to improve the sharing of key government data. This partnership between the NSW State Emergency Service (SES) and the NSW Office of Environment and Heritage has two initiatives:
• The NSW flood data portal gives local government and other stakeholders access to floodplain risk management studies shared by local councils
• The NSW flood database aggregates information on flood risk.
Victoria is constructing a similar, more detailed portal, which won an international award for innovation.
The interactive FloodCheck Map in Queensland combines state and local government data to show flood lines, imagery and the extent of floodplains. For example, it includes the detailed flood maps developed and released in 2017 by Mackay Regional Council that helped the safe evacuation of residents following Cyclone Debbie. The service will likely lead to more accurate insurance pricing too, according to local media (Daily Mercury, 2017).
Data collection under the Sendai FrameworkTo meet its Sendai obligations, Australia must monitor data on resilience and disaster impacts. Some of this data is only available at the state level. The data will enable Australia to report against the Sendai seven global targets:
1. Substantially reduce global disaster mortality by 2030
2. Substantially reduce the number of affected people globally by 2030
3. Reduce direct disaster economic loss in relation to global gross domestic product (GDP) by 2030
4. Substantially reduce disaster damage to critical infrastructure and disruption of basic services, among them health and educational facilities
5. Substantially increase the number of countries with national and local disaster risk reduction strategies by 2020
6. Substantially enhance international cooperation to developing countries through adequate and sustainable support to complement their national actions for implementation of this Framework by 2030
7. Substantially increase the availability of and access to multi-hazard early warning systems and disaster risk information and assessments to the people by 2030.
In its 2014 inquiry, the Productivity Commission recommended all levels of government make new and existing hazard data publicly available. While access to risk and hazard data has increased across state and territory governments, there are still significant barriers.
The collection, use and linking of this data is currently ad hoc. There is significant room for improvement in the availability and accessibility of data for all hazards in Australian jurisdictions. The current data are not adequate to inform decisions and encourage broader analysis and innovative ideas. The ICA (2016) states the absence of a central data repository is the most significant barrier to accessibility.
A repository could:
• Help communities understand their specific hazards
• Reduce duplication of effort between and within jurisdictions
• Enable governments to more effectively coordinate resilience activities.
Consideration should also be given to including simplified data for consumers and detailed data for insurers, industry and government.
In 2017 the Australian government is working with the states to review data availability and develop a national strategy for state data collection and reporting.
56
Keeping our mob safeAustralia has had a ‘keeping our mob safe’ strategy for emergency management in remote Aboriginal communities for more than 10 years. The program is currently under review to ensure it meets the needs of Indigenous communities.
The strategy was developed through extensive consultation with members of Indigenous communities and provides seven priorities for a coordinated and cooperative approach to emergency management.
In 2015, the Australian government provided $200,000 to pilot community based and community led emergency management training in Indigenous communities in central, northern and north-west Australia. The training built local capacity and helped communities refine their local emergency management plans.
4.7 Community awareness There are lots of successful community training, networking and awareness-raising activities improving disaster resilience in Australia. These include collaborative activities between state and local governments, businesses and community groups.
States and territories can effectively engage their communities in disaster management and establishing shared responsibility for planning. Without this, inactivity or complacency before a disaster can exacerbate its impacts. SES volunteers are a good example of how community engagement can help.
To be effective, states and territories need to understand the needs, strengths, and weaknesses of their communities. Socially vulnerable communities are often in high-risk areas, yet are less equipped to withstand and recover from a disaster. Additionally, they generally have lower levels of insurance.
A 2016 survey of WA's emergency services agencies found they believed only two regional communities had a 'very high understanding' of the hazards facing them. In general, there was a low to moderate level of community understanding of hazards.
Even where people knew what to do during an emergency, there were doubts about if they would do it. The results may reflect WA’s geographical diversity, and the number of hazards it faces, though it still suggests innovative approaches for community engagement are needed.
Information and capacity building, before and during a disaster, are critical to empowering communities to prepare, adapt and respond to disasters. Making clear, consistent and reliable information and advice accessible sees communities recover faster. States and territories are beginning to embrace communication technologies, including apps and social media for emergency planning, preparedness and timely warning messages.
“Disasters do not impact everyone in the same way, and it is often our vulnerable community members who are the hardest hit”
National Strategy for Disaster Resilience (2009)
4 The role of the states in building disaster resilience
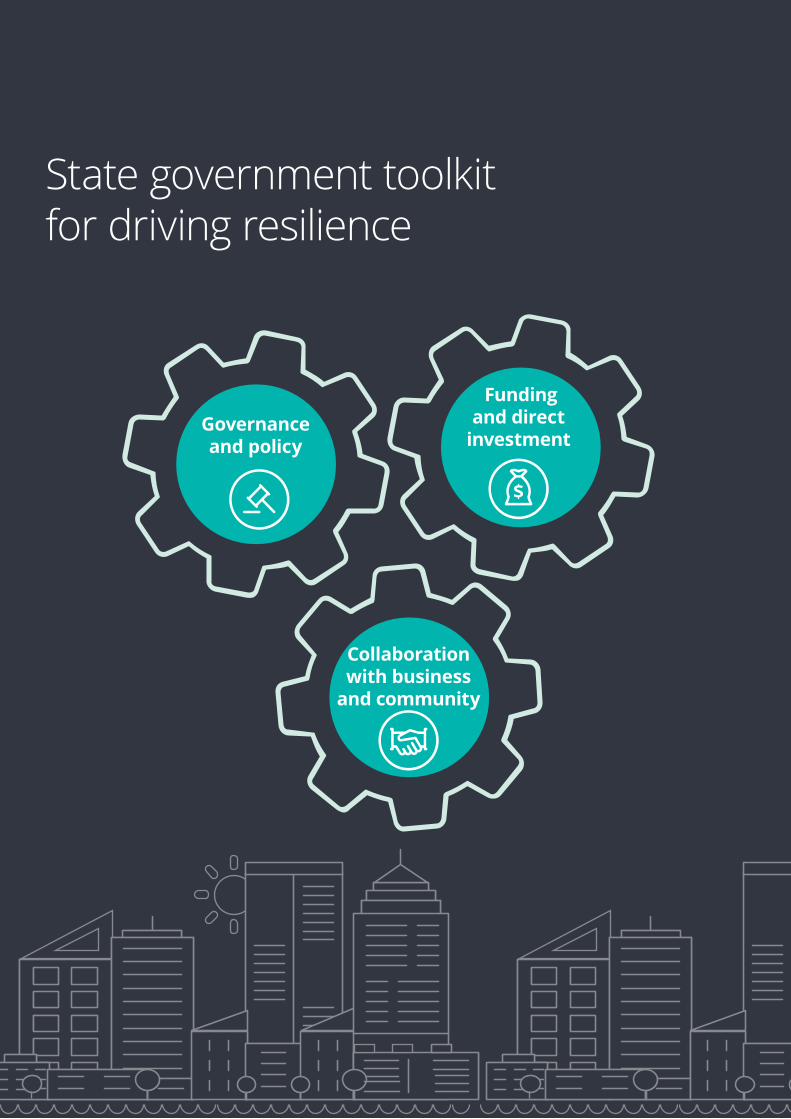
Building resilience to natural disasters in our states and territories | November 2017
57
State government toolkit for driving resilience
Governance and policy
Funding and direct
investment
Collaboration with business
and community
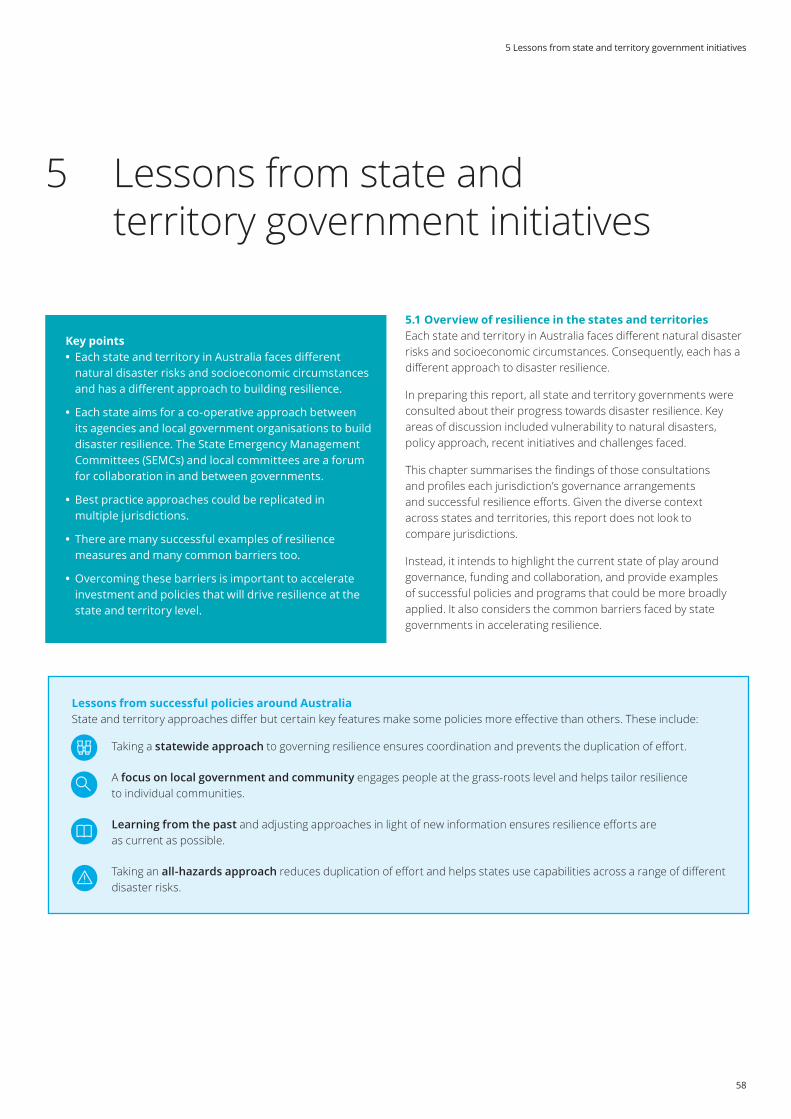
58
5 Lessons from state and territory government initiatives
Key points • Each state and territory in Australia faces different natural disaster risks and socioeconomic circumstances and has a different approach to building resilience.
• Each state aims for a co-operative approach between its agencies and local government organisations to build disaster resilience. The State Emergency Management Committees (SEMCs) and local committees are a forum for collaboration in and between governments.
• Best practice approaches could be replicated in multiple jurisdictions.
• There are many successful examples of resilience measures and many common barriers too.
• Overcoming these barriers is important to accelerate investment and policies that will drive resilience at the state and territory level.
5.1 Overview of resilience in the states and territoriesEach state and territory in Australia faces different natural disaster risks and socioeconomic circumstances. Consequently, each has a different approach to disaster resilience.
In preparing this report, all state and territory governments were consulted about their progress towards disaster resilience. Key areas of discussion included vulnerability to natural disasters, policy approach, recent initiatives and challenges faced.
This chapter summarises the findings of those consultations and profiles each jurisdiction’s governance arrangements and successful resilience efforts. Given the diverse context across states and territories, this report does not look to compare jurisdictions.
Instead, it intends to highlight the current state of play around governance, funding and collaboration, and provide examples of successful policies and programs that could be more broadly applied. It also considers the common barriers faced by state governments in accelerating resilience.
Lessons from successful policies around AustraliaState and territory approaches differ but certain key features make some policies more effective than others. These include:
Taking a statewide approach to governing resilience ensures coordination and prevents the duplication of effort.
A focus on local government and community engages people at the grass-roots level and helps tailor resilience to individual communities.
Learning from the past and adjusting approaches in light of new information ensures resilience efforts are as current as possible.
Taking an all-hazards approach reduces duplication of effort and helps states use capabilities across a range of different disaster risks.
5 Lessons from state and territory government initiatives
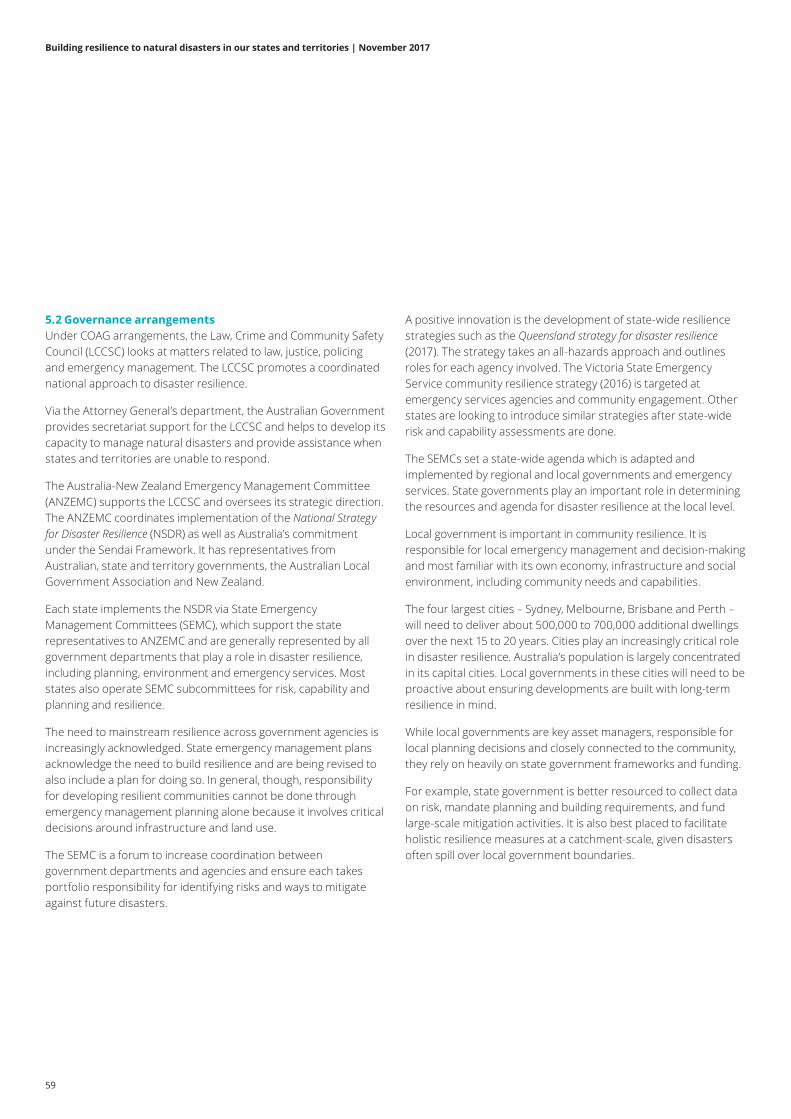
Building resilience to natural disasters in our states and territories | November 2017
59
5.2 Governance arrangementsUnder COAG arrangements, the Law, Crime and Community Safety Council (LCCSC) looks at matters related to law, justice, policing and emergency management. The LCCSC promotes a coordinated national approach to disaster resilience.
Via the Attorney General’s department, the Australian Government provides secretariat support for the LCCSC and helps to develop its capacity to manage natural disasters and provide assistance when states and territories are unable to respond.
The Australia-New Zealand Emergency Management Committee (ANZEMC) supports the LCCSC and oversees its strategic direction. The ANZEMC coordinates implementation of the National Strategy for Disaster Resilience (NSDR) as well as Australia’s commitment under the Sendai Framework. It has representatives from Australian, state and territory governments, the Australian Local Government Association and New Zealand.
Each state implements the NSDR via State Emergency Management Committees (SEMC), which support the state representatives to ANZEMC and are generally represented by all government departments that play a role in disaster resilience, including planning, environment and emergency services. Most states also operate SEMC subcommittees for risk, capability and planning and resilience.
The need to mainstream resilience across government agencies is increasingly acknowledged. State emergency management plans acknowledge the need to build resilience and are being revised to also include a plan for doing so. In general, though, responsibility for developing resilient communities cannot be done through emergency management planning alone because it involves critical decisions around infrastructure and land use.
The SEMC is a forum to increase coordination between government departments and agencies and ensure each takes portfolio responsibility for identifying risks and ways to mitigate against future disasters.
A positive innovation is the development of state-wide resilience strategies such as the Queensland strategy for disaster resilience (2017). The strategy takes an all-hazards approach and outlines roles for each agency involved. The Victoria State Emergency Service community resilience strategy (2016) is targeted at emergency services agencies and community engagement. Other states are looking to introduce similar strategies after state-wide risk and capability assessments are done.
The SEMCs set a state-wide agenda which is adapted and implemented by regional and local governments and emergency services. State governments play an important role in determining the resources and agenda for disaster resilience at the local level.
Local government is important in community resilience. It is responsible for local emergency management and decision-making and most familiar with its own economy, infrastructure and social environment, including community needs and capabilities.
The four largest cities – Sydney, Melbourne, Brisbane and Perth – will need to deliver about 500,000 to 700,000 additional dwellings over the next 15 to 20 years. Cities play an increasingly critical role in disaster resilience. Australia’s population is largely concentrated in its capital cities. Local governments in these cities will need to be proactive about ensuring developments are built with long-term resilience in mind.
While local governments are key asset managers, responsible for local planning decisions and closely connected to the community, they rely on heavily on state government frameworks and funding.
For example, state government is better resourced to collect data on risk, mandate planning and building requirements, and fund large-scale mitigation activities. It is also best placed to facilitate holistic resilience measures at a catchment-scale, given disasters often spill over local government boundaries.

60
Figure 5.1: Governance arrangements for disaster resilience in Australia
Council of Australian
Governments (COAG)
Australian New Zealand management
Committee (ANZEMC)
National Strategy for Disaster Resilience
Federal government
Sendai FrameworkCritical Infrastructure Strategy
Resilience Funding (NDRP)
State government
Emergency management legislationState-wide disaster management
Land use planning, development andbuilding codes
Resilience funding (NDRP)
Local government
Local disaster managementLand use planning
Law, Crime and Community
Safety Council (LCCSC)
State Emergency Management Committee
(SEMC)
District/Regional Emergency
Management Committees
Local Emergency Management Committees
SEMC Sub-committees
5 Lessons from state and territory government initiatives
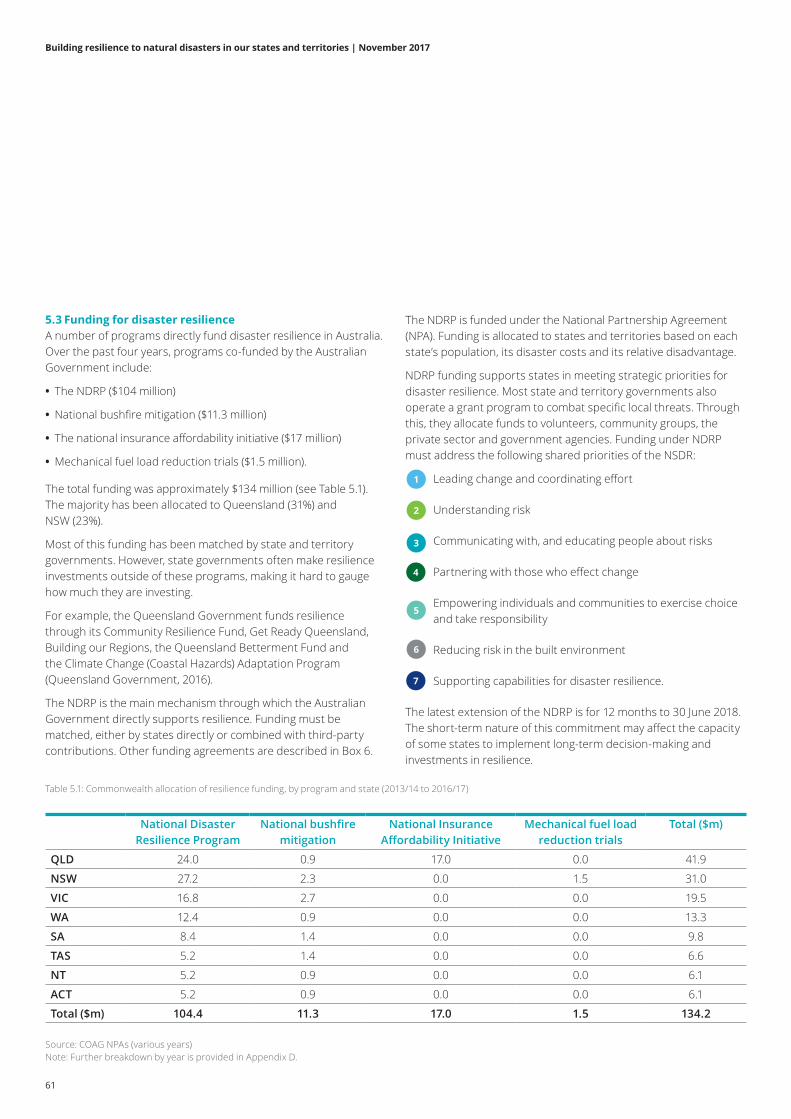
Building resilience to natural disasters in our states and territories | November 2017
61
Table 5.1: Commonwealth allocation of resilience funding, by program and state (2013/14 to 2016/17)
National Disaster Resilience Program
National bushfire mitigation
National Insurance Affordability Initiative
Mechanical fuel load reduction trials
Total ($m)
QLD 24.0 0.9 17.0 0.0 41.9
NSW 27.2 2.3 0.0 1.5 31.0
VIC 16.8 2.7 0.0 0.0 19.5
WA 12.4 0.9 0.0 0.0 13.3
SA 8.4 1.4 0.0 0.0 9.8
TAS 5.2 1.4 0.0 0.0 6.6
NT 5.2 0.9 0.0 0.0 6.1
ACT 5.2 0.9 0.0 0.0 6.1
Total ($m) 104.4 11.3 17.0 1.5 134.2
The NDRP is funded under the National Partnership Agreement (NPA). Funding is allocated to states and territories based on each state’s population, its disaster costs and its relative disadvantage.
NDRP funding supports states in meeting strategic priorities for disaster resilience. Most state and territory governments also operate a grant program to combat specific local threats. Through this, they allocate funds to volunteers, community groups, the private sector and government agencies. Funding under NDRP must address the following shared priorities of the NSDR:
Leading change and coordinating effort
Understanding risk
Communicating with, and educating people about risks
Partnering with those who effect change
Empowering individuals and communities to exercise choice and take responsibility
Reducing risk in the built environment
Supporting capabilities for disaster resilience.
The latest extension of the NDRP is for 12 months to 30 June 2018. The short-term nature of this commitment may affect the capacity of some states to implement long-term decision-making and investments in resilience.
1
2
3
4
5
6
7
Source: COAG NPAs (various years) Note: Further breakdown by year is provided in Appendix D.
5.3 Funding for disaster resilienceA number of programs directly fund disaster resilience in Australia. Over the past four years, programs co-funded by the Australian Government include:
• The NDRP ($104 million)
• National bushfire mitigation ($11.3 million)
• The national insurance affordability initiative ($17 million)
• Mechanical fuel load reduction trials ($1.5 million).
The total funding was approximately $134 million (see Table 5.1). The majority has been allocated to Queensland (31%) and NSW (23%).
Most of this funding has been matched by state and territory governments. However, state governments often make resilience investments outside of these programs, making it hard to gauge how much they are investing.
For example, the Queensland Government funds resilience through its Community Resilience Fund, Get Ready Queensland, Building our Regions, the Queensland Betterment Fund and the Climate Change (Coastal Hazards) Adaptation Program (Queensland Government, 2016).
The NDRP is the main mechanism through which the Australian Government directly supports resilience. Funding must be matched, either by states directly or combined with third-party contributions. Other funding agreements are described in Box 6.
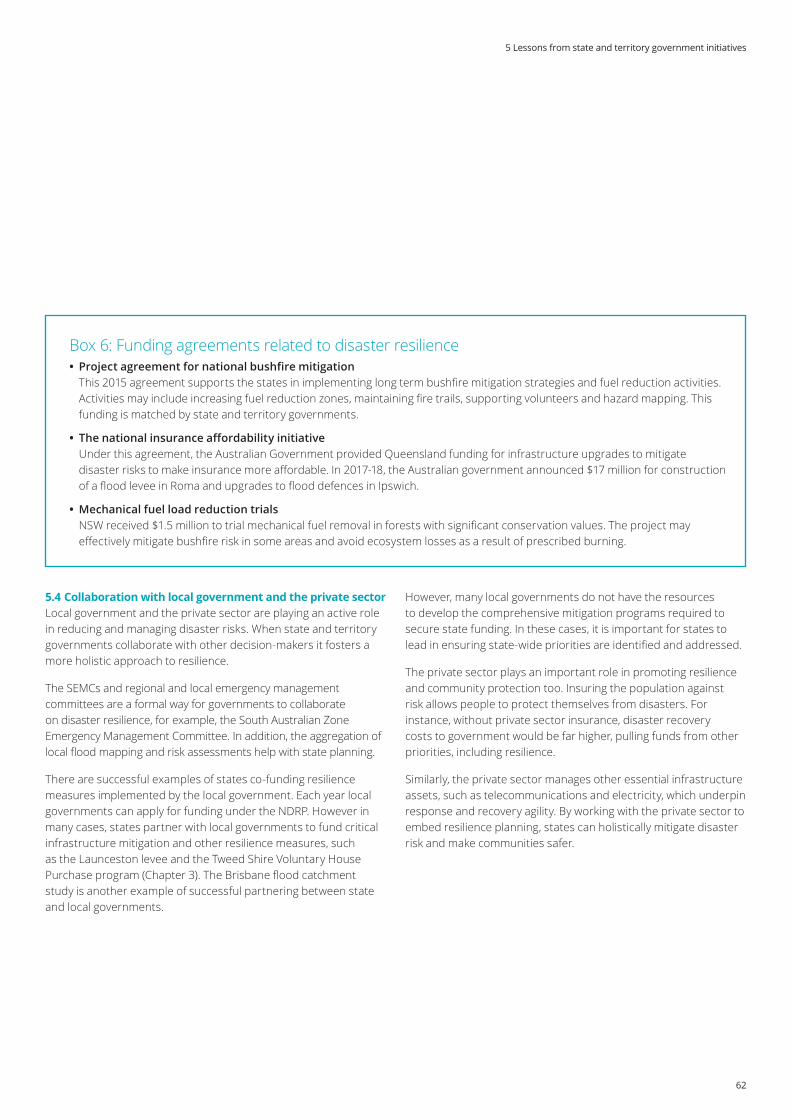
62
Box 6: Funding agreements related to disaster resilience • Project agreement for national bushfire mitigation
This 2015 agreement supports the states in implementing long term bushfire mitigation strategies and fuel reduction activities. Activities may include increasing fuel reduction zones, maintaining fire trails, supporting volunteers and hazard mapping. This funding is matched by state and territory governments.
• The national insurance affordability initiative Under this agreement, the Australian Government provided Queensland funding for infrastructure upgrades to mitigate
disaster risks to make insurance more affordable. In 2017-18, the Australian government announced $17 million for construction of a flood levee in Roma and upgrades to flood defences in Ipswich.
• Mechanical fuel load reduction trials NSW received $1.5 million to trial mechanical fuel removal in forests with significant conservation values. The project may
effectively mitigate bushfire risk in some areas and avoid ecosystem losses as a result of prescribed burning.
5.4 Collaboration with local government and the private sectorLocal government and the private sector are playing an active role in reducing and managing disaster risks. When state and territory governments collaborate with other decision-makers it fosters a more holistic approach to resilience.
The SEMCs and regional and local emergency management committees are a formal way for governments to collaborate on disaster resilience, for example, the South Australian Zone Emergency Management Committee. In addition, the aggregation of local flood mapping and risk assessments help with state planning.
There are successful examples of states co-funding resilience measures implemented by the local government. Each year local governments can apply for funding under the NDRP. However in many cases, states partner with local governments to fund critical infrastructure mitigation and other resilience measures, such as the Launceston levee and the Tweed Shire Voluntary House Purchase program (Chapter 3). The Brisbane flood catchment study is another example of successful partnering between state and local governments.
However, many local governments do not have the resources to develop the comprehensive mitigation programs required to secure state funding. In these cases, it is important for states to lead in ensuring state-wide priorities are identified and addressed.
The private sector plays an important role in promoting resilience and community protection too. Insuring the population against risk allows people to protect themselves from disasters. For instance, without private sector insurance, disaster recovery costs to government would be far higher, pulling funds from other priorities, including resilience.
Similarly, the private sector manages other essential infrastructure assets, such as telecommunications and electricity, which underpin response and recovery agility. By working with the private sector to embed resilience planning, states can holistically mitigate disaster risk and make communities safer.
5 Lessons from state and territory government initiatives
Building resilience to natural disasters in our states and territories | November 2017
63
Optus – private sector investing in resilienceOptus is the second largest telecommunications company in Australia. Optus knows its infrastructure must be resilient to help communities recover after disasters. It has a strategy to improve network resilience, in recognition that climate change will increase the frequency with which extreme weather events occur.
This strategy involves advancing its understanding of risk exposure and consequently upgrading infrastructure. For instance, following the Brisbane floods in 2011, Optus invested in self-sufficient energy sources to manage disruptions to energy supply.
In the aftermath of a disaster, telecommunications are important to allow exchanges between emergency services and community members. Optus supports the community through early warning of disasters via SMS and by investing in satellite technology so that communities cut off from regular network services are still able to communicate and access information.
Optus has a disaster response framework that enables rapid response in disaster-impacted communities. It includes actions such as establishing VCAT satellite services where cell sites have been damaged, collaborating with humanitarian relief centres, providing recharging stations for community members and extending deadlines for bill payment in times of financial hardship.
Optus has taken a leading role in business continuity planning to minimise disaster impacts and ensure communication channels are open as quickly as possible. To this end, it has raised equipment rooms and power feeds to higher levels at flood-prone sites and improved its battery capacity.
Westpac natural disaster recovery fund – private sector supporting the communityDuring natural disasters Westpac assists communities to access their money. For example, ahead of Cyclone Debbie striking land, Westpac mobilised staff and 24 generators to power ATMs at branches. Westpac also purchased an additional 10 generators for community organisations such as Global Care, the Salvation Army and a childcare centre in Bowen which enabled families to clean up and/or speak with insurers.
Post-disaster, Westpac helps disaster-affected communities recover and build resilience through its Natural Disaster Recovery Fund. Westpac supports communities based on the previous season's disasters and communities can apply for up to $10,000 to assist recovery.
The program has succeeded in helping communities build resilience. One project developed multi-lingual and pictorial resources on disaster preparation on the NSW Central Coast. These were developed with community groups and agencies such as the Rural Fire Service, SES, Police and Community Services to ensure the resources would be effective. These resources were then widely distributed and promoted.
Following the east coast low in 2015, Westpac funded workshops in the inland NSW towns of Dungog, Maitland and Cessnock. The workshops supported local businesses to better manage their risks - 97% of attendees said they were 'very satisfied' and felt better-prepared to manage a disaster next time.
64
Confident Communities project – private sector, local government and universities
The Confident Communities project recognises that individual and community resilience requires a whole-of-community approach. IAG engaged with more than 3,000 people to understand the enablers and barriers for community resilience as part of its commitment to make Australia “a nation ready for everything” (IAG, 2017).
Consultations revealed that communities think a big barrier to building resilience is a lack of harmony and trust. Confident Communities project, ‘Good Hoods’, aims to help reconnect communities and create a sense of belonging. It uses a platform that showcases local events and community-building initiatives such as sport, art, volunteering and gardening programs. The goal is to get communities talking, connected and ultimately increase resilience.
Confident Communities is also working with Murrindindi Shire Council to create sustainable social change at a grass-roots level following the Black Saturday bushfires. In partnership with the Council, the Melbourne School of Population and Global Health, and Australian Red Cross, the program has established a local network to help communities assess and address risks and co-create resilience planning.
Because it is community-led, the project aligns with the Council’s commitment to improve the self-reliance and resilience of the community. A pilot is due by early 2018.
IAG is also working with the University of Melbourne to pilot a school-based visual arts program called Enhancing Emotional Literacy through Visual Arts (ELVA) in bushfire-affected areas. Research shows that bushfires have a lasting emotional and psychological effect on children, and, while there is support immediately after a disaster, it diminishes over time. ELVA's goal is to help children express their feelings after a fire, and build resilience for next time.
There are many opportunities for the private sector and government to work together on building resilience. Notably, the Sendai Framework acknowledges the role the private sector can play.
To help the private sector implement Sendai, the United Nations Office for Disaster Risk Reduction (UNISDR) has been working to build business resilience know-how: if business can recover and return to regular operations quickly after a disaster, then communities can too.
UNISDR also encourages investment decisions to consider disaster risks. To do this effectively, the states should provide incentives and information, particularly about infrastructure and building development, to enable adequate costing of disaster risks.
Below are some examples of collaboration to build resilience between different levels of government, the private sector and the community.
Brisbane River catchment flood study – state and local government
The Queensland government and local councils have partnered on a long-term plan to manage the impact of floods and improve community safety in the Brisbane River catchment.
The Brisbane River catchment flood study was released in 2017 in support of recommendation 2.2 from the Queensland Floods Commission of Inquiry to identify the probability and extent of floods via a comprehensive study of the catchment.
The study covered four catchment areas, primarily flooding downstream of Wivenhoe Dam including the Brisbane River, Lockyer Creek and the Bremer River system.
The information gathered will help to develop the Brisbane River strategic floodplain management plan. The Queensland Government is working with four councils to assess management options to increase community safety and resilience. The plan will enable each local council to develop local floodplain management plans.
1
2
5 Lessons from state and territory government initiatives
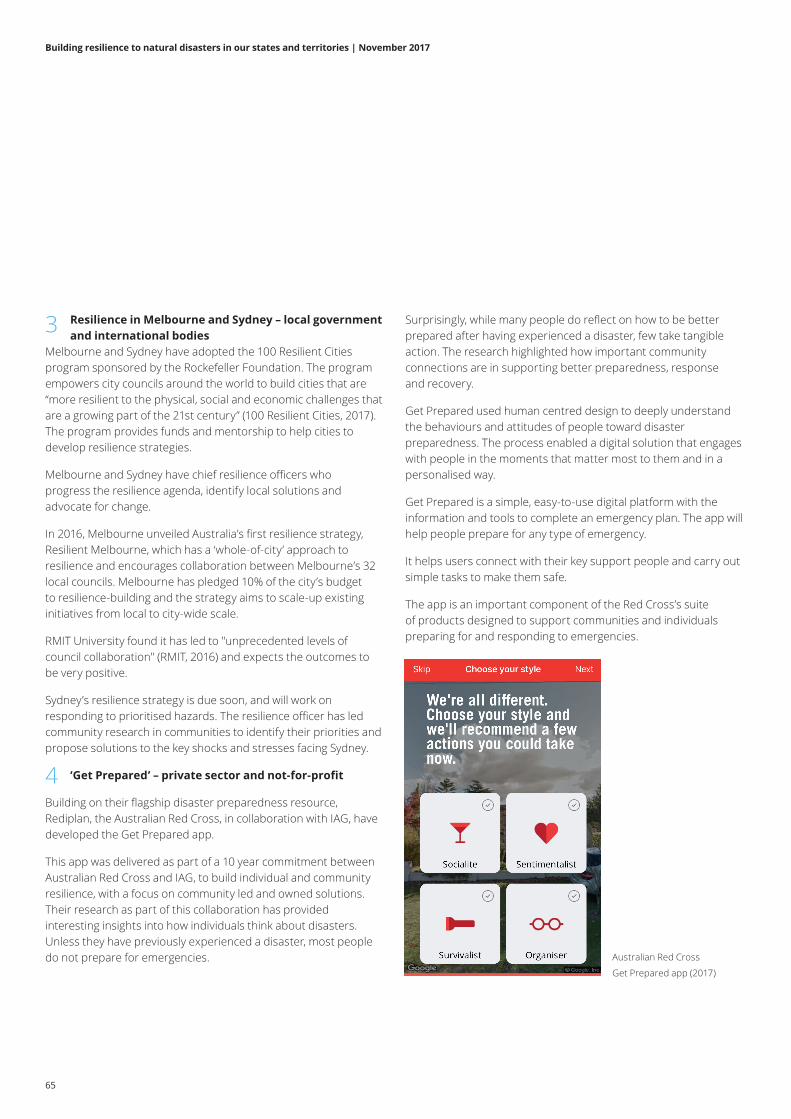
Building resilience to natural disasters in our states and territories | November 2017
65
Resilience in Melbourne and Sydney – local government and international bodies
Melbourne and Sydney have adopted the 100 Resilient Cities program sponsored by the Rockefeller Foundation. The program empowers city councils around the world to build cities that are “more resilient to the physical, social and economic challenges that are a growing part of the 21st century” (100 Resilient Cities, 2017). The program provides funds and mentorship to help cities to develop resilience strategies.
Melbourne and Sydney have chief resilience officers who progress the resilience agenda, identify local solutions and advocate for change.
In 2016, Melbourne unveiled Australia’s first resilience strategy, Resilient Melbourne, which has a ‘whole-of-city’ approach to resilience and encourages collaboration between Melbourne’s 32 local councils. Melbourne has pledged 10% of the city’s budget to resilience-building and the strategy aims to scale-up existing initiatives from local to city-wide scale.
RMIT University found it has led to "unprecedented levels of council collaboration" (RMIT, 2016) and expects the outcomes to be very positive.
Sydney’s resilience strategy is due soon, and will work on responding to prioritised hazards. The resilience officer has led community research in communities to identify their priorities and propose solutions to the key shocks and stresses facing Sydney.
‘Get Prepared’ – private sector and not-for-profit
Building on their flagship disaster preparedness resource, Rediplan, the Australian Red Cross, in collaboration with IAG, have developed the Get Prepared app.
This app was delivered as part of a 10 year commitment between Australian Red Cross and IAG, to build individual and community resilience, with a focus on community led and owned solutions. Their research as part of this collaboration has provided interesting insights into how individuals think about disasters. Unless they have previously experienced a disaster, most people do not prepare for emergencies.
Surprisingly, while many people do reflect on how to be better prepared after having experienced a disaster, few take tangible action. The research highlighted how important community connections are in supporting better preparedness, response and recovery.
Get Prepared used human centred design to deeply understand the behaviours and attitudes of people toward disaster preparedness. The process enabled a digital solution that engages with people in the moments that matter most to them and in a personalised way.
Get Prepared is a simple, easy-to-use digital platform with the information and tools to complete an emergency plan. The app will help people prepare for any type of emergency.
It helps users connect with their key support people and carry out simple tasks to make them safe.
The app is an important component of the Red Cross’s suite of products designed to support communities and individuals preparing for and responding to emergencies.
Australian Red Cross
Get Prepared app (2017)
3
4
66
5.5 Common barriers in building resilienceConsultations with states raised several challenges to building resilience to disasters at the state level. Perhaps the biggest is budgetary. The cost of recovery to states continues to outweigh beneficial investment in resilience. Resilience is a long-term investment that does not often yield large immediate effects, so it is an ongoing challenge for governments. The co-benefits emphasised in this report build a stronger case for overcoming this limitation.
Each jurisdiction is different but some of the more common barriers that states and territories face are:
• Upfront resilience costs are high and difficult to justify politically before disasters have occurred. Benefits are often long-term and difficult to quantify
• Most resilience funding is short term, which limits larger more strategic resilience planning
• The direct and indirect costs of prior events are unknown and not monitored. Such information could improve recovery and investment prioritisation
• States lack a strong understanding of business, community and local government capabilities. State use of NDRP funding is competitive and requires effective prioritisation in line with identified disaster threats
• Disaster management plans are in place, but are often not well-suited to managing risks that cross local government boundaries. Only some of these plans recognise the responsibilities of portfolio agencies and stakeholders, beyond emergency management
• Local governments have identified cost-effective solutions for resilience but must compete with limited funding
• Governments, businesses and communities have different interpretations of resilience and how it should be implemented and monitored
• Collective buy-in for resilience is difficult to harness given community expectations that governments will step in to enable recovery when a disaster occurs.
Without collective action, complacency is a risk and disaster impacts are likely to be much worse. This requires shifting the resilience agenda from an emergency management issue to a whole-of-government and whole-of-nation issue.
5.6 State disaster context and key arrangementsThe following sections use infographics to profile the disaster context of each state and territory. These reveal:
• Key statistics, including recent large disasters
• The current and forecast total economic cost of natural disasters
• The proportion of the population at high risk of disasters (see box below)
• Annual government spending on resilience through the NDRP (states invest in disaster resilience outside of this program too).
The infographics give context for the exploration of governance arrangements and best practice examples that follow.
Populations at risk of natural disastersIn 2016, IAG and SGS examined the parts of Australia at greatest risk of natural disasters.
Using their results, a spatial analysis demonstrated the percentage of a state’s population at high, very high or extreme risk of a disaster type. These percentages are reported in the state-by-state infographics (see Appendix C).
5 Lessons from state and territory government initiatives
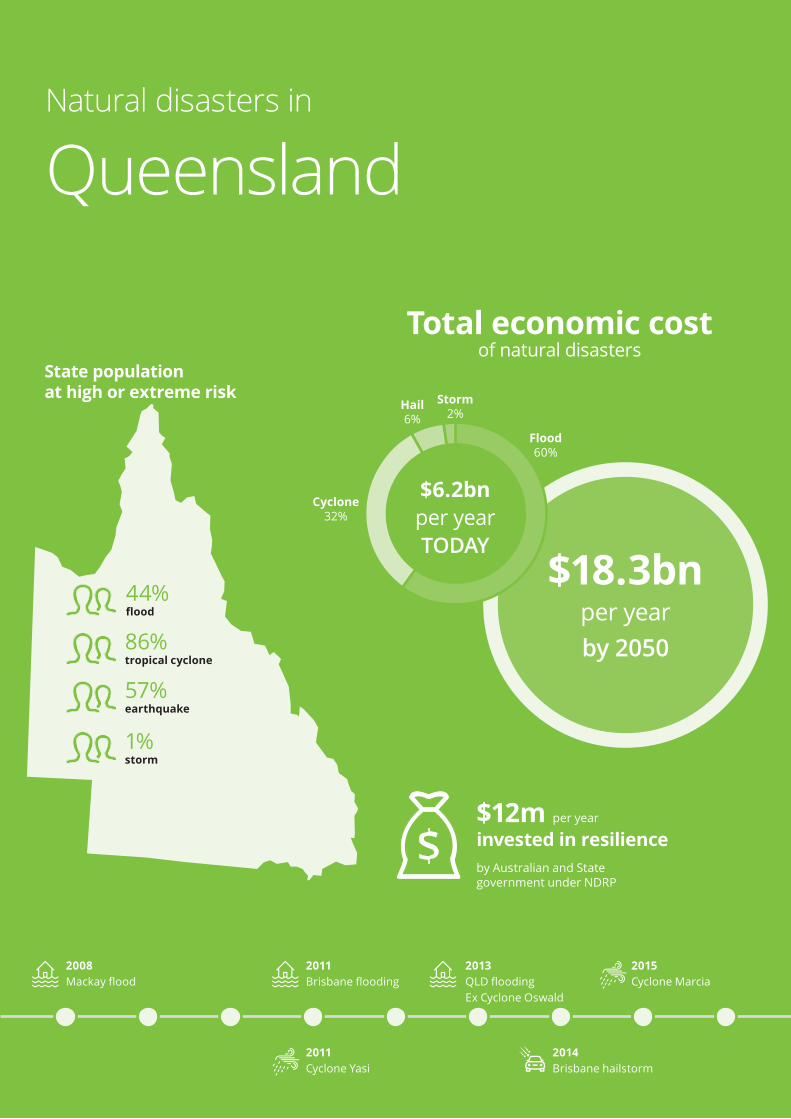
Building resilience to natural disasters in our states and territories | November 2017
67
2011 Brisbane flooding
2011 Cyclone Yasi
2014 Brisbane hailstorm
2013 QLD flooding Ex Cyclone Oswald
2015 Cyclone Marcia
2008 Mackay flood
State population at high or extreme risk
Total economic cost of natural disasters
Natural disasters in
Queensland
$12m per year invested in resilience by Australian and State government under NDRP
$18.3bn per year by 2050
Storm2%
Flood60%
Hail6%
Cyclone32%
$6.2bn per year TODAY
44% flood
86% tropical cyclone
57% earthquake
1% storm
68
5.7 QueenslandQueensland is the only state with a statutory authority to coordinate disaster reconstruction and recovery. After serious floods and cyclones in 2010-11, the Queensland Reconstruction Authority (QRA) was formed to manage disaster recovery. While the QRA has always had a role in resilience, the 2016 State Disaster Management Plan specifically recognised its responsibility for implementing recovery, resilience and mitigation policy, planning, coordination and monitoring.
The QRA is responsible for implementing the Queensland Strategy for Disaster Resilience in partnership with state and local government, the private sector, research sector and not-for-profit organisations. It has legislative responsibility for recovery and resilience planning and policy, and administers the Get Ready program.
The Department of Infrastructure, Local Government and Planning (DILGP) administers some funding programs including priority disaster mitigation projects, such as the 2017-19 Local Government Grants and Subsidies program ($60 million) and the 2016-17 and 2017-19 Works for Queensland program ($400 million).
Over the last 10 years, Queensland has borne 60% of the total economic cost of disasters in Australia. In response to these disaster impacts the Queensland government allocates funding directly to disaster mitigation, including outside of the NDRP. For example, more than $62 million in mitigation funding across two years (2015/16 and 2016/17) was allocated through the Community Resilience Fund to help local governments mitigate the impact of natural disasters on physical infrastructure.
Queensland initiated a Framework for Betterment in 2013, recognising that NDRRA funding did not cover the reconstruction of essential infrastructure to a more resilient standard unless the solution was the most cost-effective. The Queensland Betterment Fund was jointly funded with State and Australian governments contributing $40 million each in 2013. In 2015, both contributed another $10 million to continue the initiative.
In 2017 Queensland introduced a new planning act. The act requires development decisions be more transparent and all development proposals must consider the impacts of climate change. Under the State Planning Policy (SPP), local governments must identify natural hazard areas including those prone to bushfires, floods and erosion. Local government must also undertake a risk assessment and include planning provisions to ensure the risk for personal safety and property in natural hazard areas is acceptable to the community.
The SPP offers guidance to help local governments appropriately integrate policies related to natural hazards, risks and resilience into their planning schemes. The guidance relates to coastal hazards, including specific considerations for locating and designing community infrastructure and suggests flood immunity levels for specific assets.
The QRA is the lead sponsor of state-wide disaster vulnerability and risk-based planning across all hazards. It has become the central repository for whole-of-government data collection and management related to natural disasters.
Queensland has also developed several initiatives to support community resilience.
• The Money Ready Toolkit is a partnership between the Department of Communities, Child Safety and Disability Services (DCCSDS) and Good Shepard Micro Finance. It is an easy approach to help residents - especially economically disadvantaged residents - become financially ready and/or get back on their feet if they are affected by a disaster.
• People with vulnerabilities in disasters is run by DCCSDS and key partners to assist in minimising the impact of disasters in Queensland. It aims to extend the capacities of people with vulnerabilities to withstand and recover from disasters. Proposed actions are to be undertaken at individual, household, community, district and state levels, including improved disaster planning, preparedness and engagement strategies.
5 Lessons from state and territory government initiatives
Building resilience to natural disasters in our states and territories | November 2017
69
• The Queensland Climate Change Adaptation Strategy (2017) acknowledges that natural disasters are likely to intensify as a result of climate change encourages innovation and resilience to long-term climate change. The strategy focuses on partnerships between the community, businesses, government, not-for-profits, research institutions and individuals. It recognises that building resilience is a shared responsibility.
Queensland is one of the only states with a community resilience target and a state-wide strategy for disaster resilience. A baseline index of community resilience was measured in 2013-14 and a target established to increase the level by 5% each year. The Queensland Resilience Index is a measure of public disaster preparedness. It measures recognition, recall and actions taken by people linking to resilience initiatives such as Get Ready.
Queensland has updated its 2010 state risk assessment in line with Australian Government requirements, including a focus on capabilities. With the ICA, Queensland has completed the Queensland Flood Mapping Program to detail the flood hazard for 172 flood-prone communities.
A new Strategic Policy Framework for Flood Risk Management and Community Resilience has been produced, consistent with the updated Queensland Strategy for Disaster Resilience, in response to recommendations by the Queensland Floods Commission of Inquiry. Recommendations from the 2015 performance review of the Queensland flood gauge network continue to be implemented in conjunction with local governments and the Bureau of Meteorology.
The release of the Brisbane River catchment flood study in May 2017 was a significant milestone too (detailed earlier in Chapter 5).
Through its strategy and flood policies, Queensland is seeking to implement a whole-of-government approach to flood risk management. The approach is having an impact. In 2016, the Queensland Audit Office (QAO) reviewed the flood resilience of river catchments and found:
"All four councils and the state government departments we audited better understand their flood risks today than they did in 2011, and are all better prepared. This is because they have acted to identify flood risks, primarily through analysis of historical and recent flood information, local knowledge, and flood maps and studies."QAO, 2016
The QAO warned that risk can re-build because people forget the devastation flood can cause and lose momentum in building resilience.
70
Queensland Strategy for Disaster ResilienceIn July 2017 the state government revised the Queensland Strategy for Disaster Resilience, to "make Queensland the most disaster resilient state in Australia". It aims to empower local governments and communities by setting goals for the state, with outcomes to be monitored.
The strategy is based on the principles of the Sendai Framework and aligns with the NSDR. It incorporates climate change risk and an all-hazards approach to building resilience. Consultation on how to implement the strategy is underway and focussed on community initiatives.
State and local collaboration to manage bushfire risksIn 2017, Redland City Council engaged Queensland Fire and Emergency Services (QFES) to review fire risks. The review was in response to wildfires late in 2016.
Such support is embodied in QFES Strategic Plan (2017) which seeks to “collaborate with communities to develop a shared understanding of their risks and empower them to have the capability to manage them”.
The comprehensive review made 56 recommendations across 6 areas, including fuel load management practices, community resilience and local legislation. The council has already begun to adopt these recommendations, including clean-up across a number of heavy fuel load areas.
Mapping bushfire-prone areas in QueenslandQueensland is using new CSIRO methodology to map areas prone to bushfires to support local government and fire management groups. The advanced and accurate map combines spatial information with knowledge of forest fire behaviour, long-term fire weather severity estimates, potential fuel load and landscape slope.
The map is being incorporated into planning schemes by more than half of Queensland’s local governments and is publicly accessible so individuals can use the data to make their own hazard preparations.
5 Lessons from state and territory government initiatives
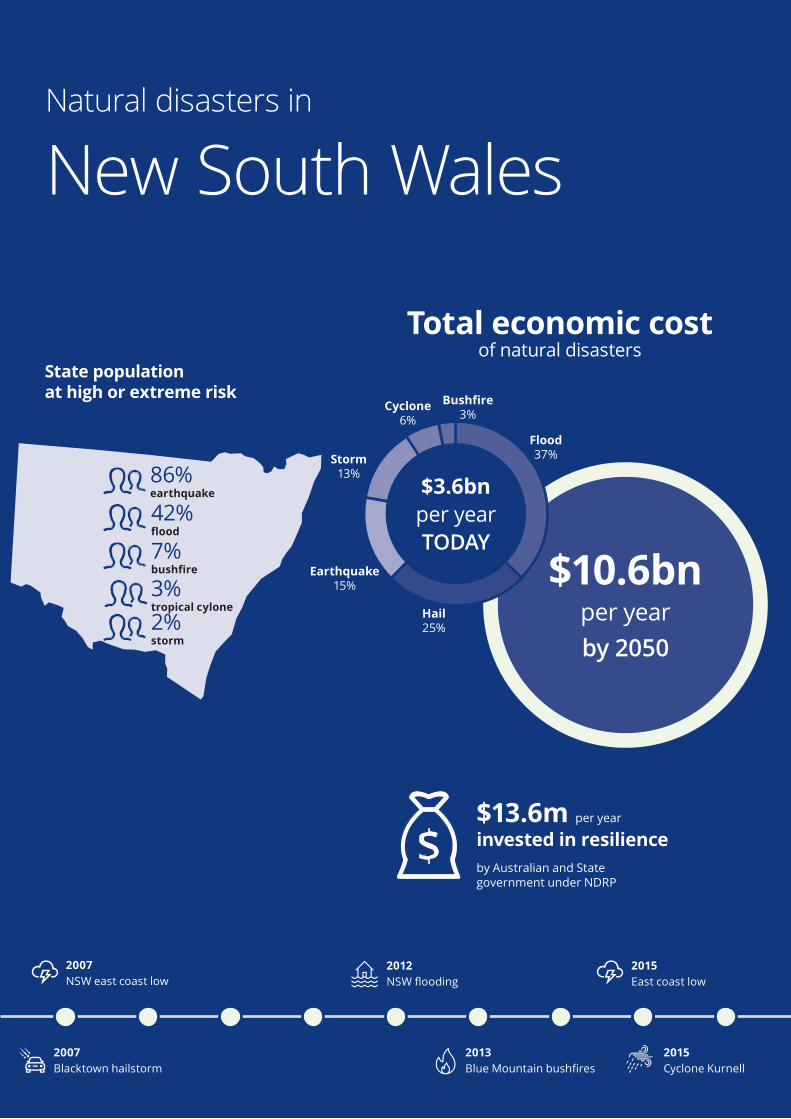
Building resilience to natural disasters in our states and territories | November 2017
71
2007 NSW east coast low
2012 NSW flooding
2013 Blue Mountain bushfres
2007 Blacktown hailstorm
2015 East coast low
2015 Cyclone Kurnell
$13.6m per year invested in resilience by Australian and State government under NDRP
Natural disasters in
New South Wales
State population at high or extreme risk
Total economic cost of natural disasters
$10.6bn per year by 2050
Flood37%
Earthquake15%
Hail25%
Cyclone6%
Bushfire3%
Storm13%
$3.6bn per year TODAY
86% earthquake
42% flood
3% tropical cylone
2% storm
7% bushfire
72
5.8 New South WalesRecovery was added to the NSW agenda for disaster management about eight years ago, shifting the state from its focus on response. Reforms are underway to further incorporate resilience and mitigation, recognising the growing cost of natural disasters. However, the knowledge and capability to support integration of resilience is still limited.
NSW has a mitigation standing committee (MSC) under the SEMC to ensure mitigation it is built into the SEMC’s decisions. The MSC aims to shift towards central coordination including by widening membership to representatives from planning, infrastructure and community-focussed portfolios. The SEMC is looking to better coordinate state resources for disaster resilience and establish a larger role for community agencies.
Recognising the key role of local government, NSW is looking to establish a devolved model for disaster resilience. To support the transition, and help with tight local budgets, NSW plans to establish a ‘fly-in’ squad of resilience officers to help local government mitigate risks.
NSW takes a hazard-by-hazard approach to risk assessment and mitigation where states such as Victoria now have an all-hazards approach. NSW is looking to increase coordination, particularly regarding communications within and between agencies. However, while an all-hazards approach helps to prevent duplication by streamlining planning for different hazards, NSW wants to retain the detail of its hazard-by-hazard approach.
Planning for resilience has begun based on the 2017 state-wide risk assessment with its updated mapping and critical priorities. NSW is focussed on engaging communities in preparedness and linking recovery to resilience. Recovery periods are when communities and local government are most aware of disaster impacts and more likely to engage with resilience measures.
NSW is also keen to promote business and residential insurance to mitigate disaster impacts.
Community Resilience Innovation Program The Community Resilience Innovation Program (CRIP) is funded by the NDRP and provides grants for community-led projects. NSW was one of the first states to have a community-focussed grants program empowering locals to voice their preferences, then helping them achieve it.
In the last year the NSW Government awarded $1.5 million in community grants for local resilience projects. These projects are not systematically evaluated but some have recorded positive outcomes.
For example, a series of CRIP-funded Blue Mountains fire safety programs lead to a 29% increase in households reporting they were prepared for an emergency and a 19% increase in people practising their emergency plan (Charles Sturt University, 2017).
NDRP funding also supports other, hazard-specific programs, such as the Bush Fire Risk Management Grants Scheme which supports bushfire mitigation projects, and the Floodplain Grants Scheme which supports flood mitigation.
5 Lessons from state and territory government initiatives
Building resilience to natural disasters in our states and territories | November 2017
73
My Fire Plan appWhen research showed that many people thought preparing a written bushfire survival plan was a complex task, the NSW Rural Fire Service (RFS) developed the 'my fire plan' app.
The app breaks the planning process into steps that can be saved and returned to later. It tells people the tasks they need to complete to enact their plan and reminds them when to complete them, with links to other helpful websites.
In the year of release, the take-up of bushfire survival plans in NSW was triple that of the previous four years with around 65,000 downloads in 2013. It gave the RFS insights into how many people were completing plans and what steps they were getting stuck on. This will help the RFS to keep developing strategies to help people prepare better.
Dipstik – NRMA Insurance and NSW State Emergency Service (SES)NRMA Insurance research showed 25% of drivers were driving through floodwater even though the SES advises it is never safe: even a small amount of floodwater can cause a vehicle to float away, leading to injury and death.
Research indicated that of the 1,859 deaths in Australia attributable to flooding between 1900 and 2015, the highest proportion of fatalities was as a result of crossing a bridge or road (Haynes et al., 2016).
To combat the risk, NRMA Insurance has been trialling new flood monitoring and alert technology to reduce community risk in flash flooding areas and educate people that it is never safe to drive through floodwater.
DipStik is Australian-made technology that continuously monitors water levels during a storm. It sends warnings to councils and SES to advise locals of floodwater risk. DipStik can also warn oncoming motorists of a flooded road with a flashing beacon light.
The trial is a collaboration between the NSW SES and six councils and will see 18 DipStiks deployed to flood-prone areas in Western Sydney and regional NSW. After a year-long trial, councils can continue with the devices and fund running costs.
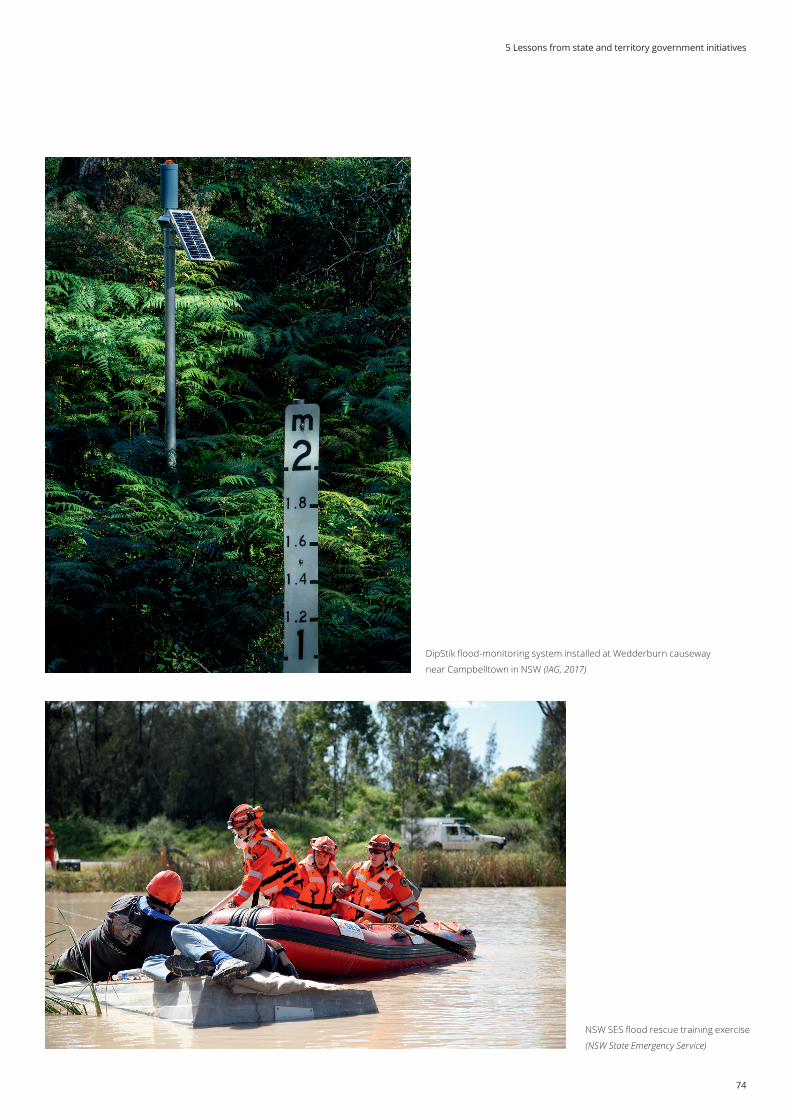
74
DipStik flood-monitoring system installed at Wedderburn causeway
near Campbelltown in NSW (IAG, 2017)
NSW SES flood rescue training exercise
(NSW State Emergency Service)
5 Lessons from state and territory government initiatives
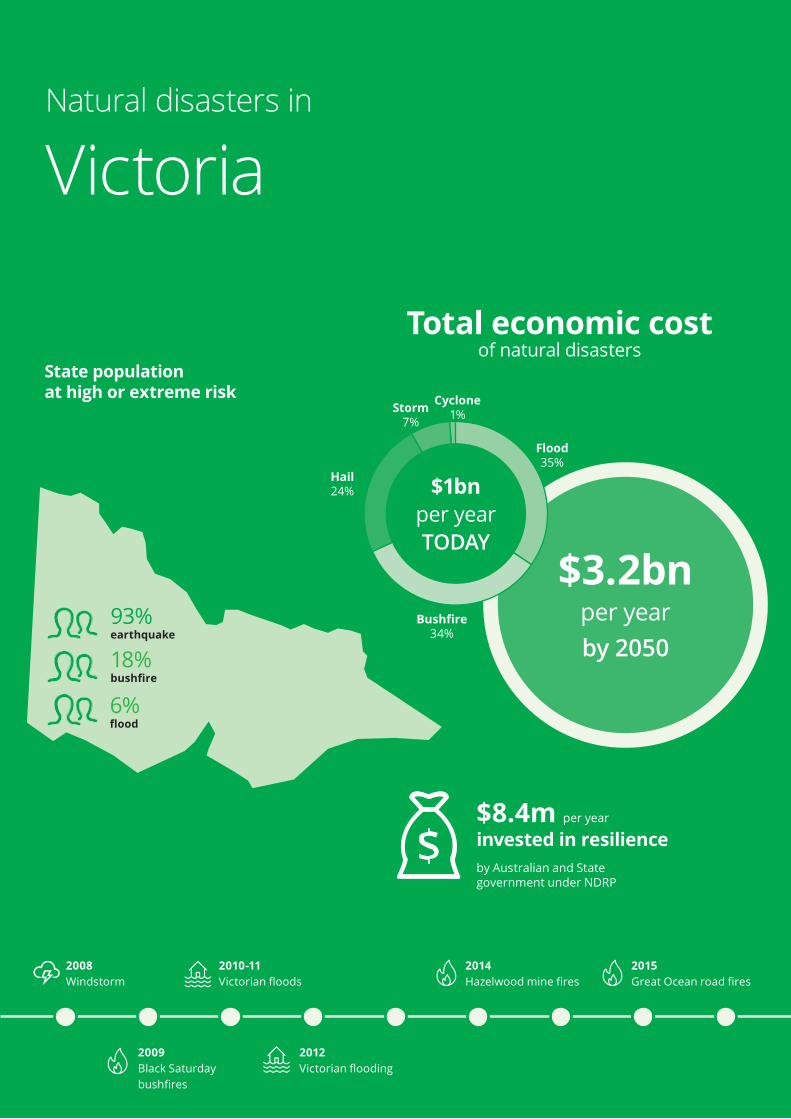
Building resilience to natural disasters in our states and territories | November 2017
75
2010-11 Victorian floods
2009 Black Saturday bushfres
2012 Victorian flooding
2014 Hazelwood mine fres
2015 Great Ocean road fres
2008 Windstorm
State population at high or extreme risk
Total economic cost of natural disasters
$3.2bn per year by 2050
Storm7%
Cyclone1%
Hail24%
Bushfire34%
Flood35%
Natural disasters in
Victoria
$8.4m per year invested in resilience by Australian and State government under NDRP
$1bn per year TODAY
93% earthquake
18% bushfire
6% flood
76
5.9 VictoriaEmergency management in Victoria has shifted to an all-hazards approach that focuses on managing uncertainty by building resilience to a range of emergencies. To build capability and encourage community resilience, Victoria is partnering with community, government and business to share the responsibility of emergency management.
Victoria acknowledges that communities will experience increased and diverse emergencies, which will generate significant social and economic recovery costs. Increasing resilience is about focusing on communities and the links between people, services and structures. As a result, strategies, programs and actions can be planned, integrated and implemented, building safer and more resilient communities.
The recently released Community Resilience Framework for Emergency Management positions business, communities, and government agencies to work together to build capabilities. This will ensure better understanding and management of the ongoing chronic stress that may impact the community’s ability to recover after an emergency. As a result, resilience will lead to better anticipation, coping and recovery from acute shocks.
Victoria has gathered 120 industry and government participants in an All Sectors Resilience Network working on resilience. The Critical Infrastructure Resilience Strategy builds management arrangements that draw from national and international best practice.
The Victorian Preparedness Framework was developed to ensure the state is better equipped to plan for, respond to and recover from the emergencies that pose the greatest risk. The document outlines 21 ‘core capabilities’ that include people, resources, governance, systems and processes needed to manage events, reduce impacts, protect communities and increase resilience.
The core capabilities include the activities that must happen to fulfil the intent of each capability.
The Victorian Preparedness Framework:
• Enables emergency management agencies to develop their capability collaboratively with community, business and government, and identify key priorities before, during and after an emergency
• Helps emergency management agencies to understand their current and required capability to respond to major emergencies.
This knowledge will help the state work towards the objectives within the Victorian Preparedness goal.
5 Lessons from state and territory government initiatives
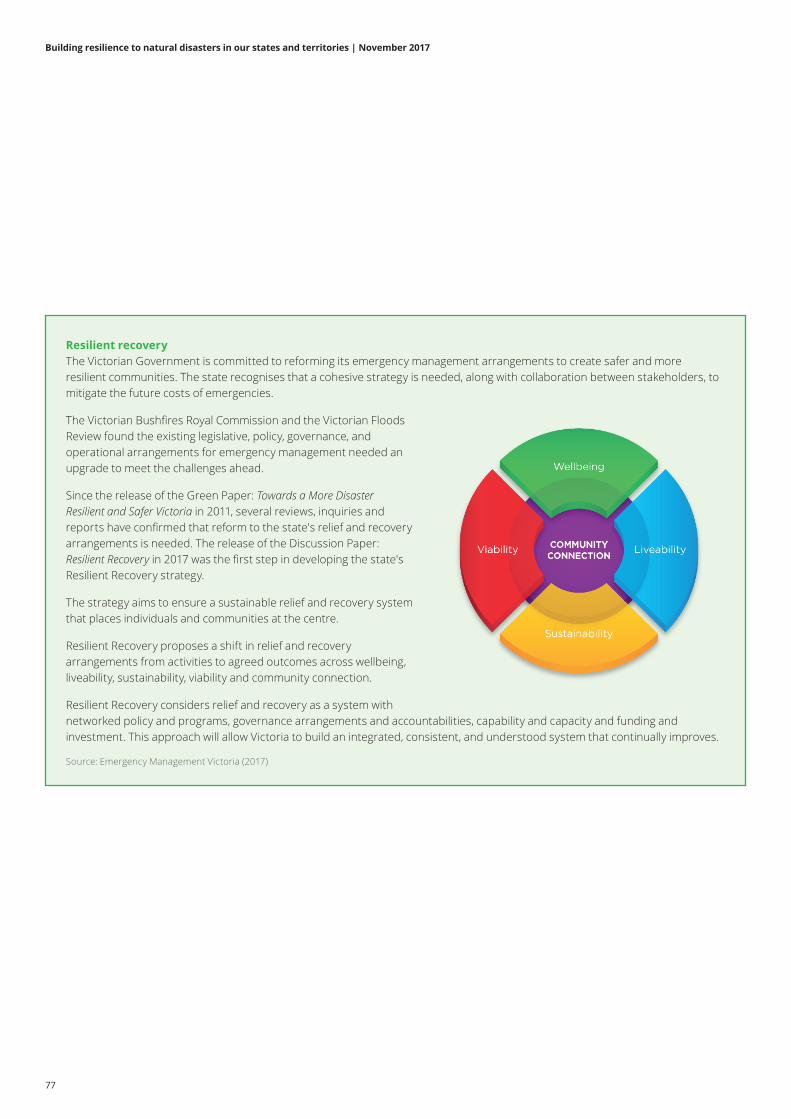
Building resilience to natural disasters in our states and territories | November 2017
77
Resilient recoveryThe Victorian Government is committed to reforming its emergency management arrangements to create safer and more resilient communities. The state recognises that a cohesive strategy is needed, along with collaboration between stakeholders, to mitigate the future costs of emergencies.
The Victorian Bushfires Royal Commission and the Victorian Floods Review found the existing legislative, policy, governance, and operational arrangements for emergency management needed an upgrade to meet the challenges ahead.
Since the release of the Green Paper: Towards a More Disaster Resilient and Safer Victoria in 2011, several reviews, inquiries and reports have confirmed that reform to the state's relief and recovery arrangements is needed. The release of the Discussion Paper: Resilient Recovery in 2017 was the first step in developing the state's Resilient Recovery strategy.
The strategy aims to ensure a sustainable relief and recovery system that places individuals and communities at the centre.
Resilient Recovery proposes a shift in relief and recovery arrangements from activities to agreed outcomes across wellbeing, liveability, sustainability, viability and community connection.
Resilient Recovery considers relief and recovery as a system with networked policy and programs, governance arrangements and accountabilities, capability and capacity and funding and investment. This approach will allow Victoria to build an integrated, consistent, and understood system that continually improves.
Source: Emergency Management Victoria (2017)
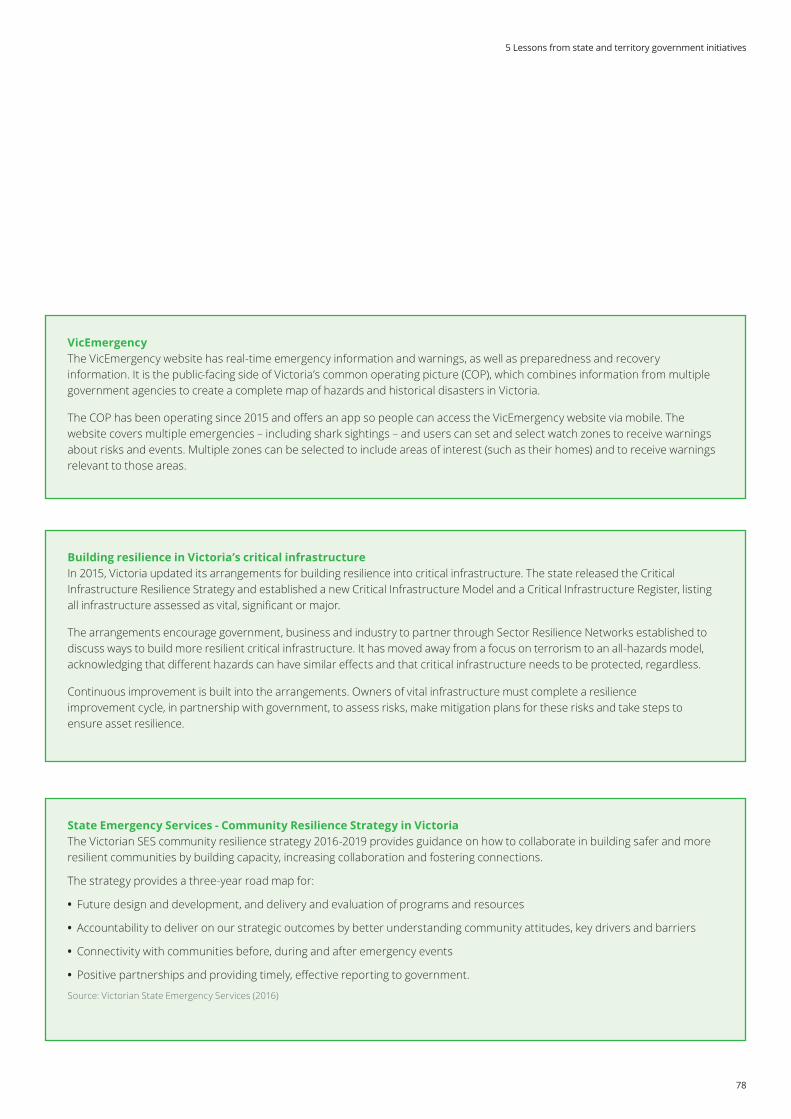
78
VicEmergencyThe VicEmergency website has real-time emergency information and warnings, as well as preparedness and recovery information. It is the public-facing side of Victoria’s common operating picture (COP), which combines information from multiple government agencies to create a complete map of hazards and historical disasters in Victoria.
The COP has been operating since 2015 and offers an app so people can access the VicEmergency website via mobile. The website covers multiple emergencies – including shark sightings – and users can set and select watch zones to receive warnings about risks and events. Multiple zones can be selected to include areas of interest (such as their homes) and to receive warnings relevant to those areas.
Building resilience in Victoria’s critical infrastructureIn 2015, Victoria updated its arrangements for building resilience into critical infrastructure. The state released the Critical Infrastructure Resilience Strategy and established a new Critical Infrastructure Model and a Critical Infrastructure Register, listing all infrastructure assessed as vital, significant or major.
The arrangements encourage government, business and industry to partner through Sector Resilience Networks established to discuss ways to build more resilient critical infrastructure. It has moved away from a focus on terrorism to an all-hazards model, acknowledging that different hazards can have similar effects and that critical infrastructure needs to be protected, regardless.
Continuous improvement is built into the arrangements. Owners of vital infrastructure must complete a resilience improvement cycle, in partnership with government, to assess risks, make mitigation plans for these risks and take steps to ensure asset resilience.
State Emergency Services - Community Resilience Strategy in VictoriaThe Victorian SES community resilience strategy 2016-2019 provides guidance on how to collaborate in building safer and more resilient communities by building capacity, increasing collaboration and fostering connections.
The strategy provides a three-year road map for:
• Future design and development, and delivery and evaluation of programs and resources
• Accountability to deliver on our strategic outcomes by better understanding community attitudes, key drivers and barriers
• Connectivity with communities before, during and after emergency events
• Positive partnerships and providing timely, effective reporting to government.
Source: Victorian State Emergency Services (2016)
5 Lessons from state and territory government initiatives
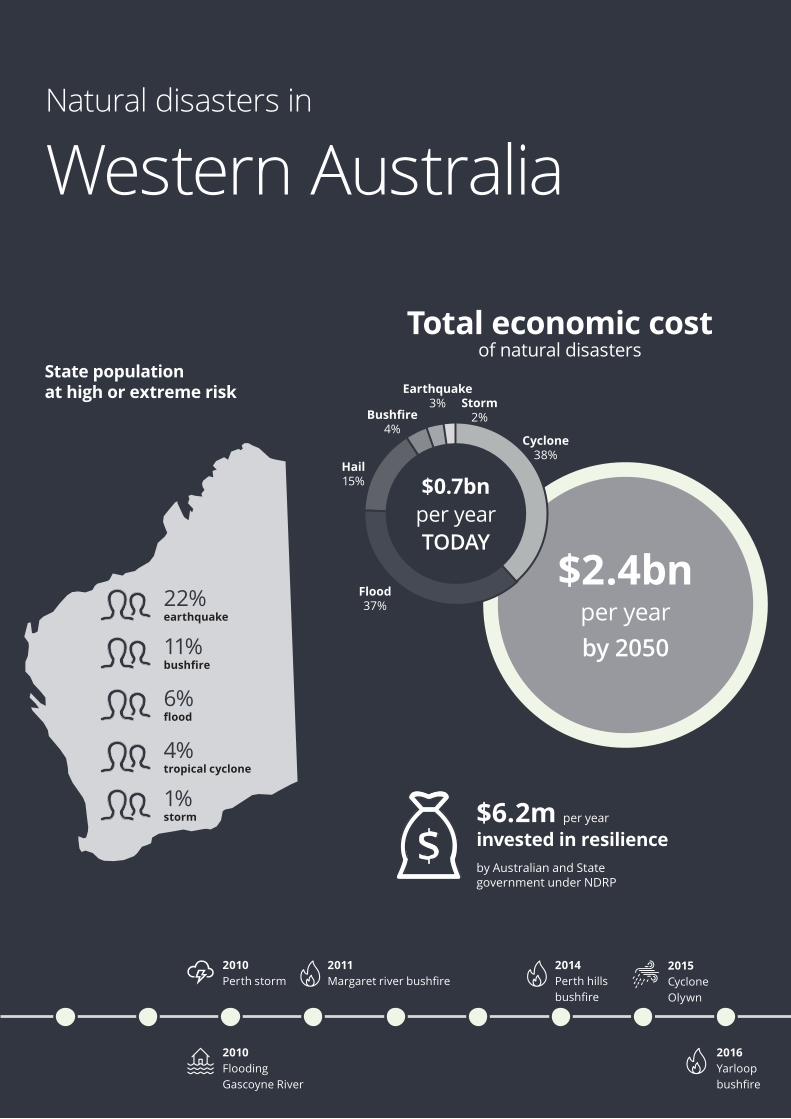
Building resilience to natural disasters in our states and territories | November 2017
79
2010 Perth storm
2010 Flooding Gascoyne River
2011 Margaret river bushfre
2014 Perth hills bushfre
2016 Yarloop bushfre
2015 Cyclone Olywn
$6.2m per year invested in resilience by Australian and State government under NDRP
Natural disasters in
Western Australia
State population at high or extreme risk
Total economic cost of natural disasters
$2.4bn per year by 2050
Earthquake3%
Cyclone38%
Storm2%
Hail15%
Bushfire4%
$0.7bn per year TODAY
Flood37%22%
earthquake
11% bushfire
4% tropical cyclone
6% flood
1% storm
80
5.10 Western AustraliaWestern Australia (WA) has intentionally separated disaster resilience governance arrangements from its emergency response services. The Office of Emergency Management (OEM) is a sub-department of the Department of Fire and Emergency Services and coordinates resilience efforts, with minimal involvement in the operational side of disaster response.
In recent years, the OEM and broader WA government has focussed on risk identification. Under the NDRP they funded a major all-hazards risk assessment to accurately map WA’s vulnerability to natural disasters. The project aims to:
• Understand WA’s risk profile and its capability to match that risk
• Identify lessons from previous disasters
• Plan how to best allocate resources
• Shift the funding balance from recovery to resilience.
The assessment shifted from state to district level and now the aim is for local governments to understand their risks. The OEM anticipates this risk assessment will identify existing gaps, guide treatment and mitigation options and help in prioritising resilience initiatives. Specifically, it will shape resource allocation in the future and shift the funding balance from recovery to resilience.
The OEM is also informing resilience investment. For example, under a new initiative called ‘the mitigation imperative’, all resilience projects must demonstrate how they will mitigate identified risks.
Pre-season preparedness briefingEach pre-season the WA SEMC hosts a preparedness briefing for senior emergency response agencies. In 2016, the briefing was broadened to include critical infrastructure operators, local government and major industries that play a role in state resilience. It gave the participants information to improve resilience planning.
This is a positive example of the mainstreaming that has begun across states and territories to shift towards an all-agencies, all-sectors approach to resilience.
State Risk ProjectWA’s State Risk Project seeks to comprehensively understand the risks faced at state, district and local levels. It is a more detailed risk assessment than that required by the NDRP. Workshops held in 2013 with relevant authorities, community groups and businesses examined the impact of seven natural disasters on families, the economy, the environment and infrastructure in a credible worst case scenario.
The assessment was widened to include 27 hazards at state and regional levels with more than 170 agencies participating in workshops. The project has established state risk hazard profiles, describing the likely impact in a given scenario. Each is assigned a likelihood, consequence and confidence level using the National Emergency Risk Assessment Guidelines 2015 criteria.
5 Lessons from state and territory government initiatives
Building resilience to natural disasters in our states and territories | November 2017
81
Emergency Preparedness ReportSince 2011, the SEMC has updated its Emergency Preparedness Report annually, taking a broad view of WA’s capacity to deal with large-scale emergencies. It recommends ways to improve resilience and better manage emergencies.
The report has become more comprehensive, setting out actions and priorities. Each report answers the question: are we ready?
The 2016 report noted that emergency management structures were successfully sharing information, skills and experience to assess risk and plan for them. It noted, the strengths and weaknesses within the emergency management sector and state more broadly while highlighting a range of initiatives that were underway to enhance resilience.
Remoteness remained a complicated issue and, despite extensive education campaigns, public understanding of risk remained low. The reports have improved transparency and accountability for disaster resilience and continue to do so.
All West Australians Reducing Emergencies (AWARE) programThe AWARE program is a grants scheme financed by the OEM to improve resilience at the district and local level. Since 2012 it has been investing in planning and human capacity building in WA.
AWARE has funded some very successful projects. For example, the disaster aware app developed in the City of Cockburn has helped residents prepare better. The app educates users on preparing, helps them create an emergency plan and share it with family and friends. It sends push notifications to warn residents of immediate dangers.
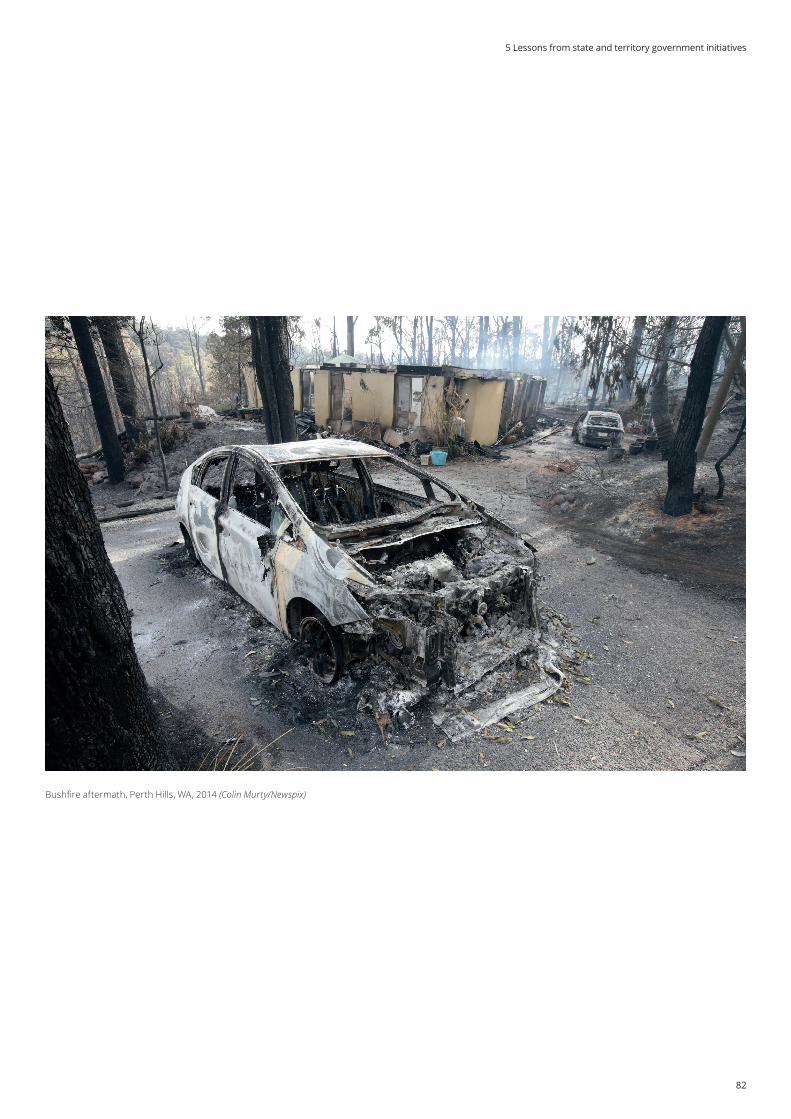
82
Bushfire aftermath, Perth Hills, WA, 2014 (Colin Murty/Newspix)
5 Lessons from state and territory government initiatives

Building resilience to natural disasters in our states and territories | November 2017
83
2007 Kangaroo Island bushfre
2015 Pinery bushfre
2015 Sampsons Flat bushfre
2016 SA severe windstorm
$4.2m per year invested in resilience by Australian and State government under NDRP
Natural disasters in
South Australia
State population at high or extreme risk
Total economic cost of natural disasters
$0.7bn per year by 2050
Bushfire57%
Flood13%
Hail23%
Storm6%
$0.2bn per year TODAY
91% earthquake
11% bushfire
4% flood
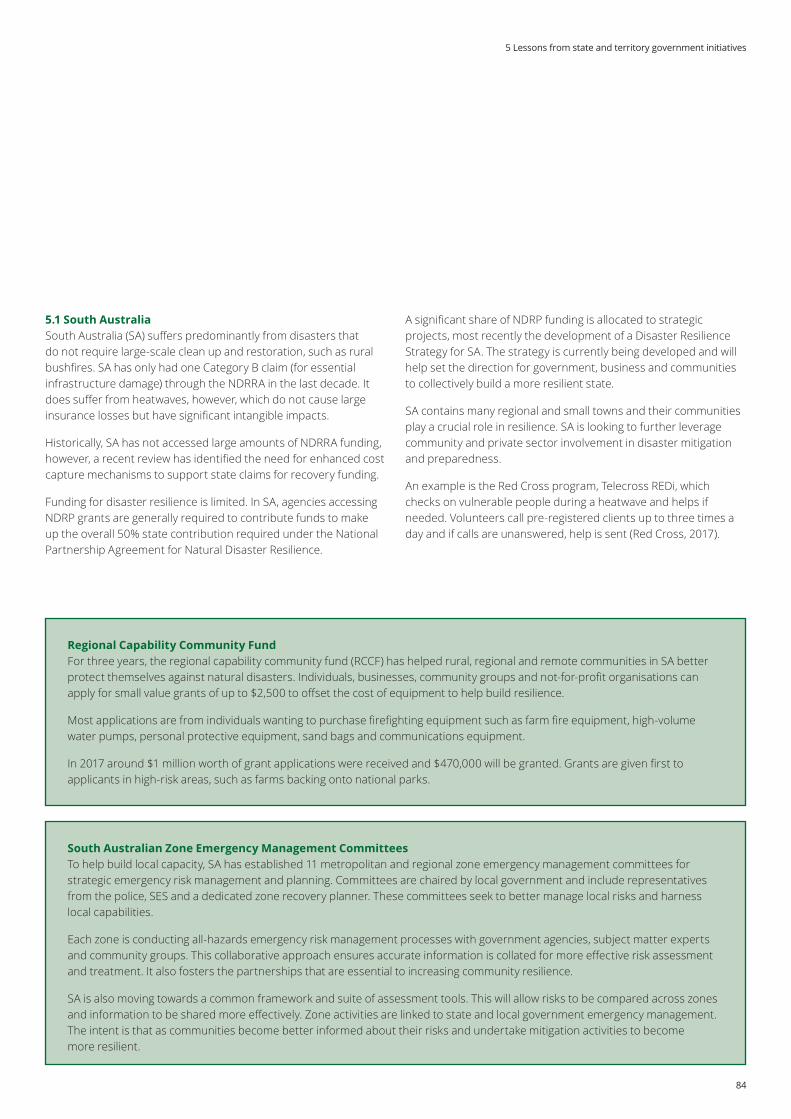
84
5.1 South AustraliaSouth Australia (SA) suffers predominantly from disasters that do not require large-scale clean up and restoration, such as rural bushfires. SA has only had one Category B claim (for essential infrastructure damage) through the NDRRA in the last decade. It does suffer from heatwaves, however, which do not cause large insurance losses but have significant intangible impacts.
Historically, SA has not accessed large amounts of NDRRA funding, however, a recent review has identified the need for enhanced cost capture mechanisms to support state claims for recovery funding.
Funding for disaster resilience is limited. In SA, agencies accessing NDRP grants are generally required to contribute funds to make up the overall 50% state contribution required under the National Partnership Agreement for Natural Disaster Resilience.
A significant share of NDRP funding is allocated to strategic projects, most recently the development of a Disaster Resilience Strategy for SA. The strategy is currently being developed and will help set the direction for government, business and communities to collectively build a more resilient state.
SA contains many regional and small towns and their communities play a crucial role in resilience. SA is looking to further leverage community and private sector involvement in disaster mitigation and preparedness.
An example is the Red Cross program, Telecross REDi, which checks on vulnerable people during a heatwave and helps if needed. Volunteers call pre-registered clients up to three times a day and if calls are unanswered, help is sent (Red Cross, 2017).
Regional Capability Community FundFor three years, the regional capability community fund (RCCF) has helped rural, regional and remote communities in SA better protect themselves against natural disasters. Individuals, businesses, community groups and not-for-profit organisations can apply for small value grants of up to $2,500 to offset the cost of equipment to help build resilience.
Most applications are from individuals wanting to purchase firefighting equipment such as farm fire equipment, high-volume water pumps, personal protective equipment, sand bags and communications equipment.
In 2017 around $1 million worth of grant applications were received and $470,000 will be granted. Grants are given first to applicants in high-risk areas, such as farms backing onto national parks.
South Australian Zone Emergency Management CommitteesTo help build local capacity, SA has established 11 metropolitan and regional zone emergency management committees for strategic emergency risk management and planning. Committees are chaired by local government and include representatives from the police, SES and a dedicated zone recovery planner. These committees seek to better manage local risks and harness local capabilities.
Each zone is conducting all-hazards emergency risk management processes with government agencies, subject matter experts and community groups. This collaborative approach ensures accurate information is collated for more effective risk assessment and treatment. It also fosters the partnerships that are essential to increasing community resilience.
SA is also moving towards a common framework and suite of assessment tools. This will allow risks to be compared across zones and information to be shared more effectively. Zone activities are linked to state and local government emergency management. The intent is that as communities become better informed about their risks and undertake mitigation activities to become more resilient.
5 Lessons from state and territory government initiatives
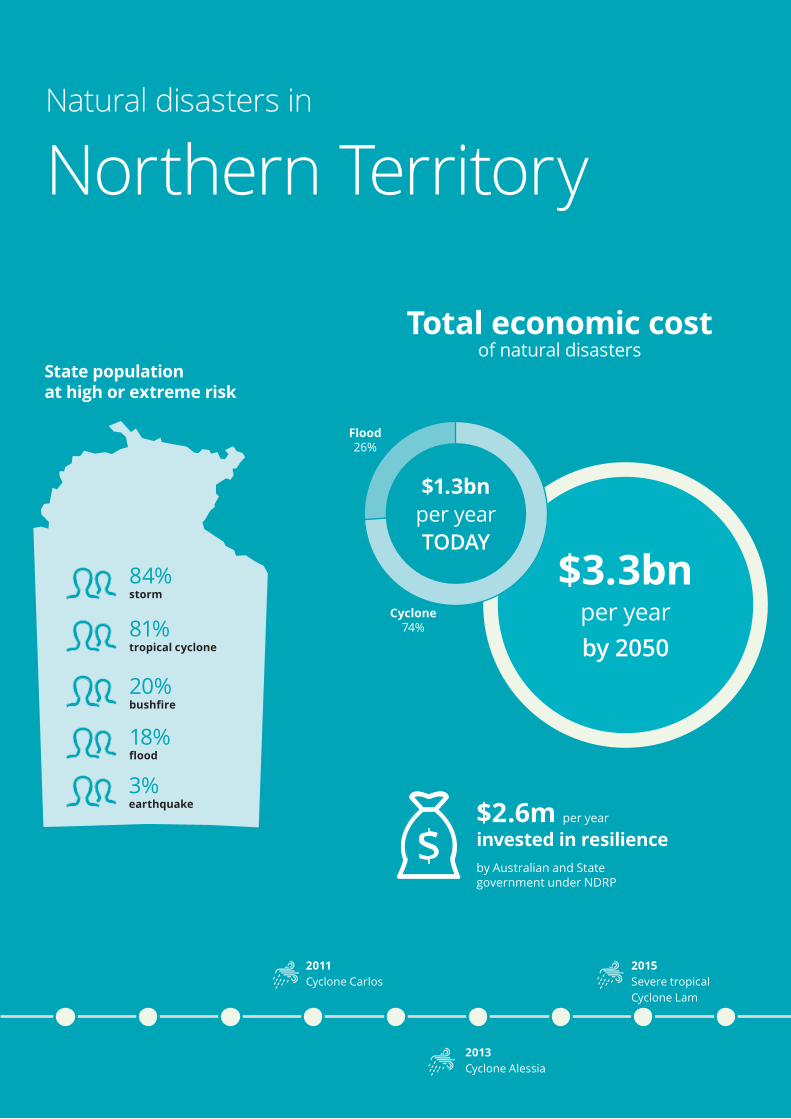
Building resilience to natural disasters in our states and territories | November 2017
85
2011 Cyclone Carlos
2013 Cyclone Alessia
2015 Severe tropical Cyclone Lam
State population at high or extreme risk
Total economic cost of natural disasters
$3.3bn per year by 2050
Cyclone74%
Flood26%
Natural disasters in
Northern Territory
$2.6m per year invested in resilience by Australian and State government under NDRP
$1.3bn per year TODAY
84% storm
81% tropical cyclone
20% bushfire
18% flood
3% earthquake
86
5.12 Northern TerritoryThe Northern Territory (NT) has a long-standing whole-of-government approach to resilience. This is partly due to its high exposure to natural disasters as well as its smaller population and government. The Territory Emergency Management Council (TEMC) leads resilience policy and is co-chaired by the Commissioner of Police and the CEO of the Department of the Chief Minister.
Several changes emerged after Cyclone Tracy in 1974 in which 70% of homes in Darwin were destroyed. The region lost critical infrastructure services, including drinking water, sewerage, telecommunications and electricity, and more than 36,000 residents were evacuated. The NT introduced zoning of cyclone regions and revised national standards for structural engineering to withstand cyclonic wind, particularly in cyclone-prone areas.
Nevertheless, resilience is not specifically recognised within the Emergency Management Act (2013), which requires emergency plans to be maintained at a territory, regional and local level. Plans must cover the response of government agencies after a disaster. The most recent plan has an additional focus on emergency prevention and mitigation and notes all levels of government are responsible for “mitigation in regard to land, property, the environment, assets and infrastructure” (NT, 2011).
While planning and infrastructure are recognised in the NT’s emergency management arrangements as playing a role in preparing communities, specific arrangements focus only on organisational responsibilities during a disaster.
Many aspects of the NT’s resilience management framework are under review such as its emergency management legislation. The NT has recently completed a territory-wide risk assessment to develop each community’s capability profile. This should improve its capacity to shift from reactive management to proactive risk mitigation.
The TEMC strategic plan for 2016-19 recognises an all-hazards, multi-agency, resilience-based approach to emergency management, aligned with the NSDR and CIRS (Northern Territory Government, 2016). Under the plan, the NT is aiming to better align emergency management with other components of resilience, specifically to:
• Inform land use planning and infrastructure resilience
• Improve government, business and cross sector partnerships by aligning critical infrastructure resilience guidelines with emergency management arrangements
• Drive accountability for managing hazards by ensuring agencies have current hazard capabilities.
The current NT planning scheme (2016) restricts developments in principal (1% AEP) and secondary (0.1% AEP) storm surge areas. New developments must gain consent to ensure appropriate safeguards, although development is still possible in designated flood areas. Outside this area, structural safety standards under building codes are applied.
The NT is one of the only states with a deemed to comply manual (DTCM) referenced in the national construction code (Vol 2, Part 3.10.1). The DTCM contains products or systems that are structurally adequate for high-wind areas and approved by the NT Building Advisory Committee. The DTCM significantly reduces the burden on builders to identify suitable products and is an effective way to ensure a building can deal with the territory’s onerous environmental conditions.
The territory recently postponed a decision to phase out the DTCM due to concerns it may reduce compliance with building codes (BPIC, 2016).
5 Lessons from state and territory government initiatives

Building resilience to natural disasters in our states and territories | November 2017
87
Flood mitigation advisory committeesRecognising regional flood risks, the NT Government sold part of the Territory Insurance Office and allocated $50 million to flood mitigation works (NT Government, 2016). To prioritise spending, the Chief Minister established Flood Mitigation Advisory Committee in Katherine, Darwin and, later, Alice Springs. The committees prioritise mitigation projects for their regions and decide how to best spend funds. Committees are comprised of government officials, business leaders and community members.
All three committees have presented five-year strategies for flood mitigation. Measures include infrastructure upgrades, land use planning and community education programs. Alice Springs’ plan centres around planning adjustments based on better mapping. Darwin is focussed on protecting infrastructure with ideas such as installing back-flow prevention devices around critical infrastructure and reviewing airport drainage. Katherine has made significant land use recommendations including relocating Katherine Hospital and, possibly, residents in highly flood-prone areas.
Each committee has a timeline and budget over five years. They have allocated the $50 million from the initial Flood Mitigation Fund and have recommended government funding to support the remaining priorities.
Community awareness and education – Key initiativesNT Police, Fire and Emergency Services drives community education and preparedness. The agency strategically aligned fire and emergency services under a new executive in 2016 to improve services to the community. It focuses on prevention, planning and mitigation to reduce disaster impacts. Resilience activities include education and awareness programs, bushfire mitigation activities, building compliance inspections and local emergency planning reviews.
The remoteness and diversity of the NT population demands a collaborative and community-driven approach. Almost half of the 250,000 people living in the NT are in remote or very remote areas and many communities are inaccessible during wet season. There are more than 20 languages spoken in Indigenous communities, which is a challenge in planning for and recovering after disasters.
As such, the NT focuses on finding the best way to work with different groups and has worked closely with the Red Cross to assign regional resilience officers.
Recent initiatives to improve disaster preparedness in the broader community include the NTES Australian sign language community message, developed by NT Emergency Services and Deaf NT. These short online videos enable hearing-impaired people to prepare for cyclones, floods and storms. During emergencies, 15-second videos are broadcast on television.
For children aged between five and 12, a SES mascot Paddy Platypus hosts events at schools and in communities to share information about preparation for floods, storms and cyclones. The initiative hopes to create generational change in awareness around natural disasters.
The NT runs programs with Indigenous communities under the NDRP to understand how they prepare for disasters. Consultation revealed new recommendations for better supporting communities, such as supporting the regular removal of debris.
Figure 5.3: Auslan community messages program in the NT
Source: NTES (2017)
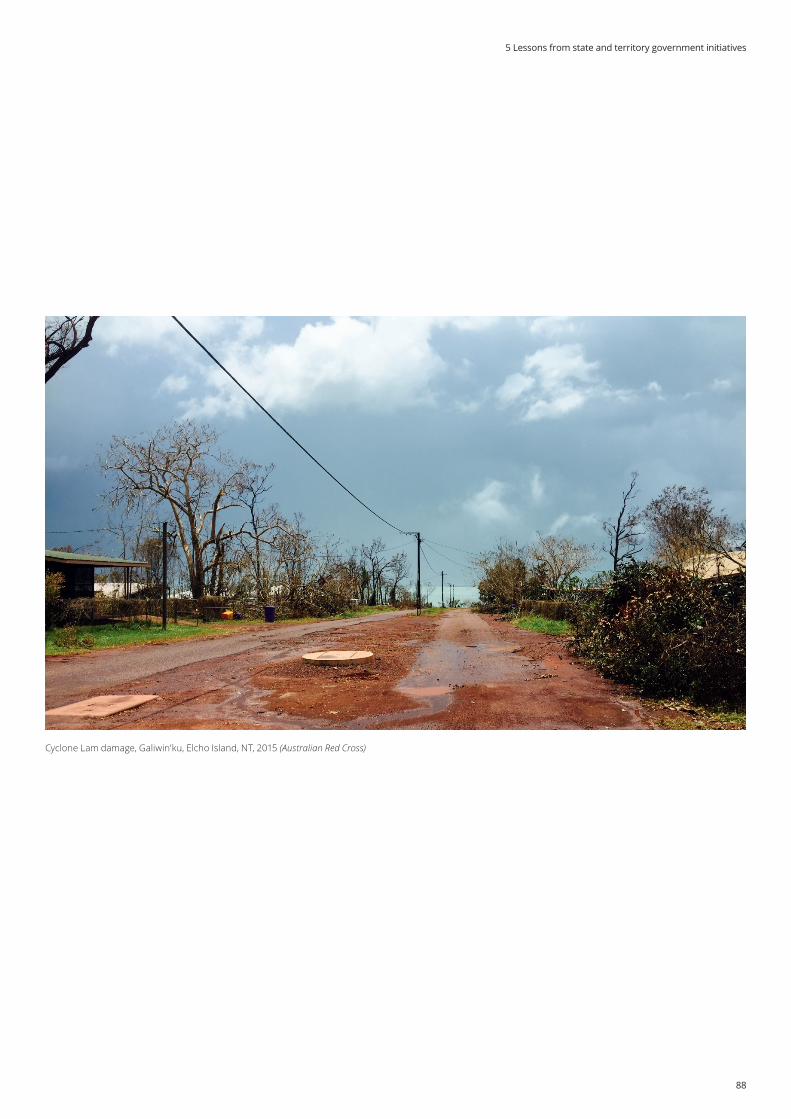
88
Cyclone Lam damage, Galiwin'ku, Elcho Island, NT, 2015 (Australian Red Cross)
5 Lessons from state and territory government initiatives
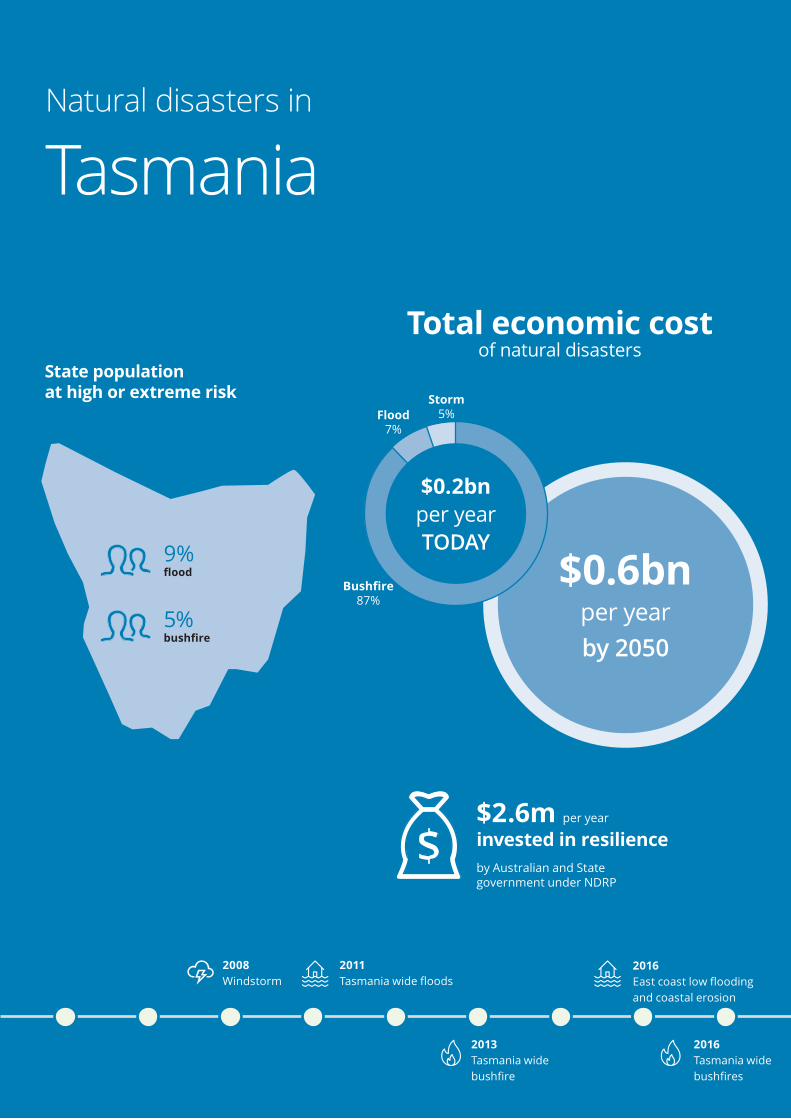
Building resilience to natural disasters in our states and territories | November 2017
89
2008 Windstorm
2011 Tasmania wide floods
2013 Tasmania wide bushfre
2016 East coast low flooding and coastal erosion
2016 Tasmania wide bushfres
$2.6m per year invested in resilience by Australian and State government under NDRP
Natural disasters in
Tasmania
State population at high or extreme risk
Total economic cost of natural disasters
$0.6bn per year by 2050
Bushfire87%
Flood7%
Storm5%
$0.2bn per year TODAY9%
flood
5% bushfire
90
2016 Tasmania wide bushfres
5.13 TasmaniaTasmania’s recent focus has been on risk and awareness. The 2016 Tasmanian state natural disaster risk assessment (TSNDRA) reviewed exposure of Tasmanian regions to hazards, which for the first time included coastal inundations and heatwaves.
The TSNDRA has already resulted in coastal inundation risk being included in planning codes. In March 2017 planning provisions began to ensure areas at high risk of coastal inundation and erosion were not built on. Any approved developments must allow for sea level rise (Coast Adapt, 2017).
The TSNDRA is also being used to inform the next SEMC Strategic Directions Framework which sets out outcomes and principles to better identify, prioritise and implement resilience programs.
The current Framework is a five-year plan (2013-2018) to help to apply the Hyogo Framework (the precursor to the Sendai Framework) and national strategy into emergency management arrangements. It recommends four strategic directions:
• Understanding and managing risks
• Recovery and building resilience
• Ensuring capability and capacity
• Developing collaborative leadership.
The framework is under review for 2018 when it will focus on policy-based resilience and incorporating the Sendai Framework.
Community Protection Planning UnitCommunity Protection Planning (CPP) is run by the Tasmanian Fire Service to improve community bushfire safety. Rather than the traditional focus on households or individual properties, it has a community-centred, consultative focus.
Locals are surveyed for each protection plan to establish which assets the community values most and where people are likely to shelter during a bushfire. A risk assessment is done so the community can critically analyse community bushfire risk and tailor risk treatments appropriate to the community through consultation.
The program won a Resilient Australia Award in 2014 for shifting behaviours and helping communities build bushfire resilience.
TasALERTTasALERT is an online emergency warning and information system currently being developed. It will allow residents to enter their address and learn about their disaster vulnerabilities, as well as current incidents in their area.
The project is administered by the Department of Premier and Cabinet with input from government agencies including the SES, police, fire and ambulance services. The website will include volunteering opportunities and guidance on disaster preparedness and resilience campaigns.
5 Lessons from state and territory government initiatives
Building resilience to natural disasters in our states and territories | November 2017
91
Join, Learn, Be ReadyJoin, Learn, Be Ready is a multi-agency volunteer recruitment and public awareness campaign to encourage volunteers to help build resilience. It aims to counteract the trend that people volunteer in the aftermath of an emergency but not to help prevent them.
It unifies volunteer recruitment across six of Tasmania’s emergency response and disaster recovery agencies (including fire and ambulance services, the SES and the Red Cross) to allow people to learn about different agencies and how they can help to build resilience. It includes a volunteer matching and referral service to help prospective volunteers find a suitable placement.
Fuel Reduction programThe Tasmanian Fire Service runs a fuel reduction program to lower the long term risk of catastrophic fires in Tasmania. The program was developed in response to the 2013 Tasmanian bushfires and findings from the Royal Commission into the 2009 Victorian bushfires.
Almost half (42%) of Tasmanian land is at risk of fires and is suitable for fuel reduction – equating to 2.5 million hectares of private, reserve or public land. As such, the program operates as a cross-agency, state-wide initiative.
Fuel reduction burns are prioritised by the Tasmanian Fire Service using a combination of local knowledge and computer modelling to identify high-risk areas, regardless of public or private land ownership. Community engagement officers include the public in planning activities through community forums, landholder consultations and public notifications.
In the 2017 budget, the program was allocated a further $27 million over four years to continue fuel reduction burning and other fire mitigation activities.
Source: Tasmania Fire Service (2017)
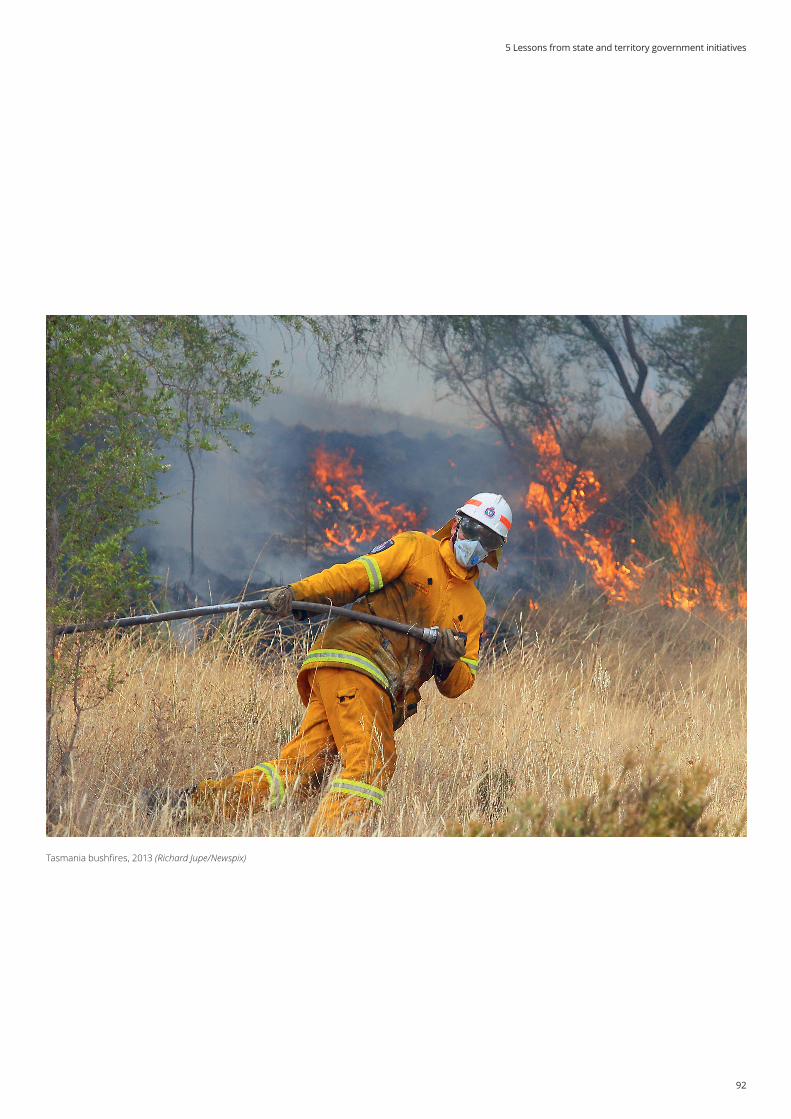
92
Tasmania bushfires, 2013 (Richard Jupe/Newspix)
5 Lessons from state and territory government initiatives
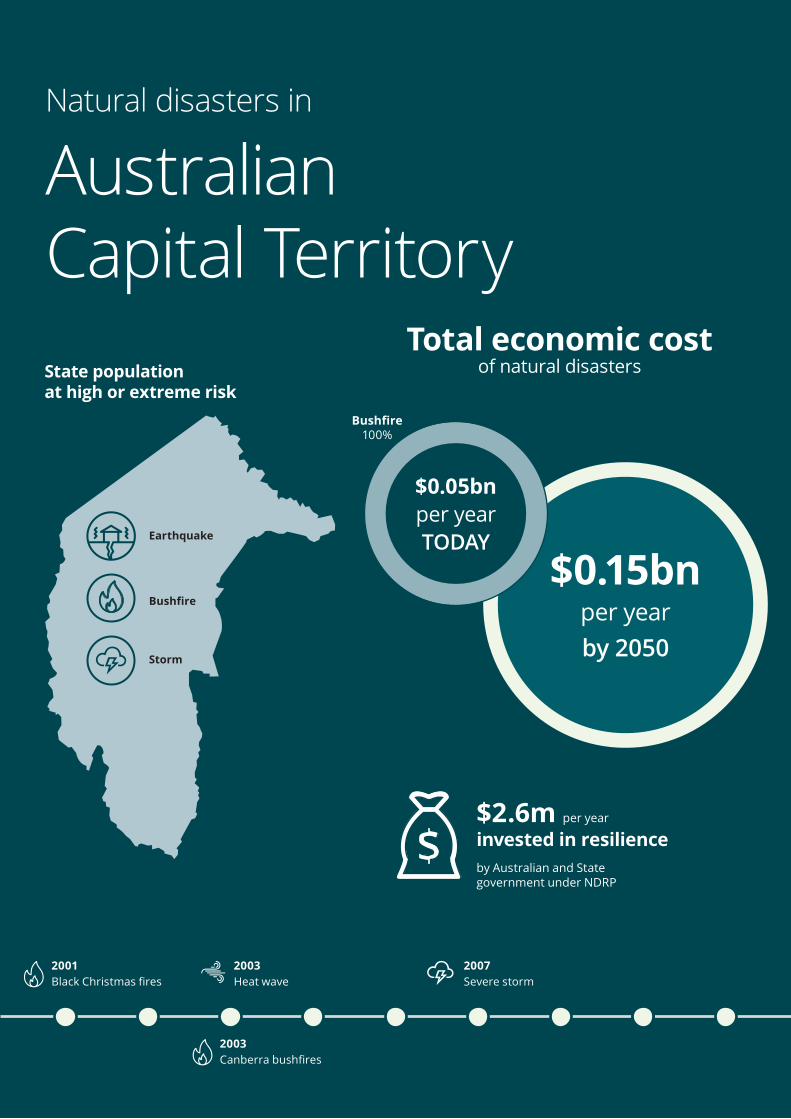
Building resilience to natural disasters in our states and territories | November 2017
93
2001 Black Christmas fres
2003 Heat wave
2003 Canberra bushfres
2007 Severe storm
State population at high or extreme risk
Natural disasters in
Australian Capital Territory
$2.6m per year invested in resilience by Australian and State government under NDRP
Earthquake
Bushfire
Storm
$0.15bn per year by 2050
Bushfire100%
Total economic cost of natural disasters
$0.05bn per year TODAY

94
5.14 Australian Capital TerritoryIn the Australian Capital Territory (ACT), resilience is a whole-of-government responsibility. Several directorates play a role, including:
• The Justice and Community Safety Directorate: implements resilience policy
• The Community Services Directorate: heavily involved in post-disaster community recovery and ‘building back stronger’
• The Health Directorate: monitors post-disaster mental and psychological health
• The Environment, Planning and Sustainable Development Directorate: looks after infrastructure with a focus on resilience to climate change.
The SEMC provides general strategic direction to the ACT Government’s prevention and preparedness arrangements for emergencies under an all-hazards planning framework. The SEMC comprises all ministers as well as the Chief Police Officer, ACT Policing, the Emergency Services Commissioner, the Chief Health Officer and the Directors-General of Chief Minister, Treasury and Economic Development Directorate (CMTEDD), Justice and Community Safety Directorate ( JACS), Health Directorate and Community Services Directorate (CSD).
The SEMC is supported by the Security and Emergency Management Senior Officials Group (SEMSOG). The SEMSOG is the primary mechanism for ensuring cooperation and coordination of activities between ACT Government agencies in emergency planning and response. SEMSOG is comprised of the Directors General of each ACT Government Directorate, as well as other relevant officials.
The SEMSOG sets strategic priorities that guide its work over the medium term. For example, the strategic assessment of risks associated with the updated territory-wide risk assessment (TWRA) and implementation of the ACT Climate Change Adoption Strategy. Three of the seven strategic priorities of the SEMSOG are critical infrastructure resilience, community resilience, and capability and capacity.
The ACT is smaller the other jurisdictions. It has a single-tier of government, with no local or regional government. Whilst this can make it easier to implement policy and co-ordinate responses, resourcing can be a challenge.
The ACT follows an all-hazards approach for managing emergencies that looks at the impact of disasters on the community. The ACT is currently reviewing its critical infrastructure arrangements, which includes updating its critical infrastructure register and analysing interdependencies and their possible impacts during and after a disaster. For the first time this year NDRP grants are being cross-checked against the TWRA and SEMSOG priorities to ensure the most important programs are funded.
Single Point of Truth (SPOT)The 'single point of truth' (SPOT) app channels all emergency information and disseminates emergency alerts, updates and warnings to multiple platforms. These include the ACT Emergency Services Agency (ESA) website, Twitter, Facebook, email and SMS distribution groups.
SPOT can distribute each alert simultaneously, within seconds, to audiences including the general public, call centres, ministers and ACT government executives. The app won the top national prize in the 2012 Resilient Australia Awards and has gained national and international interest from emergency management groups.
The streamlined system allows for faster information sharing in times of crisis and a more connected community.
ACT FirstACT first is run by Green Cross Australia, which helps business and communities build resilience. It is a partnership between the ACT Government and Australian National University, funded by the NDRP.
The interactive ACT First website uses engagement techniques including:
• Data on 100 years of disasters in the ACT, with information on the regions affected, the impacts, contributing factors and lessons learnt
• An involvement map showing the number of people in each region preparing for disasters to encourage more
• Tips on preparing for disasters such as clearing gutters and checking on elderly neighbours.
• Inspirational success stories
• Step-by-step personalised readiness plans based on region, housing arrangements and family structure.
5 Lessons from state and territory government initiatives
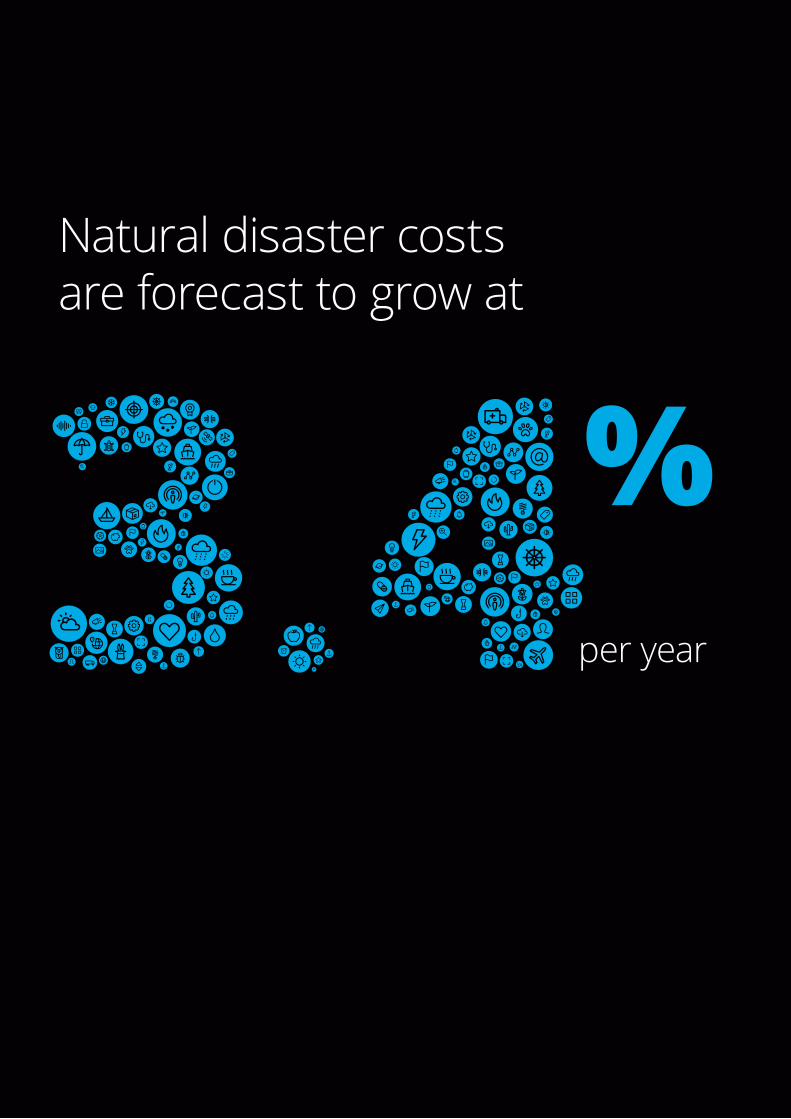
Building resilience to natural disasters in our states and territories | November 2017
95
Natural disaster costs are forecast to grow at
per year

96
6 Recommendations
Key pointsThis report makes four recommendations:
• State governments need to mainstream and embed resilience across all aspects of policy and decision-making.
• Investments in resilience should be prioritised with consideration of their double dividend potential.
• Government, business and the community should improve understanding of disaster risks, and cost to society.
• All stakeholders should collaborate in a coordinated approach to build resilience and address the long-term costs of natural disasters.
This report has considered the roles, opportunities and challenges to disaster resilience for states and territories in Australia.
Its four key recommendations outline strategies to improve this resilience. They are targeted at states and territories, given their key role in building resilience, but apply equally to other levels of government, business and the community.
Embed resilience across all aspects of policy and decision-making
Disaster resilience is enabled through a broad set of mitigation measures and policies beyond emergency management. There is an opportunity for states to embed resilience more consistently across portfolios – from infrastructure to planning to health and social policy and consider strategies to implement resilience as part of their work in the short-to-medium term.
The biggest opportunity lies in planning, land use and building controls. It is of economic benefit to address resilience in the development phase rather than retrofitting after natural disasters have occurred.
State, district and local emergency management committees are well placed to drive a collaborative approach. Responsibilities, including by agency, should be clearly outlined by these committees to ensure resilience is integrated and states use all the levers at their disposal to mitigate disaster impacts.
Meanwhile, business and not-for-profit groups could be engaged more directly in decision-making and resilience policy, including through these committees.
This report recommends that all agencies work together to:
• Understand the implications of the state-wide risk assessments and the critical infrastructure resilience strategies for their portfolios
• Establish state and local risk reduction strategies with clear responsibilities by agency
• Include long-term mitigation planning as a strategic objective of all portfolios
• Engaging business and community experts in strategic planning and decision-making.
1
6 Recommendations
Building resilience to natural disasters in our states and territories | November 2017
97
Land use, planning and development agencies should:
• Embed disaster resilience into land use planning regulation to more responsibly manage development in areas at high-risk of natural disasters
• Consider opportunities for improved resilience earlier in decision-making by amending land use and infrastructure approval processes
• Implement the roadmap for land use and building codes legislation, partnerships and training developed by the Australia-New Zealand Emergency Management Committee (ANZEMC) to improve guidance for decision-makers.
Prioritise resilience investments by considering the broader economic and social benefits that result
Inevitably, governments face competing budget priorities and funding constraints. Resilience investment should be prioritised and efficiently allocated in response to identified disaster risks.
To achieve long-term resilience for Australia's growing and largely coastal population, tough decisions must be made about the location and type of infrastructure the country develops, maintains or replaces.
The Roundtable has previously emphasised the role of cost-benefit analysis to inform robust evaluation of resilience opportunities. This report builds on that by exploring the additional benefits, or double dividend, that can be achieved by resilience investment.
A double dividend includes an investment's co-benefits, such as improved business and consumer confidence. Co-benefits are more difficult to measure and, as such, have rarely been adequately factored in to decisions. However, they are crucial to local economies and communities and should be evaluated as such.
The double dividend of a resilience measure is first, the avoided losses when a disaster occurs and second, the co-benefits that arise even in the absence of a disaster. Co-benefits can include jobs, new skills, service reliability and better business confidence.
Funds specifically allocated to resilience remain limited in contrast to recovery costs. This makes it even more crucial to prioritise investments that lessen future disaster costs as well as deliver a double dividend.
The benefits of resilience measures should be considered in full and reviewed on a case-by-case basis so investment can be better prioritised and the value of both physical and community measures can be better communicated.
This report recommends that all levels of government:
• Scope options that include both physical and community measures, including opportunities for a mixed approach to mitigate future disaster costs
• Use cost-benefit analysis to prioritise options that mitigate the long-term cost of natural disasters
• Assess the co-benefits of resilience projects – such as employment, growth, business confidence and social connectedness – to inform the full picture when prioritising investments
• Consider the costs and benefits of community resilience measures and the longer-term social impacts of their implementation.
Improve understanding of disaster risks, costs to society and activities to improve resilience
There has been significant improvement in data for some hazard types in recent years, such as state-wide flood maps in Queensland and NSW, and bushfire mapping in Victoria. However, there are still limitations associated with the availability, consistency and usability of data relevant to natural disaster risks.
2
3
98
Limited comprehensive data is available on disaster events, economic costs, affected people, assets and essential services – despite the requirement for these data to be included in Sendai Framework reporting from 2019.
Government spending on both recovery and resilience is not collated and remains difficult to monitor. Recovery expenditure data at the local, state or federal level is not comprehensive given that only a small share is claimable under the Natural Disaster Relief and Recovery Arrangements. As the Productivity Commission found in 2014, natural disasters have become a growing unfunded liability for governments.
State resilience investment face similar monitoring problems. While there is some funding explicitly for resilience under co-funding arrangements, states invest in resilience outside of these arrangements, which makes it difficult to demonstrate the value-add of these investments and their impact on mitigating future disaster costs. The betterment framework for recovery expenditure is one, albeit complex, toolkit for apportioning resilience costs.
While the variability and volatility of natural disasters does make fiscal planning difficult, greater visibility around data and expenditure is needed so governments can better manage recovery costs and capitalise on the savings associated with resilience investment.
This report recommends that all levels of government:
• Collate accessible, consistent and reliable data on disaster risks for use by technical and a non-technical citizen audience
• Develop a comprehensive approach to monitor and report on:
– The economic costs of natural disasters and direct recovery spending to build awareness of their broader long-term impacts
– Resilience investment by all levels of government to improve transparency.
Collaborate and coordinate to build resilience and address the long-term costs of natural disasters
The impacts of natural disasters are felt by individuals, businesses, governments and communities – and across government portfolios. Without collective action, complacency is a risk and disaster impacts are likely to be worse. A collaborative cross-sector process is needed to mitigate the impact of natural disasters.
Leveraging local knowledge can lead to more targeted and better-informed infrastructure and planning decisions, as well as more effective awareness, education and engagement programs. Community-driven solutions are already being used to effectively build resilience. These programs tend to be well-aligned to community needs and capabilities, reducing the burden on individual stakeholders.
Engaging business, community and not-for-profit groups in local emergency management resilience planning should be fostered. It drives collective buy-in, innovation, sustained resourcing and accelerates change to ultimately make communities safer.
This report recommends that all levels of government:
• Collaborate with businesses and communities to:
– Harness local knowledge in the design, uptake and delivery of mitigation
– Strengthen their understanding of capabilities and capability gaps
– Incorporate resilience into strategic planning and decision making
• Establish long-term policy planning for resilience and secure funding arrangements for resilience within and outside the National Partnership Agreement on Natural Disaster Resilience.
4
6 Recommendations

Building resilience to natural disasters in our states and territories | November 2017
99
References
ABC News (2016), ‘Wagga Wagga mayor confident levee bank project funding will continue from NSW government’, accessed 5 August 2017, http://www.abc.net.au/news/2016-01-19/wagga-wagga-mayor-confident-levee-bank-project-funding-will-con/7097706
ACT Emergency Services Agency (2017), ‘Emergency Arrangements’, accessed 6 July 2017, http://esa.act.gov.au/emergency-management/emergency-arrangements/
Andrews, G., Chau, S., Fu, Y., Lubarsky, K., Smith, D. and Waite, J. (2016), The cost and funding of natural disasters in Australia – current position paper. In: General Insurance Seminar. Melbourne: Institute of Actuaries of Australia. Available at: https://www.actuaries.asn.au/Library/Events/GIS/2016/NaturalDisastersWorkingGroup2016.pdf
Anikeeva, O., Steenkamp, M. and Arbon, P. (2014), 'Earthquake preparedness in South Australia: recommendations based on previous earthquakes in Australia, New Zealand and the United States of America', Australian Journal of Emergency Management, 29 (2).
Australian Building Codes Board (2017), ‘About’, accessed 28 August 2017, https://www.abcb.gov.au/NCC/About
Australian Bureau of Statistics (2017), 3218.0 - Regional Population Growth, Australia, 2016 Canberra
Bell, C., Carter, F., Boden, J., Wilkinson, T. and McKenzie, J. (2016), 'Psychological impact of the Canterbury earthquakes on university staff', The New Zealand Medical Journal, pp 18-26.
Billings, P. (2014), 'New flood levees ‘return rivers to the people', The Examiner. Available at: http://www.examiner.com.au/story/2491471/new-flood-levees-return-rivers-to-the-people/
BMT WBM (2012), Tweed Valley Floodplain Risk Management Plan, prepared for Tweed Shire Council.
Boura, J. (1998), ‘Community Fireguard: creating partnerships with the local community to minimise the impact of bushfire’, Australian Journal of Emergency Management, pp 59-64.
Building Products Innovation Council (2016), Industry Position Paper - NT Deemed to Comply Manual Consultation.
Bureau of Meteorology (2017), ‘Why do 100 year events happen so often?’, accessed 7 July 2017, http://www.bom.gov.au/water/designRainfalls/rainfallEvents/why100years.shtml
Bureau of Meteorology and CSIRO (2016), State of the Climate 2016, Commonwealth of Australia, Canberra.
Bureau of Transport Economics (2001), Economic Costs of Natural Disasters in Australia, Bureau of Transport Economics Report 103, Canberra.
Charles Sturt University (2017), Research Impact: Building community connections for disaster resilience, Available at: https://innovate.csu.edu.au/__data/assets/pdf_file/0007/2779477/building-community-connections-for-disaster-resilience.pdf
City of Launceston (2016), ‘City of Launceston annual report 2015-16’, accessed 10 July 2017, https://www.launceston.tas.gov.au/Council/Strategies-Budgets-Reports-and-Policy
Coast Adapt (2017), Planning approaches in Tasmania, Available at: https://coastadapt.com.au/planning-approaches-tasmania
Coleman, S. (2017), ‘Australia state of the environment 2016: built environment ’, Australian Government Department of the Environment and Energy.
Council of Australian Governments (2013), Nation Partnership Agreement on Natural Disaster Resilience.
Daily Mercury (2017), 'Win for 6000 Mackay families as new flood maps revealed', Available at: https://www.dailymercury.com.au/news/win-for-6000-mackay-families-as-new-flood-maps-rev/3166262/
Deloitte (2015), Building the Luck Country #5: The purpose of place reconsidered.
Deloitte Access Economics (2013), Building our Nation’s Resilience to Natural Disasters, report commissioned by the Australian Business Roundtable for Disaster Resilience and Safer Communities.
– (2014), Building an Open Platform for Natural Disaster Resilience Decisions, report commissioned by the Australian Business Roundtable for Disaster Resilience and Safer Communities.
100
– (2016), Building resilient infrastructure, report commissioned by the Australian Business Roundtable for Disaster Resilience and Safer Communities.
– (2016), The Economic Cost of the Social Impact of Natural Disasters, report commissioned by the Australian Business Roundtable for Disaster Resilience and Safer Communities.
Department of Infrastructure and Regional Development (DIRD), (2017), Infrastructure Investment Program, Australian Government.
Department of Infrastructure, Local Government and Planning (2017), ‘RACQ Get Ready Queensland Initiative’, accessed 7 July 2017, http://www.dilgp.qld.gov.au/local-government/grants/racq-get-ready-queensland-program.html
Department of Police and Emergency Management (2015), Tasmania Emergency Management Plan, Hobart.
EM-DAT The International Disaster Database (online), ‘Explanatory Notes’, Centre for Research on the Epidemiology of Disasters, accessed 10 October 2017 http://emdat.be/explanatory-notes
Emergency Management Victoria (2017a), Community Resilience Framework for Emergency Management, Melbourne.
– (2017b), Victorian Preparedness Framework, Melbourne.
– (2017c), Resilient Recovery Discussion Paper, Melbourne.
– (2016a), Critical Infrastructure Resilience Strategy, Melbourne.
– (2016b), Emergency Management Manual Victoria, Melbourne.
Emergency New South Wales (2017), ‘NSW Emergency Management Arrangements’, accessed 17 July 2017, https://www.emergency.nsw.gov.au/about-us/semc/nsw-emergency-management-arrangements.html
Every, D., Reynolds, A., Clarkson, L., Bearman, C., Matthews, R., Haigh, L. and Dawson, D. (2016), Capturing community experiences in the 2015 Sampson flat fire, Bushfire and Natural Hazards CRC.
Geoscience Australia (2017) Where do earthquakes occur, available at: http://www.ga.gov.au/earthquakes/staticPageController.do?page=earthquake-hazard/where-do-earthquakes-occur.
Gibbs, L., Sia, K., Block, K., Baker, E., Nelsson, C., Gilbert, J., and Cook, A. (2015), Cost and outcomes associated with participating in the community fireguard program: Experiences from the black Saturday bushfires in Victoria, Australia, International Journal of Disaster Risk Reduction, 13, pp 375-380.
Gissing, A. and Van Leeuwen, J. (2017), Flood risk perceptions of Lismore Businesses, Risk Frontiers, Briefing Note 340.
Goldsworthy, H., McBean, P. and Somerville, P. (2015), Mitigation of seismic hazard in Australia by improving the robustness of buildings. In: Tenth Pacific Conference on Earthquake Engineering. Sydney. Available at: http://www.aees.org.au/wp-content/uploads/2015/12/Paper_3.pdf
Griffith, M. and Lucas, W. (2016), Economic loss modelling of earthquake damaged buildings, Bushfire and Natural Hazards CRC.
Harwood, S., Carson, D., Wensing, E., and Jackson, L. (2014), ‘Natural Hazard Resilient Communities and Land Use Planning: The Limitations of Planning Governance in Tropical Australia’, Journal of Geography & Natural Disasters, 4 (2).
Haynes, K., Coates, L., de Oliveira, F., Gissing, A., Bird, D., van den Honert, R., Radford, D., D’Arcy, R, and Smith, C. (2016), An analysis of human fatalities from floods in Australia 1900-2015, Bushfire and Natural Hazards CRC.
Hunt, S. (2017), Implementing Disaster Resilience Policy in the Australian Federation, Peer-reviewed research proceedings from the Bushfire and Natural Hazards CRC & AFAC conference Sydney, 4 – 6 September 2017.
Insurance Australia Group (2017a), ‘Good Hoods’, accessed 21 August, http://www.goodhoods.com.au/what-resilience
– (2017b), ‘The role of exposure, capital and infrastructure in post-disaster recovery’, FMA conference paper.
Insurance Brokers Association of New Zealand (2017), Seminar on internal fitout failures. Available at: https://ibanz.co.nz/Seminar-on-Internal-fitout-failures/10193-d4215332-039c-406f-9887-604c37b161f2/
References
Building resilience to natural disasters in our states and territories | November 2017
101
Reisinger, A., R.L. Kitching, F. Chiew, L. Hughes, P.C.D. Newton, S.S. Schuster, A. Tait, and P. Whetton (2014), Australasia. In: Climate Change 2014: Impacts, Adaptation, and Vulnerability. Part B: Regional Aspects. Contribution of Working Group II to the Fifth Assessment Report of the Intergovernmental Panel on Climate Change, Cambridge University Press pp. 1371-1438
Maqsood, T., Edwards, M., Wehner, M. and Corby, N. (2017), Launceston Flood Risk Mitigation Assessment Project, Bushfire and Natural Hazards CRC.
McCue, K. (2010), Land of earthquakes and volcanoes, Australian Geographic. Available at: http://www.australiangeographic.com.au/news/2010/02/land-of-earthquakes-and-volcanoes/
Mulligan, M., McLennan, B. and Kruger, T. (2016), Resilient Melbourne: Implementing the Rockefeller Foundation 100 Resilient Cities Project in Melbourne, RMIT University.
Munich RE (2015), Expect the unexpected: scientific facts and economic impacts of natural disasters. Available at: https://www.munichre.com/site/corporate/get/documents_E284843648/mr/Australia-Hazards/documents/Downloads/302-08732_en.pdf
Northern Territory Government (2016a), ‘Flood mitigation in the Northern Territory’, accessed 12 July 2017, https://dipl.nt.gov.au/lands-and-planning/flood-mitigation/flood-mitigation-in-the-northern-territory
– (2016b), Territory Emergency Plan, Darwin.
NSW Public Works (2015), North Wagga Wagga Levee Options and Third Party Impacts, North Wagga Wagga Structural Assessment, Report Number H15/01, 10 March 2015, accessed 14 August 2017, http://wagga.nsw.gov.au/__data/assets/pdf_file/0003/36156/Levee-upgrade-July-2015-P-and-S-Report.pdf.
Office of Emergency Management (2017a), ‘The SEMC Governance Framework’, accessed 4 July 2017, https://www.oem.wa.gov.au/emergency-management/state-em-framework/governance
– (2017b), ‘The SEMC Subcommittees and Reference Groups’, accessed 4 July 2017, https://www.oem.wa.gov.au/Pages/SEMC-Subcommittees.aspx
Office of the Chief Scientist QLD (2017), How do we estimate the change of a flood occurring? Available at: http://www.chiefscientist.qld.gov.au/publications/understanding-floods/chances-of-a-flood.
Okada, T., Haynes, K., Bird, D., Honert, R. and King, D. (2014), Recovery and resettlement following the 2011 flash flooding in the Lockyer Valley, International Journal of Disaster Risk Reduction, 8, pp 20-31.
Productivity Commission (2014), Natural Disaster Funding Arrangements, Inquiry Report no. 74, Canberra.
Queensland Government (2017), ‘Adapting to climate change’, accessed 15 August 2017, https://www.qld.gov.au/environment/climate/adapting
– (2016), Queensland State Disaster Management Plan, Brisbane
– (2014), Queensland Strategy for Disaster Resilience, Brisbane
– (2011), Queensland Government response to the Floods Commission of Inquiry Interim Report, Brisbane
– (2013), ‘Queensland Resilience Index’, accessed 23 June 2017, https://data.qld.gov.au/dataset/queensland-resilience-index
Queensland Reconstruction Authority (2016), Annual Report 2015-16, Brisbane.
Red Cross (2017), ‘Telecross REDi’, accessed 14 August 2017, http://www.redcross.org.au/telecross-redi.aspx
Resilient Cities (2017), ‘Resilient Cities’, accessed 24 August 2017, http://www.100resilientcities.org/
SGS Economics (2016), At What Cost? Mapping where natural perils impact on economic growth and opportunities, prepared for IAG.
Smith, D. and Henderson, D. (2015), Insurance claims data analysis for cyclone Yasi and Larry [Report for Suncorp Group Limited], James Cook University.
South Australian Fire and Emergency Services Commission (2017a), ‘State Emergency Management Arrangements’, accessed 15 July 2017, http://www.safecom.sa.gov.au/site/emergency_management/emergency_management_arrangements/state_emergency_management_arrangements.jsp
– (2017b), ‘Prevention and Preparedness’, accessed 15 July 2017, http://www.safecom.sa.gov.au/site/emergency_management/prevention_and_preparedness.jsp
State Emergency Management Committee Western Australia (2016), 2016 Emergency Preparedness Report, Perth.
102
– (n.d.), ‘AWARE successful projects’, accessed 18 July 2017, https://www.oem.wa.gov.au/funding/aware/aware-successful-projects
Suncorp (2016), Northern Australia Insurance Premiums Taskforce – Interim Report, Suncorp General Insurance Sumbission. Available at: https://www.suncorp.com.au/content/dam/suncorp/insurance/suncorp-insurance/documents/home-and-contents/protect-the-north/suncorp-submission-naip-taskforce-interim-report.pdf
The Conversation, (2014). How building codes save homes from cyclones, and how they don’t. Available at: http://theconversation.com/how-building-codes-save-homes-from-cyclones-and-how-they-dont-25550
The Treasury, (2014). Rebuilding Christchurch, our second-biggest city. Available at: http://www.treasury.govt.nz/budget/2014/bps/06.htm
Tweed Shire Council (2017), ‘Flooding’, accessed 25 July 2017, http://www.tweed.nsw.gov.au/item/890
United Nations (2016), ‘Marrakech Action Proclamation For our Climate and Sustainable Development, UN Climate Change Conference in Marrakech (COP22), UNFCCC.
University of Melbourne (2017), ‘ELVA’, accessed 1 September 2017, http://mspgh.unimelb.edu.au/centres-institutes/centre-for-health-equity/research-group/jack-brockhoff-child-health-wellbeing-program/research/positive-mental-health-and-resilience/elva
Urbis 2015, Protecting the North: the benefits of cyclone mitigation, https://www.suncorp.com.au/content/dam/suncorp/insurance/suncorp-insurance/documents/home-and-contents/protect-the-north/suncorp-attachment-4-urbis-cyclone-mitigation-report.pdf
Wagga Wagga City Council (2017), ‘Funding the flood levee upgrades’, accessed 25 June 2017, http://wagga.nsw.gov.au/city-of-wagga-wagga/business/projects/current-projects/levee-upgrade
– (2014), Submission to Public Enquiry into Natural Disaster Funding Arrangements, Wagga Wagga.
Westpac 2017, ‘Natural Disaster Recovery Fund’, accessed 18 September 2017, https://www.westpac.com.au/about-westpac/sustainability/initiatives-for-you/social-enterprises-natural-disaster/
The feedback and information provided during consultations has been an invaluable resource in putting together this report. We would like to sincerely thank the following organisations and the individuals representing them for sharing their insights and knowledge throughout the consultation process:
• ACT Justice and Community Safety Directorate
• Attorney General’s Department
• Bushfire and Natural Hazards CRC
• Emergency Management Victoria
• NSW Office of Emergency Management
• Northern Territory Fire, Rescue and Emergency Services
• Queensland Reconstruction Authority
• SA Country Fire Service
• SA Fire and Emergency Services Commission
• Tasmania State Emergency Service
• Tasmania Office of Security and Emergency Management
• Tweed Shire Council
• Wagga Wagga City Council.
• WA Office of Emergency Management
References
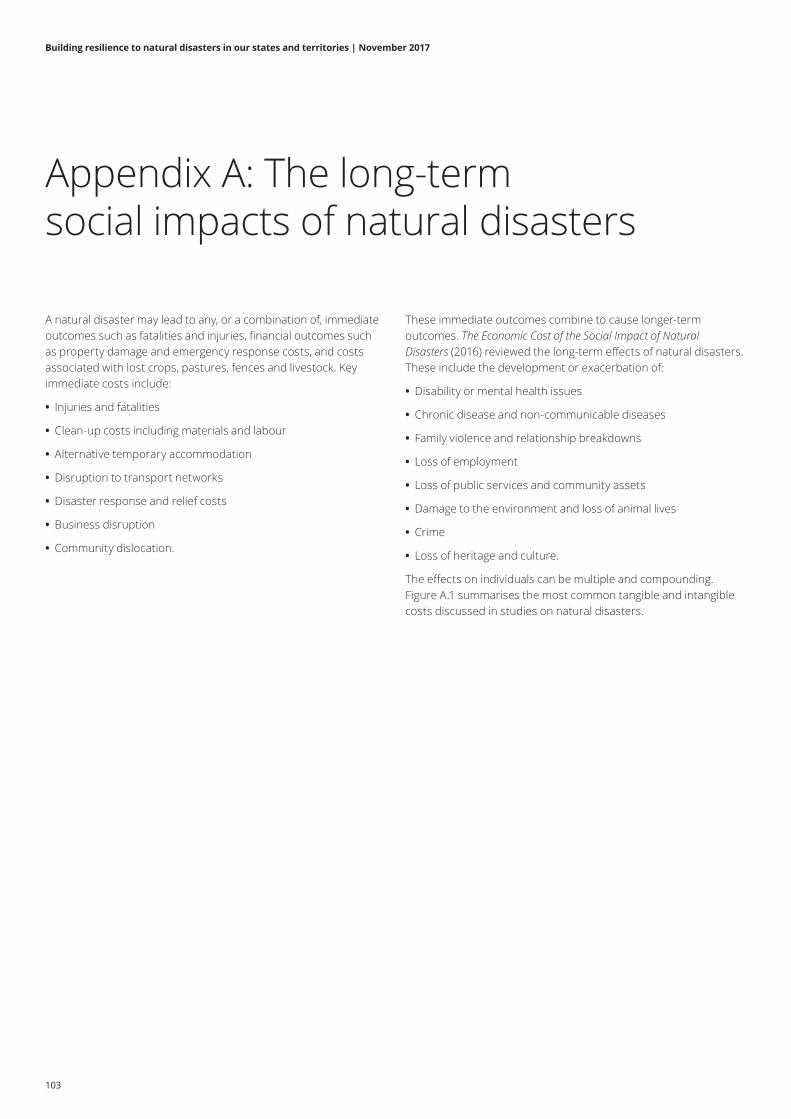
Building resilience to natural disasters in our states and territories | November 2017
103
Appendix A: The long-term social impacts of natural disasters
A natural disaster may lead to any, or a combination of, immediate outcomes such as fatalities and injuries, financial outcomes such as property damage and emergency response costs, and costs associated with lost crops, pastures, fences and livestock. Key immediate costs include:
• Injuries and fatalities
• Clean-up costs including materials and labour
• Alternative temporary accommodation
• Disruption to transport networks
• Disaster response and relief costs
• Business disruption
• Community dislocation.
These immediate outcomes combine to cause longer-term outcomes. The Economic Cost of the Social Impact of Natural Disasters (2016) reviewed the long-term effects of natural disasters. These include the development or exacerbation of:
• Disability or mental health issues
• Chronic disease and non-communicable diseases
• Family violence and relationship breakdowns
• Loss of employment
• Loss of public services and community assets
• Damage to the environment and loss of animal lives
• Crime
• Loss of heritage and culture.
The effects on individuals can be multiple and compounding. Figure A.1 summarises the most common tangible and intangible costs discussed in studies on natural disasters.
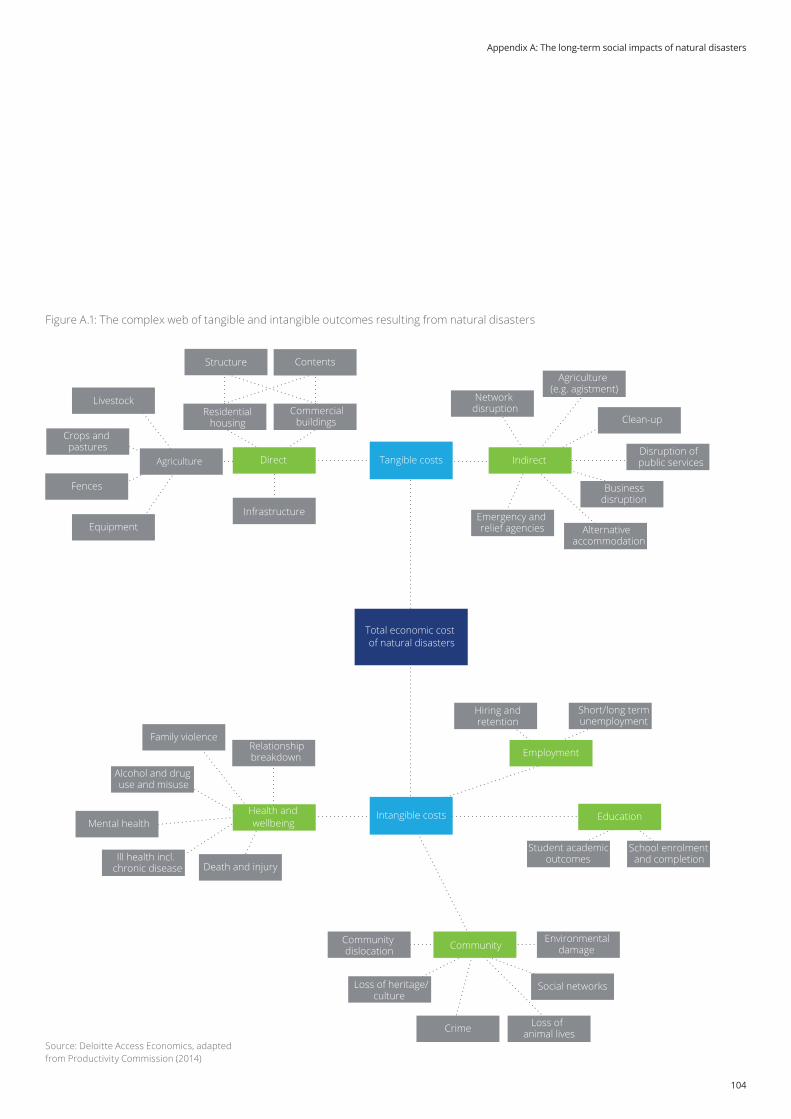
104
Figure A.1: The complex web of tangible and intangible outcomes resulting from natural disasters
Source: Deloitte Access Economics, adapted from Productivity Commission (2014)
Intangible costs
Tangible costs
Total economic cost of natural disasters
Infrastructure
Commercialbuildings
Structure Contents
Residential housing
Agriculture
Livestock
Crops and pastures
Equipment
Fences
Alternative accommodation
Emergency and relief agencies
Clean-up
Networkdisruption
Businessdisruption
Agriculture (e.g. agistment)
Disruption of public servicesIndirect Direct
Hiring andretention
Short/long termunemployment
Employment
Crime
Environmental damage
Loss of animal lives
Community dislocation
Social networksLoss of heritage/culture
Student academic outcomes
Education
School enrolment and completion
Alcohol and druguse and misuse
Relationshipbreakdown
Death and injury
Mental health
Family violence
Ill health incl.chronic disease
Health and wellbeing
Community
Appendix A: The long-term social impacts of natural disasters

Building resilience to natural disasters in our states and territories | November 2017
105
Appendix B: Methodology for estimating total economic costs
The approach for estimating the total economic cost of natural disasters follows that used in The Economic Cost of the Social Impact of Natural Disasters (2016).
The approach includes five broad components:
• Using updated data on insured losses from the Insurance Council of Australia (ICA) (to 2016) as well as ratios of insured losses to uninsured losses from BTE (2001) to estimate tangible costs
• Estimating a ratio of intangible-to-tangible costs in an average year, using bottom-up estimates on intangible costs for the Queensland floods and the Black Saturday bushfires
• Applying the intangible-to-tangible cost factor to the estimated average tangible cost for estimating the total cost of natural disasters in an average year
• The total cost of natural disasters were simulated based on the historical frequency and severity of natural disasters in each state, consistent with Building our Nation’s Resilience To Natural Disasters (2013)
• Simulated costs were indexed to account for growth in the number of households and increases in the value of housing stock. This index draws on the ABS population growth forecasts (Cat no. 3236.0) and extrapolating trends in housing value (ABS Cat. 4102.0). It was assumed that growth rates for housing value in each state converge in the long run towards the national average.
The total economic cost estimates in this report are conservative. The estimates are developed using insured costs data from ICA. The database includes natural disaster events including bushfire, cyclones, hail, flood, earthquake and severe storms. These are classified by the ICA (see Table B.1).
While this is the most comprehensive source of data on disaster losses in Australia, it includes only those events that were declared a catastrophe for insurance purposes. It is not a comprehensive database of all disaster events. It excludes some disaster types (such as heatwaves) and a number of disaster events for which there were not recorded insured losses. Specifically, it excludes disasters which may have had large intangible or uninsured tangible costs.
It is important to recognise that historical disaster costs are only one indicator of possible risk of natural disaster. For example, ACT had zero recorded disasters with insured costs over the past decade. However, they are at risk of a number of disaster types. Similarly, other states may be at risk of other disaster types even though they have not incurred estimated costs over the past decade.
Table B.1: ICA categorisation of natural disaster types
Bushfire
Most property losses occur in NSW, VIC, WA, SA and the ACT between September and March. With increasing urban development and a climate that is getting drier and warmer, bushfires are an increasing risk for property owners.
Cyclones
Most property damage occurs in Northern QLD, NT and WA between December and April. Under climate change predictions, severe cyclones are expected to occur further south than at present.
Hail
Hail is a very significant factor in insured losses. The worst affected states are NSW, VIC and QLD. The worst months for damaging hail are between October and April, though hail can occur at any time.
Flood
Inland flood is a significant issue in Australia, historically accounting for nearly one third of insured losses. From an insurance perspective the worst affected states are NSW and VIC, followed by QLD, SA and WA typically from April to October.
Earthquake
Australia has a low incidence of highly damaging earthquakes. The most affected states are NSW and WA, with four significant earthquakes causing an insured loss occurring in the past 40 years.
Severe Storms
The worst affected states are NSW and QLD, followed by WA, VIC, SA and TAS. Most severe storms occur between September and February.
Source: ICA (2017)

106
Table B.2: Ratio of total economic cost to insured losses by disaster type
Building our Nation’s Resilience to Natural Disasters (2013)
The Economic Cost of the Social Impact of Natural Disasters (2016)
This report
Storm 3 5.3 4.9
Cyclone 5 8.6 9.5
Flood 10 17.5 21.7
Earthquake 4 7 7.3
Bushfire 3 5.3 4.9
Hail 3 5.3 4.9
Source: Deloitte Access Economics
In The Economic Cost of the Social Impact of Natural Disasters (2016), the multipliers for different disaster types reported by BTE (2001) were applied to the insured losses. These multipliers included death and injury costs. A average factor of 1.75 was estimated through case studies to adjust these multipliers to reflect other intangible costs too.
For this report, multipliers for intangible costs including deaths and injuries were estimated separately for each disaster type to enable more specific estimates for each state to be derived. This involved removing the contribution of death and injuries from the multipliers used in Building our Nation’s Resilience to Natural Disasters (2013) to generate a separate ratio of tangible to insured losses for each event type.
The next step was to derive the ratios of total economic costs to insured losses for each disaster type. This was done by adding the other intangible costs to the ratio of tangible to insured losses derived above for each disaster type. These costs were again derived from the case studies presented in The Economic Cost of the Social Impact of Natural Disasters (2016).
The multipliers used in this report are presented in Table B.2.
The update of the multipliers has implications on the forecasts of total economic costs. Because the update involved deriving event-specific multipliers, there is greater variation between disaster event types in these new forecasts. In particular, flood events have a substantially higher multiplier compared to other disaster events.
In this report, the total economic costs are presented as a historical average over the past decade, and as a simulated forecast from 2017 to 2050. While the 10-year average presents an estimate of the average costs that society has incurred each year, it does not provide a good indication of what might occur in the future. For some states, the simulated estimate (which uses 50 years of historical data) provides a different picture of what states may incur in a ‘typical’ year. The first year of the simulation is 2017, after which the forecast is anticipated to increase with population and the number and value of housing stock.
As described earlier, this forecast is conservative and excludes other influences such as climate change that will influence the frequency and intensity of disaster events. Similarly, it does not capture the potential volatility in the timing and location of disasters.
Appendix B: Methodology for estimating total economic costs
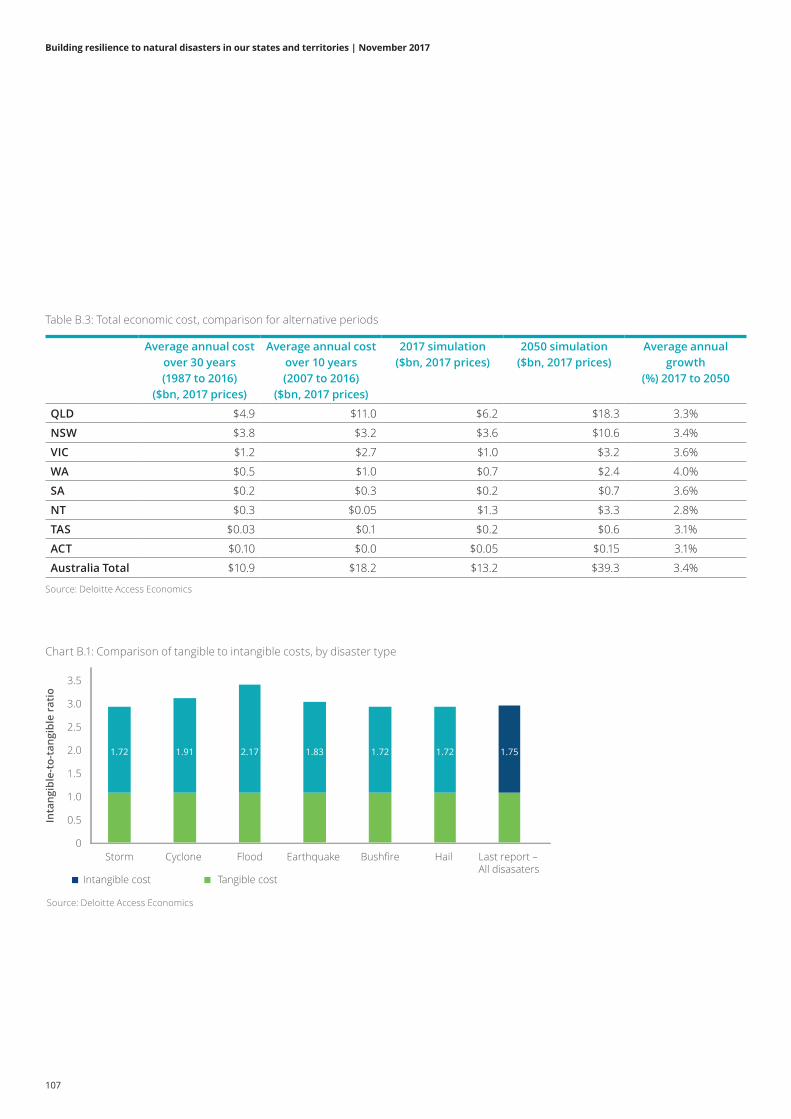
Building resilience to natural disasters in our states and territories | November 2017
107
Table B.3: Total economic cost, comparison for alternative periods
Average annual cost over 30 years (1987 to 2016)
($bn, 2017 prices)
Average annual cost over 10 years (2007 to 2016)
($bn, 2017 prices)
2017 simulation ($bn, 2017 prices)
2050 simulation ($bn, 2017 prices)
Average annual growth
(%) 2017 to 2050
QLD $4.9 $11.0 $6.2 $18.3 3.3%
NSW $3.8 $3.2 $3.6 $10.6 3.4%
VIC $1.2 $2.7 $1.0 $3.2 3.6%
WA $0.5 $1.0 $0.7 $2.4 4.0%
SA $0.2 $0.3 $0.2 $0.7 3.6%
NT $0.3 $0.05 $1.3 $3.3 2.8%
TAS $0.03 $0.1 $0.2 $0.6 3.1%
ACT $0.10 $0.0 $0.05 $0.15 3.1%
Australia Total $10.9 $18.2 $13.2 $39.3 3.4%
Source: Deloitte Access Economics
Chart B.1: Comparison of tangible to intangible costs, by disaster type
Intangible cost Tangible cost
0
0.5
1.0
1.5
2.0
2.5
3.0
3.5
Storm
1.72
Cyclone
Inta
ngib
le-t
o-ta
ngib
le r
atio
1.91
Flood
2.17
Earthquake
1.83
Bushfire
1.72
Hail
1.72
Last report – All disasaters
1.75
Source: Deloitte Access Economics
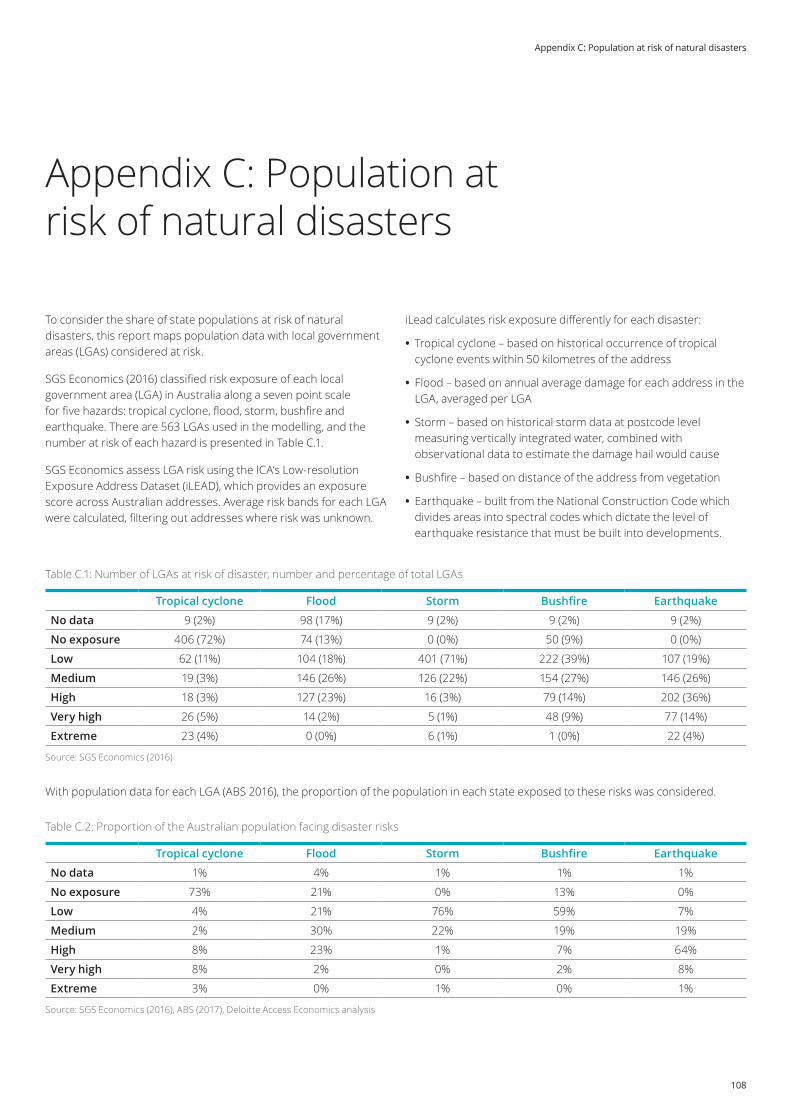
108
Table C.1: Number of LGAs at risk of disaster, number and percentage of total LGAs
Table C.2: Proportion of the Australian population facing disaster risks
Tropical cyclone Flood Storm Bushfire Earthquake
No data 9 (2%) 98 (17%) 9 (2%) 9 (2%) 9 (2%)
No exposure 406 (72%) 74 (13%) 0 (0%) 50 (9%) 0 (0%)
Low 62 (11%) 104 (18%) 401 (71%) 222 (39%) 107 (19%)
Medium 19 (3%) 146 (26%) 126 (22%) 154 (27%) 146 (26%)
High 18 (3%) 127 (23%) 16 (3%) 79 (14%) 202 (36%)
Very high 26 (5%) 14 (2%) 5 (1%) 48 (9%) 77 (14%)
Extreme 23 (4%) 0 (0%) 6 (1%) 1 (0%) 22 (4%)
Source: SGS Economics (2016)
Tropical cyclone Flood Storm Bushfire Earthquake
No data 1% 4% 1% 1% 1%
No exposure 73% 21% 0% 13% 0%
Low 4% 21% 76% 59% 7%
Medium 2% 30% 22% 19% 19%
High 8% 23% 1% 7% 64%
Very high 8% 2% 0% 2% 8%
Extreme 3% 0% 1% 0% 1%
Source: SGS Economics (2016), ABS (2017), Deloitte Access Economics analysis
Appendix C: Population at risk of natural disasters
To consider the share of state populations at risk of natural disasters, this report maps population data with local government areas (LGAs) considered at risk.
SGS Economics (2016) classified risk exposure of each local government area (LGA) in Australia along a seven point scale for five hazards: tropical cyclone, flood, storm, bushfire and earthquake. There are 563 LGAs used in the modelling, and the number at risk of each hazard is presented in Table C.1.
SGS Economics assess LGA risk using the ICA’s Low-resolution Exposure Address Dataset (iLEAD), which provides an exposure score across Australian addresses. Average risk bands for each LGA were calculated, filtering out addresses where risk was unknown.
iLead calculates risk exposure differently for each disaster:
• Tropical cyclone – based on historical occurrence of tropical cyclone events within 50 kilometres of the address
• Flood – based on annual average damage for each address in the LGA, averaged per LGA
• Storm – based on historical storm data at postcode level measuring vertically integrated water, combined with observational data to estimate the damage hail would cause
• Bushfire – based on distance of the address from vegetation
• Earthquake – built from the National Construction Code which divides areas into spectral codes which dictate the level of earthquake resistance that must be built into developments.
With population data for each LGA (ABS 2016), the proportion of the population in each state exposed to these risks was considered.
Appendix C: Population at risk of natural disasters
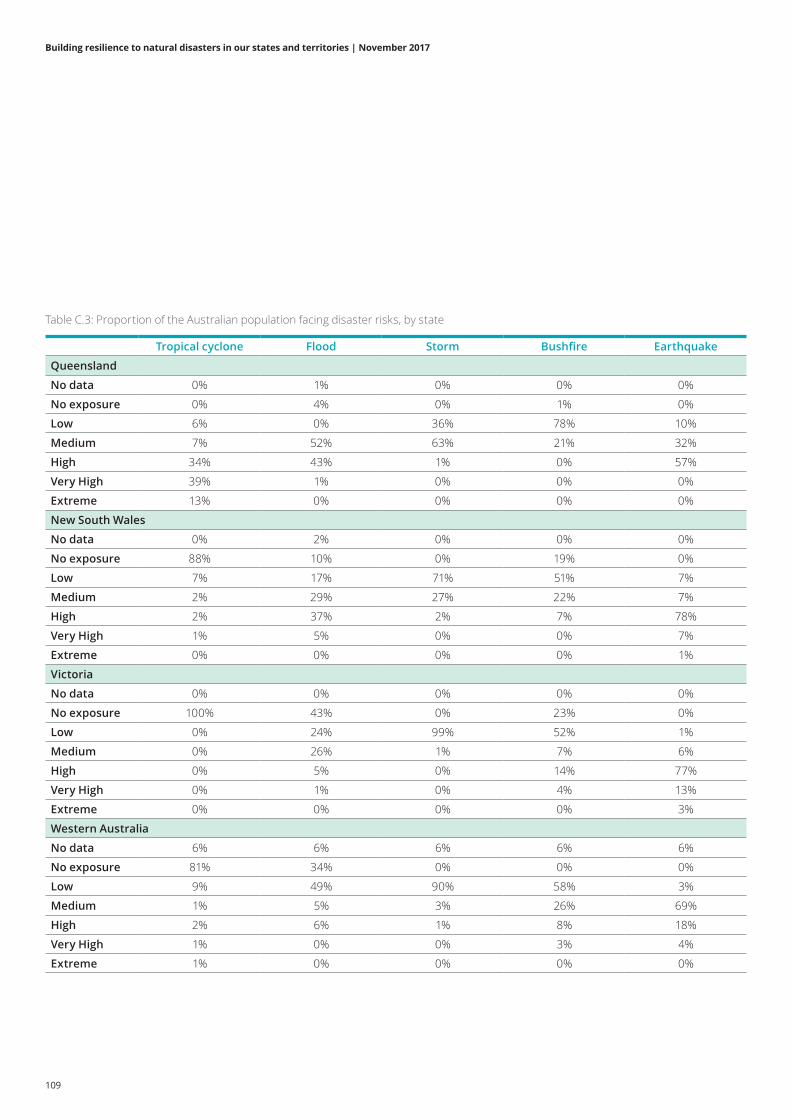
Building resilience to natural disasters in our states and territories | November 2017
109
Table C.3: Proportion of the Australian population facing disaster risks, by state
Tropical cyclone Flood Storm Bushfire Earthquake
Queensland
No data 0% 1% 0% 0% 0%
No exposure 0% 4% 0% 1% 0%
Low 6% 0% 36% 78% 10%
Medium 7% 52% 63% 21% 32%
High 34% 43% 1% 0% 57%
Very High 39% 1% 0% 0% 0%
Extreme 13% 0% 0% 0% 0%
New South Wales
No data 0% 2% 0% 0% 0%
No exposure 88% 10% 0% 19% 0%
Low 7% 17% 71% 51% 7%
Medium 2% 29% 27% 22% 7%
High 2% 37% 2% 7% 78%
Very High 1% 5% 0% 0% 7%
Extreme 0% 0% 0% 0% 1%
Victoria
No data 0% 0% 0% 0% 0%
No exposure 100% 43% 0% 23% 0%
Low 0% 24% 99% 52% 1%
Medium 0% 26% 1% 7% 6%
High 0% 5% 0% 14% 77%
Very High 0% 1% 0% 4% 13%
Extreme 0% 0% 0% 0% 3%
Western Australia
No data 6% 6% 6% 6% 6%
No exposure 81% 34% 0% 0% 0%
Low 9% 49% 90% 58% 3%
Medium 1% 5% 3% 26% 69%
High 2% 6% 1% 8% 18%
Very High 1% 0% 0% 3% 4%
Extreme 1% 0% 0% 0% 0%
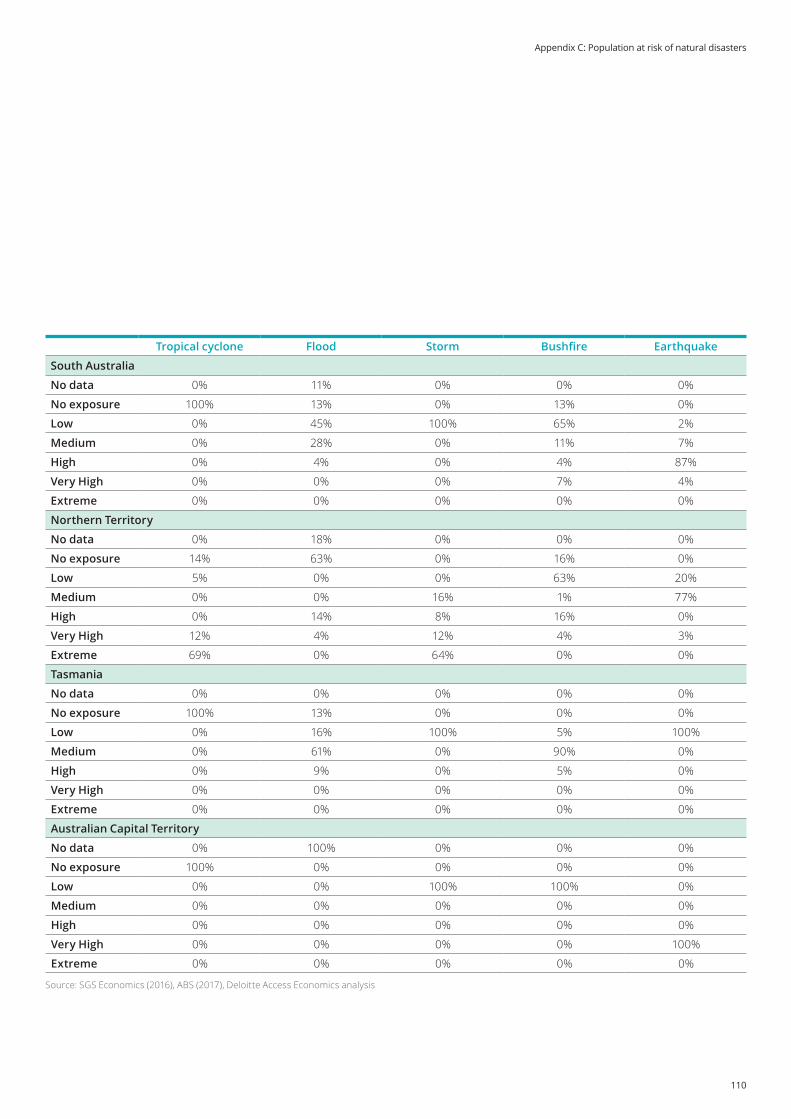
110
Tropical cyclone Flood Storm Bushfire Earthquake
South Australia
No data 0% 11% 0% 0% 0%
No exposure 100% 13% 0% 13% 0%
Low 0% 45% 100% 65% 2%
Medium 0% 28% 0% 11% 7%
High 0% 4% 0% 4% 87%
Very High 0% 0% 0% 7% 4%
Extreme 0% 0% 0% 0% 0%
Northern Territory
No data 0% 18% 0% 0% 0%
No exposure 14% 63% 0% 16% 0%
Low 5% 0% 0% 63% 20%
Medium 0% 0% 16% 1% 77%
High 0% 14% 8% 16% 0%
Very High 12% 4% 12% 4% 3%
Extreme 69% 0% 64% 0% 0%
Tasmania
No data 0% 0% 0% 0% 0%
No exposure 100% 13% 0% 0% 0%
Low 0% 16% 100% 5% 100%
Medium 0% 61% 0% 90% 0%
High 0% 9% 0% 5% 0%
Very High 0% 0% 0% 0% 0%
Extreme 0% 0% 0% 0% 0%
Australian Capital Territory
No data 0% 100% 0% 0% 0%
No exposure 100% 0% 0% 0% 0%
Low 0% 0% 100% 100% 0%
Medium 0% 0% 0% 0% 0%
High 0% 0% 0% 0% 0%
Very High 0% 0% 0% 0% 100%
Extreme 0% 0% 0% 0% 0%
Source: SGS Economics (2016), ABS (2017), Deloitte Access Economics analysis
Appendix C: Population at risk of natural disasters
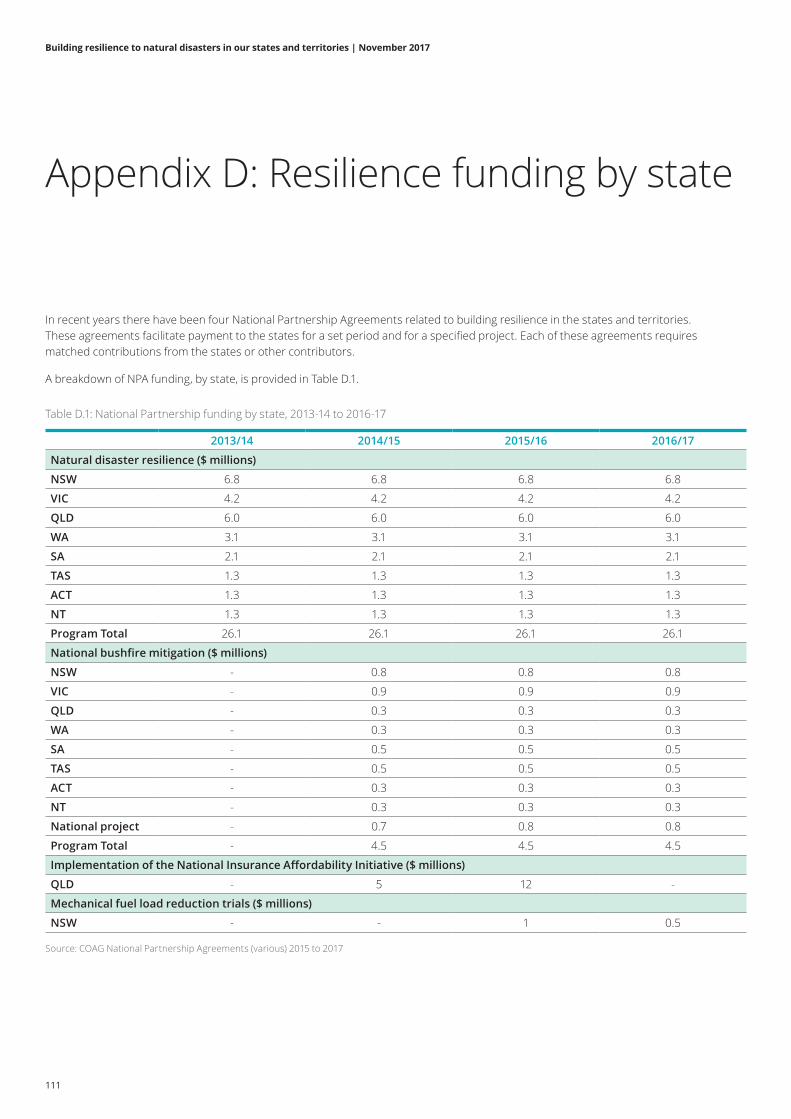
Building resilience to natural disasters in our states and territories | November 2017
111
Appendix D: Resilience funding by state
In recent years there have been four National Partnership Agreements related to building resilience in the states and territories. These agreements facilitate payment to the states for a set period and for a specified project. Each of these agreements requires matched contributions from the states or other contributors.
A breakdown of NPA funding, by state, is provided in Table D.1.
Table D.1: National Partnership funding by state, 2013-14 to 2016-17
2013/14 2014/15 2015/16 2016/17
Natural disaster resilience ($ millions)
NSW 6.8 6.8 6.8 6.8
VIC 4.2 4.2 4.2 4.2
QLD 6.0 6.0 6.0 6.0
WA 3.1 3.1 3.1 3.1
SA 2.1 2.1 2.1 2.1
TAS 1.3 1.3 1.3 1.3
ACT 1.3 1.3 1.3 1.3
NT 1.3 1.3 1.3 1.3
Program Total 26.1 26.1 26.1 26.1
National bushfire mitigation ($ millions)
NSW - 0.8 0.8 0.8
VIC - 0.9 0.9 0.9
QLD - 0.3 0.3 0.3
WA - 0.3 0.3 0.3
SA - 0.5 0.5 0.5
TAS - 0.5 0.5 0.5
ACT - 0.3 0.3 0.3
NT - 0.3 0.3 0.3
National project - 0.7 0.8 0.8
Program Total - 4.5 4.5 4.5
Implementation of the National Insurance Affordability Initiative ($ millions)
QLD - 5 12 -
Mechanical fuel load reduction trials ($ millions)
NSW - - 1 0.5
Source: COAG National Partnership Agreements (various) 2015 to 2017

112
Limitation of our work
General use restrictionThis report should not be relied on by any party other than our client. We accept no duty of care to any other person or entity for the use of this report.
Limitation of our work
Contact us
Deloitte Access EconomicsACN: 149 633 116225 George StSydney NSW 2000Tel: +61 2 9322 7000 Fax: +61 2 9322 7001
Deloitte Access Economics is Australia’s pre-eminent economics advisory practice and a member of Deloitte’s global economics group. For more information, please visit our website
www.deloitte.com/au/deloitte-access-economics
This publication contains general information only, and none of Deloitte Touche Tohmatsu Limited, its member firms, or their related entities (collectively the “Deloitte Network”) is, by means of this publication, rendering professional advice or services. Before making any decision or taking any action that may affect your finances or your business, you should consult a qualified professional adviser. No entity in the Deloitte Network shall be responsible for any loss whatsoever sustained by any person who relies on this publication.
Deloitte refers to one or more of Deloitte Touche Tohmatsu Limited, a UK private company limited by guarantee, and its network of member firms, each of which is a legally separate and independent entity. Please see www.deloitte.com/au/about for a detailed description of the legal structure of Deloitte Touche Tohmatsu Limited and its member firms.
About DeloitteDeloitte provides audit, tax, consulting, and financial advisory services to public and private clients spanning multiple industries. With a globally connected network of member firms in more than 150 countries, Deloitte brings world-class capabilities and high-quality service to clients, delivering the insights they need to address their most complex business challenges. Deloitte’s approximately 244,000 professionals are committed to becoming the standard of excellence.
About Deloitte AustraliaIn Australia, the member firm is the Australian partnership of Deloitte Touche Tohmatsu. As one of Australia’s leading professional services firms. Deloitte Touche Tohmatsu and its affiliates provide audit, tax, consulting, and financial advisory services through approximately 7,000 people across the country. Focused on the creation of value and growth, and known as an employer of choice for innovative human resources programs, we are dedicated to helping our clients and our people excel. For more information, please visit our web site at www.deloitte.com.au.
Liability limited by a scheme approved under Professional Standards Legislation.
Member of Deloitte Touche Tohmatsu Limited.© 2017 Deloitte Touche Tohmatsu.
MCBD_USICS_11/17_054957