Building a “quality in work” index in Spain
31
Institut de Recerca en Economia Aplicada Regional i Pública Document de Treball 2012/06, 31 pàg. Research Institute of Applied Economics Working Paper 2012/06, 31 pag. Grup de Recerca Anàlisi Quantitativa Regional Document de Treball 2012/04, 31 pàg. Regional Quantitative Analysis Research Group Working Paper 2012/04, 31 pag. “Building a “quality in work” index in Spain” Jordi López-Tamayo, Vicente Royuela and Jordi Suriñach
-
Upload
independent -
Category
Documents
-
view
2 -
download
0
Transcript of Building a “quality in work” index in Spain
Institut de Recerca en Economia Aplicada Regional i Pública Document de Treball 2012/06, 31 pàg. Research Institute of Applied Economics Working Paper 2012/06, 31 pag. Grup de Recerca Anàlisi Quantitativa Regional Document de Treball 2012/04, 31 pàg. Regional Quantitative Analysis Research Group Working Paper 2012/04, 31 pag.
“Building a “quality in work” index in Spain”
Jordi López-Tamayo, Vicente Royuela and Jordi Suriñach

Research Institute of Applied Economics Working Paper 2012/04, pàg. 2 Regional Quantitative Analysis Research Group Working Paper 2012/03, pag. 2
2
WEBSITE: www.ub-irea.com • CONTACT: [email protected]
WEBSITE: www.ub.edu/aqr/ • CONTACT: [email protected]
Universitat de Barcelona Av. Diagonal, 690 • 08034 Barcelona
The Research Institute of Applied Economics (IREA) in Barcelona was founded in
2005, as a research institute in applied economics. Three consolidated research
groups make up the institute: AQR, RISK and GiM, and a large number of members
are involved in the Institute. IREA focuses on four priority lines of investigation: (i) the
quantitative study of regional and urban economic activity and analysis of regional and
local economic policies, (ii) study of public economic activity in markets, particularly in
the fields of empirical evaluation of privatization, the regulation and competition in the
markets of public services using state of industrial economy, (iii) risk analysis in finance
and insurance, and (iv) the development of micro and macro econometrics applied for
the analysis of economic activity, particularly for quantitative evaluation of public
policies.
IREA Working Papers often represent preliminary work and are circulated to encourage
discussion. Citation of such a paper should account for its provisional character. For
that reason, IREA Working Papers may not be reproduced or distributed without the
written consent of the author. A revised version may be available directly from the
author.
Any opinions expressed here are those of the author(s) and not those of IREA.
Research published in this series may include views on policy, but the institute itself
takes no institutional policy positions.
Research Institute of Applied Economics Working Paper 2012/04, pàg. 3 Regional Quantitative Analysis Research Group Working Paper 2012/03, pag. 3
3
Abstract
The European Union launched the Lisbon Strategy in 2000 with the aim of establishing itself as the world’s most competitive knowledge-based economy. At the same time, job quality was placed at the top of the European employment and social policy agenda and, later, it was to be incorporated as part of the European Employment and Europe-2020 Strategies. However, in a climate of economic crisis, it is argued that the price we are paying for continued economic growth is the dehumanisation of labour relationships with good jobs being substituted by bad jobs. In order to appraise such claims, scholars require quantifiable measures. The aim of this study is to define and apply a composite index of the quality in work in Spain. We present the results for the period 2001 to 2009. Our measure adopts the dimensional framework provided by the European Commission, and we present our results by region, sector, professional category and firm size. We find that the best results are recorded in the most developed regions, in the service sector, in the largest firms and in jobs in which workers are entrusted with most responsibility.
JEL classification: R10, R11, R12; I31, J01. Keywords: Regional Data, Regional Development, Economic Geography, Quality of Life, Labour Economics.
Jordi López-Tamayo, AQR Research Group-IREA. Department of Econometrics. University of Barcelona, Av. Diagonal 690, 08034 Barcelona, Spain. E-mail: [email protected] Vicente Royuela, AQR Research Group-IREA. Department of Econometrics. University of Barcelona, Av. Diagonal 690, 08034 Barcelona, Spain. E-mail: [email protected] Jordi Suriñach, AQR Research Group-IREA. Department of Econometrics. University of Barcelona, Av. Diagonal 690, 08034 Barcelona, Spain. E-mail: [email protected] Acknowledgements: Vicente Royuela acknowledges the support of ECO2010-16006, and Jordi Suriñach the support of ECO2009-12678. All the authors acknowledge the Ministerio de Trabajo e Inmigración their database “Encuesta de Condiciones de Vida en el Trabajo”. Also they would like to thank the support from Manpower Professional.
Research Institute of Applied Economics Working Paper 2012/04, pàg. 4 Regional Quantitative Analysis Research Group Working Paper 2012/03, pag. 4
4
1. Introduction
In Lisbon, in March 2000, the European Union (EU) resolved to become the world’s
most competitive knowledge-based economy by 2010. Three years earlier in
Luxembourg, in 1997, a related strategy, the European Employment Strategy (EES),
had similarly been launched. Underlying the two policies is a growing consensus in
Europe that quality and productivity at work go hand in hand and that, consequently,
more and better jobs are essential if Europe wishes to attain its main objectives. Under
the German EU Presidency in 2007, quality in work and employment returned to the
top of the European employment and social policy agenda with the drawing up of an
agreement covering a set of policy principles that included ‘good work’. The latter was
a new addition to EU terminology superseding a more firmly established concern for
‘more and better jobs’. More recently the Commission has published new proposals in
“EUROPE 2020 – A strategy for smart, sustainable and inclusive growth”, which
identifies the overall objectives, priorities and recommendations for flagship initiatives.
On 25th-26th March 2010, the European Council debated the new strategy and
identified what it considered be its key elements. These were appraised by the
European Parliament and a number of modifications were introduced. EU-2020 was
formally ratified by the European Council on 17th June 2010, and integrated guidelines
were drawn up to implement the proposed reforms. The overall strategy adheres to the
original goal of ‘more and better jobs’ through the fixing of three headline targets to be
achieved by 2020: 1) 75% of people aged 20-64 to be employed; 2) reducing school
drop-out rates below 10% and at least 40% of 30 to 34-year-olds completing tertiary
education; and 3) at least 20 million fewer people in or at risk of poverty and social
exclusion. These goals form part of the ‘Agenda for New Skills and Jobs’, which
identifies a number of actions designed specifically to improve flexibility and security in
the labour market ('flexicurity'), to equip people with the right skills for the jobs of today
and tomorrow, to improve the quality of jobs and ensure better working conditions,
and to improve the conditions for job creation.
Yet, despite these political objectives, today’s global crisis is a constant reminder of
those who would claim that the dehumanisation of labour relations is the price that we
must pay for achieving higher economic growth. In Europe, in general, but above all, in
Spain, high unemployment rates have been experienced throughout the eighties and
early nineties. And although this was followed by a subsequent recovery, it has been
argued that what occurred was that good jobs were substituted by bad jobs (Clark,
Research Institute of Applied Economics Working Paper 2012/04, pàg. 5 Regional Quantitative Analysis Research Group Working Paper 2012/03, pag. 5
5
2005). Globalization and the abundance of labour force, together with the technological
progress, lead to the inevitable conclusion that “in the current economic system
workers are irrelevant” (Sennett, 2006).1
Eurofund claims (2007) that ‘without data, all you are is another person with an
opinion’. Therefore, to identify the nature of the relationship between economic growth
and the dimensions of quality in work, reliable measures of the work environment and
job quality are needed, which is the specific aim of this paper: namely, the
quantification of quality in work. We estimate a composite index of quality in work for
Spain between 2001 and 2009, and we present our results by region, sector,
professional category and firm size. We find that the best results are recorded in the
most developed regions, in the service sector, in the largest firms and in jobs in which
workers are entrusted with most responsibility.
2. Methodology
In building a quality in work index, both objective and subjective indicators need to be
considered. Most of the discussions of work quality held in Lisbon in 2000 focused on
the aggregate labour market outcomes published in the official statistics. However, to
ensure greater accuracy, and to guarantee that objective assessments are not
overstated to the detriment of subjective appraisals, workers’ reports are also required.
In the intervening years, considerable progress has been made in gathering data and
designing indicators that can measure quality in work factors.
Royuela et al. (2008 and 2009) adopt an institutional definition of quality in work based
on a multidimensional format that can be applied to the Spanish case through the
design of specific indicators. The Communication from the Commission to the Council,
the European Parliament, the Economic and Social Committee and the Committee of
the Regions entitled “Employment and social policies: a framework for investing in
quality” (COM-2001 313 final) provides the following definition of quality of work life
(QWL): ‘Quality (…) is a key element in promoting employment in a competitive and
inclusive knowledge economy. Quality reflects the desire, not just to defend minimum
standards, but to promote rising standards and ensure a more equitable sharing of
1 The words were used as the title for an interview with the sociologist Richard Sennett, published by the Spanish newspaper, La Vanguardia, on 20th December 2006.
Research Institute of Applied Economics Working Paper 2012/04, pàg. 6 Regional Quantitative Analysis Research Group Working Paper 2012/03, pag. 6
6
progress. It delivers results – embracing the economy, the workplace, the home,
society at large. It links the dual goals of competitiveness and cohesion in a sustainable
way, with clear economic benefits flowing from investing in people and strong,
supportive, social systems.’
The Communication draws heavily on the EU’s Social Policy Agenda and on the EES.
As such, its definition of QWL takes into account not only the existence of paid
employment, but also the characteristics of that employment. It is thus a multi-
dimensional concept that considers such aspects as the objective characteristics
related to employment, the specific characteristics of a job, and the subjective
evaluation of those characteristics by the individual worker. Most studies of QWL
conducted to date adopt some of these key dimensions of job quality, focusing their
analyses on the specific characteristics of a job and on aspects of the wider work
environment.2 Indeed, in order to provide a framework of analysis, the Commission
grouped the main elements of QWL under two broad headings: job characteristics, on
the one hand, and the work and the wider labour market context, on the other. It further
proposed a set of indicators for ten recognised dimensions of quality that would
facilitate the undertaking of exhaustive and structured assessment procedures. The
eventual tool consists of 75 indicators, both objective and subjective, of some 30
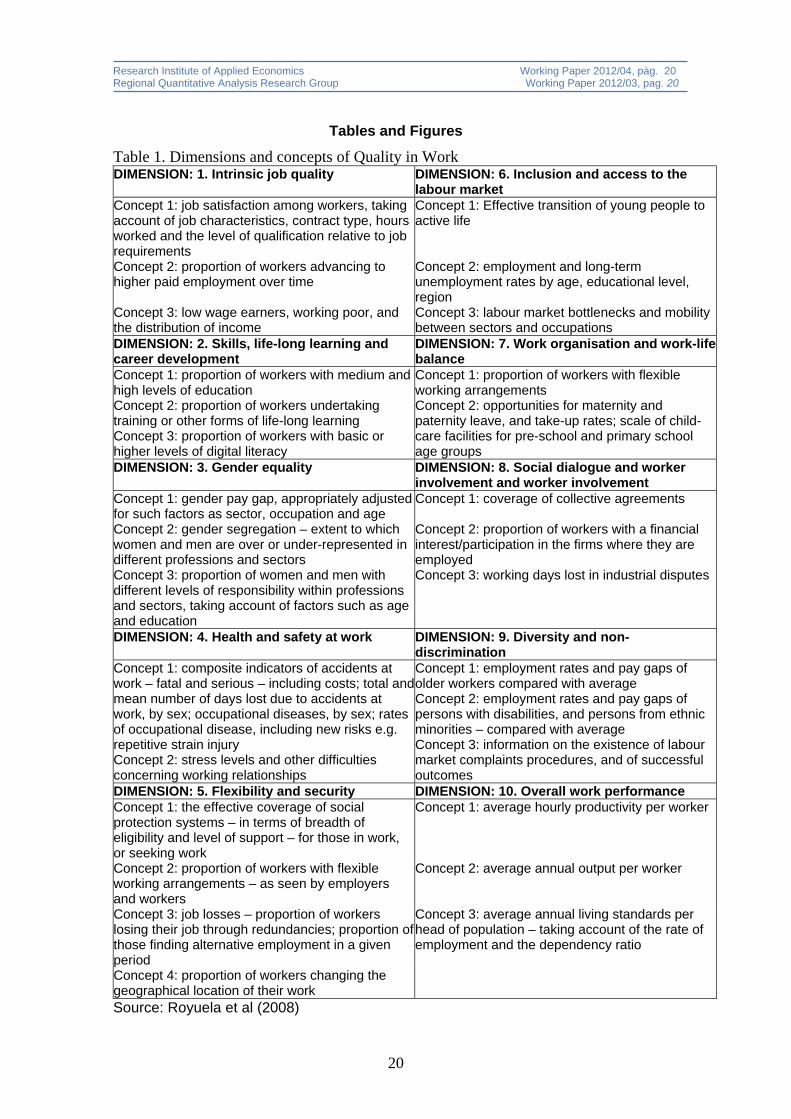
concepts into which the ten dimensions are divided. Table 1 shows these dimensions
and concepts.
TABLE 1 ABOUT HERE
This framework is employed here to compute a composite measure of quality of work
life. We used index number methodology to calculate the composite measurements as
a result of the weighted average of each indicator and, subsequently, of each concept
and dimension. This gave us the final index, which was based on the 2001 Composite
European Commission Quality of Work Life Index (CECQWLI).3 All dimensions were
weighted equally, with the exception of the first, Intrinsic Job Quality, which counted
double as it accounts for individuals’ general perceptions of their wellbeing at work. We
use wellbeing as a summary measure of quality of work life and as our “residual” factor,
i.e. to include all other dimensions not covered by the EC’s proposal.
2 For a review of how the concept has been dealt with in the academic literature, see Martel and Dupuis (2006). 3 See Royuela et al. (2003) for details of this methodology.
Research Institute of Applied Economics Working Paper 2012/04, pàg. 7 Regional Quantitative Analysis Research Group Working Paper 2012/03, pag. 7
7
3. The composite quality in work index in Spain
3.1. The Spanish labour market
In the present paper we apply our index to Spain, a Mediterranean country, with a
relatively poor standing among the EU15 states. In 2007, according to Eurostat data,
Spain was ranked 13th in terms of GDP per capita (above just Greece and Portugal).
Moreover, when Spain entered the European Monetary Union its unemployment rate
stood at 24%, and although it fell to around 8% in 2007, it has since soared to levels of
around 20% as the country has suffered the effects of the economic crisis. Jaumotte
(2011) has recently provided the following description of the Spanish labour market:4
High unemployment rates: from 1980 to 2009 the unemployment rate averaged
16%.
High cyclicality of employment and unemployment: output elasticity of
unemployment is much larger than that of other EU15 countries.
High share of temporary contracts; few part-time contracts: there is a marked
duality in the market between permanent and temporary (fixed-term) contracts, with
the latter representing about 30% of the labour force.
High degree of wage rigidity: wages increased faster than in other EU15 countries
and failed to respond to the changing market conditions ushered in with the
economic crisis. As a result most of the adjustments affected temporary workers.
In an attempt at solving some of these structural problems, a labour market reform was
finally adopted in June 2010, which reduced the costs of dismissal, eased the criteria
for ‘fair’ dismissal and broadened the conditions under which firms can opt-out of
collective bargaining agreements, which take place primarily at province and industry
levels.
4 Additional analyses of the Spanish labour market can be found in Bentolila and Dolado (1994), Dolado et al. (2002), Bentolila and Jimeno (2003), Bank of Spain (2009), and Royuela and Sanchis-i-Marco (2010).
Research Institute of Applied Economics Working Paper 2012/04, pàg. 8 Regional Quantitative Analysis Research Group Working Paper 2012/03, pag. 8
8
3.2. Data collection
Data collection here represents an essential part of the study as the concepts are not
always readily measurable. Appendix 1 shows the sources drawn upon in collecting our
basic information. Notice that considerably more information was available at the
territorial level (93.7% of the indicators considered) than it was at any other level. By
contrast, sector information was available for only 56.2% of indicators; firm size data
was available for just 40.7% of indicators and information on professional categories
was available for only 38.6%. For our purposes, this asymmetry is not especially
relevant, although our key results are obviously more focused on the territorial level of
data, the 17 Spanish regions, than they are on the ten sectors, three firm sizes and
three professional categories. The information is available for the period 2001 to 2009.5
Between the years 2004 and 2007, five changes were made in the methodologies
adopted in obtaining the data used in our study, a fact that should be borne in mind
when evaluating the results. These included 1) a change to the methodology for
conducting the Survey of Quality of Life at Work (SQLW); 2) a methodological change
in the conducting of the Labour Force Survey (LFS); 3) a re-estimation of the human
capital series computed by the Instituto Valenciano de Investigaciones Económicas
(IVIE) in 2010; 4) the process of regularization of the immigrant population; and, finally,
5) a change in Spain’s regional accounting base (CRE).
Finally, since most of our subjective information is drawn from the SQLW, when the
economic cycle changed, the respondents of that survey and their perceptions
changed as well. Thus, it might be the case that worker perceptions will improve if they
compare their own situation with that of being unemployed. Consequently, a certain
degree of caution should be exercised in interpreting the results for 2009.
4. Results
In line with all base indexes, our QWL index takes a value of 100 for Spain in the base
year, 2001. This holds both for the composite index and for each dimension considered
separately. The index enable us to make comparisons over time of the dimensions
under consideration (Table 2), as well as comparisons between regions (Table 3),
5 Note that owing to the fact that the Quality of Life at Work Survey was not conducted by the Labour Ministry in 2005, this year was eventually excluded.
Research Institute of Applied Economics Working Paper 2012/04, pàg. 9 Regional Quantitative Analysis Research Group Working Paper 2012/03, pag. 9
9
sectors (Table 4), professional categories (Table 5), and firm sizes (Table 6). Below,
we briefly describe the main outcomes provided by the index.
TABLES 2, 3, 4, 5 AND 6 ABOUT HERE
4.1. Dimensions
If we examine the evolution in the global index over time, we see that quality in work
improved between 2001 and 2009, growing at a rate of approximately 2%. The index
did, nevertheless, fall in 2004 and its growth rate slowed down in 2009 due to the
impact of the global crisis.
The individual dimensions measuring quality in work, however, presented more marked
changes. Major improvements were observed in dimensions D03 (Gender equality),
D07 (Work organization and work-life balance), D02 (Skills, life-long learning and
career development) and D01 (Intrinsic job quality). These positive changes offset the
poorer results reported in D10 (Overall work performance) and setbacks in D05
(Flexibility and security) and, especially, those in D06 (Inclusion and access to the
labour market). It should be borne in mind that the data for 2009 reflect the harsh
realities of the severe economic crisis afflicting the Spanish economy. As a result,
between 2008 and 2009, seven of the ten dimensions saw a deterioration in their index
scores. Below, we briefly describe the evolution in each dimension over the period
considered.
D01 - Intrinsic job quality: this dimension shows moderate growth during the period
2001-2009 (with an average annual growth rate of 2.1%). An increasing number of
individuals report being satisfied with their jobs. Between 2008 and 2009, the index
for this dimension fell (-3.4%).
D02 - Skills, life-long learning and career development: this dimension shows
moderate growth during the period 2001-2009 (2.2% annual growth). The decline
between 2008 and 2009 reflects the reduction in resources spent by companies on
training and, in part, the fall in the share of the highly educated labour force. These
aspects were widely observed throughout the country.
D03 - Gender equality: this dimension improved dramatically during the period
2001-2009 (4.7% annual growth). This reflects two factors: 1) gender policies
Research Institute of Applied Economics Working Paper 2012/04, pàg. 10 Regional Quantitative Analysis Research Group Working Paper 2012/03, pag. 10
10
facilitated the access of women to the labour market, as reflected, for example, in
the increase in the number of female managers during the period 2001-2009; and
2) the adjustment that occurred in the labour market has affected male workers
most markedly. This has reinforced the indicators of equality for women, especially
during the last three years of crisis: 2007, 2008 and 2009.
D04 - Health and safety at work: this dimension presents moderate improvement
during the 2001-2009 period (1.5% annual growth). This is due mainly to: 1) a
reduction in workplace accidents thanks to improved standards in jobs at greatest
risks, such as those in the construction sector; and 2) a significant decline in
workers who feel they work in hazardous conditions or have to do undertake
strenuous physical activities. There has also been an increase in the amount of
workers who are satisfied with their physical environment and the health and safety
conditions in their place of work, as well as in the number of those who feel that
their company provides adequate safeguards. The result was reversed between
2008 and 2009, despite the fall in number of accidents in the workplace.
D05 - Flexibility and security: this dimension presents a declining index during the
2001-2009 period (-0.8% annually), mainly owing to the drop recorded between
2008 and 2009 (-18.2%). The negative index is due to 1) a fall in the wage gap
between permanent and temporary workers; 2) an increase in the number of part-
time workers unable to find full-time employment; 3) the drop in the number of
welfare pension beneficiaries; and 4) the increase in the rate of unemployment
coverage.
D06 - Inclusion and access to the labour market: this dimension dropped to values
well below those of 2001 (-2.3% annually). In this case the fall began in 2007,
reflecting, in the main, widespread job losses, especially among the young and
long-term unemployed. There has also been a reduction in the number of job
vacancies. The impact of the crisis can be seen in the sharp drop suffered by this
dimension between 2008 and 2009 (-33.6%).
D07 - Work organisation and work-life balance: this dimension shows quite
remarkable growth throughout the period (3.2% annual growth). Between 2001 and
2009, there was an increase in the number of workers expressing satisfaction with
the social services provided by their firms (housing subsidies, training, dining, etc.).
Moreover, while part-time contracts remain at low levels, fixed-term contracts fell as
the crisis targeted the signing of such contracts as opposed to permanent
contracts, thereby magnifying the duality in the Spanish labour market. Until 2009,

Research Institute of Applied Economics Working Paper 2012/04, pàg. 11 Regional Quantitative Analysis Research Group Working Paper 2012/03, pag. 11
11
some utilities subsidized by firms were maintained and a degree of support was
provided to reconcile work with family life. In general, the behaviour observed
throughout the period has not changed greatly in recent years and, indeed,
between 2008 and 2009 the index grew by 3.2%.
D08 - Social dialogue and worker involvement: this dimension has grown
throughout the period (1.4% annual growth), in particular towards the end (10%
between 2008 and 2009). This improvement reflects the increase in the number of
workers participating in company benefit schemes, working for companies that
operate collective bargaining structures, or for companies regulated by some kind
of financial agreement. Notice that that the crisis has tended to expel workers
without these benefits from the labour market, which has led to slightly misleading
results in the case of this dimension.
D09 - Diversity and discrimination: the values recorded for this dimension in 2009
are very similar to those recorded in 2001, with just a moderate annual growth of
1%. However, the decline experienced in 2008, and which became more marked in
2009, offset the growth experienced during the boom years of the economic cycle.
Immigrants were partly responsible for the economic growth observed during the
boom (note the 2005 process of regularization of this population) but, together with
young workers, they have been hit hardest by the crisis. The index value for this
dimension fell by 2.5% between 2008 and 2009.
D10 - Overall work performance: this dimension barely grew during the decade,
with average annual growth standing at just 0.5%. The modest overall results
recorded by this dimension reflect the falls in GDP per capita and the general
increase in the economic dependency ratio, while the decline experienced between
2008 and 2009 (-3.6%) are the result of a fall in the first factor and a rise in the
second.
4.2. Regions
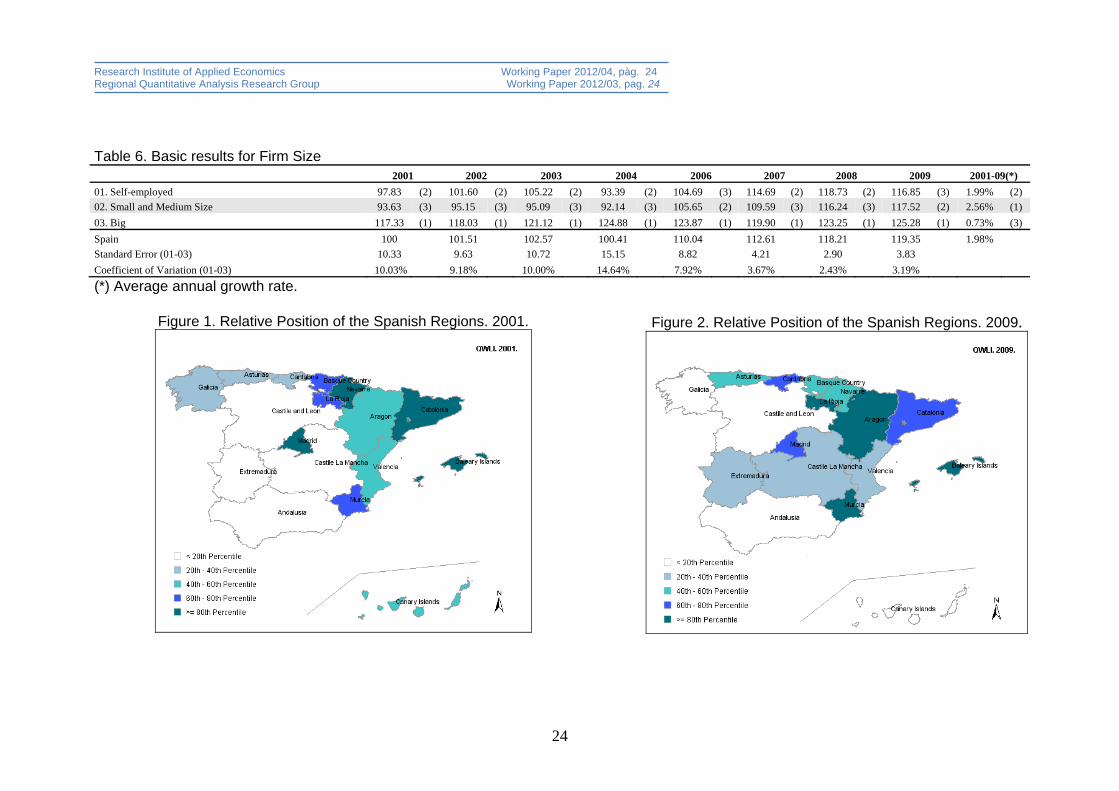
Table 3 shows the index results for the 17 Spanish Comunidades Autónomas, and
Figures 1 and 2 present maps indicating the relative positions of each region according
to the 2001 and 2009 index values, respectively. The 2001 results highlight a
remarkable degree of index dispersion (there being a 25-point difference between the
minimum of 86.3 recorded by Andalusia and the maximum of 111.3 recorded by the
Balearic Islands). At the bottom of the distribution (5th quintile) we find Andalusia,
Research Institute of Applied Economics Working Paper 2012/04, pàg. 12 Regional Quantitative Analysis Research Group Working Paper 2012/03, pag. 12
12
Castile Leon, Castile La Mancha and Extremadura (south and centre of Spain). The 4th
quintile comprises Asturias, Cantabria and Galicia (north). In the middle of the
distribution (3rd quintile) we find Aragon, the Canary Islands and Valencia. Between the
60th and the 80th percentile lie the regions of the Basque Country, La Rioja and Murcia.
Finally, at the top of the distribution we find the Balearic Islands, Catalonia, Madrid and
Navarre.
FIGURES 1 AND 2 ABOUT HERE
If we compare these results and those obtained for 2009, we find a similar picture
regarding the relative position held by the Spanish regions, although there has been a
decline in the overall index dispersion – the gap being closed to 21 points (between
Andalusia – 109.2 – and La Rioja – 129.84). Some regions find themselves in a worse
position in 2009 (Galicia and Canary Islands now occupy the 5th quintile), while
Extremadura and Castile La Mancha improved their standing significantly. Likewise,
the most developed regions, Catalonia and Madrid, now lie in the 2nd quintile, while
Aragon, Murcia and La Rioja join Balearic Islands in the 1st quintile.
However, the final ranking of the regions is not the only point of interest; we also need
to measure the effort each region has expended in seeking to improve the QWL in its
territory over the period. This information is included in Figure 3.
FIGURE 3 ABOUT HERE
Thus, taking into account not only their initial position, but also their cumulative average
growth over the period 2001-2009, the autonomous communities can be divided into
four groups:
Group A: Regions below the average (100) in 2001 presenting an above average
increase (2%) over the period. This group comprises regions from the south
(Andalusia and Estremadura), the centre (Castile Leon and Castile La Mancha) and
the north (Asturias and Cantabria). Although Andalusia experienced considerable
growth between 2001 and 2009, it remained at the bottom of the ranking, indicating
just how poor its initial position was. By contrast, Asturias and Cantabria, which
also started with low values in 2001, ended up with above average values in 2009
thanks to their strong growth.
Research Institute of Applied Economics Working Paper 2012/04, pàg. 13 Regional Quantitative Analysis Research Group Working Paper 2012/03, pag. 13
13
Group B: Regions above the average (100) in 2001 presenting an above average
improvement (2%) over the period. This group comprises the regions of Murcia,
Aragon, the Basque Country and La Rioja, the latter establishing itself at the top of
the ranking in 2009.
Group C: Regions below the average (100) in 2001 presenting a below average
improvement (2%) over the period. In this group we find only Galicia, lying in the
northwest of Spain. The relative position of this region worsened, as it fell from 11th
in the 2001 ranking to 16th in that of 2009.
Group D: Regions above the average (100) in 2001 and presenting a below
average improvement (2%) over the period. In this group we find the island regions
(Balearic and Canary Islands), and three developed regions: the capital of Spain
(Madrid), two economic poles, Valencia and Catalonia; and, finally, the region of
Navarre, one of the regions with the highest indexes of well being.
In short, Spain can be divided into three distinct areas. The first includes southern and
central zones together with Galicia, characterized, in comparative terms, by low quality
in work. The second is made up of the northern zone, with average levels of labour
quality. Thirdly, the eastern regions plus Madrid, in the centre of the country, are
characterized by higher quality in work than the rest of the state. Figure 3 also shows a
certain degree of convergence in these regional values during the decade 2001 to
2009.
4.3. Sectors
In 2009, the economic sectors with the highest quality in work scores were Financial
services for companies and leasing; Energy, chemistry, rubber and metallurgy;
Transport and telecommunications; Public administration, education and health; and
Food, textile, wood, paper and publishing. By contrast, Other community services;
Construction; Commerce, hotel and catering and repairs; and Agriculture, livestock,
forests and fisheries presented the lowest quality in work indexes. Thus, it would
appear that sectors with the highest added value perform better on the composite index
of quality in work.
Interestingly, all economic sectors improved their quality in work indexes from 2001 to
2009. The sectors that underwent the most marked improvements were Construction,
Research Institute of Applied Economics Working Paper 2012/04, pàg. 14 Regional Quantitative Analysis Research Group Working Paper 2012/03, pag. 14
14
Other community services and Agriculture, livestock, forests and fishing. The sectors
with the smallest rates of improvement were Energy, chemistry, rubber and metallurgy,
Financial services for companies and leasing, and Public administration, education and
health. Between 2008 and 2009, however, while labour quality improved significantly
(by almost 5%) in the Transport and telecommunications sectors, there were setbacks
in Energy, chemicals, rubber and metallurgy, and Agriculture, livestock, forests and
fisheries.
The range of the quality in work index in 2001 (39 points separated the minimum score
of 82.5 in the Construction sector and the maximum score of 121.4 of the Financial
services for companies and leasing) was higher than in the case of the regions. In
2009, the index range had fallen by 15 points to a difference of 24. Figure 4 illustrates
that there has been considerable convergence, with the sectors presenting low quality
in work indexes in 2001 having experienced the greatest increase in the index in the
intervening years. This convergence pattern is stronger than that observed in the case
of the regions (Figure 3).
FIGURE 4 ABOUT HERE
As with the regions, we can classify the sectors into different groups according to the
progress recorded between 2001 and 2009:
Group A: Sectors below the average (100) in 2001 presenting an above average
increase (2%) over the period. This group comprises Construction; Other
community services; Agriculture, livestock, forests and fisheries; Food, textiles,
wood, paper and publication; and Commerce, hotel and catering and repairs.
Group B: Sectors above the average (100) in 2001 presenting an above average
increase (2%) over the period. The only sector in this group is Transport and
telecommunications.
Group D: Sectors above the average (100) in 2001 presenting a below average
improvement (2%) over the period. This group comprises Machinery, electrical
material and transport material; Public administration, education and health;
Financial services for companies and leasing; and, finally, Energy, chemistry,
rubber and metallurgy.
Research Institute of Applied Economics Working Paper 2012/04, pàg. 15 Regional Quantitative Analysis Research Group Working Paper 2012/03, pag. 15
15
Interestingly, no sector can be classified in Group C (i.e., below the average in 2001
presenting a below average increase in the index over the period).
4.4. Professional categories and firm sizes
Our results for the quality in work index by professional category are shown in Table 5.
We considered three professional categories: Managers and professionals;
Technicians and skilled workers; and Operators and unskilled workers. This division
reflects the scarcity of statistical information available preventing us from
disaggregating the data further.
Professionals and managers enjoy significantly higher quality in work (132.3 in 2009)
than is the case of the other two groups of workers. This result is higher than the
highest average value for any region, and ties with the average index for the Financial
services for companies and leasing sector. As for the other two categories -
Technicians and skilled workers and Operators and unskilled workers, the relative
differences have experienced a dramatic reduction (from 13 points in 2001 to 2 points
in 2009). This is the result of a significant improvement in the situation of those
employed in the group of Operators and unskilled workers. Here, there has been an
average annual increase of 3.2% since 2001.
Between 2008 and 2009, the quality in work index of Managers and professionals has
fallen by -0.4%. By contrast, the situation of the other workers has improved, albeit at a
slower rate than during the period of expansion.
Our results for the quality in work index by firm size are shown in Table 6. As expected,
workers in large firms present a significantly higher quality in work index (125.3). Here,
we see that the categories that started the period with the worst quality in work indexes
experienced most improvement over the period (2% for Self-employed and 2.6% for
Small and medium sized firms) compared to a much lower rate for large firms (0.7%).
Between 2008 and 2009, a fall was recorded in the quality of the Self-employed
category (-1.6%). By contrast, the other two groups presented some improvement.
Research Institute of Applied Economics Working Paper 2012/04, pàg. 16 Regional Quantitative Analysis Research Group Working Paper 2012/03, pag. 16
16
5. Convergence – a brief analysis
The above results clearly point to a process of convergence, i.e. of -convergence
(Barro and Sala-i-Martin, 1992), with regions and sectors presenting the highest
(lowest) quality endowments in 2001 generally recording lower (higher) index increases
than the country average. Moreover, this negative relationship was more marked in the
case of the economic sectors than it was in the regions.
The other traditional measure of convergence, i.e., -convergence (Quah, 1993),
captures the evolution in relative dispersion as indicated by the coefficient of variation
(Figure 5). With the exception of 2004, we observed a constant decrease in the pattern
of relative dispersion of the quality in work index by region, sector, professional
category and firm size:
In the case of the regions, it fell from 7.9% in 2001 to 4.7% in 2009.
In the economic sectors, it fell from 12.8% to 5.8% in the same period.
In the professional categories it fell from 13.1% in 2001 to 6.6% in 2009.
Finally, in the case of firm size it fell from 10% to 3.2%.
All in all, we observe a process of convergence over the years. This is particularly
marked in the case of the economic sectors, professional categories and firm sizes,
suggesting that the labour market adjusts more quickly in these dimensions than it
does in the regional one. Interestingly, the initial impact of the economic crisis has only
resulted in a reduction in the coefficient of variation for sectors and firm sizes in 2009.
However, this is not unexpected given that regional labour markets in Spain tend not to
adjust through the usual mechanisms of migration. By contrast, workers change more
readily the sector in which they work, and firms adapt more readily their size structure
during the economic cycle.
Research Institute of Applied Economics Working Paper 2012/04, pàg. 17 Regional Quantitative Analysis Research Group Working Paper 2012/03, pag. 17
17
6. Conclusions
In this paper we have presented the outcomes of a quality in work index for Spain for
the years 2001 to 2009. Drawing on the definition of quality in work and the
dimensional structures drawn up by the European Commission, we compute the index
for each dimension in this framework and also for Spain’s 17 regions, 10 sectors, 3
professional categories and 3 firm sizes. We find that the best results are recorded in
the most developed regions, in the service sector, in the largest firms and in jobs in
which workers are entrusted with most responsibility. We also conclude that the
economic crisis has affected seven of the ten dimensions considered between 2008
and 2009, in particular as regards the concepts included in D06 - Inclusion and access
to the labour market, and D05 - Flexibility and security.
By region, we identify three main zones characterised by the quality in work. Thus, the
south and centre of Spain present low index levels, the north presents average levels
of quality, while the highest index scores are found in the east of Spain and in the
capital, Madrid. As for economic sector, professional category and firm size, we find
that the higher the sector’s added value, the higher the workers’ qualifications, and the
larger the firm, the higher is the quality in work index.
Finally, our data reveal a process of convergence, that is, greater increases in the
index are recorded in sectors and regions that started the period with a low quality
endowment (-convergence). In a similar vein, we note a reduction in the gap between
regions, sectors, firm sizes and professional categories (-convergence). Specifically,
economic sectors and firm sizes experienced the steepest convergence processes;
however, in 2009 this falling trend in their coefficients of variation was curtailed. This
might suggest that the market adjusts quicker in relation to these dimensions than it
does to the territorial dimension, which can be seen as a symptom of the spatial
rigidities in the Spanish labour market.
Future research needs to be developed along two lines: on the one hand, analysing the
convergence in quality in work in Spain’s labour market and in its spatial distribution
based on conditional regressions and spatial estimation techniques; and, on the other,
examining the relationship between quality in work and sector productivity and the
economy’s global evolution.
Research Institute of Applied Economics Working Paper 2012/04, pàg. 18 Regional Quantitative Analysis Research Group Working Paper 2012/03, pag. 18
18
References Bank of Spain (2009) “El Funcionamiento del Mercado de Trabajo y el Aumento del
Paro en España”, Boletin Economico, Julio-Augosto 2009.
Barro, R.J. and Sala-i-Martin, X. (1992), “Convergence”, Journal of Political Economy,
100 (2): 223-251
Bentolila, S. and J.J. Dolado (1994) “Labour Flexibility and Wages: Lessons from
Spain” Economic Policy, Vol. 8, Issue 18, April.
Bentolila, S. and J. F. Jimeno (2003), “Spanish Unemployment: The End of the Wild
Ride?” FEDEA Documento de Trabajo 2003-10.
Clark, A.E. (2005). “Your Money or Your Life: Changing Job Quality in OECD
Countries”, British Journal of Industrial Relations, 43(3), 377–400.
Dolado, J.J., C. García-Serrano and J.F. Jimeno (2002), “Drawing Lessons from the
Boom of Temporary Jobs in Spain,” The Economic Journal, Vol. 112, No. 480, June.
Eurofund (2007). Quality of work and employment in Europe, available at
www.eurofound.europa.eu
Jaumotte F. (2011). The Spanish Labor Market in a Cross-Country Perspective, IMF
working paper WP/11/11.
Martel, J-P., and Dupuis, G. (2006) “Quality of work life: theoretical and Methodological
problems, and Presentation of a new model and Measuring instrument”, Social
Indicators Research, 77, pp. 333–368.
Quah, D.T. (1993), “Empirical Cross-section Dynamics in Economic Growth”, European
Economic Review, 37 (2-3): 426-434.
Royuela, V.; Suriñach, J.; Reyes, M. (2003). "Measuring quality of life in small areas
over different periods of time" Social Indicators Research, 64(1), 51-74
Research Institute of Applied Economics Working Paper 2012/04, pàg. 19 Regional Quantitative Analysis Research Group Working Paper 2012/03, pag. 19
19
Royuela, V., J. López-Tamayo and J. Suriñach (2008). "The institutional vs. the
academic definition of the quality of work life. What is the focus of the European
Commission?" Social Indicators Research, 86(3), 401-415,
Royuela, V, J. López-Tamayo and J. Suriñach. (2009). "Results of a Quality of Work
Life Index in Spain. A Comparison of Survey Results and Aggregate Social Indicators",
Social Indicators Research, 90(2), 225-241.
Royuela, V. and Sanchis-i-Marco, M. (2010). "La reforma de la contratación en el
mercado de trabajo: entre la flexibilidad y la seguridad", Papeles de Economía
Española, 124, 109-127.
Sennet, R. (2006). La nueva cultura del capitalismo, Ed. Anagrama.
Research Institute of Applied Economics Working Paper 2012/04, pàg. 20 Regional Quantitative Analysis Research Group Working Paper 2012/03, pag. 20
20
Tables and Figures
Table 1. Dimensions and concepts of Quality in Work DIMENSION: 1. Intrinsic job quality DIMENSION: 6. Inclusion and access to the
labour market Concept 1: job satisfaction among workers, taking account of job characteristics, contract type, hours worked and the level of qualification relative to job requirements
Concept 1: Effective transition of young people to active life
Concept 2: proportion of workers advancing to higher paid employment over time
Concept 2: employment and long-term unemployment rates by age, educational level, region
Concept 3: low wage earners, working poor, and the distribution of income
Concept 3: labour market bottlenecks and mobility between sectors and occupations
DIMENSION: 2. Skills, life-long learning and career development
DIMENSION: 7. Work organisation and work-life balance
Concept 1: proportion of workers with medium and high levels of education
Concept 1: proportion of workers with flexible working arrangements
Concept 2: proportion of workers undertaking training or other forms of life-long learning Concept 3: proportion of workers with basic or higher levels of digital literacy
Concept 2: opportunities for maternity and paternity leave, and take-up rates; scale of child-care facilities for pre-school and primary school age groups
DIMENSION: 3. Gender equality DIMENSION: 8. Social dialogue and worker involvement and worker involvement
Concept 1: gender pay gap, appropriately adjusted for such factors as sector, occupation and age
Concept 1: coverage of collective agreements
Concept 2: gender segregation – extent to which women and men are over or under-represented in different professions and sectors
Concept 2: proportion of workers with a financial interest/participation in the firms where they are employed
Concept 3: proportion of women and men with different levels of responsibility within professions and sectors, taking account of factors such as age and education
Concept 3: working days lost in industrial disputes
DIMENSION: 4. Health and safety at work DIMENSION: 9. Diversity and non-discrimination
Concept 1: composite indicators of accidents at work – fatal and serious – including costs; total andmean number of days lost due to accidents at work, by sex; occupational diseases, by sex; rates of occupational disease, including new risks e.g. repetitive strain injury Concept 2: stress levels and other difficulties concerning working relationships
Concept 1: employment rates and pay gaps of older workers compared with average Concept 2: employment rates and pay gaps of persons with disabilities, and persons from ethnic minorities – compared with average Concept 3: information on the existence of labour market complaints procedures, and of successful outcomes
DIMENSION: 5. Flexibility and security DIMENSION: 10. Overall work performance Concept 1: the effective coverage of social protection systems – in terms of breadth of eligibility and level of support – for those in work, or seeking work
Concept 1: average hourly productivity per worker
Concept 2: proportion of workers with flexible working arrangements – as seen by employers and workers
Concept 2: average annual output per worker
Concept 3: job losses – proportion of workers losing their job through redundancies; proportion of those finding alternative employment in a given period
Concept 3: average annual living standards per head of population – taking account of the rate of employment and the dependency ratio
Concept 4: proportion of workers changing the geographical location of their work
Source: Royuela et al (2008)

Research Institute of Applied Economics Working Paper 2012/04, pàg. 21 Regional Quantitative Analysis Research Group Working Paper 2012/03, pag. 21
21
Table 2. Basic results for Dimensions 2001 2002 2003 2004 2006 2007 2008 2009 2001-09(*)
01. Intrinsic job quality 100 98.35 (10) 98.45 (9) 102.05 (8) 102.63 (9) 110.68 (7) 124.44 (4) 120.16 (4) 2.06% (4)
02. Skills, life-long learning and career development 100 100.70 (6) 101.13 (5) 107.22 (2) 111.57 (4) 119.72 (3) 127.66 (3) 121.18 (3) 2.16% (3)
03. Gender equality 100 105.06 (1) 113.02 (1) 119.71 (1) 132.82 (1) 133.88 (1) 134.05 (1) 151.42 (1) 4.72% (1)
04. Health and safety at work 100 98.99 (8) 99.68 (6) 107.03 (3) 104.27 (7) 110.02 (8) 114.77 (6) 114.12 (5) 1.48% (5)
05. Flexibility and security 100 98.52 (9) 99.03 (8) 103.68 (6) 110.86 (5) 113.44 (6) 114.05 (7) 93.27 (9) -0.77% (9)
06. Inclusion and access to the labour market 100 102.32 (3) 103.43 (3) 106.61 (4) 126.40 (2) 129.32 (2) 121.87 (5) 80.90 (10) -2.33% (10)
07. Work organisation and work-life balance 100 100.71 (5) 95.68 (10) 99.20 (9) 109.13 (6) 117.03 (5) 128.94 (2) 133.01 (2) 3.22% (2)
08. Social dialogue and worker involvement and worker involvement 100 104.69 (2) 105.15 (2) 83.59 (10) 98.14 (10) 102.12 (10) 103.57 (10) 113.34 (6) 1.40% (6)
09. Diversity and non-discrimination 100 100.30 (7) 99.37 (7) 102.69 (7) 121.20 (3) 117.27 (4) 111.65 (8) 108.90 (7) 0.95% (7)
10. Overall work performance 100 100.88 (4) 101.84 (4) 103.77 (5) 104.23 (8) 109.58 (9) 108.91 (9) 105.01 (8) 0.54% (8)
Spain 100 101.51 102.57 100.41 110.04 112.61 118.21 119.35 1.98%
Standard Error (01-10) 2.23 4.55 8.46 10.65 9.04 9.35 18.66
Coefficient of Variation (01-10) 2.21% 4.47% 8.17% 9.50% 7.77% 7.86% 16.35%
(*) Average annual growth rate.

Research Institute of Applied Economics Working Paper 2012/04, pàg. 22 Regional Quantitative Analysis Research Group Working Paper 2012/03, pag. 22
22
Table 3. Basic results for Regions (Autonomous Communities)
2001 2002 2003 2004 2006 2007 2008 2009 2001-09(*)
01. Andalusia 86.37 (17) 88.88 (17) 89.67 (17) 62.44 (17) 98.97 (16) 105.31 (16) 111.34 (15) 109.24 (17) 2.64% (6)
02. Aragón 101.76 (8) 102.63 (7) 107.20 (5) 112.65 (6) 116.56 (7) 120.19 (2) 128.60 (2) 125.53 (4) 2.36% (8)
03. Asturias 91.40 (13) 96.94 (11) 99.25 (10) 100.66 (11) 101.12 (13) 104.67 (17) 119.48 (9) 122.88 (9) 3.34% (1)
04. Balearic Islands 110.83 (2) 112.68 (1) 111.94 (3) 116.53 (3) 123.35 (1) 125.44 (1) 129.59 (1) 129.38 (2) 1.73% (13)
05. Canary Islands 100.03 (10) 101.10 (9) 101.04 (9) 104.34 (8) 109.20 (10) 112.37 (9) 115.65 (11) 115.57 (15) 1.62% (14)
06. Cantabria 92.39 (12) 95.54 (12) 95.47 (13) 101.51 (10) 120.35 (2) 108.78 (11) 114.66 (12) 123.13 (7) 3.24% (2)
07. Castile La Mancha 90.85 (15) 93.21 (14) 89.82 (16) 89.43 (15) 97.38 (17) 107.49 (13) 112.79 (14) 116.48 (13) 2.80% (5)
08. Castile Leon 88.09 (16) 92.06 (16) 93.79 (15) 96.63 (12) 105.62 (12) 108.47 (12) 109.84 (16) 116.32 (14) 3.14% (3)
09. Catalonia 111.30 (1) 109.05 (3) 108.59 (4) 113.82 (4) 117.88 (6) 118.25 (4) 122.19 (5) 124.35 (5) 1.24% (17)
10. Valencia 100.41 (9) 101.39 (8) 101.84 (8) 103.38 (9) 107.81 (11) 111.39 (10) 118.88 (10) 118.81 (11) 1.89% (11)
11. Extremadura 91.07 (14) 92.90 (15) 93.91 (14) 87.12 (16) 99.39 (15) 106.48 (14) 106.83 (17) 117.40 (12) 2.86% (4)
12. Galicia 94.13 (11) 95.28 (13) 95.65 (12) 91.92 (14) 100.90 (14) 106.16 (15) 113.97 (13) 111.31 (16) 1.88% (12)
13. Madrid 108.46 (3) 112.09 (2) 118.57 (1) 122.28 (1) 119.06 (4) 116.39 (7) 121.25 (8) 124.10 (6) 2.51% (7)
14. Murcia 101.81 (7) 103.36 (6) 105.58 (6) 106.48 (7) 112.42 (8) 117.08 (5) 122.03 (6) 125.58 (3) 1.51% (15)
15. Navarre 107.60 (4) 107.92 (4) 112.64 (2) 119.51 (2) 118.52 (5) 116.61 (6) 123.11 (4) 121.43 (10) 2.36% (9)
16. Basque Country 102.27 (6) 104.91 (5) 99.16 (11) 96.24 (13) 111.25 (9) 114.75 (8) 123.72 (3) 122.96 (8) 1.35% (16)
17. La Rioja 103.90 (5) 100.99 (10) 102.29 (7) 112.86 (5) 119.80 (3) 119.65 (3) 121.86 (7) 129.84 (1) 2.07% (10)
Spain 100 101.51 102.57 100.41 110.04 112.61 118.21 119.35 1.98%
Standard Error (01-17) 7.83 6.97 8.04 14.22 8.48 6.00 6.22 5.66
Coefficient of Variation (01-17) 7.91% 6.93% 7.92% 13.91% 7.67% 5.31% 5.25% 4.68%
(*) Average annual growth rate.

Research Institute of Applied Economics Working Paper 2012/04, pàg. 23 Regional Quantitative Analysis Research Group Working Paper 2012/03, pag. 23
23
Table 4. Basic results for Sectors 2001 2002 2003 2004 2006 2007 2008 2009 2001-09(*)
01. Agriculture, livestock, forests and fishing 82.84 (9) 86.13 (10) 87.41 (9) 53.00 (10) 96.46 (10) 106.73 (9) 111.49 (10) 108.93 (10) 3.09% (3)
02. Energy, chemistry, rubber and metallurgy 114.12 (2) 114.97 (2) 111.79 (3) 134.07 (2) 128.89 (2) 122.19 (2) 127.61 (2) 125.69 (2) 1.08% (9)
03. Food, textiles, wood, paper and publication 97.43 (6) 98.69 (6) 98.86 (6) 94.57 (6) 103.94 (6) 111.65 (6) 118.61 (5) 119.79 (6) 2.32% (4)
04. Machinery, electrical material and transport material 105.63 (4) 109.45 (4) 106.82 (4) 111.40 (4) 118.29 (3) 118.91 (3) 124.37 (3) 125.04 (3) 1.89% (7)
05. Construction 82.50 (10) 87.15 (9) 86.79 (10) 74.50 (9) 96.52 (9) 104.23 (10) 112.63 (8) 113.99 (8) 3.66% (1)
06. Commerce, hotel and catering, repairs 94.06 (7) 96.12 (7) 97.81 (7) 86.59 (7) 100.37 (8) 107.36 (8) 112.49 (9) 112.97 (9) 2.06% (6)
07. Transport and telecommunications 100.81 (5) 99.97 (5) 100.08 (5) 96.63 (5) 112.33 (5) 114.79 (5) 116.68 (6) 122.42 (5) 2.18% (5)
08. Financial services for companies and leasing 121.40 (1) 121.54 (1) 123.47 (1) 141.30 (1) 133.75 (1) 123.98 (1) 129.11 (1) 132.80 (1) 1.00% (10)
09. Public administration, education and health 110.53 (3) 110.14 (3) 113.62 (2) 121.82 (3) 117.26 (4) 116.30 (4) 121.97 (4) 122.88 (4) 1.18% (8)
10. Other community services 86.27 (8) 87.63 (8) 89.60 (8) 78.18 (8) 102.13 (7) 109.05 (7) 112.85 (7) 114.29 (7) 3.17% (2)
Spain 100 101.51 102.57 100.41 110.04 112.61 118.21 119.35 1.98%
Standard Error (01-10) 12.77 11.81 11.59 26.50 12.63 6.46 6.29 6.90
Coefficient of Variation (01-10) 12.82% 11.67% 11.40% 26.71% 11.38% 5.69% 5.30% 5.76%
(*) Average annual growth rate.
Table 5. Basic results for Professional Categories 2001 2002 2003 2004 2006 2007 2008 2009 2001-09(*)
01. Managers and professionals 118.48 (1) 118.78 (1) 124.56 (1) 134.71 (1) 124.98 (1) 125.38 (1) 132.80 (1) 132.33 (1) 1.24% (3)
02. Technicians and skilled workers 99.07 (2) 100.57 (2) 101.52 (2) 100.46 (2) 107.79 (2) 109.43 (2) 115.06 (2) 116.52 (2) 1.82% (2)
03. Operators and non-skilled workers 86.22 (3) 88.67 (3) 85.66 (3) 69.64 (3) 101.95 (3) 108.81 (3) 112.28 (3) 114.48 (3) 3.20% (1)
Spain 100 101.51 102.57 100.41 110.04 112.61 118.21 119.35 1.98%
Standard Error (01-03) 13.26 12.38 15.97 26.57 9.77 7.67 9.09 7.98
Coefficient of Variation (01-03) 13.10% 12.06% 15.37% 26.16% 8.76% 6.69% 7.57% 6.59%
(*) Average annual growth rate.
Research Institute of Applied Economics Working Paper 2012/04, pàg. 24 Regional Quantitative Analysis Research Group Working Paper 2012/03, pag. 24
24
Table 6. Basic results for Firm Size 2001 2002 2003 2004 2006 2007 2008 2009 2001-09(*)
01. Self-employed 97.83 (2) 101.60 (2) 105.22 (2) 93.39 (2) 104.69 (3) 114.69 (2) 118.73 (2) 116.85 (3) 1.99% (2)
02. Small and Medium Size 93.63 (3) 95.15 (3) 95.09 (3) 92.14 (3) 105.65 (2) 109.59 (3) 116.24 (3) 117.52 (2) 2.56% (1)
03. Big 117.33 (1) 118.03 (1) 121.12 (1) 124.88 (1) 123.87 (1) 119.90 (1) 123.25 (1) 125.28 (1) 0.73% (3)
Spain 100 101.51 102.57 100.41 110.04 112.61 118.21 119.35 1.98%
Standard Error (01-03) 10.33 9.63 10.72 15.15 8.82 4.21 2.90 3.83
Coefficient of Variation (01-03) 10.03% 9.18% 10.00% 14.64% 7.92% 3.67% 2.43% 3.19%
(*) Average annual growth rate.
Figure 1. Relative Position of the Spanish Regions. 2001.
Figure 2. Relative Position of the Spanish Regions. 2009.

Research Institute of Applied Economics Working Paper 2012/04, pàg. 25 Regional Quantitative Analysis Research Group Working Paper 2012/03, pag. 25
25
Figure 3. Change in Relative Position of the Spanish Regions. 2001-2009.
Aragon
Catalonia
Galicia
Madrid
Navarre
Andalusia
Asturias
Balearic Islands
Canary Islands
Cantabria
Castille La Mancha
Castille and Leon
Valencia
Extremadura
Murcia
Basque Country
La Rioja
1.00%
1.98%
2.96%
85 100 115
QWLI 2001
Cu
mu
lati
ve A
vera
ge
Gro
wth
200
1-2
009
A B
C
D
Figure 4. Change in Relative Position of the Spanish Sectors. 2001-2009
Public administration, education and health
Agriculture. livestock, forests and fishing
Energy, chemistry, rubber and metallurgy
Food, textiles, wood, paper and publication
Machinery, electrical material and transport material
Construction
Commerce, hotel and catering, repairs
Transport and telecommunications
Financial services for companies and leasing
Other community services
0.50%
1.98%
3.46%
80 100 120
QWLI 2001
Cu
mu
lati
ve A
ver
age
Gro
wth
20
01-2
009
A
B
C
D
Figure 5. Evolution of the Relative Dispersion of QWLI’s. 2001-2009.
0%
5%
10%
15%
20%
25%
30%
2001 2002 2003 2004 2006 2007 2008 2009
Dimensions (01-10) Regions (01-17) Sectors (01-10) Professional Categories (01-03) Firm Size (01-03)
Research Institute of Applied Economics Working Paper 2012/04, pàg. 26 Regional Quantitative Analysis Research Group Working Paper 2012/03, pag. 26
26
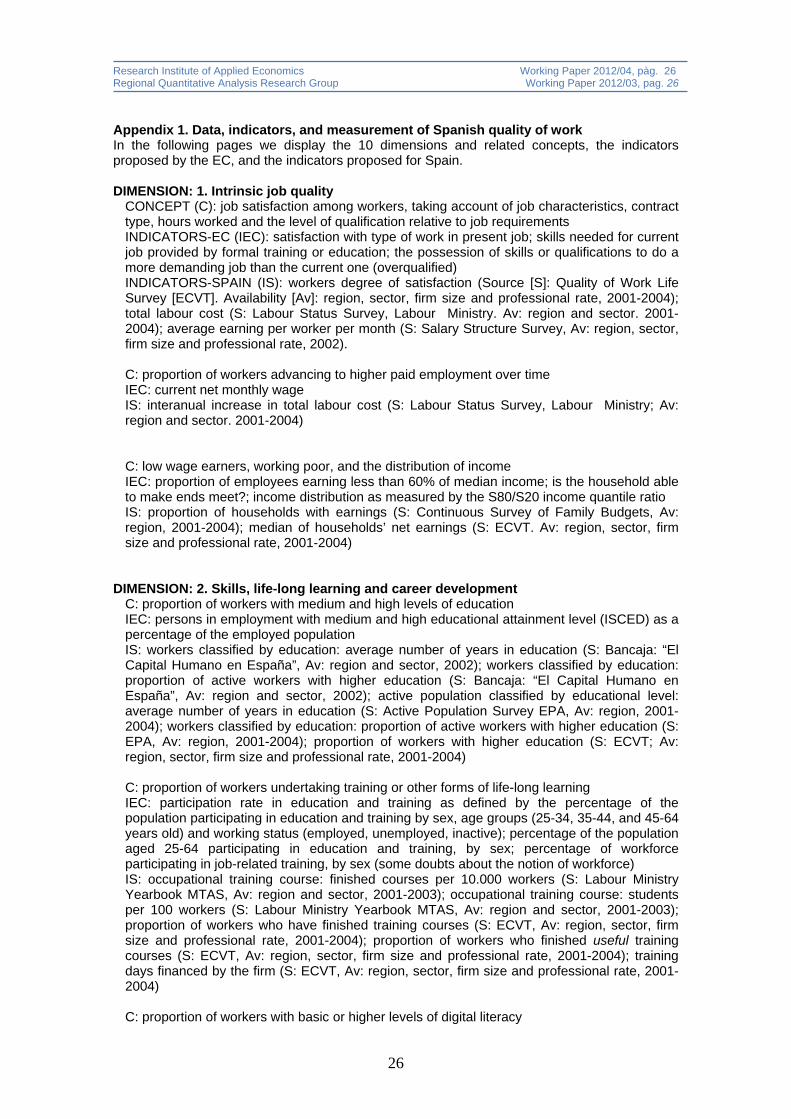
Appendix 1. Data, indicators, and measurement of Spanish quality of work In the following pages we display the 10 dimensions and related concepts, the indicators proposed by the EC, and the indicators proposed for Spain. DIMENSION: 1. Intrinsic job quality
CONCEPT (C): job satisfaction among workers, taking account of job characteristics, contract type, hours worked and the level of qualification relative to job requirements INDICATORS-EC (IEC): satisfaction with type of work in present job; skills needed for current job provided by formal training or education; the possession of skills or qualifications to do a more demanding job than the current one (overqualified) INDICATORS-SPAIN (IS): workers degree of satisfaction (Source [S]: Quality of Work Life Survey [ECVT]. Availability [Av]: region, sector, firm size and professional rate, 2001-2004); total labour cost (S: Labour Status Survey, Labour Ministry. Av: region and sector. 2001-2004); average earning per worker per month (S: Salary Structure Survey, Av: region, sector, firm size and professional rate, 2002). C: proportion of workers advancing to higher paid employment over time IEC: current net monthly wage IS: interanual increase in total labour cost (S: Labour Status Survey, Labour Ministry; Av: region and sector. 2001-2004) C: low wage earners, working poor, and the distribution of income IEC: proportion of employees earning less than 60% of median income; is the household able to make ends meet?; income distribution as measured by the S80/S20 income quantile ratio IS: proportion of households with earnings (S: Continuous Survey of Family Budgets, Av: region, 2001-2004); median of households’ net earnings (S: ECVT. Av: region, sector, firm size and professional rate, 2001-2004)
DIMENSION: 2. Skills, life-long learning and career development
C: proportion of workers with medium and high levels of education IEC: persons in employment with medium and high educational attainment level (ISCED) as a percentage of the employed population IS: workers classified by education: average number of years in education (S: Bancaja: “El Capital Humano en España”, Av: region and sector, 2002); workers classified by education: proportion of active workers with higher education (S: Bancaja: “El Capital Humano en España”, Av: region and sector, 2002); active population classified by educational level: average number of years in education (S: Active Population Survey EPA, Av: region, 2001-2004); workers classified by education: proportion of active workers with higher education (S: EPA, Av: region, 2001-2004); proportion of workers with higher education (S: ECVT; Av: region, sector, firm size and professional rate, 2001-2004) C: proportion of workers undertaking training or other forms of life-long learning IEC: participation rate in education and training as defined by the percentage of the population participating in education and training by sex, age groups (25-34, 35-44, and 45-64 years old) and working status (employed, unemployed, inactive); percentage of the population aged 25-64 participating in education and training, by sex; percentage of workforce participating in job-related training, by sex (some doubts about the notion of workforce) IS: occupational training course: finished courses per 10.000 workers (S: Labour Ministry Yearbook MTAS, Av: region and sector, 2001-2003); occupational training course: students per 100 workers (S: Labour Ministry Yearbook MTAS, Av: region and sector, 2001-2003); proportion of workers who have finished training courses (S: ECVT, Av: region, sector, firm size and professional rate, 2001-2004); proportion of workers who finished useful training courses (S: ECVT, Av: region, sector, firm size and professional rate, 2001-2004); training days financed by the firm (S: ECVT, Av: region, sector, firm size and professional rate, 2001-2004) C: proportion of workers with basic or higher levels of digital literacy
Research Institute of Applied Economics Working Paper 2012/04, pàg. 27 Regional Quantitative Analysis Research Group Working Paper 2012/03, pag. 27
27
IEC: currently not entirely available IS: currently not entirely available
DIMENSION: 3. Gender equality
C: gender pay gap, appropriately adjusted for such factors as sector, occupation and age IEC: ratio of women's hourly earnings index to men's for paid employees at work 15+hours by job content and education IS: average earning ratio (women/men) (S: ECVT, Av: region, sector, firm size and professional rate, 2001-2004); salary earnings: gender differences (S: Salary Structure Survey, Av: region, sector and professional rate, 2002) C: gender segregation – extent to which women and men are over or under-represented in different professions and sectors IEC: the average national proportion of employment for women and men applied to employment in each sector/occupation. The differences are added and related to total employment to obtain a gender imbalance figure. IS: proportion of women workers, classified by sector and firm size (S: Labour Status Survey. MTAS, Av: sector and firm size, 2001-2004); activity rate: gender differences (S: EPA, Av: region, 2001-2004); unemployment rate: gender differences (S: EPA, Av: region, 2001-2004) C: proportion of women and men with different levels of responsibility within professions and sectors, taking account of factors such as age and education IEC: employment of women and men, by level of responsibility within firms and by sector (adjustment for age and education); job status (supervisory, intermediate, non-supervisory) by occupation or industry. IS: proportion of women working as member of the board of a firm in comparison with the proportion of men on the board (S: ECVT, Av: region, sector, firm size and professional rate, 2001-2004)
DIMENSION: 4. Health and safety at work
C: composite indicators of accidents at work – fatal and serious – including costs; total and mean number of days lost due to accidents at work, by sex; occupational diseases, by sex; rates of occupational disease, including new risks e.g. repetitive strain injury IEC: the incidence rate, defined as the number of accidents at work per 100,000 persons in employment, by sex, calculated as: [number of accidents (fatal or non-fatal) / number of employed persons in the studied population] x 100 000; health problems related to making repetitive movements; working at very high speed and its effects on health IS: accidents at different work rates (S: Labour Accidents at Work. MTAS, Av: region, sector, firm size and professional rate, 2001-2004) C: stress levels and other difficulties concerning working relationships IEC: working to tight deadlines and its effects on health IS: proportion of workers who consider that they have to do physical work (S: ECVT, Av: region, sector, firm size and professional rate, 2001-2004); proportion of workers who consider that their work is stressful (S: ECVT, Av: region, sector, firm size and professional rate, 2001-2004); proportion of workers who consider that their work is dangerous (S: ECVT, Av: region, sector, firm size and professional rate, 2001-2004); proportion of workers who consider that their work is developed in a satisfactory environment (S: ECVT, Av: region, sector, firm size and professional rate, 2001-2004); proportion of workers who consider that their work is satisfactory in hygenic terms (S: ECVT, Av: region, sector, firm size and professional rate, 2001-2004); proportion of workers who are satisfied with the safety measures (S: ECVT, Av: region, sector, firm size and professional rate, 2001-2004)
DIMENSION: 5. Flexibility and security
C: the effective coverage of social protection systems – in terms of breadth of eligibility and level of support – for those in work, or seeking work IEC: coverage of the employed by social insurance, as measured by the total net social/social insurance receipts in the year prior to the interview (as part of income)

Research Institute of Applied Economics Working Paper 2012/04, pàg. 28 Regional Quantitative Analysis Research Group Working Paper 2012/03, pag. 28
28
IS: coverage of the employed by social insurance (S: MTAS e INEM, Av: region, 2001-2004); beneficiaries of assistance insurance (S: MTAS and INEM, Av: Region. 2001-2004); benefits for retired people (S: MTAS e INEM Av: region, 2001-2004]; average amount of benefits (S: MTAS and INEM, Av: Region. 2001-2004) C: proportion of workers with flexible working arrangements – as seen by employers and workers IEC: satisfaction with working time in present job; type of employment contract, by categories: permanent, fixed-term or short-term, casual work with no contract, some other working arrangement; full-time/part-time. IS: salary differences between permanent and temporary contracts (S: Salary Structure Survey. Av: region, 2002); proportion of workers with permanent contracts (S: ECVT, Av: region, sector, firm size and professional rate, 2001-2004); proportion of workers with permanent contracts and undesired part time jobs (S: ECVT, Av: region, sector, firm size and professional rate, 2001-2004) C: job losses – proportion of workers losing their job through redundancies; proportion of those finding alternative employment in a given period IEC: reason for leaving a previous job; main reason for leaving last job or business. IS: unemployment rate (S: EPA, Av: region, 2001-2004) C: proportion of workers changing the geographical location of their work IEC: data available through Eurostat but in need of analysis and presentation IS: not available
DIMENSION: 6. Inclusion and access to the labour market
C: Effective transition of young people to active life IEC: Activity rate 15-24 as a proportion of the population of 15-24; youth unemployment ratio: unemployed aged 15-24 as a percentage of the population aged 15-24 IS: unemployment rate of young people (15-25) (S: EPA, Av: region, 2001-2004); employment rate of young people (15-25) (S: EPA, Av: region, 2001-2004) C: employment and long-term unemployment rates by age, educational level, region IEC: employment rate by main age group (15-24, 25-54, 55-64, 15-64) and educational attainment levels (ISCED: high, medium and low); total long-term unemployment rate IS: proportion of long-term unemployed workers (S: EPA, Av: region, 2001-2004) C: labour market bottlenecks and mobility between sectors and occupations IEC: none currently available; employed in current and previous job; sector of current and previous job IS: vacancies / unemployed workers. (S: INEM, Av: region and professional rate, 2001-2004)
DIMENSION: 7. Work organisation and work-life balance
C: proportion of workers with flexible working arrangements IEC: proportion of employees with flexible working arrangements (flexible hours, annualised hours contract, on-call work) out of total employees, by sex; number of employees working involuntary part-time as a percentage of total number of employees IS: proportion of workers with part time contracts (S: EPA, Av: region, 2001-2004); proportion of workers with temporary contracts, per region (S: EPA, Av: region, 2001-2004); proportion of workers with temporary contracts, per sector (S: EPA, Av: sector, 2001-2004); proportion of workers with part-time jobs because they have not found a permanent job (S: ECVT, Av: region, sector, firm size and professional rate, 2001-2004); proportion of workers with part-time jobs because they are not willing to take on a permanent job (S: ECVT, Av: region, sector, firm size and professional rate, 2001-2004) C: opportunities for maternity and paternity leave, and take-up rates; scale of child-care facilities for pre-school and primary school age groups IEC: employed men and women on parental leave (paid and unpaid) as a proportion of all employed parents; allocation of parental leave between employed men and women as a
Research Institute of Applied Economics Working Paper 2012/04, pàg. 29 Regional Quantitative Analysis Research Group Working Paper 2012/03, pag. 29
29
proportion of all parental leave; children cared for (other than by the family) as a proportion of all children in the same age group. Broken down by before the noncompulsory preschool system, in noncompulsory or equivalent preschool system and compulsory primary education IS: subsidy for infant care per 1,000 inhabitants (S: Labour Ministry Yearbook MTAS, Av: region, 2001-2004); infant services per 100,000 inhabitants (S: Labour Ministry Yearbook MTAS, Av: region, 2001-2004); primary health care per 1,000 inhabitants (S: Labour Ministry Yearbook MTAS, Av: region, 2001-2004); proportion of workers whose firms offer subsidies for nurseries (S: ECVT, Av: region, sector, firm size and professional rate, 2001-2004); proportion of workers whose firms offer subsidies for housing (S: ECVT, Av: region, sector, firm size and professional rate, 2001-2004); proportion of workers whose firms offer subsidies for life long learning (S: ECVT, Av: region, sector, firm size and professional rate, 2001-2004); proportion of workers whose firms offer canteen services (S: ECVT, Av: region, sector, firm size and professional rate, 2001-2004); proportion of workers whose firms offer pension plans (S: ECVT, Av: region, sector, firm size and professional rate, 2001-2004), Proportion of workers whose firms offer other services (S: ECVT, Av: region, sector, firm size and professional rate, 2001-2004)
DIMENSION: 8. Social dialogue and worker involvement and worker involvement
C: coverage of collective agreements IEC: none currently available IS: proportion of workers with collective agreements (S: Labour Ministry Yearbook MTAS and EPA Av: region, sector and professional rate, 2001-2003); proportion of workers employed in firms without any structure for conducting collective negotiations (S: ECVT, Av: region, sector, firm size and professional rate. 2001-2004); ratio of workers with a firm-level of collective agreement (S: ECVT, Av: region, sector, firm size and professional rate, 2001-2004) C: proportion of workers with a financial interest/participation in the firms where they are employed IEC: percentage of business units with more than 200 employees in each country using financial participation schemes IS: proportion of workers whose salary partly depends on the firm’s profits (S: ECVT, Av: region, sector, firm size and professional rate, 2001-2004) C: working days lost in industrial disputes IEC: no. of working days lost (1000) IS: ratio of lost days per strikes over working days (S: Labour Ministry Yearbook MTAS, Av: region and sector, 2001-2003)
DIMENSION: 9. Diversity and non-discrimination
C: employment rates and pay gaps of older workers compared with average IEC: total net monthly wages IS: activity rate for workers older than 55 (S: EPA, Av: region. 2001-2004); unemployment rate of older workers (older than 55) (S: EPA, Av: Region. 2001-2004); average earnings per worker (S: Salary Structure Survey, Av: region and sector, 2002) C: employment rates and pay gaps of persons with disabilities, and persons from ethnic minorities – compared with average IEC: none currently available but some employment data is available concerning non-nationals IS: earnings differentials by nationality (S: Salary Structure Survey, Av: sector and professional rate, 2002); ratio of social security systems enroled in by workers over total potential workers (S: Seguridad Social e INE [Padrón], Av: region, 2001-2004); proportion of workers enroled in the social security system (S: Seguridad Social, Av: region, 2001-2004); foreigners: ratio of foreigners working in the cleaning regime (S: Seguridad Social, Av: region, 2001-2004) C: information on the existence of labour market complaints procedures, and of successful outcomes
Research Institute of Applied Economics Working Paper 2012/04, pàg. 30 Regional Quantitative Analysis Research Group Working Paper 2012/03, pag. 30
30
IEC: none currently available IS: not available
DIMENSION: 10. Overall work performance
C: average hourly productivity per worker IEC: average productivity per hour worked, calculated as the GDP divided by the total number of hours worked during the year IS: added value per worked hour (measured in constant euros) (S: MTAS e INE, Av: region and sector, 2001-2004) C: average annual output per worker IEC: annual labour productivity, calculated as GDP per person employed; GDP per head of population in purchasing power parities IS: value added per worker (measured in constant euros) (S: MTAS and INE, Av: region and sector, 2001-2004) C: average annual living standards per head of population – taking account of the rate of employment and the dependency ratio IEC: economic dependency ratio, calculated as aged 15+unemployed people as a percentage of total employment IS: value added per capita (S: INE, Av: region and sector, 2001-2004); economic dependence ratio (nonworkers over 15 / total employment) (S: INE and EPA, Av: region, 2001-2004)
Research Institute of Applied Economics Working Paper 2009/17, pàg. 5 Regional Quantitative Analysis Research Group Working Paper 2009/06, pag. 5