Budget Watch 2020.pdf - Parliament of Kenya
73
REPUBLIC OF KENYA PARLIAMENTARY SERVICE COMMISSION Parliamentary Budget Office Budget Watch for 2020/21 and the Medium Term September 2020 |Edition No. 13 THE CLOUDS ARE GATHERING AS THE WINDS BLOW AWAY THE PANDEMIC
-
Upload
khangminh22 -
Category
Documents
-
view
1 -
download
0
Transcript of Budget Watch 2020.pdf - Parliament of Kenya
Budget Watch For 2020/2021 And The Medium Term i
REPUBLIC OF KENYA
PARLIAMENTARY SERVICE COMMISSION
Parliamentary Budget Office
Budget Watch for 2020/21 and the Medium Term
September 2020 |Edition No. 13
THE CLOUDS ARE GATHERING AS THE WINDS
BLOW AWAY THE PANDEMIC

Budget Watch For 2020/2021 And The Medium Term ii
© Parliamentary Budget Office, 2020
For more information, contact:
The Director,
Parliamentary Budget Office
Parliament of the Republic of Kenya
Protection House, 10th Floor
P.O. Box 41842 – 00100 GPO
NAIROBI, KENYA
Tel: +254-20-284-8810
Email: [email protected]
The document can be downloaded from www.parliament.go.ke
13th Edition of the Budget Watch (2020/21)
Disclaimer
The Parliamentary Budget Office (PBO) is a non-partisan professional office of the Parliament of the
Republic of Kenya. The primary function of the Office is to provide professional services in respect of
budget, finance and economic information to committees of Parliament.
Budget Watch For 2020/2021 And The Medium Term iii
Key Contributors
The 13th edition of the Budget Watch was prepared by a team under the leadership and guidance of
Phyllis Makau (Director, Parliamentary Budget Office); and close supervision from Martin Masinde
(Senior Deputy Director and Head of Macroeconomic Analysis and Statistics Department), Robert Nyaga
(Deputy Director and Head of Budget Analysis and Expenditure Review Department) and Lucy Makara
(Deputy Director and Head of Tax Analysis and Inter-fiscal Relations Department).
The key contributors were the following: Millicent Makina, Josephat Motonu, Dr. Abel Nyagwachi, Chacha
Machage, Danson Kachumbo, Edison Odhiambo, Eric Kanyi, Abdinasir Moge, Robert Ng’etich,
Abdirahman Gorod and Ali Salat Hussein.
The Budget Watch disseminates findings by the Parliamentary Budget Office on key issues regarding implementation of the
budget estimates in a particular financial year. The 13th edition of the Budget Watch has been prepared to facilitate monitoring
of the budget for the financial year 2020/2021 by the Legislature and other stakeholders. The findings, interpretations and
conclusions expressed in this publication are entirely those of the authors. They do not necessarily represent the views of the
Parliament of the Republic of Kenya.
This report is available at the Parliament’s website (www.parliament.go.ke)
List of Acronyms and Abbreviations ASAL Arid and Semi-Arid Land
Budget Watch For 2020/2021 And The Medium Term iv
ADB African Development Bank
ADP Annual Development Plan
BPS Budget Policy Statement
CBK Central Bank of Kenya
CFS Consolidated Fund Services
CFSP County Fiscal Strategy Plan
CoB Controller of Budget
ERS Economic Recovery Strategy
FY Financial Year
GDP Gross Domestic Product
GOK Government of Kenya
HELB Higher Education Loans Board
ICT Information, Communication and Technology
KM Kilometres
KNBS Kenya National Bureau of Statistics
KPIs Key Performance Indicators
KPLC Kenya Power and Lighting Company
KSHS Kenya Shillings
MDAs Ministries, Departments and Agencies
MoU Memorandum of Understanding
MSE Micro and Small Enterprise
MT Metric Tonnes
MTDS Medium Term Debt Management Strategy
NHIF National Hospital Insurance Fund
NMS Nairobi Metropolitan Services
NSE Nairobi Securities Exchange
OVCs Orphans and Vulnerable Children
PBO Parliamentary Budget Office
PMI Purchasing Manager Index
PWDs People with disabilities
REREC Rural Electrification and Renewable Energy Corporation
SEZ Special Economic Zone
SMEs Small and Medium Enterprises
TVET Technical and Vocational Education and Training
UHC Universal Health Coverage
US United States
VAT Value Added Tax
VTC Vocational Training Centre
Table of Contents
List of Acronyms and Abbreviations ...................................................................................................iii
List of Figures .........................................................................................................................................v
Budget Watch For 2020/2021 And The Medium Term v
List of Tables .........................................................................................................................................vi
Chapter One: ...........................................................................................................................................1
Macroeconomic Context and Revenue Outlook ..................................................................................1
1.0. Global economic downturn: can the 2020/2021 budget steer the economy through the stormy
waters? ................................................................................................................................................................2
1.1. Macroeconomic context of the 2020/2021 budget .............................................................................3
1.1.3. Risks to the macro-economic outlook ...........................................................................................4
1.2. Revenue prospects during the COVID-19 pandemic .........................................................................9
1.3. Debt Management for FY 2020/2021 and the Medium Term ...........................................................19
1.4. Monetary Policy ..................................................................................................................................23
Chapter Two:.........................................................................................................................................28
Enhancing efficiency and effectiveness through budget implementation ......................................28
2.0. Introduction .........................................................................................................................................29
2.1. Social Sector .......................................................................................................................................30
2.2. Infrastructure .......................................................................................................................................38
2.3. Food Security to all Kenyans .............................................................................................................42
2.4. Manufacturing .....................................................................................................................................46
Chapter Three: ......................................................................................................................................51
Enhancing Equity, transparency and accountability to achieve the devolution dream .................51
3.0. Introduction .........................................................................................................................................52
3.1. Do counties get what they need or what is available? ....................................................................52
3.2. Accountability and transparency in budget implementation .........................................................55
3.3. Enhancing Transparency through Public participation ..................................................................56
References ............................................................................................................................................58
Annexes ................................................................................................................................................60
List of Figures Figure 1: Agricultural Exports ...............................................................................................................................6
Figure 2: Total Diaspora Remittances (USD ‘000) ...............................................................................................7

Budget Watch For 2020/2021 And The Medium Term vi
Figure 3: Exchange rate Ksh/US$ .........................................................................................................................7
Figure 4: Performance of the Nairobi Securities Exchange ...............................................................................8
Figure 5: Ordinary revenue performance ...........................................................................................................10
Figure 6: Income tax projections ........................................................................................................................12
Figure 7: VAT revenue projections .....................................................................................................................12
Figure 8: Excise duty projections .......................................................................................................................13
Figure 9: National Debt Stock, FY 2009-10 to FY 2023-24 (Ksh. Millions) .......................................................19
Figure 10: Fiscal Deficit as a percentage of GDP ..............................................................................................20
Figure 11: Money Supply, March 2018 – March 2020 (Kshs. Billions) ............................................................21
Figure 12: Incurred External Debt Commitment Fees.......................................................................................21
Figure 13: Commercial Weighted Interest Rates (Lending rate vs. Deposit rate) January 2017 to May 2020
................................................................................................................................................................................24
Figure 14: The Interbank Rate, 91 T-Bill and 182 T-Bill yields, January 2017 to June 2020..........................24
Figure 15: Annual Growth rate of credit to the private sector vs. Government, Jan 2017 to May 2020 ......25
Figure 16: Gross Loans vs. Non-performing Loans..........................................................................................26
Figure 17: Fiscal Deficit vs. Domestic Borrowing .............................................................................................26
Figure 18: Analysis of annual revenues vs. operational expenditures of the Standard Gauge Railway
(SGR) from June 2017 to May 2020.....................................................................................................................38
Figure 19: production of selected crops (Millions of bags) .............................................................................43
Figure 20: Manufacturing annual growth rates and contribution to GDP .......................................................46
Figure 21: Growth in Quantum Indices of Manufacturing Production, 2013 - 2018 .......................................47
Figure 22: what public participation entails.......................................................................................................56
List of Tables Table 1: Ordinary revenue performance FY 2019/2020 .....................................................................................10 Table 2: Revenue projections by the National Treasury...................................................................................11 Table 3: FY 2020/2021 Deficit Financing Framework (Ksh. Billions) ...............................................................22 Table 4: Public Debt Servicing Expenses (Kshs. Millions) ..............................................................................23 Table 5: Summary of Budgetary Allocation in Kshs. Billions ..........................................................................29 Table 6: Analysis of Outputs and Key Performance Indicators .......................................................................29 Table 7: Priority areas funded in 2020/2021 .......................................................................................................31 Table 8: COVID-19 economic stimulus programme for the sector ..................................................................32 Table 9: Capital projects targeted for completion in 2020/2021 ......................................................................33 Table 10: Key strategic interventions in the Ministry of Health Budget .........................................................34 Table 11: Summary of key priority programmes and projects for the FY 2020/21.........................................36 Table 12: programmes and priority projects as well as expected KPIs for monitoring/oversight ...............39 Table 13: Importation of food in Kenya ..............................................................................................................43 Table 14: Key Projects Supporting Manufacturing IN Kshs. Millions .............................................................48 Table 15: County Equitable Share and allocation to National sectors as a share of GDP ............................53 Table 16: The annual budget preparation and approval process ....................................................................54 Table 17: Counties revenue targets, actual and potential for 2013/14 to 2019/20..........................................55

Budget Watch For 2020/2021 And The Medium Term 1
Chapter One:
Macroeconomic Context and Revenue Outlook
“The pandemic will end eventually, but its impact on the economy will persist long after to remind us of
the poor investments we have made in the health sector”
Budget Watch For 2020/2021 And The Medium Term 2
1.0. Global economic downturn: can the 2020/2021 budget steer the economy through
the stormy waters?
The 2020/2021 budget is a crisis budget that must balance between mitigating the socio-economic
impact of a health pandemic while still providing adequately for existing administrative and
economic needs. This budget is being implemented at a time when the economy is navigating uncharted
waters on account of the COVID-19 pandemic. This is a challenging context for the government given
the highly uncertain economic outlook of the country and the expected impact on revenue performance.
Though the government has set aside funds in the budget to mitigate the adverse effects of COVID-19
on the economy, a worsening of the crisis could easily weaken the economy further thereby constraining
the fiscal space and reducing the ability of the government to respond adequately to the crisis.
The 2020/2021 budget has proposed a stimulus package to alleviate the economic burden of the
health crisis particularly on the vulnerable households. However inherent accountability issues
may hinder the achievement of targeted results of this stimulus. The eight point economic stimulus
programme contained in this budget is expected to cushion vulnerable citizens and businesses adversely
affected by the COVID-19 pandemic. It proposes several interventions which include the following:
rehabilitation of access roads and foot bridges, wells, water pans and underground tanks in ASAL areas;
the Kazi Mtaani programme for unemployed youths; improving education outcomes through the
improvement of infrastructure, increased capitation and recruitment of intern teachers; provision of
affordable credit to businesses; fast-tracking payment of VAT refunds and pending bills; purchase of
locally assembled vehicles to safeguard jobs; tourism promotion as well as interventions under agriculture
and food security. Furthermore, the 2020/2021 budget also provides an allocation of Kshs.4.3 billion for
the hunger safety net programme.
The loss of income occasioned by the COVID -19 pandemic has been significant and the proposed
interventions, while useful, may not fully alleviate the economic burden particularly in vulnerable
households. Indeed, even before the pandemic struck, unemployment was high in the country especially
for the youth; many poor people especially the urban poor with little income were already skipping meals
and serving short term menial jobs; the health sector was ill-equipped; the SMEs were struggling to
survive and access credit from banks and the country as a whole was not and has never been food
secure. The pandemic has therefore simply worsened an already existing dire situation and exposed the
soft underbelly of the country’s economic growth story. Despite the country’s relatively reasonable
economic growth over the past few years, it has failed to translate into meaningful and reliable
employment opportunities for the youth resulting in short term unsustainable interventions such as the
Kazi kwa Vijana programme and now the Kazi Mtaani initiative. These programmes offer small stipends
to the youth in exchange for short term menial jobs that do not translate into meaningful, employable
skills. In addition, the budgetary allocation of Ksh. 4.3 billion for the hunger safety net programme is
simply not adequate to alleviate the needs of those experiencing financial distress, given the prevailing
statistics on the impact of COVID-19 on households.
Significant interventions have been carried out to strengthen the healthcare system– but gaps
still exist. In the Budget Statement for 2020/2021, the Cabinet Secretary of the National Treasury
reported that in response to the pandemic, the government was implementing the following interventions
in healthcare: Kshs.1.2 billion for the recruitment of an additional cohort of 5,000 healthcare workers to

Budget Watch For 2020/2021 And The Medium Term 3
support local health staff for a period of one year; Kshs. 500 million to supply 20,000 locally made beds
and beddings to public hospitals; and Kshs. 25 million to support the establishment of 50 modern
walkthrough sanitizers at border points and main hospitals across the country. This is in addition to other
resource allocations to various sub-sectors under health as well as all public hospitals in order to improve
the functionality of the health sector.
Concern over alleged misuse of COVID-19 funds is hampering the fight against the pandemic. A
recent report by the Ministry of Health giving a breakdown of how the COVID-19 funds have been utilized
stirred controversy as members of the public questioned the costs of some of the procured/leased items.
The perception that the emergency funds are being misused is a blow to the fight against the pandemic
as it has generated mistrust and apathy among the citizens with some downplaying the gravity of the
pandemic or dismissing it altogether. In times of emergency, misuse of funds can happen due to lack of
adequate time to carry out proper scrutiny. It is important for the legislature to continually demand full
disclosure, transparency and accountability and periodically review the use of the COVID-19 funds
especially those outside the budget process, in order to ensure that the intended purpose is served. A
forensic audit of funds spent towards this pandemic since March to end of August will re-assure Kenyans
and those who contributed funds for this emergency of accountability.
1.1. Macroeconomic context of the 2020/2021 budget
1.1.1. Global economic outlook
A global recession is looming due to severe disruptions brought about by COVID-19 containment
measures which have significantly weakened economic activity. Supply and demand shocks
brought about by total/partial lockdowns and other directives aimed at ensuring social distancing is upheld
are expected to reduce consumption, investment, and hamper both domestic and international trade [1,2].
As a result, some projections have indicated that the looming global recession may be greater than the
global financial crisis. The IMF is projecting a global GDP contraction of -4.9% in 2020 whereas the World
Bank is projecting a contraction of -5.2%. It should be noted that even before the COVID-19 pandemic
erupted, the global economic outlook was lacklustre, with a modest growth forecast estimated at 2.51 to
3.3%2 for 2020 – and these were downgrades from previous forecasts. The COVID-19 pandemic has
therefore significantly worsened an already bad situation.
Sub-Saharan Africa which escaped the worst of the global financial crisis is projected this year
to go into its first recession in 25 years [1].The African Development Bank (AfDB) projects that Africa’s
economy is likely to contract in 2020 as a result of the ongoing health crisis. The continent’s real GDP is
expected to contract by between 1.7% and 3.4% in 2020 as opposed to the pre-Covid-19 projection of
3.9% growth. The revised projections suggest that Africa will experience GDP losses of between $145.5
billion and $189.7 billion. The worst affected economies will be those that rely on commodity exports,
tourism, volatile financial flows and those with high debt burdens [2]. It is estimated that between 25
million to 30 million jobs in Africa could be lost as a result of the Covid-19 pandemic [2]. Informal sector
1 World Bank projections, January 2020 Global Economic Prospects Report 2 IMF Projections, World Economic Outlook, January 2020
Budget Watch For 2020/2021 And The Medium Term 4
jobs, accounting for 89% of all employment in sub-Saharan Africa, are likely to be the worst affected by
the Covid-19 pandemic [5].
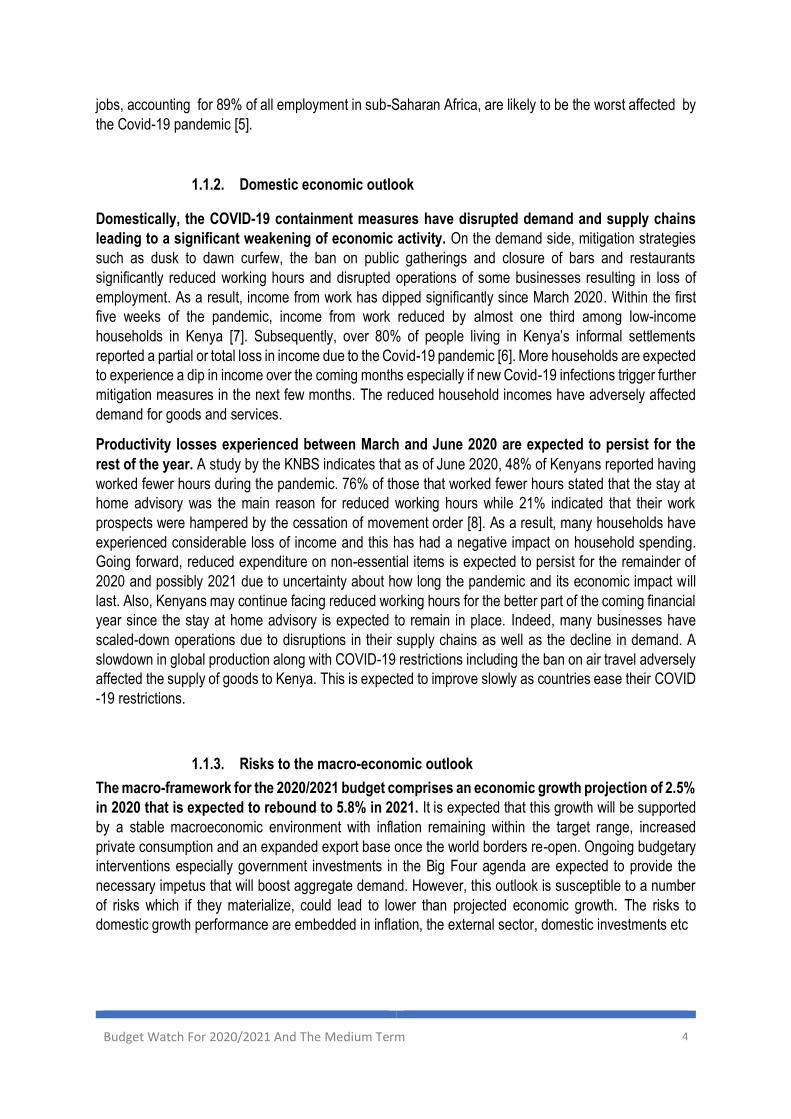
1.1.2. Domestic economic outlook
Domestically, the COVID-19 containment measures have disrupted demand and supply chains
leading to a significant weakening of economic activity. On the demand side, mitigation strategies
such as dusk to dawn curfew, the ban on public gatherings and closure of bars and restaurants
significantly reduced working hours and disrupted operations of some businesses resulting in loss of
employment. As a result, income from work has dipped significantly since March 2020. Within the first
five weeks of the pandemic, income from work reduced by almost one third among low-income
households in Kenya [7]. Subsequently, over 80% of people living in Kenya’s informal settlements
reported a partial or total loss in income due to the Covid-19 pandemic [6]. More households are expected
to experience a dip in income over the coming months especially if new Covid-19 infections trigger further
mitigation measures in the next few months. The reduced household incomes have adversely affected
demand for goods and services.
Productivity losses experienced between March and June 2020 are expected to persist for the
rest of the year. A study by the KNBS indicates that as of June 2020, 48% of Kenyans reported having
worked fewer hours during the pandemic. 76% of those that worked fewer hours stated that the stay at
home advisory was the main reason for reduced working hours while 21% indicated that their work
prospects were hampered by the cessation of movement order [8]. As a result, many households have
experienced considerable loss of income and this has had a negative impact on household spending.
Going forward, reduced expenditure on non-essential items is expected to persist for the remainder of
2020 and possibly 2021 due to uncertainty about how long the pandemic and its economic impact will
last. Also, Kenyans may continue facing reduced working hours for the better part of the coming financial
year since the stay at home advisory is expected to remain in place. Indeed, many businesses have
scaled-down operations due to disruptions in their supply chains as well as the decline in demand. A
slowdown in global production along with COVID-19 restrictions including the ban on air travel adversely
affected the supply of goods to Kenya. This is expected to improve slowly as countries ease their COVID
-19 restrictions.
1.1.3. Risks to the macro-economic outlook
The macro-framework for the 2020/2021 budget comprises an economic growth projection of 2.5%
in 2020 that is expected to rebound to 5.8% in 2021. It is expected that this growth will be supported
by a stable macroeconomic environment with inflation remaining within the target range, increased
private consumption and an expanded export base once the world borders re-open. Ongoing budgetary
interventions especially government investments in the Big Four agenda are expected to provide the
necessary impetus that will boost aggregate demand. However, this outlook is susceptible to a number
of risks which if they materialize, could lead to lower than projected economic growth. The risks to
domestic growth performance are embedded in inflation, the external sector, domestic investments etc

Budget Watch For 2020/2021 And The Medium Term 5
Inflation
Though Inflation has remained broadly within target and was estimated at 4.59% in June, 2020, it
is still a key factor to watch for due to the expected impact on vulnerable households. So far,
declining demand and reduced money in circulation due to reduced economic activity has resulted in
manageable inflation levels. The estimated inflation rate of 4.36 percent in July 2020 is a reduction from
the June inflation rate of 4.59 percent mostly on account of a reduction in food prices as well as lower
cost of water vendor services, house maintenance and some house rents. Going forward, the biggest
risk to inflation is likely to emanate from fuel prices, desert locust upsurge, below average rainfall and the
ongoing health crisis.
The current fuel price dynamics pose a significant risk to inflation. In July 2020, the Energy
Regulatory Authority announced higher fuel prices, citing the recovery of crude oil prices as well as the
increase in the petrol levy from Ksh.0.4 to Ksh.5.40. The easing of travel restrictions and phased
reopening of most economies including the resumption of air travel is expected to increase demand for
oil. International crude oil prices have improved significantly since May 2020 and by early July, were
estimated to average 43 dollars per barrel3. Fuel is a major component in production and transportation
and may, therefore, increase the price of goods and the cost of transportation. Higher diesel prices will
also result in higher electricity prices due to the fuel levy component thereby increasing production costs.
Notably, Kenya’s petroleum pricing system has not been very responsive to changes in global oil prices.
Benefits of low global crude oil prices are rarely passed on to the consumer due to many other factors
such as levies and taxes determining the pricing of fuel.
Though the population of the desert locusts has declined, they still remain a threat in some
counties particularly in the Northern region. The food and agriculture organization (FAO) indicated
that by mid-July, less than 5% of the desert locust swarms would be remaining in the country as most
were likely to migrate northwards into Ethiopia and South Sudan, facilitated by the prevailing winds.
However, with the change of winds during the October – December short rains season, there is risk of
re-invasion of the desert locusts from Ethiopia, Somalia and Yemen into Kenya.
Below average October to December rainfall is likely to adversely affect food security outcomes.
According to information provided by the famine early warning systems network, seasonal forecasts
project a likelihood of below average rainfall during the October-December short rains season as well as
the March – May 2021 long rains season4. Furthermore, the floods that occurred during the March to May
long rains season delayed planting in some areas and destroyed crops and eroded soil in other areas.
Thus food production from this season may be slightly below average. This will have an adverse impact
on food security outcomes in late 2020 and early 2021 and is likely to lead to increased food prices
thereby increasing headline inflation.
External sector
The export sector appears to have largely withstood the effects of COVID-19 in the second quarter
of 2020. Available statistics from the KNBS indicate that the value of total exports increased from
Ksh.43.20 billion in April 2020 to Ksh. 48.5 billion in June 2020. This is however a slight
underperformance compared to the performance in 2019 of Ksh. 48.8 billion in April to Ksh.51.2 billion in
3 Oil Market Report 4 https://fews.net/east-africa/kenya/food-security-outlook/june-2020

Budget Watch For 2020/2021 And The Medium Term 6
June. The KNBS statistics indicate that Food and beverages accounted for 49.4 percent of total exports
whereas non-food industrial supplies accounted for 26.35 percent of total exports by end of June 2020.
Horticultural exports underperformed in the second quarter of 2020, but the decline was only
moderate. Between March and May 2020, the combined value of key agricultural exports such as tea,
coffee, cut-flowers and vegetables was only about Kshs. 10 billion below its 2019 value. Available
statistics reveal a significant increase in earnings for tea from March to May compared to a similar period
in 2019. Tea earnings are reported to have increased by approximately Ksh. 8.3 billion between March
and May compared to the same period in 2019. Fruits and vegetables also registered increased earnings
in the same period by Kshs.4.5 billion and 370 million respectively compared to a similar period in 2019.
On the other hand, the flower industry seems to have borne the brunt of the pandemic and registered a
decline by Ksh. 4.4 billion in April and May compared to a similar period in 2019. Coffee also registered
a slight decline in earnings by Ksh. 177 million between March and May compared to a similar period in
20195.
Figure 1: Agricultural Exports
Source of Data: Kenya National Bureau of Statistics
Going forward, the risks to the export sector are likely to emanate from factors that will affect
crop production such as below average rainfall performance and a desert locust upsurge. Kenya’s
exports are largely agricultural and any factors adversely affecting agricultural production will significantly
affect exports. Since agricultural exports are the main alternative for earning foreign exchange in the
coming financial year, the poor performance of this sector will directly impact foreign reserves which are
needed to cover foreign debt repayment.
The decline in remittances is set to disproportionately affect poorer households who rely on them
for household consumption, investment and accumulation of savings [12–14]. During the
pandemic, 80% of surveyed households have reported that cash remittances they have received have
been below pre-pandemic levels with 40% reporting remittances had decreased significantly[8]. The
expected decline in remittances from abroad which stand at about 3% of GDP and had replaced Kenya’s
principal domestic exports such as tea and international tourism as the main source of foreign exchange
is expected to negatively impact foreign reserves which are needed to cover the increasing foreign debt
5 KNBS, Leading Economic Indicators, May 2020
0
10,000
20,000
30,000
40,000
50,000
60,000
70,000
80,000
90,000
100,000
Mar to May 2018 Mar to May 2019 Mar to May 2020
Val
ue
Ksh
s. M
illio
ns
Tea Coffee (not roasted) Cut-flowers Vegetables

Budget Watch For 2020/2021 And The Medium Term 7
repayment. Between March and May 2020 diaspora remittances declined by US$ 15 million relative to
a similar period in 2019 see figure 2.
Figure 2: Total Diaspora Remittances (USD ‘000)
Source of Data: Central Bank of Kenya
Dwindling diaspora remittances are expected to worsen as countries in North America and Europe, the
source of about 80% of Kenya’s remittances, go into recession. A drop in diaspora remittances coupled
with the slump in international tourism has left agricultural exports as the main alternative for earning
foreign exchange.
Subdued exports and diaspora remittances, coupled with the increasing demand for US dollars globally
as investors shy away from uncertainty associated with the impact of the Covid-19 pandemic on other
riskier assets, has contributed to the depreciation of the Kenya Shilling. Between January 2020 and May
2020, the Kenya shilling depreciated by about 6% (see figure 3). Continued depreciation of the Kenya
Shilling may contribute to higher debt service obligations in the current financial year.
Figure 3: Exchange rate KHz/US$
Source of Data: Central Bank of Kenya
693,058.06
710,478.82
695,178.58
MARCH TO MAY 2018 MARCH TO MAY 2019 MARCH TO MAY 2020
US$
000
96
98
100
102
104
106
108
Jan
-18
Feb
-18
Mar
-18
Ap
r-1
8
May
-18
Jun
-18
Jul-
18
Au
g-18
Sep
-18
Oct
-18
No
v-18
Dec
-18
Jan
-19
Feb
-19
Mar
-19
Ap
r-1
9
May
-19
Jun
-19
Jul-
19
Au
g-19
Sep
-19
Oct
-19
No
v-19
Dec
-19
Jan
-20
Feb
-20
Mar
-20
Ap
r-2
0
May
-20
Month
Ksh/US$
Budget Watch For 2020/2021 And The Medium Term 8
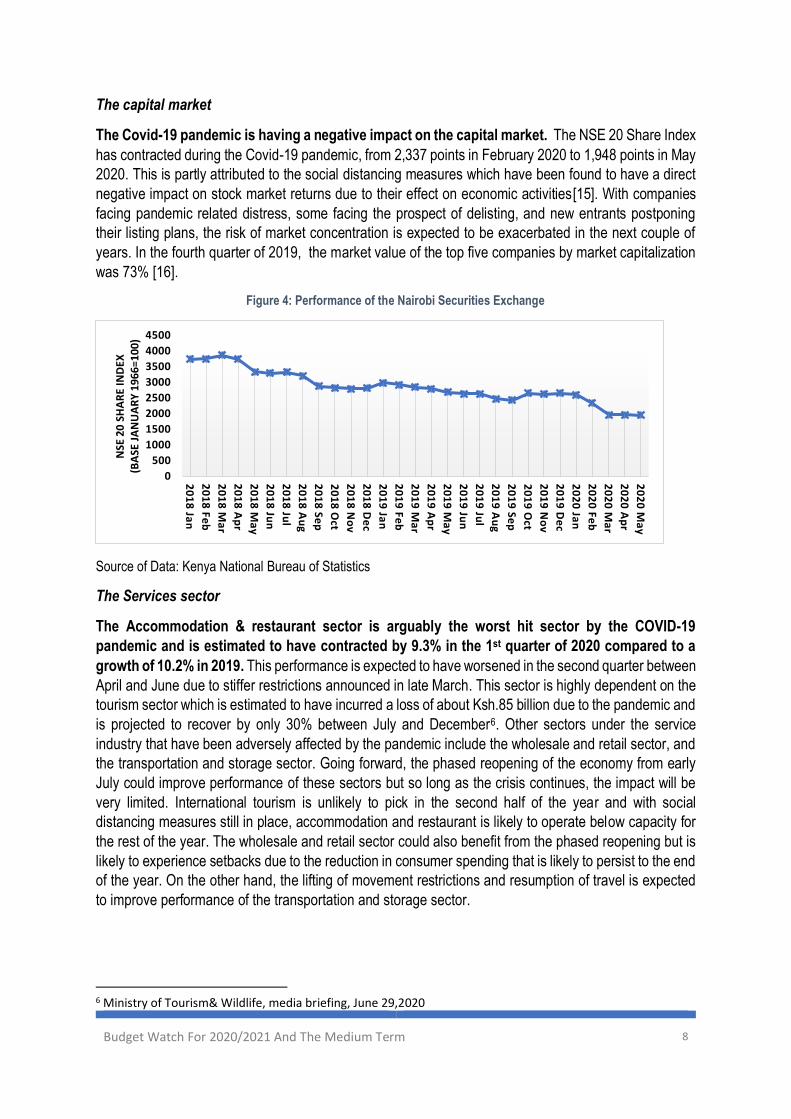
The capital market
The Covid-19 pandemic is having a negative impact on the capital market. The NSE 20 Share Index
has contracted during the Covid-19 pandemic, from 2,337 points in February 2020 to 1,948 points in May
2020. This is partly attributed to the social distancing measures which have been found to have a direct
negative impact on stock market returns due to their effect on economic activities[15]. With companies
facing pandemic related distress, some facing the prospect of delisting, and new entrants postponing
their listing plans, the risk of market concentration is expected to be exacerbated in the next couple of
years. In the fourth quarter of 2019, the market value of the top five companies by market capitalization
was 73% [16].
Figure 4: Performance of the Nairobi Securities Exchange
Source of Data: Kenya National Bureau of Statistics
The Services sector
The Accommodation & restaurant sector is arguably the worst hit sector by the COVID-19
pandemic and is estimated to have contracted by 9.3% in the 1st quarter of 2020 compared to a
growth of 10.2% in 2019. This performance is expected to have worsened in the second quarter between
April and June due to stiffer restrictions announced in late March. This sector is highly dependent on the
tourism sector which is estimated to have incurred a loss of about Ksh.85 billion due to the pandemic and
is projected to recover by only 30% between July and December6. Other sectors under the service
industry that have been adversely affected by the pandemic include the wholesale and retail sector, and
the transportation and storage sector. Going forward, the phased reopening of the economy from early
July could improve performance of these sectors but so long as the crisis continues, the impact will be
very limited. International tourism is unlikely to pick in the second half of the year and with social
distancing measures still in place, accommodation and restaurant is likely to operate below capacity for
the rest of the year. The wholesale and retail sector could also benefit from the phased reopening but is
likely to experience setbacks due to the reduction in consumer spending that is likely to persist to the end
of the year. On the other hand, the lifting of movement restrictions and resumption of travel is expected
to improve performance of the transportation and storage sector.
6 Ministry of Tourism& Wildlife, media briefing, June 29,2020
0
500
1000
1500
2000
2500
3000
3500
4000
4500
20
18
Jan
20
18
Feb
20
18
Ma
r
20
18
Ap
r
20
18
Ma
y
20
18
Jun
20
18
Jul
20
18
Au
g
20
18
Sep
20
18
Oct
20
18
No
v
20
18
De
c
20
19
Jan
20
19
Feb
20
19
Ma
r
20
19
Ap
r
20
19
Ma
y
20
19
Jun
20
19
Jul
20
19
Au
g
20
19
Sep
20
19
Oct
20
19
No
v
20
19
De
c
20
20
Jan
20
20
Feb
20
20
Ma
r
20
20
Ap
r
20
20
Ma
y
NSE
20
SHA
RE
IND
EX
(BA
SE J
AN
UA
RY
19
66
=1
00
)

Budget Watch For 2020/2021 And The Medium Term 9
In view of the foregoing, is the economic growth outlook feasible?
Due to the fluidity of the ongoing situation, it is difficult to accurately predict economic growth performance
for 2020. The outcome will largely depend on the length and depth of the crisis. A surge in infections
without a breakthrough in medical interventions may trigger stiffer COVID-19 containment measures in
the course of the year. Furthermore, the situation is still evolving for some businesses and the impact of
the early COVID-19 containment restrictions continues to be felt particularly in the accommodation and
restaurant sector. Production is likely to remain muted due to declined demand and investment prospects
are likely to be kept on hold pending outcome of the crisis. This will further exacerbate the impact of job
losses on livelihoods.
In view of the foregoing, the projected real GDP growth for 2020 is between 1% and 2%7. This is
nonetheless an improvement from the previous forecast of -1.5% to 1% in April 2020 due to the general
easing of COVID-19 restrictions which have brought about a slight improvement in business activity as
illustrated by the PMI index; and the better than expected performance of the country’s agricultural
exports.
Despite the economic burden presented by the health pandemic, the situation has presented an
opportunity for the country to boost the local industries. Given the unprecedented demand for
Personal Protective Equipment (PPEs) such as masks, gloves and gowns for the protection of frontline
healthcare workers as well as the general public, many apparel manufacturers including SMEs in the
Textiles and Apparel sector have taken to producing fabric masks and protective gowns to deal with the
pandemic. Notably, RIVATEX in Eldoret and KICOTEC in Kitui have stepped up production of face masks
and are receiving support from the government through the COVID-19 fund to enable continued
production. Other local industries such as Haco industries are producing hand sanitisers. This is a
significant boost to the manufacturing industry in Kenya and could potentially alleviate, to a small extent,
the increasing unemployment problem. Going forward, this new capacity can be expanded to enable the
country reduce its reliance on imported goods.
Keep an Eye On:
i. Re-introduction of stiffer COVID-19 containment restrictions – A worsening of the crisis
could lead to reintroduction of stiffer restrictions leading to a further deterioration of economic
activity. Ideally, an effective COVID-19 containment strategy should entail high level of
testing, isolation and treatment as well as effective containment of vulnerable populations to
mitigate severity of impact.
ii. Global economic performance – A recession particularly in the country’s trading partners
is likely to adversely affect demand for Kenyan exports. Furthermore, tourism inflows and
diaspora remittances may decline significantly if the economies of the source countries are
hard hit by the pandemic thereby reducing the country’s foreign exchange reserves.
1.2. Revenue prospects during the COVID-19 pandemic
1.2.1. Tax Revenue
In the past, the National Treasury has consistently set unattainable revenue targets at the start of
each Financial Year. To illustrate, in FY 2019/2020, the revenue target set in the printed budget
7 PBO projections

Budget Watch For 2020/2021 And The Medium Term 10
estimates was Kshs. 1.88 trillion. This was initially revised to Kshs.1.84 trillion during the first
supplementary budget then was further revised downwards to Khs.1.64 trillion during second
supplementary budget. However, as of June 2020, ordinary revenue collected during FY 2019/20 stood
at Kshs.1.58 trillion. This is Kshs. 300 billion (16%) below the target that was set at the beginning of the
financial year.
Table 1: Ordinary revenue performance FY 2019/2020
2019/2020 Ordinary revenue performance
Printed
Estimates
(Kshs.)
Supplementary
Budget I (Kshs.)
Supplementary
Budget II (Kshs.)
Actual receipts as of
30th June 2020 (Kshs.)
Total
Ordinary
Revenue 1,877,176,497,191 1,843,812,537,631 1,643,400,000,000 1,575,195,550,892.39
Figure 5: Ordinary revenue performance
Revenue is expected to underperform in the current financial year. The National Treasury projects
that ordinary revenue will decline from Kshs. 1,643.4 billion (16.1% of GDP) billion in 2019/20 (revised
estimates II) to Kshs. 1,621.4 billion (14.4% of GDP) in 2020/21. A number of revenue enhancement
measures have been introduced which could potentially mitigate the anticipated revenue decline. The
recent tax policy changes which introduced new taxes and removed many hitherto, as well as existing
tax incentives in the tax system are discussed elsewhere in this paper.
0
200,000
400,000
600,000
800,000
1,000,000
1,200,000
1,400,000
1,600,000
1,800,000
2,000,000
2015/2016 2016/2017 2017/2018 2018/2019 2019/2020*
Ksh
. M
illio
n
Printed Estimates Actual
Budget Watch For 2020/2021 And The Medium Term 11
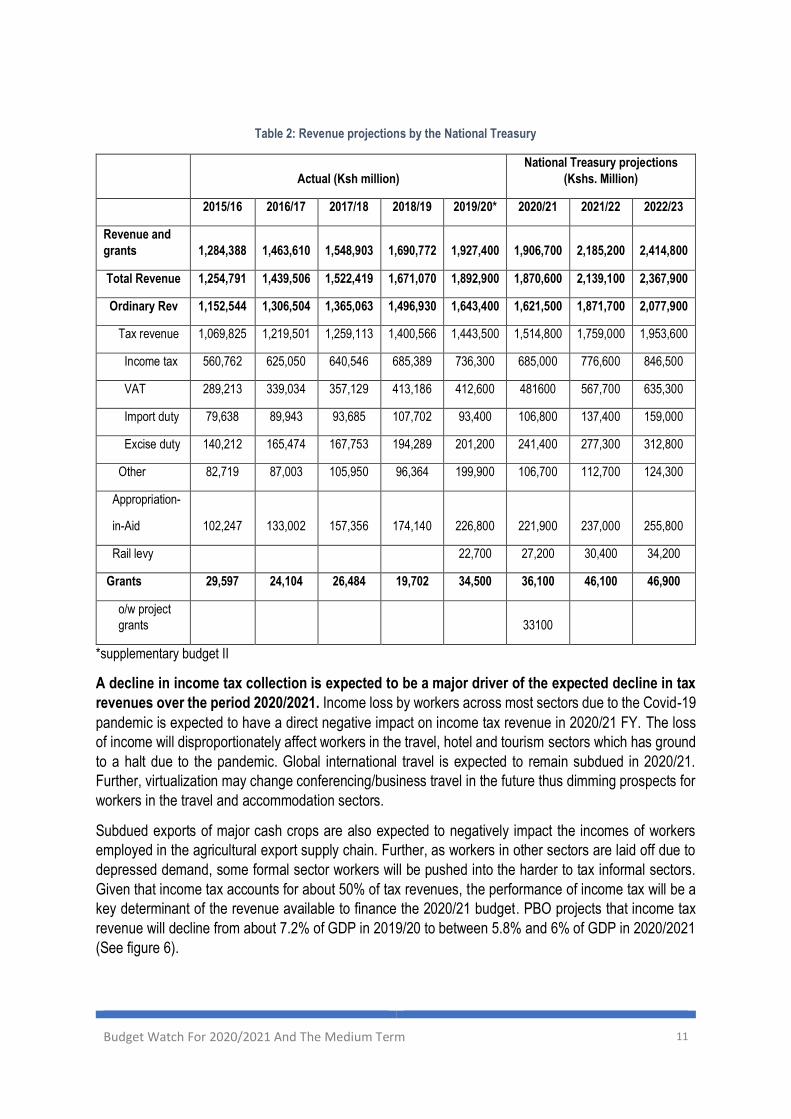
Table 2: Revenue projections by the National Treasury
Actual (Ksh million)
National Treasury projections
(Kshs. Million)
2015/16 2016/17 2017/18 2018/19 2019/20* 2020/21 2021/22 2022/23
Revenue and
grants 1,284,388 1,463,610 1,548,903 1,690,772 1,927,400 1,906,700 2,185,200 2,414,800
Total Revenue 1,254,791 1,439,506 1,522,419 1,671,070 1,892,900 1,870,600 2,139,100 2,367,900
Ordinary Rev 1,152,544 1,306,504 1,365,063 1,496,930 1,643,400 1,621,500 1,871,700 2,077,900
Tax revenue 1,069,825 1,219,501 1,259,113 1,400,566 1,443,500 1,514,800 1,759,000 1,953,600
Income tax 560,762 625,050 640,546 685,389 736,300 685,000 776,600 846,500
VAT 289,213 339,034 357,129 413,186 412,600 481600 567,700 635,300
Import duty 79,638 89,943 93,685 107,702 93,400 106,800 137,400 159,000
Excise duty 140,212 165,474 167,753 194,289 201,200 241,400 277,300 312,800
Other 82,719 87,003 105,950 96,364 199,900 106,700 112,700 124,300
Appropriation-
in-Aid 102,247 133,002 157,356 174,140 226,800 221,900 237,000 255,800
Rail levy 22,700 27,200 30,400 34,200
Grants 29,597 24,104 26,484 19,702 34,500 36,100 46,100 46,900
o/w project
grants 33100
*supplementary budget II
A decline in income tax collection is expected to be a major driver of the expected decline in tax
revenues over the period 2020/2021. Income loss by workers across most sectors due to the Covid-19
pandemic is expected to have a direct negative impact on income tax revenue in 2020/21 FY. The loss
of income will disproportionately affect workers in the travel, hotel and tourism sectors which has ground
to a halt due to the pandemic. Global international travel is expected to remain subdued in 2020/21.
Further, virtualization may change conferencing/business travel in the future thus dimming prospects for
workers in the travel and accommodation sectors.
Subdued exports of major cash crops are also expected to negatively impact the incomes of workers
employed in the agricultural export supply chain. Further, as workers in other sectors are laid off due to
depressed demand, some formal sector workers will be pushed into the harder to tax informal sectors.
Given that income tax accounts for about 50% of tax revenues, the performance of income tax will be a
key determinant of the revenue available to finance the 2020/21 budget. PBO projects that income tax
revenue will decline from about 7.2% of GDP in 2019/20 to between 5.8% and 6% of GDP in 2020/2021
(See figure 6).
Budget Watch For 2020/2021 And The Medium Term 12
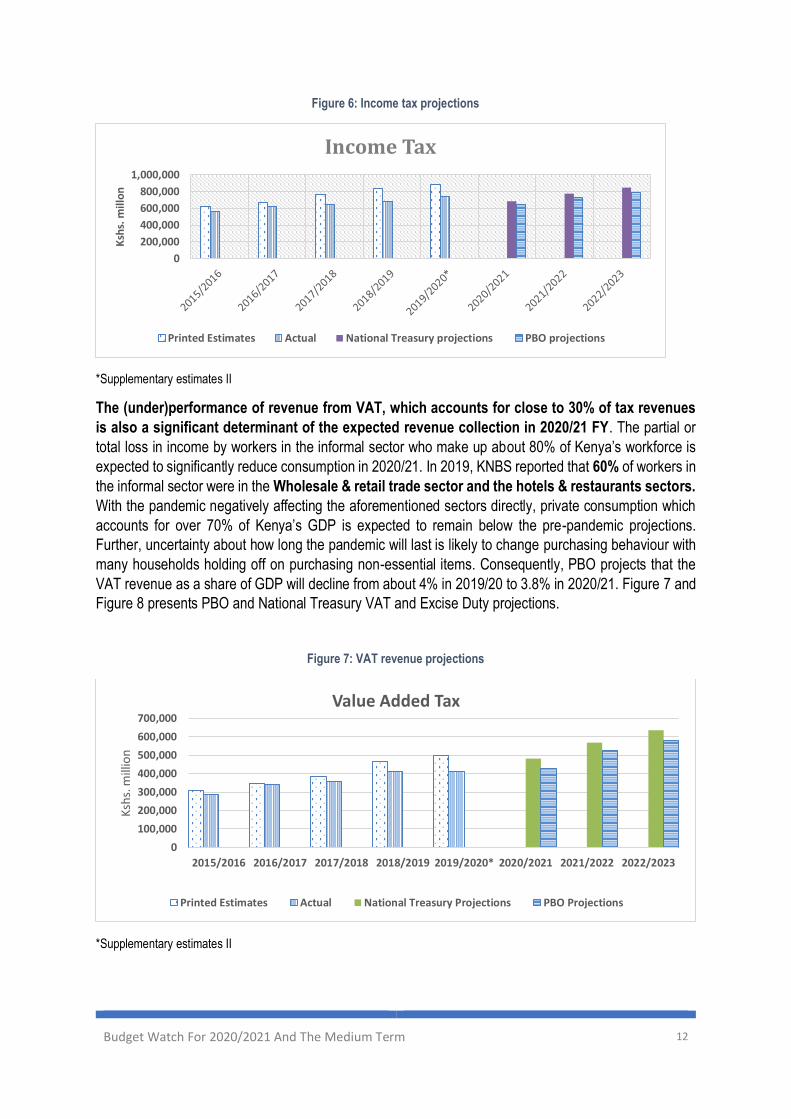
Figure 6: Income tax projections
*Supplementary estimates II
The (under)performance of revenue from VAT, which accounts for close to 30% of tax revenues
is also a significant determinant of the expected revenue collection in 2020/21 FY. The partial or
total loss in income by workers in the informal sector who make up about 80% of Kenya’s workforce is
expected to significantly reduce consumption in 2020/21. In 2019, KNBS reported that 60% of workers in
the informal sector were in the Wholesale & retail trade sector and the hotels & restaurants sectors.
With the pandemic negatively affecting the aforementioned sectors directly, private consumption which
accounts for over 70% of Kenya’s GDP is expected to remain below the pre-pandemic projections.
Further, uncertainty about how long the pandemic will last is likely to change purchasing behaviour with
many households holding off on purchasing non-essential items. Consequently, PBO projects that the
VAT revenue as a share of GDP will decline from about 4% in 2019/20 to 3.8% in 2020/21. Figure 7 and
Figure 8 presents PBO and National Treasury VAT and Excise Duty projections.
Figure 7: VAT revenue projections
*Supplementary estimates II
0
200,000
400,000
600,000
800,000
1,000,000
Ksh
s. m
illo
n
Income Tax
Printed Estimates Actual National Treasury projections PBO projections
0
100,000
200,000
300,000
400,000
500,000
600,000
700,000
2015/2016 2016/2017 2017/2018 2018/2019 2019/2020* 2020/2021 2021/2022 2022/2023
Ksh
s. m
illio
n
Value Added Tax
Printed Estimates Actual National Treasury Projections PBO Projections
Budget Watch For 2020/2021 And The Medium Term 13
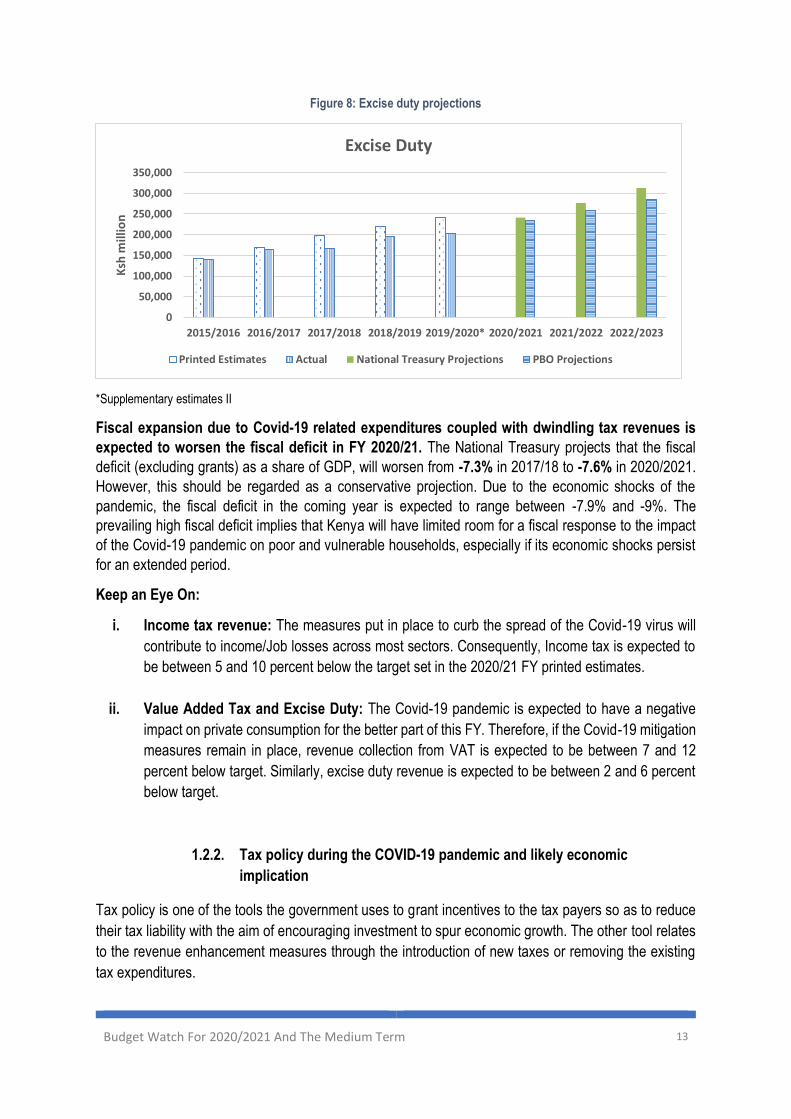
Figure 8: Excise duty projections
*Supplementary estimates II
Fiscal expansion due to Covid-19 related expenditures coupled with dwindling tax revenues is
expected to worsen the fiscal deficit in FY 2020/21. The National Treasury projects that the fiscal
deficit (excluding grants) as a share of GDP, will worsen from -7.3% in 2017/18 to -7.6% in 2020/2021.
However, this should be regarded as a conservative projection. Due to the economic shocks of the
pandemic, the fiscal deficit in the coming year is expected to range between -7.9% and -9%. The
prevailing high fiscal deficit implies that Kenya will have limited room for a fiscal response to the impact
of the Covid-19 pandemic on poor and vulnerable households, especially if its economic shocks persist
for an extended period.
Keep an Eye On:
i. Income tax revenue: The measures put in place to curb the spread of the Covid-19 virus will
contribute to income/Job losses across most sectors. Consequently, Income tax is expected to
be between 5 and 10 percent below the target set in the 2020/21 FY printed estimates.
ii. Value Added Tax and Excise Duty: The Covid-19 pandemic is expected to have a negative
impact on private consumption for the better part of this FY. Therefore, if the Covid-19 mitigation
measures remain in place, revenue collection from VAT is expected to be between 7 and 12
percent below target. Similarly, excise duty revenue is expected to be between 2 and 6 percent
below target.
1.2.2. Tax policy during the COVID-19 pandemic and likely economic
implication
Tax policy is one of the tools the government uses to grant incentives to the tax payers so as to reduce
their tax liability with the aim of encouraging investment to spur economic growth. The other tool relates
to the revenue enhancement measures through the introduction of new taxes or removing the existing
tax expenditures.
0
50,000
100,000
150,000
200,000
250,000
300,000
350,000
2015/2016 2016/2017 2017/2018 2018/2019 2019/2020* 2020/2021 2021/2022 2022/2023
Ksh
mill
ion
Excise Duty
Printed Estimates Actual National Treasury Projections PBO Projections
Budget Watch For 2020/2021 And The Medium Term 14
In order to cushion individuals, corporations and other businesses against the COVID-19 pandemic, the
government introduced various taxation measures, whose likely implication is to reduce targeted tax
liability and also removing many tax incentives inherent in the taxation system in order to enhance
revenue collection, among others. These are discussed hereunder:
i. Introduction of revenue measures to raise additional revenue
The recent policy shift has been leaning towards the introduction of new revenue measures aimed at
raising additional revenue to finance the budget. These include the following:
The introduction of minimum tax: - a new tax under the Income Tax Act, known as minimum tax was
introduced through the Finance Bill, 2020. The tax which comes into effect on 1st of January, 2021 shall
be charged at the rate of 1% of the gross turnover. Ideally, the tax is seeking to enhance fairness and
also facilitate the expansion of the tax base so as to improve on the revenue yield. Advertently, this tax
seems to mainly target businesses in loss making positions by demanding a portion of their turnover.
This tax will ensure that all businesses regardless of profit position, shall contribute to revenue yield either
through the usual Corporate Income Tax in the event of being on a positive profit position or minimum
tax if in a negative profit position. The tax is scheduled to be paid in quarterly instalments on the 20 th day
the Fourth, sixth, ninth and twelfth month of the year of income.
The Digital Service Tax: - this tax was introduced at the rate of 1.5% of the gross transaction value in
the provision of services in the digital market place. The tax is targeted at non-resident persons who do
not have a permanent establishment in Kenya. In the recent days, it is noted that an array of transactions
and business activities have been shifting to the digital platforms. For instance, e-commerce has been
on the rise8 and it is estimated that about 30% of firms in the country are selling their products online. In
2014, the Communication Authority estimated that e-commerce market was about KSh. 4.3 billion. Fast
forward to 2020 and beyond, it is anticipated that with the internet penetration of close to 90%, the outlook
is likely to be much more promising. This calls for re-engineering of the taxation system to capture such
activities, lest, substantive revenue is potentially forgone.
Expansion of the excise duty tax base by the reducing the threshold of alcohol strength for spirits
from 10% to 6% for taxation purposes: - the reduction of threshold of alcohol strength for purposes of
taxation implies that more spirituous drinks under this category which are taxed at KSh. 200 per litre shall
now be captured in the tax net. However, increased taxation or imposition of taxes to commodities such
as these is a delicate balancing where the need to raise additional revenue is weighed against the shifting
of the market to contrabands and counterfeits9 that may be encouraged by the price differentials, which
is likely to affect the economy of the county as well as the health of the partakers.
ii. Abolition of the existing tax incentives
The latest tax policy changes led to the overhaul of so many tax incentives that have been inherent in
the tax laws for quite a long time. Whereas some of them had outlived the purpose for which they were
established, others had posed a huge risk of distortions to the taxation system without a concrete benefit
8 https://ca.go.ke/industry/ecommerce-development/; https://ecommerceguide.com/news/kenyan-ecommerce-set-major-growth/ 9 https://movendi.ngo/news/2019/04/20/kenya-big-alcohol-against-alcohol-tax-increase/

Budget Watch For 2020/2021 And The Medium Term 15
accruing to the economy. Originally, this was intended to provide incentives to encourage some activities
to thrive so as to spur economic growth. However, it is believed that in 2018 alone, the government lost
about KSh. 535 billion10 through tax expenditures which was about 35.7% of the total ordinary revenue
collected in 2018/19. This is a large amount, considering the fact that it was not far from the fiscal deficit
recorded around the same period.
Removal of allowable deductions: - the income tax statute has previously contained several types of
income that was allowed as deductions especially by businesses and corporations. This means that they
are allowed to knock off some types of income from the taxable income before calculating the tax liability.
Ideally, it was expected that this incentive would offer some form of relief to taxpayers in order for them
to reduce their tax liability and subsequently pass the benefit to the economy. However, there appears to
be no sufficient evidence that the objective was achieved. Therefore, to modernize the law and align it to
the Constitution as well as the Public Finance Management Act with regard to the principles of public
finance, the incentive was removed. The full list of the allowable deductions is attached in annex 1.
Removal of exempt income incentive: - there existed a wide range of income, under the income tax
law that was exempt from taxation under the income tax and it was removed through the Tax Laws
(Amendment) Act, 2020 and the Finance Act, 2020. Other than reducing the list of exempt income in
order to raise additional revenue, this endeavour also modernized the tax law by extinguishing some
antiquated incentives that date as back as 1970s and are no longer relevant. A list is attached in annex
2.
Changes in the Value Added Tax (VAT) exemption and zero rated regimes: - the VAT law was re-
enacted in 2013 and this exercise witnessed the removal of a superfluity of items in the exemption and
zero rate regimes. This significantly improved the revenue yield. However, the long list of items seems to
have gradually made their way back through various Finance Acts and other legislative means. This may
have potentially undermined revenue collection in addition to rendering the tax administration
cumbersome. Therefore, the overhaul of these incentives at a time such as this was timely and this is
likely to substantively enhance the revenue yield. The list is attached in Annex 3.
iii. Overhaul of the investment deductions regime
The investment deduction (ID) regime was overhauled and replaced with a modern and progressive
system which ensures that the deduction is done in a phased manner so as to ensure that at least
businesses contribute to the tax yield even as they deduct some portion of investment capital from taxable
pay. It is worth noting that the regime that existed prior to April, 2020 seemed to contain a myriad of
deductions some of which may not have been well targeted. It is believed that this is one of the single-
most source of revenue loss associated with poor performance of corporation income tax since investors
are allowed to deduct their capital expenses from taxable income up to 100% (and in some cases
reaching 150% in recent amendments to the income tax). It takes quite a very long time before all the
investment expenditure is recouped for a firm to start paying taxes. The changes collapsed the investment
deductions are in four categories, that is: construction of buildings, installation of machinery, installation
of fibre optic cable and farm works. The deduction range from the highest of 50% and reduces
progressively to 10%. Further details are presented in annex 4.
10 The National Treasury report to the National Assembly’s Finance and National Planning Committee
Budget Watch For 2020/2021 And The Medium Term 16
iv. Introduction of tax incentives to cushion the vulnerable and/or spur economic growth
Reduction of Turnover Tax (ToT) from 3% to 1% of gross turnover: - the reduction of turnover tax
was aimed at cushioning businesses especially the Micro, Small and Medium Enterprises (MSMEs) who
are believed to bear the brunt of economic turmoil that has been occasioned by the COVID-19 pandemic.
Linked to this also, is the change of thresholds turnover of below KSh. 5 million to a range of KSh. 1
million to KSh. 50 million and even incorporated businesses within this range are at liberty to choose
whether to pay turnover tax or corporation income tax. Further, the change removed the then existing
presumptive tax which had been introduced earlier on to facilitate enforcement of turnover tax.
Reduction of the Pay-As-You-Earn (PAYE) top taxation band from 30% to 25% and exemption of
income below KSh. 24,000: - the PAYE taxation bands were reduced from 5 to 4 and reworked such
that the lowest band was set at 25%. This, coupled with the enhancement of personal relief from KSh.
1,408 to KSh. 2,400 per month and exemption from PAYE persons earning below KSh. 24,000 per month
were intended to provide relief to PAYE tax payers so to avail additional income to the economy which,
ideally can only be spent, saved or invested, all of which are avenues of supporting economic growth
even beyond the pandemic period. It seems that this is one of the incentives that are very effective in its
intended purpose because, increased disposable income to households has the greatest benefit since it
is one of the most important determinants of demand11. PAYE bands in annex 5
Reduction of Corporate Income Tax (CIT) from 30% to 25%: - the corporation tax was reduced to
25% and the understanding was that the businesses and companies will apply the savings arising from
this tax incentive not only to cushion themselves against the effects of the pandemic but also cushion
their employees by retaining them in the payroll. However, since the implementation of this incentive,
together with the one on reduction of VAT from 16% to 14%, there are indications that companies are
still struggling with cushioning their employees and prices of commodities which are subjected to VAT do
not depict any significant difference before and after the introduction.
Clarity in the taxation of pension payments by persons over the age of 65 years: - the confusion
that had been occasioned by the existence of two provisions with similar numbering was cleared. It is
noted that there were two provisions both occupying paragraph 53 of Part I of the First Schedule (income
exempt from tax). The first one was “the monthly pension granted to a person who is 65 years of age or
more”, which was introduced to the Income Tax statute through the Finance Act of 2007. The other one
was “income from employment paid in form of bonuses, overtime and retirement benefits” which was
introduced through the Finance Act of 2016.
Therefore, to comprehensively address the matter by retaining the tax exemption of monthly pension paid
to retirees who have attained 65 years but removing the exemption on bonuses and overtime (since the
minimum taxable income had been shifted to KSh. 24,000 and above), both paragraphs were deleted
and the correct one re-introduced which is “the monthly pension granted to a person who is 65 years of
age or more”. Therefore, this implies that the monthly pension to persons aged 65 years or more is
exempt from income tax.
v. Value added tax on transfer of business as a going concern
11 https://www.thebalance.com/consumer-spending-definition-and-determinants-3305917

Budget Watch For 2020/2021 And The Medium Term 17
Value Added Tax (VAT) on transfer of businesses as a going concern (TOGC) has undergone major
policy changes in recent times; moving from zero rate, to exemption and finally to standard rate with
effect from April, 2020. The implication is that this matter is now considered as a supply that is liable to
VAT at standard rate. A review of other jurisdictions reveals that the transfer of businesses as a going
concern is out of the scope of the VAT. However, there are always set conditions that must be fulfilled in
order for such a transaction to be regarded as such. Some of the standard conditions12 are such as the
requirement that:
i. The transfer should be whole of independent parts of the business which is capable of
independent operations (the assets such as good will, machinery, premises etc must be part of
the arrangement);
ii. The transfer must be to a registered VAT taxpayer, meaning there is no anticipated disruptions
regarding VAT treatment before and after the transfer;
iii. The recipient must commit to continue with the same kind of business. Not identical but it should
be clear that it is the business that is being bought and not the assets of the business;
iv. What to do with the land must be clearly addressed (whether it is being sold with the business
or not and if sold whether it is taxable or not);
v. Safeguards must be instituted against immediate consecutive transfers of the business.
It is noted that Kenya does not have a group taxation and relief regime to consider transfer of businesses
as a going concern. This implies that there are no conditions in place to ascertain the intention of transfer
of business on whether it is indeed a transfer of business or it is merely a transfer of assets. These two
ought to be treated differently. When the former is determined, then it falls out of the scope of the VAT if
the set conditions such the ones highlighted above are met. Otherwise, if the latter is ascertained, then it
becomes just the normal business that should be subjected to VAT taxation in the usual manner.
Therefore, whereas the definition of business, according to the Transfer of Businesses Act provides that
it is a trade or occupation other than a profession carried out with a view to profit, it is imperative to
evaluate the VAT issue on the transfer of businesses as a going concern to ensure that there is a clear
demarcation between what constitutes a supply to be subjected to VAT and what can be considered a
transfer of businesses as a going concern which is out of scope of VAT. This may be done by introducing
group taxation and relief regime in Kenya which shall impose conditions to be fulfilled for the consideration
of transfer of businesses as a going concern for purpose of VAT application. Otherwise, the current
taxation regime treats transfer of businesses as a going concern as being the same as the normal
business of supply. These two ought to be accorded different treatments.
12 Government of the United Kingdom Value Added Tax, VAT Notice 700/9 (https://www.gov.uk/guidance/transfer-a-business-as-a-going-concern-and-vat-notice-7009)
Budget Watch For 2020/2021 And The Medium Term 18
Keep an eye on:
i. The expected enhanced revenue yield that shall be occasioned by, first, the introduction of new
tax measures such as the Minimum Tax (MT) and Digital Service Tax (DST). Second is the
overhaul of the tax incentives regime such as the modernization of Investment Deductions (ID)
regime. Third, the removal of several items from the allowable deductions and exempt income
under the Income Tax. With robust tax administration in these areas, these measures would
revolutionize and substantively increase the revenue collection.
ii. The reduction of the corporation income tax (CIT) from 30% to 25% which is an incentive meant
to reduce the tax liability and encourage companies to keep employees in the payroll especially
this time of the global pandemic. The successful implementation of this incentive and its
attendant promise would help alleviate the impact of the COVID-19 on the workers in these
corporations.
iii. The reduction of Turnover Tax (ToT) for eligible businesses from 3% to 1% of the annual turnover
which is intended to grant reprieve, especially to the Micro, Small and Medium Enterprises
(MSMEs) to cushion them against the effects of slackened economic activities, occasioned by
COVID-19.
iv. The reduction of the Value Added Tax (VAT) from 16% to 14% whose ultimate aim is to reduce
the prices of commodities so as to provide relief to the consumers at such a time when household
income levels are expected to dwindle. The efficacy of this incentive may be evaluated since
there seem to initial indications that prices of most commodities have not adjusted in response
to the reduction in the tax rate.
v. The removal of several items from the Value Added Tax zero rate and exemption regime so as
to address distortions inherent in the tax system, promote fairness and enhance revenue yield
to finance the provision of public goods and services for all. This status need to be maintained
to guarantee enhanced revenue and simplified tax administration.
Budget Watch For 2020/2021 And The Medium Term 19
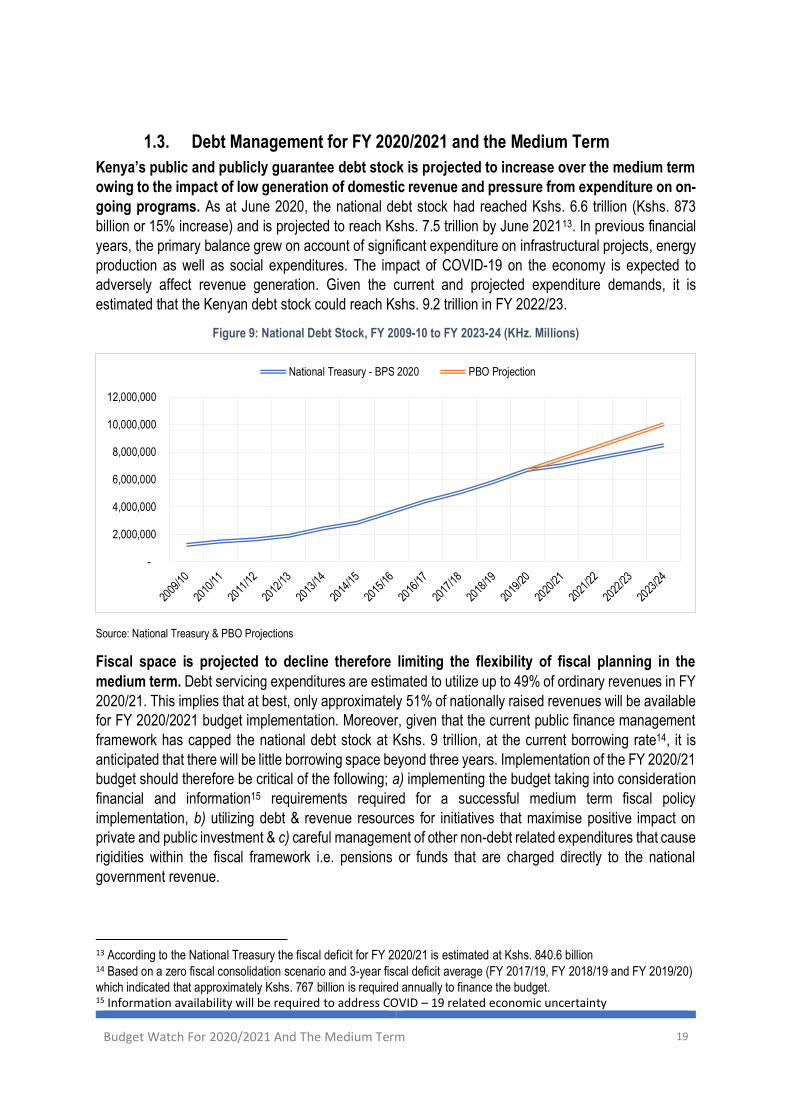
1.3. Debt Management for FY 2020/2021 and the Medium Term
Kenya’s public and publicly guarantee debt stock is projected to increase over the medium term
owing to the impact of low generation of domestic revenue and pressure from expenditure on on-
going programs. As at June 2020, the national debt stock had reached Kshs. 6.6 trillion (Kshs. 873
billion or 15% increase) and is projected to reach Kshs. 7.5 trillion by June 202113. In previous financial
years, the primary balance grew on account of significant expenditure on infrastructural projects, energy
production as well as social expenditures. The impact of COVID-19 on the economy is expected to
adversely affect revenue generation. Given the current and projected expenditure demands, it is
estimated that the Kenyan debt stock could reach Kshs. 9.2 trillion in FY 2022/23.
Figure 9: National Debt Stock, FY 2009-10 to FY 2023-24 (KHz. Millions)
Source: National Treasury & PBO Projections
Fiscal space is projected to decline therefore limiting the flexibility of fiscal planning in the
medium term. Debt servicing expenditures are estimated to utilize up to 49% of ordinary revenues in FY
2020/21. This implies that at best, only approximately 51% of nationally raised revenues will be available
for FY 2020/2021 budget implementation. Moreover, given that the current public finance management
framework has capped the national debt stock at Kshs. 9 trillion, at the current borrowing rate14, it is
anticipated that there will be little borrowing space beyond three years. Implementation of the FY 2020/21
budget should therefore be critical of the following; a) implementing the budget taking into consideration
financial and information15 requirements required for a successful medium term fiscal policy
implementation, b) utilizing debt & revenue resources for initiatives that maximise positive impact on
private and public investment & c) careful management of other non-debt related expenditures that cause
rigidities within the fiscal framework i.e. pensions or funds that are charged directly to the national
government revenue.
13 According to the National Treasury the fiscal deficit for FY 2020/21 is estimated at Kshs. 840.6 billion 14 Based on a zero fiscal consolidation scenario and 3-year fiscal deficit average (FY 2017/19, FY 2018/19 and FY 2019/20)
which indicated that approximately Kshs. 767 billion is required annually to finance the budget. 15 Information availability will be required to address COVID – 19 related economic uncertainty
-
2,000,000
4,000,000
6,000,000
8,000,000
10,000,000
12,000,000
National Treasury - BPS 2020 PBO Projection
Budget Watch For 2020/2021 And The Medium Term 20
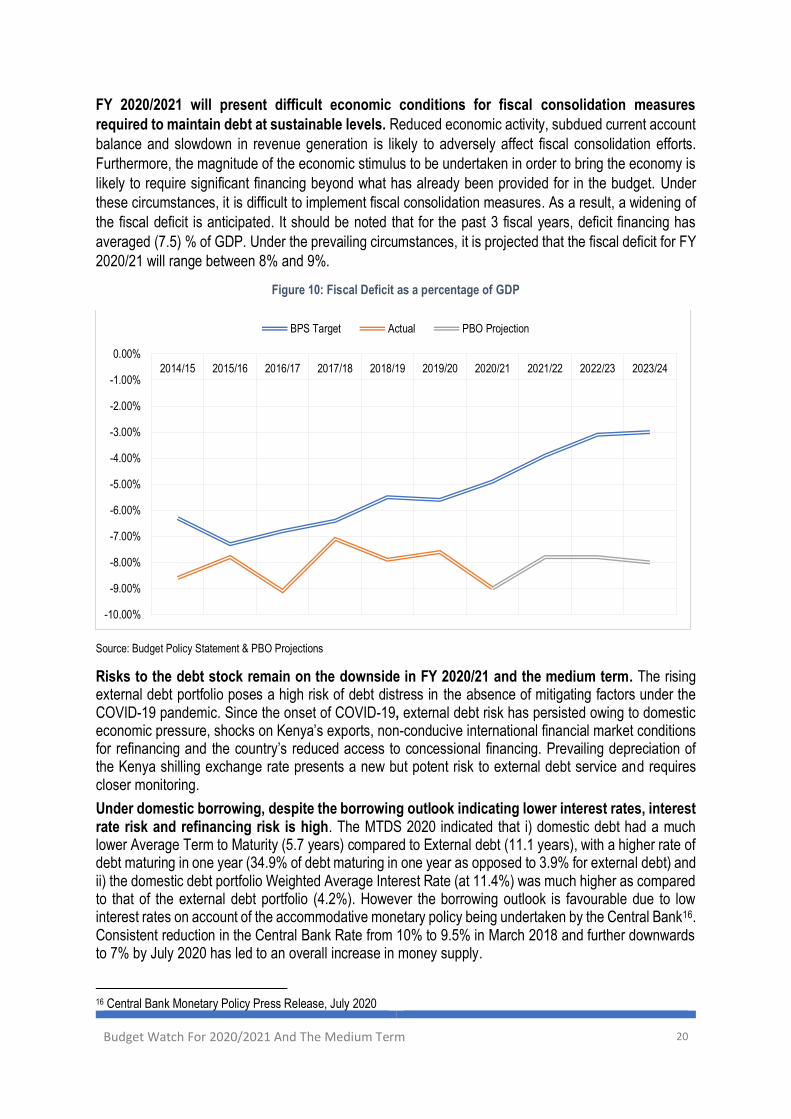
FY 2020/2021 will present difficult economic conditions for fiscal consolidation measures
required to maintain debt at sustainable levels. Reduced economic activity, subdued current account
balance and slowdown in revenue generation is likely to adversely affect fiscal consolidation efforts.
Furthermore, the magnitude of the economic stimulus to be undertaken in order to bring the economy is
likely to require significant financing beyond what has already been provided for in the budget. Under
these circumstances, it is difficult to implement fiscal consolidation measures. As a result, a widening of
the fiscal deficit is anticipated. It should be noted that for the past 3 fiscal years, deficit financing has
averaged (7.5) % of GDP. Under the prevailing circumstances, it is projected that the fiscal deficit for FY
2020/21 will range between 8% and 9%.
Figure 10: Fiscal Deficit as a percentage of GDP
Source: Budget Policy Statement & PBO Projections
Risks to the debt stock remain on the downside in FY 2020/21 and the medium term. The rising external debt portfolio poses a high risk of debt distress in the absence of mitigating factors under the COVID-19 pandemic. Since the onset of COVID-19, external debt risk has persisted owing to domestic economic pressure, shocks on Kenya’s exports, non-conducive international financial market conditions for refinancing and the country’s reduced access to concessional financing. Prevailing depreciation of the Kenya shilling exchange rate presents a new but potent risk to external debt service and requires closer monitoring.
Under domestic borrowing, despite the borrowing outlook indicating lower interest rates, interest rate risk and refinancing risk is high. The MTDS 2020 indicated that i) domestic debt had a much lower Average Term to Maturity (5.7 years) compared to External debt (11.1 years), with a higher rate of debt maturing in one year (34.9% of debt maturing in one year as opposed to 3.9% for external debt) and ii) the domestic debt portfolio Weighted Average Interest Rate (at 11.4%) was much higher as compared to that of the external debt portfolio (4.2%). However the borrowing outlook is favourable due to low interest rates on account of the accommodative monetary policy being undertaken by the Central Bank16. Consistent reduction in the Central Bank Rate from 10% to 9.5% in March 2018 and further downwards to 7% by July 2020 has led to an overall increase in money supply.
16 Central Bank Monetary Policy Press Release, July 2020
-10.00%
-9.00%
-8.00%
-7.00%
-6.00%
-5.00%
-4.00%
-3.00%
-2.00%
-1.00%
0.00%
2014/15 2015/16 2016/17 2017/18 2018/19 2019/20 2020/21 2021/22 2022/23 2023/24
BPS Target Actual PBO Projection

Budget Watch For 2020/2021 And The Medium Term 21
Figure 11: Money Supply, March 2018 – March 2020 (KHz. Billions)
Source: Central Bank Monthly Economic Indicators
Despite the planning of government financing for each financial year, the country continues to
incur commitment fees arising from non-disbursement of external debt. Since FY 2015/16, a total
of Kshs.7.6 billion has been incurred as commitment fees. This is an extra burden arising from debt
disbursement inefficiencies due to late issuance of letters of credit and lack of allocation of the required
counterpart funding. At the end of the third quarter of FY 2019/2020, only Kshs. 98.4 billion (42%) of the
Kshs. 232.78 billion net foreign financing, had been disbursed. To increase efficiency of project
implementation and reduce incurring commitment fees, a higher rate of disbursement will have to be
achieved in FY 2020/21.
Figure 12: Incurred External Debt Commitment Fees
Source: Annual Public Debt Management Reports
0.00
500.00
1,000.00
1,500.00
2,000.00
2,500.00
3,000.00
3,500.00
4,000.00
Mar
-18
Ap
r-1
8
May
-18
Jun
-18
Jul-
18
Au
g-18
Sep
-18
Oct
-18
No
v-18
Dec
-18
Jan
-19
Feb
-19
Mar
-19
Ap
r-1
9
May
-19
Jun
-19
Jul-
19
Au
g-19
Sep
-19
Oct
-19
No
v-19
Dec
-19
Jan
-20
Feb
-20
Mar
-20
M1 M2 M3
-
500,000,000
1,000,000,000
1,500,000,000
2,000,000,000
2,500,000,000
3,000,000,000
3,500,000,000
FY 2016/17 FY 2017/18 FY 2018/19
Budget Watch For 2020/2021 And The Medium Term 22
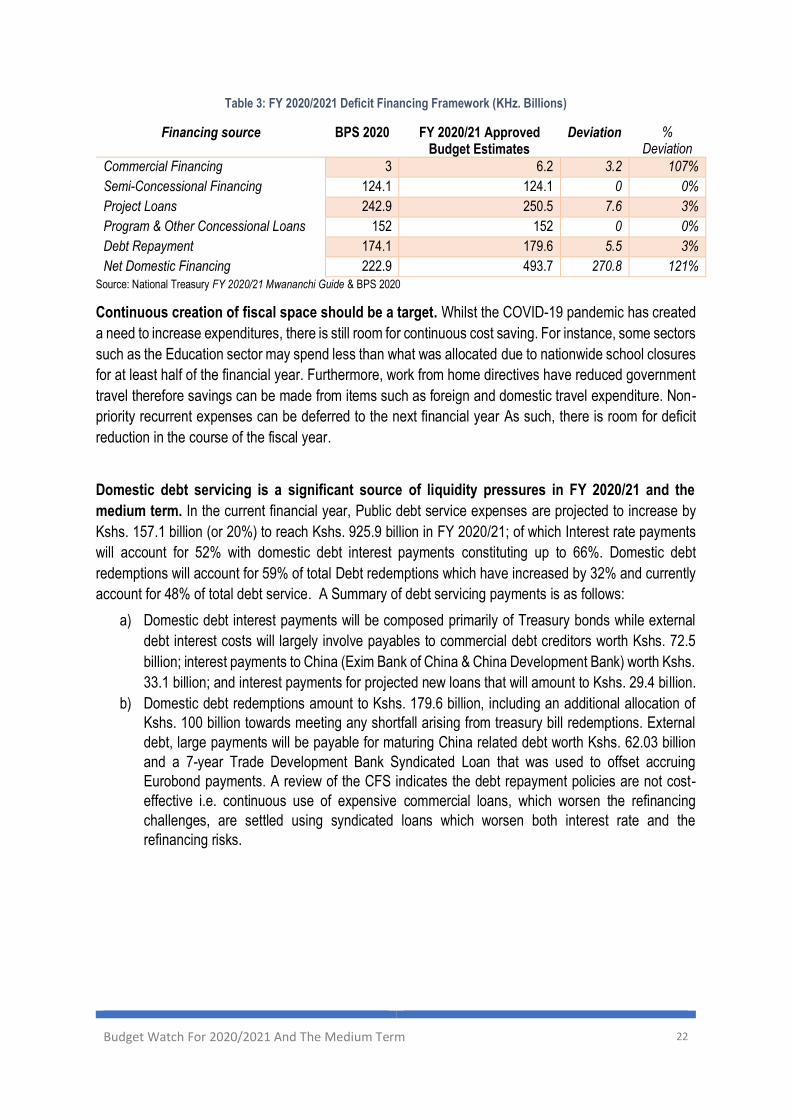
Table 3: FY 2020/2021 Deficit Financing Framework (KHz. Billions)
Financing source BPS 2020 FY 2020/21 Approved Budget Estimates
Deviation % Deviation
Commercial Financing 3 6.2 3.2 107%
Semi-Concessional Financing 124.1 124.1 0 0%
Project Loans 242.9 250.5 7.6 3%
Program & Other Concessional Loans 152 152 0 0%
Debt Repayment 174.1 179.6 5.5 3%
Net Domestic Financing 222.9 493.7 270.8 121%
Source: National Treasury FY 2020/21 Mwananchi Guide & BPS 2020
Continuous creation of fiscal space should be a target. Whilst the COVID-19 pandemic has created
a need to increase expenditures, there is still room for continuous cost saving. For instance, some sectors
such as the Education sector may spend less than what was allocated due to nationwide school closures
for at least half of the financial year. Furthermore, work from home directives have reduced government
travel therefore savings can be made from items such as foreign and domestic travel expenditure. Non-
priority recurrent expenses can be deferred to the next financial year As such, there is room for deficit
reduction in the course of the fiscal year.
Domestic debt servicing is a significant source of liquidity pressures in FY 2020/21 and the
medium term. In the current financial year, Public debt service expenses are projected to increase by
Kshs. 157.1 billion (or 20%) to reach Kshs. 925.9 billion in FY 2020/21; of which Interest rate payments
will account for 52% with domestic debt interest payments constituting up to 66%. Domestic debt
redemptions will account for 59% of total Debt redemptions which have increased by 32% and currently
account for 48% of total debt service. A Summary of debt servicing payments is as follows:
a) Domestic debt interest payments will be composed primarily of Treasury bonds while external
debt interest costs will largely involve payables to commercial debt creditors worth Kshs. 72.5
billion; interest payments to China (Exim Bank of China & China Development Bank) worth Kshs.
33.1 billion; and interest payments for projected new loans that will amount to Kshs. 29.4 billion.
b) Domestic debt redemptions amount to Kshs. 179.6 billion, including an additional allocation of
Kshs. 100 billion towards meeting any shortfall arising from treasury bill redemptions. External
debt, large payments will be payable for maturing China related debt worth Kshs. 62.03 billion
and a 7-year Trade Development Bank Syndicated Loan that was used to offset accruing
Eurobond payments. A review of the CFS indicates the debt repayment policies are not cost-
effective i.e. continuous use of expensive commercial loans, which worsen the refinancing
challenges, are settled using syndicated loans which worsen both interest rate and the
refinancing risks.

Budget Watch For 2020/2021 And The Medium Term 23
Table 4: Public Debt Servicing Expenses (KHz. Millions)
FY
2019/20 FY
2020/21 FY 2021/22 FY 2022/23 FY 2023/24
Interest - Internal Debt 301,812 321,911 370,430 382,588 385,662
Interest - External Debt 131,868 162,434 166,821 173,950 183,692
Interest Payments, Sub-Total 433,680 484,345 537,251 556,538 569,354
Redemption - Internal Debt 213,691 261,955 246,810 336,623 357,165
Redemption - External Debt 121,477 179,640 239,393 257,612 258,457
Redemptions Payments, Sub-Total 335,168 441,595 486,203 594,235 615,622 Public Debt Service Expenses 768,848 925,940 1,023,454 1,150,773 1,184,976
Source: Respective Annual Approved Budget Estimates
Contingent liabilities from debt guarantees are an additional risk to the debt management
framework. Contingent liabilities are obligations that arise when a particular event occurs and create in
year fiscal risks17 as they are not included in the budget estimates. Section 58 of the PFM Act requires
the government to meet financial obligations of institutions that fail to meet their debt servicing expenses,
that is, called up guarantees. Under the prevailing economic conditions that have reduced revenue
generation, guaranteed institutions are likely to fail to meet their debt servicing obligations. Should this
materialize, then the National government will be obliged to meet their expenses even though there is no
provision for called guarantee in the FY 2020/2021 budget., this position might not hold given the
depressed economic conditions that are likely to reduce incomes for guaranteed institutions.
Furthermore, there are plans to introduce Credit Guarantee Scheme for SMEs which will also increase
the overall public and publicly guaranteed debt stock.
Keep an eye on:
i. Financial risk emanating from contingent liabilities. These specifically relate to called up
guarantee arising from already guaranteed debt which if the national government is obliged
to pay, will increase expenditure requirements mid-year. Furthermore, the anticipated Credit
Guarantee Scheme will require enhancement in the oversight framework.
ii. Disbursement rate of external debt in order to limit the overall cost of acquiring external debt
that is occasioned by commitment fees incurred each financial year
iii. Absorption rate of debt financed projects in order to increase efficiency of borrowed
resources through increased oversight involving increased reporting on factors such as
project status, cash disbursement etc.
iv. Risks to debt sustainability, these will relate to exchange rate risk, refinancing risk, and
interest rate risks rations of which occasion an increase of debt servicing expenses at a
moment of tight fiscal space.
1.4. Monetary Policy
To alleviate adverse economic effects of the lockdown, the Central Bank of Kenya (CBK) has
initiated various measures to ensure that there is ample liquidity in the economy. The CBK has
lowered its policy rate by 125 basis points to currently stand at 7 percent. The lowering of the Central
Bank Rate (CBR) signals commercial banks to lower their lending rate so as to make loans more
affordable. The bank further lowered the Cash Reserve Ratio (CRR) by 100 basis point to 4.25 percent
17 Government Finance Statistics Manual 2014
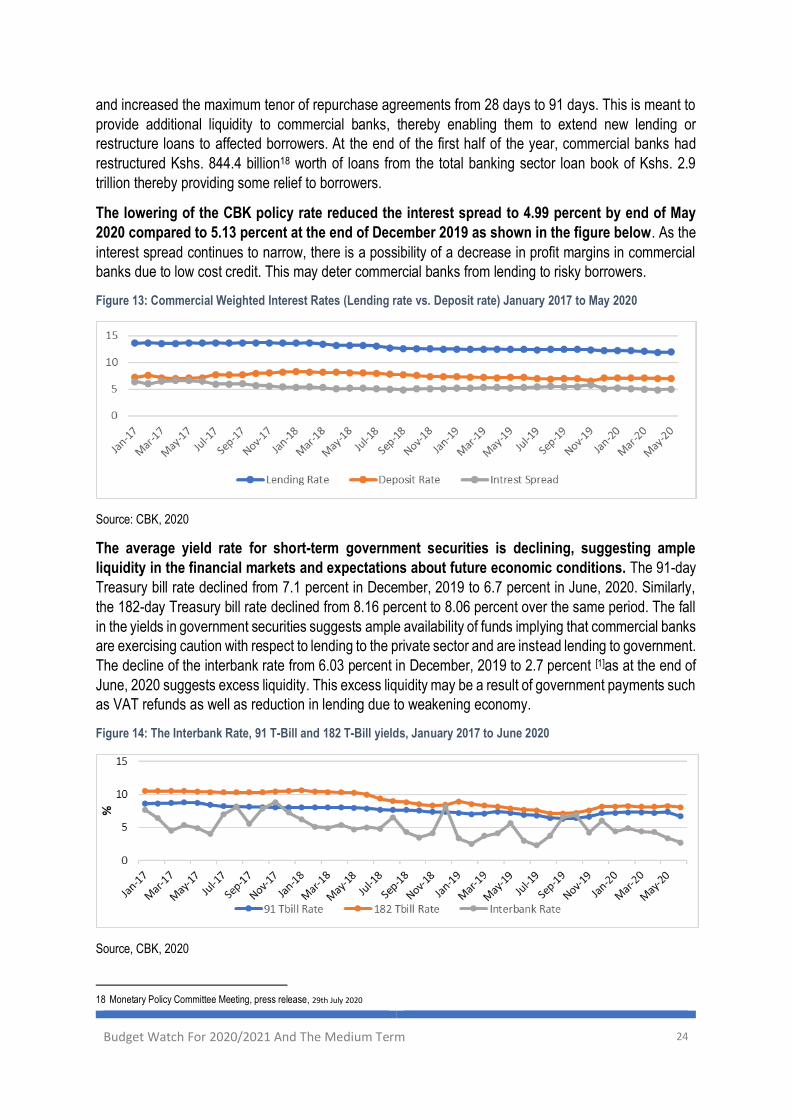
Budget Watch For 2020/2021 And The Medium Term 24
and increased the maximum tenor of repurchase agreements from 28 days to 91 days. This is meant to
provide additional liquidity to commercial banks, thereby enabling them to extend new lending or
restructure loans to affected borrowers. At the end of the first half of the year, commercial banks had
restructured Kshs. 844.4 billion18 worth of loans from the total banking sector loan book of Kshs. 2.9
trillion thereby providing some relief to borrowers.
The lowering of the CBK policy rate reduced the interest spread to 4.99 percent by end of May
2020 compared to 5.13 percent at the end of December 2019 as shown in the figure below. As the
interest spread continues to narrow, there is a possibility of a decrease in profit margins in commercial
banks due to low cost credit. This may deter commercial banks from lending to risky borrowers.
Figure 13: Commercial Weighted Interest Rates (Lending rate vs. Deposit rate) January 2017 to May 2020
Source: CBK, 2020
The average yield rate for short-term government securities is declining, suggesting ample
liquidity in the financial markets and expectations about future economic conditions. The 91-day
Treasury bill rate declined from 7.1 percent in December, 2019 to 6.7 percent in June, 2020. Similarly,
the 182-day Treasury bill rate declined from 8.16 percent to 8.06 percent over the same period. The fall
in the yields in government securities suggests ample availability of funds implying that commercial banks
are exercising caution with respect to lending to the private sector and are instead lending to government.
The decline of the interbank rate from 6.03 percent in December, 2019 to 2.7 percent [1]as at the end of
June, 2020 suggests excess liquidity. This excess liquidity may be a result of government payments such
as VAT refunds as well as reduction in lending due to weakening economy.
Figure 14: The Interbank Rate, 91 T-Bill and 182 T-Bill yields, January 2017 to June 2020
Source, CBK, 2020
18 Monetary Policy Committee Meeting, press release, 29th July 2020
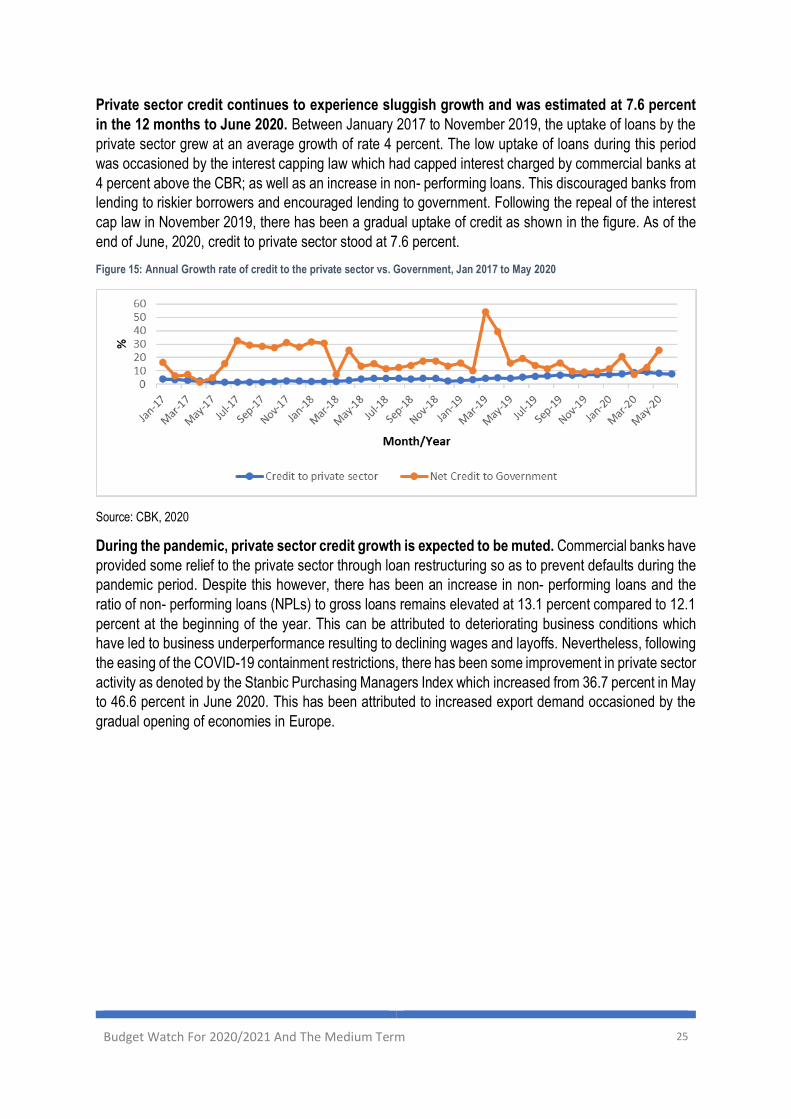
Budget Watch For 2020/2021 And The Medium Term 25
Private sector credit continues to experience sluggish growth and was estimated at 7.6 percent
in the 12 months to June 2020. Between January 2017 to November 2019, the uptake of loans by the
private sector grew at an average growth of rate 4 percent. The low uptake of loans during this period
was occasioned by the interest capping law which had capped interest charged by commercial banks at
4 percent above the CBR; as well as an increase in non- performing loans. This discouraged banks from
lending to riskier borrowers and encouraged lending to government. Following the repeal of the interest
cap law in November 2019, there has been a gradual uptake of credit as shown in the figure. As of the
end of June, 2020, credit to private sector stood at 7.6 percent.
Figure 15: Annual Growth rate of credit to the private sector vs. Government, Jan 2017 to May 2020
Source: CBK, 2020
During the pandemic, private sector credit growth is expected to be muted. Commercial banks have
provided some relief to the private sector through loan restructuring so as to prevent defaults during the
pandemic period. Despite this however, there has been an increase in non- performing loans and the
ratio of non- performing loans (NPLs) to gross loans remains elevated at 13.1 percent compared to 12.1
percent at the beginning of the year. This can be attributed to deteriorating business conditions which
have led to business underperformance resulting to declining wages and layoffs. Nevertheless, following
the easing of the COVID-19 containment restrictions, there has been some improvement in private sector
activity as denoted by the Stanbic Purchasing Managers Index which increased from 36.7 percent in May
to 46.6 percent in June 2020. This has been attributed to increased export demand occasioned by the
gradual opening of economies in Europe.
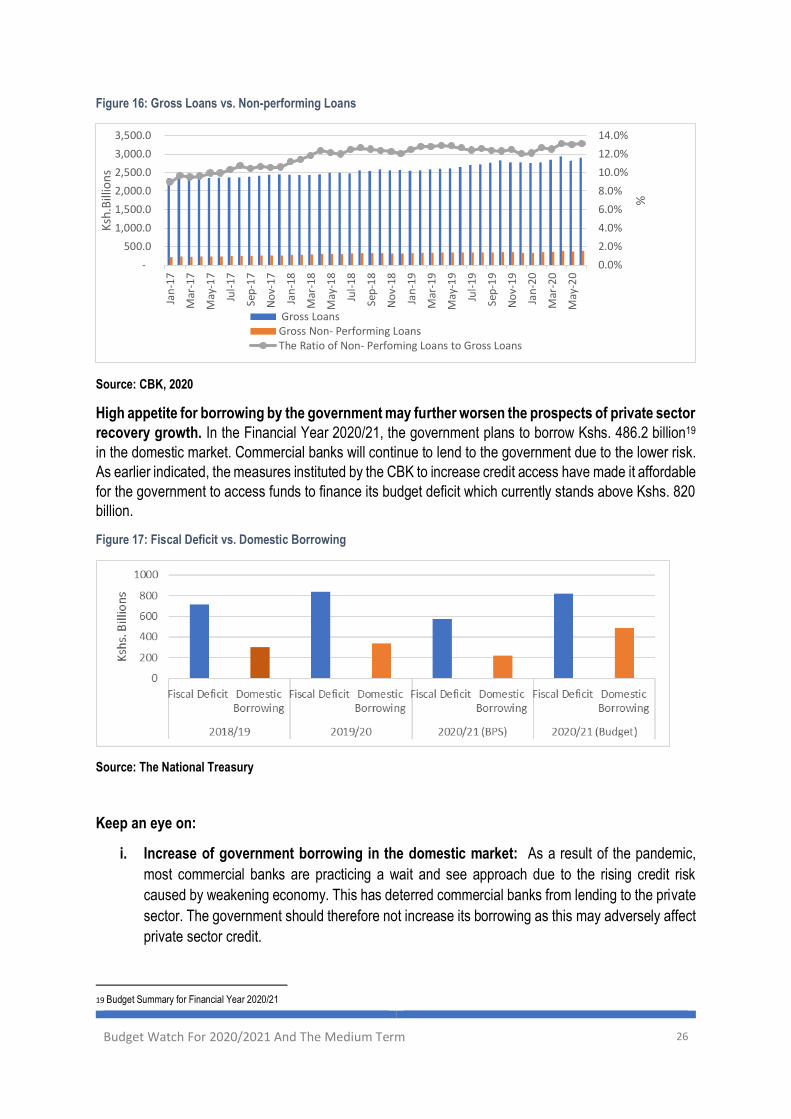
Budget Watch For 2020/2021 And The Medium Term 26
Figure 16: Gross Loans vs. Non-performing Loans
Source: CBK, 2020
High appetite for borrowing by the government may further worsen the prospects of private sector
recovery growth. In the Financial Year 2020/21, the government plans to borrow Kshs. 486.2 billion19
in the domestic market. Commercial banks will continue to lend to the government due to the lower risk.
As earlier indicated, the measures instituted by the CBK to increase credit access have made it affordable
for the government to access funds to finance its budget deficit which currently stands above Kshs. 820
billion.
Figure 17: Fiscal Deficit vs. Domestic Borrowing
Source: The National Treasury
Keep an eye on:
i. Increase of government borrowing in the domestic market: As a result of the pandemic,
most commercial banks are practicing a wait and see approach due to the rising credit risk
caused by weakening economy. This has deterred commercial banks from lending to the private
sector. The government should therefore not increase its borrowing as this may adversely affect
private sector credit.
19 Budget Summary for Financial Year 2020/21
0.0%
2.0%
4.0%
6.0%
8.0%
10.0%
12.0%
14.0%
-
500.0
1,000.0
1,500.0
2,000.0
2,500.0
3,000.0
3,500.0
Jan
-17
Mar
-17
May
-17
Jul-
17
Sep
-17
No
v-17
Jan
-18
Mar
-18
May
-18
Jul-
18
Sep
-18
No
v-18
Jan
-19
Mar
-19
May
-19
Jul-
19
Sep
-19
No
v-19
Jan
-20
Mar
-20
May
-20
%
Ksh
.Bill
ion
s
Gross LoansGross Non- Performing LoansThe Ratio of Non- Perfoming Loans to Gross Loans
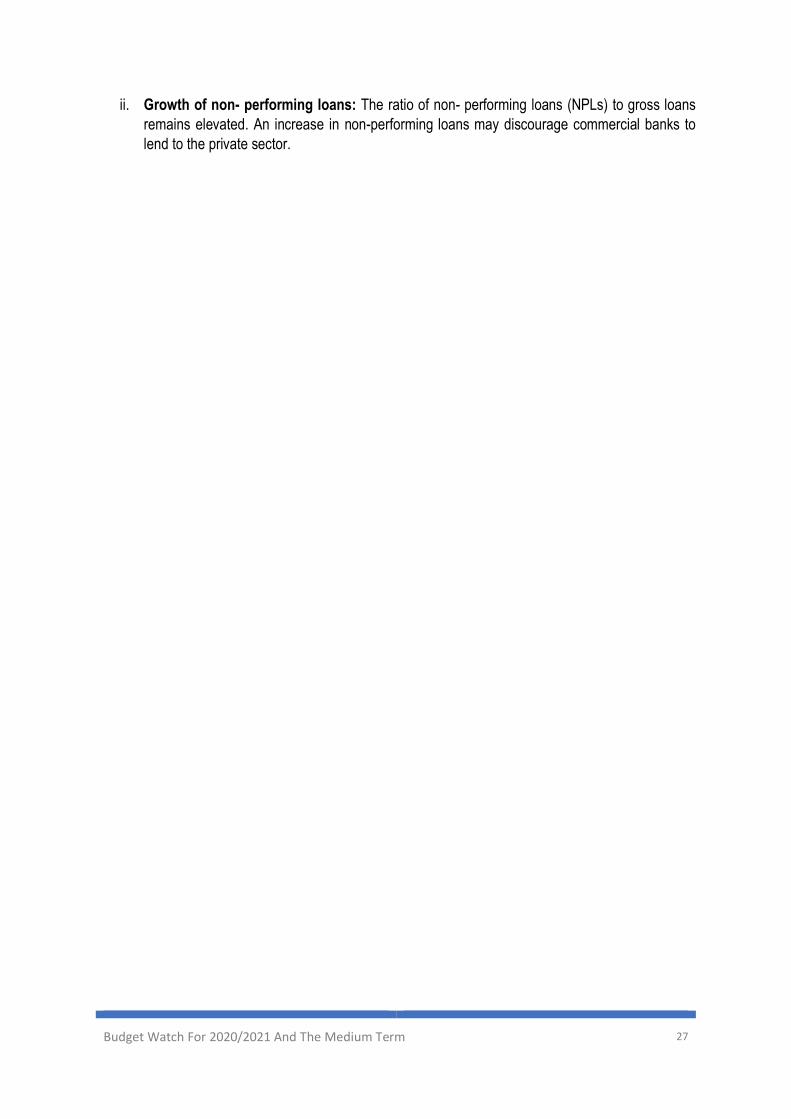
Budget Watch For 2020/2021 And The Medium Term 27
ii. Growth of non- performing loans: The ratio of non- performing loans (NPLs) to gross loans
remains elevated. An increase in non-performing loans may discourage commercial banks to
lend to the private sector.
Budget Watch For 2020/2021 And The Medium Term 28
Chapter Two:
Enhancing efficiency and effectiveness through budget
implementation
The choices we make today will directly affect the way the crisis unfolds and so the lives of billions of
people. With the right measures, we can limit its impact and the scars it leaves. We must aim to build
back better so that our new systems are safer, fairer and more sustainable than those that allowed the
crisis to happen.
Guy Ryder, ILO’s Director General

Budget Watch For 2020/2021 And The Medium Term 29
2.0. Introduction
The total MDAs budget including the Judiciary and Parliament amounts to KSh 1,886.4 billion comprising
of KSh. 1,253.1 billion for recurrent activities and KSh. 633 billion for development activities. Notably
about 39 percent of the total development expenditure will be donor financed.
Table 5: Summary of Budgetary Allocation in KHz. Billions
Recurrent Development Total
1. National Executive 869.8 627.3 1,497.1 o/w AIA 184.9 245.4 430.3
2. Commissions and Independent Offices 383.3 6.0 389.3 o/w AIA 1.2 - 1.2
Total 1,253.1 633.3 1,886.4 Source: Appropriations Act, 2020
The resources will be geared towards implementation of 158 programmes with specific Key Performance
Indicators and targets spread across the three arms of government and other independent commissions
and offices. Included in the budget, is an allocation of KSh. 53.7 billion for various interventions under a
stimulus package including youth empowerment and employment creation, improving education
outcomes, health, road rehabilitation among others. The table below shows an analysis of outputs, key
Performance Indicators (KPIs) and targets specific to the stimulus package.
Table 6: Analysis of Outputs and Key Performance Indicators
S/No. Thematic Area KSh. Millions
Output KPI Target
1. 1. Youth Empowerment
10,000
Youth and other Stakeholder Involvement
Number of Youth Involvement in post covid-19 economic revamping programmes
100,000
2. 2. Education 6,500 • Intern teachers to support 100% transition
• Classrooms constructed in secondary schools
• Locally fabricated desk
• No. of Intern teachers recruited
• Number of classes constructed in public schools
• No of locally fabricated desks
10,000
1,238
250,000
3. 3. Health 1,725 Increased access to health services • No. of locally sourced beds and beddings to public hospitals
• No of diploma health interns
20,000
5,000
4. 4. Environment and Water
3,822 Dykes constructed • No of km of flood dykes constructed
• No of check dams constructed
29
1
5. 5. Roads 5,410 Roads rehabilitated No. of KMS of roads rehabilitated. 280
6. 6. Agriculture and Food Security
4,970 Improved farmers access to farm inputs
No of farmers using digital e-subsidy platform
304,158
1. 7. Tourism 6,000 Tourism facilities financed No. of facilities financed 50

Budget Watch For 2020/2021 And The Medium Term 30
S/No. Thematic Area KSh. Millions
Output KPI Target
2. 8. Enhancing Liquidity to Businesses
14,312 Payments of outstanding bills Amount of pending bills less than 3 million paid to local businesses
5 billion
3. 9. Social Protection
1,000 Households with vulnerable persons supported
No. of Households supported 833,000
4. Total 53,739
Source: The National Treasury
The success of these interventions will depend on how the overall budget is implemented. Beyond
budgetary allocation, budget execution is critical to public service delivery to ensure that all
outputs/targets are achieved as planned. As such public expenditure management and efficiency
becomes necessary to reduce wastage.
2.1. Social Sector
Access to Education amidst the COVID-19 pandemic
The Education sector has been adversely affected by the COVID 19 pandemic with the
government instituting nationwide school closures and deferring the entire 2020 academic year.
This is an unprecedented situation that has led to joblessness for a segment of the population that
depends on the sector as a source of livelihood. The situation is worse for the private sector as some
private learning institutions are reported to have closed permanently. However the savings to government
are minimal as bulk of government spending in this sector is for personnel emoluments which continue
to be paid despite closure of schools.
The resumption of studies in January 2021 is dependent on the preparedness of the learning
institutions to respond adequately to the threat posed by the pandemic. This entails putting in place
measures that will facilitate observation of social distancing guidelines as well as high standards of
hygiene. Schools will be required to expand infrastructure including water, sanitation and hygiene
(WASH) facilities as well as increasing learning amenities such as desks. To this extent, the sector has
been allocated resources for infrastructural and allied interventions in the 2020/2021 budget which
require urgent implementation. The period (July-December) when learners are out of school gives an
opportunity for the sector to address infrastructural and WASH gaps aimed at containing the spread of
the virus once studies resume. The implementation of the development budget for the sector in the first
half (July- December) of the financial year 2020/21 will be a make or break situation. Prioritization of
release of development funds for the sector is therefore highly critical.
The Education budget also presents some opportunities for savings. For instance, Capitation funds
which are allocated per learner (at basic, tertiary and university level) to support operations and
maintenance in learning institutions, account for 25% (Kshs 124.4 Billion) of the entire Education sector
budget. The operations and maintenance includes aspects such as settlement of utility bills, infrastructure
rehabilitation, and payment of salaries for teaching (in the case of universities) and non-teaching staff.
However, given that the major users of various cost utilities are not in session for the first half of the
financial year especially in basic learning institutions (primary and secondary), there is an opportunity to
save some capitation resources.
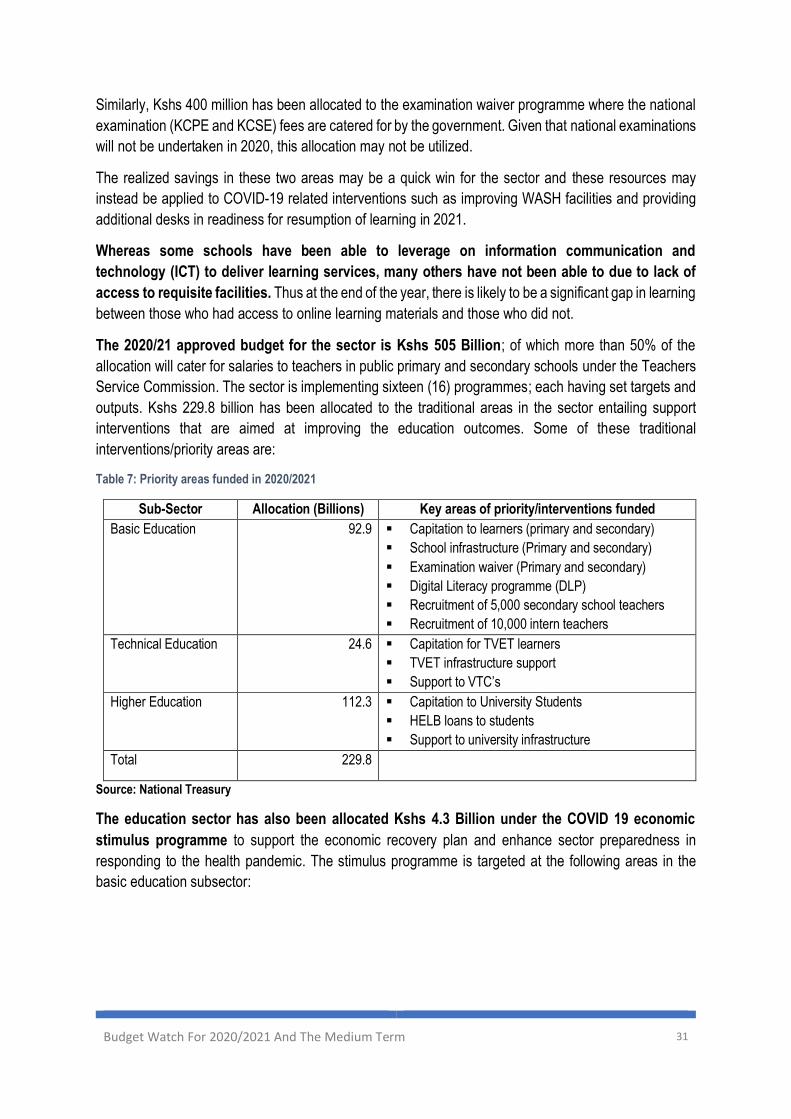
Budget Watch For 2020/2021 And The Medium Term 31
Similarly, Kshs 400 million has been allocated to the examination waiver programme where the national
examination (KCPE and KCSE) fees are catered for by the government. Given that national examinations
will not be undertaken in 2020, this allocation may not be utilized.
The realized savings in these two areas may be a quick win for the sector and these resources may
instead be applied to COVID-19 related interventions such as improving WASH facilities and providing
additional desks in readiness for resumption of learning in 2021.
Whereas some schools have been able to leverage on information communication and
technology (ICT) to deliver learning services, many others have not been able to due to lack of
access to requisite facilities. Thus at the end of the year, there is likely to be a significant gap in learning
between those who had access to online learning materials and those who did not.
The 2020/21 approved budget for the sector is Kshs 505 Billion; of which more than 50% of the
allocation will cater for salaries to teachers in public primary and secondary schools under the Teachers
Service Commission. The sector is implementing sixteen (16) programmes; each having set targets and
outputs. Kshs 229.8 billion has been allocated to the traditional areas in the sector entailing support
interventions that are aimed at improving the education outcomes. Some of these traditional
interventions/priority areas are:
Table 7: Priority areas funded in 2020/2021
Sub-Sector Allocation (Billions) Key areas of priority/interventions funded
Basic Education 92.9 ▪ Capitation to learners (primary and secondary)
▪ School infrastructure (Primary and secondary)
▪ Examination waiver (Primary and secondary)
▪ Digital Literacy programme (DLP)
▪ Recruitment of 5,000 secondary school teachers
▪ Recruitment of 10,000 intern teachers
Technical Education 24.6 ▪ Capitation for TVET learners
▪ TVET infrastructure support
▪ Support to VTC’s
Higher Education 112.3 ▪ Capitation to University Students
▪ HELB loans to students
▪ Support to university infrastructure
Total 229.8
Source: National Treasury
The education sector has also been allocated Kshs 4.3 Billion under the COVID 19 economic
stimulus programme to support the economic recovery plan and enhance sector preparedness in
responding to the health pandemic. The stimulus programme is targeted at the following areas in the
basic education subsector:
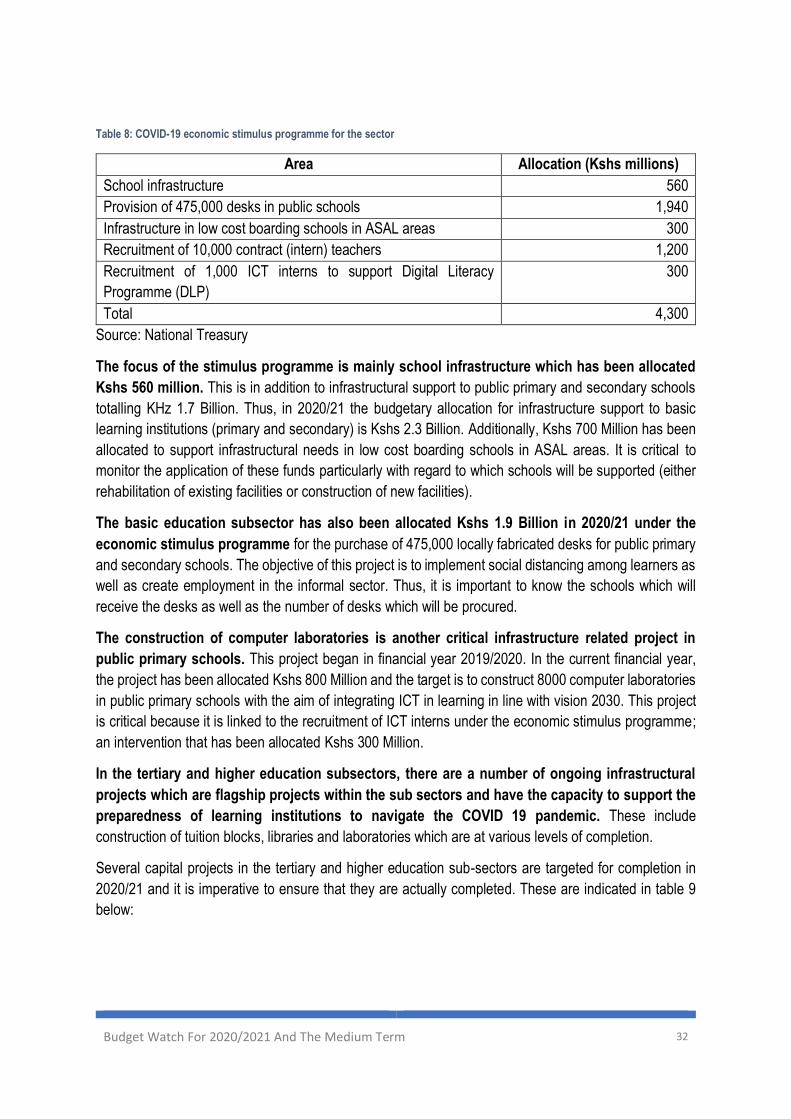
Budget Watch For 2020/2021 And The Medium Term 32
Table 8: COVID-19 economic stimulus programme for the sector
Area Allocation (Kshs millions)
School infrastructure 560
Provision of 475,000 desks in public schools 1,940
Infrastructure in low cost boarding schools in ASAL areas 300
Recruitment of 10,000 contract (intern) teachers 1,200
Recruitment of 1,000 ICT interns to support Digital Literacy
Programme (DLP)
300
Total 4,300
Source: National Treasury
The focus of the stimulus programme is mainly school infrastructure which has been allocated
Kshs 560 million. This is in addition to infrastructural support to public primary and secondary schools
totalling KHz 1.7 Billion. Thus, in 2020/21 the budgetary allocation for infrastructure support to basic
learning institutions (primary and secondary) is Kshs 2.3 Billion. Additionally, Kshs 700 Million has been
allocated to support infrastructural needs in low cost boarding schools in ASAL areas. It is critical to
monitor the application of these funds particularly with regard to which schools will be supported (either
rehabilitation of existing facilities or construction of new facilities).
The basic education subsector has also been allocated Kshs 1.9 Billion in 2020/21 under the
economic stimulus programme for the purchase of 475,000 locally fabricated desks for public primary
and secondary schools. The objective of this project is to implement social distancing among learners as
well as create employment in the informal sector. Thus, it is important to know the schools which will
receive the desks as well as the number of desks which will be procured.
The construction of computer laboratories is another critical infrastructure related project in
public primary schools. This project began in financial year 2019/2020. In the current financial year,
the project has been allocated Kshs 800 Million and the target is to construct 8000 computer laboratories
in public primary schools with the aim of integrating ICT in learning in line with vision 2030. This project
is critical because it is linked to the recruitment of ICT interns under the economic stimulus programme;
an intervention that has been allocated Kshs 300 Million.
In the tertiary and higher education subsectors, there are a number of ongoing infrastructural
projects which are flagship projects within the sub sectors and have the capacity to support the
preparedness of learning institutions to navigate the COVID 19 pandemic. These include
construction of tuition blocks, libraries and laboratories which are at various levels of completion.
Several capital projects in the tertiary and higher education sub-sectors are targeted for completion in
2020/21 and it is imperative to ensure that they are actually completed. These are indicated in table 9
below:
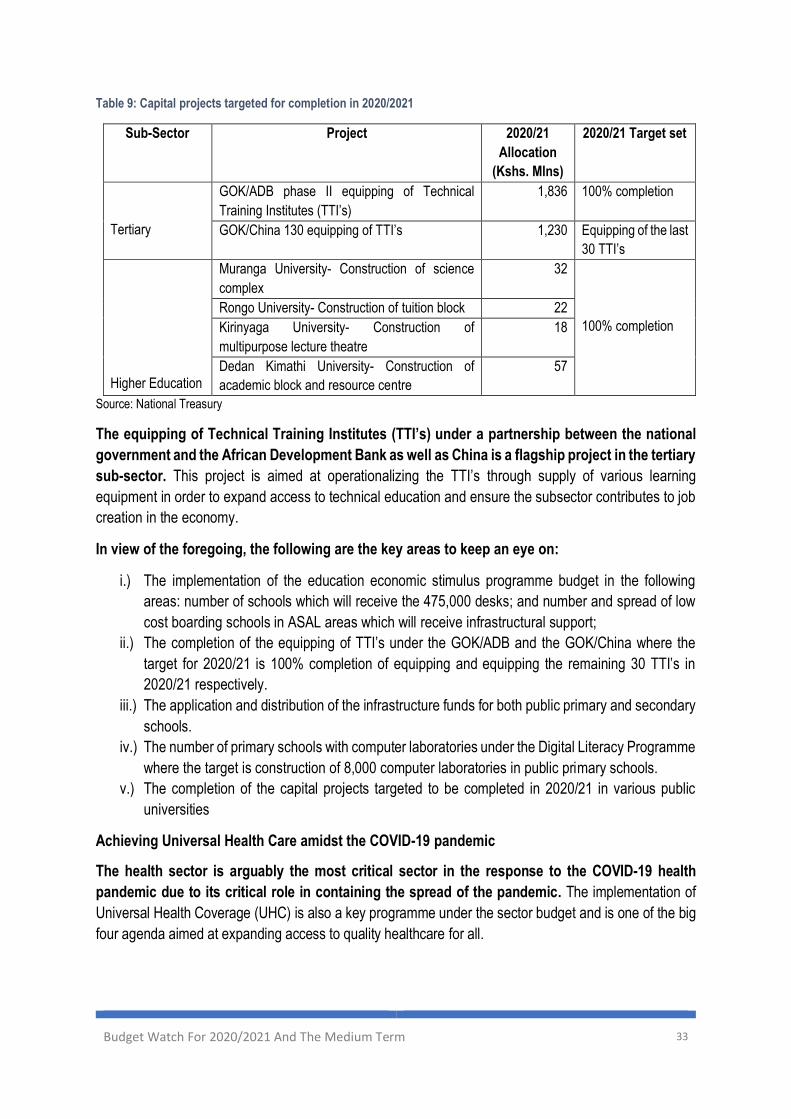
Budget Watch For 2020/2021 And The Medium Term 33
Table 9: Capital projects targeted for completion in 2020/2021
Sub-Sector Project 2020/21
Allocation
(Kshs. Mlns)
2020/21 Target set
Tertiary
GOK/ADB phase II equipping of Technical
Training Institutes (TTI’s)
1,836 100% completion
GOK/China 130 equipping of TTI’s 1,230 Equipping of the last
30 TTI’s
Higher Education
Muranga University- Construction of science
complex
32
100% completion
Rongo University- Construction of tuition block 22
Kirinyaga University- Construction of
multipurpose lecture theatre
18
Dedan Kimathi University- Construction of
academic block and resource centre
57
Source: National Treasury
The equipping of Technical Training Institutes (TTI’s) under a partnership between the national
government and the African Development Bank as well as China is a flagship project in the tertiary
sub-sector. This project is aimed at operationalizing the TTI’s through supply of various learning
equipment in order to expand access to technical education and ensure the subsector contributes to job
creation in the economy.
In view of the foregoing, the following are the key areas to keep an eye on:
i.) The implementation of the education economic stimulus programme budget in the following
areas: number of schools which will receive the 475,000 desks; and number and spread of low
cost boarding schools in ASAL areas which will receive infrastructural support;
ii.) The completion of the equipping of TTI’s under the GOK/ADB and the GOK/China where the
target for 2020/21 is 100% completion of equipping and equipping the remaining 30 TTI’s in
2020/21 respectively.
iii.) The application and distribution of the infrastructure funds for both public primary and secondary
schools.
iv.) The number of primary schools with computer laboratories under the Digital Literacy Programme
where the target is construction of 8,000 computer laboratories in public primary schools.
v.) The completion of the capital projects targeted to be completed in 2020/21 in various public
universities
Achieving Universal Health Care amidst the COVID-19 pandemic
The health sector is arguably the most critical sector in the response to the COVID-19 health
pandemic due to its critical role in containing the spread of the pandemic. The implementation of
Universal Health Coverage (UHC) is also a key programme under the sector budget and is one of the big
four agenda aimed at expanding access to quality healthcare for all.

Budget Watch For 2020/2021 And The Medium Term 34
The approved health sector budget for financial year 2020/2021 is Kshs 111.7 Billion. This
constitutes five programmes which will be implemented by the Ministry of Health and its various semi-
autonomous agencies (SAGA’s). The key strategic interventions and the targets set are indicated below.
Table 10: Key strategic interventions in the Ministry of Health Budget
Key interventions
2020/21 allocation
(Kshs Billions)
2020/21 Target
Free maternity programme (Linda mama programme)
4.1 72% of deliveries
conducted by skilled
health workers
Provision of Health cover to the elderly and the
vulnerable
1.9 195,000 vulnerable
households covered
Scale up of UHC project 12.6 47 counties covered
Provision of Vaccines and immunizations
1.4 90% of children
immunized
Construction of Regional cancer centres
1.3 One cancer centre
completed
Provision of beds and beddings to public hospitals
0.5 20,000 beds and
beddings
Provision of walk through sanitizers in public
hospitals and at border points
0.025 50 walk through
sanitizers
Source: National Treasury
The interventions highlighted above are critical since they are aimed at addressing pertinent concerns
within the sector, such as reducing children mortality, reducing the high out of pocket health related
expenditures among households as well as addressing the global health crisis.
There are key areas to monitor during the implementation of the health sector 2020/21 budget:
The first relates to the purchase of 20,000 locally sourced hospital beds which will expand hospitals bed
capacity as well as expand treatment access for COVID 19 patients requiring critical care. Given that
these beds are to be sourced locally, there is need to ensure that they meet the required medical
standards. This is a responsibility of the Ministry of Health. Furthermore, the number of hospitals which
will receive these hospital beds should be clearly stipulated with the determining factor being the COVID
19 burden in various regions.
The second area of focus is the implementation of UHC which began in 2018 and is expected to be fully
implemented by 2022. After the piloting programme of UHC, the approach adopted for the delivery of
UHC is in two aspects: firstly, the strengthening of the primary health system (county level) through
ensuring provision of Health products and technologies - a responsibility assigned to the Kenya Medical
Supplies Agency (KEMSA) and having requisite number of health human resources - a responsibility
assigned to both levels of government. These two aspects of UHC delivery are supported by the inter-
partnership agreements (IPA’s) between the two levels of government.
The sector has also been allocated Kshs 5.4 Billion which will be channelled to KEMSA for supply
of essential health products and technologies (HPT’s) to counties. The target set is 100% UHC

Budget Watch For 2020/2021 And The Medium Term 35
HPT’s refill rates. The risk here is procurement processes within KEMSA which may result to delays and
failure to fully adhere to the procurement laws when purchasing the HPT’s.
The second aspect is the provision of social health insurance to vulnerable persons for patients
accessing health service in level 4 to 6 health facilities. The National Hospital Insurance Fund (NHIF)
has been identified as the institution to provide social insurance. However for NHIF to offer social
insurance, legal and administrative reforms are currently ongoing. Under the UHC, Kshs 6.3 Billion has
been allocated for social health insurance. The risk here is the slow pace of reforms at the NHIF in order
to transform it to a social insurance provider. This may hinder the utilization of the funds allocated.
To ensure that the sector responds to the COVID 19 pandemic as well as ensure that
implementation of UHC remains on course, the following are the key areas to keep an eye on
during the implementation of the 2020/21 budget:
i. The rollout of the social health cover under a reformed NHIF as part of UHC where the 2020/21
target is to cover 195,000 vulnerable households;
ii. The implementation of the Inter Partnership Agreements (IPA’s) between the National and
County governments in the provision of essential medicines for UHC under KEMSA where the
target is 100% supply of health products and technologies to counties.
iii. Track the progress in implementing interventions aimed reducing the COVID 19 infections in the
country which includes recruitment of 5,000 health workers, provision of 20,000 hospital beds to
hospitals, provision of 50 walk through sanitizers at border points and in hospitals as well as
testing of 32,000 persons.
iv. Fast tracking the governance issues related to accountability in the supply chain of health related
goods and services.
Social Welfare for the Vulnerable
The COVID -19 Pandemic has significantly disrupted livelihoods. The International Labour
Organization (ILO) estimates that, in the second quarter of 2020, 195 million full-time workers lost
employment globally. It is further estimated that by the end of this year, workers will lose $ 3.4 trillion
equivalent of income.20
Domestically, the disruption in the transport industry, the dusk to dawn curfew, closure of restaurants and
entertainment joints coupled with restriction of movement for the most affected counties had an adverse
effect on employment particularly in the informal sector. The resultant loss of income as a result of these
measures has increased the vulnerable population in the country and hence the need for urgent policy
interventions.
The Social Protection sector plays a key role in alleviating the challenges associated with the
Covid-19 pandemic because of its central role in the provision of social assistance to the vulnerable
including Older persons, Orphans, vulnerable children and the disabled.
20 The United Nations Department of Global Communications (DGC)
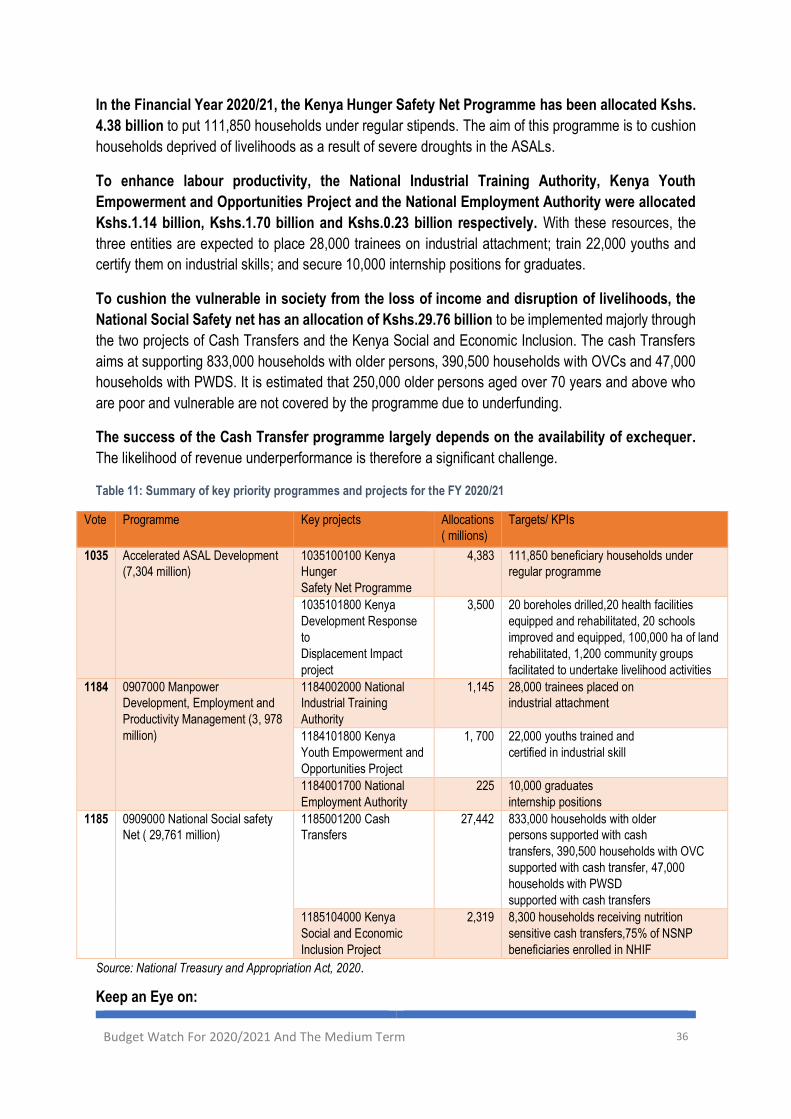
Budget Watch For 2020/2021 And The Medium Term 36
In the Financial Year 2020/21, the Kenya Hunger Safety Net Programme has been allocated Kshs.
4.38 billion to put 111,850 households under regular stipends. The aim of this programme is to cushion
households deprived of livelihoods as a result of severe droughts in the ASALs.
To enhance labour productivity, the National Industrial Training Authority, Kenya Youth
Empowerment and Opportunities Project and the National Employment Authority were allocated
Kshs.1.14 billion, Kshs.1.70 billion and Kshs.0.23 billion respectively. With these resources, the
three entities are expected to place 28,000 trainees on industrial attachment; train 22,000 youths and
certify them on industrial skills; and secure 10,000 internship positions for graduates.
To cushion the vulnerable in society from the loss of income and disruption of livelihoods, the
National Social Safety net has an allocation of Kshs.29.76 billion to be implemented majorly through
the two projects of Cash Transfers and the Kenya Social and Economic Inclusion. The cash Transfers
aims at supporting 833,000 households with older persons, 390,500 households with OVCs and 47,000
households with PWDS. It is estimated that 250,000 older persons aged over 70 years and above who
are poor and vulnerable are not covered by the programme due to underfunding.
The success of the Cash Transfer programme largely depends on the availability of exchequer.
The likelihood of revenue underperformance is therefore a significant challenge.
Table 11: Summary of key priority programmes and projects for the FY 2020/21
Vote Programme Key projects Allocations
( millions)
Targets/ KPIs
1035 Accelerated ASAL Development
(7,304 million)
1035100100 Kenya
Hunger
Safety Net Programme
4,383 111,850 beneficiary households under
regular programme
1035101800 Kenya
Development Response
to
Displacement Impact
project
3,500 20 boreholes drilled,20 health facilities
equipped and rehabilitated, 20 schools
improved and equipped, 100,000 ha of land
rehabilitated, 1,200 community groups
facilitated to undertake livelihood activities
1184 0907000 Manpower
Development, Employment and
Productivity Management (3, 978
million)
1184002000 National
Industrial Training
Authority
1,145 28,000 trainees placed on
industrial attachment
1184101800 Kenya
Youth Empowerment and
Opportunities Project
1, 700 22,000 youths trained and
certified in industrial skill
1184001700 National
Employment Authority
225 10,000 graduates
internship positions
1185 0909000 National Social safety
Net ( 29,761 million)
1185001200 Cash
Transfers
27,442 833,000 households with older
persons supported with cash
transfers, 390,500 households with OVC
supported with cash transfer, 47,000
households with PWSD
supported with cash transfers
1185104000 Kenya
Social and Economic
Inclusion Project
2,319 8,300 households receiving nutrition
sensitive cash transfers,75% of NSNP
beneficiaries enrolled in NHIF
Source: National Treasury and Appropriation Act, 2020.
Keep an Eye on:
Budget Watch For 2020/2021 And The Medium Term 37
i. The Timely release of the approved resources for cushioning the vulnerable in society especially
the cash transfers under the National Social Safety Net and the Hunger Safety Net programmes
so as to guarantee seamless and predictable flow of cash to the 1.38 million beneficiary
households under the two programmes
ii. The progress in the distribution and placement of the 28,000 trainees in industrial attachment
and the training and certification of 22,000 youth in industrial Skills to enhance labour productivity
iii. Whether the Planned enrolment of 75% of NSNP beneficiaries to the National Hospital Insurance Fund (NHIF) through the Kenya Social and Economic Inclusion Project is achieved, and ensure that at least 50% of the target is achieved by December, 2020.
In response to the undesirable consequences of the COVID-19 pandemic on livelihoods, the
National Hygiene Programme (NHP) dubbed Kazi Mtaani was conceptualized. The initiative was
designed to be implemented in two phases with the first phase implemented from 29th April 2020 to 26th
June 2020. The first phase of the programme targeted slum areas in eight counties and benefitted a total
of 31,689 vulnerable youths living in slums and informal settlements.
Phase two of the programme has been allocated Kshs.10 billion in the FY 2020/2021 approved budget
and targets to engage 282,617 vulnerable youths living in slums and informal settlements in urban areas
across the 47 Counties for a duration of six and a half months21. It is expected that the youths will be
engaged in productive labour based economic activities that will enhance money circulation and stimulate
the economy.
Implementation of the programme however, presents some challenges. Firstly, coordination and
execution of the programme is a significant challenge to implementation of the initiative. This is because
the approved resources are spread under various votes, for instance, the State Department for Housing
and Urban Development has been allocated Kshs. 3,000 million, State Department for Infrastructure has
Kshs. 5,000 million, office of the president through NMS has been allocated Kshs. 1,155 million and the
Ministry of Water has been allocated Kshs. 845 million. Thus clear coordination is paramount. Secondly,
recruitment procedures for the programme are opaque and are prone to abuse, nepotism, favouritism
and corruption. In addition, there are no clear expected outputs from the various activities in which the
youth are engaged in.
Keep an eye on:
i. Success in the roll out of the Kazi Mtaani initiative that is devoid of abuse, nepotism, favouritism
and corruption to ensure proper identification of the target beneficiaries in all the Counties.
21 Ministry of Transport, Infrastructure, Public Works, Housing and Urban Development

Budget Watch For 2020/2021 And The Medium Term 38
2.2. Infrastructure
2.2.1. Enhancing Implementation of projects in the Transport Infrastructure
The government has continued to invest heavily in transport infrastructure and has invested in
major infrastructure projects such as expansion of the road network, Airports, ports and the
construction of the Standard Gauge Railway from Mombasa to Malaba. However, despite the huge
investments in the sector, inadequate funding is still an impediment to project implementation. The sector
has huge resource requirements due to the Capital intensiveness and huge portfolio especially in the
road subsector which is implementing over one thousand projects across the country.
The issue of pending bills is a significant bottleneck facing the sector. It is estimated that the road
sub-sector has accumulated an estimated Kshs. 80 billion worth of pending bills and there are pending
bills worth Kshs. 40 billion accruing from the operational cost of the Standard Gauge Railway. In an
attempt to address this, Kshs.60 billion was provided in the second Supplementary Estimates of
2019/2020. However, its utilization is yet to be reported on.
The SGR is not able to meet its financial obligation from its own revenue. An analysis of revenues
and operational expenditures of the SGR reveals that the SGR is nowhere near meeting its
financial obligations from its revenues. In this regard, thus there will be need to explore possibility of
accessing the Railway Development Levy Fund (RDLF) to pay the outstanding Bills.
Figure 18: Analysis of annual revenues vs. operational expenditures of the Standard Gauge Railway (SGR) from June 2017 to May 2020
Source: Ministry of Transport, Infrastructure, Public Works, Housing and Urban Development
In the Financial Year 2020/21, the sector has been allocated Kshs. 237.14 billion of which Kshs.
189.59 billion is earmarked for expanding the road network while Kshs. 47.55 billion is to support ports
and rail projects. In addition, the private sector plays a key role in upscaling and improving mobility
through Transport infrastructure among them the Construction JKIA – James Gichuru Express way.
969
5,600
13,581
4,889
7,398
14,051
17,976
7,299
(6,429)(8,451)
(4,395)(2,410)
(10,000)
(5,000)
-
5,000
10,000
15,000
20,000
2017 ( Jun-Dec) 2018 2019 2020 (Jan - May)
Revenue (millions) opperartion cost (millions) Deficit (millions)
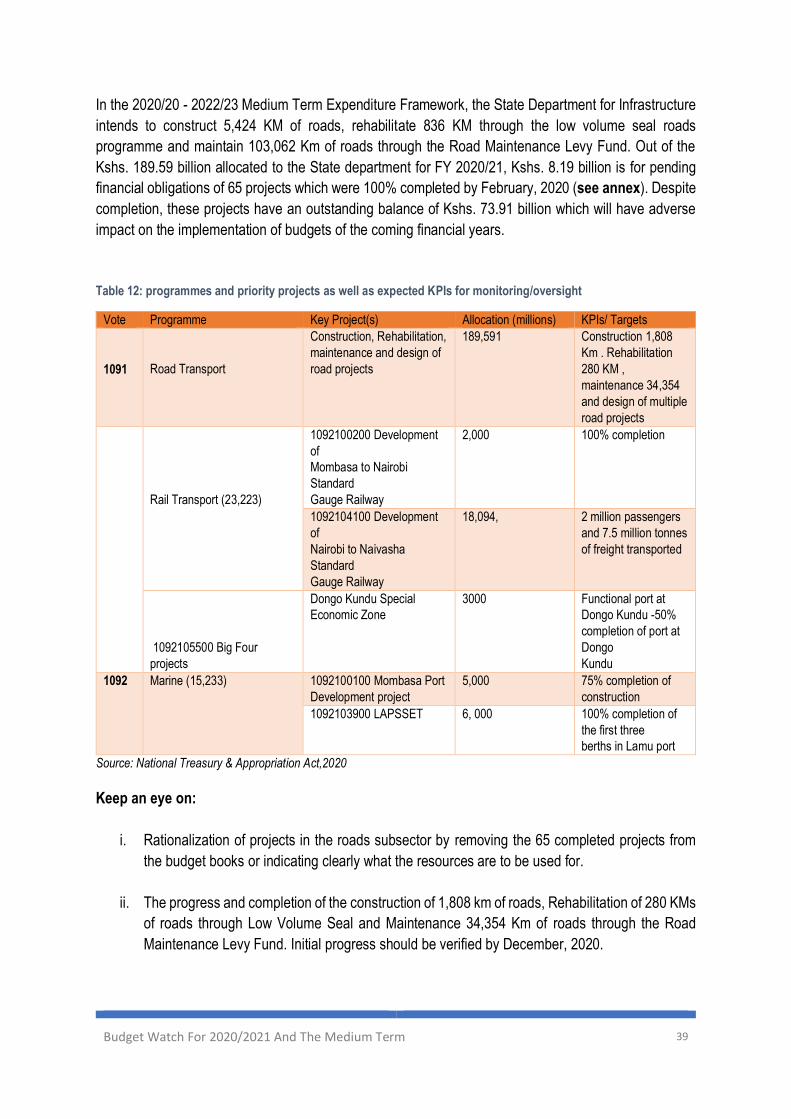
Budget Watch For 2020/2021 And The Medium Term 39
In the 2020/20 - 2022/23 Medium Term Expenditure Framework, the State Department for Infrastructure
intends to construct 5,424 KM of roads, rehabilitate 836 KM through the low volume seal roads
programme and maintain 103,062 Km of roads through the Road Maintenance Levy Fund. Out of the
Kshs. 189.59 billion allocated to the State department for FY 2020/21, Kshs. 8.19 billion is for pending
financial obligations of 65 projects which were 100% completed by February, 2020 (see annex). Despite
completion, these projects have an outstanding balance of Kshs. 73.91 billion which will have adverse
impact on the implementation of budgets of the coming financial years.
Table 12: programmes and priority projects as well as expected KPIs for monitoring/oversight
Vote Programme Key Project(s) Allocation (millions) KPIs/ Targets
1091
Road Transport
Construction, Rehabilitation,
maintenance and design of
road projects
189,591 Construction 1,808
Km . Rehabilitation
280 KM ,
maintenance 34,354
and design of multiple
road projects
Rail Transport (23,223)
1092100200 Development
of
Mombasa to Nairobi
Standard
Gauge Railway
2,000 100% completion
1092104100 Development
of
Nairobi to Naivasha
Standard
Gauge Railway
18,094, 2 million passengers
and 7.5 million tonnes
of freight transported
1092105500 Big Four
projects
Dongo Kundu Special
Economic Zone
3000 Functional port at
Dongo Kundu -50%
completion of port at
Dongo
Kundu
1092 Marine (15,233) 1092100100 Mombasa Port
Development project
5,000 75% completion of
construction
1092103900 LAPSSET 6, 000 100% completion of
the first three
berths in Lamu port
Source: National Treasury & Appropriation Act,2020
Keep an eye on:
i. Rationalization of projects in the roads subsector by removing the 65 completed projects from
the budget books or indicating clearly what the resources are to be used for.
ii. The progress and completion of the construction of 1,808 km of roads, Rehabilitation of 280 KMs
of roads through Low Volume Seal and Maintenance 34,354 Km of roads through the Road
Maintenance Levy Fund. Initial progress should be verified by December, 2020.
Budget Watch For 2020/2021 And The Medium Term 40
iii. Progress in the settlement of pending bills with respect to SGR operations and Road projects.
The Ministry should report on the status of the pending bills by end of the first half of the financial
year.
Investing in Energy to spur Economic Growth
Provision of efficient energy infrastructure and affordable and clean energy services is a major
catalyst in economic activities. However, even though substantial resources in the sector have been
deployed towards electricity modernization in the country, limited access and high energy costs especially
for industrial production and commercial use continues to adversely affect the competitiveness of the
economy. Furthermore, poor transport facilities and high cost of materials are significant bottlenecks in
achieving higher capacity utilization for industrial and construction establishments, estimated at an
average capacity of 63.6 per cent22. Despite recent policy impetus to scale up transmission and
distribution including subsidized last mile connections for universal access to electricity by households,
the connectivity and consumption target remains below committed levels. This is partly due to delays in
completion of transmission lines and associated substations as well as other factors such as
inappropriate pricing partly informed by generation obligations and variable costs (fuel cost, foreign
exchange and inflation adjustments) which suppress electricity consumption.
The onset of the COVID-19 pandemic appears to have worsened an already weak energy supply
and consumption situation in Kenya. Notably, reduced electricity demand occasioned by containment
measures and declining incomes is a material risk to sector performance. Declining consumer demand
is likely to be more disproportionately pronounced among some sector players such as the key power
distributor - Kenya Power and its broader supply networks, taking into account its declining pre-crisis
performance23, which reflected approximately 64% lower profit-after-tax in the year ended 2018. With the
gradual phasing out of the COVID-19 containment measures, the electricity sector is expected to support
economic recovery.
The energy sector is one of the top priorities of the government due to its ability to spur economic
growth as a critical enabler to the Big Four agenda. Ensuring robust electricity generation and
maintaining a stable electricity supply during the COVID-19 pandemic period is important for economic
recovery. In FY 2020/21, the total budgetary allocation to the Energy sector is KSh 72.49 billion; of which
80% is under the Transmission and Power Distribution programme and 14% is for the Power Generation
Programme which is critical for development of grid power infrastructure. Other programmes include the
Administration Planning and Support Services Programme (1%) which supports project governance and
necessary operational/technical needs; and the Alternative Energy Technologies Programme (5%) which
comprises interventions such as installation and maintenance of solar projects targeting institutions and
community boreholes, small hydropower projects, and other renewable energy initiatives such as the
efficient use of biomass.
22 Economic survey , 2020 23 https://kplc.co.ke/img/full/zTKNb9GQqjoc_Profit%20Warning%20Announcement%20-%2019.09.2019.pdf on 2019 profit warnings in excess of 25% net earnings compared to 2018 performance and Financial statement for FY 2018

Budget Watch For 2020/2021 And The Medium Term 41
A total of 72 total projects are currently under implementation with the outstanding cost to completion
estimated at KSh 431.061 billion24 (4% of GDP) in the medium term. Thus substantial resources will be
required in future development budgets of the sector. In the last financial year, approximately 58 capital
projects were under implementation. The additional projects are mainly Big Four related projects such as
electrification of Dongu Kondu SEZ and Naivasha Industrial Park, electrification of hospitals and
healthcare facilities.
Budget execution challenges are an impediment to project implementation. Emerging contractual
risks such as bankruptcy of some contractors involved in construction of key transmission lines has
delayed project timelines. This is particularly the case under the transmission lines and geothermal
generation project in steam developed fields in Menengai in Nakuru. This is likely to lead to cost overruns
and a delay in achieving least-cost power development objectives.
Other challenges to budget execution include:
I. In year revisions affecting key projects such as street lighting, Power Transmission System
Improvement Projects, electrification of Level 3 and Level 4 hospitals, connecting food
processing plants and housing schemes as was the case in FY 2019/20;
II. Outstanding pending bills which are likely to affect capacity of sector utilities to manage own
operations and future implementation of energy infrastructure and connectivity projects on
behalf of the government. Such arrangements which have also occasioned pending bills are
mostly between REREC and KPLC, with outstanding claims under REREC and GoK amounting
to KSh 12.76 billion for rural electrification including primary schools connectivity, among others;
III. Lack of performance data for programmes and projects under implementation which are
subsequently not reported by the Controller of Budget to parliament.
High and uncompetitive pricing of energy remains a sticky point since prevailing tariffs are
inconsistent with policy targets on cost of power for industry and households25. Domestic and
industrial power costs have remained high, despite the rising share of renewable energy sources in the
national grid.
Key projects under implementation in the FY 2020/21 budget include last mile connectivity (Ksh 6.6
billion); Street lighting (Ksh 300 million); electrification of public facilities (Ksh 7.3 billion) and installation
of transformers in constituencies (Ksh 900 million) by REREC; Olkaria – Lessos – Kisumu Transmission
Line ( 5.9 billion); Machakos – Konza – Kajiado – Namanga Transmission Line (Ksh 706 million); Bogoria
- Silali geothermal exploration (Ksh 1.75 billion) and Menengai Geothermal projects (Ksh 2.37 billion) in
Bogoria/West Pokot and Nakuru Counties respectively; and connectivity of Dongu Kundu SEZ (Ksh 2.00
billion) in Mombasa County. Timely completion of these projects will enhance grid stability and improve
access to electricity as well as reduce system losses. For western Kenya in particular, completion of the
Olkaria – Lessos – Kisumu Transmission Line will reduce the current reliance on power imports from
Uganda.
24 2020/21 Ministerial Submissions on the 2020/21 Budget Estimates with the outstanding projects costs as at March 2020 and including for projects running up-to 2027/2028,. 25 Ministry of Energy past Submissions: Generation Tariff (US$cts/kWh) of 7.41, Industrial/Commercial Tariff (US$cts/kWh) of 9
Budget Watch For 2020/2021 And The Medium Term 42
Keep an Eye On:
To realize access to electricity and upscale provision of affordable power, there is need to focus on the
following key expected outputs and targets as well as related legal and policy measures:
i. Progress in construction of 2,946 KM of transmission lines and 21 transmission substations. This
includes 95% completion of the Olkaria – Lessos – Kisumu power lines which is beyond its
completion timeline as well as 100% completion of the Loiyangalani - Marsabit 400 KV
Transmission Line and Machakos Konza - Kajiado – Namanga transmission line and associated
substations.
ii. Construction and completion of 1,570 KM of distribution lines and 60 distribution substations -
critical to the uptake of and improved access to electricity.
iii. Electricity connection for 192,000 new customers under the Last Mile Electricity Connectivity and
another 14,900 under electrification of public facilities under rural electrification.
iv. The progress in the planned installation of 30,000 street lighting points with a target of 90, 000
in the medium term; and 1,958 transformer installations in constituencies across the country.
v. Installation of 75 solar PVs in institutions and/or community boreholes and adoption of 30,000
clean cooking solutions in the period under consideration.
vi. Pricing models used by the power distributors so as to ensure that both industrial and household
power users receive affordable and internationally competitive power tariffs.
2.3. Food Security to all Kenyans
Agriculture remains the leading driver of economic growth in Kenya and is the leading source of
employment for most Kenyan citizens. The sector has great potential for economic prosperity and has
been identified as a key factor in enabling the country to achieve the economic growth rate of 10 per cent
annually as envisaged in the Vision 2030. According to the Agricultural Sector Transformation and
Growth Strategy, this growth rate can be achieved through the transformation of smallholder farmers
from subsistence to an innovative, commercially-oriented and modern agricultural sector.
The production of staple food has either declined or remained stagnant in the recent years. The
production of maize for instance declined from 42.5 million bags in 2015 to 39.8 million bags in 2019
according to data from the Ministry of Agriculture, Livestock, Fisheries and Cooperatives. Similarly, the
production of beans declined from 8.5 million bags in 2015 to 8.3 million bags by 2019. The production
of potatoes however has remained at 2.0 million bags over the same period (see Figure 19).
Under the “Big Four” Agenda, the government is targeting to achieve food and nutrition security.
The overall strategy adopted by the government involves expanding irrigation schemes, supporting large-
scale production of staples, increasing access to agricultural inputs, implementing programmes to
support smallholder farmers and promoting the use of appropriate farming techniques among others26.
Despite these measures, Kenya has remained a net food importer as shown in the table below.
26 BPS 2020 and the Medium Term
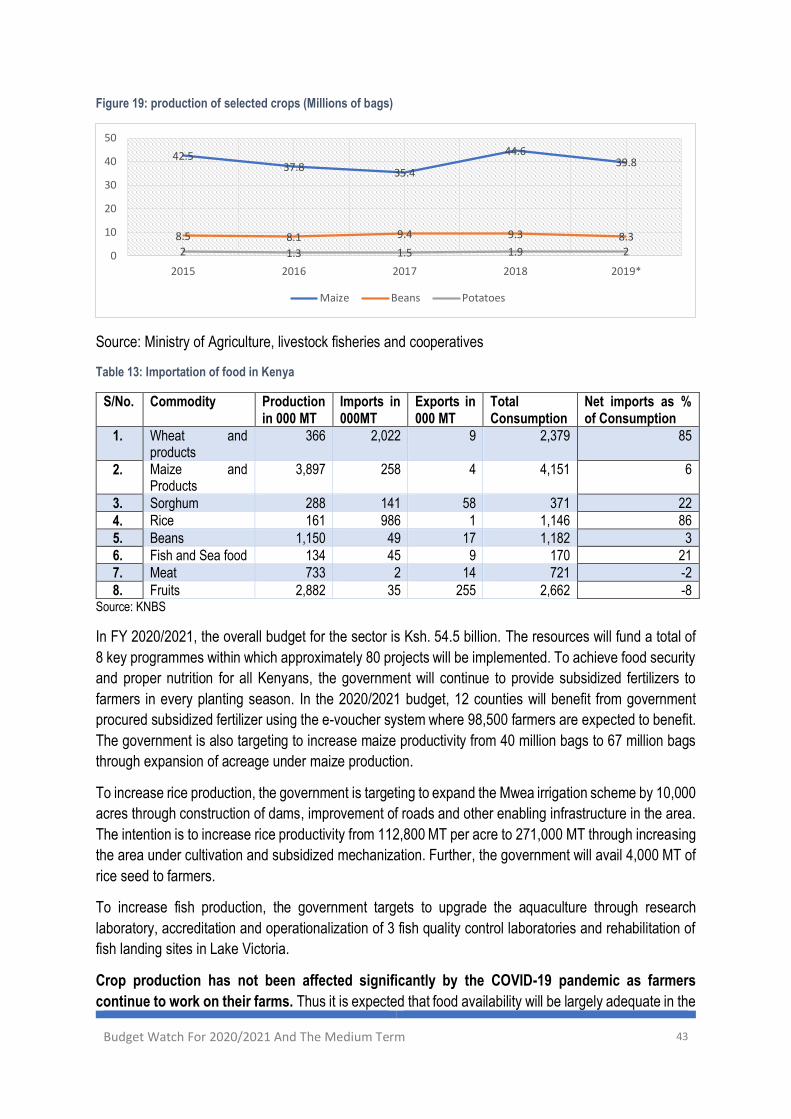
Budget Watch For 2020/2021 And The Medium Term 43
Figure 19: production of selected crops (Millions of bags)
Source: Ministry of Agriculture, livestock fisheries and cooperatives
Table 13: Importation of food in Kenya
S/No. Commodity Production in 000 MT
Imports in 000MT
Exports in 000 MT
Total Consumption
Net imports as % of Consumption
1. Wheat and products
366 2,022 9 2,379 85
2. Maize and Products
3,897 258 4 4,151 6
3. Sorghum 288 141 58 371 22
4. Rice 161 986 1 1,146 86
5. Beans 1,150 49 17 1,182 3
6. Fish and Sea food 134 45 9 170 21
7. Meat 733 2 14 721 -2
8. Fruits 2,882 35 255 2,662 -8 Source: KNBS
In FY 2020/2021, the overall budget for the sector is Ksh. 54.5 billion. The resources will fund a total of
8 key programmes within which approximately 80 projects will be implemented. To achieve food security
and proper nutrition for all Kenyans, the government will continue to provide subsidized fertilizers to
farmers in every planting season. In the 2020/2021 budget, 12 counties will benefit from government
procured subsidized fertilizer using the e-voucher system where 98,500 farmers are expected to benefit.
The government is also targeting to increase maize productivity from 40 million bags to 67 million bags
through expansion of acreage under maize production.
To increase rice production, the government is targeting to expand the Mwea irrigation scheme by 10,000
acres through construction of dams, improvement of roads and other enabling infrastructure in the area.
The intention is to increase rice productivity from 112,800 MT per acre to 271,000 MT through increasing
the area under cultivation and subsidized mechanization. Further, the government will avail 4,000 MT of
rice seed to farmers.
To increase fish production, the government targets to upgrade the aquaculture through research
laboratory, accreditation and operationalization of 3 fish quality control laboratories and rehabilitation of
fish landing sites in Lake Victoria.
Crop production has not been affected significantly by the COVID-19 pandemic as farmers
continue to work on their farms. Thus it is expected that food availability will be largely adequate in the
42.537.8 35.4
44.639.8
8.5 8.1 9.4 9.3 8.32 1.3 1.5 1.9 20
10
20
30
40
50
2015 2016 2017 2018 2019*
Maize Beans Potatoes

Budget Watch For 2020/2021 And The Medium Term 44
post coronavirus period. However, there are numerous challenges facing the agricultural sector which
will require critical focus during implementation of the 2020/21 budget. These include: dwindling arable
land, increasing human population, low agricultural productivity, limited extension services, erratic and
unreliable weather patterns, pest and disease prevalence, delivery and marketing of the agricultural
products amongst others.
The following are the key projects and investments being implemented in the financial year 2020/2021:
1) Kenya Livestock Insurance Scheme- the objective of the project is to cushion vulnerable
pastoral communities against drought. In the current financial year, the target is to insure 300,000
tropical livestock units across 12 counties.
2) Regional Pastoral Livelihoods Resilience Project (RPLP)- the objective of the project is to
support pastoral and agro-pastoral communities in their efforts to reduce vulnerability to drought
related shocks through participatory approaches. In the current financial year, the projects
targets to: develop 14 boreholes and water pans; establish and rehabilitate 500 hectares under
pastures and fodder; construct 7 livestock markets; procure and administer 10 million vaccines
on cattle, sheep and goats.
3) Modernization/Rehabilitation of the Kenya Meat Commission Factory- the objective of the
project is to provide market for livestock and livestock products. In the current financial year, the
KMC seeks to produce and market 3,150 metric tonnes of meat and meat products and 234
metric tonnes of by-products.
Keep an eye on:
i. The implementation and establishment of livestock insurance schemes for insuring
planned 300,000 tropical livestock units across 12 counties.
ii. Support to pastoral and agro-pastoral communities where there will be drilling of 14
boreholes and water pans, rehabilitation/ establishment of 500 hectares under pastures and
fodder; as well as procurement and administration of 10 million vaccines on cattle, sheep and
goats.
4) Drought Resilience and Sustainable Livelihood Programme in the Horn of Africa- in
2020/21, the target is to: rehabilitate 120 hectares of irrigation infrastructure; construct 44 water
structures (earth dams, boreholes, water pans); and to plant 40 hectares of improved pastures.
5) Kenya Cereal Enhancement Programme (KCEP)- The project targets to increase the
productivity of smallholder farmers in cereal staples including maize, sorghum, millet, and
associated pulses, and to support smallholder farmers to graduate from subsistence to
commercial agriculture. During the FY 2020/21, the project targets to; provide 118,648
smallholders with production inputs and technological packages, train 18,119 small holder
farmers on harvest and post-harvest management for improved management of grains; and
refurbish 10 storage facilities.
Budget Watch For 2020/2021 And The Medium Term 45
Keep an eye on:
i. Provision of farm inputs and technological packages where 118,648 smallholder farmers will
be supplied with production inputs and technological packages.
ii. Training on harvest and post-harvest management. 18,119 smallholder farmers are to be
trained for improved management of grains.
6) National Value Chain Support Programme- the objective of the programme is to avail quality
crop production inputs to farmers across 12 counties in 2020/21. The programme seeks to:
procure 17,620 metric tonnes (MT) of subsidized fertilizers to benefit 98,500 farmers; procure
13,298 metric tonnes of lime, 1,121 metric tonnes of assorted seeds, and 113 metric tonnes of
agro-chemicals; enrol 328,400 farmers using digital e-subsidy platform.
Keep an eye on:
i. Procurement and distribution of 17,620 metric tons of subsidized fertilizers to 98,500 farmers.
ii. Procurement of; 13,298 metric tonnes of lime, 1,121 metric tonnes of assorted seeds, and 113
metric tonnes of agro-chemicals;
iii. Enrolment of 328,400 farmers using digital e-subsidy platform.
7) Food Security and Crop Diversification Project- the project seeks to: improve the livelihoods
of Miraa farmers; diversify food crops; and enhance food productivity. The livelihoods of miraa
farmers is to be improved through construction of water pans, dams, boreholes and construction
of miraa sheds. Food diversification is achieved through procurement and distribution of: green
grams, cow peas, sorghum, beans, cassava, sweet potato vines, cashew nuts, coconut,
macadamia, and certified potato seeds.
Keep an eye on:
i. Procurement and distribution of: 250 MT of green grams; 100 MT of cow peas; 100 MT of beans;
100,000 sweet potato vines; 60,000 MT of subsidized high yielding maize seeds; 4,000 MT rice
seeds; 100,000 macadamia seedlings; 100,000 cashew nuts seedlings to farmers.
8) Fisheries, Aquaculture and the Blue Economy is very essential in increasing food security
and income. Fisheries and aquaculture are essential in delivering fast socio-economic benefits
to the communities in the coastal areas. The 2020/21 budget will fund the Aquaculture Business
Development Programme, Kenya Marine Fisheries and Socio-Economic Development, the
exploitation of Living Resources under the Blue Economy, and rehabilitation of fish landing sites
in L. Victoria.
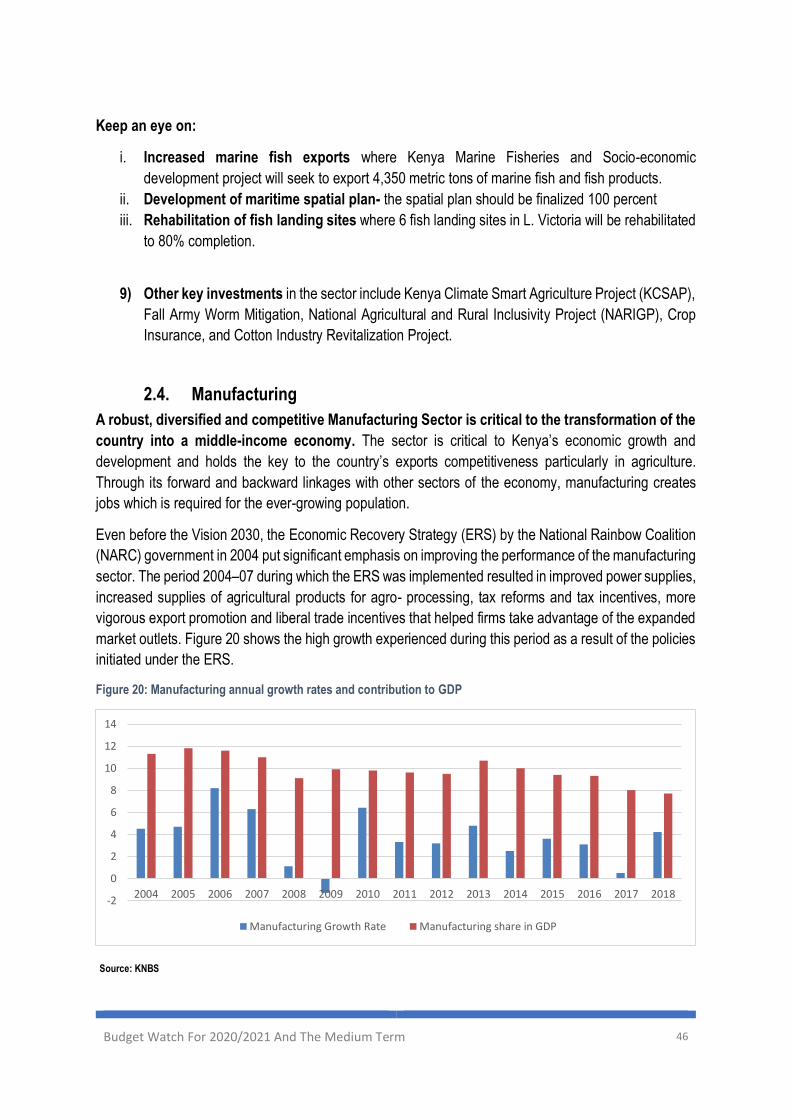
Budget Watch For 2020/2021 And The Medium Term 46
Keep an eye on:
i. Increased marine fish exports where Kenya Marine Fisheries and Socio-economic
development project will seek to export 4,350 metric tons of marine fish and fish products.
ii. Development of maritime spatial plan- the spatial plan should be finalized 100 percent
iii. Rehabilitation of fish landing sites where 6 fish landing sites in L. Victoria will be rehabilitated
to 80% completion.
9) Other key investments in the sector include Kenya Climate Smart Agriculture Project (KCSAP),
Fall Army Worm Mitigation, National Agricultural and Rural Inclusivity Project (NARIGP), Crop
Insurance, and Cotton Industry Revitalization Project.
2.4. Manufacturing
A robust, diversified and competitive Manufacturing Sector is critical to the transformation of the
country into a middle-income economy. The sector is critical to Kenya’s economic growth and
development and holds the key to the country’s exports competitiveness particularly in agriculture.
Through its forward and backward linkages with other sectors of the economy, manufacturing creates
jobs which is required for the ever-growing population.
Even before the Vision 2030, the Economic Recovery Strategy (ERS) by the National Rainbow Coalition
(NARC) government in 2004 put significant emphasis on improving the performance of the manufacturing
sector. The period 2004–07 during which the ERS was implemented resulted in improved power supplies,
increased supplies of agricultural products for agro- processing, tax reforms and tax incentives, more
vigorous export promotion and liberal trade incentives that helped firms take advantage of the expanded
market outlets. Figure 20 shows the high growth experienced during this period as a result of the policies
initiated under the ERS.
Figure 20: Manufacturing annual growth rates and contribution to GDP
Source: KNBS
-2
0
2
4
6
8
10
12
14
2004 2005 2006 2007 2008 2009 2010 2011 2012 2013 2014 2015 2016 2017 2018
Manufacturing Growth Rate Manufacturing share in GDP
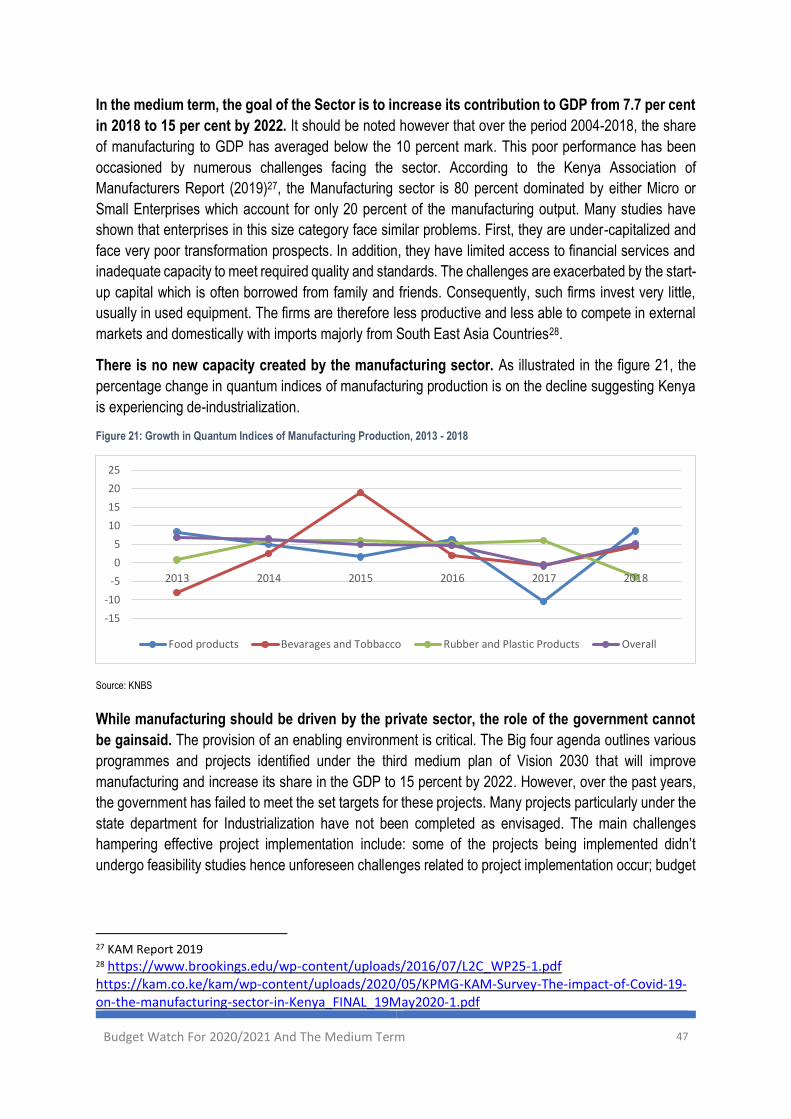
Budget Watch For 2020/2021 And The Medium Term 47
In the medium term, the goal of the Sector is to increase its contribution to GDP from 7.7 per cent
in 2018 to 15 per cent by 2022. It should be noted however that over the period 2004-2018, the share
of manufacturing to GDP has averaged below the 10 percent mark. This poor performance has been
occasioned by numerous challenges facing the sector. According to the Kenya Association of
Manufacturers Report (2019)27, the Manufacturing sector is 80 percent dominated by either Micro or
Small Enterprises which account for only 20 percent of the manufacturing output. Many studies have
shown that enterprises in this size category face similar problems. First, they are under-capitalized and
face very poor transformation prospects. In addition, they have limited access to financial services and
inadequate capacity to meet required quality and standards. The challenges are exacerbated by the start-
up capital which is often borrowed from family and friends. Consequently, such firms invest very little,
usually in used equipment. The firms are therefore less productive and less able to compete in external
markets and domestically with imports majorly from South East Asia Countries28.
There is no new capacity created by the manufacturing sector. As illustrated in the figure 21, the
percentage change in quantum indices of manufacturing production is on the decline suggesting Kenya
is experiencing de-industrialization.
Figure 21: Growth in Quantum Indices of Manufacturing Production, 2013 - 2018
Source: KNBS
While manufacturing should be driven by the private sector, the role of the government cannot
be gainsaid. The provision of an enabling environment is critical. The Big four agenda outlines various
programmes and projects identified under the third medium plan of Vision 2030 that will improve
manufacturing and increase its share in the GDP to 15 percent by 2022. However, over the past years,
the government has failed to meet the set targets for these projects. Many projects particularly under the
state department for Industrialization have not been completed as envisaged. The main challenges
hampering effective project implementation include: some of the projects being implemented didn’t
undergo feasibility studies hence unforeseen challenges related to project implementation occur; budget
27 KAM Report 2019 28 https://www.brookings.edu/wp-content/uploads/2016/07/L2C_WP25-1.pdf https://kam.co.ke/kam/wp-content/uploads/2020/05/KPMG-KAM-Survey-The-impact-of-Covid-19-on-the-manufacturing-sector-in-Kenya_FINAL_19May2020-1.pdf
-15
-10
-5
0
5
10
15
20
25
2013 2014 2015 2016 2017 2018
Food products Bevarages and Tobbacco Rubber and Plastic Products Overall
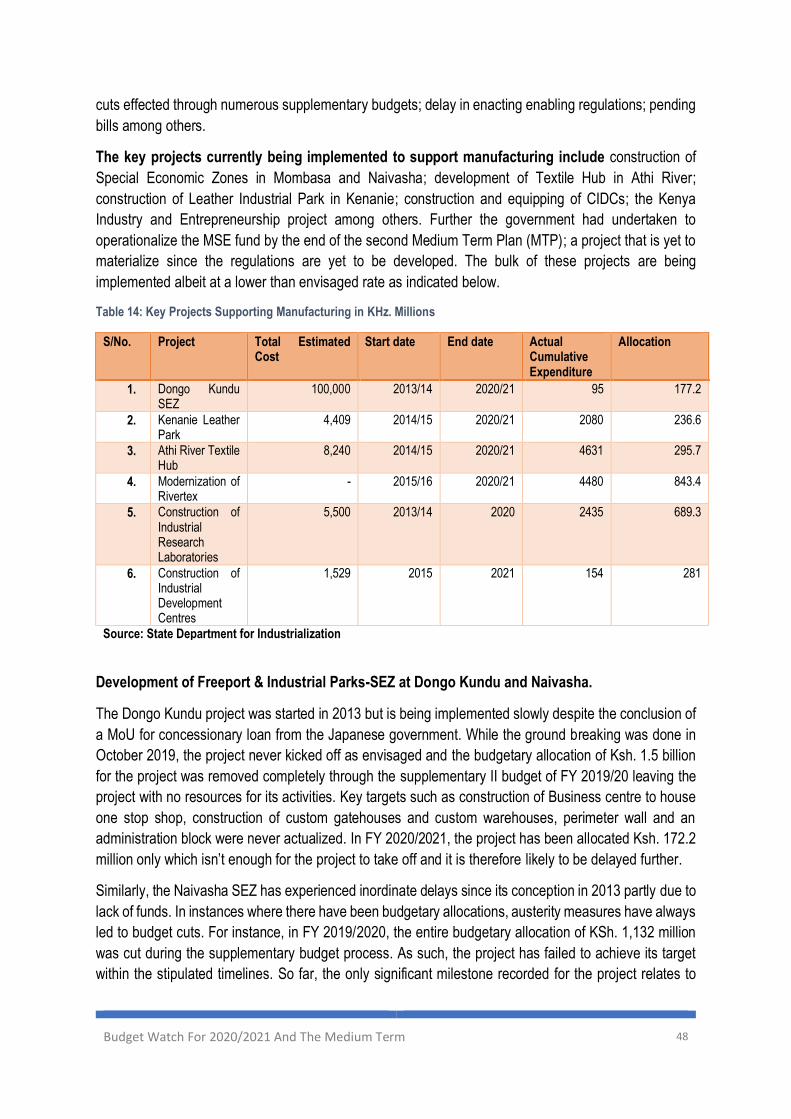
Budget Watch For 2020/2021 And The Medium Term 48
cuts effected through numerous supplementary budgets; delay in enacting enabling regulations; pending
bills among others.
The key projects currently being implemented to support manufacturing include construction of
Special Economic Zones in Mombasa and Naivasha; development of Textile Hub in Athi River;
construction of Leather Industrial Park in Kenanie; construction and equipping of CIDCs; the Kenya
Industry and Entrepreneurship project among others. Further the government had undertaken to
operationalize the MSE fund by the end of the second Medium Term Plan (MTP); a project that is yet to
materialize since the regulations are yet to be developed. The bulk of these projects are being
implemented albeit at a lower than envisaged rate as indicated below.
Table 14: Key Projects Supporting Manufacturing in KHz. Millions
S/No. Project Total Estimated Cost
Start date End date Actual Cumulative Expenditure
Allocation
1. Dongo Kundu SEZ
100,000 2013/14 2020/21 95 177.2
2. Kenanie Leather Park
4,409 2014/15 2020/21 2080 236.6
3. Athi River Textile Hub
8,240 2014/15 2020/21 4631 295.7
4. Modernization of Rivertex
- 2015/16 2020/21 4480 843.4
5. Construction of Industrial Research Laboratories
5,500 2013/14 2020 2435 689.3
6. Construction of Industrial Development Centres
1,529 2015 2021 154 281
Source: State Department for Industrialization
Development of Freeport & Industrial Parks-SEZ at Dongo Kundu and Naivasha.
The Dongo Kundu project was started in 2013 but is being implemented slowly despite the conclusion of
a MoU for concessionary loan from the Japanese government. While the ground breaking was done in
October 2019, the project never kicked off as envisaged and the budgetary allocation of Ksh. 1.5 billion
for the project was removed completely through the supplementary II budget of FY 2019/20 leaving the
project with no resources for its activities. Key targets such as construction of Business centre to house
one stop shop, construction of custom gatehouses and custom warehouses, perimeter wall and an
administration block were never actualized. In FY 2020/2021, the project has been allocated Ksh. 172.2
million only which isn’t enough for the project to take off and it is therefore likely to be delayed further.
Similarly, the Naivasha SEZ has experienced inordinate delays since its conception in 2013 partly due to
lack of funds. In instances where there have been budgetary allocations, austerity measures have always
led to budget cuts. For instance, in FY 2019/2020, the entire budgetary allocation of KSh. 1,132 million
was cut during the supplementary budget process. As such, the project has failed to achieve its target
within the stipulated timelines. So far, the only significant milestone recorded for the project relates to
Budget Watch For 2020/2021 And The Medium Term 49
compensation for land acquisition which was completed in 2019. Phase II of the project entails
construction of the necessary infrastructure and is expected to last for three years.
Keep an eye on:
i. The planned completion of basic infrastructure at Dongo Kundu SEZ by 15% through
constructions of a centre to house one stop shop and construction of custom gatehouses and
warehouses
ii. The planned completion of basic infrastructure at Naivasha SEZ by 25% through construction of
custom gatehouses and warehouses, perimeter wall, development of buffer zone and
landscaping.
Development of Leather Industrial Park
The construction of the Kenanie leather park has been started all over again with drawing up of a revised
master plan after heavy rains in 2018 rendered 60 percent of the land unsuitable29. The project which
was started in 2014 has also been regularly subjected to budget cuts which are often implemented
through the supplementary budget. Failure to complete the project as scheduled will lead to delayed
returns on investments. The budgetary allocation of KSh. 236 million is expected to facilitate completion
of the common effluent treatment plant, construction of access roads as well as preliminaries towards
the development of two tannery sheds, three footwear and leather goods sheds.
Keep an eye on:
i. The planned completion of the common effluent treatment plant at Kenanie Industrial Leather
Park by 40 percent.
Development of Athi River Textile Hub
The project which was started in 2014 was designed to host a serviced textile city at the Export
Processing Zone in Athi River in order to meet the manufacturing investments needs of garment
marketing firms. It was envisaged that the project would attract 100 textile investment firms to take up
investment opportunities relating to cotton ginning and yarn spinning, manufacture of textile fabrics and
home fabrics among other ventures at the textile city and thereby create more than 200,000 jobs.
However, this project has not been implemented as envisaged. Like Kenanie, it has been slow to attract
investments and the infrastructure system that was to be provided is yet to be finalized on account of
inadequate resources and budget cuts through supplementary budgets. The total cost of the project is
estimated at KSh. 8.2 billion but so far only KSh. 3.6 billion had been expended as at December 2019.
In FY 2020/2021, the project has been allocated KSh 297.5 million. These resources are targeted at
construction of new internal access roads, repair and re-carpeting of the existing internal roads.
Keep an eye on:
29 Ministry of |Industry, Trade and Cooperatives submission to Departmental committee on Trade and Industry during the scrutiny of 2019/20 estimates
Budget Watch For 2020/2021 And The Medium Term 50
i. The planned increase in investments in the EPZ by 35 percent with half year progress
assessment to be done by December 2020.
ii. The planned additional 62,000 jobs to protect livelihoods
iii. The planned increase in exports by KSh. 75 billion to the Unites States under the AGOA scheme
and the rest of the world.
Securing MSMEs jobs amidst COVID-19 pandemic
As noted earlier, Kenya’s manufacturing is 80 percent dominated by either Micro or Small Enterprises
which account for only 20 percent of the manufacturing output. Many studies have shown that enterprises
in this category face similar problems. The impact of COVID-19 on MSMEs is felt far much harder than
larger manufacturing firms and access to finance is far more difficult as they are considered high risk
enterprises30. To alleviate some of these challenges, the government is constructing Constituency
Industrial Development Centres as incubation centres to support the MSME sector. Further, a budgetary
allocation of KSh. 712 million has been provided in the FY 2020/21 budget for MSMEs to access finances.
However, failure to provide a clear legal framework for the fund may impede access to this facility.
Further to sustain MSMEs during the COVID -19 period, the government will continue with its policy of
“Buy Kenya Build Kenya” initiative. To this end the government intend to purchase 250,000 prefabricated
desks and buy 20,000 hospital beds locally mainly through the ministries of Education and Health. Further
the government will continue with the payment of historical pending bills owed to small businesses majorly
in the State Department for Correctional Services and the National Youth Service among others.
Keep an eye on:
i. Completion of and equipping of 115 Constituency Industrial Development Centres
ii. Facilitation of industrial incubation and financial support to MSMEs
iii. Amount of loan disbursed to MSE through loans by MSE Authority
iv. Development of an enabling SMEs policy
30 KPMG-KAM Joint Survey 2020
Budget Watch For 2020/2021 And The Medium Term 51
Chapter Three:
Enhancing Equity, transparency and accountability
to achieve the devolution dream
“A Man kept searching for his wallet under the street lamp because, he said when asked, it was too dark in the back street where he had lost it.”

Budget Watch For 2020/2021 And The Medium Term 52
3.0. Introduction
The advent of devolution in August 2010, ignited the hope of Kenyans for equitable development
across all parts of the country. For many years, centralized decision making with little participation at
the grassroots level had led to poor service delivery at the local level. The 2010 Constitution provided for
a basic minimum of 15% of the nationally raised revenues to be set aside to fund devolved functions.
Seven years down the line, and still counting, equitable development across the entire country is still a
dream. This is partly attributed to the amount of resources (equitable share) set aside to finance devolved
functions, the efforts in raising local revenues and the fundamental issues of governance and
accountability.
County governments have specific functions outlined in the constitution but without sufficient
resources and proper management, they may take a long time to efficiently and effectively deliver
on these functions. Transparency and Accountability are key pillars of governance. In the interest of
the public every Kenyan must take responsibility for their activities in an accountable and transparent
manner. Studies have shown that the higher the transparency and accountability in use of public
resources, the better the stability and growth of the economy.
The Budget is the only mechanism available for the county governments to deliver on each county
government agenda which in turn contributes positively or negatively to the overall country
development agenda. It is not possible to implement well a badly formulated budget. Thus as much as
some of the weaknesses in budget implementation at county level were inherited from the national
government the key to efficiency in delivery of county level services lies in improved execution of the
budget.
Budget execution just like in the national level calls for (i) ensuring that the budget is implemented as
approved by the legislature31 (ii) ensuring adherence to approved work plans, (iii) adhering to cash flow
plans (i) predictable county exchequer releases and (v) control of commitments.
3.1. Do counties get what they need or what is available?
3.1.1. County Equitable Share Compared to Sectors in National Government
Article 203 of Constitution outlines the criteria to be taken into consideration when determining the
equitable share. This includes the need to ensure that the county governments are able to perform the
functions allocated to them; the fiscal capacity and efficiency of county Governments; the developmental
and other needs of the counties; the economic disparities within and among counties and the need to
remedy them; and the desirability of stable and predictable allocation of revenue among others.
The share of equitable share to Counties has reduced over the years, from 3.9% of Nominal GDP
in 2014/15 to 2.8% in 2020/21 as shown in table 15. This is due to overall resource scarcity as well as
the rise of non-discretionary32 expenditures which have created inflexibility in the overall resource
envelope. It is noted that the county equitable share accounts for less resources than education and
infrastructure sectors in the National Government. The major concern should thus be the process of
31 County Assemblies 32 Non- discretionary in this case refers to public debt, interest payments and other related expenses
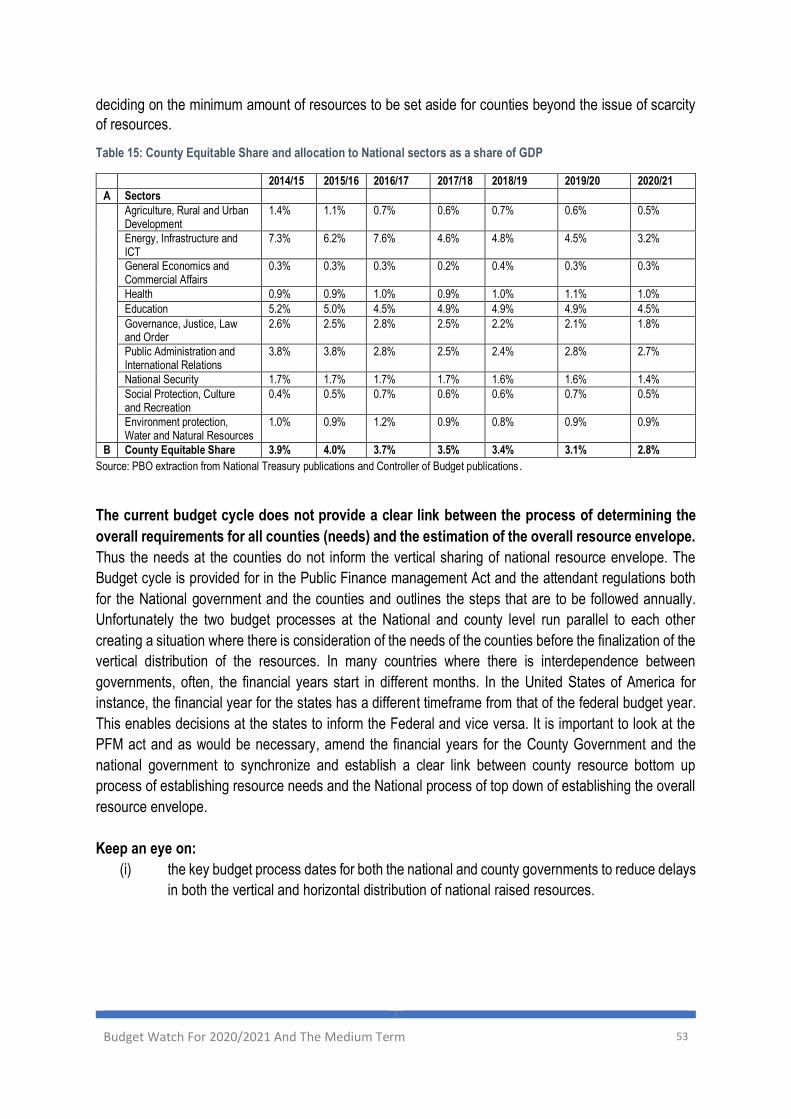
Budget Watch For 2020/2021 And The Medium Term 53
deciding on the minimum amount of resources to be set aside for counties beyond the issue of scarcity
of resources.
Table 15: County Equitable Share and allocation to National sectors as a share of GDP
2014/15 2015/16 2016/17 2017/18 2018/19 2019/20 2020/21
A Sectors
Agriculture, Rural and Urban Development
1.4% 1.1% 0.7% 0.6% 0.7% 0.6% 0.5%
Energy, Infrastructure and ICT
7.3% 6.2% 7.6% 4.6% 4.8% 4.5% 3.2%
General Economics and Commercial Affairs
0.3% 0.3% 0.3% 0.2% 0.4% 0.3% 0.3%
Health 0.9% 0.9% 1.0% 0.9% 1.0% 1.1% 1.0%
Education 5.2% 5.0% 4.5% 4.9% 4.9% 4.9% 4.5%
Governance, Justice, Law and Order
2.6% 2.5% 2.8% 2.5% 2.2% 2.1% 1.8%
Public Administration and International Relations
3.8% 3.8% 2.8% 2.5% 2.4% 2.8% 2.7%
National Security 1.7% 1.7% 1.7% 1.7% 1.6% 1.6% 1.4%
Social Protection, Culture and Recreation
0.4% 0.5% 0.7% 0.6% 0.6% 0.7% 0.5%
Environment protection, Water and Natural Resources
1.0% 0.9% 1.2% 0.9% 0.8% 0.9% 0.9%
B County Equitable Share 3.9% 4.0% 3.7% 3.5% 3.4% 3.1% 2.8%
Source: PBO extraction from National Treasury publications and Controller of Budget publications .
The current budget cycle does not provide a clear link between the process of determining the
overall requirements for all counties (needs) and the estimation of the overall resource envelope.
Thus the needs at the counties do not inform the vertical sharing of national resource envelope. The
Budget cycle is provided for in the Public Finance management Act and the attendant regulations both
for the National government and the counties and outlines the steps that are to be followed annually.
Unfortunately the two budget processes at the National and county level run parallel to each other
creating a situation where there is consideration of the needs of the counties before the finalization of the
vertical distribution of the resources. In many countries where there is interdependence between
governments, often, the financial years start in different months. In the United States of America for
instance, the financial year for the states has a different timeframe from that of the federal budget year.
This enables decisions at the states to inform the Federal and vice versa. It is important to look at the
PFM act and as would be necessary, amend the financial years for the County Government and the
national government to synchronize and establish a clear link between county resource bottom up
process of establishing resource needs and the National process of top down of establishing the overall
resource envelope.
Keep an eye on:
(i) the key budget process dates for both the national and county governments to reduce delays
in both the vertical and horizontal distribution of national raised resources.
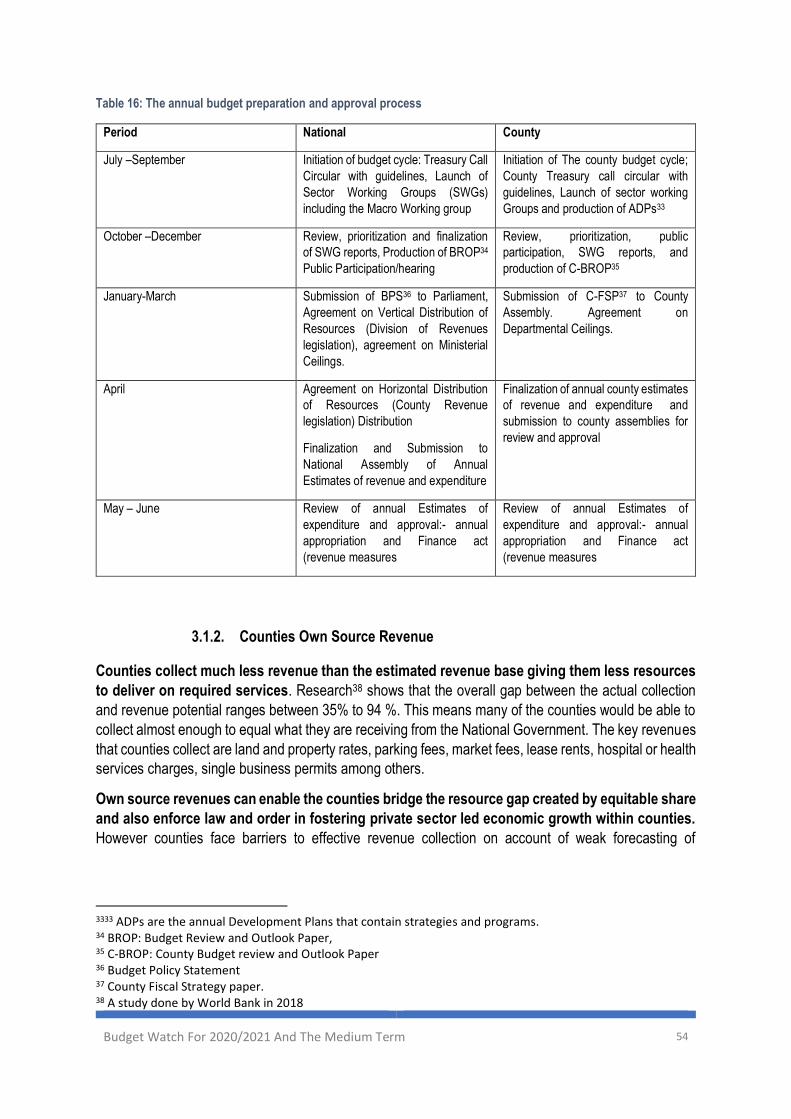
Budget Watch For 2020/2021 And The Medium Term 54
Table 16: The annual budget preparation and approval process
Period National County
July –September Initiation of budget cycle: Treasury Call
Circular with guidelines, Launch of
Sector Working Groups (SWGs)
including the Macro Working group
Initiation of The county budget cycle;
County Treasury call circular with
guidelines, Launch of sector working
Groups and production of ADPs33
October –December Review, prioritization and finalization
of SWG reports, Production of BROP34
Public Participation/hearing
Review, prioritization, public
participation, SWG reports, and
production of C-BROP35
January-March Submission of BPS36 to Parliament,
Agreement on Vertical Distribution of
Resources (Division of Revenues
legislation), agreement on Ministerial
Ceilings.
Submission of C-FSP37 to County
Assembly. Agreement on
Departmental Ceilings.
April Agreement on Horizontal Distribution
of Resources (County Revenue
legislation) Distribution
Finalization and Submission to
National Assembly of Annual
Estimates of revenue and expenditure
Finalization of annual county estimates
of revenue and expenditure and
submission to county assemblies for
review and approval
May – June Review of annual Estimates of
expenditure and approval:- annual
appropriation and Finance act
(revenue measures
Review of annual Estimates of
expenditure and approval:- annual
appropriation and Finance act
(revenue measures
3.1.2. Counties Own Source Revenue
Counties collect much less revenue than the estimated revenue base giving them less resources
to deliver on required services. Research38 shows that the overall gap between the actual collection
and revenue potential ranges between 35% to 94 %. This means many of the counties would be able to
collect almost enough to equal what they are receiving from the National Government. The key revenues
that counties collect are land and property rates, parking fees, market fees, lease rents, hospital or health
services charges, single business permits among others.
Own source revenues can enable the counties bridge the resource gap created by equitable share
and also enforce law and order in fostering private sector led economic growth within counties.
However counties face barriers to effective revenue collection on account of weak forecasting of
3333 ADPs are the annual Development Plans that contain strategies and programs. 34 BROP: Budget Review and Outlook Paper, 35 C-BROP: County Budget review and Outlook Paper 36 Budget Policy Statement 37 County Fiscal Strategy paper. 38 A study done by World Bank in 2018
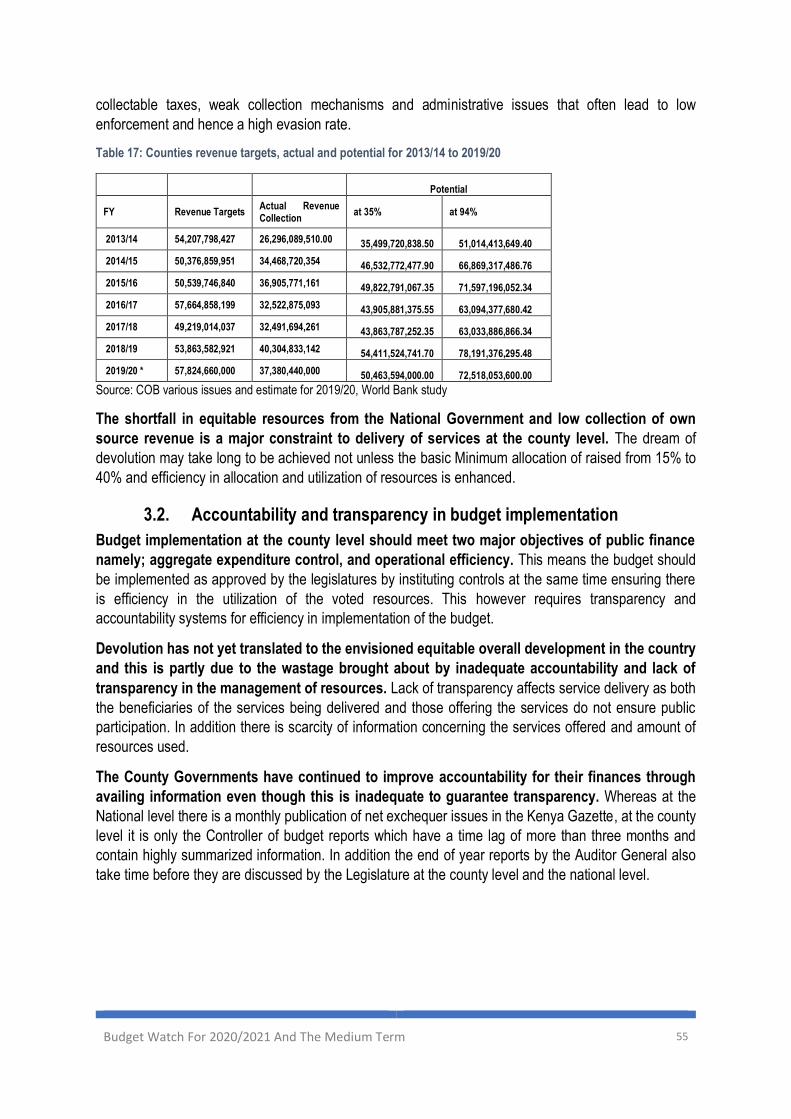
Budget Watch For 2020/2021 And The Medium Term 55
collectable taxes, weak collection mechanisms and administrative issues that often lead to low
enforcement and hence a high evasion rate.
Table 17: Counties revenue targets, actual and potential for 2013/14 to 2019/20
Potential
FY Revenue Targets Actual Revenue Collection
at 35% at 94%
2013/14 54,207,798,427 26,296,089,510.00 35,499,720,838.50 51,014,413,649.40
2014/15 50,376,859,951 34,468,720,354 46,532,772,477.90 66,869,317,486.76
2015/16 50,539,746,840 36,905,771,161 49,822,791,067.35 71,597,196,052.34
2016/17 57,664,858,199 32,522,875,093 43,905,881,375.55 63,094,377,680.42
2017/18 49,219,014,037 32,491,694,261 43,863,787,252.35 63,033,886,866.34
2018/19 53,863,582,921 40,304,833,142 54,411,524,741.70 78,191,376,295.48
2019/20 * 57,824,660,000 37,380,440,000 50,463,594,000.00 72,518,053,600.00
Source: COB various issues and estimate for 2019/20, World Bank study
The shortfall in equitable resources from the National Government and low collection of own
source revenue is a major constraint to delivery of services at the county level. The dream of
devolution may take long to be achieved not unless the basic Minimum allocation of raised from 15% to
40% and efficiency in allocation and utilization of resources is enhanced.
3.2. Accountability and transparency in budget implementation
Budget implementation at the county level should meet two major objectives of public finance
namely; aggregate expenditure control, and operational efficiency. This means the budget should
be implemented as approved by the legislatures by instituting controls at the same time ensuring there
is efficiency in the utilization of the voted resources. This however requires transparency and
accountability systems for efficiency in implementation of the budget.
Devolution has not yet translated to the envisioned equitable overall development in the country
and this is partly due to the wastage brought about by inadequate accountability and lack of
transparency in the management of resources. Lack of transparency affects service delivery as both
the beneficiaries of the services being delivered and those offering the services do not ensure public
participation. In addition there is scarcity of information concerning the services offered and amount of
resources used.
The County Governments have continued to improve accountability for their finances through
availing information even though this is inadequate to guarantee transparency. Whereas at the
National level there is a monthly publication of net exchequer issues in the Kenya Gazette, at the county
level it is only the Controller of budget reports which have a time lag of more than three months and
contain highly summarized information. In addition the end of year reports by the Auditor General also
take time before they are discussed by the Legislature at the county level and the national level.
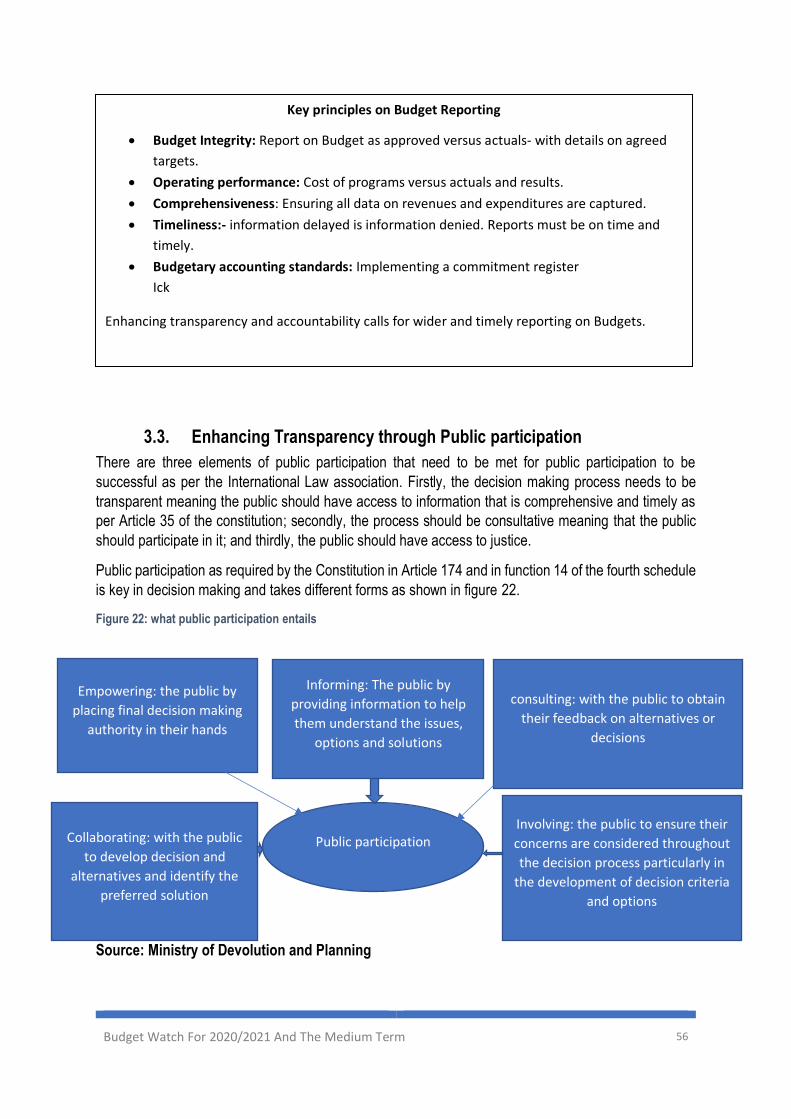
Budget Watch For 2020/2021 And The Medium Term 56
3.3. Enhancing Transparency through Public participation
There are three elements of public participation that need to be met for public participation to be
successful as per the International Law association. Firstly, the decision making process needs to be
transparent meaning the public should have access to information that is comprehensive and timely as
per Article 35 of the constitution; secondly, the process should be consultative meaning that the public
should participate in it; and thirdly, the public should have access to justice.
Public participation as required by the Constitution in Article 174 and in function 14 of the fourth schedule
is key in decision making and takes different forms as shown in figure 22.
Figure 22: what public participation entails
Source: Ministry of Devolution and Planning
Public participation
consulting: with the public to obtain
their feedback on alternatives or
decisions
Empowering: the public by
placing final decision making
authority in their hands
Involving: the public to ensure their
concerns are considered throughout
the decision process particularly in
the development of decision criteria
and options
Informing: The public by
providing information to help
them understand the issues,
options and solutions
Collaborating: with the public
to develop decision and
alternatives and identify the
preferred solution
Key principles on Budget Reporting
• Budget Integrity: Report on Budget as approved versus actuals- with details on agreed
targets.
• Operating performance: Cost of programs versus actuals and results.
• Comprehensiveness: Ensuring all data on revenues and expenditures are captured.
• Timeliness:- information delayed is information denied. Reports must be on time and
timely.
• Budgetary accounting standards: Implementing a commitment register
Ick
Enhancing transparency and accountability calls for wider and timely reporting on Budgets.
Budget Watch For 2020/2021 And The Medium Term 57
In planning and budget process, public participation in the county government should be undertaken from
the initial stage of planning and preparation of County Integrated Development Plan (CIDP), County
Annual Plan (ADP), County sectoral plans, Spatial Plans, Cities and Urban plans. The plans inform the
development and approval of the budget where public participation should also be carried out. The
County Budget Review and Outlook paper and County Fiscal Strategy Paper as well as the Finance Bill
require budget participation.
County government have carried out public participation since 2013/14 Financial year when the
country implemented the devolved system of government. However, majority of the counties do not
meet even the minimum expectations as shown in figure 22. This is mostly as a result of inadequate
resources and public participation activities that are carried out in an ad hoc manner with minimum
publicity and few members of the public attending mainly to comply with constitutional requirements. The
feedback on issues raised through public participation are also not provided to the public and no records
are maintained on the issues raised for future reference particularly on the demands that might not be
met in the short term.

Budget Watch For 2020/2021 And The Medium Term 58
References
1. World Bank. Kenya Economic Update. World Bank Group; 2020 Apr. Report No.: Edition No.
21.
2. African Development Bank. African Economic Outlook 2020 Supplement. African Development
Bank Group; 2020.
3. Lone SA, Ahmad A. COVID-19 pandemic–An African perspective. Emerging Microbes &
Infections. 2020;1–28.
4. Brenton P, Chemutai V. Trade Responses to the COVID-19 Crisis in Africa. World Bank; 2020.
5. Ataguba JE. COVID-19 pandemic, a war to be won: understanding its economic implications
for Africa. Springer; 2020.
6. Quaife M, van Zandvoort K, Gimma A, Shah K, McCreesh N, Prem K, et al. The impact of
COVID-19 control measures on social contacts and transmission in Kenyan informal settlements.
medRxiv. 2020;
7. Janssens W, Pradhan MP, de Groot R, Sidze E, Donfouet H, Abajobir A. The short-term
economic effects of COVID-19 and risk-coping strategies of low-income households in Kenya: A rapid
analysis using weekly financial household data. Tinbergen Institute Disucssion Paper. 2020;40.
8. KNBS. Survey on Socio Economic Impact of COVID-19 on Households Report Wave 2. Kenya
National Bureau of Statistics; 2020 Jun. Report No.: Wave 2.
9. McDonald B, Larson S. Implications of the Coronavirus on Sales Tax Revenue and Local
Government Fiscal Health. Available at SSRN 3571827. 2020;
10. McKibbin WJ, Fernando R. The global macroeconomic impacts of COVID-19: Seven
scenarios. 2020;
11. Baker SR, Farrokhnia RA, Meyer S, Pagel M, Yannelis C. How does household spending
respond to an epidemic? consumption during the 2020 covid-19 pandemic. National Bureau of
Economic Research; 2020.
12. Bang JT, Mitra A, Wunnava PV. Do remittances improve income inequality? An instrumental
variable quantile analysis of the Kenyan case. Economic Modelling. 2016;58:394–402.
13. Dendir S. Saving out of Remittances: Evidence from Ethiopia and Kenya. International
Migration. 2017;55(4):118–140.
14. Hines AL, Simpson NB. Migration, remittances and human capital investment in Kenya.
Economic Notes: Review of Banking, Finance and Monetary Economics. 2019;48(3):e12142.
15. Ashraf BN. Economic impact of government interventions during the COVID-19 pandemic:
International evidence from financial markets. Journal of Behavioral and Experimental Finance.
2020;100371.
16. Capital Markets Authority. The Capital Markets Soundness Report (CMSR). Nairobi, Kenya:
Capital Markets Authority; 2019 Quarter IV. Report No.: Volume XIII.
17. Osiki A. COVID-19 and Labour Law: Kenya. Italian Labour Law e-Journal. 2020;13(1S).
Budget Watch For 2020/2021 And The Medium Term 59
18. Mbae N. COVID-19 in Kenya. Electron J Gen Med. 2020; 17 (6): em231. 2020.
19. Yusufu AB, Oluwaseun JO. EFFECT OF GLOBAL PANDEMIC VIRUS (COVID-19) ON SMALL
BUSINESS IN OGUN STATE: EXPERIENCE FROM ABEOKUTA SOUTH LOCAL GOVERNMENT,
OGUN STATE NIGERIA.
20. Nicola M, Alsafi Z, Sohrabi C, Kerwan A, Al-Jabir A, Iosifidis C, et al. The socio-economic
implications of the coronavirus pandemic (COVID-19): A review. International journal of surgery
(London, England). 2020;78:185.
21. Ranasinghe R, Karunarathna C, Pradeepamali J. After Corona (Covid-19) Impacts On Global
Poverty and Recovery of Tourism Based Service Economies: An Appraisal. Available at SSRN
3591259. 2020;
22. Gössling S, Scott D, Hall CM. Pandemics, tourism and global change: a rapid assessment of
COVID-19. Journal of Sustainable Tourism. 2020;1–20.
23. Su\lkowski \Lukasz. Covid-19 pandemic; recession, virtual revolution leading to de-
globalization? Journal of Intercultural Management. 2020;12(1):1–11.
24. Kenya Association of Manufacturers. Closing the Manufacturing gap through the Big 4 agenda
for shared prosperity. 2019; 34-40
25. KPMG and KAM Joint Survey. The Impact of COVID-19 on the Manufacturing Sector in Kenya.
2020; 20-27
26. Ministry of devolution and planning and council of governors-county public participation guidelines
(2016)
27. Adam Smith international study commissioned by World Bank on behalf of National Treasury on Own-
Source revenue potential and tax gap study of Kenyans County Governments 2018.
Budget Watch For 2020/2021 And The Medium Term 60
Annexes
Annex 1: list of allowable deduction removed from the Income Tax Act
i) The 30% of electricity cost incurred by manufacturers in addition to the normal electricity
expense, subject to conditions set by the Ministry of Energy
ii) Entrance fee or annual subscription paid during that year of income to a trade association which
has made an election under Section 21(2) of this Act
iii) Expenditure of capital nature incurred in that year of income by a person, on legal costs and
other incidental expenses, relating to authorization and issue of shares, debentures and similar
securities offered for purchase by the general public.
iv) Expenditure of capital nature incurred in that year of income by a person, on legal costs and
other incidental expenses, for purposes of listing on any securities exchange operating in
Kenya, without raising additional capital
v) Expenditure of capital nature incurred in that year of income by a person on rating for the
purpose of listing on any securities exchange operating in Kenya
vi) Club subscription paid by an employer on behalf of an employee
vii) Expenditure of capital nature incurred in that year of income with prior approval by the Cabinet
Secretary, by a person on the construction of a public school, hospital, road or any similar kind
of social infrastructure
Annex 2: Exempt Income that was removed from Income Tax Act
i) Income from public boards
ii) Income from agricultural societies
iii) Interest on tax reserve
iv) Disturbance allowance for public servants
v) Allowance on foreign travels
vi) Emolument of officers of desert locust survey
vii) Education grant paid by the government of the United Kingdom under agreement with the
government of Kenya for public servants
viii) Remuneration for international corporation administration
ix) Income earned from working for a citizen of the United States of America on agricultural
research
x) Gains/profits from the UK atomic energy authority for discovery of uranium in Kenya

Budget Watch For 2020/2021 And The Medium Term 61
xi) Income from listed bonds, notes, or similar securities to raise funds for infrastructure and other
social services
xii) Bonus, overtime and retirement benefits not exceeding 10%
xiii) Dividends paid by a Special Economic Zone non-resident person
xiv) Compensating tax regarding power producers under power purchase agreement
xv) Interest from green bonds, among others
Annex 3: VAT exempt and zero rated goods and services proposed to be removed
(a) Proposed to be deleted from VAT exemption through the Tax Laws (Amendment) Act, 2020
i) Some helicopters and aeroplanes not exceeding 2,000 kg
ii) Helicopters and aeroplanes parts
iii) Mosquito nets
iv) Hand-made fishing nets
v) Fertilizers
vi) Materials for animal feeds
vii) Specialized equipment for solar and wind energy
viii) Tractors, other than road tractors for semi-trailers
ix) Materials for the manufacture of solar equipment
x) Plastic biogas digesters
xi) Biogas
xii) Leasing of biogas producing equipment
xiii) Parts for computer assembly
xiv) Taxable goods for the construction of industrial parks
xv) Inputs and raw materials for the for the manufacture of agricultural machinery
xvi) Museums and natural history exhibits and specimens
xvii) Chemicals, reagents, films etc for National Museums of Kenya
xviii) Goods for construction of tourism facilities, recreational parks and conference facilities
xix) Goods for clean cooking stoves
xx) Inputs for clean cooking stove
xxi) Stoves, cookers, barbeques etc
xxii) Inputs for the manufacture of pesticides
xxiii) Materials for the construction of grain storage facilities
xxiv) Transfer of business as a going concern
xxv) Goods for marine fisheries and fish processing
Budget Watch For 2020/2021 And The Medium Term 62
xxvi) Goods under Special Operating Framework Arrangement with government
xxvii) A motor vehicle for a returning public servant from foreign posting
xxviii) Plant, machinery and equipment for the construction of plastic recycle plant
(b) Exempt services proposed for removal from VAT Act
i) Insurance agency, insurance brokerage and stock exchange brokerage services
ii) Construction of industrial parks
iii) Entry fees for national parks and game reserves
iv) Tour operators
v) Construction of tourism facilities
vi) Construction of liquefied petroleum gas (LPG) storage facilities
vii) Assets transfer under Real Estate Investment Trusts (REITs)
viii) Supplies made under Special Operating Framework Arrangement (SOFA) with government
(c) Proposed to be removed from VAT Zero rate
i) Liquefied Petroleum Gas
ii) Supply of ordinary bread
iii) Inputs for the manufacture of agricultural pest control products
iv) Materials for the manufacture of automotive and solar batteries
Annex 4: Observations on the overhaul of Investment Allowance (Investment Deduction)
The following are some key observations on the repeal of the Second Schedule of the Income Tax Act:
i. Greatly simplifies the Schedule by repealing it to clearly provide for the rates of investment
deductions or allowances and removing unnecessary exemptions or waivers.
ii. Reduces proportion of investment deduction for machinery or buildings to maximum 50 % in
the first year of use to previous ridiculous 100% to 150% deduction.
iii. Reduces unfair treatment of various sectors and regions. For example, there is no
categorization of what rates should apply for major towns or rest of the country, or on whether
a company is in the SEZ or EPZ.
iv. While large companies received these generous investment waivers and treatments, most
small businesses have had to deal with high costs of initial investment.
v. The repeal helps address the problem of excessive tax expenditure associated with low
performance of corporate income tax in Kenya. It is therefore expected to improve corporate
income tax collection post COVID-19.

Budget Watch For 2020/2021 And The Medium Term 63
vi. Drops old, antiquated provisions dating 1960s and 1970s which are no longer applicable today.
vii. Removes the Commissioners power to increase the rates of deduction arbitrarily
viii. It should however be noted that for some industries like manufacturing, hotels buildings, and
hospitals, ships building among others are only allowed a one-off 50% investment deduction
while others are allowed to deduct up to 100% in successive years on a reducing balance.
ix. Removes deductions related to wear and tear of machinery or investments.
x. May affect rate of investment and FDI, but a simplified framework is better.
Annex 5: PAYE bands
Pay-As-You-Earn (PAYE) taxation bands, where the highest was reduced from 30% to 25%
Previous PAYE Bands
(KSh. P.M)
PAYE rate
(%)
New PAYE Bands (KSh.
P.M)
Rate (%)
First 12,298 10 First 24,000 10
The next 11,587 15 The next 16,666.7 15
The next 11,587 20 The next 16,666.7 20
The next 11,587 25 Above KSh. 57,333.3 25
Above 47,059 30 - -
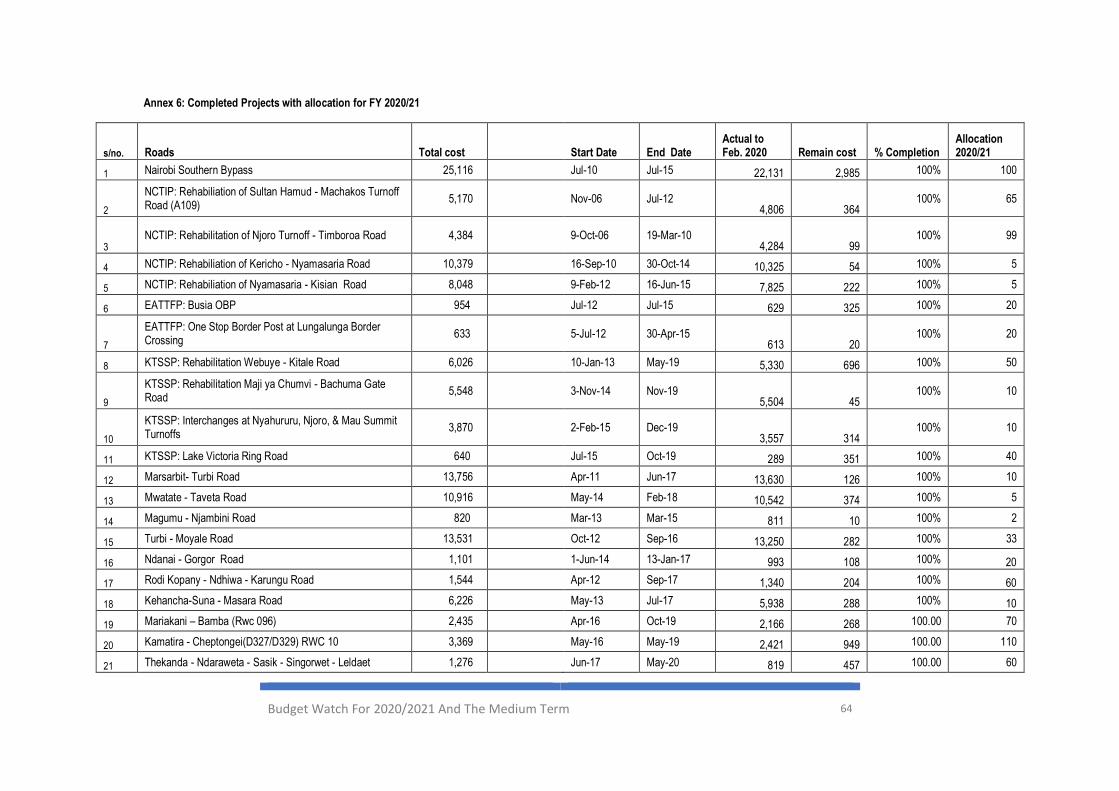
Budget Watch For 2020/2021 And The Medium Term 64
Annex 6: Completed Projects with allocation for FY 2020/21
s/no. Roads Total cost
Start Date End Date Actual to Feb. 2020 Remain cost % Completion
Allocation 2020/21
1 Nairobi Southern Bypass 25,116 Jul-10 Jul-15 22,131 2,985 100% 100
2
NCTIP: Rehabiliation of Sultan Hamud - Machakos Turnoff Road (A109)
5,170
Nov-06 Jul-12 4,806 364
100% 65
3 NCTIP: Rehabilitation of Njoro Turnoff - Timboroa Road 4,384
9-Oct-06 19-Mar-10
4,284 99 100% 99
4 NCTIP: Rehabiliation of Kericho - Nyamasaria Road 10,379 16-Sep-10 30-Oct-14 10,325 54 100% 5
5 NCTIP: Rehabiliation of Nyamasaria - Kisian Road 8,048 9-Feb-12 16-Jun-15 7,825 222 100% 5
6 EATTFP: Busia OBP 954 Jul-12 Jul-15 629 325 100% 20
7
EATTFP: One Stop Border Post at Lungalunga Border Crossing
633
5-Jul-12 30-Apr-15 613 20
100% 20
8 KTSSP: Rehabilitation Webuye - Kitale Road 6,026 10-Jan-13 May-19 5,330 696 100% 50
9
KTSSP: Rehabilitation Maji ya Chumvi - Bachuma Gate Road
5,548
3-Nov-14 Nov-19 5,504 45
100% 10
10
KTSSP: Interchanges at Nyahururu, Njoro, & Mau Summit Turnoffs
3,870
2-Feb-15 Dec-19 3,557 314
100% 10
11 KTSSP: Lake Victoria Ring Road 640 Jul-15 Oct-19 289 351 100% 40
12 Marsarbit- Turbi Road 13,756 Apr-11 Jun-17 13,630 126 100% 10
13 Mwatate - Taveta Road 10,916 May-14 Feb-18 10,542 374 100% 5
14 Magumu - Njambini Road 820 Mar-13 Mar-15 811 10 100% 2
15 Turbi - Moyale Road 13,531 Oct-12 Sep-16 13,250 282 100% 33
16 Ndanai - Gorgor Road 1,101 1-Jun-14 13-Jan-17 993 108 100% 20
17 Rodi Kopany - Ndhiwa - Karungu Road 1,544 Apr-12 Sep-17 1,340 204 100% 60
18 Kehancha-Suna - Masara Road 6,226 May-13 Jul-17 5,938 288 100% 10
19 Mariakani – Bamba (Rwc 096) 2,435 Apr-16 Oct-19 2,166 268 100.00 70
20 Kamatira - Cheptongei(D327/D329) RWC 10 3,369 May-16 May-19 2,421 949 100.00 110
21 Thekanda - Ndaraweta - Sasik - Singorwet - Leldaet 1,276 Jun-17 May-20 819 457 100.00 60

Budget Watch For 2020/2021 And The Medium Term 65
s/no. Roads Total cost
Start Date End Date Actual to Feb. 2020 Remain cost % Completion
Allocation 2020/21
22 Lwakhakha - Korrosiondet - Tulienge - Sirisia - Namwela 1,610
Oct-16 Sep-18
1,036 574 100.00 50
23 Butere(Bukolwe) -Musanda - Bungasi - Sigomere - Ugunja 2,218
Dec-16 Nov-19
1,522 696 100.00 72
24 Kisima - Kibirichia - Kima - Ruiri 1,704 Aug-16 Feb-19 1,200 504 100.00 100
25 Kangeta - Muutine - Lare 652 Jun-17 Nov-18 315 337 100.00 85
26
Njegas - Mutito - Kagumo - Gatwe - Kangaita / Kiaga - Kianjege - Mukindori
1,253
Oct-16 Apr-19 1,224 29
100.00 100
27
Karima(A2) - Kianjege - Mukangu -Ndimaini - Karatina(A2) And Kiburu Kabonge
1,208
Oct-16 Apr-19 991 217
100.00 100
28 Imaroro - Mashru - Isara 3,038 Jun-17 Jun-20 2,110 928 100.00 90
29
Murang`a Town (Huhi Town Stn)-Karii Railway Stn-Muthingiriri-Marewa-Gakindu Bridge-Wandaka-Gikuu-Kayuy-Mirira
1,076
Aug-17 Jul-19
655 421
100.00 53
30 Modika - Nuno Road (phase II) 1,227 Mar-12 May-15 1,140 87 100% 6
31 Wajir - Buna -Moyale 206 May-12 May-15 186 20 100% 1
32 Eldoret - Webuye Road 6,512 Mar-11 Jul-16 6,441 72 100% 4
33 Nairobi - Thika Highway Improvement Project Lot 1 & 2 16,321
Jul-07 Jul-12
14,542 1,779 100%
300
34 Emali- Oloitoktok Road 5,140 Jun-08 Jul-12 4,972 168 100% 10
35
Jn. A109 (Changamwe round about) - Moi International Airport Access Road & Port Reitz Road
5,129
Apr-15 Oct-18 236 4,893
100% 10
36 Isiolo - Merille Road 6,332 Jun-07 Jul-10 6,267 65 100% 20
37 Kangema - Gacharage Road 4,468 1-Aug-12 Feb-16 4,029 438 100% 8
38 Elwak - Wargadud 505 Feb-16 Aug-18 505 - 100% 60
39 Bambo - Rhamu 635 Jan-16 Jul-18 634 1 100% 60
40 Kitale-Morpus (A1) (Lot No. 2) 431 Jun-16 Jun-18 430 1 100% 917
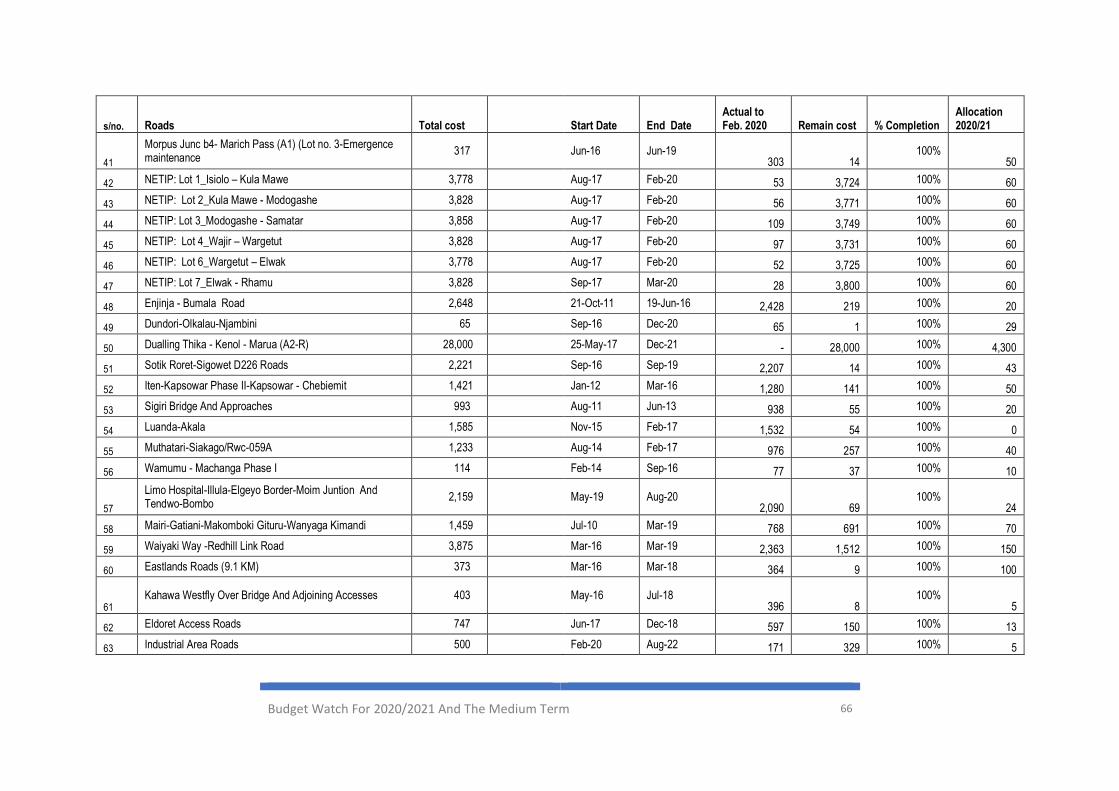
Budget Watch For 2020/2021 And The Medium Term 66
s/no. Roads Total cost
Start Date End Date Actual to Feb. 2020 Remain cost % Completion
Allocation 2020/21
41
Morpus Junc b4- Marich Pass (A1) (Lot no. 3-Emergence maintenance
317
Jun-16 Jun-19 303 14
100% 50
42 NETIP: Lot 1_Isiolo – Kula Mawe 3,778 Aug-17 Feb-20 53 3,724 100% 60
43 NETIP: Lot 2_Kula Mawe - Modogashe 3,828 Aug-17 Feb-20 56 3,771 100% 60
44 NETIP: Lot 3_Modogashe - Samatar 3,858 Aug-17 Feb-20 109 3,749 100% 60
45 NETIP: Lot 4_Wajir – Wargetut 3,828 Aug-17 Feb-20 97 3,731 100% 60
46 NETIP: Lot 6_Wargetut – Elwak 3,778 Aug-17 Feb-20 52 3,725 100% 60
47 NETIP: Lot 7_Elwak - Rhamu 3,828 Sep-17 Mar-20 28 3,800 100% 60
48 Enjinja - Bumala Road 2,648 21-Oct-11 19-Jun-16 2,428 219 100% 20
49 Dundori-Olkalau-Njambini 65 Sep-16 Dec-20 65 1 100% 29
50 Dualling Thika - Kenol - Marua (A2-R) 28,000 25-May-17 Dec-21 - 28,000 100% 4,300
51 Sotik Roret-Sigowet D226 Roads 2,221 Sep-16 Sep-19 2,207 14 100% 43
52 Iten-Kapsowar Phase II-Kapsowar - Chebiemit 1,421 Jan-12 Mar-16 1,280 141 100% 50
53 Sigiri Bridge And Approaches 993 Aug-11 Jun-13 938 55 100% 20
54 Luanda-Akala 1,585 Nov-15 Feb-17 1,532 54 100% 0
55 Muthatari-Siakago/Rwc-059A 1,233 Aug-14 Feb-17 976 257 100% 40
56 Wamumu - Machanga Phase I 114 Feb-14 Sep-16 77 37 100% 10
57
Limo Hospital-Illula-Elgeyo Border-Moim Juntion And Tendwo-Bombo
2,159
May-19 Aug-20 2,090 69
100% 24
58 Mairi-Gatiani-Makomboki Gituru-Wanyaga Kimandi 1,459 Jul-10 Mar-19 768 691 100% 70
59 Waiyaki Way -Redhill Link Road 3,875 Mar-16 Mar-19 2,363 1,512 100% 150
60 Eastlands Roads (9.1 KM) 373 Mar-16 Mar-18 364 9 100% 100
61 Kahawa Westfly Over Bridge And Adjoining Accesses 403
May-16 Jul-18
396 8 100%
5
62 Eldoret Access Roads 747 Jun-17 Dec-18 597 150 100% 13
63 Industrial Area Roads 500 Feb-20 Aug-22 171 329 100% 5
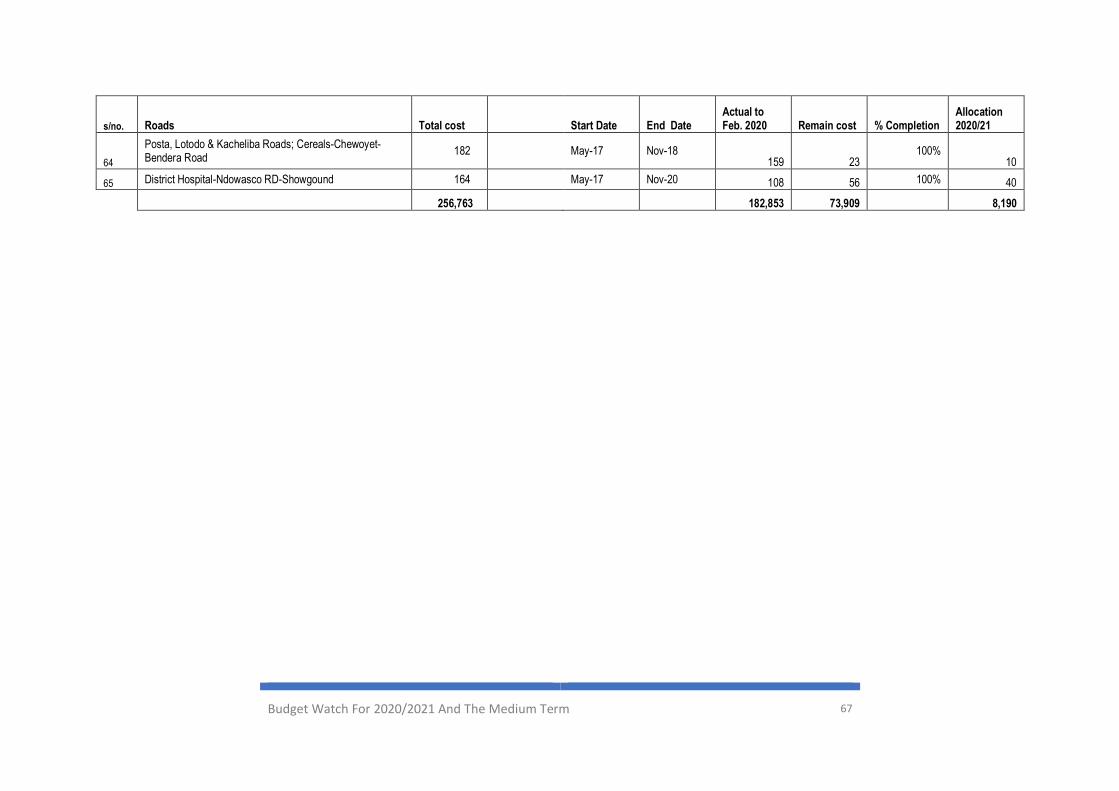
Budget Watch For 2020/2021 And The Medium Term 67
s/no. Roads Total cost
Start Date End Date Actual to Feb. 2020 Remain cost % Completion
Allocation 2020/21
64
Posta, Lotodo & Kacheliba Roads; Cereals-Chewoyet-Bendera Road
182
May-17 Nov-18 159 23
100% 10
65 District Hospital-Ndowasco RD-Showgound 164 May-17 Nov-20 108 56 100% 40
256,763
182,853 73,909 8,190