Thermal comfort of multiple-skin facades in warm- climate offices
Upload
independentCategory
view
2download
0
Technovation 33 (2013) 2–12
Contents lists available at SciVerse ScienceDirect
Technovation
0166-49
http://d
n Corr
E-m
journal homepage: www.elsevier.com/locate/technovation
BTP—Best Transfer Practices. A tool for qualitative analysis of tech-transferoffices: A cross cultural analysis
David N. Resende a,n, David Gibson b, James Jarrett b
a University of Aveiro—Governance, Competitiveness and Public Policies Research Unit (GOVCOPP), Campo Universitario de Santiago, 3810-193 Aveiro, Portugalb IC2 Institute, The University of Texas at Austin, 2815 San Gabriel, Austin, TX 78705, USA
a r t i c l e i n f o
Available online 8 October 2012
Keywords:
Technology transfer
University enterprise relationship
Facilitators
Technology valorization
Triple helix
Technology transfer office
72/$ - see front matter & 2012 Elsevier Ltd. A
x.doi.org/10.1016/j.technovation.2012.09.001
esponding author. Tel.: þ351 234611500; fa
ail address: [email protected] (D.N. Resende).
a b s t r a c t
The objective of this article is to present a qualitative analysis tool which technology transfer offices
(TTOs) can utilize to improve their efficiency and effectiveness. Such qualitative tool is one of the
novelties presented. The other is information that advances understanding of the processes, procedures
and structures required to transfer technology, as a set of best practices.
From December 2008 to September 2010 a variety of methodologies (document analysis,
participative observation, interviews and surveys) generated data which led to development of a
theoretical framework. The theoretical framework, called Master Plan for Technology Transfer (TT), is a
reference schema for best practices. The Master Plan contains 271 rules (good practices) referring to 43
facilitators distributed in seven groups. The facilitators and rules were selected from a coding process
based on grounded theory, where facilitators are the categories and rules are their properties.
Based on the methodologies and development of the Master Plan, we constructed a tool called Best
Transfer Practices (BTP) which is a qualitative tool to assess and study TTOs and their host R&D
institutions.
The collection of rules and facilitators are the soul of our BTP. It is our contribution to the knowledge
of actual practices in TT.
& 2012 Elsevier Ltd. All rights reserved.
1. Introduction
Research and development (R&D) institutions, both university-related and others concerned with technology transfer (TT), areengines that increase industry competitiveness (Sanchez andTejedor, 1995). Therefore, it is crucial to know how well theseinstitutions implement a process as complex as the transferenceof knowledge and technology to companies. Because TTOs arecentral in this transference, we must know how efficient andeffective a TTO is conducting its missions.
Pries and Guild (2011), in their studies, suggest that technol-ogy attributes may have an impact on the methods used to TTarising from university research.
Yet the various strategies and processes for transferringtechnology are difficult to configure, to follow, and to manage(McAdam et al., 2005; Philpott et al., 2011). Because of this, it isdifficult to evaluate TTO performance, and often used metrics –for example counting patents as mentioned by Anderson et al.(2007) – may have little to do with overall performance.
ll rights reserved.
x: þ351 611 540.
To address this complex problem, we propose a systematic toolto analyze and diagnose bottlenecks in the TT processes.
Part of our references is based in the studied institutions.It reflects concern with the actual best practices.
2. Problem characterization
Today’s (and tomorrow’s) quality of life depend on science andtechnology advances. And economic and cultural progress willbe hastened if science and technology advances are adoptedby companies and institutions through technology transfer(Novozhilov, 1991). Technology transfer is complex: technologicalinnovation is fast and continuous, companies are at a loss on howbest to innovate and work with universities/R&D institutions, andthe institutions themselves lack a full understanding of whatcompanies need and when (Rogers et al., 2001). So while there isagreement that innovation will maintain and promote the com-petitiveness of companies, there are real hurdles in achievingsuch innovation (Etzkowitz et al., 2000). Technology transferoffices (TTOs) are integral to these processes, and yet havereceived scant attention from policymakers and institutionalleaders. They deserve significantly more attention now and inthe future. New studies of regional development and the
D.N. Resende et al. / Technovation 33 (2013) 2–12 3
knowledge-based economy (as in McAdam et al., 2012) lead tothe TTOs as central hubs in the regional relationships.
There is no generally accepted (standard) method to verifysystematically the performance of an institution’s TTO—we donot know if TTO performance is adequate, if it can be improved,and if improvements are possibly, how to intervene to improveefficiency and effectiveness. Chapple et al. (2005), Debackere andVeugelers (2005) and Siegel et al. (2003) showed many organiza-tional practices that improve performance. Gilsing et al. (2011)show a collection of ‘‘transfer mechanisms’’ and ‘‘barriersinhibiting the process’’. But yet we not only need to know suchinformation for improving individual institutions, we need suchinformation systematically normalized for regional and nationalprograms which utilize incentives and grants to enhance perfor-mances. In a time of reduced public expenditures, it is importantto determine the best rate of return for every investment made.
The questions driving this analysis are:
�
Because of the huge collection of variables conditioning the TTrelationship, can we systematically analyze and recognizeprocesses, procedures and structures in a R&D institution,when it is transferring technology? � Is it possible to characterize processes, procedures, and struc-tures between an institution and its external partners, and toidentify ideal (yet practical) implementation?
� Is it possible to point out TT facilitators to an institution in agiven scenario, which direct to the actual best practicesaccording to (comparing with) a collection of rules of actualbest practices?
� Can we find processes and critical mechanisms that are weaklyimplemented?
� If we find and improve weakly implemented processes andmechanisms, what performance increases (both efficiency andeffectiveness) can we expect to achieve from intervening andrectifying existing problems?
A tool that points to critical facilitators in a R&D organizationand allows targeted interventions to improve performance mustbe comprehensive and build upon prior studies of TTOs. At theglobal level, there are many research works addressing issues ofTT relationships (both cases in open innovation (Chesbroughet al., 2006; Carvalho, 2009) as driven by the triple helix(Etzkowitz et al., 2000; Fundacion Cotec, 2003)). However, notall could be applied to the various scenarios and regions due tosocial, economic, and cultural specificities. In the following sec-tions we identify the steps necessary in our ultimate quest toimprove technology transfer operations.
3. The methodology to collect data and the research limits
The scientific domain of this research is the management ofinnovation and knowledge and technology transfer. Its central subjectis the relationships between companies and the innovation agentsthat make technology transfer one of its activities. For that, it isimportant to characterize an adequate analysis tool to study thoseagents, while knowledge disseminators, and aim ways to maximizeits actuation when trying to take care of the necessities of thecompanies and value its intellectual property helped by its TTO.
We propose an analysis tool prototype (the BTP—Best TransferPractice tool) that, besides identifying critical ‘‘facilitators’’ (in thesense of to aim big concerns), in what it touches to the relation-ship with companies, also can describe a concept of solutionbased on processes reengineering and introduction and use ofnew improved concepts for structures, processes and proceduresin the host institution and its TTO.
A reference for the development of the BTP tool is an approachdeveloped for the improvement of business processes and theintroduction of supporting ICT systems in manufacturing compa-nies. This methodology developed for and successfully applied tomanufacturing process improvement is based on the ‘‘best enter-prise practices’’ (BEP) approach. It includes elaborated conceptsthat imply organizational and technical solutions for quality andproduction control problems. This BEP methodology for businessprocess re-engineering and exploitation of ICT tools enablesefficient generation of key implementation plans to overcomeidentified bottlenecks in companies in different industrial sectors.In several Commission of the European Communities (CEC)funded projects, and many industrial projects, BEP successfullyimproved manufacturing processes in about 35 SMEs and largercompanies in different European regions. It was applied also inthe improvement of business processes in hospitals by IEETA(2010) with the BHP—Best Hospital Practices (empirically testedand validated in five hospitals). In our scope, the objective is totransfer this successfully applied approach to the improvement ofTT processes driven by TTOs in their R&D institutions.
The specific goals are:
�
Using grounded theory methodology—the expression‘‘grounded theory’’ refers to the theory that is developedinductively from a data collection (Strauss and Corbin, 1990;Glaser and Strauss, 1967), we find a management framework(the Master Plan to TT) from coding actual best practices thatpromote interaction in various phases of the process and theirtransversal practices—the TTO and its institution’s internalprocesses, procedures, and structures (Resende, 2010). � To suggest a tool that, using the previous knowledge, makes itpossible to identify process ‘‘bottlenecks’’ and aims a concep-tual solution to eliminate them without damaging otheractivities of the R&D institution/university.
For this, we will use a collection of actual best practices asrules (of good practices). Grouped in facilitators of TT, they willreflect the state of the art in the management of technologytransfer. They will help to internally characterize any R&Dinstitution/university with its TTO in the sense of its relationshipwith the business environment. Grounded theory is the metho-dology used to code these facilitators and, as its properties, therules of actual best practices.
The methodology to collect data consisted of documental analysis,surveys, and interviews in the US and Portugal between December,2008 and September, 2010 and participative observations onIEETA—Institute of Electronics and Telematics Engineering of Aveiro(a research institute at the University of Aveiro) and IC2 institute (aninterdisciplinary research unit of The University of Texas at Austin.IC2¼ Innovation, Creativity and Capital) as in Table 1.This research is limited to common practices in North American
and European R&D institutions (although other references arepresent) with special attention on U.S. Department of Defense(DOD laboratories), 29 universities in the US, one in Singapore,one in Australia, and eight in Europe, 22 TTOs in Portugal, and 29 inthe US. It is a cross-cultural analysis (Table 2).
4. A proposal of a qualitative analysis tool (define facilitators,rules, and the master plan)
4.1. The facilitators and their rules
This study started with presupposing the existence of practicesand structures that facilitate the management (by a TTO) of theinteraction between R&D institutions and companies. It is
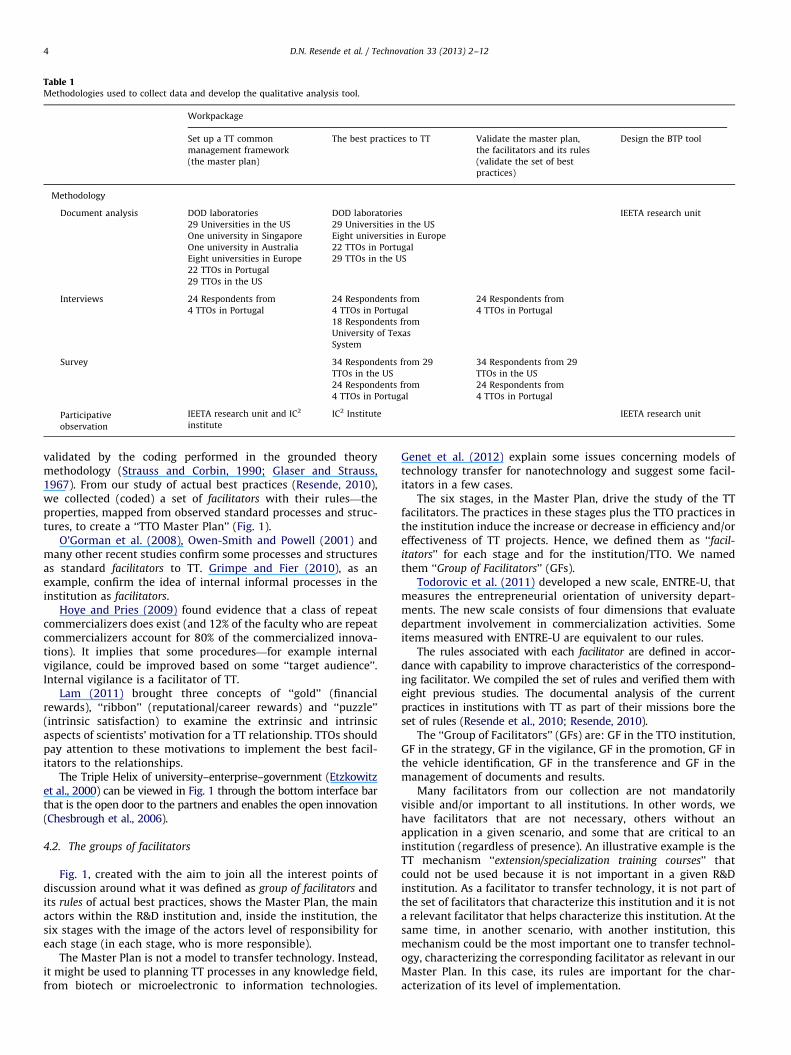
Table 1Methodologies used to collect data and develop the qualitative analysis tool.
Workpackage
Set up a TT common
management framework
(the master plan)
The best practices to TT Validate the master plan,
the facilitators and its rules
(validate the set of best
practices)
Design the BTP tool
Methodology
Document analysis DOD laboratories DOD laboratories IEETA research unit
29 Universities in the US 29 Universities in the US
One university in Singapore Eight universities in Europe
One university in Australia 22 TTOs in Portugal
Eight universities in Europe 29 TTOs in the US
22 TTOs in Portugal
29 TTOs in the US
Interviews 24 Respondents from
4 TTOs in Portugal
24 Respondents from
4 TTOs in Portugal
24 Respondents from
4 TTOs in Portugal
18 Respondents from
University of Texas
System
Survey 34 Respondents from 29
TTOs in the US
34 Respondents from 29
TTOs in the US
24 Respondents from
4 TTOs in Portugal
24 Respondents from
4 TTOs in Portugal
Participative
observation
IEETA research unit and IC2
institute
IC2 Institute IEETA research unit
D.N. Resende et al. / Technovation 33 (2013) 2–124
validated by the coding performed in the grounded theorymethodology (Strauss and Corbin, 1990; Glaser and Strauss,1967). From our study of actual best practices (Resende, 2010),we collected (coded) a set of facilitators with their rules—theproperties, mapped from observed standard processes and struc-tures, to create a ‘‘TTO Master Plan’’ (Fig. 1).
O’Gorman et al. (2008), Owen-Smith and Powell (2001) andmany other recent studies confirm some processes and structuresas standard facilitators to TT. Grimpe and Fier (2010), as anexample, confirm the idea of internal informal processes in theinstitution as facilitators.
Hoye and Pries (2009) found evidence that a class of repeatcommercializers does exist (and 12% of the faculty who are repeatcommercializers account for 80% of the commercialized innova-tions). It implies that some procedures—for example internalvigilance, could be improved based on some ‘‘target audience’’.Internal vigilance is a facilitator of TT.
Lam (2011) brought three concepts of ‘‘gold’’ (financialrewards), ‘‘ribbon’’ (reputational/career rewards) and ‘‘puzzle’’(intrinsic satisfaction) to examine the extrinsic and intrinsicaspects of scientists’ motivation for a TT relationship. TTOs shouldpay attention to these motivations to implement the best facil-itators to the relationships.
The Triple Helix of university–enterprise–government (Etzkowitzet al., 2000) can be viewed in Fig. 1 through the bottom interface barthat is the open door to the partners and enables the open innovation(Chesbrough et al., 2006).
4.2. The groups of facilitators
Fig. 1, created with the aim to join all the interest points ofdiscussion around what it was defined as group of facilitators andits rules of actual best practices, shows the Master Plan, the mainactors within the R&D institution and, inside the institution, thesix stages with the image of the actors level of responsibility foreach stage (in each stage, who is more responsible).
The Master Plan is not a model to transfer technology. Instead,it might be used to planning TT processes in any knowledge field,from biotech or microelectronic to information technologies.
Genet et al. (2012) explain some issues concerning models oftechnology transfer for nanotechnology and suggest some facil-itators in a few cases.
The six stages, in the Master Plan, drive the study of the TTfacilitators. The practices in these stages plus the TTO practices inthe institution induce the increase or decrease in efficiency and/oreffectiveness of TT projects. Hence, we defined them as ‘‘facil-
itators’’ for each stage and for the institution/TTO. We namedthem ‘‘Group of Facilitators’’ (GFs).
Todorovic et al. (2011) developed a new scale, ENTRE-U, thatmeasures the entrepreneurial orientation of university depart-ments. The new scale consists of four dimensions that evaluatedepartment involvement in commercialization activities. Someitems measured with ENTRE-U are equivalent to our rules.
The rules associated with each facilitator are defined in accor-dance with capability to improve characteristics of the correspond-ing facilitator. We compiled the set of rules and verified them witheight previous studies. The documental analysis of the currentpractices in institutions with TT as part of their missions bore theset of rules (Resende et al., 2010; Resende, 2010).
The ‘‘Group of Facilitators’’ (GFs) are: GF in the TTO institution,GF in the strategy, GF in the vigilance, GF in the promotion, GF inthe vehicle identification, GF in the transference and GF in themanagement of documents and results.
Many facilitators from our collection are not mandatorilyvisible and/or important to all institutions. In other words, wehave facilitators that are not necessary, others without anapplication in a given scenario, and some that are critical to aninstitution (regardless of presence). An illustrative example is theTT mechanism ‘‘extension/specialization training courses’’ thatcould not be used because it is not important in a given R&Dinstitution. As a facilitator to transfer technology, it is not part ofthe set of facilitators that characterize this institution and it is nota relevant facilitator that helps characterize this institution. At thesame time, in another scenario, with another institution, thismechanism could be the most important one to transfer technol-ogy, characterizing the corresponding facilitator as relevant in ourMaster Plan. In this case, its rules are important for the char-acterization of its level of implementation.
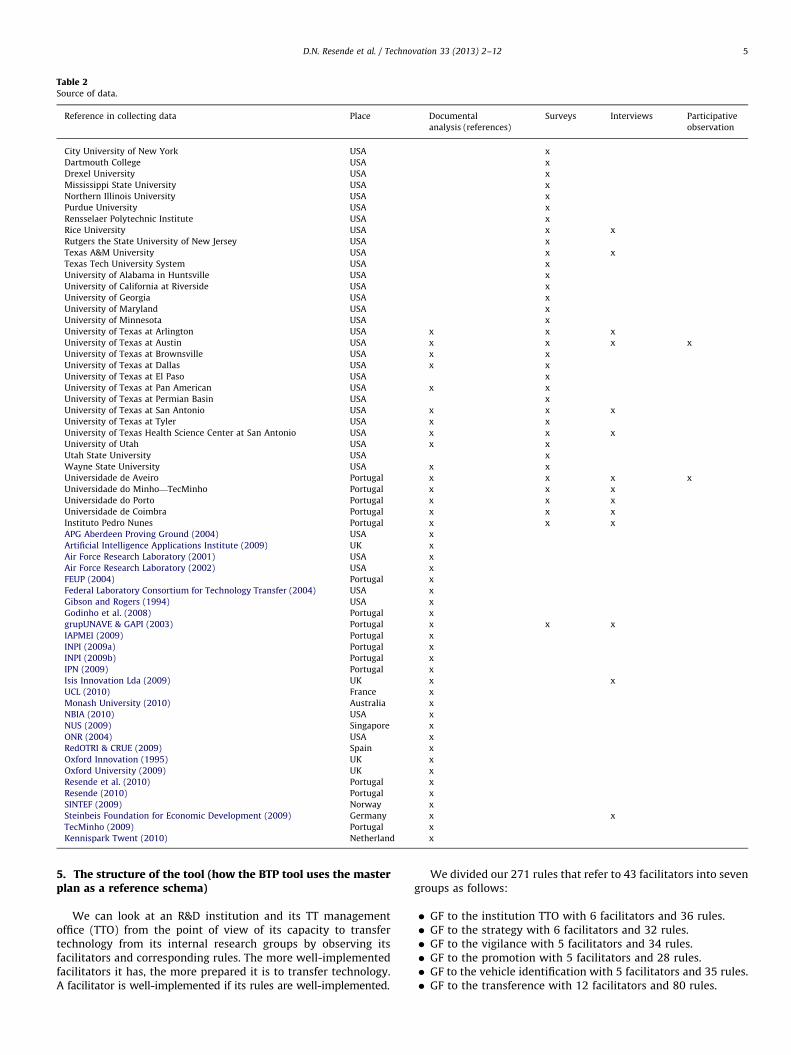
Table 2Source of data.
Reference in collecting data Place Documental
analysis (references)
Surveys Interviews Participative
observation
City University of New York USA x
Dartmouth College USA x
Drexel University USA x
Mississippi State University USA x
Northern Illinois University USA x
Purdue University USA x
Rensselaer Polytechnic Institute USA x
Rice University USA x x
Rutgers the State University of New Jersey USA x
Texas A&M University USA x x
Texas Tech University System USA x
University of Alabama in Huntsville USA x
University of California at Riverside USA x
University of Georgia USA x
University of Maryland USA x
University of Minnesota USA x
University of Texas at Arlington USA x x x
University of Texas at Austin USA x x x x
University of Texas at Brownsville USA x x
University of Texas at Dallas USA x x
University of Texas at El Paso USA x
University of Texas at Pan American USA x x
University of Texas at Permian Basin USA x
University of Texas at San Antonio USA x x x
University of Texas at Tyler USA x x
University of Texas Health Science Center at San Antonio USA x x x
University of Utah USA x x
Utah State University USA x
Wayne State University USA x x
Universidade de Aveiro Portugal x x x x
Universidade do Minho—TecMinho Portugal x x x
Universidade do Porto Portugal x x x
Universidade de Coimbra Portugal x x x
Instituto Pedro Nunes Portugal x x x
APG Aberdeen Proving Ground (2004) USA x
Artificial Intelligence Applications Institute (2009) UK x
Air Force Research Laboratory (2001) USA x
Air Force Research Laboratory (2002) USA x
FEUP (2004) Portugal x
Federal Laboratory Consortium for Technology Transfer (2004) USA x
Gibson and Rogers (1994) USA x
Godinho et al. (2008) Portugal x
grupUNAVE & GAPI (2003) Portugal x x x
IAPMEI (2009) Portugal x
INPI (2009a) Portugal x
INPI (2009b) Portugal x
IPN (2009) Portugal x
Isis Innovation Lda (2009) UK x x
UCL (2010) France x
Monash University (2010) Australia x
NBIA (2010) USA x
NUS (2009) Singapore x
ONR (2004) USA x
RedOTRI & CRUE (2009) Spain x
Oxford Innovation (1995) UK x
Oxford University (2009) UK x
Resende et al. (2010) Portugal x
Resende (2010) Portugal x
SINTEF (2009) Norway x
Steinbeis Foundation for Economic Development (2009) Germany x x
TecMinho (2009) Portugal x
Kennispark Twent (2010) Netherland x
D.N. Resende et al. / Technovation 33 (2013) 2–12 5
5. The structure of the tool (how the BTP tool uses the masterplan as a reference schema)
We can look at an R&D institution and its TT managementoffice (TTO) from the point of view of its capacity to transfertechnology from its internal research groups by observing itsfacilitators and corresponding rules. The more well-implementedfacilitators it has, the more prepared it is to transfer technology.A facilitator is well-implemented if its rules are well-implemented.
We divided our 271 rules that refer to 43 facilitators into sevengroups as follows:
�
GF to the institution TTO with 6 facilitators and 36 rules. � GF to the strategy with 6 facilitators and 32 rules. � GF to the vigilance with 5 facilitators and 34 rules. � GF to the promotion with 5 facilitators and 28 rules. � GF to the vehicle identification with 5 facilitators and 35 rules. � GF to the transference with 12 facilitators and 80 rules.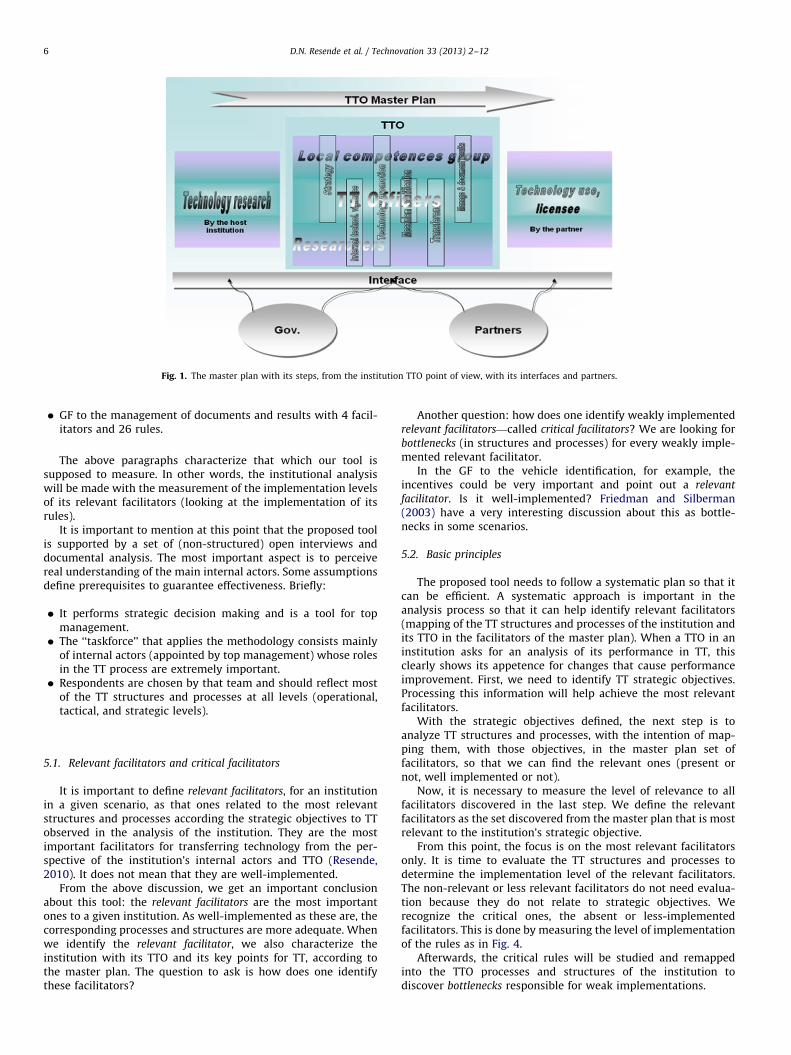
Fig. 1. The master plan with its steps, from the institution TTO point of view, with its interfaces and partners.
D.N. Resende et al. / Technovation 33 (2013) 2–126
�
GF to the management of documents and results with 4 facil-itators and 26 rules.The above paragraphs characterize that which our tool issupposed to measure. In other words, the institutional analysiswill be made with the measurement of the implementation levelsof its relevant facilitators (looking at the implementation of itsrules).
It is important to mention at this point that the proposed toolis supported by a set of (non-structured) open interviews anddocumental analysis. The most important aspect is to perceivereal understanding of the main internal actors. Some assumptionsdefine prerequisites to guarantee effectiveness. Briefly:
�
It performs strategic decision making and is a tool for topmanagement. � The ‘‘taskforce’’ that applies the methodology consists mainlyof internal actors (appointed by top management) whose rolesin the TT process are extremely important.
� Respondents are chosen by that team and should reflect mostof the TT structures and processes at all levels (operational,tactical, and strategic levels).
5.1. Relevant facilitators and critical facilitators
It is important to define relevant facilitators, for an institutionin a given scenario, as that ones related to the most relevantstructures and processes according the strategic objectives to TTobserved in the analysis of the institution. They are the mostimportant facilitators for transferring technology from the per-spective of the institution’s internal actors and TTO (Resende,2010). It does not mean that they are well-implemented.
From the above discussion, we get an important conclusionabout this tool: the relevant facilitators are the most importantones to a given institution. As well-implemented as these are, thecorresponding processes and structures are more adequate. Whenwe identify the relevant facilitator, we also characterize theinstitution with its TTO and its key points for TT, according tothe master plan. The question to ask is how does one identifythese facilitators?
Another question: how does one identify weakly implementedrelevant facilitators—called critical facilitators? We are looking forbottlenecks (in structures and processes) for every weakly imple-mented relevant facilitator.
In the GF to the vehicle identification, for example, theincentives could be very important and point out a relevant
facilitator. Is it well-implemented? Friedman and Silberman(2003) have a very interesting discussion about this as bottle-necks in some scenarios.
5.2. Basic principles
The proposed tool needs to follow a systematic plan so that itcan be efficient. A systematic approach is important in theanalysis process so that it can help identify relevant facilitators(mapping of the TT structures and processes of the institution andits TTO in the facilitators of the master plan). When a TTO in aninstitution asks for an analysis of its performance in TT, thisclearly shows its appetence for changes that cause performanceimprovement. First, we need to identify TT strategic objectives.Processing this information will help achieve the most relevantfacilitators.
With the strategic objectives defined, the next step is toanalyze TT structures and processes, with the intention of map-ping them, with those objectives, in the master plan set offacilitators, so that we can find the relevant ones (present ornot, well implemented or not).
Now, it is necessary to measure the level of relevance to allfacilitators discovered in the last step. We define the relevantfacilitators as the set discovered from the master plan that is mostrelevant to the institution’s strategic objective.
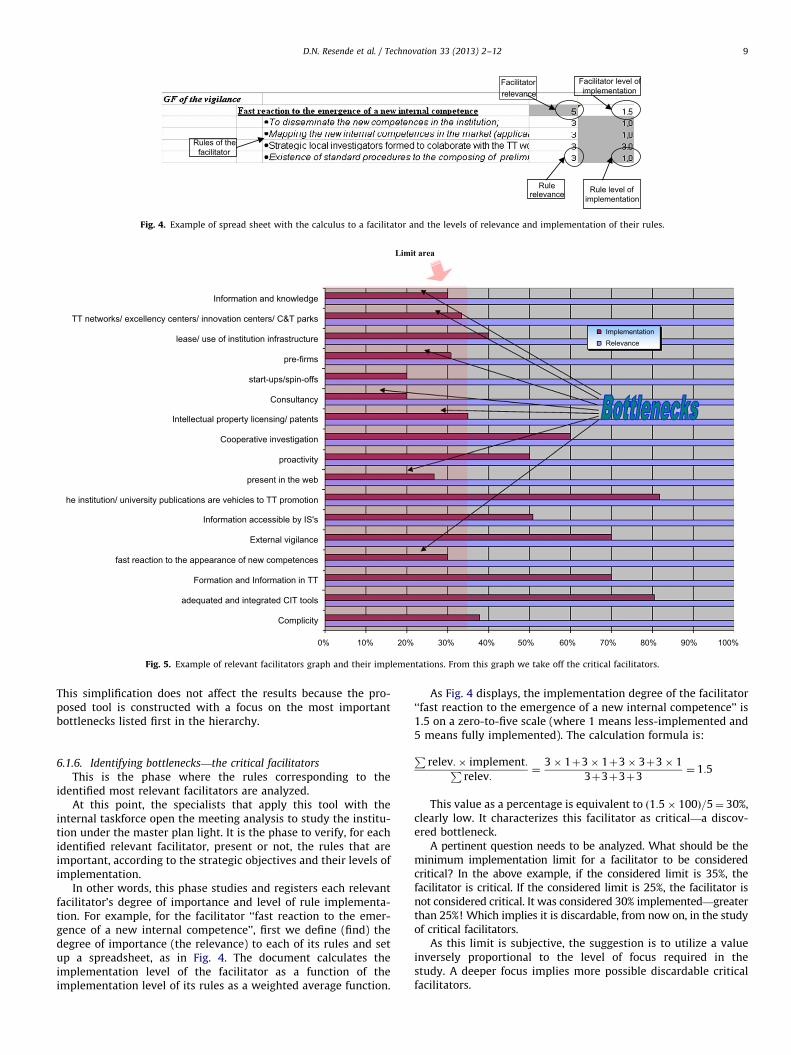
From this point, the focus is on the most relevant facilitatorsonly. It is time to evaluate the TT structures and processes todetermine the implementation level of the relevant facilitators.The non-relevant or less relevant facilitators do not need evalua-tion because they do not relate to strategic objectives. Werecognize the critical ones, the absent or less-implementedfacilitators. This is done by measuring the level of implementationof the rules as in Fig. 4.
Afterwards, the critical rules will be studied and remappedinto the TTO processes and structures of the institution todiscover bottlenecks responsible for weak implementations.
D.N. Resende et al. / Technovation 33 (2013) 2–12 7
After identifying critical facilitators, we pass to the analysis oftheir rules. The identification of a bottleneck means that a veryimportant facilitator (to the objectives of the institution and theTTO) does not have well-implemented rules.
Dynamic tables and graphics allow visualization of the asso-ciations and interdependencies between facilitators and theinfluence that the environment could have upon them. In otherwords, we will attempt to disclose which critical facilitators areinfluenced by others. This information allows us to identifywhether there are any critical facilitators that, when modified(improved by a solution design), could influence other existingcritical facilitators. In this case, that critical facilitator will be thefirst one to be analyzed with the objective to introduce improve-ments in the corresponding bottlenecks.
The next step is the improvement solution planning to themost important weak points, identified in the bottlenecks, in theform of a progressive improvement plan, looking at the TTstructures, processes and TTO procedures to identify the problemsand its causes.
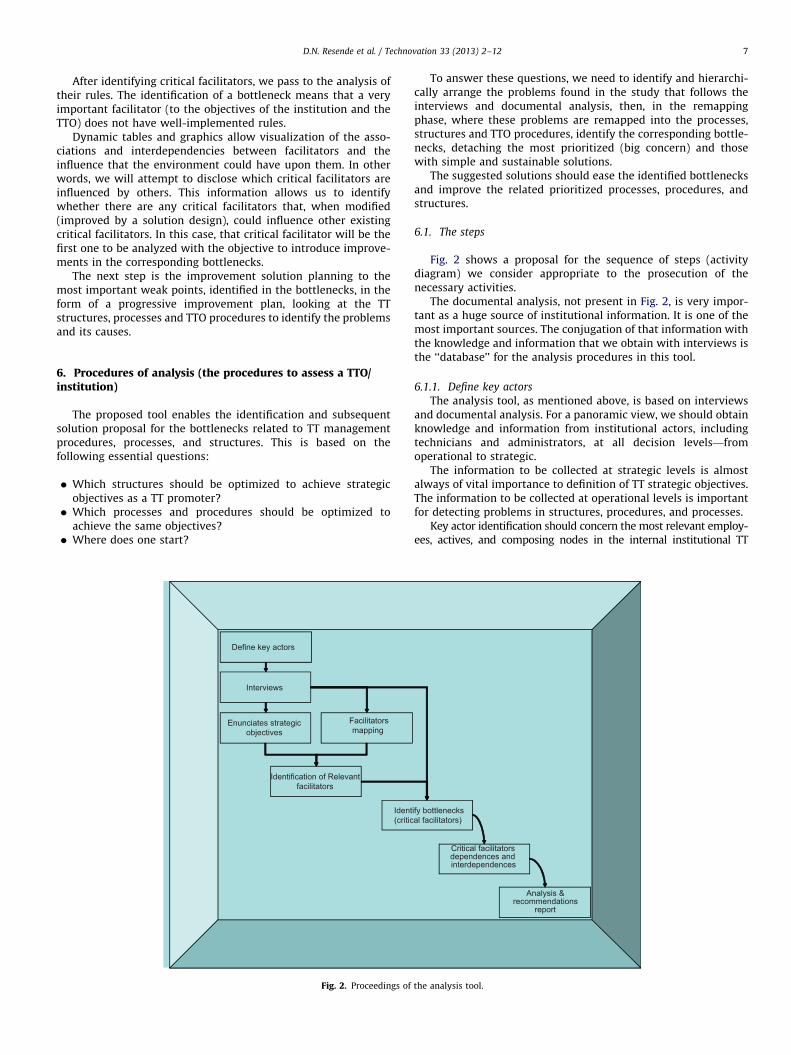
6. Procedures of analysis (the procedures to assess a TTO/institution)
The proposed tool enables the identification and subsequentsolution proposal for the bottlenecks related to TT managementprocedures, processes, and structures. This is based on thefollowing essential questions:
�
Which structures should be optimized to achieve strategicobjectives as a TT promoter? � Which processes and procedures should be optimized toachieve the same objectives?
� Where does one start?Definir actores chave
Entrevistas
Enunciar objectivos estratégicos
Mapeamentodos facilitadores
Identificar facilitadores relevantes
Identificfacilita
Define key actors
Interviews
Enunciates strategic objectives
Facilitators mapping
Identification of Relevant facilitators
Ident(critic
Fig. 2. Proceedings of
To answer these questions, we need to identify and hierarchi-cally arrange the problems found in the study that follows theinterviews and documental analysis, then, in the remappingphase, where these problems are remapped into the processes,structures and TTO procedures, identify the corresponding bottle-necks, detaching the most prioritized (big concern) and thosewith simple and sustainable solutions.
The suggested solutions should ease the identified bottlenecksand improve the related prioritized processes, procedures, andstructures.
6.1. The steps
Fig. 2 shows a proposal for the sequence of steps (activitydiagram) we consider appropriate to the prosecution of thenecessary activities.
The documental analysis, not present in Fig. 2, is very impor-tant as a huge source of institutional information. It is one of themost important sources. The conjugation of that information withthe knowledge and information that we obtain with interviews isthe ‘‘database’’ for the analysis procedures in this tool.
6.1.1. Define key actors
The analysis tool, as mentioned above, is based on interviewsand documental analysis. For a panoramic view, we should obtainknowledge and information from institutional actors, includingtechnicians and administrators, at all decision levels—fromoperational to strategic.
The information to be collected at strategic levels is almostalways of vital importance to definition of TT strategic objectives.The information to be collected at operational levels is importantfor detecting problems in structures, procedures, and processes.
Key actor identification should concern the most relevant employ-ees, actives, and composing nodes in the internal institutional TT
ar bottlenecks-dores críticos
Dependências e interdependências dos
facilitadores críticos
Relatório de análise e recomendações
ify bottlenecks al facilitators)
Critical facilitators dependences and interdependences
Analysis & recommendations
report
the analysis tool.
D.N. Resende et al. / Technovation 33 (2013) 2–128
network. We could point to others as the representatives in functionalareas crossed transversely by the TT processes—some senior inves-tigators active in the TT processes of their local groups; experts ofinternal rules and procedures; and others pointed out by colleaguesand partners.
6.1.2. Interviews
The analysis interviews are crucial to compilation of necessaryinformation to identify the strategic objectives and find evidenceof bottlenecks.
In the interviews, key actors highlight points of interest in thediscussion of their TT activities and help to clearly identify themain day-to-day problems. At the strategic management level,key actors show a clear idea about TT strategic objectives and theproblems with evolving integration of their institutions’ globalstrategies and missions.
The interviews elicit necessary knowledge about the institu-tion and its TT processes and structures. This is required foridentification and posterior mapping into the master plan TTfacilitators.
6.1.3. Enunciate the strategic objectives
The TT-concerned strategic objectives could not be formallyenunciated. We must find and formulate them because they areessential to identification of relevant facilitators and, later, to selectactions to eliminate or attenuate the most critical bottlenecks.
6.1.4. Mapping the facilitators
Mapping is the way to relate the master plan’s facilitators withthe TTO procedures and institution processes and structuresidentified during interviews and documental analysis. This stepis a short review of the facilitators that are important to thestrategic objectives, in spite of whether they are implemented inthe institution.
0% 10%
ComplicityContinuos learning
human resources adequacyKnowledge networks integration
adequated and integrated CIT toolsorientation integrated in the mission
Defined strategical objectivesorientation for resources management
The strategy is integrated in the institution strategyFormation and Information in TT
Strategies coordinated with all actorsLocal strategic plans
clear-cut benefits systemfast reaction to the appearance of new competences
External vigilanceInformation accessible by IS's
The institution R&D has commercial applications notebooktechnological audit
Orientation optimizationExistence of promotion competences in the TTO
approach mechanismsThe institution/ university publications are vehicles to TT promotion
Existence of promotion programpresent in the web
proactivityVehicle identification group
Commercialization planSystematic vehicle identification
Definition of an optimal TT support teamStandard procedures signing of agreements and accompaniment
Investigation by order/ acquisition contractCooperative investigation
Intellectual property licensing/ patentsConsultancy
start-ups/spin-offspartnerships with intermediaries (tech brokers)
Commercial testIncubators
pre-firmsStaff interchange programs
Contracts with shared costs and other acquisition contractseducative aids and awards
lease/ use of institution infrastructureextension courses/specialization
TT networks/ excellency centers/ innovation centers/ C&T parksTechnical assistence/ services/ adviser
Specific interdisciplinary contactsTT process is a system with feedbacks during all its extension
economic and efficient use (intelligent) of the equipment, installations and resources in generalInformation and knowledge
Pos-transfer relationshipProfits and expenses management
Management information systemcontinuous improvement
Fig. 3. Relevance of the fac
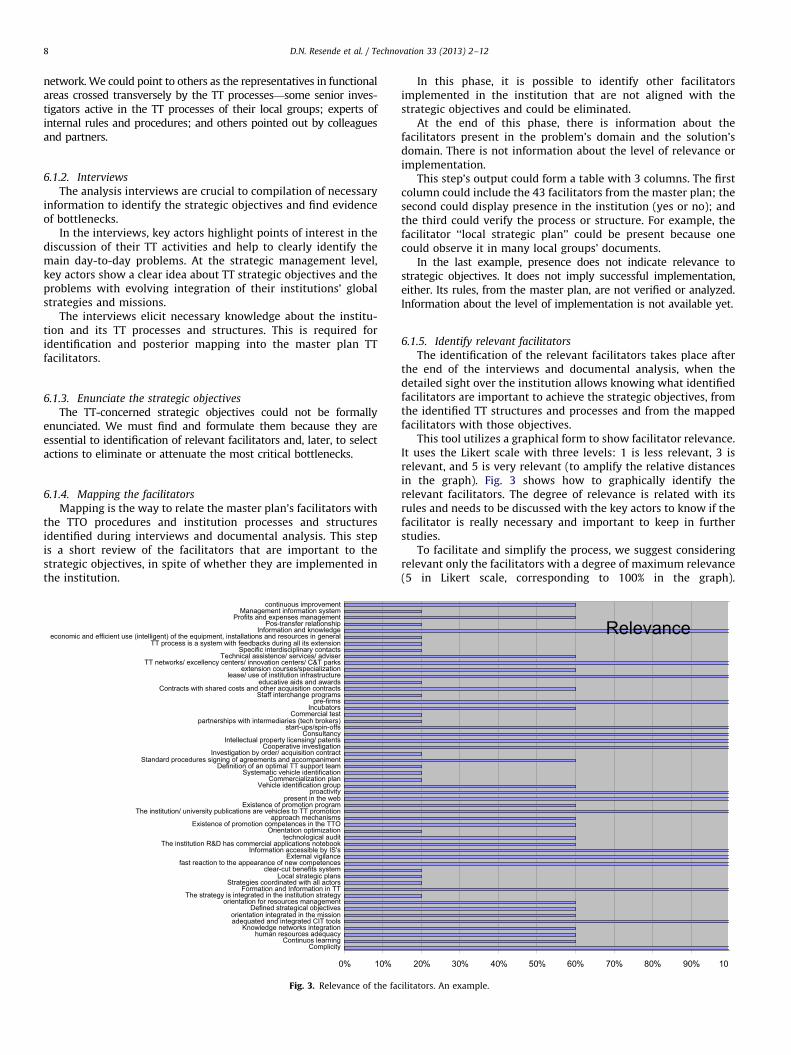
In this phase, it is possible to identify other facilitatorsimplemented in the institution that are not aligned with thestrategic objectives and could be eliminated.
At the end of this phase, there is information about thefacilitators present in the problem’s domain and the solution’sdomain. There is not information about the level of relevance orimplementation.
This step’s output could form a table with 3 columns. The firstcolumn could include the 43 facilitators from the master plan; thesecond could display presence in the institution (yes or no); andthe third could verify the process or structure. For example, thefacilitator ‘‘local strategic plan’’ could be present because onecould observe it in many local groups’ documents.
In the last example, presence does not indicate relevance tostrategic objectives. It does not imply successful implementation,either. Its rules, from the master plan, are not verified or analyzed.Information about the level of implementation is not available yet.
6.1.5. Identify relevant facilitators
The identification of the relevant facilitators takes place afterthe end of the interviews and documental analysis, when thedetailed sight over the institution allows knowing what identifiedfacilitators are important to achieve the strategic objectives, fromthe identified TT structures and processes and from the mappedfacilitators with those objectives.
This tool utilizes a graphical form to show facilitator relevance.It uses the Likert scale with three levels: 1 is less relevant, 3 isrelevant, and 5 is very relevant (to amplify the relative distancesin the graph). Fig. 3 shows how to graphically identify therelevant facilitators. The degree of relevance is related with itsrules and needs to be discussed with the key actors to know if thefacilitator is really necessary and important to keep in furtherstudies.
To facilitate and simplify the process, we suggest consideringrelevant only the facilitators with a degree of maximum relevance(5 in Likert scale, corresponding to 100% in the graph).
Relevance
20% 30% 40% 50% 60% 70% 80% 90% 10
ilitators. An example.
Facilitatorrelevance
Facilitator level of implementation
Rule level of implementation
Rule relevance
Rules of the facilitator
Fig. 4. Example of spread sheet with the calculus to a facilitator and the levels of relevance and implementation of their rules.
0% 10% 20% 30% 40% 50% 60% 70% 80% 90% 100%
Complicity
adequated and integrated CIT tools
Formation and Information in TT
fast reaction to the appearance of new competences
External vigilance
Information accessible by IS's
he institution/ university publications are vehicles to TT promotion
present in the web
proactivity
Cooperative investigation
Intellectual property licensing/ patents
Consultancy
start-ups/spin-offs
pre-firms
lease/ use of institution infrastructure
TT networks/ excellency centers/ innovation centers/ C&T parks
Information and knowledge
ImplementationRelevance
Limit area
Fig. 5. Example of relevant facilitators graph and their implementations. From this graph we take off the critical facilitators.
D.N. Resende et al. / Technovation 33 (2013) 2–12 9
This simplification does not affect the results because the pro-posed tool is constructed with a focus on the most importantbottlenecks listed first in the hierarchy.
6.1.6. Identifying bottlenecks—the critical facilitators
This is the phase where the rules corresponding to theidentified most relevant facilitators are analyzed.
At this point, the specialists that apply this tool with theinternal taskforce open the meeting analysis to study the institu-tion under the master plan light. It is the phase to verify, for eachidentified relevant facilitator, present or not, the rules that areimportant, according to the strategic objectives and their levels ofimplementation.
In other words, this phase studies and registers each relevantfacilitator’s degree of importance and level of rule implementa-tion. For example, for the facilitator ‘‘fast reaction to the emer-gence of a new internal competence’’, first we define (find) thedegree of importance (the relevance) to each of its rules and setup a spreadsheet, as in Fig. 4. The document calculates theimplementation level of the facilitator as a function of theimplementation level of its rules as a weighted average function.
As Fig. 4 displays, the implementation degree of the facilitator‘‘fast reaction to the emergence of a new internal competence’’ is1.5 on a zero-to-five scale (where 1 means less-implemented and5 means fully implemented). The calculation formula is:
Prelev:� implement:
Prelev:
¼3� 1þ3� 1þ3� 3þ3� 1
3þ3þ3þ3¼ 1:5
This value as a percentage is equivalent to ð1:5� 100Þ=5¼ 30%,clearly low. It characterizes this facilitator as critical—a discov-ered bottleneck.
A pertinent question needs to be analyzed. What should be theminimum implementation limit for a facilitator to be consideredcritical? In the above example, if the considered limit is 35%, thefacilitator is critical. If the considered limit is 25%, the facilitator isnot considered critical. It was considered 30% implemented—greaterthan 25%! Which implies it is discardable, from now on, in the studyof critical facilitators.
As this limit is subjective, the suggestion is to utilize a valueinversely proportional to the level of focus required in thestudy. A deeper focus implies more possible discardable criticalfacilitators.
D.N. Resende et al. / Technovation 33 (2013) 2–1210
From the suggested spreadsheet, it is possible to extract therelevant facilitators with their implementation degrees, as inFig. 5. It shows the information in a useful form so that thenecessary knowledge can be easily extracted to the next phases.
The most important bottlenecks, considering the limit (35%),are displayed in the graph.
The seven critical facilitators, in Fig. 5, are the only onesimportant to the next phases. These critical facilitators causethe bottlenecks. They will be analyzed with each other (asinterdependencies) and in relation to their environmentalinfluences.
The most important rules from these critical facilitators willreceive a deeper analysis in the last phases. These are responsiblefor the bottlenecks.
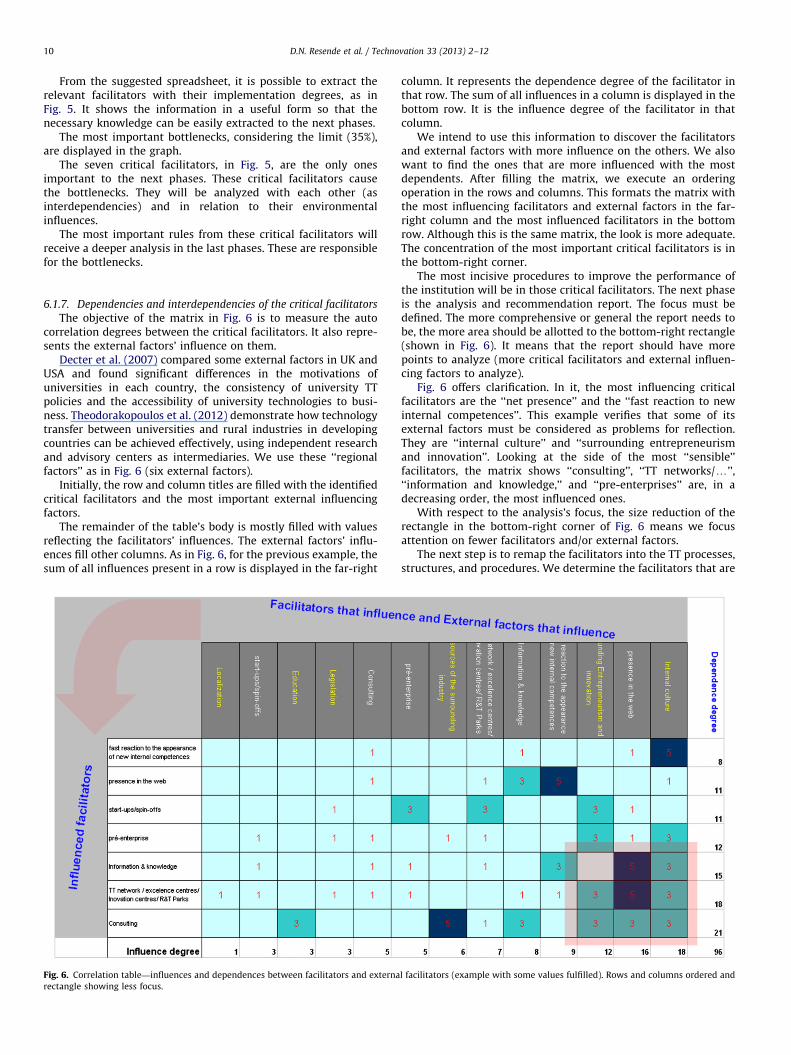
6.1.7. Dependencies and interdependencies of the critical facilitators
The objective of the matrix in Fig. 6 is to measure the autocorrelation degrees between the critical facilitators. It also repre-sents the external factors’ influence on them.
Decter et al. (2007) compared some external factors in UK andUSA and found significant differences in the motivations ofuniversities in each country, the consistency of university TTpolicies and the accessibility of university technologies to busi-ness. Theodorakopoulos et al. (2012) demonstrate how technologytransfer between universities and rural industries in developingcountries can be achieved effectively, using independent researchand advisory centers as intermediaries. We use these ‘‘regionalfactors’’ as in Fig. 6 (six external factors).
Initially, the row and column titles are filled with the identifiedcritical facilitators and the most important external influencingfactors.
The remainder of the table’s body is mostly filled with valuesreflecting the facilitators’ influences. The external factors’ influ-ences fill other columns. As in Fig. 6, for the previous example, thesum of all influences present in a row is displayed in the far-right
Fig. 6. Correlation table—influences and dependences between facilitators and externa
rectangle showing less focus.
column. It represents the dependence degree of the facilitator inthat row. The sum of all influences in a column is displayed in thebottom row. It is the influence degree of the facilitator in thatcolumn.
We intend to use this information to discover the facilitatorsand external factors with more influence on the others. We alsowant to find the ones that are more influenced with the mostdependents. After filling the matrix, we execute an orderingoperation in the rows and columns. This formats the matrix withthe most influencing facilitators and external factors in the far-right column and the most influenced facilitators in the bottomrow. Although this is the same matrix, the look is more adequate.The concentration of the most important critical facilitators is inthe bottom-right corner.
The most incisive procedures to improve the performance ofthe institution will be in those critical facilitators. The next phaseis the analysis and recommendation report. The focus must bedefined. The more comprehensive or general the report needs tobe, the more area should be allotted to the bottom-right rectangle(shown in Fig. 6). It means that the report should have morepoints to analyze (more critical facilitators and external influen-cing factors to analyze).
Fig. 6 offers clarification. In it, the most influencing criticalfacilitators are the ‘‘net presence’’ and the ‘‘fast reaction to newinternal competences’’. This example verifies that some of itsexternal factors must be considered as problems for reflection.They are ‘‘internal culture’’ and ‘‘surrounding entrepreneurismand innovation’’. Looking at the side of the most ‘‘sensible’’facilitators, the matrix shows ‘‘consulting’’, ‘‘TT networks/y’’,‘‘information and knowledge,’’ and ‘‘pre-enterprises’’ are, in adecreasing order, the most influenced ones.
With respect to the analysis’s focus, the size reduction of therectangle in the bottom-right corner of Fig. 6 means we focusattention on fewer facilitators and/or external factors.
The next step is to remap the facilitators into the TT processes,structures, and procedures. We determine the facilitators that are
l facilitators (example with some values fulfilled). Rows and columns ordered and
D.N. Resende et al. / Technovation 33 (2013) 2–12 11
important to re-evaluate from an analysis of the most criticalfacilitators and external constraints identified in the previousstudy. The output will be the discovery of the bottlenecks andrecommendations ordered by importance.
6.2. Analysis and recommendation report
This report presents results of the accomplished analysis of theTT processes, structures, and procedures of a R&D institution andits TTO. It shows clearly the critical facilitators and externalfactors with a graphical viewpoint as in Figs. 5 and 6. It proposesrecommendations based in the reengineering of processes,improvement in the procedures and infra-structures. It focus inmost influencing (and influenced) critical facilitators improve-ment and in the most influencing external factors neutralization(or attenuation). Recommendations translate to actions thatremove one or more bottlenecks. Actions should be the mosteconomically relevant according to an ordered project plan.Analysis material consists of available documentation: interviewoutcomes (the implicit knowledge); reports from local visits tothe most important places (observations); report meetings(mainly remapping meetings); and other explicit knowledgeavailable in the institution.
The document should explain and explicitly shows the insti-tution’s TTO-related TT procedures, processes, and structures, andthe most critical rules derived from the remapping meetings.
7. Conclusions and final notes
It has been well documented that regional economic expan-sion and well-being are dependent in part on universities asknowledge-generator institutions. High growth regions fre-quently are characterized by strong innovation, with innovationbeing led by commercialization of university knowledge. Tech-nology transfer offices play a very important, often critical role, insuch regions. Yet a high-performing TTO does not evolve, it mustbe built on a well-structured plan which includes well-definedsystematic processes and uses all available potential from orga-nizational structures. Only when this occurs will the institutionand its TTO enrich the surrounding region and society.
The master plan does not have the pretension to be a model.The analysis tool’s necessity and importance led to the masterplan. The grounded theory methodology’s codes (reflecting thefacilitator) and properties (reflecting the rules) comprise theplan’s foundation (Strauss and Corbin, 1990; Glaser and Strauss,1967). The data included knowledge that, to systematicallyanalyze an institution as a knowledge disseminator, it would benecessary to map its processes in a set of actual practices. Thismethod finds bottlenecks (less- or not-implemented criticalfacilitators) (Resende, 2010).
Our study started from the presupposed existence of TTinternal practices and structures. These items facilitate the inter-action between TT-promoting R&D institutions and nearby sur-roundings. Then we created the master plan and used it tocompile facilitators, each one with its own rules. For the tool,we compiled 271 rules referring to 43 facilitators divided intoseven groups of facilitators (Resende et al., 2010). The betterimplemented a facilitator, the more prepared it will be to transfertechnology. And a facilitator will be well-implemented if its rulesare well-implemented.
In conclusion, the proposed assessment tool is designed to be acomprehensive and systematic approach to determine how well aTTO is performing, and where efficiency and effectivenessimprovements are most urgently needed. The tool produces apreliminary qualitative analysis to find the most important
actions that could quickly improve an institution’s TT processesand structures. The tool produces solutions focused on bottle-necks and the most important critical processes and structures,allowing improvements to be made in steps. Moreover, criticalfacilitators’ knowledge helps to identify quickly problems as wellas those actions necessary to optimize improvements. And thetool arranges actions in order of importance.
If properly used, and if current TTO performance is sub-optimal,this tool will lead to change: the redesign and specification of newprocesses, structures, and procedures. The redesign will be basedon teamwork aided by the system automation approach toimprove TT processes and procedures. Implementation is straight-forward requiring documentation, guides, instruction manuals,data sheets, and questionnaires, among others. The tool will bemost useful for TTOs interested in understanding their internalbottlenecks and willing to change them based upon this structuredapproach.
Acknowledgments
The authors would like to thank the Portuguese Science andTechnology Foundation (FCT) for financial support of this workwithin the UTEN project. The authors would also like to thank theinterviewees who generously shared their time and experiencewith us and acknowledge the support from all the people at theIC2 Institute (Austin—Texas).
References
Air Force Research Laboratory, 2001. Air Force Technology Transfer Handbook:Patent Licenses. /http://www.afrl.af.milS (accessed 2001).
Air Force Research Laboratory, 2002. Air Force Technology Transfer Handbook./http://www.afrl.af.milS (accessed 2002).
Anderson, T.R., Daim, T.U., Lavoie, F.F., 2007. Measuring the efficiency of universitytechnology transfer. Technovation 27 (5), 306–318.
APG Aberdeen Proving Ground, 2004. Science and Technology Board: TechTransfer Mechanisms. /http://stb.apg.army.mil/mechanisms/Transfer.htmS(accessed 2004).
Artificial Intelligence Applications Institute, 2009. /http://www.aiai.ed.ac.ukS(accessed 2009).
Carvalho, Vidal, 2009. Open Innovation: Novo paradigma de Inovac- ~ao. CEISE/STI—Centro de Investigac- ~ao e Servic-os ao Exterior em Sistemas e Tecnologiasde Informac- ~ao. Newsletter 25 (March).
Chapple, W., Lockett, A., Siegel, D., Wright, M., 2005. Assessing the relativeperformance of U.K. university technology transfer offices: parametric andnon-parametric evidence. Research Policy 34 (3), 369–384.
Chesbrough, Henry, Vanhaverbeke, Wim, West, Joel (Eds.), 2006. Oxford UniversityPress, Oxford.
Debackere, K., Veugelers, R., 2005. The role of academic technology transferorganizations in improving industry-science links. Research Policy 34 (3),321–342.
Decter, M., Bennett, D., Leseure, M., 2007. University to business technologytransfer—UK and USA comparisons. Technovation 27 (3), 145–155.
Etzkowitz, H., Webster, A., Gebhardt, C., Terra, B.R.C., 2000. The future of theuniversity and the university of the future: evolution of ivory tower toentrepreneurial paradigm. Research Policy 29, 313–330.
Federal Laboratory Consortium for Technology Transfer, 2004. Technology TransferDesk Reference. /http://www.federallabs.orgS (accessed 2004).
FEUP—Faculdade de Engenharia da Universidade do Porto, 2004. Polıtica da FEUPpara a protecc- ~ao da propriedade intelectual. FEUP.
Friedman, J., Silberman, J., 2003. University technology transfer: do incentives,management, and location matter? Journal of Technology Transfer 28, 17–30.
Fundacion Cotec para la Innovacion Tecnologica, 2003. Nuevos mecanismos detransferencia de tecnologıa: Debilidades y oportunidades del Sistema Espanolde Transferencia de Tecnologıa: Encuentros Empresariales. In: Cotec, 2003(Ed.). COTEC, Gijon.
Genet, C., Errabi, K., Gauthier, C., 2012. Which model of technology transfer fornanotechnology? A comparison with biotech and microelectronics. Technova-tion 32 (3–4), 205–215.
Gibson, D.V., Rogers, E.M., 1994. R&D Collaboration on Trial: The Microelectronicsand Computer Technology Corporation. Harvard Business School Press, Boston.
Gilsing, V., Bekkers, R., Bodas Freitas, I.M., Van Der Steen, M., 2011. Differences intechnology transfer between science-based and development-based indus-tries: transfer mechanisms and barriers. Technovation 31 (12), 638–647.
Glaser, Barney G., Strauss, Anselm L., 1967. The Discovery of Grounded Theory:Strategies for Qualitative Research. Aldine Publishing Company, Chicago.
D.N. Resende et al. / Technovation 33 (2013) 2–1212
Godinho, Manuel M., Silva, Luis Mira, Cartaxo, Rui, 2008. Analise da actividade dasOficinas de Transferencia de Tecnologia e de Conhecimento (OTIC) e dosGabinetes de Apoio �a Promoc- ~ao da Propriedade Industrial (GAPI) de ambitoacademico. OTIC/UTL, Lisboa.
Grimpe, Christoph, Fier, Heide, 2010. Informal university technology transfer: acomparison between the United States and Germany. Journal of TechnologyTransfer 35, 637–650.
grupUNAVE & GAPI, 2003. Ciclo de Seminarios: A Propriedade Industrial noContexto Universitario. Universidade de Aveiro, Aveiro.
Hoye, K., Pries, F., 2009. ‘Repeat commercializers’, the ‘habitual entrepreneurs’ ofuniversity–industry technology transfer. Technovation 29 (10), 682–689.
IAPMEI—Instituto de Apoio �as Pequenas e Medias Empresas e �a Inovac- ~ao, 2009.Incentivos e Apoios. /http://www.iapmei.pt/iapmei-art-01.phpS (accessed2009).
IEETA—Instituto de Engenharia Electronica e Telematica de Aveiro, 2010. BHP in aNutshell: A Methodology for Process Improvement in Hospitals. Universidade deAveiro. /http://www.ieeta.pt/team-hos/cached/teamhos/home.nsfS (accessed2010).
INPI—Instituto Nacional da Propriedade Industrial, 2009a. Manual de Aplicac- ~ao doCP: Vers~ao V.06 (Jul. 2009). INPI, Lisboa.
INPI—Instituto Nacional da Propriedade Industrial, 2009b. Guia de Procedimentospara Direitos de Incidencia Tecnologica: Vers~ao V.03 (Fev.2009). INPI, Lisboa.
IPN—Instituto Pedro Nunes, 2009. /https://www.ipn.pt/si/apresentacaoS(accessed 2009).
Isis Innovation Lda, 2009. /http://www.isis-innovation.comS (accessed 2009).Kennispark Twente—University of Twente, 2010. Annual Report 2007 and Putting
Science to Work. /http://www.kennispark.nl/en/About%20Kennispark%20Twente/S (accessed 2010).
Lam, A., 2011. What motivates academic scientists to engage in researchcommercialization: ‘gold’, ‘ribbon’ or ‘puzzle’? Research Policy 40 (10),1354–1368.
McAdam, R., Keogh, W., Galbraith, B., Laurie, D., 2005. Defining and improvingtechnology transfer business and management processes in university innova-tion centres. Technovation 25 (12), 1418–1429.
McAdam, R., Miller, K., McAdam, M., Teague, S., 2012. The development ofuniversity technology transfer stakeholder relationships at a regional level:lessons for the future. Technovation 32 (1), 57–67.
Monash University, 2010. Science Technology Research and Innovation Precinct(STRIP). /http://www.monash.edu.au/STRIPS (accessed 2010).
NBIA—National Business Incubation Association, 2010. /http://www.nbia.orgS(accessed 2010).
Novozhilov, Y.V., 1991. University–industry cooperation in Eastern Europe: theexperience of some advanced universities in the USSR. International Journal ofTechnology Management 6 (5/6), 469–477.
NUS—National University of Singapore, 2009. INTRO—Industry and TechnologyRelations Office. /http://www.nus.edu.sg/introS and /www.nus.edu.sg/NUSinfo/Milestones/research.htmlS (accessed 2009).
O’Gorman, C., Byrne, O., Pandya, D., 2008. How scientists commercialise newknowledge via entrepreneurship. Journal of Technology Transfer 33, 23–43.
ONR—Office of Naval Research, 2004. Industrial and Corporate Program: Technol-ogy Transfer Mechanisms. /http://www.onr.navy.mil/sci_tech/S (accessed2004).
Owen-Smith, J., Powell, W.W., 2001. To patent or not: faculty decisions andinstitutional success at technology transfer. Journal of Technology Transfer 26,99–114.
Oxford Centre for Innovation, 1995. Best Practices in the Facilitation of TechnologyTransfer: Lessons From the Entry Data for the 1995 Department of Trade andIndustry Technology Transfer Award. Oxford Centre for Innovation, Oxford.
Oxford University, 2009. Research Services. /http://www.admin.ox.ac.uk/rsoS(accessed 2009).
Philpott, K., Dooley, L., O’Reilly, C., Lupton, G., 2011. The entrepreneurial uni-versity: examining the underlying academic tensions. Technovation 31 (4),161–170.
Pries, F., Guild, P., 2011. Commercializing inventions resulting from universityresearch: analyzing the impact of technology characteristics on subsequentbusiness models. Technovation 31 (4), 151–160.
RedOTRI Universidades & CRUE, 2009. Informe de la encuesta RedOTRI 2008.RedOTRI, Spain.
Resende, David N., 2010. Transferencia de Tecnologia: as praticas actuais e umaMetodologia para analise subjectiva das instituic- ~oes. Ph.D. Thesis. Universi-dade de Aveiro—DEGEI, Aveiro, Portugal.
Resende, David N., Gibson, D., Jarrett, J., Diz, H., Reis, D., 2010. A set of ‘‘Facilitators’’that drive the Technology Transfer Offices (TTO) in the actual effective andefficient practices of TT. In: IAMOT 2010—Proceedings of the 19th InternationalConference on Management of Technology. March 8–11, 2010, Cairo, Egypt.
Rogers, E.M., Takegami, S., Yin, J., 2001. Lessons learned about technology transfer.Technovation 21 (4), 253–261.
Sanchez, A.M., Tejedor, A.P., 1995. University–industry relationships in peripheralregions: the case of Aragon in Spain. Technovation 15 (10), 613–625.
Siegel, D.S., Waldman, D., Link, A., 2003. Assessing the impact of organizationalpractices on the relative productivity of university technology transfer offices:an exploratory study. Research Policy 32 (1), 27–48.
SINTEF—Stiftelsen for industriell og teknisk forskning, 2009. Annual Report 2008./http://www.sintef.no/Home/Technology-transfer/S (accessed 2009).
Steinbeis Foundation for Economic Development, 2009. /http://www.stw.de/en/about-steinbeis/organization.htmlS (accessed 2009).
Strauss, Anselm, Corbin, Juliet, 1990. Basics of Qualitative Research: GroundedTheory Procedures and Techniques. EUA: Sage, Newbury Park.
TecMinho—Universidade do Minho,2009. /http://www.tecminho.uminho.pt/S(accessed 2009).
Theodorakopoulos, N., Preciado, D., Bennett, D., 2012. Transferring technologyfrom university to rural industry within a developing economy context: thecase for nurturing communities of practice. Technovation 32 (9–10), 550–559.
Todorovic, Z.W., McNaughton, R.B., Guild, P., 2011. ENTRE-U: an entrepreneurialorientation scale for universities. Technovation 31 (2–3), 128–137.
UCL—Universite Catholique de Louvain, 2010. Research and Development LiaisonsOffice. /http://www.ucl.ac.be/intro-en.htmlS (accessed 2010).
Copyright © 2022 FDOKUMEN