
Brand Management in Small to Medium-Sized Enterprises &ast
19
Brand Management in Small to Medium-Sized Enterprises* by Pierre Berthon, Michael T. Ewing, and Julie Napoli Although an impressive body of literature has emerged focusing on the critical activities involved in brand management for larger organizations with well- established brands and substantial marketing budgets, no research has been under- taken to examine branding within small to medium-sized enterprises (SMEs). The present study therefore seeks to assess the nature and scope of brand management within an SME context. Findings show significant differences between small and large organizations along 9 of the 10 brand management dimensions reported in Keller’s brand report card. Moreover, different brand management practices are associated with business performance in SMEs. Implications of the study are high- lighted, limitations noted, and directions for future research outlined. Introduction The marketing literature has long recognized the strategic importance of effective brand management (Berthon, Hulbert, and Pitt 1999a; Keller 1998; Low and Fullerton 1994; Park, Jaworski, and MacInnis 1986). Two research streams have emerged: the first focuses on pro- viding an overarching brand manage- ment framework to guide managerial decision-making (Keller 1998; Macrae 1996; Aaker 1991; Park, Jaworski, and MacInnis 1986); whereas the second con- centrates on various discrete aspects of the process (Aaker and Joachimsthaler 2000; Berthon, Hulbert, and Pitt 1999a; de Chernatony and Riley 1998). This lit- erature suggests that organizations that direct their managerial actions and prac- tices toward the development, acquisi- tion, and leveraging of branded products and services will be better placed to see positive gains in performance (Noble, Sinha, and Kumar 2002; Hankinson 2001). However, two notable gaps in the *All authors contributed equally. Names appear alphabetically. Pierre Berthon is Clifford F. Youse Chair of Marketing at Bentley College. Michael T. Ewing is professor and head of the Department of Marketing at Monash University. Julie Napoli is senior lecturer in marketing at the University of Melbourne. Address correspondence to: Julie Napoli, School of Marketing, Curtin University of Tech- nology, GPO Box U1987, Perth, WA 6845. Tel: (618) 9266 7288. Fax: (618) 9266 3937. E-mail: [email protected]. Journal of Small Business Management 2008 46(1), pp. 27–45 BERTHON, EWING, AND NAPOLI 27
Transcript of Brand Management in Small to Medium-Sized Enterprises &ast

Brand Management in Small to Medium-SizedEnterprises*by Pierre Berthon, Michael T. Ewing, and Julie Napoli
Although an impressive body of literature has emerged focusing on the criticalactivities involved in brand management for larger organizations with well-established brands and substantial marketing budgets, no research has been under-taken to examine branding within small to medium-sized enterprises (SMEs). Thepresent study therefore seeks to assess the nature and scope of brand managementwithin an SME context. Findings show significant differences between small andlarge organizations along 9 of the 10 brand management dimensions reported inKeller’s brand report card. Moreover, different brand management practices areassociated with business performance in SMEs. Implications of the study are high-lighted, limitations noted, and directions for future research outlined.
IntroductionThe marketing literature has long
recognized the strategic importance ofeffective brand management (Berthon,Hulbert, and Pitt 1999a; Keller 1998; Lowand Fullerton 1994; Park, Jaworski, andMacInnis 1986). Two research streamshave emerged: the first focuses on pro-viding an overarching brand manage-ment framework to guide managerialdecision-making (Keller 1998; Macrae1996; Aaker 1991; Park, Jaworski, and
MacInnis 1986); whereas the second con-centrates on various discrete aspects ofthe process (Aaker and Joachimsthaler2000; Berthon, Hulbert, and Pitt 1999a;de Chernatony and Riley 1998). This lit-erature suggests that organizations thatdirect their managerial actions and prac-tices toward the development, acquisi-tion, and leveraging of branded productsand services will be better placed to seepositive gains in performance (Noble,Sinha, and Kumar 2002; Hankinson2001). However, two notable gaps in the
*All authors contributed equally. Names appear alphabetically.Pierre Berthon is Clifford F. Youse Chair of Marketing at Bentley College.Michael T. Ewing is professor and head of the Department of Marketing at Monash
University.Julie Napoli is senior lecturer in marketing at the University of Melbourne.Address correspondence to: Julie Napoli, School of Marketing, Curtin University of Tech-
nology, GPO Box U1987, Perth, WA 6845. Tel: (618) 9266 7288. Fax: (618) 9266 3937. E-mail:[email protected].
Journal of Small Business Management 2008 46(1), pp. 27–45
BERTHON, EWING, AND NAPOLI 27
literature can be identified. First, thereis a growing realization that successfulfirms often pursue multiple orientationssimultaneously. This has been referredto as organizational ambidexterity(Berthon, Hulbert, and Pitt 1999b). Morespecifically, the literature suggests thatmarket orientation alone may not alwayselicit desirable results for every type oforganization (Voss and Voss 2000; Chris-tensen and Bower 1996; Frosch 1996;MacDonald 1995; Hamel and Prahalad1994). Empirical studies of the extent towhich organizations focus on alternatebusiness philosophies, such as brandmanagement, are limited. Second, thebrand management literature hasfocused almost exclusively on large, mul-tinational brands (for example, the Inter-brand “top 100”). Small to medium-sizedenterprises (SMEs) have been largelyoverlooked. This is surprising, given thatSMEs constitute the vast (numerical)majority of organizations. Could it bebecause SMEs typically lack the capabili-ties, marketing power, and otherresources of larger organizations (LOs)(Knight 2000; Cohn and Lindberg 1972)?Or do SMEs fail to realize that brands canin fact be established and maintained onrelatively modest budgets (Aaker andJoachimsthaler 1999)? We contend thateven with constrained budgets, SME mar-keters can creatively manage and lever-age the full potential of their brands. Thequestion then becomes which brandmanagement principles, practices, orphilosophies are most amenable toSMEs.
To address these gaps, the presentstudy seeks to identify the nature andscope of brand management within anSME context by comparing such prac-tices to those of LOs. We commence byoutlining the characteristics of SMEs and(some of the) marketing challenges theyface. We then describe the present study,discuss the results, note the limitations,and highlight possible directions forfuture research in this area.
SME MarketingManagement
SMEs account for the vast majority oforganizations in most developed econo-mies (Culkin and Smith 2000; Graham1999; ABS 1997–1998). By way ofexample, of the 5.7 million businesses inthe United States, only 14,000 employmore than 500 workers (Chaston,Badger, and Sadler-Smith 2001). Further-more, SMEs contribute significantly toa country’s gross domestic product,national employment, and export perfor-mance (Culkin and Smith 2000; Graham1999; ABS, 1997–1998).
It has long been recognized that themanagement style, operations, and func-tions of SMEs are different from LOs(Knight 2000; Cohn and Lindberg 1972).The SME owner–manager is often thekey decision-maker and is responsiblefor managing and attending to many ofthe functions performed within the orga-nization, such as banking, advertising,recruitment, or even stationery pur-chases. The use of specialists, such asadvertising or recruitment agencies, israre (Culkin and Smith 2000). Further-more, SMEs often face resource con-straints, both in terms of time andmoney, which result in many owner–managers adopting what could bedescribed as a “survival mentality.” Thisis perhaps exacerbated by the fact thatstrategic planning within SMEs is oftenlimited (Huang, Soutar, and Brown 2002;Orser, Hogarth-Scott, and Riding 2000;Gilmore et al. 1999). As such, the man-agement style within SMEs is one that isvery unique and personal to each firm(Culkin and Smith 2000; Gilmore et al.1999).
Several scholars have been quick toextol the virtues of being small. Theysuggest that unlike LOs, SMEs tend to bemore entrepreneurial, flexible, and inno-vative, which makes them more adept atserving specialist or niche markets andremaining responsive to customer needs
JOURNAL OF SMALL BUSINESS MANAGEMENT28
(Gilmore et al. 1999; Cohn and Lindberg1972). SMEs have more of an opportu-nity to get close to customers and obtainvaluable feedback, which can then beused to provide them with a custo-mized, value-added service (Gilmoreet al. 1999). In addition, research hasshown that entrepreneurial SMEs have agreater ability to leverage marketingstrategies for entering new productmarkets and coping with complex envi-ronments (Knight 2000). Furthermore,they tend to exhibit a higher order levelof organizational learning and are moreadept at acquiring and utilizing market-ing information than their nonentrepre-neurial counterparts (Chaston, Badger,and Sadler-Smith 2001).
However, research has demonstratedthat SMEs are more likely to experienceproblems in marketing, human resourcemanagement, and general business plan-ning (Huang and Brown 1999). Whencombined with a lack of marketingexpertise, difficulties arise in selectingsuitable promotional media, designingcontent, conducting market research,and interpreting marketing information(Raymond, Brisoux, and Azami 2001;Huang and Brown 1999). This is partlya result of limited financial, technologi-cal and managerial resources, lack ofmanagement information systems andconcentration of decision-making with,more often than not, the owner–manager (Huang, Soutar, and Brown2002; Raymond, Brisoux, and Azami2001; Huang and Brown 1999). Further-more, marketing tends to be more reac-tive, in terms of responding to customerneeds, rather than proactive (Carsonand Gilmore 2000). As the businessdevelops, SME managers begin toexperiment with different marketingtechniques, acquiring experience andknowledge as time progresses andbecoming more adept at accommodat-ing those marketing practices thatproduce positive results for the organi-zation (Carson and Gilmore 2000).
It seems, then, that some of the con-ventional principles prescribed in themarketing literature cannot always befully appreciated or applied within anSME context (Carson and Gilmore 2000;Conant and White 1999; Gilmore et al.1999). The marketing activities of SMEstend to be pragmatic, practical andadapted to suit the unique needs, circum-stances and abilities of an individual SME(Carson and Gilmore 2000). When con-strained by resources, managers of SMEstend to pursue those activities theybelieve will deliver the greatest benefitto the organization and most effectivelyutilize the resources that are available(Carson and Gilmore 2000; Gilmore et al.1999). Furthermore, most marketingprinciples are adapted to suit the uniquesituation of an SME, with many owner/managers relying largely on their intu-ition, experience or judgment to makesuch decisions (Carson and Gilmore2000).
Brand ManagementMost marketing scholars are of the
view that a clear distinction can be madebetween a company’s identity/image andtheir reputation. Corporate image isdefined in terms of the publics’ latestbeliefs about a company (Balmer 1998)or the total impression an entity makeswith such publics (Dowling 1994). Cor-porate reputation, on the other hand,refers to value judgments about an orga-nization’s qualities, trustworthiness andreliability built up over time (Balmer1998; Fombrun and Van Riel 1997). Thissuggests that corporate reputation ismore durable than image and cannot bedeveloped or altered as quickly (Mark-wick and Fill 1997). Likewise, it requiresnurturing over time (Bennett and Kottasz2000).
De Chernatony (1999) suggests thatbrand management can help bridge thegap between a brand’s image/identityand its reputation. Brand management isthe process of creating, coordinating and
BERTHON, EWING, AND NAPOLI 29

monitoring interactions that occurbetween an organization and its stake-holders (Schultz and Barnes 1999), suchthat there is consistency between anorganization’s vision and stakeholders’beliefs about a brand. It is important thatorganizations initially focus their effortson creating an appropriate brand imagethat has a niche in the market place.Marketing mix elements should be usedto operationalize the concept and com-municate this to a target audience (Park,Jaworski, and MacInnis 1986). As thebrand (and organization) grows, mana-gerial emphasis should shift towardmaking a brand memorable, ensuringthat positive brand associations canreadily be recalled by consumers andreinforcing the link between a brand(image) and other products within acompany’s portfolio (Farquhar 1989;Park, Jaworski, and MacInnis 1986).Regardless of whether an organization iscomprised of a singular or multiplebrands, it is necessary that marketingefforts be directed toward establishingand maintaining a positive brand imagein the minds of key stakeholders.Ultimately, this can contribute to thedevelopment of a favorable corporatereputation (de Chernatony 1999).
Managing Brands inSMEs
Small business managers generallyaccept that a good corporate reputation isimportant to receiving legitimization fromdifferent stakeholders (Goldberg, Cohen,and Fiegenbaum 2003). However, the dif-ficulty often arises in terms of translatingthis viewpoint into specific reputation-building activities. Managing the externalimage of a business is one way to buildand enhance its reputation (Goldberg,Cohen, and Fiegenbaum 2003). Althoughsome scholarly attention has beendirected toward SME marketing (Carsonand Gilmore 2000; Conant and White1999; Gilmore et al. 1999), we could findno prior research specifically on brand
management in SMEs. Two studies alludeto this issue through a comparison of theorganizational structures and internal cul-tures of organizations that manage theworld’s top 100 brands and those manag-ing smaller, or outsider, brands (Hankin-son and Hankinson 1999, 1998). Resultsindicate that some aspects of corporateculture impact the way in which brandsare managed. A third study by Goldberg,Cohen, and Fiegenbaum (2003) suggeststhat few small businesses follow areputation-building strategy and when aneed for “image management” is recog-nized, it is often limited to implementinga public relations campaign. As is evidentin the brand management literature,however, the process of managing a cor-porate and/or brand image certainlycould entail a much broader set of activi-ties. This suggests that an SME’s approachto brand management differs from thepractices adopted by LOs, which raisesthe question of how brands are in fact,managed within SMEs. Hence, the follow-ing axiom and propositions are offered
A1: SMEs and LOs will vary in the extentto which they implement key brandmanagement practices (BMPs).
P1: BMPs differentiate high versus low-performing SMEs and LOs.
P2: High- and low-performing SMEs willdiffer in the extent to which theyimplement key BMPs.
The StudyKeller’s (2000) brand report card
(BRC), which consolidates many of thevarying perspectives on brand manage-ment, formed the basis of the question-naire used in this study. From the BRC, 37items, purported to measure organiza-tional BMPs and philosophies, were gen-erated. Face validity was assessed by twomarketing academics, whose task was toidentify any overlapping, ambiguous orirrelevant items. This resulted in theretention of all 37 items. We then con-
JOURNAL OF SMALL BUSINESS MANAGEMENT30
ducted three focus groups with seniormanagers of both small and large organi-zations, to evaluate each statement forrelevance and clarity. Minor adjustment tothe wording of some statements wasrequired, however, all 37 items wereretained for analysis. Each item was thenplaced on a seven-point scale, withrespondents asked to rate the extent towhich their organization engaged in theactivity described. A response of 1reflected “to a very little extent”, and a 7,“to a very great extent”. The questionnairealso included subjective measures oforganizational performance. Subjectivemeasures have been shown to be reliablein gauging an organization’s performance(Mintzberg 1996; Pearce, Robbins, andRobinson 1987), and produce results con-sistent with objective measures of perfor-mance (Dess, Lumpkin, and Covin 1997;Dess and Robinson 1984). The use ofsubjective measures can also be an effec-tive way by which to overcome difficultiesassociated with obtaining, what couldbe described as, competitively sensitiveinformation (Caruana, Ramaseshan, andEwing 1998). Furthermore, measuring anorganization’s performance using objec-tive financial data can be difficult as theinformation may either be unavailable,unreliable or difficult to validate withexternal sources (Sapienza, Smith, andGannon 1988).
SampleConsistent with prior literature, we
focused on organizations that marketedtheir products or services directly to finalconsumers (B2C). Industries wereselected based on the Standard IndustryClassification code and specific organiza-tions within each sector selected througha random sampling technique. The finalsample consisted of 1,000 organizationsoperating across six broad industries.Data were collected from the ChiefExecutive Officer via a mail survey.Ninety-two questionnaires were returnedto us unopened, with 263 usable ques-
tionnaires retained for analysis. This rep-resents a response rate of 29 percent.
Armstrong and Overton’s (1977) pro-cedure was used to assess for nonre-sponse bias. This technique is based onthe assumption that late respondents aresimilar to the “theoretical” nonrespon-dent. If no significant differences areobserved between early and late respon-dents, it can be assumed that nonrespon-dents are similar to survey participantsand the effects of nonresponse biasminimal (Armstrong and Overton 1977).An independent samples t-test was usedto compare responses along the scaleitems between early and late respon-dents, which were represented by thefirst and fourth quartiles, respectively.Results indicated that there were no sig-nificant differences between early andlate respondents. As such, it can beassumed that the probability of non-response bias is minimal.
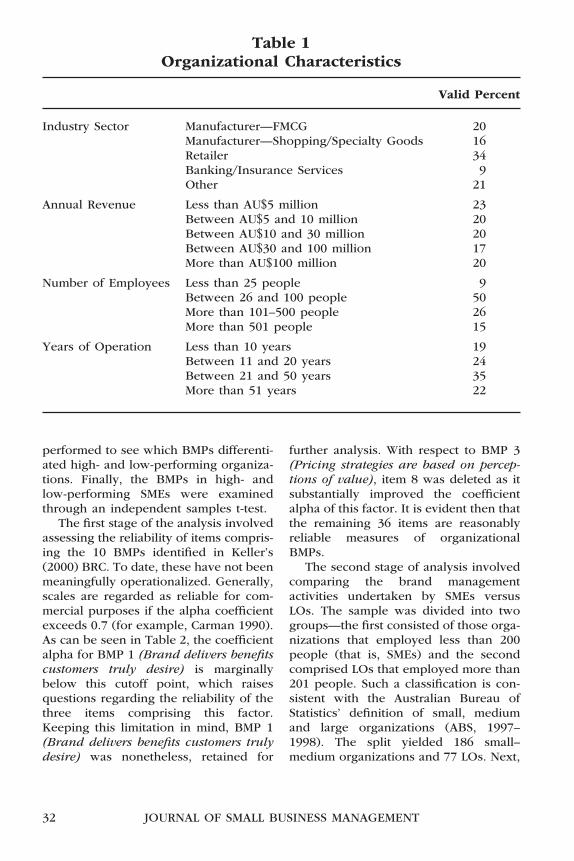
As can be seen in Table 1, bothservice organizations and manufacturersare evenly represented. The majority ofrespondent organizations (78 percent)have been in operation for less than 50years. Furthermore, 63 percent of thesample reported annual revenues of lessthan AU$30 million and employed fewerthan 500 people (85 percent). In terms ofthe demographic characteristics of indi-vidual respondents, the position heldwithin the organization was either that ofChief Executive Officer (66 percent),manager (33 percent) or “other” (1percent). Eighty percent of respondentswere male, 30 percent were youngerthan 40 years of age, 33 percent werebetween 41 and 50 years, 34 percentwere between 51 and 60 years, with theremainder being older than 61 years.
ResultsThe analysis proceeded in a number
of stages. First, the reliability of itemscomprising the 10 BMPs was assessed.Second, BMPs in SMEs and LOs werecompared and a discriminant analysis
BERTHON, EWING, AND NAPOLI 31
performed to see which BMPs differenti-ated high- and low-performing organiza-tions. Finally, the BMPs in high- andlow-performing SMEs were examinedthrough an independent samples t-test.
The first stage of the analysis involvedassessing the reliability of items compris-ing the 10 BMPs identified in Keller’s(2000) BRC. To date, these have not beenmeaningfully operationalized. Generally,scales are regarded as reliable for com-mercial purposes if the alpha coefficientexceeds 0.7 (for example, Carman 1990).As can be seen in Table 2, the coefficientalpha for BMP 1 (Brand delivers benefitscustomers truly desire) is marginallybelow this cutoff point, which raisesquestions regarding the reliability of thethree items comprising this factor.Keeping this limitation in mind, BMP 1(Brand delivers benefits customers trulydesire) was nonetheless, retained for
further analysis. With respect to BMP 3(Pricing strategies are based on percep-tions of value), item 8 was deleted as itsubstantially improved the coefficientalpha of this factor. It is evident then thatthe remaining 36 items are reasonablyreliable measures of organizationalBMPs.
The second stage of analysis involvedcomparing the brand managementactivities undertaken by SMEs versusLOs. The sample was divided into twogroups—the first consisted of those orga-nizations that employed less than 200people (that is, SMEs) and the secondcomprised LOs that employed more than201 people. Such a classification is con-sistent with the Australian Bureau ofStatistics’ definition of small, mediumand large organizations (ABS, 1997–1998). The split yielded 186 small–medium organizations and 77 LOs. Next,
Table 1Organizational Characteristics
Valid Percent
Industry Sector Manufacturer—FMCG 20Manufacturer—Shopping/Specialty Goods 16Retailer 34Banking/Insurance Services 9Other 21
Annual Revenue Less than AU$5 million 23Between AU$5 and 10 million 20Between AU$10 and 30 million 20Between AU$30 and 100 million 17More than AU$100 million 20
Number of Employees Less than 25 people 9Between 26 and 100 people 50More than 101–500 people 26More than 501 people 15
Years of Operation Less than 10 years 19Between 11 and 20 years 24Between 21 and 50 years 35More than 51 years 22
JOURNAL OF SMALL BUSINESS MANAGEMENT32
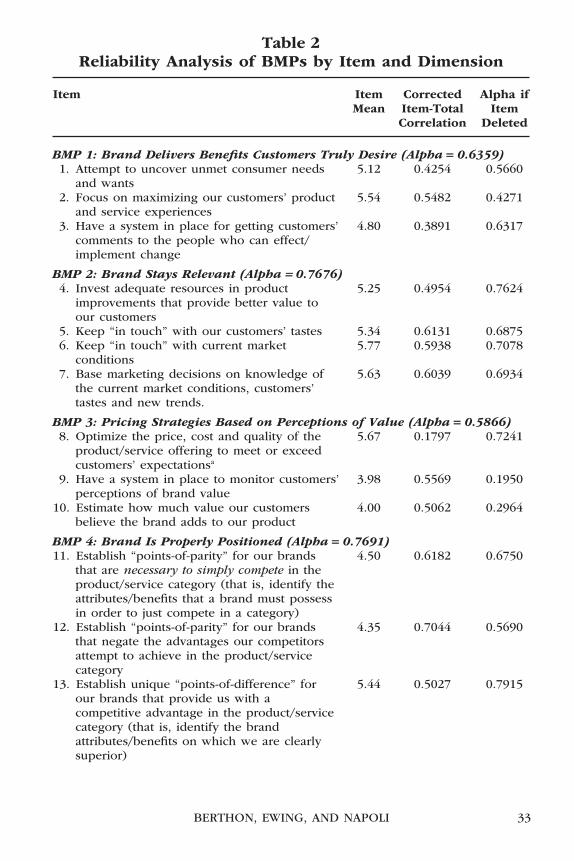
Table 2Reliability Analysis of BMPs by Item and Dimension
Item ItemMean
CorrectedItem-TotalCorrelation
Alpha ifItem
Deleted
BMP 1: Brand Delivers Benefits Customers Truly Desire (Alpha = 0.6359)1. Attempt to uncover unmet consumer needs
and wants5.12 0.4254 0.5660
2. Focus on maximizing our customers’ productand service experiences
5.54 0.5482 0.4271
3. Have a system in place for getting customers’comments to the people who can effect/implement change
4.80 0.3891 0.6317
BMP 2: Brand Stays Relevant (Alpha = 0.7676)4. Invest adequate resources in product
improvements that provide better value toour customers
5.25 0.4954 0.7624
5. Keep “in touch” with our customers’ tastes 5.34 0.6131 0.68756. Keep “in touch” with current market
conditions5.77 0.5938 0.7078
7. Base marketing decisions on knowledge ofthe current market conditions, customers’tastes and new trends.
5.63 0.6039 0.6934
BMP 3: Pricing Strategies Based on Perceptions of Value (Alpha = 0.5866)8. Optimize the price, cost and quality of the
product/service offering to meet or exceedcustomers’ expectationsa
5.67 0.1797 0.7241
9. Have a system in place to monitor customers’perceptions of brand value
3.98 0.5569 0.1950
10. Estimate how much value our customersbelieve the brand adds to our product
4.00 0.5062 0.2964
BMP 4: Brand Is Properly Positioned (Alpha = 0.7691)11. Establish “points-of-parity” for our brands
that are necessary to simply compete in theproduct/service category (that is, identify theattributes/benefits that a brand must possessin order to just compete in a category)
4.50 0.6182 0.6750
12. Establish “points-of-parity” for our brandsthat negate the advantages our competitorsattempt to achieve in the product/servicecategory
4.35 0.7044 0.5690
13. Establish unique “points-of-difference” forour brands that provide us with acompetitive advantage in the product/servicecategory (that is, identify the brandattributes/benefits on which we are clearlysuperior)
5.44 0.5027 0.7915
BERTHON, EWING, AND NAPOLI 33

Table 2Continued
Item ItemMean
CorrectedItem-TotalCorrelation
Alpha ifItem
Deleted
BMP 5: Brand Is Consistent (Alpha = 0.7280)14. Develop marketing programs that do not
send conflicting messages about our brandsto our target audience
5.11 0.5725 —
15. Adjust the brand’s marketing program tokeep current and abreast with changes inconsumer tastes
4.88 0.5725 —
BMP 6: Brand Portfolio and Hierarchy Make Sense (Alpha = 0.7684)16. Have a corporate brand that creates a
seamless umbrella for all the brands in ourportfolio
4.76 0.5065 0.7535
17. Ensure that the brands in our portfolio targetspecific, well-defined segments, which do notoverlap with one another
4.54 0.6210 0.6857
18. Ensure that brands in our portfolio fullymaximize market coverage
4.82 0.6229 0.6864
19. Create a brand hierarchy that is well thoughtout and well understood by our staff
4.82 0.5416 0.7276
BMP 7: Brand Uses Full Repertoire of Marketing Activities to Build Equity(Alpha = 0.8597)20. Design the brand name, logo, symbol,
slogan, packaging, signage etc., for ourproducts/services to maximize brandawareness and image
5.51 0.6161 0.8454
21. Implement integrated “push and pull”marketing activities to target both distributorsand customers
4.37 0.5604 0.8611
22. Ensure that brand managers are aware of allof the marketing activities that involve theirbrands
4.94 0.7690 0.8057
23. Ensure that all people involved in managingthe marketing activities for a brand are awareof one another
5.01 0.7267 0.8177
24. Capitalize on the unique capabilities of eachcommunication tool (that is, advertising, PR,sales promotion, etc.) while ensuring that themeaning of the brand is consistentlyrepresented
4.68 0.7222 0.8186
JOURNAL OF SMALL BUSINESS MANAGEMENT34
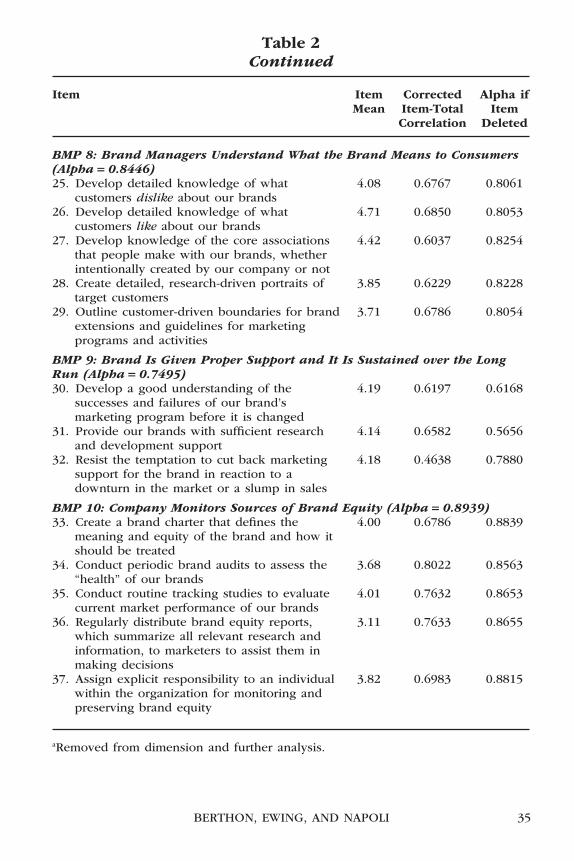
Table 2Continued
Item ItemMean
CorrectedItem-TotalCorrelation
Alpha ifItem
Deleted
BMP 8: Brand Managers Understand What the Brand Means to Consumers(Alpha = 0.8446)25. Develop detailed knowledge of what
customers dislike about our brands4.08 0.6767 0.8061
26. Develop detailed knowledge of whatcustomers like about our brands
4.71 0.6850 0.8053
27. Develop knowledge of the core associationsthat people make with our brands, whetherintentionally created by our company or not
4.42 0.6037 0.8254
28. Create detailed, research-driven portraits oftarget customers
3.85 0.6229 0.8228
29. Outline customer-driven boundaries for brandextensions and guidelines for marketingprograms and activities
3.71 0.6786 0.8054
BMP 9: Brand Is Given Proper Support and It Is Sustained over the LongRun (Alpha = 0.7495)30. Develop a good understanding of the
successes and failures of our brand’smarketing program before it is changed
4.19 0.6197 0.6168
31. Provide our brands with sufficient researchand development support
4.14 0.6582 0.5656
32. Resist the temptation to cut back marketingsupport for the brand in reaction to adownturn in the market or a slump in sales
4.18 0.4638 0.7880
BMP 10: Company Monitors Sources of Brand Equity (Alpha = 0.8939)33. Create a brand charter that defines the
meaning and equity of the brand and how itshould be treated
4.00 0.6786 0.8839
34. Conduct periodic brand audits to assess the“health” of our brands
3.68 0.8022 0.8563
35. Conduct routine tracking studies to evaluatecurrent market performance of our brands
4.01 0.7632 0.8653
36. Regularly distribute brand equity reports,which summarize all relevant research andinformation, to marketers to assist them inmaking decisions
3.11 0.7633 0.8655
37. Assign explicit responsibility to an individualwithin the organization for monitoring andpreserving brand equity
3.82 0.6983 0.8815
aRemoved from dimension and further analysis.
BERTHON, EWING, AND NAPOLI 35

10 BMP dimensions were formed bysummating the items that comprisedeach factor. An independent samplest-test was then used to compareresponses between the two groups along
each of the 10 BMP dimensions. As canbe seen in Table 3, significant differencesexist between SMEs and LOs along 9 ofthe 10 BMP dimensions (BMP1 and3–10), lending support to A1.
Table 3Comparison of BMPs between Small to Medium-Sized
Enterprises and Large Organizations
Dimension OrganizationType
N Mean S.D. Significance
BMP1 Brand deliversbenefits customerstruly desire
SME 186 5.09 1.09 0.05LO 77 5.46 1.87
263 5.20 1.37BMP2 Brand stays relevant SME 186 5.45 0.94 0.44
LO 77 5.55 0.79263 5.48 0.90
BMP3 Pricing strategiesbased onperceptions ofvalue
SME 186 4.36 1.09 0.00LO 77 4.99 1.01
263 4.55 1.10
BMP4 Brand is properlypositioned
SME 186 4.58 1.27 0.00LO 77 5.11 0.98
263 4.73 1.22BMP5 Brand is consistent SME 186 4.71 1.29 0.00
LO 77 5.62 0.96263 4.97 1.27
BMP6 Brand portfolio andhierarchy makesense
SME 186 4.54 1.24 0.00LO 77 5.06 1.05
263 4.69 1.21BMP7 Brand uses full
repertoire ofmarketing activitiesto build equity
SME 186 4.65 1.32 0.00LO 77 5.35 0.89
263 4.86 1.25
BMP8 Brand managersunderstand whatthe brand means toconsumers
SME 186 3.89 1.26 0.00LO 77 4.75 1.03
263 4.14 1.25
BMP9 Brand is given propersupport and it issustained over thelong run
SME 186 4.03 1.35 0.01LO 77 4.47 1.22
263 4.16 1.33
BMP10 Company monitorssources of brandequity
SME 186 3.33 1.40 0.00LO 77 4.72 1.53
263 3.74 1.57
JOURNAL OF SMALL BUSINESS MANAGEMENT36
A discriminant analysis was then usedto identify which BMPs were associatedwith superior business performanceamong both small and larger organiza-tions. The sample was split in terms ofsize and performance. The index fororganization performance was the com-posite of three self-report measures ofperformance: return on investment,market share and ability to serve custom-ers better, relative to rivals, (Delaney andHuselid 1996; Youndt et al. 1996;Conant, Mokwa, and Varadarajan 1990).Table 4 summarizes the main results offour-group discriminant analysis. First,from the univariate F-test, it can beobserved that all 10 BMPs varied acrossthe four groups (p < .01). Second, threediscriminant functions are extracted, thefirst two are significant at the 0 percentlevel, and third is significant at the 28percent level as measured by Wilks’Lambda statistic. The first discriminantfunction explained 57.1 percent of thevariance, the second function explained38.0 percent of the variance, whereas thethird function explained 4.9 percent ofthe variance. Figure 1 plots the centroidsof the four groups against the first twodiscriminant functions. As can be seen,high-performing LOs load positively onboth discriminant functions, high-performing SMEs load positively onfunction 2 and negatively on function 1,low-performing LOs load positively onfunction 1 and negatively on function 2,while low-performing SMEs load nega-tively on both dimensions. Thus, the firstdiscriminant function primarily differen-tiates between SMEs and LOs, whereasthe second discriminant function prima-rily differentiates between high- andlow-performing organizations. From thestructure matrix, it can be observed thatBMPs 10 (Company monitors sources ofbrand equity), 5 (Brand is consistent)and 7 (Brand uses full repertoire of mar-keting activities to build equity) contrib-ute primarily to the first discriminantfunction, whereas BMPs 2 (Brand stays
relevant), 9 (Brand is given propersupport and it is sustained over the longrun), 8 (Brand managers understandwhat the brand means to consumers), 3(Pricing strategies based on perceptionsof value), 1 (Brand delivers benefits cus-tomers truly desire), 6 (Brand portfolioand hierarchy make sense), and 4(Brand is properly positioned) contributeprimarily to the second discriminantfunction.
Further validation for the discriminantfunctions is provided by a comparison ofthe discriminant functions’ accuracy inpredicting group membership with theaccuracy expected from the use of a pro-portional chance model (cf. Hair et al.1998). The classification results revealthat the derived discriminant functionsprovide an overall accuracy of 64.6percent against 28.9 percent that mightbe expected from proportional chance, a35.7 percentage point improvement. Theclassification table shows that the classi-fication for low-performing SMEs isthe most accurate, with 74.5 percent ofcases being correctly assigned. High-performing SMEs are also well classifiedwith 67.9 percent of cases being cor-rectly assigned. High- and low-performing LOs are slightly less wellclassified, with 42.9 and 54.3 percentcorrect classification, respectively. Assuch, P1 is supported—BMPs differenti-ate between high- and low-performingSMEs and LOs.
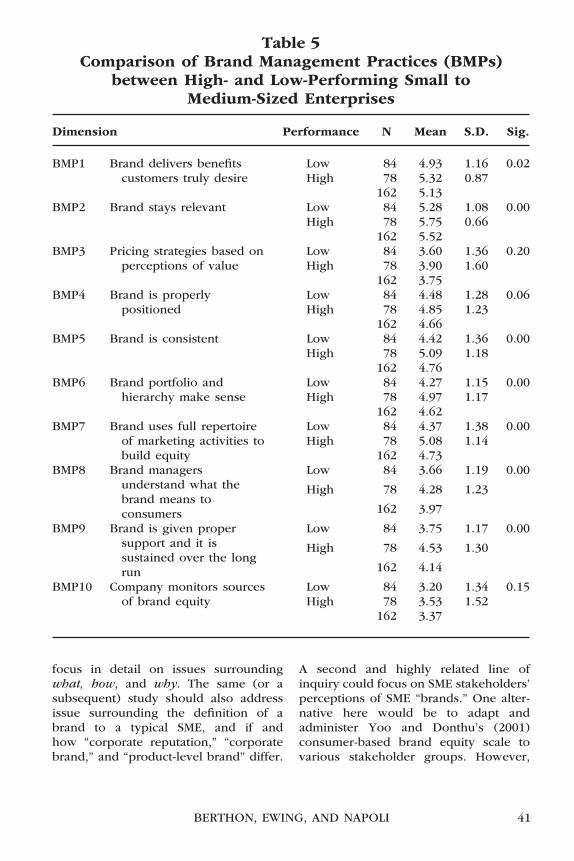
The final stage of analysis involvedspecifically comparing the brand man-agement activities undertaken by highversus low-performing SMEs. The sampleof SMEs was divided into two groups,by way of a mean split on organizationperformance. The split yielded 84low-performing SMEs and 78 high-performing SMEs. An independentsamples t-test was then used to compareresponses between the two groups alongeach of the 10 BMP dimensions. Ascan be seen from Table 5, significantdifferences exist between high- and
BERTHON, EWING, AND NAPOLI 37
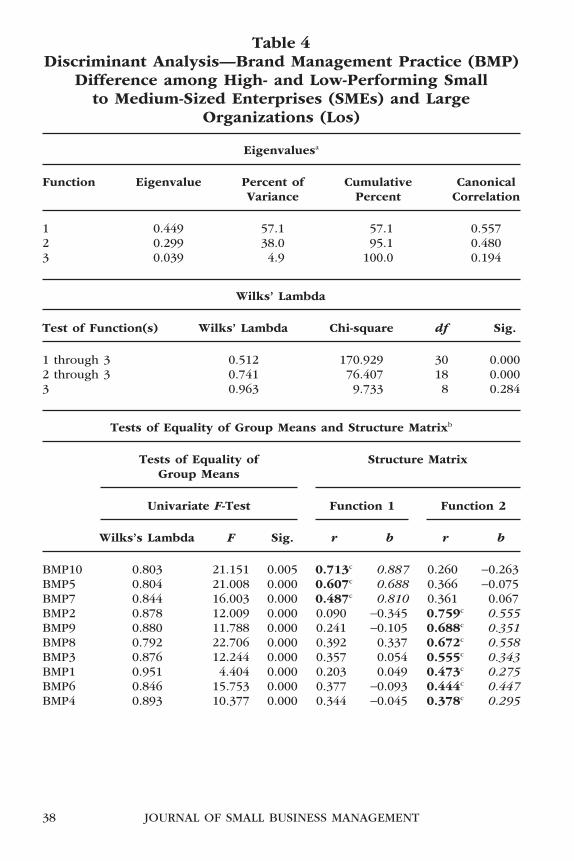
Table 4Discriminant Analysis—Brand Management Practice (BMP)
Difference among High- and Low-Performing Smallto Medium-Sized Enterprises (SMEs) and Large
Organizations (Los)
Eigenvaluesa
Function Eigenvalue Percent ofVariance
CumulativePercent
CanonicalCorrelation
1 0.449 57.1 57.1 0.5572 0.299 38.0 95.1 0.4803 0.039 4.9 100.0 0.194
Wilks’ Lambda
Test of Function(s) Wilks’ Lambda Chi-square df Sig.
1 through 3 0.512 170.929 30 0.0002 through 3 0.741 76.407 18 0.0003 0.963 9.733 8 0.284
Tests of Equality of Group Means and Structure Matrixb
Tests of Equality ofGroup Means
Structure Matrix
Univariate F-Test Function 1 Function 2
Wilks’s Lambda F Sig. r b r b
BMP10 0.803 21.151 0.005 0.713c 0.887 0.260 -0.263BMP5 0.804 21.008 0.000 0.607c 0.688 0.366 -0.075BMP7 0.844 16.003 0.000 0.487c 0.810 0.361 0.067BMP2 0.878 12.009 0.000 0.090 -0.345 0.759c 0.555BMP9 0.880 11.788 0.000 0.241 -0.105 0.688c 0.351BMP8 0.792 22.706 0.000 0.392 0.337 0.672c 0.558BMP3 0.876 12.244 0.000 0.357 0.054 0.555c 0.343BMP1 0.951 4.404 0.000 0.203 0.049 0.473c 0.275BMP6 0.846 15.753 0.000 0.377 -0.093 0.444c 0.447BMP4 0.893 10.377 0.000 0.344 -0.045 0.378c 0.295
JOURNAL OF SMALL BUSINESS MANAGEMENT38

low-performing SMEs along 7 of the 10BMPs. That is, higher-performing SMEsplace relatively more emphasis than low-performing SMEs on brand benefits(BMP1), relevancy (BMP2), consistency(BMP5), portfolio (BMP6), activities(BMP7), meaning (BMP8) and support(BMP9). These findings provide someempirical evidence of the importanceand value of brand management to SMEsand lend support to P2—that is, high-performing SMEs implement BMPs to agreater extent than their less successfulcounterparts.
Discussion andImplications
Over the years, marketing scholarsand practitioners have continued to
expand the domain of brand manage-ment and describe the salient practices,principles and philosophies that organi-zations should adopt. Not surprisingly,the focus has tended to be on the world’smost successful brands. Managers oflarge corporations, with significant mar-keting budgets, therefore have an abun-dance of information (albeit not allempirical) to guide their brandingefforts. However, the question of howsmaller organizations, with modestresources, can effectively manage theirbrands has been hitherto completelyoverlooked by researchers. This studyexamined the nature and scope of brandmanagement in SMEs. Specifically, wesought to first identify whether BMPsemployed by SMEs varies to that of LOs
Table 4Continued
Classification Resultsd
Predicted Group Membership
Low-performing
SMEs
High-performing
SMEs
Low-performing
LOs
High-performing
LOs
Total
Count(%)
Low-performingSMEs
73 19 2 4 98(74.5) (19.4) (2.0) (4.1) (100.0)
High-performingSMEs
20 57 0 7 84(23.8) (67.9) (0.0) (8.3) (100.0)
Low-performingLOs
6 6 15 8 35(17.1) (17.1) (42.9) (22.9) (100.0)
High-performingLOs
10 11 0 25 46(21.7) (23.9) (0.0) (54.3) (100.0)
aFirst three canonical discriminant functions were used in the analysis.br = Pooled within-groups correlations between discriminating variables andstandardized canonical discriminant functions. Variables ordered by absolute sizeof correlation within function. b = standardized canonical discriminant functioncoefficients.cLargest absolute correlation between each variable and any discriminant function.d64.6 percent of original grouped cases correctly classified; 28.9 percent accuracyexpected from proportional chance model.
BERTHON, EWING, AND NAPOLI 39

and second, whether such differencesextend to high- and low-performingSMEs.
The results indicate that there are cer-tainly differences between SMEs and LOsin the extent to which they implementkey BMPs. It is evident from the resultsthat SMEs and LOs alike are both cogni-zant of the need to deliver relevant anddesirable brands to customers. However,the BMPs of LOs are certainly gearedmore toward understanding and moni-toring consumer needs and measuringthe effectiveness of past actions.
It is also evident from the results thatthe 10 BMP dimensions are effective indiscriminating between high- and low-performing small and large organiza-tions. More importantly, it seems thathigh-performing SMEs implement keyBMPs to a greater extent than low-performing SMEs. Brand-focused SMEsare able to achieve a distinct perfor-mance advantage over rivals by essen-
tially getting back to the “brandingbasics”: that is, understanding customers’needs and brand perceptions, creatingrelevant and valued brands, supportingthe brand consistently over time, effec-tively communicating the brand’s iden-tity to internal and external stakeholdersand creating a coherent brand architec-ture. Such activities are well noted in theliterature as necessary for building andmanaging brand equity in the long term(Keller 1999, 1998; Shocker, Srivastava,and Ruekert 1994; Park, Jaworski, andMacInnis 1986). In particular, this sug-gests that there is the potential for SMEsto optimize their performance by mirror-ing and adapting the brand managementactivities of their larger counterparts totheir specific needs and circumstances.Ultimately, this should go some waytoward contributing to the ongoing per-formance of organizations.
Limitations andDirections for FutureResearch
This study paves the way for delineat-ing the salient brand managementactivities necessary for enhancing theperformance of both SMEs and LOs.Several limitations of the study are to benoted, however. First, the two subgroupsused in this study (that is, SMEs and LOs)were unequal size, with the latter beingsomewhat smaller than desirable.Second, the study was based on Keller’s(2000) BRC, which raises the question ofwhether the BRC in fact fully capturesthe nuances of branding in SMEs. Third,the reliability of one of the BMP dimen-sions is questionable.
There are several salient avenues forfuture research in this area. First, thefield would benefit tremendously from agrounded, interpretive study of SMEsand how they view their key intangible(marketing) asset. Such an approachmight take the form of multiple casestudies or depth interviews and could
Figure 1Plot of Group Centroids forHigh- and Low-Performing
Small to Medium-SizedEnterprises and Larger
Organizations byDiscriminant Functions
210-1-2
2
0
-2
High PerformingLCs
Low PerformingLCs
High PerformingSMEs
Low PerformingSMEs
Function 1
Fun
ctio
n 2
JOURNAL OF SMALL BUSINESS MANAGEMENT40
focus in detail on issues surroundingwhat, how, and why. The same (or asubsequent) study should also addressissue surrounding the definition of abrand to a typical SME, and if andhow “corporate reputation,” “corporatebrand,” and “product-level brand” differ.
A second and highly related line ofinquiry could focus on SME stakeholders’perceptions of SME “brands.” One alter-native here would be to adapt andadminister Yoo and Donthu’s (2001)consumer-based brand equity scale tovarious stakeholder groups. However,
Table 5Comparison of Brand Management Practices (BMPs)
between High- and Low-Performing Small toMedium-Sized Enterprises
Dimension Performance N Mean S.D. Sig.
BMP1 Brand delivers benefitscustomers truly desire
Low 84 4.93 1.16 0.02High 78 5.32 0.87
162 5.13BMP2 Brand stays relevant Low 84 5.28 1.08 0.00
High 78 5.75 0.66162 5.52
BMP3 Pricing strategies based onperceptions of value
Low 84 3.60 1.36 0.20High 78 3.90 1.60
162 3.75BMP4 Brand is properly
positionedLow 84 4.48 1.28 0.06High 78 4.85 1.23
162 4.66BMP5 Brand is consistent Low 84 4.42 1.36 0.00
High 78 5.09 1.18162 4.76
BMP6 Brand portfolio andhierarchy make sense
Low 84 4.27 1.15 0.00High 78 4.97 1.17
162 4.62BMP7 Brand uses full repertoire
of marketing activities tobuild equity
Low 84 4.37 1.38 0.00High 78 5.08 1.14
162 4.73BMP8 Brand managers
understand what thebrand means toconsumers
Low 84 3.66 1.19 0.00
High 78 4.28 1.23
162 3.97
BMP9 Brand is given propersupport and it issustained over the longrun
Low 84 3.75 1.17 0.00
High 78 4.53 1.30
162 4.14
BMP10 Company monitors sourcesof brand equity
Low 84 3.20 1.34 0.15High 78 3.53 1.52
162 3.37
BERTHON, EWING, AND NAPOLI 41
other more generative approaches couldwork just as well. A third direction mightentail the development of a psychometri-cally robust measure of brand manage-ment within SMEs (in other words, amore deductive approach than that fol-lowed in this paper). This could assistpractitioners in benchmarking theiractivities against rival organizations andunderstanding the effectiveness of theirbranding activities. From an academicperspective, such a scale would providea mechanism by which to explore rela-tionships and associations with otherconstructs. Fourth, research could bedirectly toward identifying and under-standing the key antecedents to and con-sequences of an SME’s BMPs. Forinstance, what are the key drivers of theBMPs pursued by an organization? Whatimpact does organizational culture haveon an organization’s BMPs or vice versa?What are the outcomes of adopting effec-tive BMPs and does it lead to measurableimprovements in organizational perfor-mance, customer satisfaction or commit-ment? Alternatively, which BMPs lead toincreased brand equity? These are someof the questions that future researcherscould address. Finally, it may be useful toidentify how the BMPs of SMEs differacross cultures and whether this leads todesirable performance outcomes.
In sum, this is an underresearchedarea. The present study provides anempirically based “springboard” forfuture research. Hopefully, others willtake up the challenge.
ReferencesAaker, D. A. (1991). Managing Brand
Equity. New York: The Free Press.Aaker, D. A., and E. A. Joachimsthaler
(1999). “The Lure of Global Brand-ing,” Harvard Business Review,November–December, 137–144.
——— (2000). “The Brand RelationshipSpectrum: The Key to the BrandArchitecture Challenge,” CaliforniaManagement Review 42(4), 8–23.
ABS. (1997–98). Small and MediumEnterprises: Business Growth and Per-formance Survey Australia. Canberra:Australian Bureau of Statistics, 55.
Armstrong, J. S., and R. S. Overton(1977). “Estimating Nonresponse Biasin Mail Surveys,” Journal of MarketingResearch 14(3), 396–402.
Balmer, J. M. T. (1998). “CorporateIdentity and the Advent of CorporateMarketing.” Journal of MarketingManagement 14(8), 963–996.
Bennett, R., and Kottasz, R. (2000).“Practitioner Perceptions of CorporateReputation: an Empirical Investiga-tion,” Corporate Communications,5(4), 224.
Berthon, P., J. M. Hulbert, and L. F. Pitt(1999a). “Brand Management Prog-nostications,” Sloan ManagementReview 40(2), 53–65.
——— (1999b). “To Serve or Create? Stra-tegic Orientations Toward Customersand Innovation,” California Manage-ment Review 42(1), 37–58.
Carman, J. M. (1990). “Consumer Percep-tions of Service Quality: an Assess-ment of the SERVQUAL Dimensions,”Journal of Retailing 66(1), 33–55.
Carson, D., and A. Gilmore (2000). “Mar-keting at the Interface: Not ‘What’ but‘How,’ ” Journal of Marketing Theoryand Practice 8(2), 1–7.
Caruana, A., B. Ramaseshan, and M. T.Ewing (1998). “Do Universities thatAre more Market Oriented PerformBetter?” The International Journalof Public Sector Management 11(1),55–64.
Chaston, I., B. Badger, and E. Sadler-Smith (2001). “Organizational Learn-ing: An Empirical Assessment ofProcess in Small UK ManufacturingFirms,” Journal of Small BusinessManagement 39(2), 139–151.
Christensen, C. M., and J. L. Bower(1996). “Customer Power, StrategicInvestment and the Failure of LeadingFirm,” Strategic Management Journal17(3), 197–218.
JOURNAL OF SMALL BUSINESS MANAGEMENT42

Cohn, T., and R. Lindberg (1972). HowManagement Is Different in SmallCompanies. New York: AmericanManagement Association.
Conant, J. S., M. P. Mokwa, and P. R.Varadarajan (1990). “Strategic Types,Distinctive Marketing Competenciesand Organizational Performance: AMultiple Measures-Based Study,” Stra-tegic Management Journal 11(5), 365–383.
Conant, J. S., and J. C. White (1999).“Marketing Program Planning,Process Benefits and Store Perfor-mance: An Initial Study Among SmallRetail Firms,” Journal of Retailing75(4), 525–541.
Culkin, N., and D. Smith (2000). “AnEmotional Business: A Guide to Under-standing the Motivations of SmallBusiness Decision Takers,” QualitativeMarket Research 3(3), 145–157.
de Chernatony, L. (1999). “Brand Man-agement Through Narrowing the GapBetween Brand Identity and BrandReputation,” Journal of MarketingManagement 15, 157–179.
de Chernatony, L., and F. D. O. Riley(1998). “Modeling the Components ofthe Brand,” European Journal ofMarketing 32(11/12), 1074–1090.
Delaney, J. T., and M. A. Huselid (1996).“The Impact of Human ResourceManagement Practices on Perceptionsof Organizational Performance,”Academy of Management Journal 39,919–969.
Dess, G. G., and R. B. Robinson (1984).“Measuring Organizational Perfor-mance in the Absence of ObjectiveMeasures: The Case of the Privately-held Firm and Conglomerate BusinessUnit,” Strategic Management Journal5(3), 265–273.
Dess, G. G., G. T. Lumpkin, and J. G.Covin (1997). “Entrepreneurial Strat-egy Making and Firm Performance:Tests of Contingency and Configura-tional Models,” Strategic ManagementJournal 18(1), 2–23.
Dowling, G. (1994). Corporate Reputa-tions: Strategies for Developing theCorporate Brand. London: KoganPage.
Farquhar, P. H. (1989). “Managing BrandEquity,” Marketing Research 1(Sep-tember), 24–33.
Fombrun, C. J., and C. B. M. Van Riel(1997). “The Reputational Landscape,”Corporate Reputation Review 1(1/2),5–13.
Frosch, R. A. (1996). “The Customerfor R&D id Always Wrong,” ResearchTechnology Management39(November–December), 22–27.
Gilmore, A., D. Carson, A. O’Donnell,and D. Cummins (1999). “AddedValue: A Qualitative Assessment ofSME Marketing,” Irish MarketingReview 12(1), 27–35.
Goldberg, A. I., G. Cohen, and A. Fiegen-baum (2003). “Reputation Building:Small Business Strategies for Success-ful Venture Development,” Journal ofSmall Business Management 41(2),168–186.
Graham, P. (1999). “Small Business Par-ticipation in the Global Economy,”European Journal of Marketing33(1/2), 88–102.
Hair, J. F., anderson, R. E., Tatham, R. L.,and Black, W. C. (1998). MultivariateData Analysis, 5th ed. Upper SaddleRiver, NJ: Prentice Hall Inc.
Hamel, G., and C. K. Prahalad (1994).Competing for the Future. Boston:Harvard Business School Press.
Hankinson, P. (2001). “Brand Orientationin the Top 500 Fundraising Charitiesin the UK,” Journal of Product andBrand Management 10(6), 346–360.
Hankinson, P., and G. Hankinson (1998).“The Role of Organizational Structurein Successful Global Brand Manage-ment: A Case Study of the PierreSmirnoff Company,” The Journal ofProduct and Brand Management6(1), 29–43.
——— (1999). “Managing SuccessfulBrands: An Empirical Study which
BERTHON, EWING, AND NAPOLI 43

Compares the Corporate Cultures ofCompanies Managing the World’s Top100 Brands with Those Managing Out-sider Brands,” Journal of MarketingManagement 15(1–3), 135–155.
Huang, X., and A. Brown (1999). “AnAnalysis and Classification of Prob-lems in Small Business,” InternationalJournal of Small Business 18(1),73–86.
Huang, X., G. N. Soutar, and A. Brown(2002). “New Product DevelopmentProcesses in Small and Medium-SizedEnterprises,” Journal of Small Busi-ness Management 40(1), 27–42.
Keller, K. L. (1998). Strategic BrandManagement: Building, Measuringand Managing Brand Equity. ••, NJ:Prentice Hall.
——— (1999). “Managing Brands for theLong Run: Brand Reinforcement andRevitalization Strategies,” CaliforniaManagement Review 41(3), 102–124.
——— (2000). “The Brand Report Card,”Harvard Business Review 78(1), 147–156.
Knight, G. A. (2000). “Entrepreneurshipand Marketing Strategy: The SMEUnder Globalization,” Journal ofInternational Marketing 8(2), 12–32.
Low, G. S., and R. A. Fullerton (1994).“Brands, Brand Management and theBrand Manager System: A Critical-Historical Evaluation,” Journal ofMarketing Research 31(2), 173–190.
MacDonald, S. (1995). “Too Close forComfort? The Strategic Implications ofGetting Close to Customers,” Califor-nia Management Review 37(4), 8–27.
Macrae, C. (1996). The Brand CharteringHandbook. Harlow, UK: EIU/Addison-Wesley.
Markwick, N., and C. Fill (1997).“Towards a Framework for ManagingCorporate Identity,” EuropeanJournal of Marketing 31(5/6), 396.
Mintzberg, H. (1996). “ManagingGovernment Governing Manage-ment,” Harvard Business Review74(3), 75–83.
Noble, C. H., R. K. Sinha, and A. Kumar(2002). “Market Orientation and Alter-native Strategic Orientations: A Longi-tudinal Assessment of PerformanceImplications,” Journal of Marketing66(4), 25–39.
Orser, B. J., S. Hogarth-Scott, and A. L.Riding (2000). “Performance, FirmSize and Management ProblemSolving,” Journal of Small BusinessManagement 38(4), 42–58.
Park, C. W., B. J. Jaworski, D. J. MacInnis(1986). “Strategic Brand Concept-Image Management,” Journal ofMarketing 50(4), 135–145.
Pearce, J. A., D. K. Robbins, and R. B.Robinson (1987). “The Impact ofGrand Strategy and Planning Formal-ity on Financial Performance,” Strate-gic Management Journal 8(March–April), 125–134.
Raymond, L., J. Brisoux, and A. Azami(2001). “Marketing InformationSystems Practices in Small Manufac-turing Firms: Antecedents and Con-sequences.” Journal of ComputerInformation Systems 41(3), 32–41.
Sapienza, H. J., K. G. Smith, and M. J.Gannon (1988). “Using SubjectiveEvaluations of Organizational Perfor-mance in Small Business Research,”American Journal of Small Business12(3), 45–53.
Schultz, D., and B. E. Barnes (1999).Strategic Brand CommunicationCampaigns. Chicago: NTC BusinessBooks.
Shocker, A. D., R. K. Srivastava, and R.Ruekert (1994). “Challenges andOpportunities Facing Brand Manage-ment: An Introduction to the SpecialIssue,” Journal of Marketing Research31(May), 149–158.
Voss, G. B., and G. Z. Voss (2000).“Strategic Orientation and Firm Per-formance in an Artistic Environ-ment,” Journal of Marketing 64(1),67–83.
Yoo, B., and N. Donthu (2001). “Devel-oping and Validating a Multidimen-
JOURNAL OF SMALL BUSINESS MANAGEMENT44
sional Consumer-Based Brand EquityScale,” Journal of Business Research52(1), 1–14.
Youndt, M. A., S. A. Snell, J. W. Dean,and D. P. Lepak (1996). “Human
Resource Management, ManufacturingStrategy and Firm Performance,”Academy of Management Journal 39,836–865.
BERTHON, EWING, AND NAPOLI 45