The book of the goat. Containing full particulars of the various ...
Upload
khangminh22Category
view
0download
0

Organized by
Supported by
InternationalConferenceonSustainable
Development(ICSD)2015
Editedby
AlmaLigata
Published,2015
This work is subject to copyright. All rights are reserved, whether the whole or part of thematerialisconcerned.Nothingfromthispublicationmaybetranslated,reproduced,storedinacomputerizedsystemorpublished inany formor inanymanner, including,butnot limitedtoelectronic,mechanical,reprographicorphotographic,withoutpriorwrittenpermissionfromthepublisher
www.icsd.eu
www.zenithgroup.ba
Theindividualcontributionsinthispublicationandanyliabilitiesarisingfromthemremaintheresponsibilityoftheauthors.
The publisher is not responsible for possible damages, which could be a result of contentderivedfromthispublication.
Publisher: CNR GROUP Publishing

SCIENTIFICCOMMITTEE
Prof.Dr.AbdülhamitŞubaşıInternationalBurchUniversityProf.Dr.AbdulrezzakMemonInternationalUniversityofSarajevoProf.Dr.AdisaParićUniversityofSarajevoProf.Dr.AdnanÇelikSelçukUniversityProf.Dr.AnaVovk-KoržeUniversityofMariborProf.Dr.ArchieCarollUniversityofGeorgiaProf.Dr.AslıYÜKSELMERMODMarmaraUniversityProf.Dr.CumaliKınacıİstanbulTechnicalUniversityProf.Dr.DraganVinterhalterUniversityofBelgradeProf.Dr.DragutinT.MihailovićUniversityofNoviSadProf.Dr.EbruÇAĞLAYANAKAYMarmaraUniversityProf.Dr.EdinaMuratovićUniversityofSarajevoProf.Dr.EmineÇOBANOĞLUMarmaraUniversityProf.Dr.EsadProhicUniversityofZagreb,CroatiaProf.Dr.HalilHasarFıratUniversityProf.Dr.IsmailBakanKahramanmarasSutcuImamUniversityProf.Dr.JasnaHuremovićUniversityofSarajevoProf.Dr.LadaLukićBilelaUniversityofSarajevoProf.Dr.LukmanThalibKuwaitUniversityProf.Dr.M.AsgharFazelUniversityofEnvironmentProf.Dr.MehmetKarataşKaramanoğluMehmetBeyUniversity
Prof.Dr.MustafaERDOĞDUMarmaraUniversityProf.Dr.MustafaÖZBİLGİNBrunelUniversityProf.Dr.ÖzerÇınarYıldızTechnicalUniversityProf.Dr.PhoebeKoundouriAthensUniversityofEconomicsandBusinessProf.Dr.RefikaBakoğluMarmaraUniversityProf.Dr.RifatSkrijeljUniversityofSarajevoProf.Dr.SamirĐugUniversityofSarajevoProf.Dr.SeniyeUmitFIRATMarmaraUniversityProf.Dr.SuadBećirovićInternationalUniversityofNoviPazarProf.Dr.ŠemsudinPlojovićInternationalUniversityofNoviPazarProf.Dr.TanaySıtkıUYARMarmaraUniversityProf.Dr.TanjuKaranfilClemsonUniversityProf.Dr.ThankomArunLancashireBusinessSchoolProf.Dr.WiboonKittilaksanawongSaitamaUniversity,JAPANProf.Dr.YahiaZoubirKEDGEBusinessSchoolProf.Dr.ZehraSemraCANMarmaraUniversityAssoc.Prof.Dr.AgimMamutiUniversityofNewYorkinTirana(UNYT)Assoc.Prof.Dr.AltunayPerendeciAkdenizUniversityAssoc.Prof.Dr.AylaÖncerMarmaraUniversityAssoc.Prof.Dr.CevatYamanGebzeTechnicalUniversityAssoc.Prof.Dr.ChristinaAnneStringerTheUniversityofAuckland,NewZealand
Assoc.Prof.Dr.ElmaElfić-ZukorlićInternationalUniversityofNoviPazarAssoc.Prof.Dr.ErkanŞahinkayaİstanbulMedeniyetUniversityAssoc.Prof.Dr.MehmedMetaInternationalUniversityofNoviPazarAssoc.Prof.Dr.MostafaJafariResearchInstituteofForestsandRangelandsAssoc.Prof.Dr.NusretDreškovićUniversityofSarajevoAssoc.Prof.Dr.OlcayBigeYILDIRIMMarmaraUniversityAssoc.Prof.Dr.SamiGörenUmmAl-QuraUniversityAssoc.Prof.Dr.SenijaTahirovićInternationalUniversityofSarajevoAssist.Prof.Dr.AhmadTalebiUniversityofEnvironmentAssist.Prof.Dr.BarışYILMAZMarmaraUniversity
Assist.Prof.Dr.IngFouziTABETGermanBiomassResearchCenterAssist.Prof.Dr.KonstantinosChalvatzisKonstantinosChalvatzisAssist.Prof.Dr.LeszekCICHOBLAZINSKICzestochowaUniversityofTechnologyAssist.Prof.Dr.MarkR.MurphyTheUniversityofScrantonAssist.Prof.Dr.MehmetGanićInternationalUniversityofSarajevoAssist.Prof.Dr.MostafaPanahiIslamicAzadUniversityAssist.Prof.Dr.SasanRabiehShahidBeheshtiUniversityAssist.Prof.Dr.SenadBusatlicInternationalUniversityofSarajevoAssist.Prof.Dr.ŠevkijaOkerićUniversityofSarajevoAssist.Prof.Dr.TubaBozInternationalUniversityofSarajevo
ORGANIZATIONCOMMITTEE
Prof.Dr.ÖzerÇınar(ConferenceChairman)YıldızTechnicalUniversityProf.Dr.RefikaBakoğluMarmaraUniversityProf.Dr.M.AsgharFazelUniversityofEnvironmentProf.Dr.LukmanThalibKuwaitUniversityProf.Dr.SamirĐugUniversityofSarajevo
Assoc.Prof.Dr.NusretDreškovićUniversityofSarajevoHanaSarkinovicZenithGroupSarajevoMusaKoseZenithGroupSarajevoIsmetUzunZenithGroupSarajevoAlmaLigataZenithGroupSarajevoAjdinPercoFaktor.ba
TableofContents
1-8 AWindPowerPlantFeasibiltyStudyforBursa,GemlikRegion,TurkeySemihAkın,YusufAliKara
9-12 PsychologicalEffectsoftheWaterandWaterStructuresonUrbanandUrbanites
ÖmerAtabeyoğlu13-18 AResearchonQFD-“HouseofBrand”inFashionIndustry
EvrimKabukcu19-27 EnergyEfficiencyandPolicyMixintheEuropeanCountries
SavaşÇevik,FatmaTurna,M.MustafaErdoğdu28-32 AntimicrobialandAntioxidativeActivityofCommercialversusTraditionalApple
VinegarElizabetaJanchovska,MajaJanchovska,BozhidarRistovski,MirjanaBocevska1
33-39 ManagementStatus:WaterQualityandEcologicalDynamicsoftheDamLake
DidemGökçe40-47 ASurrogateModelfortheOperationCostofCitytoCityCommuterAirlineServicefor
SustainableRegionalAviation AlperenYıllıkçı
48-55 SocialDimensionofRevitalizationanditsRoleinLocalSustainableDevelopment:
CaseofCzęstochowaCityinPoland AnnaSłocińska,LeszekCichobłaziński
56-60 TrendsinSustainabilityReportingbetween2004-2014byFortune250:TurkeyCase
M.ŞebnemEnsari,MelekErdil,HazalGenç61-65 FWallAngleandThermalPerformanceRelation
KübraSümerHaydaraslan,NeşeDikmen66-81 ManagementPracticesTowardstheEmbeddednessofSustainabilityinEuropean
Universities SolomonChukwuemekaUgbaja,RefikaBakoglu
82-88 EffectsonGlobalWarmingofInsulationinPipeaccordingtoLifeCycleAssessment
YusufBaşoğul,AliKeçebaş,YavuzDemirci89-93 LiteratureReviewofLifecycleTimeofProductsandServices:ACaseStudyinTextile
Sector AyşenurErdil,ErturulTaçgın
94-101 SustainabilityofJointProjectsBetweenUniversityandIndustryinTurkey
AyşenurErdil,HikmetErbıyık102-108 Non-isothermalModel-freeDifferentialKineticStudyofPyrolysisofWaste
PolyolefinMixture KarminaMiteva,AleksovskiSlavcho,GordanaBogoeva-Gaceva

109-115 KineticStudyofPyrolysisofWastePolyolefinMixtureUsingIntegralFittingKineticModel KarminaMiteva,AleksovskiSlavcho,GordanaBogoeva-Gaceva
116-121 TraditionalWomen’sScarvesWornintheKonyaRegion MiyaseÇağdaş,TürkanKayser
122-129 TheExaminationofKonya’sTraditionalManCurlingShirtsinTurkishCulture
TürkanKayser,MiyaseÇağdaş130-135 RecognitionTheSpeakerIdentityByMeansOfArtificialNeuralNetwork
YasinAkman,EmineÖzcan136-144 EvaluationofIzmirClockTower&KonakSquareandTheirEnvironswithRegardto
User-SpaceInteraction ÇiğdemKılıçaslan,EmineMalkoçTrue
145-152 EducationofLocalGovernmentsasawaytowardsSustainableDevelopmentofthe
CountriesoftheWesternBalkans-CaseStudyofMontenegro RadojeVujadinovic,UrosKaradzic
153-158 TheAnaFlysisofBasicConceptsRelatedtoCorporateSustainabilitybyUsingN-
GramAnalysisTechnique MustafaNuriUral,ÖzlemTuna159-164 TechnologicalPropertiesofOblachinska,CiganchicaandMarelaSourCherry
Varieties BozhidarRistovski,EniseSipahi,MirjanaBocevska
165-172 SimulationofBiogasCounterFlowDiffusionFlameUnderSeveralOperationConditionsofCompositionandPressureAbdelbakiMameri,FouziTabet,AmmarHadef
173-181 EnergyEfficiencyandPolicyMixintheEuropeanCountries SavaşÇevik,FatmaTurna,M.MustafaErdoğdu

1
A Wind Power Plant Feasibilty Study for Bursa, Gemlik Region, Turkey
Semih Akın1, Yusuf Ali Kara2
Abstract Increasing energy demand on a global scale and with the emerging constraint of conventional energy resources has forced the developing countries to improve alternative energy resources. Especially in last decades, many studies and researches have been done in order to benefit more efficiently from renewable energy sources. Wind energy as a renewable energy resource has showed greater improvement since it is sustainable, efficient and clean energy. As a result, the number of wind power plants (WPP) investments has been increasing expeditiously all around the world. Correspondingly, Turkey promotes the incentives and investments to the wind power conversion systems. Along with being increased the incentives and investments to wind power conversion systems, the external dependence on energy of Turkey will decrease. In addition to that, at the same time competitive power of Turkey in the energy sector will increase dramatically. In this study, a WPP feasibility study is realized for Gemlik Bay connected with Bursa Province which has remarkable wind potential but has not any WPP. Wind data of Gemlik applied to Windsim software; annual energy production (AEP), capacity factor are calculated and also power and energy curves of selected wind turbines are obtained as output. The study shows that through 5 Vestas V90 turbines with 2-MW capacity in Gemlik Ata region, establishment of economic WPP which has over 40 GWh/y AEP capacity is feasible.
Keywords: Gemlik Region, Renewable Energy Sources, Wind Energy, Wind Power Plant, Windsim.
1. INTRODUCTION
Energy is the most important source for economic sustainability. Rapidly increase of population and industrialization resulted in an enormous energy demand all around the world. In order to meet this huge energy demand, investments in renewable energy sources have increased across the world. Nowadays, new energy investments are directed towards to clean energy. Renewable energy sources enable countries to meet energy requirements and protect environment with almost zero emission [1-3]. In addition, renewable energy sources are seen as a hope for economy of the developing countries.
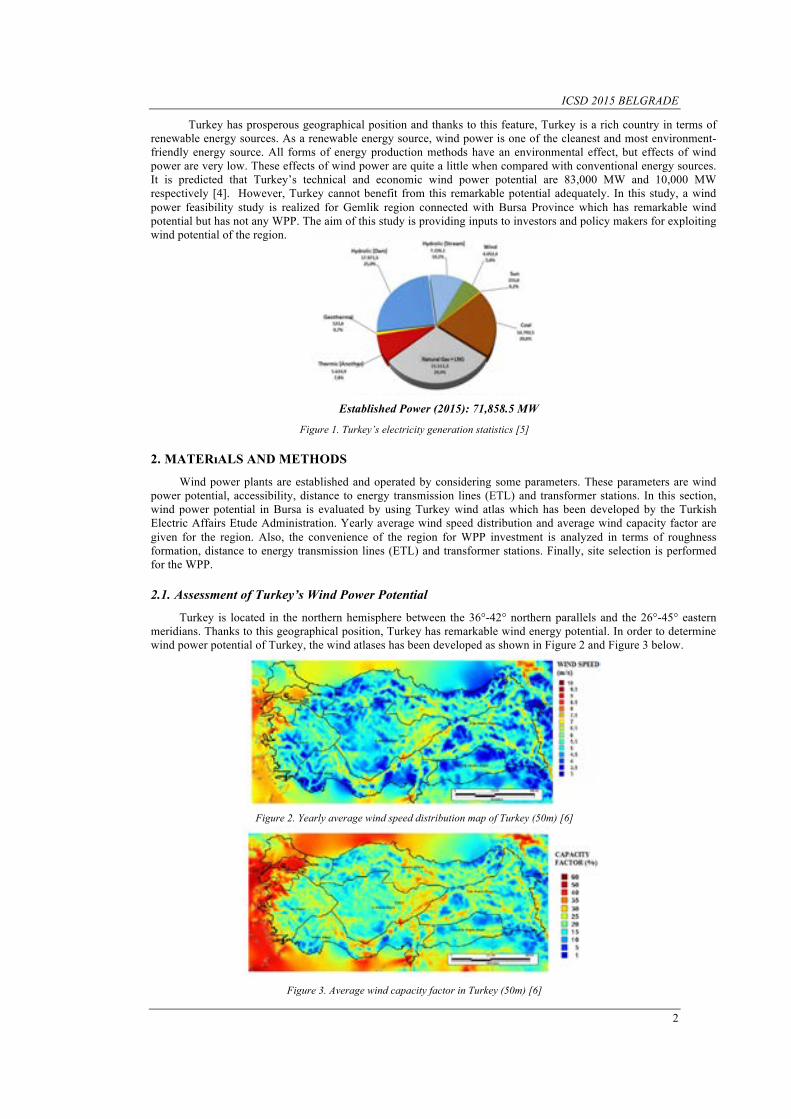
Industrialization in Turkey is developing which respect to the developed countries. Turkey’s main energy demand is increasing with a rate of 4-5% per year and this amount is causing 8% electrical energy demand [3]. Turkey’s electricity generation by primary sources in 2015 is shown in Figure1. According to Figure1, Turkey meets its nearly 60% energy demands from fossil fuel resources. Turkey is a foreign-dependent country in terms of energy. Turkey imports 72% of current energy sources to meet energy demand [3]. This issue brings along a current deficit problem and Turkey’s economy sustains a serious loss and, also it causes negative effect on competitive power of Turkey on a global scale. The main reason of this situation is not used from domestic energy resources efficiently. If this problem is addressed, it can be said that investment in renewable energy sources is inevitable in terms of Turkey’s future.
1Corresponding author: Bursa Technical University, Department of Mechanical Engineering, 16190, Osmangazi/Bursa, dTurkey. [email protected] 2Corresponding author: Bursa Technical University, Department of Mechanical Engineering, 16190, Osmangazi/Bursa, dTurkey. [email protected]
ICSD 2015 BELGRADE
2
Turkey has prosperous geographical position and thanks to this feature, Turkey is a rich country in terms of renewable energy sources. As a renewable energy source, wind power is one of the cleanest and most environment- friendly energy source. All forms of energy production methods have an environmental effect, but effects of wind power are very low. These effects of wind power are quite a little when compared with conventional energy sources. It is predicted that Turkey’s technical and economic wind power potential are 83,000 MW and 10,000 MW respectively [4]. However, Turkey cannot benefit from this remarkable potential adequately. In this study, a wind power feasibility study is realized for Gemlik region connected with Bursa Province which has remarkable wind potential but has not any WPP. The aim of this study is providing inputs to investors and policy makers for exploiting wind potential of the region.
Established Power (2015): 71,858.5 MW
Figure 1. Turkey’s electricity generation statistics [5]
2. MATERıALS AND METHODS
Wind power plants are established and operated by considering some parameters. These parameters are wind power potential, accessibility, distance to energy transmission lines (ETL) and transformer stations. In this section, wind power potential in Bursa is evaluated by using Turkey wind atlas which has been developed by the Turkish Electric Affairs Etude Administration. Yearly average wind speed distribution and average wind capacity factor are given for the region. Also, the convenience of the region for WPP investment is analyzed in terms of roughness formation, distance to energy transmission lines (ETL) and transformer stations. Finally, site selection is performed for the WPP.
2.1. Assessment of Turkey’s Wind Power Potential
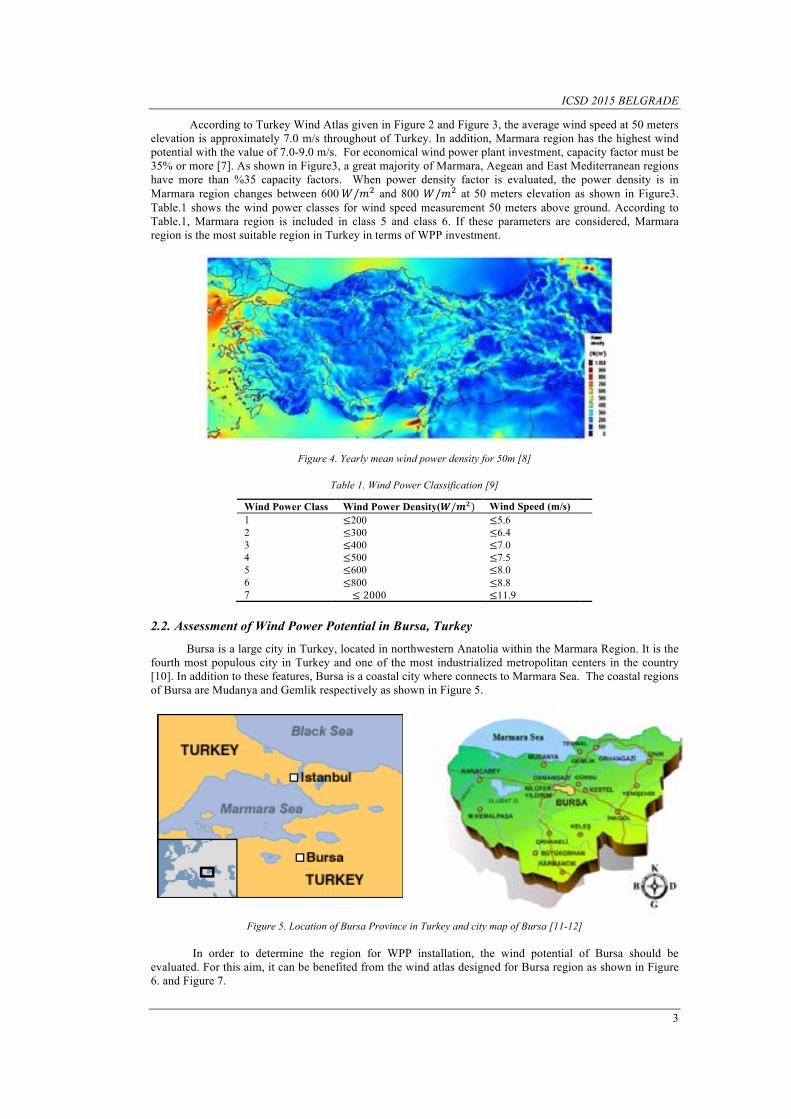
Turkey is located in the northern hemisphere between the 36°-42° northern parallels and the 26°-45° eastern meridians. Thanks to this geographical position, Turkey has remarkable wind energy potential. In order to determine wind power potential of Turkey, the wind atlases has been developed as shown in Figure 2 and Figure 3 below.
Figure 2. Yearly average wind speed distribution map of Turkey (50m) [6]
Figure 3. Average wind capacity factor in Turkey (50m) [6]
ICSD 2015 BELGRADE
3
According to Turkey Wind Atlas given in Figure 2 and Figure 3, the average wind speed at 50 meters elevation is approximately 7.0 m/s throughout of Turkey. In addition, Marmara region has the highest wind potential with the value of 7.0-9.0 m/s. For economical wind power plant investment, capacity factor must be 35% or more [7]. As shown in Figure3, a great majority of Marmara, Aegean and East Mediterranean regions have more than %35 capacity factors. When power density factor is evaluated, the power density is in Marmara region changes between 600 !/!! and 800 !/!! at 50 meters elevation as shown in Figure3. Table.1 shows the wind power classes for wind speed measurement 50 meters above ground. According to Table.1, Marmara region is included in class 5 and class 6. If these parameters are considered, Marmara region is the most suitable region in Turkey in terms of WPP investment.
Figure 4. Yearly mean wind power density for 50m [8]
Table 1. Wind Power Classification [9]
Wind Power Class Wind Power Density(!/!!) Wind Speed (m/s) 1 ≤200 ≤5.6 2 ≤300 ≤6.4 3 ≤400 ≤7.0 4 ≤500 ≤7.5 5 ≤600 ≤8.0 6 ≤800 ≤8.8 7 ≤ 2000 ≤11.9
2.2. Assessment of Wind Power Potential in Bursa, Turkey
Bursa is a large city in Turkey, located in northwestern Anatolia within the Marmara Region. It is the fourth most populous city in Turkey and one of the most industrialized metropolitan centers in the country [10]. In addition to these features, Bursa is a coastal city where connects to Marmara Sea. The coastal regions of Bursa are Mudanya and Gemlik respectively as shown in Figure 5.
Figure 5. Location of Bursa Province in Turkey and city map of Bursa [11-12]
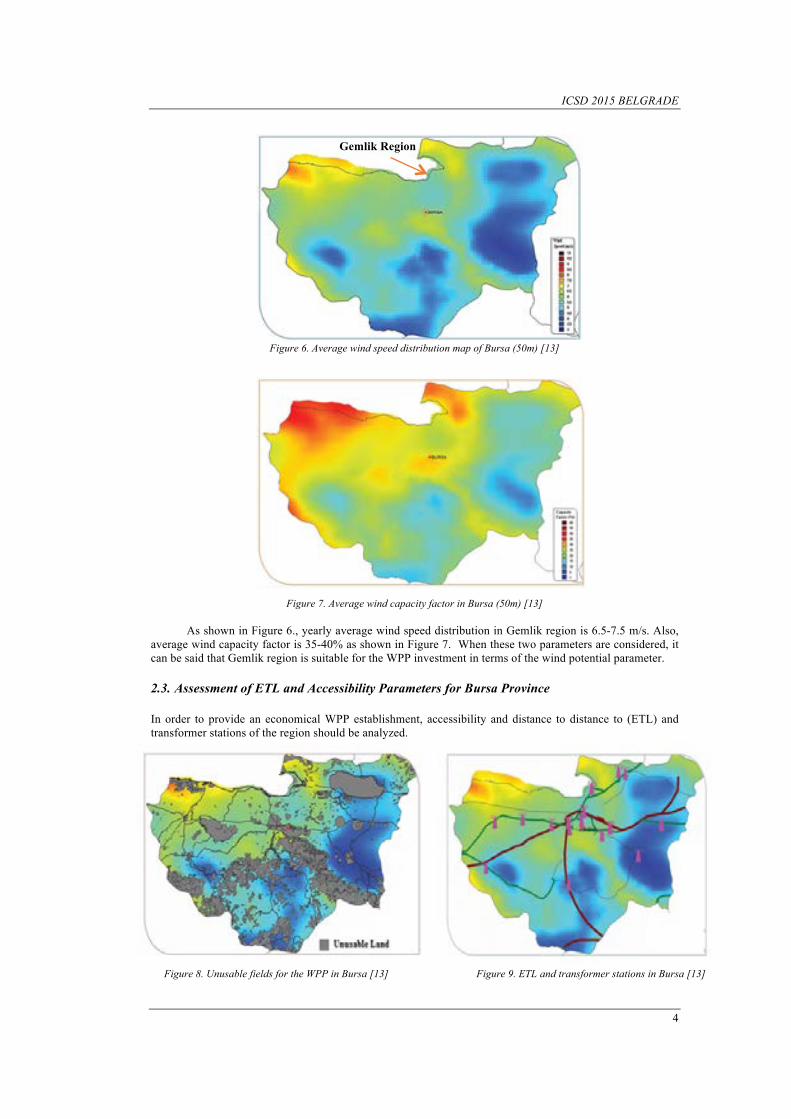
In order to determine the region for WPP installation, the wind potential of Bursa should be evaluated. For this aim, it can be benefited from the wind atlas designed for Bursa region as shown in Figure 6. and Figure 7.
ICSD 2015 BELGRADE
4
Gemlik Region
Figure 6. Average wind speed distribution map of Bursa (50m) [13]
Figure 7. Average wind capacity factor in Bursa (50m) [13]
As shown in Figure 6., yearly average wind speed distribution in Gemlik region is 6.5-7.5 m/s. Also, average wind capacity factor is 35-40% as shown in Figure 7. When these two parameters are considered, it can be said that Gemlik region is suitable for the WPP investment in terms of the wind potential parameter.
2.3. Assessment of ETL and Accessibility Parameters for Bursa Province
In order to provide an economical WPP establishment, accessibility and distance to distance to (ETL) and transformer stations of the region should be analyzed.
Figure 8. Unusable fields for the WPP in Bursa [13] Figure 9. ETL and transformer stations in Bursa [13]

ICSD 2015 BELGRADE
5
Unusable fields for WPP investment is shown in Figure8. According to Figure8., Gemlik is a favorable region in terms of accessibility. ETL and transformer stations in Bursa are given in Figure 9. As seen in Figure9., in terms of distance to ETL and transformer stations the most suitable region is Gemlik in Bursa. In order to determine the roughness formation of Gemlik region, it can be benefited from CORINE (Coordination of Information on the Environment) database with 100 meters resolution. The terrain roughness formation is given in Figure 10 by using CORINE database. If the roughness formation of Gemlik is analyzed, it can be said that the most suitable field is Ata region which given in Figure 11.
Figure 10. Rougness formation in Gemlik (m)
Figure 11. Ata Region in Gemlik
3. WIND FARM LAYOUT
In this section, a wind farm layout is designed for Ata region by using Windsim software. In order to provide 40 GWh/y or more AEP capacity, 5 Vestas V90 wind turbines are installed in the region by considering wake affect and air density changing. In addition to that, wind potential of the region is calculated by Windsim. Weibull distribution and its parameters are calculated for all sectors. Also calculated values are compared with the wind atlas.
3.1. Windsim Software
Windsim is wind energy software that uses computational fluid dynamics (CFD) to design and optimize wind turbine placement in onshore and offshore wind farms. Considering terrain conditions, the AEP amount of onshore and offshore wind farms can be calculated by Windsim. Windsim is powerful, world-class software based on CFD that combines advanced numeric processing with compelling 3D visualization. Through Windsim software, more accurate results can be obtained by taking turbulence, density changing, and topography-vegetation effects into account [14].
ICSD 2015 BELGRADE
6
3.2. Assessment of Wind Power Potential for Bursa Province by CFD Analysis
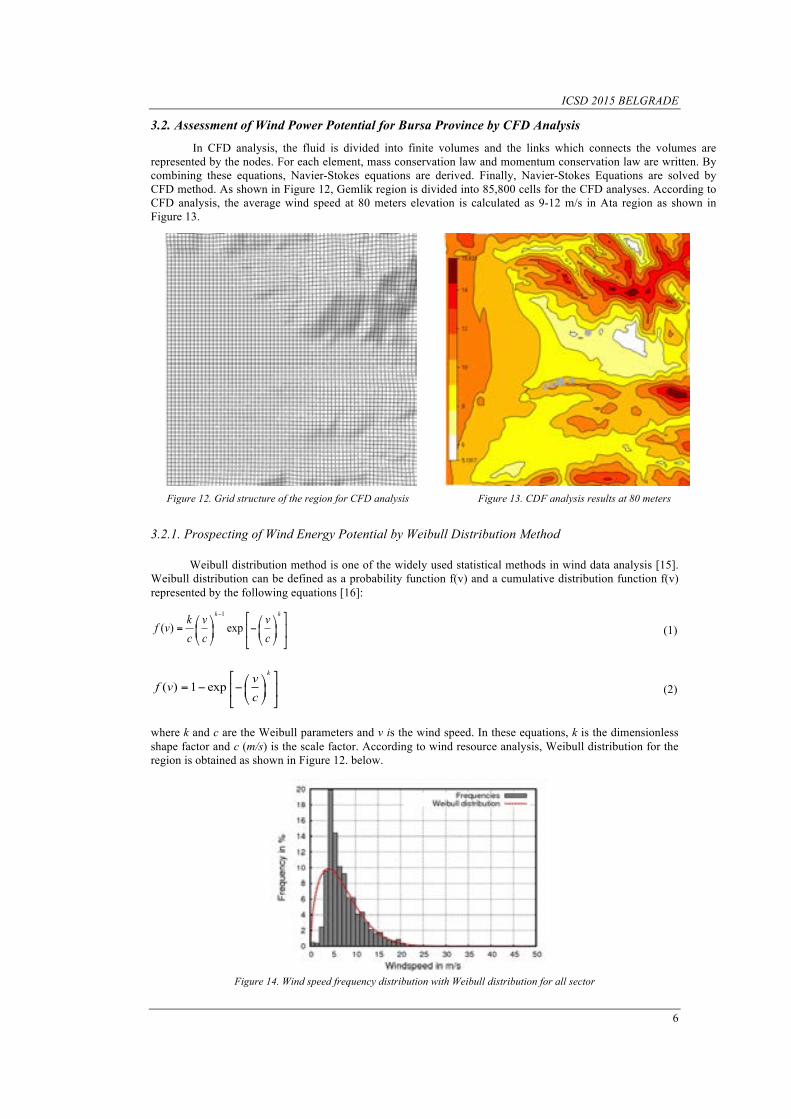
In CFD analysis, the fluid is divided into finite volumes and the links which connects the volumes are represented by the nodes. For each element, mass conservation law and momentum conservation law are written. By combining these equations, Navier-Stokes equations are derived. Finally, Navier-Stokes Equations are solved by CFD method. As shown in Figure 12, Gemlik region is divided into 85,800 cells for the CFD analyses. According to CFD analysis, the average wind speed at 80 meters elevation is calculated as 9-12 m/s in Ata region as shown in Figure 13.
Figure 12. Grid structure of the region for CFD analysis Figure 13. CDF analysis results at 80 meters
3.2.1. Prospecting of Wind Energy Potential by Weibull Distribution Method
Weibull distribution method is one of the widely used statistical methods in wind data analysis [15]. Weibull distribution can be defined as a probability function f(v) and a cumulative distribution function f(v) represented by the following equations [16]:
1
( ) expk kk v v
f vc c c
−
= −⎡ ⎤⎛ ⎞ ⎛ ⎞⎢ ⎥⎜ ⎟ ⎜ ⎟
⎝ ⎠ ⎝ ⎠⎣ ⎦ (1)
( ) 1 expkv
f vc
= − −⎡ ⎤⎛ ⎞⎢ ⎥⎜ ⎟⎝ ⎠⎣ ⎦
(2)
where k and c are the Weibull parameters and v is the wind speed. In these equations, k is the dimensionless shape factor and c (m/s) is the scale factor. According to wind resource analysis, Weibull distribution for the region is obtained as shown in Figure 12. below.
Figure 14. Wind speed frequency distribution with Weibull distribution for all sector

ICSD 2015 BELGRADE
7
According to Weibull distribution given in Figure 14., average wind speed is found 7.41 m/s for 80 meters elevation. Also, Weibull parameters, shape factor and scale factor are calculated 1.57 and 7.67 respectively. Through CFD analysis, this value was found as approximately 10 m/s. It can be deduced that CFD results and results of Weibull distribution matches well.
3.3. Turbine Layout
Turbine layout is performed by considering wake affect. Wake effect occurs when the wind turbines embower themselves. This phenomenon affects the wind turbine efficiency substantially. In order to prevent this situation, adequate separation distance at the dominant wind direction must be ensured between the wind turbines. As shown in Figure 14., wind farms in the prevailing wind direction need a minimum distance of eight times the rotor diameter. At the vertical direction, the space in the prevailing wind direction should be three times of the rotor diameter to avoid each other’s mutual interference.
Figure 15. Wind turbine layout [16]
In this study, Jensen’s wake affect is used since it is effective in terms of converging [17]. By considering this layout proposal, the wind farm layout is designed by using 5 Vestas V90 wind turbines as shown in Figure 15.
Figure 16. Wind farm layout
4. ENERGY ANALYSIS
Wind farm energy analysis considering wake affect and air density changing is calculated by Windsim software. According to energy analysis performed with 85,800 cells is found that annual energy production and capacity factor are 45.0 (GWh/y) and 49.8% respectively. According to the results, the wind farm provides of being an economical WPP with %49.8 capacity factor. In order to verify the analysis, the results must be obtained independent of the cell number. The next phase of the study, cell number is increased until finding the independent results of cell number. The new analyses results are obtained as given in Table 2.
Table 2. Analyses Results
Cell Number AEP(!"#/!) Capacity Factor (%) Wake Loss (%)
85,800 45.0 49.8 3.1 239,800 44.0 50.2 3.0 541,200 43.6 49.8 3.1
ICSD 2015 BELGRADE
8
5. RESULTS AND DıSCUSSıONS
According to Table 2., if the second analysis is compared with the last analysis; 0.917% relative error at the capacity factor value and 3.21% relative error at the wake losses occur. If these values are evaluated, it can be said that the last analysis is pretty reliable. Apart from this, with the 49.8% capacity factor, the WPP provides being an economical WPP.
In this study, the energy analysis of the WPP was performed the datas which obtained from the measurement mast of Turkish State Meteorological Service. This mast is carrying out the measurements at 10 meters elevation. In order to adapt this measurement for 50 meters elevation, Wind Power Law was used. Also, there is a significant distance between the measurement mast location and Ata region, Gemlik. In order to prevent this problem, a climate transferred mast was added into the region by using Windsim software. If a specific measurement mast which has 80 meters height is used in Ata region, more certain results can be obtained for the energy analysis.
6. CONCLUSıONS
In this study, a WPP feasibility study is realized for Gemlik region connected with Bursa Province which has remarkable wind potential but has not any wind power plant. The study shows that establishment of economic WPP which has 49.8 GWh/y AEP capacity is feasible by using 5 number of Vestas V90 turbines with 2-MW capacity in Ata region, Gemlik. The main objective of this study is providing inputs to investors and policy makers for exploiting the wind potential of the region.
ACKNOWLEDGMENT
The authors would like to thank Turkish State Meteorological Service for their support given to this work.
REFERENCES [1]. K. Baris., S. Kucukali., “Availability of renewable energy sources in Turkey: current situation, potential, government policies
and EU perspective”, Energy Policy, vol 42, pp.377-391, 2012. [2]. S. T. Basaran, A. O. Dogru, F. B. Balcik, N. N. Ulugtekin, C. Goksel, S. Sozen, “Assessment of renewable energy potential
and policy in Turkey-toward the acquisition period in European Union”, Environmental Science and Policy, vol 46, pp. 82-94, 2015.
[3]. Y. A. Kaplan., “Overview of wind energy in the world and assessment of current wind energy policies in Turkey”, Renewable and Sustainable Energy Reviews, vol 43, pp. 562-568, 2015.
[4]. M. Bilgili., “Wind energy potential and turbine insallations in Turkey”, Energy Sources, Part B: Economics, Planning and Policy”, vol 7:2, pp. 140-151, 2015.
[5]. (2015) The UCTEA Website. [Online]. Available: http://www.emo.org.tr/genel/bizden_detay.php?kod=88369#.VeAZC8_tlBd [6]. Y. Oner, S. Ozcira, N. Bekiroglu, I. Senol, “A compratative analysis of wind power density prediction methods for
Çanakkale, Intepe region, Turkey”, Renewable and Sustainable Energy Reviews, vol. 23, pp. 491-502, 2013. [7]. (2015) REPA-Wind Energy Potential Map of Turkey, General Directorate of Electrical Power Resources Survey and
Development Administration. [Online]. Available: http://www.eie.gov.tr/yekrepa/BURSA-REPA.pdf [8]. S. A. Akdağ., Ö. Güler., “Evaluation of wind energy investment interest and electricity generation cost analysis for Turkey”,
Applied Energy, vol 87, pp.2574-2580, 2010. [9]. (2015) Wind Energy Resource Assessment [Online]. Available: http://www.klickitatcounty.org/Planning/filesHtml/200408-EOZ-EIS/04-AppendixA-Draft.pdf [10]. (2015) Bursa [Online]. Available: https://en.wikipedia.org/wiki/Bursa [11]. (2004) Turkey 'Foils Nato Summit Attack [Online]. Available: http://news.bbc.co.uk/2/hi/europe/3679751.stm [12]. (2006) Bursa map.gif [Online]. Available: https://en.wikipedia.org/wiki/File:Bursa_map.gif [13]. (2015) REPA-Wind Energy Potential Map of Turkey, General Directorate of Electrical Power Resources Survey and
Development Administration’ [Online]. Available: http://www.eie.gov.tr/yekrepa/BURSA-REPA.pdf [14]. (2015) Windsim Technical Basics [Online]. Available: https://www.windsim.com/products/windsim---technical- basics.aspx [15]. A. K. Azad, M. G. Rasul, R. Islam, I. R. Shishir, “Analysis of Wind Energy Prospect for Power Generation bu Three Weibull
Distribution Methods”, The 7th International Conference on Applied Energy-ICAE2015, vol 75, pp. 722-727, 2015. [16]. (2015) Wind Power Lecture Notes. [Online]. Available: http://www.yildiz.edu.tr/~okincay/dersnotu/RuzgBol3.pdf [17]. Jensen, N.O., ”A note on wind generator interaction” Tec rep. RISØ-M-2411, Denmark; 1983.
BIOGRAPHY
Semih Akın was born in İstanbul, Turkey. He received his bachelor’s degree from Mechanical Engineering Department and Industrial Engineering Department (Double Major) of Uludağ University, Bursa, Turkey, in 2013. He is currently studying for a mechanical engineering M.Sc. degree in Bursa Technical University. Mr. Akın’s major fields of study are renewable energy sources and energy efficiency. He is currently is a research and teaching assistant at Bursa Technical University. Yusuf Ali Kara is a Professor in the Department of Mechanical Engineering at Bursa Technical University, Turkey. He received his Ph.D. degree in 1999 from Ataturk University, Erzurum, Turkey. His main research interests are heat pumps, heat exchangers, and renewable energy. He has published eleven articles in international journals.

ICSD 2015 BELGRADE
9
Psychological Effects of the Water and Water Structures on Urban and Urbanites
Ömer Atabeyoğlu1
Abstract Water is one of the most important element and source of life. It is impossible to think that is no water and subtract from our life. Water is extremely important life conditions and living areas. Therefore, it is usually enough to feels good to hear and see water. Besides the physical benefits of water, there are most psychological benefits of water, too. Psychological characteristics of the water effect urban life and urbanites. If the water use rightly, urban have right image and meaning for urbanites and tourists. Urban with its construct are like books to read for tourists and urbanites. They have most story and meaning. Water and water structures bring meaning, aesthetic, function and attractive characteristic to urban. Structural elements strengthen its meaning, aesthetic and functional sense. Responsibility of designer is big to create correct senses. Abilities and imagination of the designer are determinant to correctly motivated human psychology. Design techniques of water structure, details and characteristics of structural elements and locations of water structures are important for urbanites to feel better and peaceful about themselves. Aim of the landscape architectures is to serve the people. For this purpose psychological factors are a method to evaluate. This study includes use of water and water elements in urban, image of urban, psychological effects on urbanites and use of water elements by psychological approaches.
Keywords: Water Structures, Urbanite Psychology, Urban Sustainability, Landscape Architecture, Urban Design.
1. DESIGN AND PSYCHOLOGY
Human have made an effort to meet vital needs through. This effort can only to meet needs and survival. But the effort to meet need reach up most suitable because of increasing needs, possibilities, alternative choices. By force of trade, marketing tactics improve difficult ways on all meta that services to human. This strengthens concept that compatible with human as well as aesthetic and functional.
According Özkan and Küçükerbaş (1993); physical spaces use by human notwithstanding kind or characteristic. Therefore human and human sizes form design studies as physical and perceptual.
Physical harmony and needs are only one part of design. Soul as well as body affects by design. On the other hand the design must appeal to spiritual worlds of human as well as physical world. In this point the psychology is an important area affecting on design.
Psychology is a discipline that investigates human behaviors, mental processes and its reasons. Psychology has a short history than other disciplines. In this short time, psychology was defined in different forms. First is "to examine the structure of human mind". Second is "scientific examined of observable behavior" (Cüceloğlu 1991).
According Aytuğ (1987); relationship between architecture with humanities are necessary. Aim of relationship of architectural with psychology, sociology, social psychology, environmental psychology and etc. provides objective data to help architecture in processes of information collection and analysis (Uzunoğlu and Özer 2014).
1Assist. Prof. Dr., Landscape Architecture Department, Agricultural Faculty, University of Ordu, Ordu, Turkiye. [email protected]
ICSD 2015 BELGRADE
10
There are very much factors conquered to human with its emotions. Effect and entity of these factors on human are a fact. Human understand directly and perceive or explore with subconscious. Messages and energy that all factors spread are read by human as conscious or unconscious. Human is positively or negatively impressed by this messages and come under the influence of the messages. Human prefer natural areas. Nature always spreads positively energy to environment. This positively situation is condition of spiritual and psychological rest.
Psychology is that mental activities effect on behaviors. Therefore all events have mental activity make out a way of behavior. Human is exposed to numerous effects, event, space, object and very much stimulus. Human use this stimulus to evaluate and comment to environment. Senses and mind process all data in environment. This situation provides that human recognize, interpret and perceive their environment. Mined is the main factor of system formed interpretation, perception and reaction. All facts in environment spread sensory and physical messages with forms, colors, sizes, textures and sounds. Job of the mind is to read the messages. Collected data designs lifestyle.
If there are fewer things for think and fear, then it provides physically relaxing by mentally relaxing. The relaxed body is result of the relaxed mined. Uneasy and uncomfortable state of mind doesn't provide suitable conditions for the rest of the body. Comfortable, peaceful, rested, still and purified mind and soul can provide with true physical and psychological ergonomics conditions for all objects in place of work, rest and entertainment. Thus, it is provided social peace and consciousness in both individual and social environment.
2. PSCYHOGOCIAL EFFECTS OF WATER ELEMENTS
Design is an important part of the life. It is the search process for both function and aesthetic. Equipment elements in urban is product of design, too. The design ensures liking by urbanities and increases attraction of urban function. The well designed equipment elements and urban functions are more livable spaces.
Water elements are one of the important elements for the livable urban. It provides attraction, dynamism and comfort to urban. It is engineering construction with special production techniques and constructional details. It has variety to decorative pool, swimming pool and natural river than see. Water finds as natural or/and human-made in urban and suburban. It is multifunction structures using in both indoor and outdoor spaces. Different kinds of the water elements have different meaning and sense. It has positive effects on human. These effects are both physical and psychological. In physical way water and water elements are important as material. In psychological way water and water elements are important with emotion, sense, meaning and connotation. Water and water structures gather, direct, attract attention, entertain and relax human. Thus, spaces used of water transform preferred and favorite spaces. Sometimes water is used as negative to keep apart, remove, bring under control and provided circulation in spaces. Water is a tool to determined using of urban functions. In terms of psychological, water and water elements are effective in many ways.
2.1. Psychological effects in terms of sensory
Water is a sensible characteristic with fife senses. Water can affect and control to the fife senses. Water appeals to hearing with its sound, to seeing with its gleam, color and design, to touching with its wetness, heat and cool, to taste with its taste.
Sound of water is like melody and has relaxing effect. Waving, flow, fall of water has a specific sound. This sound uses to created peaceful spaces and to bring people together. Because the sound reminds nature and peoples likes this sound. As it is a natural sound, it provides peace and relaxation. Sometimes the loud sound uses to control human circulation in space.
The gleam and color of water are an attractive characteristic. As it predicts eternity, blue color of water provides relaxation. For this reason human likes to see lake and sea views. Besides large and calm water surfaces provide reflection effect. This characteristic shows larger to space. Thus space is felt spacious. The water appeals to tactual sense, too. Bath or touch to water relaxes. It refreshes with its cool and heats with its temperature. Its ergonomic characteristics provide to feeling good. Water is a drink and an important part of life. It appeals our taste sense with its taste. Thirst causes to depression as physiological, like as physical. When we have water, we feel safe.
2.2. Psychological effects in terms of material
Structural materials used in water structures important. The materials have variety. Using materials can give senses like modern, classic, insecure, heat, aesthetic, sincere to peoples. Perception of material effects aesthetic and function of water element. Natural materials always give a friendly effect to people. Materials like stone and wood are compatible with human. Artificial materials have modern and technologic connotation. It is important to known of used materials, too. People do not fear than known think.
ICSD 2015 BELGRADE
11
Clear or dirty water effects to psychology because of heath concerns. It is wanted clean spaces as to be healthy. Dirt water structures and water do not feel comfortable and peaceful. It is also important well-groomed of water structures for aesthetic and security. Well-groomed structures give messages to perform well. Thus enjoy of water structure increases for seen aesthetic.
2.3. Psychological effects in terms of design
Many features can be added to water elements. The features can be aesthetic, function or both of them. Added features have also important effects on psychology. The correct designs give positive effects, but the incorrect designs give negative effects. The incorrect designs can give sense like displeasure, imperceptions and eschewal.
The design must be make compatible with human size and it must be carefully to proportion. Otherwise it creates pressure on human and causes negative effect. If the proportion is not provided in water structures, it can cause problems. And this situation is psychologically negative. Places and objects in human size are preferred. Peoples feel good in places have appropriate sizes. This uses sent positive messages to people. Color is an important design characteristic. Different colors have different meanings. Warm colors are stimulus. It gives dynamism and exaltation. Cold colors have effect of eternity and relaxation. The color uses in both structure of water element and its lighting. The color must uses according to function, place, culture, meaning and environmental design.
Line characteristics of design are also important for psychology. Formal lines have a more regular and an artificial expression. Informal lines have a more natural and soft expression. Round sides and corners are relaxing and sharp lines are more tense and rigid. Perception of geometric forms is easy.
Details in water elements increase interest and surprises. Simple water elements are better understood and naturalized. Detailed water elements are less understood and complicated. Increased surprises keep alive interest.
2.4. Psychological effects in terms of perceptual
Their perception form to environment manages people. They comment to environment as their perceived. The perceived realities determine to correct-incorrect, good-bad, harmful-harmless, functional-nonfunctional of design. Fear is a changeable perception for everybody. The fear requires to protected and avoid. Trust is a wanted characteristic in water structures, because people known that is dangerous in sometimes. Motivate of water brings to open childish senses. This sense provides a friendly approach.
Perception and recognizability of environment is important and people prefers it. The design must be readable. Unreadable designs cause to distrust, fear and anxiety. Perceptual illusion likens another material to a material. Perceptual illusions create sense of temporary trust. It causes to displeasure when has been realized the truth. Signs, signboards and etc. strengthen and inform to perception and meaning, too. Having information effects positive to psychology.
2.5. Psychological effects in terms of natural and environmental factors
When water elements build, it is paid attention to climate factors like snow, rain, wind, day-night, seasons. If water elements compatible with environmental conditions and climatic factors, they are accepted easier. If they are incompatible, this situation causes stress as psychological. Indirect features by natural events cause positive or negative effects on human psychology. Reflection, light events, night lightning and shadows can be used with true techniques for impress to people. Shadow, reflection, light games give extra feature to water elements. The acquired characteristics are positive and increase interest.
Water elements in natural areas are always more attractive to people. Peoples feel themselves closer to nature. In this reason peoples go to natural areas for rest and fun. On the contrary urban areas have chaos and stress. Water is one of the used elements to bring nature to the urban. Water and water elements remember nature. This makes feel rested, relaxed and peaceful to peoples.
Water structures in winter cities aren't used in winter months. This water structures must be aesthetic in winter. These structures are more functions to use in winter. The functions can be thing like ice skate. To be usable of water elements are preferred by people.
2.6. Psychological effects in terms of individual
Individual habits, experiences and living environment are determinant to evaluate choices of peoples on water structures. Extra water structures aren't necessity for peoples lived in city has sea. Water based activities occur in sea and sea cost in these cities. The effects of the water and water elements are bigger in the cities haven't sea.
ICSD 2015 BELGRADE
12
Ethic and culture values of individual and society direct urban designs. If the design doesn't provide ethic and cultural values, it isn't accepted by peoples. Similarly religious beliefs are determinant on using and design of water structures. The water is symbol of cleaning in all religions. And it is need to cleaning. Having water to fulfill religious beliefs relaxes peoples as psychological. Additionally sound of water uses in treatment of psychological disorders.
3. DISCUSSION AND CONCLUTION
The urban design is born from needs and requests. This is a concept includes functional and aesthetic facts. It raises life standards of urbanities. It make attractive and livable to urban. If the urban designs well and functions and equipment elements fictionalize true, it is prefer more by urbanities.
Function and fiction of urban are very effective on psychology of urbanities. Psychology of individual and society is affected on urban experiences. This situation is effective for tourists and urbanities. Some urban elements have wider impact on urban. The water elements are one of the important elements.
Natural or artificial water elements are one of the important parts in living spaces. It appropriates to use its functional and aesthetic characteristics. It meets to recreational needs of peoples and it is one of the important support elements for psychology of peoples. It provides image and prestige to spaces. The water directs psychology of peoples with true design techniques and methods. Thus it contributes to individual and social peace. The water and water elements are used in very different function, aim and location. Because it has a large number of using, it directs to psychology in different ways.
When the water elements design, psychological and perception approaches must consider like other urban functions. To sent true messages to perception of peoples is responsibility of designer. True designed spaces are one of the important ways to peaceful society and individual. Therefore the psychology must integrates to education of design for true and effective designs.
REFERENCES [1]. Özkan, B. ve Küçükerbaş, E. (1993) Mimarlık Bilgisi, Bilim Ofset ve Fotokopi, İzmir [2]. Cüceloğlu, D., 1991. İnsan ve Davranışı, "Psikolojinin Tanımı", Remzi Kitabevi, ISBN 978-975-14-0250-9. [3]. Aytuğ, A., 1987. Mimaride Doku Kullanımının Psikolojik Etkileri Üzerine Bir Araştırma. Yayımlanmamış doktora
tezi, Yıldız Üniversitesi, İstanbul. [4]. Uzunoğlu, S., S., Özer, H., 2014. Mimarlık Eğitiminde Mimari Psikoloji Formasyonunun Geliştirilmesi İçin Bir
Model. Megaron Journal, 9(2), 143-165.

ICSD 2015 BELGRADE
13
A Research on QFD - “House of Brand”
in Fashion Industry Evrim Kabukcu 1
Abstract Fashion continues to be an area that reflects the increasing popularity of different theoretical and practical approaches of researchers from different disciplines. Due to the rapid cycles of fashion, sustainable products and processes in terms of technical creativity and innovative approach is needed. In this context, fashion marketing emerges as an integrative marketing application with its both technical and social aspects by taking potential customers center that symbolize rapid change and creativity of fashion products. In this study, QFD - House of Brand was designed with Quality Function Deployment (QFD) approach. In this context, the experts (Focus Group) in Fashion Industry evaluated the selected fashion brand and its selected products by prioritizing the criteria. These evaluations were used in QFD - House of Brand. Thus technical and social aspects of fashion industry were analysed together. By this technique, QFD - House of Brand established in relation to products and brand, was interpreted and optimization suggestions were presented in accordance with the findings of the research. In addition, suggestions on sustainability and optimization of brand equity in fashion industry were provided. Keywords: Brand Equity, Fashion Industry, Product, Quality Function Deployment, Sustainability.
1. INTRODUCTION
In the fashion industry, a designer or a company spends large amounts of money, time and expertise to develop innovations in fashion or apparel renewed every season. After the products' technical qualities are designed and manufactured, the products are transmitted to the target market. In this process, companies or designers try to ensure to differentiate the specific nature of the products by consumers. In this way, they struggle for protecting, improving and more importantly sustaining their position in the market. In this context, within the framework of QFD (Quality Function Deployment), this study associates a brand which has manufacturing operations in Turkey and its selected products’ technical specifications with the reviews of experts (Focus Group) from the fashion industry (Focus Group) and then develops a proposal for the improvement and sustainability of the brand in certain selected products.
2. CONFIGURING FOCUS GROUP
Focus groups involve blending techniques from group process theory and qualitative research [1] [2] [3] [4]. Focus groups are considered to be a qualitative research method [4][5][6]. Focus groups are generally used to gather in-depth knowledge about attitudes, perceptions, beliefs and opinions of individuals regarding a specific topic [1] [3] [4] [7]. In a word, about what people think, how they think, and why they think the way they do about certain issues [8]. Currently, focus groups continue to be used by companies to gather consumer opinions regarding products and to understand consumer buying habits, attitudes and perceptions [1] [4] [9]. A focus group as Liamputtong [10] sustained enables in-depth discussions; involves a relatively small number of people… focused on a specific area of interest that allows participants to discuss the topic in greater detail; is interactive: group processes assist people to explore and clarify their points of view; and provides good, accurate information[8]. Focus groups can also be used to generate constructs and hypotheses; in-depth understanding of phenomena of interest and clarifying the meaning of certain behaviours. In addition, the focus group researcher can obtain data that can be used in quantitative research such as questionnaire development [1] [3] [4] [7]. Conversely, it can also be used to gather additional information as
1Corresponding author: Manisa Celal Bayar University, Salihli Vocational School, Department of Design, 45300, dSalihli/Manisa, Turkey. [email protected]
ICSD 2015 BELGRADE
14
an adjunct to quantitative data collection methods (it provides interpretations of numeric and measurable data collected through quantitative methods [8]. And also it can be used “as part of a mixed method evaluation approach to increase the validity of evaluation findings” [8]. Focus groups are socially organised situations, where participants and moderators enter the setting under shared assumptions of performance [11] [12]. As such, accounts generated should be interpreted as constructed within this specific social situation and context. As with many other research methods, they are shaped by the interests of the researcher and the questions that are asked and by the participants’ interpretations of the questions and their own interests [12][13]. Focus groups, however, are not meant to be a forum for debate, therapy, or an opportunity for an educational session. The focus is on the individuals in the group, to see how they interact, to allow them to develop their own ideas and questions and to do so using their words [4] [10]. The information obtained in the focus group is not only concerned with the actual words that are said, but the non-verbal communication as well. Discussion among the group members allows for observation about individual views, as the views relate to others in the group. It is important for the observer to note what changes occur as the group progresses and what remains the same. It is as important to note whether the opinions of some participants change the opinions of others, as it is to note the opinions themselves [4].
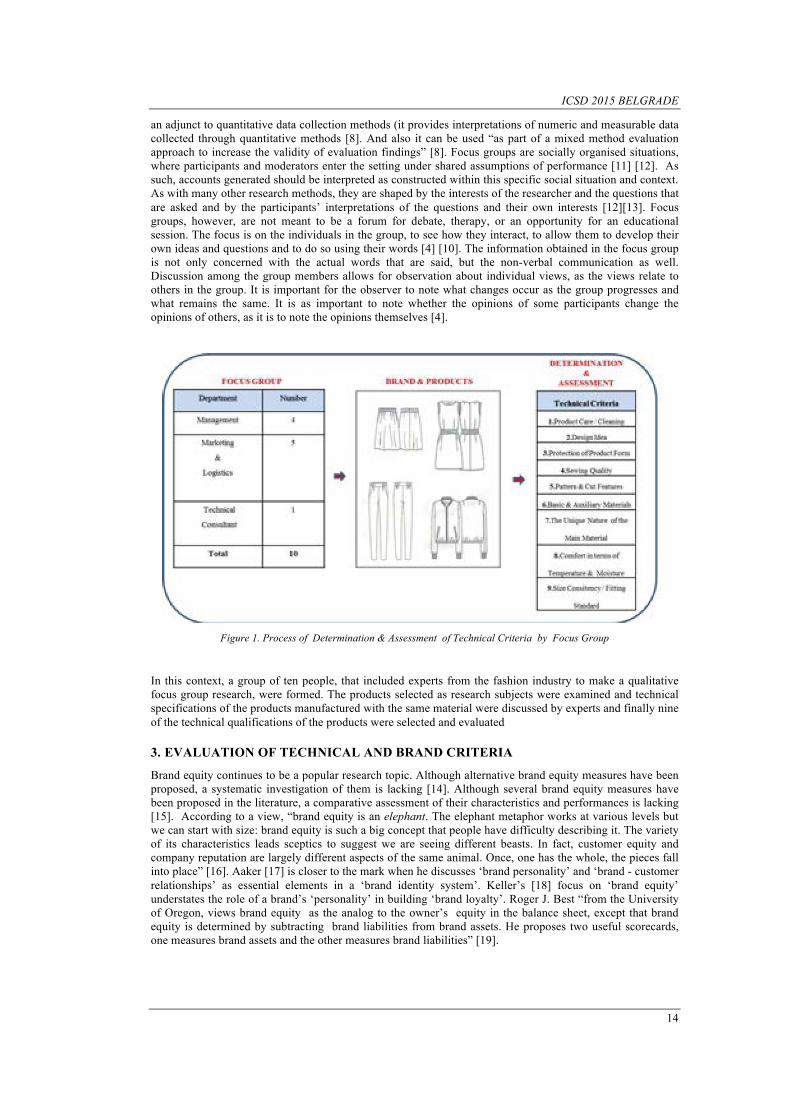
Figure 1. Process of Determination & Assessment of Technical Criteria by Focus Group
In this context, a group of ten people, that included experts from the fashion industry to make a qualitative focus group research, were formed. The products selected as research subjects were examined and technical specifications of the products manufactured with the same material were discussed by experts and finally nine of the technical qualifications of the products were selected and evaluated
3. EVALUATION OF TECHNICAL AND BRAND CRITERIA
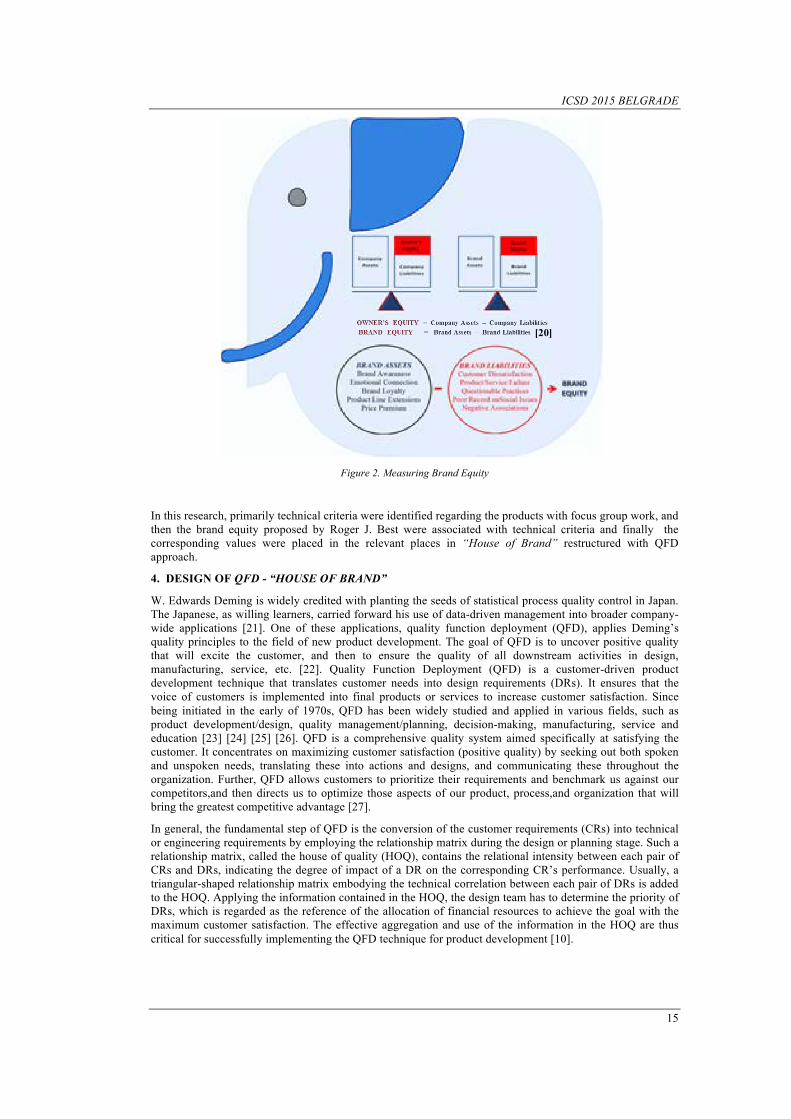
Brand equity continues to be a popular research topic. Although alternative brand equity measures have been proposed, a systematic investigation of them is lacking [14]. Although several brand equity measures have been proposed in the literature, a comparative assessment of their characteristics and performances is lacking [15]. According to a view, “brand equity is an elephant. The elephant metaphor works at various levels but we can start with size: brand equity is such a big concept that people have difficulty describing it. The variety of its characteristics leads sceptics to suggest we are seeing different beasts. In fact, customer equity and company reputation are largely different aspects of the same animal. Once, one has the whole, the pieces fall into place” [16]. Aaker [17] is closer to the mark when he discusses ‘brand personality’ and ‘brand - customer relationships’ as essential elements in a ‘brand identity system’. Keller’s [18] focus on ‘brand equity’ understates the role of a brand’s ‘personality’ in building ‘brand loyalty’. Roger J. Best “from the University of Oregon, views brand equity as the analog to the owner’s equity in the balance sheet, except that brand equity is determined by subtracting brand liabilities from brand assets. He proposes two useful scorecards, one measures brand assets and the other measures brand liabilities” [19].
ICSD 2015 BELGRADE
15
Figure 2. Measuring Brand Equity
In this research, primarily technical criteria were identified regarding the products with focus group work, and then the brand equity proposed by Roger J. Best were associated with technical criteria and finally the corresponding values were placed in the relevant places in “House of Brand” restructured with QFD approach.
4. DESIGN OF QFD - “HOUSE OF BRAND”
W. Edwards Deming is widely credited with planting the seeds of statistical process quality control in Japan. The Japanese, as willing learners, carried forward his use of data-driven management into broader company-wide applications [21]. One of these applications, quality function deployment (QFD), applies Deming’s quality principles to the field of new product development. The goal of QFD is to uncover positive quality that will excite the customer, and then to ensure the quality of all downstream activities in design, manufacturing, service, etc. [22]. Quality Function Deployment (QFD) is a customer-driven product development technique that translates customer needs into design requirements (DRs). It ensures that the voice of customers is implemented into final products or services to increase customer satisfaction. Since being initiated in the early of 1970s, QFD has been widely studied and applied in various fields, such as product development/design, quality management/planning, decision-making, manufacturing, service and education [23] [24] [25] [26]. QFD is a comprehensive quality system aimed specifically at satisfying the customer. It concentrates on maximizing customer satisfaction (positive quality) by seeking out both spoken and unspoken needs, translating these into actions and designs, and communicating these throughout the organization. Further, QFD allows customers to prioritize their requirements and benchmark us against our competitors,and then directs us to optimize those aspects of our product, process,and organization that will bring the greatest competitive advantage [27].
In general, the fundamental step of QFD is the conversion of the customer requirements (CRs) into technical or engineering requirements by employing the relationship matrix during the design or planning stage. Such a relationship matrix, called the house of quality (HOQ), contains the relational intensity between each pair of CRs and DRs, indicating the degree of impact of a DR on the corresponding CR’s performance. Usually, a triangular-shaped relationship matrix embodying the technical correlation between each pair of DRs is added to the HOQ. Applying the information contained in the HOQ, the design team has to determine the priority of DRs, which is regarded as the reference of the allocation of financial resources to achieve the goal with the maximum customer satisfaction. The effective aggregation and use of the information in the HOQ are thus critical for successfully implementing the QFD technique for product development [10].
[20]

ICSD 2015 BELGRADE
16
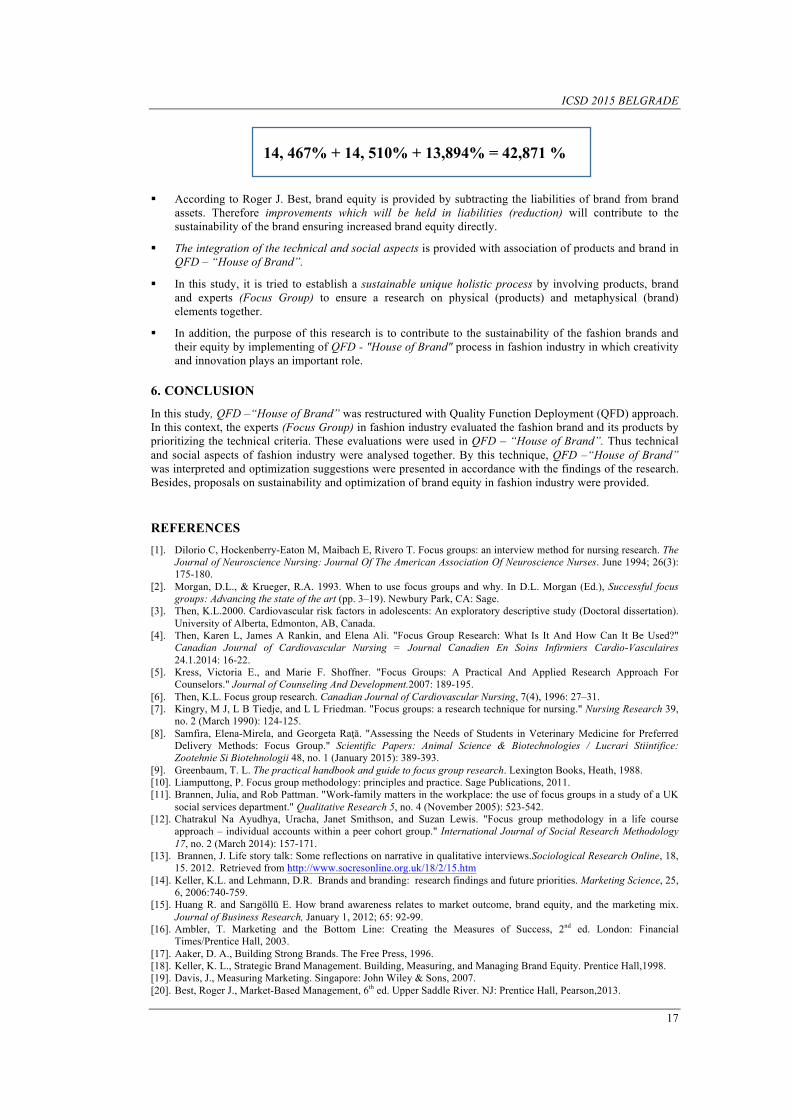
Figure 3. QFD -“House of Brand”
In this study, technical criteria were associated with brand criteria in the matrix of QFD "House of Brand". With this vision; the degree of impact of technical criteria on brand criteria was tried to determine. Prioritization of the technical criteria and triangular relationship matrix, located on the brand criteria that indicates positive / negative correlation between each two brand criteria, were carried out by experts. Need weights and absolute weights generated by expert assessments are shown in the QFD “House of Brand” matrix above (Figure 3).
5. INTERPRETATION OF QFD - “HOUSE of BRAND”
The process of QFD "House of Brand" and restructured matrix led to the following findings:
§ QFD – “House of Brand” that has been created on the basis of concept of brand equity which was proposed by Roger J. Best, associates technical and brand criteria. In technical sense, the highest expectations of the brand from products are design idea, pattern & cut features, the unique nature of the main material (100% natural silk) and size consistency /fitting standard. This standard is possible with the selected design, material and pattern quality. In addition, the use of natural material is especially noteworthy. The highest values of absolute weights are product/service failures, customer dissatisfaction and negative associations. Fashion brand can be optimized ratio of 42.87% with improvements to be made to these criteria.
ICSD 2015 BELGRADE
17
14, 467% + 14, 510% + 13,894% = 42,871 %
§ According to Roger J. Best, brand equity is provided by subtracting the liabilities of brand from brand assets. Therefore improvements which will be held in liabilities (reduction) will contribute to the sustainability of the brand ensuring increased brand equity directly.
§ The integration of the technical and social aspects is provided with association of products and brand in QFD – “House of Brand”.
§ In this study, it is tried to establish a sustainable unique holistic process by involving products, brand and experts (Focus Group) to ensure a research on physical (products) and metaphysical (brand) elements together.
§ In addition, the purpose of this research is to contribute to the sustainability of the fashion brands and their equity by implementing of QFD - "House of Brand" process in fashion industry in which creativity and innovation plays an important role.
6. CONCLUSION
In this study, QFD –“House of Brand” was restructured with Quality Function Deployment (QFD) approach. In this context, the experts (Focus Group) in fashion industry evaluated the fashion brand and its products by prioritizing the technical criteria. These evaluations were used in QFD – “House of Brand”. Thus technical and social aspects of fashion industry were analysed together. By this technique, QFD –“House of Brand” was interpreted and optimization suggestions were presented in accordance with the findings of the research. Besides, proposals on sustainability and optimization of brand equity in fashion industry were provided.
REFERENCES [1]. Dilorio C, Hockenberry-Eaton M, Maibach E, Rivero T. Focus groups: an interview method for nursing research. The
Journal of Neuroscience Nursing: Journal Of The American Association Of Neuroscience Nurses. June 1994; 26(3): 175-180.
[2]. Morgan, D.L., & Krueger, R.A. 1993. When to use focus groups and why. In D.L. Morgan (Ed.), Successful focus groups: Advancing the state of the art (pp. 3–19). Newbury Park, CA: Sage.
[3]. Then, K.L.2000. Cardiovascular risk factors in adolescents: An exploratory descriptive study (Doctoral dissertation). University of Alberta, Edmonton, AB, Canada.
[4]. Then, Karen L, James A Rankin, and Elena Ali. "Focus Group Research: What Is It And How Can It Be Used?" Canadian Journal of Cardiovascular Nursing = Journal Canadien En Soins Infirmiers Cardio-Vasculaires 24.1.2014: 16-22.
[5]. Kress, Victoria E., and Marie F. Shoffner. "Focus Groups: A Practical And Applied Research Approach For Counselors." Journal of Counseling And Development.2007: 189-195.
[6]. Then, K.L. Focus group research. Canadian Journal of Cardiovascular Nursing, 7(4), 1996: 27–31. [7]. Kingry, M J, L B Tiedje, and L L Friedman. "Focus groups: a research technique for nursing." Nursing Research 39,
no. 2 (March 1990): 124-125. [8]. Samfira, Elena-Mirela, and Georgeta Raţă. "Assessing the Needs of Students in Veterinary Medicine for Preferred
Delivery Methods: Focus Group." Scientific Papers: Animal Science & Biotechnologies / Lucrari Stiintifice: Zootehnie Si Biotehnologii 48, no. 1 (January 2015): 389-393.
[9]. Greenbaum, T. L. The practical handbook and guide to focus group research. Lexington Books, Heath, 1988. [10]. Liamputtong, P. Focus group methodology: principles and practice. Sage Publications, 2011. [11]. Brannen, Julia, and Rob Pattman. "Work-family matters in the workplace: the use of focus groups in a study of a UK
social services department." Qualitative Research 5, no. 4 (November 2005): 523-542. [12]. Chatrakul Na Ayudhya, Uracha, Janet Smithson, and Suzan Lewis. "Focus group methodology in a life course
approach – individual accounts within a peer cohort group." International Journal of Social Research Methodology 17, no. 2 (March 2014): 157-171.
[13]. Brannen, J. Life story talk: Some reflections on narrative in qualitative interviews.Sociological Research Online, 18, 15. 2012. Retrieved from http://www.socresonline.org.uk/18/2/15.htm
[14]. Keller, K.L. and Lehmann, D.R. Brands and branding: research findings and future priorities. Marketing Science, 25, 6, 2006:740-759.
[15]. Huang R. and Sarıgöllü E. How brand awareness relates to market outcome, brand equity, and the marketing mix. Journal of Business Research, January 1, 2012; 65: 92-99.
[16]. Ambler, T. Marketing and the Bottom Line: Creating the Measures of Success, 2nd ed. London: Financial Times/Prentice Hall, 2003.
[17]. Aaker, D. A., Building Strong Brands. The Free Press, 1996. [18]. Keller, K. L., Strategic Brand Management. Building, Measuring, and Managing Brand Equity. Prentice Hall,1998. [19]. Davis, J., Measuring Marketing. Singapore: John Wiley & Sons, 2007. [20]. Best, Roger J., Market-Based Management, 6th ed. Upper Saddle River. NJ: Prentice Hall, Pearson,2013.
ICSD 2015 BELGRADE
18
[21]. Akao, Yoji, and Glenn H. Mazur. "The leading edge in QFD: past, present and future." International Journal of Quality & Reliability Management, 2003: 20,1. 20-35.
[22]. Mazur G. Quality function deployment: voice of customer meets voice of process. The Journal for Quality and Participation.2015:24.
[23]. Lai-Kow C, Ming-Lu W. Quality function deployment: A literature review. European Journal Of Operational Research, 2002; 143(3):463-497.
[24]. Chen, Liang-Hsuan, and Cheng-Nien Chen. "Normalisation Models For Prioritising Design Requirements For Quality Function Deployment Processes." International Journal of Production Research 52.2 2014: 299-313.
[25]. Geum, Youngjung, Ran Kwak, and Yongtae Park. "Modularizing Services: A Modified Hoq Approach." Computers & Industrial Engineering 62.2012: 579-590.
[26]. Jia, G.Z., and M. Bai. "An Approach For Manufacturing Strategy Development Based On Fuzzy-QFD." Computers & Industrial Engineering 60. 2011: 445-454.
[27]. Ching-Wen, Chen, and Huang Shih-Tao. "Implementing KM Programmes Using Fuzzy QFD."Total Quality Management & Business Excellence 22.4 2011: 387-406.
BIOGRAPHY
Evrim Kabukcu got her MSc in Industrial Design at İzmir Institute of Technology and got her PhD in Business Administration at Yaşar University, İzmir, Turkey. She works as a lecturer at Manisa Celal Bayar University, Turkey. Her research is in fashion design for innovation and creativity, management of innovation, entrepreneurship and design marketing & management. She is interested in the management of creativity, the role of design in the new product development process, fashion branding and marketing. She published several papers on design, creativity and entrepreneurship. She teaches Fashion Marketing and Entrepreneurship in undergradutate programs. She participates several art events and conferences in Turkey and abroad.
ICSD 2015 BELGRADE
19
Energy Efficiency and Policy Mix in the European Countries
Savaş Çevik1, Fatma Turna2, M. Mustafa Erdoğdu3
Abstract
Although countries have had concerns about energy security and energy supply for a long time, global warming and other environmental problems have led to increased interest in renewable energy use and energy efficiency only in the last decades. On the one hand, energy efficiency is important for cost-effective use of resources, overcoming environmental problems, and improving energy security. On the other hand, it is important for increasing living standards and life quality of inhabitants. Therefore, many countries have developed energy efficiency policies since 1970s. Among them, the EU countries appear as in a very good shape in policy design and innovation policies. Energy efficiency policies and their instruments are inherently complex due to the sectoral diversity, a variety of audience and uses. However, the success of a policy could largely depend on the process of policy making with regard to the characteristics of the policy, instruments and measures used, stakeholders involved and its targets. This paper aims to examine the effect of policy packages on the impact level of policies and to search if there is any efficient combination of policy instruments, based on the data of the MURE project which is a unique database on energy efficiency policy measures in 28 EU countries and Norway. First, the study provides an insight into the energy efficiency policies in European Countries by their sectoral distribution, targeted end-use and measure types to determine policy mix and policy trend. Later, it analyzes the policy packages to determine if the policy mix with respect to sectors, actors and measures has any effect on semi-quantitative impact levels of policies through cross-tabulations. The main finding of the paper is that the policy mix is crucial for policy success. Keywords: Energy Policy, European Union, Energy Efficiency, MURE Project.
1. INTRODUCTION
Energy is one of the most important inputs for economic growth and human development since it provides an essential ingredient for almost all human activities. Efficient energy use,4 on the other hand, is a cost-effective strategy for building economies without necessarily increasing energy consumption. Improving energy efficiency is an important priority in the policy agenda for all countries not only for economic reasons but also for many other reasons, such as environmental benefits, energy security and creating new jobs. Since energy efficiency represents the cheapest and surest means of curbing carbon emissions and saving money for other productive uses, national energy efficiency policies and measures and monitoring energy efficiency are seen today as the most important component of energy strategies of countries.
Besides, the European Union and its members are seen to be the world champion with respect to policy design, policy innovations and their energy efficiency outcomes despite some member states are among the world’s largest energy consumers. As national policies of member states are heavily formed by the EU 1Corresponding author: Assoc. Prof. Selcuk University, Faculty of Economic and Administrative Sciences, Department of dEconomics, Konya, Turkey. [email protected] 2Res. Ass. Marmara University, Faculty of Economics, Department of Public Finance, Goztepe Yerleskesi, 34722 dKadikoy/Istanbul, [email protected] 3Prof. Dr., Marmara University, Faculty of Economics, Department of Public Finance, Goztepe Yerleskesi, 34722 Kadikoy/ dIstanbul, [email protected] 4Energy efficiency improvements are more prudent use of scarce and polluting resources while simultaneously maintaining da certain level of output.
ICSD 2015 BELGRADE
20
regulations and policies, the EU provides a roadmap for moving a low-carbon and energy-efficient economy by drawing clear targets on emissions and uses to members states. According to the Europe 2020 strategy approved by the European Council, it is targeted to increase energy efficiency by 20%, to reduce greenhouse gas emissions by 20% and to reach a share of 20% of energy from renewables in 2020 compare to 1990. The Energy Efficiency Directive (EED; 2012/27/EU) further specified that the EU-28 energy consumption for 2020 has to be no more than 1,483 Mtoe of primary energy or no more than 1,086 Mtoe of final energy. On 23 October 2014, the European Council decided on a new 2030 Climate and Energy Policy Framework including a binding EU target of at least 40% domestic reduction in greenhouse gas emissions by 2030 compared to 1990, and a share of at least 27% of renewable energy consumed in the EU in 2030 is binding at EU level. There are also sector-specific targets by the EU regulations.
According to Energy Savings 2020 report prepared by Wesselink, Harmsen, and Eichhammer (2010; 6), the EU’s 20% energy savings target can be met largely through cost-effective measures but a tripling of policy impact is required. There are wide range of policy design with respect to their targets, actors, measures and other instruments in the EU members. The gap between the estimated opportunities in energy efficiency in sectors and achieved levels require examining energy-efficiency policies design and policy-making process in more detail in order to determine the characteristics of successful policy. In this context, the study’s first objective is to examine policy design of the European countries where are seen as the leader in energy efficiency policy and in combating climate change, in order to identify the sector and the measure specific characteristics of energy efficiency policies and the recent trends in the region. The second objective is to determine if policy mix or policy packages with respect to their characteristics on actors, targets and measure types has an effect on the policy’s impact on energy efficiency. For these objectives, we use the data of the MURE project which is a unique database that provides an evaluation of energy efficiency policy measures in the EU members, Norway, Croatia and the EU as a whole.
The next section describes and evaluates the main purposes and instruments of energy efficiency policies in sample countries. The third section assesses the energy-efficiency impacts of policy packages by their actors involved, measures used and end-use targeted through the average impact scores calculated from semi-quantitative impact levels. The final section concludes.
2. THE DESIGN OF ENERGY EFFICIENCY POLICIES: PURPOSES AND INSTRUMENTS
There have been implemented numerous energy efficiency policy instruments among countries, the energy gains compared to potential still limited, and the impact of policies varies across policies and countries (Morvaj and Bukarica, 2010) because of components of policies as well as the importance of other drivers in energy saving such as technologic innovations (Huber and Mills, 2005; Hogan and Jorgenson, 1991) and the increase in energy prices (Sutherland, 2003) as argued by some authors. When enforcement can be secured, mandatory and regulatory measures are generally the most cost-effective ways of increasing the energy efficiency on a long-term basis (UNDP, 2009; Erdogdu, Karaca, & Kurultay, 2015).
Taking into account of the energy efficiency gap between the observed level of energy efficiency and the potential of energy efficiency, this gap and therefore the need for policy intervention in energy markets mostly are explained by market and behavioral failures (Gillingham, Newell and Palmer, 2009; Shogren and Taylor, 2008), despite of some critics which argue that all market failures and barriers are not problem that should be overcome or can be overcome cost-effectively (Geller and Attali, 2009). Gillingham, Newell and Palmer (2009) classify potential failures and policy options as energy market failures (policy options are fiscal and new market-based instruments), capital market failures (policy options are financial and loan instruments), innovation market failures (policy options are fiscal and financial instruments), information problems (policy options are information programs) and behavioral failures (policy options are educational and informational instruments and legislative-normative measures as product standards).
In this paper, we examine the European countries which are seen to be having the developed policy designs and to be having enormous energy gains from policies through the MURE database. The first policies that appear in the MURE database are “farm land re-parceling project” of Finland in 1917 and “speed limits and active traffic management” of UK in 1934. Until 1990, there were only 86 policies according to the MURE database. The energy-efficiency policies have mainly began to increase from 1990s, and at mid-2000s, the number of policy has reached at its highest level, despite of relatively decrease after 2009 (the decrease can be seen to be partly due to data availability in the MURE database). There has been a continuous increase in the number of measures that have come into force every year until 2009. The increase is valid for all sectors, but the least increase was experienced in the industrial sector. The policy number for all years and all sectors is 2382 as of August 2015 when the data was collected for this study. The largest part of policies is those related to energy efficiency in the household sector. Policies without the semi-quantitative impact estimation are about 13% of the total. The largest number of policies consists of measures addressing energy-efficient in the household sector by 28% as share of total policies (663 policies as frequency). The second largest number of policies is those which address transport and tertiary sectors. The share of transport and tertiary sector
ICSD 2015 BELGRADE
21
policies is quite similar and 22% (528 policies for transport and 524 policies for tertiary) with respect to policy numbers. Policies toward the industrial sector and general cross-cutting sector are again same as 14% as a share of total policies (334 policies for general cross-cutting and 333 policies for industrial sector). The MURE database also publishes semi-quantitative impact evaluations of 86 percent of policies (with 2055 at frequency). All sectors have the impact evaluation above 87% except general cross-cutting sector by 76%.
Taking together households and tertiary sector, policies which tackle buildings consist of a half of total policies. EC Directorate-General for Energy (2012) has also recognized that buildings must be central to the EU's energy efficiency policy. Studies have generally indicated that since there is currently a high final energy demand for heating and cooling in the residential and tertiary sector, energy saving potential in the buildings (especially from refurbishment of existing buildings) is rather high compared to other sectors (Eichhammer, et al. 2009; Boßmann et al. 2012).
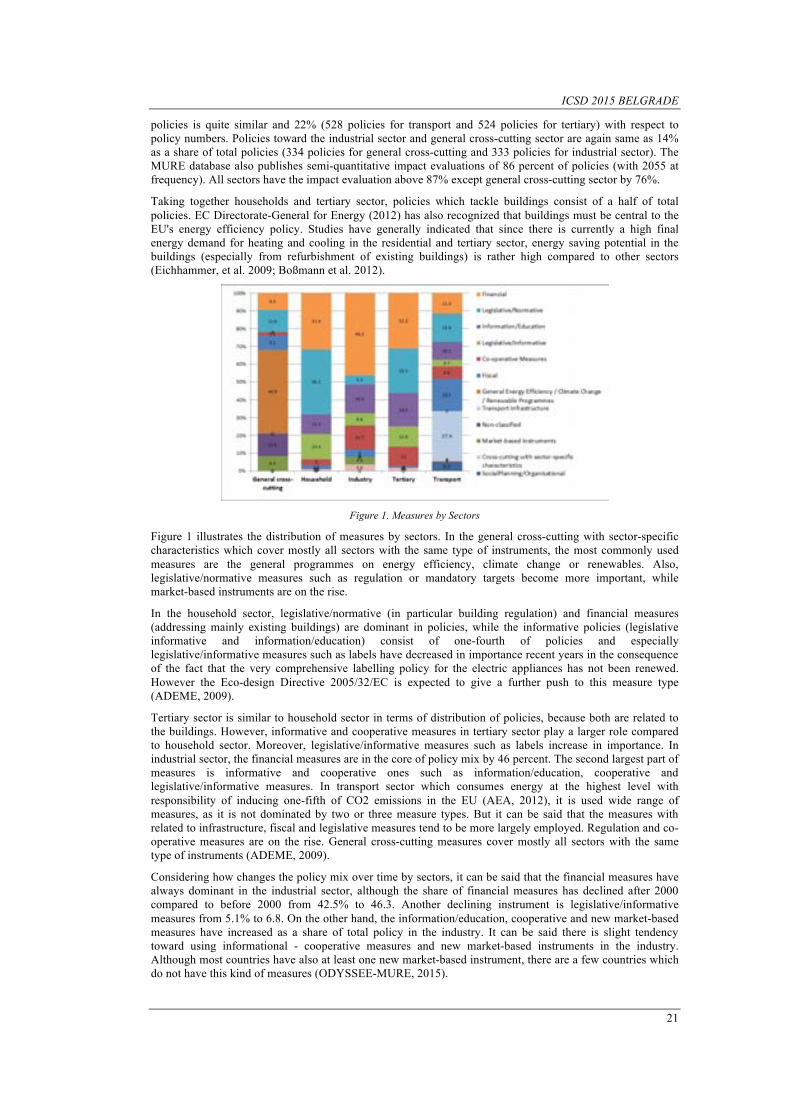
Figure 1. Measures by Sectors
Figure 1 illustrates the distribution of measures by sectors. In the general cross-cutting with sector-specific characteristics which cover mostly all sectors with the same type of instruments, the most commonly used measures are the general programmes on energy efficiency, climate change or renewables. Also, legislative/normative measures such as regulation or mandatory targets become more important, while market-based instruments are on the rise.
In the household sector, legislative/normative (in particular building regulation) and financial measures (addressing mainly existing buildings) are dominant in policies, while the informative policies (legislative informative and information/education) consist of one-fourth of policies and especially legislative/informative measures such as labels have decreased in importance recent years in the consequence of the fact that the very comprehensive labelling policy for the electric appliances has not been renewed. However the Eco-design Directive 2005/32/EC is expected to give a further push to this measure type (ADEME, 2009).
Tertiary sector is similar to household sector in terms of distribution of policies, because both are related to the buildings. However, informative and cooperative measures in tertiary sector play a larger role compared to household sector. Moreover, legislative/informative measures such as labels increase in importance. In industrial sector, the financial measures are in the core of policy mix by 46 percent. The second largest part of measures is informative and cooperative ones such as information/education, cooperative and legislative/informative measures. In transport sector which consumes energy at the highest level with responsibility of inducing one-fifth of CO2 emissions in the EU (AEA, 2012), it is used wide range of measures, as it is not dominated by two or three measure types. But it can be said that the measures with related to infrastructure, fiscal and legislative measures tend to be more largely employed. Regulation and co-operative measures are on the rise. General cross-cutting measures cover mostly all sectors with the same type of instruments (ADEME, 2009).
Considering how changes the policy mix over time by sectors, it can be said that the financial measures have always dominant in the industrial sector, although the share of financial measures has declined after 2000 compared to before 2000 from 42.5% to 46.3. Another declining instrument is legislative/informative measures from 5.1% to 6.8. On the other hand, the information/education, cooperative and new market-based measures have increased as a share of total policy in the industry. It can be said there is slight tendency toward using informational - cooperative measures and new market-based instruments in the industry. Although most countries have also at least one new market-based instrument, there are a few countries which do not have this kind of measures (ODYSSEE-MURE, 2015).
ICSD 2015 BELGRADE
22
Financial and legislative measures are dominant in the building sector. However, comparing after-2000 and before-2000, there is a slight increase in legislative/informative measures and fiscal measures for household sector, on the other hand, for tertiary sector, as the financial measures and information/education have increased respectively from 31.3% to 33.4 and from 18.1% to 18.5, legislative normative measures have decreased by 3 percentage points.
In transport sector in which policy efforts intensify on mobility paradigm in transport, using new technologies in vehicles and transport systems, encouraging modal shift toward less energy intensive modes like public transport and improving transport infrastructure systems with regard to energy efficiency and environmental sustainability (ADEME, 2013; EC, 2011; Marcucci, Valeri and Stathopoulos, 2012), it is dominantly implemented infrastructure, fiscal, information/education and legislative/normative measures. Comparing after-2000 and before-2000, the legislative measures (informative and normative) have increased from 19.5% to 22.5% despite of slight decreases in all measure types except of a slight increase in social planning/organization types of measures.
3. POLICY PACKAGES AND THEIR SEMI-QUANTITATIVE IMPACTS
One of the most important advantages of the MURE database is that it publishes the impact evaluations of a policy in semi-quantitative categories as having high impact, medium impact and low impact based on quantitative evaluations or expert estimates, with respect to energy savings achieved by the policy. This is quite valuable information to judge the success of a policy.
The information on the impact level could also be used to consider the success of a mix of policy instruments such as actors involved, measures employed and targeted-end-use of policies, when the multiple actors are used in a policy. In this case, an option is to compare how much policy has the highest impact as percentage of total policy or how much of them in the lowest impact level for related categories. Another way is to develop a score on impact levels to compare categories. We prefer the second option by calculating simply the average impact score for comparison purposes. Accordingly, we assign the coefficients for 1 for the low impact, 2 for the medium impact and 3 for high impact in an instrument, and then divide total value by the frequency of the category respective.
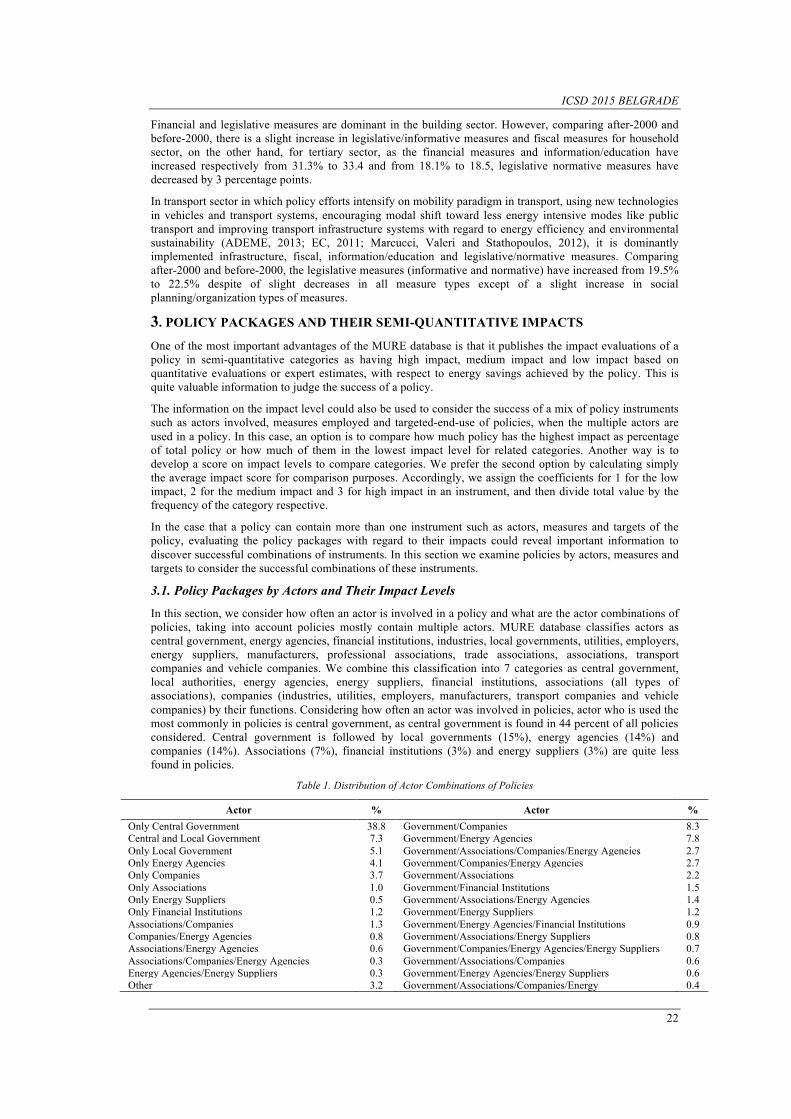
In the case that a policy can contain more than one instrument such as actors, measures and targets of the policy, evaluating the policy packages with regard to their impacts could reveal important information to discover successful combinations of instruments. In this section we examine policies by actors, measures and targets to consider the successful combinations of these instruments.
3.1. Policy Packages by Actors and Their Impact Levels
In this section, we consider how often an actor is involved in a policy and what are the actor combinations of policies, taking into account policies mostly contain multiple actors. MURE database classifies actors as central government, energy agencies, financial institutions, industries, local governments, utilities, employers, energy suppliers, manufacturers, professional associations, trade associations, associations, transport companies and vehicle companies. We combine this classification into 7 categories as central government, local authorities, energy agencies, energy suppliers, financial institutions, associations (all types of associations), companies (industries, utilities, employers, manufacturers, transport companies and vehicle companies) by their functions. Considering how often an actor was involved in policies, actor who is used the most commonly in policies is central government, as central government is found in 44 percent of all policies considered. Central government is followed by local governments (15%), energy agencies (14%) and companies (14%). Associations (7%), financial institutions (3%) and energy suppliers (3%) are quite less found in policies.
Table 1. Distribution of Actor Combinations of Policies
Actor % Actor % Only Central Government 38.8 Government/Companies 8.3 Central and Local Government 7.3 Government/Energy Agencies 7.8 Only Local Government 5.1 Government/Associations/Companies/Energy Agencies 2.7 Only Energy Agencies 4.1 Government/Companies/Energy Agencies 2.7 Only Companies 3.7 Government/Associations 2.2 Only Associations 1.0 Government/Financial Institutions 1.5 Only Energy Suppliers 0.5 Government/Associations/Energy Agencies 1.4 Only Financial Institutions 1.2 Government/Energy Suppliers 1.2 Associations/Companies 1.3 Government/Energy Agencies/Financial Institutions 0.9 Companies/Energy Agencies 0.8 Government/Associations/Energy Suppliers 0.8 Associations/Energy Agencies 0.6 Government/Companies/Energy Agencies/Energy Suppliers 0.7 Associations/Companies/Energy Agencies 0.3 Government/Associations/Companies 0.6 Energy Agencies/Energy Suppliers 0.3 Government/Energy Agencies/Energy Suppliers 0.6 Other 3.2 Government/Associations/Companies/Energy 0.4
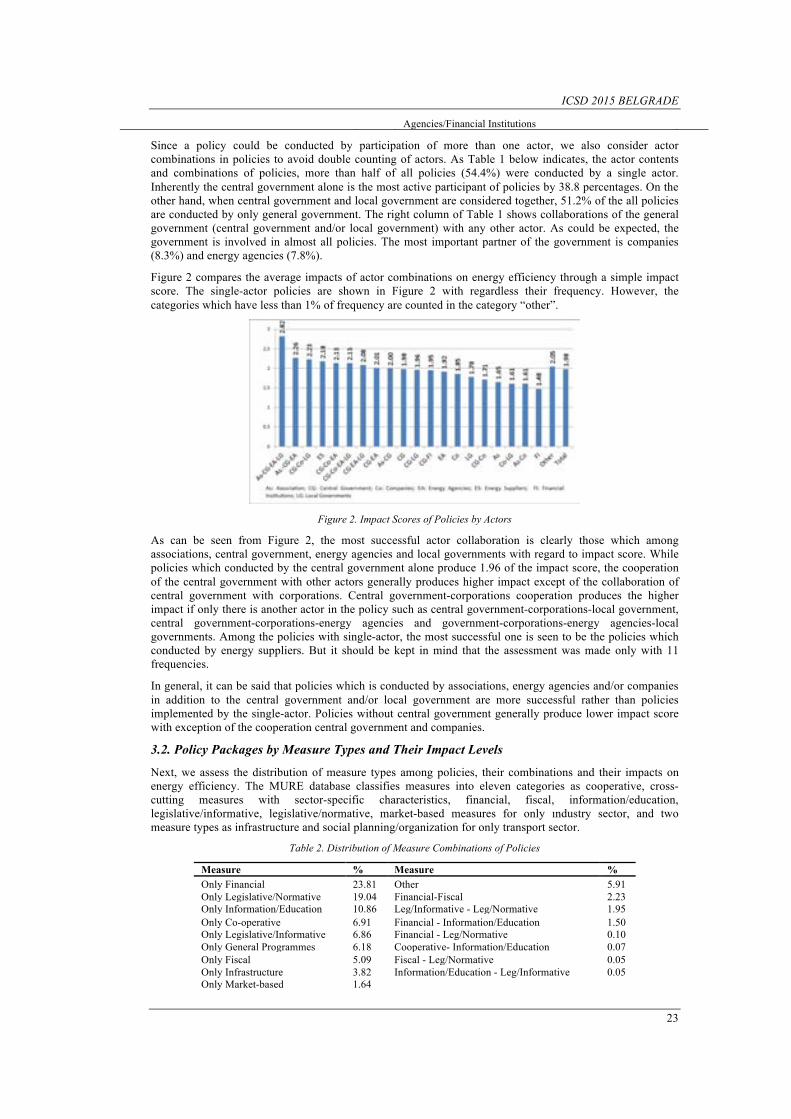
ICSD 2015 BELGRADE
23
Agencies/Financial Institutions
Since a policy could be conducted by participation of more than one actor, we also consider actor combinations in policies to avoid double counting of actors. As Table 1 below indicates, the actor contents and combinations of policies, more than half of all policies (54.4%) were conducted by a single actor. Inherently the central government alone is the most active participant of policies by 38.8 percentages. On the other hand, when central government and local government are considered together, 51.2% of the all policies are conducted by only general government. The right column of Table 1 shows collaborations of the general government (central government and/or local government) with any other actor. As could be expected, the government is involved in almost all policies. The most important partner of the government is companies (8.3%) and energy agencies (7.8%).
Figure 2 compares the average impacts of actor combinations on energy efficiency through a simple impact score. The single-actor policies are shown in Figure 2 with regardless their frequency. However, the categories which have less than 1% of frequency are counted in the category “other”.
Figure 2. Impact Scores of Policies by Actors
As can be seen from Figure 2, the most successful actor collaboration is clearly those which among associations, central government, energy agencies and local governments with regard to impact score. While policies which conducted by the central government alone produce 1.96 of the impact score, the cooperation of the central government with other actors generally produces higher impact except of the collaboration of central government with corporations. Central government-corporations cooperation produces the higher impact if only there is another actor in the policy such as central government-corporations-local government, central government-corporations-energy agencies and government-corporations-energy agencies-local governments. Among the policies with single-actor, the most successful one is seen to be the policies which conducted by energy suppliers. But it should be kept in mind that the assessment was made only with 11 frequencies.
In general, it can be said that policies which is conducted by associations, energy agencies and/or companies in addition to the central government and/or local government are more successful rather than policies implemented by the single-actor. Policies without central government generally produce lower impact score with exception of the cooperation central government and companies.
3.2. Policy Packages by Measure Types and Their Impact Levels
Next, we assess the distribution of measure types among policies, their combinations and their impacts on energy efficiency. The MURE database classifies measures into eleven categories as cooperative, cross-cutting measures with sector-specific characteristics, financial, fiscal, information/education, legislative/informative, legislative/normative, market-based measures for only ındustry sector, and two measure types as infrastructure and social planning/organization for only transport sector.
Table 2. Distribution of Measure Combinations of Policies Measure % Measure % Only Financial 23.81 Other 5.91 Only Legislative/Normative 19.04 Financial-Fiscal 2.23 Only Information/Education 10.86 Leg/Informative - Leg/Normative 1.95 Only Co-operative 6.91 Financial - Information/Education 1.50 Only Legislative/Informative 6.86 Financial - Leg/Normative 0.10 Only General Programmes 6.18 Cooperative- Information/Education 0.07 Only Fiscal 5.09 Fiscal - Leg/Normative 0.05 Only Infrastructure 3.82 Information/Education - Leg/Informative 0.05 Only Market-based 1.64
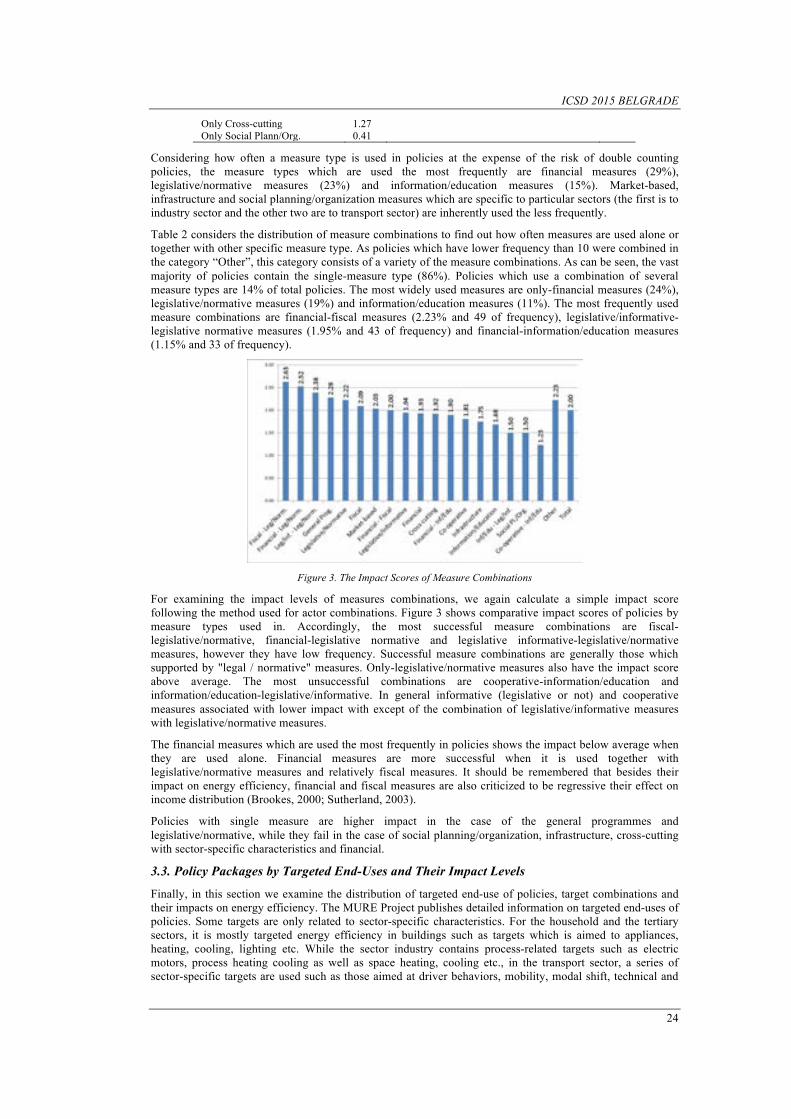
ICSD 2015 BELGRADE
24
Only Cross-cutting 1.27 Only Social Plann/Org. 0.41
Considering how often a measure type is used in policies at the expense of the risk of double counting policies, the measure types which are used the most frequently are financial measures (29%), legislative/normative measures (23%) and information/education measures (15%). Market-based, infrastructure and social planning/organization measures which are specific to particular sectors (the first is to industry sector and the other two are to transport sector) are inherently used the less frequently.
Table 2 considers the distribution of measure combinations to find out how often measures are used alone or together with other specific measure type. As policies which have lower frequency than 10 were combined in the category “Other”, this category consists of a variety of the measure combinations. As can be seen, the vast majority of policies contain the single-measure type (86%). Policies which use a combination of several measure types are 14% of total policies. The most widely used measures are only-financial measures (24%), legislative/normative measures (19%) and information/education measures (11%). The most frequently used measure combinations are financial-fiscal measures (2.23% and 49 of frequency), legislative/informative-legislative normative measures (1.95% and 43 of frequency) and financial-information/education measures (1.15% and 33 of frequency).
Figure 3. The Impact Scores of Measure Combinations
For examining the impact levels of measures combinations, we again calculate a simple impact score following the method used for actor combinations. Figure 3 shows comparative impact scores of policies by measure types used in. Accordingly, the most successful measure combinations are fiscal-legislative/normative, financial-legislative normative and legislative informative-legislative/normative measures, however they have low frequency. Successful measure combinations are generally those which supported by "legal / normative" measures. Only-legislative/normative measures also have the impact score above average. The most unsuccessful combinations are cooperative-information/education and information/education-legislative/informative. In general informative (legislative or not) and cooperative measures associated with lower impact with except of the combination of legislative/informative measures with legislative/normative measures.
The financial measures which are used the most frequently in policies shows the impact below average when they are used alone. Financial measures are more successful when it is used together with legislative/normative measures and relatively fiscal measures. It should be remembered that besides their impact on energy efficiency, financial and fiscal measures are also criticized to be regressive their effect on income distribution (Brookes, 2000; Sutherland, 2003).
Policies with single measure are higher impact in the case of the general programmes and legislative/normative, while they fail in the case of social planning/organization, infrastructure, cross-cutting with sector-specific characteristics and financial.
3.3. Policy Packages by Targeted End-Uses and Their Impact Levels
Finally, in this section we examine the distribution of targeted end-use of policies, target combinations and their impacts on energy efficiency. The MURE Project publishes detailed information on targeted end-uses of policies. Some targets are only related to sector-specific characteristics. For the household and the tertiary sectors, it is mostly targeted energy efficiency in buildings such as targets which is aimed to appliances, heating, cooling, lighting etc. While the sector industry contains process-related targets such as electric motors, process heating cooling as well as space heating, cooling etc., in the transport sector, a series of sector-specific targets are used such as those aimed at driver behaviors, mobility, modal shift, technical and
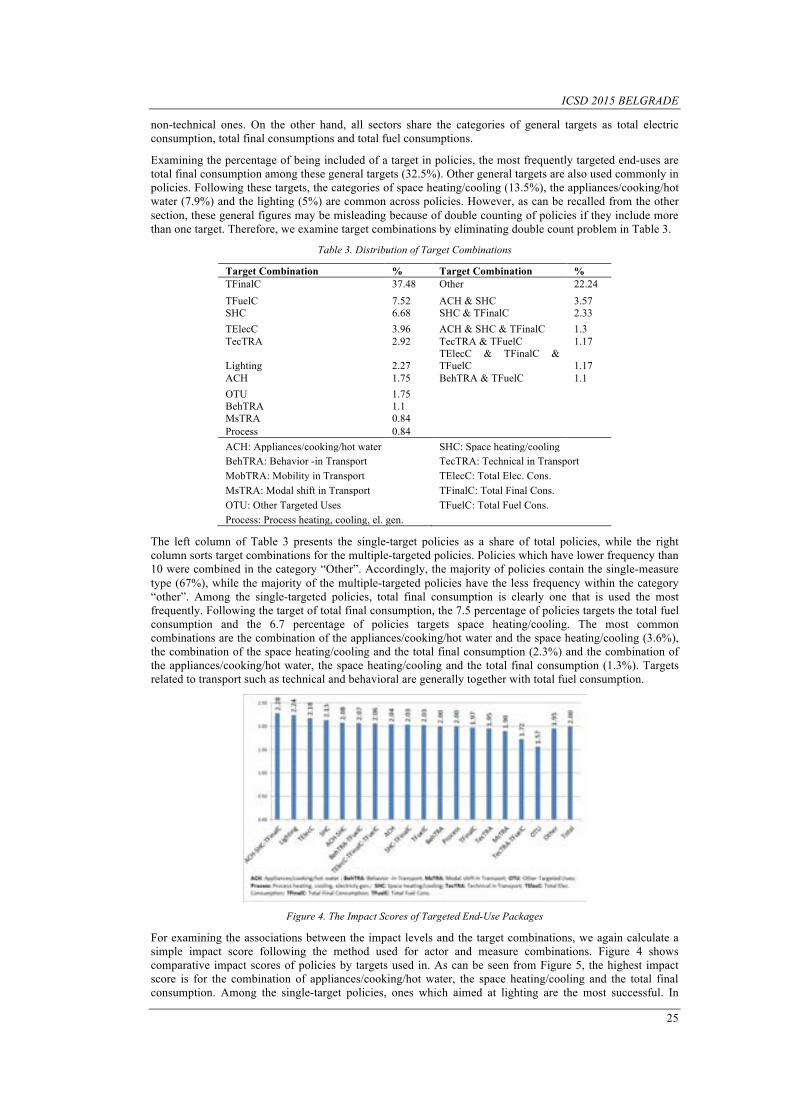
ICSD 2015 BELGRADE
25
non-technical ones. On the other hand, all sectors share the categories of general targets as total electric consumption, total final consumptions and total fuel consumptions.
Examining the percentage of being included of a target in policies, the most frequently targeted end-uses are total final consumption among these general targets (32.5%). Other general targets are also used commonly in policies. Following these targets, the categories of space heating/cooling (13.5%), the appliances/cooking/hot water (7.9%) and the lighting (5%) are common across policies. However, as can be recalled from the other section, these general figures may be misleading because of double counting of policies if they include more than one target. Therefore, we examine target combinations by eliminating double count problem in Table 3.
Table 3. Distribution of Target Combinations Target Combination % Target Combination % TFinalC 37.48 Other 22.24 TFuelC 7.52 ACH & SHC 3.57 SHC 6.68 SHC & TFinalC 2.33 TElecC 3.96 ACH & SHC & TFinalC 1.3 TecTRA 2.92 TecTRA & TFuelC 1.17
Lighting 2.27 TElecC & TFinalC & TFuelC 1.17
ACH 1.75 BehTRA & TFuelC 1.1 OTU 1.75 BehTRA 1.1 MsTRA 0.84 Process 0.84 ACH: Appliances/cooking/hot water SHC: Space heating/cooling BehTRA: Behavior -in Transport TecTRA: Technical in Transport MobTRA: Mobility in Transport TElecC: Total Elec. Cons. MsTRA: Modal shift in Transport TFinalC: Total Final Cons. OTU: Other Targeted Uses TFuelC: Total Fuel Cons. Process: Process heating, cooling, el. gen.
The left column of Table 3 presents the single-target policies as a share of total policies, while the right column sorts target combinations for the multiple-targeted policies. Policies which have lower frequency than 10 were combined in the category “Other”. Accordingly, the majority of policies contain the single-measure type (67%), while the majority of the multiple-targeted policies have the less frequency within the category “other”. Among the single-targeted policies, total final consumption is clearly one that is used the most frequently. Following the target of total final consumption, the 7.5 percentage of policies targets the total fuel consumption and the 6.7 percentage of policies targets space heating/cooling. The most common combinations are the combination of the appliances/cooking/hot water and the space heating/cooling (3.6%), the combination of the space heating/cooling and the total final consumption (2.3%) and the combination of the appliances/cooking/hot water, the space heating/cooling and the total final consumption (1.3%). Targets related to transport such as technical and behavioral are generally together with total fuel consumption.
Figure 4. The Impact Scores of Targeted End-Use Packages
For examining the associations between the impact levels and the target combinations, we again calculate a simple impact score following the method used for actor and measure combinations. Figure 4 shows comparative impact scores of policies by targets used in. As can be seen from Figure 5, the highest impact score is for the combination of appliances/cooking/hot water, the space heating/cooling and the total final consumption. Among the single-target policies, ones which aimed at lighting are the most successful. In
ICSD 2015 BELGRADE
26
general, targets related to building sector such as lighting, total electric consumption, space heating/cooling have the higher impact levels, while policies with transport-specific targets are unsuccessful with regard to their impact scores. Among transport-specific targets, the most successful one is behavioral targets, but it has higher impact if it is used with total fuel consumption target.
Among targets aimed at general energy efficiency (total final consumption, total electric consumption and total fuel consumption), total electric consumption is the most successful, while total final consumption is the less successful one, when they are used alone. Total final consumption has higher impact if it is used together with targets the appliances/cooking/hot water and the space heating/cooling instead of using alone, while the fuel consumption has higher impact if it is used together with behavioral targets for transport instead of using alone.
4. CONCLUSION
We have evaluated the policy contents with respect to their impacts on energy efficiency by actors, measure types and targets. The most successful actor collaboration clearly appears as those which among associations, central government, energy agencies and local governments. The cooperation of the central government with other actors generally produces the higher impact except the collaboration of central government with corporations. Policies without central government generally produce lower impact score with the exception of the cooperation central government and companies.
For measure types employed in policies, the most successful measure combinations are fiscal-legislative/normative, financial-legislative normative and legislative informative-legislative/normative measures. Successful measure combinations are generally those which supported by "legislative/normative" measures. Only-legislative/normative measures also have the impact score above average. When enforcement can be secured, mandatory and regulatory measures are generally the most cost-effective ways of increasing the energy efficiency. The most unsuccessful combinations are cooperative-information/education and information/education-legislative/informative. In general informative (legislative or not) and cooperative measures associated with lower impact with except of the combination of legislative/informative measures with legislative/normative measures. The financial measures which are used the most frequently in policies shows the impact below average when they are used alone. Financial measures are more successful when it is used together with legislative/normative measures and relatively fiscal measures.
With regard to target packages of policies, the highest impact score is for the combination of appliances/cooking/hot water, the space heating/cooling and the total final consumption. Among the single-target policies, ones which aimed at lighting are the most successful. In general, targets related to building sector such as lighting, total electric consumption, space heating/cooling have the higher impact levels, while policies with transport-specific targets are unsuccessful with regard to their impact scores. Among transport-specific targets, the most successful one is behavioral targets, but it has higher impact if it is used with total fuel consumption target.
REFERENCES [1]. ADEME, “Overall Energy Efficiency Trends and Policies in the EU 27”, October 2009. [2]. ADEME (2013), “Energy Efficiency Policies in the EU: Lessons from the Odyssee-Mure Project” website, July
2013. [Online]. Available: http://www.ademe.fr/sites/default/files/assets/documents/89109_7860-energy-efficiency-policies-in-eu.pdf
[3]. AEA, “Energy Efficiency Policies in the Transport Sector in the EU”, Report for the EACI, Issue Number 2, October 2012.
[4]. T. Boßmann, W. Eichhammer and R. Elsland “Concrete Paths of the European Union to the 2°C Scenario: Achieving the Climate Protection Targets of the EU by 2050 through Structural Change, Energy Savings and Energy Efficiency Technologies: Accompanying scientific report – Contribution of energy efficiency measures to climate protection within the European Union until 2050”, Karlsruhe: Fraunhofer Institute for Systems and Innovation Research ISI, 2012.
[5]. EC, “White Paper: Roadmap to a Single European Transport Area – Towards a Competitive and Resource Efficient Transport System”, COM (2011) 144 final
[6]. EC Directorate-General for Energy, Consultant Paper: Financial Support for Energy Efficiency in Buildings, Brussels: February 2012
[7]. W. Eichhammer, et al., “Study on the Energy Savings Potentials in EU Member States, Candidate Countries and EEA Countries - Final Report for the European Commission Directorate-General Energy and Transport”, Karlsruhe / Grenoble / Rome / Vienna / Wuppertal: Fraunhofer ISI, ENERDATA, Institute of Studies for the Integration of Systems ISIS, Vienna Technical University, Wuppertal Institute for Climate, Environment and Energy WI, March 2009.
[8]. M. Erdoğdu, C. Karaca, A. Kurultay, “Economic Potential of Energy-Efficient Retrofitting in the Residential Buildings: The Case of Istanbul”. International Conference on Sustainable Development, November 12-15, 2015 / Belgrade.
[9]. H. Geller and S. Attali, The Experience with Energy Efficiency Policies and Programmes in IEA Countries: Learning from the Critics, IEA, August 2005.

ICSD 2015 BELGRADE
27
[10]. K. Gillingham, R. G. Newell and K. Palmer, “Energy Efficiency Economics and Policy”, Resources for Future Discussion Paper, RFF DP 09-13, Washington D.C, 2009.
[11]. W. Hogan and D. Jorgenson, “Productivity Trends and The Cost of Reducing CO2 Emissions”, The Energy Journal, 12(1), 67-86. 1991.
[12]. P. W. Huber and M. P. Mills, The Bottomless Well: The Twilight of Fuel, the Virtue of Waste, and Why We Will Never Run Out of Energy, New York: Basic Books, 2005.
[13]. E. Marcucci, E. Valeri and A. Stathopoulos, “Energy efficiency in transport sector: policy evolution in some European countries”, CREI Working Paper, No: 3, 2012.
[14]. Z. Morvaj and V. Bukarica, “Immediate challenge of combating climate change: effective implementation of energy efficiency policies”, 21st World Energy Congress, 2010, 12-16 September, Montreal, Canada
[15]. ODYSSEE-MURE, “Energy Efficiency Trends and Policies in Industry: An Analysis Based on the ODYSSEE and MURE Databases”, September 2015.
[16]. J. Shogren and L. Taylor, “On Behavioral-Environmental Economics”, Review of Environmental Economics and Policy, 2, 26-44, 2008.
[17]. R. J. Sutherland, (2003), The High Costs of Federal Energy Efficiency Standards for Residential Appliances, The Cato Institute Policy Analysis no. 504, Washington D.C.: The Cato Institute.UNDP (2009). Promoting Energy Efficiency in Buildings: Lessons Learned from International Experience. United Nations Development Programme. New York. [Online]. Available: https://www.thegef.org/gef/sites/thegef.org/files/publication/EEBuilding_WEB.pdf
[18]. B. Wesselink, R. Harmsen & W. Eichhammer, Energy Savings 2020: How to Triple the Impact of Energy Saving Policies in Europe. September, 2010.
ICSD 2015 BELGRADE
28
Antimicrobial and Antioxidative Activity of Commercial versus Traditional Apple
Vinegar Elizabeta Janchovska1, Maja Janchovska2, Bozhidar Ristovski1,
Mirjana Bocevska1
Abstract Four samples of commercially produced apple vinegars, by different producers, and one sample obtained traditionally or homemade were analyzed. Their dry mass, total acids, pH value as well as antioxidant DPPH activity and antimicrobial capacity against Salmonella typhimurium, Escherichia coli, Staphylococcus aureus and Candida albicans were determined and compared. In commercially obtained vinegars dry mass varied from 2 to 3.1%, but in traditional was about 8.2%. Content of total acids in commercially products was in the range of 1.5% to 4.6% and about 18.6% in traditionally obtained vinegar, pH varying in the range of 2.7 – 3.5 in commercially and 2.8 in homemade vinegar. One of the commercial sample was with higher DPPH antioxidant activity than homemade vinegar, while two samples were with very weak activity. Traditionally obtained vinegar was the most effective to Salmonella typhimurium, but the coommercially vinegars to Candida albicans. Keywords: Antimicrobial, Antiradical Activity, Apple Vinegar, Commercial, Traditional.
1. INTRODUCTION
The word vinegar comes from the French “vinaigre”, that means sour wine (vin=wine, aigre=sour) [1]. The definition of vinegar itself differs from country to country. The available definition from the Codex Alimentarius [2] indicates that vinegar is “a liquid, fit for human consumption, produced from a suitable raw material of agricultural origin, containing starch, sugars, or starch and sugars, by the process of double fermentation, first alcoholic and then acetous”. Vinegar was first made from wine, as its name indicates, however, today it is a product of mash prepared from cereals or a wide varieties of fruits. It is a clear aqueous liquid, which may be colorless, with the color of its raw material, or additionally colored, with pH value of about 2.0-3.5, and enough level of acetic acid [3]. Vinegar has long been used worldwide as an additive in a wide variety of foods which it preserves due to the properties of acetic acid. However, recent research has shown that, in addition to its well-known anti-bacterial activity, vinegar when consumed as a drink, confers considerable health benefits and provide refreshment after exercise [4]. Therapeutic effects of vinegar arising from consuming the inherent bioactive components including acetic acid and phenolic compounds like gallic acid, catechin, ephicatechin, chlorogenic acid, caffeic acid, p-coumaric acid, and ferulic acid cause antioxidative, antidiabetic, antimicrobial, antitumor, antiobesity, antihypertensive, and cholesterol-lowering responses [5]. In the last decades there is a growing demand for fruit vinegars, which are sold as a health food [6]. Vinegar can be produced by different methods ranges from traditional employing wood casks and surface culture to submerged fermentation in acetators, and from various raw materials (apple, grape, orange, peach, pear, pineapple, apricot and banana, honey, rice, malted barley, etc.) [7]. Traditional methods include slow processing of raw material, while industrial quick processing. Traditionally obtained vinegar became as much as popular among the consumer, because of their green technology. Because vinegar is generally an inexpensive product, its production requires low-cost raw materials, such as sub-standard fruit and seasonal agricultural surpluses [8]. Some knowledge about the nutritional and health benefits as well as organoleptic 1Corresponding author: Ss. Cyril and Methodius University, Faculty of Technology and Metallurgy, Rudjer Boskovic 16, d1000 Skopje, R. Macedonia. [email protected] 2Faculty of Medical Science , University “Goce Delchev”, Krste Misirkov bb, 2000 Shtip, R.Macedonia
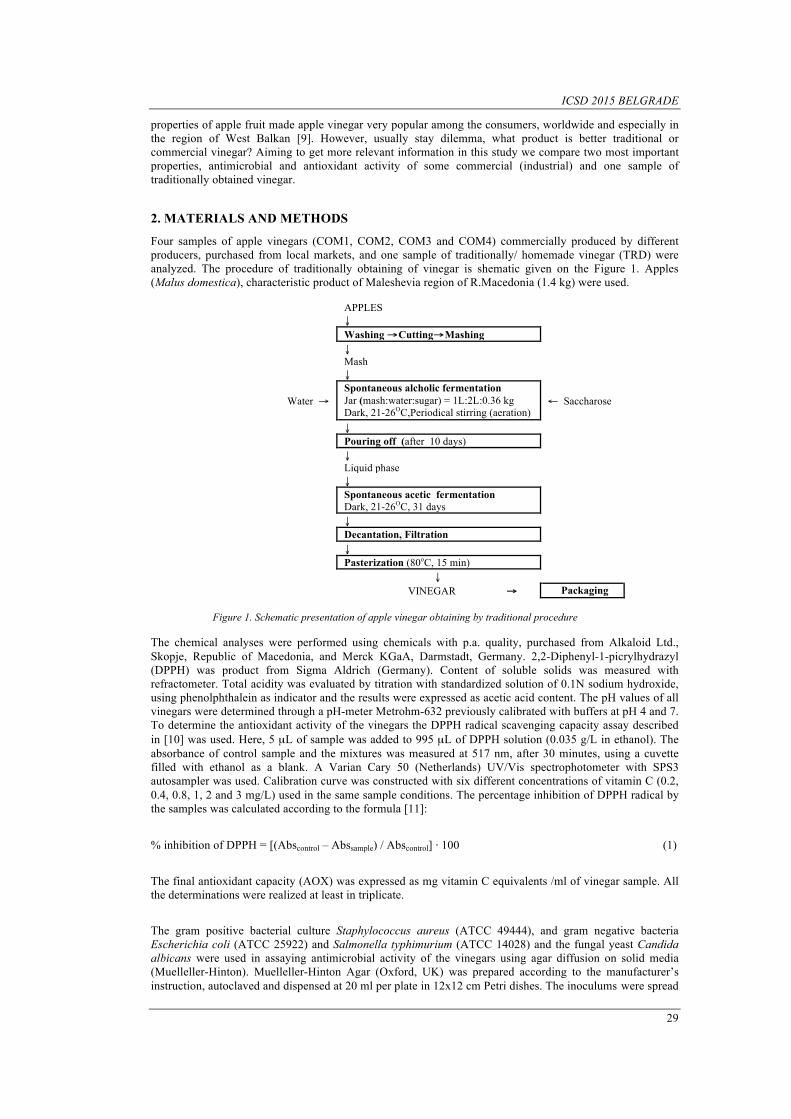
ICSD 2015 BELGRADE
29
properties of apple fruit made apple vinegar very popular among the consumers, worldwide and especially in the region of West Balkan [9]. However, usually stay dilemma, what product is better traditional or commercial vinegar? Aiming to get more relevant information in this study we compare two most important properties, antimicrobial and antioxidant activity of some commercial (industrial) and one sample of traditionally obtained vinegar. 2. MATERIALS AND METHODS
Four samples of apple vinegars (COM1, COM2, COM3 and COM4) commercially produced by different producers, purchased from local markets, and one sample of traditionally/ homemade vinegar (TRD) were analyzed. The procedure of traditionally obtaining of vinegar is shematic given on the Figure 1. Apples (Malus domestica), characteristic product of Maleshevia region of R.Macedonia (1.4 kg) were used.
APPLES ↓
Washing →Cutting→Mashing ↓ Mash ↓ Water →
Spontaneous alcholic fermentation Jar (mash:water:sugar) = 1L:2L:0.36 kg Dark, 21-26OC,Periodical stirring (aeration)
← Saccharose
↓ Pouring off (after 10 days) ↓ Liquid phase ↓ Spontaneous acetic fermentation
Dark, 21-26OC, 31 days
↓ Decantation, Filtration ↓ Pasterization (80oC, 15 min) ↓ VINEGAR → Packaging Figure 1. Schematic presentation of apple vinegar obtaining by traditional procedure
The chemical analyses were performed using chemicals with p.a. quality, purchased from Alkaloid Ltd., Skopje, Republic of Macedonia, and Merck KGaA, Darmstadt, Germany. 2,2-Diphenyl-1-picrylhydrazyl (DPPH) was product from Sigma Aldrich (Germany). Content of soluble solids was measured with refractometer. Total acidity was evaluated by titration with standardized solution of 0.1N sodium hydroxide, using phenolphthalein as indicator and the results were expressed as acetic acid content. The pH values of all vinegars were determined through a pH-meter Metrohm-632 previously calibrated with buffers at pH 4 and 7. To determine the antioxidant activity of the vinegars the DPPH radical scavenging capacity assay described in [10] was used. Here, 5 µL of sample was added to 995 µL of DPPH solution (0.035 g/L in ethanol). The absorbance of control sample and the mixtures was measured at 517 nm, after 30 minutes, using a cuvette filled with ethanol as a blank. A Varian Cary 50 (Netherlands) UV/Vis spectrophotometer with SPS3 autosampler was used. Calibration curve was constructed with six different concentrations of vitamin C (0.2, 0.4, 0.8, 1, 2 and 3 mg/L) used in the same sample conditions. The percentage inhibition of DPPH radical by the samples was calculated according to the formula [11]:
% inhibition of DPPH = [(Abscontrol – Abssample) / Abscontrol] ⋅ 100 (1)
The final antioxidant capacity (AOX) was expressed as mg vitamin C equivalents /ml of vinegar sample. All the determinations were realized at least in triplicate.
The gram positive bacterial culture Staphylococcus aureus (ATCC 49444), and gram negative bacteria Escherichia coli (ATCC 25922) and Salmonella typhimurium (ATCC 14028) and the fungal yeast Candida albicans were used in assaying antimicrobial activity of the vinegars using agar diffusion on solid media (Muelleller-Hinton). Muelleller-Hinton Agar (Oxford, UK) was prepared according to the manufacturer’s instruction, autoclaved and dispensed at 20 ml per plate in 12x12 cm Petri dishes. The inoculums were spread
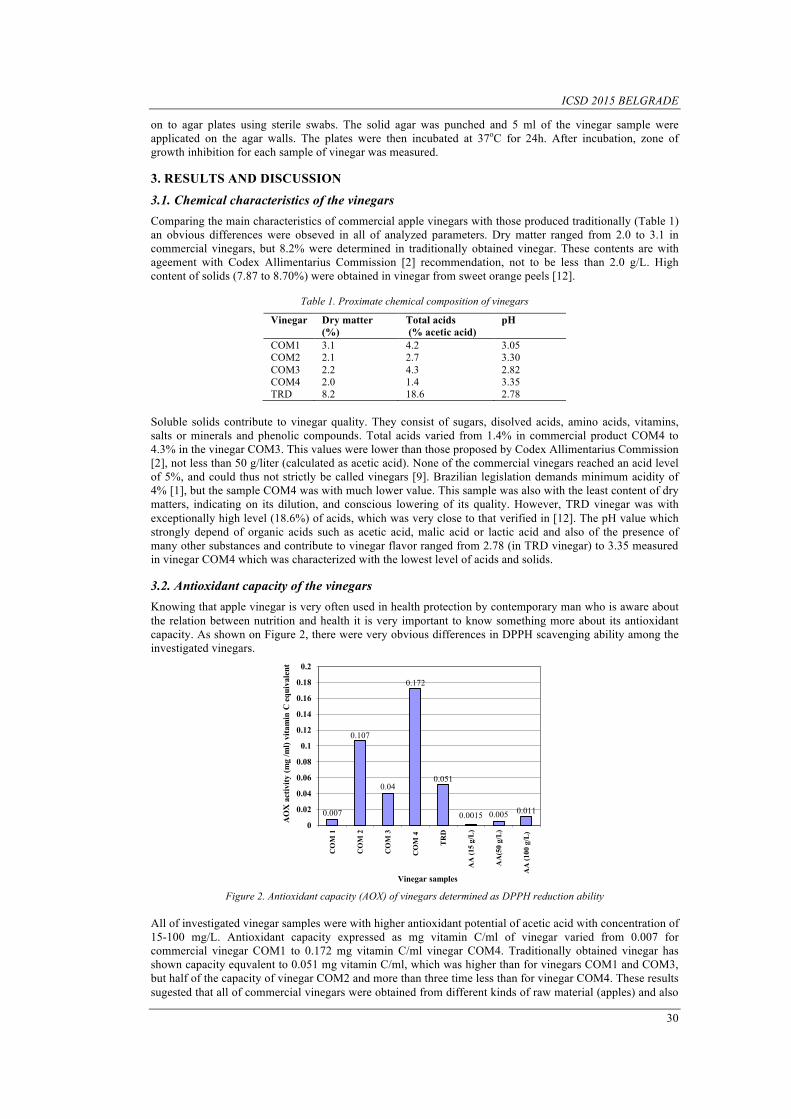
ICSD 2015 BELGRADE
30
on to agar plates using sterile swabs. The solid agar was punched and 5 ml of the vinegar sample were applicated on the agar walls. The plates were then incubated at 37oC for 24h. After incubation, zone of growth inhibition for each sample of vinegar was measured. 3. RESULTS AND DISCUSSION
3.1. Chemical characteristics of the vinegars
Comparing the main characteristics of commercial apple vinegars with those produced traditionally (Table 1) an obvious differences were obseved in all of analyzed parameters. Dry matter ranged from 2.0 to 3.1 in commercial vinegars, but 8.2% were determined in traditionally obtained vinegar. These contents are with ageement with Codex Allimentarius Commission [2] recommendation, not to be less than 2.0 g/L. High content of solids (7.87 to 8.70%) were obtained in vinegar from sweet orange peels [12].
Table 1. Proximate chemical composition of vinegars
Vinegar Dry matter (%)
Total acids (% acetic acid)
pH
COM1 3.1 4.2 3.05 COM2 2.1 2.7 3.30 COM3 2.2 4.3 2.82 COM4 2.0 1.4 3.35 TRD 8.2 18.6 2.78
Soluble solids contribute to vinegar quality. They consist of sugars, disolved acids, amino acids, vitamins, salts or minerals and phenolic compounds. Total acids varied from 1.4% in commercial product COM4 to 4.3% in the vinegar COM3. This values were lower than those proposed by Codex Allimentarius Commission [2], not less than 50 g/liter (calculated as acetic acid). None of the commercial vinegars reached an acid level of 5%, and could thus not strictly be called vinegars [9]. Brazilian legislation demands minimum acidity of 4% [1], but the sample COM4 was with much lower value. This sample was also with the least content of dry matters, indicating on its dilution, and conscious lowering of its quality. However, TRD vinegar was with exceptionally high level (18.6%) of acids, which was very close to that verified in [12]. The pH value which strongly depend of organic acids such as acetic acid, malic acid or lactic acid and also of the presence of many other substances and contribute to vinegar flavor ranged from 2.78 (in TRD vinegar) to 3.35 measured in vinegar COM4 which was characterized with the lowest level of acids and solids. 3.2. Antioxidant capacity of the vinegars
Knowing that apple vinegar is very often used in health protection by contemporary man who is aware about the relation between nutrition and health it is very important to know something more about its antioxidant capacity. As shown on Figure 2, there were very obvious differences in DPPH scavenging ability among the investigated vinegars.
Figure 2. Antioxidant capacity (AOX) of vinegars determined as DPPH reduction ability
All of investigated vinegar samples were with higher antioxidant potential of acetic acid with concentration of 15-100 mg/L. Antioxidant capacity expressed as mg vitamin C/ml of vinegar varied from 0.007 for commercial vinegar COM1 to 0.172 mg vitamin C/ml vinegar COM4. Traditionally obtained vinegar has shown capacity equvalent to 0.051 mg vitamin C/ml, which was higher than for vinegars COM1 and COM3, but half of the capacity of vinegar COM2 and more than three time less than for vinegar COM4. These results sugested that all of commercial vinegars were obtained from different kinds of raw material (apples) and also
0.007
0.107
0.04
0.172
0.051
0.0015 0.005 0.011
0
0.02
0.04
0.06
0.08
0.1
0.12
0.14
0.16
0.18
0.2
CO
M 1
CO
M 2
CO
M 3
CO
M 4
TRD
AA
(15
g/L
)
AA
(50
g/L)
AA
(100
g/L
)
AO
X a
ctiv
ity (m
g /m
l) vi
tam
in C
equ
ival
ent
Vinegar samples
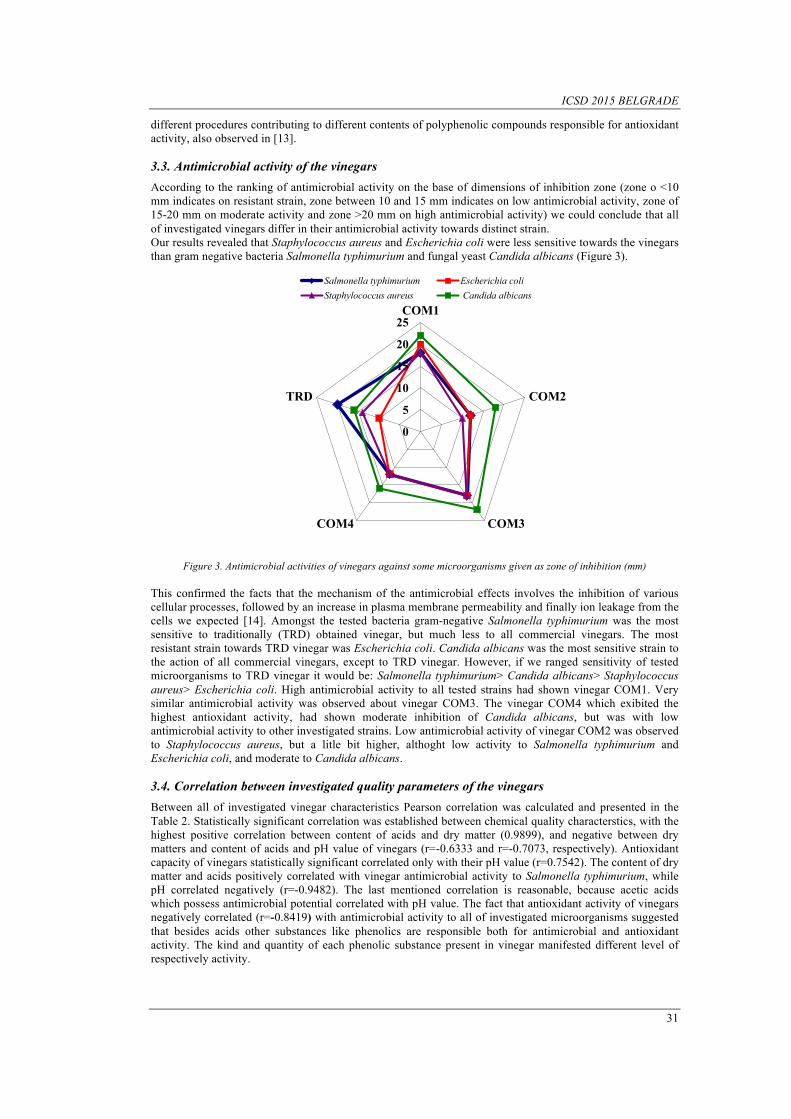
ICSD 2015 BELGRADE
31
different procedures contributing to different contents of polyphenolic compounds responsible for antioxidant activity, also observed in [13]. 3.3. Antimicrobial activity of the vinegars
According to the ranking of antimicrobial activity on the base of dimensions of inhibition zone (zone o <10 mm indicates on resistant strain, zone between 10 and 15 mm indicates on low antimicrobial activity, zone of 15-20 mm on moderate activity and zone >20 mm on high antimicrobial activity) we could conclude that all of investigated vinegars differ in their antimicrobial activity towards distinct strain. Our results revealed that Staphylococcus aureus and Escherichia coli were less sensitive towards the vinegars than gram negative bacteria Salmonella typhimurium and fungal yeast Candida albicans (Figure 3).
Figure 3. Antimicrobial activities of vinegars against some microorganisms given as zone of inhibition (mm)
This confirmed the facts that the mechanism of the antimicrobial effects involves the inhibition of various cellular processes, followed by an increase in plasma membrane permeability and finally ion leakage from the cells we expected [14]. Amongst the tested bacteria gram-negative Salmonella typhimurium was the most sensitive to traditionally (TRD) obtained vinegar, but much less to all commercial vinegars. The most resistant strain towards TRD vinegar was Escherichia coli. Candida albicans was the most sensitive strain to the action of all commercial vinegars, except to TRD vinegar. However, if we ranged sensitivity of tested microorganisms to TRD vinegar it would be: Salmonella typhimurium> Candida albicans> Staphylococcus aureus> Escherichia coli. High antimicrobial activity to all tested strains had shown vinegar COM1. Very similar antimicrobial activity was observed about vinegar COM3. The vinegar COM4 which exibited the highest antioxidant activity, had shown moderate inhibition of Candida albicans, but was with low antimicrobial activity to other investigated strains. Low antimicrobial activity of vinegar COM2 was observed to Staphylococcus aureus, but a litle bit higher, althoght low activity to Salmonella typhimurium and Escherichia coli, and moderate to Candida albicans. 3.4. Correlation between investigated quality parameters of the vinegars
Between all of investigated vinegar characteristics Pearson correlation was calculated and presented in the Table 2. Statistically significant correlation was established between chemical quality characterstics, with the highest positive correlation between content of acids and dry matter (0.9899), and negative between dry matters and content of acids and pH value of vinegars (r=-0.6333 and r=-0.7073, respectively). Antioxidant capacity of vinegars statistically significant correlated only with their pH value (r=0.7542). The content of dry matter and acids positively correlated with vinegar antimicrobial activity to Salmonella typhimurium, while pH correlated negatively (r=-0.9482). The last mentioned correlation is reasonable, because acetic acids which possess antimicrobial potential correlated with pH value. The fact that antioxidant activity of vinegars negatively correlated (r=-0.8419) with antimicrobial activity to all of investigated microorganisms suggested that besides acids other substances like phenolics are responsible both for antimicrobial and antioxidant activity. The kind and quantity of each phenolic substance present in vinegar manifested different level of respectively activity.
0
5
10
15
20
25COM1
COM2
COM3COM4
TRD
Salmonella typhimurium Escherichia coliStaphylococcus aureus Candida albicans
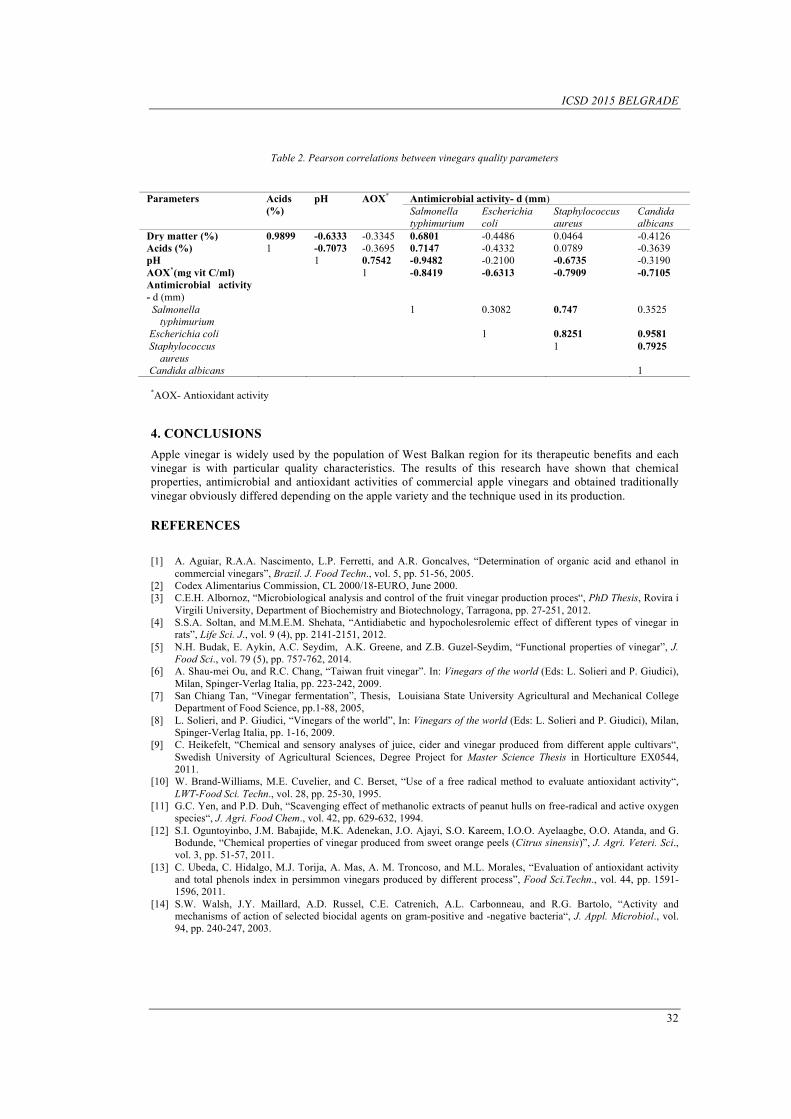
ICSD 2015 BELGRADE
32
Table 2. Pearson correlations between vinegars quality parameters
Parameters Acids (%)
pH AOX*
Antimicrobial activity- d (mm) Salmonella typhimurium
Escherichia coli
Staphylococcus aureus
Candida albicans
Dry matter (%) 0.9899 -0.6333 -0.3345 0.6801 -0.4486 0.0464 -0.4126 Acids (%) 1 -0.7073 -0.3695 0.7147 -0.4332 0.0789 -0.3639 pH 1 0.7542 -0.9482 -0.2100 -0.6735 -0.3190 AOX*(mg vit C/ml) 1 -0.8419 -0.6313 -0.7909 -0.7105 Antimicrobial activity - d (mm)
Salmonella typhimurium
1 0.3082 0.747 0.3525
Escherichia coli 1 0.8251 0.9581 Staphylococcus aureus
1 0.7925
Candida albicans 1
*AOX- Antioxidant activity 4. CONCLUSIONS
Apple vinegar is widely used by the population of West Balkan region for its therapeutic benefits and each vinegar is with particular quality characteristics. The results of this research have shown that chemical properties, antimicrobial and antioxidant activities of commercial apple vinegars and obtained traditionally vinegar obviously differed depending on the apple variety and the technique used in its production. REFERENCES
[1] A. Aguiar, R.A.A. Nascimento, L.P. Ferretti, and A.R. Goncalves, “Determination of organic acid and ethanol in commercial vinegars”, Brazil. J. Food Techn., vol. 5, pp. 51-56, 2005.
[2] Codex Alimentarius Commission, CL 2000/18-EURO, June 2000. [3] C.E.H. Albornoz, “Microbiological analysis and control of the fruit vinegar production proces“, PhD Thesis, Rovira i
Virgili University, Department of Biochemistry and Biotechnology, Tarragona, pp. 27-251, 2012. [4] S.S.A. Soltan, and M.M.E.M. Shehata, “Antidiabetic and hypocholesrolemic effect of different types of vinegar in
rats”, Life Sci. J., vol. 9 (4), pp. 2141-2151, 2012. [5] N.H. Budak, E. Aykin, A.C. Seydim, A.K. Greene, and Z.B. Guzel-Seydim, “Functional properties of vinegar”, J.
Food Sci., vol. 79 (5), pp. 757-762, 2014. [6] A. Shau-mei Ou, and R.C. Chang, “Taiwan fruit vinegar”. In: Vinegars of the world (Eds: L. Solieri and P. Giudici),
Milan, Spinger-Verlag Italia, pp. 223-242, 2009. [7] San Chiang Tan, “Vinegar fermentation”, Thesis, Louisiana State University Agricultural and Mechanical College
Department of Food Science, pp.1-88, 2005, [8] L. Solieri, and P. Giudici, “Vinegars of the world”, In: Vinegars of the world (Eds: L. Solieri and P. Giudici), Milan,
Spinger-Verlag Italia, pp. 1-16, 2009. [9] C. Heikefelt, “Chemical and sensory analyses of juice, cider and vinegar produced from different apple cultivars“,
Swedish University of Agricultural Sciences, Degree Project for Master Science Thesis in Horticulture EX0544, 2011.
[10] W. Brand-Williams, M.E. Cuvelier, and C. Berset, “Use of a free radical method to evaluate antioxidant activity“, LWT-Food Sci. Techn., vol. 28, pp. 25-30, 1995.
[11] G.C. Yen, and P.D. Duh, “Scavenging effect of methanolic extracts of peanut hulls on free-radical and active oxygen species“, J. Agri. Food Chem., vol. 42, pp. 629-632, 1994.
[12] S.I. Oguntoyinbo, J.M. Babajide, M.K. Adenekan, J.O. Ajayi, S.O. Kareem, I.O.O. Ayelaagbe, O.O. Atanda, and G. Bodunde, “Chemical properties of vinegar produced from sweet orange peels (Citrus sinensis)”, J. Agri. Veteri. Sci., vol. 3, pp. 51-57, 2011.
[13] C. Ubeda, C. Hidalgo, M.J. Torija, A. Mas, A. M. Troncoso, and M.L. Morales, “Evaluation of antioxidant activity and total phenols index in persimmon vinegars produced by different process”, Food Sci.Techn., vol. 44, pp. 1591-1596, 2011.
[14] S.W. Walsh, J.Y. Maillard, A.D. Russel, C.E. Catrenich, A.L. Carbonneau, and R.G. Bartolo, “Activity and mechanisms of action of selected biocidal agents on gram-positive and -negative bacteria“, J. Appl. Microbiol., vol. 94, pp. 240-247, 2003.
ICSD 2015 BELGRADE
33
Management Status: Water Quality and Ecological Dynamics of the Dam Lake
Didem Gökçe1
Abstract In Karakaya Dam Lake, on the upper Euphrates River, freshwater flux through the dam lakes takes place through a main channel. Aim of water quality monitoring and management is to define the physical, chemical, and biological characteristics of natural waters. Water quality monitoring is used to determine important features. These features are physical and chemical characteristics of water for a period of time, and changes in the properties of water over the course of time for multiple monitoring cases The results of the comparison made between water quality and phytoplankton community structure in this study may be used for long-term sustainable water resource monitoring and management. Biological assessment data are important for measuring the attainment of water quality standards to management the basin of Karakaya Dam Lake in the future. Data of this study is important to provide a conceptual framework for monitoring the progress in accordance with water policy objectives at an international scale in the basin of transboundary upper Euphrates River. Phosphorus, nitrogen and chlorophyll levels determined water quality and trophic status. Especially Cyanobacteria abundance in the phytoplankton and macroinvertebrate composition is an important for trophic level. By comparing these phytoplankton trends with other measurements, such as temperature, further studies can be conducted about how phytoplankton may be contributing to, and affected by climatic and environmental changes. In conclusion, phytoplankton is increasingly used to monitor the ecological quality and health of the water environment, and also to measure the effectiveness of management or restoration programs, or regulatory actions.
Keywords: Indicator, Karakaya, Monitoring, Plankton, Sustainable, Trophy.
1. INTRODUCTION
Turkey is a country which is extremely important in terms of hydro-strategic between Europe and Asia. Water resources development projects are of the most importance for the fulfillment of the development goals of the country.
Turkey is not a water-rich country; currently water consumption per capita is about 1700 m3/year and this figure is estimated to fall below 1000 m3/year by the year 2025, indicating that Turkey will become a water-deficit country in the future and will face serious water problems. Turkey’s territory, considering the hydrological conditions of the country, is divided into 26 drainage basins. Rivers have generally irregular regimes and natural flows cannot be taken directly as usable resources. Increasing demand for water as a result of increasing population and development industrialization leads to increased stress on water resources.
As a result, knowledge of the physical, chemical and biological characteristics of impacted ecosystems is extremely important [1]. Physical and chemical analyses provide information on water conditions at the moment the measurements are taken, making them critical when the object under study is a lotic system, in which the water is continually renewed at each point; however, periodic measurements over a considerable time frame significantly increase the information value of physical and chemical methods [1, 2]. Biological analyses can detect possible alterations in water quality, as well as the tendencies over time that are reflected in habitat changes or the nature of aquatic organisms.
Of primary significance from an ecological and environmental quality perspective is the abundance of nutrients containing nitrogen (N) and phosphorus (P) that flow into lakes, reservoirs, streams and rivers 1Corresponding author: Inonu University, Department of Biology, 44280, Campus/Malatya, Turkey. [email protected]
ICSD 2015 BELGRADE
34
resulting in eutrophic conditions. The N: P ratio often determines which algae genera are dominant, present or absent in these nutrient affected water bodies [3, 4]. Sources of the inorganic compounds that contain these elements include household laundry detergents, commercial fertilizers used for meadows and agriculture, and organic pollution from domestic uses.
Lakes and reservoirs that receive these sources of pollution periodically, or chronically, display high densities of algae growth resulting in blooms of nuisance and/or toxin producing genera.
A well-documented auto-ecology and the study of biotic communities, their distribution, species abundance in determinate sampling areas, are important factors to take into account for indicating water quality. Among biotic communities, algae are recommended for water quality assessment, since they have diverse spatial and temporal distribution [5, 6, 7]. Phytoplankton consists of a large variety of algae with different forms and life history strategies to maximize productivity.
When reservoirs and lakes become more eutrophicated, the diversity of phytoplankton composition gradually decreases, which leads ultimately to cyanobacteria dominance and toxin production [7]. In recent years, community ecology has been viewed from the ecological complexity theme, which includes spatial and temporal complexities of biological species. Both are considered important pillars in the understanding of distribution over space and time [8]. Long-term dominance of cyanobacteria species is related to the increased productivity of shallow lakes, whereas colonial species generally dominate in deeper lakes and interfere in the pattern of phytoplankton distribution [9, 10].
It is known that temporal and spatial distribution of phytoplankton abundance is one of the important parameters to monitoring of water quality. The aim of study, phytoplankton composition was used for determination of ecological dynamics of Karakaya Dam Lake and its monitoring. Zooplankton and benthic macroinvertebrate community structures were supported this study.
2. MATERIAL AND METHODS
2.1. Study Area
The Euphrates River, which has the largest drainage basin in Turkey, is formed by four tributaries. The Karakaya Dam and HEPP project is one of the important projects of the Southeastern Anatolian Project (GAP) Karakaya Dam and HEPP project is the second biggest project on Euphrates river basin, after Ataturk Dam and HEPP, within the framework of GAP. The Karakaya Dam is a single purpose project for power generation; the average annual energy generation is 7354 GWh. It is located on the main stem of the Euphrates River about 163 km downstream of the Keban Dam (Fig. 1).
The effects of environmental factors on the composition and structure of plankton and benthic invertebrate communities in the Karakaya Dam Lake were investigated. Six sampling points were selected and samplings were taken monthly. In every sampling period, the physical-chemical parameters of water were measured vertically.
2.2. Sampling and Analyses
The Water samples were collected from six stations (Fig.1) at vertically depths. The sampling sites were chosen to cover eco-trophic structure. A Ruttner sampler (Hydro-Bios, 2 L) was used to collect water samples at 5-m intervals in the water column, at each station. Collected samples were immediately stored in a dark ice-box. Back at the laboratory (in the same day with sampling) the water samples were filtered under vacuum using Whatman GF/C glass-fiber filters chemical analyses.
Water temperature (T) and dissolved oxygen (DO) were measured by a pre-calibrated dissolved oxygen meter, YSI-55. pH was measured with using a YSI-60. Specific electrical conductivity (EC25) was measured by YSI-30. Transparency was estimated by employing a white, 30 cm diameter, Secchi disc (Hydro-Bios).
All nutrients were measured with a spectrophotometer. Ammonium (NH4-N; DIN38 406-E5–1 standard method), nitrite (NO2-N; DIN38 405-D10 standard method), nitrate (NO3-N; DIN38 405-D9-2 standard method) and soluble reactive phosphate (SRP; DIN38 405-D11-1 standard method) were analyzed [11, 12, 13].

ICSD 2015 BELGRADE
35
Figure 1. Map of the Karakaya Dam Lake and sampling sites
Subsurface phytoplankton and zooplankton samples were captured by filtering 100 L of subsurface water through Hydro-Bios plankton nets (20 and 55-µm pore-size respectively). Immediately phytoplankton samples fixed in lugol’s iodine solution and zooplankton samples preserved in 4% formalin [12, 13] macroinvertebrate species were collected from the top layer (10 cm) of the sediment in the lake by Eckman grab. Macroinvertebrates in the lake were sampled in triplicates per sampling point for faunal analysis. Each core was carefully sieved (mesh sized 500 µm) and preserved in 85% alcohol [14].
The Shannon-Weaver diversity index (H´) and dominance were calculated using biotic taxa community parameters and species changes in the sampling stations.
3. RESULTS AND DıSCUSSıON METHODS
3.1. Water Quality Variables
Nitrogen (NO3-N, NO2-N and NH4-N) and SRP, which are the main nutrient as their limiting influence on aquatic organisms, were determined as water quality criteria. These nutrients were seen at low concentration, especially in the surface water. NO3-N values were measured to be 0.001- 0.304 mg L-1 (in June and October), NO2-N values as 0.003-0.032 mg L-1 (in April, July and February) and NH4-N values as 0.004-0.105 mg L-1 (in July and October).
pH value is alkali level which was found to be at a high level of alkali (pH 7.55- 9.24 in st.1,winter and st.2, summer, respectively). DO amount was observed to be high in every season (6.944 mgL-1 in st.3, summer – 11.516 mgL-1 in st.1, spring). On the other side, DO values in the surface layers were high, declined rapidly at bottom, and reached extremely low values of DO as anoxic level (2.68 and 1.31 mgL-1) at st. 4 in July and September.
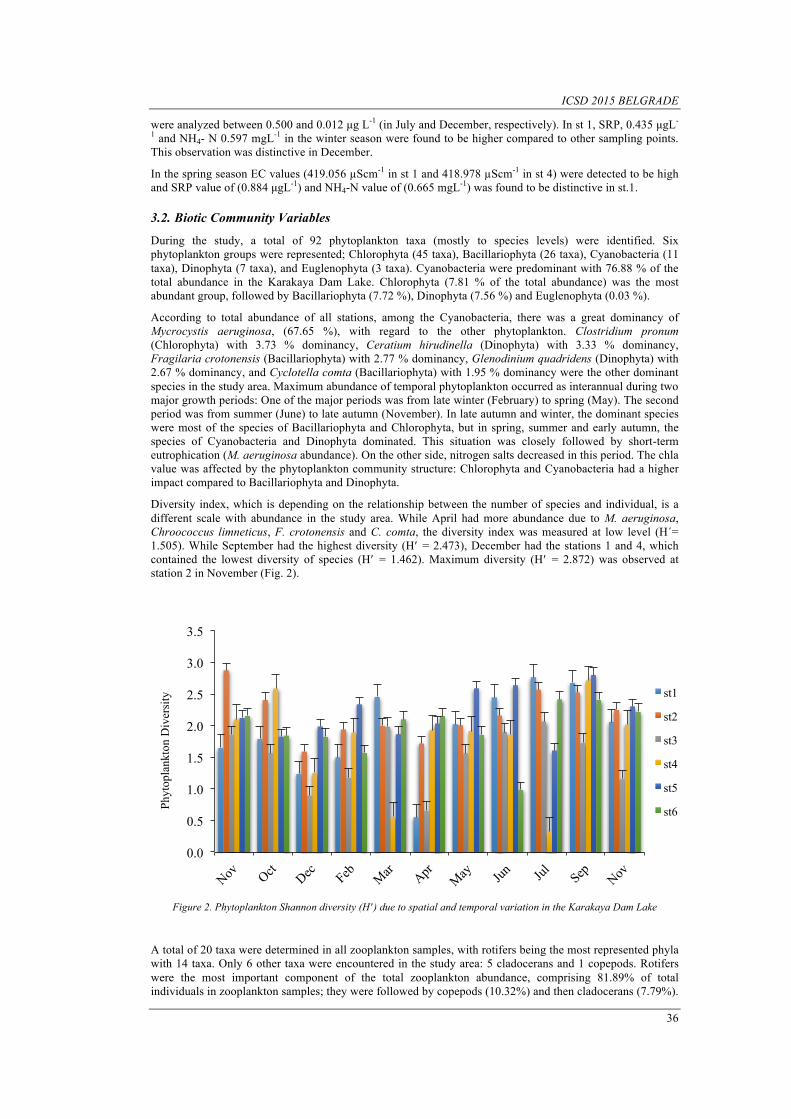
ICSD 2015 BELGRADE
36
were analyzed between 0.500 and 0.012 µg L-1 (in July and December, respectively). In st 1, SRP, 0.435 µgL-
1 and NH4- N 0.597 mgL-1 in the winter season were found to be higher compared to other sampling points. This observation was distinctive in December.
In the spring season EC values (419.056 µScm-1 in st 1 and 418.978 µScm-1 in st 4) were detected to be high and SRP value of (0.884 µgL-1) and NH4-N value of (0.665 mgL-1) was found to be distinctive in st.1.
3.2. Biotic Community Variables
During the study, a total of 92 phytoplankton taxa (mostly to species levels) were identified. Six phytoplankton groups were represented; Chlorophyta (45 taxa), Bacillariophyta (26 taxa), Cyanobacteria (11 taxa), Dinophyta (7 taxa), and Euglenophyta (3 taxa). Cyanobacteria were predominant with 76.88 % of the total abundance in the Karakaya Dam Lake. Chlorophyta (7.81 % of the total abundance) was the most abundant group, followed by Bacillariophyta (7.72 %), Dinophyta (7.56 %) and Euglenophyta (0.03 %).
According to total abundance of all stations, among the Cyanobacteria, there was a great dominancy of Mycrocystis aeruginosa, (67.65 %), with regard to the other phytoplankton. Clostridium pronum (Chlorophyta) with 3.73 % dominancy, Ceratium hirudinella (Dinophyta) with 3.33 % dominancy, Fragilaria crotonensis (Bacillariophyta) with 2.77 % dominancy, Glenodinium quadridens (Dinophyta) with 2.67 % dominancy, and Cyclotella comta (Bacillariophyta) with 1.95 % dominancy were the other dominant species in the study area. Maximum abundance of temporal phytoplankton occurred as interannual during two major growth periods: One of the major periods was from late winter (February) to spring (May). The second period was from summer (June) to late autumn (November). In late autumn and winter, the dominant species were most of the species of Bacillariophyta and Chlorophyta, but in spring, summer and early autumn, the species of Cyanobacteria and Dinophyta dominated. This situation was closely followed by short-term eutrophication (M. aeruginosa abundance). On the other side, nitrogen salts decreased in this period. The chla value was affected by the phytoplankton community structure: Chlorophyta and Cyanobacteria had a higher impact compared to Bacillariophyta and Dinophyta.
Diversity index, which is depending on the relationship between the number of species and individual, is a different scale with abundance in the study area. While April had more abundance due to M. aeruginosa, Chroococcus limneticus, F. crotonensis and C. comta, the diversity index was measured at low level (H´= 1.505). While September had the highest diversity (Hʹ = 2.473), December had the stations 1 and 4, which contained the lowest diversity of species (Hʹ = 1.462). Maximum diversity (Hʹ = 2.872) was observed at station 2 in November (Fig. 2).
Figure 2. Phytoplankton Shannon diversity (Hʹ ) due to spatial and temporal variation in the Karakaya Dam Lake
A total of 20 taxa were determined in all zooplankton samples, with rotifers being the most represented phyla with 14 taxa. Only 6 other taxa were encountered in the study area: 5 cladocerans and 1 copepods. Rotifers were the most important component of the total zooplankton abundance, comprising 81.89% of total individuals in zooplankton samples; they were followed by copepods (10.32%) and then cladocerans (7.79%).
0.0
0.5
1.0
1.5
2.0
2.5
3.0
3.5
Phyt
opla
nkto
n D
iver
sity
st1
st2
st3
st4
st5
st6
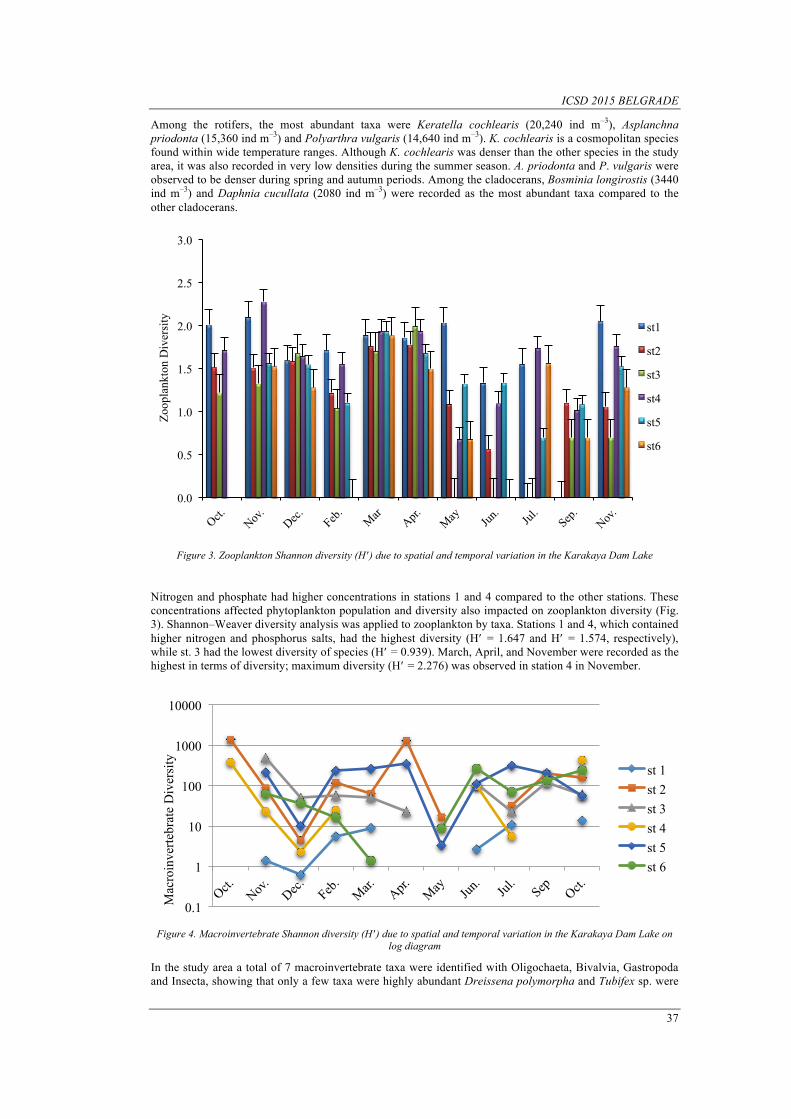
ICSD 2015 BELGRADE
37
Among the rotifers, the most abundant taxa were Keratella cochlearis (20,240 ind m–3), Asplanchna priodonta (15,360 ind m–3) and Polyarthra vulgaris (14,640 ind m–3). K. cochlearis is a cosmopolitan species found within wide temperature ranges. Although K. cochlearis was denser than the other species in the study area, it was also recorded in very low densities during the summer season. A. priodonta and P. vulgaris were observed to be denser during spring and autumn periods. Among the cladocerans, Bosminia longirostis (3440 ind m–3) and Daphnia cucullata (2080 ind m–3) were recorded as the most abundant taxa compared to the other cladocerans.
Figure 3. Zooplankton Shannon diversity (Hʹ ) due to spatial and temporal variation in the Karakaya Dam Lake
Nitrogen and phosphate had higher concentrations in stations 1 and 4 compared to the other stations. These concentrations affected phytoplankton population and diversity also impacted on zooplankton diversity (Fig. 3). Shannon–Weaver diversity analysis was applied to zooplankton by taxa. Stations 1 and 4, which contained higher nitrogen and phosphorus salts, had the highest diversity (Hʹ = 1.647 and Hʹ = 1.574, respectively), while st. 3 had the lowest diversity of species (Hʹ = 0.939). March, April, and November were recorded as the highest in terms of diversity; maximum diversity (Hʹ = 2.276) was observed in station 4 in November.
Figure 4. Macroinvertebrate Shannon diversity (Hʹ ) due to spatial and temporal variation in the Karakaya Dam Lake on
log diagram
In the study area a total of 7 macroinvertebrate taxa were identified with Oligochaeta, Bivalvia, Gastropoda and Insecta, showing that only a few taxa were highly abundant Dreissena polymorpha and Tubifex sp. were
0.1
1
10
100
1000
10000
Mac
roin
verte
brat
e D
iver
sity
st 1 st 2 st 3 st 4 st 5 st 6
0.0
0.5
1.0
1.5
2.0
2.5
3.0
st1
st2
st3
st4
st5
st6
Zoop
lank
ton
Div
ersi
ty
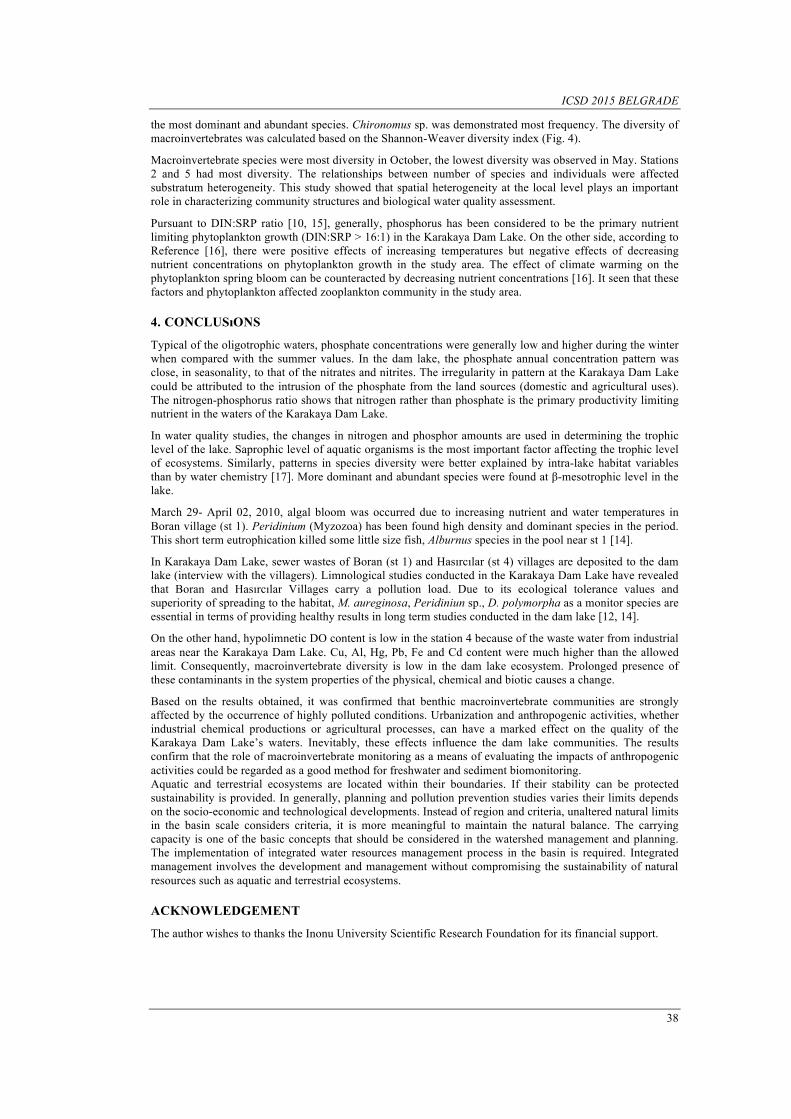
ICSD 2015 BELGRADE
38
the most dominant and abundant species. Chironomus sp. was demonstrated most frequency. The diversity of macroinvertebrates was calculated based on the Shannon-Weaver diversity index (Fig. 4).
Macroinvertebrate species were most diversity in October, the lowest diversity was observed in May. Stations 2 and 5 had most diversity. The relationships between number of species and individuals were affected substratum heterogeneity. This study showed that spatial heterogeneity at the local level plays an important role in characterizing community structures and biological water quality assessment.
Pursuant to DIN:SRP ratio [10, 15], generally, phosphorus has been considered to be the primary nutrient limiting phytoplankton growth (DIN:SRP > 16:1) in the Karakaya Dam Lake. On the other side, according to Reference [16], there were positive effects of increasing temperatures but negative effects of decreasing nutrient concentrations on phytoplankton growth in the study area. The effect of climate warming on the phytoplankton spring bloom can be counteracted by decreasing nutrient concentrations [16]. It seen that these factors and phytoplankton affected zooplankton community in the study area.
4. CONCLUSıONS
Typical of the oligotrophic waters, phosphate concentrations were generally low and higher during the winter when compared with the summer values. In the dam lake, the phosphate annual concentration pattern was close, in seasonality, to that of the nitrates and nitrites. The irregularity in pattern at the Karakaya Dam Lake could be attributed to the intrusion of the phosphate from the land sources (domestic and agricultural uses). The nitrogen-phosphorus ratio shows that nitrogen rather than phosphate is the primary productivity limiting nutrient in the waters of the Karakaya Dam Lake.
In water quality studies, the changes in nitrogen and phosphor amounts are used in determining the trophic level of the lake. Saprophic level of aquatic organisms is the most important factor affecting the trophic level of ecosystems. Similarly, patterns in species diversity were better explained by intra-lake habitat variables than by water chemistry [17]. More dominant and abundant species were found at β-mesotrophic level in the lake.
March 29- April 02, 2010, algal bloom was occurred due to increasing nutrient and water temperatures in Boran village (st 1). Peridinium (Myzozoa) has been found high density and dominant species in the period. This short term eutrophication killed some little size fish, Alburnus species in the pool near st 1 [14].
In Karakaya Dam Lake, sewer wastes of Boran (st 1) and Hasırcılar (st 4) villages are deposited to the dam lake (interview with the villagers). Limnological studies conducted in the Karakaya Dam Lake have revealed that Boran and Hasırcılar Villages carry a pollution load. Due to its ecological tolerance values and superiority of spreading to the habitat, M. aureginosa, Peridiniun sp., D. polymorpha as a monitor species are essential in terms of providing healthy results in long term studies conducted in the dam lake [12, 14].
On the other hand, hypolimnetic DO content is low in the station 4 because of the waste water from industrial areas near the Karakaya Dam Lake. Cu, Al, Hg, Pb, Fe and Cd content were much higher than the allowed limit. Consequently, macroinvertebrate diversity is low in the dam lake ecosystem. Prolonged presence of these contaminants in the system properties of the physical, chemical and biotic causes a change.
Based on the results obtained, it was confirmed that benthic macroinvertebrate communities are strongly affected by the occurrence of highly polluted conditions. Urbanization and anthropogenic activities, whether industrial chemical productions or agricultural processes, can have a marked effect on the quality of the Karakaya Dam Lake’s waters. Inevitably, these effects influence the dam lake communities. The results confirm that the role of macroinvertebrate monitoring as a means of evaluating the impacts of anthropogenic activities could be regarded as a good method for freshwater and sediment biomonitoring. Aquatic and terrestrial ecosystems are located within their boundaries. If their stability can be protected sustainability is provided. In generally, planning and pollution prevention studies varies their limits depends on the socio-economic and technological developments. Instead of region and criteria, unaltered natural limits in the basin scale considers criteria, it is more meaningful to maintain the natural balance. The carrying capacity is one of the basic concepts that should be considered in the watershed management and planning. The implementation of integrated water resources management process in the basin is required. Integrated management involves the development and management without compromising the sustainability of natural resources such as aquatic and terrestrial ecosystems.
ACKNOWLEDGEMENT
The author wishes to thanks the Inonu University Scientific Research Foundation for its financial support.

ICSD 2015 BELGRADE
39
REFERENCES [1]. N.T. Chellappa, F.R.A. Câmara and O. Rocha, “Phytoplankton community: indicator of water quality in the
Armando Ribeiro Gonçalves Reservoir and Pataxó Channel, Rio Grande do Norte, Brazil”, Braz. J. Biol., vol. 69(2), pp. 241-251, 2009.
[2]. T Nhiwatiwa. and B.E. Marshall, “Water quality and plankton dynamics in two small reservoirs”. African J. Aqua.Sci. vol. 32(2), pp.139– 151, 2007.
[3]. A.C. Redfıeld, “The biological control of chemical factors in the environment”. American Sci. vol. 46, pp. 205-212, 1958.
[4]. L. Ye,. and Q.Cai, “Spring phytoplankton blooms in Xiangxi Bay of Three-Gorges Reservoir: spatiotemporal dynamics across sharp nutrient gradients”, J. Freshwater Ecol, vol. 26(1), pp. 11-22, 2011.
[5]. D. F Burger,.D. P. Hamilton and C. A. Pilditch, “Modelling the relative importance of internal and external nutrient loads on water column nutrient concentrations and phytoplankton biomass in a shallow polymictic lake”. Ecol. Model, vol. 211, pp. 411–423, 2008.
[6]. K. D. Hambright, W. Eckert, P. R. Leavitt and C. L. Schelske, “Effects of historical lake level and land use on sediment and phosphorus accumulation rates in Lake Kinneret”, Environ. Sci. Technol., vol. 38, pp. 6460–6467, 2004.
[7]. W. S Chan, F. Recknagel, H. Cao and H. D. Park, “Elucidation and short-term forecasting of microcystin concentrations in Lake Suwa (Japan) by means of artificial neural networks and evolutionary algorithms”, Water Res., vol. 41 pp. 2247–2255, 2007.
[8]. C. Loehle, 2004, “Challenges of ecological complexity”, Ecol. Comp., vol. 1, p. 3-6, 2004. [9]. M. Albay. and R. Akçaalan, “Factors influencing the phytoplankton steady-state assemblages in a drinking water
reservoir (Ömerli Reservoir, İstanbul)”, Hydrobiologia, vol. 502, pp. 85- 95, 2003. [10]. C.S. Reynolds, “The scales of the disturbance and their role in plankton ecology”, Hydrobiologia, vol. 249, p. 157�
171, 1993. [11]. E. Merck, The Testing of Water. Merck (Darmstadt, Allemagne, Firm), Darmstadt, pp. 224, 1974. [12]. D. Gokce “Variations of phytoplankton community structure related to water quality in the deep dam lake”, Fresen.
Environ. Bul., vol. 23, p. 1407-1417, 2014. [13]. D. Gökçe and D. Özhan-Turhan, “Evaluation of vertical and horizontal changes in community of zooplankton in the
deep dam lake”, Turkish J. Zool., vol. 38, pp. 11- 22, 2014. [14]. D. Gokce. and D. Ozhan, “Limno-ecological properties of deep reservoir, Karakaya HEPP, Turkey” GU. J. Sci., vol.
24, pp. 663-669, 2011. [15]. C. Tian, X. Lu, H. Pei, W. Hu and J. Xie, “Seasonal dynamics of phytoplankton and its relationship with the
environmental factors in Dongping Lake, China” Environ. Monitor. Asses., vol. 185, pp. 2627- 2645, 2013. [16]. W. M. Mooij, J. H. Janse, L. N. De Senerpont Domis, S. Hülsmann and B. W. Ibelings, “Predicting the effect of
climate change on temperate shallow lakes with the ecosystem model PCLake”, Hydrobiologia vol. 584, pp. 443–454, 2007.
[17]. W. M. Mooij,. D. Trolle, E. Jeppesen, G. Arhonditsis, P.V. Belolipetsky, D. B. R. Chitamwebwa, A. G. Degermendzhy, D. L. De Angelis, L. N. De Senerpont Domis, A. S. Downing, J. A. Elliott, C. R. Fragoso Jr, U. Gaedke, S. N. Genova, R. D. Gulati, L. Ha°kanson, D. P. Hamilton, M. R. Hipsey, J. Hoen, S. Hu¨lsmann, F. H. Los, V. Makler- Pick, T. Petzoldt, I. G. Prokopkin, K. Rinke, S. A. Schep, K. Tominaga, A. A. Van Dam, E. H. Van Nes, S. A. Wells and J. H. Janse, “Challenges and opportunities for integrating lake ecosystem modelling approaches”, Aqua. Ecol., vol. 44 pp. 633–667, 2010.
ICSD 2015 BELGRADE
40
A Surrogate Model for the Operation Cost of City to City Commuter Airline Service for
Sustainable Regional Aviation Alperen Yıllıkçı1
Abstract
In this study a surrogate model based Operation Cost and Feasibility (OCF) analysis is introduced for the regional commuter airline operation economics. For an integrated economic, social and cultural sustainable development, direct city to city air travel has been accepted as an important fast and flexible mode of transportation. On the other hand, route networks of existing airlines are mostly constructed between major hubs and hub spoke cities and airlines usually pick profitable routes and cancel money-losing ones. In present study operational economics of city to city air travel with commuter aircraft is studied with a reversed approach; the least number of passengers for possible lowest cost per passenger is considered rather than a conventional break-even Load Factor for pre-selected aircraft for a network routes. In other words, costs of travel for per passenger on each selected route are calculated instead of break-even number of passenger. On Overall Evaluation Criteria for Costs (OECC) is defined for a collective-cumulative cost per passenger for a given network as the function of the output variables of the airline operational cost analysis. As the next step Design of Experiments (DoE) is constructed for the input cost variables with their maximum and minimum values. One output of this DoE analysis is the Pareto Chart which ranks the input variables in terms of their effect on the defined OECC. Response Surface for the OECC is the Surrogate Model (SM) of the operational cost. Several examples for different OECC and their corresponding SMs, which represent different cost versus profit dynamics, are presented.
Keywords: Airline Operation Cost, Design of Experiments, Response Surface.
1. INTRODUCTION
Few inventions have changed how people live and experience the world as much as the invention of the airplane. During both World Wars, government subsidies and demands for new airplanes vastly improved techniques for their design and construction. Following the World War II, the first commercial airplane routes were set up in Europe. Over time, air travel has become so commonplace that it would be hard to imagine life without it. The airline industry, therefore, certainly has progressed. It has also altered the way in which people live and conduct business by shortening travel time and altering our concept of distance, making it possible for us to visit and conduct business in places once considered remote. The airline industry exists in an intensely competitive market. In recent years, there has been an industry-wide shakedown, which will have far-reaching effects on the industry's trend towards expanding domestic and international services. In the past, the airline industry was at least partly government owned. The airline industry can be separated into four categories by the U.S. Department of Transportation (DOT):
• International - 130+ seat planes that have the ability to take passengers just about anywhere in the world. Companies in this category typically have annual revenue of $1 billion or more;
• National - Usually these airlines seat 100-150 people and have revenues between $100 million and $1 billion.;
• Regional - Companies with revenues less than $100 million that focus on short-haul flights; • Cargo - These are airlines generally transport goods. 1Corresponding author: Istanbul Technical University, Aeromak, Technology Center, Maslak/İstanbul, Turkey. [email protected]
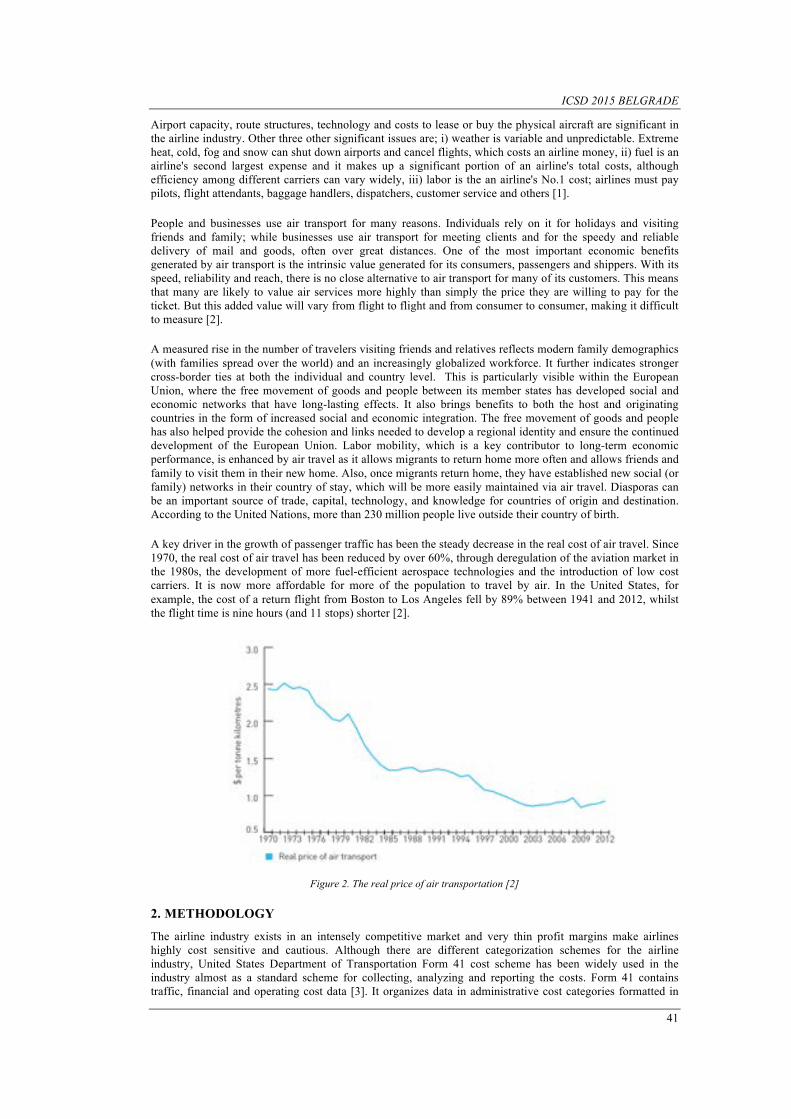
ICSD 2015 BELGRADE
41
Airport capacity, route structures, technology and costs to lease or buy the physical aircraft are significant in the airline industry. Other three other significant issues are; i) weather is variable and unpredictable. Extreme heat, cold, fog and snow can shut down airports and cancel flights, which costs an airline money, ii) fuel is an airline's second largest expense and it makes up a significant portion of an airline's total costs, although efficiency among different carriers can vary widely, iii) labor is the an airline's No.1 cost; airlines must pay pilots, flight attendants, baggage handlers, dispatchers, customer service and others [1].
People and businesses use air transport for many reasons. Individuals rely on it for holidays and visiting friends and family; while businesses use air transport for meeting clients and for the speedy and reliable delivery of mail and goods, often over great distances. One of the most important economic benefits generated by air transport is the intrinsic value generated for its consumers, passengers and shippers. With its speed, reliability and reach, there is no close alternative to air transport for many of its customers. This means that many are likely to value air services more highly than simply the price they are willing to pay for the ticket. But this added value will vary from flight to flight and from consumer to consumer, making it difficult to measure [2].
A measured rise in the number of travelers visiting friends and relatives reflects modern family demographics (with families spread over the world) and an increasingly globalized workforce. It further indicates stronger cross-border ties at both the individual and country level. This is particularly visible within the European Union, where the free movement of goods and people between its member states has developed social and economic networks that have long-lasting effects. It also brings benefits to both the host and originating countries in the form of increased social and economic integration. The free movement of goods and people has also helped provide the cohesion and links needed to develop a regional identity and ensure the continued development of the European Union. Labor mobility, which is a key contributor to long-term economic performance, is enhanced by air travel as it allows migrants to return home more often and allows friends and family to visit them in their new home. Also, once migrants return home, they have established new social (or family) networks in their country of stay, which will be more easily maintained via air travel. Diasporas can be an important source of trade, capital, technology, and knowledge for countries of origin and destination. According to the United Nations, more than 230 million people live outside their country of birth.
A key driver in the growth of passenger traffic has been the steady decrease in the real cost of air travel. Since 1970, the real cost of air travel has been reduced by over 60%, through deregulation of the aviation market in the 1980s, the development of more fuel-efficient aerospace technologies and the introduction of low cost carriers. It is now more affordable for more of the population to travel by air. In the United States, for example, the cost of a return flight from Boston to Los Angeles fell by 89% between 1941 and 2012, whilst the flight time is nine hours (and 11 stops) shorter [2].
Figure 2. The real price of air transportation [2]
2. METHODOLOGY
The airline industry exists in an intensely competitive market and very thin profit margins make airlines highly cost sensitive and cautious. Although there are different categorization schemes for the airline industry, United States Department of Transportation Form 41 cost scheme has been widely used in the industry almost as a standard scheme for collecting, analyzing and reporting the costs. Form 41 contains traffic, financial and operating cost data [3]. It organizes data in administrative cost categories formatted in
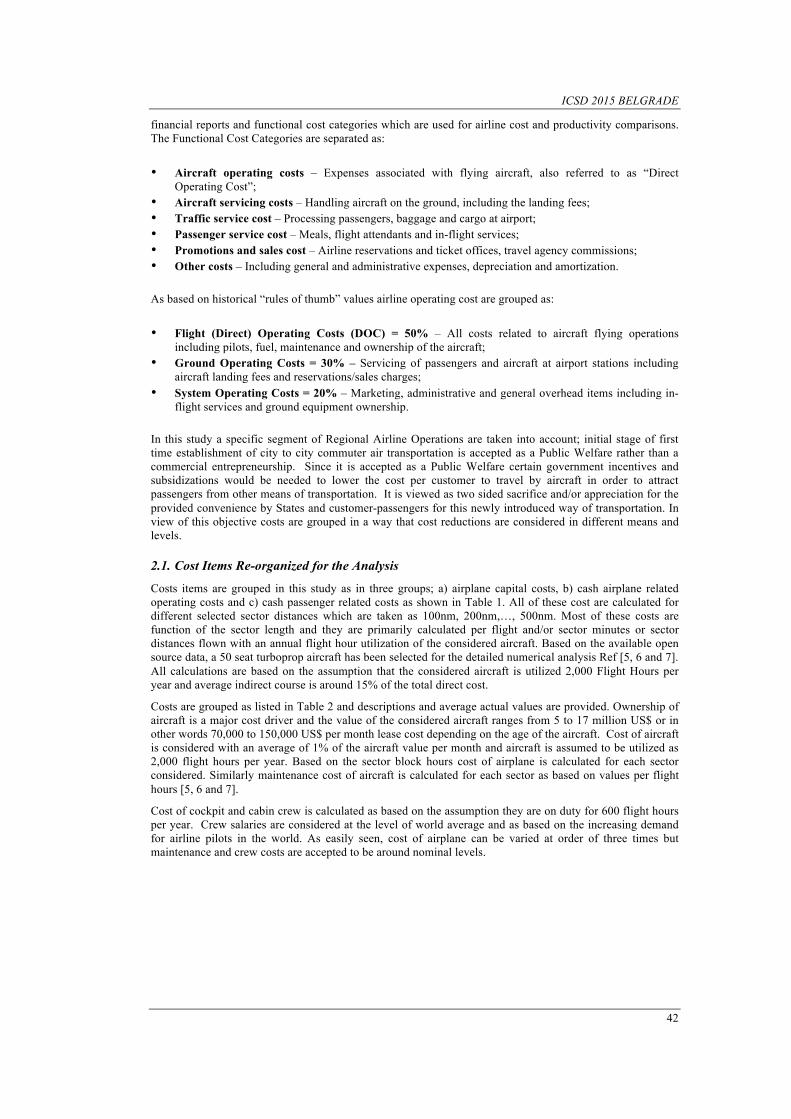
ICSD 2015 BELGRADE
42
financial reports and functional cost categories which are used for airline cost and productivity comparisons. The Functional Cost Categories are separated as:
• Aircraft operating costs – Expenses associated with flying aircraft, also referred to as “Direct Operating Cost”;
• Aircraft servicing costs – Handling aircraft on the ground, including the landing fees; • Traffic service cost – Processing passengers, baggage and cargo at airport; • Passenger service cost – Meals, flight attendants and in-flight services; • Promotions and sales cost – Airline reservations and ticket offices, travel agency commissions; • Other costs – Including general and administrative expenses, depreciation and amortization.
As based on historical “rules of thumb” values airline operating cost are grouped as:
• Flight (Direct) Operating Costs (DOC) = 50% – All costs related to aircraft flying operations including pilots, fuel, maintenance and ownership of the aircraft;
• Ground Operating Costs = 30% – Servicing of passengers and aircraft at airport stations including aircraft landing fees and reservations/sales charges;
• System Operating Costs = 20% – Marketing, administrative and general overhead items including in-flight services and ground equipment ownership.
In this study a specific segment of Regional Airline Operations are taken into account; initial stage of first time establishment of city to city commuter air transportation is accepted as a Public Welfare rather than a commercial entrepreneurship. Since it is accepted as a Public Welfare certain government incentives and subsidizations would be needed to lower the cost per customer to travel by aircraft in order to attract passengers from other means of transportation. It is viewed as two sided sacrifice and/or appreciation for the provided convenience by States and customer-passengers for this newly introduced way of transportation. In view of this objective costs are grouped in a way that cost reductions are considered in different means and levels.
2.1. Cost Items Re-organized for the Analysis
Costs items are grouped in this study as in three groups; a) airplane capital costs, b) cash airplane related operating costs and c) cash passenger related costs as shown in Table 1. All of these cost are calculated for different selected sector distances which are taken as 100nm, 200nm,…, 500nm. Most of these costs are function of the sector length and they are primarily calculated per flight and/or sector minutes or sector distances flown with an annual flight hour utilization of the considered aircraft. Based on the available open source data, a 50 seat turboprop aircraft has been selected for the detailed numerical analysis Ref [5, 6 and 7]. All calculations are based on the assumption that the considered aircraft is utilized 2,000 Flight Hours per year and average indirect course is around 15% of the total direct cost.
Costs are grouped as listed in Table 2 and descriptions and average actual values are provided. Ownership of aircraft is a major cost driver and the value of the considered aircraft ranges from 5 to 17 million US$ or in other words 70,000 to 150,000 US$ per month lease cost depending on the age of the aircraft. Cost of aircraft is considered with an average of 1% of the aircraft value per month and aircraft is assumed to be utilized as 2,000 flight hours per year. Based on the sector block hours cost of airplane is calculated for each sector considered. Similarly maintenance cost of aircraft is calculated for each sector as based on values per flight hours [5, 6 and 7].
Cost of cockpit and cabin crew is calculated as based on the assumption they are on duty for 600 flight hours per year. Crew salaries are considered at the level of world average and as based on the increasing demand for airline pilots in the world. As easily seen, cost of airplane can be varied at order of three times but maintenance and crew costs are accepted to be around nominal levels.
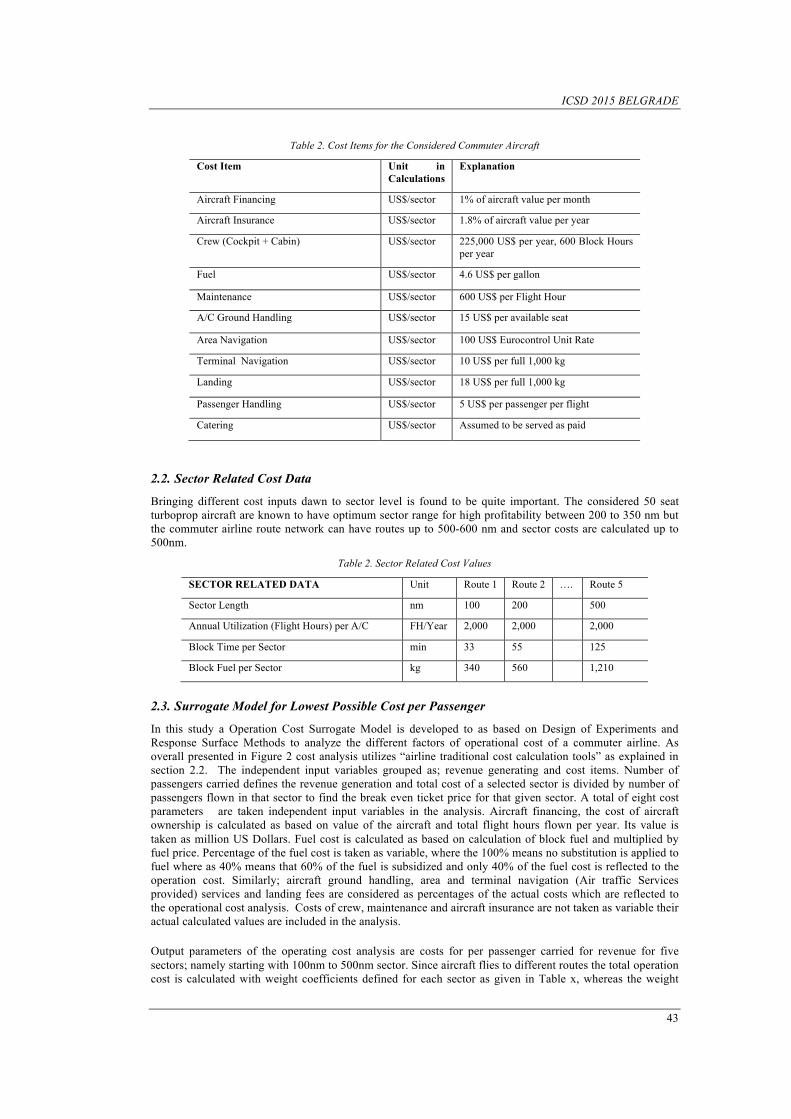
ICSD 2015 BELGRADE
43
Table 2. Cost Items for the Considered Commuter Aircraft
Cost Item Unit in Calculations
Explanation
Aircraft Financing US$/sector 1% of aircraft value per month
Aircraft Insurance US$/sector 1.8% of aircraft value per year
Crew (Cockpit + Cabin) US$/sector 225,000 US$ per year, 600 Block Hours per year
Fuel US$/sector 4.6 US$ per gallon
Maintenance US$/sector 600 US$ per Flight Hour
A/C Ground Handling US$/sector 15 US$ per available seat
Area Navigation US$/sector 100 US$ Eurocontrol Unit Rate
Terminal Navigation US$/sector 10 US$ per full 1,000 kg
Landing US$/sector 18 US$ per full 1,000 kg
Passenger Handling US$/sector 5 US$ per passenger per flight
Catering US$/sector Assumed to be served as paid
2.2. Sector Related Cost Data
Bringing different cost inputs dawn to sector level is found to be quite important. The considered 50 seat turboprop aircraft are known to have optimum sector range for high profitability between 200 to 350 nm but the commuter airline route network can have routes up to 500-600 nm and sector costs are calculated up to 500nm.
Table 2. Sector Related Cost Values
SECTOR RELATED DATA Unit Route 1 Route 2 …. Route 5
Sector Length nm 100 200 500
Annual Utilization (Flight Hours) per A/C FH/Year 2,000 2,000 2,000
Block Time per Sector min 33 55 125
Block Fuel per Sector kg 340 560 1,210
2.3. Surrogate Model for Lowest Possible Cost per Passenger
In this study a Operation Cost Surrogate Model is developed to as based on Design of Experiments and Response Surface Methods to analyze the different factors of operational cost of a commuter airline. As overall presented in Figure 2 cost analysis utilizes “airline traditional cost calculation tools” as explained in section 2.2. The independent input variables grouped as; revenue generating and cost items. Number of passengers carried defines the revenue generation and total cost of a selected sector is divided by number of passengers flown in that sector to find the break even ticket price for that given sector. A total of eight cost parameters are taken independent input variables in the analysis. Aircraft financing, the cost of aircraft ownership is calculated as based on value of the aircraft and total flight hours flown per year. Its value is taken as million US Dollars. Fuel cost is calculated as based on calculation of block fuel and multiplied by fuel price. Percentage of the fuel cost is taken as variable, where the 100% means no substitution is applied to fuel where as 40% means that 60% of the fuel is subsidized and only 40% of the fuel cost is reflected to the operation cost. Similarly; aircraft ground handling, area and terminal navigation (Air traffic Services provided) services and landing fees are considered as percentages of the actual costs which are reflected to the operational cost analysis. Costs of crew, maintenance and aircraft insurance are not taken as variable their actual calculated values are included in the analysis.
Output parameters of the operating cost analysis are costs for per passenger carried for revenue for five sectors; namely starting with 100nm to 500nm sector. Since aircraft flies to different routes the total operation cost is calculated with weight coefficients defined for each sector as given in Table x, whereas the weight
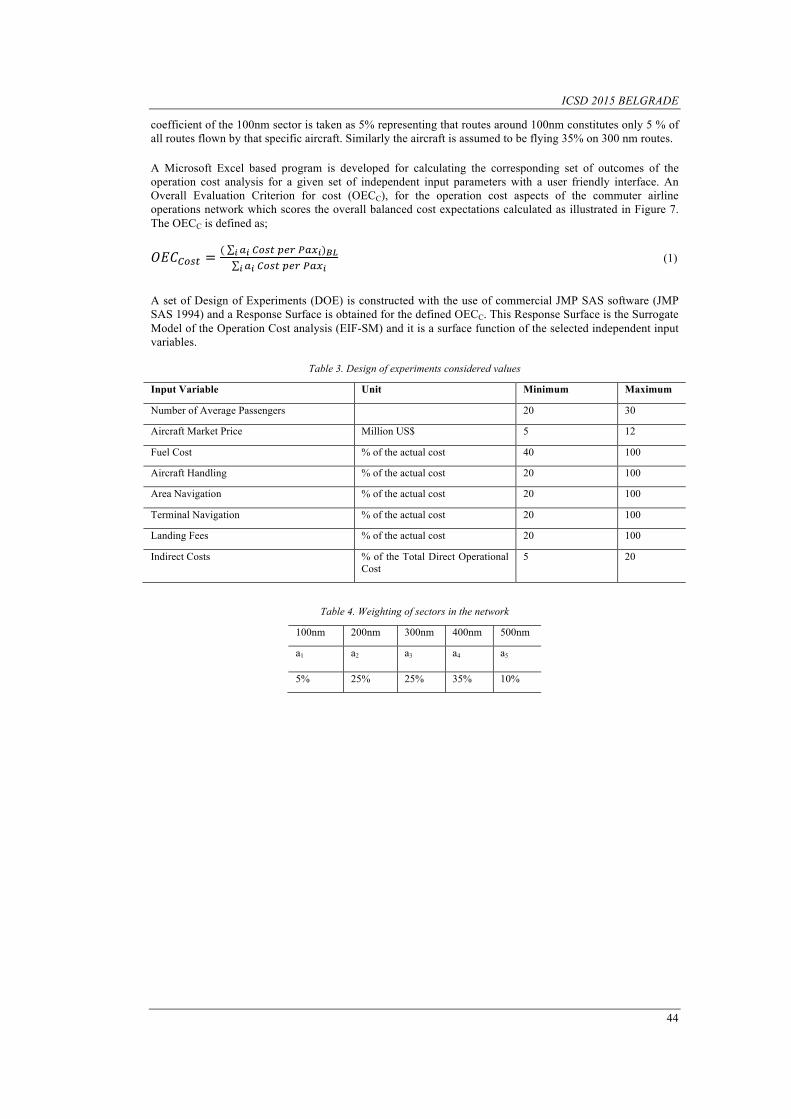
ICSD 2015 BELGRADE
44
coefficient of the 100nm sector is taken as 5% representing that routes around 100nm constitutes only 5 % of all routes flown by that specific aircraft. Similarly the aircraft is assumed to be flying 35% on 300 nm routes.
A Microsoft Excel based program is developed for calculating the corresponding set of outcomes of the operation cost analysis for a given set of independent input parameters with a user friendly interface. An Overall Evaluation Criterion for cost (OECC), for the operation cost aspects of the commuter airline operations network which scores the overall balanced cost expectations calculated as illustrated in Figure 7. The OECC is defined as;
!"#!"#$ = ( !! !"#$ !"# !"#!! )!"!! !"#$ !"# !"#!!
(1)
A set of Design of Experiments (DOE) is constructed with the use of commercial JMP SAS software (JMP SAS 1994) and a Response Surface is obtained for the defined OECC. This Response Surface is the Surrogate Model of the Operation Cost analysis (EIF-SM) and it is a surface function of the selected independent input variables.
Table 3. Design of experiments considered values
Input Variable Unit Minimum Maximum
Number of Average Passengers 20 30
Aircraft Market Price Million US$ 5 12
Fuel Cost % of the actual cost 40 100
Aircraft Handling % of the actual cost 20 100
Area Navigation % of the actual cost 20 100
Terminal Navigation % of the actual cost 20 100
Landing Fees % of the actual cost 20 100
Indirect Costs % of the Total Direct Operational Cost
5 20
Table 4. Weighting of sectors in the network
100nm 200nm 300nm 400nm 500nm
a1 a2 a3 a4 a5
5% 25% 25% 35% 10%
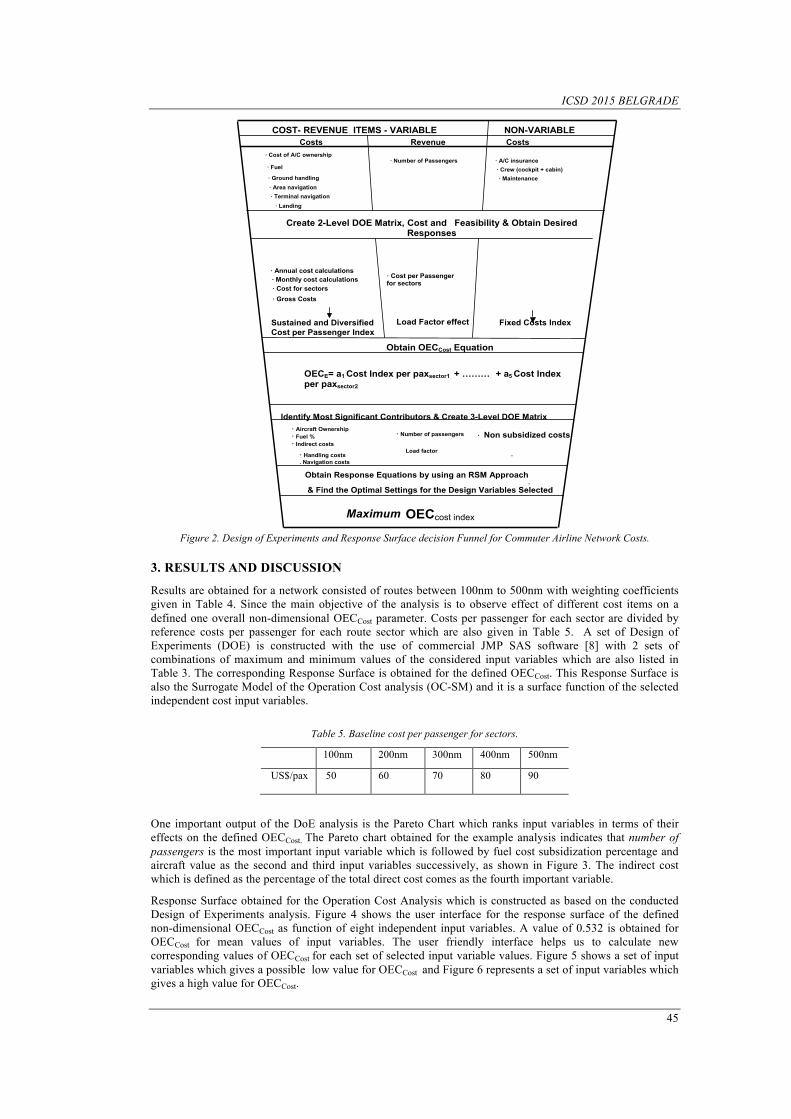
ICSD 2015 BELGRADE
45
Figure 2. Design of Experiments and Response Surface decision Funnel for Commuter Airline Network Costs.
3. RESULTS AND DISCUSSION
Results are obtained for a network consisted of routes between 100nm to 500nm with weighting coefficients given in Table 4. Since the main objective of the analysis is to observe effect of different cost items on a defined one overall non-dimensional OECCost parameter. Costs per passenger for each sector are divided by reference costs per passenger for each route sector which are also given in Table 5. A set of Design of Experiments (DOE) is constructed with the use of commercial JMP SAS software [8] with 2 sets of combinations of maximum and minimum values of the considered input variables which are also listed in Table 3. The corresponding Response Surface is obtained for the defined OECCost. This Response Surface is also the Surrogate Model of the Operation Cost analysis (OC-SM) and it is a surface function of the selected independent cost input variables.
Table 5. Baseline cost per passenger for sectors.
100nm 200nm 300nm 400nm 500nm
US$/pax 50 60 70 80 90
One important output of the DoE analysis is the Pareto Chart which ranks input variables in terms of their effects on the defined OECCost. The Pareto chart obtained for the example analysis indicates that number of passengers is the most important input variable which is followed by fuel cost subsidization percentage and aircraft value as the second and third input variables successively, as shown in Figure 3. The indirect cost which is defined as the percentage of the total direct cost comes as the fourth important variable.
Response Surface obtained for the Operation Cost Analysis which is constructed as based on the conducted Design of Experiments analysis. Figure 4 shows the user interface for the response surface of the defined non-dimensional OECCost as function of eight independent input variables. A value of 0.532 is obtained for OECCost for mean values of input variables. The user friendly interface helps us to calculate new corresponding values of OECCost for each set of selected input variable values. Figure 5 shows a set of input variables which gives a possible low value for OECCost and Figure 6 represents a set of input variables which gives a high value for OECCost.
COST- REVENUE ITEMS - VARIABLE NON-VARIABLE
Costs Revenue Costs · Cost of A/C ownership
· Number of Passengers · A/C insurance · Fuel · Crew (cockpit + cabin) · Ground handling · Maintenance · Area navigation · Terminal navigation · Landing Create 2-Level DOE Matrix, Cost and Feasibility & Obtain Desired
Responses
· Annual cost calculations · Monthly cost calculations · Cost per Passenger
for sectors · Cost for sectors · Gross Costs
Sustained and Diversified Cost per Passenger Index
Load Factor effect Fixed Costs Index
Obtain OECCost Equation
Identify Most Significant Contributors & Create 3-Level DOE Matrix · Aircraft Ownership · Fuel % · Indirect costs
· Number of passengers
· Non subsidized costs · Handling costs
. Navigation costs Load factor
·
·
Obtain Response Equations by using an RSM Approach
& Find the Optimal Settings for the Design Variables Selected
Maximum OECcost index
OECE= a1 Cost Index per paxsector1 + ……… + a5 Cost Index per paxsector2
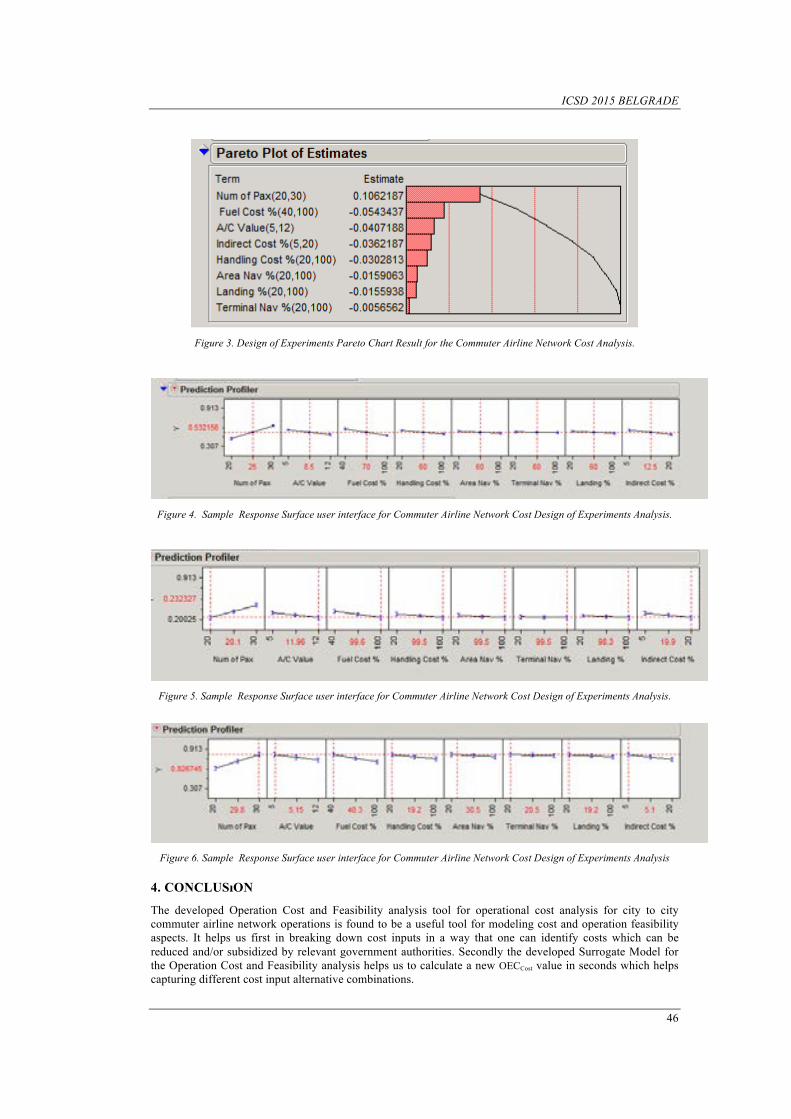
ICSD 2015 BELGRADE
46
Figure 3. Design of Experiments Pareto Chart Result for the Commuter Airline Network Cost Analysis.
Figure 4. Sample Response Surface user interface for Commuter Airline Network Cost Design of Experiments Analysis.
Figure 5. Sample Response Surface user interface for Commuter Airline Network Cost Design of Experiments Analysis.
Figure 6. Sample Response Surface user interface for Commuter Airline Network Cost Design of Experiments Analysis
4. CONCLUSıON
The developed Operation Cost and Feasibility analysis tool for operational cost analysis for city to city commuter airline network operations is found to be a useful tool for modeling cost and operation feasibility aspects. It helps us first in breaking down cost inputs in a way that one can identify costs which can be reduced and/or subsidized by relevant government authorities. Secondly the developed Surrogate Model for the Operation Cost and Feasibility analysis helps us to calculate a new OECCost value in seconds which helps capturing different cost input alternative combinations.

ICSD 2015 BELGRADE
47
Based on these valuable sides, the newly introduced Surrogate Model can be further be developed as;
• OECCost can be calculated for sets of alternative network of actual routes considered to be operated; • More realistic maximum and minimum values for different cost items can be defined; • The cost and feasibility analysis model can be expanded for different aircraft types and networks of
commuter airline operation models.
REFERENCES [1]. (2015) The Investopedia website. [Online] Available:
http://www.investopedia.com/features/industryhandbook/airline.asp/ [2]. Aviation Benefits Beyond Borders Sectorial Report, ATAG website. [Online]. Available:
http://aviationbenefits.org/media/26786/ATAG__AviationBenefits2014_FULL_LowRes.pdf [3]. P. Belobaba (Editor), A. Odoni (Editor) and C. Barnhart (Editor), The Global Airline Industry, 1st ed., John Wiley,
(2012). [4]. Aviation Benefits Beyond Borders Sectorial Report, ATAG website. [Online]. Available:
http://aviationbenefits.org/media/26786/ATAG__AviationBenefits2014_FULL_LowRes.pdf [5]. http://www.airfinancejournal.com/Article/3160018/AircraftProfileATR42500.html [6]. ATR42 Brosure [7]. Specs ATR42-500
ICSD 2015 BELGRADE
48
Social Dimension of Revitalization and its Role in Local Sustainable Development: Case
of Częstochowa City in Poland Anna Słocińska1, Leszek Cichobłaziński2
Abstract
The aim of the study is to identify the role of revitalization and its social dimensions in the sustainable local development. In the theoretical part the author will make an attempt to describe characteristic of the issues of sustainable development, local governance and revitalization of urban and postindustrial regions. It should be emphasized that the issue of sustainable development and revitalization come together in the area of local management practices. Local development-oriented management concerns not only the material and economic realm but also the social one. Local development is in fact connected with a growth of living standards, the level of satisfaction of their needs and the generally perceived quality of life. It is a long-term process and in order to make it sustainable, it must fulfill the strategic plans adopted for the area. The empirical part will be based on the analysis of two separate research: carried out as a part of a revitalization program in the city of Czestochowa and revitalization activities’ case studies in chosen Polish cities.
Keywords: Revitalization, Local Sustainable Development, Local Management.
1. INTRODUCTION
Fast social and economic development, typical for today's world makes city quarters and even larger areas lose their primary functions, which drives them to development decrease or even collapse and degradation. It concerns both, post – industrial and residential areas, which is related to a progressive deindustrialisation and fast (oftne destructive) urban tissue growth – altogether leading to the cities' primary functions degradation. Postcomunist countries face an additional problem, based on reclamation of the cities' central quarters primary functions, as in the communist period they were often transformed into social residential zones in terms of so caled public housing social care, which was a purposeful activity aimed at separating traditional social tissue of Polish cities. The system transformation, which brought, i.a. systemic (technological) unemployment, these quarters were inhabited by people being under threat of social exclusion.
The abovementioned phenomena make us face an important and urgent issue of architectural and urbanistic revitalisation of these areas, but among all of establishing new functionalities of them. It surely is related to solving social problems typical for these areas, discovering aspects vital for identification of local communities, which, as a consequence, may release social energy of the citizens. This is revitalisation in the most brief review, which is the main topic of this study. According to the scientific definition „ Revitalisation is a group of economic, socialand architectural activities aimed at activation of a degradated area. (...) The aim of revitalisation is to improve all aspects of city inhabitants and their economic and social development support”[1]. The revitalisation problem, however, may not be considered separately from the local government's strategic idea of sustainable development.
1Corresponding author: Częstochowa University of Technology, Management Faculty, Poland, [email protected] 2Częstochowa University of Technology, Management Faculty, Poland, [email protected]
ICSD 2015 BELGRADE
49
2. SUSTAINABLE DEVELOPMENT
Local development is one of the basic tasks of local governments. It is treated as a specific category of social – economic development, which is typical for internally diversified local government unit, connected with its various useful qualities and prognosable advantages for citizens and businesses [2]. Local development, is then influenced by economic base, which is strictly related to definition of endogenic and exogenic factors of local government units development, their location and position among other local government units [3]. Local development should be treated as a social process, based on activation of local community responsible for local development initiatives. It requires considerable institutional involvement, educational activities and resourcefulness of local authorities. It is social dimension of local development that makes the local authorities consider cultural, demographic and environmental aspects defining the citizens' needs. Therefore, a development strategy may be defined as a systemic method of solving issues by creating a consensus including all local community in order to create better economic future [4].
It is important to see, that local government economy functions within a wider social context, composed by households and enterprises but also by all organisations created by people. These institutions influences not only the creation of law and politics, but also supports educational, administrative and others, related to society functioning, including its relations with the environment. These institutions act thanks to social capital, represented by human resources, which depend on interpersonal and intergroup relationships, as well as person – group - institution interactions. This dimension is about increasing citizens' quality of life, seen as meeting present and future generations' needs.[5]
Such insight in local development is compatible with the idea of sustainable development which in practice may be seen in the history of societies which rejected it. The sustainable development requires preserving environmental and social capital, which have direct impact on local government unit future growth.
Sustainable development may be understood (definition taken from the report of World Commission of Environment and Development) as a process aimed at meeting demand of future generations.[6]
Sustainable development requires also applying the prudence rule (limiting potentially hazardous activities) and prevention (preventing problem causing situations). More aware and active society plays a key role in sustainable growth. It constitutes both, a tool and feature of sustainable development.
Sustainable development is expressed in figure 1., presenting two middle fields representing common and narrow understanding of development, involving only intermediate (from the sustainable point of view) means and intermediate aims. Sustainable growth should be considered in wider perspective, which means that generation of intermediate means (capital generated by people) requires ultimate means coming from the environment (environmental capital) and intermediate aims (social capital) are used to obtain ultimate ones (defined as well-being).
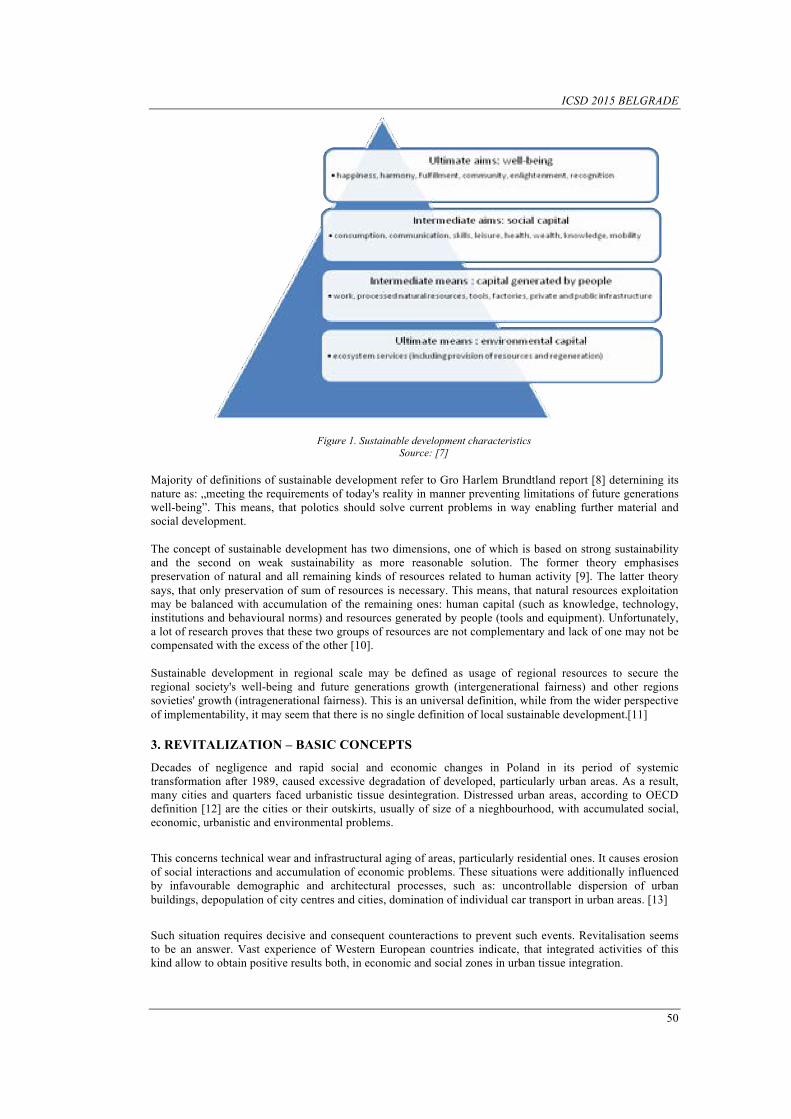
ICSD 2015 BELGRADE
50
Figure 1. Sustainable development characteristics Source: [7]
Majority of definitions of sustainable development refer to Gro Harlem Brundtland report [8] deternining its nature as: „meeting the requirements of today's reality in manner preventing limitations of future generations well-being”. This means, that polotics should solve current problems in way enabling further material and social development. The concept of sustainable development has two dimensions, one of which is based on strong sustainability and the second on weak sustainability as more reasonable solution. The former theory emphasises preservation of natural and all remaining kinds of resources related to human activity [9]. The latter theory says, that only preservation of sum of resources is necessary. This means, that natural resources exploitation may be balanced with accumulation of the remaining ones: human capital (such as knowledge, technology, institutions and behavioural norms) and resources generated by people (tools and equipment). Unfortunately, a lot of research proves that these two groups of resources are not complementary and lack of one may not be compensated with the excess of the other [10]. Sustainable development in regional scale may be defined as usage of regional resources to secure the regional society's well-being and future generations growth (intergenerational fairness) and other regions sovieties' growth (intragenerational fairness). This is an universal definition, while from the wider perspective of implementability, it may seem that there is no single definition of local sustainable development.[11]
3. REVITALIZATION – BASIC CONCEPTS
Decades of negligence and rapid social and economic changes in Poland in its period of systemic transformation after 1989, caused excessive degradation of developed, particularly urban areas. As a result, many cities and quarters faced urbanistic tissue desintegration. Distressed urban areas, according to OECD definition [12] are the cities or their outskirts, usually of size of a nieghbourhood, with accumulated social, economic, urbanistic and environmental problems.
This concerns technical wear and infrastructural aging of areas, particularly residential ones. It causes erosion of social interactions and accumulation of economic problems. These situations were additionally influenced by infavourable demographic and architectural processes, such as: uncontrollable dispersion of urban buildings, depopulation of city centres and cities, domination of individual car transport in urban areas. [13]
Such situation requires decisive and consequent counteractions to prevent such events. Revitalisation seems to be an answer. Vast experience of Western European countries indicate, that integrated activities of this kind allow to obtain positive results both, in economic and social zones in urban tissue integration.
ICSD 2015 BELGRADE
51
Renewal of territorial units is connected not only with its economic development, seen as an improvement of life conditions and infrastructure, but also as a prevention applied in functioning of groups being under threat of social exclusion, by including them into the local community life [14].
The idea of distressed areas revitalisation is now commonly agreed as a development and well-being causing factor influencing situation of inhabitants and other involved parties of a given area. Today in Poland we may see trends compliant with European tendencies in terms of revitalisation implemented according to social expectations and promoting an idea of „returing to cities”, which will transform into low emissive and citizen friendly ones. This means, that residential, economic and cultural functions of cities will grow stronger, which will enhance life quality of the citizens and decrease urbanistic pressure in the outskirts and costs related to cities and metropolis functioning. Such concept is more suitable to the idea of sustainability of growth which is now the leading objective of local governments strategies. [15]
The subject of revitalisation and attempt to make it operational on the level of local government has been discussed in Poland on social and political grounds since 1992. Since then the Revitalisation Act started to be prepared[16]. However, only twenty yeears later, June 30th 2015, the Council of Ministers issued a legislative project on revitalisation, containing first atempts to implement this phenomenon on the legal grounds [17]. Polish Sejm (Parliament's Legislative Chamber) considered Senate's amendments on October 9th 2015 and passed the project to the President for being signed on Octoner 12th [18]. According to the act project, the act itself is understood as a tool of bringing the distressed areas out of crisis, through integration of interventions for the sake of local comminity, space and economy, territorially concentrated and run by the interested parties on the basis of the municipal revitalisation programme.
Nevertheless, we still lack legal definition of revitalisation and this phenomenon has been defined according to local needs expressed in strategic and operation documents. The definition approved by the Polish Scientific Committee for the Urban Development Institute Project puts its question in terms of a process related to sustainability of growth and local authorities' role. According to the definition agreed by the Committee, revitalisation is a process run by local government, local community and other participants, each of whom constitute a part of development policy aimed at [19]: • preventing distress of urban area; • preventing crisis phenomena; • stimulation of growth and qualitative changes through increasing social and economic activities; • improvement of inhabited environments, and • protection of national heritage in sustainable manner.
Slightly different definition may be found in the guide „How to prepare a local development plan” of C.A. Heller [20]. Revitalisation is seen here as a „process of architectural, technical, social and economic changes aimed at public good, in order to bring the area out of crisis, reclaim its former functions and create the conditions for its further development using its endogenic features”.
The municipal practice proves how revitalisation show its implantational character, which means new functions to the area, or new spacial and architectural forms instead of those degraded or destroyed. Interesting is, that these kinds of revitalisation are addressed to completely new people, who arrived to this area from outside. The decisions on revitalisation are made by higher authorities, outside the group of interested receivers. Local community uses this these changes indirectly. Implantational revitalisations are represented by using postindustrial facilities for residential construction. Integrative revitalisation is another type, based on similar principles as implantational one, being however, strictly connected with local community, i.e. adapting postindustrial facilities for cultural purposes.[21]
This form of revitalisation includes a key role both, in its social influence and participation of local communities in diagnosing local issues, performing social consultations on range and form of revitalisation initiatives.
And here we meet with another revitalisation approach, based on opinion, that the strategies should be focused on people, instead of infrastructures. This concerns mainly gettos as a growing problem in Polish cities and communes. A new paradigm in revitalisation problematics becomes not space but people, who are not seen as a bunch of individuals, but as groups and communities living together and creating a given territory. This is so called civic investment perspective, typical for local communities activation and development programmes, aimed mainly at socially excluded groups [22]. Special role is played by public
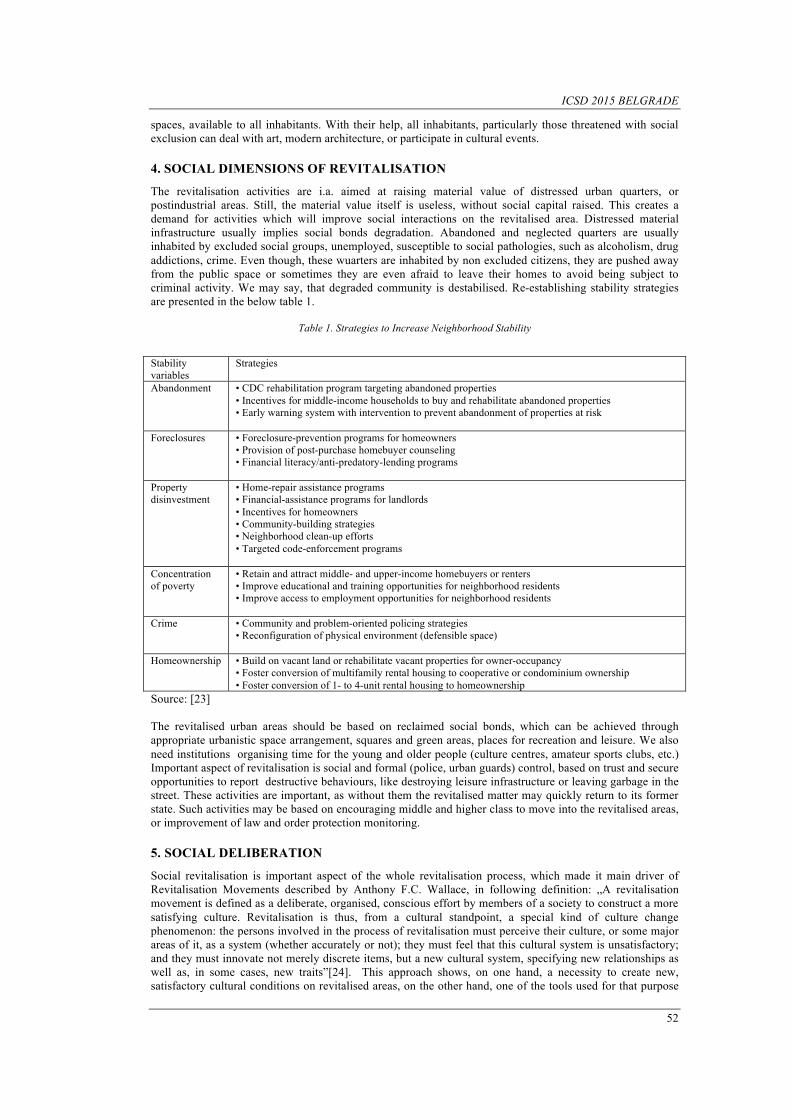
ICSD 2015 BELGRADE
52
spaces, available to all inhabitants. With their help, all inhabitants, particularly those threatened with social exclusion can deal with art, modern architecture, or participate in cultural events.
4. SOCIAL DIMENSIONS OF REVITALISATION
The revitalisation activities are i.a. aimed at raising material value of distressed urban quarters, or postindustrial areas. Still, the material value itself is useless, without social capital raised. This creates a demand for activities which will improve social interactions on the revitalised area. Distressed material infrastructure usually implies social bonds degradation. Abandoned and neglected quarters are usually inhabited by excluded social groups, unemployed, susceptible to social pathologies, such as alcoholism, drug addictions, crime. Even though, these wuarters are inhabited by non excluded citizens, they are pushed away from the public space or sometimes they are even afraid to leave their homes to avoid being subject to criminal activity. We may say, that degraded community is destabilised. Re-establishing stability strategies are presented in the below table 1.
Table 1. Strategies to Increase Neighborhood Stability
Stability variables
Strategies
Abandonment • CDC rehabilitation program targeting abandoned properties • Incentives for middle-income households to buy and rehabilitate abandoned properties • Early warning system with intervention to prevent abandonment of properties at risk
Foreclosures • Foreclosure-prevention programs for homeowners • Provision of post-purchase homebuyer counseling • Financial literacy/anti-predatory-lending programs
Property disinvestment
• Home-repair assistance programs • Financial-assistance programs for landlords • Incentives for homeowners • Community-building strategies • Neighborhood clean-up efforts • Targeted code-enforcement programs
Concentration of poverty
• Retain and attract middle- and upper-income homebuyers or renters • Improve educational and training opportunities for neighborhood residents • Improve access to employment opportunities for neighborhood residents
Crime • Community and problem-oriented policing strategies • Reconfiguration of physical environment (defensible space)
Homeownership • Build on vacant land or rehabilitate vacant properties for owner-occupancy • Foster conversion of multifamily rental housing to cooperative or condominium ownership • Foster conversion of 1- to 4-unit rental housing to homeownership
Source: [23] The revitalised urban areas should be based on reclaimed social bonds, which can be achieved through appropriate urbanistic space arrangement, squares and green areas, places for recreation and leisure. We also need institutions organising time for the young and older people (culture centres, amateur sports clubs, etc.) Important aspect of revitalisation is social and formal (police, urban guards) control, based on trust and secure opportunities to report destructive behaviours, like destroying leisure infrastructure or leaving garbage in the street. These activities are important, as without them the revitalised matter may quickly return to its former state. Such activities may be based on encouraging middle and higher class to move into the revitalised areas, or improvement of law and order protection monitoring.
5. SOCIAL DELIBERATION
Social revitalisation is important aspect of the whole revitalisation process, which made it main driver of Revitalisation Movements described by Anthony F.C. Wallace, in following definition: „A revitalisation movement is defined as a deliberate, organised, conscious effort by members of a society to construct a more satisfying culture. Revitalisation is thus, from a cultural standpoint, a special kind of culture change phenomenon: the persons involved in the process of revitalisation must perceive their culture, or some major areas of it, as a system (whether accurately or not); they must feel that this cultural system is unsatisfactory; and they must innovate not merely discrete items, but a new cultural system, specifying new relationships as well as, in some cases, new traits”[24]. This approach shows, on one hand, a necessity to create new, satisfactory cultural conditions on revitalised areas, on the other hand, one of the tools used for that purpose

ICSD 2015 BELGRADE
53
aere social deliberations helping the communities actively participate in all stages of the process. Here we meet a necessity of an integrative approach, where social participation plays a vital role.[25] Such approach allows to solve not only technical or architectural issues but also social ones. This research should be focused mainly on problems related both, to urbanistic, technical and social problems. Social problems are complex and they should be considered in comprehensive way. „The economic transformation in Poland raised importance of social problems. Still, not the economic development itself, but economic activity disproportions are the causes of social problems. Economic changes made contribution to new social threats. These problems are then strictly related to the results of economic activity. The common features of social problems are the following: • they evoke anxiety, stress, leading people to behaviours expressing these emotional states; • they are long term with wide and growing range of influence; • they cumulate in certain social groups; • they lead to social development disturbances; • they are connected with the social institutions' failure to meet the needs of the people; • they may not be overcome by the people being subject to them.[26]
6. MATERIALS AND METHODS
In order to describe the social aspects of revitalisation, the case study of Częstochowa has been performed. The analysis foundation is based on social research report which was a part of social consultancies carried out before implementation of several quarters of Częstochowa revitalisation.[27]
Częstochowa is located in southern Poland, with around 230 000 inhabitants. It is mainly known of Claramontana Monastery, which is a large pilgrimage and tourism centre. Till the end of XXth century it had strongly industrial character (metallurgical and textile), which was considerably reduced in 90-s during the systemic transformation. This resulted with large unemployment, social exclusion and degradation of postindustrial areas and quarters inhabited by ex employees of bankrupt enterprises.
The research was made in August 2008 among the inhabitants of quarters included in the municipal revitalisation progamme. The respondents filled 609 surveys, 1/3 of which were filled online, which proves the large interest of of internet users.
The tool used in the research was a survey consisting of 14 questions, both, closed and open. The survey has been edited in manner enabling its use in direct interview and online. The interviews were carried out in special consulting points in the zones of the highest pedestrin traffic of the quarters planned for revitalisation. There were six consulting points organised.
The surveys were carried out by trained clerks from the City Hall and trainees. Consulting points were marked with City Hall logo and equipped with tables and chairs. The respondents participated in surveys voluntarely, using the pollster's help if necessary. Apart from street surveys, the respondents could also fill the survey online on the City Hall's website. The web surveys were filled by respondents without any help.
The research were preceded with widespread communicatory action in local media (press and television) and internet. Moreover, the posters were sent to the Residential Management Office and residential cooperatives and parishes located in the research area.
7. RESULTS AND DISCUSTION
The research and consultancies led to the following conclusions: • The inhabitants of almost all quarters highlighted lack of green areas: parks, places for walks and bike
rides, gsquares and places for leisure available to families such as swimming pools. There were also proposals of potential locations of such areas;
• The citizens were concerned about social pathologies seen in the street, particularly alcoholism. This issue concerns mainly central and postindustrial zones. They are dominated by agressive underworld, which makes regular citizens being pushed away from the public space;
• Another crucial task is to counteract social pathologies. For this purpose, the cities need to build a programme of social revitalisation of quarters affected with these pathologies in order to minimise the threat. The task of the local government is to generate the solutions for the social problems with consideration of local conditions. The sociological research results on subjective security and threats of
ICSD 2015 BELGRADE
54
pathology may be a starting point in works on activities aimed at improvement of local safety. They would constitute a platform to build a system of public safety and elaboration of a strategic concept in this matter;
• The task of local government is to create the conditions favourable for management of children and youth free time, i.e. clubs, common rooms and sports areas. The city should undertake activities to build local playgrounds, sports fields, bicycle routes, where all citizens could spend their time actively;
• The inhabitants notice a necessity to solve social issues with diversified methodology. They require relatively high involvement of municipal and quarter local authorities and administration. A necessity of a revitalisation programme aimed at quarters' inhabitants activation has been expressed, as a step towards increasing common quality of life;
• The most important social problems solving actors are the Częstochowa quarters councils. They should, though, be the most involved in the abovementioned initiatives, either as their initiators, or by cooperating with other persons, e.g. the local government units;
• Another important entity working to solve the problems of local community is the local parish. The inhabitants of Częstochowa appreciate activity of parochial community and priests in this matter. These communities should more involve in these activities, e.g. by organising common rooms, integrative events – parochial picnics, charity actions, etc
8. CONCLUSION
From the citizens' point of view revitalisation is perceived as reclamation of material aspect. As a second aspect, social solutions are seen as necessary measures to secure such factors as: safety, restoring social bonds, free time management, socially activating events for youth and social misfits. It seems that both dimensions of revitalisation (technical and social) are inseparable and mutually related.
Even though the research was performed in 2008, in the initial phase of municipal revitalisation programme, the programme itself is being carried out on its basis. The revitalisation included the city centre, by creation of a friendly public space and other chosen territories within the city. The areas outside the centre await their revitalisation, often suffering from accumulated social problems caused mainly by public housing residential system routed in the old, communistic order. As the urban revitalisation programme undergoes further stages, another research would be recommended, in order to diagnose the satisfaction of citizens of the revitalisation implemented.
REFERENCES [1] Miejski Program Rewitalizacji dla Częstochowy - Aktualizacja, Częstochowa, maj 2007, p. 6. [2] E. Wojciechowski, Zarządzanie w samorządzie terytorialnym, Difin, Warszawa, 2012, p. 213. [3] J.J. Parysek, Podstawy gospodarki lokalnej, Wydawnictwo Naukowe Uniwersytetu im. A. Mickiewicza w Poznaniu,
Poznań, 2001, p.58-61. [4] T. Dziurbejko, Planowanie rozwoju gminy jako instrument pozyskiwania funduszy pomocowych Unii Europejskiej,
Difin, Warszawa, 2006, p.77. [5] J. Kronenberg, T. Bergier, Wyzwania zrównoważonego rozwoju w Polsce, Fundacja Sendzimira, Kraków, 2010, p. 24. [6] A. Kowalczyk, Zrównoważony rozwój społeczno-gospodarczy i ekologiczny gminy wiejskiej jako wspólny przedmiot
działania lokalnej jednostki samorządu terytorialnego, lokalnej grupy działania i lokalnej organizacji turystycznej, Handel Wewnętrzny, September - October (A) nr 5/2013, p. 37.
[7] J. Kronenberg, T. Bergier, Wyzwania zrównoważonego rozwoju w Polsce, Fundacja Sendzimira, Kraków, 2010, p. 28. [8] Sustainable Development: From Brundtland to Rio 2012, September 2010, United Nations Headquarters, New York,
http://www.un.org/wcm/webdav/site/climatechange/shared/gsp/docs/GSP1-6_Background%20on%20Sustainable%20Devt.pdf, p. 6
[9] H. Daly, Commentary: Toward some operational principles of sustainable development, Ecological Economics 2(1990), p. 1-6.
[10] J. Kronenberg, T. Bergier, Wyzwania zrównoważonego rozwoju w Polsce, Fundacja Sendzimira, Kraków, 2010, pp. 71.
[11] M. Skup (Ed.), Zrównoważony rozwój - aspekty rozwoju społeczności lokalnych, Fundacja Forum Inicjatyw Rozwojowych, Białystok, 2009
[12] Integrating Distressed Urban Areas, OECD, 1998, p. 15. [13] Uzasadnienie rządowego projektu ustawy o rewitalizacji, http://www.sejm.gov.pl/Sejm7.nsf/druk.xsp?nr=3594
(1.10.2015). [14] T. Wrona, Revitalization of cities: social aspect [w:] Management and Managers Facing Challenges of the 21st
Century. Theoretical Background and Practical Applications. Eds. F. Bylok, I. Ubreziova, L. Cichobłaziński, Szent Istvan Egyetemi Kiado Nonprofit Kft., Gödöllő, 2014, p. 371.
[15] Uzasadnienie rządowego projektu ustawy o rewitalizacji, http://www.sejm.gov.pl/Sejm7.nsf/druk.xsp?nr=3594 (1.10.2015).
[16] E. Strzelecka, Rewitalizacja miast w kontekście zrównoważonego rozwoju, Zeszyty Naukowe Politechniki Białostockiej. Budownictwo, Oficyna Wydawnicza Politechniki Białostockiej, Białystok, Vol. 2, nr 4/ 2011.
[17] https://www.mir.gov.pl/strony/zadania/polityka-rozwoju-kraju/rewitalizacja/ ( 03.07.2015). [18] https://www.mir.gov.pl/strony/zadania/polityka-rozwoju-kraju/rewitalizacja/#Ustawa o rewitalizacji (16.10.2015)

ICSD 2015 BELGRADE
55
[19] E. Strzelecka, Rewitalizacja miast w kontekście zrównoważonego rozwoju, Zeszyty Naukowe Politechniki Białostockiej. Budownictwo, Oficyna Wydawnicza Politechniki Białostockiej, Białystok, Vol. 2, nr 4/ 2011.
[20] C.A. Heller, Rewitalizacja obszarów miejskich. Praktyczny przewodnik: Jak opracować lokalny plan rozwoju?, 2002, http://wsb.edu.pl/container/Biblioteka%20WSb/rewitalizacja-obszarow-miejskich-przewodnik.pdf, (06.07.2015).
[21] S. Kaczmarek, Rewitalizacja terenów poprzemysłowych. Nowy wymiar w rozwoju miast, Wydawnictwo Uniwersytetu Łódzkiego, Łódź, 2001.
[22] B. Skrzypczak, (Ed.), Rewitalizacja społeczna: od aktywizacji do rozwoju lokalnego, Katowice: Urząd Marszałkowski Województwa Śląskiego; Radom: Wydawnictwo Naukowe Instytutu Technologii Eksploatacji – Państwowy Instytut Badawczy, 2011, pp.6-7.
[23] A. Mallach, Managing Neighborhood Change. A Framework for Sustainable and Equitable Revitalization, National Housing Institute, Montclair, 2008, p. 9.
[24] A. F.C. Wallace, Revitalization Movements, American Anthropologist Vol. 58, No. 2, 2009, p. 256. [25] P. Bielawska-Roepke, Podejście zintegrowane i partycypacja w rewitalizacji zdegradowanych obszarów miejskich,
[in:] Zmieniając miasto. Wokół teorii i praktyki rewitalizacji, ed.: M. Kowalewski, Economicus, Szczecin 2008, pp. 15 -25.
[26] F. Bylok, Identyfikacja problemów społecznych w Częstochowie, [in:] (Eds.) F. Bylok, L. Cichobłaziński, P. Pachura, Opinie mieszkańców Częstochowy na temat rewitalizacji obszarów wyznaczonych w miejskim programie rewitalizacji – raport z badań ankietowych, Urząd Miasta Częstochowy, Częstochowa 2008, p. 11.
[27] F. Bylok, L. Cichobłaziński, P. Pachura, Opinie mieszkańców Częstochowy na temat rewitalizacji obszarów wyznaczonych w miejskim programie rewitalizacji – raport z badań ankietowych, Urząd Miasta Częstochowy, Częstochowa 2008.
ICSD 2015 BELGRADE
56
Trends in Sustainability Reporting between
2004-2014 by Fortune 250: Turkey Case
M. Şebnem Ensari1, Melek Erdil, Hazal Genç
Abstract This paper evaluates the trend in sustainability reporting between 2004 and 2014 of Fortune 250 of Turkey. In order to do this, the websites of each company listed in Fortune 250 were analyzed, and the existence of sustainability report, the companies’ existing webpage including their ideas and vision related to sustainability were also taken into account separately. This study was repeated for the list of Fortune 250 bi yearly from 2004 until 2014. The analysis of Fortune 250 companies of Turkey between 2004-2014 has shown that, compared with 2004, reporting on environmental and social issues has increased significantly. Keywords: Sustainability, Trend, Turkey, Fortune 250.
1. INTRODUCTION
A focus on sustainability helps organizations manage their social and environmental impacts and improve operating efficiency and natural resource stewardship, and it remains a vital component of shareholder, employee, and stakeholder relations. Corporate sustainability reporting represents a rapidly-growing arena for corporate reporting that involves reporting nonfinancial and financial information to a broader set of stakeholders than only the shareholders. The reports inform various stakeholder groups on the reporting organization’s ability to manage key risks related to the organization that are of a concern to the stakeholders. Because these interests vary, the type of information varies in turn, however, much of the information surrounds economic, operational, social, philanthropic, and environmental objectives (Ballou and Heitger, 2005, p.3.)
In the millennium age, companies are getting more concerned about sustainability reporting in order to overcome social and environmental drawbacks caused by globalization. Sustainability reports are used as a way of communication tool of companies between them and their stakeholders. As Kolk (2004), mentioned that since the publication of the first separate environmental reports in 1989, the number of companies that have started to publish information on their environmental, social or sustainability policies and/or impacts has increased substantially.
With the rise in influence of the global reporting initiative and its series of sustainability reporting guidelines, corporate sustainability reports, also frequently referred to as corporate social responsibility reports and health safety and environment reports, have begun to appear regularly on the websites of many of the world’s largest firms, duplicating or more often supplanting printed copies, to the point that even when a printed copy exists it is also available electronically (Morhardt, 2010, p.436). According to environmentalleader.com, over two-thirds of the Fortune Global 250 issue sustainability reports. Firms continuously seek new ways to improve performance, protect reputational assets, and win shareholder and stakeholder trust. Lately, many academic studies have focused on evaluating the interest of the companies by analysing these electronic sustainability reports of the companies ranked in Global Fortune 250 and Fortune 500 ( Mordhardt, 2001; Rikhardsson et.
1Corresponding author: Nisantasi University, Department of Business Administration, 34406, Kağıthane/İstanbul, Turkey [email protected]
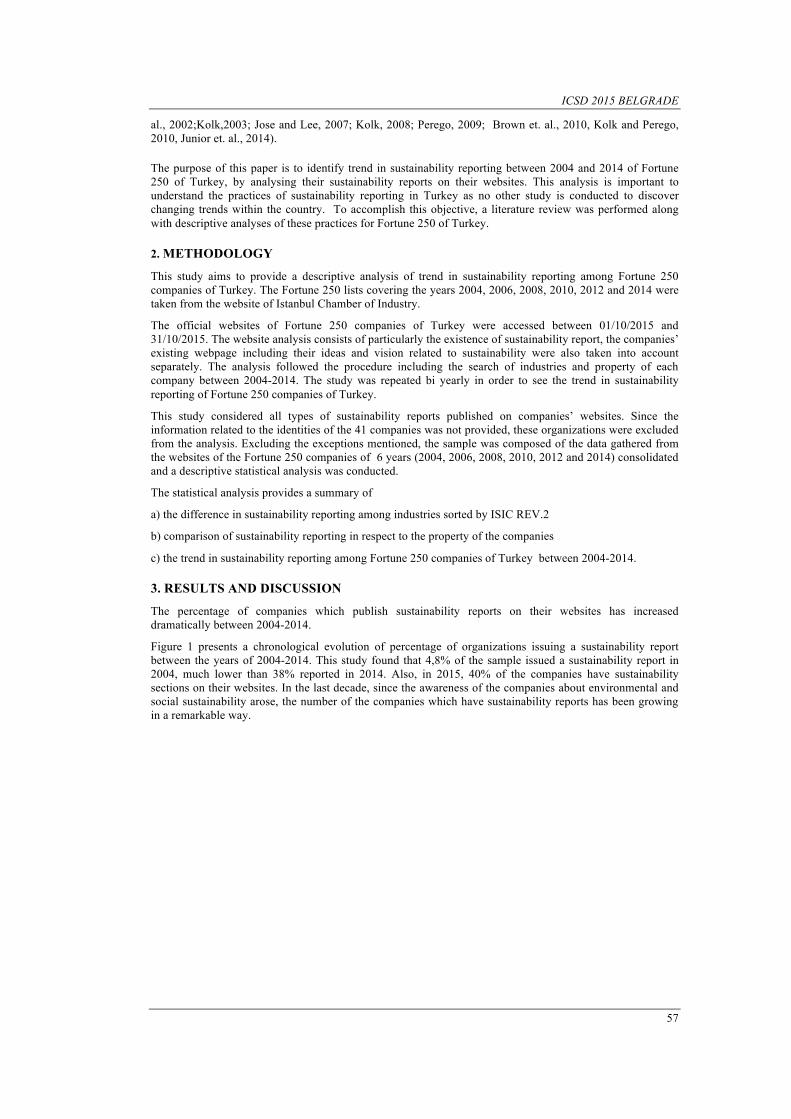
ICSD 2015 BELGRADE
57
al., 2002;Kolk,2003; Jose and Lee, 2007; Kolk, 2008; Perego, 2009; Brown et. al., 2010, Kolk and Perego, 2010, Junior et. al., 2014).
The purpose of this paper is to identify trend in sustainability reporting between 2004 and 2014 of Fortune 250 of Turkey, by analysing their sustainability reports on their websites. This analysis is important to understand the practices of sustainability reporting in Turkey as no other study is conducted to discover changing trends within the country. To accomplish this objective, a literature review was performed along with descriptive analyses of these practices for Fortune 250 of Turkey.
2. METHODOLOGY
This study aims to provide a descriptive analysis of trend in sustainability reporting among Fortune 250 companies of Turkey. The Fortune 250 lists covering the years 2004, 2006, 2008, 2010, 2012 and 2014 were taken from the website of Istanbul Chamber of Industry.
The official websites of Fortune 250 companies of Turkey were accessed between 01/10/2015 and 31/10/2015. The website analysis consists of particularly the existence of sustainability report, the companies’ existing webpage including their ideas and vision related to sustainability were also taken into account separately. The analysis followed the procedure including the search of industries and property of each company between 2004-2014. The study was repeated bi yearly in order to see the trend in sustainability reporting of Fortune 250 companies of Turkey.
This study considered all types of sustainability reports published on companies’ websites. Since the information related to the identities of the 41 companies was not provided, these organizations were excluded from the analysis. Excluding the exceptions mentioned, the sample was composed of the data gathered from the websites of the Fortune 250 companies of 6 years (2004, 2006, 2008, 2010, 2012 and 2014) consolidated and a descriptive statistical analysis was conducted.
The statistical analysis provides a summary of
a) the difference in sustainability reporting among industries sorted by ISIC REV.2
b) comparison of sustainability reporting in respect to the property of the companies
c) the trend in sustainability reporting among Fortune 250 companies of Turkey between 2004-2014.
3. RESULTS AND DISCUSSION
The percentage of companies which publish sustainability reports on their websites has increased dramatically between 2004-2014.
Figure 1 presents a chronological evolution of percentage of organizations issuing a sustainability report between the years of 2004-2014. This study found that 4,8% of the sample issued a sustainability report in 2004, much lower than 38% reported in 2014. Also, in 2015, 40% of the companies have sustainability sections on their websites. In the last decade, since the awareness of the companies about environmental and social sustainability arose, the number of the companies which have sustainability reports has been growing in a remarkable way.
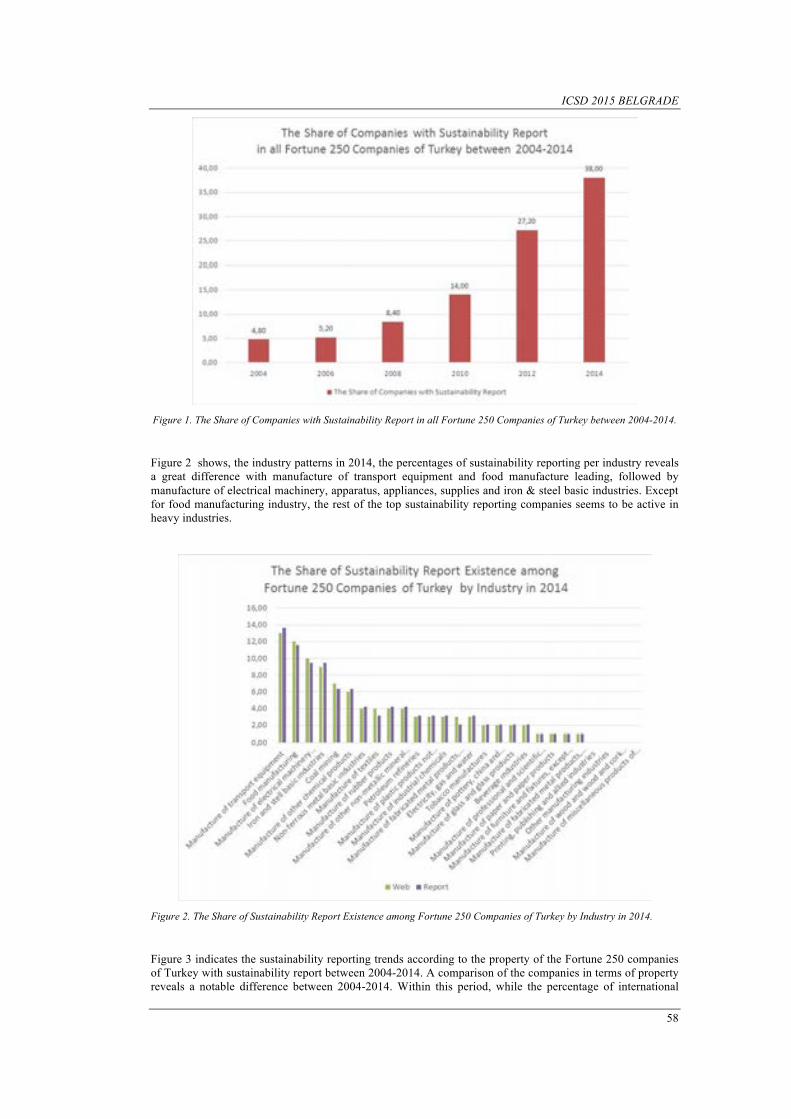
ICSD 2015 BELGRADE
58
Figure 1. The Share of Companies with Sustainability Report in all Fortune 250 Companies of Turkey between 2004-2014.
Figure 2 shows, the industry patterns in 2014, the percentages of sustainability reporting per industry reveals a great difference with manufacture of transport equipment and food manufacture leading, followed by manufacture of electrical machinery, apparatus, appliances, supplies and iron & steel basic industries. Except for food manufacturing industry, the rest of the top sustainability reporting companies seems to be active in heavy industries.
Figure 2. The Share of Sustainability Report Existence among Fortune 250 Companies of Turkey by Industry in 2014.
Figure 3 indicates the sustainability reporting trends according to the property of the Fortune 250 companies of Turkey with sustainability report between 2004-2014. A comparison of the companies in terms of property reveals a notable difference between 2004-2014. Within this period, while the percentage of international
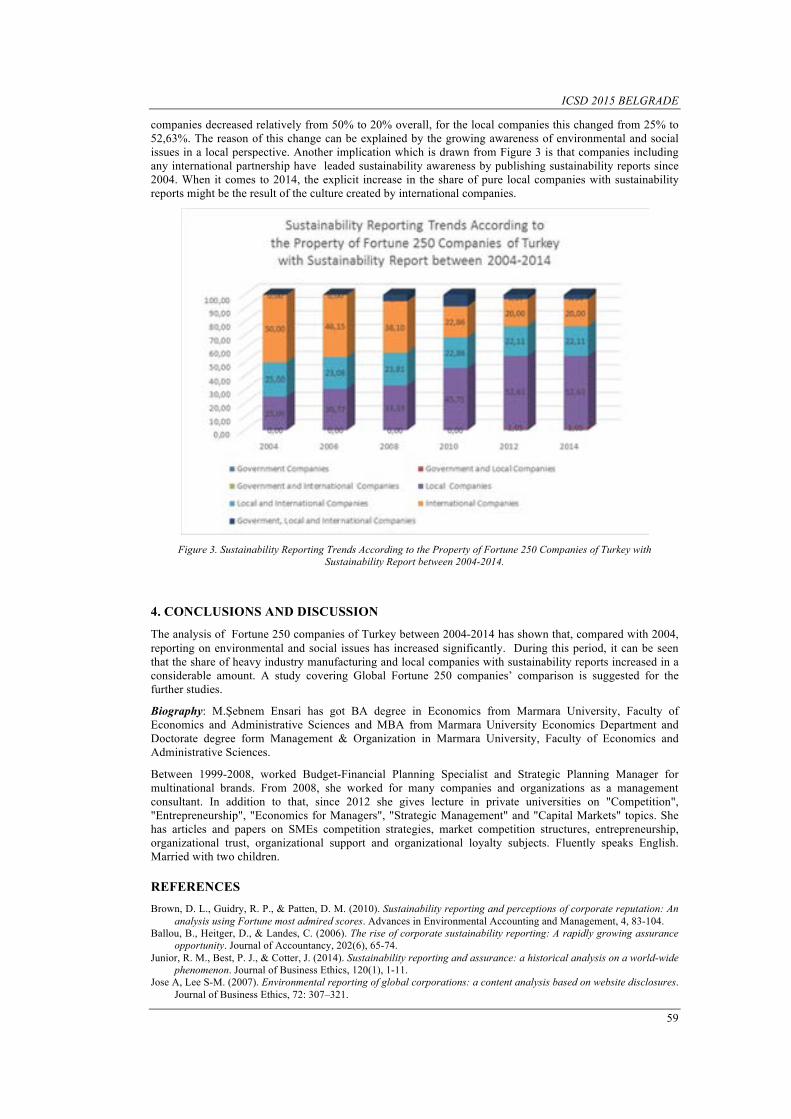
ICSD 2015 BELGRADE
59
companies decreased relatively from 50% to 20% overall, for the local companies this changed from 25% to 52,63%. The reason of this change can be explained by the growing awareness of environmental and social issues in a local perspective. Another implication which is drawn from Figure 3 is that companies including any international partnership have leaded sustainability awareness by publishing sustainability reports since 2004. When it comes to 2014, the explicit increase in the share of pure local companies with sustainability reports might be the result of the culture created by international companies.
Figure 3. Sustainability Reporting Trends According to the Property of Fortune 250 Companies of Turkey with
Sustainability Report between 2004-2014.
4. CONCLUSIONS AND DISCUSSION
The analysis of Fortune 250 companies of Turkey between 2004-2014 has shown that, compared with 2004, reporting on environmental and social issues has increased significantly. During this period, it can be seen that the share of heavy industry manufacturing and local companies with sustainability reports increased in a considerable amount. A study covering Global Fortune 250 companies’ comparison is suggested for the further studies.
Biography: M.Şebnem Ensari has got BA degree in Economics from Marmara University, Faculty of Economics and Administrative Sciences and MBA from Marmara University Economics Department and Doctorate degree form Management & Organization in Marmara University, Faculty of Economics and Administrative Sciences.
Between 1999-2008, worked Budget-Financial Planning Specialist and Strategic Planning Manager for multinational brands. From 2008, she worked for many companies and organizations as a management consultant. In addition to that, since 2012 she gives lecture in private universities on "Competition", "Entrepreneurship", "Economics for Managers", "Strategic Management" and "Capital Markets" topics. She has articles and papers on SMEs competition strategies, market competition structures, entrepreneurship, organizational trust, organizational support and organizational loyalty subjects. Fluently speaks English. Married with two children.
REFERENCES Brown, D. L., Guidry, R. P., & Patten, D. M. (2010). Sustainability reporting and perceptions of corporate reputation: An
analysis using Fortune most admired scores. Advances in Environmental Accounting and Management, 4, 83-104. Ballou, B., Heitger, D., & Landes, C. (2006). The rise of corporate sustainability reporting: A rapidly growing assurance
opportunity. Journal of Accountancy, 202(6), 65-74. Junior, R. M., Best, P. J., & Cotter, J. (2014). Sustainability reporting and assurance: a historical analysis on a world-wide
phenomenon. Journal of Business Ethics, 120(1), 1-11. Jose A, Lee S-M. (2007). Environmental reporting of global corporations: a content analysis based on website disclosures.
Journal of Business Ethics, 72: 307–321.

ICSD 2015 BELGRADE
60
Jose A, Lee S-M. (2007). Environmental reporting of global corporations: a content analysis based on website disclosures. Journal of Business Ethics, 72: 307–321.
Kolk, A. (2004). A Decade of Sustainability Reporting: Developments and Significance. Int. J. Environment and Sustainable Development, Vol.3, No.1, 2004.
Kolk, A. (2008). Sustainability, accountability and corporate governance: exploring multinationals' reporting practices. Business Strategy and the Environment, 17(1), 1-15.
Kolk, A., & Perego, P. (2010). Determinants of the adoption of sustainability assurance statements: an international investigation. Business Strategy and the Environment, 19(3), 182-198.
Kolk, A., & Perego, P. (2010). Determinants of the adoption of sustainability assurance statements: an international investigation. Business Strategy and the Environment, 19(3), 182-198.
Morhardt, J. E. (2010). Corporate social responsibility and sustainability reporting on the internet. Business strategy and the environment, 19(7), 436-452.
Perego, P. (2009). Causes and consequences of choosing different assurance providers: An international study of sustainability reporting. International Journal of Management, 26(3), 412-425.
Rikhardsson, P., Andersen, R., Jacob, A., & Bang, H. (2002). Sustainability reporting on the internet. Greener management international, 2002(40), 57-75.
Sustainability Reports, http://www.environmentalleader.com/category/sustainability-reports accessed on 05.10.2015.
ICSD 2015 BELGRADE
61
FWall Angle and Thermal Performance Relation
Kübra Sümer Haydaraslan1, Neşe Dikmen2
Abstract
A large portion of heat loss in structures is caused by transparent surfaces. In hot climates, such surfaces also cause excessive heat gain. Therefore, completely transparent curtain walls play a significant role in calculation of the heating and cooling loads of structures. This study was conducted to research the relation between the curtain wall angle the building's energy performance. For this purpose, a building model was made using the DesignBuilder simulation software. Heating and cooling loads were calculated for angles 90°, 100°, 110°, 120° and 130°. According to the data obtained, the structure's annual heating load increases and its cooling load decreases as the angle between the wall and the ground decreases. Controlled use of solar light and taking this into account during the design stage are important factors in provision of optimal energy consumption. Keywords: Curtain Wall, Thermal Performance, Facade Angle.
1. INTRODUCTION
Consumption of energy and natural resources is increasing every day with the population growth, increase in quality of life, development of new technologies and other similar factors. While the resource consumption increases, the environment quality decreases. Effects of any kind of production intended to satisfy any demand on people and their environment are very important in terms of the benefits of the whole world.
As a result of construction systems developed with the Industrial Revolution, it has been possible to create window openings more freely. Glass - one of the oldest materials known - has taken its place in present-day architecture after a long period of development. Since 19th century, glass was not only used in windows, it could be applied to the whole facades [1].
Curtain walls, examples of which were seen since the 19th century, and development of which began after the 2nd World War, first started being used in America ad then distributed throughout the world. Curtain walls found extensive usage in our days due to being functional and aesthetic [2].
Sections of a facade, where the largest heat loss is experienced, are the windows [3]. In hot climates, such surfaces also cause excessive heat gain. According to Baimuratov (2012), examination of the facade, which constitutes a significant item of the building envelope and separates the structure from external conditions, in terms of sustainability and its contribution to the structure's environmental sustainability, has a significant role [4].
Building's shape is an important factor that affects heat gain and heat loss. A building's shape can be defined by means of geometrical variables forming the building such as rate of the building length to the building depth in the plan, building height, roof type, wall slope and protrusions [5].
Sloped walls, which are frequently preferred in formation of the building's shape, are important in terms of the building's heat gain and loss. Especially, transparent sloped surfaces affect the thermal performance to a significant degree. Therefore, the relation between the curtain wall angle and the thermal performance was investigated during this study.
1Suleyman Demirel University, Department of Architecture, 32260, Çünür/Isparta, Turkey. [email protected] 2Suleyman Demirel University, Department of Civil Engineering, 32260, Çünür/Isparta, Turkey. [email protected]

ICSD 2015 BELGRADE
62
2. MATERIAL AND METHOD
A structure with the dimensions of 15m x 30m and height of 9m was designed for the purposes of this study. One facade of the building with a terrace roof is made completely of curtain wall and the facade faces the south direction (Figure 2.1).
The sample structure is considered located in the Antalya region in the southern region of Turkey, which is known to have a Mediterranean climate. According to Üçgül & Akgül, the annual average solar radiation in Antalya amounts to 1390 kWh/m2 and the annual insolation period is 2956 [6].
Figure 1. Schematic Floor Plan
The components constituting building envelope in the designed example were created taking into consideration the U values indicated in TS 825 Building Heat Insulation Rules and Standards, which have compulsory implementation in Turkey. According thereto, U values obtained from the structural elements of the building considered located in Antalya - the 1st Climate region, are presented in the table below.
Table 1. U Values
Uwall(W/m2K) 0,532
Ufloor(W/m2K) 0,7
Uceiling(W/m2K) 0,44
Uwindow(W/m2K) 2,4
5 versions of the designed building were prepared, where the direction of the building and materials used in structural elements remained constant, with curtain wall and building ground forming angles of 90°, 100°, 110°, 120° and 130°. With the changes in wall slopes of the buildings examined during the study, the angle of the solar light reaching the wall also changed. In order to compare the effect of such changes on the heat and cooling energy consumption, the DesignBuilder energy simulation software was used during the calculations. Structures with prepared drawings were modeled with the DesignBuilder simulation software. The climatic data of the Antalya region were obtained from the climate data file of the DesignBuilder simulation software.
3. RESULTS AND DISCUSSION
Model A (Curtain Wall Angle 90°): The schematic cross-section (Figure 3.1a) and the visual from the Design Builder model (Figure 3.1b) in the event when the curtain wall of the structure forms a 90° angle with the building's ground are provided below. The heating requirements and cooling requirements of this model were calculated as 4710 kWh and 82700 kWh respectively.
Figure 1.1a Schematic Section Figure 1.1b 3D Model of Building
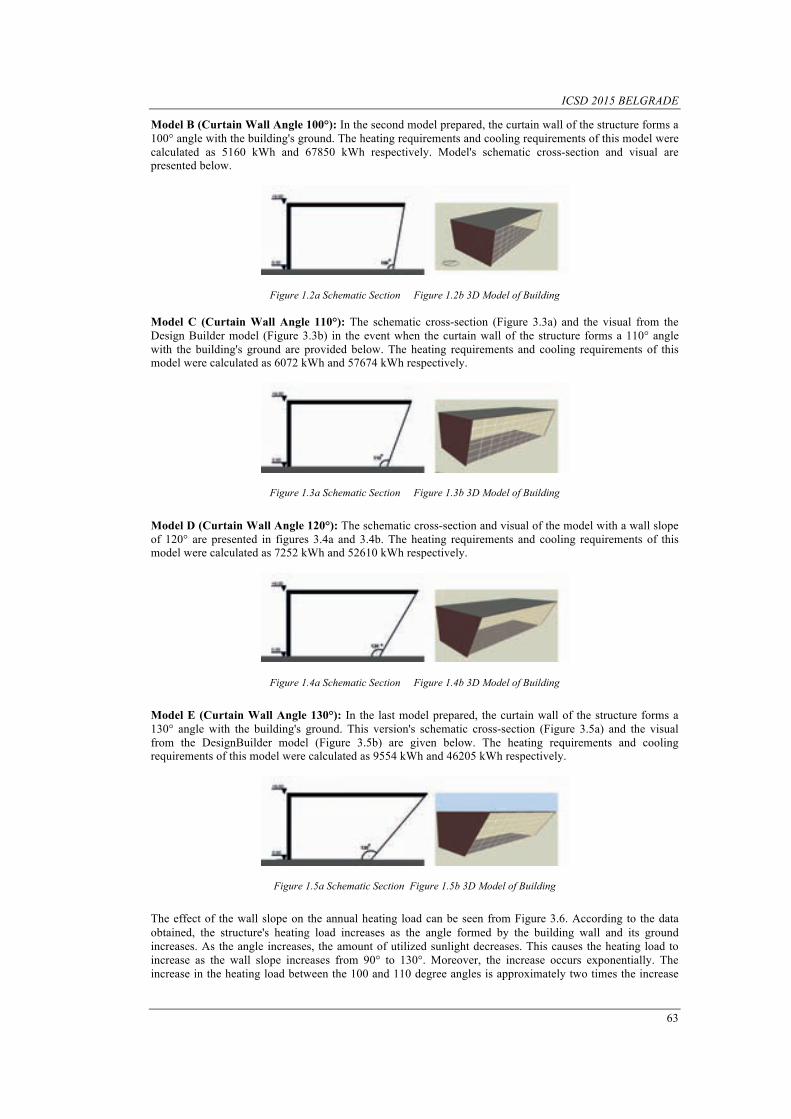
ICSD 2015 BELGRADE
63
Model B (Curtain Wall Angle 100°): In the second model prepared, the curtain wall of the structure forms a 100° angle with the building's ground. The heating requirements and cooling requirements of this model were calculated as 5160 kWh and 67850 kWh respectively. Model's schematic cross-section and visual are presented below.
Figure 1.2a Schematic Section Figure 1.2b 3D Model of Building
Model C (Curtain Wall Angle 110°): The schematic cross-section (Figure 3.3a) and the visual from the Design Builder model (Figure 3.3b) in the event when the curtain wall of the structure forms a 110° angle with the building's ground are provided below. The heating requirements and cooling requirements of this model were calculated as 6072 kWh and 57674 kWh respectively.
Figure 1.3a Schematic Section Figure 1.3b 3D Model of Building
Model D (Curtain Wall Angle 120°): The schematic cross-section and visual of the model with a wall slope of 120° are presented in figures 3.4a and 3.4b. The heating requirements and cooling requirements of this model were calculated as 7252 kWh and 52610 kWh respectively.
Figure 1.4a Schematic Section Figure 1.4b 3D Model of Building
Model E (Curtain Wall Angle 130°): In the last model prepared, the curtain wall of the structure forms a 130° angle with the building's ground. This version's schematic cross-section (Figure 3.5a) and the visual from the DesignBuilder model (Figure 3.5b) are given below. The heating requirements and cooling requirements of this model were calculated as 9554 kWh and 46205 kWh respectively.
Figure 1.5a Schematic Section Figure 1.5b 3D Model of Building
The effect of the wall slope on the annual heating load can be seen from Figure 3.6. According to the data obtained, the structure's heating load increases as the angle formed by the building wall and its ground increases. As the angle increases, the amount of utilized sunlight decreases. This causes the heating load to increase as the wall slope increases from 90° to 130°. Moreover, the increase occurs exponentially. The increase in the heating load between the 100 and 110 degree angles is approximately two times the increase
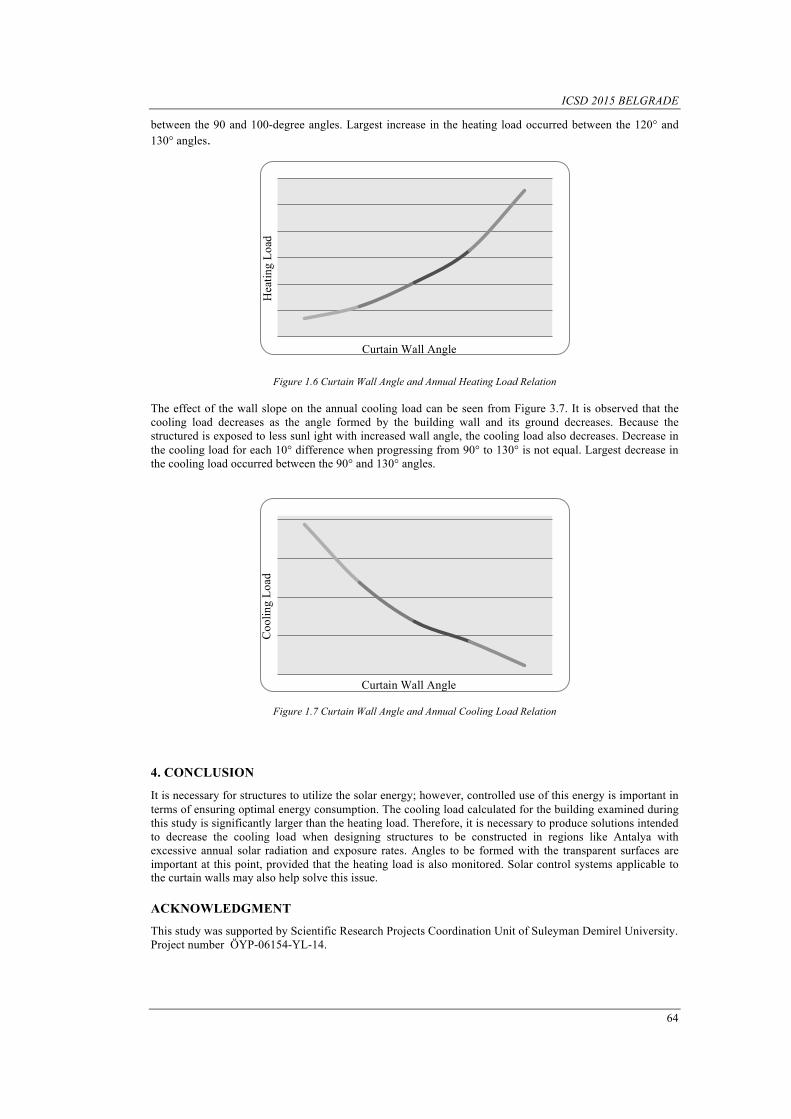
ICSD 2015 BELGRADE
64
between the 90 and 100-degree angles. Largest increase in the heating load occurred between the 120° and 130° angles.
Figure 1.6 Curtain Wall Angle and Annual Heating Load Relation
The effect of the wall slope on the annual cooling load can be seen from Figure 3.7. It is observed that the cooling load decreases as the angle formed by the building wall and its ground decreases. Because the structured is exposed to less sunl ight with increased wall angle, the cooling load also decreases. Decrease in the cooling load for each 10° difference when progressing from 90° to 130° is not equal. Largest decrease in the cooling load occurred between the 90° and 130° angles.
Figure 1.7 Curtain Wall Angle and Annual Cooling Load Relation
4. CONCLUSION
It is necessary for structures to utilize the solar energy; however, controlled use of this energy is important in terms of ensuring optimal energy consumption. The cooling load calculated for the building examined during this study is significantly larger than the heating load. Therefore, it is necessary to produce solutions intended to decrease the cooling load when designing structures to be constructed in regions like Antalya with excessive annual solar radiation and exposure rates. Angles to be formed with the transparent surfaces are important at this point, provided that the heating load is also monitored. Solar control systems applicable to the curtain walls may also help solve this issue.
ACKNOWLEDGMENT
This study was supported by Scientific Research Projects Coordination Unit of Suleyman Demirel University. Project number ÖYP-06154-YL-14.
Curtain Wall Angle
Hea
ting
Load
C
oolin
g Lo
ad
Curtain Wall Angle
ICSD 2015 BELGRADE
65
REFERENCES [1] Yıldırım, Ö., Giydirme Cephelerin Projelendirilmesinde Verimliliğin Araştırılması, Haliç Üniversitesi, Fen Bilimleri
Enstitüsü Mimarlık Bölümü, Yüksek Lisans Tezi, İstanbul, 2011. [2] Chasan, S., Dış Cephe Bitirme Sistemlerinde Isı Yalıtımının Sıcaklık Ve Nem Performansına Etkisinin İncelenmesi,
Trakya Üniversitesi, Fen Bilimleri Enstitüsü Mimarlık Bölümü, Yüksek Lisans Tezi, Edirne, 2013. [3] Sev, A., Sürdürülebilir Mimarlık, Yapı-Endüstri Merkezi, İstanbul, 2009. [4] Baimuratov, D., Metal Çerçeveli Giydirme Cephelerin Sürdürülebilirlik Açısından İncelenmesi, Mimar Sinan
Üniversitesi Fen Bilimleri Enstitüsü, Yüksek Lisans Tezi, 2s. İstanbul, 2012. [5] Utkutuğ, G., Ayçam, Ġ., ve Erol, M., Fiziksel Çevre Denetimi–I Yayınlanmamış Ders Notları, GÜMMF, Yapı
Bilgisi Bölümü. Ankara, 1996. [6] Üçgül, İ. ve Akgül, G., Termodynamical, Environmental and Economical Analyses for Solar Ejector Air-
Conditioning System, 12-23, Yekarum Dergisi, 2010.
BıOGRAPHY
Full Name: Kübra SÜMER HAYDARASLAN
Place and Date of Birth: Isparta-1989
Universities and Colleges Attended:
• Bachelors degree at Yıldız Technical University-Department of Architecture graduated in 2012, İstanbul-Turkey.
• Master degree at Suleyman Demirel University-Department Architecture, 2012/- , Isparta,Turkey.
ICSD 2015 BELGRADE
66
Management Practices Towards the
Embeddedness of Sustainability in European Universities
Solomon Chukwuemeka Ugbaja1, Refika Bakoglu2
Abstract Sustainable development (SD) has become increasingly evident during the last decades. Universities being the integral part of the global economy and since they prepare most of the professionals, who develop, manage and teach in society’s public, private and non-governmental institutions, they are uniquely positioned to influence the direction of a sustainable society. Consequently, as major contributors to the values, health and wellbeing of society, universities has a fundamental responsibility to teach, train and research for sustainability. This development is essential, as future professionals will be working globally with companies that increasingly have sustainability on their agenda. This development puts high demands on universities to embed sustainability into the management practices of their institutions so that this intelligence permeates all activities as a university identity. The aim of this study is to observe and evaluate management practices towards the embeddedness of sustainability in European universities. It is intended by this research using content analysis of universities’ websites and sustainability annual reports to observe universities embeddedness and management practices related to sustainability. The main question of the study is: How are management systems/practices embedding sustainability in sustainability focused British universities as far as CORE system (curriculum, operations, research, and engagement) is considered? The employed research methodology mainly relies on content analysis of selected universities in the UK from the UI GreenMetric Sustainable University assessment and ranking index. The UI GreenMetric Susataible University assessment and ranking is selected since it considers the Operations, Curriculum, Research and Enagagements (CORE system) of universities with indicators such as Setting and Infrastructure, Energy and Climate Change, Waste, Water, Transportation and Education. This covers the triple bottom line of sustainability (Environment, Economy and Society) which other indexes like GASU, AASHE: STAR, ESM and others, focused mostly on operational Eco-efficiency. The secondary data gathered in this research has been used for developing research variables and conceptual framework of the research. The sample of the study is selected from seventeen (17) sustainable universities in the UK ranked by UI GreenMetric. The total population of the study observed and evaluated in this study are Five (5) top Sustainable Universities in UK according to UI GreenMetric sustainable ranking. Descriptive data analysis involves the calculation of percentage distribution. The data analysis used in this research study involves using percentage table and diagram to describe the common Management Practices towards the embeddedness of sustainability in the selected universities. Keywords: Embeddedness, Managament Practices, Sustainability, Universities.
1. INTRODUCTION
The concept of sustainability, developed by the Brundtland Report defined sustainability as “development that meets the needs of the present without compromising the ability of future generations to meet their own needs” (World Commission on Environment and Development), [1] foregrounds the interconnections of the economic, social, and environmental aspects of corporate actions (the ‘triple bottom line’). In recent years, several definitions of sustainable higher education institutions have emerged [2]. Alshuwaikhat and Abubakar [3]argued that a sustainable campus should be environmentally healthy, with a prosperous economy through
1Corresponding author: Okan University, Department of Business Administration,Tuzla Kampüsü, 34959 Akfırat – Tuzla, İstanbul, [email protected] 2Marmara University, Faculty of Business Administration,Göztepe- İstanbul, Turkey [email protected]
ICSD 2015 BELGRADE
67
energy and resource conservation, waste reduction and with efficient environmental management; it should promote equity and social justice and export these values to the community. According to Milutinovic and Nikoli [4], the vision of sustainable development in higher education is a world where everyone has the opportunity to benefit from a quality education and learn the values, behaviours and lifestyles required for a sustainable future and for positive societal transformation [5].
In the last two decades, an increasing number of higher education institutions have been engaged in embedding/incorporating and institutionalizing sustainability into their systems [6], [7],[8]. This is arguably due to the increased level of consciousness in society of sustainability issues and the significant impacts of campus activities on both the environment and communities [3],[9]. In addition, the increasing importance of declarations, charters and partnerships for fostering transformative sustainable development is demonstrated by the more than 1000 university leaders who ratified their commitment to sustainability by signing the Talloires Declaration, the Kyoto Declaration, and the Copernicus University Charter [10].
Nevertheless, sustainable development in higher education is still far from being embedded into a holistic and organic manner by university leaders [11], [4]. A number of scholars have called for more comprehensive embeddedness of sustainable development into their systems, rather than only as ‘add-ons’ to existing practices, by engaging in fundamental and radical changes [12], [13], [14]. The slow rate of change in universities presents a tremendous challenge to higher education institutions and society to become more sustainable [5].
Therefore, it is necessary to analyze how universities have been contributing towards the embeddedness of Sustainability [15], [16]. This contribution can occur within the context of education, research, outreach/engagement and the administrative management of the university itself [3], [17]. The relevance of the present study links to current discussions regarding sustainability approaches in universities. Higher education has begun to recognize the need to reflect the reality that humanity is affecting the environment in ways which are historically unprecedented and which are potentially devastating for both natural ecosystems and us. Since universities are the integral part of the global economy and since they prepare most of the professionals who develop, manage and teach in society’s public, private and non-governmental institutions, they are uniquely positioned to influence the direction of a sustainable society. Thus, as major contributors to the values, health and wellbeing of society, higher education has a fundamental responsibility to teach, train and research for sustainability.
The success of universities in the twenty-first century will be judged by the ability to put forward a bold agenda that makes sustainability and the environment a cornerstone of academic practice. There is a great concern among some universities, for example, to increase their students’ awareness and commitment to sustainable practices. As a result, student organizations and special events have emerged to focus on sustainable practices regarding transportation, construction, energy, waste, food, water, and landscaping [18].
By seeking to embed sustainability in the system, many higher education institutions are adopting specific management systems [19]. A management system is usually based on management by objectives [20], in which the principal aim refers to the process of directing and controlling employees and work units, and motivating them towards performances regarding specific set of objectives. Although, higher education institutions are interested in performing under a variety of objectives, this research focuses on those related to sustainability [21].
The relevance of higher education institutions as important actors in the global arena is well exemplified by Waheed and colleagues [22], who argue that “the main general objectives of all higher education institutions are to educate students; to preserve and refine existing knowledge while producing, disseminating, and applying new knowledge; and to define and assist in finding solutions for problems in society. (…) Sustainability for universities can be seen as a necessity, not to avoid the cost of deteriorating social, environmental, and economic systems, but also to create new opportunities to improve the rate and extent of human development.” [22]. The need for sustainable development (SD) which has become increasingly evident during the last decades, implying that universities are expected to prepare students to develop the ability to embed social, environmental and economic considerations in future decision making [7], [23]. Among the most relevant competencies for future decision makers are to understand the complexities of sustainability and to convert the knowledge of education for sustainable development (ESD) into systemic, anticipatory and critical thinking and actions [24]. This development is essential, as future professionals will be working globally with companies that increasingly have sustainability on their agenda [25]. This development puts high demands on universities to embed sustainability into the management practices of the universities so that this intelligence permeates all activities as a university identity [26]. To significantly address these problems, university management practices have the potential to contribute to the embeddedness of sustainability [21]. Hence, an approach as the one presented here can contribute to research
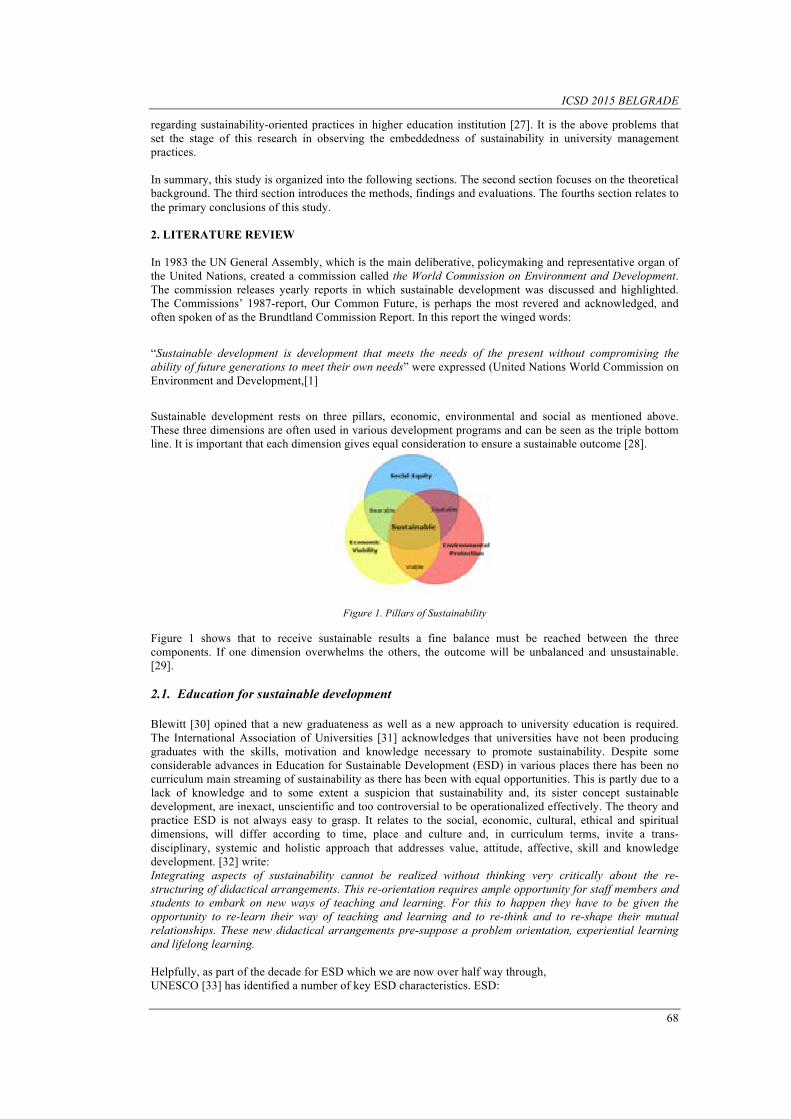
ICSD 2015 BELGRADE
68
regarding sustainability-oriented practices in higher education institution [27]. It is the above problems that set the stage of this research in observing the embeddedness of sustainability in university management practices.
In summary, this study is organized into the following sections. The second section focuses on the theoretical background. The third section introduces the methods, findings and evaluations. The fourths section relates to the primary conclusions of this study.
2. LITERATURE REVIEW
In 1983 the UN General Assembly, which is the main deliberative, policymaking and representative organ of the United Nations, created a commission called the World Commission on Environment and Development. The commission releases yearly reports in which sustainable development was discussed and highlighted. The Commissions’ 1987-report, Our Common Future, is perhaps the most revered and acknowledged, and often spoken of as the Brundtland Commission Report. In this report the winged words:
“Sustainable development is development that meets the needs of the present without compromising the ability of future generations to meet their own needs” were expressed (United Nations World Commission on Environment and Development,[1]
Sustainable development rests on three pillars, economic, environmental and social as mentioned above. These three dimensions are often used in various development programs and can be seen as the triple bottom line. It is important that each dimension gives equal consideration to ensure a sustainable outcome [28].
Figure 1. Pillars of Sustainability
Figure 1 shows that to receive sustainable results a fine balance must be reached between the three components. If one dimension overwhelms the others, the outcome will be unbalanced and unsustainable. [29]. 2.1. Education for sustainable development
Blewitt [30] opined that a new graduateness as well as a new approach to university education is required. The International Association of Universities [31] acknowledges that universities have not been producing graduates with the skills, motivation and knowledge necessary to promote sustainability. Despite some considerable advances in Education for Sustainable Development (ESD) in various places there has been no curriculum main streaming of sustainability as there has been with equal opportunities. This is partly due to a lack of knowledge and to some extent a suspicion that sustainability and, its sister concept sustainable development, are inexact, unscientific and too controversial to be operationalized effectively. The theory and practice ESD is not always easy to grasp. It relates to the social, economic, cultural, ethical and spiritual dimensions, will differ according to time, place and culture and, in curriculum terms, invite a trans-disciplinary, systemic and holistic approach that addresses value, attitude, affective, skill and knowledge development. [32] write: Integrating aspects of sustainability cannot be realized without thinking very critically about the re-structuring of didactical arrangements. This re-orientation requires ample opportunity for staff members and students to embark on new ways of teaching and learning. For this to happen they have to be given the opportunity to re-learn their way of teaching and learning and to re-think and to re-shape their mutual relationships. These new didactical arrangements pre-suppose a problem orientation, experiential learning and lifelong learning. Helpfully, as part of the decade for ESD which we are now over half way through, UNESCO [33] has identified a number of key ESD characteristics. ESD:
ICSD 2015 BELGRADE
69
a. is based on the principles and values that underlie sustainable development; b. deals with the well-being of all three realms of sustainability – environment, society and economy; c. promotes life-long learning; d. is locally relevant and culturally appropriate; e. is based on local needs, perceptions and conditions, but acknowledges that fulfilling local needs often has international effects and consequences; f. engages formal, non-formal and informal education; g. accommodates the evolving nature of the concept of sustainability; h. addresses content, context, global issues and local priorities; i. builds civil capacity for community-based decision making, social tolerance, environmental stewardship, adaptable workforce and quality of life; j. is interdisciplinary. No one discipline can claim ESD for its own, but all disciplines can contribute to ESD and k. uses a variety of pedagogical techniques that promote participatory learning and higher order thinking skills. Selby [34] stresses the urgency of our global predicament seeing the role of Higher Education (HE) as needing to prepare us for contraction. Climate change, excessive resource use and overpopulation requires formal and informal education to help nurture alternative and localized conceptions of the “good life” together with more holistic ways of mediating and interpreting reality. Learning in HE needs a keener appreciation of complexity, such as the multiple ramifications and reverberations of human action. Selby also recognizes the inherent complacency or lack of engagement in the view that the academy exists only for disinterested contemplation and reflection. HE certainly needs to offer learners this space, but overall the sector needs to do more than monitor the demise of yet another human civilization. HE must therefore be focused on more than simply delivering employability or servicing the business as usual economy. It must encompass: a civil component – community engagement going beyond encouraging student and staff volunteering; a political component – skills of decision making, leadership, conflict negotiation and values/moral education; and, our rights and obligations to other people, other species and the planet as a whole. It needs to be more eco-centric. Graduates need to prioritize actions, balance environmental, social and economic costs and benefits, understand the needs and perspectives of others and, through both a generic understanding of sustainability and through their own disciplinary knowledge and expertise, be able to work in an inter-professional and intercultural manner. For Clugston and Calder [10], one way of developing a sustainability curriculum in HE is to develop learning around the key concepts of sustainability rather than a set of concepts located within each traditional disciplinary area. This needs to be married to a trans-disciplinarility and Mode 2 knowledge [35] which, as Harloe and Perry [36] discuss, is key to HE successfully engaging with a diverse range of intellectual, economic and social interests where both knowledge creation activities and research findings are disseminated interactively, in real and virtual time, and where research groups are networked globally with participants from a range of public, private and third-sector institutions. 2.2. Embeddedness of Sustainability in Universities.
The need for sustainable development (SD) has become increasingly evident during the last decades, implying that universities are expected to prepare students to develop the ability to integrate social, environmental and economic considerations in future decision making [7], [23]. Among the most relevant competencies for future decision makers are to understand the complexities of sustainability and to convert the knowledge of education for sustainable development (ESD) into systemic, anticipatory and critical thinking and actions [24]. This development is essential, as future professionals will be working globally with companies that increasingly have sustainability on their agenda [25]. This development puts high demands on universities to integrate SD into the functions of faculty and staff so that this intelligence permeates all activities as a university identity [26] and is not only offered piecemeal in single course activities. The transformation towards university ESD requires three elements to function: SD orientation integrated in university activities, education about sustainable development and education for sustainable development in society [37].
The role of universities in ESD has been encouraged in many declarations and initiatives. Many programs for ESD have according to Leicht [38] been “good”, but they commonly depend on active individuals, resulting in a lack of a more holistic approach that connects SD to other discourses in education (ibid.). That shortcoming is addressed in one of the latest initiatives: the Higher Education Sustainability Initiative and the Rioþ20 Treaty on Higher Education ask universities, in addition to the previous declarations, to commit themselves to actions for ESD [39], [40].
ICSD 2015 BELGRADE
70
Although faculty and staff in universities still perceive sustainability as peripheral to their functions [41] and are in the early stages of the learning process [42], they are the change agents who can and will engage in the ESD [43]. Universities are now progressing from the “bolting-on stage” of SD [44], starting to face the challenge and building in more systematic changes for SD [41]. The next stage requires universities to equip leaders, faculty and staff with a perception of sustainability in the academic context they can apply to their functions at the university. For this change to become a transformation [44], SD needs to be integrated in all university activities and be transformed into practical actions, which call for innovative educational cross-disciplinary approaches [45] and a thinking paradigm [37]. Lazano expressed that the future leaders, decision-makers and intellectuals of the social, political, economic and academic sectors are created, formed and shaped within the world’s higher education institutions. Even though each university is unique, all of them have the same basic system [9]. This system, according to Cortese [46], has four dimensions: (a) Education (referring to courses and curricula), (b) Research, both basic and applied, (c) Campus operations, and (d) Community outreach. These dimensions must also be assessed and reported in an on-going manner which leads to a fifth dimension: (e) Assessment and reporting. It should be noted that these dimensions are interdependent. Lazano also considers the main actors in universities to be as follows: (a) the academic directors, (b) the professors and (c) the students. Ideally the concepts of SD should be integrated into the policies, approaches and learning of all members of these stakeholders; in practice this is almost impossible in the first stages of SD incorporation into the university’s system [9]. Other scholars have stressed the basic types of activities given in higher education institutions assessing the main elements in this transformative process towards sustainability [47], [48] [49]. For instance, [48] identified that the main activities are related to the fields of operation and maintenance, teaching, research, and outreach (which is engagement and cooperation with local communities, companies, the media, etc.) [48]. Similarly, different definitions focus on the activities as a C.O.R.E. system [47]. The abbreviation stands for curriculum, operations, research and engagement. The CORE model is presented as a “campus-wide guide for holistic implementation of campus sustainability initiatives” [47]. Models like these are based on assessments as the one of [50]. Lukman and Glavic [50] argued that desirable outcomes of sustainability-oriented practices are those fostering “research, technical development and innovations within a knowledge-based society”. Lukman and Glavic also argued that incorporating sustainability-oriented practices into everyday activities involves a further identification of variables such as “management performance (vision, mission, statement, strategy, and sustainability council/ coordinator), education and research (programmes, curriculum, teaching methods), operations, forming networks and reporting to stakeholders (assessment tools, sustainability indicators)” [50]. The construction of a framework of sustainability assessment in universities is enriched by the C.O.R.E system/model in approaches to management practices. 2.3. Sustainability Assessment Tools
According to the sustainability model (Fig. 2). Sustainability refers to the holistic and interconnected phenomena of economic, environmental, and social aspects [51]. Sustainability oriented practices are always multidimensional and are organized within the economic, environmental and social dimensions. Strictly one-dimensional activity (e.g. Environmental) hardly exists, since it is always related to economic and social effects. University's performance aspects (research, education, and environmental protection) are interconnected, multidimensional, too. They should all be evaluated when the sustainability of the University is under consideration. Research, development, investment and matriculation are aspects, which are closely linked with an economic dimension of the development of universities. Thus, in order to organize the university performance into the sustainability idea, the assumption has been made that these four aspects represent mainly the economic dimension of the university's performance. Education and student services were assumed to relate mainly to the social dimension, while resource usage, emissions, and waste represent environmental dimensions of the university's performance. In this way, all the three perspectives of sustainable development have been covered by the proposed three dimensions [52].
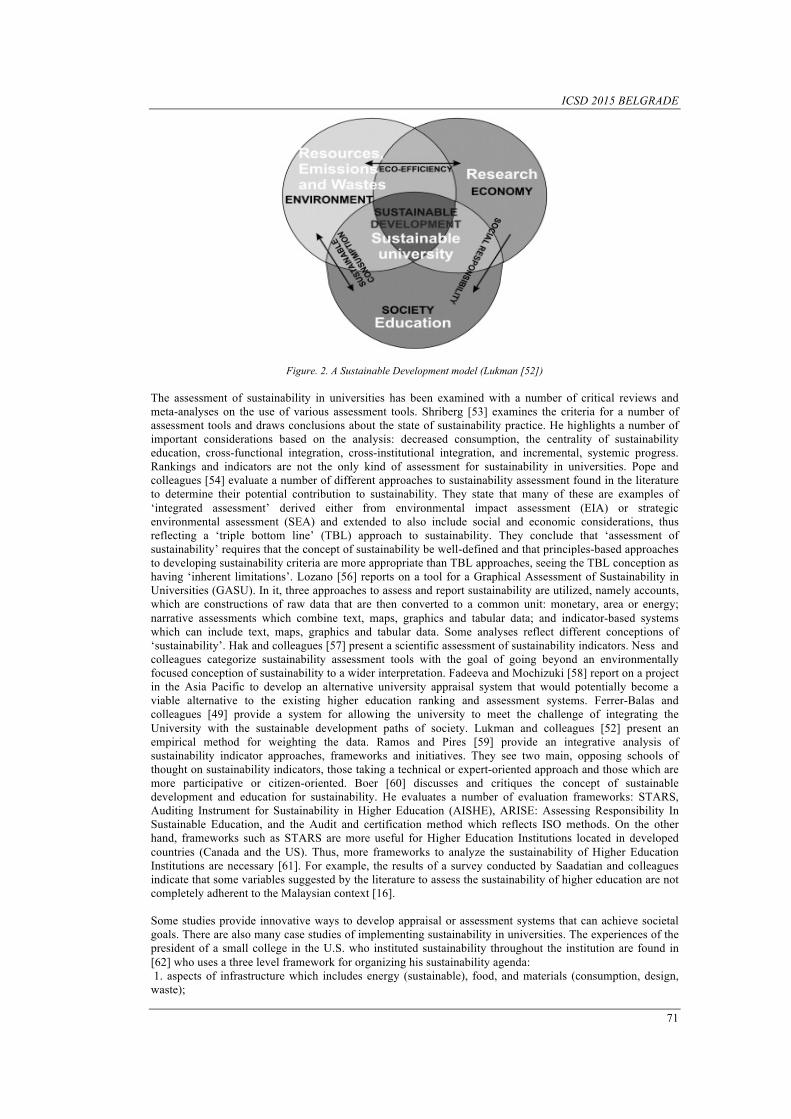
ICSD 2015 BELGRADE
71
Figure. 2. A Sustainable Development model (Lukman [52]) The assessment of sustainability in universities has been examined with a number of critical reviews and meta-analyses on the use of various assessment tools. Shriberg [53] examines the criteria for a number of assessment tools and draws conclusions about the state of sustainability practice. He highlights a number of important considerations based on the analysis: decreased consumption, the centrality of sustainability education, cross-functional integration, cross-institutional integration, and incremental, systemic progress. Rankings and indicators are not the only kind of assessment for sustainability in universities. Pope and colleagues [54] evaluate a number of different approaches to sustainability assessment found in the literature to determine their potential contribution to sustainability. They state that many of these are examples of ‘integrated assessment’ derived either from environmental impact assessment (EIA) or strategic environmental assessment (SEA) and extended to also include social and economic considerations, thus reflecting a ‘triple bottom line’ (TBL) approach to sustainability. They conclude that ‘assessment of sustainability’ requires that the concept of sustainability be well-defined and that principles-based approaches to developing sustainability criteria are more appropriate than TBL approaches, seeing the TBL conception as having ‘inherent limitations’. Lozano [56] reports on a tool for a Graphical Assessment of Sustainability in Universities (GASU). In it, three approaches to assess and report sustainability are utilized, namely accounts, which are constructions of raw data that are then converted to a common unit: monetary, area or energy; narrative assessments which combine text, maps, graphics and tabular data; and indicator-based systems which can include text, maps, graphics and tabular data. Some analyses reflect different conceptions of ‘sustainability’. Hak and colleagues [57] present a scientific assessment of sustainability indicators. Ness and colleagues categorize sustainability assessment tools with the goal of going beyond an environmentally focused conception of sustainability to a wider interpretation. Fadeeva and Mochizuki [58] report on a project in the Asia Pacific to develop an alternative university appraisal system that would potentially become a viable alternative to the existing higher education ranking and assessment systems. Ferrer-Balas and colleagues [49] provide a system for allowing the university to meet the challenge of integrating the University with the sustainable development paths of society. Lukman and colleagues [52] present an empirical method for weighting the data. Ramos and Pires [59] provide an integrative analysis of sustainability indicator approaches, frameworks and initiatives. They see two main, opposing schools of thought on sustainability indicators, those taking a technical or expert-oriented approach and those which are more participative or citizen-oriented. Boer [60] discusses and critiques the concept of sustainable development and education for sustainability. He evaluates a number of evaluation frameworks: STARS, Auditing Instrument for Sustainability in Higher Education (AISHE), ARISE: Assessing Responsibility In Sustainable Education, and the Audit and certification method which reflects ISO methods. On the other hand, frameworks such as STARS are more useful for Higher Education Institutions located in developed countries (Canada and the US). Thus, more frameworks to analyze the sustainability of Higher Education Institutions are necessary [61]. For example, the results of a survey conducted by Saadatian and colleagues indicate that some variables suggested by the literature to assess the sustainability of higher education are not completely adherent to the Malaysian context [16]. Some studies provide innovative ways to develop appraisal or assessment systems that can achieve societal goals. There are also many case studies of implementing sustainability in universities. The experiences of the president of a small college in the U.S. who instituted sustainability throughout the institution are found in [62] who uses a three level framework for organizing his sustainability agenda: 1. aspects of infrastructure which includes energy (sustainable), food, and materials (consumption, design, waste);

ICSD 2015 BELGRADE
72
2. aspects of community which includes governance (leadership, mission), investment, (capital, endowments), and wellness (wellness, fitness, vitality, service, gratitude, individual eco-community relations); and 3. aspects of learning including curriculum, interpretation (visitors, ecology, awareness), and aesthetics (stewardship, campus canvas, graffiti, wind turbines). Koshy and colleagues [63] reported on a case study using a tool called Sustainability Assessment Methodology (SAM) that monitors the implementation of sustainability at a university in Malaysia and can produce ratings. Other case studies include those in RMIT University in Australia [64], and universities in New Zealand [65].
It can be seen that a great deal has been written about sustainability, sustainability in higher education and assessment, measures and ranking of sustainability. However, most of this is in regional, national or local contexts or case studies of single university's attempts to establish and measure sustainability. There is still relatively little in the literature on global sustainability assessment and rankings in higher education. UI GreenMetric a global sustainability assessing and ranking tool for university addresses this lack. The mission for the assessment and ranking of UI GreenMetric was that it is of interest and accessible to universities in developing countries as well as to those in developed countries. It provides an entry-level tool for assessing campus sustainability efforts. The assessment and ranking emerged out of a number of disparate concerns and realizations regarding the challenge of introducing sustainable concepts in a Sustainability Environmental Assessment (SEA) context. The other aspects of the mission for the assessment and ranking were that it be global in scope, raise awareness in sustainability and be a driver of change [66].
Table 1. The UI GreenMetric Categories used in the assessing, ranking and their weighting Sustainability in Universities Category Percentage of Total Points (%)
1 Setting and Infrastructure (SI) 15 2 Energy and Climate Change (EC) 21 3 Waste (WS) 18 4 Water (WR) 10 5 Transportation (TR) 18 6 Education (ED) 18 TOTAL 100
2.3.1. Setting and Infrastructure: The campus setting and infrastructure information will give the basic information of the university consideration towards a green environment. This indicator also shows whether the campus deserves to be called Green Campus. The aim is to trigger the participating university to provide more space for greenery and in safeguarding the environment, as well as the development of sustainable energy.
2.3.2. Energy and Climate Change: The university’s attention to the use of energy and climate change issues be the indicator with the highest weighting in this ranking. In our questionnaire, we define several indicators for this particular area of concern, i.e. energy efficient appliance usage, renewable energy usage policy, total electricity use, energy conservation program, green building, climate change adaptation and mitigation program, greenhouse gas emission reduction policy. With this indicator, universities are expected to increase the effort in energy efficiency of their building and to care more about nature and energy resources. 2.3.3. Waste: Waste treatment and recycling activities are major factors in creating a sustainable environment. The activities of university staff and students on campus will produce a lot of waste, therefore some programs and waste treatments should be among the concern of the university, i.e. recycling program, toxic waste recycling, organic waste treatment, inorganic waste treatment, sewerage disposal, policy to reduce the use of paper and plastic in campus.
2.3.4. Water: Water use on campus is another important indicator in Greenmetric. The aim is that universities can decrease water usage, increase conservation program, and protect the habitat. Water conservation program, piped water use are among the criteria.
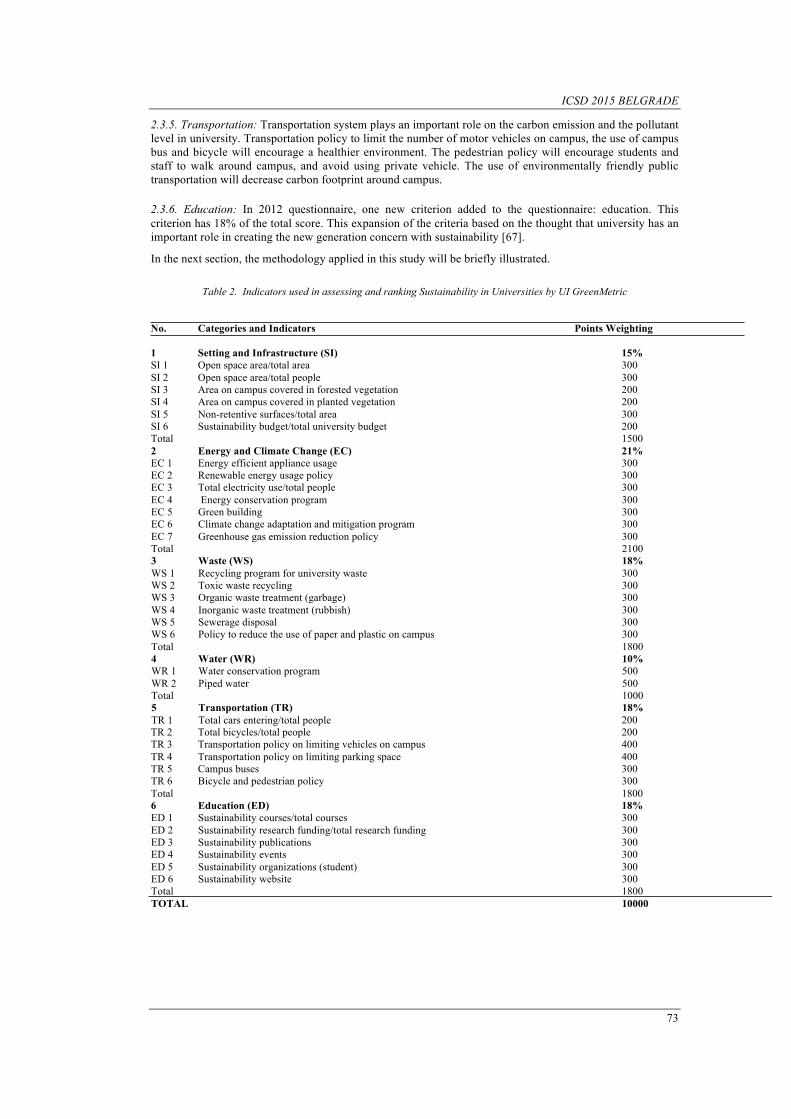
ICSD 2015 BELGRADE
73
2.3.5. Transportation: Transportation system plays an important role on the carbon emission and the pollutant level in university. Transportation policy to limit the number of motor vehicles on campus, the use of campus bus and bicycle will encourage a healthier environment. The pedestrian policy will encourage students and staff to walk around campus, and avoid using private vehicle. The use of environmentally friendly public transportation will decrease carbon footprint around campus.
2.3.6. Education: In 2012 questionnaire, one new criterion added to the questionnaire: education. This criterion has 18% of the total score. This expansion of the criteria based on the thought that university has an important role in creating the new generation concern with sustainability [67].
In the next section, the methodology applied in this study will be briefly illustrated.
Table 2. Indicators used in assessing and ranking Sustainability in Universities by UI GreenMetric
No. Categories and Indicators Points Weighting 1 Setting and Infrastructure (SI) 15% SI 1 Open space area/total area 300 SI 2 Open space area/total people 300 SI 3 Area on campus covered in forested vegetation 200 SI 4 Area on campus covered in planted vegetation 200 SI 5 Non-retentive surfaces/total area 300 SI 6 Sustainability budget/total university budget 200 Total 1500 2 Energy and Climate Change (EC) 21% EC 1 Energy efficient appliance usage 300 EC 2 Renewable energy usage policy 300 EC 3 Total electricity use/total people 300 EC 4 Energy conservation program 300 EC 5 Green building 300 EC 6 Climate change adaptation and mitigation program 300 EC 7 Greenhouse gas emission reduction policy 300 Total 2100 3 Waste (WS) 18% WS 1 Recycling program for university waste 300 WS 2 Toxic waste recycling 300 WS 3 Organic waste treatment (garbage) 300 WS 4 Inorganic waste treatment (rubbish) 300 WS 5 Sewerage disposal 300 WS 6 Policy to reduce the use of paper and plastic on campus 300 Total 1800 4 Water (WR) 10% WR 1 Water conservation program 500 WR 2 Piped water 500 Total 1000 5 Transportation (TR) 18% TR 1 Total cars entering/total people 200 TR 2 Total bicycles/total people 200 TR 3 Transportation policy on limiting vehicles on campus 400 TR 4 Transportation policy on limiting parking space 400 TR 5 Campus buses 300 TR 6 Bicycle and pedestrian policy 300 Total 1800 6 Education (ED) 18% ED 1 Sustainability courses/total courses 300 ED 2 Sustainability research funding/total research funding 300 ED 3 Sustainability publications 300 ED 4 Sustainability events 300 ED 5 Sustainability organizations (student) 300 ED 6 Sustainability website 300 Total 1800 TOTAL 10000
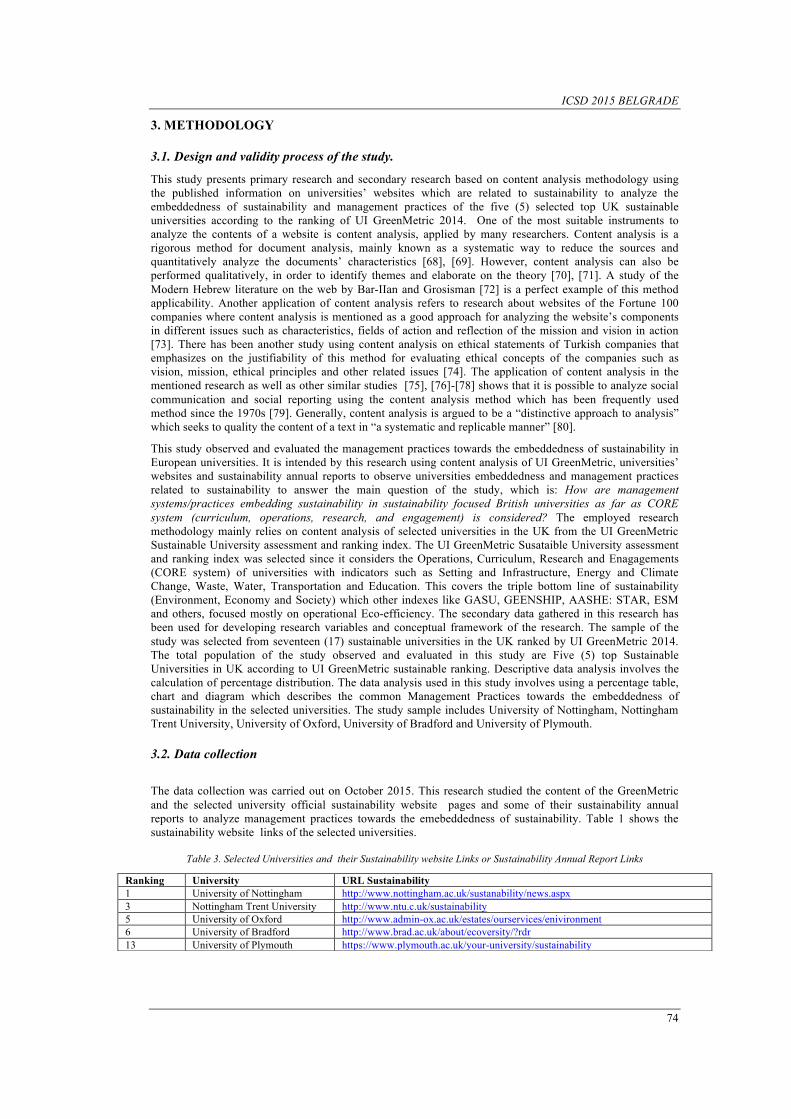
ICSD 2015 BELGRADE
74
3. METHODOLOGY
3.1. Design and validity process of the study.
This study presents primary research and secondary research based on content analysis methodology using the published information on universities’ websites which are related to sustainability to analyze the embeddedness of sustainability and management practices of the five (5) selected top UK sustainable universities according to the ranking of UI GreenMetric 2014. One of the most suitable instruments to analyze the contents of a website is content analysis, applied by many researchers. Content analysis is a rigorous method for document analysis, mainly known as a systematic way to reduce the sources and quantitatively analyze the documents’ characteristics [68], [69]. However, content analysis can also be performed qualitatively, in order to identify themes and elaborate on the theory [70], [71]. A study of the Modern Hebrew literature on the web by Bar-IIan and Grosisman [72] is a perfect example of this method applicability. Another application of content analysis refers to research about websites of the Fortune 100 companies where content analysis is mentioned as a good approach for analyzing the website’s components in different issues such as characteristics, fields of action and reflection of the mission and vision in action [73]. There has been another study using content analysis on ethical statements of Turkish companies that emphasizes on the justifiability of this method for evaluating ethical concepts of the companies such as vision, mission, ethical principles and other related issues [74]. The application of content analysis in the mentioned research as well as other similar studies [75], [76]-[78] shows that it is possible to analyze social communication and social reporting using the content analysis method which has been frequently used method since the 1970s [79]. Generally, content analysis is argued to be a “distinctive approach to analysis” which seeks to quality the content of a text in “a systematic and replicable manner” [80].
This study observed and evaluated the management practices towards the embeddedness of sustainability in European universities. It is intended by this research using content analysis of UI GreenMetric, universities’ websites and sustainability annual reports to observe universities embeddedness and management practices related to sustainability to answer the main question of the study, which is: How are management systems/practices embedding sustainability in sustainability focused British universities as far as CORE system (curriculum, operations, research, and engagement) is considered? The employed research methodology mainly relies on content analysis of selected universities in the UK from the UI GreenMetric Sustainable University assessment and ranking index. The UI GreenMetric Susataible University assessment and ranking index was selected since it considers the Operations, Curriculum, Research and Enagagements (CORE system) of universities with indicators such as Setting and Infrastructure, Energy and Climate Change, Waste, Water, Transportation and Education. This covers the triple bottom line of sustainability (Environment, Economy and Society) which other indexes like GASU, GEENSHIP, AASHE: STAR, ESM and others, focused mostly on operational Eco-efficiency. The secondary data gathered in this research has been used for developing research variables and conceptual framework of the research. The sample of the study was selected from seventeen (17) sustainable universities in the UK ranked by UI GreenMetric 2014. The total population of the study observed and evaluated in this study are Five (5) top Sustainable Universities in UK according to UI GreenMetric sustainable ranking. Descriptive data analysis involves the calculation of percentage distribution. The data analysis used in this study involves using a percentage table, chart and diagram which describes the common Management Practices towards the embeddedness of sustainability in the selected universities. The study sample includes University of Nottingham, Nottingham Trent University, University of Oxford, University of Bradford and University of Plymouth.
3.2. Data collection
The data collection was carried out on October 2015. This research studied the content of the GreenMetric and the selected university official sustainability website pages and some of their sustainability annual reports to analyze management practices towards the emebeddedness of sustainability. Table 1 shows the sustainability website links of the selected universities.
Table 3. Selected Universities and their Sustainability website Links or Sustainability Annual Report Links
Ranking University URL Sustainability 1 University of Nottingham http://www.nottingham.ac.uk/sustanability/news.aspx 3 Nottingham Trent University http://www.ntu.c.uk/sustainability 5 University of Oxford http://www.admin-ox.ac.uk/estates/ourservices/enivironment 6 University of Bradford http://www.brad.ac.uk/about/ecoversity/?rdr 13 University of Plymouth https://www.plymouth.ac.uk/your-university/sustainability
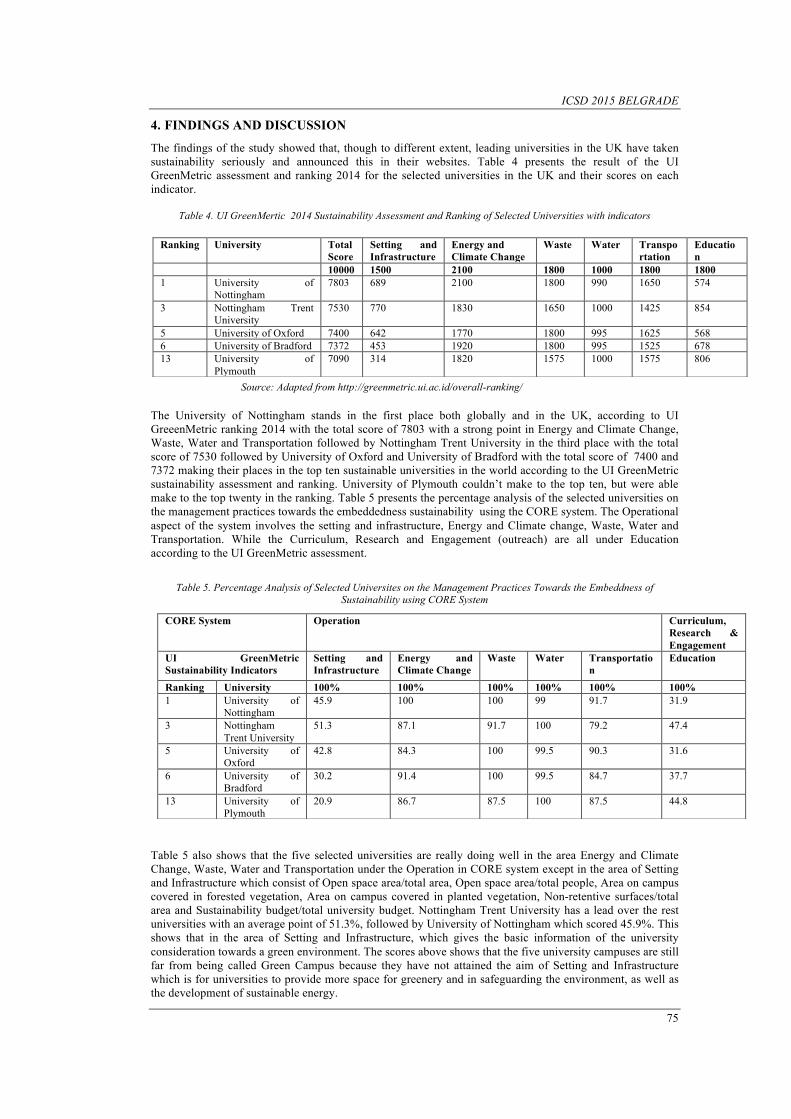
ICSD 2015 BELGRADE
75
4. FINDINGS AND DISCUSSION
The findings of the study showed that, though to different extent, leading universities in the UK have taken sustainability seriously and announced this in their websites. Table 4 presents the result of the UI GreenMetric assessment and ranking 2014 for the selected universities in the UK and their scores on each indicator.
Table 4. UI GreenMertic 2014 Sustainability Assessment and Ranking of Selected Universities with indicators
Source: Adapted from http://greenmetric.ui.ac.id/overall-ranking/
The University of Nottingham stands in the first place both globally and in the UK, according to UI GreeenMetric ranking 2014 with the total score of 7803 with a strong point in Energy and Climate Change, Waste, Water and Transportation followed by Nottingham Trent University in the third place with the total score of 7530 followed by University of Oxford and University of Bradford with the total score of 7400 and 7372 making their places in the top ten sustainable universities in the world according to the UI GreenMetric sustainability assessment and ranking. University of Plymouth couldn’t make to the top ten, but were able make to the top twenty in the ranking. Table 5 presents the percentage analysis of the selected universities on the management practices towards the embeddedness sustainability using the CORE system. The Operational aspect of the system involves the setting and infrastructure, Energy and Climate change, Waste, Water and Transportation. While the Curriculum, Research and Engagement (outreach) are all under Education according to the UI GreenMetric assessment.
Table 5. Percentage Analysis of Selected Universites on the Management Practices Towards the Embeddness of Sustainability using CORE System
Table 5 also shows that the five selected universities are really doing well in the area Energy and Climate Change, Waste, Water and Transportation under the Operation in CORE system except in the area of Setting and Infrastructure which consist of Open space area/total area, Open space area/total people, Area on campus covered in forested vegetation, Area on campus covered in planted vegetation, Non-retentive surfaces/total area and Sustainability budget/total university budget. Nottingham Trent University has a lead over the rest universities with an average point of 51.3%, followed by University of Nottingham which scored 45.9%. This shows that in the area of Setting and Infrastructure, which gives the basic information of the university consideration towards a green environment. The scores above shows that the five university campuses are still far from being called Green Campus because they have not attained the aim of Setting and Infrastructure which is for universities to provide more space for greenery and in safeguarding the environment, as well as the development of sustainable energy.
Ranking University Total Score
Setting and Infrastructure
Energy and Climate Change
Waste Water Transportation
Education
10000 1500 2100 1800 1000 1800 1800 1 University of
Nottingham 7803 689 2100 1800 990 1650 574
3 Nottingham Trent University
7530 770 1830 1650 1000 1425 854
5 University of Oxford 7400 642 1770 1800 995 1625 568 6 University of Bradford 7372 453 1920 1800 995 1525 678 13 University of
Plymouth 7090 314 1820 1575 1000 1575 806
CORE System Operation Curriculum, Research & Engagement
UI GreenMetric Sustainability Indicators
Setting and Infrastructure
Energy and Climate Change
Waste Water Transportation
Education
Ranking University 100% 100% 100% 100% 100% 100% 1 University of
Nottingham 45.9 100 100 99 91.7 31.9
3 Nottingham Trent University
51.3 87.1 91.7 100 79.2 47.4
5 University of Oxford
42.8 84.3 100 99.5 90.3 31.6
6 University of Bradford
30.2 91.4 100 99.5 84.7 37.7
13 University of Plymouth
20.9 86.7 87.5 100 87.5 44.8

ICSD 2015 BELGRADE
76
Figure 3. Analysis of Selected Universities on the Management Practices towards the Embeddness of Sustainability using
Bar Chart
Figure 3 presents the chart analysis of the performance of the selected universities. It is obvious that in the area of Operation of sustainability in the CORE system, which deals with the environment of the universities. The management of universities with University of Nottingham on the lead with a 100% score, has been able to attain to a high extent the Eco-efficiency level of sustainability, which are the energy efficient appliance usage, renewable energy usage policy, total electricity use, energy conservation program, green building, climate change adaptation and mitigation program, greenhouse gas emission reduction policy. Universities are still expected to increase the effort in energy efficiency of their building and to care more about nature and energy resources. In the area of waste, waste treatment and recycling activities which are major factors in creating a sustainable environment. The managements of the selected universities with University of Nottingham, University of Oxford and University of Bradford with 100% scores, have been able to manage the activities of university staff and students on campus in reducing the production of waste through some programs and waste treatments such as, recycling program, toxic waste recycling, organic waste treatment, inorganic waste treatment, sewerage disposal, policy to reduce the use of paper and plastic on campus have been implemented and attained in these universities. Also, university managements with Nottingham Trent University and University of Plymouth with 100% scores, have been able to decrease water usage, increase conservation program, and protect the habitat to achieve water conservation program and piped water use. In the area of transportation, university managements with the University of Nottingham in the lead with 91.7% score. Knowing that transportation system plays an important role on the carbon emission and the pollutant level in university. The managements of the selected universities implemented transportation policy to limit the number of motor vehicles on campus, the use of campus bus and bicycle was encouraging for a healthier environment. The pedestrian policy which encourages students and staff to walk around campus, and avoid using private vehicle and the use of environmentally friendly public transportation which decreases the carbon footprint around campus were implemented.
Curriculum, Research and Engagement (outreach) which forms the rest of the CORE system are under Education which includes Curriculum:- Sustainability courses/total courses, Reserach:- Sustainability research funding/total research funding and Engagement:- Sustainability publications, Sustainability events, Sustainability organizations (student) and Sustainability website, in UI GreenMetric sustainability assessment indicators showed that the five (5) UK universities are really below average performance with Nottingham Trent University with 47.4% score on the lead against others. İt is clear that the University of Nottingham, Nottingham Trent University, University of Oxford, University of Bradford and University of Plymouth has not been able to meet up with the critical role universities have in creating the new generation concerned with sustainability considering the demand from universities since they prepare most of the professionals, who manage and teach both public and private institutions in the society because as major contributors to the values, health and wellbeing of society, universities have a fundamental responsibility to teach, train and research for sustainability. This development is essential, as future professionals will be working globally with companies that increasingly have sustainability on their agenda. Figure 4 shows a summary of the common Management practices of the studied universities toward the embeddedness of sustainability.
0
20
40
60
80
100
120
University of
Nottingham
Nottingham Trent
University
University of Oxford
University of Bradford
University of Plymouth
Setting and Infrastruction
Energy and Climate Change
Waste
Water
Transportation
Education
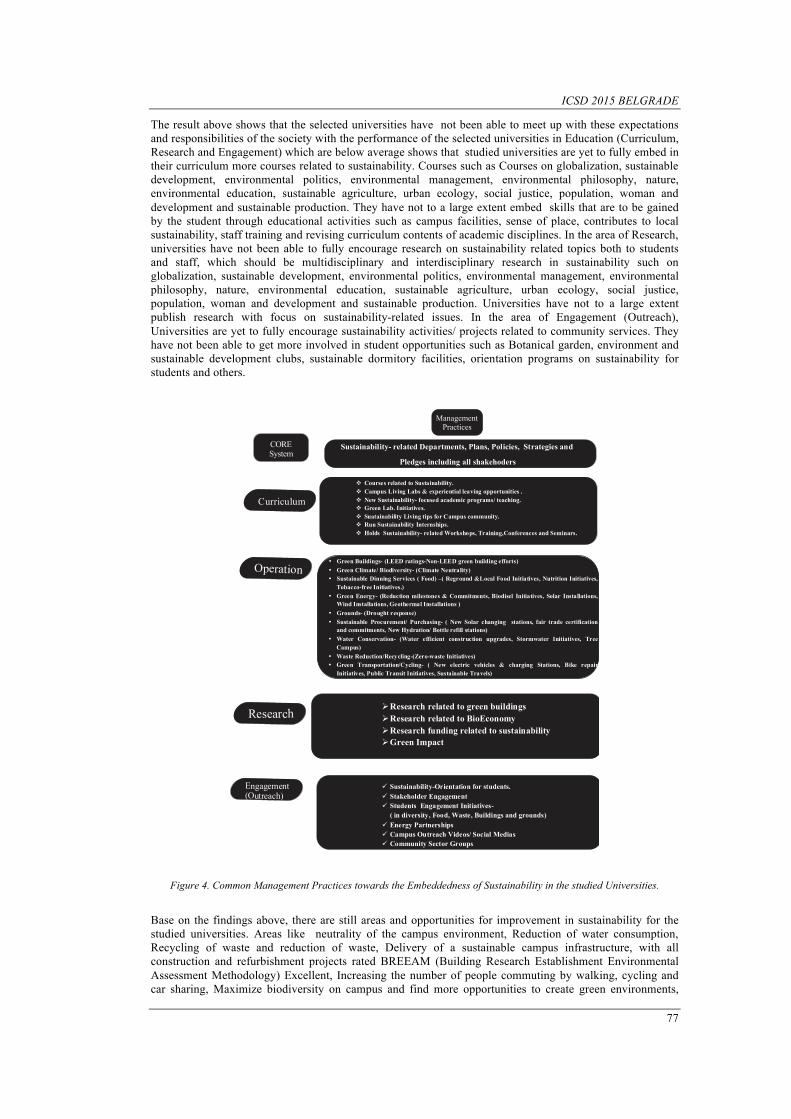
ICSD 2015 BELGRADE
77
The result above shows that the selected universities have not been able to meet up with these expectations and responsibilities of the society with the performance of the selected universities in Education (Curriculum, Research and Engagement) which are below average shows that studied universities are yet to fully embed in their curriculum more courses related to sustainability. Courses such as Courses on globalization, sustainable development, environmental politics, environmental management, environmental philosophy, nature, environmental education, sustainable agriculture, urban ecology, social justice, population, woman and development and sustainable production. They have not to a large extent embed skills that are to be gained by the student through educational activities such as campus facilities, sense of place, contributes to local sustainability, staff training and revising curriculum contents of academic disciplines. In the area of Research, universities have not been able to fully encourage research on sustainability related topics both to students and staff, which should be multidisciplinary and interdisciplinary research in sustainability such on globalization, sustainable development, environmental politics, environmental management, environmental philosophy, nature, environmental education, sustainable agriculture, urban ecology, social justice, population, woman and development and sustainable production. Universities have not to a large extent publish research with focus on sustainability-related issues. In the area of Engagement (Outreach), Universities are yet to fully encourage sustainability activities/ projects related to community services. They have not been able to get more involved in student opportunities such as Botanical garden, environment and sustainable development clubs, sustainable dormitory facilities, orientation programs on sustainability for students and others.
Curriculum
ManagementPractices
CORE System
Operation
Research
Engagement(Outreach)
Sustainability- related Departments, Plans, Policies, Strategies and
Pledges including all shakehoders
• Green Buildings- (LEED ratings-Non-LEED green building efforts)• Green Climate/ Biodiversity- (Climate Neutrality)• Sustainable Dinning Services ( Food) –( Reground &Local Food Initiatives, Nutrition Initiatives,Tobacco-free Initiatives.)
• Green Energy- (Reduction milestones & Commitments, Biodisel Initiatives, Solar Installations,Wind Installations, Geothermal Installations )
• Grounds- (Drought response)• Sustainable Procurement/ Purchasing- ( New Solar changing stations, fair trade certificationand commitments, New Hydration/ Bottle refill stations)
• Water Conservation- (Water efficient construction upgrades, Stormwater Initiatives, TreeCampus)
• Waste Reduction/Recycling-(Zero-waste Initiatives)• Green Transportation/Cycling- ( New electric vehicles & charging Stations, Bike repairInitiatives, Public Transit Initiatives, Sustainable Travels)
ü Sustainability-Orientation for students.ü Stakeholder Engagementü Students Engagement Initiatives-( in diversity, Food, Waste, Buildings and grounds)
ü Energy Partnershipsü Campus Outreach Videos/ Social Mediasü Community Sector Groups
ØResearch related to green buildingsØResearch related to BioEconomyØResearch funding related to sustainabilityØGreen Impact
v Courses related to Sustainability.v Campus Living Labs & experiential leaving opportunities .v New Sustainability- focused academic programs/ teaching.v Green Lab. Initiatives.v Suatainability Living tips for Campus community.v Run Sustainability Internships.v Holds Sustainability- related Workshops, Training,Conferences and Seminars.
Figure 4. Common Management Practices towards the Embeddedness of Sustainability in the studied Universities.
Base on the findings above, there are still areas and opportunities for improvement in sustainability for the studied universities. Areas like neutrality of the campus environment, Reduction of water consumption, Recycling of waste and reduction of waste, Delivery of a sustainable campus infrastructure, with all construction and refurbishment projects rated BREEAM (Building Research Establishment Environmental Assessment Methodology) Excellent, Increasing the number of people commuting by walking, cycling and car sharing, Maximize biodiversity on campus and find more opportunities to create green environments,
ICSD 2015 BELGRADE
78
Creating a sustainable food culture, providing fair-trade products where possible and working with local food partners to increase the demand and supply of seasonal, local and organic food, Embedding sustainable procurement by ensuring the University purchases from socially, ethically and environmentally responsible businesses, Support to the community and local, regional and social enterprise through business community partnerships, Provision of education for sustainable development, Development of education potential for sustainable development by enriching learning across the formal and non-formal curriculum, Promotion and advancement of education for sustainable development research in relation to enhancing the student and staff experience and building a more sustainable university, Advancement and articulate the central role of education and learning in furthering the University's cross-institutional sustainability agenda - and in relation to sustainability leadership and profile in the Higher Education sector. Undertake substantial sustainability research to deliver solutions to the world's most pressing sustainability problems, Facilitate internal communications and enhance internal research interaction for sustainability, Promote sustainability research, making the Institute of Sustainability Solutions Research the single point of contact for organizations wanting to engage with the University on sustainability. They also need to increase the impact of sustainability research, Support understanding of multi-disciplinary funding. Identify and communicate funding opportunities and support teams and their project ideas for sustainability research.
5. CONCLUSION AND LIMITATIONS
The study shows that all the five (5) UK universities studied are, in some way or another, there are significant progress in embedding sustainability in their management practices and announces it on their website content. It is obvious that from observation made in this study, that the studied universities have sustainability as part of their goal and have plans, policies, strategies and have gone ahead to implement most of their sustainability goals in order to meet up with the demand that is on universities to bring about sustainable society starting from their management practices. From the findings, the five UK universities have go a long in achieving the Operational Eco--efficiency ( Energy and Climate Change, Waste reduction/ recycling ,Water conservation and Transportation) aspect of the CORE system except in the area of setting and infarstracture which demands universities to provide more space for greenery and in safeguarding the environment, as well as the development of sustainable energy thereby achieving a Green Campus which all of them were below average base on their performance except Nottingham Trent University that was the only university that performed above average. Also, in the area of Education which consist of (Curriculum, Reasearch and Engagement) in the CORE System all the studied universities performed below average and need to really set up in this aspect of sustainability which is very important in the education of the students and the society about sustainability.
A limitation of this study is lack of considering the effectiveness of management practices toward the Embeddedness of sustainability of universities. While this paper observed management practices towards the Embeddedness of sustainability based on the assessment of GreenMetric sustainability ranking and the websites contents and sustainability annual reports of universities, the perceptions of their stakeholders about these sustainable practices are not measured. This is important, because the practices might not meet the stakeholders’ expectations or even create a negative impression that the university is doing this simply for the sake of promoting itself rather than as a commitment towards sustainability. Future studies can look into the effect of these practices on stakeholders’ perception and loyalty on the universities.
ACKNOWLEDGEMENTS
The authors would like to express our sincere thanks to the organizers of this conference for considering this paper as important for the conference and for their patience and support. Thanks to Prof. Refika Bakoglu for her constructive comments and suggestions on the paper. It was much appreciated.
REFERENCES
[1] United Nations World Commission on Environment and Development,Brundtlandkommissionen. Chapter 3: Towards Sustainable Development. Our Common Future. Oxford: Oxford University Press, 1987.
[2] Madeira, A.C., Carravilla, M.A., Oliveira, J.F., Costa, C., “A methodology for sustainability evaluation and reporting in higher education institutions.” High.Educ. Policy 24, 459e479,2011.
[3] Alshuwaikhat, H.M., Abubakar, I., “An integrated approach to achieving campus sustainability: assessment of the current campus environmental management practices.” J. Clean. Prod. 16, 1777e1785, 2008
[4] Milutinovi_c, S., Nikoli_c, V., “Rethinking higher education for sustainable development in Serbia: an assessment of Copernicus charter principles in current higher education practices.” J. Clean. Prod. 62 (1), 107e113,2014.
[5] Jorge, M.L, madueno,J.H, Cejas,M.Y.C,Pena,F.J.A, “An approach to the implementation os sustainability practices in Spanish universities.”.J.Clean.Prod.xxx(2014)1-11,2013.
[6] Ceulemans, K., De Prins, M., Cappuyns, V., De Coninck, W., “ Integration of sustainable development in higher education’s curricula of applied economics:large-scale assessments, integration strategies and barriers”. J. Manag. Organ. 17(4), 621e640, 2011
ICSD 2015 BELGRADE
79
[7] Lozano, R., Lukman, R., Lozano, F., Huisingh, D., Lambrechts, W., “Declarations for sustainability in higher education: becoming better leaders, through addressing the university system.” J. Clean. Prod. 16 (17), 10e19,2013.
[8] Shephard, K., Furnari, M.,” Exploring what university teachers think about education for sustainability.” Stud. High. Educ. 38 (10), 1577e1590,2013.
[9] Lozano, R., “Incorporation and institutionalization of SD into universities: breaking through barriers to change,” Journal of Cleaner Production, Volume 14, Issues 9–11, 2006, Pages 787-796,2006.
[10] Calder, M., Clugston, M.,” International efforts to promote higher education for sustainable development.“Plan. High. Educ. 31, 30e44,2003.
[11] Lee, K., Barker, M., Mouasher, A., “Is it even espoused? An exploratory study of commitment to sustainability as evidenced in vision, mission, and graduate attribute statements in Australian universities.” J. Clean. Prod. 48 (10), 20e28,2013.
[12] Fadeeva, Z., Mochizuki, Y.,“Higher education for today and tomorrow: university appraisal for diversity, innovation and change towards sustainable development.” Sustain. Sci. 5 (2),249e256,2010.
[13] Ferrer-Balas, D., Lozano, R., Huisingh, D., Buckland, H., Ysern, P., Zilahy, G.,”Going beyond the rhetoric: system-wide changes in universities for sustainable societies.” J. Clean. Prod. 18 (7), 607e610. http://dx.doi.org/10.1016/j.jclepro.2009.12.009,2010.
[14] Koester, B.J., Efli, J., Vann, J.,“Greening of the campus: a whole-systems approach.” J. Clean. Prod. 14 (9e11), 769e779,2006.
[15] Leal Filho, W.,“Integrating environmental education and environmental management.” Environmental Management and Health 8 (2), 80e82,1997.
[16] de Castro, R., Charbel José Chiappetta Jabbour, C.J.C, “Evaluating sustainability of an Indian university.” 2 Journal of Cleaner Production xxx (2015) 1e12, 2012
[17] Jabbour, C.J.C.,“Greening of business schools: a systemic view.” International Journal of Sustainability in Higher Education 11 (1), 49e60,2010.
[18] Emanuel, R. “College students’ perceptions of campus sustainability.” International Journal of Sustainability in
Higher Education,12 (1), 79-92, 2010. [19] Clarke, A., Kouri, R.“Choosing an appropriate university or college environmental management system,”
Journal of Cleaner Production, Volume 17, Issue 11, 971-984, 2009. [20] Lundberg, K., Balfors, B., Folkeson, L. “Framework for environmental performance measurement in a Swedish
public sector organization,” Journal of Cleaner Production, Volume 17,Issue 11, July, Pages 1017-1024,2009. [21] Vecchio, “Steps toward sustainability in higher education institutions – Management practices on focus.”
Gothemburg University – Master Programme in Global Studies, Sweden, Master Thesis, 2012. [22] Waheed, B., Khan, F. I., Veitch, B.”Developing a quantitative tool for sustainability assessment of HEIs.”
International Journal of Sustainability in Higher Education, Vol. 12 Iss: 4,pp.355 – 368, 2011. [23] Sibbel, A., “Pathways towards sustainability through higher education.” Int. J. Sustain. High. Educ. 10 (1),
68e82,2009. [24] Rieckmann, M.,”Future-oriented higher education: which key competencies should be fostered through
university teaching and learning?” Futures 44 (2),127e135,2012. [25] Kiron, D., Kruschwitz, N., Haanaes, K., von Steng Velken, I.,”Sustainability nears a tipping point.” MIT Sloan
Manag. Rev. 53, 69e74, 2012. [26] Steiner, L., Sundstr€om, A., Sammalisto, K., “An analytical model for university identity and reputation
strategy work.” High. Educ. 65 (4), 401e415, 2013. [27] Emanuel, R., Adams, J. N.”College students' perceptions of campus sustainability.” International Journal of
Sustainability in Higher Education, Vol. 12 Iss: 1, 79 – 92, 2011. [28] Rogers, P Peter., Jalal, F Kazi., and Boyd, A John. An introduction to Sustainable Development. Trowbridge:
Cromwell Press, 2008. [29] Ahlberg, “The sustainability movement - The institutionalization of sustainability in organizations “Bachelor
thesis in the main field of work science, Sociology and Work science, University of Gothenburg, Sweden, May, 2014.
[30] Blewitt, “Higher education for a sustainable world.” Aston University, Birmingham, UK ,The current issue and full text archive of this journal is available atwww.emeraldinsight.com/0040-0912.htm, 2010.
[31] IAU “IAU conference: education for a sustainable future”, paper presented at Conference General Report, International Association of Universities, available at: www.iauaiu. net/sd/sd_confprague.html, 2006.
[32] Wals, A.E.J. and Jickling, B. “Sustainability’ in higher education: from doublethink and newspeak to critical thinking and meaningful learning”, International Journal of Sustainability in Higher Education, Vol. 3 No. 3, pp. 221-32,2002.
[33] UNESCO, United Nations Decade of Education for Sustainable Development (2005-2014),United Nations Educational, Cultural and Scientific Organization, Paris, available at:http://unesdoc.unesco.org/images/0014/001486/148654e.pdf , 2005.
[34] Selby, D. “As the heating happens: education for sustainable development or education for sustainable contraction?”, International Journal of Innovation and Sustainable Development, Vol. 2 Nos 2/3, pp. 249-67,2007.
[35] Gibbons, M., Limoges, C., Nowotny, H., Schwartzman, S., Scott, P. and Trow, M.The New Production of Knowledge: The Dynamics of Science and Research in Contemporary Societies. Sage, London, 1994.
[36] Harloe, M. and Perry, B. “Rethinking or hollowing out the university? External engagement and internal transformation in the knowledge economy”, Higher Education Management and Policy, Vol. 17 No. 2, pp. 157-306,2005.
[37] McKeown, R., Hopkins, C.A., Rizzi, R., Chrystalbridge, M., Education for Sustainable Development Toolkit. Version 2. Waste Management Research and Education Institute, University of Tennessee, USA. Available at: http://www.esdtoolkit.org/,2002.
ICSD 2015 BELGRADE
80
[38] Leicht, A., Interview: Fyra Frågor till Alexander Leicht...Chef For Avdelningen For Education for Sustainable Development (ESD) På Unescos Sekretariat I Paris. http://www.unesco.se/Bazment/Unesco/sv/Svenska-Unescoradets-arbete/ intervju_alexanderleicht.aspx, 2013.
[39] Copernicus Alliance, The Rioþ20 Treaty on Higher Education. http://hetreatyrio20.com/. http://www.uncsd2012.org/index.php?page¼view&type¼1006&menu¼153&nr¼34, 2013.
[40] Dlouh_a, J., Huisingh, D., Bartron, A., “Learning networks in higher education: universities in search of making effective regional impacts.” J. Clean. Prod. 49,5e10,2013.
[41] Wals, A.E.J., “Sustainability in higher education in the context of the UN DESD: a review of learning and institutionalization processes.” J. Clean. Prod. 62, 8e15,2014.
[42] Mulder, K.F., Segal_as, J., Ferrer-Balas, D., “How to educate engineers for/in sustainable development Ten years of discussion, remaining challenges.” Int. J. Sustain. High. Educ. 13 (3), 211e218,2012.
[43[ Barth, M., Rieckmann, M., “Academic staff development as a catalyst for curriculum change towards education for sustainable development: an output perspective. “J. Clean. Prod. 26, 28e36,2012.
[44] Sterling, S., Higher education, sustainability, and the role of systematic learning. In: Corcoran Wals, A.E.J. (Ed.), Higher Education and the Challenge of Sustainability. Problems, Promise, and Practice. Kluwer Academic Publishers,Dordrecht, the Netherlands, pp. 49e70,2004.
[45] Warburton, K.,“Deep learning and education for sustainability.” Int. J. Sustain. High. Educ. 4 (1), 44e56,2003. [46] Cortese, A.D., “The critical role of higher education in creating a sustainable future” Plan. High. Educ. 15e22,
MarcheMay 2003. [47] Hills, E. Book review: John Aber, Tom Kelly and Bruce Mallory (eds.) “The Sustainable Learning Community:
One University’s Journey to the Future.” Journal of Agriculture Environmental Ethics, Vol. 24, 87-90, 2011. [48] Christensen, P., Thrane, M., Herreborg Jørgensen, T., Lehmann, M. (2009), "Sustainable development:
Assessing the gap between preaching and practice at Aalborg University",International Journal of Sustainability in Higher Education, Vol. 10 Issue 1, pp.4 – 20, 2009.
[49] Ferrer-Balas, D., Adachi, J., Banas, S., Davidson, C., Hoshikoshi, A., Mishra, A., Motodoa, Y.,Onga, M.,
Ostwald, M. “An international comparative analysis of sustainability transformation across seven universities.” International Journal of Sustainability in Higher Education, Vol. 9 Iss: 3 pp. 295 – 316,2008.
[50] Lukman, R., Glavic, P. “What are the key elements of a sustainable university?” Clean Technology Environmental Policy, Vol. 9, 103-114,2007.
[51] Lozano R. “Envisioning sustainability three-dimensionally. Working paper series no. 39. Centre for Business Relationships, Accountability, Sustainability and Society” (BRASS). Available online: http://works.bepress.com/rodrigo lozano/5; 2007 [15 May 2009].
[52] Lukman, R., Krajnc, D., Glavi_c, P., “University ranking using research, educational and environmental indicators.” J. Clean. Prod. 18, 619e628,2010.
[53] Shriberg, M., Assessing sustainability: criteria, tools, and implications. In: Corcoran, P.B., Wals, A.E.J. (Eds.), Higher Education and the Challenge of Sustainability:Problematics, Promise, and Practice. Kluwer Academic Publishers,Dordrecht, The Netherlands, pp. 71e86,2004.
[54] Pope, J., Annandale, D., Morrison-Saunders, A., “Conceptualizing sustainability assessment.” Environ. Impact Assess. Rev. 24, 595e616,2004
[55] Lozano, R., “A tool for a graphical assessment of sustainability in universities” (GASU). J. Clean. Prod. 14, 963e972, 2006b
[56] Hak, T., Moldan, B., Dahl, A.L,Sustainability Indicators: a Scientific Assessment, Scientific Committee on Problems of the Environment (SCOPE) Series. Island Press, Washington and London,2007.
[57] Ness, B., Urbel-Piirsalu, E., Anderberg, S., Olsson, L.,”Categorising tools for sustainability assessment.” Ecol. Econ. 60, 498e508,2007.
[58] Fadeeva, Z., Mochizuki, Y.,”Higher education for today and tomorrow: university appraisal for diversity, innovation and change towards sustainable development.” Sustain. Sci. 5, 249e256,2010.
[59] Ramos, T., Pires, S.M.,”Sustainability assessment: the role of indicators.” In: Caeiro, S., Filho, W.L., Jabbour, C., Azeiteiro, U.M. (Eds.), “Sustainability Assessment Tools in Higher Education Institutions: Mapping Trends and Good Practices Around the World.” Springer, Heidelberg and New York,pp. 81e100, 2013.
[60] Boer, P., “Assessing sustainability and social responsibility in higher education assessment frameworks explained.” In: Caeiro, S., Filho, W.L., Jabbour, C., Azeiteiro, U.M. (Eds.), “Sustainability Assessment Tools in Higher Education Institutions:Mapping Trends and Good Practices Around the World.” Springer,Heidelberg and New York, pp. 121e138,2013.
[61] Saadatian, O., Sopian, K.B., Salleh, E., “Adaptation of sustainability community indicators for Malaysian campuses as small cities.” Sustain. Cities Soc. 6, 40e50, 2013.
[62] Thomashow, M., 2014. The Nine Elements of a Sustainable Campus. MIT Press,Cambridge, MA, 2014 [63] Koshy, K.C., Nor, N.M., Sibly, S., Rahim, A.A., Jegatesen, G., Muhamad, M., “An indicator-based approach to
sustainability monitoring and mainstreaming at Universiti Sains Malaysia.” In: Caeiro, S., Filho, W.L., Jabbour, C., Azeiteiro, U.M.(Eds.), “Sustainability Assessment Tools in Higher Education Institutions: Mapping Trends and Good Practices Around the World.” Springer, Heidelberg and New York, pp. 237e258,2013.
[64] Holdsworth, S., Caswell, T., “Protecting the Future: Stories of Sustainability from RMIT University.” CSIRO Publishing, Collingwood, VIC. Australia, 2004.
[65] Miller, C.L., Implementing Sustainability: the New Zealand Experience. Routledge, London and New York, 2011.
[66] Lauder, A,Sari,R.F, Suwartha, N., Gunawan Tjahjono,G., “Critical review of a global campus sustainability ranking: GreenMetric” Journal of Cleaner Production xxx (2015) 1e12
[67] GreenMetric, (2014),[Online]. Available:http://greenmetric.ui.ac.id/ranking-by-subject/ [68] Jupp, V. (Ed.), The SAGE Dictionary of Social Research Methods. Sage Publications
Ltd, London, 2006.
ICSD 2015 BELGRADE
81
[69] Onwuegbuzie, A.J., Leech, N.L., Collins, M.T.,”Qualitative analysis techniques for the review of the literature.” Qual. Rep. 17 (56), 1e28,2012
[70] Berg, B.L., Qualitative Research Methods for the Social Sciences, sixth ed. Allyn and Bacon, Boston, MA, 2001.
[71] Krippendorff, K.,Content Analysis: an Introduction to Its Methodology. Sage, Thousand Oaks, 2004. [72] Bar-Ilan J, Groisman N, “Modern Hebrew literature on the Web: a content analysis.” Online Inform. Rev., 27(2):
77-86,2003. [73] Perry M, Bodkin C, “Content analysis of the fortune 100 company websites.” Corp. Comm. Int. J., 5(2): 87-96,
2000. [74] Halici A, Kucukaslan A, “Turkish companies ethical statements: content analysis with comparisons.” Manage.
Res. News, 28(1): 45-61, 2005. [75] Chatov R, “What Corporate Ethics Statements Say?” Calif. Manage. Rev., 22: 20-29, 1980. [76] Cressey D, Moore CA, “Managerial Values and Corporate Codes of Ethics.” Calif. Manage. Rev., 25: 53-
77,1983. [77] Mathews MC, “Codes of Ethics: Organizational Behavior and Misbehavior.” Res. Corp. Soc. Perform., 9: 107-
130, 1987. [78] Stevens B, “Hotel Ethical Codes: A Content Analysis.” Int. Hosp. Manage., 16: 261-271, 1992. [79] Milne MJ, Adler RW, “Exploring the reliability of social and environmental disclosures content analysis.
“Account. Audit. Account. J. 12(2): 237-256, 1999. [80] Bryman A, Soc. Res. Methods. 2nd edition. Oxford: Oxford University Press, 2004.
BİOGRAPHY
Ugbaja Solomon Chukwuemeka is a young and active Nigerian researcher and has lived in Istanbul, Turkey since 2014. He is a Postgraduate (MBA) student of the Department of Business Administration, Okan University of Istanbul, Tukey. He Obtained a B. Ed double honour degree in Education and English Language from Nassarawa State University, Keffi, Nigeria in 2011. He is currently working on his thesis, which is on Management Practices towards the Embeddedness of Sustainability in Universities for his MBA, masters degree at Okan University, Istanbul, Turkey.
Refika Bakoğlu is from Turkey. She obtained her BA in Business Administration, from Marmara University,1990. Got her MA-in Management- Thesis on “Development Strategies for Public Relations: A Case Study Analysis” from Marmara University, 1993.She went further to obtain her PHD- Thesis on “The Relationship Between Strategic Roles of Middle Management and Organizational Performance: Cases for Strategic Roles of Middle Management” from Marmara University, 1999. She has experimental training skills, therapy (innerspeak) and is presently a Prof. Dr., Head of Sustainability and Quality Management Master Program at Marmara University
ICSD 2015 BELGRADE
82
Effects on Global Warming of Insulation in Pipe according to Life Cycle Assessment
Yusuf Başoğul 1, Ali Keçebaş 2, Yavuz Demirci 3
Abstract Energy consumption in space heating will be significantly reduced through the use of appropriate insulation materials, thereby reducing fossil fuel consumption and its polluting effects on the environment. Even in well-insulated buildings, energy consumption and emissions can be reduced further by insulating heating pipes. In particular, water supply, fire protection and district heating/cooling systems and industrial and chemical processing plants contain intricate and costly piping configurations. Un-insulated distribution and return pipelines are a prominent source of wasted energy. Adding insulation for energy conservation in pipe systems not only reduces heat transmission losses but also reduces its polluting products. The use of thermal insulation is one of the most effective methods of energy conservation and environmental protection in buildings and pipes. Therefore, the selection of a proper insulation material and determination of optimum insulation thickness are particularly vital. In this study, a novel method related with life cycle assessment analysis is used for determining the optimum insulation thickness of pipe. The life cycle processes affected by the pipe insulation application have been characterized in terms of their environmental impacts. The life cycle assessment method is performed by using energetic and environmental criteria, which determined the optimum insulation thicknesses in pipe insulation applications.
Keywords: Pipe Insulation; Global Warming; LCA Analysis; Optimum Insulation Thickness.
1. INTRODUCTION
Energy and environment are two vital aspects of the conservation of modern and healthy living conditions. Energy is one of the most important inputs required to maintain social and economic improvement in a country. It is necessary that energy demand should occur at the right time economically, and should be of good quality and respectful of increasing environmental consciousness in order to preserve national development and a high standard of living [1]. Furthermore; environmental pollution, especially global warming is one of the most acute problems brought by modern life. A major proportion of this problem arises due to pollutants emitted from residences and industrial installations. Currently, the total CO2 emissions from consumption of fossil fuel are about 0.73 million metric tons. It is estimated that CO2 contributes about %50 to the anthropogenic greenhouse effect [2].
Energy consumption can be examined under four main sectors such as industrial, building (residential), transportation and agriculture. These sectors especially building have recently received considerable attention on energy consumption because of heat losses. Energy consumption in this sector is one of the main parts of the total energy consumption in most countries. Energy consumption in space heating will be significantly reduced through the use of appropriate insulation materials, thereby reducing fossil fuel consumption and its polluting effects on the environment. Even in well-insulated buildings, energy consumption and emissions can be reduced further by insulating heating pipes. In particular, water supply, fire protection and district heating/cooling systems and industrial and chemical processing plants contain intricate and costly piping
1Corresponding author: Adıyaman University, Department of Mechanical Engineering, 02040, Adıyaman, Turkey, [email protected] 2Muğla Sıtkı Koçman University, Department of Energy Systems Engineering, 48000, Menteşe/Muğla, Turkey. [email protected] 3Adıyaman University, Department of Environment Engineering, 02040, Adıyaman, Turkey, [email protected]
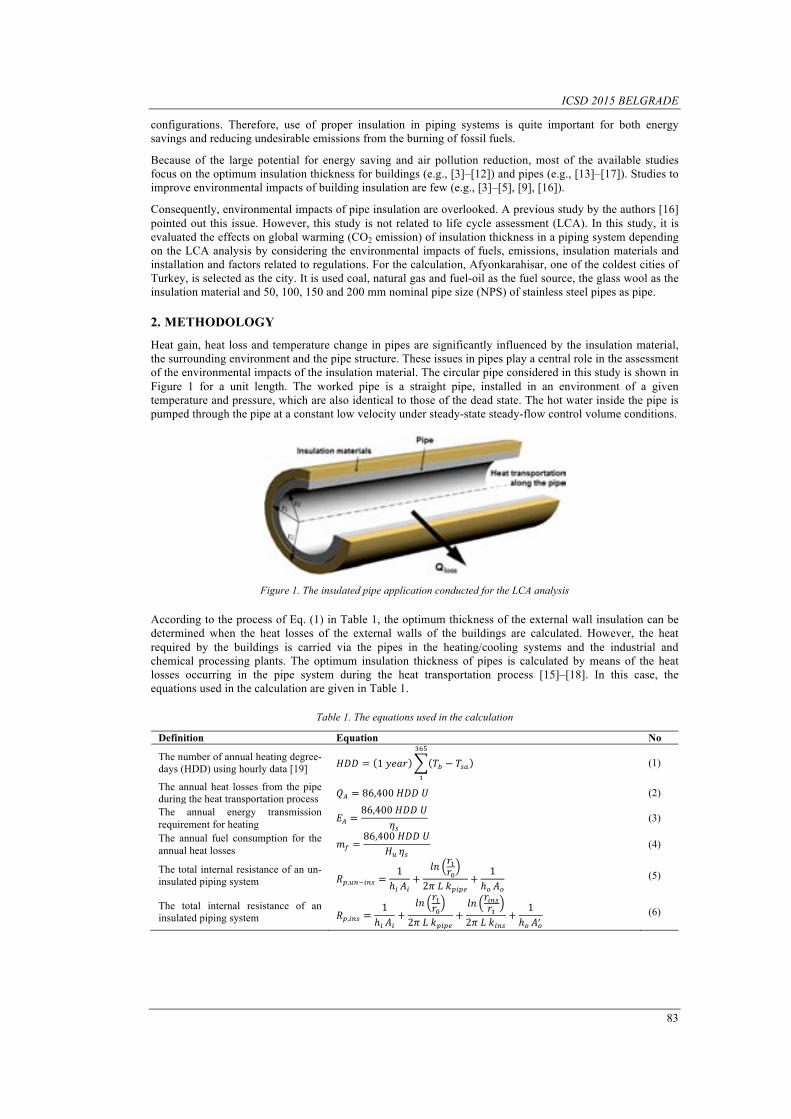
ICSD 2015 BELGRADE
83
configurations. Therefore, use of proper insulation in piping systems is quite important for both energy savings and reducing undesirable emissions from the burning of fossil fuels.
Because of the large potential for energy saving and air pollution reduction, most of the available studies focus on the optimum insulation thickness for buildings (e.g., [3]–[12]) and pipes (e.g., [13]–[17]). Studies to improve environmental impacts of building insulation are few (e.g., [3]–[5], [9], [16]).
Consequently, environmental impacts of pipe insulation are overlooked. A previous study by the authors [16] pointed out this issue. However, this study is not related to life cycle assessment (LCA). In this study, it is evaluated the effects on global warming (CO2 emission) of insulation thickness in a piping system depending on the LCA analysis by considering the environmental impacts of fuels, emissions, insulation materials and installation and factors related to regulations. For the calculation, Afyonkarahisar, one of the coldest cities of Turkey, is selected as the city. It is used coal, natural gas and fuel-oil as the fuel source, the glass wool as the insulation material and 50, 100, 150 and 200 mm nominal pipe size (NPS) of stainless steel pipes as pipe.
2. METHODOLOGY
Heat gain, heat loss and temperature change in pipes are significantly influenced by the insulation material, the surrounding environment and the pipe structure. These issues in pipes play a central role in the assessment of the environmental impacts of the insulation material. The circular pipe considered in this study is shown in Figure 1 for a unit length. The worked pipe is a straight pipe, installed in an environment of a given temperature and pressure, which are also identical to those of the dead state. The hot water inside the pipe is pumped through the pipe at a constant low velocity under steady-state steady-flow control volume conditions.
Figure 1. The insulated pipe application conducted for the LCA analysis
According to the process of Eq. (1) in Table 1, the optimum thickness of the external wall insulation can be determined when the heat losses of the external walls of the buildings are calculated. However, the heat required by the buildings is carried via the pipes in the heating/cooling systems and the industrial and chemical processing plants. The optimum insulation thickness of pipes is calculated by means of the heat losses occurring in the pipe system during the heat transportation process [15]–[18]. In this case, the equations used in the calculation are given in Table 1.
Table 1. The equations used in the calculation
Definition Equation No
The number of annual heating degree-days (HDD) using hourly data [19] !"" = 1 !"#$ !! − !!"
!"#
! (1)
The annual heat losses from the pipe during the heat transportation process !! = 86,400 !"" ! (2)
The annual energy transmission requirement for heating !! =
86,400 !"" !!!
(3)
The annual fuel consumption for the annual heat losses !! =
86,400 !"" !!! !!
(4)
The total internal resistance of an un-insulated piping system !!,!"!!"# =
1ℎ! !!
+!" !!
!!2! ! !!"!#
+ 1ℎ! !!
(5)
The total internal resistance of an insulated piping system !!,!"# =
1ℎ! !!
+!" !!
!!2! ! !!"!#
+!" !!"#
!!2! ! !!"#
+ 1ℎ! !!!
(6)
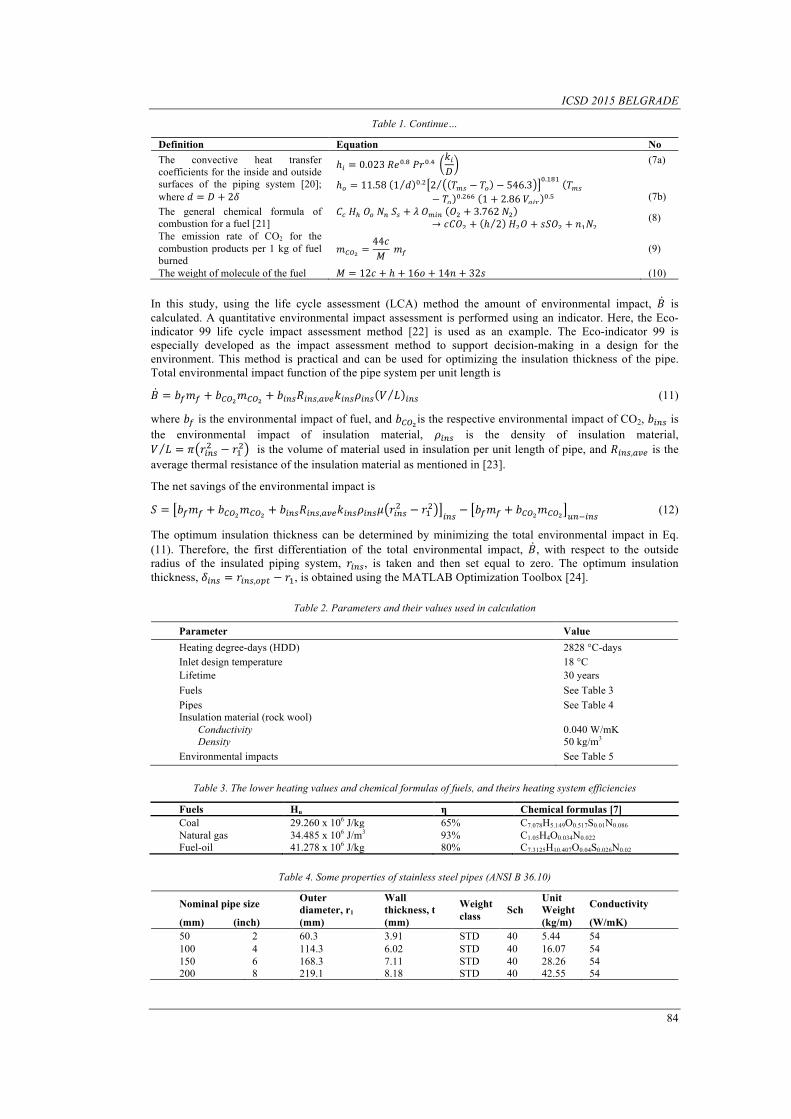
ICSD 2015 BELGRADE
84
Table 1. Continue…
Definition Equation No The convective heat transfer coefficients for the inside and outside surfaces of the piping system [20]; where ! = ! + 2!
ℎ! = 0.023 !"!.! !"!.! !!!
ℎ! = 11.58 1 ! !.! 2 !!" − !! − 546.3 !.!"! !!"− !! !.!"" 1 + 2.86 !!"# !.!
(7a) (7b)
The general chemical formula of combustion for a fuel [21]
!! !! !! !! !! + ! !!"# !! + 3.762 !!→ !!"! + ℎ 2 !!! + !!"! + !!!! (8)
The emission rate of CO2 for the combustion products per 1 kg of fuel burned
!!"! =44!! !! (9)
The weight of molecule of the fuel ! = 12! + ℎ + 16! + 14! + 32! (10)
In this study, using the life cycle assessment (LCA) method the amount of environmental impact, ! is calculated. A quantitative environmental impact assessment is performed using an indicator. Here, the Eco-indicator 99 life cycle impact assessment method [22] is used as an example. The Eco-indicator 99 is especially developed as the impact assessment method to support decision-making in a design for the environment. This method is practical and can be used for optimizing the insulation thickness of the pipe. Total environmental impact function of the pipe system per unit length is
! = !!!! + !!"!!!"! + !!"#!!"#,!"#!!"#!!"# ! ! !"# (11)
where !! is the environmental impact of fuel, and !!"! is the respective environmental impact of CO2, !!"# is the environmental impact of insulation material, !!"# is the density of insulation material, ! ! = ! !!"#! − !!! is the volume of material used in insulation per unit length of pipe, and !!"#,!"# is the average thermal resistance of the insulation material as mentioned in [23].
The net savings of the environmental impact is
! = !!!! + !!"!!!"! + !!"#!!"#,!"#!!"#!!"!! !!"#! − !!! !"# − !!!! + !!"!!!"! !"!!"# (12)
The optimum insulation thickness can be determined by minimizing the total environmental impact in Eq. (11). Therefore, the first differentiation of the total environmental impact, !, with respect to the outside radius of the insulated piping system, !!"#, is taken and then set equal to zero. The optimum insulation thickness, !!"# = !!"#,!"# − !!, is obtained using the MATLAB Optimization Toolbox [24].
Table 2. Parameters and their values used in calculation
Parameter Value Heating degree-days (HDD) 2828 °C-days Inlet design temperature 18 °C Lifetime 30 years Fuels See Table 3 Pipes See Table 4 Insulation material (rock wool)
Conductivity Density
0.040 W/mK 50 kg/m3
Environmental impacts See Table 5
Table 3. The lower heating values and chemical formulas of fuels, and theirs heating system efficiencies
Fuels Hu η Chemical formulas [7] Coal 29.260 x 10⁶ J/kg 65% C7.078H5.149O0.517S0.01N0.086 Natural gas 34.485 x 10⁶ J/m3 93% C1.05H4O0.034N0.022 Fuel-oil 41.278 x 10⁶ J/kg 80% C7.3125H10.407O0.04S0.026N0.02
Table 4. Some properties of stainless steel pipes (ANSI B 36.10)
Nominal pipe size Outer diameter, r1
Wall thickness, t Weight
class Sch Unit Weight Conductivity
(mm) (inch) (mm) (mm) (kg/m) (W/mK) 50 2 60.3 3.91 STD 40 5.44 54 100 4 114.3 6.02 STD 40 16.07 54 150 6 168.3 7.11 STD 40 28.26 54 200 8 219.1 8.18 STD 40 42.55 54
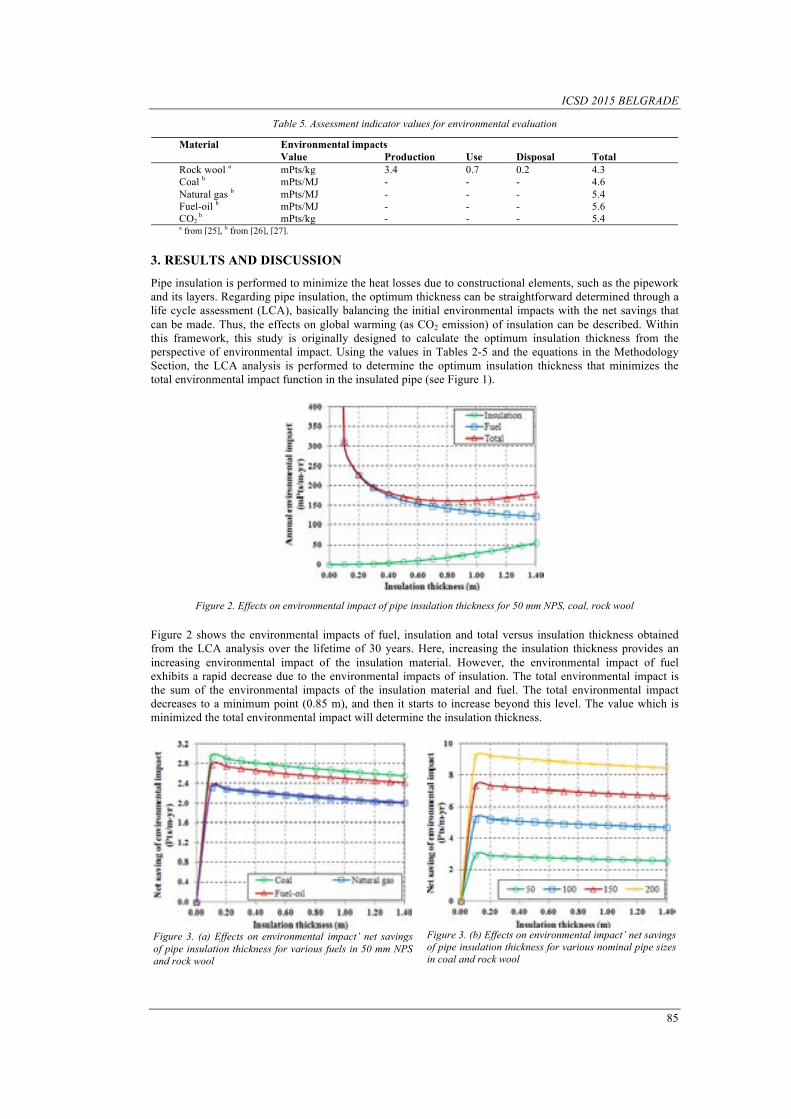
ICSD 2015 BELGRADE
85
Table 5. Assessment indicator values for environmental evaluation
Material Environmental impacts Value Production Use Disposal Total Rock wool a mPts/kg 3.4 0.7 0.2 4.3 Coal b mPts/MJ - - - 4.6 Natural gas b mPts/MJ - - - 5.4 Fuel-oil b mPts/MJ - - - 5.6 CO2
b mPts/kg - - - 5.4 a from [25], b from [26], [27].
3. RESULTS AND DISCUSSION
Pipe insulation is performed to minimize the heat losses due to constructional elements, such as the pipework and its layers. Regarding pipe insulation, the optimum thickness can be straightforward determined through a life cycle assessment (LCA), basically balancing the initial environmental impacts with the net savings that can be made. Thus, the effects on global warming (as CO2 emission) of insulation can be described. Within this framework, this study is originally designed to calculate the optimum insulation thickness from the perspective of environmental impact. Using the values in Tables 2-5 and the equations in the Methodology Section, the LCA analysis is performed to determine the optimum insulation thickness that minimizes the total environmental impact function in the insulated pipe (see Figure 1).
Figure 2. Effects on environmental impact of pipe insulation thickness for 50 mm NPS, coal, rock wool
Figure 2 shows the environmental impacts of fuel, insulation and total versus insulation thickness obtained from the LCA analysis over the lifetime of 30 years. Here, increasing the insulation thickness provides an increasing environmental impact of the insulation material. However, the environmental impact of fuel exhibits a rapid decrease due to the environmental impacts of insulation. The total environmental impact is the sum of the environmental impacts of the insulation material and fuel. The total environmental impact decreases to a minimum point (0.85 m), and then it starts to increase beyond this level. The value which is minimized the total environmental impact will determine the insulation thickness.
Figure 3. (a) Effects on environmental impact’ net savings of pipe insulation thickness for various fuels in 50 mm NPS and rock wool
Figure 3. (b) Effects on environmental impact’ net savings of pipe insulation thickness for various nominal pipe sizes in coal and rock wool
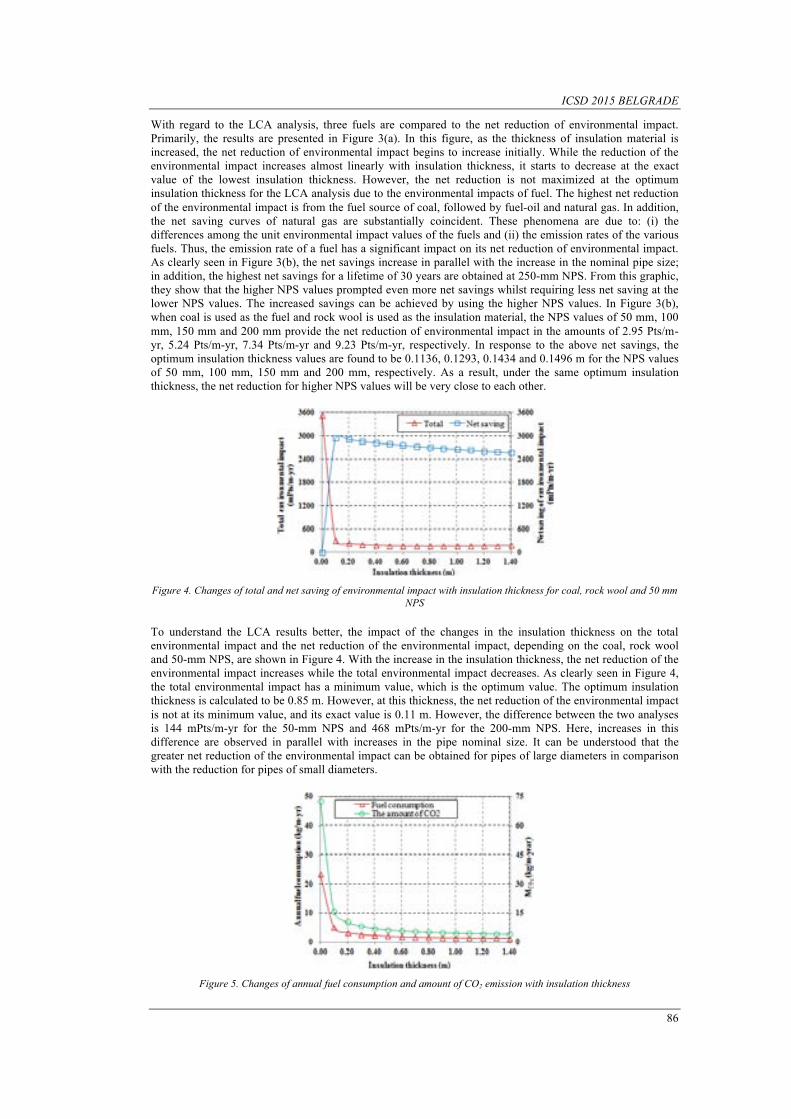
ICSD 2015 BELGRADE
86
With regard to the LCA analysis, three fuels are compared to the net reduction of environmental impact. Primarily, the results are presented in Figure 3(a). In this figure, as the thickness of insulation material is increased, the net reduction of environmental impact begins to increase initially. While the reduction of the environmental impact increases almost linearly with insulation thickness, it starts to decrease at the exact value of the lowest insulation thickness. However, the net reduction is not maximized at the optimum insulation thickness for the LCA analysis due to the environmental impacts of fuel. The highest net reduction of the environmental impact is from the fuel source of coal, followed by fuel-oil and natural gas. In addition, the net saving curves of natural gas are substantially coincident. These phenomena are due to: (i) the differences among the unit environmental impact values of the fuels and (ii) the emission rates of the various fuels. Thus, the emission rate of a fuel has a significant impact on its net reduction of environmental impact. As clearly seen in Figure 3(b), the net savings increase in parallel with the increase in the nominal pipe size; in addition, the highest net savings for a lifetime of 30 years are obtained at 250-mm NPS. From this graphic, they show that the higher NPS values prompted even more net savings whilst requiring less net saving at the lower NPS values. The increased savings can be achieved by using the higher NPS values. In Figure 3(b), when coal is used as the fuel and rock wool is used as the insulation material, the NPS values of 50 mm, 100 mm, 150 mm and 200 mm provide the net reduction of environmental impact in the amounts of 2.95 Pts/m-yr, 5.24 Pts/m-yr, 7.34 Pts/m-yr and 9.23 Pts/m-yr, respectively. In response to the above net savings, the optimum insulation thickness values are found to be 0.1136, 0.1293, 0.1434 and 0.1496 m for the NPS values of 50 mm, 100 mm, 150 mm and 200 mm, respectively. As a result, under the same optimum insulation thickness, the net reduction for higher NPS values will be very close to each other.
Figure 4. Changes of total and net saving of environmental impact with insulation thickness for coal, rock wool and 50 mm NPS
To understand the LCA results better, the impact of the changes in the insulation thickness on the total environmental impact and the net reduction of the environmental impact, depending on the coal, rock wool and 50-mm NPS, are shown in Figure 4. With the increase in the insulation thickness, the net reduction of the environmental impact increases while the total environmental impact decreases. As clearly seen in Figure 4, the total environmental impact has a minimum value, which is the optimum value. The optimum insulation thickness is calculated to be 0.85 m. However, at this thickness, the net reduction of the environmental impact is not at its minimum value, and its exact value is 0.11 m. However, the difference between the two analyses is 144 mPts/m-yr for the 50-mm NPS and 468 mPts/m-yr for the 200-mm NPS. Here, increases in this difference are observed in parallel with increases in the pipe nominal size. It can be understood that the greater net reduction of the environmental impact can be obtained for pipes of large diameters in comparison with the reduction for pipes of small diameters.
Figure 5. Changes of annual fuel consumption and amount of CO2 emission with insulation thickness
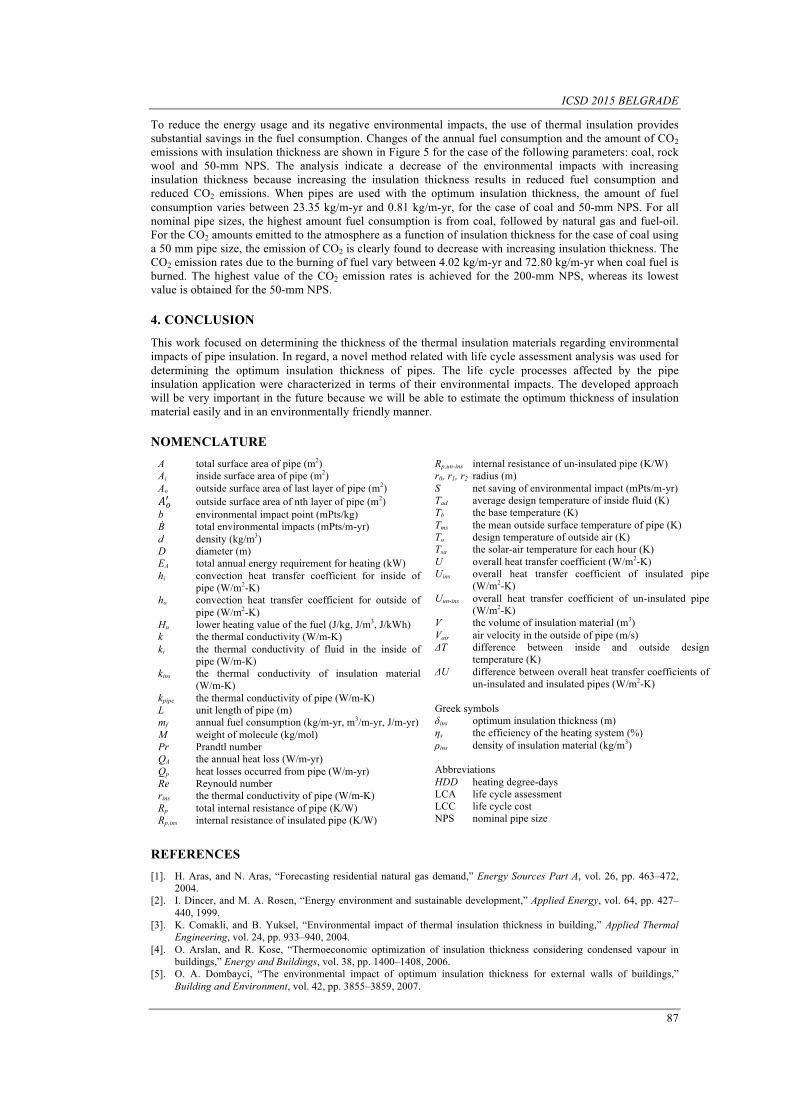
ICSD 2015 BELGRADE
87
To reduce the energy usage and its negative environmental impacts, the use of thermal insulation provides substantial savings in the fuel consumption. Changes of the annual fuel consumption and the amount of CO2 emissions with insulation thickness are shown in Figure 5 for the case of the following parameters: coal, rock wool and 50-mm NPS. The analysis indicate a decrease of the environmental impacts with increasing insulation thickness because increasing the insulation thickness results in reduced fuel consumption and reduced CO2 emissions. When pipes are used with the optimum insulation thickness, the amount of fuel consumption varies between 23.35 kg/m-yr and 0.81 kg/m-yr, for the case of coal and 50-mm NPS. For all nominal pipe sizes, the highest amount fuel consumption is from coal, followed by natural gas and fuel-oil. For the CO2 amounts emitted to the atmosphere as a function of insulation thickness for the case of coal using a 50 mm pipe size, the emission of CO2 is clearly found to decrease with increasing insulation thickness. The CO2 emission rates due to the burning of fuel vary between 4.02 kg/m-yr and 72.80 kg/m-yr when coal fuel is burned. The highest value of the CO2 emission rates is achieved for the 200-mm NPS, whereas its lowest value is obtained for the 50-mm NPS.
4. CONCLUSION
This work focused on determining the thickness of the thermal insulation materials regarding environmental impacts of pipe insulation. In regard, a novel method related with life cycle assessment analysis was used for determining the optimum insulation thickness of pipes. The life cycle processes affected by the pipe insulation application were characterized in terms of their environmental impacts. The developed approach will be very important in the future because we will be able to estimate the optimum thickness of insulation material easily and in an environmentally friendly manner.
NOMENCLATURE A total surface area of pipe (m2) Ai inside surface area of pipe (m2) Ao outside surface area of last layer of pipe (m2) !!! outside surface area of nth layer of pipe (m2) b environmental impact point (mPts/kg) Ḃ total environmental impacts (mPts/m-yr) d density (kg/m3) D diameter (m) EA total annual energy requirement for heating (kW) hi convection heat transfer coefficient for inside of
pipe (W/m2-K) ho convection heat transfer coefficient for outside of
pipe (W/m2-K) Hu lower heating value of the fuel (J/kg, J/m3, J/kWh) k the thermal conductivity (W/m-K) ki the thermal conductivity of fluid in the inside of
pipe (W/m-K) kins the thermal conductivity of insulation material
(W/m-K) kpipe the thermal conductivity of pipe (W/m-K) L unit length of pipe (m) mf annual fuel consumption (kg/m-yr, m3/m-yr, J/m-yr) M weight of molecule (kg/mol) Pr Prandtl number QA the annual heat loss (W/m-yr) Qp heat losses occurred from pipe (W/m-yr) Re Reynould number rins the thermal conductivity of pipe (W/m-K) Rp total internal resistance of pipe (K/W) Rp,ins internal resistance of insulated pipe (K/W)
Rp,un-ins internal resistance of un-insulated pipe (K/W) r0, r1, r2 radius (m) S net saving of environmental impact (mPts/m-yr) Tad average design temperature of inside fluid (K) Tb the base temperature (K) Tms the mean outside surface temperature of pipe (K) To design temperature of outside air (K) Tsa the solar-air temperature for each hour (K) U overall heat transfer coefficient (W/m2-K) Uins overall heat transfer coefficient of insulated pipe
(W/m2-K) Uun-ins overall heat transfer coefficient of un-insulated pipe
(W/m2-K) V the volume of insulation material (m3) Vair air velocity in the outside of pipe (m/s) ΔT difference between inside and outside design
temperature (K) ΔU difference between overall heat transfer coefficients of
un-insulated and insulated pipes (W/m2-K) Greek symbols δins optimum insulation thickness (m) ηs the efficiency of the heating system (%) ρins density of insulation material (kg/m3) Abbreviations HDD heating degree-days LCA life cycle assessment LCC life cycle cost NPS nominal pipe size
REFERENCES [1]. H. Aras, and N. Aras, “Forecasting residential natural gas demand,” Energy Sources Part A, vol. 26, pp. 463–472,
2004. [2]. I. Dincer, and M. A. Rosen, “Energy environment and sustainable development,” Applied Energy, vol. 64, pp. 427–
440, 1999. [3]. K. Comakli, and B. Yuksel, “Environmental impact of thermal insulation thickness in building,” Applied Thermal
Engineering, vol. 24, pp. 933–940, 2004. [4]. O. Arslan, and R. Kose, “Thermoeconomic optimization of insulation thickness considering condensed vapour in
buildings,” Energy and Buildings, vol. 38, pp. 1400–1408, 2006. [5]. O. A. Dombayci, “The environmental impact of optimum insulation thickness for external walls of buildings,”
Building and Environment, vol. 42, pp. 3855–3859, 2007.
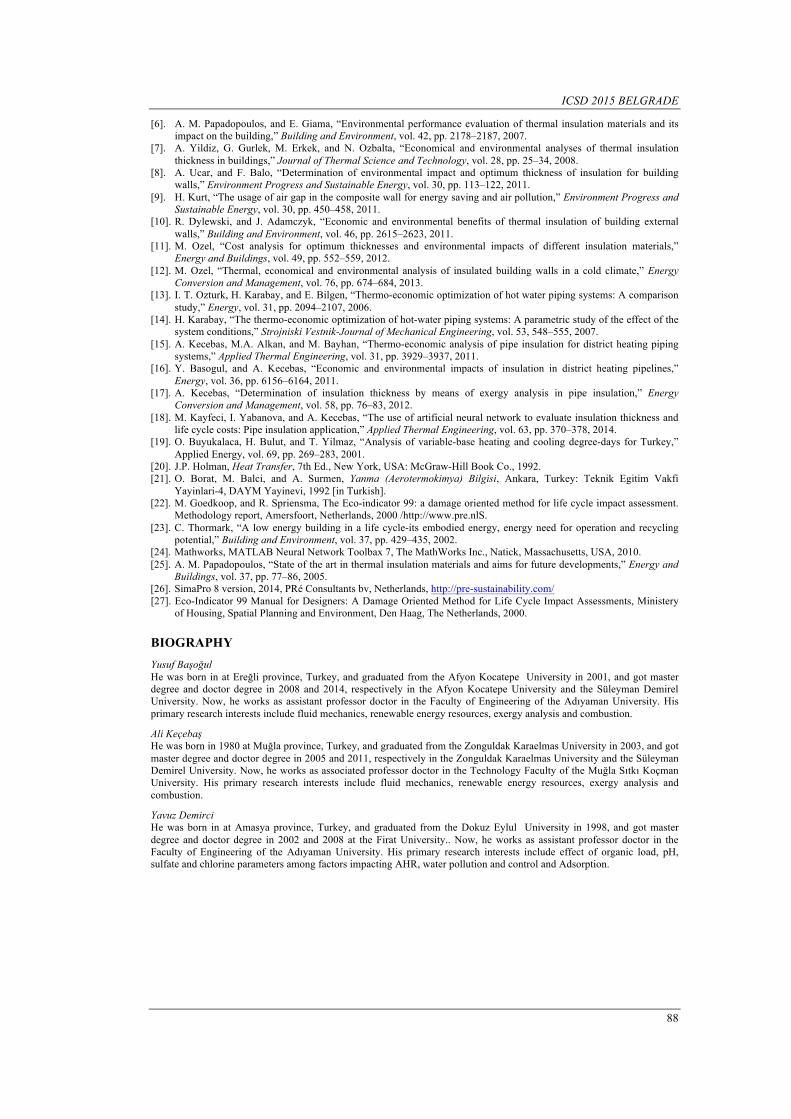
ICSD 2015 BELGRADE
88
[6]. A. M. Papadopoulos, and E. Giama, “Environmental performance evaluation of thermal insulation materials and its impact on the building,” Building and Environment, vol. 42, pp. 2178–2187, 2007.
[7]. A. Yildiz, G. Gurlek, M. Erkek, and N. Ozbalta, “Economical and environmental analyses of thermal insulation thickness in buildings,” Journal of Thermal Science and Technology, vol. 28, pp. 25–34, 2008.
[8]. A. Ucar, and F. Balo, “Determination of environmental impact and optimum thickness of insulation for building walls,” Environment Progress and Sustainable Energy, vol. 30, pp. 113–122, 2011.
[9]. H. Kurt, “The usage of air gap in the composite wall for energy saving and air pollution,” Environment Progress and Sustainable Energy, vol. 30, pp. 450–458, 2011.
[10]. R. Dylewski, and J. Adamczyk, “Economic and environmental benefits of thermal insulation of building external walls,” Building and Environment, vol. 46, pp. 2615–2623, 2011.
[11]. M. Ozel, “Cost analysis for optimum thicknesses and environmental impacts of different insulation materials,” Energy and Buildings, vol. 49, pp. 552–559, 2012.
[12]. M. Ozel, “Thermal, economical and environmental analysis of insulated building walls in a cold climate,” Energy Conversion and Management, vol. 76, pp. 674–684, 2013.
[13]. I. T. Ozturk, H. Karabay, and E. Bilgen, “Thermo-economic optimization of hot water piping systems: A comparison study,” Energy, vol. 31, pp. 2094–2107, 2006.
[14]. H. Karabay, “The thermo-economic optimization of hot-water piping systems: A parametric study of the effect of the system conditions,” Strojniski Vestnik-Journal of Mechanical Engineering, vol. 53, 548–555, 2007.
[15]. A. Kecebas, M.A. Alkan, and M. Bayhan, “Thermo-economic analysis of pipe insulation for district heating piping systems,” Applied Thermal Engineering, vol. 31, pp. 3929–3937, 2011.
[16]. Y. Basogul, and A. Kecebas, “Economic and environmental impacts of insulation in district heating pipelines,” Energy, vol. 36, pp. 6156–6164, 2011.
[17]. A. Kecebas, “Determination of insulation thickness by means of exergy analysis in pipe insulation,” Energy Conversion and Management, vol. 58, pp. 76–83, 2012.
[18]. M. Kayfeci, I. Yabanova, and A. Kecebas, “The use of artificial neural network to evaluate insulation thickness and life cycle costs: Pipe insulation application,” Applied Thermal Engineering, vol. 63, pp. 370–378, 2014.
[19]. O. Buyukalaca, H. Bulut, and T. Yilmaz, “Analysis of variable-base heating and cooling degree-days for Turkey,” Applied Energy, vol. 69, pp. 269–283, 2001.
[20]. J.P. Holman, Heat Transfer, 7th Ed., New York, USA: McGraw-Hill Book Co., 1992. [21]. O. Borat, M. Balci, and A. Surmen, Yanma (Aerotermokimya) Bilgisi, Ankara, Turkey: Teknik Egitim Vakfi
Yayinlari-4, DAYM Yayinevi, 1992 [in Turkish]. [22]. M. Goedkoop, and R. Spriensma, The Eco-indicator 99: a damage oriented method for life cycle impact assessment.
Methodology report, Amersfoort, Netherlands, 2000 /http://www.pre.nlS. [23]. C. Thormark, “A low energy building in a life cycle-its embodied energy, energy need for operation and recycling
potential,” Building and Environment, vol. 37, pp. 429–435, 2002. [24]. Mathworks, MATLAB Neural Network Toolbax 7, The MathWorks Inc., Natick, Massachusetts, USA, 2010. [25]. A. M. Papadopoulos, “State of the art in thermal insulation materials and aims for future developments,” Energy and
Buildings, vol. 37, pp. 77–86, 2005. [26]. SimaPro 8 version, 2014, PRé Consultants bv, Netherlands, http://pre-sustainability.com/ [27]. Eco-Indicator 99 Manual for Designers: A Damage Oriented Method for Life Cycle Impact Assessments, Ministery
of Housing, Spatial Planning and Environment, Den Haag, The Netherlands, 2000.
BIOGRAPHY Yusuf Başoğul He was born in at Ereğli province, Turkey, and graduated from the Afyon Kocatepe University in 2001, and got master degree and doctor degree in 2008 and 2014, respectively in the Afyon Kocatepe University and the Süleyman Demirel University. Now, he works as assistant professor doctor in the Faculty of Engineering of the Adıyaman University. His primary research interests include fluid mechanics, renewable energy resources, exergy analysis and combustion.
Ali Keçebaş He was born in 1980 at Muğla province, Turkey, and graduated from the Zonguldak Karaelmas University in 2003, and got master degree and doctor degree in 2005 and 2011, respectively in the Zonguldak Karaelmas University and the Süleyman Demirel University. Now, he works as associated professor doctor in the Technology Faculty of the Muğla Sıtkı Koçman University. His primary research interests include fluid mechanics, renewable energy resources, exergy analysis and combustion.
Yavuz Demirci He was born in at Amasya province, Turkey, and graduated from the Dokuz Eylul University in 1998, and got master degree and doctor degree in 2002 and 2008 at the Firat University.. Now, he works as assistant professor doctor in the Faculty of Engineering of the Adıyaman University. His primary research interests include effect of organic load, pH, sulfate and chlorine parameters among factors impacting AHR, water pollution and control and Adsorption.
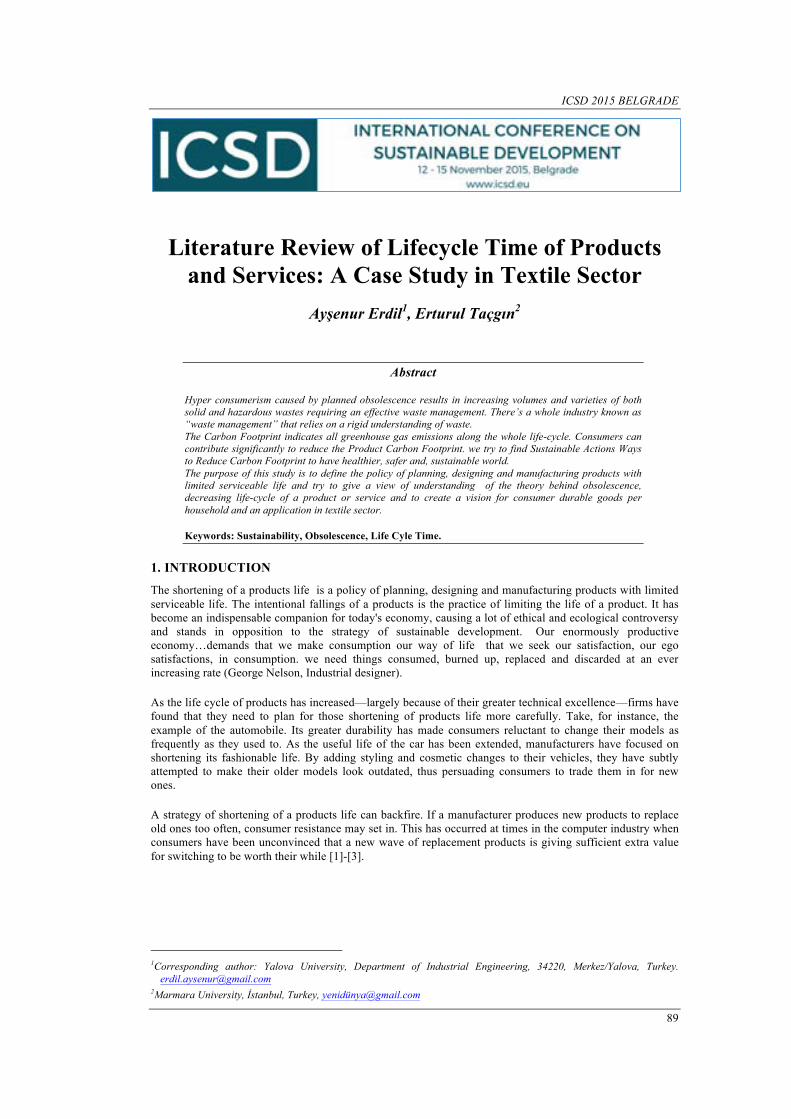
ICSD 2015 BELGRADE
89
Literature Review of Lifecycle Time of Products and Services: A Case Study in Textile Sector
Ayşenur Erdil1, Erturul Taçgın2
Abstract
Hyper consumerism caused by planned obsolescence results in increasing volumes and varieties of both solid and hazardous wastes requiring an effective waste management. There’s a whole industry known as “waste management” that relies on a rigid understanding of waste. The Carbon Footprint indicates all greenhouse gas emissions along the whole life-cycle. Consumers can contribute significantly to reduce the Product Carbon Footprint. we try to find Sustainable Actions Ways to Reduce Carbon Footprint to have healthier, safer and, sustainable world. The purpose of this study is to define the policy of planning, designing and manufacturing products with limited serviceable life and try to give a view of understanding of the theory behind obsolescence, decreasing life-cycle of a product or service and to create a vision for consumer durable goods per household and an application in textile sector.
Keywords: Sustainability, Obsolescence, Life Cyle Time.
1. INTRODUCTION
The shortening of a products life is a policy of planning, designing and manufacturing products with limited serviceable life. The intentional fallings of a products is the practice of limiting the life of a product. It has become an indispensable companion for today's economy, causing a lot of ethical and ecological controversy and stands in opposition to the strategy of sustainable development. Our enormously productive economy…demands that we make consumption our way of life that we seek our satisfaction, our ego satisfactions, in consumption. we need things consumed, burned up, replaced and discarded at an ever increasing rate (George Nelson, Industrial designer).
As the life cycle of products has increased—largely because of their greater technical excellence—firms have found that they need to plan for those shortening of products life more carefully. Take, for instance, the example of the automobile. Its greater durability has made consumers reluctant to change their models as frequently as they used to. As the useful life of the car has been extended, manufacturers have focused on shortening its fashionable life. By adding styling and cosmetic changes to their vehicles, they have subtly attempted to make their older models look outdated, thus persuading consumers to trade them in for new ones.
A strategy of shortening of a products life can backfire. If a manufacturer produces new products to replace old ones too often, consumer resistance may set in. This has occurred at times in the computer industry when consumers have been unconvinced that a new wave of replacement products is giving sufficient extra value for switching to be worth their while [1]-[3].
1Corresponding author: Yalova University, Department of Industrial Engineering, 34220, Merkez/Yalova, Turkey.
[email protected] 2Marmara University, İstanbul, Turkey, yenidü[email protected]
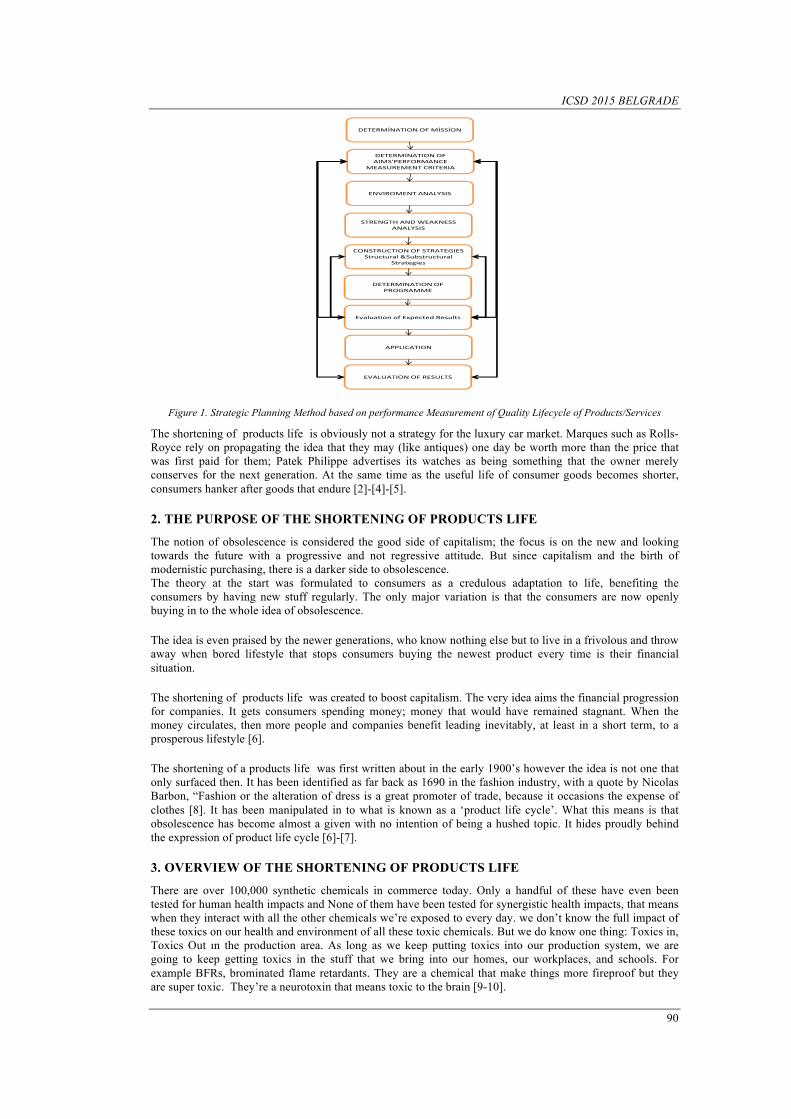
ICSD 2015 BELGRADE
90
Figure 1. Strategic Planning Method based on performance Measurement of Quality Lifecycle of Products/Services
The shortening of products life is obviously not a strategy for the luxury car market. Marques such as Rolls-Royce rely on propagating the idea that they may (like antiques) one day be worth more than the price that was first paid for them; Patek Philippe advertises its watches as being something that the owner merely conserves for the next generation. At the same time as the useful life of consumer goods becomes shorter, consumers hanker after goods that endure [2]-[4]-[5].
2. THE PURPOSE OF THE SHORTENING OF PRODUCTS LIFE
The notion of obsolescence is considered the good side of capitalism; the focus is on the new and looking towards the future with a progressive and not regressive attitude. But since capitalism and the birth of modernistic purchasing, there is a darker side to obsolescence. The theory at the start was formulated to consumers as a credulous adaptation to life, benefiting the consumers by having new stuff regularly. The only major variation is that the consumers are now openly buying in to the whole idea of obsolescence.
The idea is even praised by the newer generations, who know nothing else but to live in a frivolous and throw away when bored lifestyle that stops consumers buying the newest product every time is their financial situation.
The shortening of products life was created to boost capitalism. The very idea aims the financial progression for companies. It gets consumers spending money; money that would have remained stagnant. When the money circulates, then more people and companies benefit leading inevitably, at least in a short term, to a prosperous lifestyle [6].
The shortening of a products life was first written about in the early 1900’s however the idea is not one that only surfaced then. It has been identified as far back as 1690 in the fashion industry, with a quote by Nicolas Barbon, “Fashion or the alteration of dress is a great promoter of trade, because it occasions the expense of clothes [8]. It has been manipulated in to what is known as a ‘product life cycle’. What this means is that obsolescence has become almost a given with no intention of being a hushed topic. It hides proudly behind the expression of product life cycle [6]-[7].
3. OVERVIEW OF THE SHORTENING OF PRODUCTS LIFE
There are over 100,000 synthetic chemicals in commerce today. Only a handful of these have even been tested for human health impacts and None of them have been tested for synergistic health impacts, that means when they interact with all the other chemicals we’re exposed to every day. we don’t know the full impact of these toxics on our health and environment of all these toxic chemicals. But we do know one thing: Toxics in, Toxics Out ın the production area. As long as we keep putting toxics into our production system, we are going to keep getting toxics in the stuff that we bring into our homes, our workplaces, and schools. For example BFRs, brominated flame retardants. They are a chemical that make things more fireproof but they are super toxic. They’re a neurotoxin that means toxic to the brain [9-10].
DETERMİNATIONOFMİSSİON
ENVIROMENTANALYSIS
STRENGTHANDWEAKNESSANALYSIS
CONSTRUCTIONOFSTRATEGIESStructural&Substructural
Strategies
DETERMINATIONOFPROGRAMME
EvaluationofExpectedResults
APPLICATION
EVALUATIONOFRESULTS
DETERMİNATIONOFAIMS'PERFORMANCE
MEASUREMENTCRITERIA
ICSD 2015 BELGRADE
91
The textile industry is the third largest consumer of water in the world – behind at paper and oil industries. Water consumption is a huge problem for growing fibres. Cotton accounts for 90% of all natural fibres used in the textile industry. It is used in 40% of all apparel produced globally, with synthetics accounting for 55%. Cotton farming is also the single largest water consumption factor in the apparel supply chain. The ever-thirsty cotton plant takes over 30,000 litres to create 1 kg of cotton. 1 cotton shirt uses approximately 2,700 litres of water [11].
It’s estimated that clothing and textiles account for about one ton of the 19.8 tons of total CO2 emissions produced by each person in the U.S. in 2006 (see Jurg Rupp, “Ecology and Economy in Textile Finishing”, Textile World, Nov/Dec 2008). Based on estimated annual global textile production of 60 billion kilograms of fabric, the estimated energy and water needed to produce that 60 billion kgs of fabrics boggles the mind: 1,074 billion KWh of electricity (or 132 million metric tons of coal) and between 6 – 9 trillion liters of water. The CO2 emissions is generated during the complete life-cycle of an item of clothing in the product carbon footprint[9-10-11].
System which has received a lot of backing and becoming a standard to which companies should follow; it is called EPEAT or Electronic Product Environmental Assessment Tool [9]. It is the environmental rating system for electronic products. Apple were originally a member of this green scheme which rates products on how environmentally friendly they are.
Toxic E-Waste: Electronic products and particularly mobile phones have extremely short user life span; they are very quickly discarded once marketing has taken control and activated the need to own the newest model. But an issue that has not been addressed as yet but must be, for one to recognize the dangers of e-waste. Some products contain high levels of permanent biological toxins (PBTs). Arsenic, lead, nickel and zinc are most common [10]. We need to provide a different subject. Let’s start by challenging the fundamental assumption that producing and consuming Stuff-products is the central purpose and engine of our economy. We need to understand that the drive to over consume is neither human nature nor a birthright. We need to support when we are clarified as “a nation of consumers”; priority and collectively, we are so much more than consumers, and those other parts of ourselves have been relegated to subordinate roles for too long.
3.1. Quality Oriented Assesment
Quality Oriented Assesment for published by a recognized standards organization and contains rules, requirements, or procedures for an orderly approach to a specific activity. It may include product design requirements, test methods, classifications, recommended practices, and other considerations [12]. It defines safety requirements intended to reduce the risk of accident. Quality Oriented provides some of benefits: It sets a level of performance for products. They are a framework for quality processes. It reduces cost and saves money. A set of activities or techniques whose purpose is to ensure that all quality requirements are being met by monitoring of processes and solving performance problems through Inspecting and Testing [13].
This control system focuses on General, Test and Inspection, Thread, Woven Fabric, Braided Goods Braided Goods. Textile Product, Yarn Reeling Machine, Textile Machine, Braiding Machine, Dyeing Finishing Machine
3.2. Encountered Problems in the Sector
The textile and ready-made sectors have new dynamics, they also encounter with many problems.These problems are summarized as follows:
- There are rapid changes in the export markets.So many foreign importers do not buy in big lots, lot sizes are rather decreased The firms that do not obey these rules are encountered with different problems;
- Since many firms in sector are small and middle sized, they are not financially strong. Because of this reason banks do not give credit for those firms easily;
- Excess amount over export is sold in internal market. This decreases the prices of internal market. So firms that sell their products into internal market are effected negatively;
- Bureaucracy and stationary are still among the important items.Changes in the exchange rates effects the firms negatively that export 60 percent of their products;
- The excess amount of new firms causes price competition for foreign markets;
ICSD 2015 BELGRADE
92
- The lack of energy and infrastructure causes many problems.
3.3. New Dynamics of Textile and Ready-Made Sectors
Textile and Ready-Made sectors are the candidates of dynamic sectors in short run.
** There is no risk of raw material scarcity. Turkey is one of the few countries that has enough raw material
capacity in the world.
** It is seen that being active in the marketing and delivery channels is a vital requirement. For this reason,
new investments on marketing and delivery channels in target markets are increasing.
** Marketing and delivery problems of small and middle size producers must be eliminated by Sectorial
Foreign Trade Firms.
In order to improve export of firms, government started to give
** Support of marketing research.
** Support of opening office, shop and depot in abroad.
** Support of attending international fairs.
** Support of foreign trade education.
** Support of qualified staff employing.
** Support of enviromental conscious.
Reasons for Textile Testing
1. Checking Raw Materials;
2. Monitoring Production;
3. Assessing the Final Product.
4. CONCLUSIONS
Shortening the product's life started in the early 20th century. Innovation had to go backwards and Brainwashing and habit to consume. Planned obsolescence is one of the basis of todays’ capitalism. Commitment and Consistency, Scarcity, Social, and lastly Ego are the four heading chosen to meet the persuasive needs of obsolescence .Each heading enlists an idea which manipulates the consumer in to purchasing by either subconscious or conscious techniques. Commitment and Consistency and Ego are predominantly a side-effect of buying in to a company product. Scarcity and Social are the most influenced by company marketing. Strategy of the shortening of products life is contrary to the concept of sustainable development. This strategy does not meet consumer requirements for the quality of the product and the time of their operation. Environmental awareness should replace the policy of planned obsolescence and should reduce unfavorable environmental impact and improve the quality of life on our planet. Engineers should force socially rational solutions including design and production of environmentally friendly and durable products causing the formation of a minimum amount of waste during the manufacturing, operation and recycling in accordance to the policy of "product and design to minimize the amount of the waste”. It is not someone else responsibility to solve social and environmental problems-its everyone’s responsibility. Designer’s are in a unique position to influence change over corporations and consumers alike.
REFERENCES [1]. J. Guiltinan “Creative Destruction and Destructive Creations: Environmental Ethics and Planned Obsolescence,”
Journal of Business Ethics 89, pp.19-28, 2009.) [2]. Slade, G., “Made to Break: Technology and Obsolescence in America”, Harvard University Press, 2006] [3]. T. Iizuka, “An Empirical Analysis of Planned Obsolescence,” American Economic Association, 2004, available
at http://www.aeaweb.org/assa/2005/0107_1015_0616.pdf.) [4]. www.livingeconomies.org. [5]. Slade, G. 2006. Cell Phones and E-Waste. Cell Phones and E-Waste. Teoksessa Made to Break. Massachusetts:
Harvard University Press, 264. [6]. Keeble D. (2013) ,Title of Bachelor’s thesis: The culture of planned obsolescence in technology companies
Term and year of completion, Oulu University of Applied Sciences Business Information Technology. [7]. https://archive.org/details/PlannedObsolescenceDocumentary i Access Data:

ICSD 2015 BELGRADE
93
[8]. Maycroft, N. 2009. Consumption, planned obsolescence and waste. Lincoln: University of Lincoln. 5, 24. [9]. Green Electronics Council. Electronic Product Environmental Assessment Tool. Date of retrieval 4 April 2013,
www.epa.gov. [10]. Slade, G. 2006. Cell Phones and E-Waste. Cell Phones and E-Waste. Teoksessa Made to Break. Massachusetts:
Harvard University Press, 264. [11]. Climate change is really important for environment and health of population: http://www.ethical.org.au/get-
informed/issues/fashion-footprint/ [12]. Redmill, F., Anderson, T., Components of System Safety: Proceedings of the Tenth Safety-critical ,2000 [13]. Neeraj Jha, K., Construction Project Management: Theory and Practice, Pearson, 2011.
ICSD 2015 BELGRADE
94
Sustainability of Joint Projects Between University
and Industry in Turkey
Ayşenur Erdil1, Hikmet Erbıyık2
Abstract
Industries in Turkey, since 1980's, perform important improvements as a result of the policies that pursue the goal of exports orientation and globalization. Although there are structural economic problems such as inflation, privatization, taxes and efficient institutional structure of government has not been formed yet, the performance of Turkish industry seems to give hope. However, this improvement and performance is the result of the industry's own efforts. This situation makes it difficult to determine medium and long term targets. In these circumstances, it makes a contribution to Turkish industry, consequently the development of Turkey, that foundations which form the institutional frame including universities, related bureaucracy with main chambers, unions and priority industry are able to produce common studies, projects. International competition represents a rich competition concept containing divided markets, different products and technological changes. So The international trade one of the most important supports of the competition advantage is the technological changes. In the technological race, technology, R&D are vital determining factors.
Keywords: Industry, Research & Development, Technology, University Projects.
1. INTRODUCTION
Combination of several definitions can give a whole meaning for technology. the ability to change the knowledge and the material, the appearance of the work in different dimensions, a process of decreasing the dependency on the material and the factors, a bunch of new choices, a way of getting rid of the difficulty, a system that makes dreams come true by including experience and change. Technological development in each area is the determining factor at every level of the economy. It is possible to think technology and scientific progress that supports the technological development as an igniting variable of a great social change. In this meaning technology has been the basic variable for the transformation of the humanity history [22-23].
During the technological development process there occurs institutional accumulating progress. At the technological progress from production to marketing, R&D and innovation should be applied to technology not to make it an abstract concept. One of the other important dimensions of the technological developments is the innovation. Innovations are the augmenting aids to the product, system, process and the method for every division and personnel in the firm. In a sense innovation appears as the change of attributes as result of universal accumulation of new ideas. Innovations can be evaluated in four categories. First of these is the product innovation, the second one is the production tools innovation and the process innovation, the third is the management-organization innovation, and the fourth is the entering innovation. Contribution of the first three also creates vital innovations in the entrepreneurs' features. When the innovations are considered as a whole they reflect the aid of the technology in the economic power of the states [35-36].
1Corresponding author: Yalova University, Department of Industrial Engineering, 77000, Merkez/Yalova, Turkey.
[email protected] 2Yalova University, Department of Industrial Engineering, 77000, Merkez/Yalova, Turkey. [email protected]
ICSD 2015 BELGRADE
95
When the technology is not commercialized in both R&D and innovations dimensions it becomes only a scientific study, not a technology [2]. Research, both basic and applied, is systematic, intensive study directed toward fuller scientific knowledge for the subject studied. Basic Research if for the non-profit making sector, research devoted to achieving a fuller knowledge or understanding, rather than a practical application for the subject under study. But National Science Foundation(NFS) makes an allowance for commercial firms, classifying as basic research investigation for the advancement of scientific as basic research investigation for the advancement of scientific knowledge that do not have specific commercial objectives, although they may be in fields of present or potential interest to the company. Applied research is directed toward the practical application of knowledge, with for industry means the discovery of new scientific knowledge that has specific commercial objectives with respect to either product or processes [3-6].
Academic Research is a type of research generally focused on the extension of the limits of understanding, broadening man's knowledge of natural phenomena, or finding theoretical solutions to hypothetical problems. Industrial Research certainly requires intellectual activity and uses the classical scientific method, as does academic research but it has quite a different orientation. Its focus is on industrial problems, the solution of which is believed to be financially advantageous to the corporation. Government Research may cover a wide spectrum, but even there the goals are to obtain problem solutions that have national or social consequences in addition to scientific value. Government agencies sponsoring research usually have to demonstrate technological value of the project but rarely have to show that it is economically sound.
Development is the systematic use of scientific knowledge directed toward the production of useful materials, devices systems, or methods including design and development of prototypes and processes. In general, it can be said that academic research uses the criterion of obtaining new knowledge and demonstrating technical excellence but is rarely concerned seriously with economics; government-sponsored research and development uses the criterion of social need rather than economic justification and industry-sponsored research and development weights economic justification heavily, though it still values technical excellence [2-6].
2. BALANCING REQUIREMENTS FOR RESEARCH AND FOR DEVELOPMENT
Formula are often advanced for determining what proportion of research to development is right. There is justification for the idea that technology has advanced so far that the same person can no longer be an expert in both research and development. In applied research the technical questions relate to making a product function; in the advanced stages of development they relate to engineering a product so that it can be produced efficiently [3-4].
A development program may come up with against a need for further research; a research program may need the development of a particular piece of equipment or instrumentation. The important point is that rigidity must be avoided. Perhaps the most vital factor to keep in mind is that however the two are distinguished, there must be the chance for continual communication between those doing research and development. Unless research and development complement each other, parallel efforts will spring up .This duplication of effort wastes corporate resources [3-4].
2.1. Classification for the R&D Process
In 1960, Charles Hitch and R.N. McKean proposed a classification system for R&D that breaks the process down into six parts: Research, Exploratory development, Advanced development, Engineering development, Operational system development, Management and support. These six way classification of R&D spectrum has been used by the U.S. department of Defense for years. It is considerably more detailed than the traditional three classes (Basic Research, Applied Research, Development). The approximate relationship between the two types of classification is shown in Figure 1.
ICSD 2015 BELGRADE
96
Figure 1. Two Clasification of R&D
As a general role the more detailed classification is most useful when the organization is structed quite rigidly and has detailed rules for the preparation and submission fo budget requests. The classification of six levels permits R&D management to relate its proposed activities to the corporate strategic plan in a more specific way[10-14].
When the budget process is used as the primary device for classifying research and development , it is most likely that short-term market and financial considerations will be of paramount importance. Money has a great deal of power, and it is difficult to counter the argumants of those who deal solely in financial terms unless a specific plan, related to the corporate plan, exists[11-16].
2.2. The Role R&D The instituations sponsor R&D do so in order to further their ultimate goals. Nonprofit foundations may spend money on research in order to answer questions that they deem important to society. Profit-seeking industry offers an intriguing relationship between organizaitonal relatşonship between organizaitonal goals and the R&D it sponsors. ıf the goal for company is to maximize its profits over both the short and the long run, then the appropriate form of R&D is whatever will maximize profits. Depending on the business strategy of the firmi the amount of R&D that is appropriate may be a great deal or virtually none. Here the R&D management's role is to connect R&D program logically with the other corporate goals[7]. R&D policy should flow from market needs and this will determine the success of products developed by the R&D process. R&D sucecess can , of course, create market needs, and the question of timing is exremely important in this case. Very often, research and development will occur in areas where there is no reasonable market need. But within a period of a few years, the market need exists and this time it will be too late to start an R&D program[8].
The most fundamental way in which R&D efforts can be directed by the marketplace is though careful market research or determination of what the market's needs are, and the development of products to fill those needs. Most failures and problems in R&D efforts occur because of weak coordination betwen R&D and marketing departments. One simple technique in order to prevent this unwanted situation is to require participation of marketing Department representatives in periodic R&D product and new product initialisation and review meetings[36].
3. TECHNOLOGY AND RESEARCH &DEVELOPMENT IN TURKEY
Historically, Turkey has a great tradition in science and technology of which it is justifiably proud and which is still little appreciated outside of Turkey. Today, given the importance of research and technological innovation, it is clear that Turkey must strengthen its science and technology (S&T) system. Too much of its research is being carried out in the universities and too little in industry. Moreover, the amount of R& D being performed in Turkey is too low, as a percentage of the gross domestic product(GDP), to allow the country to approach the future confidently and to generate the necessary jobs, whether in industry, agriculture or the service sector. Business enterprises (both small and medium-sixed and large ones) urgently needs to become technologically up to date and competitive in international markets. Clearly, the government should have a key role here, particularly as a facilitator [1-3];[11-14].
Turkey has advantages that should not be overlooked, its traditions, its human capital and its geography. Its scientific and technological traditions should by rights be a source of pride and inspirations for modern Turkey. Is human capital is Turkey's most important resource; its citizens are hardworking, open to education and discipline, and highly entrepreneurial as the very large number of small enterprises clearly shows, Lastly, because of the its unique geographical location and its linguistic and cultural ties with a large community beyond its borders, Turkey is an important bridge between cultures. Turkey is moving from a planned
HITCHANDMcKEAN TRADITIONALResearch BasicResearchExploratoryDevelopmentAdvancedDevelopment AppliedResearchEngineeringDevelopmentOperationalSystemsDevelopment DevelopmentManagementSupport
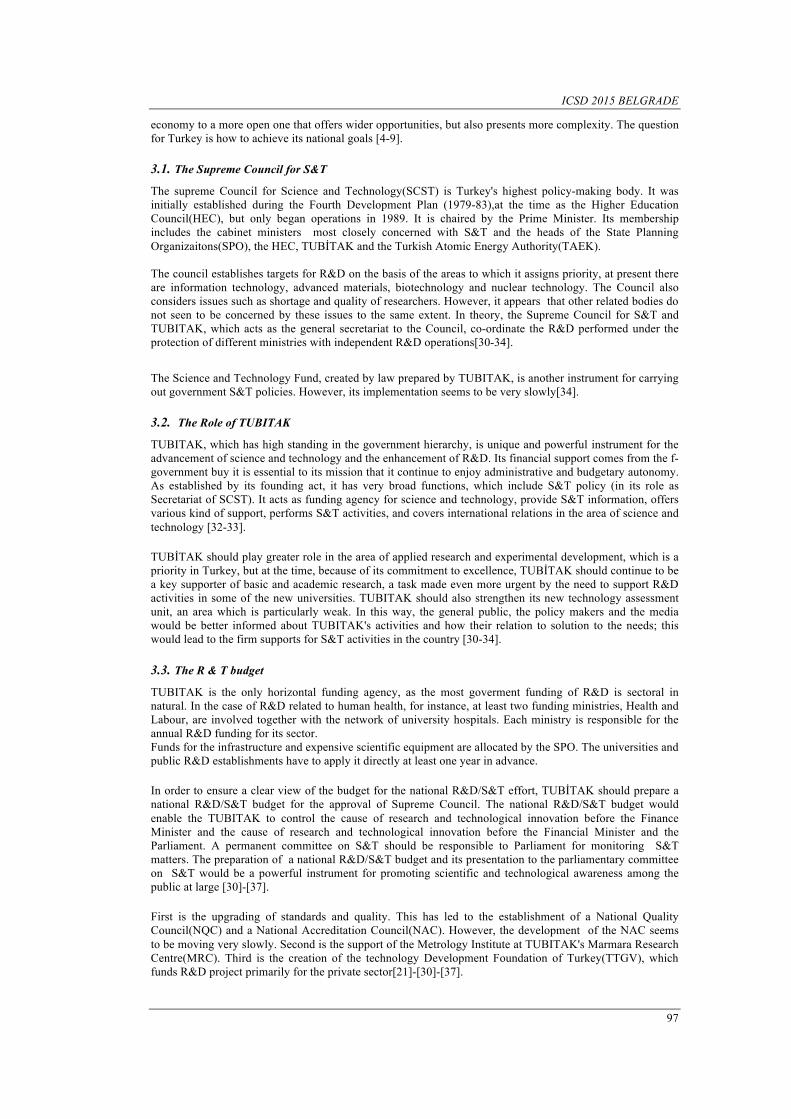
ICSD 2015 BELGRADE
97
economy to a more open one that offers wider opportunities, but also presents more complexity. The question for Turkey is how to achieve its national goals [4-9].
3.1. The Supreme Council for S&T The supreme Council for Science and Technology(SCST) is Turkey's highest policy-making body. It was initially established during the Fourth Development Plan (1979-83),at the time as the Higher Education Council(HEC), but only began operations in 1989. It is chaired by the Prime Minister. Its membership includes the cabinet ministers most closely concerned with S&T and the heads of the State Planning Organizaitons(SPO), the HEC, TUBİTAK and the Turkish Atomic Energy Authority(TAEK). The council establishes targets for R&D on the basis of the areas to which it assigns priority, at present there are information technology, advanced materials, biotechnology and nuclear technology. The Council also considers issues such as shortage and quality of researchers. However, it appears that other related bodies do not seen to be concerned by these issues to the same extent. In theory, the Supreme Council for S&T and TUBITAK, which acts as the general secretariat to the Council, co-ordinate the R&D performed under the protection of different ministries with independent R&D operations[30-34].
The Science and Technology Fund, created by law prepared by TUBITAK, is another instrument for carrying out government S&T policies. However, its implementation seems to be very slowly[34].
3.2. The Role of TUBITAK TUBITAK, which has high standing in the government hierarchy, is unique and powerful instrument for the advancement of science and technology and the enhancement of R&D. Its financial support comes from the f-government buy it is essential to its mission that it continue to enjoy administrative and budgetary autonomy. As established by its founding act, it has very broad functions, which include S&T policy (in its role as Secretariat of SCST). It acts as funding agency for science and technology, provide S&T information, offers various kind of support, performs S&T activities, and covers international relations in the area of science and technology [32-33].
TUBİTAK should play greater role in the area of applied research and experimental development, which is a priority in Turkey, but at the time, because of its commitment to excellence, TUBİTAK should continue to be a key supporter of basic and academic research, a task made even more urgent by the need to support R&D activities in some of the new universities. TUBITAK should also strengthen its new technology assessment unit, an area which is particularly weak. In this way, the general public, the policy makers and the media would be better informed about TUBITAK's activities and how their relation to solution to the needs; this would lead to the firm supports for S&T activities in the country [30-34].
3.3. The R & T budget TUBITAK is the only horizontal funding agency, as the most goverment funding of R&D is sectoral in natural. In the case of R&D related to human health, for instance, at least two funding ministries, Health and Labour, are involved together with the network of university hospitals. Each ministry is responsible for the annual R&D funding for its sector. Funds for the infrastructure and expensive scientific equipment are allocated by the SPO. The universities and public R&D establishments have to apply it directly at least one year in advance.
In order to ensure a clear view of the budget for the national R&D/S&T effort, TUBİTAK should prepare a national R&D/S&T budget for the approval of Supreme Council. The national R&D/S&T budget would enable the TUBITAK to control the cause of research and technological innovation before the Finance Minister and the cause of research and technological innovation before the Financial Minister and the Parliament. A permanent committee on S&T should be responsible to Parliament for monitoring S&T matters. The preparation of a national R&D/S&T budget and its presentation to the parliamentary committee on S&T would be a powerful instrument for promoting scientific and technological awareness among the public at large [30]-[37].
First is the upgrading of standards and quality. This has led to the establishment of a National Quality Council(NQC) and a National Accreditation Council(NAC). However, the development of the NAC seems to be moving very slowly. Second is the support of the Metrology Institute at TUBITAK's Marmara Research Centre(MRC). Third is the creation of the technology Development Foundation of Turkey(TTGV), which funds R&D project primarily for the private sector[21]-[30]-[37].
ICSD 2015 BELGRADE
98
3.4. Evaluation and Assessments
Evaluation and assessments have been a constant in successive development plan, and this has encourged imprevements in the management amd elaboration of S&T policies. R&D projects submitted by individuals of groups of researchers are evaluted through " anonymous peer review" by specialised TUBITAK sub-commities. On the basis of the results of the scientific evaluations, these sub-committees decide on priorities and produce a list for final decision by the research grant committee. TUBITAK offers scholarships for training young scientists on the basis of similar evaluation and assessment methods[10]-[18].
One of the evaluators of a project serve as the technical auditor and monitors how well the proposed activities are carried out. If the project is successfully commercialised, the company has to refund the grants, in instalments over a period of three to five years. Electronics and communications are the technoogical areas in which projects are most frequently proposed and selected . The board of executives carries out a final assessment of hte funded projects[19]-[20]. Turkey should also establish a national centre to monitor and assess technologies in the country and abroad. This initiative could benefit from the experience of various countries(the United States, the Neitherlands) and international/regional organisations (the European Union), and form technology foresight exercises like the ones conducted in Japan, Germany ,United States and other countries. TUBITAK is the natural candidate for carrying out this activity, and concrete steps have been taken by TUBITAK to establish a new evaluation and assessment unit[21].
4. HIGHER EDUCATION SECTOR
4.1. Universities and Their Problems in R&D Activities
Universities are the main performer of R&D in Turkey. Individual researchers in universities, however, perform little R&D . The most vital reason of this apparent situation is the heavy involvement of faculty members in teaching, which leaves them little time for research. Faculty members have little time for research even in the major research universities, where most of the faculty members do virtually no research and a smaller group does a large amount. As a result, Turkish production of research papers is generally low; just one per year per eight professors, on average. However, in some universities, and in some area, production is higher[11]-[13].
Low research productivity is also affected by a number of other factors: libraries are genarally not well maintained; laboratories are difficult to maintain because of a lack of technicians, forcing faculty to pursue R&D abroad; and there is limited financial support for travel. Because a number of the university faculty are trained abroad, it also particularly important to place in them a sense of the importance of R&D in their field to Turkey's industrial development.
A related problem is the fact that public universities are hampered by a large bureaucracy, which is involved in distribution in distribution of funds. This makes it difficult for universities to spend allocated funds efficiently and leaves research. Even when funds are available. It takes months to approve every expenditure. These delays cost the university money and restrict its ability to interact with industry. The issue of the higher education bureaucracy requires urgent attention[12-16].
It seems important to note the big differences in facilities and equipment between the ten older universities in Ankara and İstanbul and the new ones recently established throughout the country. The older universities and the private ones are reasonably well-aquipped and have laboratories able to carry out R&D activities. Expenditure for labour costs for R&D personel does not seem satisfactory, especially in the higher education sector. In the public universities, salaries are a serious issue.It is a geberal experience that in periods of economic crisis, low salaries drive scientiests and engineers away from R&D activities and towards more advanced countries (external brain drain) or towards more financially rewarding local activities. The problem of young researchers and professors must not be overlooked if the university is to take the important role of supporting technological development. Like all personnel in the universities, young researchers face problems of instrumentation, of ,adequate numbers and quality of technicans, and of ability to respond rapidly to industry needs[1-3].
Small and medium-sized enterprises find it difficult to approach universities, it very much need the help of faculty researchers in solving their R&D problems. They should be given effective incentives to work with universities. It id also important to bring together the knowledge of the business schools and of the engineering and science faculties, which today seem to belong to different worlds[2-5];[12-14].

ICSD 2015 BELGRADE
99
Universities are concerned about the tendency of increasing numbers of graduates to enter the service sector rather than join production companies. The corcern is understandable, but it is also vital to recognise the importantance of the service sector and the fact that technological training and research programmes for the service sector will be increasingly useful on the future of Turkey[11;15-16].
4.2. Need for a Systematic View of the Higher Education Sector There is an urgent need for a systematic view of universities that would better integrate old and new ones, clarify their complementary roles, and provide the new universities with the capacity to develop programmes of quality through distance learning, joint faculty appointments, the kind of senior-university/junior-university partnerships that have worked well in a number of other countries.
The universities need to be granted greater autonomy and the capacity to develop initiatives in the pursuit of their mission without being subjected to bureaucratic micromanagement. In brief, each university should be given greater autonomy in selecting their own faculty. There is also a need to change goverment regulations so as to allow faculty anf the universities to form their own companies. If this is allowed, so as not to endanger the university's basic functions of instruction and research, it would help to create close ties between universities and industry and, at the same time, encourage the creation of new high-technology industries[22].
5. CONCLUSIONS
Turkey is at a turning point with regard to science and technology except some specific areas of excellence, S&T is neither sufficiently developed nor efficiently enough deployed to allow the country to meet both its internal needs and the prospects of the international competition.
Science and technology are the fundamental instruments for creating new industries, expanding existing ones, creating jobs, and providing the higher wages that raise economic and living standards. To enable science and technology to carry out their fundamental role, it is essential to adress the issues of strategy, investment, and efficiency. By adressing these issues successfully, Turkey will be able to take full advantage of its great assets: its traditions, its geopolitical position, and the quality of its human resources. With a highly entrepreneurial, hard-working and disciplined population Turkey has the most important ingredient for technological advances and industrial and economic progress.
Turkey also has as part of its scientific and technological infrastructure, a memeber of understanding institutions that are crucial to its further progress, it has among others, several first-class universities, goverment bodies such as TUBITAK with all its institutes, KOSGEB;UCCET , research-intensive industries , such as Aselsanor Netas, and research parks[11].
5.1. Linking S&T Policy With Industrial Policy Turkey needs to develop and implement a much more effective policy to encourage industrial R&D and to link industry and university research, to increase the availability of reasonably priced venture capital; to support technological sectors crucial to technological development, such as software or the service sector, to clarify and enhance the mission of public sector R&D establishment; to strengthen a rather weak R&D activity in agriculture, and to clarify the role of the new public universities-in brief, it needs to create a balanced and integrated system for technological advancement.
It is vital to combine technology and industrial policy. In terms of industrial policy, the role of SMEs essential and means must be found to place them in a better competitive position. In terms of S&T policy, the universities need to be strengthened,industry must become much more involved in R&D and international interaction needs to be carefully improved as it can give Turkey an important competitive advantage.
It is imperative to increase the efficiency of the public sector, with particular urgency in terms of S&T, in the areas that help the development of the universities and their R&D capabilities.
5.2. Sectoral Needs Electronics, microelectronics and computer science are to be the leading sectors for the industrial development of high technology in Turkey in the future. They need to be strengthened and to be supported by the development of stronger capabilities in the area of software, a serious and a recognised weakness, and by widespread access to Internet and other international communication networks.
ICSD 2015 BELGRADE
100
At the same time, Turkey must continue to support well-established industries such as petroleum, cement, glass, textiles, and iron and steel production. It needs to encourage collaboration between these industries and universities and even the location of the research facilities of those industries on the university campuses.
Efforts should be made to encourage the creation of biotechnology enterprises and products, an area that is presently weak.Important obstacles to be overcome include the current laws and very limited research facilities. A realistic strategy for developing biotechnology may consider focusing first on short-range goals and on collobration with other countries, rather than on ambitious but more risky developments.
The construction industry, which is both ver important at home and a major source of revenues from projects abrod, could greatly benefit from research support, particularly in the areas of new materials,instruments,an d new construction methods.
Science and technology and especially R&D also need to focus on the needs of the agricultural sector, which is an less efficient industry and has received less attention from the R&D establishment. Solving the problem requires attention to the technological needs of these small agricultural units.
This approach, university-industry relationship, also reduces the need for foreign consultants and advisors who are always handicapped by not knowing local conditions. This is a very crucial point that has no tolerance for "brain train". The professionals most prepared, most gifted, and most capable, who have initiated research, emigrated to more highy developed centers looking for very advantageous reasons offered justly by international organizations. In this international market that has opened for the professionals, one finds a true paradox. Professional engineers of various specialities are hired to serve experts in advising countries other than those from which they originate. Would it not be more logical for these professionals, loaded with knowledge and experience to be employed in the milieu that they know? Would it not be preferable to create some special incentive so that they do not take up root in other countries? Ought not the agencies for development and international credit that finance these programs understand that the policies they are carrying out in technical assistance are creating an in operable and prejudical international bureaucracy? Should not these organizations, which are diminishing the value of the specific function of the professional, be shown that they are converting him into a special diplomat rather than an advisor?
Furthermore, leadership of universities in providing ideas in new areas has no need of discussion. For example universities may establish a computer center, make it available to outside engineers, and provide short courses to develop profiency in its use all for reasonable fees. If the country needs to be surveyed or mapped, the university develops a center of excellence in this area. If the properties of indigenous materials such as timber and soil are not ver well known,studies are undertaken at the university to determine them. If there is a need to develop an electornics industry, the university might establish a solid-state and even an integrated-circuits laboratory. These examples are not imaginary, they are real applications.
REFERENCES [1]. Mensch, G. (1995), Statemate in technology, Cambridge Ballinger [2]. Blake, Steward P. (1998), Managing For Responsive Research&Development, W.H. Freeman and Company,
Sanfrancisco. [3]. Şen,A.(1992),Science technology and Development: Lessons From Japan For Developing Nations, METU Faculty of
Administrative Science ,vol. 42, METU, Ankara. [4]. Guile, B. R. and Quinn, J. B. (1998), Managing Innovation, National Academy Press, Series On technological and
Social Priorities, Washington. [5]. Pasinetti, Luigi L.,(1993), Structural Economic Dynamics, Cambridge University, Newyork. [6]. Roberts, Philip A.(1988), Technology Transfer: A Policy Model, National Defence University, Washington. [7]. Caulcut,Roland(1995), Statistics in Research and Development, Chapman & Hall, 2nd ed., London. [8]. Steele, Lowell W.(1999), Managing Technology: The Strategic View, McGraw Hill, Newyork. [9]. Micheal J.Stahl, Bounds and Gregory M. (1991), Computing Globally Through Customer Value, Quorum Books,
New York. [10]. Türkiye'de ve Dünyada Yükseköğretim Bilim ve Teknoloji(1994), TÜSİAD, İstanbul. [11]. Tezer,Ö.(1990), Küçük Sanayi İşletmelerimizin Konumu Önemi ve AT'ye Girerken Karşılaştırılabilecek Sorunlar ile
Çözüm Yolları, Milli Productivite Merkezi Yayınları, vol.26, Ankara. [12]. Fehr, Francis(1989), yeni Ürün Tasarlamka Üretmek Pazarlamak, ITO Yayınları, vol.12,İstanbul. [13]. Uludağ, İlhan and Serin, Vildan(1991), Türkiye'de küçük ve orta ölçekli işletmler yapısal ve finansal
sorunlar,Çözümler, ITO Yayınları, vol 25,İstanbul. [14]. Tüzün, S., Türkiye Sanayisinde Küçük Üretim, TUSES Yayınları, İstanbul. [15]. Bağrıaçık, A.(1999), Dışa Açılma Sürecinde Küçük ve Orta Boy Firmalar , Dünya , İstanbul. [16]. Küçük Sanayicinin Soruları Semineri (2007), ITO Yayınları, vol 34, İstanbul.
ICSD 2015 BELGRADE
101
[17]. Ocak, N.(Mart 1994), "Rekabet Öncesi Araştırma", Bilim ve Teknoloji Strateji ve Politika Çalışmaları, TÜBİTAK BTP 94\01, Ankara.
[18]. Araştırma Geliştirme Faaliyet ve Projelerini Değerlendirme Yöntemleri: Bilim ve Teknoloji Strateji ve Politika Çalışmaları(Mart 1995), TÜBİTAK BTP 95\01, Ankara.
[19]. "Bilim ve Teknoloji Yönetim Sistemleri Ülke Örnekleri ve Türkiye", Bilim ve teknoloji Strateji ve Politika Çalışmaları(Mayıs 1996), TÜBİTAK BTP 96\01, Ankara.
[20]. Etkin teknoloji Yönetimi ve Teknoloji Transferi (Mayod 1999), Türkiye Sanayi Sevk ve İdare Enstitüsü,Gebze, Kocaeli.
[21]. "Ar-Ge proje yardımı", Sanayimize Önemli Bir Destek (Mart 1996), TUBİTAK, Ankara. [22]. "University Involvement In Industrial Development", Inıtial Response a UNIDO Survey Factory Establishment and
Management Section,1990, United Nations Industrial Development Organisation Distr. Limited., [23]. Industrial Operation Division Activating the Potential of Universities for Industrial Development, Moil, K Factory
Establishment and Management Section (January 1990),UNIDO. [24]. "Türk Sanayinde teknolojik Yenileme", TTGV Araştırma (2004), TTGV, Ankara. [25]. Bakırtaş, T., Top,S. (2006), Türkiye'nin Teknolojik Gelişim ve Üretim Yapısı için Yeni Bir Süreç Önerisi,
Uluslararası Teknolojik, Ekonomik ve Sosyal Araştırmalar Vakfı(UTESAV) Araştırma Raporları I. [26]. "ODTÜ-Teknokent", Endüstriyel Araştırmalar Programı(2006),Ankara [27]. "Bilim ve Teknoloji Merkezleri Müzesi, Bilim ve Teknoloji Strateji ve Politika Çalışmaları(Kasım 2006), TUBITAK
BTP 96\04, Ankara. [28]. Sanayi ve Teknolojinin Bilgi Ihtiyacını Belirleme Anketi Raporu, Tübitak Enformasyon Hizmetleri Müdürlüğü,
Ankara. [29]. Prof.Martinez, Armando Albert(Spain), Prof.Bugiiarelo, George(ABD) and Prof Sivili, Giorgio(Italy)
(2005),"Reviews of National Science and Technology Policy", Turkey Exeminers Report. [30]. Enformatik Alana Bilim, Teknolojik Bilim, Teknoloji ve Sanayi Politikaları Çalışma Grubu, Enformatik Alanda
Düzenleyici Kuruluşlar ve Yeni Politikalar(Ekim 2005), TUBA-TUBİTAK-TTGV Bilim- Teknoloji-Sanayi Tartışmaları Platformu, Ankara.
[31]. Education for the Manufacturing World of the Future(2005), Series on technology and Social Priorities, National Academy Press, Washington.
[32]. Sanayide Teknolojik İşbiriliği Program, Ar-Ge Proje Pazarı (2007), TUBİTAK-TIDEP, Ankara. [33]. "AR-GE Desteği", Sanayi Kuruluşarına AR_GE Desteği ve Rekabet Üstünlüğü için Yeni Yol(1995), TUBİTAK,
Ankara. [34]. Üniversite/Sanayi Ortak Araştırma Merkezleri Ugulama Esasları, TÜBİTAK, Ankara. [35]. Kafalı, K., Bilimsel ve Teknolojik Gelişmelerde Üniversite/Sanayi İlişkileri ve Destek Kuruluşlar. [36]. Ardan,F.(1996), teknoloji transferi ve İmalat Sanayisinde Uygulması, İstanbul Uni.,Siyasal Bilgiler fak.,İşletme
Yüksek Lisans Tezi,İstanbul. [37]. "Türkiye Üniversite sanayi İşbirliği Birinci Şurası, Üniversite-Sanayi İşbirliğinin Geliştirilmesi, Stratejik Tasarımı ve
Uygulama Modelinin Ortaya Konulması Alt Komisyon Raporu", Bilim ve Teknoloji Strateji ve Politika Çalışmaları (Haziran 1994), TUBİTAK BTP 94/02, Ankara.
ICSD 2015 BELGRADE
102
Non-isothermal Model-free Differential Kinetic Study of Pyrolysis of Waste Polyolefin
Mixture
Karmina Miteva1, Aleksovski Slavcho1, Gordana Bogoeva-Gaceva1
Abstract
The pyrolysis/thermolysis is very important alternative method for chemical recycling of waste polyolefines. The kinetics of thermal degradation of plastic waste must be analyzed to provide the apparent kinetic parameters that are useful for optimisation of pyrolysis process. Thermogravimetric analysis (TGA) provides valuable information for kinetic parameters, such as pre-exponential factor and activation energy.
In the present work, the kinetics of thermal and catalytic degradation of mixture of waste HDPE and PP over ZSM-5 catalyst was studied using the thermo-gravimetric analysis (TGA). The degradation was preformed at five different heating rates (3-20 K/min) under nitrogen atmosphere. The pyrolysis process occurred in an one-step decomposition between 380 and 520 oC. The values of kinetic parameters have been obtained in non isothermal conditions, assuming first order reaction kinetic. Model-free differential Friedman method [1, 2] is used to analyze non-isothermal solid-state kinetic data from TGA. The average activation energy for thermal and catalytic decomposition of waste polyolefin mixture was calculated as 180 KJ/mol and 270 KJ/mol respectively. Keywords: Polyolefines, Pyrolysis, TGA, Kinetics, Non-isothermal Models Parameters.
1. INTRODUCTION
Polyolefines such as polyethylene and polypropylene are very important organic synthetic polymers. Plastic materials are widely used because of their positive characteristic: light weight, durability, corrosion resistant, cheap and etc. Production of plastic products, the same as plastic consumption tremendous increase over the last few decades with a 10% increase yearly [3]. This type of plastic waste is recyclable but, obtained products are more hazardous to the environment than the virgin products and recycling can be done only 2-3 times [4]. Therefore, management of waste polyolefin still represents a big environmental problem. A proper thermal treatment such as pyrolysis resolves the plastic west disposal problems. Pyrolysis processes convert feedstock into high energy content fuels (solid, liquid or gaseous), through adequate heating rate and temperature program. Thermal decomposition of waste is thermochemical processes occurring in an inert atmosphere mostly under non-isothermal conditions [5]. In general pyrolysis processes, thermal or catalytic are high energy, endothermic processes. In particular, thermal decomposition of polyolefins takes place at temperatures of at least 350-550°C [6,7]. This is very complex process of chemical changes of plastics and breaking the long polymer chains into short ones [8,9]. TGA has been widely used for determination of composition of organic and inorganic compounds as well as composition of multicomponent systems. This technique also can determinate the content of moisture in materials, its oxidative stability, lifetime of a products and etc. [10]. Using TGA, the weight loss of material, mostly in non-isothermal conditions at constant heating rate in a controlled atmosphere is measured, therefore this is one of the most extensively used technique for determination of pyrolysis characteristics and kinetic parameters [10,12,13].
1Karmina Miteva: Ss. Cyril and Methodius University, Faculty of Technology and Metallurgy, Rudjer Boskovic 16, 1000 dSkopje, Republic of Macedonia. [email protected]
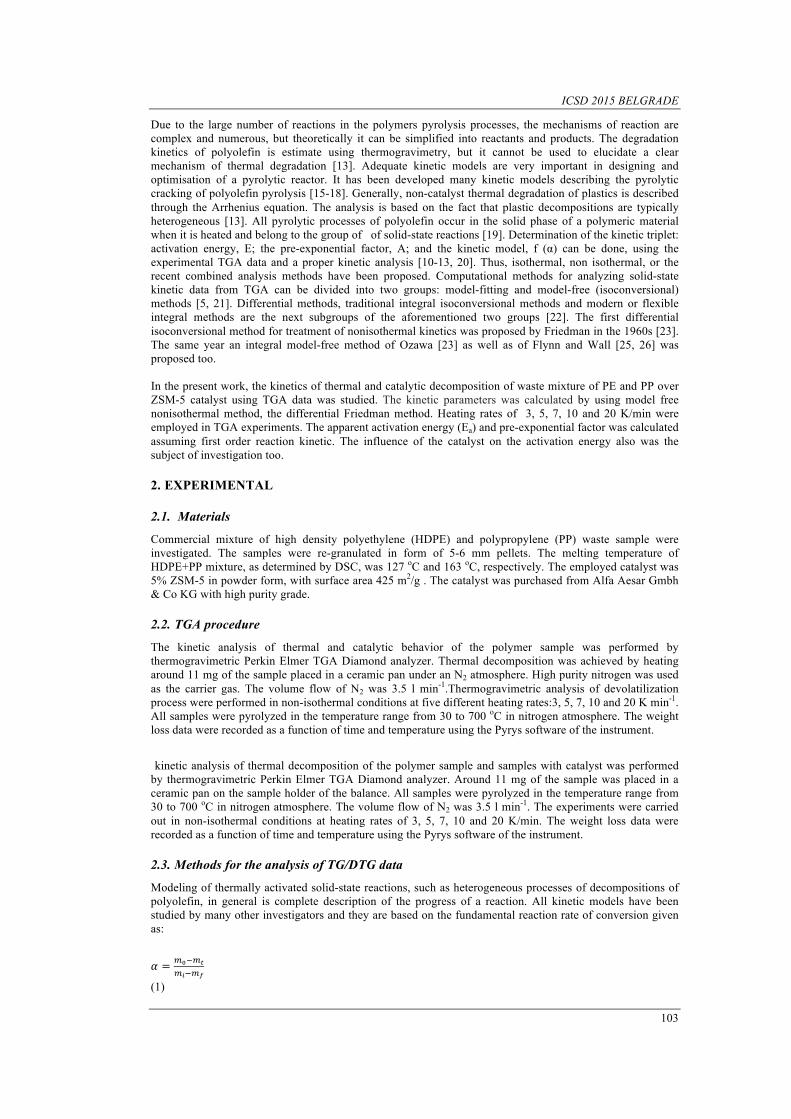
ICSD 2015 BELGRADE
103
Due to the large number of reactions in the polymers pyrolysis processes, the mechanisms of reaction are complex and numerous, but theoretically it can be simplified into reactants and products. The degradation kinetics of polyolefin is estimate using thermogravimetry, but it cannot be used to elucidate a clear mechanism of thermal degradation [13]. Adequate kinetic models are very important in designing and optimisation of a pyrolytic reactor. It has been developed many kinetic models describing the pyrolytic cracking of polyolefin pyrolysis [15-18]. Generally, non-catalyst thermal degradation of plastics is described through the Arrhenius equation. The analysis is based on the fact that plastic decompositions are typically heterogeneous [13]. All pyrolytic processes of polyolefin occur in the solid phase of a polymeric material when it is heated and belong to the group of of solid-state reactions [19]. Determination of the kinetic triplet: activation energy, E; the pre-exponential factor, A; and the kinetic model, f (α) can be done, using the experimental TGA data and a proper kinetic analysis [10-13, 20]. Thus, isothermal, non isothermal, or the recent combined analysis methods have been proposed. Computational methods for analyzing solid-state kinetic data from TGA can be divided into two groups: model-fitting and model-free (isoconversional) methods [5, 21]. Differential methods, traditional integral isoconversional methods and modern or flexible integral methods are the next subgroups of the aforementioned two groups [22]. The first differential isoconversional method for treatment of nonisothermal kinetics was proposed by Friedman in the 1960s [23]. The same year an integral model-free method of Ozawa [23] as well as of Flynn and Wall [25, 26] was proposed too. In the present work, the kinetics of thermal and catalytic decomposition of waste mixture of PE and PP over ZSM-5 catalyst using TGA data was studied. The kinetic parameters was calculated by using model free nonisothermal method, the differential Friedman method. Heating rates of 3, 5, 7, 10 and 20 K/min were employed in TGA experiments. The apparent activation energy (Ea) and pre-exponential factor was calculated assuming first order reaction kinetic. The influence of the catalyst on the activation energy also was the subject of investigation too.
2. EXPERIMENTAL
2.1. Materials
Commercial mixture of high density polyethylene (HDPE) and polypropylene (PP) waste sample were investigated. The samples were re-granulated in form of 5-6 mm pellets. The melting temperature of HDPE+PP mixture, as determined by DSC, was 127 oC and 163 oC, respectively. The employed catalyst was 5% ZSM-5 in powder form, with surface area 425 m2/g . The catalyst was purchased from Alfa Aesar Gmbh & Co KG with high purity grade.
2.2. TGA procedure
The kinetic analysis of thermal and catalytic behavior of the polymer sample was performed by thermogravimetric Perkin Elmer TGA Diamond analyzer. Thermal decomposition was achieved by heating around 11 mg of the sample placed in a ceramic pan under an N2 atmosphere. High purity nitrogen was used as the carrier gas. The volume flow of N2 was 3.5 l min-1.Thermogravimetric analysis of devolatilization process were performed in non-isothermal conditions at five different heating rates:3, 5, 7, 10 and 20 K min-1. All samples were pyrolyzed in the temperature range from 30 to 700 oC in nitrogen atmosphere. The weight loss data were recorded as a function of time and temperature using the Pyrys software of the instrument.
kinetic analysis of thermal decomposition of the polymer sample and samples with catalyst was performed by thermogravimetric Perkin Elmer TGA Diamond analyzer. Around 11 mg of the sample was placed in a ceramic pan on the sample holder of the balance. All samples were pyrolyzed in the temperature range from 30 to 700 oC in nitrogen atmosphere. The volume flow of N2 was 3.5 l min-1. The experiments were carried out in non-isothermal conditions at heating rates of 3, 5, 7, 10 and 20 K/min. The weight loss data were recorded as a function of time and temperature using the Pyrys software of the instrument.
2.3. Methods for the analysis of TG/DTG data
Modeling of thermally activated solid-state reactions, such as heterogeneous processes of decompositions of polyolefin, in general is complete description of the progress of a reaction. All kinetic models have been studied by many other investigators and they are based on the fundamental reaction rate of conversion given as:
! = !!!!!!!!!!
(1)

ICSD 2015 BELGRADE
104
under conditions far from equilibrium, by the following expression: !"!" = ! ! !(!) (2) Where function: ! ! = !
! !!!!!"
(3) described by the Arrhenius equation. For linear heating rate β , which is most common for studying solid-state reaction, rate conditions eq. (1) can be written:
!"!" =
!! !
!!!!" !(!)
(4) Where conversion function !(!) very often is presumed to be an n-th order for solid-state reactions [27]: ! ! = (1 − !)! (5)
2.4. Friedman method
Transformation rate-isoconversion methods, or differential Friedman methods does not use any mathematical approximation, but instead uses a determination of the reaction rate at an equivalent stage of the reaction for various heating rates [28].
!" !"!" = − !!
! + !" !" ! (6)
Thus if a linear heating experiments at different heating rates, β, are performed, than f (α) will be a constant for fixed given conversion !. Determination of activation energies Ea can be obtained from the slope of plots of ln (dα/dt) versus 1/T, Eq 6, and the intercept gives the value of the apparent preexponential factor, A.
3. RESULTS AND DISCUSSION
3.1. Thermal decomposition process
The DTG curves of thermal Fig. 1(a) and catalytic Fig. 1(b) degradation of polyolefin mixture for five different heating rates of 3, 5, 7, 10 and 20 K min−1 under nitrogen atmosphere are shown respectively. The DTG curves for each sample are similar to each other for different heating rates. It was observed that DTG curves have one peak for samples of pure polyolefin mixture. These peaks indicate that the pyrolysis process of waste polyolefin mixture (HDPE + PP) include a single degradation step. In comparison, the DTG curves for samples with a catalyst have two peaks on DTG curves although the TGA curves of degradation of polyolefin mixture in the presence of 5% ZSM-5 as a catalyst appears as a single weight-loss step.This indicates that catalytic degradation of polyolefin mixture is too complex and two distinct reactions are occurring during the decomposition of the samples.
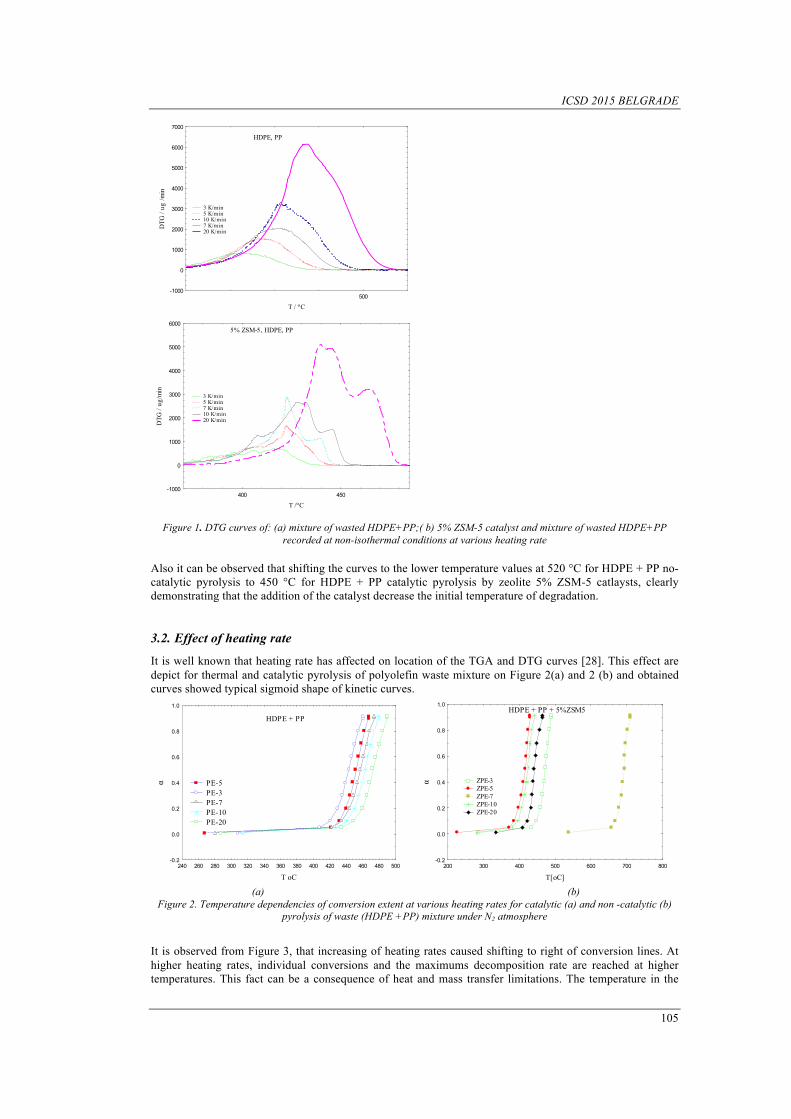
ICSD 2015 BELGRADE
105
500
T / oC
-1000
0
1000
2000
3000
4000
5000
6000
7000
DTG
/ ug
/min
3 K/min 5 K/min 10 K/min 7 K/min 20 K/min
HDPE, PP
400 450
T /oC
-1000
0
1000
2000
3000
4000
5000
6000
DTG
/ ug
/min
5% ZSM-5, HDPE, PP
3 K/min 5 K/min 7 K/min 10 K/min 20 K/min
Figure 1. DTG curves of: (a) mixture of wasted HDPE+PP;( b) 5% ZSM-5 catalyst and mixture of wasted HDPE+PP
recorded at non-isothermal conditions at various heating rate
Also it can be observed that shifting the curves to the lower temperature values at 520 °C for HDPE + PP no-catalytic pyrolysis to 450 °C for HDPE + PP catalytic pyrolysis by zeolite 5% ZSM-5 catlaysts, clearly demonstrating that the addition of the catalyst decrease the initial temperature of degradation.
3.2. Effect of heating rate
It is well known that heating rate has affected on location of the TGA and DTG curves [28]. This effect are depict for thermal and catalytic pyrolysis of polyolefin waste mixture on Figure 2(a) and 2 (b) and obtained curves showed typical sigmoid shape of kinetic curves.
240 260 280 300 320 340 360 380 400 420 440 460 480 500
T oC
-0.2
0.0
0.2
0.4
0.6
0.8
1.0
α PE-5 PE-3 PE-7 PE-10 PE-20
HDPE + PP
200 300 400 500 600 700 800
T[oC]
-0.2
0.0
0.2
0.4
0.6
0.8
1.0
α
HDPE + PP + 5%ZSM5
ZPE-3 ZPE-5 ZPE-7 ZPE-10 ZPE-20
(a) (b)
Figure 2. Temperature dependencies of conversion extent at various heating rates for catalytic (a) and non -catalytic (b) pyrolysis of waste (HDPE +PP) mixture under N2 atmosphere
It is observed from Figure 3, that increasing of heating rates caused shifting to right of conversion lines. At higher heating rates, individual conversions and the maximums decomposition rate are reached at higher temperatures. This fact can be a consequence of heat and mass transfer limitations. The temperature in the
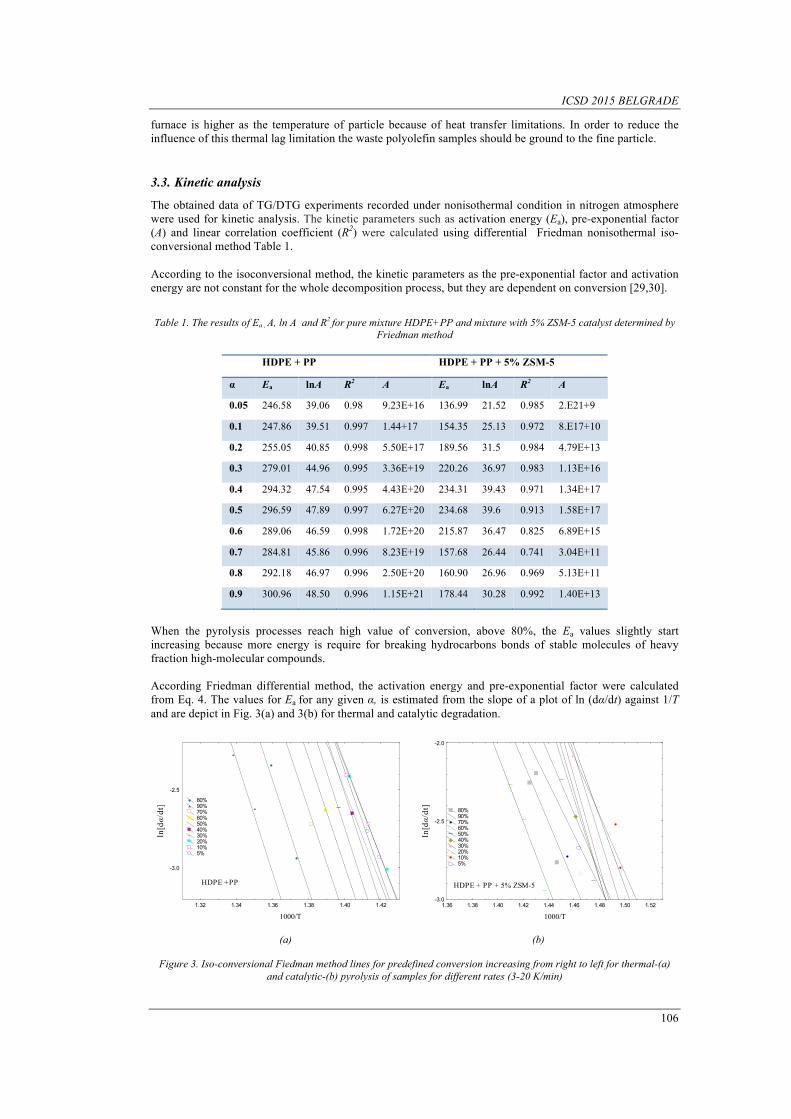
ICSD 2015 BELGRADE
106
furnace is higher as the temperature of particle because of heat transfer limitations. In order to reduce the influence of this thermal lag limitation the waste polyolefin samples should be ground to the fine particle.
3.3. Kinetic analysis
The obtained data of TG/DTG experiments recorded under nonisothermal condition in nitrogen atmosphere were used for kinetic analysis. The kinetic parameters such as activation energy (Ea), pre-exponential factor (A) and linear correlation coefficient (R2) were calculated using differential Friedman nonisothermal iso-conversional method Table 1. According to the isoconversional method, the kinetic parameters as the pre-exponential factor and activation energy are not constant for the whole decomposition process, but they are dependent on conversion [29,30].
Table 1. The results of Ea , A, ln A and R2 for pure mixture HDPE+PP and mixture with 5% ZSM-5 catalyst determined by Friedman method
HDPE + PP HDPE + PP + 5% ZSM-5
α Ea lnA R2 A Ea lnA R2 A
0.05 246.58 39.06 0.98 9.23E+16 136.99 21.52 0.985 2.E21+9
0.1 247.86 39.51 0.997 1.44+17 154.35 25.13 0.972 8.E17+10
0.2 255.05 40.85 0.998 5.50E+17 189.56 31.5 0.984 4.79E+13
0.3 279.01 44.96 0.995 3.36E+19 220.26 36.97 0.983 1.13E+16
0.4 294.32 47.54 0.995 4.43E+20 234.31 39.43 0.971 1.34E+17
0.5 296.59 47.89 0.997 6.27E+20 234.68 39.6 0.913 1.58E+17
0.6 289.06 46.59 0.998 1.72E+20 215.87 36.47 0.825 6.89E+15
0.7 284.81 45.86 0.996 8.23E+19 157.68 26.44 0.741 3.04E+11
0.8 292.18 46.97 0.996 2.50E+20 160.90 26.96 0.969 5.13E+11
0.9 300.96 48.50 0.996 1.15E+21 178.44 30.28 0.992 1.40E+13
When the pyrolysis processes reach high value of conversion, above 80%, the Ea values slightly start increasing because more energy is require for breaking hydrocarbons bonds of stable molecules of heavy fraction high-molecular compounds. According Friedman differential method, the activation energy and pre-exponential factor were calculated from Eq. 4. The values for Ea for any given α, is estimated from the slope of a plot of ln (dα/dt) against 1/T and are depict in Fig. 3(a) and 3(b) for thermal and catalytic degradation.
1.32 1.34 1.36 1.38 1.40 1.42
1000/T
-3.0
-2.5
ln[dα/dt] 80%
90% 70% 60% 50% 40% 30% 20% 10% 5%
HDPE +PP
1.36 1.38 1.40 1.42 1.44 1.46 1.48 1.50 1.52
1000/T
-3.0
-2.5
-2.0
ln[dα/dt]
80% 90% 70% 60% 50% 40% 30% 20% 10% 5%
HDPE + PP + 5% ZSM-5
(a) (b)
Figure 3. Iso-conversional Fiedman method lines for predefined conversion increasing from right to left for thermal-(a)
and catalytic-(b) pyrolysis of samples for different rates (3-20 K/min)
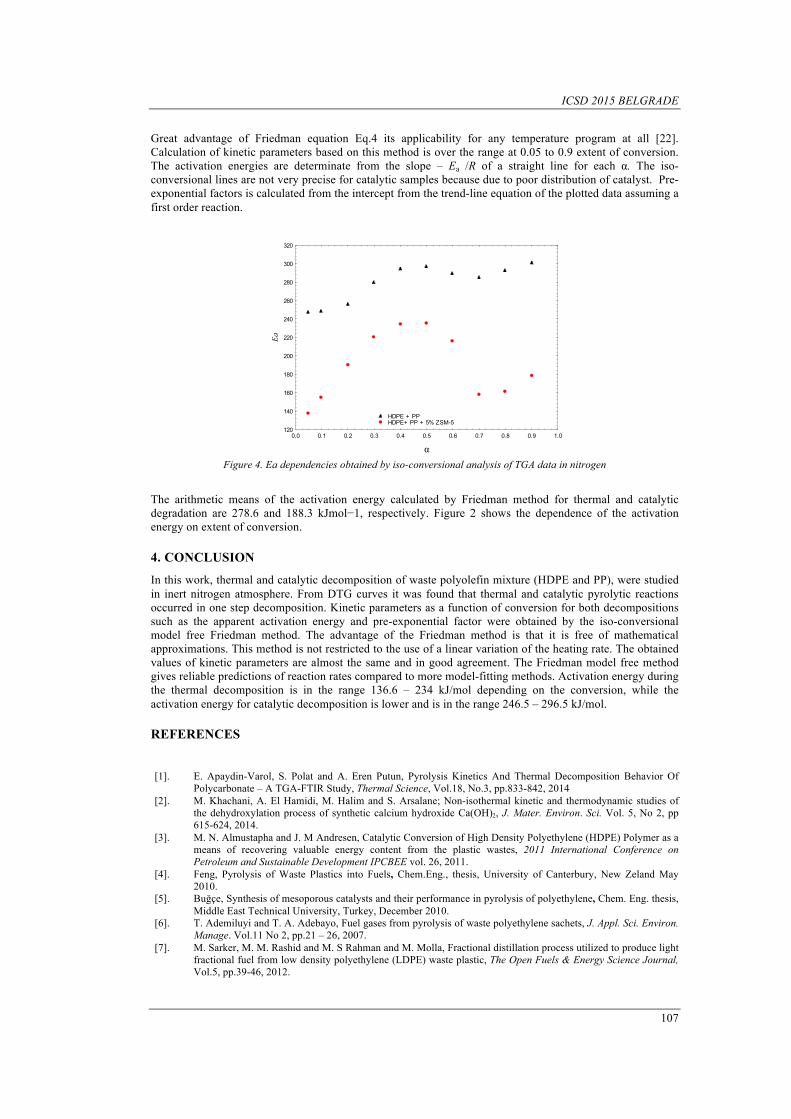
ICSD 2015 BELGRADE
107
Great advantage of Friedman equation Eq.4 its applicability for any temperature program at all [22]. Calculation of kinetic parameters based on this method is over the range at 0.05 to 0.9 extent of conversion. The activation energies are determinate from the slope – Ea /R of a straight line for each α. The iso-conversional lines are not very precise for catalytic samples because due to poor distribution of catalyst. Pre-exponential factors is calculated from the intercept from the trend-line equation of the plotted data assuming a first order reaction.
0.0 0.1 0.2 0.3 0.4 0.5 0.6 0.7 0.8 0.9 1.0
α
120
140
160
180
200
220
240
260
280
300
320
Ea
HDPE + PP HDPE+ PP + 5% ZSM-5
Figure 4. Ea dependencies obtained by iso-conversional analysis of TGA data in nitrogen
The arithmetic means of the activation energy calculated by Friedman method for thermal and catalytic degradation are 278.6 and 188.3 kJmol−1, respectively. Figure 2 shows the dependence of the activation energy on extent of conversion.
4. CONCLUSION
In this work, thermal and catalytic decomposition of waste polyolefin mixture (HDPE and PP), were studied in inert nitrogen atmosphere. From DTG curves it was found that thermal and catalytic pyrolytic reactions occurred in one step decomposition. Kinetic parameters as a function of conversion for both decompositions such as the apparent activation energy and pre-exponential factor were obtained by the iso-conversional model free Friedman method. The advantage of the Friedman method is that it is free of mathematical approximations. This method is not restricted to the use of a linear variation of the heating rate. The obtained values of kinetic parameters are almost the same and in good agreement. The Friedman model free method gives reliable predictions of reaction rates compared to more model-fitting methods. Activation energy during the thermal decomposition is in the range 136.6 – 234 kJ/mol depending on the conversion, while the activation energy for catalytic decomposition is lower and is in the range 246.5 – 296.5 kJ/mol.
REFERENCES
[1]. E. Apaydin-Varol, S. Polat and A. Eren Putun, Pyrolysis Kinetics And Thermal Decomposition Behavior Of Polycarbonate – A TGA-FTIR Study, Thermal Science, Vol.18, No.3, pp.833-842, 2014
[2]. M. Khachani, A. El Hamidi, M. Halim and S. Arsalane; Non-isothermal kinetic and thermodynamic studies of the dehydroxylation process of synthetic calcium hydroxide Ca(OH)2, J. Mater. Environ. Sci. Vol. 5, No 2, pp 615-624, 2014.
[3]. M. N. Almustapha and J. M Andresen, Catalytic Conversion of High Density Polyethylene (HDPE) Polymer as a means of recovering valuable energy content from the plastic wastes, 2011 International Conference on Petroleum and Sustainable Development IPCBEE vol. 26, 2011.
[4]. Feng, Pyrolysis of Waste Plastics into Fuels, Chem.Eng., thesis, University of Canterbury, New Zeland May 2010.
[5]. Buğçe, Synthesis of mesoporous catalysts and their performance in pyrolysis of polyethylene, Chem. Eng. thesis, Middle East Technical University, Turkey, December 2010.
[6]. T. Ademiluyi and T. A. Adebayo, Fuel gases from pyrolysis of waste polyethylene sachets, J. Appl. Sci. Environ. Manage. Vol.11 No 2, pp.21 – 26, 2007.
[7]. M. Sarker, M. M. Rashid and M. S Rahman and M. Molla, Fractional distillation process utilized to produce light fractional fuel from low density polyethylene (LDPE) waste plastic, The Open Fuels & Energy Science Journal, Vol.5, pp.39-46, 2012.
ICSD 2015 BELGRADE
108
[8]. M.L. Mastellone, U. Arena, G. Barbato, C. Carrillo, E. Romeo, S. Granata, A. Frassoldati, T. Faravelli and E. Ranzi, A preliminary modeling study of a fluidized bed pyrolyser for plastic wastes, 29th Meeting on Combustion, Pisa, June 14-17, 2006.
[9]. N. Miskolczi, L. Bartha, G. Deák, B. Jóver and D. Kalló, Kinetic model of the chemical recycling of waste polyethylene into fuels, Process Safety and Environmental Protection, Vol82, No. B3, pp 223 -229, 2004.
[10]. J. W. Park, S. C. Oh, H. P. Lee, H. T. Kim and K Ok Yoo, A kinetic analysis of thermal degradation of polymers using a dynamic method, Polymer Degradation and Stability Vol.67, pp.535-540, 2000.
[11]. M. M Farid and E. Khaghanikavkan, Thermal pyrolysis of polyethylene: Kinetic study, Energy Science and Technology, Vol. 2, No. 1, pp. 1-10, 2011.
[12]. A.K Galwey, M.E Brown, Thermal Decomposition of Ionic Solids,1st. ed. Amsterdam-Holand, Elsevier, 1999. [13]. Berrueco C., Ceamanos J., E. Esperanza and J. F. Mastral, Experimental study of co-pyrolysis of
polyethylene/sawdust mixtures, Thermal Science, Vol.8, No.2, pp. 65-80, 2004. [14]. Han, Theoretical study of thermal analysis kinetics, Mech.eng. thesis, University of Kentucky, USA, 2014. [15]. A. Aboulkas, K. El Harfi, A. El Bouadili, M. Benchanaa, A. Mokhlisse and A. Outzourit, Kinetics of co-
pyrolysis of tarfaya (morocco) oil shale with high-density polyethylene, Oil Shale, Vol. 24, No. 1, pp. 15–33, 2007.
[16]. I. Kayacan and Ö. M. Do˘gan, Pyrolysis of Low and High Density Polyethylene. Part I: Non-isothermal Pyrolysis Kinetics, Energy Sources Part A, Vol.30 pp.385–391, 2008.
[17]. C. Gai, Y. Dong, T and Zhang, The kinetic analysis of the pyrolysis of agricultural residue under non-isothermal conditions, Bioresource Technology, Vol. 127, pp. 298-305, 2013.
[18]. Pinthong, Co-pyrolysis of rice husk, polyethylene and polypropylene mixtures: a kinetic study, Chem-Bio. eng., thesis, Graduate School, Kasetsart University, Thailand, 2009.
[19]. A. F. López, A. A. El Hadad, F. J. Alguacil, T. A. Centeno and B. Lobato, Kinetics of the thermal degradation of granulated scrap tyres: a model-free analysis Materials Science (Medžiagotyra), Vol. 19, No.4, pp.1320–1329, 2013.
[20]. Khawam, Application of solid-state kinetics to desolvation reactions, Philos. thesis, University of Iowa, USA, 2014.
[21]. S. Vyazovkin, Iso-conversional Kinetics of Thermally Stimulated Processes, Intern. Publisher Springer Switzerland, 2015.
[22]. H.L. Friedman, Kinetics of thermal degradation of char-forming plastics from thermogravimetry Application to a phenolic plastic. J Polym Sci Part C, vol. 6, pp.183–195, 1964.
[23]. T. Ozawa, A new method of analyzing thermogravimetric data. Bull Chem Soc Japan, Vol. 38, pp.1881–1886, 1965.
[24]. J.H. Flynn and L.A. Wall A quick, direct method for the determination of activation energyfrom thermogravimetric data. J Polym Sci B Polym Lett, Vol.4, pp.323–328, 1966.
[25]. J.H. Flynn and L.A. Wall, General treatment of the thermogravimetry of polymers. J Res Nat Bur Standards Part A, Vol.70, pp.487–523, 1966.
[26]. Philcoh, A new adaptation of a method of invariant kinetic parameters and its application to a flame retardant system, Philosophy thesis, the University of Adelaide, USA. Febryary, 2014.
[27]. N.A. Liu and W.C. Fan, Critical consideration on the Freeman and Carroll method for evaluating global mass loss kinetics of polymer thermal degradation, Thermochimica Acta Vol. 338, pp. 85-94, 1999.
[28]. P. Šimon, Isoconversional methods, Journal of Thermal Analysis and Calorimetry, Vol.76, No. 1 , pp. 123-132, 2004.
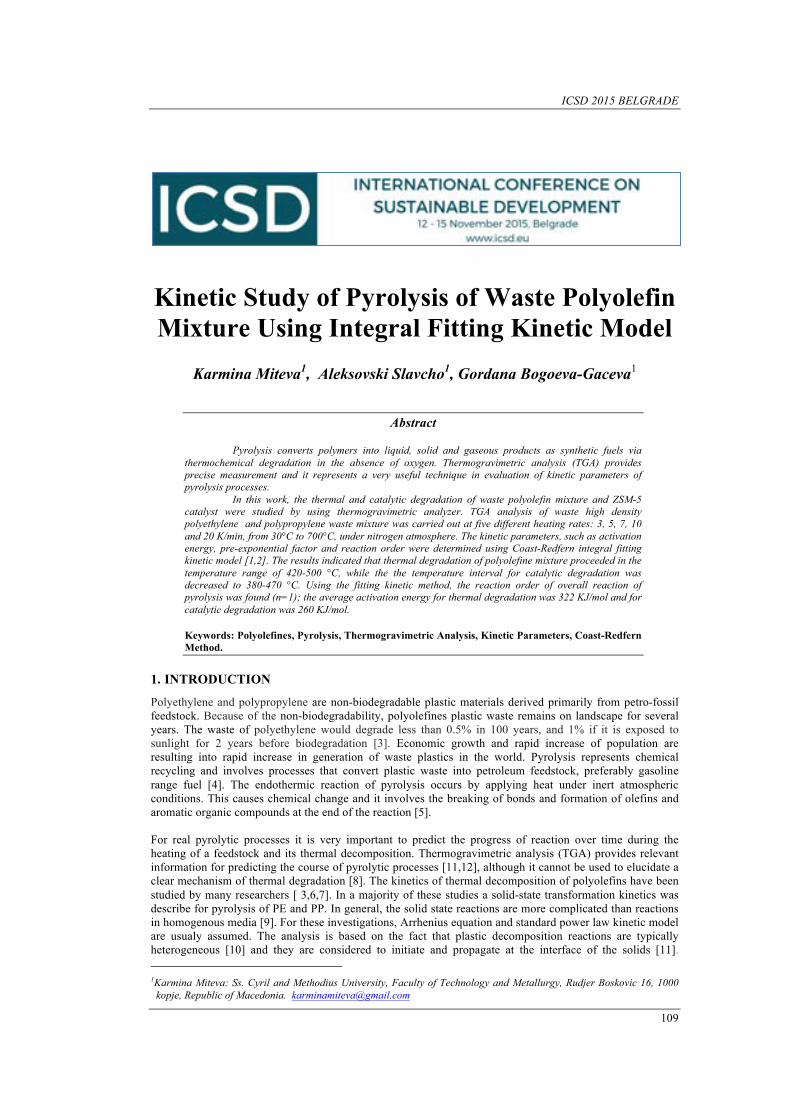
ICSD 2015 BELGRADE
109
Kinetic Study of Pyrolysis of Waste Polyolefin Mixture Using Integral Fitting Kinetic Model
Karmina Miteva1, Aleksovski Slavcho1, Gordana Bogoeva-Gaceva1
Abstract
Pyrolysis converts polymers into liquid, solid and gaseous products as synthetic fuels via thermochemical degradation in the absence of oxygen. Thermogravimetric analysis (TGA) provides precise measurement and it represents a very useful technique in evaluation of kinetic parameters of pyrolysis processes.
In this work, the thermal and catalytic degradation of waste polyolefin mixture and ZSM-5 catalyst were studied by using thermogravimetric analyzer. TGA analysis of waste high density polyethylene and polypropylene waste mixture was carried out at five different heating rates: 3, 5, 7, 10 and 20 K/min, from 30°C to 700°C, under nitrogen atmosphere. The kinetic parameters, such as activation energy, pre-exponential factor and reaction order were determined using Coast-Redfern integral fitting kinetic model [1,2]. The results indicated that thermal degradation of polyolefine mixture proceeded in the temperature range of 420-500 °C, while the the temperature interval for catalytic degradation was decreased to 380-470 °C. Using the fitting kinetic method, the reaction order of overall reaction of pyrolysis was found (n=1); the average activation energy for thermal degradation was 322 KJ/mol and for catalytic degradation was 260 KJ/mol. Keywords: Polyolefines, Pyrolysis, Thermogravimetric Analysis, Kinetic Parameters, Coast-Redfern Method.
1. INTRODUCTION
Polyethylene and polypropylene are non-biodegradable plastic materials derived primarily from petro-fossil feedstock. Because of the non-biodegradability, polyolefines plastic waste remains on landscape for several years. The waste of polyethylene would degrade less than 0.5% in 100 years, and 1% if it is exposed to sunlight for 2 years before biodegradation [3]. Economic growth and rapid increase of population are resulting into rapid increase in generation of waste plastics in the world. Pyrolysis represents chemical recycling and involves processes that convert plastic waste into petroleum feedstock, preferably gasoline range fuel [4]. The endothermic reaction of pyrolysis occurs by applying heat under inert atmospheric conditions. This causes chemical change and it involves the breaking of bonds and formation of olefins and aromatic organic compounds at the end of the reaction [5]. For real pyrolytic processes it is very important to predict the progress of reaction over time during the heating of a feedstock and its thermal decomposition. Thermogravimetric analysis (TGA) provides relevant information for predicting the course of pyrolytic processes [11,12], although it cannot be used to elucidate a clear mechanism of thermal degradation [8]. The kinetics of thermal decomposition of polyolefins have been studied by many researchers [ 3,6,7]. In a majority of these studies a solid-state transformation kinetics was describe for pyrolysis of PE and PP. In general, the solid state reactions are more complicated than reactions in homogenous media [9]. For these investigations, Arrhenius equation and standard power law kinetic model are usualy assumed. The analysis is based on the fact that plastic decomposition reactions are typically heterogeneous [10] and they are considered to initiate and propagate at the interface of the solids [11]. 1Karmina Miteva: Ss. Cyril and Methodius University, Faculty of Technology and Metallurgy, Rudjer Boskovic 16, 1000 dkopje, Republic of Macedonia. [email protected]

ICSD 2015 BELGRADE
110
Different kinetic methods, model-fitting and model-free (isoconversional) have been employed to represent the progress of the reaction. Coats-Redfern model is widely used non-isothermal model-fitting method. Model fitting methods minimize the difference between the experimentally measured and calculated data of one reaction rate. The first and most important step in model fitting is to identify an appropriate model [12]. This method extract the three kinetic parameters (A, Ea and model) from nonisothermal data and it was widely used earlier in solid-state kinetic analysis and it continues to appear now days [13]. The objective of this work was to study the thermal and catalytic decomposition of waste polyolefin mixture containing polyethylene and polypropylene. The catalyst employed was ZSM-5 zeolite and the analysis was performed in non-isothermal TG-regime, in an inert atmosphere. TGA data were taken at different heating rates (3, 5, 7, 10 and 20 Kmin-1), in the temperature range of 30–700 oC. The decomposition temperature of the waste plastic mixture was influenced by the heating rate, both in catalytic and non-catalytic degradation process. From the obtained results, the apparent kinetic parameters of thermal and catalytic degradation were determined, using integral Coats-Redfern method. The reaction order n=1 gives the best fitting of experimental data. The average activation energy for reaction order n=1 of thermal degradation was 322 KJ/mol and for catalytic degradation - 260 KJ/mol.
2. EXPERIMENTAL
2.1. Materials
Commercial mixture of high density polyethylene (HDPE) and polypropylene (PP) waste was investigated. The samples were re-granulated in form of 5-6 mm pellets. The melting temperature of HDPE+PP mixture, as determined by DSC, was 127 oC and 163 oC, respectively. The employed catalyst was ZSM-5 in powder form, with surface area 425 m2/g . The catalyst was purchased from Alfa Aesar Gmbh & Co KG with high purity grade.
2.2. TGA procedure
The kinetic analysis of thermal decomposition of the polymer sample and samples with catalyst was performed by thermogravimetric Perkin Elmer TGA Diamond analyzer. Around 11 mg of the sample was placed in a ceramic pan on the sample holder of the balance. All samples were pyrolyzed in the temperature range from 30 to 700 oC in nitrogen atmosphere. The volume flow of N2 was 3.5 l min-1. The experiments were carried out in non-isothermal conditions at heating rates of 3, 5, 7, 10 and 20 K/min. The weight loss data were recorded as a function of time and temperature using the Pyrys software of the instrument.
2.3. Kinetic studies using TGA data
Thermogravimetric experimental data were used for estimation of kinetic parameters ( Ea, A and n) by iso-conversional method. Coats and Redfern method was applied for the description of pyrolysis of waste polymer mixture. The rate of reaction follows Arrhenius equation:
!!!" = Ae
!!!!" f(α)
(1)
When the samples are heated at constant linear heating rate under non-isothermal conditions where actual temperature is ! = !! + ! ∗ ! , temperature dependence of the rate equation is given by differential form of the nonisothermal rate law:
!!!" =
!! e
!!!!" f(α)
(2)
and upon integration:
!(!) = !! !
!!!!" !"!
!
(3)

ICSD 2015 BELGRADE
111
Expression (3) represents an integral form of the non-isothermal rate law where A; Ea; T and R are the pre-exponential factor (1/min), the activation energy (J/mol), the temperature of reaction (K), and the gas constant (8.314 J/mol K), respectively and n denotes the overall reaction order. For solid state reaction a kinetic model function for treating the conversion is given with expression:
! ! = (1 − !)! (4) while extend of conversion (α) is given as:
! = !!!!!!!!!!
(5)
where m0 is the initial mass of the sample, mt is the actual mass of sample after “t” minutes (mg), and mf is the final mass of sample after pyrolysis (mg).
2.4. Coats-Redfern method
Coats-Redfern method is model fitting integral method and it involves the thermal degradation mechanism [13.] This method is one of the most widely used procedures for the determination of kinetic parameters (Ea and A). This integral method [14-17] uses the integral form of the nonisothermal rate law given with Eq.4 The method assumes various orders of reaction and compares the linearity in each case to select the correct order [18]. The Ea at a constant heating rate for any of the g(α) functions [15] can be obtained from equation (6): for n ≠1
ln !! !!! !!!
!! !!! = !" !"!!!
1 − !!"!!
+ !!!!"
(6) for n =1 ln (!!" !!!
!! ) = !" !"!!!
(1 − !!"!!
+ !!!!" )
(7) The value of Ea is obtained from the slope of the straight lines − !!
! from the plots of left side of Eq (6). versus 1/T if n is correctly chosen. Pre-exponential factor A can also be determined from constant expression !" !"
!!!(1 − !!"
!!+ !!!
!" ) in Eq. (6) and Eq. (7) by taking temperature T at which:
!! = !!!!!
! (8) and the intercept of the straight line [19, 20].
3. RESULTS AND DISCUSSION
3.1. Thermal decomposition process
The TG curves of thermal (Fig. 1-a) and catalytic degradation (Fig. 1-b) of polyolefin mixture for five different heating rates of 3, 5, 7, 10 and 20 K min−1 are shown in Fig. 1. The rate of mass loss is strongly dependent on the rate of temperature increasing, which is in agreement with most thermogravimetry studies. Thus, the increase of the heating rate results in shifting of the curves towards higher temperatures. If TGA measurements employed fast heating rate, a polymer decomposing will appear to have higher initial temperature of decomposition than its true initial temperature, because defined time is required to cause a detectable weight change [21]. Depending on the heating rate (from 3 to 20 K/min), the devolatilization
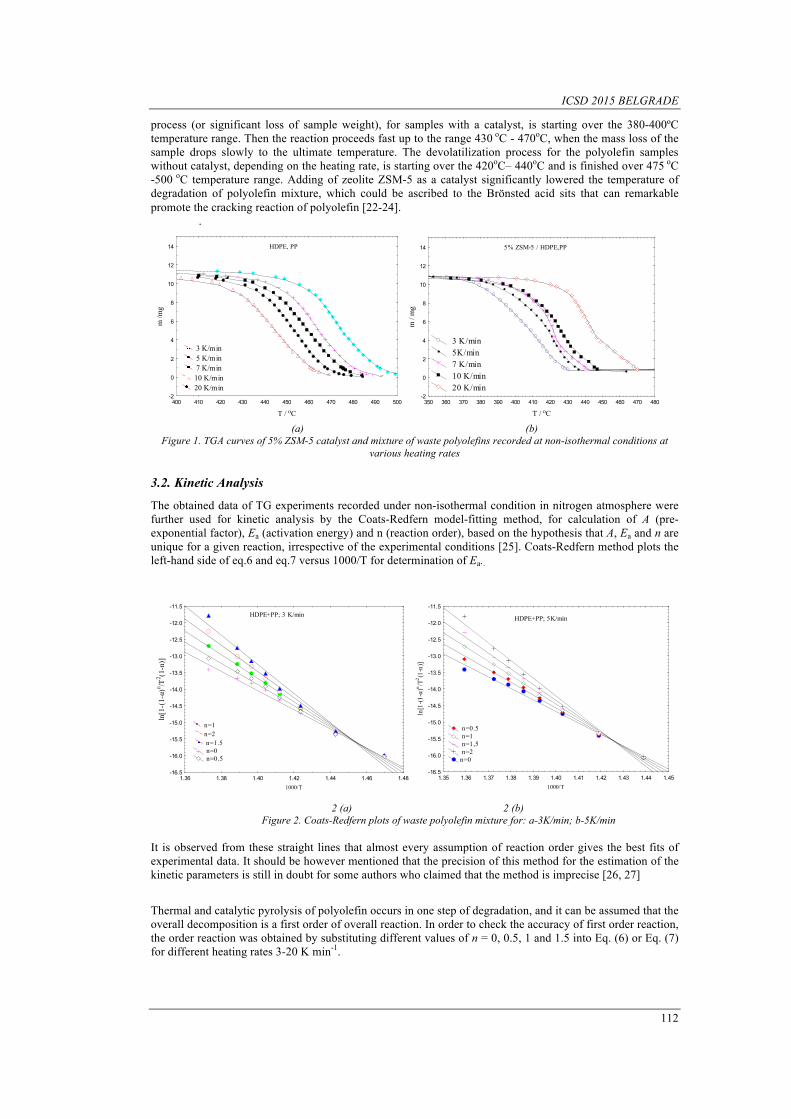
ICSD 2015 BELGRADE
112
process (or significant loss of sample weight), for samples with a catalyst, is starting over the 380-400ºC temperature range. Then the reaction proceeds fast up to the range 430 oC - 470oC, when the mass loss of the sample drops slowly to the ultimate temperature. The devolatilization process for the polyolefin samples without catalyst, depending on the heating rate, is starting over the 420oC– 440oC and is finished over 475 oC -500 oC temperature range. Adding of zeolite ZSM-5 as a catalyst significantly lowered the temperature of degradation of polyolefin mixture, which could be ascribed to the Brönsted acid sits that can remarkable promote the cracking reaction of polyolefin [22-24].
.
400 410 420 430 440 450 460 470 480 490 500
T / oC
-2
0
2
4
6
8
10
12
14
m /m
g
3 K/min 5 K/min 7 K/min 10 K/min 20 K/min
HDPE, PP
(a) (b)
Figure 1. TGA curves of 5% ZSM-5 catalyst and mixture of waste polyolefins recorded at non-isothermal conditions at various heating rates
3.2. Kinetic Analysis
The obtained data of TG experiments recorded under non-isothermal condition in nitrogen atmosphere were further used for kinetic analysis by the Coats-Redfern model-fitting method, for calculation of A (pre-exponential factor), Ea (activation energy) and n (reaction order), based on the hypothesis that A, Ea and n are unique for a given reaction, irrespective of the experimental conditions [25]. Coats-Redfern method plots the left-hand side of eq.6 and eq.7 versus 1000/T for determination of Ea..
1.36 1.38 1.40 1.42 1.44 1.46 1.481000/T
-16.5
-16.0
-15.5
-15.0
-14.5
-14.0
-13.5
-13.0
-12.5
-12.0
-11.5
ln[1
-(1-α)n /T
2 (1-n)]
n=1 n=2 n=1.5
n=0 n=0.5
HDPE+PP; 3 K/min
1.35 1.36 1.37 1.38 1.39 1.40 1.41 1.42 1.43 1.44 1.451000/T
-16.5
-16.0
-15.5
-15.0
-14.5
-14.0
-13.5
-13.0
-12.5
-12.0
-11.5
ln[1
-(1-α)n/T2 (1-n)]
n=0.5 n=1 n=1,5 n=2 n=0
HDPE+PP; 5K/min
2 (a) 2 (b)
Figure 2. Coats-Redfern plots of waste polyolefin mixture for: a-3K/min; b-5K/min It is observed from these straight lines that almost every assumption of reaction order gives the best fits of experimental data. It should be however mentioned that the precision of this method for the estimation of the kinetic parameters is still in doubt for some authors who claimed that the method is imprecise [26, 27]
Thermal and catalytic pyrolysis of polyolefin occurs in one step of degradation, and it can be assumed that the overall decomposition is a first order of overall reaction. In order to check the accuracy of first order reaction, the order reaction was obtained by substituting different values of n = 0, 0.5, 1 and 1.5 into Eq. (6) or Eq. (7) for different heating rates 3-20 K min-1.
350 360 370 380 390 400 410 420 430 440 450 460 470 480
T / oC
-2
0
2
4
6
8
10
12
14
m /
mg
3 K/min 5K/min 7 K/min 10 K/min 20 K/min
5% ZSM-5 / HDPE,PP
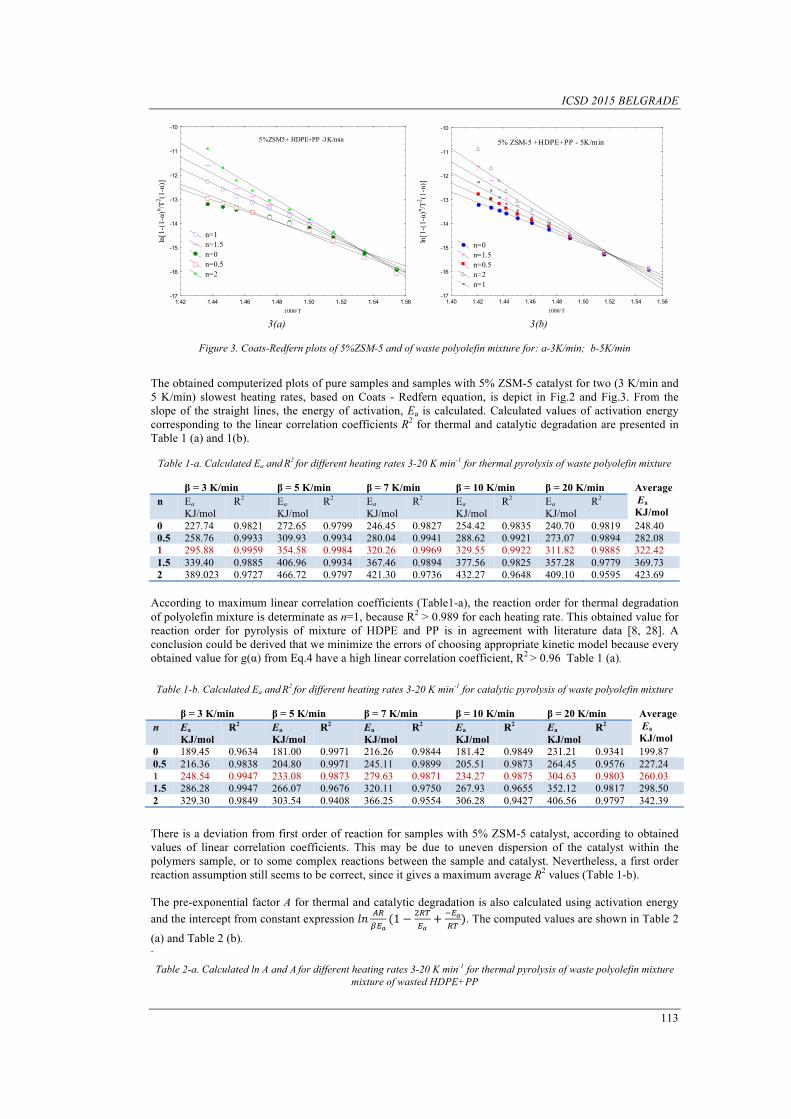
ICSD 2015 BELGRADE
113
1.42 1.44 1.46 1.48 1.50 1.52 1.54 1.561000/T
-17
-16
-15
-14
-13
-12
-11
-10
ln[1
-(1-α)n /T
2 (1-n)]
n=1 n=1.5 n=0 n=0.5 n=2
5%ZSM5+ HDPE+PP -3K/min
1.40 1.42 1.44 1.46 1.48 1.50 1.52 1.54 1.561000/T
-17
-16
-15
-14
-13
-12
-11
-10
ln[1
-(1-α)n /T
2 (1-n)]
n=0 n=1.5 n=0.5 n=2 n=1
5% ZSM-5 +HDPE+PP - 5K/min
3(a) 3(b)
Figure 3. Coats-Redfern plots of 5%ZSM-5 and of waste polyolefin mixture for: a-3K/min; b-5K/min
The obtained computerized plots of pure samples and samples with 5% ZSM-5 catalyst for two (3 K/min and 5 K/min) slowest heating rates, based on Coats - Redfern equation, is depict in Fig.2 and Fig.3. From the slope of the straight lines, the energy of activation, Ea is calculated. Calculated values of activation energy corresponding to the linear correlation coefficients R2 for thermal and catalytic degradation are presented in Table 1 (a) and 1(b).
Table 1-a. Calculated Ea and R2 for different heating rates 3-20 K min-1 for thermal pyrolysis of waste polyolefin mixture
β = 3 K/min β = 5 K/min β = 7 K/min β = 10 K/min β = 20 K/min Average Ea KJ/mol
n Ea KJ/mol
R2 Ea KJ/mol
R2 Ea KJ/mol
R2 Ea KJ/mol
R2 Ea KJ/mol
R2
0 227.74 0.9821 272.65 0.9799 246.45 0.9827 254.42 0.9835 240.70 0.9819 248.40 0.5 258.76 0.9933 309.93 0.9934 280.04 0.9941 288.62 0.9921 273.07 0.9894 282.08 1 295.88 0.9959 354.58 0.9984 320.26 0.9969 329.55 0.9922 311.82 0.9885 322.42 1.5 339.40 0.9885 406.96 0.9934 367.46 0.9894 377.56 0.9825 357.28 0.9779 369.73 2 389.023 0.9727 466.72 0.9797 421.30 0.9736 432.27 0.9648 409.10 0.9595 423.69
According to maximum linear correlation coefficients (Table1-a), the reaction order for thermal degradation of polyolefin mixture is determinate as n=1, because R2 > 0.989 for each heating rate. This obtained value for reaction order for pyrolysis of mixture of HDPE and PP is in agreement with literature data [8, 28]. A conclusion could be derived that we minimize the errors of choosing appropriate kinetic model because every obtained value for g(α) from Eq.4 have a high linear correlation coefficient, R2 > 0.96 Table 1 (a).
Table 1-b. Calculated Ea and R2 for different heating rates 3-20 K min-1 for catalytic pyrolysis of waste polyolefin mixture β = 3 K/min β = 5 K/min β = 7 K/min β = 10 K/min β = 20 K/min Average
Ea KJ/mol
n Ea KJ/mol
R2 Ea KJ/mol
R2 Ea KJ/mol
R2 Ea KJ/mol
R2 Ea KJ/mol
R2
0 189.45 0.9634 181.00 0.9971 216.26 0.9844 181.42 0.9849 231.21 0.9341 199.87 0.5 216.36 0.9838 204.80 0.9971 245.11 0.9899 205.51 0.9873 264.45 0.9576 227.24 1 248.54 0.9947 233.08 0.9873 279.63 0.9871 234.27 0.9875 304.63 0.9803 260.03 1.5 286.28 0.9947 266.07 0.9676 320.11 0.9750 267.93 0.9655 352.12 0.9817 298.50 2 329.30 0.9849 303.54 0.9408 366.25 0.9554 306.28 0.9427 406.56 0.9797 342.39
There is a deviation from first order of reaction for samples with 5% ZSM-5 catalyst, according to obtained values of linear correlation coefficients. This may be due to uneven dispersion of the catalyst within the polymers sample, or to some complex reactions between the sample and catalyst. Nevertheless, a first order reaction assumption still seems to be correct, since it gives a maximum average R2 values (Table 1-b). The pre-exponential factor A for thermal and catalytic degradation is also calculated using activation energy and the intercept from constant expression !" !"
!!!(1 − !!"
!!+ !!!
!" ). The computed values are shown in Table 2
(a) and Table 2 (b). . Table 2-a. Calculated ln A and A for different heating rates 3-20 K min-1 for thermal pyrolysis of waste polyolefin mixture
mixture of wasted HDPE+PP
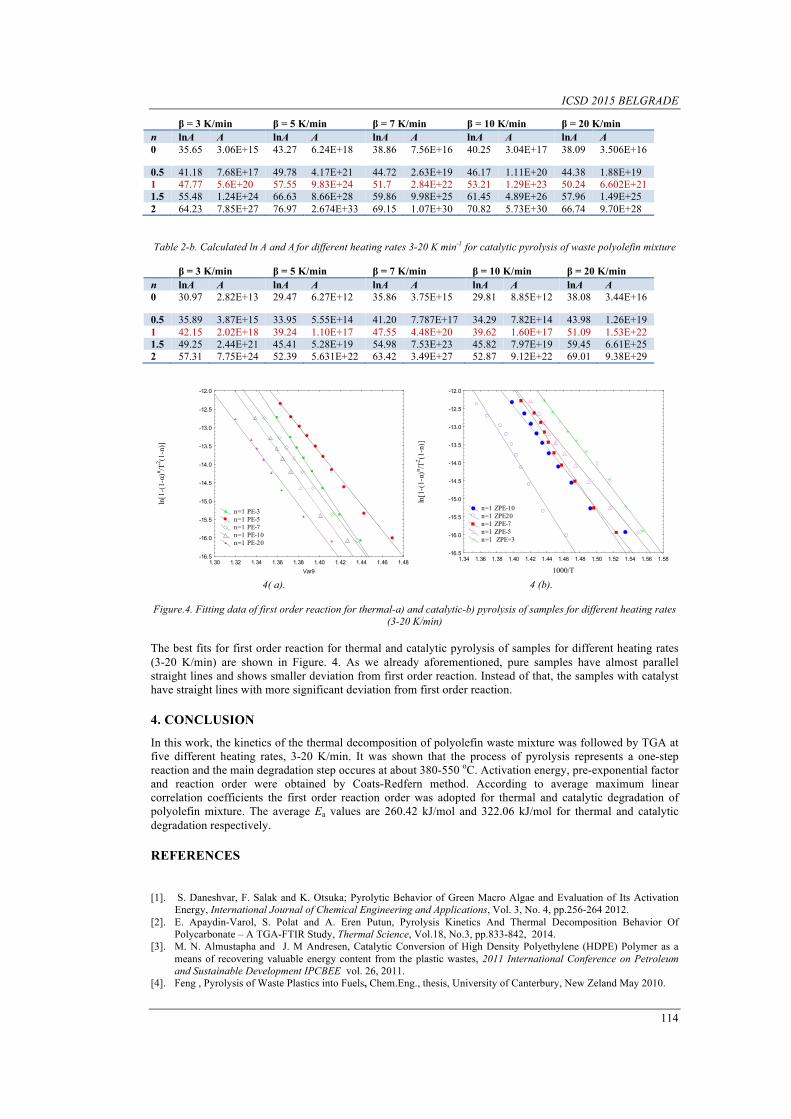
ICSD 2015 BELGRADE
114
β = 3 K/min β = 5 K/min β = 7 K/min β = 10 K/min β = 20 K/min n lnA A lnA A lnA A lnA A lnA A 0 35.65 3.06E+15 43.27 6.24E+18 38.86 7.56E+16 40.25 3.04E+17 38.09 3.506E+16
0.5 41.18 7.68E+17 49.78 4.17E+21 44.72 2.63E+19 46.17 1.11E+20 44.38 1.88E+19 1 47.77 5.6E+20 57.55 9.83E+24 51.7 2.84E+22 53.21 1.29E+23 50.24 6.602E+21 1.5 55.48 1.24E+24 66.63 8.66E+28 59.86 9.98E+25 61.45 4.89E+26 57.96 1.49E+25 2 64.23 7.85E+27 76.97 2.674E+33 69.15 1.07E+30 70.82 5.73E+30 66.74 9.70E+28 Table 2-b. Calculated ln A and A for different heating rates 3-20 K min-1 for catalytic pyrolysis of waste polyolefin mixture
β = 3 K/min β = 5 K/min β = 7 K/min β = 10 K/min β = 20 K/min n lnA A lnA A lnA A lnA A lnA A 0 30.97 2.82E+13 29.47 6.27E+12 35.86 3.75E+15 29.81 8.85E+12 38.08 3.44E+16
0.5 35.89 3.87E+15 33.95 5.55E+14 41.20 7.787E+17 34.29 7.82E+14 43.98 1.26E+19 1 42.15 2.02E+18 39.24 1.10E+17 47.55 4.48E+20 39.62 1.60E+17 51.09 1.53E+22 1.5 49.25 2.44E+21 45.41 5.28E+19 54.98 7.53E+23 45.82 7.97E+19 59.45 6.61E+25 2 57.31 7.75E+24 52.39 5.631E+22 63.42 3.49E+27 52.87 9.12E+22 69.01 9.38E+29
1.30 1.32 1.34 1.36 1.38 1.40 1.42 1.44 1.46 1.48Var9
-16.5
-16.0
-15.5
-15.0
-14.5
-14.0
-13.5
-13.0
-12.5
-12.0
ln[1
-(1-α)n /T
2 (1-n)]
n=1 PE-3 n=1 PE-5 n=1 PE-7 n=1 PE-10 n=1 PE-20
1.34 1.36 1.38 1.40 1.42 1.44 1.46 1.48 1.50 1.52 1.54 1.56 1.58
1000/T
-16.5
-16.0
-15.5
-15.0
-14.5
-14.0
-13.5
-13.0
-12.5
-12.0
ln[1
-(1-α)n /T
2 (1-n)]
n=1 ZPE-10 n=1 ZPE20 n=1 ZPE-7 n=1 ZPE-5 n=1 ZPE=3
n=1 ZPE-10 n=1 ZPE20 n=1 ZPE-7 n=1 ZPE-5 n=1 ZPE=3
4( a). 4 (b).
Figure.4. Fitting data of first order reaction for thermal-a) and catalytic-b) pyrolysis of samples for different heating rates
(3-20 K/min) The best fits for first order reaction for thermal and catalytic pyrolysis of samples for different heating rates (3-20 K/min) are shown in Figure. 4. As we already aforementioned, pure samples have almost parallel straight lines and shows smaller deviation from first order reaction. Instead of that, the samples with catalyst have straight lines with more significant deviation from first order reaction.
4. CONCLUSION
In this work, the kinetics of the thermal decomposition of polyolefin waste mixture was followed by TGA at five different heating rates, 3-20 K/min. It was shown that the process of pyrolysis represents a one-step reaction and the main degradation step occures at about 380-550 oC. Activation energy, pre-exponential factor and reaction order were obtained by Coats-Redfern method. According to average maximum linear correlation coefficients the first order reaction order was adopted for thermal and catalytic degradation of polyolefin mixture. The average Ea values are 260.42 kJ/mol and 322.06 kJ/mol for thermal and catalytic degradation respectively.
REFERENCES
[1]. S. Daneshvar, F. Salak and K. Otsuka; Pyrolytic Behavior of Green Macro Algae and Evaluation of Its Activation Energy, International Journal of Chemical Engineering and Applications, Vol. 3, No. 4, pp.256-264 2012.
[2]. E. Apaydin-Varol, S. Polat and A. Eren Putun, Pyrolysis Kinetics And Thermal Decomposition Behavior Of Polycarbonate – A TGA-FTIR Study, Thermal Science, Vol.18, No.3, pp.833-842, 2014.
[3]. M. N. Almustapha and J. M Andresen, Catalytic Conversion of High Density Polyethylene (HDPE) Polymer as a means of recovering valuable energy content from the plastic wastes, 2011 International Conference on Petroleum and Sustainable Development IPCBEE vol. 26, 2011.
[4]. Feng , Pyrolysis of Waste Plastics into Fuels, Chem.Eng., thesis, University of Canterbury, New Zeland May 2010.
ICSD 2015 BELGRADE
115
[5]. Buğçe, Synthesis of mesoporous catalysts and their performance in pyrolysis of polyethylene , Chem. Eng. thesis, Middle East Technical University, Turkey, December 2010.
[6]. M.L. Mastellone, U. Arena, G. Barbato, C. Carrillo, E. Romeo, S. Granata, A. Frassoldati, T.Faravelli and E. Ranzi, A preliminary modeling study of a fluidized bed pyrolyser for plastic wastes, 29th Meeting on Combustion, Pisa, June 14-17, 2006.
[7]. M. M Farid and E. Khaghanikavkan, Thermal pyrolysis of polyethylene: Kinetic study, Energy Science and Technology, Vol. 2, No. 1, pp. 1-10, 2011.
[8]. J. W. Park, S. C. Oh, H. P. Lee, H. T. Kim and K Ok Yoo, A kinetic analysis of thermal degradation of polymers using a dynamic method, Polymer Degradation and Stability Vol.67, pp.535-540, 2000.
[9]. A.K Galwey, M.E Brown, Thermal Decomposition of Ionic Solids,1st. ed. Amsterdam-Holand, Elsevier, 1999. [10]. Berrueco C., Ceamanos J., E. Esperanza and J. F. Mastral, Experimental study of co-pyrolysis of
polyethylene/sawdust mixtures, Thermal Science, Vol.8, No.2, pp. 65-80, 2004. [11]. Han, Theoretical study of thermal analysis kinetics, Mech.eng. thesis, University of Kentucky,USA, 2014. [12]. ICTAC Kinetics committee recommendations for performing kinetic computations on thermal analysis data, Post-
print of: Thermochimica Acta, Vol. 520, No. 1–2, pp 1–50, 10 June 2011. [13]. Khawam, Application of solid-state kinetics to desolvation reactions, Philos. thesis, University of Iowa, USA, 2014. [14]. S. Vyazovkin, Iso-conversional Kinetics of Thermally Stimulated Processes, Intern.Publis. Springer Switzerland
2015. [15]. L.A. Pérez-Maqueda, P.E. Sánchez-Jiménez and J.M. Criado, Kinetic analysis of solid-state reactions: Precision of
the activation energy calculated by integral methods, International Journal of Chemical Kinetics Vol. 37, No. 11, pp. 658–666, 2005.
[16]. Y. Tonbul and K. Yurdakoc, Thermogravimetric investigation of the dehydration kinetics of KSF, K10 and Turkish bentonite, Turk J Chem, Vol 25, pp. 333 – 339, 2001.
[17]. Ö. Kayacan1 and M. Do˘gan1, Pyrolysis of low and high density polyethylene. part I: non-isothermal pyrolysis kinetics, Energy Sources, Part A, Vol. 30, pp. 385–391, 2008.
[18]. P.Rantucha, D. Kačíkováb and B. Nagypálb, Investigation of activation energy of polypropylene composite thermooxidation by model-free methods, European Journal of Environmental and Safety Sciences, Vol. 2, No. 1, pp. 12-18, 2014.
[19]. H. H. Sait, A. Hussain, A. A. Salema and F. N. Ani, Pyrolysis and combustion kinetics of date palm biomass using thermogravimetric analysis, Bioresource Technology, Vol.118, pp. 382-389, 2012.
[20]. C. Gai, Y. Dong, T and Zhang, The kinetic analysis of the pyrolysis of agricultural residue under non-isothermal conditions, Bioresource Technology, Vol. 127, pp. 298-305, 2013.
[21]. A. F. López, A. A. El Hadad, F. J. Alguacil, T. A. Centeno and B. Lobato, Kinetics of the thermal degradation of granulated scrap tyres: a model-free analysis Materials Science (Medžiagotyra), Vol. 19, No.4, pp.1320–1329, 2013.
[22]. Ifedimna. Catalytic Pyrolysis Of Polyolefins, Chem.- Bio.eng. thesis. Georgia Institute of Technology, Atlanta, USA, January, 2006
[23]. Sodero S., Berruti F. and Behie L. Ultrapyrolytic cracking of polyethylene - a high yield recycling method, Chemical Engineering Science, Vol.51, No.11, pp. 2805-2810, 1996.
[24]. Van Grieken, R. et al., “Thermal and catalytic cracking of polyethylene under mild conditions”, Journal of Analytical and Applied Pyrolysis, Vol58/59, pp. 127–142, 2001.
[25]. Philcoh, A new adaptation of a method of invariant kinetic parameters and its application to a flame retardant system, Philosophy thesis, the University of Adelaide, USA. Febryary, 2014.
[26]. G. R. Heal, Evaluation of the function p(x), used in non-isothermal kinetics, by a series of Chebyshev polynomials, Instrumentation Science & Technology, Vol.27, pp. 367-378, 1999.
[27]. Flynn, J. H., The ‘temperature integral’ — its use and abuse, Thermochimica Acta, Vol.300, No.1-2, pp. 83-92, 1997. [28]. P. K. Roy, P. Surekha, C. Rajagopal and V. Choudhary, Thermal degradation studies of LDPE containing cobalt
stearate as pro-oxidant, Express Polymer Letters, Vol.1, No.4,. pp. 208–216, 2007.
ICSD 2015 BELGRADE
116
Traditional Women’s Scarves Worn in the
Konya Region
Miyase Çağdaş1, Türkan Kayser2
Abstract
Scarves are the cloth accessories complementing the traditional Turkish clothing. The sides of these clothing elements, which are prepared with madders, different motives and variety of printing techniques on the cotton fabric, are decorated with point lace and tatting.
Such traditional clothing accessories which have to be included in the dowries of the girls at marriageable age are named as “çember” [scarf] in the region while it is called as “yazma” [scarf] in Turkey generally.
Silk yarn is used in the laces of the scarves the sides of which are decorated with point lace. Laces are named with their local names as “filize”, zilli maşa, kıllı kurt etc.” according to the characteristic of the motive.
The purpose of the research is to determine and document the characteristics of the point laced scarves (yazma) which complement the clothing of the traditional Konya women.
Population of research consists of the point laced scarves in Konya center, and the research sample consists of 5 scarves collected from the houses in the center of Konya.
The scarves in the research are investigated via the observation tags developed according to the features of the side laces. The general view, binding types and detailed photos of the scarves are also included.
Interpreting the research based on the obtained findings, the result was tried to be reached and various recommendations were provided. Key Words: Culture, Traditional Turkısh Clothing, Scarf, Motives, Sustainable.
1. INTRODUCTION
Every community has a unique understanding of clothing in social life. Geography, natural conditions, social and cultural structures of societies influenced structure of clothing.
Throughout history, clothing, accessories and clothing styles have assumed a role of communication symbol in social interactions. The head scarves that are used to cover head in traditional Turkish clothing are the most important examples of these. While scarves were used to get covered and protected from climate conditions in the past, now combined with aesthetic sophistication of women they have taken their place among traditional products.
Hand paint kerchiefs among scarves, which Anatolian women produced by combining traditional culture and social life conditions, have an important place in our national culture. It is possible to see its examples in every region of Anatolia prepared with various techniques, colors and materials.
In many parts of Anatolia, colloquial word “kerchief printing” and head covering kerchiefs are used in the same meaning.
Kerchief printing is a fabric printing technique applied by hand drawing or printing with wooden molds and has an important place in traditional handicrafts (Tezel, 2009:27). Wooden block used in fabric
1Selçuk Üniversitesi, Sanat ve Tasarım Fakültesi, Moda Tasarımı Bölümü, Konya, 42000, TÜRKİYE. [email protected] 2Selçuk Üniversitesi, Sanat ve Tasarım Fakültesi, Moda Tasarımı Bölümü, Konya, 42000, TÜRKİYE. [email protected]
ICSD 2015 BELGRADE
117
quality is very important. Raw material is not preferred synthetic that fabrics, cotton fabrics in terms of holding more dye is preferred (Çağdaş et al.,2012:131).
Although there is no definite information on where the printing technique with wooden molds was applied first, it is known that printing on clay with wooden molds was made in Mesopotamia, and seals were impressed with wooden molds in China. Between 1000 BC – 100 AD, Turkish tribes living in Central Asia used animal figures to print fabrics. These figures reflected hunting and hunting culture. Greek historian Herodotus wrote that communities living around the Caspian Sea decorated their clothes by drawing animal figures with the dyes they extracted from plants. Based on this information, it is stated that Turks in Central Asia knew printing in the period before Christ (Gökaydın, 1990: 190).
The Hittite state, the most famous state among the tribes that settled in the Anatolian territories in the Anatolian history, established the Hittite art on these lands. “Seal” shaped molds found in the archaeological excavations carried out in 1964 show that the Hittites knew how to perform mold printing in 7000 BC. Many seals and stamps made of baked clay that belonged to the Hittites, the first civilization in Anatolia that served as a bridge between civilizations throughout history, have been found. Same sources suggest that the first kerchief printings were done with these molds in spiral and four-leaf flower form (Kaya, 1988:11).
The oldest known examples of Turkish kerchief printing belong to the period of beyliks (principalities). Kerchief printing whose examples increased in time has become an important handicraft in Anatolia, particularly in Kastamonu, Tokat, Gaziantep, Diyarbakır and in the XVIIth centry in Istanbul (Sipahioğlu et al.,2012:76). Those kerchiefs which are made in such districts as Kandilli, Yeniköy, Kumkapı, Yenikapı, Samatya and Üsküdar are magnificent (Öz, 2006:52).
Kerchief printing, one of unique examples of our handicrafts, has developed as a folk art in our country and continued production over the centuries. Kerchiefs that our women use and our young girls keep in their dowry show difference from region to region, even from province to province.
Kerchiefs haven’t been specific to women only from past to present. They were also used as a shirt under sultan’s armor when he goes to war or as a cover of its quilted turban. It has not disappeared with time and has been referred with different names from region to region, named colored cotton kerchief, scarf, large handkerchief and cheesecloth (Karaçay, 1999:18).
These head coverings known as “kerchief” across Turkey were named “scarf” in the Konya region as a traditional clothing accessory in the girls’ dowry. These scarves prepared with needle works with local names are a must in in girls’ dowries as a tradition from past. In fact, certain pieces of needle laces should be given to mother-in-law as a gift as a wedding tradition.
Needle laces, indispensable element of head ornaments, have a special place in traditional Turkish clothing. These needle laces reflecting Turkish women’s taste, originality and handicraft, were also a silent communication tool carrying hidden messages with motifs apart from their purpose as decoration (Sürür, 1983:41). While needle laces have original motifs in the framework of regional characteristics, it is seen that same motifs are named with different names in different regions. Needle works can be described as plain or three-dimensional decorations made by weaving silk, thread, twisted or untwisted colored yarns with crochet needle, hairpin, shuttle or needle and it is possible to classify them according to used tools, technique and area of usage (Onuk, 1988:12).
Silk thread is used for the scarves decorated with needle work in the Konya region, which is the subject of our research. In determining needle lace model that will be applied, motif and color characteristic on the scarf are taken into consideration. These needle works are named “kaya (rock), küpeli(fuchsia), menevşe(violet), zilli masa (bell tong), filize(buds)’’ etc. according to the characteristics of the applied needle work. “Buds” must be contained in the dowry of young girls of the region as a requirement of traditional living culture of the local people (Arzu Çağdaş: personal communication). Also, it is considered as a status indicator to have plenty of these needle works in the dowry of a young girl.
The fact that raw silk is used for the needle works of the scarves of the Konya region reveals prosperity level of the period, social life culture and refined taste and sophistication of the local women.
The Konya scarves of our traditional art works are an important part of our cultural heritage. Our cultural heritage of hundreds of years, which is under the siege of globalization along with modernization, has been quickly and radically disappearing. It should be noted that protecting cultural heritage is as important as protecting life; it is necessary and even inevitable.
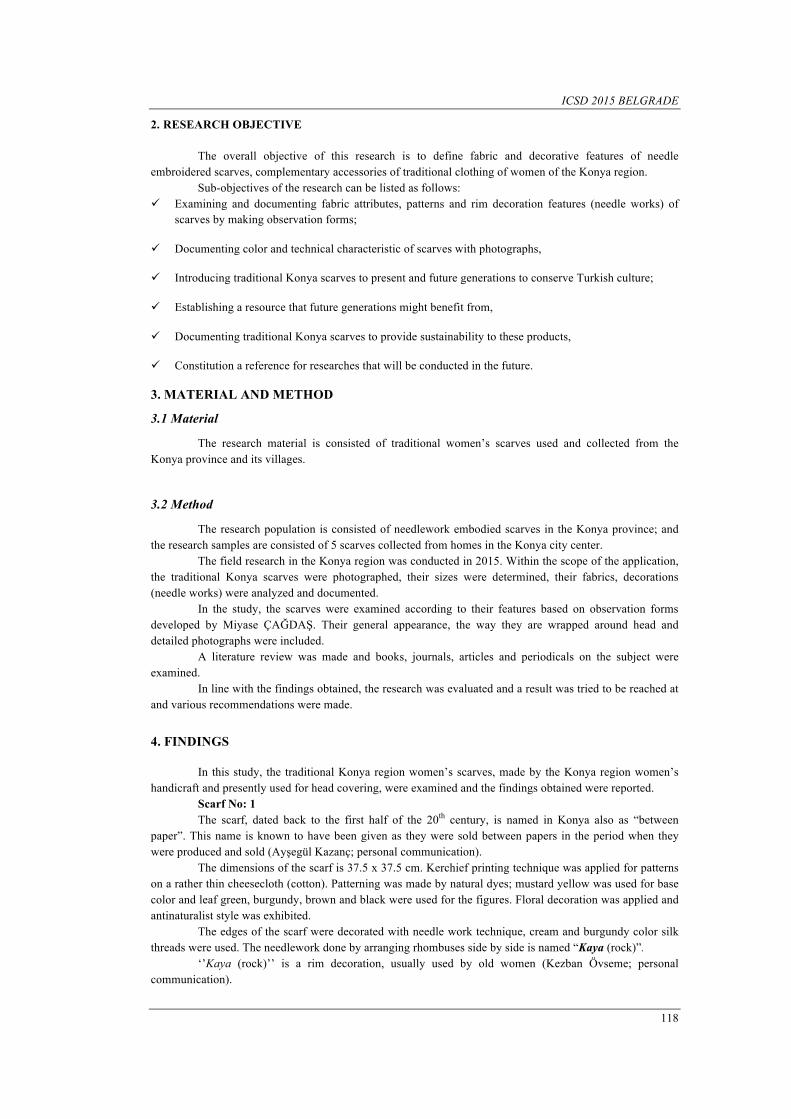
ICSD 2015 BELGRADE
118
2. RESEARCH OBJECTIVE
The overall objective of this research is to define fabric and decorative features of needle embroidered scarves, complementary accessories of traditional clothing of women of the Konya region.
Sub-objectives of the research can be listed as follows: ü Examining and documenting fabric attributes, patterns and rim decoration features (needle works) of
scarves by making observation forms;
ü Documenting color and technical characteristic of scarves with photographs,
ü Introducing traditional Konya scarves to present and future generations to conserve Turkish culture;
ü Establishing a resource that future generations might benefit from,
ü Documenting traditional Konya scarves to provide sustainability to these products,
ü Constitution a reference for researches that will be conducted in the future.
3. MATERIAL AND METHOD
3.1 Material
The research material is consisted of traditional women’s scarves used and collected from the Konya province and its villages.
3.2 Method
The research population is consisted of needlework embodied scarves in the Konya province; and the research samples are consisted of 5 scarves collected from homes in the Konya city center.
The field research in the Konya region was conducted in 2015. Within the scope of the application, the traditional Konya scarves were photographed, their sizes were determined, their fabrics, decorations (needle works) were analyzed and documented.
In the study, the scarves were examined according to their features based on observation forms developed by Miyase ÇAĞDAŞ. Their general appearance, the way they are wrapped around head and detailed photographs were included.
A literature review was made and books, journals, articles and periodicals on the subject were examined.
In line with the findings obtained, the research was evaluated and a result was tried to be reached at and various recommendations were made.
4. FINDINGS
In this study, the traditional Konya region women’s scarves, made by the Konya region women’s handicraft and presently used for head covering, were examined and the findings obtained were reported.
Scarf No: 1 The scarf, dated back to the first half of the 20th century, is named in Konya also as “between
paper”. This name is known to have been given as they were sold between papers in the period when they were produced and sold (Ayşegül Kazanç; personal communication).
The dimensions of the scarf is 37.5 x 37.5 cm. Kerchief printing technique was applied for patterns on a rather thin cheesecloth (cotton). Patterning was made by natural dyes; mustard yellow was used for base color and leaf green, burgundy, brown and black were used for the figures. Floral decoration was applied and antinaturalist style was exhibited.
The edges of the scarf were decorated with needle work technique, cream and burgundy color silk threads were used. The needlework done by arranging rhombuses side by side is named “Kaya (rock)”.
‘’Kaya (rock)’’ is a rim decoration, usually used by old women (Kezban Övseme; personal communication).
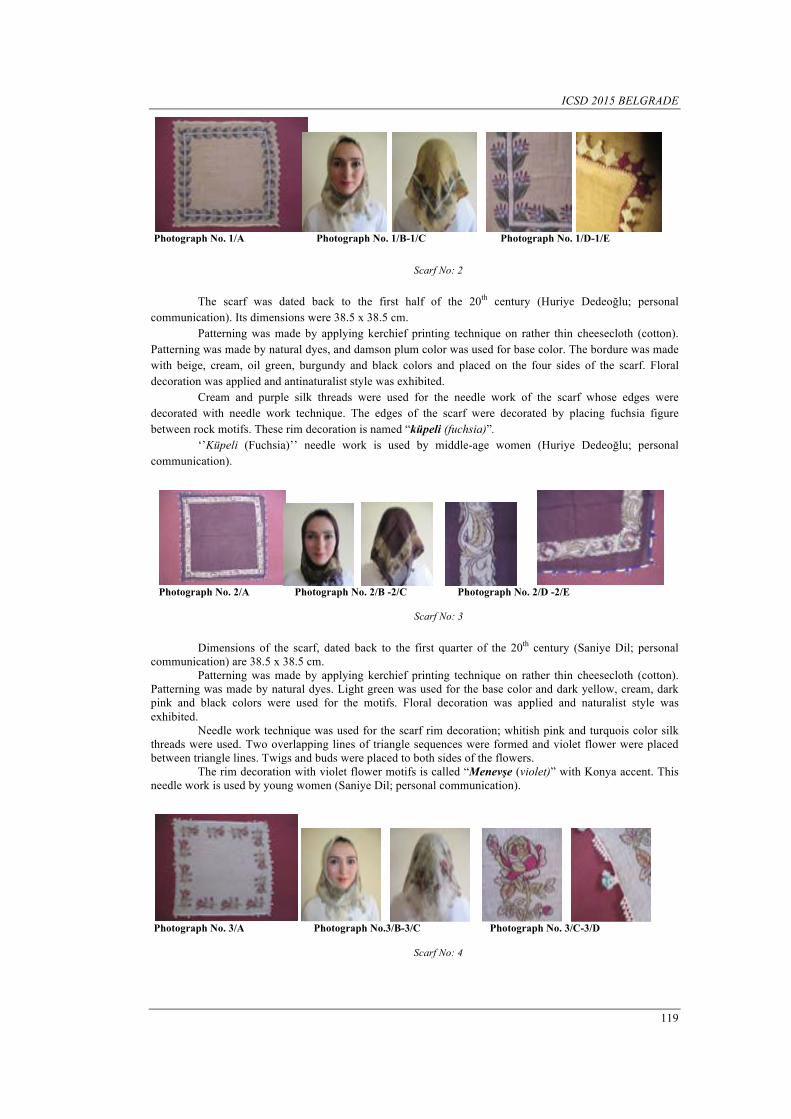
ICSD 2015 BELGRADE
119
Photograph No. 1/A Photograph No. 1/B-1/C Photograph No. 1/D-1/E
Scarf No: 2
The scarf was dated back to the first half of the 20th century (Huriye Dedeoğlu; personal
communication). Its dimensions were 38.5 x 38.5 cm. Patterning was made by applying kerchief printing technique on rather thin cheesecloth (cotton).
Patterning was made by natural dyes, and damson plum color was used for base color. The bordure was made with beige, cream, oil green, burgundy and black colors and placed on the four sides of the scarf. Floral decoration was applied and antinaturalist style was exhibited.
Cream and purple silk threads were used for the needle work of the scarf whose edges were decorated with needle work technique. The edges of the scarf were decorated by placing fuchsia figure between rock motifs. These rim decoration is named “küpeli (fuchsia)”.
‘’Küpeli (Fuchsia)’’ needle work is used by middle-age women (Huriye Dedeoğlu; personal communication).
Photograph No. 2/A Photograph No. 2/B -2/C Photograph No. 2/D -2/E
Scarf No: 3
Dimensions of the scarf, dated back to the first quarter of the 20th century (Saniye Dil; personal
communication) are 38.5 x 38.5 cm. Patterning was made by applying kerchief printing technique on rather thin cheesecloth (cotton).
Patterning was made by natural dyes. Light green was used for the base color and dark yellow, cream, dark pink and black colors were used for the motifs. Floral decoration was applied and naturalist style was exhibited.
Needle work technique was used for the scarf rim decoration; whitish pink and turquois color silk threads were used. Two overlapping lines of triangle sequences were formed and violet flower were placed between triangle lines. Twigs and buds were placed to both sides of the flowers.
The rim decoration with violet flower motifs is called “Menevşe (violet)” with Konya accent. This needle work is used by young women (Saniye Dil; personal communication).
Photograph No. 3/A Photograph No.3/B-3/C Photograph No. 3/C-3/D
Scarf No: 4
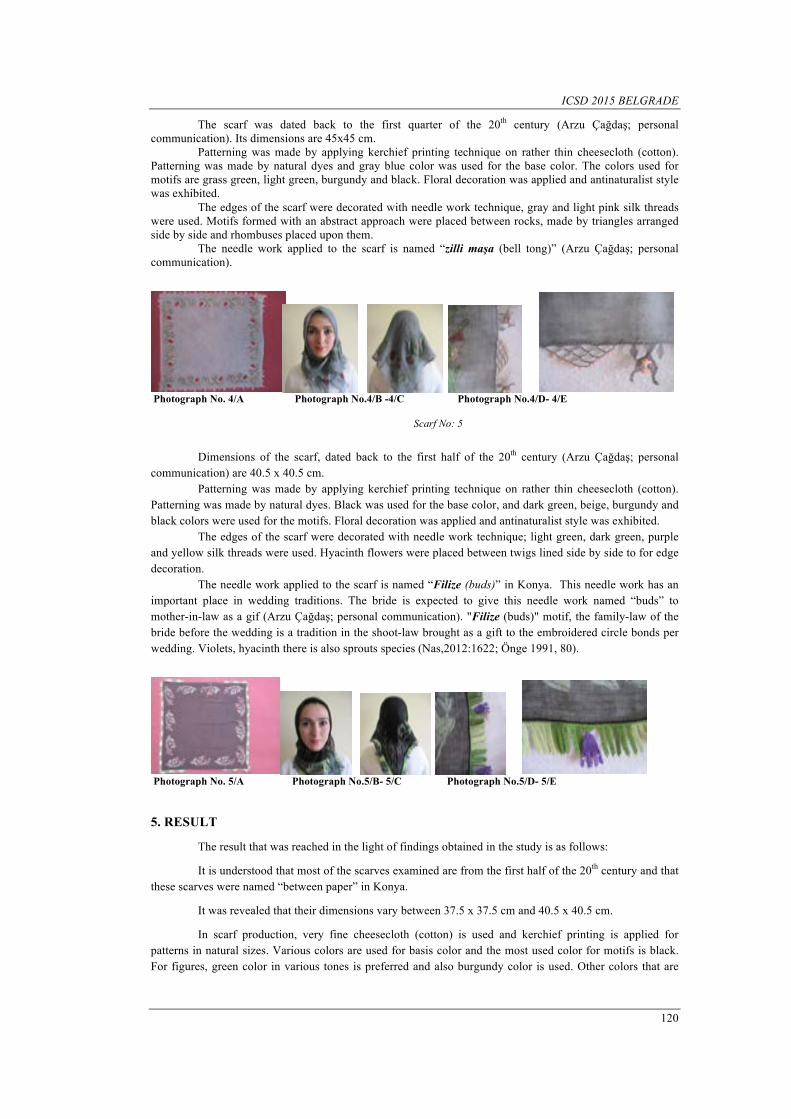
ICSD 2015 BELGRADE
120
The scarf was dated back to the first quarter of the 20th century (Arzu Çağdaş; personal communication). Its dimensions are 45x45 cm.
Patterning was made by applying kerchief printing technique on rather thin cheesecloth (cotton). Patterning was made by natural dyes and gray blue color was used for the base color. The colors used for motifs are grass green, light green, burgundy and black. Floral decoration was applied and antinaturalist style was exhibited.
The edges of the scarf were decorated with needle work technique, gray and light pink silk threads were used. Motifs formed with an abstract approach were placed between rocks, made by triangles arranged side by side and rhombuses placed upon them.
The needle work applied to the scarf is named “zilli maşa (bell tong)” (Arzu Çağdaş; personal communication).
Photograph No. 4/A Photograph No.4/B -4/C Photograph No.4/D- 4/E
Scarf No: 5
Dimensions of the scarf, dated back to the first half of the 20th century (Arzu Çağdaş; personal
communication) are 40.5 x 40.5 cm. Patterning was made by applying kerchief printing technique on rather thin cheesecloth (cotton).
Patterning was made by natural dyes. Black was used for the base color, and dark green, beige, burgundy and black colors were used for the motifs. Floral decoration was applied and antinaturalist style was exhibited.
The edges of the scarf were decorated with needle work technique; light green, dark green, purple and yellow silk threads were used. Hyacinth flowers were placed between twigs lined side by side to for edge decoration.
The needle work applied to the scarf is named “Filize (buds)” in Konya. This needle work has an important place in wedding traditions. The bride is expected to give this needle work named “buds” to mother-in-law as a gif (Arzu Çağdaş; personal communication). "Filize (buds)" motif, the family-law of the bride before the wedding is a tradition in the shoot-law brought as a gift to the embroidered circle bonds per wedding. Violets, hyacinth there is also sprouts species (Nas,2012:1622; Önge 1991, 80).
Photograph No. 5/A Photograph No.5/B- 5/C Photograph No.5/D- 5/E 5. RESULT
The result that was reached in the light of findings obtained in the study is as follows:
It is understood that most of the scarves examined are from the first half of the 20th century and that these scarves were named “between paper” in Konya.
It was revealed that their dimensions vary between 37.5 x 37.5 cm and 40.5 x 40.5 cm.
In scarf production, very fine cheesecloth (cotton) is used and kerchief printing is applied for patterns in natural sizes. Various colors are used for basis color and the most used color for motifs is black. For figures, green color in various tones is preferred and also burgundy color is used. Other colors that are
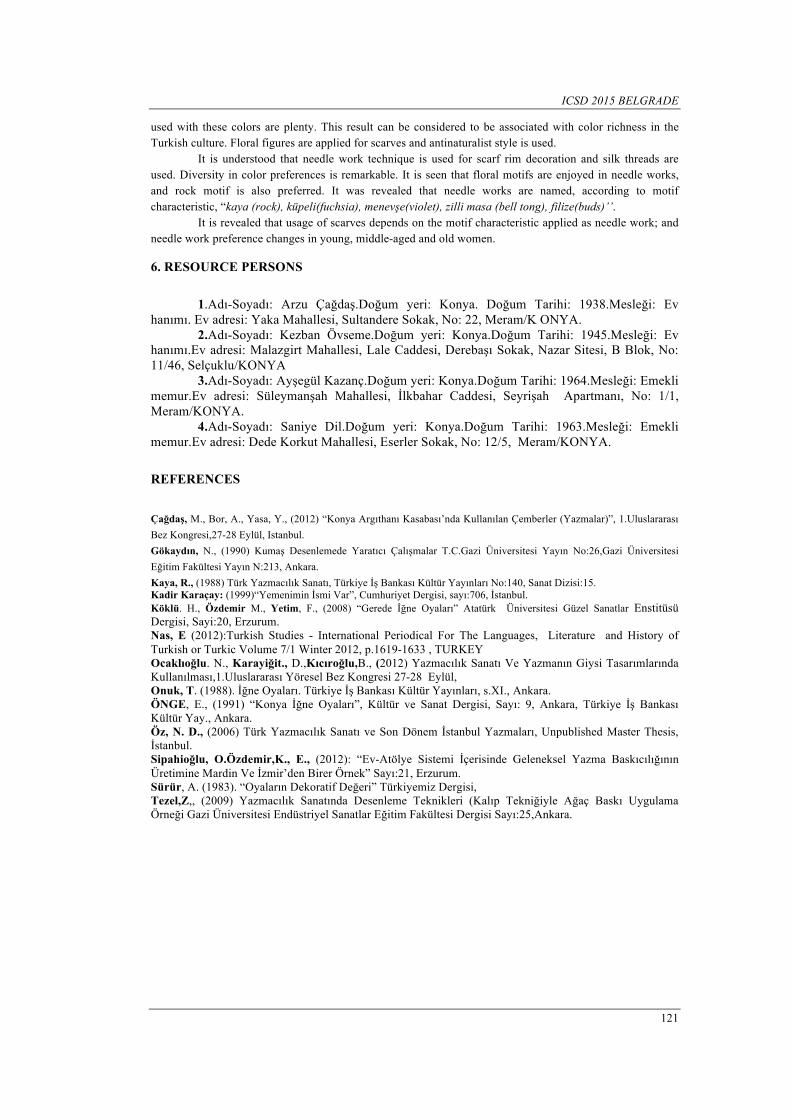
ICSD 2015 BELGRADE
121
used with these colors are plenty. This result can be considered to be associated with color richness in the Turkish culture. Floral figures are applied for scarves and antinaturalist style is used.
It is understood that needle work technique is used for scarf rim decoration and silk threads are used. Diversity in color preferences is remarkable. It is seen that floral motifs are enjoyed in needle works, and rock motif is also preferred. It was revealed that needle works are named, according to motif characteristic, “kaya (rock), küpeli(fuchsia), menevşe(violet), zilli masa (bell tong), filize(buds)’’.
It is revealed that usage of scarves depends on the motif characteristic applied as needle work; and needle work preference changes in young, middle-aged and old women. 6. RESOURCE PERSONS
1.Adı-Soyadı: Arzu Çağdaş.Doğum yeri: Konya. Doğum Tarihi: 1938.Mesleği: Ev hanımı. Ev adresi: Yaka Mahallesi, Sultandere Sokak, No: 22, Meram/K ONYA.
2.Adı-Soyadı: Kezban Övseme.Doğum yeri: Konya.Doğum Tarihi: 1945.Mesleği: Ev hanımı.Ev adresi: Malazgirt Mahallesi, Lale Caddesi, Derebaşı Sokak, Nazar Sitesi, B Blok, No: 11/46, Selçuklu/KONYA
3.Adı-Soyadı: Ayşegül Kazanç.Doğum yeri: Konya.Doğum Tarihi: 1964.Mesleği: Emekli memur.Ev adresi: Süleymanşah Mahallesi, İlkbahar Caddesi, Seyrişah Apartmanı, No: 1/1, Meram/KONYA.
4.Adı-Soyadı: Saniye Dil.Doğum yeri: Konya.Doğum Tarihi: 1963.Mesleği: Emekli memur.Ev adresi: Dede Korkut Mahallesi, Eserler Sokak, No: 12/5, Meram/KONYA.
REFERENCES
Çağdaş, M., Bor, A., Yasa, Y., (2012) “Konya Argıthanı Kasabası’nda Kullanılan Çemberler (Yazmalar)”, 1.Uluslararası Bez Kongresi,27-28 Eylül, Istanbul. Gökaydın, N., (1990) Kumaş Desenlemede Yaratıcı Çalışmalar T.C.Gazi Üniversitesi Yayın No:26,Gazi Üniversitesi Eğitim Fakültesi Yayın N:213, Ankara. Kaya, R., (1988) Türk Yazmacılık Sanatı, Türkiye İş Bankası Kültür Yayınları No:140, Sanat Dizisi:15. Kadir Karaçay: (1999)“Yemenimin İsmi Var”, Cumhuriyet Dergisi, sayı:706, İstanbul. Köklü. H., Özdemir M., Yetim, F., (2008) “Gerede İğne Oyaları” Atatürk Üniversitesi Güzel Sanatlar Enstitüsü Dergisi, Sayi:20, Erzurum. Nas, E (2012):Turkish Studies - International Periodical For The Languages, Literature and History of Turkish or Turkic Volume 7/1 Winter 2012, p.1619-1633 , TURKEY Ocaklıoğlu. N., Karayiğit., D.,Kıcıroğlu,B., (2012) Yazmacılık Sanatı Ve Yazmanın Giysi Tasarımlarında Kullanılması,1.Uluslararası Yöresel Bez Kongresi 27-28 Eylül, Onuk, T. (1988). İğne Oyaları. Türkiye İş Bankası Kültür Yayınları, s.XI., Ankara. ÖNGE, E., (1991) “Konya İğne Oyaları”, Kültür ve Sanat Dergisi, Sayı: 9, Ankara, Türkiye İş Bankası Kültür Yay., Ankara. Öz, N. D., (2006) Türk Yazmacılık Sanatı ve Son Dönem İstanbul Yazmaları, Unpublished Master Thesis, İstanbul. Sipahioğlu, O.Özdemir,K., E., (2012): “Ev-Atölye Sistemi İçerisinde Geleneksel Yazma Baskıcılığının Üretimine Mardin Ve İzmir’den Birer Örnek” Sayı:21, Erzurum. Sürür, A. (1983). “Oyaların Dekoratif Değeri” Türkiyemiz Dergisi, Tezel,Z,, (2009) Yazmacılık Sanatında Desenleme Teknikleri (Kalıp Tekniğiyle Ağaç Baskı Uygulama Örneği Gazi Üniversitesi Endüstriyel Sanatlar Eğitim Fakültesi Dergisi Sayı:25,Ankara.
ICSD 2015 BELGRADE
122
The Examination of Konya’s Traditional Man
Curling Shirts in Turkish Culture
Türkan Kayser1, Miyase Çağdaş2
Abstract
Clothing is a part of social life and a main tool expressing identity in public sphere. In every nation, traditional costumes culturally have a different importance and meaning. Traditional costumes are the living factors that reflect the color and deepness of national culture
The woven fabrics and the clothes made by the fabrics in the Anatolian lands, which serve as a cradle for civilizations throughout history, have an important place in Turkish culture. Local garments produced with woven fabrics are used in the upper clothing sometimes and the under clothing sometimes. The shirts that are ones in the group of the underwear in the Turkish clothes culture are as rich as it is a study field with a different title. When the shirts have a difference of model for male and female clothes among shirts in traditional clothes, they carry common features in terms of the features of cloth use, besides. In addition, they are useful, flexible, and ergonomic clothes in terms of its feature absorbing sweat. These clothes of which production starts to lose in the present days were woven fromcottons, silks, and cotton-silk mixed threads on traditional hand looms in the past times. However, the production of these clothes is not made by the effect of industrialization now. The clothes called “crepe” across Turkey take the name of “Curling” in Konya.
The aim of this research; is to examine traditional Konya men curling shirts., documented with photographs, to gain sustainability.
The universe of study; in Konya contained man curlıng shirts is to constitued. The sample group of the research; is restricted Konya which collected from houses and antique shops with four man curling shirts. In the study, “Man’s Curling Shirts” are examined by monitoring sheets generated,and it was included detailed photos taken from different angles with its front of and back views. Under the scope of research, the blocks prepared with dimensions that are exactly taken out of garments are involved in the section of findings of the research, scaling down. In the light of the findings obtained, it is tried to reach a conclusion., The traditional man’s curling shirts are recorded through monitoring sheets and some suggestions have been made on behalf of bringing to today and gaining sustainability Key Words: Culture, Social Life, Garments, Woven Fabrics, Traditional Man’s Curling Shirts, Sustainability.
1Selçuk Üniversitesi, Sanat ve Tasarım Fakültesi, Moda Tasarımı Bölümü, Konya, 42000, TÜRKİYE. [email protected] 2Selçuk Üniversitesi, Sanat ve Tasarım Fakültesi, Moda Tasarımı Bölümü, Konya, 42000, TÜRKİYE. [email protected]
ICSD 2015 BELGRADE
123
1. INTRODUCTION "Culture" is generally accepted rules by everyone, which regulates the lives of the structured people
groups without their knowing. (Haviland and Prins, 2006:69). The experiences, which have been acquired for centuries, pass on from generation to generation (Artun, 2008:453) and accepted as a way of living. The commonsense, daily life, religion, tradition, world perspective and verbal traditions of societies are nourished with their applications and products. Furthermore, it is the body of the values which carry the structure and tissue of the society to which it belongs. (Günay, 1999: 24). The most important part of the cultural values of the society is their clothes as a living, visible evident.
Clothes have been formed by the several factors such as protection instinct, adaption to natural conditions, regional or philosophical beliefs, fitting to the work, administrative regulations, economic conditions, psychological tendencies and fashion (Turan, 1994:202) Furthermore, it is a social tools that provide inter societal connection and carry important determinative tips about the ethnical features of the societies such as geography, religion, social status and gender (Tyrchniewicz, Hicks,1979:187). Even if there are formal and content differences, it overflows to the historical, cultural and geographical limits and engage in the life of the societies (Fogg, 2014:8).
Clothes, accessories and the way of dressing have been used as a symbol in social interaction. These symbols ascribe meaning in social, cultural, political and economical structure of the individual and play an important role in the socio-economic, political, religious expression of the identities (Koç and et al,2009:2168;Barnard 2001: 47-68) It is the manifestation of identity that provides interaction of the individual in the public sphere as being a part of the social life.
Each society had developed a perspective of dressing specific to their own in the periods when traditional society was dominant (Koç and et al,2009:2169). The dressing preference of the societies presents the powerful norms in relation to the appearances, which are suitable to the certain period of time and how they interpreted the culture having an extraordinary richness (Crane, 2000:11). The clothes, which have been interpreted in harmony with the national identity, revealed the traditional clothes of each nation. The traditional clothes reflect the depth of the color of the national identity of each nation.
Many cultures have lived in the Anatolia, due to its geographical location. Dressing styles and types have been influenced by these cultural richness and a great number of variety have emerged there to the extent that it could not be experienced anywhere else (Özdemir, 2009:3).
Weave and weaving are cultural and artistic phenomenon as old as the history of the humankind.Turkish people, which are one of founders of the ancient civilizations of the world, have developed the weaving art according to their culture and have obtained an important place in the world weaving industry. They have presented clothes used them in their dresses which are extremely hard even now, in line with the technical facilities available to them on their age. (Salman, 1998:141)
The dresses which are created with the weaving fabric and dresses out of these fabrics have an important place in the Turkish culture in the Anatolia which is a cradle to civilizations throughout the history. Regional dresses, formed with the woven fabric are used in the upper clothing and sometimes as underwear.
Shirts, which are in the underwear clothes group in Turkish clothes culture, are so rich that we have to address it in a separate topic since it is so rich in cutting and sewing. Being unisex clothes used in both men and women, it shows differences in terms of the model, cutting and cloth features. At the same time, it is useful and ergonomic. The traditional weaving fabrics production which have been woven with the fabric, silk and thread mixed with silk-cotton in the traditional hand looms in the past begin to be forgotten with the industrialization. The produced ones are scarcely any.
"Bürümcük" (crimped fabric) is named as "kıvratma" (curling shirt) in the city of Konya, which is one of the traditional fabrics addressed with the features of the weaving (Atalayer, 2009:1) and with the name of the region from time to time in Anatolia, which is rich in terms of the range of the fabric (Çağdaş,2012:123). Crimped fabric; is a type of fabric with narrow width with rare and thin tissues made of crimped raw silk (Karpuz, at al,2015:9,Görünür,2010:293).
Hungarian Turcologist Zoltan Gombocs expresses about the crimped fabric that this has been known from Hungary to Manchuria, by taking the "bürümcük" word in particular. The word Bürümcük refers to crimping, wrapping, covering and means weaving, woven with very twisted silk threads in the textile industry. (Uğurlu,2005:279).
It is a type of fabric, registered in the Ottoman records in the XV. century as crimped fabric. It had been generally woven with the plain weave knit with raw silk yarn, which was got with high twisting.
ICSD 2015 BELGRADE
124
Crimped fabric, which has been processed by boiling called as cooking, has curling and twisting on the surface of the fabric as a result of the pull-out, occurred in the thread. The fabric takes its name from these twisting which forms its feature. (Salman,2004:22). The simplest and most powerful of the basic weaving knitting is on the plain weaving. It is possible to see samples of warp yarn with very twisting nature and scarves in the crimped fabric weaving in which very twisted yarns are used as a scarf (Uğurlu, 2005:279).
Due to its wrinkled structure, the weaving breathes, of which width gets narrowed down in lie with the twisting rate of the threads, and fabric does not hand on to the body. It is ergonomic, easy and useful. For that reason, crimped weaving is generally used as underwear in the traditional Turkish dressing.
In the Ottoman period, the most accepted form of this weaving type, which could be applied with every classical material such as wool, linen, cotton and silk, is made with silk yarn. However, crimped weaving was only used by the palace and rich people since it was expensive. The people could not wear silk fabric since it was expensive. Furthermore, there was a belief that wearing silk is forbidden by religion.
The thin version of the curling fabrics, woven by using the plain weaving technique is for women and the thick one is for man for making undershirt. While cotton, cotton-linen and silk mixture threads are preferred for the women shirts, threads mixed by the cotton and linen are used for the undershirts for men due to the silk fabric was believed to be forbidden by the religion (haram) in Turkish society pursuant to the Islamic belief. In some men shirts, by mixing weaving substances such as cotton and linen to the silk and woven fabrics were used and this was believed to be "halal" and these were called ("helali") (Koçu,1969:125)
Curling fabrics, which are woven in Konya, have narrow width since it is woven with the hand loom. They are woven as a ball for a shirt. They have plain cream color, white or pinstriped (striped) colors at red, blue, green, pink edges.
Such wear; is the clothes that protects the body from the effects of the nature, has aesthetics to the body and outerwear and is worn under the outerwear (Çağdaş, 1996:5).
The traditional clothes of the region of Konya within the Turkish clothing are prominent for their reflection of importance. It has shown a significant development for centuries depending on the geographical, social and economical conditions with the legacy of the clothes of the Seljukian, to which it is a capital (Çağdaş and et al.1996:1). The traditional clothes have enriched due to the fact that people several ethnical origins have lived together.
The word "gömlek" (shirt) is a common use by the people. The correct form is "Gönlek". "Gön" means, skin, body. Gönlek refers to a cloth worn on the naked body (Koçu,1969:125). It is regionally called "göynek", iç göynek (undershirt) or bürümcük (crimped fabric) (Arslan, 2008:594). Göynek; is an underwear, which is woven with silk, cotton or crimped. (Karpuz et al,2015:9:Ayhan,1998:145).
Shirt fabric is woven in stripes with pale shades of red, yellow, blue colors on the white or plain white (Koçu,1969:125), the width of these fabrics is generally narrowed.
The fabric, which will be applied curling, is plain when it is out from the loom. It is observed that the measurement of the width is 24 cm after applying curling to the fabric which has around 54cm width. The fabric, which has been applied curling, stored by puckering from the starting and ending point not to distort the curling feature (Çağdaş et al, 1996:36).
The front and back body of the men's curling shirts in the city of Konya have been applied a cup and not a side seam. The body consists of four parts and the width of the parts is limited with the width of the fabric.
Generally below arm is plain, but there are some examples where below arm is sewed. Collars are opened subsequently, mold has not been used for the fabric cutting. The cutting is decided by rule of thumb or by spanning.
In most of the curling shirts, sleeve hem and hem lines are only curled on hand. In the collars, which are opened subsequently, long deep slits, square or o neck or thin crew-neck with slits are used. There are some examples, which are cleaned with cuff or band in the sleeve ham. Batiste or silk fabric is selected in the cuffs used in the sleeve hem. The closing for the shirts with plackets and cuffs are generally made with shell button and buttonhole.
2. THE OBJECTİVE OF THE STUDY

ICSD 2015 BELGRADE
125
The general objective of this study is to determine and document the features of the traditional Konya male curling shirts.
The followings are the objectives which are set out in line with the general objectives. ü To document the model, cutting, materials used, sewing techniques by creating observation forms; ü Document the characteristics of the models with photographs; ü To document the model and cutting features with the pattern drawings; ü Introduce the Konya's traditional man curling shirt to this and next generations so as to live the Turkish
culture; ü To have sustainability to the products which are our cultural legacy by documenting the Konya's
traditional man curling shirt and fabrics; ü To be resource for the following researches.
3. METHOD OF THE RESEARCH
3.1. Material
The material of the research is the men curling shirts, which re purchased from the antique shop in the city center of Konya.
3.2.Method "Konya's traditional man curling shirts" 4 units man curling shirts, which are the target population
of the study, have been included in the sampling group and descriptive methods are used in examining, analyzing and interpreting the data with respect to the Konya's traditional man curling shirts, which is the subject matter of the research.
Konya's traditional man curling shirts are provided by purchasing from the antique shop. Konya's traditional curling shirts, which are addressed in the scope of the research, have been documented through observation form and document analysis techniques developed by the Miyase Çağdaş. Comprehensive observation forms have been developed for the traditional dress samples in the scope of the study and all characteristics (cutting techniques, sewing techniques etc.) of the works have been determined in line with the observation forms.
The dresses basing on the observation forms have been formed in the following basis:
ü Front, back, collar and arm details of the dresses have been taken place;
ü Mold drawings of the dresses with 100/25 scale have been conducted;
ü The dresses have been analyzed with their model, cutting and sewing.
The application of the research in the region of Konya has been conducted between 2014 and 2015. In the scope of the application, photographs of the traditional dresses have been taken and their measurements are obtained and their sizes are specified and documented by analyzing the fabrics and sewing.
4. FINDINGS:
In this study, by the men of the 19th and 20th centuries Konya used until the middle of the traditional male curling reached the shirt fabric, trimming and planting examined in terms of features and photographed.
The First Example:
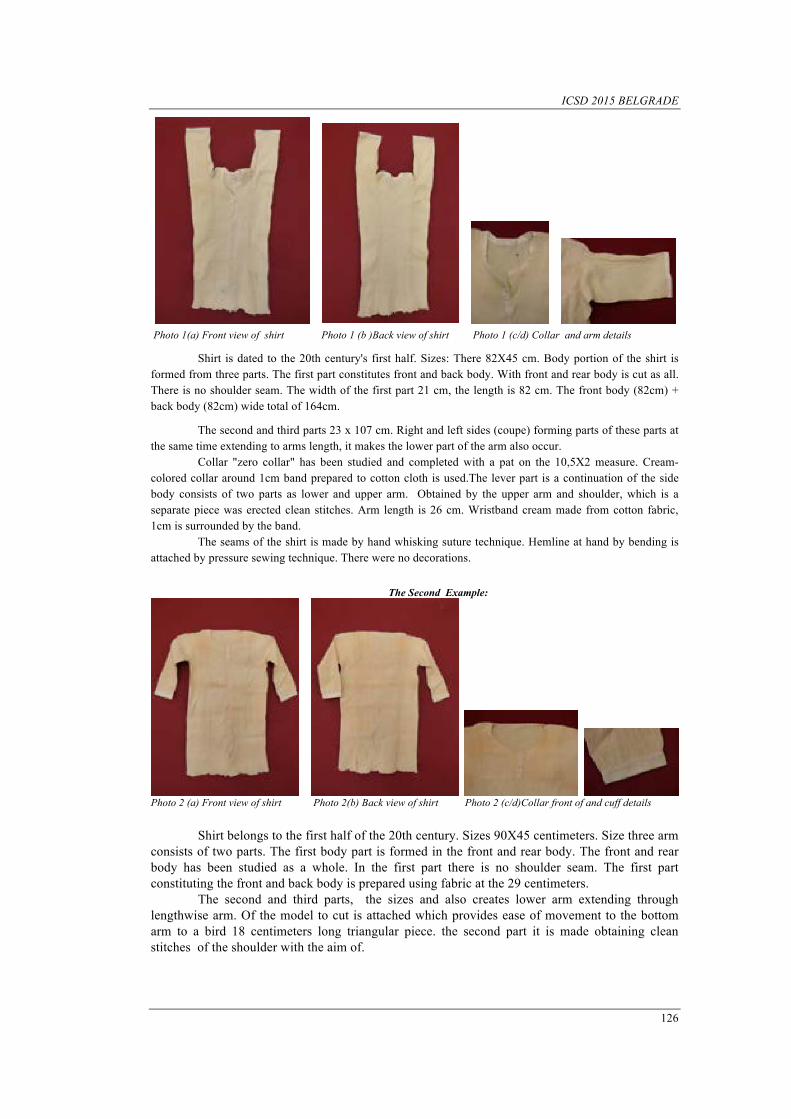
ICSD 2015 BELGRADE
126
Photo 1(a) Front view of shirt Photo 1 (b )Back view of shirt Photo 1 (c/d) Collar and arm details
Shirt is dated to the 20th century's first half. Sizes: There 82X45 cm. Body portion of the shirt is formed from three parts. The first part constitutes front and back body. With front and rear body is cut as all. There is no shoulder seam. The width of the first part 21 cm, the length is 82 cm. The front body (82cm) + back body (82cm) wide total of 164cm.
The second and third parts 23 x 107 cm. Right and left sides (coupe) forming parts of these parts at the same time extending to arms length, it makes the lower part of the arm also occur.
Collar "zero collar" has been studied and completed with a pat on the 10,5X2 measure. Cream-colored collar around 1cm band prepared to cotton cloth is used.The lever part is a continuation of the side body consists of two parts as lower and upper arm. Obtained by the upper arm and shoulder, which is a separate piece was erected clean stitches. Arm length is 26 cm. Wristband cream made from cotton fabric, 1cm is surrounded by the band.
The seams of the shirt is made by hand whisking suture technique. Hemline at hand by bending is attached by pressure sewing technique. There were no decorations.
The Second Example:
Photo 2 (a) Front view of shirt Photo 2(b) Back view of shirt Photo 2 (c/d)Collar front of and cuff details
Shirt belongs to the first half of the 20th century. Sizes 90X45 centimeters. Size three arm
consists of two parts. The first body part is formed in the front and rear body. The front and rear body has been studied as a whole. In the first part there is no shoulder seam. The first part constituting the front and back body is prepared using fabric at the 29 centimeters.
The second and third parts, the sizes and also creates lower arm extending through lengthwise arm. Of the model to cut is attached which provides ease of movement to the bottom arm to a bird 18 centimeters long triangular piece. the second part it is made obtaining clean stitches of the shoulder with the aim of.
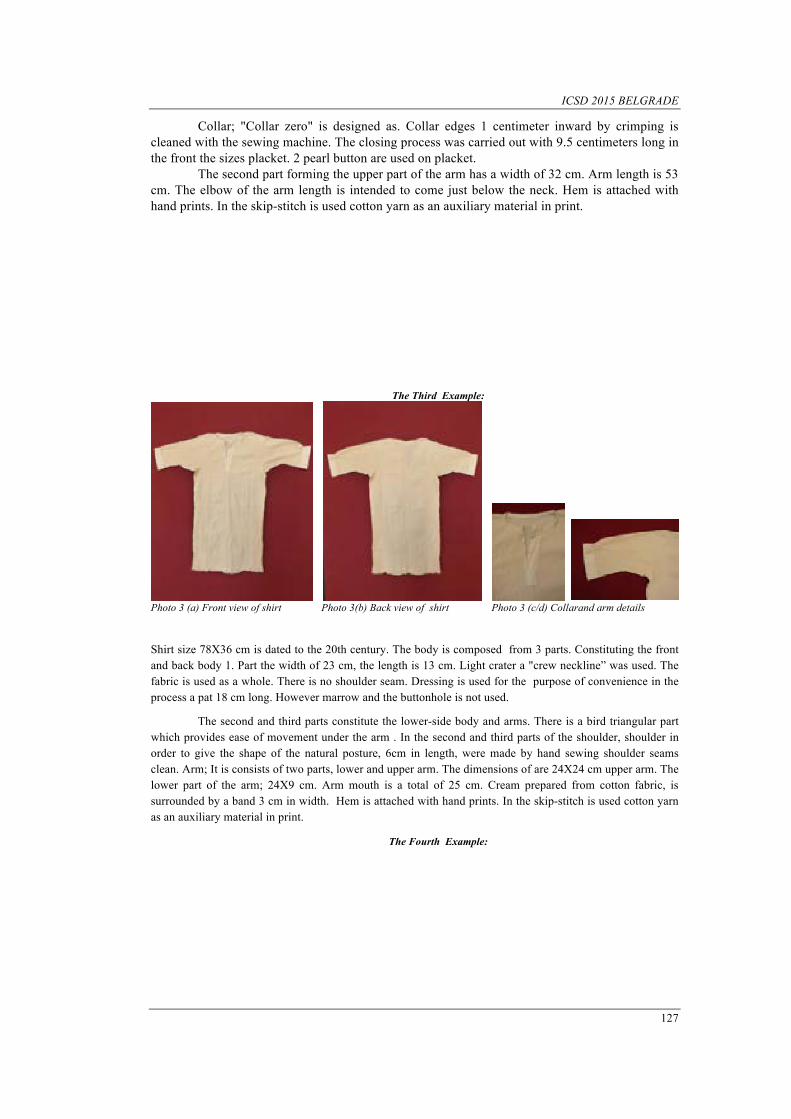
ICSD 2015 BELGRADE
127
Collar; "Collar zero" is designed as. Collar edges 1 centimeter inward by crimping is cleaned with the sewing machine. The closing process was carried out with 9.5 centimeters long in the front the sizes placket. 2 pearl button are used on placket.
The second part forming the upper part of the arm has a width of 32 cm. Arm length is 53 cm. The elbow of the arm length is intended to come just below the neck. Hem is attached with hand prints. In the skip-stitch is used cotton yarn as an auxiliary material in print.
The Third Example:
Photo 3 (a) Front view of shirt Photo 3(b) Back view of shirt Photo 3 (c/d) Collarand arm details Shirt size 78X36 cm is dated to the 20th century. The body is composed from 3 parts. Constituting the front and back body 1. Part the width of 23 cm, the length is 13 cm. Light crater a "crew neckline” was used. The fabric is used as a whole. There is no shoulder seam. Dressing is used for the purpose of convenience in the process a pat 18 cm long. However marrow and the buttonhole is not used.
The second and third parts constitute the lower-side body and arms. There is a bird triangular part which provides ease of movement under the arm . In the second and third parts of the shoulder, shoulder in order to give the shape of the natural posture, 6cm in length, were made by hand sewing shoulder seams clean. Arm; It is consists of two parts, lower and upper arm. The dimensions of are 24X24 cm upper arm. The lower part of the arm; 24X9 cm. Arm mouth is a total of 25 cm. Cream prepared from cotton fabric, is surrounded by a band 3 cm in width. Hem is attached with hand prints. In the skip-stitch is used cotton yarn as an auxiliary material in print.
The Fourth Example:

ICSD 2015 BELGRADE
128
Photo 4(a) Front view of shirt Photo 4 (b) Back view of shirt Photo 4(c/d) Collar and cuff details
It dated the 20th century. The body is composed from 3 parts, arm 2 part. The first the sizes part 85X20 cm. Front and back the sizes whole. Collar opening is made later on. In the first part there is no shoulder seam. “Crew neckline” was worked as. Closure process, which is designed in the 21 cm in length, is realized with paste. 3 In 7-cm intervals marrow button is used with the paste. Buttons are mother of pearl buttons.
The second and third parts creates lower-side the sizes and arms. Its size is 127X18 cm. Due to the models designed long-sleeved, side parts are too long. Arm is made up of two parts. Lower arm and upper arm is a separate part which is a continuation of the body. The dimensions of the upper arm is 45X9 cm.
Arm mouth is shirred. The cream-colored cotton yarn studied, complemented by headlines and slash. Cuff width is 5 cm.Hem is attached with hand prints. In the skip-stitch is used cotton yarn as an auxiliary material in print.
5. RESULT AND SUGGESTIONS
Research findings on the basis of data obtained from;
It is understood that the review of the shirt of the 20th century. Sizes ranged between 78X36 cm 90X45 cm. In the production of shirts, are used traditional at hand looms which are woven crimped fabric. The main color is vary between creamy and white. Auxiliary fabric was used as a cream-colored cotton fabrics. In addition, aids are being used mother of pearl buttons. Also available this auxiliary of the material that use models.
Tradıtıonal of man curlıng shırts in the body part of front and rear the sizes shoulders down to the hem of the herb, used as models are emerging and cutting capability. Some of the sleeve of his shirt cut triangular feature that met the bird pieces, while others; It was observed that continued until the mouth of the side arm cube pieces. The seam of the shirt sewing used mostly hand clapping, skirt is fastened with a print seam ends. As material help in the planting process has been used cotton yarn.
During the research that the surveyed in the man curling shirts has been seen that the use of ornament making and trimming materials.
According to research findings; In the use of zero-neck in neck and closing; pat in more applications are emerging that use varying lengths.
Arm length is short, long, it appears that the use of varying length between the elbow and wrist. Slit and mouth were also observed in the arm cuff armband.
The Examınatıon of Konya’s Tradıtıonal Man Curlıng Shırts In Turkısh Culture Are An İmportant Part of Our Cultural Heritage. Our cultural heritage of hundreds of years, with modernization, has been quickly and radically disappearing. It should be noted that protecting cultural heritage is as important as protecting life; it is necessary and even inevitable.
ICSD 2015 BELGRADE
129
REFERENCES
ARTUN, Erman. (2008). Halk Kültürü Araştırmaları. Kitabevi Yayınları. İstanbul. ATALAYER, Günay,(1997) "Anadolu Dokumacılığında İkat Geleneği ve Çağdaş Bir Yaklaşım" Türkiye’de EI
Sanatları Geleneği ve Çağdaş Sanatlar Içindeki Yeri” Türkive'de El Sanatları Geleneği ve Çağdaş Sanatlar içindeki Yeri Sempozyumu Bildirileri, Ankara.
BARNARD, Malcolm, (2001). Fashion as Communication, London, New York: Routledge. CRANE, D.,(2000) Moda ve Gündemleri, Ayrıntı Yayınları, İstanbul ÇAĞDAŞ , M., BARIŞERİ,N., ÖZEREN, F.,.(1996),. Geleneksel Konya Merkez Kadın Ve Erkek İç
Giyimlerinden Kıvratma Gömleklerinin Özelliklerinin Belirlenmesi, Selçuk Üniversitesi Projesi,No:95/014,Konya. ÇAĞDAŞ,M., AYTEN, H.,YILMAZ, E.D.,(2012), 1. “Geçmişten Günümüze Geleneksel Kıvratma Kumaş” 1.
Uluslararası Yöresel Bez Kongresi,27-28 Eylül, İstanbul. FOGG,M., (2004). Modanın Tüm Öyküsü, Hayalperest Yayınevi,İstanbul. GÖRÜNÜR, L., (20109, Osmanlı İmparatorluğu’nun Son Döneminden Kadın Giysileri Sadberk Hanım Müzesi
Koleksiyonu,İstanbul. GÜNAY, Umay. (1999). “Osmanlı İmparatorluğu ve Türk Halk Kültürü”. Osmanlı Kültür ve Sanat. Cilt.9.
Yeni Türkiye Yayınları. Ankara. HAVİLAND.,W. PRİNS, E.L. Harald, WALRATH,D. ,MCBRIDE, B., (2006) Kültürel Antroploji
Çeviren:Sarıoğlu., İ., D.,Kaktüs yayınları, İstanbul. KARPUZ, E., ŞENTÜRK, H.A., HARMANKAYA, H.,(2015), Çankırı’da Bulunan Saklı Hazineler:İşlemeli Ev
Eşyaları, Giyimler ve Giyim Donatıları. Çankırı. KOÇ., F., E., KOCA. (2009) Geleneksel Giysi Tarzlarının Değişimi ve Türk Modasının Oluşumunda İstanbul,
7. Uluslararası Türk Kültürü Kongresi, 5-10 Ekim ,Ankara . KOÇU,R.E., (1969). Türk Giyim Kuşam ve Süslenme Sözlüğü, Sümerbank Kültür Yayınları,Ankara. OĞUZ, B., (2004). Türkiye Halkının Kültür Kökenleri 4 (Dokuma ve Giyim Teknikleri), Anadolu Aydınlanma
Vakfı Yayınları:17, Kültür Dizisi: 10, İstanbul. ÖZDEMİR,M. (2009) Bolu İlinde Geleneksel Kadın Başlıkları, Süleyman Demirel Üniversitesi Güzel Sanatlar
Fakültesi Hakemli Dergisi ART-E ,2009-04,Isparta. SALMAN., F. (1998) “Tarihi Türk Kumaşlarında Desen ve Renk Anlayışı”, Atatürk Üniversitesi Güzel Sanatlar
Enstitüsü Dergisi, Erzurum. e-dergi.atauni.edu.tr/ataunigsfd/article/viewFile/1025003138/ SALMAN,F., (2004) “ Türk Kumaş Sanatnda Görülen Geleneksel Kumaş Çeştlerimız” Atatürk Üniversitesi
Güzel Sanatlar Enstitüsü Dergisi, Erzurum. e-dergi.atauni.edu.tr/ataunigsfd/article/viewFile/1025003138/ UĞURLU, A., UĞURLU, S. S.,(2006) “Yörenin Kültürel Kimliği Olarak Buldan Bezi,Buldan” Sempozyumu
Pamukkale Üniversitesi Buldan Meslek Yüksek Okulu 23-23 Kasım, Denizli. TURAN, Şerafettin. (1994). Türk Kültür Tarihi. Bilgi Yayınları. Ankara. TYRCHNIEWICZ, Peggy – HICKS, Bill. (1979). Ethnic Folk Costumes in Canada.Hyperion Press. New York.

ICSD 2015 BELGRADE
130
Recognition The Speaker Identity By Means Of Artificial Neural Network
Yasin Akman1, Emine Özcan 2
Abstract The aim of this paper, work is to investigate the algorithms of speech recognition. The authors, programmed and simulated the designed systems for algorithms of speech recognition in Matlab. Ten speaker audio recording is made within the scope of the paper. The voice signal generated from 10 different people (6 males and 4 females). WavePad program was made pre-treatment and cleaning of noise. Audio processing was carried out with Matlab program. We generated the useable data from this voice signals with the help of a Matlab Simulink Model. We use this data as an input signal for Matlab program based neural network. Voice signals are processed with artificial neural networks (ANN) classification process and 10 different speaker voice recognition process was carried out.
Keywords: Speaker Recognition, Sound Processing, Wavelet, ANN.
1. INTRODUCTION
In recent years, Artificial Neural Network (ANN) have been applied in many areas and it is one of the most commonly researched methods. ANN have been defined in numerous ways by several scientists [1,2,3]. The ANN techniques are effective for the complex and non-linear models. ANN research techniques are applied to various fields such as classification, optimization, forecasting, recognition, modeling and learning [4,5,6,7,8]. Audio signal samples from ten different individuals (6 males and 4 females) in this study was obtained. This is a preliminary procedure. For example, cleaning of noise. WavePad program was used at this stage. After this step, the audio sample was carried out with the help of Matlab. The useable data is occurred from the audio samples (For example; target data and training data). We use this data as an input signal for Matlab based ANN. The classification process was done and the voice recognition process is done successfully.
2. MATERIAL AND METHODS
2.1. The Sound Recording Process
Audio recordings were carried out with the WavePad program. The sampling frequency is 44100 Hz. They are recorded as a monorail sound with Windows 7 Operating System and the help of a dynamic microphone. Their format is .wav format. They are recorded in mono to hold less space.
1Selçuk University, Huğlu Vocational School, Department of Computer Technologies, 42770, Kulu/Konya/Turkey.
[email protected] 2Selçuk University, Kulu Vocational School, Department of Computer Technologies, 42710, Beyşehir/Konya/Turkey.

ICSD 2015 BELGRADE
131
Figure 1.1. The WavePad program
Figure 1.2. Examples of audio recordings
Sound recordings were made in a quiet environment in the home. There was only the sound of computer fans. Ten different words of ten different people were obtained. The WavePad program made the noise cleaning process and audio files segmentation process in the audio file. The audio file is passed from the High-Pass Filter and Low-Pass Filter.
Figure 1.3. Noisy sound signal
Figure 1.4. Noiseless sound signal
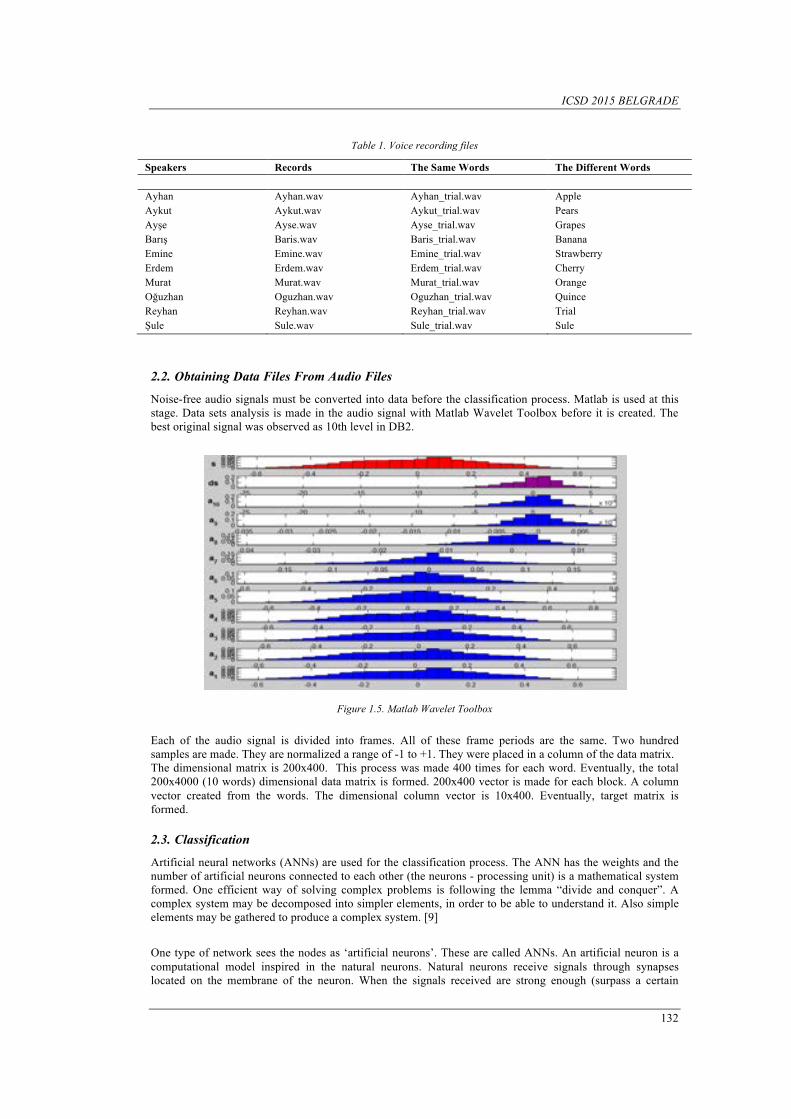
ICSD 2015 BELGRADE
132
Table 1. Voice recording files
Speakers Records The Same Words The Different Words Ayhan Ayhan.wav Ayhan_trial.wav Apple Aykut Aykut.wav Aykut_trial.wav Pears Ayşe Ayse.wav Ayse_trial.wav Grapes Barış Baris.wav Baris_trial.wav Banana Emine Emine.wav Emine_trial.wav Strawberry Erdem Erdem.wav Erdem_trial.wav Cherry Murat Murat.wav Murat_trial.wav Orange Oğuzhan Oguzhan.wav Oguzhan_trial.wav Quince Reyhan Reyhan.wav Reyhan_trial.wav Trial Şule Sule.wav Sule_trial.wav Sule
2.2. Obtaining Data Files From Audio Files
Noise-free audio signals must be converted into data before the classification process. Matlab is used at this stage. Data sets analysis is made in the audio signal with Matlab Wavelet Toolbox before it is created. The best original signal was observed as 10th level in DB2.
Figure 1.5. Matlab Wavelet Toolbox Each of the audio signal is divided into frames. All of these frame periods are the same. Two hundred samples are made. They are normalized a range of -1 to +1. They were placed in a column of the data matrix. The dimensional matrix is 200x400. This process was made 400 times for each word. Eventually, the total 200x4000 (10 words) dimensional data matrix is formed. 200x400 vector is made for each block. A column vector created from the words. The dimensional column vector is 10x400. Eventually, target matrix is formed.
2.3. Classification
Artificial neural networks (ANNs) are used for the classification process. The ANN has the weights and the number of artificial neurons connected to each other (the neurons - processing unit) is a mathematical system formed. One efficient way of solving complex problems is following the lemma “divide and conquer”. A complex system may be decomposed into simpler elements, in order to be able to understand it. Also simple elements may be gathered to produce a complex system. [9]
One type of network sees the nodes as ‘artificial neurons’. These are called ANNs. An artificial neuron is a computational model inspired in the natural neurons. Natural neurons receive signals through synapses located on the membrane of the neuron. When the signals received are strong enough (surpass a certain

ICSD 2015 BELGRADE
133
threshold), the neuron is activated and emits a signal though the axon. This signal might be sent to another synapse, and might activate other neurons. [9]
Figure 1.6. An artificial neuron [9] Voice recognition process is faster than the other algorithms in ANN. Therefore ANN were used in this study. Artificial neural network features:
• Nntool used in Matlab for ANN;
• Designed using newff() command;
• Hidden layer: 40 neurons;
• Output layer: 10 neurons;
• Epoch: 1000;
• Network type: feed forward;
• Training function: traincgf;
• Transfer function: tansig.
3. RESULTS AND DISCUSSION
Two different trainings and two different tests was carried out. For in the first test group: The same words for each speaker in the first test group are used. They are "trial.wav" files. They are recorded for each speaker. These files are examining and the input and output dataset was created. Ten different audio signals of ten people are applied as input to the ANN training. Performance value of the first test group = 3.3531e-05.
Figure 2.1. Performance graphic of the first test group
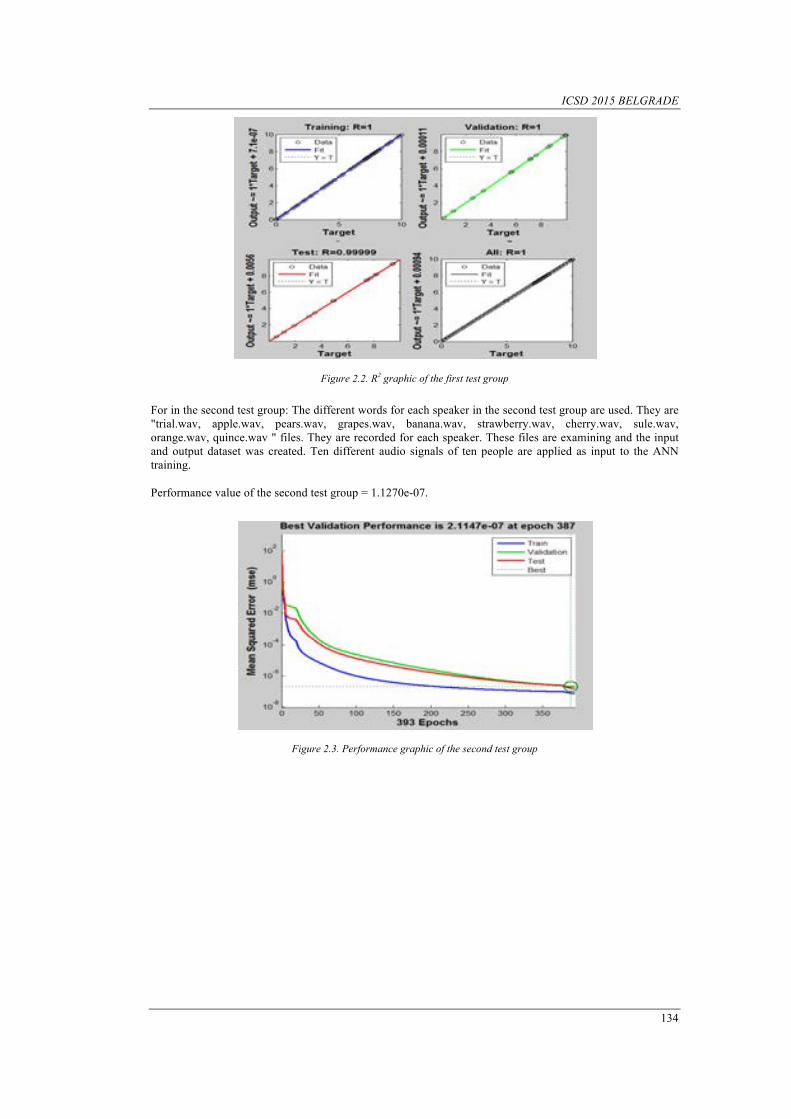
ICSD 2015 BELGRADE
134
Figure 2.2. R2 graphic of the first test group
For in the second test group: The different words for each speaker in the second test group are used. They are "trial.wav, apple.wav, pears.wav, grapes.wav, banana.wav, strawberry.wav, cherry.wav, sule.wav, orange.wav, quince.wav " files. They are recorded for each speaker. These files are examining and the input and output dataset was created. Ten different audio signals of ten people are applied as input to the ANN training. Performance value of the second test group = 1.1270e-07.
Figure 2.3. Performance graphic of the second test group
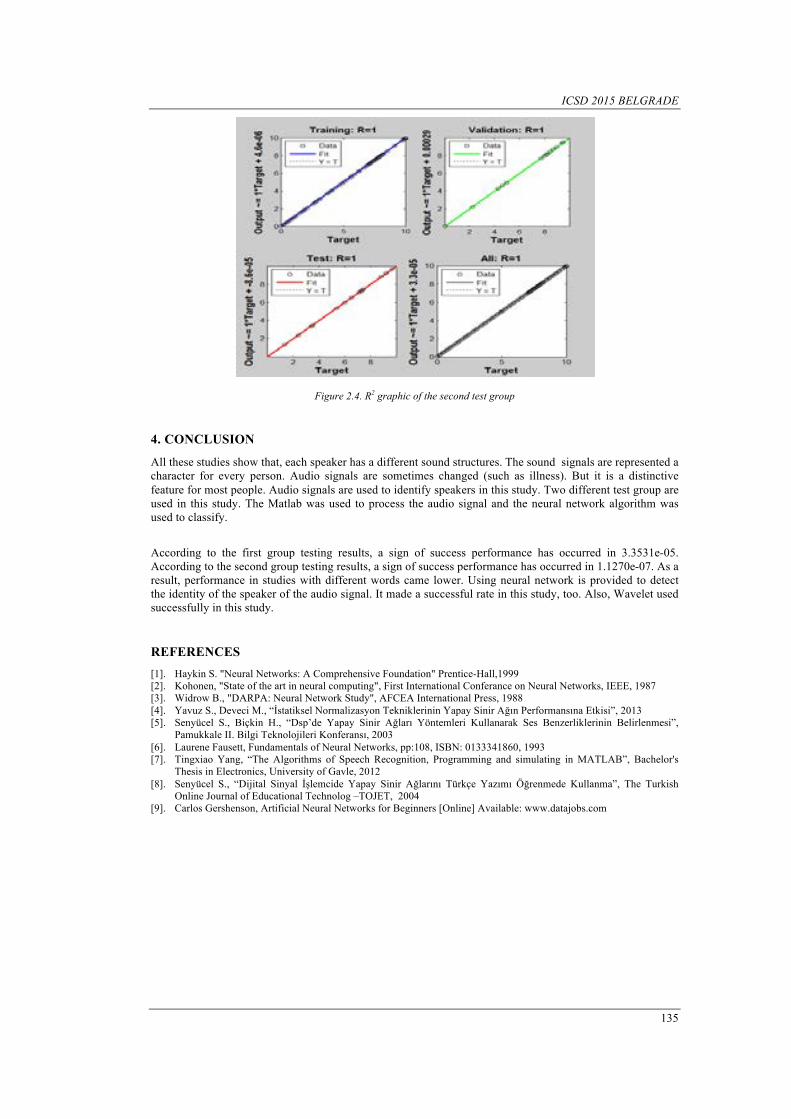
ICSD 2015 BELGRADE
135
Figure 2.4. R2 graphic of the second test group
4. CONCLUSION
All these studies show that, each speaker has a different sound structures. The sound signals are represented a character for every person. Audio signals are sometimes changed (such as illness). But it is a distinctive feature for most people. Audio signals are used to identify speakers in this study. Two different test group are used in this study. The Matlab was used to process the audio signal and the neural network algorithm was used to classify.
According to the first group testing results, a sign of success performance has occurred in 3.3531e-05. According to the second group testing results, a sign of success performance has occurred in 1.1270e-07. As a result, performance in studies with different words came lower. Using neural network is provided to detect the identity of the speaker of the audio signal. It made a successful rate in this study, too. Also, Wavelet used successfully in this study.
REFERENCES [1]. Haykin S. "Neural Networks: A Comprehensive Foundation" Prentice-Hall,1999 [2]. Kohonen, "State of the art in neural computing", First International Conferance on Neural Networks, IEEE, 1987 [3]. Widrow B., "DARPA: Neural Network Study", AFCEA International Press, 1988 [4]. Yavuz S., Deveci M., “İstatiksel Normalizasyon Tekniklerinin Yapay Sinir Ağın Performansına Etkisi”, 2013 [5]. Senyücel S., Biçkin H., “Dsp’de Yapay Sinir Ağları Yöntemleri Kullanarak Ses Benzerliklerinin Belirlenmesi”,
Pamukkale II. Bilgi Teknolojileri Konferansı, 2003 [6]. Laurene Fausett, Fundamentals of Neural Networks, pp:108, ISBN: 0133341860, 1993 [7]. Tingxiao Yang, “The Algorithms of Speech Recognition, Programming and simulating in MATLAB”, Bachelor's
Thesis in Electronics, University of Gavle, 2012 [8]. Senyücel S., “Dijital Sinyal İşlemcide Yapay Sinir Ağlarını Türkçe Yazımı Öğrenmede Kullanma”, The Turkish
Online Journal of Educational Technolog –TOJET, 2004 [9]. Carlos Gershenson, Artificial Neural Networks for Beginners [Online] Available: www.datajobs.com
ICSD 2015 BELGRADE
136
Evaluation of Izmir Clock Tower & Konak Square and Their Environs with Regard to
User - Space Interaction Çiğdem Kılıçaslan1, Emine Malkoç True2
Abstract İzmir Clock Tower is an example of a "singular tower clock" which dates from the Ottoman Sultan Abdülhamid II period and still survives at the same place where it was built. The Clock Tower is a landmark for both its environs and İzmir city. The structure was opened in Konak Square on September 1, 1901 to celebrate the 25th anniversary of the accession of Abdülhamid II to the throne, and has gained a central importance for the city. In this study, İzmir Clock Tower, its symbolical role, historical importance and aesthetic value was dealt with, along with Konak Square where it is located, and evaluated in terms of user – space interaction. The study was carried out in four different parts; conceptual analysis, data collection, evaluation, discussion and results. In the first part of the study, the historical and architectural properties of İzmir Clock Tower and Konak Square, and their importance for the city, are explained. Data collection for the study consisted of three main parts. In the first part, İzmir Clock Tower was evaluated as an architectural structure and discussed according to its general features, attribute information, design properties and its relations with its surroundings. In the second part, Konak Square was evaluated in terms of its general features, uses and activities and positive – negative physical features. In the final stage, both the Clock Tower and Konak Square, and their immediate surroundings, were handled in an integrated manner. After the discussion on general features, the usages are evaluated on the basis of access and Linkage. In the assessment, the Clock Tower and Konak Square are evaluated holistically and discussed in terms of user - space interaction.
Keywords: İzmir Clock Tower, İzmir Konak Square.
1. INTRODUCTION
Landmarks are important symbols associated with place which increased in significance with time through. Even natural landmarks have essential characteristics – height, distinctiveness, form, visibility, views: and they define ‘place, signpost routes, modify ‘space’ and have as we have noted developed cultural, economic or religious meaning. They represented a quality of place, depth of tradition and culture that is true of today’s landmarks [1]. Landmarks are type of point - reference and they are usually a rather simply defined physical object as building, sign, store, or mountain [2].
The types of landmarks can be separated into four groups: Historical or civic buildings, such as churches, libraries and town halls; distinctive structures, such as clock and water towers, and public art; places of activity, such as mixed - use squares, parks and playgrounds; places or buildings of personal significance, such as a previous workplace, the general practitioner’s surgery, a favourite public house and so on [3]. The clock towers which are mostly seen structures are the important landmarks of the cities. Beyond being a monument which decorating the cities and towns with respect to urbanism, clock towers have become the symbols of the settlements in our day [4]. In the period they were built, they were usually the highest 1Corresponding author: Adnan Menderes University, Faculty of Agriculture, Department of Landscape Architecture, d09100, Koçarlı / Aydın, Turkey, [email protected] 2Emine Malkoç True, Ege University, Faculty of Agriculture, Department of Landscape Architecture, 35100, Bornova / dTurkey, [email protected]
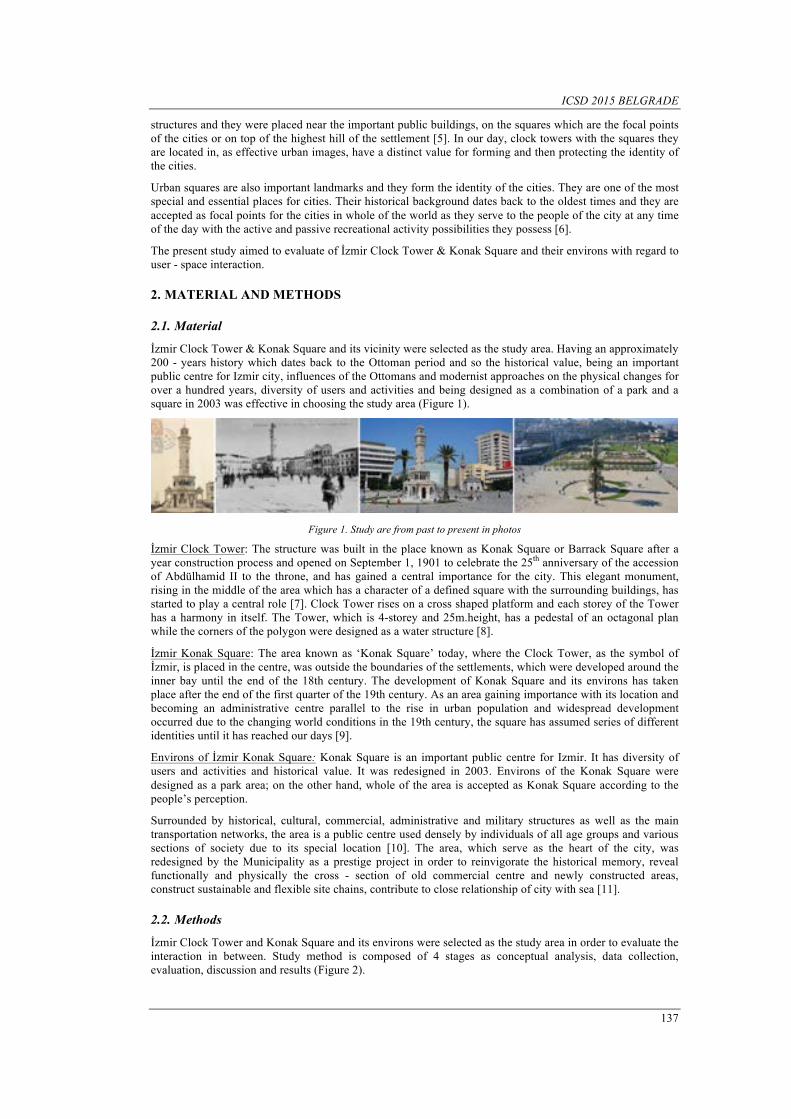
ICSD 2015 BELGRADE
137
structures and they were placed near the important public buildings, on the squares which are the focal points of the cities or on top of the highest hill of the settlement [5]. In our day, clock towers with the squares they are located in, as effective urban images, have a distinct value for forming and then protecting the identity of the cities.
Urban squares are also important landmarks and they form the identity of the cities. They are one of the most special and essential places for cities. Their historical background dates back to the oldest times and they are accepted as focal points for the cities in whole of the world as they serve to the people of the city at any time of the day with the active and passive recreational activity possibilities they possess [6].
The present study aimed to evaluate of İzmir Clock Tower & Konak Square and their environs with regard to user - space interaction.
2. MATERIAL AND METHODS
2.1. Material
İzmir Clock Tower & Konak Square and its vicinity were selected as the study area. Having an approximately 200 - years history which dates back to the Ottoman period and so the historical value, being an important public centre for Izmir city, influences of the Ottomans and modernist approaches on the physical changes for over a hundred years, diversity of users and activities and being designed as a combination of a park and a square in 2003 was effective in choosing the study area (Figure 1).
Figure 1. Study are from past to present in photos
İzmir Clock Tower: The structure was built in the place known as Konak Square or Barrack Square after a year construction process and opened on September 1, 1901 to celebrate the 25th anniversary of the accession of Abdülhamid II to the throne, and has gained a central importance for the city. This elegant monument, rising in the middle of the area which has a character of a defined square with the surrounding buildings, has started to play a central role [7]. Clock Tower rises on a cross shaped platform and each storey of the Tower has a harmony in itself. The Tower, which is 4-storey and 25m.height, has a pedestal of an octagonal plan while the corners of the polygon were designed as a water structure [8].
İzmir Konak Square: The area known as ‘Konak Square’ today, where the Clock Tower, as the symbol of İzmir, is placed in the centre, was outside the boundaries of the settlements, which were developed around the inner bay until the end of the 18th century. The development of Konak Square and its environs has taken place after the end of the first quarter of the 19th century. As an area gaining importance with its location and becoming an administrative centre parallel to the rise in urban population and widespread development occurred due to the changing world conditions in the 19th century, the square has assumed series of different identities until it has reached our days [9].
Environs of İzmir Konak Square: Konak Square is an important public centre for Izmir. It has diversity of users and activities and historical value. It was redesigned in 2003. Environs of the Konak Square were designed as a park area; on the other hand, whole of the area is accepted as Konak Square according to the people’s perception.
Surrounded by historical, cultural, commercial, administrative and military structures as well as the main transportation networks, the area is a public centre used densely by individuals of all age groups and various sections of society due to its special location [10]. The area, which serve as the heart of the city, was redesigned by the Municipality as a prestige project in order to reinvigorate the historical memory, reveal functionally and physically the cross - section of old commercial centre and newly constructed areas, construct sustainable and flexible site chains, contribute to close relationship of city with sea [11].
2.2. Methods
İzmir Clock Tower and Konak Square and its environs were selected as the study area in order to evaluate the interaction in between. Study method is composed of 4 stages as conceptual analysis, data collection, evaluation, discussion and results (Figure 2).
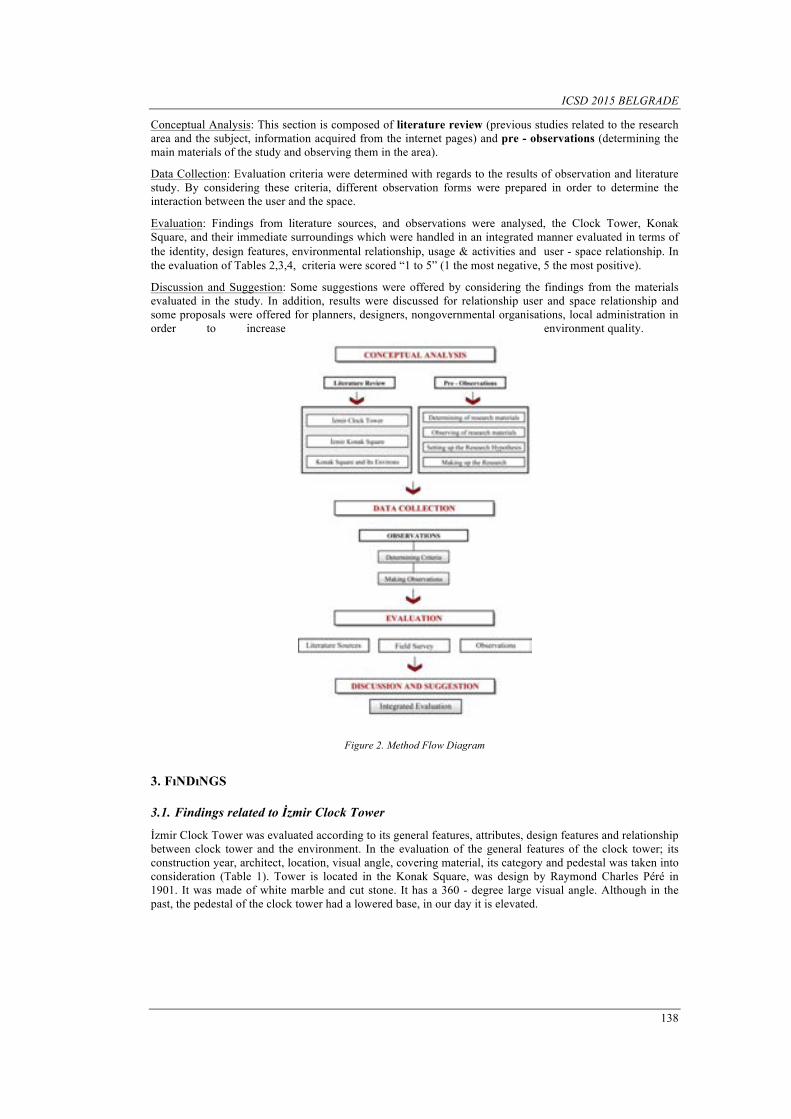
ICSD 2015 BELGRADE
138
Conceptual Analysis: This section is composed of literature review (previous studies related to the research area and the subject, information acquired from the internet pages) and pre - observations (determining the main materials of the study and observing them in the area).
Data Collection: Evaluation criteria were determined with regards to the results of observation and literature study. By considering these criteria, different observation forms were prepared in order to determine the interaction between the user and the space.
Evaluation: Findings from literature sources, and observations were analysed, the Clock Tower, Konak Square, and their immediate surroundings which were handled in an integrated manner evaluated in terms of the identity, design features, environmental relationship, usage & activities and user - space relationship. In the evaluation of Tables 2,3,4, criteria were scored “1 to 5” (1 the most negative, 5 the most positive).
Discussion and Suggestion: Some suggestions were offered by considering the findings from the materials evaluated in the study. In addition, results were discussed for relationship user and space relationship and some proposals were offered for planners, designers, nongovernmental organisations, local administration in order to increase environment quality.
Figure 2. Method Flow Diagram
3. FıNDıNGS
3.1. Findings related to İzmir Clock Tower
İzmir Clock Tower was evaluated according to its general features, attributes, design features and relationship between clock tower and the environment. In the evaluation of the general features of the clock tower; its construction year, architect, location, visual angle, covering material, its category and pedestal was taken into consideration (Table 1). Tower is located in the Konak Square, was design by Raymond Charles Péré in 1901. It was made of white marble and cut stone. It has a 360 - degree large visual angle. Although in the past, the pedestal of the clock tower had a lowered base, in our day it is elevated.

ICSD 2015 BELGRADE
139
Table 1. General features
GENERAL FEATURES Construction Year 1901
Architect Raymond Charles Péré Location City center Visual angle 360° Material White marble and cut stone Category Clock tower Pedestal Exist - Elevated base
The Clock Tower was evaluated due to its functions in this section. In this evaluation, both the relationship between the functions of the Clock Tower and Konak Square and between the Clock Tower and Park – Square were taken into consideration (Table 2). The clock tower is an attraction point for the Konak Square and its environs and also for whole of the city with its historical importance. It increases the visual value and the environmental quality of both the Konak square and the park – square. With its historical value, it has great importance in reflecting the identity of the study area, even the city. It creates image and influence the value judgement. It’s one of the most important landmarks and meeting points in the study area and at the same time in the city. There are also other important meeting points for the city inside the study are especially in the park – square part.
Table 2. Attributes
ATTRIBUTES FUNCTION 1 2 3 4 5 Improve the quality v • Reflection of identity v • Create Image • v Influence value judgment v • Being a landmark • v Being a meeting point • v
v Relationship with the Clock Tower and Konak Square • Relationship with the Clock Tower and Park - Square
In this section, Clock Tower was evaluated in the respect of repetition, harmony, contrast, hierarchy, dominance, balance and unity as design principles and evaluated in the respect of direction, form, scale, movement as design elements (Table 3). The clock tower is a four-storey monument and we can see the repetition and the harmony especially on the arch shaped openings. Also the star ornaments inside diamond shaped figures repeat on the main column and the fountains which are placed around the base in a circular pattern also repeat. Balance is prevalent in general design of the structure and dominance is provided with the elements of direction and the form (Especially the arch form is dominant). All the parts of the tower are in a balanced composition that unity can be easily perceived.
Table 3. Design features
DESIGN FEATURES
BASIC DESIGN PRINCIPLES Repetition 5 Harmony 5
ELEMENTS Contrast 1 Direction 5 Hierarchy 4 Form 5 Dominance 5 Scale 4 Balance 5 Movement 3 Unity 5
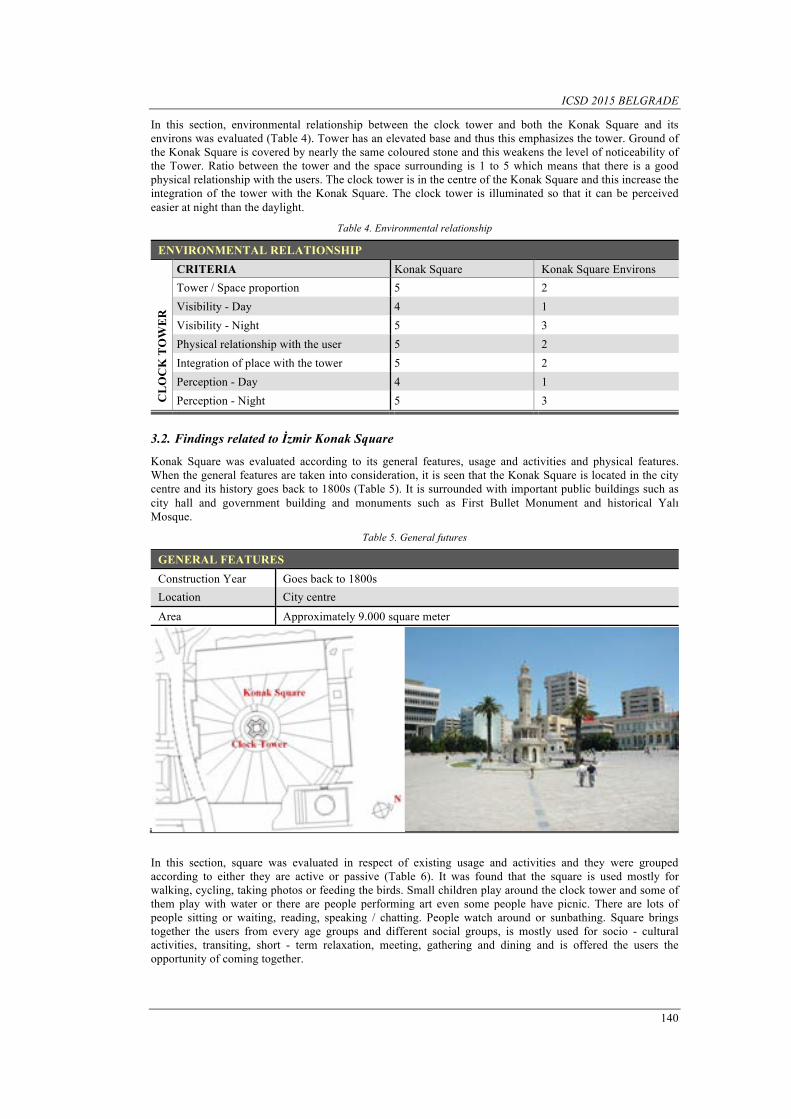
ICSD 2015 BELGRADE
140
In this section, environmental relationship between the clock tower and both the Konak Square and its environs was evaluated (Table 4). Tower has an elevated base and thus this emphasizes the tower. Ground of the Konak Square is covered by nearly the same coloured stone and this weakens the level of noticeability of the Tower. Ratio between the tower and the space surrounding is 1 to 5 which means that there is a good physical relationship with the users. The clock tower is in the centre of the Konak Square and this increase the integration of the tower with the Konak Square. The clock tower is illuminated so that it can be perceived easier at night than the daylight.
Table 4. Environmental relationship
ENVIRONMENTAL RELATIONSHIP
CL
OC
K T
OW
ER
CRITERIA Konak Square Konak Square Environs Tower / Space proportion 5 2 Visibility - Day 4 1 Visibility - Night 5 3 Physical relationship with the user 5 2 Integration of place with the tower 5 2 Perception - Day 4 1 Perception - Night 5 3
3.2. Findings related to İzmir Konak Square
Konak Square was evaluated according to its general features, usage and activities and physical features. When the general features are taken into consideration, it is seen that the Konak Square is located in the city centre and its history goes back to 1800s (Table 5). It is surrounded with important public buildings such as city hall and government building and monuments such as First Bullet Monument and historical Yalı Mosque.
Table 5. General futures
GENERAL FEATURES Construction Year Goes back to 1800s Location City centre
Area Approximately 9.000 square meter
In this section, square was evaluated in respect of existing usage and activities and they were grouped according to either they are active or passive (Table 6). It was found that the square is used mostly for walking, cycling, taking photos or feeding the birds. Small children play around the clock tower and some of them play with water or there are people performing art even some people have picnic. There are lots of people sitting or waiting, reading, speaking / chatting. People watch around or sunbathing. Square brings together the users from every age groups and different social groups, is mostly used for socio - cultural activities, transiting, short - term relaxation, meeting, gathering and dining and is offered the users the opportunity of coming together.
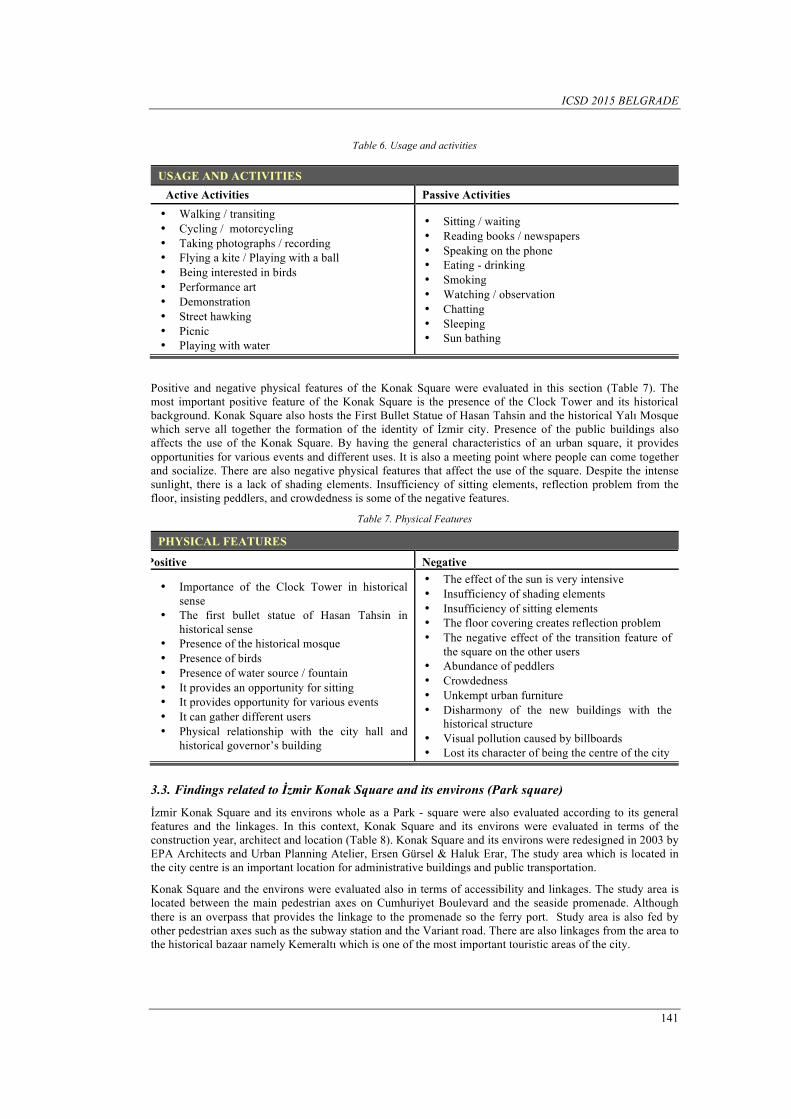
ICSD 2015 BELGRADE
141
Table 6. Usage and activities
USAGE AND ACTIVITIES Active Activities Passive Activities • Walking / transiting • Cycling / motorcycling • Taking photographs / recording • Flying a kite / Playing with a ball • Being interested in birds • Performance art • Demonstration • Street hawking • Picnic • Playing with water
• Sitting / waiting • Reading books / newspapers • Speaking on the phone • Eating - drinking • Smoking • Watching / observation • Chatting • Sleeping • Sun bathing
Positive and negative physical features of the Konak Square were evaluated in this section (Table 7). The most important positive feature of the Konak Square is the presence of the Clock Tower and its historical background. Konak Square also hosts the First Bullet Statue of Hasan Tahsin and the historical Yalı Mosque which serve all together the formation of the identity of İzmir city. Presence of the public buildings also affects the use of the Konak Square. By having the general characteristics of an urban square, it provides opportunities for various events and different uses. It is also a meeting point where people can come together and socialize. There are also negative physical features that affect the use of the square. Despite the intense sunlight, there is a lack of shading elements. Insufficiency of sitting elements, reflection problem from the floor, insisting peddlers, and crowdedness is some of the negative features.
Table 7. Physical Features
PHYSICAL FEATURES
Positive Negative
• Importance of the Clock Tower in historical sense
• The first bullet statue of Hasan Tahsin in historical sense
• Presence of the historical mosque • Presence of birds • Presence of water source / fountain • It provides an opportunity for sitting • It provides opportunity for various events • It can gather different users • Physical relationship with the city hall and
historical governor’s building
• The effect of the sun is very intensive • Insufficiency of shading elements • Insufficiency of sitting elements • The floor covering creates reflection problem • The negative effect of the transition feature of
the square on the other users • Abundance of peddlers • Crowdedness • Unkempt urban furniture • Disharmony of the new buildings with the
historical structure • Visual pollution caused by billboards • Lost its character of being the centre of the city
3.3. Findings related to İzmir Konak Square and its environs (Park square)
İzmir Konak Square and its environs whole as a Park - square were also evaluated according to its general features and the linkages. In this context, Konak Square and its environs were evaluated in terms of the construction year, architect and location (Table 8). Konak Square and its environs were redesigned in 2003 by EPA Architects and Urban Planning Atelier, Ersen Gürsel & Haluk Erar, The study area which is located in the city centre is an important location for administrative buildings and public transportation.
Konak Square and the environs were evaluated also in terms of accessibility and linkages. The study area is located between the main pedestrian axes on Cumhuriyet Boulevard and the seaside promenade. Although there is an overpass that provides the linkage to the promenade so the ferry port. Study area is also fed by other pedestrian axes such as the subway station and the Variant road. There are also linkages from the area to the historical bazaar namely Kemeraltı which is one of the most important touristic areas of the city.

ICSD 2015 BELGRADE
142
Table 8. General Features
GENERAL FEATURES Construction Year 2003 Area / Location 204.000 square meter (Approx.80.000 square meter green area) / City center Architect EPA Architects and Urban Planning Atelier - Ersen Gürsel & Haluk Erar
KONAK SQUARE ENVIRONS
LINKAGES
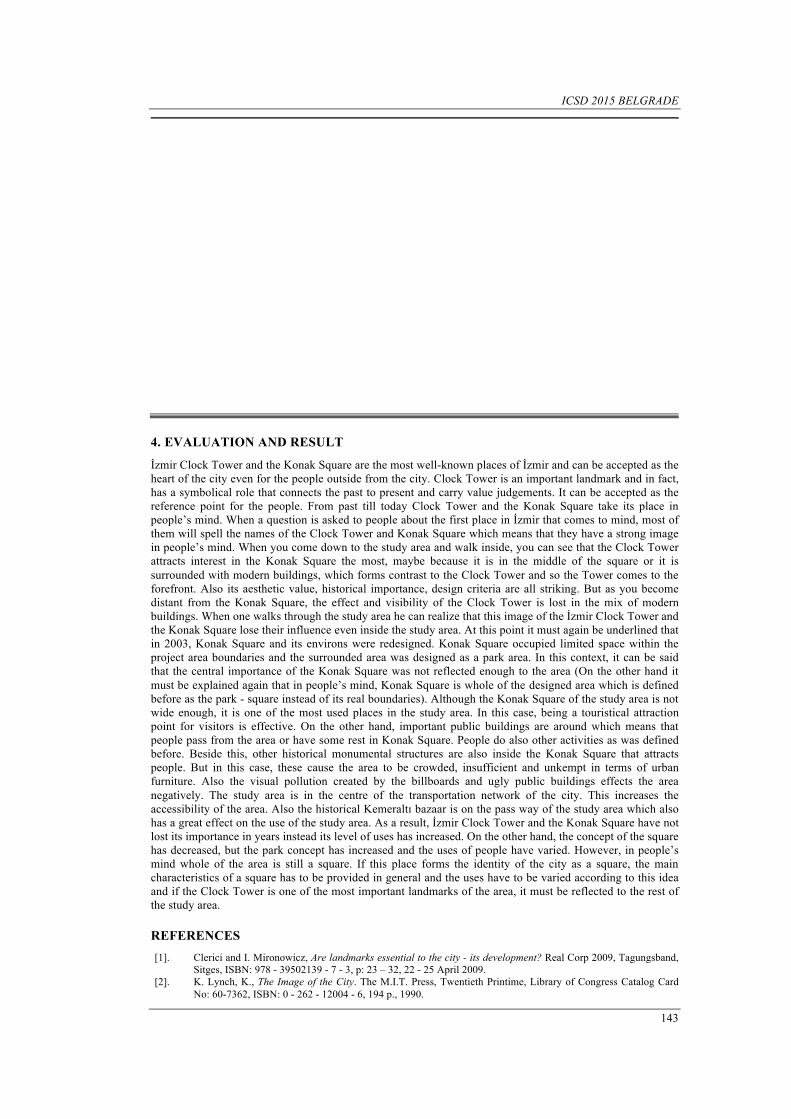
ICSD 2015 BELGRADE
143
4. EVALUATION AND RESULT
İzmir Clock Tower and the Konak Square are the most well-known places of İzmir and can be accepted as the heart of the city even for the people outside from the city. Clock Tower is an important landmark and in fact, has a symbolical role that connects the past to present and carry value judgements. It can be accepted as the reference point for the people. From past till today Clock Tower and the Konak Square take its place in people’s mind. When a question is asked to people about the first place in İzmir that comes to mind, most of them will spell the names of the Clock Tower and Konak Square which means that they have a strong image in people’s mind. When you come down to the study area and walk inside, you can see that the Clock Tower attracts interest in the Konak Square the most, maybe because it is in the middle of the square or it is surrounded with modern buildings, which forms contrast to the Clock Tower and so the Tower comes to the forefront. Also its aesthetic value, historical importance, design criteria are all striking. But as you become distant from the Konak Square, the effect and visibility of the Clock Tower is lost in the mix of modern buildings. When one walks through the study area he can realize that this image of the İzmir Clock Tower and the Konak Square lose their influence even inside the study area. At this point it must again be underlined that in 2003, Konak Square and its environs were redesigned. Konak Square occupied limited space within the project area boundaries and the surrounded area was designed as a park area. In this context, it can be said that the central importance of the Konak Square was not reflected enough to the area (On the other hand it must be explained again that in people’s mind, Konak Square is whole of the designed area which is defined before as the park - square instead of its real boundaries). Although the Konak Square of the study area is not wide enough, it is one of the most used places in the study area. In this case, being a touristical attraction point for visitors is effective. On the other hand, important public buildings are around which means that people pass from the area or have some rest in Konak Square. People do also other activities as was defined before. Beside this, other historical monumental structures are also inside the Konak Square that attracts people. But in this case, these cause the area to be crowded, insufficient and unkempt in terms of urban furniture. Also the visual pollution created by the billboards and ugly public buildings effects the area negatively. The study area is in the centre of the transportation network of the city. This increases the accessibility of the area. Also the historical Kemeraltı bazaar is on the pass way of the study area which also has a great effect on the use of the study area. As a result, İzmir Clock Tower and the Konak Square have not lost its importance in years instead its level of uses has increased. On the other hand, the concept of the square has decreased, but the park concept has increased and the uses of people have varied. However, in people’s mind whole of the area is still a square. If this place forms the identity of the city as a square, the main characteristics of a square has to be provided in general and the uses have to be varied according to this idea and if the Clock Tower is one of the most important landmarks of the area, it must be reflected to the rest of the study area.
REFERENCES [1]. Clerici and I. Mironowicz, Are landmarks essential to the city - its development? Real Corp 2009, Tagungsband,
Sitges, ISBN: 978 - 39502139 - 7 - 3, p: 23 – 32, 22 - 25 April 2009. [2]. K. Lynch, K., The Image of the City. The M.I.T. Press, Twentieth Printime, Library of Congress Catalog Card
No: 60-7362, ISBN: 0 - 262 - 12004 - 6, 194 p., 1990.
ICSD 2015 BELGRADE
144
[3]. L. Mitchell, E. Burton and S. Raman, Dementia - friendly Cities: Designing Intelligible Neighbourhoods for Life. Journal of Urban Design, Vol. 9, No. 1, 89 -1 01, February 2004.
[4]. Ö. Kokal, Saat Kuleleri. http://www.yapidergisi.com/makaleicerik.aspx?MakaleNum=27, Access Date: 30.09.2015.
[5]. H. H. Halaç and S. Ö. İlhan, Urban Image of the Clock Tower; in the Period of II. Abdülhamit, the Distribution of Clock Towers Outside İstanbul in the Geography of Turkey and a Typology Trial. NWSA-Humanities, 4C0189, 9, (4), 190 - 200, 2014.
[6]. E. V. Küçükerbaş, M. B., Özkan, E. Malkoç Yiğit, H. Sönmez Türel, İ. Altuğ and E. Önen, Kula Bir Meydan Tasarim Süreci: Didim Kent Meydaninın Geliştirilmesine Yönelik Kentsel Tasarim Senaryolari. Geçmişten Geleceğe Köprü: Yanik Ülke Kula Sempozyumu, 1–3 Eylül 2006, Kula, Isbn: 978–975–483–725–4, 521 S. 2006.
[7]. F. Yılmaz, Konak Square in the Historical Process. İzmir Metropalitan Municapility Library, Stil Press., 40 s., 2003.
[8]. İ. K. Ersoy, İzmir Saat Kulesi. Ege Üniversitesi Türk Dünyası Araştırmaları Enstitüsü, Türk Dünyası İncelemeleri Dergisi IV, Ege Üniversitesi Basım Evi, Bornova, İzmir, s: 277 - 287, 2000.
[9]. Ö. Eyüce, Konak Square From Past to Present in Pictures. Ege Mimarlık Special Issue, UIA 2005, s: 4 - 10. http://www.izmim.org/data/tulay_yesugey_mimarizmirizm.doc, Erişim: 08.05.2006, 2005.
[10]. E. Malkoc and M.B. Özkan, Post - Occupancy Evaluation of a Built Environment: The Case of Konak Square (İzmir, Turkey). Indoor and Built Environment 2010, 19;4: 422 - 434, 2010.
[11]. Ege Mimarlık, Konak Meydanı ve Çevresi Düzenleme Projesi. Konak Meydanı Denizle Yeniden Bulusuyor. Ege Mimarlık Volume: 50, 2004 (2): 44 - 53, 2004.
REFERENCES OF FIGURE AND TABLES Figure 1 Restorasyon Forum, 2015. İzmir Saat Kulesi. http://www.restorasyonforum.com/izmir/izmir-saat-kulesi-t109.0.html, Access date: 18.09.2015 İBB, 2015., History Pictures of İzmir. https://www.izmir.bel.tr/PhotoGallery/8/en, Access date: 16.09.2015. Panoramio, 2015. İzmir Konak Yalı Camii ve Saat Kulesi. http://www.panoramio.com/photo_explorer#view=photo&position=40&with_photo_id=54443568&order=date_desc&user=2426548, Access date: 17.09.2015. Marka ve sehir, 2013. https://markavesehir.files.wordpress.com/2013/04/dd33bb9ce97b06330eaa664816d274133ead93c6221b3f432c2baf45ce0c1229.jpg, Access date: 16.09.2015. Table 1: Original photo Table 5: Original photo Table 8: Arkitera (2006). Izmir Konak Meydani Duzenlemesi. Arkitera Mimarlik Veritabani, EPA Mimarlik Ltd. Sti., Projeleri. http://v2.arkiv.com.tr/p5160-izmir-konak-meydani-duzenlemesi.html, Access: 13.10.2015.
ICSD 2015 BELGRADE
145
Education of Local Governments as a way towards Sustainable Development of the Countries of the
Western Balkans - Case Study of Montenegro Radoje Vujadinovic1, Uros Karadzic1
Abstract
There is an urgent need of capacity building in sustainable development in the Western Balkans Countries. Thus, education and training are necessary elements to make municipality administration capable to recognize, define, prepare, and finalize any kind of the energy efficiency projects, from the simple ones up to technically and particularly financially complex projects, particularly taking into consideration today very attractive concepts of the projects financing, as ESCO’s, PPP, etc. This paper presents the activities on the TEMPUS project Training courses for public services in sustainable infrastructure development in Western Balkans (Project Number: 530530-TEMPUS-1-2012-1-SE-TEMPUS-JPHES), in the Montenegro, as case study. The project is designed to establish system for training of public authorities aimed at improving level of environmental expertise, facilitating good governance and sustainable development in Western Balkan countries. In that sense, for capacity building of staff at public authorities in sustainable development, particularly energy efficiency in the public buildings, management in the renewable energy sources at University of Montenegro - Faculty for Mechanical Engineering in cooperation with Union of Municipalities of Montenegro two training programmes are designed, developed and implemented. Key teachers were being retrained at EU universities and they disseminated their new knowledge to colleagues, so the capacities of University of Montenegro in providing training in sustainable development have been significantly improved. Strong connection between University of Montenegro and Union of Municipalities of Montenegro has been established. All these things contributed to creation of the system for continuous development of the knowledge, skills and competencies of the staff of public authorities. A web-based toolkits as an interactive learning environment for training of public authorities was developed during the project implementation.
Keywords: Education, Energy Efficiency, Sustainable Development, TEMPUS, Training.
1. INTRODUCTION
This paper presents the activities on the TEMPUS project under title „Training courses for public services in sustainable infrastructure development in Western Balkans” (Project Number: 530530-TEMPUS-1-2012-1-SE-TEMPUS-JPHES)-SDTRAIN. The paper will be an emphasis on activities that were implemented in this project in the Montenegro.
It is more than obvious that there is an urgent need for capacity building in the Western Balkans Countries (WBC) in the area of sustainable development. Because public authorities on all levels (local, regional and national) do not have the necessary level of knowledge on topics such as energy and the environment. This disadvantage is a very serious barrier to sustainable development of these countries. The analysis of the situation in terms of administrative capacity in the Western Balkans came to the conclusion that local governments of cities have major problems when it comes to skills and competencies of employees in this area. Thus, education and training are necessary elements to make municipality administration capable to recognize, define, prepare, and finalize any kind of the energy efficiency projects, from the simple ones up to
1Corresponding author: University of Montenegro, Faculty of Mechanical Engineering, 81000, Podgorica, Montenegro.
ICSD 2015 BELGRADE
146
technically and particularly financially complex projects, particularly taking into consideration today very attractive concepts of the projects financing, as ESCO’s, PPP, etc.
Analysis of interviews in all WBC demonstrated a need in networking between Local Authorities and Universities. Since many energy managers and environmental officers at municipal level work alone, a contact with the specialists in that area from Universities could be a big help when difficulties arise.
The SDTRAIN project proposal was finalized during the NALAS Task Force on Energy Efficiency meeting in Vienna on 6-9 February, 2012. NALAS is a network of associations of local authorities of South East Europe, which bring together 15 Associations which represent roughly 4000 local authorities. Interest of NALAS and its WBC members in the SDTRAIN project proves its high relevance to the needs of society.
The project is designed to establish system for training of public authorities aimed at improving level of environmental expertise, facilitating good governance and sustainable development in Western Balkan countries, and in particular in Montenegro, Serbia and BiH.
2. DESCRIPTION OF THE CONSORTIUM THAT IS CARRIED OUT THE PROJECT
The project consortium consist of:
I-European Universities that are proactive in realization their commitments towards sustainable regional and local development: KTH Stockholm, TU Delft and UPC Barcelona.
The EU partners have broad experience in organization of training courses for public authorities within national and international projects and in organization of training cources municipalities and other stakeholders on regular basis. They iniated a European network of Universities and cities aimed at development of green and resilient urban areas.
KTH introduced a set of training courses aimed at local and regional authorities in Baltic Sea Area within Interreg IIIB project. They also have expirience of such international courses for public authorities in Russia, Belarus and Ukraine.
UPC provides training courses in sustainable urban development, public administration and good governance both nationaly and internationally.
TU Delft provides training courses for various actors and expertise in public participation in decision-making processes, and conducts stake holders’ workshops focusing on sustainable development of local and regional infrastructure.
Originally it was planned that Polito (Politecnico di Torino) be part of a consortium but by the end of the project they did not take active participation. Polito is working on development of energy infrastructure in WBC and training of relevant stakeholders in this area.
II-Five universities from WBC: Serbia (2), Bosnia and Hercegovina (2) and Montenegro (1) that have experience in retraining and were approaching by public authorities for organization of training courses in sustainable public infrastructure.
In BiH: the project team conducted evaluation of need in training of local authorities supported by SIDA, University of Banja Luka (UBL) participated in development of strategic document on the level of Republic of Srpska and Bosnia and Hercegovina such as Air Quality Strategy for Republic of Srpska, UBL cooperates with associations of the local authorities of BiH and its experts participate in the Council of Climate Changes of City of Banja Luka and in development of Sustainable Environment Action Plan.
University of East Sarajevo (UES) is having extensive experiences in cooperation with public and private stakeholders in the sphere of energy efficiency within projects financed by the World Bank, NNTU and national funds. Lifelong learning activities have a strategic focus at UES. UES is located in 10 towns, which contributes to the faster development of these towns.
In Serbia project team has strategic cooperation with Association of Towns and Municipalities of Serbia that expressed the need of staff training of their members in sustainable urban development and energy efficiency. University of Belgrade (UB) put a high priority on supporting development of sustainable energy system in Serbia. Experts of Faculty of Mining and Geology and Mechanical Engineering have been involved in preparation of few strategic Serbian documents and they have managed projects related to energy efficiency improvement and RES utilization for Serbian municipalities. University of Kragujevac (UKG) is located in Kragujevac, the centre of Šumadija Region, while other five faculties are located in four towns of Central Serbia-covering the area with more than 2,5 mil inhabitants. UKG and its Euro Energy Efficiency Centre has extensive cooperation with local authorities, the Regional Chamber of Commerce in Kragujevac, the Energy Efficiency Agency of Serbia, the Ministry for Environment and companies that have a great need of training
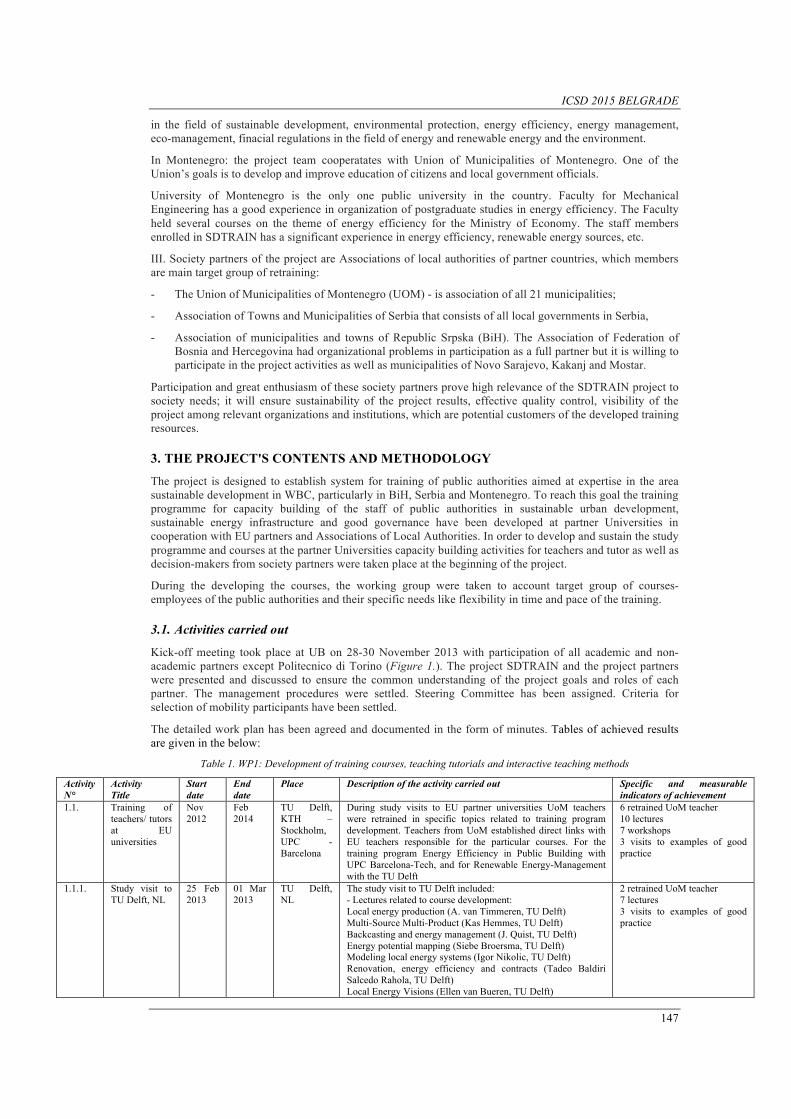
ICSD 2015 BELGRADE
147
in the field of sustainable development, environmental protection, energy efficiency, energy management, eco-management, finacial regulations in the field of energy and renewable energy and the environment.
In Montenegro: the project team cooperatates with Union of Municipalities of Montenegro. One of the Union’s goals is to develop and improve education of citizens and local government officials.
University of Montenegro is the only one public university in the country. Faculty for Mechanical Engineering has a good experience in organization of postgraduate studies in energy efficiency. The Faculty held several courses on the theme of energy efficiency for the Ministry of Economy. The staff members enrolled in SDTRAIN has a significant experience in energy efficiency, renewable energy sources, etc.
III. Society partners of the project are Associations of local authorities of partner countries, which members are main target group of retraining:
- The Union of Municipalities of Montenegro (UOM) - is association of all 21 municipalities;
- Association of Towns and Municipalities of Serbia that consists of all local governments in Serbia,
- Association of municipalities and towns of Republic Srpska (BiH). The Association of Federation of Bosnia and Hercegovina had organizational problems in participation as a full partner but it is willing to participate in the project activities as well as municipalities of Novo Sarajevo, Kakanj and Mostar.
Participation and great enthusiasm of these society partners prove high relevance of the SDTRAIN project to society needs; it will ensure sustainability of the project results, effective quality control, visibility of the project among relevant organizations and institutions, which are potential customers of the developed training resources.
3. THE PROJECT'S CONTENTS AND METHODOLOGY
The project is designed to establish system for training of public authorities aimed at expertise in the area sustainable development in WBC, particularly in BiH, Serbia and Montenegro. To reach this goal the training programme for capacity building of the staff of public authorities in sustainable urban development, sustainable energy infrastructure and good governance have been developed at partner Universities in cooperation with EU partners and Associations of Local Authorities. In order to develop and sustain the study programme and courses at the partner Universities capacity building activities for teachers and tutor as well as decision-makers from society partners were taken place at the beginning of the project.
During the developing the courses, the working group were taken to account target group of courses-employees of the public authorities and their specific needs like flexibility in time and pace of the training.
3.1. Activities carried out
Kick-off meeting took place at UB on 28-30 November 2013 with participation of all academic and non-academic partners except Politecnico di Torino (Figure 1.). The project SDTRAIN and the project partners were presented and discussed to ensure the common understanding of the project goals and roles of each partner. The management procedures were settled. Steering Committee has been assigned. Criteria for selection of mobility participants have been settled.
The detailed work plan has been agreed and documented in the form of minutes. Tables of achieved results are given in the below:
Table 1. WP1: Development of training courses, teaching tutorials and interactive teaching methods
Activity N°
Activity Title
Start date
End date
Place Description of the activity carried out Specific and measurable indicators of achievement
1.1. Training of teachers/ tutors at EU universities
Nov 2012
Feb 2014
TU Delft, KTH – Stockholm, UPC -Barcelona
During study visits to EU partner universities UoM teachers were retrained in specific topics related to training program development. Teachers from UoM established direct links with EU teachers responsible for the particular courses. For the training program Energy Efficiency in Public Building with UPC Barcelona-Tech, and for Renewable Energy-Management with the TU Delft
6 retrained UoM teacher 10 lectures 7 workshops 3 visits to examples of good practice
1.1.1. Study visit to TU Delft, NL
25 Feb 2013
01 Mar 2013
TU Delft, NL
The study visit to TU Delft included: - Lectures related to course development: Local energy production (A. van Timmeren, TU Delft) Multi-Source Multi-Product (Kas Hemmes, TU Delft) Backcasting and energy management (J. Quist, TU Delft) Energy potential mapping (Siebe Broersma, TU Delft) Modeling local energy systems (Igor Nikolic, TU Delft) Renovation, energy efficiency and contracts (Tadeo Baldiri Salcedo Rahola, TU Delft) Local Energy Visions (Ellen van Bueren, TU Delft)
2 retrained UoM teacher 7 lectures 3 visits to examples of good practice
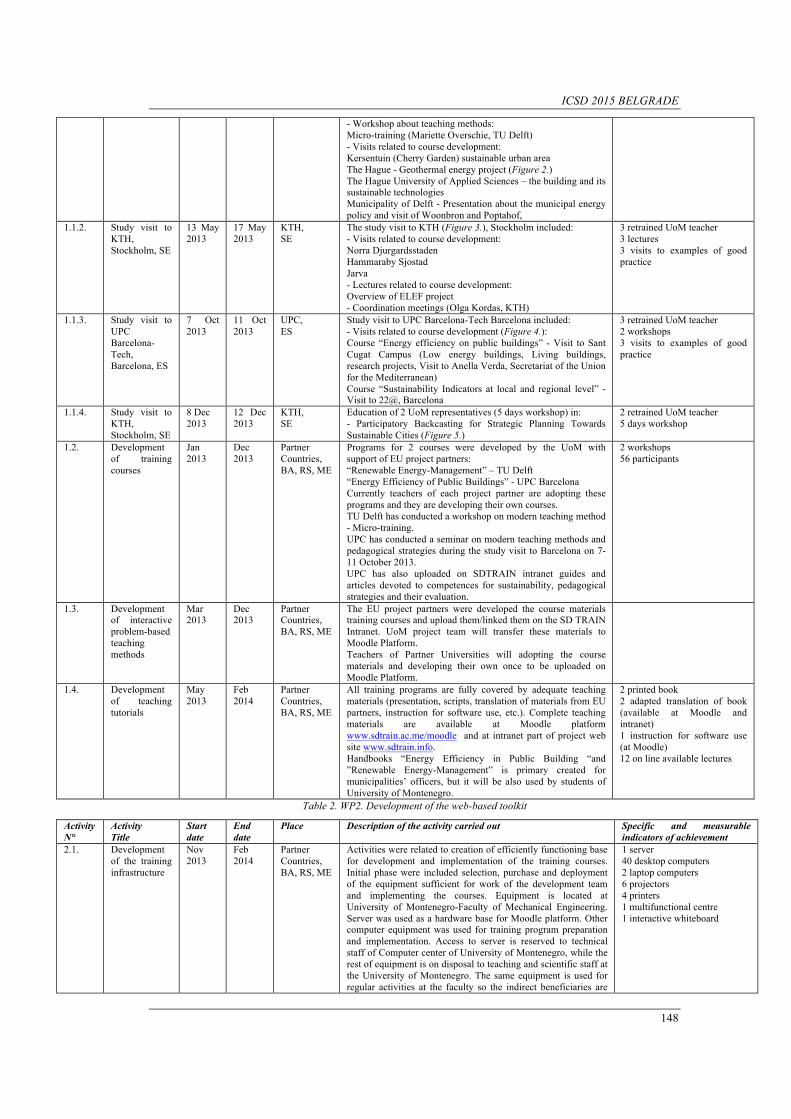
ICSD 2015 BELGRADE
148
- Workshop about teaching methods: Micro-training (Mariette Overschie, TU Delft) - Visits related to course development: Kersentuin (Cherry Garden) sustainable urban area The Hague - Geothermal energy project (Figure 2.) The Hague University of Applied Sciences – the building and its sustainable technologies Municipality of Delft - Presentation about the municipal energy policy and visit of Woonbron and Poptahof,
1.1.2. Study visit to KTH, Stockholm, SE
13 May 2013
17 May 2013
KTH, SE
The study visit to KTH (Figure 3.), Stockholm included: - Visits related to course development: Norra Djurgardsstaden Hammaraby Sjostad Jarva - Lectures related to course development: Overview of ELEF project - Coordination meetings (Olga Kordas, KTH)
3 retrained UoM teacher 3 lectures 3 visits to examples of good practice
1.1.3. Study visit to UPC Barcelona-Tech, Barcelona, ES
7 Oct 2013
11 Oct 2013
UPC, ES
Study visit to UPC Barcelona-Tech Barcelona included: - Visits related to course development (Figure 4.): Course “Energy efficiency on public buildings” - Visit to Sant Cugat Campus (Low energy buildings, Living buildings, research projects, Visit to Anella Verda, Secretariat of the Union for the Mediterranean) Course “Sustainability Indicators at local and regional level” - Visit to 22@, Barcelona
3 retrained UoM teacher 2 workshops 3 visits to examples of good practice
1.1.4. Study visit to KTH, Stockholm, SE
8 Dec 2013
12 Dec 2013
KTH, SE
Education of 2 UoM representatives (5 days workshop) in: - Participatory Backcasting for Strategic Planning Towards Sustainable Cities (Figure 5.)
2 retrained UoM teacher 5 days workshop
1.2. Development of training courses
Jan 2013
Dec 2013
Partner Countries, BA, RS, ME
Programs for 2 courses were developed by the UoM with support of EU project partners: “Renewable Energy-Management” – TU Delft “Energy Efficiency of Public Buildings” - UPC Barcelona Currently teachers of each project partner are adopting these programs and they are developing their own courses. TU Delft has conducted a workshop on modern teaching method - Micro-training. UPC has conducted a seminar on modern teaching methods and pedagogical strategies during the study visit to Barcelona on 7-11 October 2013. UPC has also uploaded on SDTRAIN intranet guides and articles devoted to competences for sustainability, pedagogical strategies and their evaluation.
2 workshops 56 participants
1.3. Development of interactive problem-based teaching methods
Mar 2013
Dec 2013
Partner Countries, BA, RS, ME
The EU project partners were developed the course materials training courses and upload them/linked them on the SD TRAIN Intranet. UoM project team will transfer these materials to Moodle Platform. Teachers of Partner Universities will adopting the course materials and developing their own once to be uploaded on Moodle Platform.
1.4. Development of teaching tutorials
May 2013
Feb 2014
Partner Countries, BA, RS, ME
All training programs are fully covered by adequate teaching materials (presentation, scripts, translation of materials from EU partners, instruction for software use, etc.). Complete teaching materials are available at Moodle platform www.sdtrain.ac.me/moodle and at intranet part of project web site www.sdtrain.info. Handbooks “Energy Efficiency in Public Building “and ”Renewable Energy-Management” is primary created for municipalities’ officers, but it will be also used by students of University of Montenegro.
2 printed book 2 adapted translation of book (available at Moodle and intranet) 1 instruction for software use (at Moodle) 12 on line available lectures
Table 2. WP2. Development of the web-based toolkit
Activity N°
Activity Title
Start date
End date
Place Description of the activity carried out Specific and measurable indicators of achievement
2.1. Development of the training infrastructure
Nov 2013
Feb 2014
Partner Countries, BA, RS, ME
Activities were related to creation of efficiently functioning base for development and implementation of the training courses. Initial phase were included selection, purchase and deployment of the equipment sufficient for work of the development team and implementing the courses. Equipment is located at University of Montenegro-Faculty of Mechanical Engineering. Server was used as a hardware base for Moodle platform. Other computer equipment was used for training program preparation and implementation. Access to server is reserved to technical staff of Computer center of University of Montenegro, while the rest of equipment is on disposal to teaching and scientific staff at the University of Montenegro. The same equipment is used for regular activities at the faculty so the indirect beneficiaries are
1 server 40 desktop computers 2 laptop computers 6 projectors 4 printers 1 multifunctional centre 1 interactive whiteboard
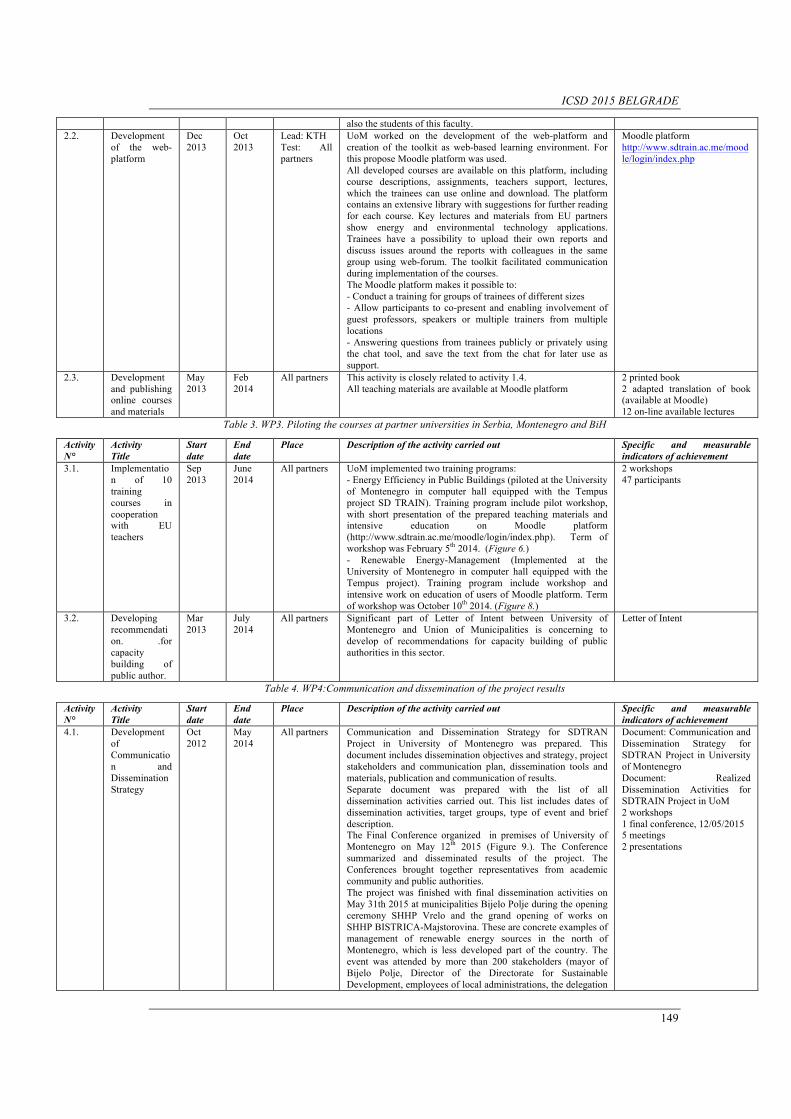
ICSD 2015 BELGRADE
149
also the students of this faculty. 2.2. Development
of the web-platform
Dec 2013
Oct 2013
Lead: KTH Test: All partners
UoM worked on the development of the web-platform and creation of the toolkit as web-based learning environment. For this propose Moodle platform was used. All developed courses are available on this platform, including course descriptions, assignments, teachers support, lectures, which the trainees can use online and download. The platform contains an extensive library with suggestions for further reading for each course. Key lectures and materials from EU partners show energy and environmental technology applications. Trainees have a possibility to upload their own reports and discuss issues around the reports with colleagues in the same group using web-forum. The toolkit facilitated communication during implementation of the courses. The Moodle platform makes it possible to: - Conduct a training for groups of trainees of different sizes - Allow participants to co-present and enabling involvement of guest professors, speakers or multiple trainers from multiple locations - Answering questions from trainees publicly or privately using the chat tool, and save the text from the chat for later use as support.
Moodle platform http://www.sdtrain.ac.me/moodle/login/index.php
2.3. Development and publishing online courses and materials
May 2013
Feb 2014
All partners This activity is closely related to activity 1.4. All teaching materials are available at Moodle platform
2 printed book 2 adapted translation of book (available at Moodle) 12 on-line available lectures
Table 3. WP3. Piloting the courses at partner universities in Serbia, Montenegro and BiH
Activity N°
Activity Title
Start date
End date
Place Description of the activity carried out Specific and measurable indicators of achievement
3.1. Implementation of 10 training courses in cooperation with EU teachers
Sep 2013
June 2014
All partners UoM implemented two training programs: - Energy Efficiency in Public Buildings (piloted at the University of Montenegro in computer hall equipped with the Tempus project SD TRAIN). Training program include pilot workshop, with short presentation of the prepared teaching materials and intensive education on Moodle platform (http://www.sdtrain.ac.me/moodle/login/index.php). Term of workshop was February 5th 2014. (Figure 6.) - Renewable Energy-Management (Implemented at the University of Montenegro in computer hall equipped with the Tempus project). Training program include workshop and intensive work on education of users of Moodle platform. Term of workshop was October 10th 2014. (Figure 8.)
2 workshops 47 participants
3.2. Developing recommendation. .for capacity building of public author.
Mar 2013
July 2014
All partners Significant part of Letter of Intent between University of Montenegro and Union of Municipalities is concerning to develop of recommendations for capacity building of public authorities in this sector.
Letter of Intent
Table 4. WP4:Communication and dissemination of the project results
Activity N°
Activity Title
Start date
End date
Place Description of the activity carried out Specific and measurable indicators of achievement
4.1. Development of Communication and Dissemination Strategy
Oct 2012
May 2014
All partners Communication and Dissemination Strategy for SDTRAN Project in University of Montenegro was prepared. This document includes dissemination objectives and strategy, project stakeholders and communication plan, dissemination tools and materials, publication and communication of results. Separate document was prepared with the list of all dissemination activities carried out. This list includes dates of dissemination activities, target groups, type of event and brief description. The Final Conference organized in premises of University of Montenegro on May 12th 2015 (Figure 9.). The Conference summarized and disseminated results of the project. The Conferences brought together representatives from academic community and public authorities. The project was finished with final dissemination activities on May 31th 2015 at municipalities Bijelo Polje during the opening ceremony SHHP Vrelo and the grand opening of works on SHHP BISTRICA-Majstorovina. These are concrete examples of management of renewable energy sources in the north of Montenegro, which is less developed part of the country. The event was attended by more than 200 stakeholders (mayor of Bijelo Polje, Director of the Directorate for Sustainable Development, employees of local administrations, the delegation
Document: Communication and Dissemination Strategy for SDTRAN Project in University of Montenegro Document: Realized Dissemination Activities for SDTRAIN Project in UoM 2 workshops 1 final conference, 12/05/2015 5 meetings 2 presentations
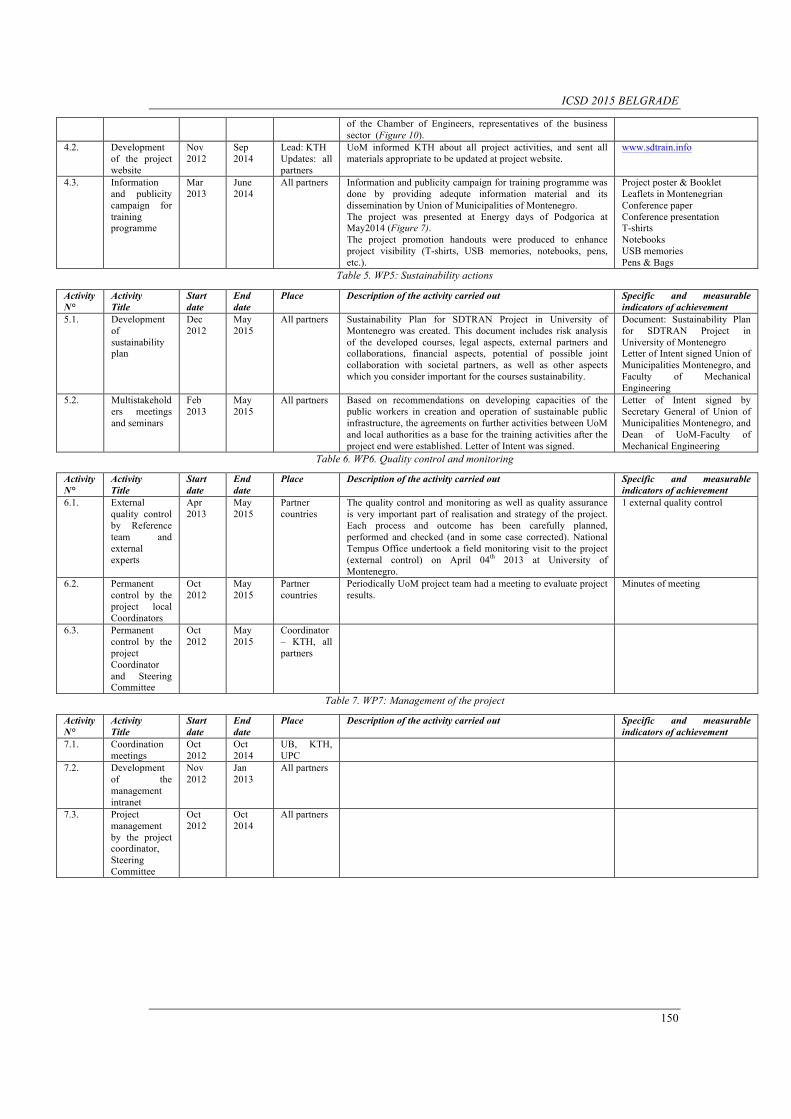
ICSD 2015 BELGRADE
150
of the Chamber of Engineers, representatives of the business sector (Figure 10).
4.2. Development of the project website
Nov 2012
Sep 2014
Lead: KTH Updates: all partners
UoM informed KTH about all project activities, and sent all materials appropriate to be updated at project website.
www.sdtrain.info
4.3. Information and publicity campaign for training programme
Mar 2013
June 2014
All partners Information and publicity campaign for training programme was done by providing adequte information material and its dissemination by Union of Municipalities of Montenegro. The project was presented at Energy days of Podgorica at May2014 (Figure 7). The project promotion handouts were produced to enhance project visibility (T-shirts, USB memories, notebooks, pens, etc.).
Project poster & Booklet Leaflets in Montenegrian Conference paper Conference presentation T-shirts Notebooks USB memories Pens & Bags
Table 5. WP5: Sustainability actions
Activity N°
Activity Title
Start date
End date
Place Description of the activity carried out Specific and measurable indicators of achievement
5.1. Development of sustainability plan
Dec 2012
May 2015
All partners Sustainability Plan for SDTRAN Project in University of Montenegro was created. This document includes risk analysis of the developed courses, legal aspects, external partners and collaborations, financial aspects, potential of possible joint collaboration with societal partners, as well as other aspects which you consider important for the courses sustainability.
Document: Sustainability Plan for SDTRAN Project in University of Montenegro Letter of Intent signed Union of Municipalities Montenegro, and Faculty of Mechanical Engineering
5.2. Multistakeholders meetings and seminars
Feb 2013
May 2015
All partners Based on recommendations on developing capacities of the public workers in creation and operation of sustainable public infrastructure, the agreements on further activities between UoM and local authorities as a base for the training activities after the project end were established. Letter of Intent was signed.
Letter of Intent signed by Secretary General of Union of Municipalities Montenegro, and Dean of UoM-Faculty of Mechanical Engineering
Table 6. WP6. Quality control and monitoring
Activity N°
Activity Title
Start date
End date
Place Description of the activity carried out Specific and measurable indicators of achievement
6.1. External quality control by Reference team and external experts
Apr 2013
May 2015
Partner countries
The quality control and monitoring as well as quality assurance is very important part of realisation and strategy of the project. Each process and outcome has been carefully planned, performed and checked (and in some case corrected). National Tempus Office undertook a field monitoring visit to the project (external control) on April 04th 2013 at University of Montenegro.
1 external quality control
6.2. Permanent control by the project local Coordinators
Oct 2012
May 2015
Partner countries
Periodically UoM project team had a meeting to evaluate project results.
Minutes of meeting
6.3. Permanent control by the project Coordinator and Steering Committee
Oct 2012
May 2015
Coordinator – KTH, all partners
Table 7. WP7: Management of the project
Activity N°
Activity Title
Start date
End date
Place Description of the activity carried out Specific and measurable indicators of achievement
7.1. Coordination meetings
Oct 2012
Oct 2014
UB, KTH, UPC
7.2. Development of the management intranet
Nov 2012
Jan 2013
All partners
7.3. Project management by the project coordinator, Steering Committee
Oct 2012
Oct 2014
All partners
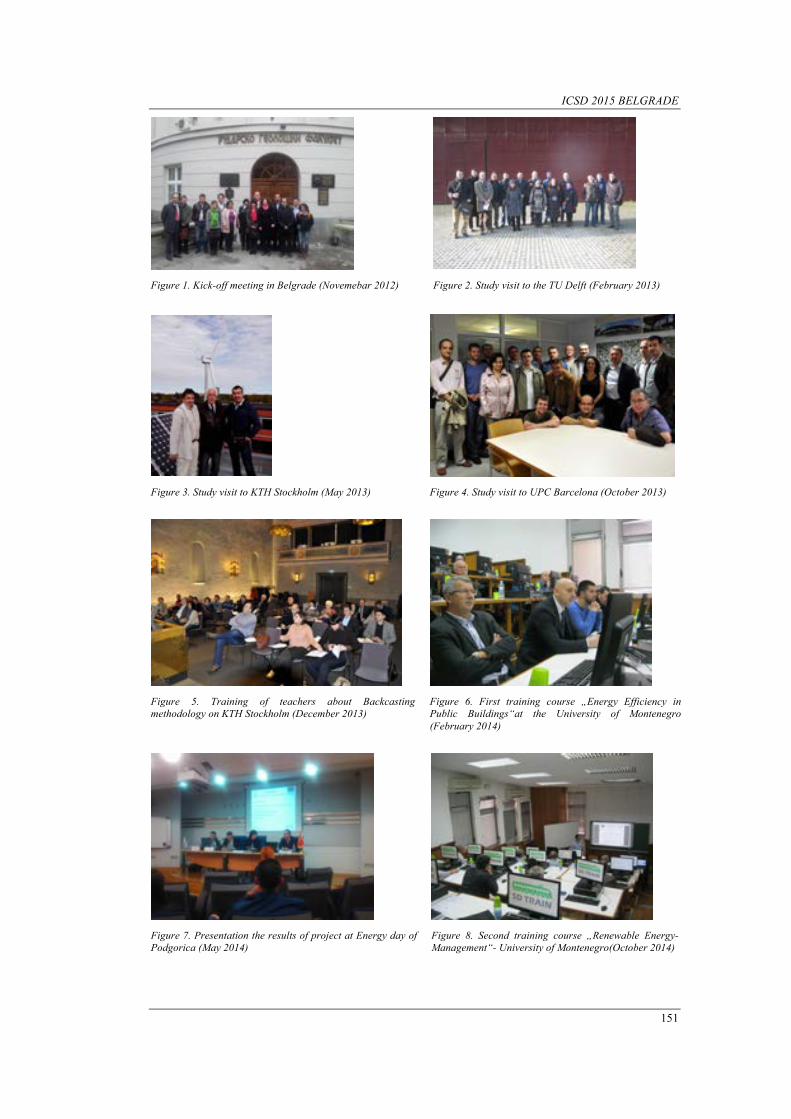
ICSD 2015 BELGRADE
151
Figure 1. Kick-off meeting in Belgrade (Novemebar 2012) Figure 2. Study visit to the TU Delft (February 2013)
Figure 3. Study visit to KTH Stockholm (May 2013) Figure 4. Study visit to UPC Barcelona (October 2013)
Figure 5. Training of teachers about Backcasting methodology on KTH Stockholm (December 2013)
Figure 6. First training course „Energy Efficiency in Public Buildings“at the University of Montenegro (February 2014)
Figure 7. Presentation the results of project at Energy day of Podgorica (May 2014)
Figure 8. Second training course „Renewable Energy-Management“- University of Montenegro(October 2014)
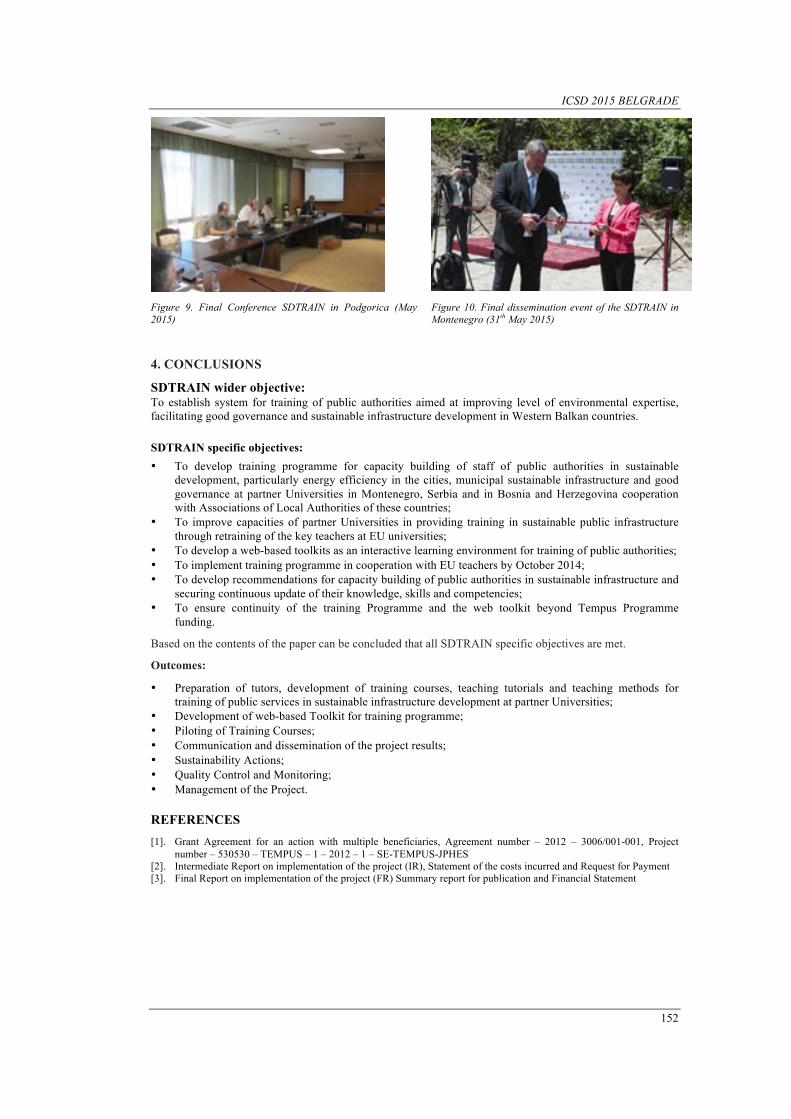
ICSD 2015 BELGRADE
152
Figure 9. Final Conference SDTRAIN in Podgorica (May 2015)
Figure 10. Final dissemination event of the SDTRAIN in Montenegro (31th May 2015)
4. CONCLUSIONS
SDTRAIN wider objective: To establish system for training of public authorities aimed at improving level of environmental expertise, facilitating good governance and sustainable infrastructure development in Western Balkan countries. SDTRAIN specific objectives: • To develop training programme for capacity building of staff of public authorities in sustainable
development, particularly energy efficiency in the cities, municipal sustainable infrastructure and good governance at partner Universities in Montenegro, Serbia and in Bosnia and Herzegovina cooperation with Associations of Local Authorities of these countries;
• To improve capacities of partner Universities in providing training in sustainable public infrastructure through retraining of the key teachers at EU universities;
• To develop a web-based toolkits as an interactive learning environment for training of public authorities; • To implement training programme in cooperation with EU teachers by October 2014; • To develop recommendations for capacity building of public authorities in sustainable infrastructure and
securing continuous update of their knowledge, skills and competencies; • To ensure continuity of the training Programme and the web toolkit beyond Tempus Programme
funding.
Based on the contents of the paper can be concluded that all SDTRAIN specific objectives are met.
Outcomes:
• Preparation of tutors, development of training courses, teaching tutorials and teaching methods for training of public services in sustainable infrastructure development at partner Universities;
• Development of web-based Toolkit for training programme; • Piloting of Training Courses; • Communication and dissemination of the project results; • Sustainability Actions; • Quality Control and Monitoring; • Management of the Project.
REFERENCES [1]. Grant Agreement for an action with multiple beneficiaries, Agreement number – 2012 – 3006/001-001, Project
number – 530530 – TEMPUS – 1 – 2012 – 1 – SE-TEMPUS-JPHES [2]. Intermediate Report on implementation of the project (IR), Statement of the costs incurred and Request for Payment [3]. Final Report on implementation of the project (FR) Summary report for publication and Financial Statement
ICSD 2015 BELGRADE
153
The AnaFlysis of Basic Concepts Related to Corporate Sustainability by Using N-Gram
Analysis Technique Mustafa Nuri Ural1, Özlem Tuna2
Abstract
Many studies on sustainability have been conducted since the first use of the term by Carl Von Carlowitz (1713). These studies have contributed to the historical development of the basic concepts related to sustainability. It is important to set forth the development process of the term and to reveal the topics which are stressed by the specialists in order to understand the concept correctly. With this study, all the books written in English and saved in ‘Google Books’ database starting from the 1900s to the recent years have been scanned with N-gram analysis and the evolution of corporate sustainability concept has been investigated. Firstly, the key words which are related to “corporate sustainability" and which will be used in the scan process were determined. Opinions of experts, 7 academicians made up of professors and associate professors who have worked on corporate sustainability and 3 managers coming from senior and mid-levels of business enterprises who are responsible for the sustainability policies of their companies have been taken and they were asked to write down 15 key words about corporate sustainability, in English or Turkish, which they thought were most related and important. The data gathered was coded and categorized. 17 keywords which have the highest frequency among the 137 concepts collected from the 10 participants were identified and decided on to be used in N-gram analysis. N-gram Viewer application has been used in its most basic form for the study. Meanwhile, the frequency of the concepts in the literature was determined. The analysis made it possible to reach to the information about these key words how the frequency of their use have increased or decreased over the years and the changes in the usage frequency rates of related terms to one another.
Keywords: Corporate Sustainability, N-gram, Retrospective Analysis.
1. INTRODUCTION
Sustainability which derives from “subtenir" in Latin means “to protect” or “to support from below” [1] and its history dates back to the industrial revolution. Mass production which showed a rapid increase with the industrial revolution resulted in over consumption of natural resources and this situation resulted in destruction of ecological balance. In this period, although societies were successful in realizing goals of industrialization and thus reinforcing economic development, they could not prevent the emergence of environmental and social problems. These unfavorable issues made taking some precautions necessary in order to make economic development sustainable. While insuring economic growth, endeavors made for the betterment of the environment and social settings resulted in the emergence of sustainable development. The contribution of real sector which is necessary for providing the conditions of sustainable development is defined as corporate sustainability.
In spite of the long time passed since the first use of sustainability concept, it is still a fresh and intensively studied field. The most suitable source for understanding the field correctly is the literature of the field. Frequency of the key words related to corporate sustainability in English resources which can be accessed
1Corresponding author: Gumushane University, Department of Software Engineering, Baglarbasi/Gumushane, Turkey. [email protected] 2Afyon Kocatepe University, Afyon Health School, Health Facilities Management, Afyonkarahisar, Turkey, [email protected]
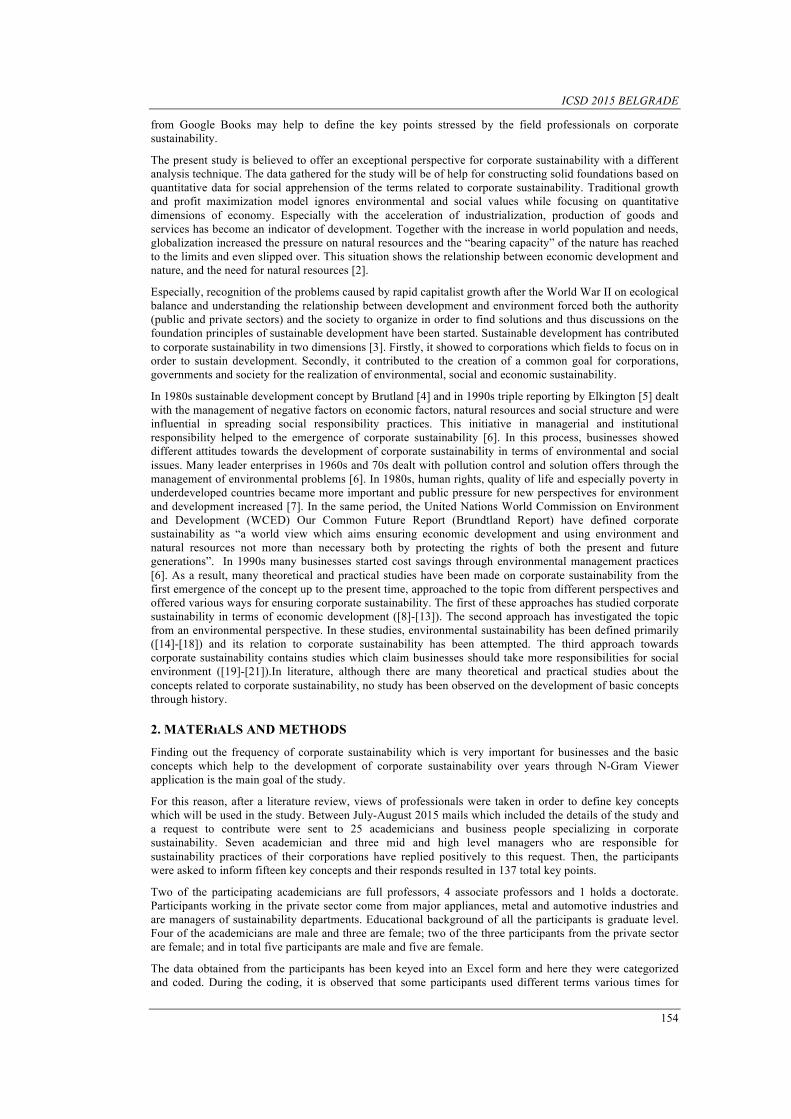
ICSD 2015 BELGRADE
154
from Google Books may help to define the key points stressed by the field professionals on corporate sustainability.
The present study is believed to offer an exceptional perspective for corporate sustainability with a different analysis technique. The data gathered for the study will be of help for constructing solid foundations based on quantitative data for social apprehension of the terms related to corporate sustainability. Traditional growth and profit maximization model ignores environmental and social values while focusing on quantitative dimensions of economy. Especially with the acceleration of industrialization, production of goods and services has become an indicator of development. Together with the increase in world population and needs, globalization increased the pressure on natural resources and the “bearing capacity” of the nature has reached to the limits and even slipped over. This situation shows the relationship between economic development and nature, and the need for natural resources [2].
Especially, recognition of the problems caused by rapid capitalist growth after the World War II on ecological balance and understanding the relationship between development and environment forced both the authority (public and private sectors) and the society to organize in order to find solutions and thus discussions on the foundation principles of sustainable development have been started. Sustainable development has contributed to corporate sustainability in two dimensions [3]. Firstly, it showed to corporations which fields to focus on in order to sustain development. Secondly, it contributed to the creation of a common goal for corporations, governments and society for the realization of environmental, social and economic sustainability.
In 1980s sustainable development concept by Brutland [4] and in 1990s triple reporting by Elkington [5] dealt with the management of negative factors on economic factors, natural resources and social structure and were influential in spreading social responsibility practices. This initiative in managerial and institutional responsibility helped to the emergence of corporate sustainability [6]. In this process, businesses showed different attitudes towards the development of corporate sustainability in terms of environmental and social issues. Many leader enterprises in 1960s and 70s dealt with pollution control and solution offers through the management of environmental problems [6]. In 1980s, human rights, quality of life and especially poverty in underdeveloped countries became more important and public pressure for new perspectives for environment and development increased [7]. In the same period, the United Nations World Commission on Environment and Development (WCED) Our Common Future Report (Brundtland Report) have defined corporate sustainability as “a world view which aims ensuring economic development and using environment and natural resources not more than necessary both by protecting the rights of both the present and future generations”. In 1990s many businesses started cost savings through environmental management practices [6]. As a result, many theoretical and practical studies have been made on corporate sustainability from the first emergence of the concept up to the present time, approached to the topic from different perspectives and offered various ways for ensuring corporate sustainability. The first of these approaches has studied corporate sustainability in terms of economic development ([8]-[13]). The second approach has investigated the topic from an environmental perspective. In these studies, environmental sustainability has been defined primarily ([14]-[18]) and its relation to corporate sustainability has been attempted. The third approach towards corporate sustainability contains studies which claim businesses should take more responsibilities for social environment ([19]-[21]).In literature, although there are many theoretical and practical studies about the concepts related to corporate sustainability, no study has been observed on the development of basic concepts through history.
2. MATERıALS AND METHODS
Finding out the frequency of corporate sustainability which is very important for businesses and the basic concepts which help to the development of corporate sustainability over years through N-Gram Viewer application is the main goal of the study.
For this reason, after a literature review, views of professionals were taken in order to define key concepts which will be used in the study. Between July-August 2015 mails which included the details of the study and a request to contribute were sent to 25 academicians and business people specializing in corporate sustainability. Seven academician and three mid and high level managers who are responsible for sustainability practices of their corporations have replied positively to this request. Then, the participants were asked to inform fifteen key concepts and their responds resulted in 137 total key points.
Two of the participating academicians are full professors, 4 associate professors and 1 holds a doctorate. Participants working in the private sector come from major appliances, metal and automotive industries and are managers of sustainability departments. Educational background of all the participants is graduate level. Four of the academicians are male and three are female; two of the three participants from the private sector are female; and in total five participants are male and five are female.
The data obtained from the participants has been keyed into an Excel form and here they were categorized and coded. During the coding, it is observed that some participants used different terms various times for

ICSD 2015 BELGRADE
155
defining the same concepts. The codes obtained have been ranked according to their frequency. Top 17 concepts which frequencies are more than 3 have been accepted for the study.
137 concepts obtained from the participants have been coded and the ones related to each other have been grouped according to certain categories. For classification, the literature of corporate sustainability has been taken as the main source. A specialist not involved in the study has gone over the concepts again and thus the concepts and categories formed have been validated.
Retrospective analysis in qualitative research methods have been used for the study. Through retrospective analysis which can be defined as a perspective aimed at past, the books recorded in “Google Books” since 1900s have been scanned with the help of N-Gram Viewer analysis application for the basic concepts obtained for corporate sustainability. N-Gram scanning service which is offered by Google can be accessed at https://books.google.com/ngrams. It is possible to make an N-Gram analysis on all the books recorded on the database of "Google Books" (books.google.com).
Figure 1. Google N viewer Interface
On this interface, keywords which will be scanned are entered into the first textbox. Checkbox near the textbox is for selecting if it is going to be case insensitive search. The first of the two textboxes in the next line is for the beginning of the time period for starting the search and the second one is for the end date. With the pulldown menu near this section, it is possible to select languages. The last setting before pressing “Search lots of books” button is defining the smoothing factor. With this factor, it is possible to decrease extreme rises and falls of the chart which will be drawn. Although it is possible to make more complex searches for the search phrase by using different operators, but these features are out of the present study.
Since N-gram analysis is expressed with as ratios, the increases in academic researches made in the last century do not affect the charts obtained. So, in our study, repetition percentage of the phrases, not the repetition number, is examined. The charts obtained have been used in the present study by taking screenshots. In cases where more than one phrase has been printed out on a single chart, some phrases with little frequency made legibility difficult. To make the chart more legible, such concepts have been multiplied with a constant and shown in the chart. Constant has been chosen as the same number and as powers of ten as possible to make every phrase legible. While studying these charts, the effect of the constant should not be disregarded.
The analyses were realized in September 2015 by using the interface prepared by Google. During N-gram analysis, the phrases which are desired to be on the same chart have been typed in together by using commas, and lower case has been chosen for all the concepts. The search covered the years between 1800 and 2008, preferred language was English with a smoothing factor of 3. Case sensitivity was unchecked. After the search, the graphs produced by Google were inspected. Among these graphs, the ones which contained years with zero levels on graphs have been searched again starting with the years where the charts start to activate. Also, because of the low frequency of some phrases in literature, some charts have been searched again where the rise and falls in time cannot be observed. By this way, it has been aimed to create charts which shows all the phrases legibly with observable rise and falls in time.
These charts on Google interface have been captured by using the screen capturing tool of Windows 8 and pasted on the text editor where the present report is prepared. Then by interpreting these charts, the report has been created.
M. Nuri URAL have contributed to the present study by designing the research process, defining the research method, working on Excel, working as N-Gram analysis method specialist and realizer, obtaining, interpreting the charts and reporting all these processes.
Özlem TUNA has contributed to the study as a corporate sustainability field specialist, obtaining the data, forming the literature review on theoretical foundations of sustainability, relating the charts to the historical development of corporate sustainability and reporting all these processes.
The main constraints of the study are that it does not cover the printed literature but starts with a search of English books written since 1800 which is the last date N-gram Viewer interface allows users to search, limited search of key phrases obtained from consulting ten specialists in the field, and scanning Google Books with only N-Gram Viewer application.
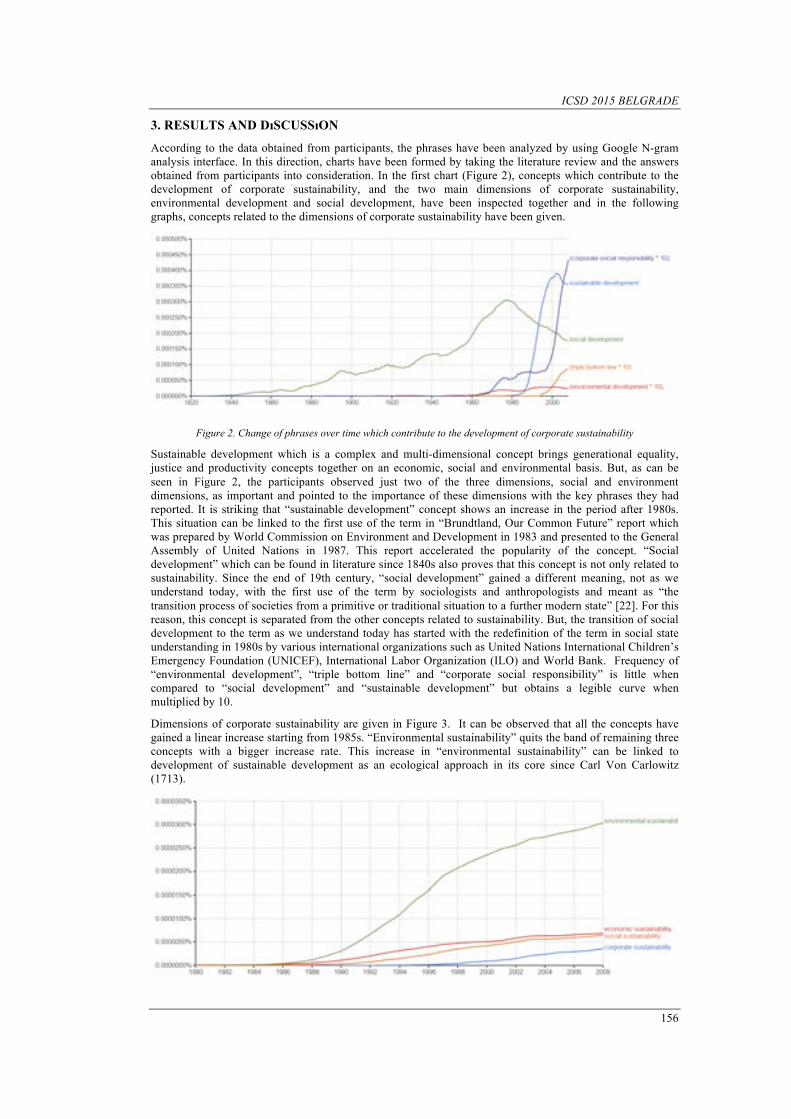
ICSD 2015 BELGRADE
156
3. RESULTS AND DıSCUSSıON
According to the data obtained from participants, the phrases have been analyzed by using Google N-gram analysis interface. In this direction, charts have been formed by taking the literature review and the answers obtained from participants into consideration. In the first chart (Figure 2), concepts which contribute to the development of corporate sustainability, and the two main dimensions of corporate sustainability, environmental development and social development, have been inspected together and in the following graphs, concepts related to the dimensions of corporate sustainability have been given.
Figure 2. Change of phrases over time which contribute to the development of corporate sustainability
Sustainable development which is a complex and multi-dimensional concept brings generational equality, justice and productivity concepts together on an economic, social and environmental basis. But, as can be seen in Figure 2, the participants observed just two of the three dimensions, social and environment dimensions, as important and pointed to the importance of these dimensions with the key phrases they had reported. It is striking that “sustainable development” concept shows an increase in the period after 1980s. This situation can be linked to the first use of the term in “Brundtland, Our Common Future” report which was prepared by World Commission on Environment and Development in 1983 and presented to the General Assembly of United Nations in 1987. This report accelerated the popularity of the concept. “Social development” which can be found in literature since 1840s also proves that this concept is not only related to sustainability. Since the end of 19th century, “social development” gained a different meaning, not as we understand today, with the first use of the term by sociologists and anthropologists and meant as “the transition process of societies from a primitive or traditional situation to a further modern state” [22]. For this reason, this concept is separated from the other concepts related to sustainability. But, the transition of social development to the term as we understand today has started with the redefinition of the term in social state understanding in 1980s by various international organizations such as United Nations International Children’s Emergency Foundation (UNICEF), International Labor Organization (ILO) and World Bank. Frequency of “environmental development”, “triple bottom line” and “corporate social responsibility” is little when compared to “social development” and “sustainable development” but obtains a legible curve when multiplied by 10.
Dimensions of corporate sustainability are given in Figure 3. It can be observed that all the concepts have gained a linear increase starting from 1985s. “Environmental sustainability” quits the band of remaining three concepts with a bigger increase rate. This increase in “environmental sustainability” can be linked to development of sustainable development as an ecological approach in its core since Carl Von Carlowitz (1713).
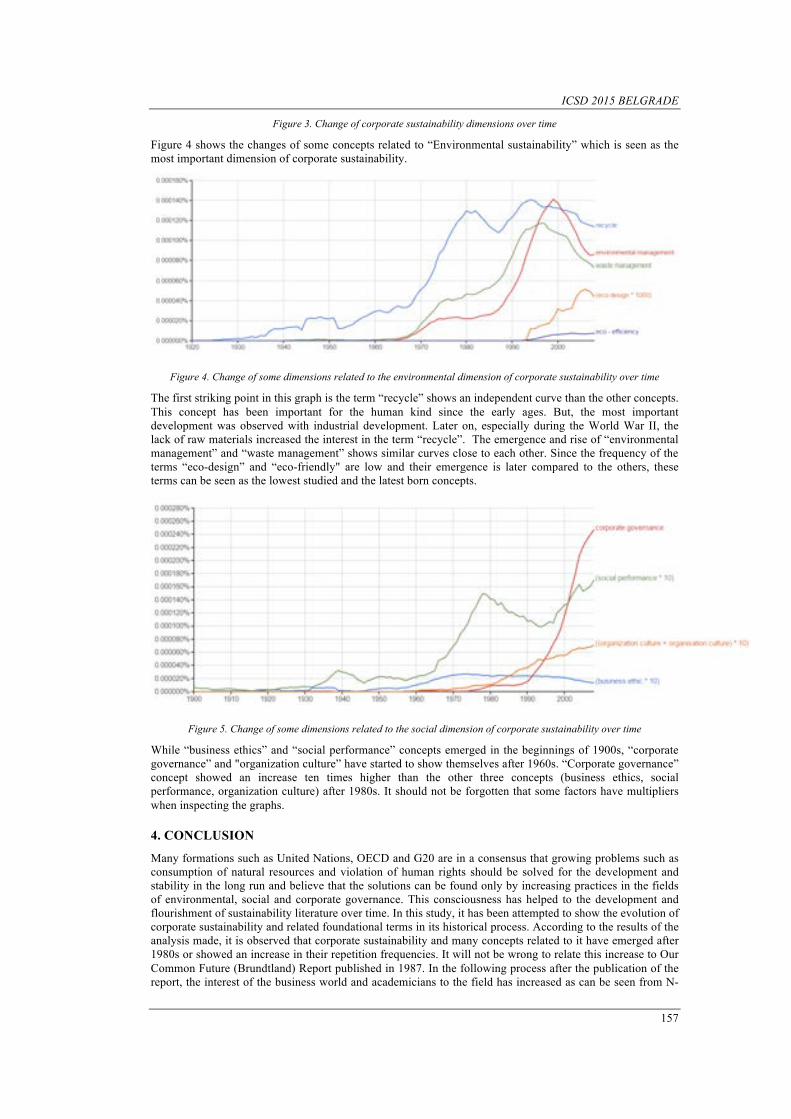
ICSD 2015 BELGRADE
157
Figure 3. Change of corporate sustainability dimensions over time
Figure 4 shows the changes of some concepts related to “Environmental sustainability” which is seen as the most important dimension of corporate sustainability.
Figure 4. Change of some dimensions related to the environmental dimension of corporate sustainability over time
The first striking point in this graph is the term “recycle” shows an independent curve than the other concepts. This concept has been important for the human kind since the early ages. But, the most important development was observed with industrial development. Later on, especially during the World War II, the lack of raw materials increased the interest in the term “recycle”. The emergence and rise of “environmental management” and “waste management” shows similar curves close to each other. Since the frequency of the terms “eco-design” and “eco-friendly" are low and their emergence is later compared to the others, these terms can be seen as the lowest studied and the latest born concepts.
Figure 5. Change of some dimensions related to the social dimension of corporate sustainability over time
While “business ethics” and “social performance” concepts emerged in the beginnings of 1900s, “corporate governance” and "organization culture” have started to show themselves after 1960s. “Corporate governance” concept showed an increase ten times higher than the other three concepts (business ethics, social performance, organization culture) after 1980s. It should not be forgotten that some factors have multipliers when inspecting the graphs.
4. CONCLUSION
Many formations such as United Nations, OECD and G20 are in a consensus that growing problems such as consumption of natural resources and violation of human rights should be solved for the development and stability in the long run and believe that the solutions can be found only by increasing practices in the fields of environmental, social and corporate governance. This consciousness has helped to the development and flourishment of sustainability literature over time. In this study, it has been attempted to show the evolution of corporate sustainability and related foundational terms in its historical process. According to the results of the analysis made, it is observed that corporate sustainability and many concepts related to it have emerged after 1980s or showed an increase in their repetition frequencies. It will not be wrong to relate this increase to Our Common Future (Brundtland) Report published in 1987. In the following process after the publication of the report, the interest of the business world and academicians to the field has increased as can be seen from N-
ICSD 2015 BELGRADE
158
gram analyses. But it is also necessary to note that the emergence and historical development of the terms social development and environmental development which played important roles in the birth and development of corporate sustainability is striking. Especially, social development whose roots date back to 1800s has been used by some anthropologists and sociologists (W. G. Sumner, H. Spencer and J. Hobhouse etc.) in a way which is not related to sustainability [22]. It is also possible to relate the rapid rise of these terms after 1980s to Brundtland Report published in 1987.
It is also observed that the participants coming from private sectors find concepts such as urbanization, population planning, industrialization in the correct region, efficient use of natural resources as important. This situation shows that sector workers approach to corporate sustainability in a macro dimension more than the academicians and they take it as sustainable development. It is possible to explain this situation with the regulations they faced both on national and international levels, import-export policies and the pressure coming from public and non-governmental organizations. Defining the frame and borders of corporate sustainability is important both for academic, private and other related sectors which work in this field. This situation indicates that there is a lack of research on the field. Moreover, training all the related parties in order to instill a consciousness of sustainability is another issue which should be emphasized.
The research objectives may be widened by including other languages or accessing different resources. Its also another subject for a research to explain the rise and decreases on the graphs. Also other terms or keywords may be inspected with the same research methodology. In this research the key words obtained by private sector and academicians are remarkably different. A research to clarify the reason seems to be necessary as well.
REFERENCES [1]. Muscoe, M. A Sustainable Community Profile, Places Journal, Vol. 9, Issue 3, 1995. [2]. Güney Ege Kalkınma Ajansı website http://www.geka.org.tr (Accessed on: 23.12.2014) [3]. İMKB İstatistik Müdürlüğü, “Sürdürülebilirlikle İlgili Özet Bilgiler”, Mayıs 2011.
http://www.imkb.gov.tr/datum/surdurulebilirlik/surdurulebilirlik_ozet_bilgiler.pdf (Accessed on: 21.06.2015). [4]. G. H. Bruntland, “Our Common Future”, Oxford University Press: Oxford, 1987. [5]. J. Elkington, Cannibals with Forks: The Triple Bottom Line of 21st Century Business, Oxford: Capstone Publishing,
1997. [6]. W. Young and F. Tilley, “Can Businesses Move Beyond Efficiency? The Shift Toward Effectiveness And Equity in
The Corporate Sustainability Debate”, Business Strategy and the Environment, Volume 15, Issue 6, pp. 402-415, 2006.
[7]. M. K. Linnenluecke, S. V. Russell and A. Griffiths, “Subcultures and Sustainability Practices: the Impact on Understanding Corporate Sustainability”, Business Strategy and the Environment, Vol. 18, pp. 439-452, 2009.
[8]. D. Doane and A. MacGillivray, “Economic Sustainability The Business of Staying in Business”, New Economics Foundation, The Sigma Project, March 2001.
[9]. J. Gassner, “Defining And Measuring Macroeconomic Sustainability—The Sustainable Economy Indices”, Clean Techn Environ Policy, Vol. 5, pp. 265–272, 2003.
[10]. A. Soppe, “Sustainable Corporate Finance”, Journal of Business Ethics 53, pp.213–224, 2004. [11]. U. Steger, A. Ionescu-Somers and O. Salzmann,"The Economic Foundations of Corporate Sustainability", Corporate
Governance, Vol. 7, Issue 2, pp.162 – 177, 2007. [12]. S. Bhattacharjee and J. Cruz “Economic Sustainability of Closed Loop Supply Chains: A Holistic Model for Decision
and Policy Analysis” Decision Support Systems, Vol. 77, pp.67–86, 2015. [13]. M.P. Dočekalova, A. Kocmanova and J. Koleňak, “Determination of Economic İndicators in The Context of
Corporate Sustainability Performance” , Verslas: Teorija ir praktika / Business: Theory and Practice, 16(1), pp.15–24,2015,
[14]. P. Shrıvastava, “The Role of Corporatıons in Achieving Ecologıcal Sustainability”, Academy of Management Review, Vol. 20, No. 4, pp.936-960, 1995.
[15]. Starik, M. & Rands, G. P. Weaving an integrated web: Multilevel and multisystem perspectives of ecologically sustainable organizations. Academy of Management Review, 20(4): 908-935, 1995.
[16]. Sharma, S. & Ruud, A. Editorial on the Path to Sustainabilty: Integrating Social Dimensions Into the Research and Practice of Environmental Management, Business Strategy and the Environment, 12: 205-214, 2003.
[17]. A. Schaefer, “Corporate Sustainability Integrating Enveronmental and Social Concorning”, Corporate Social Responsibility and Environmental Management, Vol. 11, pp.179-187, 2004.
[18]. E. Holden and K. Linnerud, “The Sustainable Development Area: Satisfying Basic Needs and Safeguarding Ecological Sustainability”, Sustainable Development, Vol. 15, pp.174–187. 2007
[19]. Jamali, D. Insights Into Triple Bottom Line Integration From A Learning Organization Perspective, Business Process Management Journal, Vol. 12 No. 6: 809-821, 2006.
[20]. C. Weingaertner and Å. Moberg, “Exploring Social Sustainability: Learning from Perspectives on Urban Development and Companies and Products”, Sustainable Development, 22, pp.122–133, 2014.
[21]. L.J.L. Veldhuizen at al., “A Method to Assess Social Sustainability of Capture Fisheries: an Application to a Norwegian Trawler”, Environmental Impact Assessment Review, Vol. 53 pp.31–39, 2015
[22]. J. Midgley, “Social Development Theory and Practice”, University of California – Berkeley, 2013.

ICSD 2015 BELGRADE
159
Technological Properties of Oblachinska, Ciganchica and Marela Sour Cherry Varieties
Bozhidar Ristovski1, Enise Sipahi1, Mirjana Bocevska1
Abstract Sour cherries (Prunus cerasus L.) are one of the most popular fruit, among the stone fruit species, due to their quality attributes and the content of health promoting compounds. The aim of the study was to evaluate some of the physical and chemical properties of the sour cherry varieties grown in Republic of Macedonia, that have major influence on the overall processing parameters. The morphological characteristics (shape, immensity, length, width, height and ratio of flesh to stones), Lab color parameters, and the contents of dry matter, ash, acids and sugars of three sour cherry varieties (Oblachinska of two regions, Ciganchica and Marela, harvested in season 2015) were assessed. Among the investigated varieties the sour cherries of Marela had the greatest dimensions and portion of the edible part of the fruit, and the most favorable sugar to acid ratio, compared to other analyzed varieties. The a* color parameter varied between 5.03 and 22.38 for the different fruit parts, and the b* parameter ranging from -4.16 to 5.36, was the lowest for those from Marela variety. Although, one of the Oblachinska sour cherries had the highest sugar and acid content, they together with those from Ciganchica variety had low maturity index (5.9 - 6.3).
Keywords: Chemical Composition, Color Characteristics, Morphological Properties, Sour Cherry.
1. INTRODUCTION
Sour cherries (Prunus cerasus L.) are perennial tree plants grown in many different varieties, in areas with mild climate, from the Mediterranean islands to northern parts of Europe and parts of Asia. They are well known to their fruits, the smallest among the stone fruits belonging to Rosaceae family [1]. The sour cherry fruits are one of the most popular in its class, due to their quality attributes and health promoting compounds. Their main quality characteristics are color, sweetness, sourness and firmness. Sour cherry fruits are rich sources of sugars, acids, vitamins (A, C, E, and K), minerals (Ca, P, K, Fe, Mg, and Se), aromatic compounds and biologically active ingredients [1], [2], [3]. Phenolics, as one of the main groups of phytochemicals in sour cherries, contribute to the sensory qualities of the fruit such as bitterness, astringency, color, flavour and odor [1], and have shown a wide range of health beneficial properties such anti-oxidant, anti-microbial, anti-inflammatory, anti-carcinogenic and neuroprotective effects [4]. Although these characteristics make them valuable products, only a small portion of sour cherries are consumed as fresh fruits. They are mainly processed into juices, purees, concentrates, jams, or as frozen or dried products, that are used as ingredients in confectionary, diary and beverage industry. Only a minor part of sour cherries are manufactured to wines, spirits or liqueurs [5]. During processing, the majority of phenolics and antioxidants present in sour cherries remain almost unchangable [6], [7]. The knowledge of these facts and increased awareness about the nutritional values of foods make consumption of sour cherry products very important in human nutrition. On the other hand, the physical properties of sour cherry fruits are of great importance in manipulation (harvesting, transporting sorting), processing (grading, prezervation relating to thermal treatment and mass transfer, packaging) and storage [8]. The overall properties of sour cherry fruits primarily depend of the variety, but also of the location where grown and growing season [9]. In the Balkan region many varieties of sour cherries grown. The most demand variety is Oblachinska due to its high quality. It is with small to medium size, red to dark-red appearance, medium firmness, and juicy, sour and aromatic flesh [10]. The variety Ciganchica is characterized by semi-sweet fruit with dark-red color, tasteful and pleasant aroma and
1Corresponding author: Ss. Cyril and Methodius University, Faculty of Technology and Metallurgy, Rudjer Boskovic 16, d1000 Skopje, Republic of Macedonia. [email protected]
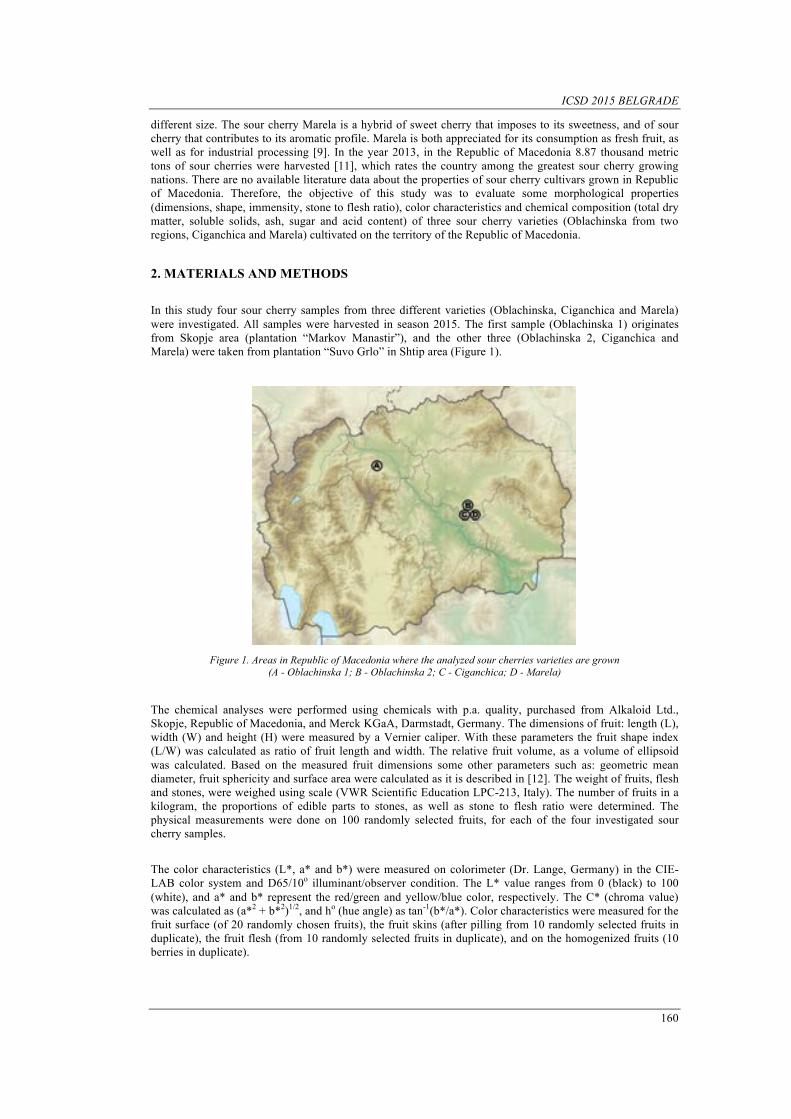
ICSD 2015 BELGRADE
160
different size. The sour cherry Marela is a hybrid of sweet cherry that imposes to its sweetness, and of sour cherry that contributes to its aromatic profile. Marela is both appreciated for its consumption as fresh fruit, as well as for industrial processing [9]. In the year 2013, in the Republic of Macedonia 8.87 thousand metric tons of sour cherries were harvested [11], which rates the country among the greatest sour cherry growing nations. There are no available literature data about the properties of sour cherry cultivars grown in Republic of Macedonia. Therefore, the objective of this study was to evaluate some morphological properties (dimensions, shape, immensity, stone to flesh ratio), color characteristics and chemical composition (total dry matter, soluble solids, ash, sugar and acid content) of three sour cherry varieties (Oblachinska from two regions, Ciganchica and Marela) cultivated on the territory of the Republic of Macedonia. 2. MATERIALS AND METHODS
In this study four sour cherry samples from three different varieties (Oblachinska, Ciganchica and Marela) were investigated. All samples were harvested in season 2015. The first sample (Oblachinska 1) originates from Skopje area (plantation “Markov Manastir”), and the other three (Oblachinska 2, Ciganchica and Marela) were taken from plantation “Suvo Grlo” in Shtip area (Figure 1).
Figure 1. Areas in Republic of Macedonia where the analyzed sour cherries varieties are grown
(A - Oblachinska 1; B - Oblachinska 2; C - Ciganchica; D - Marela) The chemical analyses were performed using chemicals with p.a. quality, purchased from Alkaloid Ltd., Skopje, Republic of Macedonia, and Merck KGaA, Darmstadt, Germany. The dimensions of fruit: length (L), width (W) and height (H) were measured by a Vernier caliper. With these parameters the fruit shape index (L/W) was calculated as ratio of fruit length and width. The relative fruit volume, as a volume of ellipsoid was calculated. Based on the measured fruit dimensions some other parameters such as: geometric mean diameter, fruit sphericity and surface area were calculated as it is described in [12]. The weight of fruits, flesh and stones, were weighed using scale (VWR Scientific Education LPC-213, Italy). The number of fruits in a kilogram, the proportions of edible parts to stones, as well as stone to flesh ratio were determined. The physical measurements were done on 100 randomly selected fruits, for each of the four investigated sour cherry samples.
The color characteristics (L*, a* and b*) were measured on colorimeter (Dr. Lange, Germany) in the CIE-LAB color system and D65/10o illuminant/observer condition. The L* value ranges from 0 (black) to 100 (white), and a* and b* represent the red/green and yellow/blue color, respectively. The C* (chroma value) was calculated as (a*2 + b*2)1/2, and ho (hue angle) as tan-1(b*/a*). Color characteristics were measured for the fruit surface (of 20 randomly chosen fruits), the fruit skins (after pilling from 10 randomly selected fruits in duplicate), the fruit flesh (from 10 randomly selected fruits in duplicate), and on the homogenized fruits (10 berries in duplicate).
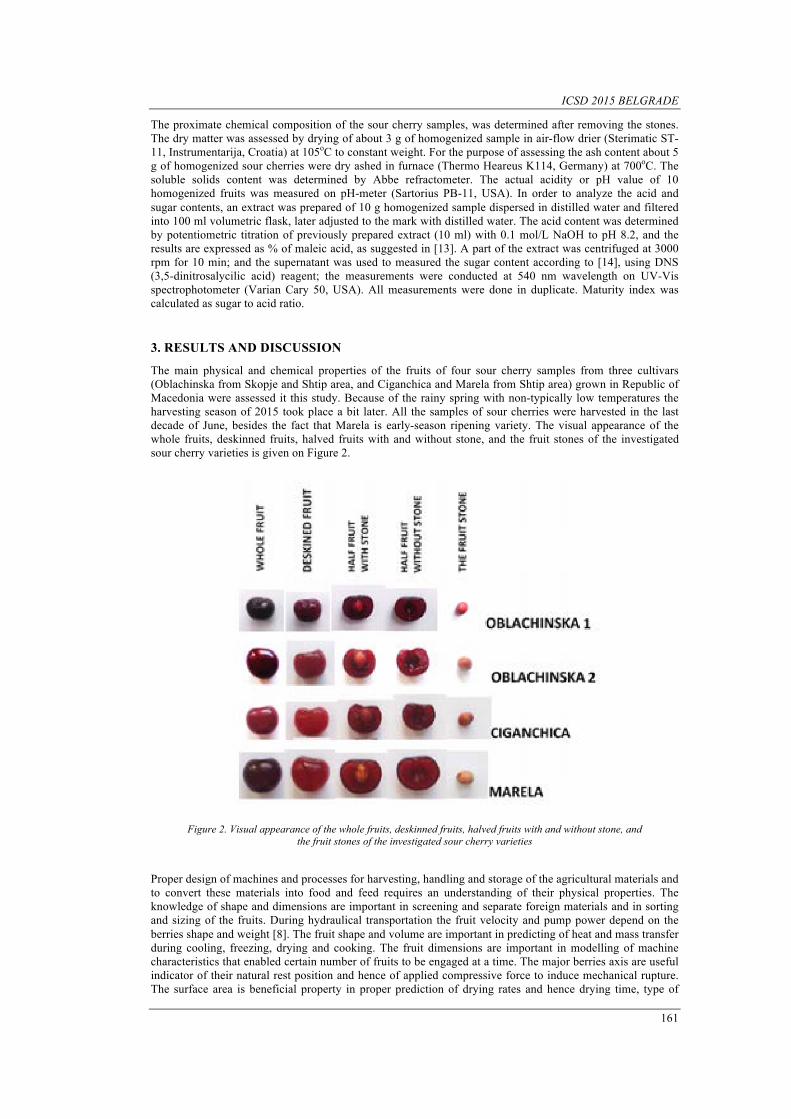
ICSD 2015 BELGRADE
161
The proximate chemical composition of the sour cherry samples, was determined after removing the stones. The dry matter was assessed by drying of about 3 g of homogenized sample in air-flow drier (Sterimatic ST-11, Instrumentarija, Croatia) at 105oC to constant weight. For the purpose of assessing the ash content about 5 g of homogenized sour cherries were dry ashed in furnace (Thermo Heareus K114, Germany) at 700oC. The soluble solids content was determined by Abbe refractometer. The actual acidity or pH value of 10 homogenized fruits was measured on pH-meter (Sartorius PB-11, USA). In order to analyze the acid and sugar contents, an extract was prepared of 10 g homogenized sample dispersed in distilled water and filtered into 100 ml volumetric flask, later adjusted to the mark with distilled water. The acid content was determined by potentiometric titration of previously prepared extract (10 ml) with 0.1 mol/L NaOH to pH 8.2, and the results are expressed as % of maleic acid, as suggested in [13]. A part of the extract was centrifuged at 3000 rpm for 10 min; and the supernatant was used to measured the sugar content according to [14], using DNS (3,5-dinitrosalycilic acid) reagent; the measurements were conducted at 540 nm wavelength on UV-Vis spectrophotometer (Varian Cary 50, USA). All measurements were done in duplicate. Maturity index was calculated as sugar to acid ratio.
3. RESULTS AND DISCUSSION
The main physical and chemical properties of the fruits of four sour cherry samples from three cultivars (Oblachinska from Skopje and Shtip area, and Ciganchica and Marela from Shtip area) grown in Republic of Macedonia were assessed it this study. Because of the rainy spring with non-typically low temperatures the harvesting season of 2015 took place a bit later. All the samples of sour cherries were harvested in the last decade of June, besides the fact that Marela is early-season ripening variety. The visual appearance of the whole fruits, deskinned fruits, halved fruits with and without stone, and the fruit stones of the investigated sour cherry varieties is given on Figure 2.
Figure 2. Visual appearance of the whole fruits, deskinned fruits, halved fruits with and without stone, and
the fruit stones of the investigated sour cherry varieties Proper design of machines and processes for harvesting, handling and storage of the agricultural materials and to convert these materials into food and feed requires an understanding of their physical properties. The knowledge of shape and dimensions are important in screening and separate foreign materials and in sorting and sizing of the fruits. During hydraulical transportation the fruit velocity and pump power depend on the berries shape and weight [8]. The fruit shape and volume are important in predicting of heat and mass transfer during cooling, freezing, drying and cooking. The fruit dimensions are important in modelling of machine characteristics that enabled certain number of fruits to be engaged at a time. The major berries axis are useful indicator of their natural rest position and hence of applied compressive force to induce mechanical rupture. The surface area is beneficial property in proper prediction of drying rates and hence drying time, type of
ICSD 2015 BELGRADE
162
dryer, but also in determination of water amounts required during the process of washing. On the other hand, the weight and volume of sour cherry fruits is important in design of efficient depitting procedure, especially in the case of products where the shape of the fruit should be retained after processing [4]. The yield of final product depends on the stone to flash ratio. The physical properties of the investigated sour cherries are given in Table 1.
Table 1. Physical characteristics of the investigated sour cherry varieties
Property Sour cherry variety Oblachinska 1 Oblachinska 2 Ciganchica Marela
Fruit length – L (cm) 1.611 1.643 1.652 2.011 Fruit width – W (cm) 1.797 1.856 1.854 2.165 Fruit height – H (cm) 1.535 1.523 1.586 1.886 Fruit shape index (L/W) 0.897 0.886 0.891 0.930 Geometric mean diameter (cm) 1.644 1.668 1.693 2.016 Degree of sphericity 1.020 1.016 1.026 1.005 Surface area (cm2) 8.496 8.751 9.012 12.774 Relative fruit volume (cm3) 2.335 2.442 2.550 4.303 Fruit weight (g) 3.041 3.325 3.582 5.526 Stone weight (g) 0.239 0.290 0.292 0.303 Edible part portion (%) 92.133 91.267 91.836 94.517 Stones portion (%) 7.867 8.733 8.164 5.483 Stone / flesh ratio 0.085 0.096 0.089 0.058 Fruits in 1000 g 330 301 280 181
Obvious differences for all assessed physical properties were observed between the sour cherries of variety Marela and the other two varieties. The fruit length and width of varieties Oblachinska 2 (1.643 cm and 1.856 cm, respectively) and Ciganchica (1.652 cm and 1.854 cm, respectively) were very similar but little higher than in Oblachinska 1 variety (1.611 cm and 1.797 cm, respectively). The dimensions and fruit shape index for Ciganchica and both Oblachinska variety samples were in range of those given in literature [15], [16]. The value of the geometric mean diameter was in range between 1.644 cm (for Oblachinska 1) and 2.016 cm (for Marela). These values are heigher than those for Oblachinska (1.589 cm) and Ciganchica (1.542 cm) grown in Cacak area in Serbia [10]. The lowest degree of sphericity had sour cherries of Marela variety (1.005), followed by Oblachinska 2 (1.016) and Oblachinska 1 (1.020), and the highest was for Ciganchica variety (1.026). All tested sour cherry samples were with different surface area that was in the range from 8.496 to 12.774 cm2. The relative volume of the fruits was different for all examined sour cherries, and varied between 2.34 and 2.55 cm3 for the varieties with small fruits (Oblachinska and Ciganchica), while for Marela it was 4.3 cm3. Fruit weight ranged between 3 and 3.6 g for the varieties with small fruits, while for the sour cherry variety Marela, with large fruits, it was about 5.5 g. The weights of fruits and stones of Oblachinska and Ciganchica are lower than those reported in literature [5], [15]. Smaller fruits are primarily processed into juice or jam, while the large fruits can be consumed both fresh and processed [7]. Although the stone weight of Marela variety was slightly higher, compared to those for Ciganchica and Oblachinska 2, the portion of edible part was the highest (94.5%). The number of fruits in 1 kg depends on fruit size and fruit weight, and it was 181 for sour cherries of Marela variety, 280 (Ciganchica), 301 (Oblachinska 2), and 330 for Oblachinska 1 variety.
Color is one of the indicators of maturity and important parameter for the commercial harvest date [10]. Furthermore, color properties are important during the processing of fruits, but also for predicting the color of the final product, as valuable quality attribute for the consumers. The color parameters L*, a* and b* give a state of lightness, redness or greenness and yellowness or blueness, respectively. The calculated value C* represents the color intensity, and the hue angle depicts how a common persons perceive the color [1]. The color characteristics for different parts of the investigated sour cherry varieties are presented in Table 2. The L* value of the fruit surface for all examined sour cherries varieties was much lower than those of flesh, skins and homegenized fruits. Thus, the surface of the fruits of Marela variety had the lowest lightness (12.02), followed by Oblachinska 1 (15.55), Oblachinska 2 (16.95) and Ciganchica (17.11), while the L* values for individual parts and homogenized sour cherries were between 23.94 and 27.96. However, a* value (redness) of the surface was higher than the skins, flesh and homogenized fruits. The a* parameter of the fruit surface of Marela was 20.14, and for Oblachinska 1 it was 22.38, but of the flesh ranged from 8.83 to 14.41, and the homogenized fruits from 5.81 to 11.92. The values of b* parameter for each part of examined sour cherry varrietes, except for the surface of Marela and Oblachinska 1 indicated on the presence of yellow color, the most prevalent in Ciganchica variety. The surface of Marela and Oblachinska 1 had a negative values for b* parameter (-4.16 and -2.76, respectively), indicating the prevalence of blue color. The color intensity, expressed by the C* values, was the highest on the fruit surface, lower for fruits flesh and homogenizates and the lowest for the skins, pilled from the fruits. The hue angle (ho) values of Oblachinska and Ciganchica
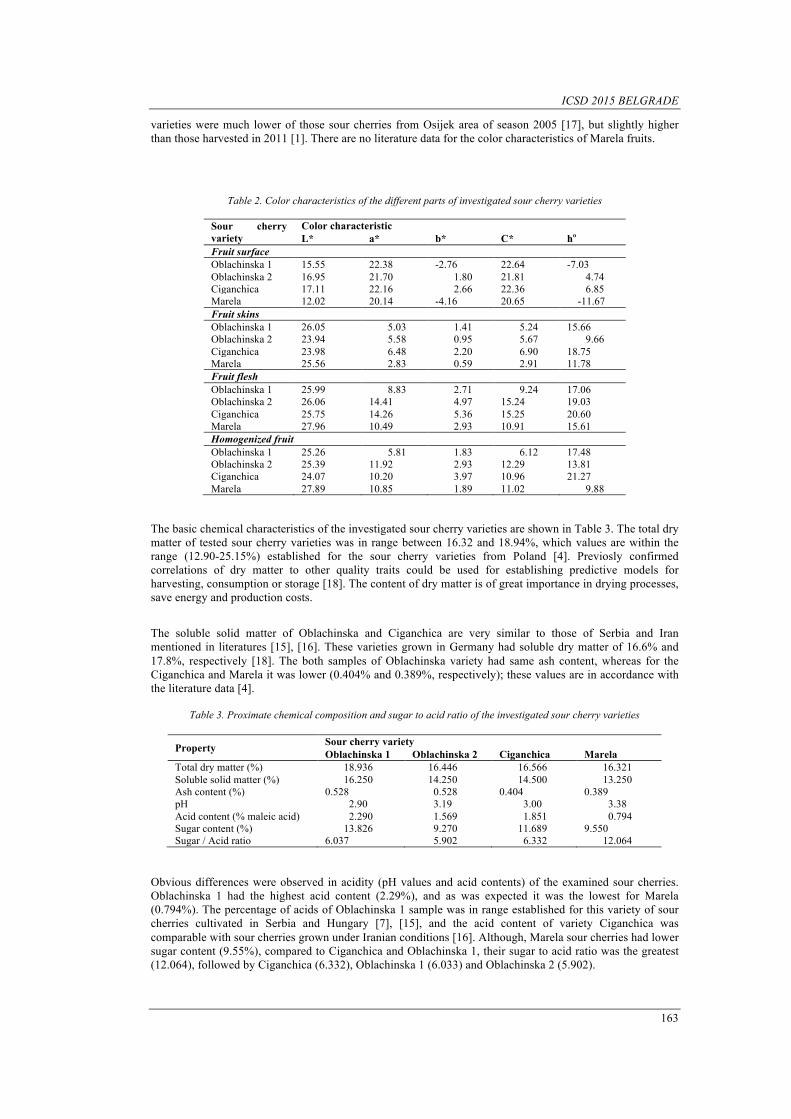
ICSD 2015 BELGRADE
163
varieties were much lower of those sour cherries from Osijek area of season 2005 [17], but slightly higher than those harvested in 2011 [1]. There are no literature data for the color characteristics of Marela fruits.
Table 2. Color characteristics of the different parts of investigated sour cherry varieties
Sour cherry variety
Color characteristic L* a* b* C* ho
Fruit surface Oblachinska 1 15.55 22.38 -2.76 22.64 -7.03 Oblachinska 2 16.95 21.70 1.80 21.81 4.74 Ciganchica 17.11 22.16 2.66 22.36 6.85 Marela 12.02 20.14 -4.16 20.65 -11.67 Fruit skins Oblachinska 1 26.05 5.03 1.41 5.24 15.66 Oblachinska 2 23.94 5.58 0.95 5.67 9.66 Ciganchica 23.98 6.48 2.20 6.90 18.75 Marela 25.56 2.83 0.59 2.91 11.78 Fruit flesh Oblachinska 1 25.99 8.83 2.71 9.24 17.06 Oblachinska 2 26.06 14.41 4.97 15.24 19.03 Ciganchica 25.75 14.26 5.36 15.25 20.60 Marela 27.96 10.49 2.93 10.91 15.61 Homogenized fruit Oblachinska 1 25.26 5.81 1.83 6.12 17.48 Oblachinska 2 25.39 11.92 2.93 12.29 13.81 Ciganchica 24.07 10.20 3.97 10.96 21.27 Marela 27.89 10.85 1.89 11.02 9.88
The basic chemical characteristics of the investigated sour cherry varieties are shown in Table 3. The total dry matter of tested sour cherry varieties was in range between 16.32 and 18.94%, which values are within the range (12.90-25.15%) established for the sour cherry varieties from Poland [4]. Previosly confirmed correlations of dry matter to other quality traits could be used for establishing predictive models for harvesting, consumption or storage [18]. The content of dry matter is of great importance in drying processes, save energy and production costs.
The soluble solid matter of Oblachinska and Ciganchica are very similar to those of Serbia and Iran mentioned in literatures [15], [16]. These varieties grown in Germany had soluble dry matter of 16.6% and 17.8%, respectively [18]. The both samples of Oblachinska variety had same ash content, whereas for the Ciganchica and Marela it was lower (0.404% and 0.389%, respectively); these values are in accordance with the literature data [4].
Table 3. Proximate chemical composition and sugar to acid ratio of the investigated sour cherry varieties
Property Sour cherry variety Oblachinska 1 Oblachinska 2 Ciganchica Marela
Total dry matter (%) 18.936 16.446 16.566 16.321 Soluble solid matter (%) 16.250 14.250 14.500 13.250 Ash content (%) 0.528 0.528 0.404 0.389 pH 2.90 3.19 3.00 3.38 Acid content (% maleic acid) 2.290 1.569 1.851 0.794 Sugar content (%) 13.826 9.270 11.689 9.550 Sugar / Acid ratio 6.037 5.902 6.332 12.064
Obvious differences were observed in acidity (pH values and acid contents) of the examined sour cherries. Oblachinska 1 had the highest acid content (2.29%), and as was expected it was the lowest for Marela (0.794%). The percentage of acids of Oblachinska 1 sample was in range established for this variety of sour cherries cultivated in Serbia and Hungary [7], [15], and the acid content of variety Ciganchica was comparable with sour cherries grown under Iranian conditions [16]. Although, Marela sour cherries had lower sugar content (9.55%), compared to Ciganchica and Oblachinska 1, their sugar to acid ratio was the greatest (12.064), followed by Ciganchica (6.332), Oblachinska 1 (6.033) and Oblachinska 2 (5.902).
ICSD 2015 BELGRADE
164
Parameters like acid and sugar content, and their ratio are very important in determination of fruit quality. This ratio provides information about the balance of sugars and acids in the fruit, determines fruit flavour harmony, which is important in choosing a particular sour cherry variety for fresh consumption [5], but also affects on the resistance and tolerance of fruits against diseases [16]. Cultivars with sour and bitter taste due to the high acid content and low pH are used in confectionary [7]. Overall, the differences among the varieties and within the same varieties grown in different areas are due to genotypic variabilities, climatic conditions, environmental factors, harvest, and maturity stage [4], [10].
4. CONCLUSIONS
This type of study of the physical and chemical characteristics of the sour cherry varieties is first in Republic of Macedonia. The obtained data could be useful especially for the processing industry in Republic of Macedonia, and for the consumers as well. Marela had the largest fruit size and the highest fruit weight, but also favorable sugar to acid ratio, in contrast to sour cherries of Oblachinska variety. Ciganchica was with the highest degree of sphericity, but the other physical and chemical properties were between the values observed for Oblachinska and Marela. All examined sour cherries had attractive color. Further investigations in terms of assessing the technological characteristics of the same sour cherry varieties in next few harvesting seasons, and studying the anthocyanins and other polyphenolics, are necessary in order to get more precise and reliable data. REFERENCES
M. Viljevac, K. Dugalić, V. Juruković, I. Mihaljević, V. Tomaš, B. Puškar, H. Lepeduš, R. Sudar, and Z. Juruković, “Relation between polyphenols content and skin colour in sour cherry fruits,” J. Agric. Sci., vol. 57, No. 2, pp. 57–67, 2012.
S. S. Mitić, M. V. Obradović, M. N. Mitić, D. A. Kostić, A. N. Pavlović, S. B. Tošić, and M. D. Stojković, “Elemental composition of various sour cherry and table grape cultivars using inductively coupled plasma atomic emission spectrometry method (ICP-OES),” Food Anal. Methods, vol. 5, pp. 279–286, 2012.
B. Levaj, V. Dragović-Uzelac, K. Delonga, K. Kovačević Ganić, M. Banović, and D. Bursać Kovačević, “Polyphenols and volatiles in fruits of two sour cherry cultivars, some berry fruits and their jams,” Food Technol. Biotechnol., vol. 48, No. 4, pp. 538–547, 2010.
A. Wojdyło, P. Nowicka, P. Laskowski, and J. Oszmiański, “Evaluation of sour cherry (Prunus cerasus L.) fruits for their polyphenol content, antioxidant properties, and nutritional components,” J. Agric. Food Chem., vol. 62, pp. 12332-12345, 2014.
C. Grafe, and M. Schuster, “Physicochemical characterization of fruit quality traits in a German sour cherry collection,” Sci. Hortic., vol. 180, pp. 24-31, 2014.
G. Toydemir, E. Capanoglu, E., M. V. G. Roldan, R. C. H. de Vos, D. Boyacioglu, R. D. Hall, and J. Beekwilder, “Industrial processing effects on phenolic compounds in sour cherry fruit,” Food Res. Int., vol. 53, pp. 218–225, 2013.
N. Papp, B. Szilvássy, L. Abrankó, T. Szabó, P. Pfeiffer, Z. Szabó, J. Nyéki, S. Ercisli, E. Stefanovits-Bányai, and A. Hegedűs, “Main quality attributes and antioxidants in hungarian sour cherries,” Int. J. Food Sci. Technol., vol. 45, pp. 395–402, 2010.
M. Naderiboldaji, A. Khadivi khub, A. Tabatabaeefar, M. Ghasemi Varnamkhasti, and Z. Zamani, “Some physical properties of sweet cherry (Prunus avium L.) fruit,” Am-Euras. J. Agric. Environ. Sci., vol. 3, No. 4, pp. 513–520, 2008.
M. N. Mitić, M. V. Obradović, D. A. Kostić, R. J. Micić, and E. T. Pecev, “Polyphenol content and antioxidant activity of sour cherries from Serbia,” Chem. Ind. Chem. Eng. Q., vol. 18, No. 1, pp. 53–62, 2012.
T. Milošević, and N. Milošević, “Fruit quality attributes of sour cherry cultivars,” ISRN Agronomy, vol. 2012, Article ID 593981, 5 pages, 2012.
Anonymous. (2015) Statistics Division, October 19, 2015. [Online]. Available: http://faostat3.fao.org/browse/Q/QC/E F. Demir, H. Doğan, M. Özcan, and H. Haciseferoğullari, “Nutritional and physical properties of hackberry (Celtis
australis L.),” J. Food Eng., vol. 54, pp. 241–247, 2012. J. E. Friedrich, “Titratable activity of acid tastants,” Curr. Protoc. Food Analyt. Chem., pp. G2.1.1–G2.1.7, 2001. G. L. Miller, “Use of dinitrosalicylic acid reagent for determination of reducing sugars,” Anal. Chem., vol. 31, pp. 426–428,
1959. V. Rakonjac, M. Fotirić Akšić, D. Nikolić, D. Milatović, and S. Čolić, “Morphological characterization of ‘Oblačinska’
sour cherry by multivariate analysis,” Sci. Hortic., vol. 125, pp. 679–684, 2010. M. Ansari, and G. H. Davarynejad, “Marked improvement of Hungarian sour cherries by cross-pollination II: fruit quality,”
Asian J. Plant Sci., vol. 7, No. 8, pp. 771–774, 2008. S. Pedišić, B. Levaj, V. Dragović-Uzelac, D. Škevin, and M. Skenderović Babojelić, “Color parameters and total
anthocyanins of sour cherries (Prunus cerasus L.) during ripening,” Agric. Conspec. Sci., vol. 74, No. 3, pp. 259–262, 2009.
C. Grafe, M. Höfer, M. Schuster, “Evaluation of dry matter in sour cherry (Prunus cerasus L.),” Acta Hortic., No. 839, pp. 281–286, 2009.

ICSD 2015 BELGRADE
165
Simulation of Biogas Counter Flow Diffusion Flame Under Several Operation Conditions of
Composition and Pressure Abdelbaki Mameri *1, Fouzi Tabet 2, Ammar Hadef 1
Abstract This study addresses the influence of several operating conditions (composition and ambient pressure) on biogas diffusion flame structure and NO emissions with particular attention on chemical and thermal effect of CO2. The biogas flame is modeled by a counter flow diffusion flame and analyzed in mixture fraction space using flamelet approach. The GRI Mech-3.0 mechanism that involves 53 species and 325 reactions is adopted for the oxidation chemistry. It has been observed that flame properties are very sensitive to biogas composition and pressure. CO2 addition decreases flame temperature, mass fraction of chain carrier radicals (O,H and OH) and index NO emission. Added CO2 may participate in chemical reaction due to thermal dissociation; excessively supplied CO2 plays the role of pure diluent. Pressure rise reduces flame thickness, radiation losses and dissociation amount. At high pressure, recombination reactions coupled with chain carrier radicals reduction, diminishes NO mass fraction.
Keywords: biogas combustion, counterflow diffusion flames, CO chemical effect, No emissions.
1. INTRODUCTION
Biogas is composed (by volume) mainly of methane (CH4 : 40%-70%), carbon dioxide (CO2 : 60%-30%), smaller amount of hydrogen sulphide (H2S : 1000-5000 ppm), moistures and siloxanes. Carbon dioxide CO2 in biogas (30% to 60%) can act as a diluent which reduces heating value, laminar burning velocity, flame stability and flammability range [1]. Research activities on biogas as a fuel are performed in several configurations (laboratory flames, gas turbines, thermal combustion engines, etc.). In the following, the main results obtained are summarized. A simulation analysis of biogas diffusion flame, using full and reduced mechanism, was conducted on blends of CH4 and CO2 by Saeed Jahangirian et al [2] to study the dioxide concentration effects on flame structure. It was shown that the reduced mechanism poorly tracks the minor species and chain branching radicals. The computations done with the full mechanism suggested that biogas may be beneficial for soot suppression. Nathan and Stone [3] conducted an experimental study to measure the laminar flame velocity of methane/carbon dioxide with air under the following conditions: ambient pressure up to 18 bars, injection temperature up to 660 K, carbon dioxide concentration up to 40% and equivalence ratio ranges from 0.7 to 1.4. The results showed that low laminar burning velocity exist at high pressure. Burning velocity increased and temperature decreased with CO2 addition. In biogas fuelled HCCI engine, and to increase operating range, Iván D. Bedoya et al. [4] have studied experimentally three parameters: oxygen enrichment, gasoline pilot port injection and delayed combustion time. Results showed that oxygen content in air above 27% combined with higher inlet absolute pressure lead to more stabilized combustion at low equivalence ratios. Gasoline pilot port injection strongly improved auto-ignition properties of biogas/air mixture and decreased HC and CO emissions at low load limit. Delayed combustion within certain limits increased IMEPg (gross Indicated Mean Effective Pressure) and reduced ringing intensities. Stability of turbulent non-premixed biogas flame for turbomachinery applications under a wide range of coflow, swirl
*1Corresponding author: Faculté des sciences et sciences appliquées, FSSA. Dept. du Génie Mécanique, Université Larbi Ben M’hidi, Oum El Bouaghi, BP 358 04000, Algérie. E-mail : [email protected] 2DBFZ (Deutsches Biomasseforschungszentrum gemeinnützige GmbH), Torgauer Straße 116 D-04347 Leipzig, Germany.
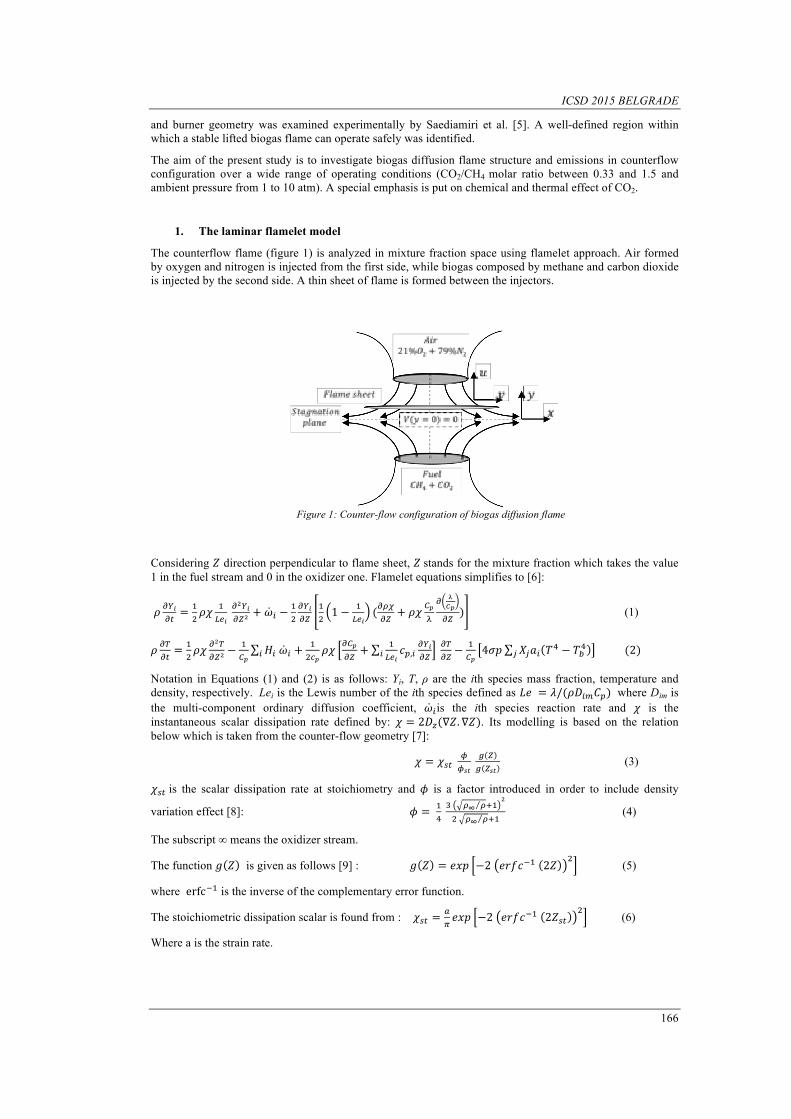
ICSD 2015 BELGRADE
166
and burner geometry was examined experimentally by Saediamiri et al. [5]. A well-defined region within which a stable lifted biogas flame can operate safely was identified.
The aim of the present study is to investigate biogas diffusion flame structure and emissions in counterflow configuration over a wide range of operating conditions (CO2/CH4 molar ratio between 0.33 and 1.5 and ambient pressure from 1 to 10 atm). A special emphasis is put on chemical and thermal effect of CO2.
1. The laminar flamelet model
The counterflow flame (figure 1) is analyzed in mixture fraction space using flamelet approach. Air formed by oxygen and nitrogen is injected from the first side, while biogas composed by methane and carbon dioxide is injected by the second side. A thin sheet of flame is formed between the injectors.
Considering ! direction perpendicular to flame sheet, ! stands for the mixture fraction which takes the value 1 in the fuel stream and 0 in the oxidizer one. Flamelet equations simplifies to [6]:
! !!!!" =!! !"
!!"!
!!!!!!! + !! −
!!!!!!"
!! 1 − !
!"!(!"#!" + !" !!
!! !
!!!" ) (1)
! !"!" =!! !"
!!!!!! −
!!!
!! !!! + !!!!
!" !!!!" +
!!"!!!,! !!!!"! !"!" −
!!!
4!" !!!! !! − !!!! (2)
Notation in Equations (1) and (2) is as follows: Yi, T, ρ are the ith species mass fraction, temperature and density, respectively. Lei is the Lewis number of the ith species defined as !" = !/(!!!"!!) where Dim is the multi-component ordinary diffusion coefficient, !!is the ith species reaction rate and ! is the instantaneous scalar dissipation rate defined by: ! = 2!!(∇!.∇!). Its modelling is based on the relation below which is taken from the counter-flow geometry [7]:
! = !!" !!!" ! !! !!"
(3)
!!" is the scalar dissipation rate at stoichiometry and ! is a factor introduced in order to include density
variation effect [8]: ! = !! ! !! !!! !
! !! !!! (4)
The subscript ∞ means the oxidizer stream.
The function ! ! is given as follows [9] : ! ! = !"# −2 !"#!!! 2! ! (5)
where erfc!! is the inverse of the complementary error function.
The stoichiometric dissipation scalar is found from : !!" = !! !"# −2 !"#!!! 2!!"
! (6)
Where a is the strain rate.
Figure 1: Counter-flow configuration of biogas diffusion flame
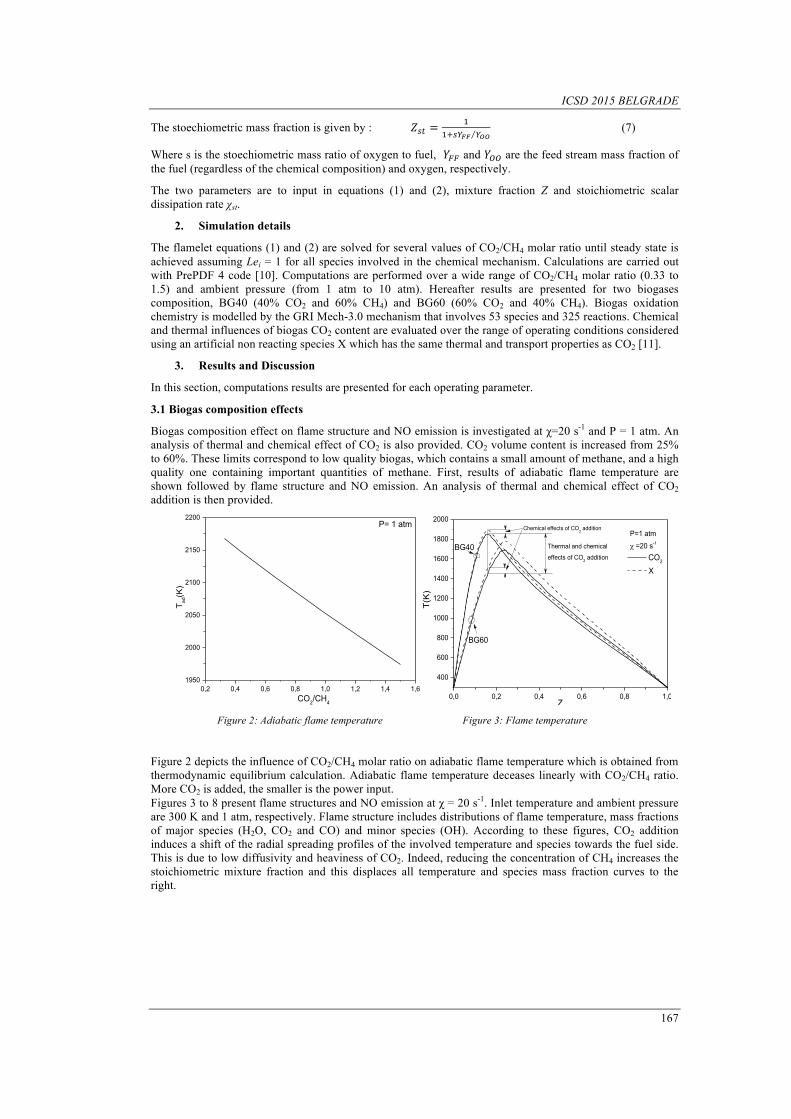
ICSD 2015 BELGRADE
167
The stoechiometric mass fraction is given by : !!" = !!!!!!! !!!
(7)
Where s is the stoechiometric mass ratio of oxygen to fuel, !!! and !!! are the feed stream mass fraction of the fuel (regardless of the chemical composition) and oxygen, respectively.
The two parameters are to input in equations (1) and (2), mixture fraction Z and stoichiometric scalar dissipation rate χst.
2. Simulation details
The flamelet equations (1) and (2) are solved for several values of CO2/CH4 molar ratio until steady state is achieved assuming Lei = 1 for all species involved in the chemical mechanism. Calculations are carried out with PrePDF 4 code [10]. Computations are performed over a wide range of CO2/CH4 molar ratio (0.33 to 1.5) and ambient pressure (from 1 atm to 10 atm). Hereafter results are presented for two biogases composition, BG40 (40% CO2 and 60% CH4) and BG60 (60% CO2 and 40% CH4). Biogas oxidation chemistry is modelled by the GRI Mech-3.0 mechanism that involves 53 species and 325 reactions. Chemical and thermal influences of biogas CO2 content are evaluated over the range of operating conditions considered using an artificial non reacting species X which has the same thermal and transport properties as CO2 [11].
3. Results and Discussion
In this section, computations results are presented for each operating parameter.
3.1 Biogas composition effects
Biogas composition effect on flame structure and NO emission is investigated at χ=20 s-1 and P = 1 atm. An analysis of thermal and chemical effect of CO2 is also provided. CO2 volume content is increased from 25% to 60%. These limits correspond to low quality biogas, which contains a small amount of methane, and a high quality one containing important quantities of methane. First, results of adiabatic flame temperature are shown followed by flame structure and NO emission. An analysis of thermal and chemical effect of CO2 addition is then provided.
0,2 0,4 0,6 0,8 1,0 1,2 1,4 1,6
1950
2000
2050
2100
2150
2200
T ad(K
)
CO2/CH4
P= 1 atm
0,0 0,2 0,4 0,6 0,8 1,0
400
600
800
1000
1200
1400
1600
1800
2000
BG60
BG40
Chemical effects of CO2 addition
T(K
)
Z
P=1 atmχ =20 s-1
CO2
X
Thermal and chemical
effects of CO2 addition
Figure 2: Adiabatic flame temperature Figure 3: Flame temperature
Figure 2 depicts the influence of CO2/CH4 molar ratio on adiabatic flame temperature which is obtained from thermodynamic equilibrium calculation. Adiabatic flame temperature deceases linearly with CO2/CH4 ratio. More CO2 is added, the smaller is the power input. Figures 3 to 8 present flame structures and NO emission at χ = 20 s-1. Inlet temperature and ambient pressure are 300 K and 1 atm, respectively. Flame structure includes distributions of flame temperature, mass fractions of major species (H2O, CO2 and CO) and minor species (OH). According to these figures, CO2 addition induces a shift of the radial spreading profiles of the involved temperature and species towards the fuel side. This is due to low diffusivity and heaviness of CO2. Indeed, reducing the concentration of CH4 increases the stoichiometric mixture fraction and this displaces all temperature and species mass fraction curves to the right.
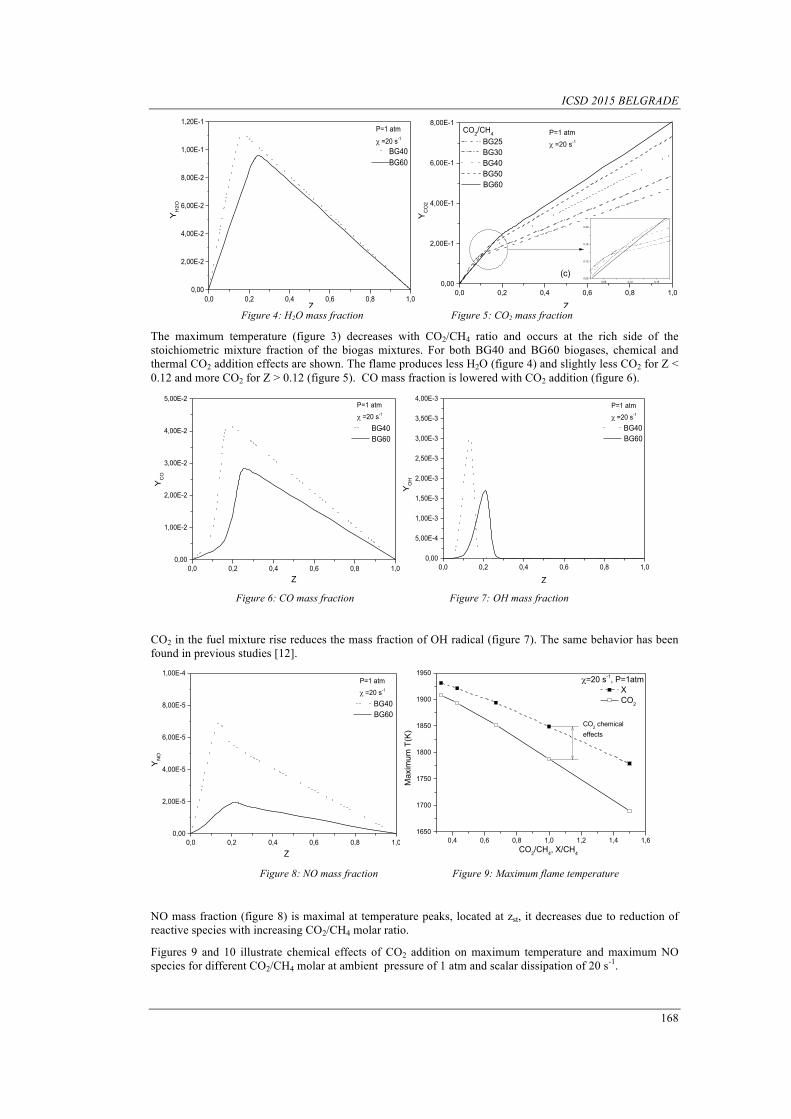
ICSD 2015 BELGRADE
168
0,0 0,2 0,4 0,6 0,8 1,00,00
2,00E-2
4,00E-2
6,00E-2
8,00E-2
1,00E-1
1,20E-1P=1 atmχ =20 s-1
YH
2O
Z
BG40BG60
Figure 4: H2O mass fraction Figure 5: CO2 mass fraction
The maximum temperature (figure 3) decreases with CO2/CH4 ratio and occurs at the rich side of the stoichiometric mixture fraction of the biogas mixtures. For both BG40 and BG60 biogases, chemical and thermal CO2 addition effects are shown. The flame produces less H2O (figure 4) and slightly less CO2 for Z < 0.12 and more CO2 for Z > 0.12 (figure 5). CO mass fraction is lowered with CO2 addition (figure 6).
0,0 0,2 0,4 0,6 0,8 1,00,00
1,00E-2
2,00E-2
3,00E-2
4,00E-2
5,00E-2
YC
O
Z
P=1 atmχ =20 s-1
BG40 BG60
0,0 0,2 0,4 0,6 0,8 1,00,00
5,00E-4
1,00E-3
1,50E-3
2,00E-3
2,50E-3
3,00E-3
3,50E-3
4,00E-3Y
OH
Z
P=1 atmχ =20 s-1
BG40 BG60
Figure 6: CO mass fraction Figure 7: OH mass fraction
CO2 in the fuel mixture rise reduces the mass fraction of OH radical (figure 7). The same behavior has been found in previous studies [12].
0,0 0,2 0,4 0,6 0,8 1,00,00
2,00E-5
4,00E-5
6,00E-5
8,00E-5
1,00E-4
YN
O
Z
P=1 atmχ =20 s-1
BG40 BG60
0,4 0,6 0,8 1,0 1,2 1,4 1,61650
1700
1750
1800
1850
1900
1950
CO2/CH4, X/CH4
Max
imum
T(K
)
X CO2
χ=20 s-1, P=1atm
CO2 chemicaleffects
Figure 8: NO mass fraction Figure 9: Maximum flame temperature
NO mass fraction (figure 8) is maximal at temperature peaks, located at zst, it decreases due to reduction of reactive species with increasing CO2/CH4 molar ratio.
Figures 9 and 10 illustrate chemical effects of CO2 addition on maximum temperature and maximum NO species for different CO2/CH4 molar at ambient pressure of 1 atm and scalar dissipation of 20 s-1.
0,0 0,2 0,4 0,6 0,8 1,00,00
2,00E-1
4,00E-1
6,00E-1
8,00E-1
YC
O2
Z
P=1 atmχ =20 s-1 BG25
BG30 BG40 BG50 BG60
CO2/CH4
0,08 0,12 0,160,08
0,12
0,16
0,20
(c)
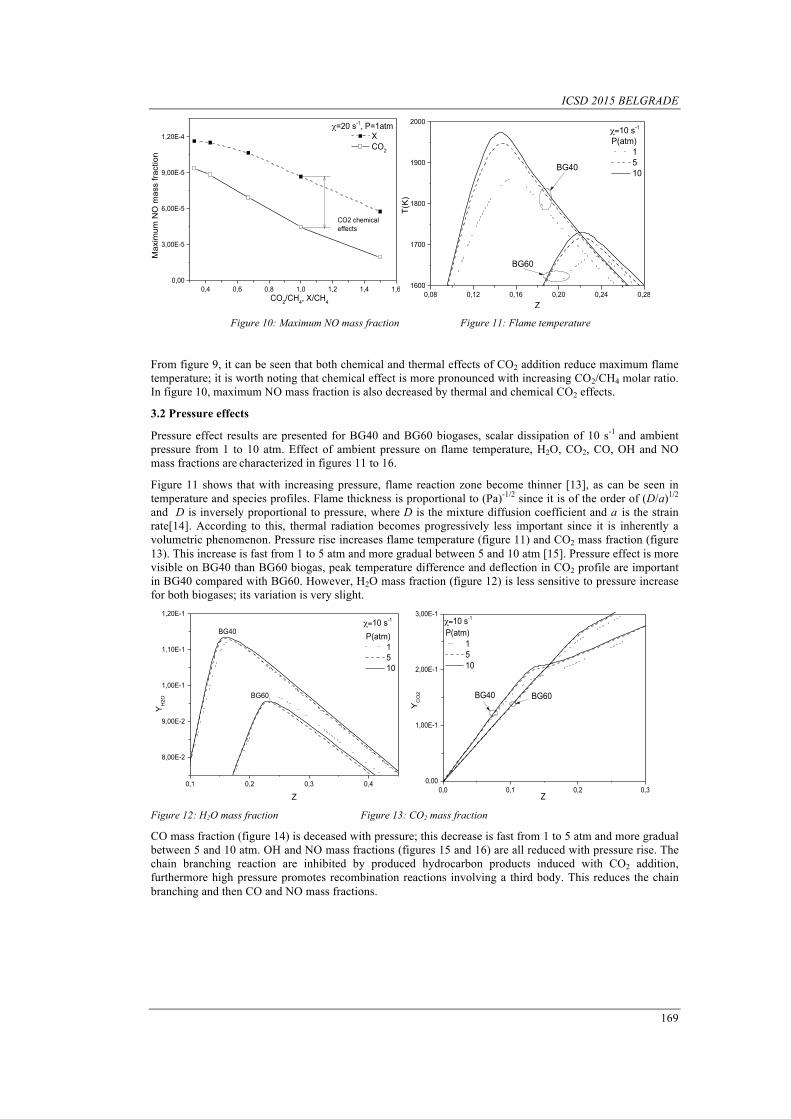
ICSD 2015 BELGRADE
169
0,4 0,6 0,8 1,0 1,2 1,4 1,60,00
3,00E-5
6,00E-5
9,00E-5
1,20E-4
CO2/CH4, X/CH4
Max
imum
NO
mas
s fra
ctio
n
X CO2
CO2 chemicaleffects
χ=20 s-1, P=1atm
0,08 0,12 0,16 0,20 0,24 0,281600
1700
1800
1900
2000
BG40
T(K
)
Z
P(atm) 1 5 10
BG60
χ=10 s-1
Figure 10: Maximum NO mass fraction Figure 11: Flame temperature
From figure 9, it can be seen that both chemical and thermal effects of CO2 addition reduce maximum flame temperature; it is worth noting that chemical effect is more pronounced with increasing CO2/CH4 molar ratio. In figure 10, maximum NO mass fraction is also decreased by thermal and chemical CO2 effects.
3.2 Pressure effects
Pressure effect results are presented for BG40 and BG60 biogases, scalar dissipation of 10 s-1 and ambient pressure from 1 to 10 atm. Effect of ambient pressure on flame temperature, H2O, CO2, CO, OH and NO mass fractions are characterized in figures 11 to 16.
Figure 11 shows that with increasing pressure, flame reaction zone become thinner [13], as can be seen in temperature and species profiles. Flame thickness is proportional to (Pa)-1/2 since it is of the order of (D/a)1/2 and D is inversely proportional to pressure, where D is the mixture diffusion coefficient and a is the strain rate[14]. According to this, thermal radiation becomes progressively less important since it is inherently a volumetric phenomenon. Pressure rise increases flame temperature (figure 11) and CO2 mass fraction (figure 13). This increase is fast from 1 to 5 atm and more gradual between 5 and 10 atm [15]. Pressure effect is more visible on BG40 than BG60 biogas, peak temperature difference and deflection in CO2 profile are important in BG40 compared with BG60. However, H2O mass fraction (figure 12) is less sensitive to pressure increase for both biogases; its variation is very slight.
0,1 0,2 0,3 0,4
8,00E-2
9,00E-2
1,00E-1
1,10E-1
1,20E-1
P(atm) 1 5 10
BG60
BG40
YH
2O
Z
χ=10 s-1
0,0 0,1 0,2 0,30,00
1,00E-1
2,00E-1
3,00E-1
YC
O2
Z
BG40 BG60
P(atm) 1 5 10
χ=10 s-1
Figure 12: H2O mass fraction Figure 13: CO2 mass fraction
CO mass fraction (figure 14) is deceased with pressure; this decrease is fast from 1 to 5 atm and more gradual between 5 and 10 atm. OH and NO mass fractions (figures 15 and 16) are all reduced with pressure rise. The chain branching reaction are inhibited by produced hydrocarbon products induced with CO2 addition, furthermore high pressure promotes recombination reactions involving a third body. This reduces the chain branching and then CO and NO mass fractions.
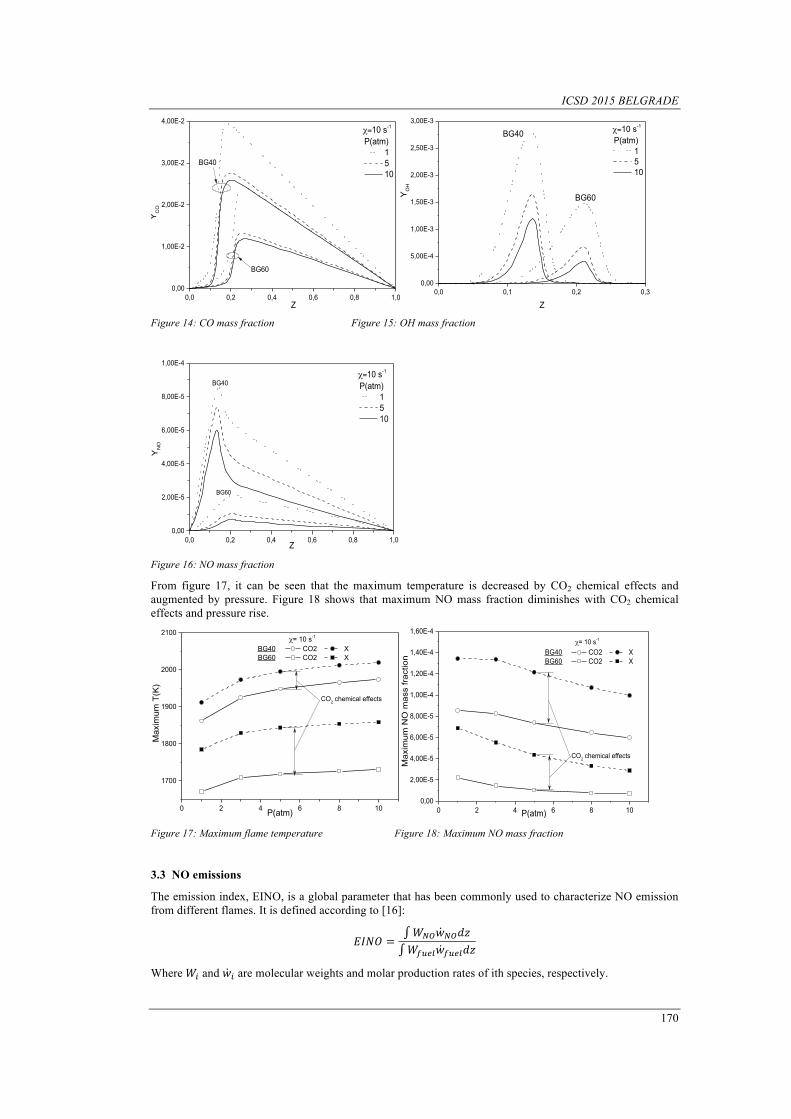
ICSD 2015 BELGRADE
170
0,0 0,2 0,4 0,6 0,8 1,00,00
1,00E-2
2,00E-2
3,00E-2
4,00E-2
YC
O
Z
BG40
BG60
P(atm) 1 5 10
χ=10 s-1
0,0 0,1 0,2 0,30,00
5,00E-4
1,00E-3
1,50E-3
2,00E-3
2,50E-3
3,00E-3
BG40
BG60YO
H
Z
P(atm) 1 5 10
χ=10 s-1
Figure 14: CO mass fraction Figure 15: OH mass fraction
0,0 0,2 0,4 0,6 0,8 1,00,00
2,00E-5
4,00E-5
6,00E-5
8,00E-5
1,00E-4
YN
O
Z
BG40
BG60
P(atm) 1 5 10
χ=10 s-1
Figure 16: NO mass fraction
From figure 17, it can be seen that the maximum temperature is decreased by CO2 chemical effects and augmented by pressure. Figure 18 shows that maximum NO mass fraction diminishes with CO2 chemical effects and pressure rise.
0 2 4 6 8 10
1700
1800
1900
2000
2100
Max
imum
T(K
)
P(atm)
BG40 CO2 XBG60 CO2 X
χ= 10 s-1
CO2 chemical effects
0 2 4 6 8 100,00
2,00E-5
4,00E-5
6,00E-5
8,00E-5
1,00E-4
1,20E-4
1,40E-4
1,60E-4
BG40 CO2 XBG60 CO2 X
Max
imum
NO
mas
s fra
ctio
n
P(atm)
χ= 10 s-1
CO2 chemical effects
Figure 17: Maximum flame temperature Figure 18: Maximum NO mass fraction
3.3 NO emissions
The emission index, EINO, is a global parameter that has been commonly used to characterize NO emission from different flames. It is defined according to [16]:
!"#$ = !!"!!"!"!!"#$!!"#$!"
Where !! and !! are molecular weights and molar production rates of ith species, respectively.
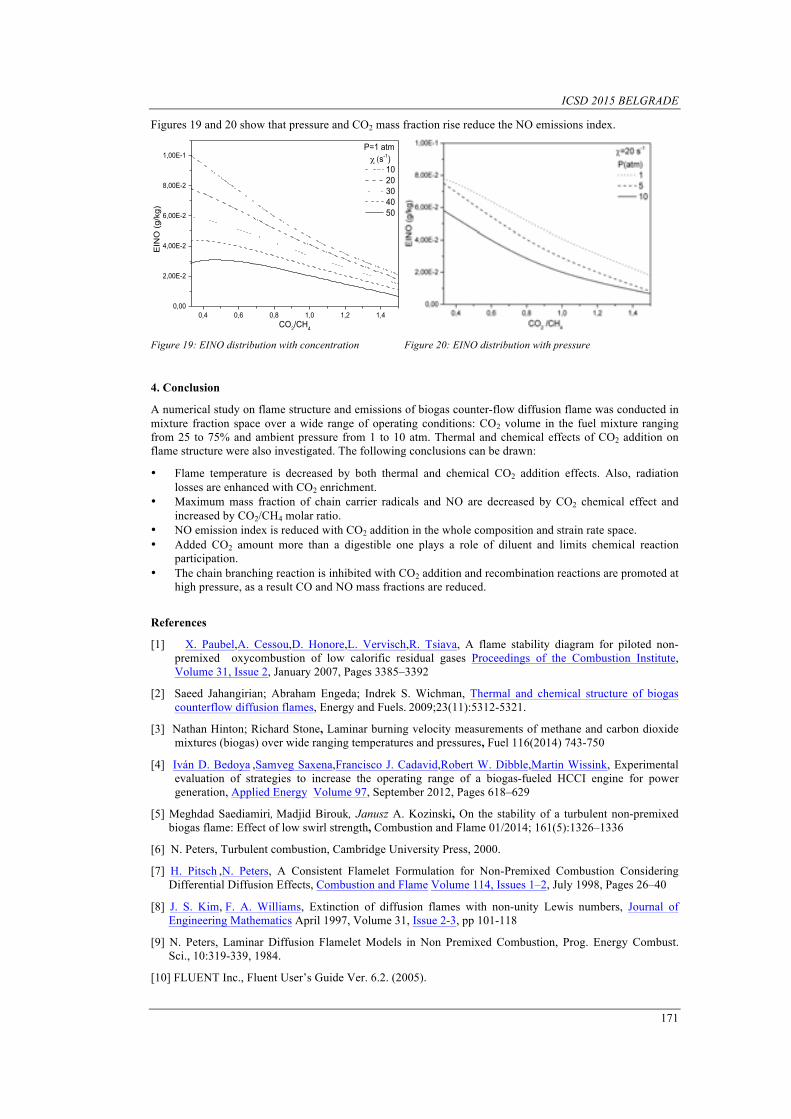
ICSD 2015 BELGRADE
171
Figures 19 and 20 show that pressure and CO2 mass fraction rise reduce the NO emissions index.
0,4 0,6 0,8 1,0 1,2 1,40,00
2,00E-2
4,00E-2
6,00E-2
8,00E-2
1,00E-1P=1 atm
EIN
O (g
/kg)
CO2/CH4
10 20 30 40 50
χ (s-1)
Figure 19: EINO distribution with concentration Figure 20: EINO distribution with pressure
4. Conclusion
A numerical study on flame structure and emissions of biogas counter-flow diffusion flame was conducted in mixture fraction space over a wide range of operating conditions: CO2 volume in the fuel mixture ranging from 25 to 75% and ambient pressure from 1 to 10 atm. Thermal and chemical effects of CO2 addition on flame structure were also investigated. The following conclusions can be drawn:
• Flame temperature is decreased by both thermal and chemical CO2 addition effects. Also, radiation losses are enhanced with CO2 enrichment.
• Maximum mass fraction of chain carrier radicals and NO are decreased by CO2 chemical effect and increased by CO2/CH4 molar ratio.
• NO emission index is reduced with CO2 addition in the whole composition and strain rate space. • Added CO2 amount more than a digestible one plays a role of diluent and limits chemical reaction
participation. • The chain branching reaction is inhibited with CO2 addition and recombination reactions are promoted at
high pressure, as a result CO and NO mass fractions are reduced.
References
[1] X. Paubel,A. Cessou,D. Honore,L. Vervisch,R. Tsiava, A flame stability diagram for piloted non-premixed oxycombustion of low calorific residual gases Proceedings of the Combustion Institute, Volume 31, Issue 2, January 2007, Pages 3385–3392
[2] Saeed Jahangirian; Abraham Engeda; Indrek S. Wichman, Thermal and chemical structure of biogas counterflow diffusion flames, Energy and Fuels. 2009;23(11):5312-5321.
[3] Nathan Hinton; Richard Stone, Laminar burning velocity measurements of methane and carbon dioxide mixtures (biogas) over wide ranging temperatures and pressures, Fuel 116(2014) 743-750
[4] Iván D. Bedoya ,Samveg Saxena,Francisco J. Cadavid,Robert W. Dibble,Martin Wissink, Experimental evaluation of strategies to increase the operating range of a biogas-fueled HCCI engine for power generation, Applied Energy Volume 97, September 2012, Pages 618–629
[5] Meghdad Saediamiri, Madjid Birouk, Janusz A. Kozinski, On the stability of a turbulent non-premixed biogas flame: Effect of low swirl strength, Combustion and Flame 01/2014; 161(5):1326–1336
[6] N. Peters, Turbulent combustion, Cambridge University Press, 2000.
[7] H. Pitsch ,N. Peters, A Consistent Flamelet Formulation for Non-Premixed Combustion Considering Differential Diffusion Effects, Combustion and Flame Volume 114, Issues 1–2, July 1998, Pages 26–40
[8] J. S. Kim, F. A. Williams, Extinction of diffusion flames with non-unity Lewis numbers, Journal of Engineering Mathematics April 1997, Volume 31, Issue 2-3, pp 101-118
[9] N. Peters, Laminar Diffusion Flamelet Models in Non Premixed Combustion, Prog. Energy Combust. Sci., 10:319-339, 1984.
[10] FLUENT Inc., Fluent User’s Guide Ver. 6.2. (2005).
ICSD 2015 BELGRADE
172
[11] Jeong Park, Dong-Jin Hwang, Jong-Geun Choi, Kee-Man Lee, Sang-In Keel and Sung-Hoon Shim, Chemical effects of CO2 addition to oxidizer and fuel streams on flame structure in H2–O2 counterflow diffusion flames, Int. J. Energy Res. 2003; 27:1205–1220
[12] A. Matynia, J. Molet, C. Roche, M. Idir, S. de Persis, L. Pillier, Measurement of OH concentration profiles by laser diagnostics and modeling in high-pressure counterflow premixed methane/air and biogas/air flames, Combustion and Flame Volume 159, Issue 11, November 2012, Pages 3300–3311
[13] Hsin-Yi Shih , Jou-Rong Hsu, A computational study of combustion and extinction of opposed-jet syngas diffusion flames, International Journal of Hydrogen Energy Volume 36, Issue 24, December 2011, Pages 15868–15879
[14] U. Niemann, K. Seshadri, F.A. Williams, Effect of pressure on structure and extinction of near-limit hydrogen counterflow diffusion flames, Proceedings of the Combustion Institute 01/2013; 34(1):881-886
[15] K. Safer, F. Tabet, A. Ouadha, M. Safer and I. Gökalp, Simulation of a syngas counter-flow diffusion flame structure and NO emissions in the pressure range 1 - 10 atm, Fuel Processing Technology Volume 123, July 2014, Pages 149–158.
[16] X.L. Zhu, J.P. Gore, Radiation effects on combustion and pollutant emissions of high-pressure opposed flow methane/air diffusion flames, Combustion and Flame Volume 141, Issues 1–2, April 2005, Pages 118–130.
ICSD 2015 BELGRADE
173
Energy Efficiency and Policy Mix in the European Countries
Savaş Çevik1, Fatma Turna2, M. Mustafa Erdoğdu3
Abstract Although countries have had concerns about energy security and energy supply for a long time, global warming and other environmental problems have led to increased interest in renewable energy use and energy efficiency only in the last decades. On the one hand, energy efficiency is important for cost-effective use of resources, overcoming environmental problems, and improving energy security. On the other hand, it is important for increasing living standards and life quality of inhabitants. Therefore, many countries have developed energy efficiency policies since 1970s. Among them, the EU countries appear as in a very good shape in policy design and innovation policies. Energy efficiency policies and their instruments are inherently complex due to the sectoral diversity, a variety of audience and uses. However, the success of a policy could largely depend on the process of policy making with regard to the characteristics of the policy, instruments and measures used, stakeholders involved and its targets. This paper aims to examine the effect of policy packages on the impact level of policies and to search if there is any efficient combination of policy instruments, based on the data of the MURE project which is a unique database on energy efficiency policy measures in 28 EU countries and Norway. First, the study provides an insight into the energy efficiency policies in European Countries by their sectoral distribution, targeted end-use and measure types to determine policy mix and policy trend. Later, it analyzes the policy packages to determine if the policy mix with respect to sectors, actors and measures has any effect on semi-quantitative impact levels of policies through cross-tabulations. The main finding of the paper is that the policy mix is crucial for policy success.
Keywords: Energy Policy, European Union, Energy Efficiency, MURE Project
1. INTRODUCTION
Energy is one of the most important inputs for economic growth and human development since it provides an essential ingredient for almost all human activities. Efficient energy use,4 on the other hand, is a cost-effective strategy for building economies without necessarily increasing energy consumption. Improving energy efficiency is an important priority in the policy agenda for all countries not only for economic reasons but also for many other reasons, such as environmental benefits, energy security and creating new jobs. Since energy efficiency represents the cheapest and surest means of curbing carbon emissions and saving money for other productive uses, national energy efficiency policies and measures and monitoring energy efficiency are seen today as the most important component of energy strategies of countries.
Besides, the European Union and its members are seen to be the world champion with respect to policy design, policy innovations and their energy efficiency outcomes despite some member states are among the world’s largest energy consumers. As national policies of member states are heavily formed by the EU regulations and policies, the EU provides a roadmap for moving a low-carbon and energy-efficient economy by drawing clear targets on emissions and uses to members states. According to the Europe 2020 strategy
1 Corresponding author: Assoc. Prof. Selcuk University, Faculty of Economic and Administrative Sciences, Department of Economics, Konya, Turkey. [email protected] 2 Res. Ass. Marmara University, Faculty of Economics, Department of Public Finance, Goztepe Yerleskesi, 34722 Kadikoy/Istanbul, [email protected] 3 Prof. Dr., Marmara University, Faculty of Economics, Department of Public Finance, Goztepe Yerleskesi, 34722 Kadikoy/ Istanbul, [email protected] 4 Energy efficiency improvements are more prudent use of scarce and polluting resources while simultaneously maintaining a certain level of output.
ICSD 2015 BELGRADE
174
approved by the European Council, it is targeted to increase energy efficiency by 20%, to reduce greenhouse gas emissions by 20% and to reach a share of 20% of energy from renewables in 2020 compare to 1990. The Energy Efficiency Directive (EED; 2012/27/EU) further specified that the EU-28 energy consumption for 2020 has to be no more than 1,483 Mtoe of primary energy or no more than 1,086 Mtoe of final energy. On 23 October 2014, the European Council decided on a new 2030 Climate and Energy Policy Framework including a binding EU target of at least 40% domestic reduction in greenhouse gas emissions by 2030 compared to 1990, and a share of at least 27% of renewable energy consumed in the EU in 2030 is binding at EU level. There are also sector-specific targets by the EU regulations.
According to Energy Savings 2020 report prepared by Wesselink, Harmsen, and Eichhammer (2010; 6), the EU’s 20% energy savings target can be met largely through cost-effective measures but a tripling of policy impact is required. There are wide range of policy design with respect to their targets, actors, measures and other instruments in the EU members. The gap between the estimated opportunities in energy efficiency in sectors and achieved levels require examining energy-efficiency policies design and policy-making process in more detail in order to determine the characteristics of successful policy. In this context, the study’s first objective is to examine policy design of the European countries where are seen as the leader in energy efficiency policy and in combating climate change, in order to identify the sector and the measure specific characteristics of energy efficiency policies and the recent trends in the region. The second objective is to determine if policy mix or policy packages with respect to their characteristics on actors, targets and measure types has an effect on the policy’s impact on energy efficiency. For these objectives, we use the data of the MURE project which is a unique database that provides an evaluation of energy efficiency policy measures in the EU members, Norway, Croatia and the EU as a whole.
The next section describes and evaluates the main purposes and instruments of energy efficiency policies in sample countries. The third section assesses the energy-efficiency impacts of policy packages by their actors involved, measures used and end-use targeted through the average impact scores calculated from semi-quantitative impact levels. The final section concludes.
2. THE DESIGN OF ENERGY EFFICIENCY POLICIES: PURPOSES AND INSTRUMENTS
There have been implemented numerous energy efficiency policy instruments among countries, the energy gains compared to potential still limited, and the impact of policies varies across policies and countries (Morvaj and Bukarica, 2010) because of components of policies as well as the importance of other drivers in energy saving such as technologic innovations (Huber and Mills, 2005; Hogan and Jorgenson, 1991) and the increase in energy prices (Sutherland, 2003) as argued by some authors. When enforcement can be secured, mandatory and regulatory measures are generally the most cost-effective ways of increasing the energy efficiency on a long-term basis (UNDP, 2009; Erdogdu, Karaca, & Kurultay, 2015).
Taking into account of the energy efficiency gap between the observed level of energy efficiency and the potential of energy efficiency, this gap and therefore the need for policy intervention in energy markets mostly are explained by market and behavioral failures (Gillingham, Newell and Palmer, 2009; Shogren and Taylor, 2008), despite of some critics which argue that all market failures and barriers are not problem that should be overcome or can be overcome cost-effectively (Geller and Attali, 2009). Gillingham, Newell and Palmer (2009) classify potential failures and policy options as energy market failures (policy options are fiscal and new market-based instruments), capital market failures (policy options are financial and loan instruments), innovation market failures (policy options are fiscal and financial instruments), information problems (policy options are information programs) and behavioral failures (policy options are educational and informational instruments and legislative-normative measures as product standards).
In this paper, we examine the European countries which are seen to be having the developed policy designs and to be having enormous energy gains from policies through the MURE database. The first policies that appear in the MURE database are “farm land re-parceling project” of Finland in 1917 and “speed limits and active traffic management” of UK in 1934. Until 1990, there were only 86 policies according to the MURE database. The energy-efficiency policies have mainly began to increase from 1990s, and at mid-2000s, the number of policy has reached at its highest level, despite of relatively decrease after 2009 (the decrease can be seen to be partly due to data availability in the MURE database). There has been a continuous increase in the number of measures that have come into force every year until 2009. The increase is valid for all sectors, but the least increase was experienced in the industrial sector. The policy number for all years and all sectors is 2382 as of August 2015 when the data was collected for this study. The largest part of policies is those related to energy efficiency in the household sector. Policies without the semi-quantitative impact estimation are about 13% of the total. The largest number of policies consists of measures addressing energy-efficient in the household sector by 28% as share of total policies (663 policies as frequency). The second largest number of policies is those which address transport and tertiary sectors. The share of transport and tertiary sector policies is quite similar and 22% (528 policies for transport and 524 policies for tertiary) with respect to policy numbers. Policies toward the industrial sector and general cross-cutting sector are again same as 14%
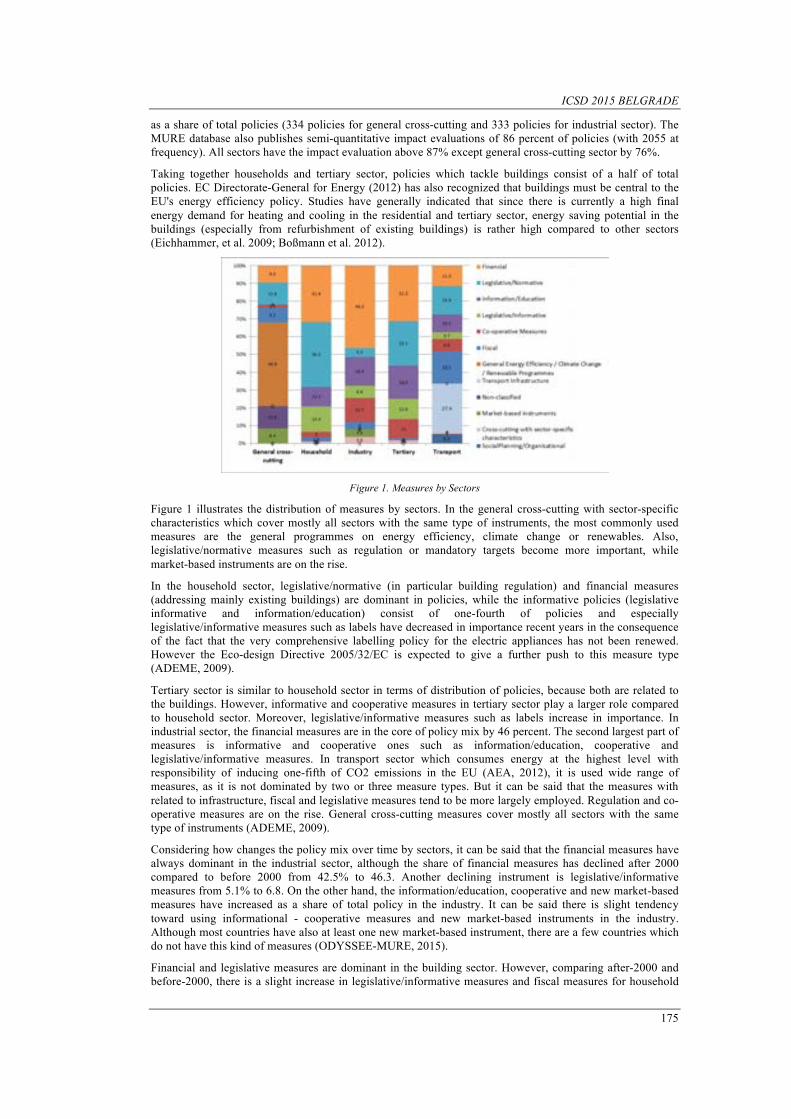
ICSD 2015 BELGRADE
175
as a share of total policies (334 policies for general cross-cutting and 333 policies for industrial sector). The MURE database also publishes semi-quantitative impact evaluations of 86 percent of policies (with 2055 at frequency). All sectors have the impact evaluation above 87% except general cross-cutting sector by 76%.
Taking together households and tertiary sector, policies which tackle buildings consist of a half of total policies. EC Directorate-General for Energy (2012) has also recognized that buildings must be central to the EU's energy efficiency policy. Studies have generally indicated that since there is currently a high final energy demand for heating and cooling in the residential and tertiary sector, energy saving potential in the buildings (especially from refurbishment of existing buildings) is rather high compared to other sectors (Eichhammer, et al. 2009; Boßmann et al. 2012).
Figure 1. Measures by Sectors
Figure 1 illustrates the distribution of measures by sectors. In the general cross-cutting with sector-specific characteristics which cover mostly all sectors with the same type of instruments, the most commonly used measures are the general programmes on energy efficiency, climate change or renewables. Also, legislative/normative measures such as regulation or mandatory targets become more important, while market-based instruments are on the rise.
In the household sector, legislative/normative (in particular building regulation) and financial measures (addressing mainly existing buildings) are dominant in policies, while the informative policies (legislative informative and information/education) consist of one-fourth of policies and especially legislative/informative measures such as labels have decreased in importance recent years in the consequence of the fact that the very comprehensive labelling policy for the electric appliances has not been renewed. However the Eco-design Directive 2005/32/EC is expected to give a further push to this measure type (ADEME, 2009).
Tertiary sector is similar to household sector in terms of distribution of policies, because both are related to the buildings. However, informative and cooperative measures in tertiary sector play a larger role compared to household sector. Moreover, legislative/informative measures such as labels increase in importance. In industrial sector, the financial measures are in the core of policy mix by 46 percent. The second largest part of measures is informative and cooperative ones such as information/education, cooperative and legislative/informative measures. In transport sector which consumes energy at the highest level with responsibility of inducing one-fifth of CO2 emissions in the EU (AEA, 2012), it is used wide range of measures, as it is not dominated by two or three measure types. But it can be said that the measures with related to infrastructure, fiscal and legislative measures tend to be more largely employed. Regulation and co-operative measures are on the rise. General cross-cutting measures cover mostly all sectors with the same type of instruments (ADEME, 2009).
Considering how changes the policy mix over time by sectors, it can be said that the financial measures have always dominant in the industrial sector, although the share of financial measures has declined after 2000 compared to before 2000 from 42.5% to 46.3. Another declining instrument is legislative/informative measures from 5.1% to 6.8. On the other hand, the information/education, cooperative and new market-based measures have increased as a share of total policy in the industry. It can be said there is slight tendency toward using informational - cooperative measures and new market-based instruments in the industry. Although most countries have also at least one new market-based instrument, there are a few countries which do not have this kind of measures (ODYSSEE-MURE, 2015).
Financial and legislative measures are dominant in the building sector. However, comparing after-2000 and before-2000, there is a slight increase in legislative/informative measures and fiscal measures for household
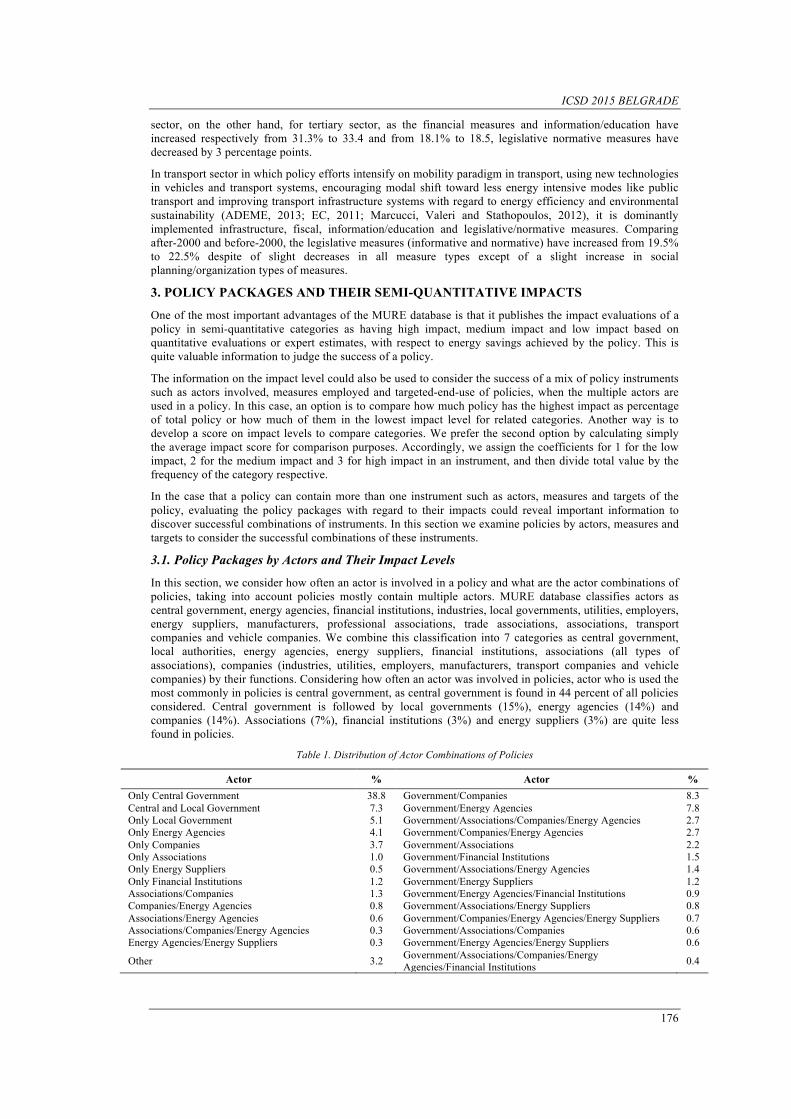
ICSD 2015 BELGRADE
176
sector, on the other hand, for tertiary sector, as the financial measures and information/education have increased respectively from 31.3% to 33.4 and from 18.1% to 18.5, legislative normative measures have decreased by 3 percentage points.
In transport sector in which policy efforts intensify on mobility paradigm in transport, using new technologies in vehicles and transport systems, encouraging modal shift toward less energy intensive modes like public transport and improving transport infrastructure systems with regard to energy efficiency and environmental sustainability (ADEME, 2013; EC, 2011; Marcucci, Valeri and Stathopoulos, 2012), it is dominantly implemented infrastructure, fiscal, information/education and legislative/normative measures. Comparing after-2000 and before-2000, the legislative measures (informative and normative) have increased from 19.5% to 22.5% despite of slight decreases in all measure types except of a slight increase in social planning/organization types of measures.
3. POLICY PACKAGES AND THEIR SEMI-QUANTITATIVE IMPACTS
One of the most important advantages of the MURE database is that it publishes the impact evaluations of a policy in semi-quantitative categories as having high impact, medium impact and low impact based on quantitative evaluations or expert estimates, with respect to energy savings achieved by the policy. This is quite valuable information to judge the success of a policy.
The information on the impact level could also be used to consider the success of a mix of policy instruments such as actors involved, measures employed and targeted-end-use of policies, when the multiple actors are used in a policy. In this case, an option is to compare how much policy has the highest impact as percentage of total policy or how much of them in the lowest impact level for related categories. Another way is to develop a score on impact levels to compare categories. We prefer the second option by calculating simply the average impact score for comparison purposes. Accordingly, we assign the coefficients for 1 for the low impact, 2 for the medium impact and 3 for high impact in an instrument, and then divide total value by the frequency of the category respective.
In the case that a policy can contain more than one instrument such as actors, measures and targets of the policy, evaluating the policy packages with regard to their impacts could reveal important information to discover successful combinations of instruments. In this section we examine policies by actors, measures and targets to consider the successful combinations of these instruments.
3.1. Policy Packages by Actors and Their Impact Levels
In this section, we consider how often an actor is involved in a policy and what are the actor combinations of policies, taking into account policies mostly contain multiple actors. MURE database classifies actors as central government, energy agencies, financial institutions, industries, local governments, utilities, employers, energy suppliers, manufacturers, professional associations, trade associations, associations, transport companies and vehicle companies. We combine this classification into 7 categories as central government, local authorities, energy agencies, energy suppliers, financial institutions, associations (all types of associations), companies (industries, utilities, employers, manufacturers, transport companies and vehicle companies) by their functions. Considering how often an actor was involved in policies, actor who is used the most commonly in policies is central government, as central government is found in 44 percent of all policies considered. Central government is followed by local governments (15%), energy agencies (14%) and companies (14%). Associations (7%), financial institutions (3%) and energy suppliers (3%) are quite less found in policies.
Table 1. Distribution of Actor Combinations of Policies
Actor % Actor % Only Central Government 38.8 Government/Companies 8.3 Central and Local Government 7.3 Government/Energy Agencies 7.8 Only Local Government 5.1 Government/Associations/Companies/Energy Agencies 2.7 Only Energy Agencies 4.1 Government/Companies/Energy Agencies 2.7 Only Companies 3.7 Government/Associations 2.2 Only Associations 1.0 Government/Financial Institutions 1.5 Only Energy Suppliers 0.5 Government/Associations/Energy Agencies 1.4 Only Financial Institutions 1.2 Government/Energy Suppliers 1.2 Associations/Companies 1.3 Government/Energy Agencies/Financial Institutions 0.9 Companies/Energy Agencies 0.8 Government/Associations/Energy Suppliers 0.8 Associations/Energy Agencies 0.6 Government/Companies/Energy Agencies/Energy Suppliers 0.7 Associations/Companies/Energy Agencies 0.3 Government/Associations/Companies 0.6 Energy Agencies/Energy Suppliers 0.3 Government/Energy Agencies/Energy Suppliers 0.6
Other 3.2 Government/Associations/Companies/Energy Agencies/Financial Institutions 0.4
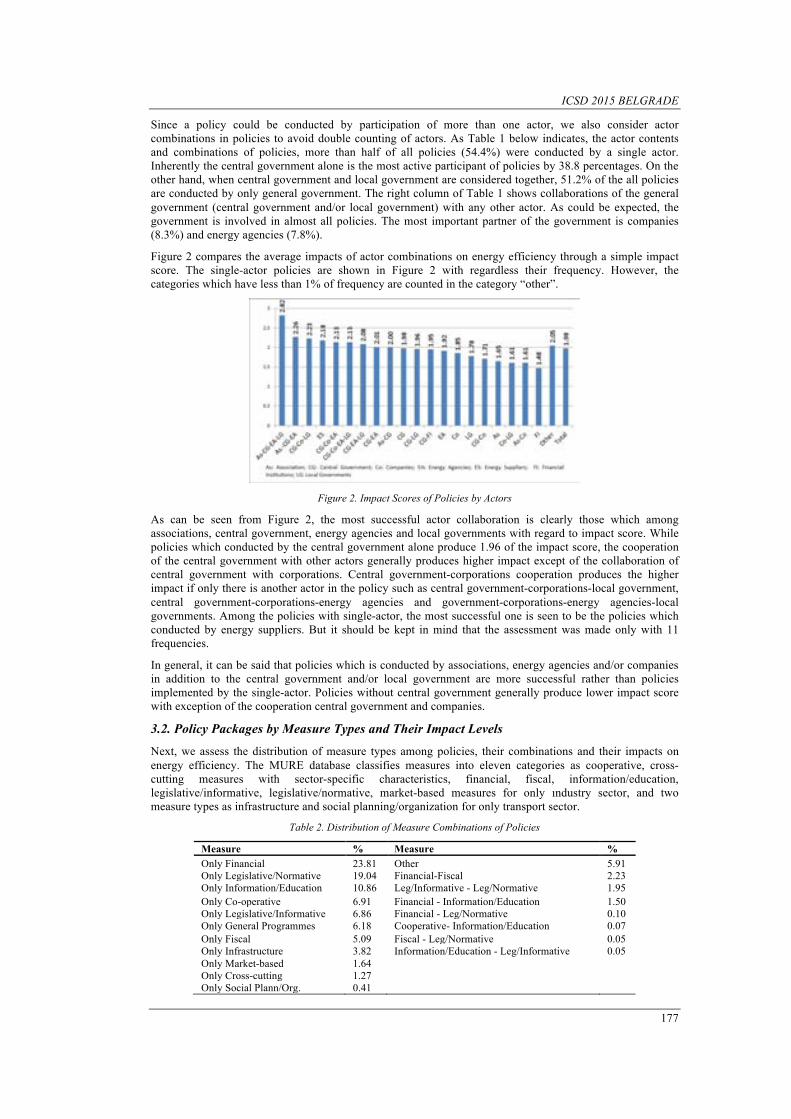
ICSD 2015 BELGRADE
177
Since a policy could be conducted by participation of more than one actor, we also consider actor combinations in policies to avoid double counting of actors. As Table 1 below indicates, the actor contents and combinations of policies, more than half of all policies (54.4%) were conducted by a single actor. Inherently the central government alone is the most active participant of policies by 38.8 percentages. On the other hand, when central government and local government are considered together, 51.2% of the all policies are conducted by only general government. The right column of Table 1 shows collaborations of the general government (central government and/or local government) with any other actor. As could be expected, the government is involved in almost all policies. The most important partner of the government is companies (8.3%) and energy agencies (7.8%).
Figure 2 compares the average impacts of actor combinations on energy efficiency through a simple impact score. The single-actor policies are shown in Figure 2 with regardless their frequency. However, the categories which have less than 1% of frequency are counted in the category “other”.
Figure 2. Impact Scores of Policies by Actors
As can be seen from Figure 2, the most successful actor collaboration is clearly those which among associations, central government, energy agencies and local governments with regard to impact score. While policies which conducted by the central government alone produce 1.96 of the impact score, the cooperation of the central government with other actors generally produces higher impact except of the collaboration of central government with corporations. Central government-corporations cooperation produces the higher impact if only there is another actor in the policy such as central government-corporations-local government, central government-corporations-energy agencies and government-corporations-energy agencies-local governments. Among the policies with single-actor, the most successful one is seen to be the policies which conducted by energy suppliers. But it should be kept in mind that the assessment was made only with 11 frequencies.
In general, it can be said that policies which is conducted by associations, energy agencies and/or companies in addition to the central government and/or local government are more successful rather than policies implemented by the single-actor. Policies without central government generally produce lower impact score with exception of the cooperation central government and companies.
3.2. Policy Packages by Measure Types and Their Impact Levels
Next, we assess the distribution of measure types among policies, their combinations and their impacts on energy efficiency. The MURE database classifies measures into eleven categories as cooperative, cross-cutting measures with sector-specific characteristics, financial, fiscal, information/education, legislative/informative, legislative/normative, market-based measures for only ındustry sector, and two measure types as infrastructure and social planning/organization for only transport sector.
Table 2. Distribution of Measure Combinations of Policies Measure % Measure % Only Financial 23.81 Other 5.91 Only Legislative/Normative 19.04 Financial-Fiscal 2.23 Only Information/Education 10.86 Leg/Informative - Leg/Normative 1.95 Only Co-operative 6.91 Financial - Information/Education 1.50 Only Legislative/Informative 6.86 Financial - Leg/Normative 0.10 Only General Programmes 6.18 Cooperative- Information/Education 0.07 Only Fiscal 5.09 Fiscal - Leg/Normative 0.05 Only Infrastructure 3.82 Information/Education - Leg/Informative 0.05 Only Market-based 1.64 Only Cross-cutting 1.27 Only Social Plann/Org. 0.41
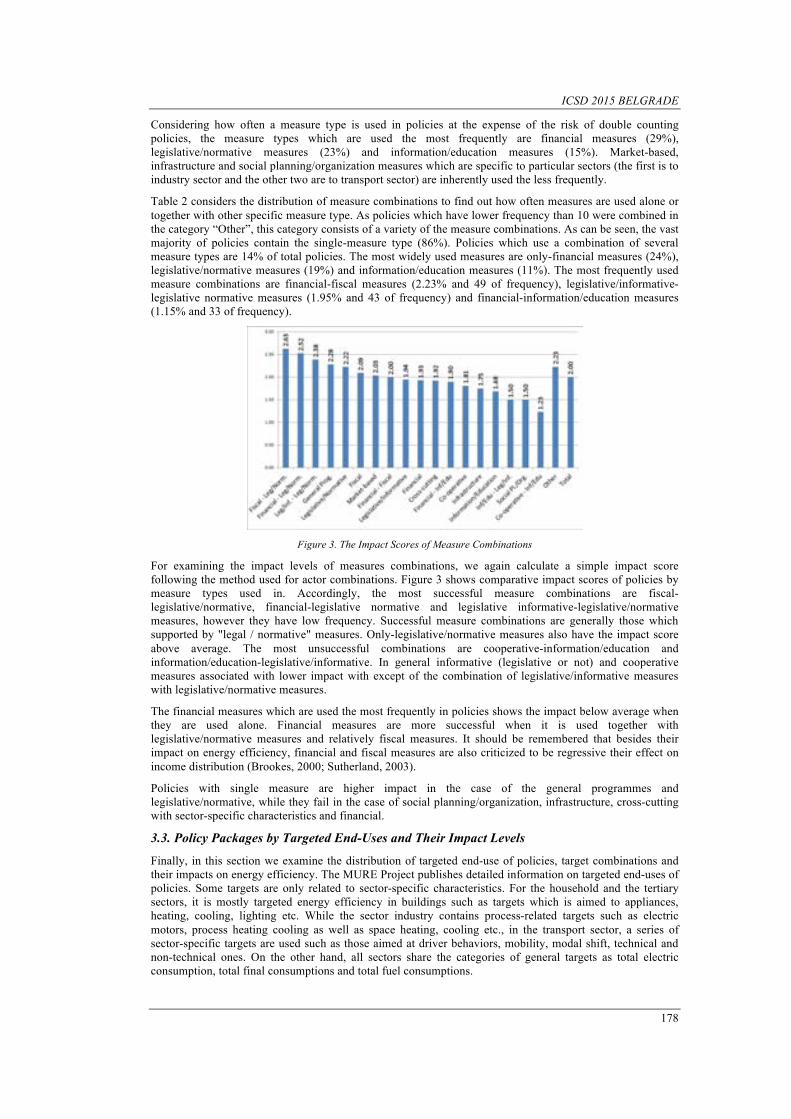
ICSD 2015 BELGRADE
178
Considering how often a measure type is used in policies at the expense of the risk of double counting policies, the measure types which are used the most frequently are financial measures (29%), legislative/normative measures (23%) and information/education measures (15%). Market-based, infrastructure and social planning/organization measures which are specific to particular sectors (the first is to industry sector and the other two are to transport sector) are inherently used the less frequently.
Table 2 considers the distribution of measure combinations to find out how often measures are used alone or together with other specific measure type. As policies which have lower frequency than 10 were combined in the category “Other”, this category consists of a variety of the measure combinations. As can be seen, the vast majority of policies contain the single-measure type (86%). Policies which use a combination of several measure types are 14% of total policies. The most widely used measures are only-financial measures (24%), legislative/normative measures (19%) and information/education measures (11%). The most frequently used measure combinations are financial-fiscal measures (2.23% and 49 of frequency), legislative/informative-legislative normative measures (1.95% and 43 of frequency) and financial-information/education measures (1.15% and 33 of frequency).
Figure 3. The Impact Scores of Measure Combinations
For examining the impact levels of measures combinations, we again calculate a simple impact score following the method used for actor combinations. Figure 3 shows comparative impact scores of policies by measure types used in. Accordingly, the most successful measure combinations are fiscal-legislative/normative, financial-legislative normative and legislative informative-legislative/normative measures, however they have low frequency. Successful measure combinations are generally those which supported by "legal / normative" measures. Only-legislative/normative measures also have the impact score above average. The most unsuccessful combinations are cooperative-information/education and information/education-legislative/informative. In general informative (legislative or not) and cooperative measures associated with lower impact with except of the combination of legislative/informative measures with legislative/normative measures.
The financial measures which are used the most frequently in policies shows the impact below average when they are used alone. Financial measures are more successful when it is used together with legislative/normative measures and relatively fiscal measures. It should be remembered that besides their impact on energy efficiency, financial and fiscal measures are also criticized to be regressive their effect on income distribution (Brookes, 2000; Sutherland, 2003).
Policies with single measure are higher impact in the case of the general programmes and legislative/normative, while they fail in the case of social planning/organization, infrastructure, cross-cutting with sector-specific characteristics and financial.
3.3. Policy Packages by Targeted End-Uses and Their Impact Levels
Finally, in this section we examine the distribution of targeted end-use of policies, target combinations and their impacts on energy efficiency. The MURE Project publishes detailed information on targeted end-uses of policies. Some targets are only related to sector-specific characteristics. For the household and the tertiary sectors, it is mostly targeted energy efficiency in buildings such as targets which is aimed to appliances, heating, cooling, lighting etc. While the sector industry contains process-related targets such as electric motors, process heating cooling as well as space heating, cooling etc., in the transport sector, a series of sector-specific targets are used such as those aimed at driver behaviors, mobility, modal shift, technical and non-technical ones. On the other hand, all sectors share the categories of general targets as total electric consumption, total final consumptions and total fuel consumptions.
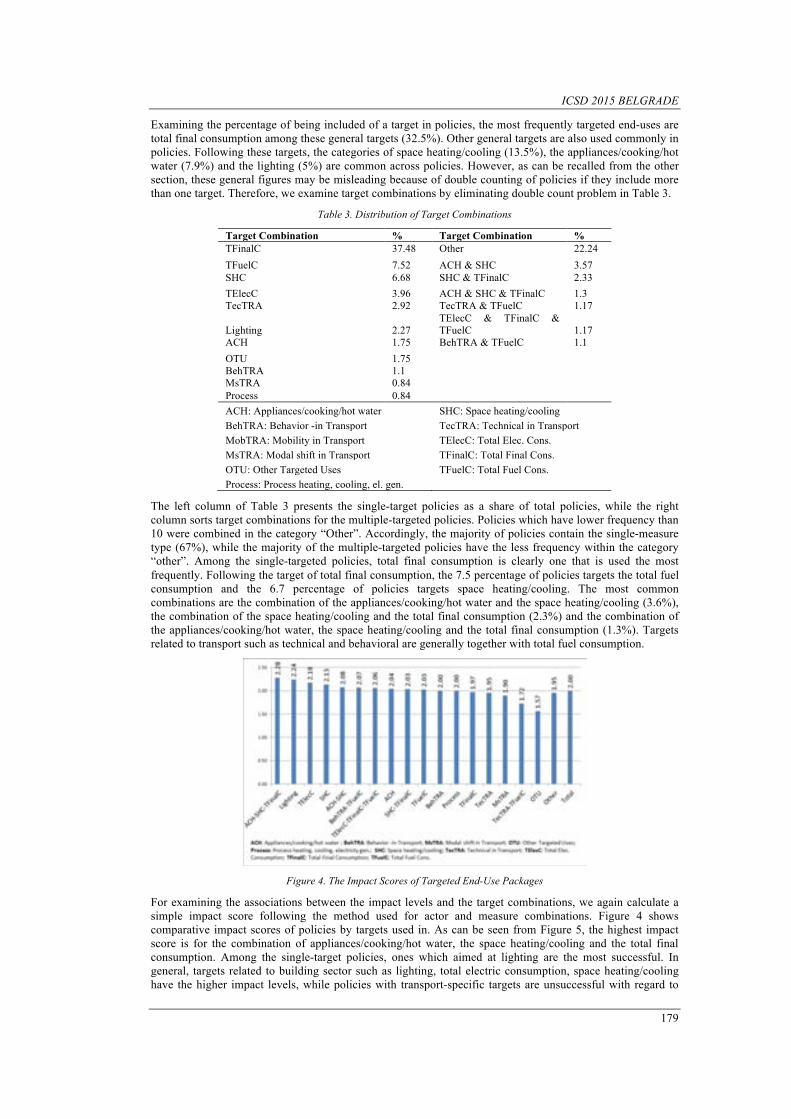
ICSD 2015 BELGRADE
179
Examining the percentage of being included of a target in policies, the most frequently targeted end-uses are total final consumption among these general targets (32.5%). Other general targets are also used commonly in policies. Following these targets, the categories of space heating/cooling (13.5%), the appliances/cooking/hot water (7.9%) and the lighting (5%) are common across policies. However, as can be recalled from the other section, these general figures may be misleading because of double counting of policies if they include more than one target. Therefore, we examine target combinations by eliminating double count problem in Table 3.
Table 3. Distribution of Target Combinations Target Combination % Target Combination % TFinalC 37.48 Other 22.24 TFuelC 7.52 ACH & SHC 3.57 SHC 6.68 SHC & TFinalC 2.33 TElecC 3.96 ACH & SHC & TFinalC 1.3 TecTRA 2.92 TecTRA & TFuelC 1.17
Lighting 2.27 TElecC & TFinalC & TFuelC 1.17
ACH 1.75 BehTRA & TFuelC 1.1 OTU 1.75 BehTRA 1.1 MsTRA 0.84 Process 0.84 ACH: Appliances/cooking/hot water SHC: Space heating/cooling BehTRA: Behavior -in Transport TecTRA: Technical in Transport MobTRA: Mobility in Transport TElecC: Total Elec. Cons. MsTRA: Modal shift in Transport TFinalC: Total Final Cons. OTU: Other Targeted Uses TFuelC: Total Fuel Cons. Process: Process heating, cooling, el. gen.
The left column of Table 3 presents the single-target policies as a share of total policies, while the right column sorts target combinations for the multiple-targeted policies. Policies which have lower frequency than 10 were combined in the category “Other”. Accordingly, the majority of policies contain the single-measure type (67%), while the majority of the multiple-targeted policies have the less frequency within the category “other”. Among the single-targeted policies, total final consumption is clearly one that is used the most frequently. Following the target of total final consumption, the 7.5 percentage of policies targets the total fuel consumption and the 6.7 percentage of policies targets space heating/cooling. The most common combinations are the combination of the appliances/cooking/hot water and the space heating/cooling (3.6%), the combination of the space heating/cooling and the total final consumption (2.3%) and the combination of the appliances/cooking/hot water, the space heating/cooling and the total final consumption (1.3%). Targets related to transport such as technical and behavioral are generally together with total fuel consumption.
Figure 4. The Impact Scores of Targeted End-Use Packages
For examining the associations between the impact levels and the target combinations, we again calculate a simple impact score following the method used for actor and measure combinations. Figure 4 shows comparative impact scores of policies by targets used in. As can be seen from Figure 5, the highest impact score is for the combination of appliances/cooking/hot water, the space heating/cooling and the total final consumption. Among the single-target policies, ones which aimed at lighting are the most successful. In general, targets related to building sector such as lighting, total electric consumption, space heating/cooling have the higher impact levels, while policies with transport-specific targets are unsuccessful with regard to
ICSD 2015 BELGRADE
180
their impact scores. Among transport-specific targets, the most successful one is behavioral targets, but it has higher impact if it is used with total fuel consumption target.
Among targets aimed at general energy efficiency (total final consumption, total electric consumption and total fuel consumption), total electric consumption is the most successful, while total final consumption is the less successful one, when they are used alone. Total final consumption has higher impact if it is used together with targets the appliances/cooking/hot water and the space heating/cooling instead of using alone, while the fuel consumption has higher impact if it is used together with behavioral targets for transport instead of using alone.
4. CONCLUSION
We have evaluated the policy contents with respect to their impacts on energy efficiency by actors, measure types and targets. The most successful actor collaboration clearly appears as those which among associations, central government, energy agencies and local governments. The cooperation of the central government with other actors generally produces the higher impact except the collaboration of central government with corporations. Policies without central government generally produce lower impact score with the exception of the cooperation central government and companies.
For measure types employed in policies, the most successful measure combinations are fiscal-legislative/normative, financial-legislative normative and legislative informative-legislative/normative measures. Successful measure combinations are generally those which supported by "legislative/normative" measures. Only-legislative/normative measures also have the impact score above average. When enforcement can be secured, mandatory and regulatory measures are generally the most cost-effective ways of increasing the energy efficiency. The most unsuccessful combinations are cooperative-information/education and information/education-legislative/informative. In general informative (legislative or not) and cooperative measures associated with lower impact with except of the combination of legislative/informative measures with legislative/normative measures. The financial measures which are used the most frequently in policies shows the impact below average when they are used alone. Financial measures are more successful when it is used together with legislative/normative measures and relatively fiscal measures.
With regard to target packages of policies, the highest impact score is for the combination of appliances/cooking/hot water, the space heating/cooling and the total final consumption. Among the single-target policies, ones which aimed at lighting are the most successful. In general, targets related to building sector such as lighting, total electric consumption, space heating/cooling have the higher impact levels, while policies with transport-specific targets are unsuccessful with regard to their impact scores. Among transport-specific targets, the most successful one is behavioral targets, but it has higher impact if it is used with total fuel consumption target.
REFERENCES [1]. ADEME, “Overall Energy Efficiency Trends and Policies in the EU 27”, October 2009. [2]. ADEME (2013), “Energy Efficiency Policies in the EU: Lessons from the Odyssee-Mure Project” website, July
2013. [Online]. Available: http://www.ademe.fr/sites/default/files/assets/documents/89109_7860-energy-efficiency-policies-in-eu.pdf
[3]. AEA, “Energy Efficiency Policies in the Transport Sector in the EU”, Report for the EACI, Issue Number 2, October 2012.
[4]. T. Boßmann, W. Eichhammer and R. Elsland “Concrete Paths of the European Union to the 2°C Scenario: Achieving the Climate Protection Targets of the EU by 2050 through Structural Change, Energy Savings and Energy Efficiency Technologies: Accompanying scientific report – Contribution of energy efficiency measures to climate protection within the European Union until 2050”, Karlsruhe: Fraunhofer Institute for Systems and Innovation Research ISI, 2012.
[5]. EC, “White Paper: Roadmap to a Single European Transport Area – Towards a Competitive and Resource Efficient Transport System”, COM (2011) 144 final
[6]. EC Directorate-General for Energy, Consultant Paper: Financial Support for Energy Efficiency in Buildings, Brussels: February 2012
[7]. W. Eichhammer, et al., “Study on the Energy Savings Potentials in EU Member States, Candidate Countries and EEA Countries - Final Report for the European Commission Directorate-General Energy and Transport”, Karlsruhe / Grenoble / Rome / Vienna / Wuppertal: Fraunhofer ISI, ENERDATA, Institute of Studies for the Integration of Systems ISIS, Vienna Technical University, Wuppertal Institute for Climate, Environment and Energy WI, March 2009.
[8]. M. Erdoğdu, C. Karaca, A. Kurultay, “Economic Potential of Energy-Efficient Retrofitting in the Residential Buildings: The Case of Istanbul”. International Conference on Sustainable Development, November 12-15, 2015 / Belgrade.
[9]. H. Geller and S. Attali, The Experience with Energy Efficiency Policies and Programmes in IEA Countries: Learning from the Critics, IEA, August 2005.
[10]. K. Gillingham, R. G. Newell and K. Palmer, “Energy Efficiency Economics and Policy”, Resources for Future Discussion Paper, RFF DP 09-13, Washington D.C, 2009.
[11]. W. Hogan and D. Jorgenson, “Productivity Trends and The Cost of Reducing CO2 Emissions”, The Energy Journal, 12(1), 67-86. 1991.

ICSD 2015 BELGRADE
181
[12]. P. W. Huber and M. P. Mills, The Bottomless Well: The Twilight of Fuel, the Virtue of Waste, and Why We Will Never Run Out of Energy, New York: Basic Books, 2005.
[13]. E. Marcucci, E. Valeri and A. Stathopoulos, “Energy efficiency in transport sector: policy evolution in some European countries”, CREI Working Paper, No: 3, 2012.
[14]. Z. Morvaj and V. Bukarica, “Immediate challenge of combating climate change: effective implementation of energy efficiency policies”, 21st World Energy Congress, 2010, 12-16 September, Montreal, Canada
[15]. ODYSSEE-MURE, “Energy Efficiency Trends and Policies in Industry: An Analysis Based on the ODYSSEE and MURE Databases”, September 2015.
[16]. J. Shogren and L. Taylor, “On Behavioral-Environmental Economics”, Review of Environmental Economics and Policy, 2, 26-44, 2008.
[17]. R. J. Sutherland, (2003), The High Costs of Federal Energy Efficiency Standards for Residential Appliances, The Cato Institute Policy Analysis no. 504, Washington D.C.: The Cato Institute.UNDP (2009). Promoting Energy Efficiency in Buildings: Lessons Learned from International Experience. United Nations Development Programme. New York. [Online]. Available: https://www.thegef.org/gef/sites/thegef.org/files/publication/EEBuilding_WEB.pdf
[18]. B. Wesselink, R. Harmsen & W. Eichhammer, Energy Savings 2020: How to Triple the Impact of Energy Saving Policies in Europe. September, 2010.

Copyright © 2022 FDOKUMEN