Boberg (2000) LVC paper on linguistic diffusion across US-Canada border
24
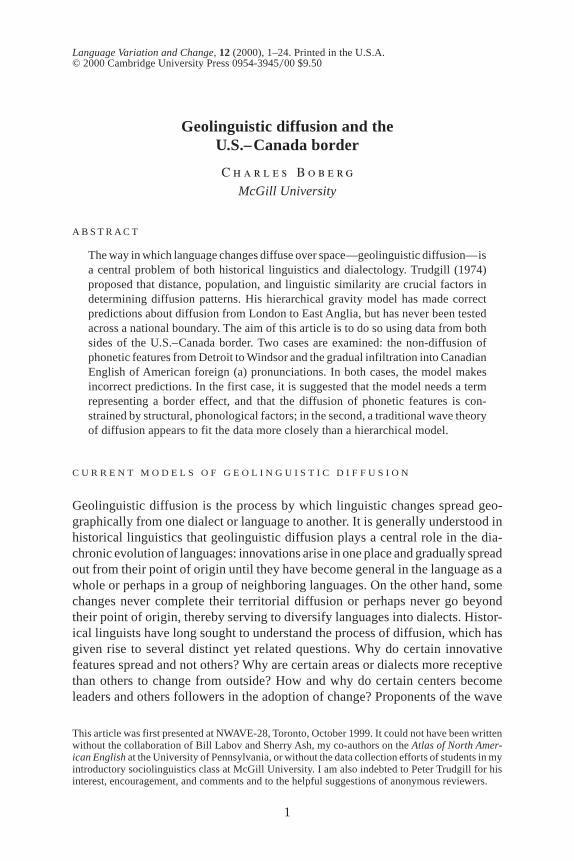
Geolinguistic diffusion and the U.S.–Canada border Charles Boberg McGill University ABSTRACT The way in which language changes diffuse over space—geolinguistic diffusion—is a central problem of both historical linguistics and dialectology. Trudgill (1974) proposed that distance, population, and linguistic similarity are crucial factors in determining diffusion patterns. His hierarchical gravity model has made correct predictions about diffusion from London to East Anglia, but has never been tested across a national boundary. The aim of this article is to do so using data from both sides of the U.S.–Canada border. Two cases are examined: the non-diffusion of phonetic features from Detroit to Windsor and the gradual infiltration into Canadian English of American foreign (a) pronunciations. In both cases, the model makes incorrect predictions. In the first case, it is suggested that the model needs a term representing a border effect, and that the diffusion of phonetic features is con- strained by structural, phonological factors; in the second, a traditional wave theory of diffusion appears to fit the data more closely than a hierarchical model. CURRENT MODELS OF GEOLINGUISTIC DIFFUSION Geolinguistic diffusion is the process by which linguistic changes spread geo- graphically from one dialect or language to another. It is generally understood in historical linguistics that geolinguistic diffusion plays a central role in the dia- chronic evolution of languages: innovations arise in one place and gradually spread out from their point of origin until they have become general in the language as a whole or perhaps in a group of neighboring languages. On the other hand, some changes never complete their territorial diffusion or perhaps never go beyond their point of origin, thereby serving to diversify languages into dialects. Histor- ical linguists have long sought to understand the process of diffusion, which has given rise to several distinct yet related questions. Why do certain innovative features spread and not others? Why are certain areas or dialects more receptive than others to change from outside? How and why do certain centers become leaders and others followers in the adoption of change? Proponents of the wave This article was first presented at NWAVE-28, Toronto, October 1999. It could not have been written without the collaboration of Bill Labov and Sherry Ash, my co-authors on the Atlas of North Amer- ican English at the University of Pennsylvania, or without the data collection efforts of students in my introductory sociolinguistics class at McGill University. I am also indebted to Peter Trudgill for his interest, encouragement, and comments and to the helpful suggestions of anonymous reviewers. Language Variation and Change, 12 (2000), 1–24. Printed in the U.S.A. © 2000 Cambridge University Press 0954-3945000 $9.50 1
Transcript of Boberg (2000) LVC paper on linguistic diffusion across US-Canada border
Geolinguistic diffusion and theU.S.–Canada border
C h a r l e s B o b e r g
McGill University
A B S T R A C T
The way in which language changes diffuse over space—geolinguistic diffusion—isa central problem of both historical linguistics and dialectology. Trudgill (1974)proposed that distance, population, and linguistic similarity are crucial factors indetermining diffusion patterns. His hierarchical gravity model has made correctpredictions about diffusion from London to East Anglia, but has never been testedacross a national boundary. The aim of this article is to do so using data from bothsides of the U.S.–Canada border. Two cases are examined: the non-diffusion ofphonetic features from Detroit to Windsor and the gradual infiltration into CanadianEnglish of American foreign (a) pronunciations. In both cases, the model makesincorrect predictions. In the first case, it is suggested that the model needs a termrepresenting a border effect, and that the diffusion of phonetic features is con-strained by structural, phonological factors; in the second, a traditional wave theoryof diffusion appears to fit the data more closely than a hierarchical model.
C U R R E N T M O D E L S O F G E O L I N G U I S T I C D I F F U S I O N
Geolinguistic diffusion is the process by which linguistic changes spread geo-graphically from one dialect or language to another. It is generally understood inhistorical linguistics that geolinguistic diffusion plays a central role in the dia-chronic evolution of languages: innovations arise in one place and gradually spreadout from their point of origin until they have become general in the language as awhole or perhaps in a group of neighboring languages. On the other hand, somechanges never complete their territorial diffusion or perhaps never go beyondtheir point of origin, thereby serving to diversify languages into dialects. Histor-ical linguists have long sought to understand the process of diffusion, which hasgiven rise to several distinct yet related questions. Why do certain innovativefeatures spread and not others? Why are certain areas or dialects more receptivethan others to change from outside? How and why do certain centers becomeleaders and others followers in the adoption of change? Proponents of the wave
This article was first presented at NWAVE-28, Toronto, October 1999. It could not have been writtenwithout the collaboration of Bill Labov and Sherry Ash, my co-authors on theAtlas of North Amer-ican Englishat the University of Pennsylvania, or without the data collection efforts of students in myintroductory sociolinguistics class at McGill University. I am also indebted to Peter Trudgill for hisinterest, encouragement, and comments and to the helpful suggestions of anonymous reviewers.
Language Variation and Change,12 (2000), 1–24. Printed in the U.S.A.© 2000 Cambridge University Press 0954-3945000 $9.50
1
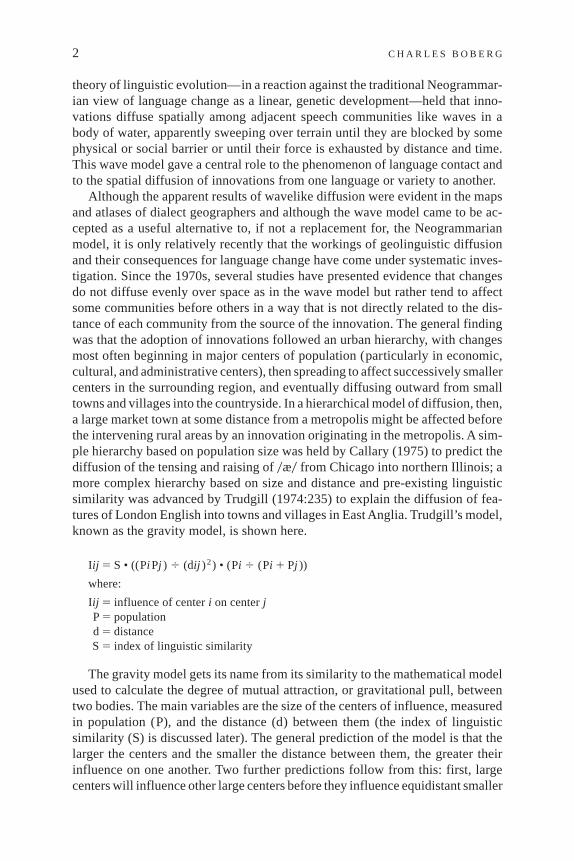
theory of linguistic evolution—in a reaction against the traditional Neogrammar-ian view of language change as a linear, genetic development—held that inno-vations diffuse spatially among adjacent speech communities like waves in abody of water, apparently sweeping over terrain until they are blocked by somephysical or social barrier or until their force is exhausted by distance and time.This wave model gave a central role to the phenomenon of language contact andto the spatial diffusion of innovations from one language or variety to another.
Although the apparent results of wavelike diffusion were evident in the mapsand atlases of dialect geographers and although the wave model came to be ac-cepted as a useful alternative to, if not a replacement for, the Neogrammarianmodel, it is only relatively recently that the workings of geolinguistic diffusionand their consequences for language change have come under systematic inves-tigation. Since the 1970s, several studies have presented evidence that changesdo not diffuse evenly over space as in the wave model but rather tend to affectsome communities before others in a way that is not directly related to the dis-tance of each community from the source of the innovation. The general findingwas that the adoption of innovations followed an urban hierarchy, with changesmost often beginning in major centers of population (particularly in economic,cultural, and administrative centers), then spreading to affect successively smallercenters in the surrounding region, and eventually diffusing outward from smalltowns and villages into the countryside. In a hierarchical model of diffusion, then,a large market town at some distance from a metropolis might be affected beforethe intervening rural areas by an innovation originating in the metropolis. A sim-ple hierarchy based on population size was held by Callary (1975) to predict thediffusion of the tensing and raising of0æ0 from Chicago into northern Illinois; amore complex hierarchy based on size and distance and pre-existing linguisticsimilarity was advanced by Trudgill (1974:235) to explain the diffusion of fea-tures of London English into towns and villages in East Anglia. Trudgill’s model,known as the gravity model, is shown here.
Iij 5 S • ((Pi Pj ) 4 (dij )2) • (Pi 4 (Pi 1 Pj ))
where:
Iij 5 influence of centeri on centerjP5 populationd 5 distanceS5 index of linguistic similarity
The gravity model gets its name from its similarity to the mathematical modelused to calculate the degree of mutual attraction, or gravitational pull, betweentwo bodies. The main variables are the size of the centers of influence, measuredin population (P), and the distance (d) between them (the index of linguisticsimilarity (S) is discussed later). The general prediction of the model is that thelarger the centers and the smaller the distance between them, the greater theirinfluence on one another. Two further predictions follow from this: first, largecenters will influence other large centers before they influence equidistant smaller
2 C H A R L E S B O B E R G
ones; second, when two centers are not equal in size, the larger will have a greaterinfluence on the smaller than vice versa. These predictions accord well not onlywith a good deal of evidence from historical linguistics, which shows that manychanges appear earlier in major centers like London than in their surroundinghinterlands, but also with our intuitive notions of the structure of society andhuman interaction. An inspection of an airline route map, for instance, suggeststhat the greatest amount of intercity interaction is among major regional centers,from which less-traveled routes fan out to smaller local centers. Taking this as areflection of patterns of personal communication and interaction, people in smalltowns only gain access to people in metropolises through people in large regionalcenters. This is also the way government and business administration work insetting up administrative hierarchies involving head, regional, and branch of-fices. Thus, people in New York City or Toronto are more likely to find them-selves talking to people in Los Angeles or Vancouver than to people in Nebraskaor Saskatchewan, even though the latter are closer to New York and Toronto.Intercity communication follows a hierarchical model.
Sociolinguistic studies of language change have shown that personal inter-action is the catalyst for the diffusion of at least some kinds of linguistic innova-tion. Labov (1980:261) found that Philadelphia vowel shifts were most advancedamong people with a maximal number of contacts outside their neighborhoods.Milroy and Milroy (1992) showed that a similar group of people in Belfast (i.e.,people with the greatest number of weak external ties) was most likely to lead inthe loss of local dialect features or in the convergence with regional or standardvarieties. If intercity personal interaction follows a hierarchical model, as sug-gested here, then we would expect linguistic changes to diffuse along the urbanhierarchy.
The diffusion studies of the 1970s have important limitations, however. Tobegin with, they considered only a few instances of the diffusion of individualfeatures; thus, the lack of a wide range of comparable studies prevents us frombeing as sure of their conclusions as we might be. A recent study of languagechange in progress in Oklahoma, for instance, shed new light on the possibilitiesof hierarchical diffusion by showing that a top-to-bottom hierarchical model ex-plained the spread of only some features; others appeared to be diffusing contra-hierarchically, from the countryside into the towns and finally to the cities (Bailey,Wikle, Tillery, & Sand, 1993).
Another limitation, which is the direct concern of this article, is that Callaryand Trudgill examined the diffusion of innovations only within regional dialectareas. This is a limitation because the English-speaking community, like the pop-ulations who speak French, Spanish, and many other languages, is now spreadnot just over many different dialect areas, but among many different nations.Some of these nations are geographically contiguous and have a long history offace-to-face interaction; all of them have for at least a generation enjoyed sub-stantial contact by means of migration, travel, and electronic communication.Chambers and Trudgill (1998:170–175) showed how, long before the age of tech-nologically facilitated travel and communication, a Parisian innovation in the
G E O L I N G U I S T I C D I F F U S I O N 3
pronunciation of0r0—the substitution of a uvular trill for an apical trill—spreadnot just to other French dialects, but across languages from French to German andDanish, apparently jumping hierarchically from Paris to the major cities of Co-logne, Berlin, and Copenhagen without affecting intervening territory until muchlater. If innovative features can spread from one language to another, we mightwell ask whether and how innovations diffuse within one language across na-tional boundaries.
G E O L I N G U I S T I C D I F F U S I O N I N N O R T H A M E R I C A N E N G L I S H :
T H E U . S . – C A N A D A B O R D E R
The national boundary between the United States and Canada presents an idealopportunity to study transnational geolinguistic diffusion. Like the boundary be-tween France and Belgium or that between Germany and Austria, the boundarybetween the United States and Canada separates two populations that speak mu-tually intelligible yet distinctive varieties of the same language, one of which issupported by a vastly more numerous and culturally influential population thanthe other. In the North American case, where the United States is approximatelyten times as populous as Canada and the flow of popular culture is overwhelm-ingly unidirectional from the United States into Canada, we would expect Amer-ican English (or rather American Englishes) to have an influence on how Englishis spoken in Canada.Assessing or deploring this influence, particularly in light ofthe supposedly more British heritage of Canadian English, has been a favoriteactivity of both linguists and cultural nationalists in Canada for a long time. (Forexamples of linguistic assessments, see Bloomfield, 1948; Chambers, 1998;Nylvek, 1992; Scargill, 1957; Zeller, 1993.)
Viewed from a non-English perspective, the differences between the kinds ofEnglish spoken along theAmerican and Canadian sides of the international bound-ary are neither many nor large. Given the common elements in the historicalorigins of these varieties, the location of the majority of the Canadian populationwithin a few hours’drive of the border, and the lack of any substantial restrictionson cross-border movement of people or cultural products, this is perhaps what wewould expect. Yet enough differences persist that the role of the political andinstitutional border as a linguistic boundary is not a trivial question. CanadianEnglish is distinct enough to be subject to measurable American influence atevery level of grammar, so that examining the progress of this influence mayserve to illuminate the linguistic status of political boundaries and to test theadequacy of current models of geolinguistic diffusion in a transnational context.
This article examines the predictions made by Trudgill’s gravity model aboutthe linguistic influence of six majorAmerican cities on six major Canadian cities.The American cities include four major cities on or near the Canadian border(Seattle, Detroit, Buffalo, and Boston) as well as the metropolises and worldcultural capitals on the east and west coasts (New York City and LosAngeles). Toget a sense of perspective, the influence of London (England) was also calcu-
4 C H A R L E S B O B E R G
lated. The Canadian cities represent a selection of major population centers acrossthe country (Vancouver, Calgary, Toronto, Montréal, and Halifax) as well as Wind-sor, a large border town in southwestern Ontario located directly across the riverfrom Detroit. A second series of calculations measured the influence of Canadiancities on each other, since it may be presumed that American influence that entersCanada in one place may spread to other cities by means of secondary influence;this is equivalent to Trudgill’s calculations of the influence of one town on an-other in East Anglia (1974:235–237).
The gravity model has no provision for a national border, but it does include anindex of pre-existing linguistic similarity, the term that Trudgill labels S in hisequation. This is a simple multiplier of the result of the size and distance calcu-lation and is intended to produce larger influence values for places that sharemany linguistic features than for places that share relatively few. Trudgill’s quan-tification of linguistic similarity is somewhat vague and makes no reference tospecific features, but follows a general taxonomy of English regional varietiesfrom the specific to the general (1974:234). In his scheme, the speech of Norwichis most similar to other Norfolk varieties (S5 4), then to other East Anglianvarieties (S5 3), then to other southeastern varieties (S5 2), and then to anyother English variety (S5 1).
The same approach to linguistic similarity is adopted here, but more explicituse has been made of similarities in phonological structure as the main crite-rion for ranking. The most basic reference points for structural comparison arethe two “pivot points” demonstrated by Labov (1991:12) to be the most con-sequential phonological variables in North American English: the status of0æ0(one phoneme or split into tense and lax lexical classes) and the status of0A0and 0O:0 (distinct or merged). Since all Canadian cities share a common pho-nology in these terms (0æ0 is one phoneme, and0A0 and 0O:0 are merged) inaddition to other linguistic features that can be identified as “Canadian,” anypair of Canadian cities was assigned a maximal similarity index of 5. Any pairinvolving Los Angeles or Seattle, which are not Canadian but share an identi-cal phonological system and many phonetic similarities, was assigned an indexof 4. Buffalo and Detroit, on the other hand, differ from Canadian English inmaintaining the phonemic distinction between0A0 and 0O:0 and also exhibitstriking phonetic differences; pairs involving these cities were assigned an in-dex of 3. New York City and Boston are even more different from CanadianEnglish than are Buffalo and Detroit, retaining a wider range of vowel con-trasts before0r0, which is often vocalized, and diverging from Canadian En-glish in terms of both pivot points in the case of New York City and one pivotpoint (i.e., the status of0æ0) in the case of Boston. Any pair involving NewYork City or Boston was therefore assigned an index of 2. Finally, any pairinvolving the non–North American variety of English spoken in London wasassigned the minimal index of 1. The absolute values of the similarity indexare obviously somewhat arbitrary, but the relative values that are required areclear. In any case, it will become obvious that the value of S does not have alarge effect on the main pattern of the results.
G E O L I N G U I S T I C D I F F U S I O N 5
The population figures used in the calculations are metropolitan area statisticsfrom the 1990 census for the United States and the 1991 census for Canada,rounded to the nearest hundred thousand. The tables show population in thou-sands, and it was these numbers (actual populations divided by 1,000) that wereused in the calculations in order to reduce the size of the resulting indices. Theentire population of Montréal was included, though this is obviously a method-ological problem since anglophones are a minority there. In fact, the effectivepopulation of any city with a large group of citizens who speak some other lan-guage or variety than the one under study is difficult to assess for purposes ofmeasuring influence. For example, a large proportion of the population of Detroit(76% of the city and 21% of the metropolitan area in 1990) speaks African Amer-ican English, which could not be expected to have the same kind or amount ofinfluence on Canadian speech as European American varieties. This is one ofmany procedural problems in applying Trudgill’s model. Others include the rel-evance of land distance in an age of jet travel and electronic communication andthe problem of what to take as the source of influence: cities, regions, or theUnited States as a whole. Cities have the advantage of being specific points fromwhich distances can be measured, but calculating the influence of every singleAmerican city near the Canadian border would be problematically laborious. Inaddition to the challenge of a national border, then, the North American situationpresents other practical complexities for the application of the gravity model.Trudgill (and Callary) examined the influence of a single metropolis on its hin-terland, a much easier situation to model.
Putting aside these methodological problems, the results of the gravity modelcalculations are shown in Table 1. The model predicts, as we would expect, anoverwhelming influence of Detroit on Windsor, since Detroit is vastly larger andless than a mile away. The skyscrapers of downtown Detroit in fact can be seenfrom many places in Windsor, almost as though Windsor were a neighborhood ofDetroit rather than a city in a different country. This influence is disproportion-ately larger than any other: the actual value produced is about 4 million. Bycomparison, the influence of Detroit on Toronto is just over 200, or 20,000 timessmaller than its influence on Windsor. In the same range as Detroit’s influence onToronto are New York City’s influence on Montréal (255) and Toronto (169) andSeattle’s influence on Vancouver (195). The influences of Buffalo on Toronto(117) and of Boston on Montréal (61) are smaller still, while other pairs of citiesproduce numbers that fade into comparative insignificance: for instance, the valuefor the influence of Los Angeles on Vancouver is only 20, and Boston’s influenceon Halifax is a mere 2. Remarkably, the influence of London on Canadian citiesnever rises above 0.4; perhaps this helps to explain the overwhelmingly NorthAmerican sound of Canadian English. In one case, across the Niagara River, theinfluence is reversed: the model predicts that Toronto will have a heavier influ-ence on Buffalo than Buffalo on Toronto, since Toronto is the larger of the twocities. If we sum the influences of all six American cities on each Canadian city,as shown in Table 1, the model predicts that the most heavily influenced city willbe Windsor, followed by Toronto, Montréal, Vancouver, Calgary, and Halifax.
6 C H A R L E S B O B E R G

TABLE 1. Gravity model calculation of influence (I) of major Americancities and London (England) on Canadian cities
VancouverP5 1,600
CalgaryP5 800
WindsorP5 300
TorontoP5 3,900
MontréalP5 3,100
HalifaxP5 300
Los Angeles d 2,045 2,523 3,661 4,037 4,568 5,509P5 14,500 I 20.0 6.9 1.3 10.9 7.1 0.6Seattle d 230 1,168 3,723 4,102 4,342 5,927P5 2,600 I 194.7 4.7 0.2 1.0 0.8 0.1Detroit d 3,869 3,042 1 384 915 1,856P5 4,700 I 1.1 1.0 3,976,200 203.8 31.5 1.2Buffalo d 4,325 3,437 549 168 638 1,579P5 1,200 I 0.1 0.1 2.9 117.0 7.7 0.3New York City d 4,709 3,883 1,207 826 611 1,528P5 18,000 I 2.4 1.8 7.3 169.1 255.0 4.5Boston d 5,048 4,218 1,293 974 496 1,101P5 4,200 I 0.4 0.3 1.4 17.9 60.9 1.9London (England) d 13,350 12,600 9,000 8,700 8,250 7,050P5 11,100 I 0.1 0.1 0.0 0.4 0.4 0.1
Sum of American influences 218.7 14.8 3,976,213.1 519.7 363.0 8.6
Top seven sources of influence, ranked by index score1. Detroit on Windsor 3,976,200.02. New York City on Montréal 255.03. Detroit on Toronto 203.84. Seattle on Vancouver 194.75. New York City on Toronto 169.16. Buffalo on Toronto 117.07. Boston on Montréal 60.9
Note: P5 population in thousands (United States: 1990 census; Canada: 1991 census); d5 distances in kilometers.
7
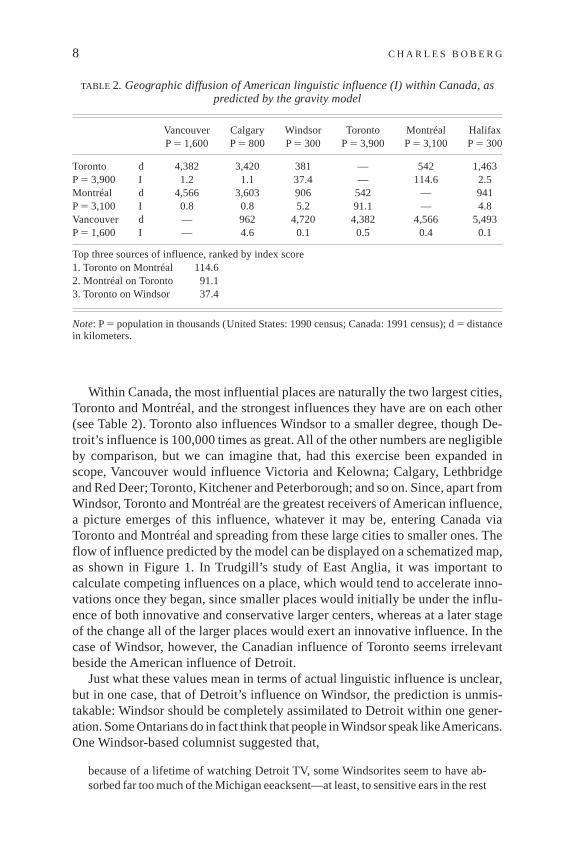
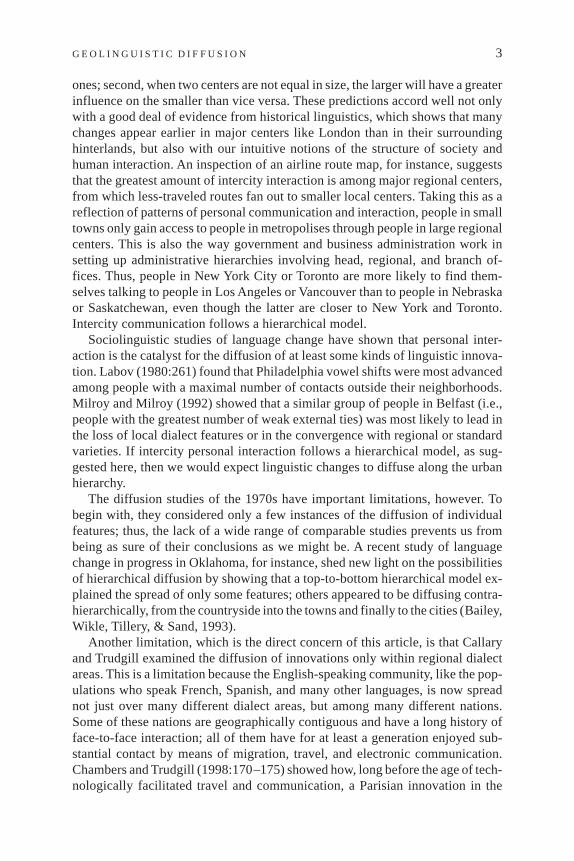
Within Canada, the most influential places are naturally the two largest cities,Toronto and Montréal, and the strongest influences they have are on each other(see Table 2). Toronto also influences Windsor to a smaller degree, though De-troit’s influence is 100,000 times as great. All of the other numbers are negligibleby comparison, but we can imagine that, had this exercise been expanded inscope, Vancouver would influence Victoria and Kelowna; Calgary, Lethbridgeand Red Deer; Toronto, Kitchener and Peterborough; and so on. Since, apart fromWindsor, Toronto and Montréal are the greatest receivers of American influence,a picture emerges of this influence, whatever it may be, entering Canada viaToronto and Montréal and spreading from these large cities to smaller ones. Theflow of influence predicted by the model can be displayed on a schematized map,as shown in Figure 1. In Trudgill’s study of East Anglia, it was important tocalculate competing influences on a place, which would tend to accelerate inno-vations once they began, since smaller places would initially be under the influ-ence of both innovative and conservative larger centers, whereas at a later stageof the change all of the larger places would exert an innovative influence. In thecase of Windsor, however, the Canadian influence of Toronto seems irrelevantbeside the American influence of Detroit.
Just what these values mean in terms of actual linguistic influence is unclear,but in one case, that of Detroit’s influence on Windsor, the prediction is unmis-takable: Windsor should be completely assimilated to Detroit within one gener-ation. Some Ontarians do in fact think that people in Windsor speak likeAmericans.One Windsor-based columnist suggested that,
because of a lifetime of watching Detroit TV, some Windsorites seem to have ab-sorbed far too much of the Michigan eeacksent—at least, to sensitive ears in the rest
TABLE 2. Geographic diffusion of American linguistic influence (I) within Canada, aspredicted by the gravity model
VancouverP5 1,600
CalgaryP5 800
WindsorP5 300
TorontoP5 3,900
MontréalP5 3,100
HalifaxP5 300
Toronto d 4,382 3,420 381 — 542 1,463P5 3,900 I 1.2 1.1 37.4 — 114.6 2.5Montréal d 4,566 3,603 906 542 — 941P5 3,100 I 0.8 0.8 5.2 91.1 — 4.8Vancouver d — 962 4,720 4,382 4,566 5,493P5 1,600 I — 4.6 0.1 0.5 0.4 0.1
Top three sources of influence, ranked by index score1. Toronto on Montréal 114.62. Montréal on Toronto 91.13. Toronto on Windsor 37.4
Note: P5 population in thousands (United States: 1990 census; Canada: 1991 census); d5 distancein kilometers.
8 C H A R L E S B O B E R G

of Canada. Now, Windsor natives aren’t quite as grating with the nasal twang, butthey can still be identified during rush hour from the far end of a subway platformin Toronto. . . . Throw in the pronunciation “daller” and the average Torontonianimmediately wants to push them in front of the next train. (Vander Doelen, 1998)
But this impression turns out to be erroneous or at least based on something otherthan the phonology and phonetics of Windsor English, which are by far the mostimportant determinant of the overall impression an outsider would have of theway people in Windsor speak. When we inspect acoustic analyses of the vowelsystems of people on either side of the Detroit River, we see a difference as big aswhat we might expect to find—and do find—between places much farther apart,such as Toronto and Chicago.
P H O N E T I C F E AT U R E S : T H E N AT I O N A L B O U N D A R Y
A S A L I N G U I S T I C B A R R I E R
Acoustic data on the speech of Americans and Canadians on either side of theinternational border are now available as a result of the Telephone Survey ofChange in Progress in North American English, carried out at the LinguisticsLaboratory of the University of Pennsylvania, a project that is now publishing anAtlas of North American English(Labov, Ash, & Boberg, to appear). These datacome from acoustic analysis of several hundred vowels for each speaker, elicitedby means of a sociolinguistic interview conducted and tape-recorded over thetelephone. The vowel systems presented in this article show normalized meanmeasurements for the vowels under discussion (rather than individual tokens ofeach vowel) as well as those means that are useful for establishing the outlines ofthe vowel space, such as those for0 i:0 and0u:0. Vowels not relevant to the dis-cussion are omitted from the charts in the interest of clarity. The means are allbased on at least 5 tokens and, in most cases, on 15 or 20 tokens. Each vowel chart
figure 1. Geographic diffusion of American linguistic influence on Canada, as predictedby the gravity model.
G E O L I N G U I S T I C D I F F U S I O N 9
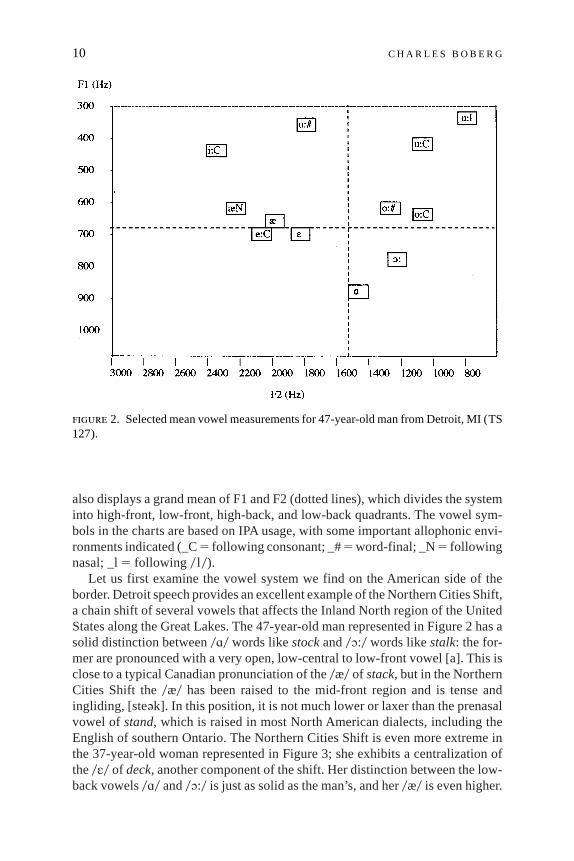
also displays a grand mean of F1 and F2 (dotted lines), which divides the systeminto high-front, low-front, high-back, and low-back quadrants. The vowel sym-bols in the charts are based on IPA usage, with some important allophonic envi-ronments indicated (_C5 following consonant; _#5word-final; _N5 followingnasal; _l5 following 0 l 0).
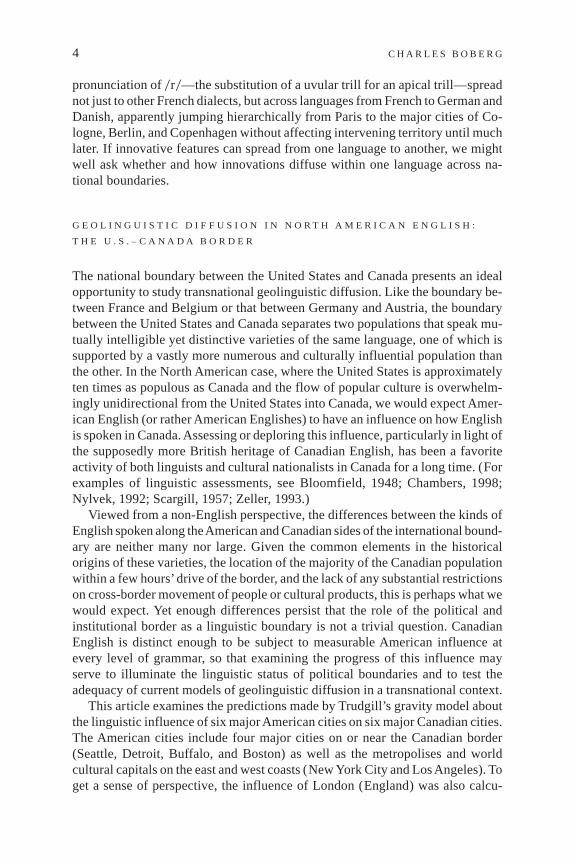
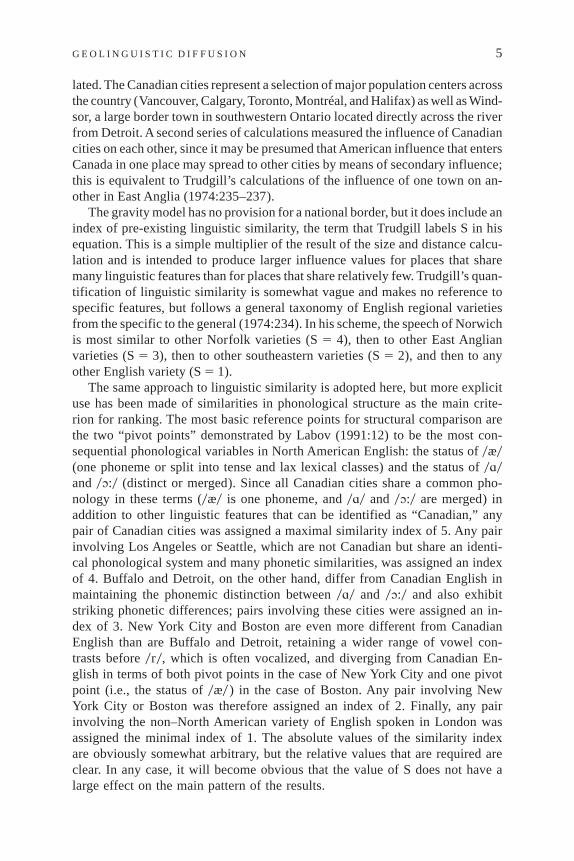
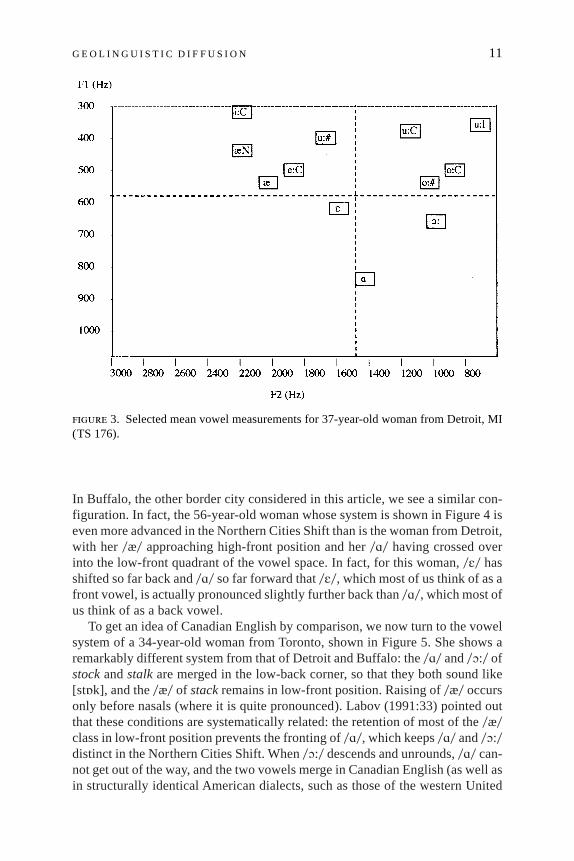
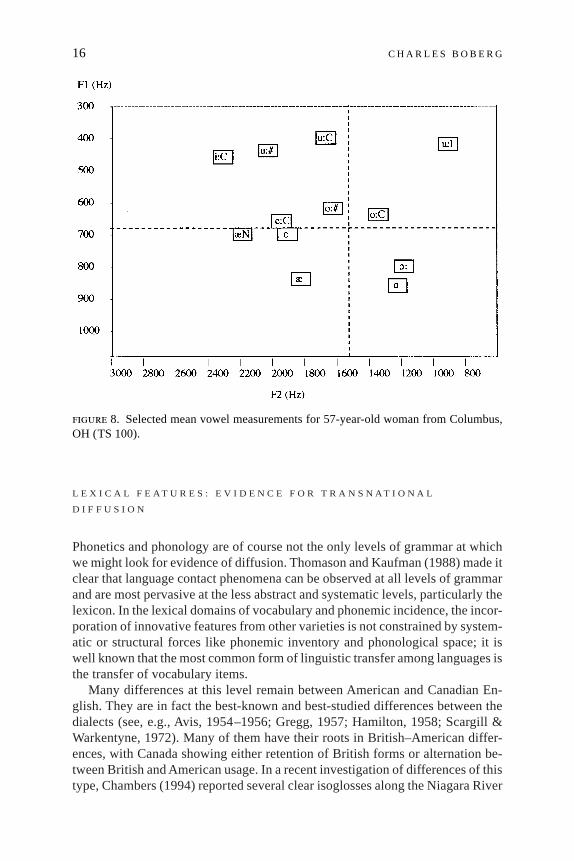
Let us first examine the vowel system we find on the American side of theborder. Detroit speech provides an excellent example of the Northern Cities Shift,a chain shift of several vowels that affects the Inland North region of the UnitedStates along the Great Lakes. The 47-year-old man represented in Figure 2 has asolid distinction between0A0 words likestockand0O:0 words likestalk: the for-mer are pronounced with a very open, low-central to low-front vowel [a]. This isclose to a typical Canadian pronunciation of the0æ0 of stack, but in the NorthernCities Shift the0æ0 has been raised to the mid-front region and is tense andingliding, [ste@k]. In this position, it is not much lower or laxer than the prenasalvowel of stand, which is raised in most North American dialects, including theEnglish of southern Ontario. The Northern Cities Shift is even more extreme inthe 37-year-old woman represented in Figure 3; she exhibits a centralization ofthe0E0 of deck, another component of the shift. Her distinction between the low-back vowels0A0 and0O:0 is just as solid as the man’s, and her0æ0 is even higher.
figure 2. Selected mean vowel measurements for 47-year-old man from Detroit, MI (TS127).
10 C H A R L E S B O B E R G
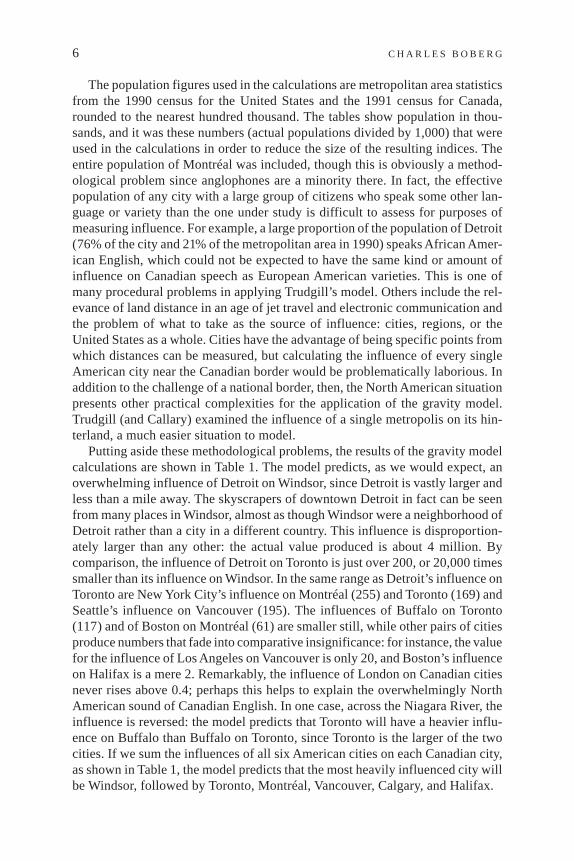
In Buffalo, the other border city considered in this article, we see a similar con-figuration. In fact, the 56-year-old woman whose system is shown in Figure 4 iseven more advanced in the Northern Cities Shift than is the woman from Detroit,with her 0æ0 approaching high-front position and her0A0 having crossed overinto the low-front quadrant of the vowel space. In fact, for this woman,0E0 hasshifted so far back and0A0 so far forward that0E0, which most of us think of as afront vowel, is actually pronounced slightly further back than0A0, which most ofus think of as a back vowel.
To get an idea of Canadian English by comparison, we now turn to the vowelsystem of a 34-year-old woman from Toronto, shown in Figure 5. She shows aremarkably different system from that of Detroit and Buffalo: the0A0 and0O:0 ofstockandstalkare merged in the low-back corner, so that they both sound like[stÁk], and the0æ0 of stackremains in low-front position. Raising of0æ0 occursonly before nasals (where it is quite pronounced). Labov (1991:33) pointed outthat these conditions are systematically related: the retention of most of the0æ0class in low-front position prevents the fronting of0A0, which keeps0A0 and0O:0distinct in the Northern Cities Shift. When0O:0 descends and unrounds,0A0 can-not get out of the way, and the two vowels merge in Canadian English (as well asin structurally identical American dialects, such as those of the western United
figure 3. Selected mean vowel measurements for 37-year-old woman from Detroit, MI(TS 176).
G E O L I N G U I S T I C D I F F U S I O N 11
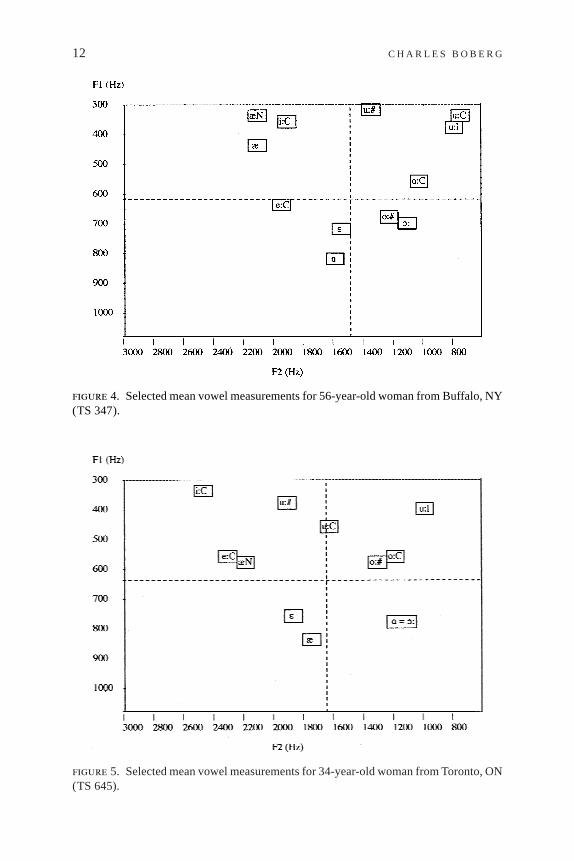
figure 4. Selected mean vowel measurements for 56-year-old woman from Buffalo, NY(TS 347).
figure 5. Selected mean vowel measurements for 34-year-old woman from Toronto, ON(TS 645).
12 C H A R L E S B O B E R G
States). Clarke hypothesized that this merger creates a pull-chain effect, whichshe called the Canadian Shift, whereby0æ0 begins to move back into centralposition to fill up the space created by the merger of the low-back vowels (Clarke,Elms, & Youssef, 1995).
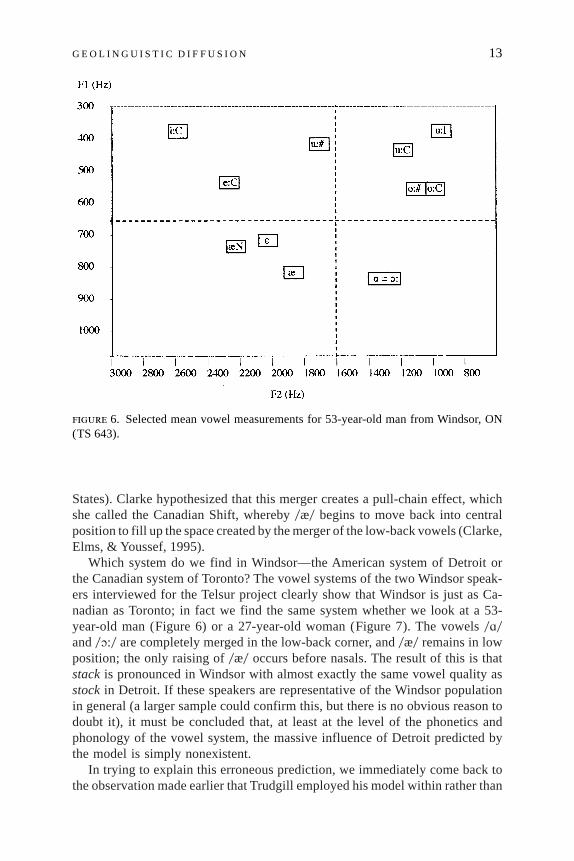
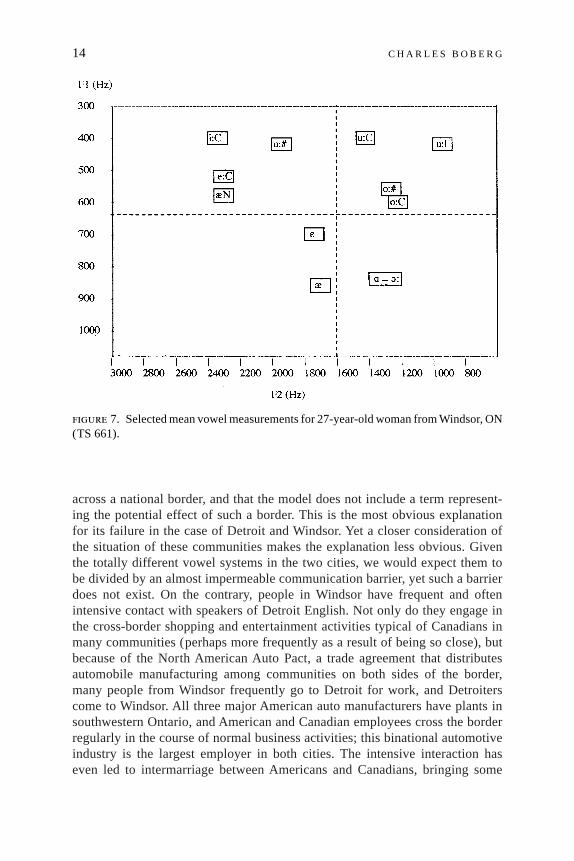
Which system do we find in Windsor—the American system of Detroit orthe Canadian system of Toronto? The vowel systems of the two Windsor speak-ers interviewed for the Telsur project clearly show that Windsor is just as Ca-nadian as Toronto; in fact we find the same system whether we look at a 53-year-old man (Figure 6) or a 27-year-old woman (Figure 7). The vowels0A0and0O:0 are completely merged in the low-back corner, and0æ0 remains in lowposition; the only raising of0æ0 occurs before nasals. The result of this is thatstackis pronounced in Windsor with almost exactly the same vowel quality asstockin Detroit. If these speakers are representative of the Windsor populationin general (a larger sample could confirm this, but there is no obvious reason todoubt it), it must be concluded that, at least at the level of the phonetics andphonology of the vowel system, the massive influence of Detroit predicted bythe model is simply nonexistent.
In trying to explain this erroneous prediction, we immediately come back tothe observation made earlier that Trudgill employed his model within rather than
figure 6. Selected mean vowel measurements for 53-year-old man from Windsor, ON(TS 643).
G E O L I N G U I S T I C D I F F U S I O N 13
across a national border, and that the model does not include a term represent-ing the potential effect of such a border. This is the most obvious explanationfor its failure in the case of Detroit and Windsor. Yet a closer consideration ofthe situation of these communities makes the explanation less obvious. Giventhe totally different vowel systems in the two cities, we would expect them tobe divided by an almost impermeable communication barrier, yet such a barrierdoes not exist. On the contrary, people in Windsor have frequent and oftenintensive contact with speakers of Detroit English. Not only do they engage inthe cross-border shopping and entertainment activities typical of Canadians inmany communities (perhaps more frequently as a result of being so close), butbecause of the North American Auto Pact, a trade agreement that distributesautomobile manufacturing among communities on both sides of the border,many people from Windsor frequently go to Detroit for work, and Detroiterscome to Windsor. All three major American auto manufacturers have plants insouthwestern Ontario, and American and Canadian employees cross the borderregularly in the course of normal business activities; this binational automotiveindustry is the largest employer in both cities. The intensive interaction haseven led to intermarriage between Americans and Canadians, bringing some
figure 7. Selected mean vowel measurements for 27-year-old woman from Windsor, ON(TS 661).
14 C H A R L E S B O B E R G
members of each speech community into the kind of personal network rela-tions that sociolinguists generally hold to be the main conduits of linguisticinfluence (Milroy & Milroy, 1992).
It is therefore difficult to imagine a communication barrier along the DetroitRiver that would be of the necessary magnitude to block a linguistic influence asintensive as that predicted by our model. Turning to other possible explanations,we might suggest that setting the linguistic similarity index so high was an error,given the phonological differences between Detroit, with a low-back (0A0 vs.0O:0) distinction, and Windsor, with a low-back merger. Labov (1991) demon-strated that such phonological differences have wide-ranging phonetic conse-quences and are the root of the major dialect divisions in modern NorthAmericanEnglish. Perhaps a difference like this should cause us to set the linguistic simi-larity index at zero, which would produce zero influence, essentially what we seeat the phonetic level. Evidently, the internal structure of the vowel system is astrong enough factor to prevent the diffusion of phonetic features from one dia-lect to another, at least when those phonetic features are structurally embedded.Trudgill anticipated this result, warning that “we have to take thelinguistic sys-teminto account as a resistance factor”; he pointed to matters of phonemic con-trast as an important example of this factor (1974:241).
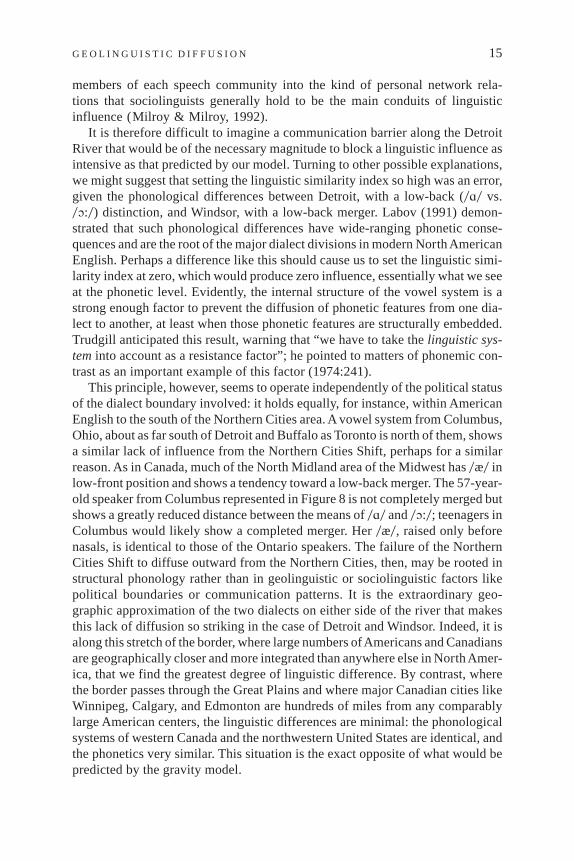
This principle, however, seems to operate independently of the political statusof the dialect boundary involved: it holds equally, for instance, within AmericanEnglish to the south of the Northern Cities area. A vowel system from Columbus,Ohio, about as far south of Detroit and Buffalo as Toronto is north of them, showsa similar lack of influence from the Northern Cities Shift, perhaps for a similarreason. As in Canada, much of the North Midland area of the Midwest has0æ0 inlow-front position and shows a tendency toward a low-back merger. The 57-year-old speaker from Columbus represented in Figure 8 is not completely merged butshows a greatly reduced distance between the means of0A0 and0O:0; teenagers inColumbus would likely show a completed merger. Her0æ0, raised only beforenasals, is identical to those of the Ontario speakers. The failure of the NorthernCities Shift to diffuse outward from the Northern Cities, then, may be rooted instructural phonology rather than in geolinguistic or sociolinguistic factors likepolitical boundaries or communication patterns. It is the extraordinary geo-graphic approximation of the two dialects on either side of the river that makesthis lack of diffusion so striking in the case of Detroit and Windsor. Indeed, it isalong this stretch of the border, where large numbers ofAmericans and Canadiansare geographically closer and more integrated than anywhere else in NorthAmer-ica, that we find the greatest degree of linguistic difference. By contrast, wherethe border passes through the Great Plains and where major Canadian cities likeWinnipeg, Calgary, and Edmonton are hundreds of miles from any comparablylarge American centers, the linguistic differences are minimal: the phonologicalsystems of western Canada and the northwestern United States are identical, andthe phonetics very similar. This situation is the exact opposite of what would bepredicted by the gravity model.
G E O L I N G U I S T I C D I F F U S I O N 15
L E X I C A L F E AT U R E S : E V I D E N C E F O R T R A N S N AT I O N A L
D I F F U S I O N
Phonetics and phonology are of course not the only levels of grammar at whichwe might look for evidence of diffusion. Thomason and Kaufman (1988) made itclear that language contact phenomena can be observed at all levels of grammarand are most pervasive at the less abstract and systematic levels, particularly thelexicon. In the lexical domains of vocabulary and phonemic incidence, the incor-poration of innovative features from other varieties is not constrained by system-atic or structural forces like phonemic inventory and phonological space; it iswell known that the most common form of linguistic transfer among languages isthe transfer of vocabulary items.
Many differences at this level remain between American and Canadian En-glish. They are in fact the best-known and best-studied differences between thedialects (see, e.g., Avis, 1954–1956; Gregg, 1957; Hamilton, 1958; Scargill &Warkentyne, 1972). Many of them have their roots in British–American differ-ences, with Canada showing either retention of British forms or alternation be-tween British and American usage. In a recent investigation of differences of thistype, Chambers (1994) reported several clear isoglosses along the Niagara River
figure 8. Selected mean vowel measurements for 57-year-old woman from Columbus,OH (TS 100).
16 C H A R L E S B O B E R G
between Canadians in southwestern Ontario and Americans in upstate New York.For example, Canadians pronounce the past tense ofshineto rhyme withgone, inthe British fashion, whereas forAmericans it rhymes withbone.The internationalborder separates two distinct varieties of English at this level.
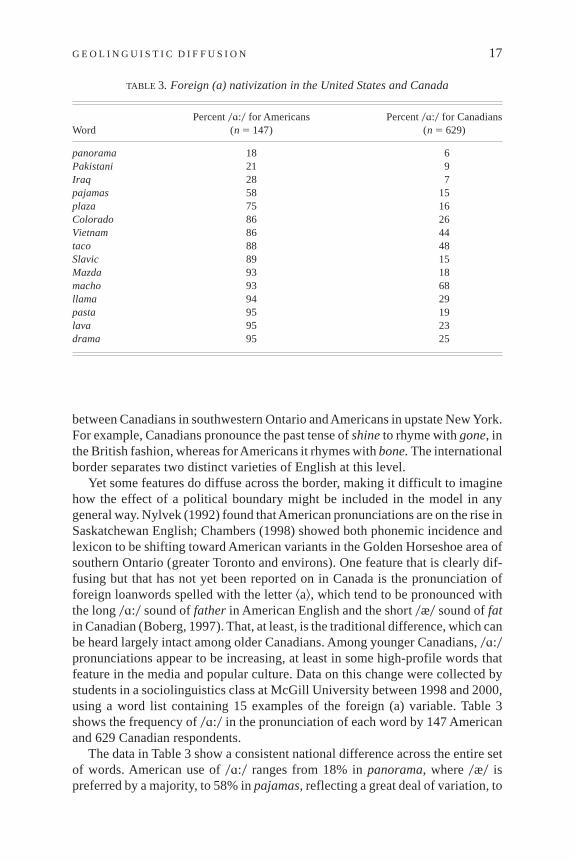
Yet some features do diffuse across the border, making it difficult to imaginehow the effect of a political boundary might be included in the model in anygeneral way. Nylvek (1992) found thatAmerican pronunciations are on the rise inSaskatchewan English; Chambers (1998) showed both phonemic incidence andlexicon to be shifting toward American variants in the Golden Horseshoe area ofsouthern Ontario (greater Toronto and environs). One feature that is clearly dif-fusing but that has not yet been reported on in Canada is the pronunciation offoreign loanwords spelled with the letter^a&, which tend to be pronounced withthe long0A:0 sound offather in American English and the short0æ0 sound offatin Canadian (Boberg, 1997). That, at least, is the traditional difference, which canbe heard largely intact among older Canadians. Among younger Canadians,0A:0pronunciations appear to be increasing, at least in some high-profile words thatfeature in the media and popular culture. Data on this change were collected bystudents in a sociolinguistics class at McGill University between 1998 and 2000,using a word list containing 15 examples of the foreign (a) variable. Table 3shows the frequency of0A:0 in the pronunciation of each word by 147 Americanand 629 Canadian respondents.
The data in Table 3 show a consistent national difference across the entire setof words. American use of0A:0 ranges from 18% inpanorama, where0æ0 ispreferred by a majority, to 58% inpajamas, reflecting a great deal of variation, to
TABLE 3. Foreign (a) nativization in the United States and Canada
WordPercent0A:0 for Americans
(n 5 147)Percent0A:0 for Canadians
(n 5 629)
panorama 18 6Pakistani 21 9Iraq 28 7pajamas 58 15plaza 75 16Colorado 86 26Vietnam 86 44taco 88 48Slavic 89 15Mazda 93 18macho 93 68llama 94 29pasta 95 19lava 95 23drama 95 25
G E O L I N G U I S T I C D I F F U S I O N 17
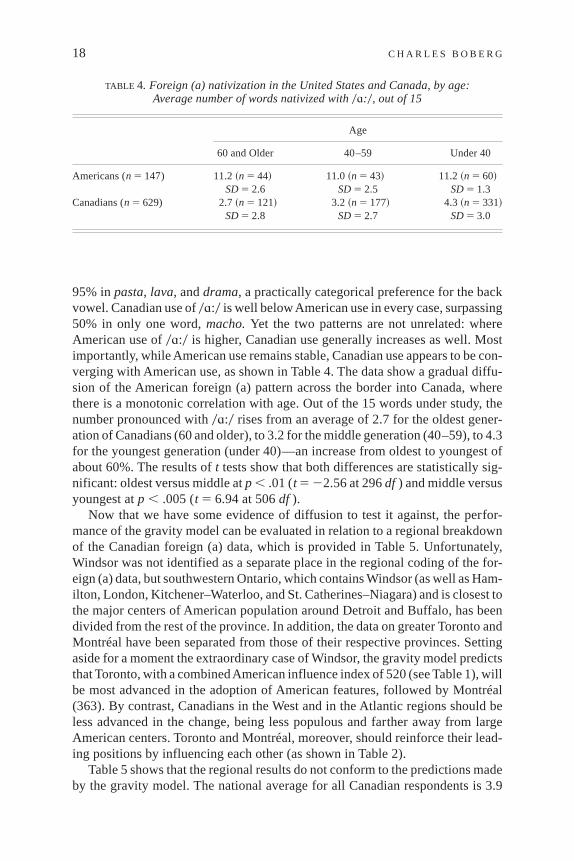
95% inpasta, lava, anddrama, a practically categorical preference for the backvowel. Canadian use of0A:0 is well belowAmerican use in every case, surpassing50% in only one word,macho.Yet the two patterns are not unrelated: whereAmerican use of0A:0 is higher, Canadian use generally increases as well. Mostimportantly, while American use remains stable, Canadian use appears to be con-verging with American use, as shown in Table 4. The data show a gradual diffu-sion of the American foreign (a) pattern across the border into Canada, wherethere is a monotonic correlation with age. Out of the 15 words under study, thenumber pronounced with0A:0 rises from an average of 2.7 for the oldest gener-ation of Canadians (60 and older), to 3.2 for the middle generation (40–59), to 4.3for the youngest generation (under 40)—an increase from oldest to youngest ofabout 60%. The results oft tests show that both differences are statistically sig-nificant: oldest versus middle atp , .01 (t 5 22.56 at 296df ) and middle versusyoungest atp , .005 (t 5 6.94 at 506df ).
Now that we have some evidence of diffusion to test it against, the perfor-mance of the gravity model can be evaluated in relation to a regional breakdownof the Canadian foreign (a) data, which is provided in Table 5. Unfortunately,Windsor was not identified as a separate place in the regional coding of the for-eign (a) data, but southwestern Ontario, which contains Windsor (as well as Ham-ilton, London, Kitchener–Waterloo, and St. Catherines–Niagara) and is closest tothe major centers of American population around Detroit and Buffalo, has beendivided from the rest of the province. In addition, the data on greater Toronto andMontréal have been separated from those of their respective provinces. Settingaside for a moment the extraordinary case of Windsor, the gravity model predictsthat Toronto, with a combinedAmerican influence index of 520 (see Table 1), willbe most advanced in the adoption of American features, followed by Montréal(363). By contrast, Canadians in the West and in the Atlantic regions should beless advanced in the change, being less populous and farther away from largeAmerican centers. Toronto and Montréal, moreover, should reinforce their lead-ing positions by influencing each other (as shown in Table 2).
Table 5 shows that the regional results do not conform to the predictions madeby the gravity model. The national average for all Canadian respondents is 3.9
TABLE 4. Foreign (a) nativization in the United States and Canada, by age:Average number of words nativized with0A:0, out of 15
Age
60 and Older 40–59 Under 40
Americans (n 5 147) 11+2 ~n 5 44! 11+0 ~n 5 43! 11+2 ~n 5 60!SD5 2.6 SD5 2.5 SD5 1.3
Canadians (n 5 629) 2+7 ~n 5 121! 3+2 ~n 5 177! 4+3 ~n 5 331!SD5 2.8 SD5 2.7 SD5 3.0
18 C H A R L E S B O B E R G

instances of0A:0 out of the 15 words. Contrary to the predictions of the model, theWest and Atlantic regions, with means of 4.1 and 3.7, respectively, are more orless at par with the national average, not significantly below it. Instead, the mostconservative region with respect to this change is Québec, including greater Mon-tréal, whose value of 2.9 is well below the average rather than above it, as pre-dicted by the model. This may be because of the isolation of Québec anglophoneswithin a francophone province, which may insulate them from continental trendsaffecting North American English. However, the model is no more successful inpredicting the performance of Toronto, which at 4.3 is slightly above average butcertainly not leading the change. While Montréal is ahead of its Québec hinter-land (2.9 vs. 2.3 is significant atp , .05;t 5 1.84 at 284df ), Toronto is not aheadof the rest of Ontario (4.3 vs. 4.5 is not significant;t 5 0.70 at 143df ). Moreover,the model predicts that Toronto and Montréal, because of their extensive mutualinfluence, will behave in a similar way, yet this is not supported by the data: theyare clearly different.
The most striking aspect of these data, however, is the fact that the regionwhich shows the most advanced state of the change is neither Toronto nor Mon-tréal but southwestern Ontario. At 5.3, this region is well above the nationalaverage and well ahead of Toronto (5.3 vs. 4.3 is significant atp , .005;t 5 3.32at 24 df ). The cross-tabulation with age shows that, in the oldest generation,
TABLE 5. Foreign (a) nativization in Canada, by age and region: Average number of wordsnativized with0A:0, out of 15
Age
Regiona 60 and Older 40–59 Under 40 All Ages
West 3.9 (n 5 16) 4.2 (n 5 21) 4.2 (n 5 38) 4.1 (n 5 75)SD5 3.1 SD5 1.9 SD5 2.3 SD5 2.4
Southwestern Ontario 3.5 (n 5 11) 4.6 (n 5 17) 6.6 (n 5 25) 5.3 (n 5 53)SD5 1.8 SD5 2.9 SD5 2.9 SD5 2.9
Toronto 2.2 (n 5 13) 4.4 (n 5 17) 5.0 (n 5 43) 4.3 (n 5 73)SD5 2.0 SD5 2.8 SD5 2.6 SD5 2.7
Other Ontario 2.6 (n 5 18) 4.2 (n 5 12) 5.5 (n 5 42) 4.5 (n 5 72)SD5 2.8 SD5 3.4 SD5 3.0 SD5 3.2
Montréal 2.7 (n 5 44) 2.3 (n 5 85) 3.3 (n 5 129) 2.9 (n 5 258)SD5 3.2 SD5 2.5 SD5 2.7 SD5 2.8
Other Québec 1.7 (n 5 3) 2.6 (n 5 7) 2.2 (n 5 18) 2.3 (n 5 28)SD5 1.5 SD5 1.7 SD5 1.8 SD5 1.7
Atlantic 0.7 (n 5 12) 2.1 (n 5 8) 5.8 (n 5 24) 3.7 (n 5 44)SD5 0.9 SD5 1.8 SD5 3.8 SD5 3.7
aOf the Canadians, 26 subjects moved from one region to another during the acquisition period, sothey could not be assigned to a region. They are included in the total (n 5 629), which is thereforegreater than the sum of the regional totals. All other subjects were classified by the region they livedin between the ages of 5 and 17.
G E O L I N G U I S T I C D I F F U S I O N 19
southwestern Ontario shares its leading position with the West (the differencebetween them not being significant), and that Toronto catches up with southwest-ern Ontario in the middle generation (again, an insignificant difference), but thatamong the youngest generation southwestern Ontario moves firmly into the lead(the difference between its mean of 6.6 and Toronto’s of 5.0 being significant atp , .005; t 5 3.87 at 66df ). At first glance, then, the regional analysis of thediffusion of the American foreign (a) pattern into Canada provides what lookslike an example of wave-style diffusion rather than a hierarchical pattern: thosepeople who live closest to large American populations are the most advanced inadopting features from American English, regardless of community size.
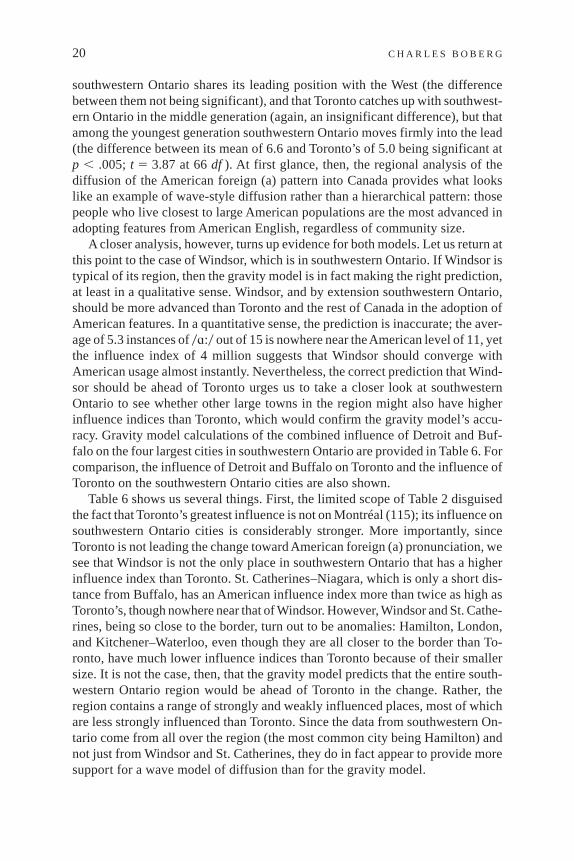
A closer analysis, however, turns up evidence for both models. Let us return atthis point to the case of Windsor, which is in southwestern Ontario. If Windsor istypical of its region, then the gravity model is in fact making the right prediction,at least in a qualitative sense. Windsor, and by extension southwestern Ontario,should be more advanced than Toronto and the rest of Canada in the adoption ofAmerican features. In a quantitative sense, the prediction is inaccurate; the aver-age of 5.3 instances of0A:0 out of 15 is nowhere near theAmerican level of 11, yetthe influence index of 4 million suggests that Windsor should converge withAmerican usage almost instantly. Nevertheless, the correct prediction that Wind-sor should be ahead of Toronto urges us to take a closer look at southwesternOntario to see whether other large towns in the region might also have higherinfluence indices than Toronto, which would confirm the gravity model’s accu-racy. Gravity model calculations of the combined influence of Detroit and Buf-falo on the four largest cities in southwestern Ontario are provided in Table 6. Forcomparison, the influence of Detroit and Buffalo on Toronto and the influence ofToronto on the southwestern Ontario cities are also shown.
Table 6 shows us several things. First, the limited scope of Table 2 disguisedthe fact that Toronto’s greatest influence is not on Montréal (115); its influence onsouthwestern Ontario cities is considerably stronger. More importantly, sinceToronto is not leading the change toward American foreign (a) pronunciation, wesee that Windsor is not the only place in southwestern Ontario that has a higherinfluence index than Toronto. St. Catherines–Niagara, which is only a short dis-tance from Buffalo, has an American influence index more than twice as high asToronto’s, though nowhere near that of Windsor. However, Windsor and St. Cathe-rines, being so close to the border, turn out to be anomalies: Hamilton, London,and Kitchener–Waterloo, even though they are all closer to the border than To-ronto, have much lower influence indices than Toronto because of their smallersize. It is not the case, then, that the gravity model predicts that the entire south-western Ontario region would be ahead of Toronto in the change. Rather, theregion contains a range of strongly and weakly influenced places, most of whichare less strongly influenced than Toronto. Since the data from southwestern On-tario come from all over the region (the most common city being Hamilton) andnot just from Windsor and St. Catherines, they do in fact appear to provide moresupport for a wave model of diffusion than for the gravity model.
20 C H A R L E S B O B E R G
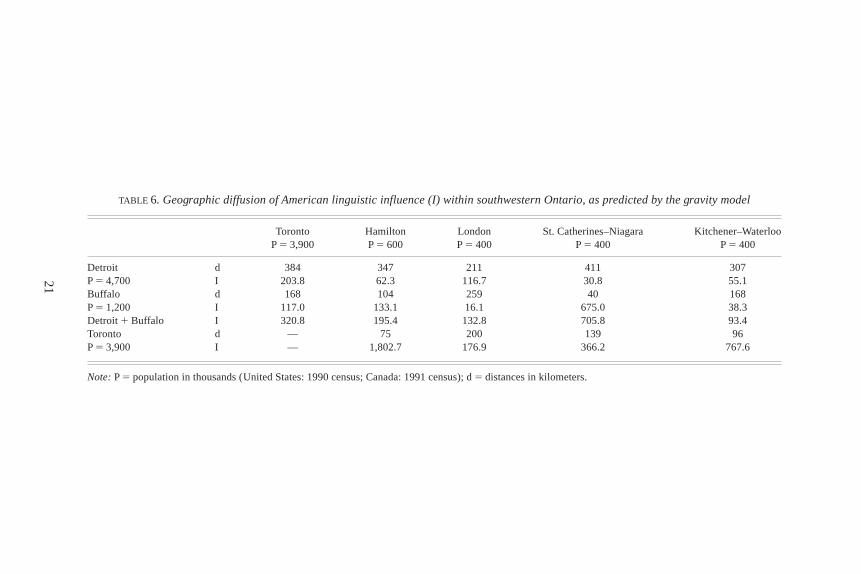
TABLE 6. Geographic diffusion of American linguistic influence (I) within southwestern Ontario, as predicted by the gravity model
TorontoP5 3,900
HamiltonP5 600
LondonP5 400
St. Catherines–NiagaraP5 400
Kitchener–WaterlooP5 400
Detroit d 384 347 211 411 307P5 4,700 I 203.8 62.3 116.7 30.8 55.1Buffalo d 168 104 259 40 168P5 1,200 I 117.0 133.1 16.1 675.0 38.3Detroit1 Buffalo I 320.8 195.4 132.8 705.8 93.4Toronto d — 75 200 139 96P5 3,900 I — 1,802.7 176.9 366.2 767.6
Note:P5 population in thousands (United States: 1990 census; Canada: 1991 census); d5 distances in kilometers.
21
Turning to other regions of Canada, the leading position of the West among theoldest speakers and the relatively high position of Atlantic Canada among theyoungest speakers (second only to southwestern Ontario) are surprising resultsthat offer counter-evidence to both the hierarchical and wave-based models ofdiffusion. While the relatively high American influence index of Vancouver (219in Table 1), stemming from its proximity to Seattle, might seem to run in favor ofthe gravity model, the 11 Vancouver subjects among the western sample did notin fact exhibit a higher mean frequency of0A:0 pronunciations than the subjectsfrom parts of the West with much lower influence scores (the Vancouver fre-quency of 4.2 and the non-Vancouver frequency of 4.0 were not significantlydifferent). The diachronic stability of the western data suggests an alternativeexplanation of the relatively high frequency of American pronunciations in theWest: it may result from American settlement rather than diffusion. This is also apossible explanation for the relatively high level of0A:0 pronunciations amongthe oldest generation of southwestern Ontarians (significantly higher than amongthe oldest Torontonians:p , .025; t 5 2.30 at 22df ), since refugees from theAmerican Revolution were the most important stream of early settlement in thatregion. The oldest Atlantic Canadians, by contrast, exhibit virtually categoricaluse of0æ0, so that the performance of the youngest generation represents an800% increase in preference for0A:0, a striking development that neither settle-ment history nor the gravity or wave models of diffusion can explain.
D I S C U S S I O N A N D C O N C L U S I O N S
How, then, can we account for the differential effects of the international bound-ary? It seems clear that some features diffuse more easily than others. The failureof phonetic features to diffuse in some cases appears to be governed more bystructural phonological factors than by the coincidence of historical isoglosseswith political boundaries. Where these constraints do not exist, many features—and even some phonetic features—appear to diffuse quite easily across the inter-national boundary. For instance, a comparison of the American and Canadianvowel systems in Figures 2 through 8 shows that the fronting of0u:0 is welladvanced on both sides of the border. There is nothing in the high-central regionof the vowel space to constrain the forward movement of0u:0 from its originalposition in the high-back corner, and so this change affects the whole continentsimultaneously. Whether this is really a case of diffusion as opposed to a series ofindependent developments is not yet clear.
This is not to say that a national boundary has no effect. Canada is clearly nota part of the American speech community in some respects, and its independencein this regard is presumably supported and perpetuated by the general post-acquisition stability of grammars at a more abstract level and by Canadian insti-tutions, such as schools, textbooks, dictionaries, and national media, at the lessstable level of lexicon and phonemic incidence. However, the fact that these
22 C H A R L E S B O B E R G
institutions have been only partially effective in maintaining distinctness (as shownby the data presented here on foreign (a) and by the studies of Nylvek, 1992, andChambers, 1998) suggests that changes at this level of grammar may indeeddiffuse by means of the mass media and popular culture—a kind of languagecontact that has generally been dismissed in sociolinguistic studies of languagechange, but should now, perhaps, become the subject of systematic study.
One factor that we have so far overlooked, anticipated again by Trudgill(1974:241), is the role of attitude and subjective evaluation in diffusion. Bailey’sresearch group found this to be decisive in determining diffusion patterns in Okla-homa. Features that had local prestige tended to diffuse up the urban hierarchyfrom the countryside, home of their traditional users, whereas features that hadglobal prestige tended to diffuse down the hierarchy from the cities, home topeople with the most external contacts (Bailey et al., 1993). In the U.S.–Canadaborder context, it seems clear that some features, such as quotativebe like, whichhas spread in Canada as rapidly as in the United States, are positively evaluatedbecause of their association with a glamorous youth culture based in the UnitedStates. TheAmerican use of long0A:0 in nativizing foreign words spelled witha&is evidently also positively evaluated, at least in some words. In Labov’s terms(1972), the shift toward using0A:0 for foreign (a) appears to be a change fromabove, with an obvious external source (American English) and an overt prestigevalue stemming from its association with perceptions about the “correct” way topronounce foreign languages. (See Boberg, 1999, for a discussion of the attitu-dinal dimensions of this variable in American English.)
Other features, however, such as the American variants of many traditionalBritish–American pronunciation differences or indeed the Northern Cities Shift,hold no such positive prestige for most Canadians and so are not imitated. Ingeneral, it seems safe to say that Canadians do not want to sound like Americans,so that when a variant is marked [1American] rather than, say, [1young] or[1trendy] it will not be readily transferred. An adequate model of geolinguisticdiffusion clearly requires a term that incorporates prestige and subjective evalu-ation in its calculations, though how this would work quantitatively is at presentnot clear. The methodological problem reminds us of trying to attach probabili-ties to variable rules in a transformational grammar: could the results of attitudi-nal surveys be attached to linguistic descriptions of language change, indicatingthe probability with which a change would be adopted in a given speech com-munity or by a certain kind of speaker? As Labov (1972) found on Martha’sVineyard, a larger center can have an influence on a smaller one only if the in-habitants of the smaller one hold a positive subjective evaluation of the largercenter and its cultural associations. It seems doubtful that the inhabitants of Wind-sor have a positive evaluation of Detroit in this sense, any more than do theToronto subway riders who apparently want to push them off the platform. Thegeneral conclusion that emerges from the research presented here is that currentmodels of geolinguistic diffusion, while they represent a great advance in thestudy of geolinguistics and language change, do not make accurate predictions
G E O L I N G U I S T I C D I F F U S I O N 23
about certain cases of diffusion in North American English and face considerablepractical difficulties when they are applied beyond the circumstances for whichthey were created. Adaptation and refinement of these models to fit a wider rangeof geolinguistic scenarios will require a great deal more research.
R E F E R E N C E S
Avis, W. S. (1954–1956). Speech differences along the Ontario–United States border: I–III.Journalof the Canadian Linguistic Association1:13–18(I), 1:14–19(II), 2:41–59(III).
Bailey, Guy, Wikle, Tom, Tillery, Jan, & Sand, Lori. (1993). Some patterns of linguistic diffusion.Language Variation and Change5:359–390.
Bloomfield, Morton W. (1948). Canadian English and its relation to eighteenth century Americanspeech.Journal of English and Germanic Philology47:59–67.
Boberg, Charles. (1997).Variation and change in the nativization of foreign (a) in English.Doctoraldissertation, University of Pennsylvania._(1999). The attitudinal component of variation in American English foreign (a) nativization.
Journal of Language and Social Psychology18:49–61.Callary, R. E. (1975). Phonological change and the development of an urban dialect in Illinois.Lan-
guage in Society4:155–170.Chambers, J. K. (1994). An introduction to dialect topography.English World-Wide15:35–53._(1998). Social embedding of changes in progress.Journal of English Linguistics26:5–36.Chambers, J. K., & Trudgill, Peter. (1998).Dialectology(2nd ed.). Cambridge: Cambridge University
Press.Clarke, Sandra, Elms, Ford, & Youssef, Amani. (1995). The third dialect of English: Some Canadian
evidence.Language Variation and Change7:209–228.Gregg, R. J. (1957). Notes on the pronunciation of Canadian English as spoken in Vancouver, B.C.
Journal of the Canadian Linguistic Association3:20–26.Hamilton, Donald. (1958). Notes on Montreal English.Journal of the Canadian Linguistic Associa-
tion 4:70–79.Labov, William. (1972).Sociolinguistic patterns.Philadelphia: University of Pennsylvania Press._(1980). The social origins of sound change. In W. Labov (ed.),Locating language in time and
space.New York: Academic. 251–265._(1991). The three dialects of English. In P. Eckert (ed.),New ways of analyzing sound change.
New York: Academic. 1–44.Labov, William, Ash, Sharon, & Boberg, Charles. (to appear).Atlas of North American English:
Phonetics, phonology and sound change.Berlin: Mouton de Gruyter.Milroy, Lesley, & Milroy, James. (1992). Social network and social class: Toward an integrated
sociolinguistic model.Language in Society21:1–26.Nylvek, Judith. (1992). Is Canadian English in Saskatchewan becoming more American?American
Speech67:268–278.Scargill, M. H. (1957). Sources of Canadian English.Journal of English and Germanic Philology
58:610–614.Scargill, M. H., & Warkentyne, H. J. (1972). The survey of Canadian English: A report.English
Quarterly5:47–104.Thomason, Sarah Grey, & Kaufman, Terrence. (1988).Language contact, creolization and genetic
linguistics.Berkeley: University of California Press.Trudgill, Peter. (1974). Linguistic change and diffusion: Description and explanation in sociolinguis-
tic dialect geography.Language in Society3:215–246.Vander Doelen, Chris. (1998). Us talk funny? Yuze ain’t got no ears!The Montreal Gazette, March 9,
A6.Zeller, Christine. (1993). Linguistic symmetries, asymmetries, and border effects within a Canadian0
American sample. In Sandra Clarke (ed.),Focus on Canada.Amsterdam: Benjamins. 179–200.
24 C H A R L E S B O B E R G