Blood pressure changes in association with black carbon exposure in a panel of healthy adults are...
6
Blood pressure changes in association with black carbon exposure in a panel of healthy adults are independent of retinal microcirculation Tijs Louwies a,b , Tim Nawrot b,c , Bianca Cox b , Evi Dons a , Joris Penders d , Eline Provost a,b , Luc Int Panis a,e , Patrick De Boever a,b, ⁎ a Environmental Risk and Health, Flemish Institute for Technological Research (VITO), Mol, Belgium b Centre for Environmental Sciences, Hasselt University, Diepenbeek, Belgium c Department of Public Health, Leuven University, Leuven, Belgium d Ziekenhuis Oost-Limburg, Genk, Belgium e Transportation Research Institute, Hasselt University, Diepenbeek, Belgium abstract article info Article history: Received 29 September 2014 Received in revised form 6 November 2014 Accepted 11 November 2014 Available online xxxx Keywords: Air pollution Black carbon Blood pressure Retinal microcirculation Mediation analysis Exposure to ambient particulate matter and elevated blood pressure are risk factors for cardiovascular morbidity and mortality. Microvascular changes might be an important pathway in explaining the association between air pollution and blood pressure. The objective of the study was to evaluate the role of the retinal microcirculation in the association between black carbon (BC) exposure and blood pressure. We estimated subchronic BC exposure based on 1-week personal measurements (μ-Aethalometer, AethLabs) in 55 healthy nurses. Blood pressure and retinal microvasculature were measured on four different days (range: 2– 4) during this week. Subchronic BC exposure averaged (± SD) 1334 ± 631 ng/m 3 and ranged from 338 ng/m 3 to 3889 ng/m 3 . An in- creased exposure of 631 ng/m 3 BC was associated with a 2.77 mm Hg (95% CI: 0.39 to 5.15, p = 0.027) increase in systolic blood pressure, a 2.35 mm Hg (95% CI: 0.52 to 4.19, p = 0.016) increase in diastolic blood pressure and with 5.65 μm (95% CI: 1.33 to 9.96, p = 0.014) increase in central retinal venular equivalent. Mediation analysis failed to reveal an effect of retinal microvasculature in the association between blood pressure and subchronic BC exposure. In conclusion, we found a positive association between blood pressure and subchronic black carbon exposure in healthy adults. This finding adds evidence to the association between black carbon exposure and cardiovascular health effects, with elevated blood pressure as a plausible intermediate effector. Our results suggest that the changes in a person's blood pressure as a result of subchronic black carbon exposure operate independently of the retinal microcirculation. © 2014 Elsevier Ltd. All rights reserved. 1. Introduction Short-term and long-term exposures to particulate matter air pollu- tion contribute to cardiovascular morbidity and mortality (Brook et al., 2010; Laden et al., 2006). Altered autonomic function of the heart, changes in micro- and macrovascular reactivity, induction of systemic inflammation, endothelial dysfunction and altered peripheral resistance of the blood vessels can mediate these cardiovascular effects (Mills et al., 2009). The microcirculation determines the overall peripheral resis- tance and microvascular alterations may lead to blood pressure eleva- tion and an increased risk for developing hypertension (Boudier et al., 1992; Levy et al., 2001). Adar et al. (2010) and Louwies et al. (2013) have studied the impact of air pollution on the retinal microcirculation. These authors found that retinal arteriolar narrowing is associated with long-term and short-term exposure to air pollution (Adar et al., 2010; Louwies et al., 2013). Additionally, retinal arteriolar narrowing has been associated with increased blood pressure and hypertension (Wong and Mitchell, 2007). Thus, microcirculatory changes in the retina are potentially relevant in the association between air pollution expo- sure and blood pressure changes. Epidemiological research and animal studies have produced posi- tive, negative and null associations between blood pressure and ambi- ent air pollution (Brook, 2007). These outcomes can be explained by study-specific differences such as population characteristics, dose and duration of the exposure that are different between studies. Further- more, the chemical composition of particulate matter is heterogeneous and varies between studies. For instance, PM 2.5 (particulate matter with a diameter smaller than 2.5 μm) exposure in high-traffic areas had a stronger effect on blood pressure compared with PM 2.5 in low-traffic Environment International 75 (2015) 81–86 ⁎ Corresponding author at: VITO, Vlasmeer 7, 2400 Mol, Belgium. E-mail address: [email protected] (P. De Boever). http://dx.doi.org/10.1016/j.envint.2014.11.006 0160-4120/© 2014 Elsevier Ltd. All rights reserved. Contents lists available at ScienceDirect Environment International journal homepage: www.elsevier.com/locate/envint
Transcript of Blood pressure changes in association with black carbon exposure in a panel of healthy adults are...
Environment International 75 (2015) 81–86
Contents lists available at ScienceDirect
Environment International
j ourna l homepage: www.e lsev ie r .com/ locate /env int
Blood pressure changes in association with black carbon exposure in apanel of healthy adults are independent of retinal microcirculation
Tijs Louwies a,b, Tim Nawrot b,c, Bianca Cox b, Evi Dons a, Joris Penders d, Eline Provost a,b,Luc Int Panis a,e, Patrick De Boever a,b,⁎a Environmental Risk and Health, Flemish Institute for Technological Research (VITO), Mol, Belgiumb Centre for Environmental Sciences, Hasselt University, Diepenbeek, Belgiumc Department of Public Health, Leuven University, Leuven, Belgiumd Ziekenhuis Oost-Limburg, Genk, Belgiume Transportation Research Institute, Hasselt University, Diepenbeek, Belgium
⁎ Corresponding author at: VITO, Vlasmeer 7, 2400 MoE-mail address: [email protected] (P. De Boeve
http://dx.doi.org/10.1016/j.envint.2014.11.0060160-4120/© 2014 Elsevier Ltd. All rights reserved.
a b s t r a c t
a r t i c l e i n f oArticle history:Received 29 September 2014Received in revised form 6 November 2014Accepted 11 November 2014Available online xxxx
Keywords:Air pollutionBlack carbonBlood pressureRetinal microcirculationMediation analysis
Exposure to ambient particulate matter and elevated blood pressure are risk factors for cardiovascular morbidityand mortality. Microvascular changes might be an important pathway in explaining the association between airpollution and blood pressure. The objective of the studywas to evaluate the role of the retinalmicrocirculation inthe association between black carbon (BC) exposure and blood pressure.We estimated subchronic BC exposure based on 1-week personal measurements (μ-Aethalometer, AethLabs) in55 healthy nurses. Blood pressure and retinal microvasculature were measured on four different days (range: 2–4) during this week.Subchronic BC exposure averaged (± SD) 1334± 631 ng/m3 and ranged from 338 ng/m3 to 3889 ng/m3. An in-creased exposure of 631 ng/m3 BCwas associatedwith a 2.77mmHg (95% CI: 0.39 to 5.15, p=0.027) increase insystolic blood pressure, a 2.35 mm Hg (95% CI: 0.52 to 4.19, p = 0.016) increase in diastolic blood pressure andwith 5.65 μm (95% CI: 1.33 to 9.96, p = 0.014) increase in central retinal venular equivalent. Mediation analysisfailed to reveal an effect of retinalmicrovasculature in the association between blood pressure and subchronic BCexposure.In conclusion, we found a positive association between blood pressure and subchronic black carbon exposure inhealthy adults. This finding adds evidence to the association between black carbon exposure and cardiovascularhealth effects, with elevated blood pressure as a plausible intermediate effector. Our results suggest that thechanges in a person's blood pressure as a result of subchronic black carbon exposure operate independently ofthe retinal microcirculation.
© 2014 Elsevier Ltd. All rights reserved.
1. Introduction
Short-term and long-term exposures to particulate matter air pollu-tion contribute to cardiovascular morbidity and mortality (Brook et al.,2010; Laden et al., 2006). Altered autonomic function of the heart,changes in micro- and macrovascular reactivity, induction of systemicinflammation, endothelial dysfunction and altered peripheral resistanceof the blood vessels canmediate these cardiovascular effects (Mills et al.,2009). The microcirculation determines the overall peripheral resis-tance and microvascular alterations may lead to blood pressure eleva-tion and an increased risk for developing hypertension (Boudier et al.,1992; Levy et al., 2001). Adar et al. (2010) and Louwies et al. (2013)
l, Belgium.r).
have studied the impact of air pollution on the retinal microcirculation.These authors found that retinal arteriolar narrowing is associated withlong-term and short-term exposure to air pollution (Adar et al., 2010;Louwies et al., 2013). Additionally, retinal arteriolar narrowing hasbeen associated with increased blood pressure and hypertension(Wong andMitchell, 2007). Thus,microcirculatory changes in the retinaare potentially relevant in the association between air pollution expo-sure and blood pressure changes.
Epidemiological research and animal studies have produced posi-tive, negative and null associations between blood pressure and ambi-ent air pollution (Brook, 2007). These outcomes can be explained bystudy-specific differences such as population characteristics, dose andduration of the exposure that are different between studies. Further-more, the chemical composition of particulate matter is heterogeneousand varies between studies. For instance, PM2.5 (particulatematterwitha diameter smaller than 2.5 μm) exposure in high-traffic areas had astronger effect on blood pressure compared with PM2.5 in low-traffic

82 T. Louwies et al. / Environment International 75 (2015) 81–86
areas (Auchincloss et al., 2008; Brook et al., 2009). Furthermore, spatialand temporal variability in pollution sources may obscure associationsbetween PM and blood pressure. Most epidemiological studies rely oncentral monitor data or complex models to estimate PM concentrationsat the participant's residence. Exposure is however strongly related toan individual's time–activity patterns and time spent indoor and out-door (Dons et al., 2011).
Exposure misclassification may occur with central monitor data andmay lead to incorrect estimation of cardiovascular health effects associ-ated with air pollution exposure (Brook et al., 2011; Padro-Martinezet al., 2012).
Black carbon (BC), a by-product of fuel combustion and a constituentof particulate matter, has been associated with systemic inflammationand oxidative stress, decreased flow-mediated dilation of the brachialartery and reduced parasympathetic tone (Alexeeff et al., 2011; O'Neillet al., 2005; Park et al., 2008; Schneider et al., 2010). Mordukhovichet al. (2009) andWilker et al. (2010) reported positive associations be-tween short-term BC exposure, measured as the concentration aver-aged over the 7 days preceding each study visit, and systolic anddiastolic blood pressure (Mordukhovich et al., 2009; Wilker et al.,2010). Schwartz et al. (2012) reported an association between bloodpressure and modelled long-term BC concentrations. A 0.32 μg/m3
increase in BC was significantly associated with a 2.64 mm Hg increasein systolic blood pressure and a 2.41 mm Hg increase in diastolic bloodpressure (Schwartz et al., 2012). Zhao et al. (2014) measured personalBC exposure using portable measuring devices in a study that investi-gated the effects of BC on blood pressure in 65 persons suffering fromthe metabolic syndrome. A short-term BC increase of 1 μg/m3, 10 hprior to the study visit, was associated with a 0.53 mm Hg increase insystolic blood and a 0.37 mm Hg increase in diastolic blood pressure(Zhao et al., 2014).
We explore the association between blood pressure, short-term andsubchronic BC exposure in this study. Subchronic BC exposure was cal-culated based on personal monitoring during one week with portablemeasuring devices and data from a reference station. During this 1-week period we repeatedly measured blood pressure and retinal vesseldiameters. The retinal microcirculation was measured to study the po-tential mediating effect of the microcirculation in the relationship be-tween BC exposure and blood pressure.
2. Methods
2.1. Study design
A total of 130 nurses working in the north of Belgium were invitedand 99 (76%) agreed to participate. Fifty five nurses (56%) could bemonitored in this study. The predominantly female participants wereaged between 22 and 59 years and reported to be free of cardiovasculardiseases and diabetes. Every participant was monitored during oneaverage working week between April and May 2013. Clinical examina-tions were scheduled for every participant on Tuesday, Thursday,Saturday and Monday between 7 am and 9 pm [mean difference be-tween repeated measurements was 1 h (range, 0.1–1.9 h)]. 75% of theparticipants underwent all 4 examinations, 23% completed 3 examina-tions, whereas 2% completed 2 examinations. Participants were notasked to fast before the visits. Blood pressuremeasurements and retinalimageswere collected during each examination. A venous blood samplewas collected on the last day of the study. Gamma-glutamyltranspeptidase (γ-GT) was measured as a marker for liver functionand alcohol consumption. Haemoglobin A1C was measured as a glyce-mic index and metabolic marker for diabetes. Participants completed aquestionnaire on their smoking status, medical history and currentmedication use. All participants provided written informed consent.The ethics boards of Hasselt University andUniversity Hospital Antwerpapproved the study.
2.2. Blood pressure measurement
Systolic blood pressure (SBP), diastolic blood pressure (DBP) andheart rate (HR)weremeasuredwith an automated device (Stabilograph,Stolberg, Germany) according to the guidelines of the European Societyof Hypertension (Parati et al., 2008). After the participants had rested ina sitting position for 5 min, SBP, DBP and HR were measured five timesconsecutively during each of the 4 study visits. The average of the lastthree measurements collected during the examinations was used inthe analysis.
2.3. Retinal photography and grading
A Canon 45° 6.3 megapixel digital nonmydriatic retinal camera(Hospithera, Brussels, Belgium) was used. The fundus of the right eyeand the left eye of each participant were photographed twice duringeach study visit. Participant characteristics weremasked for the trainedgrader before review and analysis of the retinal images. IVAN retinalimage analysis software was used to measure retinal vessel diametersaccording to previously reported protocols (Knudtson et al., 2003;Wong et al., 2004a). Retinal vessel calibres were summarized as theCentral Retinal Arteriolar Equivalent (CRAE) and Central RetinalVenular Equivalent (CRVE) in each picture. The equivalents representa summary of vessel diameters within an area equal to 0.5–1 disc diam-eters from the optic disc margin. Average CRAE and CRVE values werecalculated for each study visit based on the four images.
2.4. Exposure assessment
2.4.1. Personal black carbon exposurePersonal exposure to black carbon (BC) was measured continuously
for 7 consecutive days (from Tuesday to next week's Monday) with aportable MicroAeth Model AE51 (Aethlabs, San Francisco, California,US) on a 1-min time resolution. A short tube was attached to the inletof the aethalometer, giving the participants the opportunity to put thedevice in a purse or backpack while still sampling ambient air. Air wasdrawn over a Teflon-coated borosilicate glass fibre filter at a flow rateof 100 ml/min, resulting in BC accumulation on the filter. The attenua-tion of light at 880 nm was measured and converted into a BC concen-tration (ng/m3). The filter was replaced every two days to preventfilter saturation. The participants were instructed to carry the devicewith them at all times, but for indoor activities they were allowed toleave it in the room where the majority of the time was spent. Raw BCdata were processed before they were used. Measurements with highattenuation (ATN N 75) or an error code were excluded (Dons et al.,2011). Next, data were smoothened with an algorithm that was devel-oped by the Environmental Protection Agency (Hagler et al., 2011).
Short-term exposure windows (24 h and 48 h) were calculated bytaking the average of all BC measurements 24 h or 48 h before the clin-ical visit.
2.4.2. Calculated personal subchronic black carbon exposureSubchronic BC exposure was calculated based on the personal
BC exposure measured during the study period. This was doneusing the following formula: Subchronic BC exposure = PersonalBC measurement × (Refsite yearly average / Refsite week average).The personal BC measurement was calculated as the average BC expo-sure over the whole week for each participant. This timeframe can cap-ture the time–activity pattern during an average working week (Donset al., 2012). “Refsite yearly” represents the average BC concentrationduring the year 2013. “Refsite week average” represents the averageBC concentration at the BC reference monitor during the same weekas the personal BC measurements. The latter factor allows correctingfor varying ambient concentrations during the study period. The moni-toring station of Dessel that is operated by the Flemish EnvironmentAgency was chosen as reference. The station is equidistant from both
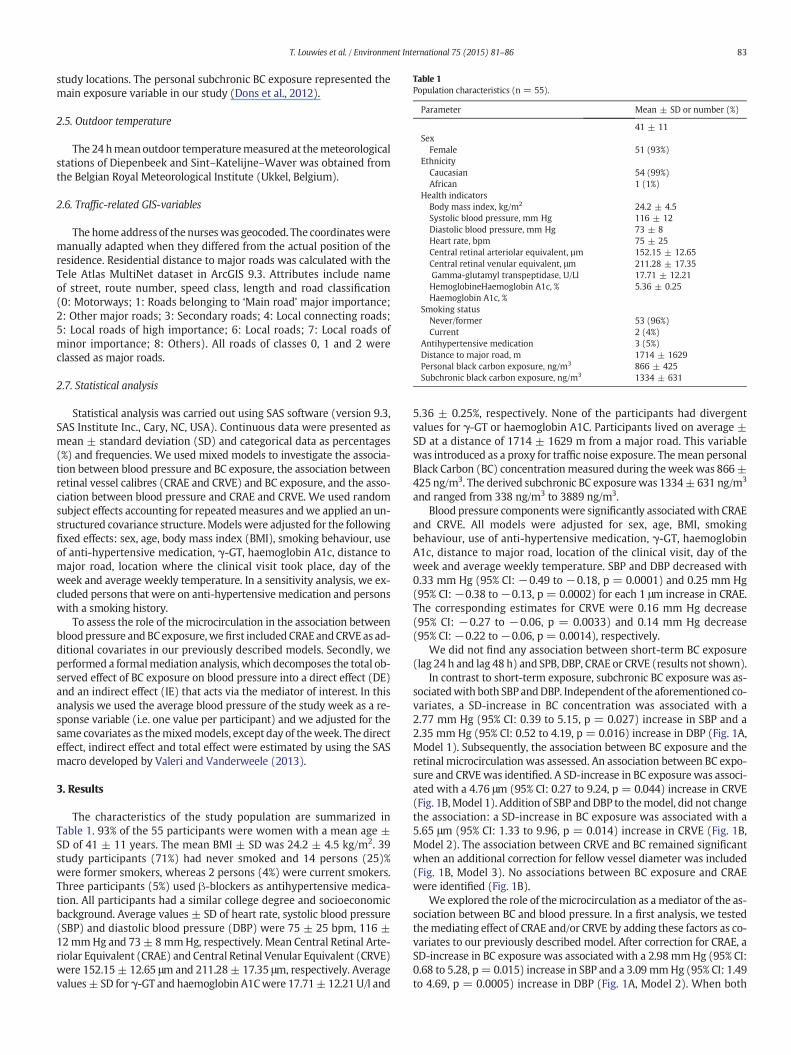
Table 1Population characteristics (n = 55).
Parameter Mean ± SD or number (%)
41 ± 11Sex
Female 51 (93%)Ethnicity
Caucasian 54 (99%)African 1 (1%)
Health indicatorsBody mass index, kg/m2 24.2 ± 4.5Systolic blood pressure, mm Hg 116 ± 12Diastolic blood pressure, mm Hg 73 ± 8Heart rate, bpm 75 ± 25Central retinal arteriolar equivalent, µm 152.15 ± 12.65Central retinal venular equivalent, μm 211.28 ± 17.35Gamma-glutamyl transpeptidase, U/Ll 17.71 ± 12.21HemoglobineHaemoglobin A1c, % 5.36 ± 0.25Haemoglobin A1c, %
Smoking statusNever/former 53 (96%)Current 2 (4%)
Antihypertensive medication 3 (5%)Distance to major road, m 1714 ± 1629Personal black carbon exposure, ng/m3 866 ± 425Subchronic black carbon exposure, ng/m3 1334 ± 631
83T. Louwies et al. / Environment International 75 (2015) 81–86
study locations. The personal subchronic BC exposure represented themain exposure variable in our study (Dons et al., 2012).
2.5. Outdoor temperature
The 24 hmeanoutdoor temperaturemeasured at themeteorologicalstations of Diepenbeek and Sint–Katelijne–Waver was obtained fromthe Belgian Royal Meteorological Institute (Ukkel, Belgium).
2.6. Traffic-related GIS-variables
The homeaddress of thenurseswas geocoded. The coordinatesweremanually adapted when they differed from the actual position of theresidence. Residential distance to major roads was calculated with theTele Atlas MultiNet dataset in ArcGIS 9.3. Attributes include nameof street, route number, speed class, length and road classification(0: Motorways; 1: Roads belonging to ‘Main road’ major importance;2: Other major roads; 3: Secondary roads; 4: Local connecting roads;5: Local roads of high importance; 6: Local roads; 7: Local roads ofminor importance; 8: Others). All roads of classes 0, 1 and 2 wereclassed as major roads.
2.7. Statistical analysis
Statistical analysis was carried out using SAS software (version 9.3,SAS Institute Inc., Cary, NC, USA). Continuous data were presented asmean ± standard deviation (SD) and categorical data as percentages(%) and frequencies. We used mixed models to investigate the associa-tion between blood pressure and BC exposure, the association betweenretinal vessel calibres (CRAE and CRVE) and BC exposure, and the asso-ciation between blood pressure and CRAE and CRVE. We used randomsubject effects accounting for repeatedmeasures andwe applied an un-structured covariance structure.Models were adjusted for the followingfixed effects: sex, age, body mass index (BMI), smoking behaviour, useof anti-hypertensive medication, γ-GT, haemoglobin A1c, distance tomajor road, location where the clinical visit took place, day of theweek and average weekly temperature. In a sensitivity analysis, we ex-cluded persons that were on anti-hypertensive medication and personswith a smoking history.
To assess the role of themicrocirculation in the association betweenblood pressure and BCexposure,wefirst included CRAE andCRVE as ad-ditional covariates in our previously described models. Secondly, weperformed a formalmediation analysis, which decomposes the total ob-served effect of BC exposure on blood pressure into a direct effect (DE)and an indirect effect (IE) that acts via the mediator of interest. In thisanalysis we used the average blood pressure of the study week as a re-sponse variable (i.e. one value per participant) and we adjusted for thesame covariates as themixedmodels, except day of theweek. The directeffect, indirect effect and total effect were estimated by using the SASmacro developed by Valeri and Vanderweele (2013).
3. Results
The characteristics of the study population are summarized inTable 1. 93% of the 55 participants were women with a mean age ±SD of 41 ± 11 years. The mean BMI ± SD was 24.2 ± 4.5 kg/m2. 39study participants (71%) had never smoked and 14 persons (25)%were former smokers, whereas 2 persons (4%) were current smokers.Three participants (5%) used β-blockers as antihypertensive medica-tion. All participants had a similar college degree and socioeconomicbackground. Average values ± SD of heart rate, systolic blood pressure(SBP) and diastolic blood pressure (DBP) were 75 ± 25 bpm, 116 ±12mmHg and 73± 8mmHg, respectively. Mean Central Retinal Arte-riolar Equivalent (CRAE) and Central Retinal Venular Equivalent (CRVE)were 152.15 ± 12.65 μm and 211.28± 17.35 μm, respectively. Averagevalues± SD for γ-GT and haemoglobin A1Cwere 17.71± 12.21U/l and
5.36 ± 0.25%, respectively. None of the participants had divergentvalues for γ-GT or haemoglobin A1C. Participants lived on average ±SD at a distance of 1714 ± 1629 m from a major road. This variablewas introduced as a proxy for traffic noise exposure. Themean personalBlack Carbon (BC) concentrationmeasured during theweek was 866±425 ng/m3. The derived subchronic BC exposurewas 1334±631 ng/m3
and ranged from 338 ng/m3 to 3889 ng/m3.Blood pressure components were significantly associatedwith CRAE
and CRVE. All models were adjusted for sex, age, BMI, smokingbehaviour, use of anti-hypertensive medication, γ-GT, haemoglobinA1c, distance to major road, location of the clinical visit, day of theweek and average weekly temperature. SBP and DBP decreased with0.33 mm Hg (95% CI: −0.49 to −0.18, p = 0.0001) and 0.25 mm Hg(95% CI:−0.38 to−0.13, p = 0.0002) for each 1 μm increase in CRAE.The corresponding estimates for CRVE were 0.16 mm Hg decrease(95% CI: −0.27 to −0.06, p = 0.0033) and 0.14 mm Hg decrease(95% CI: −0.22 to −0.06, p = 0.0014), respectively.
We did not find any association between short-term BC exposure(lag 24 h and lag 48 h) and SPB, DBP, CRAE or CRVE (results not shown).
In contrast to short-term exposure, subchronic BC exposure was as-sociatedwith both SBP andDBP. Independent of the aforementioned co-variates, a SD-increase in BC concentration was associated with a2.77 mm Hg (95% CI: 0.39 to 5.15, p = 0.027) increase in SBP and a2.35 mm Hg (95% CI: 0.52 to 4.19, p = 0.016) increase in DBP (Fig. 1A,Model 1). Subsequently, the association between BC exposure and theretinal microcirculation was assessed. An association between BC expo-sure and CRVE was identified. A SD-increase in BC exposure was associ-ated with a 4.76 μm (95% CI: 0.27 to 9.24, p = 0.044) increase in CRVE(Fig. 1B,Model 1). Addition of SBP andDBP to themodel, did not changethe association: a SD-increase in BC exposure was associated with a5.65 μm (95% CI: 1.33 to 9.96, p = 0.014) increase in CRVE (Fig. 1B,Model 2). The association between CRVE and BC remained significantwhen an additional correction for fellow vessel diameter was included(Fig. 1B, Model 3). No associations between BC exposure and CRAEwere identified (Fig. 1B).
We explored the role of themicrocirculation as a mediator of the as-sociation between BC and blood pressure. In a first analysis, we testedthemediating effect of CRAE and/or CRVE by adding these factors as co-variates to our previously described model. After correction for CRAE, aSD-increase in BC exposure was associated with a 2.98 mmHg (95% CI:0.68 to 5.28, p= 0.015) increase in SBP and a 3.09 mmHg (95% CI: 1.49to 4.69, p = 0.0005) increase in DBP (Fig. 1A, Model 2). When both
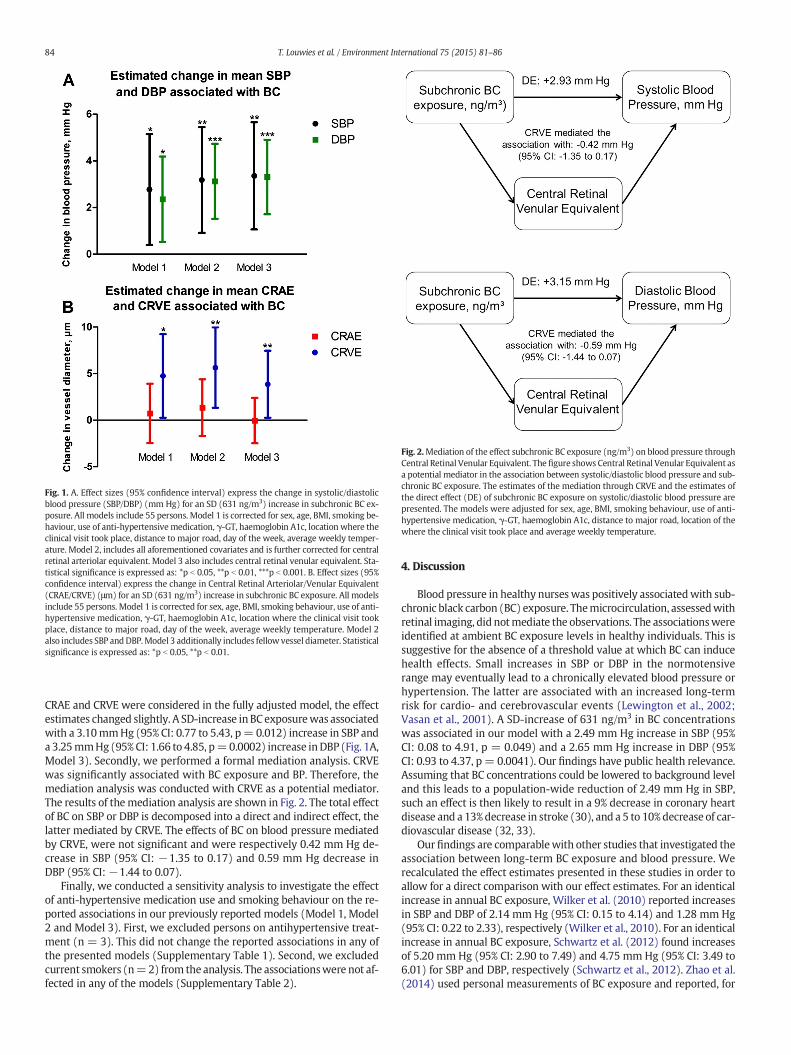
Fig. 1. A. Effect sizes (95% confidence interval) express the change in systolic/diastolicblood pressure (SBP/DBP) (mm Hg) for an SD (631 ng/m3) increase in subchronic BC ex-posure. All models include 55 persons. Model 1 is corrected for sex, age, BMI, smoking be-haviour, use of anti-hypertensivemedication, γ-GT, haemoglobin A1c, location where theclinical visit took place, distance to major road, day of the week, average weekly temper-ature. Model 2, includes all aforementioned covariates and is further corrected for centralretinal arteriolar equivalent. Model 3 also includes central retinal venular equivalent. Sta-tistical significance is expressed as: *p b 0.05, **p b 0.01, ***p b 0.001. B. Effect sizes (95%confidence interval) express the change in Central Retinal Arteriolar/Venular Equivalent(CRAE/CRVE) (μm) for an SD (631 ng/m3) increase in subchronic BC exposure. All modelsinclude 55 persons. Model 1 is corrected for sex, age, BMI, smoking behaviour, use of anti-hypertensive medication, γ-GT, haemoglobin A1c, location where the clinical visit tookplace, distance to major road, day of the week, average weekly temperature. Model 2also includes SBP andDBP.Model 3 additionally includes fellow vessel diameter. Statisticalsignificance is expressed as: *p b 0.05, **p b 0.01.
Fig. 2.Mediation of the effect subchronic BC exposure (ng/m3) on blood pressure throughCentral Retinal Venular Equivalent. The figure shows Central Retinal Venular Equivalent asa potential mediator in the association between systolic/diastolic blood pressure and sub-chronic BC exposure. The estimates of the mediation through CRVE and the estimates ofthe direct effect (DE) of subchronic BC exposure on systolic/diastolic blood pressure arepresented. The models were adjusted for sex, age, BMI, smoking behaviour, use of anti-hypertensive medication, γ-GT, haemoglobin A1c, distance to major road, location of thewhere the clinical visit took place and average weekly temperature.
84 T. Louwies et al. / Environment International 75 (2015) 81–86
CRAE and CRVE were considered in the fully adjusted model, the effectestimates changed slightly. A SD-increase in BC exposurewas associatedwith a 3.10mmHg (95% CI: 0.77 to 5.43, p= 0.012) increase in SBP anda 3.25mmHg(95% CI: 1.66 to 4.85, p=0.0002) increase inDBP (Fig. 1A,Model 3). Secondly, we performed a formal mediation analysis. CRVEwas significantly associated with BC exposure and BP. Therefore, themediation analysis was conducted with CRVE as a potential mediator.The results of themediation analysis are shown in Fig. 2. The total effectof BC on SBP or DBP is decomposed into a direct and indirect effect, thelatter mediated by CRVE. The effects of BC on blood pressure mediatedby CRVE, were not significant and were respectively 0.42 mm Hg de-crease in SBP (95% CI: −1.35 to 0.17) and 0.59 mm Hg decrease inDBP (95% CI:−1.44 to 0.07).
Finally, we conducted a sensitivity analysis to investigate the effectof anti-hypertensive medication use and smoking behaviour on the re-ported associations in our previously reported models (Model 1, Model2 and Model 3). First, we excluded persons on antihypertensive treat-ment (n = 3). This did not change the reported associations in any ofthe presented models (Supplementary Table 1). Second, we excludedcurrent smokers (n=2) from the analysis. The associationswere not af-fected in any of the models (Supplementary Table 2).
4. Discussion
Blood pressure in healthy nurseswas positively associatedwith sub-chronic black carbon (BC) exposure. Themicrocirculation, assessedwithretinal imaging, did notmediate the observations. The associationswereidentified at ambient BC exposure levels in healthy individuals. This issuggestive for the absence of a threshold value at which BC can inducehealth effects. Small increases in SBP or DBP in the normotensiverange may eventually lead to a chronically elevated blood pressure orhypertension. The latter are associated with an increased long-termrisk for cardio- and cerebrovascular events (Lewington et al., 2002;Vasan et al., 2001). A SD-increase of 631 ng/m3 in BC concentrationswas associated in our model with a 2.49 mm Hg increase in SBP (95%CI: 0.08 to 4.91, p = 0.049) and a 2.65 mm Hg increase in DBP (95%CI: 0.93 to 4.37, p= 0.0041). Our findings have public health relevance.Assuming that BC concentrations could be lowered to background leveland this leads to a population-wide reduction of 2.49 mm Hg in SBP,such an effect is then likely to result in a 9% decrease in coronary heartdisease and a 13%decrease in stroke (30), and a 5 to 10%decrease of car-diovascular disease (32, 33).
Ourfindings are comparablewith other studies that investigated theassociation between long-term BC exposure and blood pressure. Werecalculated the effect estimates presented in these studies in order toallow for a direct comparison with our effect estimates. For an identicalincrease in annual BC exposure, Wilker et al. (2010) reported increasesin SBP and DBP of 2.14 mm Hg (95% CI: 0.15 to 4.14) and 1.28 mm Hg(95% CI: 0.22 to 2.33), respectively (Wilker et al., 2010). For an identicalincrease in annual BC exposure, Schwartz et al. (2012) found increasesof 5.20 mm Hg (95% CI: 2.90 to 7.49) and 4.75 mm Hg (95% CI: 3.49 to6.01) for SBP and DBP, respectively (Schwartz et al., 2012). Zhao et al.(2014) used personal measurements of BC exposure and reported, for

85T. Louwies et al. / Environment International 75 (2015) 81–86
a comparable increase in BC, an acute increase in SBP andDBP of respec-tively 0.26 mm Hg (95% CI: 0.08 to 0.43) and 0.18 mmHg (95% CI: 0.05to 0.31) (Zhao et al., 2014). We did not find an association betweenblood pressure changes and short-term BC exposure. Differences instudy design and exposure range might explain this.
Our studywas concernedwith the effects of subchronic BC exposureon blood pressure. Furthermore, Zhao et al. reported an average expo-sure of 5.08 μg/m3 whereas our average short-term exposure was0.87 μg/m3.
The microcirculation determines the peripheral resistance and thusexerts a great influence on blood pressure. Adverse manifestations ofcardiovascular diseases are also likely to occur in microvascular beds(Levy et al., 2001; Mulvany, 1991). Therefore, we investigated the asso-ciation between the microcirculation and BC exposure in our currentstudy. We observed a positive association between retinal venules andBC exposure. During our previous work that focused on short-termmi-crocirculatory effects of ambient BC exposure we observed retinal arte-riolar narrowing in association with BC exposure (Louwies et al., 2013).In contrast, the current study focused on subchronic BC exposure. Ourcurrent study panelwas confrontedwith a narrow range of BC exposurelevels, whereas exposure levels were a tenfold higher in our previousstudy.
The influence of themicrovasculature on the association betweenBCexposure and blood pressure was assessed by including CRAE and CRVEparameters in the statistical models. This approach did not change theassociations between BC exposure and blood pressure. We also con-ducted a mediation analysis to formally test the interference of the mi-crovasculature on the association between blood pressure and BCexposure. Mediation analysis requires a significant association betweenthe exposure and the mediator, a significant association between themediator and the outcome, and a significant association between theexposure and the outcome (Baron and Kenny, 1986). In the presenceof mediation, the effect of the exposure on the outcome is expected tobe reduced after controlling for the mediator. Only CRVE was consid-ered as a candidate formediation because the significant association be-tween CRAE and BC exposure, one of the requirements to conductmediation analysis, was not met in our study. The mediation analysisdid not reveal evidence that supported our hypothesis that the micro-vasculature, as measured in the retina, mediates the association be-tween blood pressure and subchronic BC exposure. However, thisstatement should be interpreted with caution because of the smallsize of the study.
The exact pathophysiological mechanism underlying the rise inblood pressure caused by BC exposure remains to be further elucidated.BC inhalation may favour the sympathetic nerve activity via alterationsin the cardiovascular autonomic nervous system (Gold et al., 2000;Magari et al., 2001; Pieters et al., 2012). Activation of α-adrenergic re-ceptors leads to vasoconstriction and blood pressure increase (Bartoliet al., 2009). The stress imposed on the arterial vessel walls may leadto hypertrophic remodelling and an increase of medial thickness,which can further increase peripheral resistance (Heagerty et al.,2010; Mulvany, 2002). Regular incidents that trigger a blood pressureincrease may result in narrowing of retinal arterioles. In this respect, re-search has indicated that the narrowing of the retinal blood vessels pre-cedes hypertension (Ikram et al., 2006;Wong et al., 2004b). At the sametime it should be note that blood pressure is very tightly controlled byseveral feedback mechanisms. The microcirculatory response is onlyone effector pathway in this complex mechanism in which the renin–angiotensin pathway and the baroreceptor reflex also play an importantrole (Reid, 1992).
The strength of our study is the combination of personal monitoringdata and ambient BC concentrations froma reference station to estimatesubchronic BC exposure. It has been shown before that this approachprevents exposure misclassification. The cost of personal monitoringdevices typically limits the size of these personal monitoring studiesover longer time periods. After correction for variation in ambient BC
exposure, our subchronic exposure estimate is a reliable proxy and pref-erable over modelled exposure estimates. Furthermore, it has beenshown that a 1-week monitoring of a representative working weekcan capture in a reliable way the time–activity patterns that areknown to influence BC exposure (Dons et al., 2011). Blood pressure isa highly variable phenotype and we have anticipated this bymeasuringblood pressure at four distinct time points with 5measurements duringeach study visit. The circadian rhythm influences blood pressure. Weaccounted for this by measuring blood pressure of each study partici-pant at the same time at each study visit. When the time of day wasadded to our models, our reported associations did not change (datanot shown). Because the time difference between study visits was onaverage only 1 h, blood pressure was not influenced by a circadian pat-tern. A third strength is that we have studied a panel of mostly femaleparticipants who reported to be free from clinically diagnosed cardio-vascular diseases. A homogeneous study population reduces between-individual variability and increases the statistical power in a smallpanel. To our knowledge, we are introducing the first study with a reti-nal microvascular measurement to assess the role of the microvascula-ture in the association between blood pressure and subchronic BCexposure in healthy adults. We have observed a blood pressure increaseassociated with subchronic BC exposure. The microvasculature,assessed by retinal image analysis, did not mediate these effects in ourstudy.
Supplementary data to this article can be found online at http://dx.doi.org/10.1016/j.envint.2014.11.006.
Sources of funding
Tijs Louwies holds a VITO PhD scholarship. Eline Provost jointlyholds a shared VITO/FWO PhD scholarship. Tim S. Nawrot is holder ofa European Research Council starting grant.
Disclosures
None.
Acknowledgements
The authors thank Dr. Nicola Ferrier of the University of Wisconsin(Madison School of Engineering and the Fundus Photograph ReadingCenter, Department of Ophthalmology and Visual Sciences, Universityof Wisconsin — Madison) for providing the retinal image analysis soft-ware. The authors thank the participating nurses for their patienceand support during the study.
References
Adar, S.D., Klein, R., Klein, B.E.K., Szpiro, A.A., Cotch, M.F., Wong, T.Y., et al., 2010. Air pol-lution and the microvasculature: a cross-sectional assessment of in vivo retinal im-ages in the population-based Multi-Ethnic Study of Atherosclerosis (MESA). PLoSMed. 7.
Alexeeff, S.E., Coull, B.A., Gryparis, A., Suh, H., Sparrow, D., Vokonas, P.S., et al., 2011.Medium-term exposure to traffic-related air pollution and markers of inflammationand endothelial function. Environ. Health Perspect. 119, 481–486.
Auchincloss, A.H., Diez Roux, A.V., Dvonch, J.T., Brown, P.L., Barr, R.G., Daviglus, M.L., et al.,2008. Associations between recent exposure to ambient fine particulate matter andblood pressure in the Multi-ethnic Study of Atherosclerosis (MESA). Environ. HealthPerspect. 116, 486–491.
Baron, R.M., Kenny, D.A., 1986. The moderator mediator variable distinction in socialpsychological-research — conceptual, strategic, and statistical considerations. J. Pers.Soc. Psychol. 51, 1173–1182.
Bartoli, C.R., Wellenius, G.A., Diaz, E.A., Lawrence, J., Coull, B.A., Akiyama, I., et al., 2009.Mechanisms of inhaled fine particulate air pollution-induced arterial blood pressurechanges. Environ. Health Perspect. 117, 361–366.
Boudier, H.A.J.S., Lenoble, J.L.M.L., Messing, M.W.J., Huijberts, M.S.P., Lenoble, F.A.C.,Vanessen, H., 1992. The microcirculation and hypertension. J. Hypertens. 10,S147–S156.
Brook, R.D., 2007. Why physicians who treat hypertension should know more about airpollution. J. Clin. Hypertens. (Greenwich) 9, 629–635.

86 T. Louwies et al. / Environment International 75 (2015) 81–86
Brook, R.D., Urch, B., Dvonch, J.T., Bard, R.L., Speck, M., Keeler, G., et al., 2009. Insights intothe mechanisms and mediators of the effects of air pollution exposure on blood pres-sure and vascular function in healthy humans. Hypertension 54, 659–667.
Brook, R.D., Rajagopalan, S., Pope III, C.A., Brook, J.R., Bhatnagar, A., Diez-Roux, A.V., et al.,2010. Particulate matter air pollution and cardiovascular disease: an update to thescientific statement from the American Heart Association. Circulation 121,2331–2378.
Brook, R.D., Bard, R.L., Burnett, R.T., Shin, H.H., Vette, A., Croghan, C., et al., 2011. Differ-ences in blood pressure and vascular responses associated with ambient fine partic-ulate matter exposures measured at the personal versus community level. Occup.Environ. Med. 68, 224–230.
Dons, E., Int Panis, L., Van Poppel, M., Theunis, J., Willems, H., Torfs, R., et al., 2011. Impactof time–activity patterns on personal exposure to black carbon. Atmos. Environ. 45,3594–3602.
Dons, E., Int Panis, L., Van Poppel, M., Theunis, J., Wets, G., 2012. Personal exposure toblack carbon in transport microenvironments. Atmos. Environ. 55, 392–398.
Gold, D.R., Litonjua, A., Schwartz, J., Lovett, E., Larson, A., Nearing, B., et al., 2000. Ambientpollution and heart rate variability. Circulation 101, 1267–1273.
Hagler, G.S.W., Yelverton, T.L.B., Vedantham, R., Hansen, A.D.A., Turner, J.R., 2011.Post-processing method to reduce noise while preserving high time resolutionin aethalometer real-time black carbon data. Aerosol Air Qual. Res. 11,539–546.
Heagerty, A.M., Heerkens, E.H., Izzard, A.S., 2010. Small artery structure and function inhypertension. J. Cell. Mol. Med. 14, 1037–1043.
Ikram, M.K., Witteman, J.C., Vingerling, J.R., Breteler, M.M., Hofman, A., de Jong, P.T., 2006.Retinal vessel diameters and risk of hypertension: the Rotterdam Study. Hyperten-sion 47, 189–194.
Knudtson, M.D., Lee, K.E., Hubbard, L.D., Wong, T.Y., Klein, R., Klein, B.E., 2003. Revised for-mulas for summarizing retinal vessel diameters. Curr. Eye Res. 27, 143–149.
Laden, F., Schwartz, J., Speizer, F.E., Dockery, D.W., 2006. Reduction in fine particulate airpollution and mortality — extended follow-up of the Harvard six cities study. Am. J.Respir. Crit. Care Med. 173, 667–672.
Levy, B.I., Ambrosio, G., Pries, A.R., Struijker-Boudier, H.A., 2001. Microcirculation in hy-pertension: a new target for treatment? Circulation 104, 735–740.
Lewington, S., Clarke, R., Qizilbash, N., Peto, R., Collins, R., 2002. Age-specific relevance ofusual blood pressure to vascular mortality: a meta-analysis of individual data for onemillion adults in 61 prospective studies. Lancet 360, 1903–1913.
Louwies, T., Int Panis, L., Kicinski, M., De Boever, P., Nawrot, T.S., 2013. Retinal microvas-cular responses to short-term changes in particulate air pollution in healthy adults.Environ. Health Perspect. 121, 1011–1016.
Magari, S.R., Hauser, R., Schwartz, J., Williams, P.L., Smith, T.J., Christiani, D.C., 2001. Asso-ciation of heart rate variability with occupational and environmental exposure to par-ticulate air pollution. Circulation 104, 986–991.
Mills, N.L., Donaldson, K., Hadoke, P.W., Boon, N.A., MacNee, W., Cassee, F.R., et al., 2009.Adverse cardiovascular effects of air pollution. Nat. Clin. Pract. Cardiovasc. Med. 6,36–44.
Mordukhovich, I., Wilker, E., Suh, H., Wright, R., Sparrow, D., Vokonas, P.S., et al., 2009.Black carbon exposure, oxidative stress genes, and blood pressure in a repeated-measures study. Environ. Health Perspect. 117, 1767–1772.
Mulvany, M.J., 1991. Are vascular abnormalities a primary cause or secondary conse-quence of hypertension? Hypertension 18, I52–I57.
Mulvany, M.J., 2002. Small artery remodeling and significance in the development of hy-pertension. News Physiol. Sci. 17, 105–109.
O'Neill, M.S., Veves, A., Zanobetti, A., Sarnat, J.A., Gold, D.R., Economides, P.A., et al., 2005.Diabetes enhances vulnerability to particulate air pollution-associated impairment invascular reactivity and endothelial function. Circulation 111, 2913–2920.
Padro-Martinez, L.T., Patton, A.P., Trull, J.B., Zamore, W., Brugge, D., Durant, J.L., 2012. Mo-bile monitoring of particle number concentration and other traffic-related air pollut-ants in a near-highway neighborhood over the course of a year. Atmos. Environ.(1994) 61, 253–264.
Parati, G., Stergiou, G.S., Asmar, R., Bilo, G., de LP, Imai, Y., et al., 2008. European Society ofHypertension guidelines for blood pressure monitoring at home: a summary reportof the Second International Consensus Conference on Home Blood Pressure Monitor-ing. J. Hypertens. 26, 1505–1526.
Park, S.K., O'Neill, M.S., Vokonas, P.S., Sparrow, D., Spiro III, A., Tucker, K.L., et al., 2008.Traffic-related particles are associated with elevated homocysteine: the VA norma-tive aging study. Am. J. Respir. Crit. Care Med. 178, 283–289.
Pieters, N., Plusquin, M., Cox, B., Kicinski, M., Vangronsveld, J., Nawrot, T.S., 2012. An epi-demiological appraisal of the association between heart rate variability and particu-late air pollution: a meta-analysis. Heart 98, 1127–1135.
Reid, I.A., 1992. Interactions between Ang-II, sympathetic nervous-system, and barore-ceptor reflexes in regulation of blood-pressure. Am. J. Physiol. 262, E763–E778.
Schneider, A., Hampel, R., Ibald-Mulli, A., Zareba, W., Schmidt, G., Schneider, R., et al.,2010. Changes in deceleration capacity of heart rate and heart rate variability inducedby ambient air pollution in individuals with coronary artery disease. Part. FibreToxicol. 7, 29.
Schwartz, J., Alexeeff, S.E., Mordukhovich, I., Gryparis, A., Vokonas, P., Suh, H., et al., 2012.Association between long-term exposure to traffic particles and blood pressure in theVeterans Administration Normative Aging Study. Occup. Environ. Med. 69, 422–427.
Valeri, L., Vanderweele, T.J., 2013. Mediation analysis allowing for exposure–mediator in-teractions and causal interpretation: theoretical assumptions and implementationwith SAS and SPSS macros. Psychol. Methods 18, 137–150.
Vasan, R.S., Larson, M.G., Leip, E.P., Evans, J.C., O'Donnell, C.J., Kannel, W.B., et al., 2001. Im-pact of high-normal blood pressure on the risk of cardiovascular disease. N. Engl. J.Med. 345, 1291–1297.
Wilker, E.H., Baccarelli, A., Suh, H., Vokonas, P., Wright, R.O., Schwartz, J., 2010. Black car-bon exposures, blood pressure, and interactions with single nucleotide polymor-phisms in MicroRNA processing genes. Environ. Health Perspect. 118, 943–948.
Wong, T.Y., Mitchell, P., 2007. The eye in hypertension. Lancet 369, 425–435.Wong, T.Y., Knudtson, M.D., Klein, R., Klein, B.E., Meuer, S.M., Hubbard, L.D., 2004a.
Computer-assisted measurement of retinal vessel diameters in the Beaver Dam EyeStudy: methodology, correlation between eyes, and effect of refractive errors. Oph-thalmology 111, 1183–1190.
Wong, T.Y., Shankar, A., Klein, R., Klein, B.E., Hubbard, L.D., 2004b. Prospective cohortstudy of retinal vessel diameters and risk of hypertension. BMJ 329, 79.
Zhao, X., Sun, Z., Ruan, Y., Yan, J., Mukherjee, B., Yang, F., et al., 2014. Personal black carbonexposure influences ambulatory blood pressure: Air Pollution and CardiometabolicDisease (AIRCMD-China) study. Hypertension 63, 871–877.