
Bit Error Rate Estimation Methods for QPSK CO-OFDM Transmission
9
JOURNAL OF LIGHTWAVE TECHNOLOGY, VOL. 32, NO. 17, SEPTEMBER 1, 2014 2951 Bit Error Rate Estimation Methods for QPSK CO-OFDM Transmission Son Thai Le, Keith J. Blow, Vladimir K. Mezentsev, and Sergei K. Turitsyn Abstract—Coherent optical orthogonal frequency division mul- tiplexing (CO-OFDM) is an attractive transmission technique to virtually eliminate intersymbol interference caused by chro- matic dispersion and polarization-mode dispersion. Design, de- velopment, and operation of CO-OFDM systems require simple, efficient, and reliable methods of their performance evaluation. In this paper, we demonstrate an accurate bit error rate estimation method for QPSK CO-OFDM transmission based on the probabil- ity density function of the received QPSK symbols. By comparing with other known approaches, including data-aided and nondata- aided error vector magnitude, we show that the proposed method offers the most accurate estimate of the system performance for both single channel and wavelength division multiplexing QPSK CO-OFDM transmission systems. Index Terms—Bit error rate (BER), coherent detection, coherent optical transmission, orthogonal frequency division multiplexing. I. INTRODUCTION C OHERENT optical orthogonal frequency division multi- plexing (CO-OFDM) is considered as a promising can- didate for future long-haul high capacity transmission systems [1]. CO-OFDM provides an efficient way to compensate for inter-symbol interference (ISI) caused by both chromatic dis- persion (CD) and polarization-mode dispersion (PMD) [2], [3]. In addition, CO-OFDM also offers flexibility in accessing indi- vidual subcarriers in a multi-user environment, and a simplified equalization scheme [4]. The design, development, and oper- ation of CO-OFDM systems all require simple, efficient and reliable methods of their performance evaluation. The bit error rate (BER) in CO-OFDM systems can be esti- mated in numerical investigations using Monte Carlo simulation and in experiments (typically with off-line signal processing) by directly counting the number of errors at the receiver. The cor- responding Q-factor is calculated using the inverse complemen- tary error function [5]. However, this method relies on a large number of statistical samples and, in general, is time-consuming, especially if the signal quality is high and massive optimization modelling is required. It is highly desirable and practically im- portant to develop efficient indirect numerical and statistical methods for evaluating CO-OFDM system performance. Manuscript received December 5, 2013; revised May 27, 2014 and April 24, 2014; accepted June 23, 2014. Date of publication June 29, 2014; date of current version August 11, 2014. This work was supported by the U.K. EPSRC Program Grant UNLOC (EP/J017582/1). The authors are with the Aston Institute of Photonic Technologies (AIPT), School of Engineering and Applied Science, Birmingham B4 7ET, U.K. (e-mail: [email protected]; [email protected]; [email protected]; [email protected]). Color versions of one or more of the figures in this paper are available online at http://ieeexplore.ieee.org. Digital Object Identifier 10.1109/JLT.2014.2333881 For coherent communication systems with multi-level sig- nals both in amplitude and in phase, the error vector magnitude (EVM) is commonly used as a fast measure of the received dig- ital signal’s quality [6], [7]. The EVM describes the effective distance of the received complex symbol from its ideal posi- tion in the constellation diagram. In an additive white Gaussian noise transmission channel the connection of EVM to BER can be determined theoretically [7]. The standard EVM is a data- aided estimation technique, where for measurement purposes the transmitted data are known [6]. On the other hand, it is more common for real-world receivers that the sent data (e.g. training sequences) are unknown. In this case, nondata-aided reception can be applied as shown in [8]. Several other relevant methods of evaluating the signal quality have recently been proposed, experimentally verified and compared for single carrier QPSK systems [9]–[11]. However, the exact relationship between the BER and the EVM in CO-OFDM still remains an open problem. In addition, the relative performances of different BER estima- tion methods for coherent QPSK systems have to be examined carefully when being applied for CO-OFDM transmission. Recently, we have proposed a novel statistical BER estima- tion method for CO-OFDM transmissions [12] based on the probability density function (PDF) of the received QPSK sym- bols. The proposed BER estimation method was evaluated in comparison with other known approaches for single channel 112 Gb/s polarization division multiplexing (PDM) CO-OFDM transmissions with a cyclic prefix (CP) in [12]. In this paper, we extend our previous work [12] by studying the statistical properties of QPSK signals and demonstrating the effectiveness of this method in reduced-guard-interval (RGI) and wavelength division multiplexing (WDM) CO-OFDM transmissions. In ad- dition, the robustness of the proposed BER estimation method to laser phase noise and frequency offset is also discussed. II. BER ESTIMATION METHODS FOR OPTICAL QPSK TRANSMISSIONS A. Direct Error-Counting The BER can be directly measured by counting the number of errors at the receiver subject to sufficient symbols being recorded. The measured (or estimated) BER is usually converted to an equivalent “Gaussian noise” Q-factor in dB using the expression Q BER = 20 log[ √ 2 · efrc −1 (2BER)] (1) where erfc −1 is the inverse complementary error function. This sets the reference Q-factor used in the following evaluation of different indirect methods. 0733-8724 © 2014 IEEE. Personal use is permitted, but republication/redistribution requires IEEE permission. See http://www.ieee.org/publications standards/publications/rights/index.html for more information.
-
Upload
independent -
Category
Documents
-
view
1 -
download
0
Transcript of Bit Error Rate Estimation Methods for QPSK CO-OFDM Transmission

JOURNAL OF LIGHTWAVE TECHNOLOGY, VOL. 32, NO. 17, SEPTEMBER 1, 2014 2951
Bit Error Rate Estimation Methods for QPSKCO-OFDM Transmission
Son Thai Le, Keith J. Blow, Vladimir K. Mezentsev, and Sergei K. Turitsyn
Abstract—Coherent optical orthogonal frequency division mul-tiplexing (CO-OFDM) is an attractive transmission techniqueto virtually eliminate intersymbol interference caused by chro-matic dispersion and polarization-mode dispersion. Design, de-velopment, and operation of CO-OFDM systems require simple,efficient, and reliable methods of their performance evaluation. Inthis paper, we demonstrate an accurate bit error rate estimationmethod for QPSK CO-OFDM transmission based on the probabil-ity density function of the received QPSK symbols. By comparingwith other known approaches, including data-aided and nondata-aided error vector magnitude, we show that the proposed methodoffers the most accurate estimate of the system performance forboth single channel and wavelength division multiplexing QPSKCO-OFDM transmission systems.
Index Terms—Bit error rate (BER), coherent detection, coherentoptical transmission, orthogonal frequency division multiplexing.
I. INTRODUCTION
COHERENT optical orthogonal frequency division multi-plexing (CO-OFDM) is considered as a promising can-
didate for future long-haul high capacity transmission systems[1]. CO-OFDM provides an efficient way to compensate forinter-symbol interference (ISI) caused by both chromatic dis-persion (CD) and polarization-mode dispersion (PMD) [2], [3].In addition, CO-OFDM also offers flexibility in accessing indi-vidual subcarriers in a multi-user environment, and a simplifiedequalization scheme [4]. The design, development, and oper-ation of CO-OFDM systems all require simple, efficient andreliable methods of their performance evaluation.
The bit error rate (BER) in CO-OFDM systems can be esti-mated in numerical investigations using Monte Carlo simulationand in experiments (typically with off-line signal processing) bydirectly counting the number of errors at the receiver. The cor-responding Q-factor is calculated using the inverse complemen-tary error function [5]. However, this method relies on a largenumber of statistical samples and, in general, is time-consuming,especially if the signal quality is high and massive optimizationmodelling is required. It is highly desirable and practically im-portant to develop efficient indirect numerical and statisticalmethods for evaluating CO-OFDM system performance.
Manuscript received December 5, 2013; revised May 27, 2014 and April24, 2014; accepted June 23, 2014. Date of publication June 29, 2014; date ofcurrent version August 11, 2014. This work was supported by the U.K. EPSRCProgram Grant UNLOC (EP/J017582/1).
The authors are with the Aston Institute of Photonic Technologies (AIPT),School of Engineering and Applied Science, Birmingham B4 7ET, U.K.(e-mail: [email protected]; [email protected]; [email protected];[email protected]).
Color versions of one or more of the figures in this paper are available onlineat http://ieeexplore.ieee.org.
Digital Object Identifier 10.1109/JLT.2014.2333881
For coherent communication systems with multi-level sig-nals both in amplitude and in phase, the error vector magnitude(EVM) is commonly used as a fast measure of the received dig-ital signal’s quality [6], [7]. The EVM describes the effectivedistance of the received complex symbol from its ideal posi-tion in the constellation diagram. In an additive white Gaussiannoise transmission channel the connection of EVM to BER canbe determined theoretically [7]. The standard EVM is a data-aided estimation technique, where for measurement purposesthe transmitted data are known [6]. On the other hand, it is morecommon for real-world receivers that the sent data (e.g. trainingsequences) are unknown. In this case, nondata-aided receptioncan be applied as shown in [8]. Several other relevant methodsof evaluating the signal quality have recently been proposed,experimentally verified and compared for single carrier QPSKsystems [9]–[11]. However, the exact relationship between theBER and the EVM in CO-OFDM still remains an open problem.In addition, the relative performances of different BER estima-tion methods for coherent QPSK systems have to be examinedcarefully when being applied for CO-OFDM transmission.
Recently, we have proposed a novel statistical BER estima-tion method for CO-OFDM transmissions [12] based on theprobability density function (PDF) of the received QPSK sym-bols. The proposed BER estimation method was evaluated incomparison with other known approaches for single channel112 Gb/s polarization division multiplexing (PDM) CO-OFDMtransmissions with a cyclic prefix (CP) in [12]. In this paper,we extend our previous work [12] by studying the statisticalproperties of QPSK signals and demonstrating the effectivenessof this method in reduced-guard-interval (RGI) and wavelengthdivision multiplexing (WDM) CO-OFDM transmissions. In ad-dition, the robustness of the proposed BER estimation methodto laser phase noise and frequency offset is also discussed.
II. BER ESTIMATION METHODS FOR OPTICAL
QPSK TRANSMISSIONS
A. Direct Error-Counting
The BER can be directly measured by counting the numberof errors at the receiver subject to sufficient symbols beingrecorded. The measured (or estimated) BER is usually convertedto an equivalent “Gaussian noise” Q-factor in dB using theexpression
QBER = 20 log[√
2 · efrc−1(2BER)] (1)
where erfc−1 is the inverse complementary error function. Thissets the reference Q-factor used in the following evaluation ofdifferent indirect methods.
0733-8724 © 2014 IEEE. Personal use is permitted, but republication/redistribution requires IEEE permission.See http://www.ieee.org/publications standards/publications/rights/index.html for more information.

2952 JOURNAL OF LIGHTWAVE TECHNOLOGY, VOL. 32, NO. 17, SEPTEMBER 1, 2014
Fig. 1. Constellation diagram and error vector for a QPSK signal. Ideal con-stellation diagram with a received value X. Vector Et,i is the transmitted signal,vector Er , i is the received signal and Eerr , i = Er , i − Et , i is the error vector.
B. Data-Aided EVM
In an optical communication system with QPSK modulationformat, the data is encoded in the phase of the optical electricalfield. The complex amplitude of this field can be described byfour points in a complex constellation plane. At the receiver, af-ter propagation through the fiber link, the received signal vectorEr deviates by an error vector Eerr from the ideal transmittedvector Et as shown in Fig. 1. The data-aided EVM is definedby a root mean square of Eerr and embraces all (linear andnonlinear) impairments [6]
EVMm =σerr
|Et,m | , σ2err =
⟨|Eerr,i|2
⟩,Eerr,i = Er,i − Et,i
(2)where <·> stands for the averaging operation, Et,m is thelongest ideal constellation vector, serving for normalization.
By applying the definition (2), the EVM in QPSK CO-OFDMtransmissions can be calculated as
EVM =
√⟨|ck − ck,ideal|2
⟩
|cideal|(3)
where ck is the kth received symbol and ck,ideal is the corre-sponding ideal constellation point. Note that for QPSK signalsall ideal constellation points are allocated in a circle:|ck,ideal| =|cideal|.
For a QPSK system with AGWN channel the BER can beestimated from the EVM as [7]
BER =12erfc
(EVM−1
√2
). (4)
By substituting (4) into (1), we can define the equivalentQ-factor in dB knowing the EVM as
QEVM = −20 log[EVM]. (5)
C. Nondata-Aided EVM (Q factor 1, Q1)
The EVM can also be calculated without knowing thetransmitted data. The most common approach for calculatingnondata-aided EVM is to perform hard decision on the receivedsymbols and then apply the expression (2) [6]. In this case, theerror vector of a received symbol is calculated according to thenearest ideal constellation point. As a consequence, nondata-
aided EVM tends to under-estimate the EVM if the receivedsignal is strongly noisy.
Another nondata-aided EVM has been proposed for QPSKCO-OFDM transmission in [8]. In this technique the EVM iscalculated by replacing the four ideal QPSK constellation pointswith the mean values of the received symbols in the four quad-rants of the constellation diagram
EVM1 =√⟨
|ck,i − cavg ,i |2 / |cavg ,i |2⟩
(6)
where cavg ,i, i = 1, 2, 3, 4 are the means of the received sym-bols ck,i that fall into the i’th quadrant of the constellationdiagram. For comparison purpose we also convert this nondata-aided EVM into an equivalent Q-factor in dB by the expression
Q1 = −20 log[EVM1]. (7)
D. Q-Factor 2 (Q2)
It has been shown [13] that for single carrier QPSK systemswithout optical dispersion compensation, the four componentsof a QPSK signal (in-phase x-polarization, in-phase y- polariza-tion, quadrature x-polarization, quadrature y- polarization) areGaussian distributed (or at least nearly Gaussian distributed) andstatistically independent both before and after the digital sig-nal processing (DSP) in the receiver [13]. Therefore, a QPSKconstellation can be decomposed into two binary-phase-shift-keying constellations (0 and π), or equivalently two amplitude-shift-keying constellations (1 and −1), for the in-phase andquadrature components [5]. As a result, following the samewell known approach for calculating the conventional Q-factorfor on-off-keying signals, we can define the Q-factors of the in-phase and quadrature components of the received QPSK signalsby [9]
QRe =〈ck,Re(ck,Re > 0)〉 − 〈ck,Re(ck,Re < 0)〉
σRe(ck,Re > 0) + σRe(ck,Re < 0)(8)
QIm =〈ck,Im (ck,Im > 0)〉 − 〈ck,Im (ck,Im < 0)〉
σIm (ck,Im > 0) + σIm (ck,Im < 0)(9)
where σ(·) denotes the standard deviation (STD) of the statisti-cal samples. In (8) and (9) QRe(QIm ) is calculated as the ratiobetween the difference of the means and the sum of the STDsof in-phase (quadrature) components with opposite signs. TheBER then can be obtained by using the estimations from bothin-phase and quadrature components
BER =⟨[
12erfc
(QRe√
2
),12erfc
(QIm√
2
)]⟩. (10)
E. Q-Factor 3 (Q3)
Another definition of Q-factor was introduced in [9] as theratio between the mean and the STD value of each constellationpoint. For the symbol in the first quadrant, the Q-factors are
Q1,Re =|〈ck,Re(ck,Re > 0, ck,Im > 0)〉|
σRe(ck,Re > 0, ck,Im > 0)(11)
Q1,Im =|〈ck,Im (ck,Re > 0, ck,Im > 0)〉|
σIm (ck,Re > 0, ck,Im > 0). (12)
LE et al.: BIT ERROR RATE ESTIMATION METHODS FOR QPSK CO-OFDM TRANSMISSION 2953
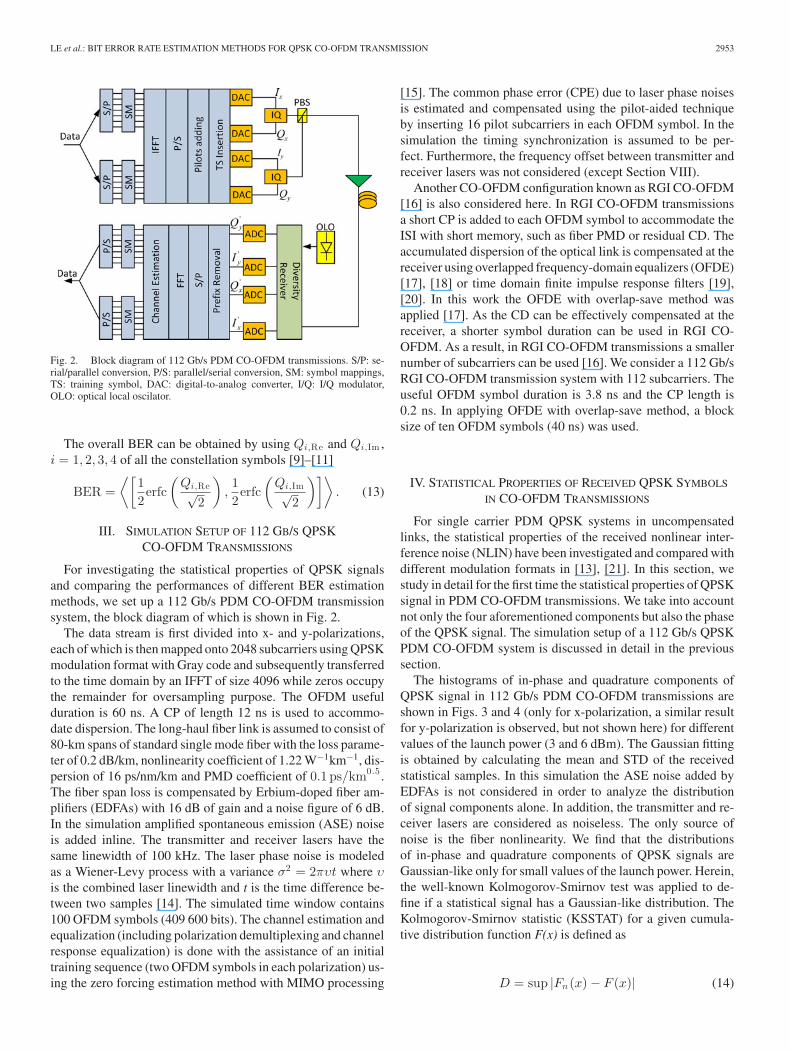
Fig. 2. Block diagram of 112 Gb/s PDM CO-OFDM transmissions. S/P: se-rial/parallel conversion, P/S: parallel/serial conversion, SM: symbol mappings,TS: training symbol, DAC: digital-to-analog converter, I/Q: I/Q modulator,OLO: optical local oscilator.
The overall BER can be obtained by using Qi,Re and Qi,Im ,i = 1, 2, 3, 4 of all the constellation symbols [9]–[11]
BER =⟨[
12erfc
(Qi,Re√
2
),12erfc
(Qi,Im√
2
)]⟩. (13)
III. SIMULATION SETUP OF 112 GB/S QPSKCO-OFDM TRANSMISSIONS
For investigating the statistical properties of QPSK signalsand comparing the performances of different BER estimationmethods, we set up a 112 Gb/s PDM CO-OFDM transmissionsystem, the block diagram of which is shown in Fig. 2.
The data stream is first divided into x- and y-polarizations,each of which is then mapped onto 2048 subcarriers using QPSKmodulation format with Gray code and subsequently transferredto the time domain by an IFFT of size 4096 while zeros occupythe remainder for oversampling purpose. The OFDM usefulduration is 60 ns. A CP of length 12 ns is used to accommo-date dispersion. The long-haul fiber link is assumed to consist of80-km spans of standard single mode fiber with the loss parame-ter of 0.2 dB/km, nonlinearity coefficient of 1.22 W−1km−1, dis-persion of 16 ps/nm/km and PMD coefficient of 0.1 ps/km0.5 .The fiber span loss is compensated by Erbium-doped fiber am-plifiers (EDFAs) with 16 dB of gain and a noise figure of 6 dB.In the simulation amplified spontaneous emission (ASE) noiseis added inline. The transmitter and receiver lasers have thesame linewidth of 100 kHz. The laser phase noise is modeledas a Wiener-Levy process with a variance σ2 = 2πυt where υis the combined laser linewidth and t is the time difference be-tween two samples [14]. The simulated time window contains100 OFDM symbols (409 600 bits). The channel estimation andequalization (including polarization demultiplexing and channelresponse equalization) is done with the assistance of an initialtraining sequence (two OFDM symbols in each polarization) us-ing the zero forcing estimation method with MIMO processing
[15]. The common phase error (CPE) due to laser phase noisesis estimated and compensated using the pilot-aided techniqueby inserting 16 pilot subcarriers in each OFDM symbol. In thesimulation the timing synchronization is assumed to be per-fect. Furthermore, the frequency offset between transmitter andreceiver lasers was not considered (except Section VIII).
Another CO-OFDM configuration known as RGI CO-OFDM[16] is also considered here. In RGI CO-OFDM transmissionsa short CP is added to each OFDM symbol to accommodate theISI with short memory, such as fiber PMD or residual CD. Theaccumulated dispersion of the optical link is compensated at thereceiver using overlapped frequency-domain equalizers (OFDE)[17], [18] or time domain finite impulse response filters [19],[20]. In this work the OFDE with overlap-save method wasapplied [17]. As the CD can be effectively compensated at thereceiver, a shorter symbol duration can be used in RGI CO-OFDM. As a result, in RGI CO-OFDM transmissions a smallernumber of subcarriers can be used [16]. We consider a 112 Gb/sRGI CO-OFDM transmission system with 112 subcarriers. Theuseful OFDM symbol duration is 3.8 ns and the CP length is0.2 ns. In applying OFDE with overlap-save method, a blocksize of ten OFDM symbols (40 ns) was used.
IV. STATISTICAL PROPERTIES OF RECEIVED QPSK SYMBOLS
IN CO-OFDM TRANSMISSIONS
For single carrier PDM QPSK systems in uncompensatedlinks, the statistical properties of the received nonlinear inter-ference noise (NLIN) have been investigated and compared withdifferent modulation formats in [13], [21]. In this section, westudy in detail for the first time the statistical properties of QPSKsignal in PDM CO-OFDM transmissions. We take into accountnot only the four aforementioned components but also the phaseof the QPSK signal. The simulation setup of a 112 Gb/s QPSKPDM CO-OFDM system is discussed in detail in the previoussection.
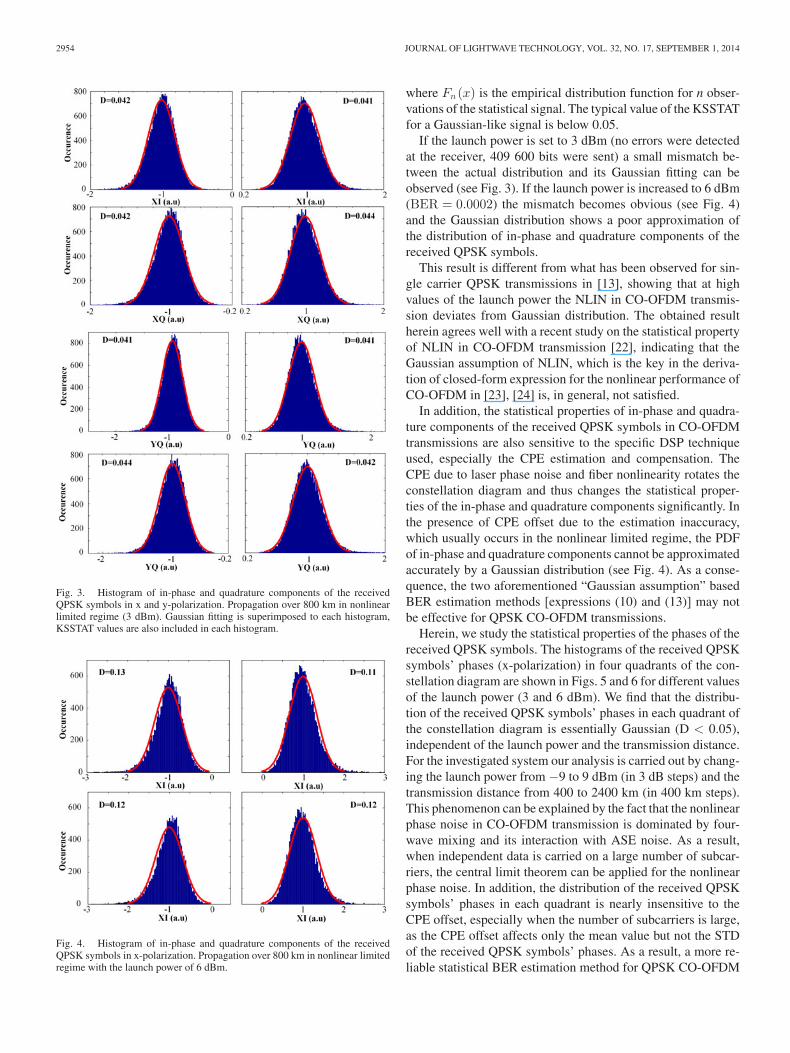
The histograms of in-phase and quadrature components ofQPSK signal in 112 Gb/s PDM CO-OFDM transmissions areshown in Figs. 3 and 4 (only for x-polarization, a similar resultfor y-polarization is observed, but not shown here) for differentvalues of the launch power (3 and 6 dBm). The Gaussian fittingis obtained by calculating the mean and STD of the receivedstatistical samples. In this simulation the ASE noise added byEDFAs is not considered in order to analyze the distributionof signal components alone. In addition, the transmitter and re-ceiver lasers are considered as noiseless. The only source ofnoise is the fiber nonlinearity. We find that the distributionsof in-phase and quadrature components of QPSK signals areGaussian-like only for small values of the launch power. Herein,the well-known Kolmogorov-Smirnov test was applied to de-fine if a statistical signal has a Gaussian-like distribution. TheKolmogorov-Smirnov statistic (KSSTAT) for a given cumula-tive distribution function F(x) is defined as
D = sup |Fn (x) − F (x)| (14)
2954 JOURNAL OF LIGHTWAVE TECHNOLOGY, VOL. 32, NO. 17, SEPTEMBER 1, 2014
Fig. 3. Histogram of in-phase and quadrature components of the receivedQPSK symbols in x and y-polarization. Propagation over 800 km in nonlinearlimited regime (3 dBm). Gaussian fitting is superimposed to each histogram,KSSTAT values are also included in each histogram.
Fig. 4. Histogram of in-phase and quadrature components of the receivedQPSK symbols in x-polarization. Propagation over 800 km in nonlinear limitedregime with the launch power of 6 dBm.
where Fn (x) is the empirical distribution function for n obser-vations of the statistical signal. The typical value of the KSSTATfor a Gaussian-like signal is below 0.05.
If the launch power is set to 3 dBm (no errors were detectedat the receiver, 409 600 bits were sent) a small mismatch be-tween the actual distribution and its Gaussian fitting can beobserved (see Fig. 3). If the launch power is increased to 6 dBm(BER = 0.0002) the mismatch becomes obvious (see Fig. 4)and the Gaussian distribution shows a poor approximation ofthe distribution of in-phase and quadrature components of thereceived QPSK symbols.
This result is different from what has been observed for sin-gle carrier QPSK transmissions in [13], showing that at highvalues of the launch power the NLIN in CO-OFDM transmis-sion deviates from Gaussian distribution. The obtained resultherein agrees well with a recent study on the statistical propertyof NLIN in CO-OFDM transmission [22], indicating that theGaussian assumption of NLIN, which is the key in the deriva-tion of closed-form expression for the nonlinear performance ofCO-OFDM in [23], [24] is, in general, not satisfied.
In addition, the statistical properties of in-phase and quadra-ture components of the received QPSK symbols in CO-OFDMtransmissions are also sensitive to the specific DSP techniqueused, especially the CPE estimation and compensation. TheCPE due to laser phase noise and fiber nonlinearity rotates theconstellation diagram and thus changes the statistical proper-ties of the in-phase and quadrature components significantly. Inthe presence of CPE offset due to the estimation inaccuracy,which usually occurs in the nonlinear limited regime, the PDFof in-phase and quadrature components cannot be approximatedaccurately by a Gaussian distribution (see Fig. 4). As a conse-quence, the two aforementioned “Gaussian assumption” basedBER estimation methods [expressions (10) and (13)] may notbe effective for QPSK CO-OFDM transmissions.
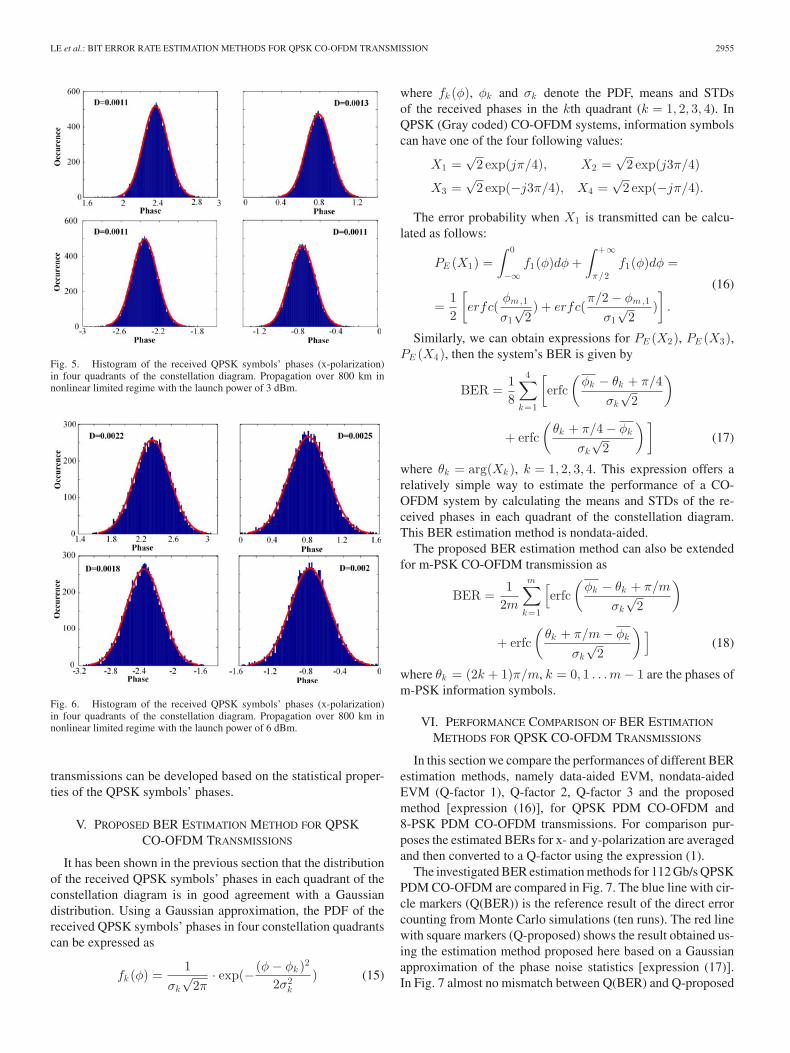
Herein, we study the statistical properties of the phases of thereceived QPSK symbols. The histograms of the received QPSKsymbols’ phases (x-polarization) in four quadrants of the con-stellation diagram are shown in Figs. 5 and 6 for different valuesof the launch power (3 and 6 dBm). We find that the distribu-tion of the received QPSK symbols’ phases in each quadrant ofthe constellation diagram is essentially Gaussian (D < 0.05),independent of the launch power and the transmission distance.For the investigated system our analysis is carried out by chang-ing the launch power from −9 to 9 dBm (in 3 dB steps) and thetransmission distance from 400 to 2400 km (in 400 km steps).This phenomenon can be explained by the fact that the nonlinearphase noise in CO-OFDM transmission is dominated by four-wave mixing and its interaction with ASE noise. As a result,when independent data is carried on a large number of subcar-riers, the central limit theorem can be applied for the nonlinearphase noise. In addition, the distribution of the received QPSKsymbols’ phases in each quadrant is nearly insensitive to theCPE offset, especially when the number of subcarriers is large,as the CPE offset affects only the mean value but not the STDof the received QPSK symbols’ phases. As a result, a more re-liable statistical BER estimation method for QPSK CO-OFDM
LE et al.: BIT ERROR RATE ESTIMATION METHODS FOR QPSK CO-OFDM TRANSMISSION 2955
Fig. 5. Histogram of the received QPSK symbols’ phases (x-polarization)in four quadrants of the constellation diagram. Propagation over 800 km innonlinear limited regime with the launch power of 3 dBm.
Fig. 6. Histogram of the received QPSK symbols’ phases (x-polarization)in four quadrants of the constellation diagram. Propagation over 800 km innonlinear limited regime with the launch power of 6 dBm.
transmissions can be developed based on the statistical proper-ties of the QPSK symbols’ phases.
V. PROPOSED BER ESTIMATION METHOD FOR QPSKCO-OFDM TRANSMISSIONS
It has been shown in the previous section that the distributionof the received QPSK symbols’ phases in each quadrant of theconstellation diagram is in good agreement with a Gaussiandistribution. Using a Gaussian approximation, the PDF of thereceived QPSK symbols’ phases in four constellation quadrantscan be expressed as
fk (φ) =1
σk
√2π
· exp(− (φ − φk )2
2σ2k
) (15)
where fk (φ), φk and σk denote the PDF, means and STDsof the received phases in the kth quadrant (k = 1, 2, 3, 4). InQPSK (Gray coded) CO-OFDM systems, information symbolscan have one of the four following values:
X1 =√
2 exp(jπ/4), X2 =√
2 exp(j3π/4)
X3 =√
2 exp(−j3π/4), X4 =√
2 exp(−jπ/4).
The error probability when X1 is transmitted can be calcu-lated as follows:
PE (X1) =∫ 0
−∞f1(φ)dφ +
∫ +∞
π/2f1(φ)dφ =
=12
[erfc(
φm,1
σ1√
2) + erfc(
π/2 − φm,1
σ1√
2)]
.
(16)
Similarly, we can obtain expressions for PE (X2), PE (X3),PE (X4), then the system’s BER is given by
BER =18
4∑k=1
[erfc
(φk − θk + π/4
σk
√2
)
+ erfc(
θk + π/4 − φk
σk
√2
) ](17)
where θk = arg(Xk ), k = 1, 2, 3, 4. This expression offers arelatively simple way to estimate the performance of a CO-OFDM system by calculating the means and STDs of the re-ceived phases in each quadrant of the constellation diagram.This BER estimation method is nondata-aided.
The proposed BER estimation method can also be extendedfor m-PSK CO-OFDM transmission as
BER =1
2m
m∑k=1
[erfc
(φk − θk + π/m
σk
√2
)
+ erfc(
θk + π/m − φk
σk
√2
) ](18)
where θk = (2k + 1)π/m, k = 0, 1 . . . m − 1 are the phases ofm-PSK information symbols.
VI. PERFORMANCE COMPARISON OF BER ESTIMATION
METHODS FOR QPSK CO-OFDM TRANSMISSIONS
In this section we compare the performances of different BERestimation methods, namely data-aided EVM, nondata-aidedEVM (Q-factor 1), Q-factor 2, Q-factor 3 and the proposedmethod [expression (16)], for QPSK PDM CO-OFDM and8-PSK PDM CO-OFDM transmissions. For comparison pur-poses the estimated BERs for x- and y-polarization are averagedand then converted to a Q-factor using the expression (1).
The investigated BER estimation methods for 112 Gb/s QPSKPDM CO-OFDM are compared in Fig. 7. The blue line with cir-cle markers (Q(BER)) is the reference result of the direct errorcounting from Monte Carlo simulations (ten runs). The red linewith square markers (Q-proposed) shows the result obtained us-ing the estimation method proposed here based on a Gaussianapproximation of the phase noise statistics [expression (17)].In Fig. 7 almost no mismatch between Q(BER) and Q-proposed

2956 JOURNAL OF LIGHTWAVE TECHNOLOGY, VOL. 32, NO. 17, SEPTEMBER 1, 2014
Fig. 7. Q-factor values (average over x-and y-polarization) as a function ofthe launch power in 112 Gb/s QPSK PDM CO-OFDM after 2400 km of trans-mission. Q(EVM), Q1, Q2, Q3 all follow the lower curve.
Fig. 8. Q-factor values (average over x-and y-polarization) as a function ofthe launch power in 112 Gb/s QPSK PDM RGI-CO-OFDM after 4000 km oftransmission.
is observed. This result indicates that the proposed BER estima-tion method is highly accurate. On the other hand, all the otherBER estimation methods, namely EVM (data-aided, nondata-aided), Q-factor 2 and Q-factor 3, underestimate the systemperformance by approximatelly 1 dB. Interestingly, all theseBER estimation methods show almost the same performancefor CO-OFDM transmission.
The performance of the BER estimation methods for112 Gb/s QPSK PDM RGI-CO-OFDM is shown in Fig. 8. In112 Gb/s QPSK RGI-CO-OFDM transmissions with OFDE atthe receiver, the proposed BER estimation method also showsexcellent agreement with the direct error counting result. OtherBER estimation methods, unlike the case of the conventionalCO-OFDM transmission, overestimate the system performance.These BER estimation methods all show similar performanceand the estimation inaccuracy increases with the launch power.When the launch power is low (ASE limited regime) EVM (data-aided and nondata-aided), Q-factor 2, Q-factor 3 show goodagreement with the direct error counting technique. However, ata high level of the launch power (the nonlinear limited regime)the inaccuracy in estimation is significant and increases pro-portionally with the launch power. A closer inspection reveals
Fig. 9. Q-factor values for the center channel (average over x- and y-polarization) as a function of the launch power in 7 × 112 Gb/s QPSK PDMWDM RGI-CO-OFDM after 3200 km of transmission.
Fig. 10. Q-factor values (average over x- and y-polarization) as a functionof the launch power in 112 Gb/s 8-PSK PDM CO-OFDM after 800 km oftransmission.
that among the BER estimation methods considered here thedata-aided EVM has the poorest performance. However, the dif-ference in performances of data-aided EVM and other methodsis not significant.
The BER estimation methods applied in WDM CO-OFDMtransmissions transmission are now investigated. We simulate7 × 112 Gb/s PDM WDM RGI-CO-OFDM transmissions with50 GHz frequency spacing. In Fig. 9 the Q-factors obtained byusing different BER estimation methods for the center channelare compared. The proposed BER estimation method also showsan excellent performance despite the nonlinear impairmentsfrom neighboring WDM channels. Similar to single channelPDM RGI-CO-OFDM transmission, all other BER estimationmethods overestimate the system performance. The data-aidedEVM also shows the worst performance and nondata-aided,Q-factor 2 and Q-factor 3 have a similar performance.
Fig. 10 shows the performance of the proposed BER esti-mation method for 112 Gb/s 8-PSK PDM CO-OFDM trans-mission. The estimation of the BER from data-aided EVM for8-PSK systems can be found in [7]. As long as the received

LE et al.: BIT ERROR RATE ESTIMATION METHODS FOR QPSK CO-OFDM TRANSMISSION 2957
Fig. 11. Q-factor values (average over x-and y-polarization) as a function ofthe combined laser linewidth in 112 Gb/s PDM CO-OFDM after 2000 km oftransmission; the launch power was 1 dBm.
phases of each transmitted symbol has a Gaussian distribution,the proposed method also offers very accurate estimation of thesystem performance if m-PSK modulation format is adopted.However, the obtained results cannot be extended directly tohigh-order quadratic-amplitude modulation (QAM) modulationformats such as eight QAM or 16QAM, in which the decisionis made by talking into account both the phases and amplitudesof the received symbols. For high-order QAM modulation for-mats, a 3-D PDF would be required for estimating the system’sBER. In this case, a larger number of statistical samples wouldbe required for an accurate estimation which significantly in-creases the complexity of the estimator. This problem is beyondthe scope of this paper. However, further investigation on thissubject is of great interest.
VII. IMPACT OF THE LASER PHASE NOISE
In this section we study the robustness of the proposed BERestimation method to laser phase noise. The laser phase noise canchange the statistical properties of the received QPSK symbols,and thus affects the performance of all statistical BER estimationmethods. For all results presented in this section the CPE isestimated and compensated using the pilot-aided technique. Forthe conventional 112 Gb/s CO-OFDM transmission 16 pilotsubcarriers are inserted in each OFDM symbol, while for RGI-CO-OFDM the number of pilot subcarriers used is 6 [25], [26].Note that a smaller number of pilot subcarriers can be used inRGI-CO-OFDM due to the shorter symbol duration.
The impact of laser phase noise on the performances of theBER estimation methods is shown in Figs. 11 and 12 for CO-OFDM and RGI-CO-OFDM transmissions. The combined laserlinewidth is the sum of the linewidths of the transmitter andreceiver lasers. We assume that the transmitter and receiverlasers have the same linewidth, which is equal to half of thecombined linewidth. For 112 Gb/s PDM CO-OFDM transmis-sion almost no mismatch between the BERs estimated by theproposed method and the direct error counting was observedwhen the combined laser linewidth is increased up to 1.2-MHz.This result indicates that the proposed BER estimation method
Fig. 12. Q-factor values (average over x- and y-polarization) as a function ofthe combined laser linewidth in 112 Gb/s PDM RGI-CO-OFDM after 4000 kmof transmission; the launch power was 1 dBm.
is extremely tolerant to laser phase noise. Note that commer-cial external-cavity lasers have a linewidth of around 100 kHzwhich is the value used here. Other BER estimation methods,on the other hand, are much less tolerant to laser phase noiseas their accuracy decreases when the combined laser linewidthis increased. At the combined laser linewidth of 200 kHz, allthe aforementioned methods underestimate the system perfor-mance by approximately 1 dB. However, if the combined laserlinewidth is increased to 1.2 MHz the difference in Q-factorincreases to over 2.5 dB.
For 112 Gb/s PDM RGI-CO-OFDM the combined laserlinewidth is increased to 12 MHz for investigating its impacton the performance of BER estimation methods. It can be seenthat RGI-CO-OFDM is much more tolerant to laser phase noisein comparison with the conventional CO-OFDM because of theshorter symbol duration. In our investigated systems the symbolduration of RGI-CO-OFDM is 4 ns, which is 18 times shorterthan the symbol duration of the CO-OFDM system (72 ns).For the CO-OFDM system a 3 dB penalty due to laser phasenoise is observed at 0.5 MHz of combined laser linewidth whilefor RGI-CO-OFDM it occurs at 9 MHz (also 18 times dif-ference). As shown in Fig. 12, the proposed BER estimationmethod also shows an excellent tolerance towards the com-bined laser linewidth. Even though at high level of the combinedlaser linewidth this method also overestimates the system per-formance but the inaccuracy is relatively small, below 0.5 dBfor 12 MHz of the combined laser linewidth. On the other hand,for the same value of the combined laser linewidth, other BERestimation methods overestimate the system performance byaround 3 dB. Note that for RGI-CO-OFDM data aided EVM of-fers the worst performance while the combined laser linewidthis varied.
The results obtained in this section indicate that the proposedBER estimation method is highly tolerant to laser phase noise,both in CO-OFDM and RGI-CO-OFDM transmissions.
VIII. IMPACT OF THE FREQUENCY OFFSET
Similar to laser phase noise, the frequency offset betweenthe transmitter and receiver lasers also changes the statistical

2958 JOURNAL OF LIGHTWAVE TECHNOLOGY, VOL. 32, NO. 17, SEPTEMBER 1, 2014
Fig. 13. Q-factor values (average over x-and y-polarization) as a function ofthe frequency offset in 112 Gb/s PDM CO-OFDM after 2000 km of transmission;the launch power was 1 dBm.
Fig. 14. Q-factor values (average over x-and y-polarization) as a functionof the frequency offset in 112 Gb/s PDM RGI-CO-OFDM after 4000 km oftransmission; the launch power was 1 dBm.
properties of the received QPSK symbols. In CO-OFDM trans-missions, this frequency offset can be effectively estimated andcompensated using DSP techniques [27]. However, a residualuncompensated carrier frequency offset is always present in thesystem and thus the performance of statistical BER estimationmethods may be affected. In this section we study the impactof carrier frequency offset on the effectiveness of the proposedBER estimation method.
For this investigation the frequency offset in CO-OFDM andRGI-CO-OFDM systems is varied up to 4 and 36 MHz respec-tively. As the frequency spacing in RGI-CO-OFDM system canbe much larger than that of the traditional CO-OFDM system,RGI-CO-OFDM is also more tolerant to the frequency offset.This is another major advantage of RGI-CO-OFDM as com-pared to traditional CO-OFDM systems.
The simulation results are shown in Figs. 13 and 14. Remark-ably, for both the conventional CO-OFDM and RGI-CO-OFDMsystems the proposed BER estimation method also offers themost accurate estimation of the system performance in the pres-ence of carrier frequency offset. However, some differenceswere observed for CO-OFDM and RGI-CO-OFDM transmis-sions. For RGI-CO-OFDM, the performance of all the BERestimation methods becomes worse if the frequency offset is in-
creased. If the frequency offset is set to 36 MHz, the data-aidedEVM overestimates the system performance by over 2 dB incomparison with 1 dB when no frequency offset is included.The proposed BER estimation method also underestimates thesystem performance in the presence of high frequency offset.However, the inaccuracy is insignificant. For CO-OFDM sys-tem, the proposed BER estimation method shows an excellentperformance even in the presence of large frequency offset.Other BER estimation methods also offer good performancesand their inaccuracies do not seem to increase with the frequencyoffset (up to 4 MHz). However, in general, the proposed BERestimation method shows a much better performance than otherconsidered here techniques.
IX. CONCLUSION
The statistical properties of CO-OFDM transmission arerather different from previously studied intensity modulationdirect detection fibre-optic systems [28]–[32]. Therefore, newrules for BER estimates from numerical modelling have to bedeveloped and verified. We have investigated the performance ofa novel BER estimation method, which is based on the statisticalproperties of the received QPSK symbols, for CO-OFDM trans-missions. Through numerical modeling of both the conventionalPDM CO-OFDM and PDM RGI-CO-OFDM transmissions wedemonstrate that this method is more accurate compared to com-monly used BER estimators. In addition, we also show that theproposed BER estimation method is extremely tolerant to thelaser phase noise and the frequency offset between transmitterand receiver lasers.
ACKNOWLEDGMENT
The support under the U.K. EPSRC Program Grant UNLOC(EP/J017582/1) is gratefully acknowledged.
REFERENCES
[1] W. Shieh and C. Athaudage, “Coherent optical orthogonal frequency di-vision multiplexing,” Electron. Lett., vol. 42, pp. 587–589, 2006.
[2] F. Buchali, R. Dischler, and X. Liu, “Optical OFDM: A promising high-speed optical transport technology,” Bell Labs Tech. J., vol. 14, pp. 125–146, 2009.
[3] A. J. Lowery, D. Liang, and J. Armstrong, “Orthogonal frequency divisionmultiplexing for adaptive dispersion compensation in long haul WDMsystems,” in Proc. Opt. Fiber Commun. Conf. Nat. Fiber Opt. Eng. Conf.,2006, pp. 1–3.
[4] Z. Benyuan, D. Peckham, Y. Man, T. Taunay, and J. Fini, “Recent progressin transmission fibers for capacity beyond 100-Tbit/s,” in Proc. Opt. FiberCommun. Conf. Expo. Nat. Fiber Opt. Eng. Conf., 2012, pp. 1–3.
[5] J. C. Cartledge, J. D. Downie, J. E. Hurley, Z. Xiaming, and I. Roudas, “Biterror ratio performance of 112 Gb/s PM-QPSK transmission systems,” J.Lightw. Technol., vol. 30, no. 10, pp. 1475–1479, May 15, 2012.
[6] R. Schmogrow, B. Nebendahl, M. Winter, A. Josten, D. Hillerkuss,S. Koenig, J. Meyer, M. Dreschmann, M. Huebner, C. Koos, J. Becker,W. Freude, and J. Leuthold, “Error vector magnitude as a performancemeasure for advanced modulation formats,” IEEE Photon. Technol. Lett.,vol. 24, no. 1, pp. 61–63, Jan. 1, 2012.
[7] R. A. Shafik, S. Rahman, and R. Islam, “On the extended relationshipsamong EVM, BER and SNR as performance metrics,” in Proc. Int. Conf.Elect. Comput. Eng., 2006, pp. 408–411.
[8] H. Bao and W. Shieh, “Transmission simulation of coherent optical OFDMsignals in WDM systems,” Opt. Exp., vol. 15, pp. 4410–4418, Apr. 16,2007.

LE et al.: BIT ERROR RATE ESTIMATION METHODS FOR QPSK CO-OFDM TRANSMISSION 2959
[9] Z. Fan, L. Yazhi, W. Yandan, L. Li, Z. Lixin, C. Zhangyuan, and W. Cheng-bin, “Experimental comparison of different BER estimation methods forcoherent optical QPSK transmission systems,” IEEE Photon. Technol.Lett., vol. 23, no. 18, pp. 1343–1345, Sep. 15, 2011.
[10] G. Goldfarb and G. Li, “BER estimation of QPSK homodyne detectionwith carrier phase estimation using digital signal processing,” Opt. Exp.,vol. 14, pp. 8043–8053, Sep. 4, 2006.
[11] F. Zhang, Y. Gao, Y. Luo, Z. Chen, and A. Xu, “Stochastic BER estima-tion for coherent QPSK transmission systems with digital carrier phaserecovery,” Opt. Exp., vol. 18, pp. 9592–9599, Apr. 26, 2010.
[12] S. T. Le, K. J. Blow, V. K. Menzentsev, and S. K. Turitsyn, “Comparison ofnumerical bit error rate estimation methods in 112Gbs QPSK CO-OFDMtransmission,” in Proc. 39th Eur. Conf. Exhib. Opt. Commun., 2013,pp. 1–3.
[13] A. Carena, G. Bosco, V. Curri, P. Poggiolini, M. T. Taiba, and F. Forghieri,“Statistical characterization of PM-QPSK signals after propagation inuncompensated fiber links,” in Proc. 36th Eur. Conf. Opt. Commun. Exhib.,2010, pp. 1–3.
[14] S. Randel, S. Adhikari, and S. L. Jansen, “Analysis of RF-pilot-basedphase noise compensation for coherent optical OFDM systems,” IEEEPhoton. Technol. Lett., vol. 22, no. 17, pp. 1288–1290, Sep. 1, 2010.
[15] S. L. Jansen, I. Morita, T. C. W. Schenk, and H. Tanaka, “121.9-Gb/sPDM-OFDM transmission with 2-b/s/Hz spectral efficiency over 1000 kmof SSMF,” J. Lightw. Technol., vol. 27, no. 3, pp. 177–188, Feb. 1, 2009.
[16] L. Xiang, S. Chandrasekhar, Z. Benyuan, P. J. Winzer, A. H. Gnauck,and D. W. Peckham, “448-Gb/s reduced-guard-interval CO-OFDM trans-mission over 2000 km of ultra-large-area fiber and five 80-GHz-gridROADMs,” J. Lightw. Technol., vol. 29, no. 4, pp. 483–490, 2011.
[17] R. Kudo, T. Kobayashi, K. Ishihara, Y. Takatori, A. Sano, and Y.Miyamoto, “Coherent optical single carrier transmission using overlapfrequency domain equalization for long-haul optical systems,” J. Lightw.Technol., vol. 27, no. 16, pp. 3721–3728, Aug. 15, 2009.
[18] M. Kuschnerov, F. N. Hauske, K. Piyawanno, B. Spinnler, A. Napoli, andB. Lankl, “Adaptive chromatic dispersion equalization for non-dispersionmanaged coherent systems,” in Proc. Opt. Fiber Commun. - Incudes PostDeadline Papers, Conf., 2009, pp. 1–3.
[19] S. J. Savory, “Digital filters for coherent optical receivers,” Opt. Exp.,vol. 16, pp. 804–817, Jan. 1, 2008.
[20] T. Xu, G. Jacobsen, S. Popov, J. Li, K. Wang, and A. T. Friberg, “Nor-malized LMS digital filter for chromatic dispersion equalization in 112-Gbit/s PDM-QPSK coherent optical transmission system,” Opt. Commun.,vol. 283, pp. 963–967, Mar. 15, 2010.
[21] P. Serena and A. Bononi, “On the accuracy of the Gaussian nonlinearmodel for dispersion-unmanaged coherent links,” in Proc. 39th Eur. Conf.Exhib. Opt. Commun., 2013, pp. 1–3.
[22] Z. Wang, Y. Qiao, Y. Xu, and Y. Ji, “Statistical characterization of thenonlinear noise in 2.8 Tbit/s PDM-16QAM CO-OFDM system,” Opt.Exp., vol. 21, pp. 18034–18042, Jul. 29, 2013.
[23] X. Chen and W. Shieh, “Closed-form expressions for nonlinear transmis-sion performance of densely spaced coherent optical OFDM systems,”Opt. Exp., vol. 18, pp. 19039–19054, Aug. 30, 2010.
[24] G. Gao, X. Chen, and W. Shieh, “Analytical expressions for nonlineartransmission performance of coherent optical OFDM systems with fre-quency guard band,” J. Lightw. Technol., vol. 30, no. 15, pp. 2447–2454,Aug. 1, 2012.
[25] L. Son Thai, T. Kanesan, E. Giacoumidis, N. J. Doran, and A. D. Ellis,“Quasi-pilot aided phase noise estimation for coherent optical OFDMsystems,” IEEE Photon. Technol. Lett., vol. 26, no. 5, pp. 504–507,Mar. 1, 2014.
[26] S. T. Le, T. Kanesan, M. McCarthy, E. Giacoumidis, I. Phillips, M. F.Stephens, M. Tan, N. J. Doran, A. D. Ellis, and S. K. Turitsyn, “Ex-perimental demonstration of data-dependent pilot-aided phase noise esti-mation for CO-OFDM,” presented at the Optical Fiber CommunicationConf., San Francisco, CA, USA, 2014, p. Tu3G.4.
[27] T. M. Schmidl and D. C. Cox, “Robust frequency and timing synchroniza-tion for OFDM,” IEEE Trans. Commun., vol. 45, no. 12, pp. 1613–1621,Dec. 1997.
[28] E. W. Laedke, N. Goder, T. Schaefer, K. H. Spatschek, and S. Turit-syn, “Improvement of optical fibre systems performance by optimisationof receiver filter bandwidth and use of numerical methods to evaluateQ-factor,” Electron. Lett., vol. 35, pp. 2131–2133, 1999.
[29] E. G. Shapiro, M. P. Fedoruk, and S. K. Turitsyn, “Numerical estimateof BER in optical systems with strong patterning effects,” Electron. Lett.,vol. 37, pp. 1179–1181, 2001.
[30] E. G. Shapiro, M. P. Fedoruk, and S. K. Turitsyn, “Direct modeling of errorstatistics at 40 Gbit/s rate in SMF/DCF link with strong bit overlapping,”in Proc. Opt. Fiber Commun. Conf., Tech. Dig., 2005, vol. 1, p. 3.
[31] B. Slater, S. Boscolo, T. Broderick, S. K. Turitsyn, R. Freund, L. Molle,et al., “Performance analysis of 20Gb/s RZ-DPSK non-slope matchedtransoceanic submarine links,” Opt. Exp., vol. 15, pp. 10999–11007,Aug. 20, 2007.
[32] B. Slater, S. Boscolo, V. K. Mezentsev, and S. K. Turitsyn, “Comparativeanalysis of BER estimation methods in numerical simulation of 40-Gb/sRZ-DPSK transmission with in-line SOAs,” IEEE Photon. Technol. Lett.,vol. 19, no. 8, pp. 607–609, Apr. 15, 2007.
Son Thai Le received the Master of Engineering degree with highest distinctionfrom Southern Federal University, Rostov-on-Don, Russia in 2012. He joinedAston Institute of Photonic Technologies, Birmingham, U.K., as a Ph.D. studentin January 2013. His research mainly focuses on coherent optical orthogonalfrequency-division multiplexing, fiber nonlinearity mitigation techniques, andvisible light communication.
Keith J. Blow received the B.A. degree in physics and theoretical physics in1978 from Cambridge University, Cambridge, U.K. He then joined the Theoryof Condensed Matter Group of the Cavendish Laboratory and received thePh.D. degree for studies on deep impurities in semiconductors in 1981. Hejoined the optics division of BT Labs in 1981 and worked on the theory ofnonlinear optical propagation effects in fibres, principally solitons. This workdeveloped into optical switching and the first demonstration of soliton switchingin nonlinear optical loop mirrors. In 1990, he set up a group working on quantumoptical properties and nonlinear spatial optics as well as continuing work onall-optical processing, which is currently concerned with ways of using andmanipulating the information that can be sent over the enormous bandwidth ofoptical fibres. In 1999, he moved to the Photonics Research Group at Astonto continue working on optical networks and optical computation. In 2003, heformed the Adaptive Networks Communications Research Group to study adhoc sensor networks, applications of dynamic hardware and mobile systems.
Vladimir Mezentsev received the Ph.D. degree in 1991 from Institute of Au-tomation, Russian Academy of Science, Novosibirsk Russia. His research in-terests include nonlinear waves, solitons and collapses, numerical modelling ofnonlinear phenomena. He is currently a Senior Lecturer at Aston University,Birmingham, U.K., where he joined in 1999. His recent research is focusedprimarily on femtosecond micro fabrication in photonics and also on high per-formance numerical modeling of fiber communication systems and ultrashortlaser pulse propagation.
Sergei Turitsyn graduated from the Department of Physics of the NovosibirskState University, Novosibirsk, Russia, in 1982 and received the Ph.D. degreein theoretical and mathematical physics from the Institute of Nuclear Physics,Novosibirsk, in 1986. From 1992 to 1998, he was with the Institute for The-oretical Physics I, Heinrich-Heine University Dusseldorf, Germany; first asa Humboldt Fellow and then within the collaborative projects with DeutscheTelekom. He is the Director at the Aston Institute of Photonic Technologies,Aston University, Birmingham, U.K. He has made contributions to nonlinearscience, including soliton theory, self-focusing of light beams, discrete nonlinearsystems, and nonlinear fibre optics. His recent research has been shifted towardthe high-speed optical communications, nonlinear photonic devices, Raman-based technologies, ultralong fibre lasers, and random fibre lasers. Dr. Turitsynreceived the Royal Society Wolfson Research Merit Award in 2005, and waselected to OSA Fellow and AIP Fellow in 2011.