bilateral measurement of pelvic floor muscle dysfunction in
197
BILATERAL MEASUREMENT OF PELVIC FLOOR MUSCLE DYSFUNCTION IN FEMALES WITH LOWER URINARY TRACT SYMPTOMS USING NEAR INFRARED SPECTROSCOPY by Emily Grace Deegan B.A., The University of Western Ontario, 2009 B.Sc.N., The University of Toronto, 2011 A THESIS SUBMITTED IN PARTIAL FULFILLMENT OF THE REQUIREMENTS FOR THE DEGREE OF MASTER OF SCIENCE in THE FACULTY OF GRADUATE AND POSTDOCTORAL STUDIES (Experimental Medicine) THE UNIVERSITY OF BRITISH COLUMBIA (Vancouver) March 2019 © Emily Grace Deegan, 2019
-
Upload
khangminh22 -
Category
Documents
-
view
0 -
download
0
Transcript of bilateral measurement of pelvic floor muscle dysfunction in

BILATERAL MEASUREMENT OF PELVIC FLOOR MUSCLE DYSFUNCTION IN
FEMALES WITH LOWER URINARY TRACT SYMPTOMS USING NEAR INFRARED
SPECTROSCOPY
by
Emily Grace Deegan
B.A., The University of Western Ontario, 2009
B.Sc.N., The University of Toronto, 2011
A THESIS SUBMITTED IN PARTIAL FULFILLMENT OF
THE REQUIREMENTS FOR THE DEGREE OF
MASTER OF SCIENCE
in
THE FACULTY OF GRADUATE AND POSTDOCTORAL STUDIES
(Experimental Medicine)
THE UNIVERSITY OF BRITISH COLUMBIA
(Vancouver)
March 2019
© Emily Grace Deegan, 2019

ii
The following individuals certify that they have read, and recommend to the Faculty of Graduate
and Postdoctoral Studies for acceptance, a thesis/dissertation entitled:
Bilateral measurement of pelvic floor muscle dysfunction in females with lower urinary tract
symptoms using near infrared spectroscopy
submitted by Emily Deegan in partial fulfilment of the requirements for
the degree Master of Science
in Experimental Medicine
Examining Committee:
Lynn Stothers, Urological Sciences Supervisor
Andrew Macnab, Urological Sciences Supervisory Committee Member
Supervisory Committee Member
Gary Gray, Division of Urology Additional Examiner
Additional Supervisory Committee Members:
Tania Lam, School of Kinesiology Supervisory Committee Member

iii
Abstract
Introduction and Objective: Near infrared spectroscopy (NIRS) is a noninvasive method of
measuring oxygen recovery kinetics in skeletal muscle. NIRS detects changes in oxygenated
(O2Hb) and deoxygenated (HHb) hemoglobin in response to exercise, to provide interpretation of
muscular capacity to restore incurred oxygen debt. Assessment of pelvic floor muscle (PFM)
function is central to managing urinary incontinence (UI) and lower urinary tract symptoms
(LUTS) but currently lacks oxygen kinetic parameters. This project aims to develop a NIRS
probe that measures oxygen kinetics of bilateral PFM in females with UI/LUTS (cases) related to
altered pelvic innervation compared to continent controls.
Methods: A transvaginal NIRS prototype to detect bilateral PFM was developed. The vaginal
NIRS probe monitored female volunteers during sustained PFM contraction (SMVC). O2Hb,
HHb and HbDiff (O2Hb-HHb) allowed measurement of oxygen kinetics unique to bilateral PFM.
Oxygen recovery kinetics determined by HbDiff half recovery time (½RT). PFM manometry
assessed SMVC peak and average cmH2O. Home-based 8-week PFM therapy (PFMT)
intervention was performed by both participant groups and an exercise diary measured
adherence, determined as total percentage of volume and frequency.
Results: Observational NIRS findings demonstrated typical hemodynamic and ½RT responses
in controls. Case group demonstrated atypical findings consistent with impaired muscle function.
NIRS found quicker ½RT for controls (7.87 vs 38.03 seconds, p 0.01). Manometer detected
greater PFM strength and endurance in controls (SMVC peak 35 vs 13 cmH2O, p <0.01, SMVC

iv
average 23 vs 10 cmH2O, p 0.02). Intra-group improvements of PFM NIRS and manometer
variables after PFMT were not determined. Post-PFMT ½RT in cases was highly correlated to
SMVC peak and average cmH2O (r -0.83 and r -0.82, respectively). High adherence of PFMT
frequency demonstrated in cases, 78%, which correlated to SMVC peak and average cmH2O (rs
0.78 and rs 0.88, respectively), ½RT (rs -0.85) and reduced urgency (rs -0.85).
Conclusions: This study shows the feasibility of NIRS to provide novel physiologic data
regarding PFM function. PFM oxygen kinetics could provide more insight into PFM pathology
and PFMT rehabilitation. Further refinement of the NIRS probe is required for use in larger
studies with PFMT interventions incorporating adjunctive therapies.

v
Lay Summary
Many women experience involuntary urinary leakage related to pelvic floor nerve injury.
Assessment of pelvic floor muscle is important aspect for managing this issue. This study
developed a new method of assessment using near infrared light to measure pelvic floor muscle
oxygen levels. The oxygen levels determine how well pelvic floor muscles perform during
exercise. Two participant groups were in this study, females with urinary leakage related to nerve
injury and females without urinary leakage or nerve injury. Participants had their pelvic floor
muscles measured before and after 8-weeks of therapeutic exercise. This study found a
difference in pelvic floor muscle function between the two groups and that urinary leakage
symptoms were reduced after 8-weeks of therapeutic exercise. Further development of the near
infrared light method to assess pelvic floor muscle oxygenation is needed to help manage urinary
leakage.

vi
Preface
This is an original thesis of independent efforts by the author, E.G. Deegan. All work was
completed at the International Collaboration on Repair Discoveries (ICORD) located in the
Blusson Spinal Cord Centre, affiliated with the University of British Columbia, Vancouver
campus. E.G. Deegan was responsible for project coordination, participant recruitment, data
collection procedures, statistical analysis and written thesis.
Dr. Lynn Stothers, as acting supervisor, oversaw the grant proposal, study design, ethics
proposal, participant recruitment and screening. Dr. Stothers provided her clinical and academic
expertise and guidance through the span of this study, as well as assistance editing this thesis. Dr.
Andrew Macnab and Dr. Tania Lam, as supervisory committee members helped to develop this
project, contributed to the methods and provided feedback and edits for this thesis.
Components from Chapter 1 section 1.1.3 Evaluation of PFM function, describing current
methodologies of PFM assessment is part of a manuscript titled: “Quantification of pelvic floor
muscle strength in female urinary incontinence: A systematic review and comparison of
contemporary methodologies.” that has been published the in the journal, Neurology and
Urodynamics. E.G. Deegan was responsible for the literature review, and primary manuscript
composition. Dr. Alex Kavanagh and Dr. Andrew Macnab provided editorial assistance. Dr.
Stothers oversaw the complete proceedings, provided guidance of literature selection and
analysis, and edited the manuscript.
All data obtained from this research project was approved by the UBC Clinical Research
Ethics Board and Vancouver Coastal Health Research Institute under the respective Certificate
numbers, H15-02040 and V15-02040.

vii
Table of Contents
Abstract .................................................................................................................................... iii
Lay Summary ........................................................................................................................... v
Preface ...................................................................................................................................... vi
Table of Contents .................................................................................................................... vii
List of Tables.......................................................................................................................... xiv
List of Figures ........................................................................................................................ xvi
Abbreviations ....................................................................................................................... xviii
Acknowledgements ................................................................................................................. xx
Dedication .............................................................................................................................. xxi
Chapter 1: Introduction ........................................................................................................... 1
1.1 Background and rationale ............................................................................................ 1
1.1.1 Urinary incontinence and pelvic floor muscle dysfunction ................................... 1
1.1.2 Pelvic floor muscle therapy.................................................................................. 3
1.1.3 Evaluation of PFM function ................................................................................. 5
1.1.4 Measurement of skeletal muscle oxygen kinetics ................................................. 7
1.2 Principles of Near Infrared Spectroscopy ..................................................................... 8
1.2.1 Development ....................................................................................................... 8
1.2.2 NIRS instrumentation .......................................................................................... 9
1.2.3 Principles of NIRS ............................................................................................. 10
1.2.3.1 Scatter ........................................................................................................... 11
1.2.3.2 Absorption ..................................................................................................... 11

viii
1.2.3.3 Pathlength ...................................................................................................... 12
1.2.4 Contribution of myoglobin and cytochrome-c-oxidase to light absorption .......... 13
1.2.5 Optical Density defined by the Beer Lambert Law ............................................. 14
1.2.6 NIRS adaptation to PFM.................................................................................... 15
1.3 Objectives and Hypotheses ........................................................................................ 17
1.3.1 Primary Aim ...................................................................................................... 17
1.3.2 Objectives ......................................................................................................... 17
1.3.3 Hypotheses ........................................................................................................ 18
Chapter 2: Methods ................................................................................................................ 19
2.1 Participants ............................................................................................................... 19
2.2 Protocol ..................................................................................................................... 20
2.3 Objective measures ................................................................................................... 23
2.3.1 Urinalysis and post void residual volume ........................................................... 23
2.3.2 Standing force plate ........................................................................................... 24
2.3.3 PFM manometry ................................................................................................ 25
2.3.4 NIRS ................................................................................................................. 27
2.4 Subjective measures .................................................................................................. 30
2.4.1 Bladder symptom questionnaires ....................................................................... 30
2.4.2 Waterloo footedness questionnaire..................................................................... 31
2.4.3 Bladder diaries................................................................................................... 31
2.5 Data analysis ............................................................................................................. 32
2.5.1 Standing force plate and WFQ ........................................................................... 32
2.5.2 SMVC focused analysis ..................................................................................... 32

ix
2.5.3 PFM manometry ................................................................................................ 33
2.5.4 NIRS ................................................................................................................. 35
2.5.4.1 Oxygen saturation patterns in response to exercise ......................................... 36
2.5.4.2 Unilateral PFM dominance based on contraction magnitude change .............. 38
2.5.4.3 Oxygen recovery kinetics in response to exercise (Half Recovery Time)........ 39
2.5.4.4 Original adaption of ½RT calculation analysis ............................................... 41
2.5.4.5 Unilateral PFM dominance based on ½RT ..................................................... 42
2.5.5 Bladder symptom questionnaires, bladder diaries and post void residual ............ 43
2.6 Statistical analysis ..................................................................................................... 44
Chapter 3: Results .................................................................................................................. 45
3.1 Participant demographics .......................................................................................... 45
3.2 Questionnaires, post void residual and bladder diary outcome measures .................... 47
3.2.1 Intra-group comparison...................................................................................... 47
3.2.2 Inter-group comparison of questionnaires and post void residual ....................... 49
3.3 Force plate, WFQ and NIRS dominance outcome measures ...................................... 50
3.3.1 Intra-group comparison...................................................................................... 50
3.3.2 Inter-group comparison...................................................................................... 52
3.4 NIRS observational outcome findings ....................................................................... 54
3.4.1 Observational NIRS findings ............................................................................. 54
3.4.1.1 Control group trends ...................................................................................... 54
3.4.1.2 Case group trends .......................................................................................... 58
3.4.1.2.1 High mobility clinical sub-group .............................................................. 59
3.4.1.2.2 Multiple Sclerosis clinical sub-group ....................................................... 63

x
3.4.1.2.3 SCI Clinical Sub-group ............................................................................ 67
3.5 NIRS objective outcome measures ............................................................................ 70
3.5.1 ½RT NIRS measurements ................................................................................. 70
3.5.1.1 Intra-group ½RT comparison ......................................................................... 70
3.5.1.2 Inter-group ½RT comparison ......................................................................... 70
3.5.2 DMag NIRS measurements ................................................................................ 74
3.5.2.1 Intra-group DMag comparison ....................................................................... 74
3.5.2.2 Inter-group DMag comparison ....................................................................... 75
3.5.3 Unilateral PFM ½RT and DMag NIRS Correlation ............................................ 79
3.5.3.1 Intra-group comparison .................................................................................. 79
3.6 Manometer objective outcome measures ................................................................... 81
3.6.1 Within assessment measurements ...................................................................... 81
3.6.1.1 Intra-group manometer comparison ............................................................... 81
3.6.2 Across assessment manometer measurements .................................................... 85
3.6.2.1 Intra-group manometer comparison ............................................................... 85
3.6.2.2 Inter-group PFM manometer comparison ....................................................... 87
3.6.3 Post-PFMT PFM manometer and NIRS dominance measures ............................ 90
3.6.4 Baseline unilateral PFM ½RT and PFM manometer measures ........................... 91
3.6.5 Post-PFMT ½RT and PFM manometer measures............................................... 92
3.7 Exercise adherence outcome measures ...................................................................... 94
3.7.1 Exercise adherence and post-PFMT PFM manometer measures ......................... 96
3.7.2 Exercise adherence correlation to questionnaire and PVR measures ................... 97
3.7.3 Exercise adherence and post-PFMT ½RT measures ........................................... 98

xi
3.7.4 Exercise adherence and post-PFMT DMag measures ....................................... 100
Chapter 4: Discussion ........................................................................................................... 102
4.1 Successful development of NIRS probe ................................................................... 102
4.2 Participant demographics ........................................................................................ 103
4.3 Observational NIRS findings ................................................................................... 105
4.3.1 Hemodynamic and oxygen kinetic response observed in heathy PFM .............. 105
4.3.2 Hemodynamic and oxygen kinetic response observed in PFM dysfunction ...... 109
4.3.2.1 High mobility clinical sub-group.................................................................. 109
4.3.2.2 MS and SCI clinical sub-groups ................................................................... 111
4.3.3 Explanations for atypical hemodynamic and oxygen kinetic response .............. 111
4.3.3.1 Innervation .................................................................................................. 111
4.3.3.1.1 Pudendal nerve innervation .................................................................... 111
4.3.3.1.2 Denervation related to pregnancy and labour .......................................... 112
4.3.3.1.3 Recruitment ........................................................................................... 112
4.3.3.1.4 Activation .............................................................................................. 113
4.3.3.2 Microvasculature ......................................................................................... 114
4.3.3.3 Contractile Intensity..................................................................................... 114
4.3.3.4 Cross Contamination ................................................................................... 115
4.3.3.5 Applicability of theoretical considerations to an individual case ................... 116
4.3.4 Objective outcome measures............................................................................ 118
4.3.4.1 Inter-group objective PFM function outcomes ............................................. 118
4.3.4.1.1 Half Recovery Time (½RT) outcomes .................................................... 119
4.3.4.1.2 Delta magnitude change (DMag) outcomes ............................................ 120

xii
4.3.4.1.3 PFM manometry outcomes .................................................................... 121
4.3.4.2 Intra-group objective PFM function outcomes ............................................. 121
4.3.4.2.1 ½RT outcomes ....................................................................................... 122
4.3.4.2.2 DMag outcomes ..................................................................................... 124
4.3.4.2.3 ½RT and DMag associated outcomes ..................................................... 125
4.3.4.2.4 PFM manometer outcomes ..................................................................... 125
4.3.4.2.5 ½RT and PFM manometer associated outcomes ..................................... 126
4.3.4.3 Lower limb and PFM dominance outcomes ................................................. 127
4.3.4.3.1 Fz and WFQ dominance outcomes ......................................................... 127
4.3.4.3.2 NIRS dominance outcomes .................................................................... 129
4.3.4.3.3 Degree of NIRS dominance and PFM manometer outcomes .................. 131
4.3.4.3.4 Degree of NIRS dominance and PFMT adherence outcomes .................. 131
4.3.4.4 QOL and clinical symptom outcomes .......................................................... 132
4.3.4.4.1 Inter-group QOL and clinical symptom outcomes .................................. 132
4.3.4.4.2 Intra-group QOL and clinical symptom outcomes .................................. 132
4.3.4.5 PFMT Adherence outcomes ......................................................................... 133
4.3.4.5.1 Adherence and reduced urgency symptoms ............................................ 135
4.3.4.5.2 Adherence and PFM function outcomes ................................................. 135
Chapter 5: Conclusion .......................................................................................................... 136
5.1 Main Findings ......................................................................................................... 136
5.2 Limitations .............................................................................................................. 138
5.3 Strengths and Future Directions ............................................................................... 142
5.4 Conclusion .............................................................................................................. 145

xiii
Bibliography ......................................................................................................................... 147
Appendix A ........................................................................................................................... 169
Appendix A Methods .......................................................................................................... 169
A.1 PFMT Instruction Sheet ....................................................................................... 169
A.2 PFMT Recording Sheet ....................................................................................... 170
A.3 Bladder Diary ...................................................................................................... 171
A.4 Questionnaire for Urinary Incontinence Diagnosis (QUID).................................. 172
A.5 Urogenital Distress Inventory Short Form (UDI-6) .............................................. 173
A.6 Incontinence Impact Questionnaire Short Form (IIQ-7) ....................................... 174
A.7 Subjective Assessment of Improvement............................................................... 175
A.8 Waterloo Footedness Questionnaire-Revised ....................................................... 176

xiv
List of Tables
Table 2.1 SPAM stratification of oxygen patterns. .................................................................... 37
Table 3.1 Demographics of study sample by participant group. ................................................. 46
Table 3.2 Demographic details of case participants listed by participant ID. ............................. 46
Table 3.3 Demographic details of control participants listed by participant ID. ......................... 47
Table 3.4 Intra-group comparison of questionnaires and PVR. .................................................. 48
Table 3.5 Case group 3-day bladder diary variables. ................................................................. 49
Table 3.6 Inter-group SSI comparison. ...................................................................................... 50
Table 3.7 Intra-group Fz lower limb dominance comparison. .................................................... 51
Table 3.8 Intra-group Fz and WFQ lower limb dominance correlation. ..................................... 51
Table 3.9 Intra-group Fz, WFQ and NIRS dominance correlations. ........................................... 52
Table 3.10 Inter-group Fz, WFQ and NIRS dominance comparison. ......................................... 53
Table 3.11 Intra-group 1/2RT variables at baseline and post-PFMT. ......................................... 72
Table 3.12 Inter-group 1/2RT variables at baseline and post-PFMT. ......................................... 73
Table 3.13 Intra-group DMag variables at baseline and post-PFMT. ......................................... 76
Table 3.14 Inter-group DMag variables at baseline and post-PFMT. ......................................... 77
Table 3.15 Intra-group 1/2RT and DMag correlations at baseline and post-PFMT. .................... 80
Table 3.16 Within assessment control group PFM manometer variables. .................................. 83
Table 3.17 Within assessment case group PFM manometer variables. ....................................... 84
Table 3.18 Across assessment intra-group PFM manometer variables. ...................................... 86
Table 3.19 Inter-group PFM manometer variables at baseline and post-PFMT. ......................... 88

xv
Table 3.20 Intra-group correlation of post-PFMT PFM manometer and NIRS dominance
variables. .................................................................................................................................. 90
Table 3.21 Intra-group correlation of unilateral PFM 1/2RT and PFM manometer variables at
baseline. ................................................................................................................................... 91
Table 3.22 Correlation of unilateral 1/2RT and PFM manometer variables at post-PFMT. ........ 93
Table 3.23 Inter-group exercise adherence. ............................................................................... 95
Table 3.24 Intra-group correlation of PFM manometer and exercise adherence variables. ......... 96
Table 3.25 Intra-group correlation of 1/2RT and exercise adherence variables. ......................... 99
Table 3.26 Intra-group correlation of DMag and exercise adherence variables......................... 101

xvi
List of Figures
Figure 2.1 Flow diagram for study procedures from baseline to post-PFMT assessment............ 22
Figure 2.2 Force plate configuration for lower limb dominance measures. ................................ 25
Figure 2.3 PFM manometer. .................................................................................................... 26
Figure 2.4 NIRS probe prototype design. ................................................................................. 28
Figure 2.5 NIRS probe prototype design details and equipment configuration. ......................... 30
Figure 2.6 SPAMD algorithm. .................................................................................................. 38
Figure 2.7 Example of 1/2RT calculation in control participant. ................................................ 41
Figure 2.8 Example of inverse 1/2RT calculation in a case participant. ..................................... 42
Figure 3.1 Case group QUID-UUI score reduction. ................................................................... 48
Figure 3.2 Intra-group DisFz and QFz association. ................................................................... 51
Figure 3.3 Inter-group DisFz and QFz comparison. ................................................................... 53
Figure 3.4 Control participant CS1 performing MVCs, SMVC and REP. .................................. 55
Figure 3.5 Control participant CS1 performing SMVC at baseline and post-PFMT. .................. 56
Figure 3.6 Control participant CS1 SMVC oxygenation patterns at baseline and post-PFMT. ... 56
Figure 3.7 Control participant CS7 performing SMVC at baseline and post-PFMT. .................. 57
Figure 3.8 Control participant CS7 SMVC oxygenation patterns at baseline and post-PFMT. ... 57
Figure 3.9 Case participant SS11 performing MVCs, SMVC and REP. .................................... 61
Figure 3.10 Case participant SS11 SMVC oxygenation patterns at baseline. ............................. 62
Figure 3.11 Case participant SS14 performing SMVC at baseline and post-PFMT. ................... 62
Figure 3.12 Case participant SS14 SMVC oxygenation patterns at baseline and post-PFMT. .... 63
Figure 3.13 Case participant SS12 performing MVCs, SMVC and REP.................................... 65

xvii
Figure 3.14 Case participant SS12 performing SMVC at baseline and post-PFMT. ................... 66
Figure 3.15 Case participant SS12 SMVC oxygenation patterns at baseline and post-PFMT. .... 66
Figure 3.16 Case participant SS3 performing SMVC at baseline including full recovery time
interval. .................................................................................................................................... 68
Figure 3.17 Case participant SS3 performing SMVC at baseline and post-PFMT. ..................... 68
Figure 3.18 Case participant SS3 SMVC oxygenation patterns at baseline and post-PFMT. ...... 69
Figure 3.19 Case participant SS4 SMVC at baseline. ................................................................ 69
Figure 3.20 Inter-group 1/2RT variables at baseline and post-PFMT. ........................................ 74
Figure 3.21 Inter-group DMag at baseline and post-PFMT. ....................................................... 78
Figure 3.22 Inter-group 1/2RT and DMag dominance at baseline and post-PFMT. .................... 79
Figure 3.23 Intra-group correlations for 1/2RT and DMag. ........................................................ 81
Figure 3.24 Across assessment correlation of PFM manometer measures. ................................. 87
Figure 3.25 Inter-group PFM manometer variables at baseline and post-PFMT......................... 89
Figure 3.26 Correlation of Right PFM 1/2RT and PFM manometer variables. .......................... 93
Figure 3.27 Correlation of Left PFM 1/2RT and PFM manometer variables. ............................. 94
Figure 3.28 Inter-group PFMT adherence mean values for Exercise Volume and Frequency..... 95
Figure 3.29 Intra-group exercise adherence percentage. ............................................................ 95
Figure 3.30 Case group correlation of PFM manometer and exercise adherence variables. ........ 97
Figure 3.31 Case group correlation of QUID-UUI score and exercise adherence. ...................... 98
Figure 3.32 Control group correlation of 1/2RT and exercise adherence. .................................. 99
Figure 3.33 Case group correlation of 1/2RT and exercise adherence. ..................................... 100
Figure 3.34 Case group correlation of DMag and exercise adherence. ..................................... 101

xviii
Abbreviations
Abbreviated terms are in keeping with the International Urogynecological Association and the
International Continence Society recommended terminology and definitions.1
DMag Magnitude change of hemoglobin concentration
½RT Half-Recovery Time
31P-MRS Phosphorus magnetic resonance spectroscopy
CWS Continuous wave spectroscopy
DisFz Distracted stance dominance measured by percentage difference of ground reaction force of bilateral lower limbs
HbDiff Difference between oxygenated and deoxygenated hemoglobin
HHb Deoxygenated hemoglobin
IAP intra-abdominal pressure
IIQ-7 Incontinence impact questionnaire short form, see Appendix A.6
LUTS Lower urinary tract symptoms
MS Multiple sclerosis
MUI Mixed urinary incontinence
MVC maximal voluntary contraction
NIRS Near infrared spectroscopy
O2Hb Oxygenated hemoglobin
PFM pelvic floor muscle
PFMT pelvic floor muscle therapy
PVR Post void residual

xix
QFz Quiet stance dominance measured by percentage difference of ground reaction force of bilateral lower limbs
QUID-SUI Questionnaire for urinary incontinence diagnosis – stress urinary incontinence score, see Appendix A.4
QUID-UUI Questionnaire for urinary incontinence diagnosis – urgency urinary incontinence score, see Appendix A.4
REP Fast repeated contractions
SB Spina bifida
SCI Spinal cord injury
SMVC Sustained maximal voluntary contraction
SSI Subjective survey of improvement, see Appendix A.7
SUI Stress urinary incontinence
tHb Total sum of oxygenated and deoxygenated hemoglobin
UDI-6 Urogenital distress inventory short form, see Appendix A.5
UI urinary incontinence
UUI Urgency urinary incontinence
WFQ Waterloo footedness questionnaire, see Appendix A.8

xx
Acknowledgements
Foremost I would like to acknowledge my supervisory committee. I would like to thank Dr.
Lynn Stothers, for believing in my capability, for encouraging my academic pursuit and for
providing me with the support needed to complete this project. I would like to thank Dr. Andrew
Macnab, for sharing his NIRS expertise, keen advise and patience. I would like to thank Dr.
Tania Lam whose assistance on methodological components and support with statistical analysis
is greatly appreciated. Also, a special thanks to the Lam Lab who graciously shared equipment
and patiently guided me through Matlab.
I would like to acknowledge the Rick Hansen Foundation and the Blusson Integrated Cures
Partnership, whom without their appreciation for continued research and financial support this
project would not have been made possible.
I would also like to acknowledge the entire community at ICORD who not only facilitated the
day to day activities of this project but also connected me to the SCI community at large.
Special thanks are owed to the nurses and administrative staff of the Urology Clinic at the
Brenda and David Mclean Integrated Spine Center, whose assistance, cooperation and patience
made the data collection possible.
A very sincere thanks is owed to the volunteers who participated in this study. Their gracious
commitment is deeply appreciated and their contributions to this research is extremely valued.

xxi
Dedication
I dedicate the completion of this thesis my supportive husband and parents.

1
Chapter 1: Introduction
This chapter will introduce the research topic, providing background literature on urinary
incontinence, pelvic floor muscle (PFM) dysfunction and lower urinary tract symptoms
experienced in females. Specific attention will be given to how neurologic conditions and
injuries contribute to these issues. To better appreciate the physiologic consequences of
neurologic conditions and injuries on continence and PFM function, near infrared spectroscopy
is introduced as a technology to address gaps in the current PFM literature surrounding oxygen
kinetics and hemodynamics within the PFM, thus providing the rationale for this project.
Subsequently objectives and hypotheses that guided the research are stated.
1.1 Background and rationale
1.1.1 Urinary incontinence and pelvic floor muscle dysfunction
Urinary incontinence (UI) is a detrimental health condition that negatively impacts
quality of life and generates a huge economic burden, totaling $2.3 billion in Canada alone.2-7 As
many as 36.5 % of adult Canadian women are living with UI and this number increases to 55%
among women older than 65 years of age.2 As determined by the International Urogynecological
Association/International Continence Society (IUGA/ICS), there are three different types of
urinary incontinence: stress incontinence, urgency incontinence and mixed incontinence.8 Stress
incontinence is defined as involuntary urinary leakage due to physical exertion and urgency
incontinence is defined involuntary urinary leakage due to strong urge to void that cannot be
suppressed.8 Mixed urinary incontinence is defined as stress and urgency incontinence
presenting in conjunction.8 UI, particularly urge incontinence, is even more pervasive among

2
individuals living with neurological conditions that cause interruption of innervation to the pelvic
viscera, resulting in neurogenic bladder.9 Research from the U.S. reports frequency of
neurogenic bladder to be 40-90% in those with multiple sclerosis (MS), 40-61% in those with
spina bifida and 70-84% in those living with spinal cord injury (SCI).10 Neurogenic bladder
leads to urinary incontinence due to overactivity or underactivity of the detrusor (contractile
muscle of the bladder). Spinal injuries above the vertebral level of T12 results in overactive
detrusor, resulting in urgency symptoms and incontinence and impaired bladder emptying as the
external urethral sphincter muscles in the pelvic floor become uncoordinated with the detrusor
contraction, resulting in detrusor sphincter dyssynergia which impedes urine flow when the
bladder is attempting to empty.9,11 Underactive bladder, or loss of detrusor contractility, occurs
in spinal injuries below the vertebral level of T12, resulting in over filling of the bladder, causing
incontinence as the bladder volume exceeds the bladder’s capacity to retain increasing amounts
of urine.10,11 On top of impaired detrusor activity, innervation to the pelvic floor muscle (PFM)
is also interrupted. This further exacerbates the incontinence experienced in spinal cord injury as
the somatic control of these skeletal muscles is inhibited. As the PFM is the only skeletal muscle
in the lower urinary tract, it is the only mechanism that can be voluntarily controlled for
maintaining continence. Not only is the motor control of the PFM inhibited in spinal cord injury
but another detriment is the resulting consequence of PFM atrophy. This means that even in
incomplete injuries with pudendal motor neuron sparing, the PFM will have weakened muscle
function limiting the ability to produce contractions meaningful for maintaining continence. A
wide variety of pathologies can result in disruption of innervation to the PFM, including: SCI,
MS, spina bifida, Parkinson’s disease and even trauma induced by vaginal delivery.9,12,13

3
1.1.2 Pelvic floor muscle therapy
Pelvic floor muscle therapy (PFMT) is defined by Bø et al. 2016 in the IUGA/ICS joint
report as “exercise to improve PFM strength, endurance, power, relaxation or a combination of
these parameters.”1 Prominent urological associations recommend PFMT as the first line
therapy for management of UI.14-17 PFMT has been demonstrated to improve PFM function and
strength by means of neuromuscular adaptations and muscle hypertrophy. 18,19 These beneficial
responses to PFMT have been shown to improve or cure both stress and urge incontinence.20,21
Stress incontinence is improved by means of the strengthened PFMs increased capability
to generate more force and at greater velocity.22,23 Such increased capability allows the external
urethra to remain closed, by nature of compression exerted from PFM contraction, during
situations of high intra-abdominal pressure (such as physical exertion, coughing or sneezing).
During situations of high intra-abdominal pressure force is exerted on to the bladder, and when
storage mechanisms are not competent, involuntary leakage of urine occurs. Thus, a strengthened
PFM can maintain closure of the external urethral sphincter and prevent stress incontinence.
Furthermore, strengthening the PFM also improves the structural integrity of the pelvic organs,
including the urethra, bladder and uterus.19,22 The PFM supports optimal anatomical positioning
of these pelvic organs, and improving PFM strength to maintain structural support prevents stress
incontinence that can occur from pelvic organ prolapse.
PFMT helps to improve urge incontinence by means of activating the “guarding reflex”.
Contraction of the PFM, causes compression and contraction of the external urethral sphincter,
this stimulates afferent nerves in the autonomic pathway of the sphincter to reduce
parasympathetic excitation promoting detrusor contractions which generate urgency.19,24 PFM

4
contractions stimulate the afferent nerves in the somatic pathway of the lumbosacral spinal cord
which also prevents activation of detrusor contractions.24
Most of the existing literature supports PFMT as a beneficial rehabilitation for females
with stress incontinence. More recent literature supports the beneficial effects in females with
urge and mixed incontinence. A current systematic review by Dumoulin et al. 2018, reports
PFMT is beneficial for management of all UI.20 However, only limited investigations have
examined the benefits of PFMT in females with UI and neurologic conditions. Investigations
have demonstrated that PFMT with and without adjunctive EMG biofeedback and electrical
stimulation was effective in reducing lower urinary tract symptoms (LUTS) in females with
MS.25-27 Voorham et al. 2017 and Fitz et al. 2017, both examined the effectiveness of PFMT
(which included biofeedback or supervised PFMT sessions) on a female population with
overactive bladder symptoms and demonstrated improvements in PFM function with EMG,
reduced symptoms and improved quality of life (QOL).28,29 Described by IUGA/ICS, common
overactive bladder symptoms include urgency, frequency and nocturia with or without urgency
continence,8 which makes this study relevant to a neurologic population, as these are also
common symptoms experienced by individuals with neuronal impairments in the PFM.9
Vasquez et al. 2015, examined the effectiveness of home-based PFMT in a case-based study of 2
males with incomplete SCI and found improvements in voluntary PFM control which helped to
reduce detrusor overactivity and incontinence.30 Based on this literature it seems reasonable to
evaluate PFM function in individuals with neurological impairment to the PFM and to further
assess the physiologic parameters contributing to the effectiveness of PFMT in this population.

5
1.1.3 Evaluation of PFM function
The positive therapeutic effects of PFMT for UI were first discovered by Dr. Arnold
Kegel in 1948, at this time he developed the first vaginal manometer to measure PFM strength
and evaluate outcomes of PFMT.31,32 Although research has progressed the understanding of the
PFM and furthered development of evaluative instruments, there still remains no current gold
standard methodology for quantifying PFM function.33-38 Evaluation of skeletal muscle function
and strength involves consideration of both slow and fast twitch muscle fibers (type I and type
IIA, IIX). Slow type I fibers are dependent upon oxygen and reflect the aerobic capacity of
muscles. This fiber type is of particular importance when evaluating PFM as this muscle group is
comprised of approximately 70% slow twitch fibers.39 Fast type IIA and type IIX fibers are
recruited under high muscle force demands, metabolize anaerobically and reach peak tension two
times faster than type I fiber.40 Although type II fibers are responsible for producing quick and
forceful muscular contractions, slow twitch fibers are important for muscular endurance, as they
help sustain repeated muscular contractions at certain intensity levels over time. Active
engagement from both fiber types in the PFM are integral for maintaining continence. The
fatigue resistance of type I is crucial for supporting continued demands placed on the PFM as it
contributes to pelvic stability during everyday physical activities, such as walking, and
counteracting intra-abdominal pressure (IAP) occurring with postural changes that exert
downward on the pelvic floor, to prevent stress incontinence.22,41-43 The type II fibers are
necessary for providing quick, strong contractions and are responsible for facilitating urethral
closure during intensive brief changes in IAP, like coughing or sneezing, and to suppress
urgency until voluntary micturition.22,44 As such, both fiber types of the PFM are assessed by

6
measuring strength and endurance, and these are important outcome measures when evaluating
PFM function after PFMT interventions.
When assessing PFM strength in females, a maximal voluntary contraction (MVC) is
performed, produced by voluntarily squeezing the pelvic floor while pulling upward and inward
to generate as much force as possible. The measurement of strength can be determined by digital
palpation, manometry or dynamometry.1 Endurance is determined by the duration of the PFM to
sustain a percentage of MVC or by the number of repeated contractions at percentage of MVC.1
Although these parameters are reported by the IUGA/ICS, they do not identify a gold standard
methodology for quantifying PFM strength and endurance. This lack of standardization is not
only problematic for proper assessment of PFM function within the general female population
experiencing UI, but also complicates the difficult assessment of PFM function among females
with neurological conditions. Their impaired motor function often only allows generation of
weak contractions, if any, that can be indiscernible by an examiner or undetected by current
assessment devices, thus preventing appropriate application and progression of PFMT therapy
for these individuals.
The metabolic properties of muscle fiber type dictate their functional roles in muscular
function. Type II fibers rapidly generate force through the breakdown of phosphocreatine and
glycogen stores within the tissue. However, the energy derived from these metabolic processes is
only capable of maintaining high intensity contractions for short periods of time as the
phosphocreatine and glycogen quickly depletes.40,45 Once these energy fuel sources are depleted
muscular function is sustained by aerobic glycolysis, utilizing oxygen from the vascular system
to generate energy.40,45 Measuring these metabolic pathways within the PFM would provide
insight on the different fiber type contributions to PFM function during exercise and help explain

7
the interplay between the demands placed on the metabolic processes of PFM during functional
situations that require both strength and endurance. Further understanding of the metabolic
processes specific to the PFM will provide more insight to how the PFM performs in both
healthy and pathologic conditions. Such information could be utilized to best direct PFMT
methods for management of LUTS.
A common way of assessing skeletal muscle metabolic processes is by measuring oxygen
kinetics. This is routinely performed in sports medicine to better facilitate athletic training
regimes and in medicine to better understand pathophysiology of disease, as oxygen kinetics
provides valuable information about the workload capacity of muscle (oxygen extraction) and
fatigue resistance (oxygen recovery). Methods utilized to measure oxygen kinetics will be
addressed in the following section.
1.1.4 Measurement of skeletal muscle oxygen kinetics
In the fields of sport medicine and physiology skeletal muscle fitness is quantified by
examining the oxygen kinetics of muscle tissue during exercise conditions, and the gold standard
measurement for this is performing muscle biopsies.46,47 Due to this severely invasive and often
impractical method, new approaches for assessing in vivo skeletal muscle oxygen kinetics have
been developed. Phosphorus magnetic resonance spectroscopy (31P-MRS) is currently accepted
as the gold standard for measuring in vivo skeletal muscle oxygen kinetics, which, although it is
not a direct measure like muscle biopsy, has the advantage of allowing for in vivo assessment of
skeletal muscle oxygen kinetics as changes occur in real time with response to exercise.48,49
Although this method is definitely less invasive than sampling of tissue from muscle biopsy, 31P-
MRS is an expensive methodology to employ and requires the use of a magnetic coil that limits

8
the ability of this measurement to be utilized during various exercise modalities.49 Near infrared
spectroscopy (NIRS) is another method of in vivo assessment of skeletal muscle oxygen kinetics,
which, similar to 31P-MRS, allows for real time measurement of skeletal muscle oxygen kinetics
in response to exercise. However, unlike 31P-MRS, NIRS equipment does not require the limb of
muscle under investigation to be confined to a magnetic coil. NIRS devices are applied
superficially over the muscle area of interest, and being relatively small in size can be easily
secured with tape and wraps, allowing the limbs to move freely with movement naturally
occurring with various exercise modalities.50 This particular advantage of NIRS makes it more
suitable to clinical investigations of skeletal muscle oxygen kinetics and as a result it is rapidly
becoming a ubiquitous and valuable research modality to evaluate skeletal muscle oxidative
metabolism in both states of health and disease.50-52 More recently, NIRS has been utilized to
investigate hemodynamic pathophysiology occurring in the presence of neurological conditions
and muscular disorders.53-56 Validation studies performed by Ryan et al. 2014, have
demonstrated that NIRS methodology is considered to provide reliable and sensitive measures
when compared to the gold standard of muscle biopsy and the currently accepted 31P-MRS
measures.46
1.2 Principles of Near Infrared Spectroscopy
1.2.1 Development
NIRS is an emerging scientific tool being used to advance the understanding of
hemodynamic properties in human tissue. Since the 1970’s NIRS technology has progressed and
become adopted by a broad range of research communities to study hemodynamic characteristics

9
of cerebral, skeletal muscle and visceral organ tissue as a means to better understand human
health and disease.50,51,57-59 NIRS was utilized for hemodynamic studies in animal models by
Jöbsis et al. 1977,60 which demonstrated that NIRS could noninvasively detect concentration
changes of oxygen in cerebral tissue. Wray et al. 1988, further progressed this finding by
defining separate near infrared light spectra for specific chromophores that indicated
oxygenation status.61 NIRS was applied to human skeletal muscle by De Blasi et al. 1991,
demonstrating oxygen desaturation in the forearm8 Efforts from Mancini et al. 1994 validated the
use of NIRS in human skeletal muscle, determining its detection of oxygenation changes to be
more sensitive than that of traditional plethysmography measurements.62 NIRS is now a
commonly used technology, particularly in exercise physiology due to its sensitivity and
specificity in detecting skeletal muscle oxygenation patterns.50
1.2.2 NIRS instrumentation
There are three main types of NIRS instrumentation used to detect chromophore
concentration in biological tissue and they are defined by the means with which they measure
optical properties. They consist of time-resolved, frequency-modulated and continuous wave
spectroscopy. Time-resolved spectroscopy uses rapid pulses of light and examines the shape of
the light pulses as they propagate through tissue to derive chromophore concentrations, allowing
the exact flight time of light travel to be quantified.63-66 Frequency-modulated spectroscopy
compares different frequency of light intensity at distinct points within the light cycle, along with
the rate of the light cycle shift to derive chromophore concentrations.50,64,66 Both time-resolved
and frequency-modulated spectroscopy have the benefits of deeper tissue penetration and

10
provide absolute chromophore concentrations by their ability to derive precise pathlength
variables.50,64,66
The third type is continuous wave spectroscopy (CWS), which continuously emits light
and detects chromophore concentration changes based on the amount of light attenuation that
occurs.51,57,64,66,67 Unlike time-resolved and frequency-modulated spectroscopy, CWS provides
only relative chromophore concentration changes, as it utilizes the Beer Lambert Law equation
with estimated coefficient values to calculate light attenuation. Newer CWS instruments have
incorporated spatially-resolved spectroscopy (SRS), which emits continuous light at multiple
distances within a tissue. SRS provides absolute chromophore concentrations to be quantified by
summing the values measured across all the distances of light emission.50,51
1.2.3 Principles of NIRS
In order to apply NIRS to any field of hemodynamic investigation, the principles of NIR
light must be considered. It is established that NIR light, which propagates between 700 to 1000
wavelengths (nm) within the light spectrum, can penetrate through biological tissue to reach
small vessels with the microvasculature.60,61,64 Within these small vessels, NIR light is absorbed
by three biological chromophores: hemoglobin, myoglobin and cytochrome-c-oxidase. 57,67,68
The amount of absorption that occurs provides an indication of the oxygenation status, as the
ability of hemoglobin and myoglobin to absorb NIR light is directly influenced by whether or not
oxygen is bound to these molecules.60,61,64,66 There are several factors that influence the
transmission of NIR light as it travels from its source through biological tissue to reach its
targeted absorption site.
11
1.2.3.1 Scatter
Light scatter refers to how much light is lost along its full trajectory path originating from
its source to targeted end point. As NIR light does not travel is one direct straight line, it is
subject to light loss from scattering in divergent directions through multiple planes and from
coming into contact with tissue that can either reflect or absorb it. Thus, this scattering property
of light can result in a reduction in the strength of the light signal when it has reached its targeted
end point.60,66 The amount of scattering that occurs is also dependent on the wavelength the light
is transmitted at. At higher wavelengths, such as in the NIR spectrum (700-1000nm), there is less
light scatter than in the visible light spectrum, which facilitates NIR light being able to penetrate
through biological tissue.60,69
Based on studies that defined the amount of NIR light scattering at different wavelengths
and through multiple types of biological tissue, scattering coefficients have been established for
use in mathematical equations to derive NIRS values on hemodynamic patterns.66,70 This
scattering coefficient also incorporates the light scattering that is caused from NIR light
travelling through skin, adipose and fibrous tissue before it reaches its final point of absorption.
1.2.3.2 Absorption
The ultimate absorption of light is also dependent upon the wavelength that the light is
transmitted at and of the molecular characteristics of the tissue the light is being transmitted
through.60,61,66 As previously mentioned the chromophores of hemoglobin, myoglobin and
cytochrome-c-oxidase absorb light differently depending on the presence of a molecular bond
with oxygen. It has been determined that hemoglobin has an isobestic point at the wavelength of
800nm, meaning both deoxygenated hemoglobin and oxygenated hemoglobin absorb light

12
equally at this wavelength.61 However, below this wavelength at approximately 750-770 nm
deoxygenated hemoglobin highly absorbs light, whereas above the isobestic point at
approximately 830-850nm oxygenated hemoglobin has higher light absorbency.61,62 The
comparison of the amount of light absorption occurring at these different wavelengths allows
NIRS to convert the amount of detected absorption into deoxygenated or oxygenated
chromophore concentrations values. Therefore, there must always be at least two light
wavelengths emitted from the light source.64,66 The concentration values that NIRS provides are
then used to infer the oxygenation patterns of the tissue under investigation. Similar to scattering
coefficient values required to derive chromophore concentrations, established absorption
extinction coefficient values for the three chromophores (hemoglobin, myoglobin and
cytochrome) at all the light wavelengths employed during a NIRS measurement are also
required.66
1.2.3.3 Pathlength
When establishing the absorption extinction coefficient, the total distance the light has
travelled is of great importance and is defined as the pathlength. As described by Jacques 2013,
an increasing pathlength will result in an exponential decrease in light absorption. Standard
pathlength values have been defined specific to the type of tissue under investigation, which will
influence the absorption coefficient value used.66 Studies from Deply et al. 1988, were among
the first to establish a known pathlength value for cerebral tissue within a rat model.69 Several
investigations were the completed by, Ferarri et al. 1992, Van der Zee et al. 1992, Essenpreis et
al. 1993, and Duncan et al. 1995, which quantified pathlength for human skeletal muscle
tissues.65,71-73 Derived from these studies, standard pathlength values for skeletal muscle have

13
been established. It is important to note that the pathlength value is also specific to inter-optode
distance. The inter-optode distance is to be determined prior to any measurement and is the
distance between the optode transmitting the light source (light entry point) and the optode
receiving the transmitted light (light exit point). In CWS, which utilizes the Beer Lambert Law to
calculate the chromophore concentration values, the pathlength value is assumed to remain
constant throughout the duration of the NIRS measurement.70,74,75 However, it should be noted
that specific pathlengths for each individual muscle have not been determined and that each
muscle has a different composition of fiber types and varying tissues that result in unique
pathlength parameters.50,62,70 Saitoh et al. 2010, also report that scatter coefficient and pathlength
can change in a given muscle as a direct result of exercise and that more accurate, absolute
values in oxygenation of the muscle should be measured with time-resolved spectroscopy to
account for this.76
1.2.4 Contribution of myoglobin and cytochrome-c-oxidase to light absorption
Although NIR light absorption of reduced cytochrome-c-oxidase was measured in the
founding work of Jöbsis et al. 1977, there remains controversy over this value as it is difficult to
isolate the light absorption occurring solely due to cytochrome-c-oxidase reduction from that of
the much stronger hemoglobin signal. The consensus opinion is that the influence of
cytochrome-c-oxidase only contributes to approximately 10-15% of the light absorbency signal,
and is therefore dismissed by some researchers as an insignificant contributing factor in the
measured values of light absorbency.61,68 Similarly, it has been determined that myoglobin
accounts for approximately 10-20% of the measured hemoglobin light absorbency signals, which

14
at this point cannot be separated from the hemoglobin signal and therefore myoglobin
oxygenation status is inferred from the hemoglobin measures.50,57,62,68
1.2.5 Optical Density defined by the Beer Lambert Law
When collecting NIRS measurements it is essential to consider the type of biological
tissue the NIR light will be transmitted through and the type of tissue at the terminal site of light
transmission, as this determines the specific parameters used for the scatter and absorption
extinction coefficients. With standard estimated values for the absorption extinction coefficient,
scatter coefficient and pathlength, along with a defined inter-optode distance specific to the
measurement, the Beer Lambert Law can then be utilized to derive the oxygenation status of
biological tissue by quantifying optical density.57,61,68,77,78 The Beer Lambert Law defines the
optical density of a medium, and the modified equation utilized in continuous wave instruments
is expressed as: A = e[c]LB+G
In this equation, A represents optical density, e represents the absorption extinction
coefficient, [c] represents the chromophore concentration, L represents the distance from the
light source to terminal end point, B represents the pathlength and G represents scatter
coefficients for other parameters that can interfere with light transmission, such as skin and
adipose tissue.51,57,77
This equation only works for one chromophore, so in order to examine multiple
chromophores simultaneously there needs to be the same number of light wavelengths emitted
for the corresponding number of chromophores under investigation. NIRS systems then employ
algorithms to solve the equations for each chromophore at the varying wavelengths, ultimately

15
providing the relative concentration values of the chromophores to allow for the interpretation of
oxygenation status of the tissue.51,57,77
It is also important to note that only standard values or estimates for these coefficients are
used and that variation in light scatter and absorption occurs across subjects, tissue site and
measurement times.66 This is why relative trends in oxygenation patterns are derived from NIRS
studies using continuous wave spectroscopy, as opposed to absolute oxygenation values
measured with time-resolved or frequency-modulated spectroscopy.51,66,77
1.2.6 NIRS adaptation to PFM
Similar to the use of NIRS in sports medicine and physiology, the adaptation of NIRS for
investigations in urology is appealing due to its sensitive and non-invasive measurements.
Traditional urological measurements of bladder function require insertion of multiple catheters,
causing discomfort and risk for infection. NIRS allows transcutaneous measurement of the
bladder, as it resides rather superficially in the lower abdomen just proximal to the symphysis
pubis. Due to its accessibility, the detrusor (visceral muscle of the bladder) has been investigated
with NIRS techniques similar to that of skeletal muscle investigations. Adapting NIRS to
monitor the bladder was first established by Macnab et al. 2005, and through this research NIRS
has demonstrated its ability to be used as an effective clinical tool for monitoring and diagnosing
urological pathologies.59,79
More recently, this group of UBC based researchers have been adapting NIRS
technologies to examine the skeletal muscle of the female pelvic floor in attempt to address
clinical issues related to LUTS, PFM dysfunction and pelvic organ prolapse.59 Shadgan et al.
2008 developed the first probe for assessment of the PFM in relation to urinary incontinence.74

16
This design utilized CWS NIRS to provide simultaneous tracings of the detrusor and the mid-
urethral sphincter for the purposes of monitoring bladder function in females with stress
incontinence.74 The data collected from the NIRS probe was reported to be reproducible and
consistent with NIRS oxygenation trends captured by their transcutaneous bladder
measurements. Furthermore, they were also able to demonstrate NIRS measurements of
voluntary PFM contractions were consistent with physiologic responses of typical voluntary
skeletal muscle contractions measured with NIRS.74
This prior prototype, although capable of measuring multiple structures of the lower
urinary tract, required repositioning for each targeted site (bladder, urethra, right and left PFM).
Utilizing the same CWS NIRS technology, a new transvaginal NIRS probe will be designed,
allowing simultaneous measurement of bilateral PFM with maintained positioning, in order to
assess the hemodynamic and oxygen kinetic response of the PFM during exercise. Current
devices used to objectively assess this muscle group assess the muscle as one functioning unit,
and do not always account for asymmetry that might occur from weakness to a specific side of
the muscle. This is of particular importance for the female population with LUTS and underlying
nerve impairment, as asymmetrical muscular function of the PFM might occur due to
neurological impairment causing differential motor and sensory function on contralateral sides of
the body.80-82 With this instrument it was planned to compare the hemodynamic trends and
oxygen recovery kinetics of the PFM in response to exercise. These parameters will be assessed
in females with continence (controls) and in females experiencing LUTS due to neurologic
conditions and injury (cases). Both groups will be exposed to a PFMT regime to evaluate
whether a training response in the PFM can be captured by NIRS measures of hemodynamics
and oxygen recovery kinetics.

17
1.3 Objectives and Hypotheses
1.3.1 Primary Aim
The primary aim of this project is to develop a transvaginal NIRS probe capable of
isolating bilateral PFM oxygenation and to determine the feasibility of utilizing NIRS derived
parameters obtained with this probe. Furthermore, this project aims to objectively measure NIRS
parameters of hemodynamics and oxygen recovery kinetics in females with LUTS due to
impaired pelvic innervation (cases) and in continent controls (controls) to determine if beneficial
PFMT training effects can be captured with NIRS instrumentation.
1.3.2 Objectives
The secondary objectives supporting this primary aim are to:
1. Compare oxygen kinetic responsiveness of bilateral PFM as detected by NIRS.
2. Compare NIRS derived parameters to currently used objective parameters of PFM
function derived by manometry.
3. Determine if lower limb dominance contributes to bilateral PFM function.
4. Evaluate the effectiveness of PFMT on NIRS and manometry parameters of PFM
function.
5. Evaluate the impact of PFMT to reduce clinical symptom of LUTS and PFM
dysfunction and improve QOL.
6. Determine how PFMT adherence influence effectiveness of PFM function
improvement and symptom reduction in the cases group.

18
1.3.3 Hypotheses
1. Oxygen kinetic responses of bilateral PFM detected by NIRS will present differences
contralaterally in the case group and similarities contralaterally in the control group.
2. NIRS derived parameters will demonstrate a relation to manometer parameters of
PFM function.
3. Lower limb dominance will be related to bilateral imbalances of PFM.
4. PFMT will improve the proficiency of oxygen kinetics as measured by NIRS and
PFM strength and endurance as measured by manometry.
5. PFMT will reduce clinical symptoms and improve QOL, as measured by validated
questionnaires.
6. Higher PFMT adherence rates will demonstrate greater effectiveness of PFM function
improvement (as measured by NIRS and manometer variables) and demonstrate
greater reduction in clinical symptoms (as measured by validated questionnaires),
within the case group.

19
Chapter 2: Methods
This chapter will provide a detailed description of the methodology of the entire research
project. The eligibility and protocol for participant involvement is described. The objective and
subjective outcome measures are identified, along with the utilized equipment and the means to
which measurements were conducted. A thorough description of the technical development of
the prototype for the NIRS probe is provided. Careful consideration is given in addressing how
outcome measures were analyzed and the rationale for how analysis was conducted.
2.1 Participants
Inclusion criteria for study participants included females 19 years of age or older who
experience urinary leakage, have a history of neurological condition for > 6 months and able to
communicate in English. Inclusion criteria for control participants included females 19 years of
age or older who do not currently experience urinary leakage or bladder symptoms, no history of
a neurological condition and able to communicate in English. Exclusion criteria for all
participants included the following: pregnancy or planned pregnancy, post-partum < 2months,
pelvic radiotherapy, pelvic pain symptoms, use of indwelling catheter, pelvic organ prolapse
beyond introitus, atrophic vaginitis, hypertonic pelvic floor muscles, skin break down of
perineum, orthopedic or cognitive impairment that does not allow for physical exercise.
A total of 45 individuals were screened for eligibility for the case group following
referral from physician or poster recruitment advertisement. Of these individuals 6 did not meet
the criteria. Of the 39 individuals that did meet the criteria for inclusion in the study group after
initial screening 25 individuals decided not to proceed with participation. The remaining 14
individuals were enrolled in the study and all had a baseline assessment. However, one

20
participant began menstruation during baseline assessment, therefore assessment ceased at this
time and the participant subsequently withdrew from further participation. Two participants
experienced falls (unrelated to study procedures) during the home-based PFMT intervention and
were unable to complete follow-up assessment. Two participants reported vaginal discomfort
with attempted manometer insertion at baseline and were therefore excluded from further
participation in the study. One participant completed the study to post assessment but reported
vaginal discomfort on attempted final manometer insertion, and therefore this final measure was
not collected for this participant. Upon baseline assessment one participant was unable to stand
safely on the force plates, and therefore this measure was not collected for this participant. Of
these 14 enrolled participants, 10 participants completed the entire baseline assessment and 8
participants completed their post-PFMT assessments.
Of 31 control participants screened, 4 individuals did not meet the criteria as they
reported bladder symptoms and 12 individuals decided not to proceed participation. The
remaining 15 individuals were enrolled in the study and had a baseline assessment.
2.2 Protocol
This pilot study utilized a prospective, non-randomized study design with pre and post
comparisons. All of the testing took place at the Blusson Spinal Cord Centre, located in
Vancouver, British Columbia, Canada during the time period of November 2016 to April 2018.
Complete protocol of the study was approved by the University of British Columbia’s Research
Ethics Board and by the Vancouver Coastal Health Research Institute Ethics Board. All
participants provided written informed consent prior to participation. All assessments were
scheduled around participants menstruation cycles to avoid active menstruation during

21
assessment appointments. At baseline assessment demographics and health history reviewed,
including parity and delivery type, neurological history, surgical history, urinary incontinence
symptoms and treatments, and current medications. A physical activity Life Style Index score
was given based on participant’s subjective report of being: “Sedentary” (no physical exercise
during the week, score of 0), “Moderate” (20 minutes of vigorous intensity physical activity 3
days a week, score of 1) or “Active” (30 minutes of moderate intensity physical activity 5 days a
week, score of 2).
PFM function was assessed at baseline and after 8-weeks of home-based PFMT
intervention (post-PFMT). Standardized PFMT instruction was provided to participants at the
completion of the baseline assessment. The PFMT was based on previous work by Bø et al.
1990,18 who conducted a study that compared two types of home-based PFMT to address SUI.
Their first PFMT intervention consisted of 8-12 strong contractions repeated 3 times throughout
the day.18 Their second PFMT intervention included this first regime along with weekly
45minute instructor-based sessions that consisted of supervised contractions in lying, sitting and
standing positions.18 Based on their results women with SUI in both the assigned intervention
groups showed significant improvement in PFM strength as measurement by manometer after 1-
month of PFMT.18 These improvements were maintained at 6-months follow-up in the first
regime group and continued to improve at 6-months with the second regime group.18 The PFMT
regime for this current study incorporated the lying, sitting and standing contractions from Bø et
al.’s 1990 supervised sessions which participants were required to perform daily at maximum
effort.18 As each contraction was to be repeated 6-8 times, participants would be performing at
minimum, the same amount of contractions as Bø et al.’s 1990 home-based PFMT.18 In
combining these two exercise regimes into one it was intended to elicit and improvement in PFM

22
strength and fitness within our constructed time span of 2-months. Participants were given
instruction on how to perform all PFMT exercises and given the opportunity to seek clarification,
demonstration and practice. A written instruction sheet of each exercise was given to participants
along with an exercise recording sheet (example in Appendix). Participants were required to
perform the standardized PFMT daily for the duration of 8-weeks. Case group participants were
also instructed on how to perform 3-day bladder diaries and materials required to complete
bladder diary were supplied to participant (example in Appendix). Participants completed
bladder diaries 3-days prior to initiating PFMT and 3-days after completion of 8-week PFMT.
Figure 2.1 Flow diagram for study procedures from baseline to post-PFMT assessment.

23
2.3 Objective measures
2.3.1 Urinalysis and post void residual volume
Upon each visit the participant was requested to arrive with a comfortably full bladder in
order to collect a urine sample and measure post void residual volume. The participant was
instructed on how to properly collect a clean catch midstream urine sample in a sterile urine
container. The participant was also instructed to ensure they voided to perceived complete
emptying, to ensure urine collection did not interfere with complete voiding. The void was
performed in a bathroom just outside the examination room and once the participant returned to
examination room urinalysis was performed on their sample to rule out presence of urinary tract
infection. Siemens Multistixâ 5 reagent strips were used for urinalysis, which tested for
leukocytes, nitrites, protein, red blood cells and glucose. Based on negative findings the
assessment proceeded, positive findings would prompt follow-up with physician and result in
rescheduling until urinary tract infection resolved.
Following urinalysis, the post void residual volume (PVR) was assessed. For this
measure participants were positioned supine on an examination table, scanner settings were
selected as appropriate (depending whether the female had a hysterectomy or not), a water-
soluble lubricant was applied to the pubis, the symphysis pubis was used as a landmark and the
handheld ultrasound was placed 1 inch above the landmark in a downward direction towards the
bladder. Only scans that indicated accurate placement were used to report the PVR volume
measured using a bladder scanner (BladderScanâ BVI 9400, Verathon).

24
2.3.2 Standing force plate
Following PVR assessment participants performed a standing force plate measurement
under two different conditions to quantify percentage of total body weight distributed across the
bilateral lower limbs as determined by ground reaction force (Fz). Force plate equipment used
was that of Bertec; Columbus, Ohio, United States. The participants were positioned in an
upright standing position on the center of two individual side-by-side force plates so that the left
foot was in the center of force plate 1 and the right foot was in the center of force plate 2. Under
the first standing condition participants were not instructed on how to stand, only to not move
their feet, and they were distracted with a video on a screen centred directly in front of them. The
participants were instructed to watch the video which reviewed concepts of pelvic floor muscle
function and contraction. Participants were instructed not to attempt any of the contractions
mentioned in the video while in the standing position. During the duration of this video 3
separate force plate measures were collected for 60-seconds each. After completion of the video
the participant was informed that force plate data had been collected at this time to determine if
altered body weight distribution occurred during distracted standing. This condition was
determined as distracted stance (DisFz). Following this the participant was instructed to stand as
straight, still and centered as possible, while maintaining their feet in the aforementioned
positions, for the duration of 60-seconds. This was considered as quiet stance (QFz). All force
plate data was collected at a sample rate of 100Hz and a low pass filter of 5. Data was
subsequently analyzed in Matlab.

25
Figure 2.2 Force plate configuration for lower limb dominance measures. Force plates within the floor, “X” marked indicators for left and right foot placement during both distracted and quiet stance. During distracted stance video played in front of participant on supported video screen.
2.3.3 PFM manometry
Prior to starting PFM assessment, the participant was given verbal overview of basic
PFM anatomy, function and contraction. Participants were then allowed to practice contractions
and examiner monitored to make sure no accessory muscles were being used. Once participant
felt comfortable performing a contraction examiner confirmed ability of subject to contract PFM
with visual inspection of perineal elevation.1,8 Participants were positioned in the supine
position, knees bent and hips flexed with external rotation so that soles of feet were touching, in
order to minimize accessory muscle contraction.83 The PFM manometer used in this study was
the Peritronâ by Laborie. Individual single use vaginal sensors were used for each participant
and infection control procedures were followed as per manufacturer guidelines and institution
standards. A water-soluble lubricant was applied to manometer prior to insertion and following a
resting time of 60-seconds to allow PFM to relax after response to insertion, a series of
standardized PFM contractions were conducted. Participants completed a set of 3 maximal
voluntary contractions (MVC) where they were instructed to contract the PFM as strong as

26
possible and to relax once they felt they reached their strongest effort. Each MVC was separated
by a 10-second recovery. After the final MVC there was a 5-minute recovery period prior to the
next contraction which was 1 sustained MVC (SMVC), where they were instructed to contract
their PFM as strong as possible and to hold the strong contraction for as long as possible before
allowing their PFM to relax. Another 5-minute recovery period followed the SMVC prior to
conducting a set of fast repeated contractions (REP) to point of perceived exertion. For the REP
participants were instructed to perform quick PFM contractions as strong as possible and quickly
relax, and to continue repeating this until they feel they can no longer perform a strong
contraction (feeling of perceived exertion). Following the REP set there was a 10-minute
recovery period prior to conducting the same set of PFM contractions with the NIRS probe.
Upon completion of PFM contractions with the NIRS probe there was another 10-minute
recovery before the manometry measures were repeated. The purpose of repeating the
manometer measures after the NIRS was to allow for assessment of learner effect and effort
consistency/muscular fatigue since the manometer and NIRS measurements were not occurring
simultaneously.
Figure 2.3 PFM manometer. (Peritronâ by Laborie) used for objective pressure measurements in cmH2O of PFM strength and endurance. Individual single-use vaginal sensors used for each participant.

27
2.3.4 NIRS
The NIRS probe that was used for assessment of PFM for this study was of original
design. This design was structured from a previous NIRS probe prototype created by Shadgan et
al. 2008, which utilized continuous wave NIRS and provided simultaneous tracings of the
detrusor and the mid-urethral sphincter for the purposes of monitoring bladder function and
related incontinence.74 They reported reproducible data with consistent NIRS oxygenation trends
when compared to the NIRS data during transcutaneous measurements of the bladder.74 With
this first prototype they were also able to demonstrate that NIRS measurements of voluntary
PFM contractions were consistent with the physiologic response of typical voluntary skeletal
muscle contractions measured with NIRS.74 When testing the feasibility of this prototype they
also determined that movement artifact did not appear to compromise the NIRS tracings as
positioning was well maintained with the probe handle.74
Based on this prototype and using the same continuous wave NIRS equipment,
(OXYMON MK III, Artinis Medical Systems BV, The Netherlands), a dual channel (2x1) set up
consisting of one emitter and one receiver fiber optic cable were secured on parallel sides of a
transparent disposable speculum. Due to size constrictions of the speculum, miniature fiber optic
cables were attached to standard fiber optic cables which were secured together via an
attachment block. Both the standard and miniature fiber optic cables were screwed into to the
attachment block and the block itself is completely opaque and black in colour to prevent any
external light contamination at the attachment point. During tracings this attachment block was
also covered with an opaque black cloth to further prevent against environmental light
contamination. The ends of the miniature fiber optic cables where actual NIR light transmission
and detection occurs are referred to as the optodes. These optodes were secured to a base foam
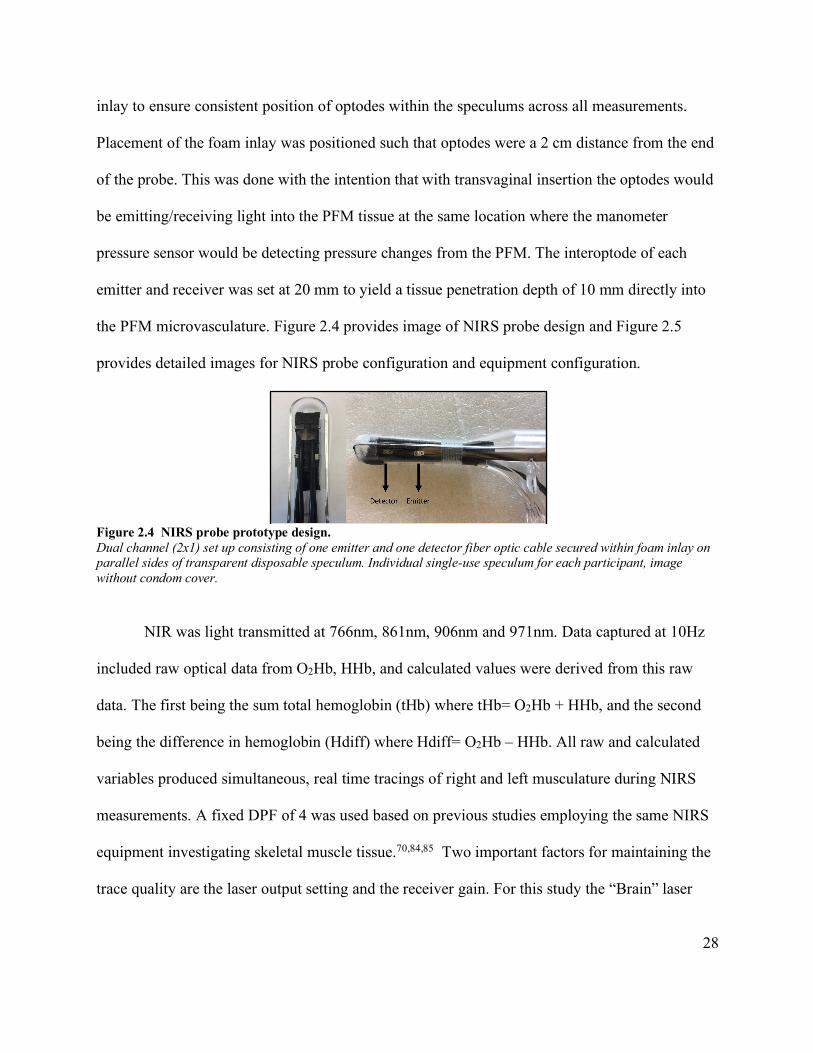
28
inlay to ensure consistent position of optodes within the speculums across all measurements.
Placement of the foam inlay was positioned such that optodes were a 2 cm distance from the end
of the probe. This was done with the intention that with transvaginal insertion the optodes would
be emitting/receiving light into the PFM tissue at the same location where the manometer
pressure sensor would be detecting pressure changes from the PFM. The interoptode of each
emitter and receiver was set at 20 mm to yield a tissue penetration depth of 10 mm directly into
the PFM microvasculature. Figure 2.4 provides image of NIRS probe design and Figure 2.5
provides detailed images for NIRS probe configuration and equipment configuration.
Figure 2.4 NIRS probe prototype design. Dual channel (2x1) set up consisting of one emitter and one detector fiber optic cable secured within foam inlay on parallel sides of transparent disposable speculum. Individual single-use speculum for each participant, image without condom cover.
NIR was light transmitted at 766nm, 861nm, 906nm and 971nm. Data captured at 10Hz
included raw optical data from O2Hb, HHb, and calculated values were derived from this raw
data. The first being the sum total hemoglobin (tHb) where tHb= O2Hb + HHb, and the second
being the difference in hemoglobin (Hdiff) where Hdiff= O2Hb – HHb. All raw and calculated
variables produced simultaneous, real time tracings of right and left musculature during NIRS
measurements. A fixed DPF of 4 was used based on previous studies employing the same NIRS
equipment investigating skeletal muscle tissue.70,84,85 Two important factors for maintaining the
trace quality are the laser output setting and the receiver gain. For this study the “Brain” laser

29
output setting was used instead of the “Muscle” setting as the “Brain” setting yields a higher
intensity of light and results in a better signal to noise ratio. The receiver gain level determines
the degree of amplification of the received signal and must be set at a level to optimize the
saturation of received light. Saturation percentages allow you to monitor the quality of trace by
indicating levels that are too low or too high. Levels that are too low indicate that all transmitted
light is being absorbed by the tissue and not enough light is being detected by the receiver to
produce a reasonable signal.57 Levels that are too high indicate over saturation of the received
light signal which indicates contamination from environmental light, resulting in reduction of
received signal and lower detected concentration values.57 Gain settings were adjusted at the
beginning of each measurement to prevent over saturation and maintain acceptable signal
strength within the range of 1-20%.57
In order to collect NIRS probe measurements with participants a new speculum was fitted
with the NIRS configuration as previously described for individual measurement and the NIRS
probe was covered with a latex free condom. The participant was positioned supine with legs in
the “butterfly” position, similar to that of the manometer measurement condition. The probe was
then inserted transvaginally to indicated insertion point. The NIRS laser output was then turned
on and once acceptable signal percentages were confirmed, the trace was biased to arbitrary zero.
Resting baseline values were then recorded prior to initiating the same protocol for PFM
contractions as described above in the manometer section (3 MVCs, 1 SMVC, REP).

30
Figure 2.5 NIRS probe prototype design details and equipment configuration. Both vaginal sensor for manometer and NIRS probe were individual single-use, NIRS probe shown without condom cover.
2.4 Subjective measures
2.4.1 Bladder symptom questionnaires
Participants in the case group were asked complete the Incontinence Impact
Questionnaire (IIQ-7),7,86,87 and the Urogenital Distress Inventory (UDI-6),86,87 at baseline and
post-PFMT assessments. All participants completed the Questionnaire for Urinary Incontinence
Diagnosis (QUID),88 at baseline and post-PFMT assessment. All participants were also asked to
complete a subjective assessment of bladder symptom improvement after completion of the
home-based PFMT. This subjective survey of improvement (which will be referred to as SSI in
this document), was developed by Bø et al. 1990, and it utilizes a Likert scale of 5 to assess for

31
self-identified changes categorized as worsened: (1), unchanged (2), improved (3), almost
continent (4) or continent (5).18
2.4.2 Waterloo footedness questionnaire
Following the force plate measurements at baseline all participants were asked to
complete the Waterloo Footedness Questionnaire-Revised version (WFQ).89 This is a validated
questionnaire to determine footedness preference. It asks a series of 10 imagined scenario
questions were participants must answer: Left always, Left usually, Equal, Right usually, Right
always. These answers are assigned with corresponding values from -2 to 2 to provide a
footedness preference score. Therefore, the minimum score of -20 would indicate the greatest
left footedness preference and the maximum of 20 would indicate the greatest right footedness
preference.
2.4.3 Bladder diaries
Participants in the case group were required to complete bladder diaries. At baseline
participants were instructed on how to complete a 24-hour 3-day bladder diary and were given a
urinary hat in order to measure all urinary output. The 3-day bladder diary has been validated in
previous literature.90 Participants were instructed to complete a baseline 3-day bladder diary
immediately prior to initiating home-based PFMT. Participants were also instructed to complete
an additional 24-hour 3-day bladder diary immediately after completing the 8-week home-based
PFMT, prior to post-PFMT assessment. An example of how to record fluid intake, urinary output
and urinary events in the diary was also provided to the participants.8 (Example of bladder diary
provided in Appendix).

32
2.5 Data analysis
2.5.1 Standing force plate and WFQ
Matlab was used to calculate the percentage of total ground reaction force (Fz) distributed to
both the right and left lower limbs. The 3 trials of distracted stance were averaged. A calculation
was then performed in SPSS to both the averaged distracted stance condition and to the quiet
stance condition to determine Fz Ground Limb Dominance:
Fz Limb Dominance = RFz-LFz
This calculated Fz Limb Dominance value difference between ground reaction force measured
from right limb (RFz) and left limb (LFz). A positive value indicates right limb dominance and a
negative value indicates left limb dominance. The Wilcoxin Signed Rank test was performed to
compare Fz Limb Dominance between Distracted and Quiet stance conditions. A Paired-T Test
was performed to compare Fz Limb Dominance between Distracted and Quiet stance conditions
for the study group.
Spearman’s Rank Correlation was performed to test association between the absolute WFQ
scores and the Fz Limb Dominance in Distracted and Quiet stance conditions separately within
each the control and case groups.
2.5.2 SMVC focused analysis
PFM assessment was carried out in the nature of performing MVCs, SMVCs and REPs
as described and recommended by Laycock and Jerwood 2001 and Devreese et al. 2004.1,91,92
NIRS tracings from this full assessment were used in consideration of the functionality of the

33
tool itself and for the consideration of observational trends which will be further characterized in
the results section.
Although a full PFM assessment was performed, the objective NIRS analysis centred on
the SMVC only. This was done in order to focus the results of the investigation on the ability of
NIRS to detect oxygen recovery kinetics of the PFM. Rationale to do so is supported by the
previous literature of Muthalib et al. 2010, who reported SMVCs are more likely than other
contractions to demonstrate the O2 demand of the muscle tissue under investigation, as it requires
more continued force production than MVCs and does not allow for the amount of resaturation
which occurs during fast repeated contractions.93 The resaturation that occurs during fast
repeated contractions allows for measure of the balance between O2 demand and O2 supply, as
the tissue attempts to maintain equilibrium during a repeated task. As we were mostly interested
in the O2 demand experienced by the PFM, we focused our analysis and objective outcome
measures with values obtained from SMVC only. The SMVC in other PFM literature is also
considered a good measure of both strength and endurance, compared to that of MVC which is
considered to assess strength alone.1,30,94
2.5.3 PFM manometry
The peak pressure of each contraction and the average pressure achieved during each
contraction was evaluated for change from baseline to post-PFMT assessment. These pressure
values were directly recorded from the manometer output. Prior to each contraction the
manometer was set to zero while it remined in situation transvaginally to give absolute pressure
change during the contraction. The peak and average pressures, along with the duration of each
SMVC were used for analysis.

34
Due to participant follow-up attrition the sample size between baseline and post-PFMT
assessments is variable both among the control and case groups. For analysis of manometer
measures among the case group at baseline assessment N = 11 (SS1, SS3, SS4, SS5, SS7, SS9,
SS10, SS11, SS12, SS13, SS14). For analysis at post-PFMT assessment N = 7 (SS1, SS3, SS9,
SS10, SS12, SS13, SS14), SS7 did not complete post-NIRS manometer measurements due to
reporting discomfort. As only the pre-NIRS manometer measurements ended up being used in
analysis as will be described further in this section, analysis for manometer outcomes between
baseline and post-PFMT assessment N=8 (SS1, SS3, SS7, SS9, SS10, SS12, SS13, SS14). For
analysis of within assessment manometer measures among the control group at baseline
assessment N = 14 (CS2 excluded as data missing from post-NIRS manometer measurement).
For analysis within post-PFMT assessment and between baseline and post-PFMT assessment N
= 13 (CS3 and CS5 withdrew after baseline assessment).
Paired sample statistical testing was performed for SMVC Peak cmH2O, SMVC Average
cmH2O and SMVC Timesec for the within session (both at baseline and post-PFMT assessment
individually) pre and post NIRS manometer measurements to assess for evidence of muscular
fatigue and learner effect. Since there was no significant difference found, except in one variable,
post-PFMT assessment Average cmH2O, which still was highly positively correlated, the pre-
NIRS manometer measurements were used for analysis for paired sample statistical testing of
manometer measurements across sessions, comparison to NIRS measurement outcomes and to
interventional exercise adherence.

35
2.5.4 NIRS
Prior to all NIRS analysis a filter was applied to smooth the data. This filter was the Moving
Gaussian Average which is a generic smoothing filter to reduce high frequency noise. This filters
at a width of 1second and calculates the average within that 1second time point.57 This filter is a
function inherent to the Oxysoft software. Similar filters have been utilized in other NIRS
investigations.55,56,95 Also prior to analysis of each contraction (MVCs, SMVC and REPs) the
NIRS tracing was set to arbitrary value of zero and the averaged 30seconds prior to the onset of
each type of contraction was used as the baseline and calculated within the Oxysoft
software.85,93,95-97 Although four NIRS variables were collected during the measurements (O2Hb,
HHb, tHb, HbDiff) only HbDiff was selected for analysis. tHb is representative of blood volume
and shifts in volume are indicative of blood flow changes, therefore it is a value used to assess
hemodynamic changes within the muscle.97 HHb was not assessed independently as a NIRS
variable as it has been determined by previous literature to be an unreliable means of
measurement when employing occlusion free ½RT analysis (which was used in this study and
will be explained further in this section).85 Whereas O2Hb and HbDiff represent relative oxygen
saturation, HbDiff (in occlusion free ½RT analysis) is considered to be more indicative of
metabolic changes within the muscle tissue, and less susceptible to blood flow changes than
O2Hb.67,85,93,98-101 The responsiveness of HbDiff during exercise is a measure of coupled oxygen
demand and supply, and when in recovery from exercise it reflects an index of oxygen
delivery.99
Due to participant follow-up attrition the sample size between baseline and post-PFMT
assessments is variable both among the controls and case participant groups for NIRS
measurements. Also, four earlier NIRS measurements (CS2, CS3, CS4, SS1) had to be excluded

36
from analysis due to inaccurate signal transmission, which was later corrected with adjusted
foam inlay as described previously in this section. For analysis of NIRS measures among the
case group at baseline assessment only N = 10 (SS3, SS4, SS5, SS7, SS9, SS10, SS11, SS12,
SS13, SS14). For analysis at post-PFMT assessment and across baseline and post-PFMT
assessment N = 7 (SS3, SS7, SS9, SS10, SS12, SS13, SS14). For analysis of NIRS measures
among the control group at baseline assessment N = 12 (CS1, CS5, CS6, CS7, CS8, CS9, CS10,
CS11, CS12, CS13, CS14, CS15). For analysis at post-PFMT assessment and across baseline
and post-PFMT assessment N = 11 (CS1, CS6, CS7, CS8, CS9, CS10, CS11, CS12, CS13,
CS14, CS15).
2.5.4.1 Oxygen saturation patterns in response to exercise
Peak magnitude change of the HbDiff NIRS variable was determined by the following
means. The maximum magnitude change of each NIRS variable reached during every
contraction was subtracted from its corresponding baseline value. Magnitude values were based
on oxygen saturation patterns. The oxygen saturation pattern observed during PFM contraction
and corresponding recovery interval is important to take into consideration, as saturation trends
during exercise are an indicator of oxygen stress experienced by the muscle during exercise,
while the oxygen saturation pattern in recovery indicates an oxygen deficit induced by
exercise.102 Chance et al. 1992 describe how the observation of oxygen desaturation occurring
with exercise represents an oxygen demand exceeding the ability of oxygen delivery mechanisms
to maintain consistent oxygenation to the muscular capillaries, implying increased rate of oxygen
consumption.93,102 Inversely, an increased oxygen concentration, or restaturation, pattern

37
indicates that oxygen delivery is greater than that of the muscular oxygen demand, implying
reduced oxygen consumption and return to hemostatic balance within the tissue.93
Therefore, magnitude changes occurring during contractions were assessed based on their
oxygen saturation pattern. In contractions where desaturation was identified the greatest
minimum value reached during contraction was subtracted from the baseline. For contractions
where increased saturation occurred the greatest maximum value reached during contraction had
the baseline subtracted from it. The calculated peak magnitude change during contraction is
referred to in this study as DMag.
Pattern Contraction Recovery 1 Desaturation Resaturation 2 Desaturation Desaturation 3 Increased saturation Resaturation 4 Increased saturation Desaturation (to baseline) 5 No response No response 6 No response Increased saturation 7 No response Desaturation 8 Increased saturation Desaturation 9 Desaturation Resaturation (to baseline)
Table 2.1 SPAM stratification of oxygen patterns. Stratification of oxygen saturation patterns observed during PFM contraction and corresponding 90-sedond recovery interval.
The peak magnitude changes of the Right and Left PFM at baseline assessment were
compared with paired sample statistical testing. Likewise, the peak magnitude changes of Right
and Left PFM at post-PFMT assessment were compared with paired sample statistical testing.
Also, the peak magnitude changes of Right PFM at baseline and post-PFMT assessment and Left
PFM at baseline and post-PFMT assessment were compared with paired sample statistical
testing.

38
2.5.4.2 Unilateral PFM dominance based on contraction magnitude change
Once the Peak DMag were calculated based, all values were converted to absolute values, in
order to determine unilateral PFM dominance. Dominance was determined based an algorithm
accounting for saturation patterns, (Saturation Pattern Algorithm for PFM Dominance-SPAMD),
which is shown below in Figure 2.5. Ultimately this algorithm calculated dominance by
subtracting the absolute Peak DMag of the Left PFM from the absolute Peak DMag of the Right
PFM. This yielded positive values indicative of Right DMag dominance and negative values
indicative of Left DMag dominance. These values were then correlated to Fz scores in Distracted
and Quiet stance conditions, as well as to WFQ scores.
Figure 2.6 SPAMD algorithm. SPAMD algorithm for using saturation patterns to calculate unilateral PFM dominance.

39
2.5.4.3 Oxygen recovery kinetics in response to exercise (Half Recovery Time)
The ability of skeletal muscle to recover from the oxygen deficit induced by exercise
represents the oxidative metabolism of the muscle and implies muscular fitness, or aerobic
capacity in that a muscle tissue has greater aerobic capacity when it is quickly able to restore
depleted oxygen saturation levels after exercise.102,103 Early investigations with NIRS determined
that the time of oxygen recovery following exercise can be used as a means to assess oxygen
delivery deficits in relation to oxygen consumption.98,101,102 The specific NIRS variable of
HbDiff (HbDiff = O2Hb-HHb), a calculation is an inherent function of the Oxysoft software and
occurs in real time with the recorded measurements, is thought to represent deoxygenation102
and provide a stronger signal for analysis.104 Modern NIRS CWS-SRS equipment is able to
provide a more accurate and absolute value of deoxygenation, the tissue saturation index (TSI).
When measured in conjunction with transient occlusions to control for blood volume, TSI
provides a validated and reliable means of noninvasively assessing respiratory capacity in
skeletal muscle.46,97,105 These current TSI and occlusion method measurements evolved from the
early investigations of Chance et al. 1992 and McCully et al. 1994, who both developed means
of assessing the kinetics of muscle tissue recovery from exercise by calculating the half recovery
time (½RT) from the cessation point of exercise to the point of maximum resaturation in
recovery.98,102 As the NIRS equipment employed in this investigation is that of the CWS era,
methods of measurement and analysis were used based on the initial literature derived from
Chance et al. 1992 and McCully et al. 1994.102,98 McCully et al. 1994 further validated this
method by fitting the HbDiff recovery to a mono-exponential curve, which gave similar results
to the gold standard measurement of muscle oxidative metabolism with PCr under conditions of
submaximal exercise.98 McCully et al. 1997 then applied this HbDiff curve fitting in a study

40
investigating peripheral vascular disease in an elderly population. However, they found that
mono-exponential curve did not fit the majority of the HbDiff resaturation response following
cessation of exercise in this clinical population. In order to analyze their data, they employed the
½RT of HbDiff, defined as half the time duration from the HbDiff difference at the end of
exercise to near baseline and either did not change or showed overshoot for at least 30seconds.99
With this method they were able to determine that the ½RT of individuals with peripheral
vascular disease were significantly slower than controls.
Utilizing the ½RT methods, Ichimura et al. 2006 used the O2Hb variable to measure half
recovery time and determined that it was inversely correlated with Peak VO2, meaning that lower
systemic oxygenation capacity is related to having slower ½RT.101 Buchheit et al. 2010
compared ½RT calculations to ½RT mono-exponential curve fitting of O2Hb, HbDiff and HHb
and found that O2Hb and HbDiff were moderately reliable (in occlusion free methods) but not
HHb, and further suggested the ½RT calculation over mono-exponential curve fitting as it can be
applied to more complex data sets.85,95,103 Based on this literature the ½RT calculation (for both
HbDiff and O2Hb) method was used in this analysis in order to assess the muscle oxidative
metabolism of PFM. All of these previous studies had varying recovery time intervals defining
their ending points, based on Muthalib et al. 2010. As they had the most similar exercise
protocol, we utilized their recovery time interval as 90-seonds following cessation of exercise,
which was also used by DeLorey et al. 2002.97,106

41
Figure 2.7 Example of 1/2RT calculation in control participant. NIRS trace of Right SMVC in control participant and ½RT calculation. Vertical green bars denote the onset and cessation of SMVC contraction.
2.5.4.4 Original adaption of ½RT calculation analysis
As we were investigating a population with impaired motor function due to neurologic
conditions, the typically oxygen saturation response expected to be observed did not always
occur in the study subjects. Rather, with some attempted contractions the inverse of the expected
was observed, in that there would be an increase of oxygenation during the active contraction
phase and desaturation (either returning to baseline or continued desaturation) during the
recovery phase. As it is known that increased saturation means the oxygen supply is greater than
oxygen demand,102 in cases where this atypical saturation pattern was observed it suggests a
hemodynamic response, almost a priming response, to supply the muscle with extra oxygen to
support anticipated oxygen consumption. However, no oxygen consumption occurs (lack of
desaturation during contraction) meaning the PFM are not actively engaging or have a weak
contraction with small oxygen demand, which the oxygen delivery exceeds, then returning to
baseline with the relaxation in recovery phase. The presence of continued desaturation beyond
the baseline levels would suggest an inability to fully relax the PFM after attempted contraction.

42
In cases where saturation patterns did not present with desaturation during contraction but rather
an increase of oxygen saturation with desaturation return to baseline or continued desaturation in
90 second recovery period an Inverse ½RT calculation was used. Inverse ½RT determined as
half the time to reach the difference value between the highest saturation point in HbDiff at end
of contraction and the lowest point of desaturation in the recovery period.
Figure 2.8 Example of inverse 1/2RT calculation in a case participant. NIRS trace of Right SMVC in case participant and Inverse ½RT due to an oxygen saturation pattern, Pattern 8 as per stratification Table 2.1. Vertical green bars denote the onset and cessation of SMVC contraction.
The ½RT of the Right and Left PFM at baseline assessment were compared with paired
sample statistical testing. Likewise, the ½RT of Right and Left PFM at post-PFMT assessment
were compared with paired sample statistical testing. Also, the ½RT of Right PFM at baseline
and post-PFMT assessments and Left PFM at baseline and post-PFMT assessments were
compared with paired sample statistical testing.
2.5.4.5 Unilateral PFM dominance based on ½RT
Unilateral dominance of PFM based on ½RT was calculated to provide a means of
comparison to force plate measurements, WFQ scores and NIRS derived magnitude changes.

43
The calculation was completed by subtracting Left PFM from Right side to give a (+) value for a
quicker Right Sided ½RT and (-) value for a quicker Left Sided ½RT. This was done so that (+)
values for Right sided dominance would correspond with (+) Right sided values for the Fz
Dominance values and WFQ scores. Careful consideration was paid to contraction and recovery
saturation patterns to determine dominance when the patterns did not match, as non-matching
oxygenation patterns could indicate unilateral dominance within itself. For instance, a Right
sided SMVC with oxygen saturation pattern 1 with a concurrent Left sided SMVC with oxygen
saturation pattern 8, would imply a more responsive PFM on the right, regardless if the recovery
time is longer, as it is actually demonstrating oxygen consumption with contraction when the left
side is not. Therefore, the same algorithm, SPAMD (as shown in Figure 2.5), was used to define
unilateral DMag Dominance was also utilized for ½RT Dominance. ½RT Dominance was then
correlated to DisFz, QFz, WFQ and DMag Dominance.
2.5.5 Bladder symptom questionnaires, bladder diaries and post void residual
Intra-group pairwise comparison was performed for questionnaire scores, bladder diary
variables and PVR measures recorded at baseline and post-PFMT. For the bladder diary
comparison n=7 as SS9 did not complete bladder diaries. Inter-group independent parametric and
non-parametric comparisons were performed for QUID (SUI and UUI) and PVR. Inter-group
SSI responses of bladder symptoms improvement were reported as frequency and percentage of
individual group total.

44
2.6 Statistical analysis
Statistical analysis was performed using SPSS version 20. Data sets were analyzed with
shapiro wilk test of normality to determined when parametric or non-parametric statistical testing
should be employed. When performing independent samples testing the levene’s test was also
performed, secondary to the shapiro wilk test to determine if parametric or non-parametric
statistical testing should be employed. For all statistical testing a p-value of a <0.05 was utilized
to determine significance. As outlined by Mukaka 2012, the following parameters were used to
interpret the size of correlation coefficients: Very high correlation = +0.90 to +1.00, High
correlation = +0.7 to +0.9, Moderate correlation = +0.5 to +0.70, Low correlation +0.30 to
+0.50, Negligible correlation +0.00 to +0.30.107

45
Chapter 3: Results
This chapter will provide a detailed account of the data collected and analyzed in this
research project. Participant demographics and subjective outcome measures will be presented
first. Observational findings regarding oxygen saturation patterns captured by the NIRS probe
will be presented in terms of trends found among controls and among clinical sub-groups within
the case group. Lastly, objective outcome measures derived from the NIRS probe and the PFM
manometer are presented, along with their relation to PFMT adherence.
3.1 Participant demographics
Demographic variables for both participant groups are demonstrated in Table 3.1. The
mean age of controls and the case group was not shown to be statistically significant (p-value
0.05), although the controls on average were younger (mean 42 years compared to mean 51
years). Statistical significance was demonstrated between the parity of the two groups, the case
group having a greater proportion of participants with parity >1 (90.9% compared to 46.7%, p-
value 0.04). No significant differences were found between groups among the rest of the
demographic variables including: BMI, menopause status, life style index of physical activity
and smoking. Full summaries of demographic variables for each group at individual participant
level are provided in Table 3.2 and Table 3.3.

46
DEMOGRAPHICS STUDY SAMPLE n=26 CONTROLS n=15 CASES n=11 P-VALUE
AGE mean +SD
range
46 +14
(24 to 72)
42 +15
(24 to 71)
51 +11
(35 to 72)
.05
BMI
mean +SD range
24.6 +5.2
(19.2 to 41.5)
23.5 +3.7
(19.2 to 33.7)
26.0 +6.8
(41.5 to 19.8)
.37
PARITY 0
>1
9 (34.6%)
17 (65.4%)
8 (53.3%) 7 (46.7%)
1 (9.1%)
10 (90.9%)
.04
MENOPAUSE Pre
Post
17(65.4%) 9 (34.6%)
10 (66.7%) 5 (33.3%)
7(63.6%) 4 (36.3%)
1.00
LIFE STYLE INDEX Sedentary Moderate
Active
3 (11.5%) 9 (34.6%)
14 (53.8%)
1 (0.07%) 5 (33.3%) 9 (60.0%)
2 (18.2%) 4 (36.4%) 5 (45.5%)
.41
SMOKING Non-Smoker
Smoker
24 (92.3%) 2 (0.08%)
14 (93.3%) 1 (0.07%)
10 (90.9%) 1 (0.09%)
1.00
Table 3.1 Demographics of study sample by participant group. Mann-Whitney U-test with (2-tailed) performed for the variables: age, BMI (kg/m2) and life style index. Fischer’s Exact test (2-tailed) was performed for the variables: parity, menopause and smoking. Grouped menopause peri status into pre (only one peri-menopause status in case group). Parity grouped as nulliparous and parity>1, (parity range 0-3 for both groups).
PARTICIPANT AGE BMI PARITY MENOPAUSE ETIOLOGY of PFM
DYSFUNCTION LIFE STYLE
INDEX SMOKER
SS1 72 25.5 3 POST Post-Polio Syndrome MODERATE NO
SS3 42 22 1 PRE Non-Traumatic SCI (benign tumor in spine hemorrhage, persisting arachnoiditis) ASIA-B
ACTIVE NO
SS4 53 25.4 1 PRE Traumatic SCI (T8 incomplete paraplegia ASIA-D)
MODERATE NO
SS5 63 24.5 2 POST Multiple Sclerosis (secondary progressive)
MODERATE NO
SS7 59 20.2 1 POST Traumatic SCI (L4-L5 incomplete) & Subsequent TBI
SEDENTARY NO
SS9 48 22.3 1 PRE Labour Trauma ACTIVE YES SS10 45 25.3 1 PRE Labour Trauma ACTIVE NO
SS11 42 23.7 2 PRE Labour Trauma & Congenital Right Hip Dysplasia
ACTIVE NO
SS12 35 36.3 0 PRE Multiple Sclerosis (relapse-remitting)
MODERATE NO
SS13 57 41.5 3 POST
Spinal Stenosis (L4) & Congenital bilateral hip dysplasia (multiple surgical interventions)
SEDENTARY NO
SS14 45 19.8 2 PERI Traumatic SCI (C2-C4 incomplete) & Concurrent TBI
ACTIVE NO
Table 3.2 Demographic details of case participants listed by participant ID.

47
PARTICIPANT AGE BMI PARITY MENOPAUSE LIFE STYLE INDEX SMOKER
CS1 30 20.7 0 PRE ACTIVE NO
CS2 32 26.8 0 PRE MODERATE NO
CS3 32 33.7 0 PRE SEDENTARY NO
CS4 71 23.1 3 POST ACTIVE NO
CS5 56 19.2 3 POST MODERATE NO
CS6 24 26.9 0 PRE MODERATE NO
CS7 60 24 1 POST MODERATE NO
CS8 34 20.2 2 PRE MODERATE NO
CS9 30 22.6 0 PRE ACTIVE YES
CS10 31 22.4 0 PRE ACTIVE NO
CS11 62 22.1 2 POST ACTIVE NO
CS12 38 23.7 1 PRE ACTIVE NO
CS13 58 19.5 2 POST ACTIVE NO
CS14 32 24.7 0 PRE ACTIVE NO
CS15 33 22.5 0 PRE ACTIVE NO Table 3.3 Demographic details of control participants listed by participant ID.
3.2 Questionnaires, post void residual and bladder diary outcome measures
3.2.1 Intra-group comparison
A reduction in mean values for both control and case groups is demonstrated from
baseline to post-PFMT for all questionnaires and PVR, (Table 3.4). These reductions only
demonstrated to be statistically significant for one questionnaire variable among the case group,
and this was the QUID-UUI score (Figure 3.1). Although the case group demonstrated less
urgency symptoms as per reduction in the QUID-UUI score, there were no statistical differences
found for all variables measured in the 3-day bladder diaries completed at baseline and post-
PFMT. Results shown in Table 3.5.

48
Participant Group Variable Baseline Post-PFMT P-value Controls n=13 QUID-SUI
mean +SD range
1.46 +1.56
(0 to 5)
0.85 +0.80
(0 to 2)
.25 NP
QUID-UUI mean +SD
range 1.92 +2.66
(0 to 8) 1.23 +1.48
(0 to 4)
.55 NP
PVR (ml) mean +SD
range
48.23 +41.38
(0 to 138)
47.69 +55.55
(0 to 200)
.96
Cases n=8 UDI-6
mean +SD range
33.85 +9.82
(16.67 to 45.83)
30.73 +12.19
(12.50 to 50.00)
.31 NP
IIQ-7 mean +SD
range
35.08 +27.14
(0.00 to 66.60)
26.87 +24.98
(0.00 to 61.84)
.20
QUID-SUI mean +SD
range 4.75 +3.37 (0 to 11)
2.75 +2.25 (0 to 6)
.08
QUID-UUI mean +SD
range 7.5 +3.89 (1 to 14)
5.0 +2.33 (1 to 7)
.03
PVR (ml) mean +SD
range
51.00 +55.54 (13 to 175)
16.50 +13.40
(0 to 40)
.44 NP
Table 3.4 Intra-group comparison of questionnaires and PVR. Intra-group comparison of questionnaires and PVR measures at baseline and post-PFMT assessments. Parametric and non-parametric paired sample tests performed. NP denotes when non-parametric performed with Wilcoxin Signed Rank test (2-tailed).
Figure 3.1 Case group QUID-UUI score reduction. Case group demonstrated statistically significant (p-value 0.03) reduction in QUID-UUI score at post-PFMT compared to baseline score. * indicates statistical significance.
0
2
4
6
8
10
12
14
16
Baseline Post-PFMT
QU
ID-U
UI S
core
SS1
SS3
SS7
SS9
SS10
SS12
SS13
SS14
*

49
Variable Baseline Post-PFMT P-value
Frequency (mean count) mean +SD
range
6.74 +1.66
(4.5 to 9.00)
7.29 +1.68
(4.67 to 9.67)
.22
DVVmax (ml) mean +SD
range
416.67 +179.83
(200.00 to 733.33)
408.33 +166.18
(150.00 to 66.67)
.88
Nocturia (mean count) mean +SD
range
0.74 +0.88
(0.00 to 2.00)
0.26 +0.27
(0.00 to 0.67)
.37NP
Incontinence (mean count) mean +SD
range
0.67 +0.67
(0.00 to 2.00)
0.60 +1.29
(0.00 to 3.50)
.82
Table 3.5 Case group 3-day bladder diary variables. Comparison of recorded measures from 3-day bladder diaries completed by case group at baseline and post-PFMT. N=7 (SS9 did not complete bladder diaries). Parametric and non-parametric Paired Sample tests performed. NP denotes when non-parametric performed with Wilcoxin Signed Rank test (2-tailed). DVVmax indicates the maximum volume of one void per day. 3.2.2 Inter-group comparison of questionnaires and post void residual
Inter-group comparisons for QUID (SUI and UUI) and PVR did not demonstrate a
statistically significant difference in measured improvement from baseline to post-PFMT
assessment. Results demonstrated in Table 3.6. Results of the SSI inter-group comparison also
did not demonstrate statistical difference in how both groups subjectively rated their bladder
symptoms post-PFMT. Among the control group 6 out 13 (46.15%) reported feeling “continent”,
1 out of 13 (7.69%) reported feeling “almost continent”, 2 out of 13 (15.38%) reported feeling
“improved” and 4 out of 13 (30.77%) reported feeling “unchanged” on the SSI at post-PFMT
assessment. Among the case group 1 out of 8 (12.5%) reported feeling “continent”, 4 out of 8
(50.00%) reported feeling “improved” and 3 out of 8 (37.50%) reported feeling “unchanged” on
the SSI at post-PFMT assessment.

50
Variable Controls n=13 Cases n=8 P-value QUID-SUI
mean +SD range
-0.61 +1.56
(-4 to 2)
-2.00 +2.73
(-7 to 2)
.15
QUID-UUI mean +SD
range
-0.69 +2.53
(-6 to 3)
-2.50 +2.56
(-7 to 1)
.13
SSI mean +SD
range
3.69 +1.38
(2 to 5) 3.06 +0.90
(2 to 5) .22NP
PVR (ml) mean +SD
range
-0.54 +37.08 (-58 to 78)
-34.5 +64.33 (-175 to 13)
.14
Table 3.6 Inter-group SSI comparison. Inter-group comparison for QUID (SUI and UUI), SSI and PVR. PVR values represented are that of the change in score calculated by subtracting post-PFMT score from baseline score. Independent T-Tests (2-tailed) performed. NP denotes when Mann-Whitney U-test (2-tailed) performed.
3.3 Force plate, WFQ and NIRS dominance outcome measures
3.3.1 Intra-group comparison
During intra-group comparison the controls demonstrated a statistically significant highly
positive correlation between DisFz and QFz lower limb dominance, (rs= 0.83, p-value <0.001),
with no demonstrated difference between the values measured during either standing condition,
data shown in Table 3.7-3.8 and Figure 3.2. No positive correlation was demonstrated between
lower limb dominance and NIRS PFM dominance measures for controls, but a moderate inverse
association was demonstrated between QFz and baseline DMag Dom, refer to Table 3.9.
Although the case group suggested a moderately positive correlation between DisFz and
QFz lower limb dominance it was not statistically significant (rs= 0.61, p-value 0.06), suggesting
more variability in standing posture between the two conditions even though the pairwise
comparison did not demonstrate show any difference. Findings shown in Table 3.7-3.8 and
Figure 3.2. Similar to controls the case group did not demonstrate any correlation between lower

51
limb dominance and NIRS PFM dominance measures, refer to Table 3.9, suggesting lower limb
dominance measures did not translate to unilateral PFM dominance. Also, no correlation was
demonstrated between lower limb dominance and NIRS dominance variables at post-PFMT.
Participant Group n Variables Mean +SD P-value
Controls 14 DisFz
QFz 0.11 +0.20 0.09 +0.17
0.17
Cases 10 DisFz
QFz -0.07 +0.09 -0.05 +0.08
0.85NP
Table 3.7 Intra-group Fz lower limb dominance comparison. Intra-group comparison of DisFz and QFz measures of lower limb dominance. Parametric and non-parametric Paired Sample tests performed. NP denotes when non-parametric performed with Wilcoxin Signed Rank test (2-tailed).
Participant Group n Variables Correlation Coefficient P-value Controls 14 DisFz vs QFz rs = 0.83 <0.001 14 DisFz vs WFQ rs = -0.38 0.18 14 QFz vs WFQ rs = -0.45 0.10 Cases 10 DisFz vs QFz rs = 0.61 0.06 10 DisFz vs WFQ rs = 0.08 0.82 10 QFz vs WFQ rs = 0.21 0.57
Table 3.8 Intra-group Fz and WFQ lower limb dominance correlation. Intra-group correlation between Fz and WFQ measures of lower limb dominance. Non-parametric Spearman Rank correlation performed for all variables.
Figure 3.2 Intra-group DisFz and QFz association. Intra-group association between Distracted stance ground reaction force lower limb dominance (DisFz) and Quiet stance ground reaction force lower limb dominance (QFz). Positive value indicates right lower limb dominance and negative value indicates left lower limb dominance. Blue represents controls (rs= 0.83, p-value = <0.001). Orange represents case group (rs= 0.61, p-value = 0.06). * indicates statistical significance.

52
Participant Group n Variables Correlation Coefficient P-value Controls 12 DisFz vs Baseline ½RT Dom rs = 0.00 1.00 12 DisFz vs Baseline DMag Dom rs = -0.36 0.25 12 QFz vs Baseline ½RT Dom rs = -0.15 0.63 12 QFz vs Baseline DMag Dom rs = -0.64 0.03 12 WFQ vs Baseline ½RT Dom rs = 0.29 0.37 12 WFQ vs Baseline DMag Dom rs = 0.18 0.57 Cases 9 DisFz vs Baseline ½RT Dom rs = 0.40 0.29 9 DisFz vs Baseline DMag Dom rs = -1.00 0.80 9 QFz vs Baseline ½RT Dom rs = 0.48 0.19 9 QFz vs Baseline DMag Dom rs = -0.07 0.87 9 WFQ vs Baseline ½RT Dom rs = 0.12 0.76 9 WFQ vs Baseline DMag Dom rs = -0.48 0.19
Table 3.9 Intra-group Fz, WFQ and NIRS dominance correlations. Intra-group correlation between Fz, WFQ lower limb dominance measures and NIRS PFM dominance measures. Non-parametric Spearman Rank correlation performed for all variables.
3.3.2 Inter-group comparison
When performing inter-group comparisons there was a statistically significant difference
in the lower limb dominance in both DisFz and QFz conditions. On average the controls
demonstrated predominant Right lower limb dominance and the case group demonstrated
predominant Left lower limb dominance, which remained consistent for both DisFz and QFz
conditions (0.11 compared to -0.07, and 0.09 compared to -0.05, respectively). Findings shown
in Table 3.10 and Figure 3.3. However, it should be noted that there were 2 significant outliers in
the control group (CS6 and CS7), who demonstrated a large degree of dominance, which
remained consistent across both standing conditions.

53
Variable Controls n=14 Cases n=10 P-value DisFz
mean +SD range
0.11 +0.20
(-0.05 to 0.58)
-0.07 +0.09
(-0.25 to 0.06)
<.01
QFz mean +SD
range
0.09 +0.17
(-0.07 to 0.48)
-0.05 +0.08
(-0.22 to 0.06)
<.01
WFQ mean +SD
range
9.5 +6.36
(-3.00 to 20.00)
7.30 +9.88
(-16.00 to 17.00)
.69
Controls n=12 Cases n=10 Baseline ½RT Dominance
mean +SD range
4.96 +12.21
-0.80 to 43.40
-3.39 +25.10
-57.00 to 33.90
0.47
Baseline DMag Dominance mean +SD
range
1.12 +6.03
-6.04 to 11.03
-2.10 +4.39
-12.51 to 2.80
0.46
Controls n=11 Cases n=7 Post-PFMT ½RT Dominance
mean +SD range
1.67 +23.66
-42.80 to 61.40
-7.56 +26.92
-60.80 to 28.00
0.47
Post-PFMT DMag Dominance mean +SD
range
1.85 +7.02
-9.27 to 15.81
-6.69 +13.00
-34.23 to 3.58
0.18
Table 3.10 Inter-group Fz, WFQ and NIRS dominance comparison. Inter-group comparison of lower limb dominance and PFM dominance measures. Non-parametric Mann-Whiney U T-tests (2-tailed) performed.
Figure 3.3 Inter-group DisFz and QFz comparison. Inter-group comparison between Fz measures of lower limb dominance. Error bars represent + 1 SD. * indincates statistical significance. Distracted stance ground reaction force lower limb dominance (DisFz) and Quiet stance ground reaction force lower limb dominance (QFz). Positive value indicates right lower limb dominance and negative value indicates left lower limb dominance. Statistically significant difference between groups for both DisFz and QFz variables (p-value < 0.01).

54
3.4 NIRS observational outcome findings
3.4.1 Observational NIRS findings
Based on the inter-group observational trends the case group demonstrated more complex
NIRS tracings during measurements, reflected by atypical muscle tissue contraction and recovery
hemodynamic patterns, resulting in slower ½RT and decreased DMag changes on average.
(Please refer to Table 3.12 and 3.14, and Figures 3.20-3.21). Similarly, the exploratory findings
of Ryan et al. 2014, also suggested that individuals with a neurologic condition (amyotrophic
lateral sclerosis), tended to have slower ½RT than controls.53 It should be noted that this
research group used ½RT calculations based on occlusion NIRS methods and TSI%.
To demonstrate the observational trends found between the control and case groups
during PFM assessment an example of control participant NIRS tracings are provided,
evidencing typical hemodynamic response of muscle contraction and recovery patterns.
Following these typical hemodynamic tracings found among the control group a series of case
participant NIRS tracings are presented. Due to large heterogeneity the case group tracings were
further categorized into relevant clinical sub-groups based on NIRS tracing trends characterized
by etiology of PFM dysfunction and mobility status.
3.4.1.1 Control group trends
With each attempted contraction desaturation is demonstrated with resaturation occurring
in recovery, consistent with skeletal muscle oxygenation patterns in response to exercise as
described in previous literature.93,95,99 The following Figures: 3.4 to 3.8, demonstrate the typical
PFM response during the NIRS assessment.

55
Figure 3.4.A. Control participant CS1 performing MVCs. NIRS traces include 10 seconds prior to contraction and 10 seconds after contraction.
Figure 3.4.B. Control participant CS1 performing SMVC. NIRS traces include 10 seconds prior to contraction and 10 seconds after contraction. Black dotted lines denote contraction onset and cessation.
Figure 3.4.C. Control participant CS1 performing REP. NIRS traces include 10 seconds prior to contraction and 10 seconds after contraction. Black dotted lines denote contraction onset and cessation.
Figure 3.4 Control participant CS1 performing MVCs, SMVC and REP.

56
Figure 3.5 Control participant CS1 performing SMVC at baseline and post-PFMT. NIRS traces include 10 seconds prior to contraction and 10 seconds after contraction. Black dotted lines denote contraction onset and cessation.
Figure 3.6.A Control participant CS1 SMVC oxygenation patterns at baseline. Bilateral PFM HbDiff oxygenation patterns during SMVC at baseline. Starting at contraction onset and inclusive of last 10 deciseconds following end of contraction.
Figure 3.6.B Control participant CS1 SMVC oxygenation patterns at post-PFMT. Bilateral PFM HbDiff oxygenation patterns during SMVC at baseline. Starting at contraction onset and inclusive of last 10 deciseconds following end of contraction.
Figure 3.6 Control participant CS1 SMVC oxygenation patterns at baseline and post-PFMT.
-9
-8-7-6
-5-4-3
-2-10
4536 4736 4936
HbD
iff C
once
ntra
tion
umol
Time in Deciseconds
SMVC Baseline
Right PFM Left PFM
-14
-12
-10
-8
-6
-4
-2
0
4872 4922 4972 5022 5072
HbD
iff C
once
ntra
tion
umol
Time in Deciseconds
SMVC Post-PFMT
Right PFM Left PFM

57
Figure 3.7 Control participant CS7 performing SMVC at baseline and post-PFMT. NIRS traces include 10 seconds prior to contraction and 10 seconds after contraction. Black dotted lines denote contraction onset and cessation.
Figure 3.8.A Control participant CS7 SMVC oxygenation patterns at baseline. Bilateral PFM HbDiff oxygenation patterns during SMVC at baseline. Starting at contraction onset and inclusive of last 10 deciseconds following end of contraction.
Figure 3.8.B Control participant CS7 SMVC oxygenation patterns at post-PFMT. Bilateral PFM HbDiff oxygenation patterns during SMVC at baseline. Starting at contraction onset and inclusive of last 10 deciseconds following end of contraction.
Figure 3.8 Control participant CS7 SMVC oxygenation patterns at baseline and post-PFMT.
-15-13-11
-9-7-5-3-11
5607 5807 6007 6207 6407HbD
iff C
once
ntra
tion
umol
Time in Deciseconds
SMVC Baseline
Right PFM Left PFM
-25
-20
-15
-10
-5
0
9104 9604 10104 10604 11104HbD
iff C
once
ntra
tion
umol
Time in Deciseconds
SMVC Post-PFMT
Right PFM Left PFM

58
3.4.1.2 Case group trends
There was large heterogeneity among sampled population in their underlying etiology for
PFM dysfunction (as described in Table 3.2). This heterogeneity resulted in observation of
diverse PFM oxygenation patterns in response to exercise during NIRS assessments.
Observational trends of the oxygenation patterns were categorized according to clinical sub-
groups. Clinical sub-groups were categorized based on consideration of underlying etiology of
PFM dysfunction and mobility status. Mobility status was categorized in the following manner:
high mobility (not dependent on mobility aid), assisted mobility (dependent on mobility aid with
limited ability of independent ambulation), wheelchair user (wheelchair used for primary mode
of mobility). The high mobility group included four case participants (SS9, SS10, SS11, SS13,
SS14) and had the following underlying etiology for PFM dysfunction: labour trauma, congenital
hip dysplasia, traumatic SCI. The specific etiology of PFM dysfunction of each participant
within the high mobility group can be referred to in Table 3.2.
Despite participant SS12 having high mobility status, the oxygenation trends presented
more similarly to other participant, SS5, both presenting with the immune mediated neurologic
condition of multiple sclerosis (MS). Although both had MS, this neurologic condition results in
varying clinical presentations and diagnoses. SS12 had relapse-remitting MS with high mobility
and SS5 had secondary progressive MS and was as a wheelchair user. Both presented with
similar atypical characteristics, but also presented with similarity trends overlapping with the
SCI clinical sub-group. However, due to their underlying etiology of an immune mediated
neurological condition, they were categorized independently for initial observational
characterization of oxygenation pattern trends.

59
The final clinical sub-group were participants with SCI who had either assisted mobility
or were wheelchair users, which included SS3, SS4, SS7, (refer to Table 3.2 for specific
etiology). Specific to mobility status, SS3 was a wheelchair user, whereas SS4 and SS7 were
considered to have assisted mobility status.
3.4.1.2.1 High mobility clinical sub-group
Those participants in the high mobility group tended to demonstrate PFM oxygenation
patterns similar to that of the control group, generating desaturation with contraction and
resaturation during recovery phase, and exhibited on bilateral PFM. Figures 3.9-3.10
demonstrate the oxygenation patterns observed in a participant with labour trauma, congenital
dysplasia of the right hip and LUTS, with unimpaired mobility (SS11). The NIRS assessment
with this participant demonstrated typical saturation patterns, as compared to controls. Similar
tracings were also demonstrated by SS13, who had underlying spinal stenosis, congenital hip
dysplasia and multiple bilateral hip replacement surgeries, with minimal cane assisted mobility.
Similar tracings were also demonstrated by SS14. This participant has a history
incomplete traumatic C2-C4 SCI (no current ASIA score), but independent unassisted mobility,
decreased sensation to pelvis with self-reported hypersensitivity and hyper-reflexes of bilateral
lower limbs. As shown in Figure 3.11-3.12, SS14, demonstrates typical desaturation during
contraction with resaturation in recovery, similar to control group. At post-PFMT assessment
greater desaturation evidenced during contraction and resaturation in recovery is observed.
Furthermore, despite a discrepancy in magnitude change, the contraction patterns evidence
similar curve characteristics bilaterally, see Figure 3.12.

60
SS9 and SS10 were also considered to have high mobility, and both had an underlying
etiology of labour trauma. Interestingly, their NIRS tracings had boarder line trends between the
high mobility and assisted mobility clinical sub-groups. Although both displayed typical
patterning at post-PFMT, the characteristics of the patterning was less similar across bilateral
PFM, a characteristic trend found among the SCI assisted mobility group, as demonstrated in
Figure 3.19.

61
Figure 3.9.A. Case participant SS11 performing MVCs NIRS traces include 10 seconds prior to contraction and 10 seconds after contraction.
Figure 3.9.B. Case participant SS11 performing SMVC NIRS traces include 10 seconds prior to contraction and 10 seconds after contraction. Black dotted lines denote contraction onset and cessation.
Figure 3.9.C. Case participant SS11 performing REP NIRS traces include 10 seconds prior to contraction and 10 seconds after contraction. Black dotted lines denote contraction onset and cessation.
Figure 3.9 Case participant SS11 performing MVCs, SMVC and REP.

62
Figure 3.10 Case participant SS11 SMVC oxygenation patterns at baseline. Bilateral PFM HbDiff oxygenation patterns during SMVC at baseline. Starting at contraction onset and inclusive of last 10 deciseconds following end of contraction.
Figure 3.11 Case participant SS14 performing SMVC at baseline and post-PFMT. Case participant SS14 with traumatic SCI, SS14, performing SMVC at baseline and post-PFMT assessment. NIRS traces include 10 seconds prior to contraction and 10 seconds after contraction. Black dotted lines denote contraction onset and cessation.
-5
-4
-3
-2
-1
0
1
4699 4719 4739 4759 4779HbD
iff C
once
ntra
tion
umol
Time in Deciseconds
SMVC Baseline
Right PFM Left PFM

63
Figure 3.12.A. Case participant SS14 SMVC oxygenation patterns at baseline. Bilateral PFM HbDiff oxygenation patterns during SMVC at baseline. Starting at contraction onset and inclusive of last 10 deciseconds following end of contraction.
Figure 3.12.B. Case participant SS14 SMVC oxygenation patterns at post-PFMT. Bilateral PFM HbDiff oxygenation patterns during SMVC at baseline. Starting at contraction onset and inclusive of last 10 deciseconds following end of contraction.
Figure 3.12 Case participant SS14 SMVC oxygenation patterns at baseline and post-PFMT.
3.4.1.2.2 Multiple Sclerosis clinical sub-group
MS is a very complex auto-immune mediated disease attacking the central nervous
system. This progressive disease causes cell death as chronic inflammation of immune cell
infiltrates form plaques in the central nervous system, resulting in demyelination and axonal
transection.108,109 Due to this pathology the neurological deficits incurred present in a
heterogeneous manner across MS subtypes and across individuals, but often include: autonomic
and sensorimotor defects, ataxia, lower urinary tract symptoms, fatigue, visual disturbances and
cognitive difficulties.109-113 Exercise training is a common therapy used in the MS population to
help manage symptoms and promote quality of life.114,115 Ataxia and sensorimotor defects
typically cause unilateral asymmetries in muscular function,110,116 which result in dominant
muscles taking on more of the workload during functional tasks and exercise.111 Therefore,
-5
-4
-3
-2
-1
0
1
4466 4516 4566 4616HbD
iff C
once
ntra
tion
umol
Time in Deciseconds
SMVC Baseline
Right PFM Left PFM
-50
-40
-30
-20
-10
0
5475 5495 5515 5535
HbD
iff C
once
ntra
tion
umol
Time in Deciseconds
SMVC Post-PFMT
Right PFM Left PFM

64
exercise therapy in the MS population not only aims to improve muscular strength and endurance
but also targets discoordination and muscular imbalances found with unilateral
asymmetries.111,112,116,117 As such it was expected that NIRS would capture muscular
discoordination and asymmetry in the bilateral PFM during exercise.
Figures 3.13-3.15 demonstrate oxygenation patterns observed in a participant with
relapse-remitting MS (SS12). At the time of NIRS assessments participant was not experiencing
relapse symptoms, although they did occur during the intervention phase and subsequently
remitted. Such symptoms reported by participant were impaired sensation to perineum, abdomen,
and bilateral lower limbs. Participant did not present with mobility issues and did not use any
mobility aids.
SS5 had secondary progressive MS and a wheelchair user, with inability to support
sustained weight bearing on lower limbs. For both MS participants atypical pattern presentation
during SMVC was noted with increase in oxygenation during contraction, although SS12
demonstrated a return to baseline or increased oxygenation in recovery and SS5 demonstrated
increase during contraction with return to baseline or continued desaturation in recovery.
However, both demonstrated typical patterning with REP contractions.
Although both MS participants shared these similarities in patterning, individually they
shared characteristics similar to the SCI clinical sub-group. SS5 demonstrated trends similar to
SS4 and SS7, SCI assisted mobility sub-group, in that atypical patterning was consistent across
different contractions with unilateral discrepancy, as shown in Figure 3.19. In contrast, SS12,
demonstrated patterning characteristics similar to SS3, SCI assisted mobility sub-group, in that
they both demonstrate an apparent lack of response unilateral PFM during attempted contraction,
as shown in Figure 3.14 and 3.17.

65
Figure 3.13.A. Case participant SS12 performing MVCs at baseline. SS12 in MS clinical sub-group. NIRS traces include 10 seconds prior to contraction and 10 seconds after contraction.
Figure 3.13.B. Case participant SS12 performing SMVC at baseline. SS12 in MS clinical sub-group. NIRS traces include 10 seconds prior to contraction and 10 seconds after contraction. Black dotted lines denote contraction onset and cessation.
Figure 3.13.C. Case participant SS12 performing REP at baseline. SS12 in MS clinical sub-group. NIRS traces include 10 seconds prior to contraction and 10 seconds after contraction. Black dotted lines denote contraction onset and cessation.
Figure 3.13 Case participant SS12 performing MVCs, SMVC and REP.

66
Figure 3.14 Case participant SS12 performing SMVC at baseline and post-PFMT. SS12 in MS clinical sub-group. NIRS traces include 10 seconds prior to contraction and 10 seconds after contraction. Black dotted lines denote contraction onset and cessation.
Figure 3.15.A. Case participant SS12 SMVC oxygenation patterns at baseline. SS12 in MS clinical sub-group. Bilateral PFM HbDiff oxygenation patterns during SMVC at baseline. Starting at contraction onset and inclusive of last 10 deciseconds following end of contraction.
Figure 3.15.B. Case participant SS12 SMVC oxygenation patterns at post-PFMT. SS12 in MS clinical sub-group. Bilateral PFM HbDiff oxygenation patterns during SMVC at baseline. Starting at contraction onset and inclusive of last 10 deciseconds following end of contraction.
Figure 3.15 Case participant SS12 SMVC oxygenation patterns at baseline and post-PFMT.
-1
0
1
2
3
4
5
6
7
4541 4561 4581 4601
HbD
iff C
once
ntra
tion
umol
Time in Deciseconds
SMVC Baseline
Right PFM Left PFM
0
0.2
0.4
0.6
0.8
1
1.2
4928 4948 4968 4988
HbD
iff C
once
ntra
tion
umol
Time in Deciseconds
SMVC Post-PFMT
Right PFM Left PFM

67
3.4.1.2.3 SCI Clinical Sub-group
The NIRS observations in this clinical sub-group varied based on mobility status, in that
those with assisted mobility tended to generate more responsive NIRS tracings than the
wheelchair user, SS3, who presented with history of incomplete non-traumatic SCI at T10-12
ASIA-B, and self-reported increased sensation to left side. At both baseline and post-PFMT
assessments SS3 patterning is characterized by an apparent lack of response in unilateral Right
PFM with atypical patterning in the Left PFM, as shown in Figures 3.16-3.18.
SS4 presented with incomplete traumatic SCI at T8-T12 ASIA-D, self-reported increased
sensation in left lower limb compared to right and assisted mobility status. SS4 demonstrates
some apparent typical saturation pattern in contraction, although it is complex. As it is slower to
present on one side compared to the other and at low magnitude. Refer to Figure 3.19. There is
almost a biphasic contraction response (initial increase wit transition to decrease during
contraction), which is also suggested in SS3 left PFM at baseline. However, the larger degree of
magnitude change, in SS4 compared to SS3, with desaturation occurring in contraction, suggests
pattern characteristics more similar to the high mobility than the SCI wheelchair user.
However, the atypical and bilateral variability in oxygen patterns presenting during
recovery period, along with less stable resting periods prior to contractions is observed to be
similar of those trends seen in MS participants. SS7 demonstrated similar trends as observed in
SS4.

68
Figure 3.16 Case participant SS3 performing SMVC at baseline including full recovery time interval. Case participant in SCI clinical sub-group. Black boxes indicate beginning and end of SMVC contraction.
Figure 3.17 Case participant SS3 performing SMVC at baseline and post-PFMT. Case participant in SCI clinical sub-group. NIRS traces include 10 seconds prior to contraction and 10 seconds after contraction. Black dotted lines denote contraction onset and cessation.

69
Figure 3.18.A. Case participant SS3 SMVC oxygenation patterns at baseline. Case participant in SCI clinical sub-group. Bilateral PFM HbDiff oxygenation patterns during SMVC at baseline. Starting at contraction onset and inclusive of last 10 deciseconds following end of contraction.
Figure 3.18.B. Case participant SS3 SMVC oxygenation patterns at post-PFMT. Case participant in SCI clinical sub-group. Bilateral PFM HbDiff oxygenation patterns during SMVC at baseline. Starting at contraction onset and inclusive of last 10 deciseconds following end of contraction.
Figure 3.18 Case participant SS3 SMVC oxygenation patterns at baseline and post-PFMT.
Figure 3.19.A. Case participant SS4 SMVC at baseline. Case participant in SCI clinical sub-group. NIRS traces include 10 seconds prior to contraction and 10 seconds after contraction. Black dotted lines denote contraction onset and cessation.
Figure 3.19.B. SS4 SMVC oxygenation patterns at baseline. Case participant in SCI clinical sub-group. Bilateral PFM HbDiff oxygenation patterns during SMVC at baseline. Starting at contraction onset and inclusive of last 10 deciseconds following end of contraction.
Figure 3.19 Case participant SS4 SMVC at baseline.
-2.5-2
-1.5-1
-0.50
0.51
1.52
5396 5446 5496HbD
iff C
once
ntra
tion
umol
Time in Deciseconds
SMVC Baseline
Right PFM Left PFM
-0.5
0
0.5
1
1.5
2
5929 5949 5969 5989HbD
iff C
once
ntra
tion
umol
Time in Deciseconds
SMVC Post-PFMT
Right PFM Left PFM
-6-4-202468
1012
4664 4764 4864 4964
HbD
iff C
once
ntra
tion
umol
Time in Deciseconds
SMVC Baseline
Right PFM Left PFM

70
3.5 NIRS objective outcome measures
3.5.1 ½RT NIRS measurements
3.5.1.1 Intra-group ½RT comparison
When comparing intra-group ½RT at baseline only the control group demonstrated a
statistically significant difference bilaterally (p-value 0.02). On average the control group had
faster ½RT in the Right PFM compared to the Left PFM, (6.30seconds and 11.39seconds,
respectively). Despite having quicker ½RT in the Right PFM, Right and Left PFM ½RT had
high positive correlation (rs=0.76) at baseline. The control group did not demonstrate any
significant difference or association in bilateral PFM ½RT at post-PFMT. Nor was any
significant difference or association found in unilateral PFM ½RT or in ½RT Dominance across
baseline and post-PFMT assessments. Refer to Table 3.11.
Intra-group comparison for the case group demonstrated a moderate positive correlation
of bilateral PFM ½RT at baseline (rs= 0.68). The case group also demonstrated high positive
correlation between baseline and post-PFMT ½RT Dominance (r= 0.91). No other significant
findings were demonstrated among the case group when analyzing bilateral PFM ½RT at
baseline and post-PFMT, unilateral PFM ½RT across baseline and post-PFMT, or in ½RT
Dominance across baseline and post-PFMT. Refer to Table 3.11.
3.5.1.2 Inter-group ½RT comparison
Statistically significant differences were found among the ½RT of the Right PFM at
baseline, where the control group demonstrated on average faster recovery times than the case
group (mean ½RT 6.30seconds and 18.90seconds, p-value <0.01), as shown in Table 3.12 and

71
Figure 3.20. Although the control group also on average demonstrated faster ½RT in the Left
PFM as well, the difference between the two groups was not statistically significant.
Furthermore, the control group demonstrated significantly less unilateral ½RT Dominance at
baseline than the case group, (5.16 compared to 17.41, p-value < 0.01)
At post-PFMT statistical significance was demonstrated between control and case groups
for Right PFM ½RT, providing evidence that the case group had slower ½RT unilateral in Right
PFM compared to the control group, (7.87seconds compared to 38.03seconds, p-value 0.01).
Results shown in Table 3.12. Similar to the baseline inter-group comparison, there was no
statistical difference found between groups for the ½RT among the unilateral Left PFM.
Although a statistically significant difference was not determined, the case group on average did
demonstrate slower ½RT in the Left PFM (18.54seconds compared to 9.55seconds).
Interestingly, the significant difference in degree of ½RT Dominance demonstrated at baseline
between the two groups was not maintained at post-PFMT.

72
Participant Group n Variable
Mean +SD Variable
Mean +SD Pairwise P-value
Correlation Coefficient
Correlation P-value
Controls 12 Baseline Right ½RT Baseline Left ½RT
6.30 +9.75 (Lg10)0.59 +0.36 11.39 +21.83 (Lg10)0.76 +0.12 (Lg10) .02 rs= .76 <.01
11 Post-PFMT Right ½RT Post-PFMT Left ½RT
7.87 +13.34 9.55 +18.11 .72NP rs= .44 .17
11 Baseline Right ½RT Post-PFMT Right ½RT
3.66 +1.51 7.87 +13.34 .79NP rs= .18 .59
11 Baseline Left ½RT Post-PFMT Left ½RT
5.33 +2.51 (Lg10)0.66 +0.23 9.55 +18.11 (Lg10)0.69 +0.44 (Lg10) .82 rs= .06 .87
11 Baseline ½RT Dominance Post-PFMT ½RT Dominance
1.46 +1.65 1.67 +23.66 .13NP rs= .11 .76
Cases 10 Baseline Right ½RT
Baseline Left ½RT
18.90 +11.35 19.36 +19.82 .92 rs= .68 .03
7 Post-PFMT Right ½RT Post-PFMT Left ½RT
38.03 +26.93 18.54 +23.09 .12 (Sqrt)r= .45 .31
7 Baseline Right ½RT Post-PFMT Right ½RT
18.59 +10.38 38.03 +26.93 .15 r= -.23 .62
7 Baseline Left ½RT Post-PFMT Left ½RT
18.71 +20.05 18.54 +23.09 .98 (Sqrt)r= .19 .69
7 Baseline ½RT Dominance Post-PFMT ½RT Dominance
-8.20 +25.77 -7.56 +26.92 .89 r= .91 <.01
Table 3.11 Intra-group 1/2RT variables at baseline and post-PFMT. Intra-group comparison of ½RT measurements at baseline and post-PFMT assessments. Parametric and non-parametric Paired Sample tests performed. NP denotes when non-parametric performed with Wilcoxin Signed Rank test (2-tailed). (Lg10) denotes that log base-10 transformation was performed. (Sqrt) denotes that square root transformation was performed.

73
NIRS Variable Controls n=12 Cases n=10 P-value Baseline Right ½RT
mean +SD range
6.30 + 9.75
1.10 – 36.90
18.90 +11.35 2.40 – 33.90
<.01NP
Baseline Left ½RT mean +SD
range
11.39 + 21.83 1.70 – 80.30
19.36 + 19.82 1.60 – 57.00
.34NP
Baseline ½RT Dominance mean +SD
range
5.16 + 12.12 0.00 – 43.40
17.41 + 17.50 2.50 – 57.00
<.01NP
NIRS Variable Controls n=11 Cases n=7 P-value Post-PFMT Right ½RT
mean +SD range
7.87 + 13.34 2.20 – 47.80
38.03 + 26.93 3.00 – 68.60
.01NP
Post-PFMT Left ½RT mean +SD
range
9.55 + 18.11 1.80 – 63.80
18.54 + 23.09 0.90 – 60.80
.47NP
Post-PFMT ½RT Dominance mean +SD
range
10.38 + 21.08 0.00 – 61.40
15.64 + 22.49 0.20 – 60.80
.39NP
Table 3.12 Inter-group 1/2RT variables at baseline and post-PFMT. Inter-group comparison of unilateral PFM NIRS ½RT at baseline and post-PFMT assessments. Parametric and non-parametric Independent Samples T-tests performed. NP demotes when non-parametric Mann-Whitney U-test with (2-tailed) was performed. Absolute values used for dominance variables as comparing the degree of dominance rather than the side of presenting dominance.

74
Figure 3.20 Inter-group 1/2RT variables at baseline and post-PFMT. Inter-group comparison of unilateral PFM NIRS variable ½RT at baseline (top row) and post-PFMT (bottom row). Error bars represent + 1 SD. * indicates statistical significance. For both baseline and post-PFMT Right ½RT significantly reduced in controls (p <0.01 and 0.01, respectively).
3.5.2 DMag NIRS measurements
3.5.2.1 Intra-group DMag comparison
Intra-group association between bilateral PFM of DMag at baseline demonstrated
moderate positive correlation (r= 0.63) among the control group, suggesting that the desaturation
tended to occur similarly in bilateral PFM. However, this association was not statistically
maintained at post-PFMT assessment.

75
Conversely, the case group demonstrated a high positive correlation in association of
unilateral Left PFM DMag across baseline and post-PFMT, as well as for DMag Dominance
across baseline and post-PFMT, (rs= 0.79 and rs= 0.75, respectively).
Neither the control or casegroups demonstrated a statistically significant pairwise
difference for all DMag NIRS variables, for within and across assessment measurements. Refer
to Table 3.13.
3.5.2.2 Inter-group DMag comparison
At baseline assessment the control group demonstrated on average greater for Right and
Left DMag during SMVC contractions, (-7.31 µmol and -1.53 µmol, -5.04 µmol and -2.21µmol,
respectively), however, the difference was not found to be statistically significant.
At post-PFMT statistical significance was demonstrated between control and case groups
for unilateral Right DMag (-10.34 µmol compared to -2.19 µmol, p-value < 0.01). Suggesting the
case group had reduced oxygenation desaturation in unilateral PFM compared to the control
group, results shown in Table 3.14. and Figure 3.21-3.22. Whereas the average DMag of the Left
PFM appeared comparable between both groups.

76
Participant Group n Variables Mean +SD Paired Samples
P-value Correlation Coefficient
Correlation P-value
Controls 12 Baseline Right DMag Baseline Left DMag
-7.30 +7.00 -5.04 +6.98 .22 r= .63 .03
11 Post-PFMT Right DMag Post-PFMT Left DMag
-10.34 +6.17 -8.49 +6.17 .40 rs= .36 .29
11 Baseline Right DMag Post-PFMT Right DMag
-8.38 +6.23 -10.34 +6.17 .30 r= .54 .09
11 Baseline Left DMag Post-PFMT Left DMag
-6.22 +5.92 -8.49 +6.17 .29 rs= .30 .37
11 Baseline DMag Dominance Post-PFMT DMag Dominance
1.54 +6.13 1.85 +7.02 .91 r= .08 .82
Cases 10 Baseline Right DMag
Baseline Left DMag
-1.53 +2.19 -2.21 +6.02 .71 r= .36 .31
7 Post-PFMT Right DMag Post-PFMT Left DMag
-2.19 +5.48 -8.06 +18.23 .33 rs= .00 1.00
7 Baseline Right DMag Post-PFMT Right DMag
-0.79 +2.21 -2.19 +5.48 .57 r= -.13 .78
7 Baseline Left DMag Post-PFMT Left DMag
-2.98 +6.45 -8.06 +18.23 .87NP rs= .79 .04
7 Baseline DMag Dominance Post-PFMT DMag Dominance
-3.23 +4.57 -6.69 +13.00 .87 NP rs= .75 .05
Table 3.13 Intra-group DMag variables at baseline and post-PFMT. Summary of intra-group comparison DMag at baseline and post-PFMT. Parametric and non-parametric Paired Sample tests performed. NP denotes when non-parametric performed with Wilcoxin Signed Rank test (2-tailed). Parametric and non-parametric correlation coefficients performed. rs denotes non-parametric Spearman Rank correlation coefficient.

77
NIRS Variable Controls n=12 Cases n=10 P-value Baseline Right DMag
mean +SD range
-7.31 +7.00
-15.89 – 4.47
-1.53 +2.19 -4.57 – 1.70
.13NP
Baseline Left DMag mean +SD
range
-5.04 +6.98
-13.97 – 8.01
-2.21 +6.02
-14.78 – 6.02
.33
Baseline DMag Dominance
mean +SD range
4.98 +3.54
0.00 – 11.03
3.25 + 3.52
0.88 – 12.51
.25 NP
NIRS Variable Controls n=11 Cases n=7 P-value
Post-PFMT Right DMag mean +SD
range
-10.34 +6.17
-19.63 – -1.05
-2.19 +5.48
-13.10 – 2.55 .01
Post-PFMT Left DMag mean +SD
range
-8.49 +6.17
-23.25 – -2.70
-8.06 +18.23 -47.33 – 7.51
.24NP
Post-PFMT DMag Dominance (Lg10)
mean +SD range
5.38 + 4.61 (Lg10)0.54 + 0.49 0.49 – 15.81 (Lg10) -0.31 – 1.20
8.15 +11.99 (Lg10) 0.53 + 0.66 0.35 – 34.23 (Lg10) -0.46 – 1.53
.97
Table 3.14 Inter-group DMag variables at baseline and post-PFMT. Inter-group comparison of unilateral PFM NIRS DMag at baseline and post-PFMT assessments. Parametric and non-parametric Independent Samples T-tests performed. NP demotes when non-parametric Mann-Whitney U-test with (2-tailed) was performed. Absolute values used for dominance variables as comparing the degree of dominance rather than the side of presenting dominance. Lg10 denotes that log base-10 transformation was performed on baseline and post-PFMT data.

78
Figure 3.21 Inter-group DMag at baseline and post-PFMT. Inter-group comparison of unilateral PFM NIRS variable DMag at baseline (top row) and post-PFMT (bottom row). Error bars represent + 1 SD. * indicates statistical significance. For post-PFMT Right DMag significantly greater in controls (p 0.01).

79
Figure 3.22 Inter-group 1/2RT and DMag dominance at baseline and post-PFMT. Inter-group comparison of unilateral PFM NIRS variables of ½RT and DMag dominance (absolute difference) at baseline (top row) and post-PFMT (bottom row). Error bars represent + 1 SD. 3.5.3 Unilateral PFM ½RT and DMag NIRS Correlation
3.5.3.1 Intra-group comparison
The control group demonstrated a moderately positive correlation (rs= 0.65) at baseline in
the unilateral Left PFM between ½RT and DMag measures, suggesting that quicker ½RT
accompanied greater desaturation changes during SMVC contractions. No other correlation was
determined among ½RT and DMag NIRS variables for unilateral PFM at baseline or post-PFMT
assessments for the control group. Refer to Table 3.15 and Figure 3.23.

80
The case group demonstrated a highly positive correlation (rs= 0.93) at baseline in the
unilateral Right PFM between ½RT and DMag measures, suggesting that quicker ½RT
accompanied greater desaturation changes during SMVC contractions. No other correlation was
determined among ½ RT and DMag NIRS variables for unilateral PFM at baseline or post-PFMT
assessments for the case group. Refer to Table 3.15. and Figures 3.23.
Participant Group
n Variables Mean +SD Correlation Coefficient
Correlation P-value
Controls
12 Baseline Right ½RT Baseline Right DMag
6.30 +9.75 -7.30 +7.00 rs= .46 .14
12 Baseline Left ½RT Baseline Left DMag
11. 39 +21.83 -5.04 +6.98 rs= .65 .02
11 Post-PFMT Right ½RT Post-PFMT Right DMag
7.87 +13.34 -10.34 +6.17 rs= .20 .55
11 Post-PFMT Left ½RT Post-PFMT Left DMag
9.55 +18.11 -8.49 +6.17 rs= .31 .36
Cases
10 Baseline Right ½RT Baseline Right DMag
18.90 +11.35 -1.53 +2.19 rs= .37 .30
10 Baseline Left ½RT Baseline Left DMag
19.36 +19.82 -2.21 +6.02 r= .37 .29
7 Post-PFMT Right ½RT Post-PFMT Right DMag
38.03 +26.93 -2.19 +5.48 rs= .93 <.01
7 Post-PFMT Left ½RT Post-PFMT Left DMag
18.54 +23.09 -8.06 +18.23 rs= .00 1.00
Table 3.15 Intra-group 1/2RT and DMag correlations at baseline and post-PFMT. Intra-group association between ½RT and DMag NIRS variables for unilateral PFM at baseline and post-PFMT assessments. Parametric and non-parametric correlation coefficients (2-tailed) performed. rs denotes non-parametric Spearman Rank correlation coefficient.

81
Figure 3.23.A. Control group Left 1/2RT and DMag correlation at baseline. Spearman rank correlation coefficient rs= 0.65 p-value 0.02, for ½RT and DMag of unilateral left PFM at baseline for control group, n=12.
Figure 3.23.B. Case group Right 1/2RT and DMag correlation at post-PFMT. Spearman rank correlation coefficient rs= 0.93 p-value <0.01, for ½RT and DMag of unilateral right PFM at post-PFMT for case group, n=7.
Figure 3.23 Intra-group correlations for 1/2RT and DMag. 3.6 Manometer objective outcome measures
3.6.1 Within assessment measurements
3.6.1.1 Intra-group manometer comparison
The control group demonstrated positive correlation for all manometer variables for
within assessment measurements. No pairwise difference was found among all manometer
variables for within assessment measurements. Refer to Table 3.16. These findings suggest
reliability of the manometer, which has also been shown in previous literature.83,118-120
The case group demonstrated positive correlation at baseline assessment for manometer
Timesec and at post-PFMT assessment for both Peak cmH2O and Average cmH2O. Refer to Table
3.17. This suggests variability in manometer measurements among the case group. However,
similar to the control and case groups, no pairwise difference was demonstrated for within
-20
-15
-10
-5
0
5
10
15
0 20 40 60 80 100
Left DM
ag µ
mol
Left ½RT in seconds
*
-14
-12
-10
-8
-6
-4
-2
0
2
4
0 20 40 60 80
Righ
t DM
ag µ
mol
Right ½RT in Seconds
*

82
assessment testing of all manometer variables during SMV contractions. Due to these results
only the Pre-NIRS manometer values were used for subsequent statistical analysis.

83
Participant Group n Variables Mean +SD Pairwise
P-value Correlation Coefficient
Correlation P-value
Controls
14 Baseline Peak cmH2O Pre-NIRS Baseline Peak cmH2O Post-NIRS
31.83 +17.29 32.61 +16.79 .66 r= .93 <.001
14 Baseline Average cmH2O Pre-NIRS Baseline Average cmH2O Post-NIRS
22.59 +14.69 20.91 +12.72 .23 r= .94 <.001
14 Baseline Timesec Pre-NIRS Baseline Timesec Post-NIRS
23.09 +15.38 26.39 +25.41 .98NP rs= .58 .03
13 Post-PFMT Peak cmH2O Pre-NIRS Post-PFMT Peak cmH2O Post-NIRS
35.68 +18.40 37.52 +18.16 .49 r= .87 <.001
13 Post-PFMT Average cmH2O Pre-NIRS Post-PFMT Average cmH2O Post-NIRS
23.68 +14.11 22.95 +13.68 .62 r= .93 <.001
13 Post-PFMT Timesec Pre-NIRS Post-PFMT Timesec Post-NIRS
33.52 +50.22 38.28 +58.75 .17 (Lg10) r= .93 <.001
Table 3.16 Within assessment control group PFM manometer variables. Within assessment, control group manometer comparison and association. Parametric and non-parametric Paired Sample tests (2-tailed) performed. NP denotes when non-parametric performed with Wilcoxin Signed Rank test (2-tailed). Parametric and non-parametric correlation coefficients performed. rs denotes non-parametric Spearman Rank correlation coefficient (2-tailed). (Lg10) denotes that log base-10 transformation was performed. (Sqrt) denotes that square root transformation was performed.

84
Participant Group n Variables Mean +SD Pairwise
P-value Correlation Coefficient
Correlation P-value
Cases
11 Baseline Peak cmH2O Pre-NIRS Baseline Peak cmH2O Post-NIRS
13.12 +9.80 (Sqrt) 3.21 +1.76 10.35 +5.34 (Sqrt) 3.02 +1.17 (Sqrt) .66 rs= .29 .39
11 Baseline Average cmH2O Pre-NIRS Baseline Average cmH2O Post-NIRS
8.13 +4.04 (Sqrt) 2.68 +1.01 9.49 +6.94 (Sqrt) 2.73 +1.49 (Sqrt) .83 rs= .19 .58
11 Baseline Timesec Pre-NIRS Baseline Timesec Post-NIRS
13.12 +5.71 19.45 +21.99 .42NP rs= .87 <.001
7 Post-PFMT Peak cmH2O Pre-NIRS Post-PFMT Peak cmH2O Post-NIRS
12.94 +10.61 13.57 +8.08 .67 r= .96 <.01
7 Post-PFMT Average cmH2O Pre-NIRS Post-PFMT Average cmH2O Post-NIRS
9.39 +7.19 8.65 +5.86 .50 r= .93 <.01
7 Post-PFMT Timesec Pre-NIRS Post-PFMT Timesec Post-NIRS
11.89 +7.30 9.53 +5.24 .39 r= .51 0.24
Table 3.17 Within assessment case group PFM manometer variables. Within assessment, case group PFM manometer comparison and association. Parametric and non-parametric Paired Sample tests (2-tailed) performed. NP denotes when non-parametric performed with Wilcoxin Signed Rank test (2-tailed). Parametric and non-parametric correlation coefficients performed. rs denotes non-parametric Spearman Rank correlation coefficient (2-tailed). (Lg10) denotes that log base-10 transformation was performed. (Sqrt) denotes that square root transformation was performed.

85
3.6.2 Across assessment manometer measurements
3.6.2.1 Intra-group manometer comparison
When assessing for PFM strength (as measured by manometer pressure) after the 8-week
PFMT no statistical difference was found in both control and case groups for all manometer
variables. Although there was no significant difference, both groups demonstrated positive
correlation for all manometer variables across session testing, suggesting that all participants
were likely to have comparable performances at baseline and post-PFMT assessments. The case
group only demonstrated a moderate positive correlation for average manometer pressure across
baseline and post-PFMT assessment, which was also not found to be significant. Refer to Table
3.18 and Figure 3.24.

86
Participant Group n Variables Mean +SD Paired Difference
P-value Correlation Coefficient
Correlation P-value
Controls
13 Baseline Peak cmH20 Post-PFMT Peak cmH20
32.31 +18.03 35.73 +19.22 .31 r= .83 <.01
13 Baseline Average cmH20 Post-PFMT Average cmH20
21.08 +11.93 23.27 +14.66 .42 r= .79 <.01
13 Baseline Timesec Post-PFMT Timesec
23.66 +16.64 (Lg10 1.29+0.28) 35.13 +52.10 (Lg10 1.30 +0.44) (Lg10) .92 (Lg10) r= .79 <.01
Cases
8 Baseline Peak cmH20 Post-PFMT Peak cmH20
14.66 +10.48 (Sqrt) 3.49 +1.68 13.91 +10.20 (Sqrt) 3.37 +1.72 .73 (Sqrt) r= .89 <.01
8 Baseline Average cmH20 Post-PFMT Average cmH20
10.71 +7.37 10.30 +7.14 .79 rs= .55 .16
8 Baseline Timesec Post-PFMT Timesec
18.38 +25.58 (Lg10) 1.06 +0.38 13.15 +7.64 (Lg10) 1.06 +0.26 (Lg10) .94 rs= .76 .03
Table 3.18 Across assessment intra-group PFM manometer variables. Across assessment, intra-group PFM manometer comparison and association. Parametric Paired Sample tests (2-tailed) performed. Parametric and non-parametric correlation coefficients performed. rs denotes non-parametric Spearman Rank correlation coefficient (2-tailed). (Lg10) denotes that log base-10 transformation was performed. (Sqrt) denotes that square root transformation was performed.

87
Figure 3.24 Across assessment correlation of PFM manometer measures. Association of across assessment PFM manometer measurements. Blue= controls. Orange= cases.* indicates statistically significant correlation coefficient.
3.6.2.2 Inter-group PFM manometer comparison
At baseline assessment the control group had statistically significant greater peak
(32.09cmH2O compared to 13.12cmH2O, p-value < 0.01), and average (20.54cmH2O compared
to 8.13cmH2O, p-value < 0.01) manometer pressures than the case group when performing
SMVCs. At baseline assessment the control group also demonstrated on average greater duration
of SMVC than the case group (24.43 seconds compared to 13.12 seconds, p-value 0.04). Refer to
Table 3.19 and Figure 3.25.
At post-PFMT assessment the control group maintained greater peak (35.68cmH2O
compared to 13.91cmH2O, p-value < 0.01), and average (23.68cmH2O compared to
10.30cmH2O, p-value 0.02) PFM manometer pressures than the case group. However, at post-

88
PFMT assessment there was no statistically significant difference in the duration of SMVC
between the two groups. Refer to Table 3.19. and Figure 3.25.
PFM Manometer Variable Controls n=15 Cases n=11 P-value Baseline Peak cmH20
mean +SD range
32.09 +16.69 11.00 – 59.00
13.12 +9.80 0.00 – 37.40
<.01NP
Baseline Average cmH2O mean +SD
range
20.54 +11.12 7.10 – 42.00
8.13 +4.04
0.00 – 15.80
<.01NP
Baseline Timesec (Lg10) mean +SD
range
24.43 +17.33 (Lg10) 1.30 +0.29 7.25 – 65.04 (Lg10) 0.86 – 1.81
13.12 +5.71 (Lg10) 1.08 +0.21
4.29 – 25.42 (Lg10) 0.63 – 1.41
.04
PFM Manometer Variable Controls n=13 Cases n=8 P-value Post-PFMT Peak cmH20
mean +SD range
35.68 +18.40 12.60 – 72.30
13.91 +10.20 0.00 – 32.70
<.01
Post-PFMT Average cmH2O mean +SD
range
23.68 +14.11 7.10 – 51.40
10.30 +7.14 0.00 – 22.70
.02
Post-PFMT Timesec (Lg10) mean +SD
range
33.52 +50.22 (Lg10) 1.29 +0.42 5.30 – 193.11 (Lg10) 0.72 – 2.29
13.15 +7.64 (Lg10) 1.05 +0.26
4.25 – 26.51 (Lg10) 0.63 – 1.42
.18
Table 3.19 Inter-group PFM manometer variables at baseline and post-PFMT. Inter-group comparison of PFM manometer measurements at baseline and post-PFMT assessments. Parametric and non-parametric Independent Samples T-tests performed. NP demotes when non-parametric Mann-Whitney U-test with (2-tailed) was performed. Lg10 denotes that log base-10 transformation was performed on baseline and post-PFMT data.

89
Figure 3.25 Inter-group PFM manometer variables at baseline and post-PFMT. Inter-group PFM manometer measurements at baseline and post-PFMT. Log10 denotes that log base-10 transformation was performed on baseline and post-PFMT data. Error bars represent + 1 SD. * indicates statistical significance.

90
3.6.3 Post-PFMT PFM manometer and NIRS dominance measures
Absolute values of ½RT and DMag Dominance were used as measure of degree of PFM
dominance which were correlated to post-PFMT to assess whether more synergistic PFM
contraction (reduced degree of dominance) were associated with large manometer pressures
(PFM strength).
The control group did not demonstrate any correlation between post-PFMT manometer
variables and NIRS dominance variables. The case group showed a suggestion of association
between ½RT dominance and both Peak and Average cmH2O, however this was only a
moderate negative correlation with which did not prove to be statistically significant. Refer to
Table 3.20.
Participant Group n Variables Correlation
Coefficient Correlation
P-value Controls 11 ½RT Dominance v Peak cmH2O rs= .16 .63
½RT Dominance v Average cmH2O rs= .18 .59
½RT Dominance v Timesec rs= .08 .81
DMag Dominance v Peak cmH2O rs= .09 .79
DMag Dominance v Average cmH2O rs= .14 .69
DMag Dominance v Timesec rs= .18 .59
Cases 7 ½RT Dominance v Peak cmH2O (Sqrt) r= -.69 .09
½RT Dominance v Average cmH2O (Sqrt) r= -.67 .10
½RT Dominance v Timesec rs= -.50 .25
DMag Dominance v Peak cmH2O rs= .04 .94
DMag Dominance v Average cmH2O rs= -.14 .76
DMag Dominance v Timesec rs= .14 .76
Table 3.20 Intra-group correlation of post-PFMT PFM manometer and NIRS dominance variables. Summary of correlation between post-PFMT PFM manometer variables and post-PFMT NIRS dominance (absolute values) variables. Parametric and non-parametric correlation coefficients performed. rs denotes non-parametric Spearman Rank correlation coefficient (2-tailed). Sqrt denotes square root transformation performed.

91
3.6.4 Baseline unilateral PFM ½RT and PFM manometer measures
The control group demonstrated moderate negative correlation between unilateral Right
PFM ½RT and both Peak cmH2O and Average cmH2O (rs = -0.63 and rs= -0.67, respectively).
The control group did not demonstrate any other associations between unilateral PFM ½RT and
manometer variables at baseline assessment. Refer to Table 3.21. The control group did not
demonstrate any correlation between unilateral PFM DMag and manometer variables.
The case group demonstrated a moderate negative correlation between unilateral Right
PFM ½RT and Average cmH2O (rs= -0.67). The case group did not demonstrate any other
associations between unilateral PFM ½RT and manometer variables at baseline assessment.
Refer to Table 3.21 and Figures 3.26-3.27. The case group did not demonstrate any significant
correlation between unilateral PFM DMag and manometer variables at baseline.
Participant
Group n Variables Correlation Coefficient
Correlation P-value
Controls 12 Right ½RT v Peak cmH2O rs= -.63 .03
12 Right ½RT v Average cmH2O rs= -.67 .02
12 Right ½RT v Timesec rs= .52 .08
12 Left ½RT v Peak cmH2O rs= -.32 .32
12 Left ½RT v Average cmH2O rs= -.35 .26
12 Left ½RT v Timesec rs= .21 .51
Cases 10 Right ½RT v Peak cmH2O rs= -.38 .28
10 Right ½RT v Average cmH2O rs= -.67 .04
10 Right ½RT v Timesec r= -.07 .85
10 Left ½RT v Peak cmH2O rs= -.40 .25
10 Left ½RT v Average cmH2O rs= -.35 .32
10 Left ½RT v Timesec rs= .56 .09
Table 3.21 Intra-group correlation of unilateral PFM 1/2RT and PFM manometer variables at baseline. Summary of association between unilateral PFM NIRS ½RT and PFM manometer variables at baseline. Parametric and non-parametric correlation coefficients performed. rs denotes non-parametric Spearman Rank correlation coefficient.

92
3.6.5 Post-PFMT ½RT and PFM manometer measures
The control group did not demonstrate any associations between unilateral PFM ½RT
and manometer variables at post-PFMT assessment. Refer to Table 3.22. Similar to baseline
findings the control group did not demonstrate any correlation between unilateral PFM DMag
and manometer variables at post-PFMT.
Conversely, the case group demonstrated highly negative correlations between both
unilateral PFM ½RT and all manometer variables, suggesting that reduced ½RT was associated
with greater manometers pressures and duration of pressure at post-PFMT assessment. This was
not demonstrated by the case group at baseline. It should be noted that although the case group
suggested a highly positive correlation (r= -0.73) for unilateral Right PFM ½RT and Timesec, this
correlation was not considered to be statistically significant. Refer to Table 3.22. and Figures
3.26-3.27.
Similar to controls, the case group did not demonstrate any significant correlation
between unilateral PFM DMag and manometer variables at post-PFMT.

93
Participant Group n Variables Correlation
Coefficient Correlation
P-value Controls 11 Right ½RT v Peak cmH2O rs= .19 .58
11 Right ½RT v Average cmH2O rs= .21 .54
11 Right ½RT v Timesec rs= .22 .53
11 Left ½RT v Peak cmH2O rs= .00 1.00
11 Left ½RT v Average cmH2O rs= .00 1.00
11 Left ½RT v Timesec rs= .11 .75
Cases 7 Right ½RT v Peak cmH2O r= -.83 .02
7 Right ½RT v Average cmH2O r= -.82 .02
7 Right ½RT v Timesec r= -.73 .06
7 Left ½RT v Peak cmH2O (Sqrt) r= -.84 .02
7 Left ½RT v Average cmH2O (Sqrt) r= -.84 .02
7 Left ½RT v Timesec (Sqrt) r= -.84 .02
Table 3.22 Correlation of unilateral 1/2RT and PFM manometer variables at post-PFMT. Summary of association between unilateral PFM NIRS ½RT and PFM manometer variables at post-PFMT. Parametric and non-parametric correlation coefficients performed. rs denotes non-parametric Spearman Rank correlation coefficient.
Figure 3.26 Correlation of Right PFM 1/2RT and PFM manometer variables. SMVC unilateral Right PFM ½RT correlation with PFM manometer variables at baseline (top row) and post-PFMT (bottom row) assessments. * indicates statistically significant correlation coefficient.

94
Figure 3.27 Correlation of Left PFM 1/2RT and PFM manometer variables. SMVC unilateral Left PFM ½RTcorrelation with PFM manometer variables at baseline (top row) and post-PFMT (bottom row) assessments. * indicates statistically significant correlation coefficient.
3.7 Exercise adherence outcome measures
Exercise adherence to the PFMT intervention was accounted for with self-recording sheet
which allowed for two adherence variables to be measured, exercise volume and frequency.
Exercise Volume is defined as amount of completed exercises per day. Exercise Frequency is
defined as the number of days any exercises were completed during the 8-week PFMT
intervention. Table 3.23 shows no statistical difference among comparison of exercise adherence
between control and case groups, although the case group did demonstrate a higher average for
percentage for Exercise Frequency. On average the control group and case group only performed
51.10% and 52.23% of required amount of exercises, Table 3.23 and Figure 3.29. Both groups
performed better with regards to frequency, completing 62.91% and 78.57% of required exercise
days (control and case group respectively).

95
Exercise Adherence Variable Controls n=13 Cases n=8 P-value Exercise Volume
mean +SD
range
51.10 +28.28
0.00-92.86%
52.23 +26.37
0.00-84.82%
.93
Exercise Frequency mean +SD
range
62.91 +29.52
0.00-100.00%
78.57 +33.81
0.00-100.00%
.10NP
Table 3.23 Inter-group exercise adherence. Inter-group comparison of exercise adherence as measured by percentage of completed amount of exercises completed per day (Exercise Volume) and percentage of days any exercises completed (Exercise Frequency). Parametric and non-parametric Independent T-test performed (2-tailed). NP demotes when non-parametric Mann-Whitney U-test with (2-tailed) was performed.
Figure 3.28 Inter-group PFMT adherence mean values for Exercise Volume and Frequency. Error bars represent + 1 SD.
Figure 3.29 Intra-group exercise adherence percentage. Exercise adherence to 8-week PFMT for controls (blue) and case (orange) groups. Dark blue & orange bars = Exercise Volume (total amount of PFMT exercises completed). Light blue & orange bars = Exercise Frequency (number of days PFMT completed).

96
3.7.1 Exercise adherence and post-PFMT PFM manometer measures
For the control group no significant correlation between PFM manometer variables and
exercise adherence variables. Refer to Table 3.24. Similarly, among the case group, there was no
correlation found between Exercise Volume and manometry values.
However, the case group did demonstrate a significant positive correlation between
Exercise Frequency and all the PFM manometry variables. This suggests that for the case group,
the number of days that any PFMT is attempted, rather than the amount of PFMT completed
each day, is more likely to help improve PFM function as measured by manometry. Refer to
Table 3.24 and Figure 3.30.
Participant Group n Variables Correlation
Coefficient Correlation
P-value Controls 13 Peak cmH2O v Exercise Volume r= -.45 .12
13 Peak cmH2O v Exercise Frequency r= -.33 .27
13 Average cmH2O v Exercise Volume r= -.50 .08
13 Average cmH2O v Exercise Frequency r= -.38 .20
13 Timesec v Exercise Volume rs= .22 .47
13 Timesec v Exercise Frequency rs= .14 .66
Cases 8 Peak cmH2O v Exercise Volume r= .04 .93
8 Peak cmH2O v Exercise Frequency rs= .78 .02
8 Average cmH2O v Exercise Volume r= .11 .80
8 Average cmH2O v Exercise Frequency rs= .88 <.01
8 Timesec v Exercise Volume r= .13 .76
8 Timesec v Exercise Frequency rs= .76 .03
Table 3.24 Intra-group correlation of PFM manometer and exercise adherence variables. Association between post-PFMT manometer variables and exercise adherence. Parametric and non-parametric correlation coefficients performed. rs denotes non-parametric Spearman Rank correlation coefficient (2-tailed).

97
Figure 3.30 Case group correlation of PFM manometer and exercise adherence variables. Case group association between SMVC post-PFMT manometer variables with percentage of adherence to PFMT measured by Exercise Volume and Frequency. * indicates statistically significant correlation coefficient.
3.7.2 Exercise adherence correlation to questionnaire and PVR measures
As the case group demonstrated a significant reduction in the QUID-UUI, this outcome
measure DQUID-UUI (change in score from baseline to post-PFMT) was correlated with
exercise adherence. There was a highly negative correlation (rs= -.85, p-value <0.01) between
DQUID-UUI and Exercise Frequency. This association suggests that QUID-UUI scores were
more likely to be reduced in participants with higher percentage of completed exercise days.
Data in Figure 3.31 suggests that Exercise Frequency of at least 80% was required in this sample
to demonstrate a reduction in urgency symptoms. There was no correlation demonstrated
between Exercise Frequency and the remaining questionnaire score changes (QUID-SUI, UDI-6,
IIQ-7, SSI) or PVR changes. Nor was any correlation found among Exercise Volume and all

98
questionnaire score changes or PVR changes. The control group did not demonstrate any
correlation between exercise adherence and questionnaire or PVR variables.
Figure 3.31 Case group correlation of QUID-UUI score and exercise adherence. Association between subjective change in QUID-UUI score from baseline to post-PFMT and exercise adherence based on Exercise Frequency.* indicates statistically significant correlation. Spearman Rank correlation coefficient (rs= -0.85).
3.7.3 Exercise adherence and post-PFMT ½RT measures
As conducted in post-PFMT PFM manometer and NIRS Dominance analysis, the
absolute ½RT Dominance value was used as measure of degree of PFM dominance was
correlated to exercise adherence variables to assess whether more synergistic PFM contraction
(reduced degree of dominance) were associated with exercise adherence rates.
No correlation found among individual unilateral sides of PFM and both exercise
adherence measures for the control group. However, the controls did demonstrate a moderately
negative correlation between ½RT Dominance and both Exercise Volume and Frequency, (rs= -
0.69 and rs= -0.61, respectively). Results shown in Table 3.25 and Figure 3.32.
The case group demonstrated a highly negative correlation between unilateral Right PFM
½RT and Exercise Frequency, (rs= -0.85). Suggesting that the PFMT intervention only had a

99
training effect on the PFM unilaterally, as no other correlations were found. Refer to Table 3.25
and Figure 3.33.
Participant
Group n Variables Correlation Coefficient
Correlation P-value
Controls 11 Right ½RT v Exercise Volume rs= -.12 .73
Right ½RT v Exercise Frequency rs= -.14 .68
Left ½RT v Exercise Volume rs= -.35 .30
Left ½RT v Exercise Frequency rs= -.35 .29
½RT Dominance v Volume rs= -.69 .02
½RT Dominance v Frequency rs= -.61 .05
Cases 7 Right ½RT v Exercise Volume r= -.35 .44
Right ½RT v Exercise Frequency rs= -.85 .02
Left ½RT v Exercise Volume rs= .13 .79
Left ½RT v Exercise Frequency rs= -.52 .23
½RT Dominance v Volume rs = -.38 .40
½RT Dominance v Frequency rs = -.48 .27
Table 3.25 Intra-group correlation of 1/2RT and exercise adherence variables. Association between post-PFMT ½RT (Dominance absolute) variables and exercise adherence. Parametric and non-parametric correlation coefficients performed. rs denotes non-parametric Spearman Rank correlation coefficient (2-tailed).
Figure 3.32 Control group correlation of 1/2RT and exercise adherence. Association between 1/2RT Dominance (absolute) and exercise adherence among controls. ½RT Dominance and Exercise Volume rs= -0.69. ½RT Dominance and Exercise Frequency rs= -0.61. * indicates statistically significant correlation coefficient.

100
Figure 3.33 Case group correlation of 1/2RT and exercise adherence. Association between unilateral Right PFM ½RT and Exercise Frequency among the case group, rs= -0.85.* indicates statistically significant correlation coefficient.
3.7.4 Exercise adherence and post-PFMT DMag measures
As conducted in post-PFMT PFM manometer and NIRS Dominance analysis, the
absolute DMag Dominance value was used as measure of degree of PFM dominance which was
correlated to exercise adherence variables to assess whether more synergistic PFM contraction
(reduced degree of dominance) were associated with exercise adherence rates.
The control group did not demonstrate any significant findings when associating post-
PFMT DMag NIRS variables with exercise adherence, as shown in Table 3.26.
The case group did demonstrate a significant highly negative correlation when
associating post-PFMT unilateral Right PFM DMag and Exercise Frequency variables, (rs= -
0.78). This suggests that case participants were more likely to have greater magnitude of
desaturation in the Right PFM with increase in exercise adherence. Refer to Table 3.26 and
Figure 3.34.

101
Participant Group n Variables Correlation
Coefficient Correlation
P-value Controls 11 Right DMag v Exercise Volume r= -.45 .17
Right DMag v Exercise Frequency rs= -.30 .37
Left DMag v Exercise Volume rs= -.02 .96
Left DMag v Exercise Frequency rs= .03 .94
DMag Dominance v Exercise Volume r= .37 .28
DMag Dominance v Exercise Frequency r= .28 .40
Cases 7 Right DMag v Exercise Volume r= -.43 .34
Right DMag v Exercise Frequency rs = -.78 .04
Left DMag v Exercise Volume rs= -.34 .45
Left DMag v Exercise Frequency rs= .11 .81
DMag Dominance v Exercise Volume rs= .18 .70
DMag Dominance v Exercise Frequency rs= -.11 .81
Table 3.26 Intra-group correlation of DMag and exercise adherence variables. Association between post-PFMT DMag (Dominance absolute) variables and exercise adherence. Parametric and non-parametric correlation coefficients performed. rs denotes non-parametric Spearman Rank correlation coefficient (2-tailed).
Figure 3.34 Case group correlation of DMag and exercise adherence. Association between post-PFMT unilateral Right PFM DMag and Exercise Frequency among the case group, (rs = -0.78).* indicates statistically significant correlation coefficient.
-14
-12
-10
-8
-6
-4
-2
0
2
4
6
0 20 40 60 80 100
DMa
g u
mo
l
Exercise Frequency
*

102
Chapter 4: Discussion
This chapter will provide interpretation of the research findings within the perspective of
physiological theories and academic literature pertaining to skeletal muscle, NIRS and PFM
dysfunction. The major research findings will be discussed in detail with mention of relevance
for clinical applicability.
4.1 Successful development of NIRS probe
Findings shown in Results section 3.4 demonstrate that the technical design of the NIRS
probe has the capacity to capture hemodynamic and oxygen kinetic response of bilateral PFM
independently and simultaneously. This capability was also demonstrated in both a continent
female control sample and in a sample of females with LUTS.
The probe was tolerated well by participants when used in the manner described in
Methods section 2.3.4. However, it should be noted that two case participants were excluded
from the study due to reported discomfort with manometer insertion and therefore were not
exposed to the NIRS probe. The presence of pelvic pain presents as a limitation for the use of the
NIRS probe, along with other PFM assessment devices that must be used transvaginally. With
this in consideration all other participants (controls n=15 and cases n=11) who did not report any
discomfort with the manometer also did not report any discomfort with the NIRS probe. This
suggests that the NIRS probe has similar tolerability to current transvaginal PFM assessment
devices.
Findings shown in Results section 3.4 demonstrate that the NIRS probe prototype design
has the capacity to capture differential hemodynamic and oxygen kinetic response of bilateral
PFM. PFM assessment was carried out in the nature of performing MVCs, SMVCs and REPs as

103
described and recommended by Laycock and Jerwood 2001 and Devreese et al. 2004.1,91,92
NIRS tracings from this full assessment were used in consideration of the functionality of the
tool itself and for the consideration of observational trends to characterize hemodynamic and
oxygen kinetic responses of the PFM.
Based on the inter-group observational trends the case group demonstrated more complex
NIRS tracings during measurements, atypical muscle tissue contraction and recovery
hemodynamic patterns, resulting in longer ½RT and decreased DMag changes on average. Please
refer to Table 3.12, Table 3.14, and Figures 3.9-3.19 in NIRS objective outcome measures
section 3.5. Similarly, the exploratory findings of Ryan et al. 2014, also suggested that
individuals with a neurologic condition (amyotrophic lateral sclerosis), tended to have slower
½RT than controls.53 It should be noted that this research group used ½RT calculations based on
occlusion NIRS methods and TSI%.
The NIRS parameters also demonstrated similar outcomes to that of manometry, which
also found greater PFM strength and endurance in the control group compared to the case group.
Interestingly, both devices did not detect a significant change in PFM function within groups
after the 8-week PFMT intervention.
4.2 Participant demographics
There was a difference in the mean age of each group, the control group on average being
younger than the case group (mean 42 years compared to mean 51 years, respectively). Although
not reaching statistical significance, it should be noted that the difference between the two was
just shy of reaching the significance cut off (p-value <0.05). Refer to Table 3.1.

104
Increasing age is associated with muscle atrophy and mass reduction, causing decreased strength
and power.121,122 Reduction in the contractile properties of skeletal muscle tissue, particularly
that of contractile velocity, also decreases fatigue resistance in aging muscle.121,122 More specific
PFM literature also reports aging as a contributor to loss of pelvic floor function.12 These
considerations of age-related factors influencing muscle should be considered, even though
statistical significance was not demonstrated between the two groups. Since the case group was
older on average, age could be a contributing factor in the slower ½RT, reduced DMag and
manometer pressure results. An age matched study design would have helped control for this
confounding variable and should be considered for future studies.
There was also statistically significance found in the parity between groups, with the case
group demonstrating a higher proportion of participants with parity >1 than the controls, (90%
compared to 46.7%, respectively). This is important for consideration as parity status is an
influential factor contributing to structural integrity of the PFM. A recent review article by Van
Geelen et al. 2018, determined that parity is associated with decreased PFM contractility, pelvic
organ prolapse, UI, bladder descent and hypermobility, as well as pudendal denervation.12 Injury
to the pudendal nerve is thought to be influenced by many factors during pregnancy and labour,
although evidence in the literature varies on which factors are most significant, they include:
vaginal delivery, prolonged second stage labour, multiparity, forceps and vacuum assisted
labour, perineal lacerations, infant birth weight and head circumference.12 Van Geelen et al.
2018, conclude that the first vaginal delivery poses the greatest risk for PFM dysfunction
including levator ani trauma and neurogenic injury. Although these complications are likely to
occur, Van Geelen et al. 2018, state they typically resolve within the year post-delivery,
however, 5-20% experience irreversible pelvic floor changes due to PFM trauma and neurogenic

105
injury.12 More specifically neurogenic injury has been reported to occur in 25-30% of
primiparous women acutely postpartum with denervation of PFM continuing up to 6-months
postpartum,13,123 which can result in permanent pudendal nerve damage contributing to long
term PFM dysfunction.12
The negative influences that parity, and most specifically vaginal delivery trauma can
have on the PFM, provides rationale for including women who have experienced labour trauma
resulting in bladder symptoms to be included in our study sample population of interest.
Furthermore, the findings of this study further support the negative impact of delivery trauma on
the PFM, as participants with this etiology presented with atypical contraction patterns observed
by NIRS. Such findings will be discussed in further detail in section 4.3.2.
4.3 Observational NIRS findings
4.3.1 Hemodynamic and oxygen kinetic response observed in heathy PFM
The observational NIRS trends observed in the control group, Figures 3.4-3.8, were
consistent with skeletal muscle oxygenation patterns in response to exercise as described in
previous literature.85,93,99 With each PFM contraction, desaturation of the muscle tissue
occurred, as evidenced by drop in both HbDiff and O2Hb. With this desaturation there was also
observable drop in tHb, suggesting that the blood volume of the muscle tissue also decreased
during contraction. At the cessation of contraction all three of these NIRS variables then returned
to baseline levels or increased above baseline levels during the 90-second recovery time interval
before returning to baseline levels. Such physiologic responses of skeletal musculature are well
documented in NIRS research.50,70,97,99 The decline of HbDiff and O2Hb reflect the oxidative

106
capacity of the musculature, in that greater desaturation occurs as an actively contracting muscle
uptakes oxygen to meet its oxygen demand and maintain the workload required of it. The decline
in the tHb infers a decrease in blood volume within the musculature, as the muscle contracts the
blood volume immediately available with the muscle tissue is decreased as the contraction
causes mechanical constriction of the vasculature, limiting incoming blood flow.124
Furthermore, after the initial decrease at onset of contraction, HHb levels increase, although not
to the same magnitude as O2Hb desaturation, demonstrated in Figure 3.5. This reflects continued
oxygen consumption with sustained contraction, as HHb levels within the given blood volume of
the musculature rises as a direct result of O2 uptake by the PFM.
This observation was more evident during SMVC contractions. The longer duration
compared to the MVCs created a larger demand on the muscle causing more desaturation of
oxygen levels within the muscle. Also, as the SMVC was sustained, compared to REP
contractions, there was limited capability for the microvasculature to restore oxygen supply to
facilitate continued muscular effort. In REP contractions the brief relaxation between each
contraction allows more opportunity to increase blood flow and oxygenation levels within the
musculature. Were this study to have employed an occlusive NIRS methodology, the amount of
blood volume during contraction would be controlled, constant blood volume then allows for
accurate calculation of muscle oxygen consumption (rate of HbDiff recovery to baseline during
occlusion measured after bout of exercise).47 Furthermore, had the occlusion method been
employed it is suspected that the observation of an inverse response from O2Hb (decreasing) and
HHb (increasing) would be more pronounced. Nonetheless, the fact that in the control group all
four NIRS variables responded in typical pattern reported in NIRS literature demonstrates that

107
the NIRS probe is capable of assessing the PFM function in healthy tissue, while providing the
added benefit of isolating bilateral PFM response.
The continued downward slope of HbDiff, with inverse relationship between O2Hb
(downward slope) and HHb (upward slope) during the post-PFMT SMVC’s is demonstrated
particularly well in Figure 3.5. The observations from Figure 3.5 suggest that although the
SMVC contraction was not held as long as during baseline, the O2 consumption of the PFM was
greater during post-PFMT, demonstrating that the oxygen consumption exceeds oxygen delivery
during this contraction as tHb also declines. During arterial occlusion when ischemia is induced,
a similar inverse pattern of O2Hb and HHb occurs, which represents rapid O2 consumption
occurring as a result of impeded blood flow (O2 delivery). In Figure 3.6 (post-PFMT Right
PFM), this contraction appears strong enough to induce such an oxygenation pattern. As
described by Muthalib et al. 2010, isometric contractions sustained at high intensity of MVC
results in intramuscular pressure high enough to impeded O2 supply of the muscle’s
microvasculature.97 This means that oxygenation patterns observed at SMVC’s of high intensity
reflect the O2 consumption related to the force generated by that muscle.97 Furthermore, this
trace of interest appears to demonstrate a quicker ½RT in post-PFMT, (½RT Right, 4.1 vs
3.9seconds and Left 8.5 vs 2.0seconds, at baseline and post-PFMT respectively), despite having
achieved greater O2 consumption during the contraction. Since it has been determined that there
is a direct and proportional relationship between blood flow and O2 consumption, the quicker
½RT corresponding with the greater HbDiff desaturation, suggests that supply is proportionally
and more efficiently meeting the demand in order to restore homeostasis and facilitate
recovery.97,125

108
Furthermore, Figure 3.7 (baseline and post-PFMT SMVC), demonstrate similar results.
In baseline SMVC the magnitude of desaturation remains fairly constant throughout the duration
of the contraction, with a less obvious inverse relationship between O2Hb and HHb. Particularly
on the Left PFM, which produces greater desaturation (as per DMag), a hyperemic-like response
is seen in the recovery which is consistent with recovery response when occlusion methods are
used.50,67 The hyperemic response again demonstrates a vasodilatory response proportional to
the oxygen consumption of the active musculature. When comparing bilateral tracings from
baseline to post-PFMT the contraction was approximately twofold at post-assessment. Although
contraction was maintained throughout, some resaturation is occurring as noted by progressive
increase in tHb, O2Hb and HbDiff before the cessation of contraction, although the restoration
still remains well below baseline values. This resaturation, or continued O2 delivery with
incoming blood flow will partially explain the lack of obvious inverse relationship of O2Hb and
HHb, and it could also explain the absence of a hyperemic response in post-PFMT Left
compared to baseline. However, it could also be argued that the ability of the PFM to sustain
such a long contraction with obvious desaturation (without a complete restoration of O2 delivery
or resaturation to baseline), suggests an adapted metabolic training response of the PFM. The
absence of the hyperemia in recovery would further support this, in that the microvasculature can
more efficiently restore oxygen deficits incurred by energy expenditure with exercise.
These two control participants are representative of the tracings obtained from control
participants as a whole and as previously discussed their observational findings are suggestive of
improvement in PFM function in response to the intervention, despite no determined statistical
significance of improved ½RT, DMag or manometer variables. It should also be noted that the

109
varying duration of these contractions could skew the interpretation of these baseline and post-
PFMT comparison oxygenation trends.
4.3.2 Hemodynamic and oxygen kinetic response observed in PFM dysfunction
As detailed in the Chapter 3: Results section 3.4.1.2, heterogeneity among the case group
tracings were categorized into to relevant clinical sub-groups. The categorization of
observational trends was conducted according to underlying etiology and mobility status. It
should be noted that mobility status was not determined by a clinical tool but rather by how the
participant presented at time of assessment and based on the degree to which they used a
mobility aid or wheelchair, as described in section 3.4.1.2
4.3.2.1 High mobility clinical sub-group
Participants in the high mobility group tended to demonstrate PFM oxygenation patterns
similar to that of the control group, generating desaturation with contraction and oxygen
restoration during recovery phase. This typical oxygen pattern was also exhibited on bilateral
PFM, with general synchronicity of unilateral oxygen patterns, regardless of the degree of
magnitude of changes occurring during contraction. Figures 3.9-3.10 demonstrate the
oxygenation patterns observed in a participant with delivery trauma, congenital dysplasia of the
right hip and LUTS, with no impaired mobility (SS11). The NIRS assessment with this
participant demonstrated typical saturation patterns, as compared to observations from controls.
Similar tracings were also demonstrated by SS13, with underlying spinal stenosis, congenital hip
dysplasia and multiple bilateral hip surgeries, with minimal cane assisted mobility. Similar
tracings were also demonstrated by SS14. This participant has a history incomplete traumatic

110
C2-C4 SCI no current ASIA score, but independent unassisted mobility, decreased sensation to
pelvis with self- reported hypersensitivity and hyper-reflexes of bilateral lower limbs. As
demonstrated in Figure 3.11-3.12, SS14 demonstrated typical desaturation during contraction
with restoration in recovery, similar to control group. At post-PFMT assessment greater bilateral
desaturation is evidenced during contraction. These observational findings, particularly in Figure
3.12, draw parallels to control findings shown in Figure 3.6. Both illustrate a shorter contraction
at post-PFMT than at baseline, with the greater oxygen consumption, suggestive of greater force
generation.97 Likewise, this trace also demonstrates reduced ½RT in post-PFMT, despite having
achieved greater oxygen consumption during the contraction, (½RT Right, 26.5 vs 5.6seconds
and Left 29.0 vs 5.9seconds, at baseline and post-PFMT respectively). As mentioned previously,
this suggests that oxygen supply is proportionally and more efficiently meeting the demand in
order to maintain workload and facilitate recovery.97,125
Furthermore, despite a discrepancy in magnitude change, the contraction patterns
evidenced similar curve characteristics bilaterally, which is also a trend found among the control
groups, refer to Figures 3.6 and 3.8 and Figures 3.10 and 3.12. That the bilateral musculature is
responding in a synchronized manner suggests coordinated bilateral motor unit activation and
microvascular unit perfusion. Furthermore, the fact that there is a magnitude discrepancy
bilaterally despite their being symmetric in their desaturation pattern might suggest that the
unilateral PFM with the greater magnitude change is activating larger motor pools (when
considering the size principle of motor neuron recruitment), in turn generating a larger
contraction within that muscle.126 In turn with larger contraction a greater metabolic demand
would be generated, producing larger oxygen extraction from the microvasculature, resulting in
the lower oxygenation saturation levels.127

111
4.3.2.2 MS and SCI clinical sub-groups
NIRS observations from these two clinical sub-groups demonstrated atypical
hemodynamic and oxygen kinetic patterns during PFM contractions. An increase in oxygenation
during contraction with either restoration to resting levels or continued oxygenation increase in
recovery phase was observed, as shown in Figures 3.13-3.19. There was also less symmetry
observed in the response between the bilateral PFM, as seen in differing curve characteristics in
Figures 3.15, 3.18, 3.19. The atypical NIRS patterns observed in these sub-groups are suggestive
of muscle impairment. A study by Azevedo et al. 2015 investigated oxygen recovery kinetics of
the vastus lateralis with NIRS in COPD patients, not only did they find slower recovery times in
COPD patients, they also observed an increase in oxygenation during both exercise and recovery
intervals, similar to the atypical tracings presented in this study.128 They report that this implies
muscular impairment. The following paragraphs will provide an interpretation attempting to
explain these atypical observations related to muscular impairments.
4.3.3 Explanations for atypical hemodynamic and oxygen kinetic response
4.3.3.1 Innervation
4.3.3.1.1 Pudendal nerve innervation
As Ryan et al. 2014 describes, the oxygenation detected by NIRS is the result of exercise
activating muscle fibers.53 With the atypical patterning characterization similar to clinical sub-
groups with neurological deficits it might possible suggest that certain patterning characteristics
allow inference to motor neuron innervation to the PFM, in that demonstrated atypical patterning

112
(either unilaterally or bilaterally), infers impaired motor neuron innervation preventing normal
muscle function and in turn normal oxygenation patterns in response to exercise. With this
possibility of innervation inference, perhaps it could then also be speculated that in the case
group when typical patterning characterization presents in conjunction with urinary symptoms
(as in the high-mobility sub-group), their symptoms might be more related to sensory innervation
rather than motor neuron innervation. This could provide an explanation for why they experience
symptoms but still have similar hemodynamic and oxygen kinetic responses as controls
(suggestive of intact motor innervation).
4.3.3.1.2 Denervation related to pregnancy and labour
SS9 and SS10 were also considered to have high mobility, both had underlying etiology
of vaginal delivery trauma, interestingly, their NIRS tracings had trends boarder lining between
the high mobility and assisted mobility clinical sub-groups. Although both displayed typical
patterning at post-PFMT, the characteristics of the patterning displayed less synchronicity
contralaterally, a characteristic trend found among the assisted mobility group, as demonstrated
in Figure 3.17-3.19. This lack of synchronicity in the musculature response to contraction could
be the result of the delivery trauma (forceps, tears, prolonged 2nd stage labour) causing muscular
defect or pudendal nerve injury, preventing optimal and coordinated muscular
contraction.13,123,129
4.3.3.1.3 Recruitment
Also, when considering motor neuron recruitment, the catch principle may provide some
insight. If impulses to motor units occurring simultaneously generate more force, it may be

113
speculated that the control group, with intact innervation was capable of firing impulses
simultaneously or at quicker intervals since they were able to generate higher PFM manometer
pressures. But in the case of interrupted innervation among the case group, impulse conduction
could be less synchronous and have longer time intervals between impulses, resulting in weaker
contractions. This might help to explain the weaker contractions among the case group as
measured by manometer but also the atypical oxygenation patterning observed during
contractions.
4.3.3.1.4 Activation
Weidner et al. 2006 reported that neuropathic injury of the PFM not only caused fewer action
potentials of low amplitude but that they also occurred spontaneously and in fibrillation.13 The
abnormal action potential activity might explain the abnormal increases in oxygen saturation
patterns observed in NIRS. The impulses that are being generated in neuropathic injury occur at
low amplitude and at varying intervals, which could be influencing the weak, delayed,
uncoordinated or absent contractions as observed by NIRS. For example, Figure 3.19,
demonstrates delayed and uncoordinated contraction. At the start contraction, only unilateral
desaturation occurs (and in low magnitude) within the Left PFM, which also begins to resaturate
before cessation of contraction. On the contralateral side, increase in oxygenation occurs at onset
of contraction, with desaturation occurring several seconds after onset of contraction, also
occurring at low magnitude.

114
4.3.3.2 Microvasculature
Increased muscle pressure during contraction can cause vascular compression, based on
previous literature demonstrating NIRS response of contracting muscle.50,52,67,100,106,130 As such
the initial sharp downward spike observed at onset of contraction in controls, reflects vascular
compression and the continued desaturation during sustained contraction generates oxygen
demand exceeding that of oxygen supply. Thus, allowing the observation of inverse in O2Hb and
HHb, with HbDiff decrease to reflect oxygen consumption. The slow upward trend of
oxygenation during SMVC before cessation of contraction, can be attributed to the vasodilatory
response of the microvasculature as it attempts to meet oxygen demands. It is probable that
atypical responses in the case group were due to low intensity contraction, not resulting in
vascular compression but through stimulus of attempted contractions a vasodilatory response
might still be occurring. As described by Delorey et al. 2002, exercise causes an increase in
blood volume by means of vasodilation, increased hemoconcentration, and capillary
recruitment.106,127 Vasomotor properties of the vasculature are regulated by the sympathetic
system, which may be responding to cause vasodilation even though there is not enough muscle
activity requiring increased oxygen supply provided from vasodilation.
4.3.3.3 Contractile Intensity
A third explanation for the atypical NIRS responses seen in the case group is the variability
of exercise intensity achieved. Since the high mobility group demonstrated similar tracings to the
control group it can be speculated that they were able to achieve similar contraction intensities.
In the MS group and the SCI sub-groups the atypical pattern presentation could be a result of low
contraction intensity, which is plausible as on inter-group comparison of manometer pressure

115
variables were significantly lower for the case group (Baseline: 32.09 vs 13.12 Peak cmH2O,
20.54 vs. 8.13 Average cmH2O and post-PFMT: 35.68 vs 13.91 Peak cmH2O, 23.68 vs 10.30
Average cmH2O; for controls and cases respectively, Refer to Table 3.19 and Figure 3.25).
Boushel et al. 2001, reports that when exercise intensity is not great enough, arterial inflow can
be greater that uptake which causes increased O2 saturation detected by NIRS or no change in
saturation is demonstrated.51 Segal et al. 2005, further describes this physiological occurrence by
the fact that microvasculature supply supports multiple motor units, which allows for increased
blood flow to quiescent muscle fibers as the blood flow is also supporting an active motor
unit.126,131 The increased blood flow to quiescent fibers can be detected by NIRS as unchanged or
increased oxygenation patterns.51 This is also supported by the findings of Ryan et al. 2014, who
reported that even with electrical stimulation they were not always able to achieve desaturation
of the denervated muscle tissue in ALS participants.53 Furthermore, initial response of muscle
microvasculature to contraction is to increase perfusion, which can proceed the activation of
muscle fibers, essentially providing a feed forward mechanism, in that oxygen is made readily
available to support the oncoming muscular contraction.127 This feed forward mechanism could
be what is observed in these NIRS tracings, as increase in oxygenation and blood volume occurs
with attempted contraction, which ultimately occurs at lower intensity not adequate to produce
desaturation or no contraction as result of innervation impairment.
4.3.3.4 Cross Contamination
Another explanation for the atypical changes observed in NIRS oxygenation patterns among
the clinical groups is cross contamination from Valsalva maneuver or accessory muscle use
(obliques, transverse abdominus, hip adductors and flexors, gluteus muscles). Performing a

116
correct PFM contraction is difficult even for women without LUTS and intact musculature.132
Although methods, as described in Methods section 2.3.3, attempted to control for this, it could
still be occurring. This cross contamination could be a possibility when the atypical response
occurs with synchronicity across bilateral PFM. Valsalva maneuver and accessory muscle use
result in increased intraabdominal pressure, resulting increased manometer pressures.133 As such
cross contamination may then also increase the oxygenation of the PFM detected by NIRS due to
blood volume distribution from the contraction of adjacent muscle groups, although it may also
be speculated that cross contamination may result in desaturation of PFM due to increased
abdominal pressure causing compression to the microvasculature. This may provide a basis for
lack of cross contamination influence as increased oxygenation was demonstrated. Moreover,
when the atypical response is occurring without synchronicity bilaterally, in that unilateral PFM
produce different responses, such presentation may be more in align with altered innervation,
microvasculature and contractile intensity discussed previously.
4.3.3.5 Applicability of theoretical considerations to an individual case
Altered physiology including innervation, microvasculature, and contractile intensity may
provide insight to the oxygenation responsiveness in isolated unilateral PFM for the case
participants SS12 and SS3, Figures 3.13-3.18. With particular interest in SS3, who demonstrated
oxygenation change detected by NIRS but no measurable pressure with attempted contraction by
manometer. (To reiterate, NIRS and manometer measurements were not performed
simultaneously). Across all three types of contractions: MVC, SMVC and REPS, the manometer
detected no change in pressure. With NIRS the MVCs demonstrated increased O2Hb, tHb, and

117
HbDiff to the left PFM. Interestingly, this participant self-reported more sensation below injury
level to their left side.
As has been determined by the concept of central pattern generation, peripheral afferent input
can generate neuronal activation to produce a motor task, without any supraspinal input.126,134-136
Research has concluded that, in the lumbosacral region central pattern generation is crucial for
regulating posture and locomotion.126,134,135 As PFM nerves project from the sacral region, it
may be plausible to consider some degree of central pattern generation regulating PFM,
especially since this muscle group is so closely connected to those of locomotion and
posture.41,42,137-139 It may then be considered that mechanoreceptors in the PFM can send
lengthening sensory information to the lumbosacral spinal cord which in preparation of a motor
response, microvasculature is recruited and increases perfusion to the musculature. Since the
motor innervation is impaired, no contraction occurs and the oxygenation of the PFM remains
elevated due to continued afferent stimuli. The PFM is 70% type I fiber,39 which has a high
concentration of mechanoreceptors sensitive to lengthening.126 Afferent stimuli could be coming
from the mechanoreceptors of the PFM, detecting changes in length due to presence of the probe.
Observations from SMVC of SS3 at baseline, Figure 3.16, are suggestive of NIRS capturing
oxygenation patterns of PFM due to central pattern generation as a result of free nerve ending
excitation. Free nerve ending excitation can be provoked by mechanical and metabolic stimuli,126
and is given particular attention in SCI as a contributor to spasticity.134 It is plausible that in the
case of SS3, excitation of free nerve endings results from PFM mechanoreceptors detecting
change in muscle length induced by the presence of the NIRS probe. Which results in an
oscillatory motor output causing the PFM to contract. As evidenced in Figure 3.16, desaturation
is apparent after an initial increase in HbDiff and O2Hb, within the time frame that the

118
participant is actively attempting a contraction. However, once “voluntary” contraction is over
(denoted by the black ox), several more desaturation patterns occur in repetition. This is
suggestive that the unilateral Left PFM at baseline assessment, actually demonstrated a spasm
rather than a voluntary contraction. This would be further supported by that desaturation does not
occur in opposite unilateral PFM, during any other attempted voluntary contraction, no detected
manometer pressures during attempted contractions, along with the clinical history of the
participant, non-traumatic SCI T8 AIS-B.
4.3.4 Objective outcome measures
4.3.4.1 Inter-group objective PFM function outcomes
The control group demonstrated better PFM function than the case group at both baseline
and post-PFMT, with regard to objective measures, including: Peak cmH2O and Average cmH2O
manometer variables (Table 3.19), as well as ½RT (Table 3.12) and DMag (Table 3.14) NIRS
variables. Although, values for these outcome variables were better for the control group
compared to the case group, they did not always achieve statistical significance.
With this in mind, the findings still suggest that the case group has weakened contractile
strength1,22,140 and reduced oxidative performance.49 That the ½RT was slower for the case
group also demonstrates that the oxidative kinetics of the PFM has reduced capacity to restore
homeostasis proceeding muscular contraction, indicating more fatigability than the control
group, as would be expected with assumed PFM atrophy among the case group.126 Furthermore,
the reduction in DMag achieved during contraction suggests reduced oxygen demand generated
during contraction, which supports (1) the manometer evidence of reduced contractile strength,

119
in that lower contraction intensity would also create lower oxygen demand, and (2) limited
oxygen uptake capability of the PFM. Which be explained by the physiological consequences
experienced by the case group, such as impaired innervation, muscle atrophy, diminished
microvasculature, transition of muscle isoform composition to type II fibers.
These findings are also supported by previous literature reporting diminished PFM
strength in incontinent females compared to continent controls.92,140-142 Also, NIRS
investigations of oxygen kinetics in individuals with neurologic conditions determined these
sample populations to have slower oxygen recovery kinetics than able-bodied
counterparts.53,130,143 In addition, Jürgensen et al. 2017, reported that in continent females, PFM
strength (measured by manometry) is correlated to whole body aerobic capacity (measured by
oxygen consumption and ventilatory anaerobic threshold), however, the correlation reported only
had moderately positive significance (r= 0.55).137
4.3.4.1.1 Half Recovery Time (½RT) outcomes
At baseline the control group demonstrated faster ½RT than the case group, for both
Right and Left PFM (6.30 vs 18.90 seconds and 11.39 vs 19.36 seconds, respectively, refer to
Table 3.12) with the difference being statistically significant for the unilateral Right PFM (p-
value <0.01). Interestingly, the control group also demonstrated Right PFM dominance based on
Fz, ½RT and DMag measures of dominance (refer to Tables 3.7, 3.10), suggesting that the
controls not only had better bilateral oxygenation recovery kinetics of PFM, but this appeared to
be specific to their dominant side. Furthermore, the case group appeared to demonstrate Left
PFM dominance based on Fz, ½RT and DMag measures of dominance (refer to Tables 3.7, 3.9,
3.10). This suggests that the lack of statistically significant findings on ½RT of unilateral Left

120
PFM is due to the fact that the controls generally had worse ½RT in their dominant PFM and the
case group demonstrated greater ½RT in their dominant PFM, making the unilateral left PFM
more comparable to each other. This is in contrast to the contralateral Right PFM, in which the
control was more dominant and the case group less dominant, pronouncing the difference of
PFM oxygen recovery kinetics between the two groups.
At post-PFMT faster ½RT values for the control compared to the case group in both
Right and Left PFM were maintained, (7.87 vs 38.03 seconds, and 9.55 vs 18.54 seconds,
respectively, refer to Table 3.12). Again, statistical difference was only demonstrated among the
unilateral Right PFM (p-value 0.01). Further supporting dominant derived differences among the
two groups.
4.3.4.1.2 Delta magnitude change (DMag) outcomes
At baseline the control group demonstrated greater DMag (oxygen consumption) than the
case group, for both Right and Left PFM, however these differences did not yield statistical
significance (-7.31 vs -1.53 µmol and -5.04 vs -2.21 µmol, respectively, refer to Table 3.12). At
post-PFMT the control maintained greater DMag desaturation values compared to the case group
for both Right and Left PFM, (-10.34 vs -2.19 µmol, and -8.49 vs -8.06 µmol, respectively, refer
to Table 3.14), however, in this instance the difference among unilateral Right PFM yielded
statistical significance (p-value 0.01). Interestingly, this supports the findings of ½RT in relation
to PFM dominance, as the case group demonstrated comparable desaturation values with their
dominant side of the Left PFM and the pronounced difference in desaturation in the Right PFM
between groups due to Right dominance of control group.

121
4.3.4.1.3 PFM manometry outcomes
At baseline the controls performed better compared to the case group across all three
variables with statistical significance achieved for: Peak cmH2O, Average cmH2O and Timesec
(32.09 vs 13.12 cmH2O p-value <0.01, 20.54 vs 8.13 cmH2O p-value <0.01, 1.30 vs 1.08
seconds Lg10 p-value 0.04).
At post-PFMT the controls maintained better performance than the case group across all
three variables, with statistical significance achieved for peak and average cmH2O but not for
Timesec (35.68 vs 13.91 cmH20 p-value <0.01, 23.68 vs 10.30 cmH20 p-value 0.02, 1.29 vs 1.05
seconds Lg10 p-value 0.18).
This supports the findings of the NIRS variables demonstrating better oxygen kinetics
among the control group, allowing for more functional strength and endurance of the PFM as
measured by manometry. Although, there was no difference in Timesec between the two groups,
the fact that the Peak and Average cmH2O achieved are lower, implies that the cases do not have
comparable levels of muscular endurance needed to sustain higher levels of contractile intensity.
4.3.4.2 Intra-group objective PFM function outcomes
Neither the control group or the case group demonstrated an improvement of objectively
measured PFM function from baseline to post-PFMT assessment, for the following variables:
Peak cmH2O and Average cmH2O (Table 3.18), as well as ½RT (Table 3.11) and DMag (Table
3.13). This was surprising as previous literature has reported improvement in PFM strength and
symptom scores after PFMT intervention, and PFMT is considered first line therapy for urinary
incontinence (regardless of type).20,21

122
A possible contributing factor for this lack of improvement is the fact that the PFMT
utilized was a home-based therapy only; should supervised sessions have occurred throughout
the intervention more pronounced improvements may have been observed, as reported in studies
which have employed such means of supervised PFMT.141,144,145 Also, the duration of PFMT
may not have been long enough to result in improved performance, varying lengths of PFMT
have been used in research and no standardized time frame has been documented. Duration range
for effective therapies reviewed in the literature spanned from 2 to 6 months of training, with
various dosing of exercise intensities and modalities.20,21,146 Impaired innervation within in the
case group may have resulted in insufficient activation of the PFM to produce meaningful
contractions at intensities required to elicit a training effect. For the more severe cases of
neurologic conditions, where only a flicker response was seen at baseline, it is likely that
neuromuscular stimulation may be the best approach to induce beneficial neuronal and muscular
adaptations.25 Overall adherence to PFMT was also low, which has a direct negative impact the
improvement outcome measures. Specific to the control group, it is possible that the PFMT
intensity was not demanding enough promote muscular hypertrophy and oxygen kinetic
improvements, as these adaptations are specific to intensity of exercise regimes, as explained by
the overload principle of strength training.147,148
4.3.4.2.1 ½RT outcomes
Neither group demonstrated an improvement of ½RT from baseline to post-PFMT. In
addition to general explaining factors for this lack of anticipated finding, another consideration
specific to the ½RT should be considered. The PFMT utilized was meant to target both strength
and endurance of PFM, and therefore should be activating both fiber types, although the PFM is

123
70% type 1 fibers. With regards to specific endurance training, slow fibers tend to have small
changes in mitochondrial enzymes promoting oxidative phosphorylation, whereas their
neuroelectrical properties tend to demonstrate larger changes.126 This could perhaps be a
contributing factor to lack of improvement in ½RT from baseline to post-PFMT. Furthermore, as
recovery kinetics are most likely to be influenced by increased number of mitochondria within
the muscle tissue, and this adaptation requires consistent progressive training to a point which
exceeds the initial PFM endurance capacity, that which was measured at baseline.149
The control group demonstrated a significant difference between Right and Left PFM
½RT at baseline (6.30 vs 11.39 seconds p-value 0.02 (Lg10), respectively, refer to Table 3.11).
Again, this supports the controls demonstrated greater oxygen recovery kinetics within their
dominant side based on Fz scores. Interestingly, this significant difference disappeared at post-
PFMT (7.87 vs 9.55 seconds p-value 0.72, refer to Table 3.11), although this was initially
thought to suggests improved synergistic recovery response of the bilateral PFM at post-PFMT,
the degree of dominance for controls increased at post-PFMT, contradicting this initial
interpretation (5.16 compared to 10.38 at post-FMT, refer to Table 3.12)
Also, interesting to note is that the ½RT dominance of controls from baseline to post-
PFMT was not significantly different but neither was it correlated (1.46 vs 1.67 p-value 0.13, rs
0.11, refer to Table 3.11) suggesting some degree of variability, even though dominance was
maintained on the Right PFM. Whereas the case group also did not demonstrate any difference in
the ½RT dominance from baseline to post-PFMT, these variables were highly positively
correlated (-8.20 vs -7.56 p-value 0.89, r -0.91 p-value <0.01, refer to Table 3.11). This suggests
that ½RT dominance was not altered among the case group after PFMT, meaning improved
coordination between bilateral PFM did not occur.

124
4.3.4.2.2 DMag outcomes
In general, the DMag of desaturation increased for all variables from baseline to post-
PFMT in both groups, although no statistical significance was determined. This may infer some
improvement in oxygen consumption of the PFM, suggesting the muscle tissue may have
responded to certain aspect of the training, but was not enough to elicit a demonstrable difference
or to influence the recovery kinetics. As the PFMT was only for 8-weeks, this duration would not
be long enough to induce muscle hypertrophy, therefore the suggestion of reduced desaturation
after PFMT would likely be due to neuronal adaptations.18,25 Such adaptations could include
increased firing rates and increased motor unit recruitment that can cause increased muscle
contractile properties, which in turn would result in greater desaturation as more muscle fibers
are active and at higher intensity.
Furthermore, both groups maintained the DMag dominant side, similar to the ½RT
dominance variables. The DMag dominance of controls from baseline to post-PFMT was not
significantly different but neither was it correlated (1.54 vs 1.85 p-value 0.91, r 0.08, refer to
Table 3.13) suggesting some degree of variability, even though dominance was maintained on
the Right PFM within the controls. Whereas the case group also did not demonstrate any
difference in the DMag dominance from baseline to post-PFMT, these variables were highly
positively correlated (-3.23 vs -6.69 p-value 0.87, r 0.75 p-value 0.05, refer to Table 3.13). This
further supports the suggestion that PFM dominance, as measured by NIRS variables, was not
altered among the case group after PFMT, meaning improved coordination between bilateral
PFM did not occur.

125
4.3.4.2.3 ½RT and DMag associated outcomes
Interestingly the only correlations demonstrated in either group were in the non-dominant
PFM (according to Fz and NIRS variables of dominance). The control group demonstrated a
moderately positive correlation between ½RT and DMag in the Left PFM at baseline (rs 0.65 p-
value 0.02, refer to Table 3.15). This suggests that as the ½RT lengthened, less DMag
desaturation occurred, implying limited oxygen consumption occurred with reduced recovery
kinetics (limited oxygen uptake and limited oxygen supply). However, at post-PFMT correlation
was not demonstrated in the non-dominant PFM of the controls. This does not imply that oxygen
uptake and delivery mechanisms improved but it may support the suggestion of a change in one
of these variables, further supporting the idea of some improved uptake mechanism due to
PFMT, but in this case specific to the non-dominant PFM.
Although the case group demonstrated a correlation between NIRS variables, this did not
occur at baseline as it did in the controls. Rather at post-PFMT data shows a highly positive
correlation between ½RT and DMag (rs 0.93 p-value <0.01, refer to Table 3.13 and Figure 3.23).
That this correlation presented at post-PFMT suggests greater oxygen uptake occurred with
reduced ½RT, suggesting some training effect may have taken effect in the non-dominant PFM.
4.3.4.2.4 PFM manometer outcomes
No statistical significance was determined in both groups in manometry variables from
baseline to post-PFMT. Despite lack of statistically significant findings, the control group
demonstrated slight improvements in all variables whereas the case group actually demonstrated
slight worsening at post-PFMT. The lack of improvement was not anticipated as it has been well

126
documented in the literature that PFMT can be effective. It is possible that the standardized
PFMT methods used in this study were not at appropriate dose for individual participants and
therefore the therapeutic effect was not achieved. Furthermore, overall adherence to PFMT was
low which will influence these results. The slight reduction also observed in the case group could
also be due to the fact that one participant had 0% adherence to PFMT, another participant
experienced symptomatic episode of relapse-remitting MS and a third participant reported a
week of hospitalization (cause of which was unrelated to study).
Although there was a lack of difference for both groups between baseline and post-
PFMT, correlation of most variables between assessments were highly positive, suggesting that
participants who performed well at baseline also performed well at post-PFMT.
4.3.4.2.5 ½RT and PFM manometer associated outcomes
When intra-group ½RT and manometer variables were correlated, interestingly only the
case group demonstrated a significant correlation at post-PFMT. Furthermore, the correlation
that was demonstrated for bilateral PFM ½RT and all manometer variables was highly negatively
correlated, as presented in Table 3.22 and Figure 3.26-3.27, (Right ½RT and Timesec had highly
negative correlation although this did not reach significance, r -0.73, p-value 0.06). This suggests
those participants that demonstrated greater PFM strength at post-PFMT, as per higher pressure
measures and increased contraction duration, or endurance, also demonstrated quicker recovery
times, or greater oxidative performance.
This infers that among the case group, greater PFM strength corresponds with oxygen
recovery kinetics of the musculature. As this relation was not observed at baseline, it suggests
that perhaps some training effect occurred for the case group, since in response to exercise,

127
corresponding adaptations occur in motor neurons and metabolic properties in order to increase
muscle activation and oxidative capacity.126 Although, if changes in muscle volume and its
consequent adaptations occurred, improvements in manometer and NIRS variables from baseline
to post-PFMT would also be expected, which was not observed in this study, with reasoning for
this lack of finding discussed previously.
4.3.4.3 Lower limb and PFM dominance outcomes
4.3.4.3.1 Fz and WFQ dominance outcomes
Isolating bilateral PFM response to exercise was examined in this study in attempt to see
whether contralateral muscular function might help explain PFM dysfunction and LUTS. It was
also hypothesized that PFM dominance would be more pronounced in the case group due to the
nature of innervation impairment. Furthermore, since the PFM plays an integral role in posture
and lumbosacral support, 41-43 it was thought that measure of lower limb dominance would be
associated with PFM unilateral dominance. For this reason, the relationship between Fz, WFQ
and NIRS dominance variables was assessed.
Inter-group comparisons of both DisFz and QFz demonstrated significance difference
between the two groups, controls demonstrating greater dominance in Right lower limb (as
indicated by positive value) and case group demonstrating greater dominance in the Left
dominant (as indicated by negative value). (DisFz 0.11 and -0.07, p-value <0.01, QFz 0.09 and -
0.05, p-value <0.01, refer to Table 3.10). As demonstrated in Table 3.10, no other differences
were found between groups for the remaining dominance variables.

128
Intra-group comparison of DisFz and QFz for both groups did not demonstrate significant
difference, indicating that lower limb dominance during stabilization tasks is maintained during a
distractive cognitive stimulus. This is further evidenced by the high positive correlation between
DisFz and QFz among the control group (rs 0.83, p-value <0.001, refer to Table 3.8 and Figure
3.2).
Despite the objective measure of lower limb dominance during both distracted and quiet
stance, the WFQ measure of self-reported lower limb dominance as described by “footedness”
did not demonstrate a difference between the two groups as both groups reported greater
preference for their Right foot. This WFQ measure indicating Right foot preference among the
controls appears reasonable, since as a group across all measures of dominance (including NIRS)
they demonstrated positive average values, indicating greater responsiveness on their Right side.
However, the WFQ measure indicating Right foot preference among the case groups is curious,
since as a group across all measures of dominance they demonstrated negative average values,
indicating greater responsiveness from their Left side.
It was initially expected that WFQ scores would be associated with Fz scores of
dominance, however, this was not demonstrated. The lack of correlation between these variables
could be due to the fact that the WFQ poses questions that pertain to two type of motor tasks,
stabilization and active movement,89 although both types of questions are equal in number the
responder may be more likely to choose their motor task foot for both types of questions with the
perception that the preferred foot indicates greater strength of that lower limb, making it the best
choice for all tasks. Research by Hart et al. 1997 and Grouios et al. 2009, determined that the
WFQ is not a good indicator of motor task dominance, as they found that participants commonly
switched limbs when actually performing a motor tasks, contradicting what they reported on the
129
WFQ.150,151 This could explain why none of the of the lower limb dominance measures
correlated with the PFM NIRS dominance measures, (refer to Table 3.9), as Fz scores measured
lower limb dominance during a stabilization task and the NIRS dominance measures were
assessing PFM dominance during an active movement motor task.
4.3.4.3.2 NIRS dominance outcomes
With implementation of PFMT it was thought that PFM dominance as determined by
NIRS would decrease, as PFMT is thought to promote coordination within the whole muscle
group.28,92,132,152 Also, it has been determined that training can cause neuromotor adaptations in
response to exercise training can result in contralateral limb improvements.148 It was thought
that this might translate to the PFM, in that the weaker or non-dominant side would experience
benefits directly from engagement in the PFMT, and further promoted by this contralateral
phenomenon as the dominant PFM may be producing the majority of the work performed by the
PFM during the training regime.
Among both the control and case groups no difference was demonstrated between
baseline and post-PFMT for ½RT Dominance (refer to Table 3.11) or DMag Dominance (refer to
Table 3.13). Interestingly, the case group demonstrated high positive correlation between
baseline and post-PFMT for ½RT (r 0.91, p-value <0.01) and for DMag Dominance (r 0.75 p-
value 0.05). Although DMag Dominance did not reach statistical significance, these correlations
both suggest that PFM dominance was more consistent within the case group and tended to
remain within the unilateral Left PFM, as values indicated by negative values, refer to Tables
3.11 and 3.13.

130
Furthermore, absolute values for both ½RT and DMag NIRS dominance were utilized to
examine the degree of dominance. The absolute ½RT and DMag NIRS dominance (degree of
dominance) provides a parameter representing how pronounced the difference is between
unilateral Right and Left PFM in their oxygen kinetic performance. A smaller absolute value of
degree of dominance indicates the Right and Left PFM were more similar, meaning the dominant
side was less pronounced, suggestive of a more coordinated bilateral PFM oxygen kinetic
performance. A larger absolute value of degree of dominance indicates the Right and Left PFM
were less similar, meaning there was more prominent unilateral dominance in the PFM,
suggestive of less coordination between of the bilateral PFM oxygen kinetic performance. Thus,
allowing for a means of assessing of improved coordination within the bilateral PFM in response
to PFMT. At baseline inter-group comparison demonstrated a significant difference between the
degree of ½RT Dominance, that of controls being much less than the case group (5.16 and 17.41,
respectively, p-value <0.01, refer to Table 3.12). However, at post-PFMT the degree of ½RT
Dominance between the two groups was comparable (10.38 and 15.64, respectively, p-value
0.39, refer to Table 3.12). The fact that the control group demonstrated an increase in the degree
of ½RT Dominance suggests that there might be reduced coordination during PFM after the
PFMT. This could imply that only the dominant PFM responded to the PFMT, thus causing the
increased dominance, however this is not supported by the comparison between Right and Left
½RT post-PFMT which did not demonstrate a significant difference bilaterally. Neither did the
Right of Left ½RT improvement at post-PFMT, refer to Table 3.11.
Interestingly, both groups did not demonstrate any difference between the degree of
DMag Dominance at baseline or post-PFMT (refer to Table 3.14), suggesting that the difference
between desaturation of unilateral PFM within groups at each assessment was comparable.

131
4.3.4.3.3 Degree of NIRS dominance and PFM manometer outcomes
Intra-group correlations between degree of ½RT Dominance and Mag Dominance did not
demonstrate any significant findings within the control group. The case group showed some
suggestion of a moderate negative correlation between degree of ½RT Dominance and
manometer Peak and Average cmH2O, however this did not reach statistical significance (r -0.69,
p-value 0.09 and r -0.67, p-value 0.10, respectively, refer to Table 3.20). This implies that less
difference between the ½RT of unilateral PFM, or a more coordinated response from the PFM,
could be related to better PFM strength (higher Peak and Average cmH20 pressures). Since the
correlations were only moderate and not statistically significant this implication is only
suggested and not confirmed.
4.3.4.3.4 Degree of NIRS dominance and PFMT adherence outcomes
The control group demonstrated a moderate negative correlation between degree of ½RT
Dominance and both Exercise Volume and Frequency (r -0.69, p-value 0.02 and r -0.61, p-value
0.05, respectively, refer to Table 3.25 and Figure 3.55), although only the correlation to Exercise
Volume had statistical significance. This provides a possible implication that greater adherence
to PFMT was associated with greater similarity of the bilateral PFM recovery response from
contraction, suggesting more consistent exercise could improve coordinated muscular effort in
health tissue.

132
4.3.4.4 QOL and clinical symptom outcomes
4.3.4.4.1 Inter-group QOL and clinical symptom outcomes
According to Dumoulin et al. 2018, general improvements of LUTS are experienced by
females with pelvic floor dysfunction and incontinence who have undergone PFMT.20 These
reported improvements are measured by the same validated questionnaires utilized in this study.
As such it was expected that symptom scores would reduce at post-PFMT for the case group and
demonstrate a larger degree of reduction from the control group. However, inter-group
comparison of both QUID, and PVR score changes did not demonstrate statistically significant
differences of change incurred between groups. Although not statistically significant, these
variables did demonstrate larger reductions among the case group, refer to Table 3.6.
4.3.4.4.2 Intra-group QOL and clinical symptom outcomes
Intra-group reductions in symptom scores were expected at post-PFMT. This hypothesis
was directed towards to the cases group, however, as some controls did report symptoms on the
QUID, diminishment of symptoms would also be expected. Although not significant, controls on
average did show a reduction in all measured questionnaire variables and for PVR. Similar
findings were demonstrated among the cases, however, only a statistically significant reduction
in the QUID-UUI score at post-PFMT was demonstrated (7.5 and 5.0, p-value 0.03, refer to
Table 3.4). As this is an indication of LUTS specific to urgency symptoms, it appears that PMFT
had more of an impact on urge related incontinence rather than stress related incontinence. This
could be due to the fact that urgency and UUI are symptoms related to detrusor overactivity,
which is a common characteristic of neurogenic bladder.8-10,30 PFMT can effectively reduce

133
symptoms of urgency, as PFM contractions can inhibit detrusor activity by means of afferent
stimulation eliciting the guarding reflex to suppress parasympathetic excitation in the sacral
nerves innervating the bladder.24,28 In addition to suppression of the parasympathetic excitation,
PFM contraction also promotes sympathetic excitation of the sacral nerves. This results in
internal sphincter closure and inhibition of detrusor activity.24,28
Even though the case participants reported a reduction in urgency symptoms it is
interesting that the average frequency recorded on the 3-bladder diary increased (6.74 to 7.29
voids/day, refer to Table 3.5), typically a measure associated with urgency.8 However, this
increase from baseline was not significant and nor were any of the other bladder diary variables.
Similar findings in lack of significant improvement of bladder diary measures are reported by
McClurg et al. 2006.25 McClurg et al. 2006, also found that when females with MS received
PFMT without biofeedback or NMES, there was no statistical improvements found on QOL
scores measured by the IIQ and UDI (full length versions).25 This was also demonstrated in this
study, as the results from the IIQ-7 and UDI-6 both reduced, refer to Table 3.4, but not
significantly.
4.3.4.5 PFMT Adherence outcomes
Adherence to is the most important indicator for successful rehabilitative PFMT.25,153,154
An ICS consensus report identified six key barriers to PFMT adherence: knowledge regarding
PFM function and reasoning for PFMT, competence regarding physical skill of correct PFM
contraction, emotional perceptions surrounding PFMT, cognitive engagement, prioritization,
accessibility of service provider.155 In addition to addressing these barriers, Dumoulin et al.
2014 emphasize the importance of instructing proper PFM contraction, education of pelvic floor

134
function and benefits of PFMT.153 This was performed both at baseline and post-PFMT, where
PFM anatomy and function were reviewed, along with instruction and practice of corrected PFM
contraction.
Although adherence is considered an integral part of PFMT there is no standard method
of measuring it and in turn no set parameters to distinguish acceptable levels of adherence.153,156
Adherence in this study was measured by percentage of total amount of required exercises
completed per day (Exercise Volume) and the percentage of days any amount of the exercises
were completed over the course of 8-weeks (Exercise Frequency). McClurg et al. 2006 reported
high adherence rates, considered to be >75%, among their participant population,25 and Borello-
France et al. 2010, reported initial high adherence rates of 81% and 90% for both exercise
frequency and volume measures.157
According to the reported rates from these studies, it can be inferred that both the control
and case groups demonstrated low levels of adherence when considering the Exercise Volume
adherence was 51.10% and 52.23%, respectively (refer to Table 3.23). Similar low adherence
rates were reported by Porta Roda et al. 2016, who had 50% adherence rate among women with
UI performing home-based PFMT.156 Although adherence was better for Exercise Frequency
among both groups, 62.91% and 78.57%, (refer to Table 3.23), with the case group
demonstrating greater frequency. If considering the interpretation by Fitz et al. 2017 and
McClurg et al. 2006, of high adherence as 75-81%, the case group met this criterion for the
Exercise Frequency measure of adherence.25,29

135
4.3.4.5.1 Adherence and reduced urgency symptoms
As shown in Table 3.24 and Figure 3.30, a highly positive correlation was determined
between all PFM manometer variables and percentage of Exercise Frequency among the case
group. This provides evidence that participants who performed excises more consistently
throughout the 8-week intervention had better PFM function as measured by PFM manometer
variables of strength and endurance. Furthermore, the significant reduction in QUID-UUI score
from baseline to post-PFMT found among the case group was also highly negatively correlated
to Exercise Frequency (rs -0.85, refer to Figure 3.31). Data presented in Figure 3.31, seems to
suggest that adherence rates of >80% of Exercise Frequency over an 8-week intervention period
is required to reduce urgency symptoms. This finding is supported by Fitz et al. 2017,29 who
found that high adherence of 80% to home exercise routine reduced overactive bladder
symptoms and improved PFM function.
4.3.4.5.2 Adherence and PFM function outcomes
In addition, among the case group, the DMag and ½RT variables of the non-dominant
PFM also demonstrated a high negative correlation to Exercise Frequency (rs -0.78 and rs -0.85,
respectively, refer to Tables 3.25-3.26 and Figures 3.33-3.34), suggesting improved oxygenation
and recovery kinetics with greater frequency of daily exercise. High adherence rates (specific to
Exercise Frequency) among cases was also positively associated with PFM manometer
measures, (Table 3.24 and Figure 3.30). This agrees with literature concerning the importance of
adherence for promoting beneficial PFMT effects.20,28,154-156 Interestingly, the controls on
average did not exceed an adherence rate >75% for both variables (Table 3.21-3.24), which did
not demonstrate correlation to PFM manometer, DMag or unilateral ½RT variables.

136
Chapter 5: Conclusion
This chapter will highlight the main findings of the research and address how they align
with the objectives and hypotheses of this project. The strengths and limitations pertaining to this
project will be discussed while also providing suggestions for future directions for continued
research in this area. This chapter will finalize the thesis with concluding statements specific to
the findings within this project while providing relevance for clinical applicability.
5.1 Main Findings
The primary aim of this project was achieved through the successful development of an
original transvaginal NIRS probe capable of isolating bilateral PFM function. This was the first
study to our knowledge that incorporated NIRS technology to investigate the bilateral PFM
physiological response to exercise. Based on the findings of this research we conclude that the
NIRS probe designed in this project is capable of detecting differential oxygen kinetics of the
PFM bilaterally, thus meeting the primary objective. Observational NIRS findings agree with
the hypothesis that contralateral differences would be detected in unilateral PFM responsiveness,
although this finding was specific to underlying etiology and mobility status.
The NIRS variables demonstrated similar results to that of manometry, in that greater
PFM function was established in controls compared to the case group at both assessment points.
In addition, neither device was capable of detecting intra-group differences in PFM function after
implementation of PFMT. Whether this is due to the inherent capabilities of the devices or other
factors such as PFMT dose and adherence remains unanswered and warrants further
investigation. Nevertheless, the comparable findings support the second hypothesis that NIRS
parameters of PFM function will relate to those of manometer parameters. The case group

137
demonstrated high correlation among oxygen recovery kinetics and PFM strength and endurance
at post-PFMT, demonstrating a relationship indicative of greater oxygen recovery capacity
corresponding with greater muscular strength and endurance. However, the second hypothesis
would have been more strongly supported had all NIRS and manometer parameters demonstrated
correlation at both assessment time points for both groups, which was not evidenced in this
study.
In contrast to the original hypothesis, lower limb dominance did not demonstrate a strong
relationship to PFM dominance. It was also thought that lower limb dominance as measured by
percentage of ground reaction force exerted by each limb, might differ during different standing
conditions. In both groups no difference was detected between lower limb dominance in
distracted (DisFz) or quiet stance (QFz). Furthermore, the WFQ did not demonstrate association
with either Fz dominance variables or NIRS dominance variables, suggesting it is not a good
predictor lower limb dominance during stabilizing motor tasks or PFM dominance during active
motor movement tasks. Inconclusive statements can be made regarding PFM dominance based
on the findings in this study, however the suggestion among the case group data of degree of
½RT dominance reducing with higher manometer pressures at post-PFMT and the control group
demonstrating reduced degree of ½RT dominance with increasing exercise adherence, suggest
that this parameter warrants further investigation.
It was hypothesized that PFMT would improve PFM strength, endurance and oxygen
kinetics. This was not demonstrated in either group, likely due to the factors regarding PFMT
dose and adherence. A PFMT with regular supervised sessions, longer duration and adjunctive
therapies such as NMES should be considered in futures studies of this population.

138
Clinical symptoms of urgency were significantly reduced among the case group after
PFMT intervention, but this did not translate into significant improvements of QOL.
Finally, as hypothesized, adherence to PFMT was a strong determinant in promoting
beneficial effects of PFMT, observed in its relation to improved NIRS, manometer variables and
urgency symptoms among females with LUTS due to impaired pelvic innervation. For this
sample population a daily adherence rate of 80% appeared crucial for reducing urgency
symptoms. From the results of this study it appears that daily consistency of PFM exercise is
important to promote therapeutic effects and is positively associated with better PFM strength
and endurance. PFMT adherence did not demonstrate a strong association to oxygen kinetics of
healthy PFM in controls, which was not expected and should be further investigated in future
studies.
5.2 Limitations
With respect to the actual construction of the probe there are some considerations around
light emission and detection. The transparent plastic encasing of the probe adds an extra physical
barrier that the NIR light must travel through, which can alter the path of emitted light directed
towards the musculature. As was experienced with the first probe design a degree NIR light was
being refracted by the plastic encasing, preventing adequate emission of NIR light to the
musculature to get an appropriate signal. With adjustment of the opaque foam inlay, the scatter
of NIR light was reduced to prevent refraction from interfering with the emission and detection
of light attenuation, allowing for sufficient signal strength. (Additional details regarding NIR
light properties and technical probe design, refer to Introduction section 1.2.3 and Methods

139
section 2.3.4, Figure 2.5). However, some degree of light scatter and refraction could still be
occurring due to the inherent nature of light have to pass through this physical barrier.
Although an advantage of NIRS is its specificity in targeting muscular tissue area of
interest, this can also pose a limitation. As the NIRS probe targets only a small cross- sectional
area of the PFM,49 it must be assumed that all the PFM behaves in the same manner as the target
site. Since it is known that microvasculature can supply more than one motor pool, and that not
all motor pools supplied by the same microvasculature may be activated simultaneously, the
NIRS could be detecting hemodynamic changes in quiescent motor pools due to neighbouring
active motor pools. Although this would likely only be in the case when NIRS detected no
change or an unexpected increasing in oxygenation in response with contraction, and since these
atypical NIRS tracings were seen among the case group, it would still be a relevant finding in
that implies that not all motor pools of the PFM are activated when exercise conditions warrant
full activation.
Another technical limitation with the NIRS probe is the consistency of placement during
assessment both at within and across assessments. As described in the Methods section 2.3.4, the
design of the NIRS probe was such have same detection area as the PFM manometer with a
marker to indicate similar insertions depth among the two devices. Although placement during
any PFM assessment method (digital palpation, manometer, dynamometer, EMG,
ultrasonography), is likely to vary to some degree, and all these methods are still employed with
acceptable levels of reliability and validity.1,83,91,159-161
As mentioned in the Methods section this probe design was modelled after that of
Shadgan et al. 2008, which determined that movement artifact during contraction did not
compromise the NIRS tracings as positioning was well maintained with the probe handle.74

140
Furthermore, to maintain consistency of targeted PFM, the optodes were positioned in alignment
with the PFM manometer sensor, as described in more detail with illustrations in Methods
section 2.3.4 and Figure 2.5. However, although we attempted to control for consistency of
placement across the two devices, the NIRS configuration we utilized only had two detection
sites, and should the device move in a clockwise or counter clockwise direction once in situation,
it could alter the target area of investigation.
A constraint in using NIRS to study the PFM is that the specific path length differential
of this muscle has not been identified and therefore the DPF of 4 was used based on previous
NIRS methodology and literature reporting skeletal muscle DPF values. Furthermore, a
definitive DPF cannot be obtained with CW-NIRS modality. Therefore, the fixed value of DPF 4
was used, even though it is known that the pathlength factor will have variability within the
muscle from one subject to the next and due to the cellular environment changes induced by
exercise.66,67,76
An issue posed with any PFM assessment is the influence of activated accessory muscles
during contraction or the inappropriate response of Valsalva and/or straining. Efforts to minimize
accessory muscle contraction are described in Methods section 2.3.3. Although precautions were
taken, it is possible that undetected accessory muscle contributed to some degree with PFM
contractions. This is particularly true in the case group, where participants with very weak
contractions demonstrated only a perineal flicker during contraction.
There were many recruiting challenges for this study that lead to a small sample size and
heterogeneity among the case group of interest. To begin with the population of interest, females
with incomplete spinal cord injury and specific bladder symptoms of urinary incontinence is a
limited population. Interested females also had to be willing to undergo pelvic floor exam which

141
hindered some individual interest. Also, the fact that altered motor and sensory innervation due
to spinal cord injury or neurological condition present with great variation, even when
underlying injury level is the same or neurological condition is similar, further resulting in large
heterogeneity.
Although this is a limitation of the study and presents challenges for statistical
comparison, we are still able to draw some meaningful insight from the observational trends
within the study population. Also, the fact that is a heterogeneous population may make the
findings more clinically relevant as it would be more similar to the clinical population presenting
to health care providers in real life situations. Challenges with recruitment for small clinical
populations of study interest with the use of NIRS has been discussed by Ryan et al. 2014, who
also attest to the value of discussing observational trends of the data in conjunction with the
statistical findings.53 The findings from this pilot study also help to lay the groundwork for
development of a larger scale study with more a targeted population.
Exercise adherence was low among participants as whole and is a warranted factor for the
lack of statistical significance in comparison of outcome variables from baseline to post-PFMT.
Adherence rates for both Exercise Volume and Frequency might have been improved had the
PFMT intervention included supervised sessions or biofeedback during exercise at home, as
these factors have been reported to promote motivation and self-efficacy.28,154 However, 75%
the case participants completed at least 82% of required days (Exercise Frequency), during
PFMT intervention, (refer to Figure 3.29). Given that transportation is an accessibility barrier
limiting exercise participation among individuals with SCI,147 the use of a home-based PFMT
could be well suited for some individuals. Perhaps longer-term follow-up (4, 6, or 12months) of
home-based PFMT that also includes a supervision component, weekly or monthly visits, would

142
better facilitate and capture PFM improvements.20,162,163 Research from Sran et al. 2016
demonstrated that PFMT with weekly supervision in combination with home-based routine for 3-
months was beneficial for women with osteoporosis and UI.144 Bø et al. 1990,18 demonstrated
that with PFMT adherence of 100%, both unsupervised home exercise and supervised home
exercise groups had significant improvements at 1-month but that the supervised group
continued to greatly increase strength at 6-months. 18
Lastly, the average age between groups was determined to be significantly different, with
the case group being older. This introduces a limitation to comparison between groups. Since it
is known that with increasing age skeletal muscle function diminishes.12,121 Utilizing an age
matched cohort design should be considered for future investigations of this nature.
5.3 Strengths and Future Directions
The strengths of this study are the success of the technical development of the NIRS
probe in isolating the physiological response of bilateral PFM and in its capability of detecting
PFM performance under exercise conditions. The fact that the captured NIRS tracings were
different between controls and case groups provides evidence that this NIRS probe can provide
insight to the altered physiological state of impaired PFM function due to neurological
conditions in females. Furthermore, the fact that the NIRS traces of the control group were
typical of that expected of healthy skeletal muscle tissue supports this claim. An additional
strength of this study is that it utilized a clinically relevant objective method of measuring PFM
function with a manometer. The use of this objective tool help to clarify the interpretation of
NIRS findings with meaningful applicability to field of study regarding PFM dysfunction and
LUTS in females.

143
In light of these strengths, further development of the technical construction of the
vaginal NIRS probe to monitor bilateral PFM oxygenation is warranted. In attempt to eliminate
NIR light refraction and scatter, a probe made of medical grade silicone housing the optodes
would be ideal. To increase the cross-sectional area of the PFM targeted by NIRS a complete
circumferential optode configuration, both at the proximal and distal end of the probe would
allow greater inference to the PFM function as a whole muscle group. This would incorporate the
anterior/posterior components as typically isolated with dynamometric force measures,133,164 the
lateral aspects as isolated in this study and the deep and superficial muscular tissue as described
by Devreese et al. 2004, considered to be important for coordination.92 Having a circumferential
optode configuration would also negate the issue of rotational displacement during assessment.
Furthermore, using NIRS technology that employed time-resolved or spatially-resolved
spectroscopy to provide absolute hemoglobin concentration values and a measure of tissue
oxygen percentage, thus allowing more accurate analysis of the hemodynamic and oxygen
kinetic variables.
Conducting NIRS investigations concurrently with other modalities would be greatly
beneficial. The use of simultaneous perineal EMG during NIRS assessment would help to clarify
how impaired innervation from neurologic conditions or injury affects motor unit activation and
corresponding oxygen patterns with the PFM. As well as use of superficial EMG over accessory
muscles in order to rule out their contribution to PFM contraction and/or consider how their
contribution may be beneficial to function PFM contractions and LUTS symptom management.
Some researchers consider the lower abdomen involvement to be beneficial and necessary for
proper PFM contraction.165

144
Future studies should employ supervised progressive PFMT training to maximize the
effects of intervention as described by previous literature, this appears to be more beneficial not
only for improvements in PFM strength but also for reduction in reported symptoms.20,28,144,162,163
Particularly for the complicated neurologic population the use of adjunctive therapy may be
beneficial for more effective PFM improvements, such as the use of neuromuscular stimulation
and biofeedback.25,28,29,166 More involved PFMT for a longer duration with a longer follow-up
period would provide better insight on how to translate this research findings into clinical
management strategies. Using PFMT that employed more supervision and adjunctive therapies
might also help to improve participant adherence to exercise intervention, as it appears studies
that employed supervision had demonstrated effectiveness and high adherence
rates.25,28,29,144,157,162,163,165
Further research is required to determine the applicability of NIRS to investigate the
theoretical concepts regarding the physiological properties of innervation, microvasculature,
contractile intensity that were previously discussed. This is needed to validate methods of
characterizing oxygenation trends and dominance (SPAM stratification and SPAMD algorithm)
used in this study, which may be beneficial for continued investigations of altered PFM
physiology in women with LUTS and for physiological adaptations that might occur in response
to PFMT. This would need to include studies of NIRS technology capable of measuring TSI%,
methods controlling for blood flow, simultaneous measures with EMG, manometry or
dynamometry, and morphological imaging. As this research is exploratory in nature, a more
refined study, with better controlled parameters for objective measurements would need to be
conducted before these speculations can be given weighted consideration. If further advanced,
NIRS would add the benefit of oxygen kinetic and hemodynamic response of the PFM,

145
physiological measures which are not currently utilized in research or clinical settings with the
field of pelvic floor medicine.
Oxygen kinetics and hemodynamics are commonly used as to assess physiologic
alterations that occur in pathologic conditions and as parameters to guide management of these
conditions and as training parameters for athletes.51,52 Therefore, refinement of NIRS
applicability to the PFM could provide new insight to the physiological alterations of the
musculature in PFM dysfunction and could be utilized as in other fields to help manage PFMT to
improve dysfunction and LUTS. Such implications may be that ½RT and desaturation magnitude
levels could be used to guide clinical decisions to determine the appropriateness of home-based
PFMT, supervised PFMT or NMES intervention.
5.4 Conclusion
With the use of NIRS in this study we were able to determine that this technology can be
utilized to detect differential bilateral PFM response to exercise. NIRS is capable of detecting
differences in oxygen kinetics in controls and females with LUTS due to altered pelvic
innervation. This NIRS methodology provided comparable objective outcomes as PFM
manometry, in that both were capable of detecting functional differences between controls and
cases, without determining within group differences in function from baseline to post-PFMT.
While providing comparable PFM assessment as comparable to PFM manometry, NIRS provides
additional information of PFM function through its ability to discriminate between the bilateral
musculature. Females with LUTS and altered pelvic innervation demonstrated a relationship
between oxygen recovery kinetics and strength and endurance of PFM. Adherence to PFMT is
critical for facilitation of beneficial training effects with regards to both muscular adaptations

146
and symptom management. Furthermore, the findings of adherence among the case group
corroborate existing PFM literature in that PFMT provides benefits of strengthening PFM while
also helping to reduce clinical symptoms. Our findings add to the existing literature by showing
that these benefits can also be obtained by females with neurological conditions and injury
impacting the pelvic floor, however, due to the small sample size and heterogeneity of the study
sample, the extent to which benefits of PFMT may be experienced females with specific
neurological conditions (with regard to severity of neurological impairment, chronicity and
underlying etiology) still warrants meaningful analysis. This research also contributes to the field
of pelvic floor medicine by demonstrating NIRS as means to provide physiological assessment
of PFM oxygen kinetics, as is commonly practiced in other fields to investigate pathology and
direct management. As such, NIRS demonstrates promise as an investigational method capable
of providing additional understanding of the pathophysiology occurring in PFM dysfunction,
thus contributing to PFMT rehabilitation.

147
Bibliography
1. Bø K, Frawley HC, Haylen BT, et al. An international urogynecological association
(IUGA)/international continence society (ICS) joint report on the terminology for the
conservative and nonpharmacological management of female pelvic floor dysfunction. Int
Urogynecol J. 2017;28(2):191-213. doi: 10.1007/s00192-016-3123-4.
2. The Canadian Continence Foundation. Incontinence: A canadian perspective. The Canadian
Continence Foundation. 2014.
3. Coyne KS, Wein A, Nicholson S, Kvasz M, Chen C, Milsom I. Economic burden of urgency
urinary incontinence in the united states: A systematic review. J Manag Care Pharm.
2014;20(2):130-140.
4. Herschorn S, Gajewski J, Schulz J, Corcos J. A population-based study of urinary symptoms
and incontinence: The canadian urinary bladder survey. BJU Int. 2008;101(1):52-58.
5. Liberman JN, Hunt TL, Stewart WF, et al. Health-related quality of life among adults with
symptoms of overactive bladder: Results from a U.S. community-based survey. Urology.
2001;57(6):1044-1050.
6. Melville JL, Delaney K, Newton K, Katon W. Incontinence severity and major depression in
incontinent women. Obstet Gynecol. 2005;106(3):585-592.
7. Shumaker SA, Wyman JF, Uebersax JS, McClish D, Fantl JA. Health-related quality of life
measures for women with urinary incontinence: The incontinence impact questionnaire and the
urogenital distress inventory. continence program in women (CPW) research group. Qual Life
Res.1994;3(5):291-306.

148
8. Haylen BT, de Ridder D, Freeman RM, et al. An international urogynecological association
(IUGA)/international continence society (ICS) joint report on the terminology for female pelvic
floor dysfunction. Neurourol Urodyn. 2010;29(1):4-20.
9. Tudor K, Sakakibara R, Panicker J. Neurogenic lower urinary tract dysfunction: Evaluation
and management. J Neurol. 2016;263(12):2555-2564. doi: 10.1007/s00415-016-8212-2.
10. Dorsher PT, McIntosh PM. Neurogenic bladder. Adv Urol. 2012;2012:816274-16. doi:
10.1155/2012/816274.
11. Taweel WA, Seyam R. Neurogenic bladder in spinal cord injury patients. Res Rep Urol.
2015;7:85-99. doi: 10.2147/RRU.S29644.
12. Van Geelen H, Ostergard D, Sand P. A review of the impact of pregnancy and childbirth on
pelvic floor function as assessed by objective measurement techniques. Int Urogynecol J.
2018;29(3):327-338. doi: 10.1007/s00192-017-3540-z.
13. Weidner AC, Jamison MG, Branham V, South MM, Borawski KM, Romero AA.
Neuropathic injury to the levator ani occurs in 1 in 4 primiparous women. Am J Obstet Gynecol.
2006;195(6):1851-1856. doi: 10.1016/j.ajog.2006.06.062.
14. Bø K, Hilde G. Does it work in the long term?-A systematic review on pelvic floor muscle
training for female stress urinary incontinence. Neurourol Urodyn. 2013;32(3):215-223.
15. Bettez M, Tu LM, Carlson K, et al. 2012 update: Guidelines for adult urinary incontinence
collaborative consensus document for the canadian urological association. Can Urol Assoc J.
2012;6(5):354. doi: 10.5489/cuaj.10.
16. Gormley EA, Lightner DJ, Burgio KL, et al. Diagnosis and treatment of overactive bladder
(non-neurogenic) in adults: AUA/SUFU guideline. J Urol. 2012;188(6 Suppl):2455-2463. doi:
10.1016/j.juro.2012.09.079.

149
17. Lucas MG, Bosch RJL, Burkhard FC, et al. EAU guidelines on assessment and nonsurgical
management of urinary incontinence. Eur Urol. 2012;62(6):1130-1142.
18. Bø K, Hagen RH, Kvarstein B, Jørgensen J, Larsen S, Burgio KL. Pelvic floor muscle
exercise for the treatment of female stress urinary incontinence: III. effects of two different
degrees of pelvic floor muscle exercises. Neurourol Urodyn. 1990;9(5):489-502.
19. Zubieta M, Carr RL, Drake MJ, Bø K. Influence of voluntary pelvic floor muscle contraction
and pelvic floor muscle training on urethral closure pressures: A systematic literature review. Int
Urogynecol J. 2016;27(5):687-696. doi: 10.1007/s00192-015-2856-9.
20. Dumoulin C, Cacciari LP, Hay-Smith EJC. Pelvic floor muscle training versus no treatment,
or inactive control treatments, for urinary incontinence in women. Cochrane Database Syst Rev.
2018;10:CD005654. doi: 10.1002/14651858.CD005654.pub4.
21. Nie X, Ouyang Y, Wang L, Redding SR. A meta-analysis of pelvic floor muscle training for
the treatment of urinary incontinence. Int J Gynaecol Obstet. 2017;138(3):250-255. doi:
10.1002/ijgo.12232.
22. Bø K. Pelvic floor muscle training is effective in treatment of female stress urinary
incontinence, but how does it work? Int Urogynecol J Pelvic Floor Dysfunct. 2004;15(2):76-84.
doi: 10.1007/s00192-004-1125-0.
23. Verelst M, Leivseth G. Force-length relationship in the pelvic floor muscles under transverse
vaginal distension: A method study in healthy women. Neurourol Urodyn. 2004;23(7):662-667.
24. Corcos J, Ginsberg D, Karsenty G. Textbook of the neurogenic bladder. 3rd ed. CRC Press;
2015.
25. McClurg D, Ashe RG, Marshall K, Lowe-Strong AS. Comparison of pelvic floor muscle
training, electromyography biofeedback, and neuromuscular electrical stimulation for bladder

150
dysfunction in people with multiple sclerosis: A randomized pilot study. Neurourol Urodyn.
2006;25(4):337-348. doi: 10.1002/nau.20209.
26. Ferreira AP, Pegorare AB, Salgado PR, Casafus FS, Christofoletti G. Impact of a pelvic floor
training program among women with multiple sclerosis: A controlled clinical trial. Am J Phys
Med Rehabil. 2016;95(1):1-8. doi: 10.1097/PHM.0000000000000302.
27. Lúcio A, Dʼancona CA, Perissinotto MC, McLean L, Damasceno BP, de Moraes Lopes MH.
Pelvic floor muscle training with and without electrical stimulation in the treatment of lower
urinary tract symptoms in women with multiple sclerosis. J Wound Ostomy Continence Nurs.
2016;43(4):414-419. doi: 10.1097/WON.0000000000000223.
28. Voorham JC, De Wachter S, Van den Bos TWL, Putter H, Lycklama À Nijeholt GA,
Voorham-van der Zalm PJ. The effect of EMG biofeedback assisted pelvic floor muscle therapy
on symptoms of the overactive bladder syndrome in women: A randomized controlled trial.
Neurourol Urodyn. 2017;36(7):1796-1803. doi: 10.1002/nau.23180.
29. Fitz F, Sartori M, Girão MJ, Castro R. Pelvic floor muscle training for overactive bladder
symptoms - A prospective study. Rev Assoc Med Bras (1992). 2017;63(12):1032-1038. doi:
10.1590/1806-9282.63.12.1032.
30. Vásquez N, Knight SL, Susser J, Gall A, Ellaway PH, Craggs MD. Pelvic floor muscle
training in spinal cord injury and its impact on neurogenic detrusor over-activity and
incontinence. Spinal Cord. 2015;53(12):887-889. doi: 10.1038/sc.2015.121.
31. Kegel AH. Progressive resistance exercise in the functional restoration of the perineal
muscles. Am J Obstet Gynecol. 1948;56(2):238-248.
32. Kegel AH. Physiologic therapy for urinary stress incontinence. J Am Med Assoc.
1951;146(10):915-917.

151
33. Messelink B, Benson T, Berghmans B, et al. Standardization of terminology of pelvic floor
muscle function and dysfunction: Report from the pelvic floor clinical assessment group of the
international continence society. Neurourol Urodyn. 2005;24(4):374-380.
34. Chehrehrazi M, Arab AM, Karimi N, Zargham M. Assessment of pelvic floor muscle
contraction in stress urinary incontinent women: Comparison between transabdominal ultrasound
and perineometry. Int Urogynecol J. 2009;20(12):1491-1496.
35. Chevalier F, Fernandez-Lao C, Cuesta-Vargas A. Normal reference values of strength in
pelvic floor muscle of women: A descriptive and inferential study. BMC Womens Health.
2014;14(1):143.
36. FitzGerald MP, Burgio KL, Borello-France D, et al. Pelvic-floor strength in women with
incontinence as assessed by the brink scale. Phys Ther. 2007;87(10):1316-1324.
37. Gameiro MO, Moreira EC, Ferrari RS, Kawano PR, Padovani CR, Amaro JL. A comparative
analysis of pelvic floor muscle strength in women with stress and urge urinary incontinence. Int
Braz J Urol. 2012;38(5):661-666.
38. Jean-Michel M, Biller DH, Bena JF, Davila GW. Measurement of pelvic floor muscular
strength with the colpexin pull test: A comparative study. Int Urogynecol J. 2010;21(8):1011-
1017.
39. Heit M, Benson JT, Russell B, Brubaker L. Levator ani muscle in women with genitourinary
prolapse: Indirect assessment by muscle histopathology. Neurourol Urodyn. 1996;15(1):17-29.
40. Kenney WL, Wilmore JH, Costill DL. Structure and function of exercising muscle. In:
Kenney WL, Wilmore JH, Costill DL, eds. Physiology of sport and exercise. Champaign, IL:
Human Kinetics; 2012:27-47.

152
41. Capson AC, Nashed J, McLean L. The role of lumbopelvic posture in pelvic floor muscle
activation in continent women. J Electromyogr Kinesiol. 2011;21(1):166-177. doi:
10.1016/j.jelekin.2010.07.017.
42. Hodges PW, Sapsford R, Pengel LHM. Postural and respiratory functions of the pelvic floor
muscles. Neurourol Urodyn. 2007;26(3):362-371. doi: 10.1002/nau.20232.
43. Smith MD, Coppieters MW, Hodges PW. Postural response of the pelvic floor and
abdominal muscles in women with and without incontinence. Neurourol Urodyn.
2007;26(3):377-385. doi: 10.1002/nau.20336.
44. Lovegrove Jones RC, Peng Q, Stokes M, Humphrey VF, Payne C, Constantinou CE.
Mechanisms of pelvic floor muscle function and the effect on the urethra during a cough. Eur
Urol. 2010;57(6):1101-1110. doi: 10.1016/j.eururo.2009.06.011.
45. Ronald MA, Wiseman RW. The metabolic systems: Control of ATP synthesis in skeletal
muscle. In: American College of Sport Medicine, ed. ACSM's advanced exercise physiology.
Philadelphia, US: Lipincott Williams and Wilkins; 2005.
46. Ryan TE, Brophy P, Lin C, Hickner RC, Neufer PD. Assessment of in vivo skeletal muscle
mitochondrial respiratory capacity in humans by near-infrared spectroscopy: A comparison with
in situ measurements. J Physiol. 2014;592(15):3231-3241.
47. Ryan TE, Southern WM, Reynolds MA, McCully KK. A cross-validation of near-infrared
spectroscopy measurements of skeletal muscle oxidative capacity with phosphorus magnetic
resonance spectroscopy. J Appl Physiol. 2013;115(12):1757-1766. doi:
10.1152/japplphysiol.00835.2013.

153
48. Valkovič L, Chmelík M, Krššák M. In-vivo31P-MRS of skeletal muscle and liver: A way for
non-invasive assessment of their metabolism. Anal Biochem. 2017;529:193-215. doi:
10.1016/j.ab.2017.01.018.
49. Grassi B, Quaresima V. Near-infrared spectroscopy and skeletal muscle oxidative function in
vivo in health and disease: A review from an exercise physiology perspective. J Biomed Opt.
2016;21(9):091313. doi: 10.1117/1.JBO.21.9.091313.
50. Ferrari M, Muthalib M, Quaresima V. The use of near-infrared spectroscopy in
understanding skeletal muscle physiology: Recent developments. Phil.Trans.R.Soc.A.
2011;369(1955):4577-4590.
51. Boushel R, Langberg H, Olesen J, Gonzales-Alonzo J, Bülow J, Kjaer M. Monitoring tissue
oxygen availability with near infrared spectroscopy (NIRS) in health and disease. Scand J Med
Sci Sports. 2001;11(4):213-222.
52. Jones S, Chiesa ST, Chaturvedi N, Hughes AD. Recent developments in near-infrared
spectroscopy (NIRS) for the assessment of local skeletal muscle microvascular function and
capacity to utilise oxygen. Artery Res. 2016;16:25-33. doi: 10.1016/j.artres.2016.09.001.
53. Ryan TE, Erickson ML, Verma A, Chavez J, Rivner MH, Mccully KK. Skeletal muscle
oxidative capacity in amyotrophic lateral sclerosis. Muscle Nerve. 2014;50(5):767-774. doi:
10.1002/mus.24223.
54. Erickson ML, Ryan TE, Backus D, McCully KK. Endurance neuromuscular electrical
stimulation training improves skeletal muscle oxidative capacity in individuals with motor-
complete spinal cord injury. Muscle Nerve. 2017;55(5):669-675. doi: 10.1002/mus.25393.

154
55. Olivier N, Boissière J, Allart E, et al. Evaluation of muscle oxygenation by near infrared
spectroscopy in patients with facioscapulohumeral muscular dystrophy. Neuromuscul Disord.
2016;26(1):47-55. doi: 10.1016/j.nmd.2015.10.004.
56. Allart E. Olivier N. Hovart H. Thevenon A. Tiffreau V. Evaluation of muscle oxygenation by
near-infrared spectroscopy in patients with becker muscular dystrophy. Neuromuscul Disord.
2012;22(8):720-727. doi: 10.1016/j.nmd.2012.04.011.
57. Artinis Medical Systems, B V. Artinis medical systems BV. optical imaging made easy: User
manual oxymon mk III. Version 1002, OxySoft 2.1.1-2.1.6 ed. St, Walburge 4, 6671 AS
Zetten, The Netherlands; 2009.
58. Boezeman RP, Moll FL, Ünlü Ç, de Vries JP. Systematic review of clinical applications of
monitoring muscle tissue oxygenation with near-infrared spectroscopy in vascular disease.
Microvasc Res. 2016;104:11-22. doi: 10.1016/j.mvr.2015.11.004.
59. Macnab AJ. The evolution of near infrared spectroscopy in urology. Biomedical
Spectroscopy and Imaging. 2014;3(4):311-344.
60. Jöbsis FF. Noninvasive, infrared monitoring of cerebral and myocardial oxygen sufficiency
and circulatory parameters. Science. 1977;198(4323):1264-1267.
61. Wray S, Cope M, Delpy DT, Wyatt JS, Reynolds EO. Characterization of the near infrared
absorption spectra of cytochrome aa3 and haemoglobin for the non-invasive monitoring of
cerebral oxygenation. Biochim Biophys Acta. 1988;933(1):184-192.
62. Mancini DM, Bolinger L, Li H, Kendrick K, Chance B, Wilson JR. Validation of near-
infrared spectroscopy in humans. J Appl Physiol. 1994;77(6):2740-2747. doi:
10.1152/jappl.1994.77.6.2740.

155
63. Kienle A, Glanzmann T. In vivo determination of the optical properties of muscle with time-
resolved reflectance using a layered model. Phys Med Biol. 1999;44(11):2689. doi:
10.1088/0031-9155/44/11/301.
64. Delpy DT, Cope M. Quantification in tissue near-infrared spectroscopy. Phil Trans R Soc
Lond B Biol Sci. 1997;352(1354):649-659.
65. Ferrari M, Wei Q, Carraresi L, De Blasi RA, Zaccanti G. Time-resolved spectroscopy of the
human forearm. J Photochem Photobiol B. 1992;16(2):141-153.
66. Jacques SL. Optical properties of biological tissues: A review. Phys Med Biol.
2013;58(11):37.
67. van Beekvelt M. Quantitative near-infrared spectroscopy in human skeletal muscle:
Methodological issues and clinical application. University of Nijmegen; 2002.
68. Boushel R, Piantadosi CA. Near-infrared spectroscopy for monitoring muscle oxygenation.
Acta Physiol Scand. 2000;168(4):615-622.
69. Delpy DT, Cope M, van dZ, Arridge S, Wray S, Wyatt J. Estimation of optical pathlength
through tissue from direct time of flight measurement. Phys Med Biol. 1988;33(12):1433-1442.
70. van Beekvelt MC, Borghuis MS, van Engelen BG, Wevers RA, Colier WN. Adipose tissue
thickness affects in vivo quantitative near-IR spectroscopy in human skeletal muscle. Clin Sci
(Lond). 2001;101(1):21-28.
71. van der Zee P, Cope M, Arridge SR, et al. Experimentally measured optical pathlengths for
the adult head, calf and forearm and the head of the newborn infant as a function of inter optode
spacing. Adv Exp Med Biol. 1992;316:143-153.
72. Essenpreis M, Elwell CE, Cope M, van der Zee P, Arridge SR, Delpy DT. Spectral
dependence of temporal point spread functions in human tissues. Appl Opt. 1993;32(4):418-425.

156
73. Duncan A, Meek JH, Clemence M, et al. Optical pathlength measurements on adult head,
calf and forearm and the head of the newborn infant using phase resolved optical spectroscopy.
Phys Med Biol. 1995;40(2):295-304.
74. Shadgan B, Stothers L, Macnab A. A transvaginal probe for near infrared spectroscopic
monitoring of the bladder detrusor muscle and urethral sphincter. Journal of Spectroscopy.
2008;22(6):429-436.
75. Guenette JA, Henderson WR, Dominelli PB, et al. Blood flow index using near-infrared
spectroscopy and indocyanine green as a minimally invasive tool to assess respiratory muscle
blood flow in humans. Am J Physiol Regul Integr Comp Physiol. 2011;300(4):984.
76. Saitoh T, Ooue A, Kondo N, Niizeki K, Koga S. Active muscle oxygenation dynamics
measured during high-intensity exercise by using two near-infrared spectroscopy methods. Adv
Exp Med Biol. 2010;662:225-230.
77. Boushel R, Langberg H, Olesen J, et al. Regional blood flow during exercise in humans
measured by near-infrared spectroscopy and indocyanine green. J Appl Physiol (1985).
2000;89(5):1868-1878.
78. van Beekvelt MCP, Colier WNJM, Wevers RA, van Engelen BGM. Performance of near-
infrared spectroscopy in measuring local O2 consumption and blood flow in skeletal muscle. J
Appl Physiol. 2001;90(2):511-519.
79. Macnab AJ, Gagnon RE, Stothers L. Clinical NIRS of the urinary bladder: A demonstration
case report. Spectroscopy. 2005;19(4):207-212.
80. Pérez-nombela S, Barroso F, Torricelli D, et al. Modular control of gait after incomplete
spinal cord injury: Differences between sides. Spinal Cord. 2017;55(1):79-86. doi:
10.1038/sc.2016.99.

157
81. Filli L, Sutter T, Easthope CS, et al. Profiling walking dysfunction in multiple sclerosis:
Characterisation, classification and progression over time. Scientific Reports. 2018;8(1):1-13.
doi: 10.1038/s41598-018-22676-0.
82. Wennerfeldt DE. Effects of asymmetrical medical conditions on lower limb dominance: A
theoretical review. Norwegian University of Science and Technology; 2013.
83. Kerschan-Schindl K, Uher E, Wiesinger G, et al. Reliability of pelvic floor muscle strength
measurement in elderly incontinent women. Neurourol Urodyns. 2002;21(1):42-47. doi:
10.1002/nau.2099.
84. Shadgan B, Guenette JA, Sheel AW, Reid WD. Sternocleidomastoid muscle deoxygenation
in response to incremental inspiratory threshold loading measured by near infrared spectroscopy.
Respir Physiol Neurobiol. 2011;178(2):202-209.
85. Buchheit M, Ufland P, Haydar B, Laursen PB, Ahmaidi S. Reproducibility and sensitivity of
muscle reoxygenation and oxygen uptake recovery kinetics following running exercise in the
field. Clin Physiol Funct Imaging. 2011;31(5):337-346. doi: 10.1111/j.1475-097X.2011.01020.x.
86. Uebersax JS, Wyman JF, Shumaker SA, McClish DK, Fantl JA. Short forms to assess life
quality and symptom distress for urinary incontinence in women: The incontinence impact
questionnaire and the urogenital distress inventory. continence program for women research
group. Neurourol Urodyn. 1995;14(2):131-139.
87. Barber MD, Walters MD, Bump RC. Short forms of two condition-specific quality-of-life
questionnaires for women with pelvic floor disorders (PFDI-20 and PFIQ-7). Am J Obstet
Gynecol. 2005;193(1):103-113. doi: 10.1016/j.ajog.2004.12.025.
88. Bradley CS, Rahn DD, Nygaard IE, et al. The questionnaire for urinary incontinence
diagnosis (QUID): Validity and responsiveness to change in women undergoing non-surgical

158
therapies for treatment of stress predominant urinary incontinence. Neurourol Urodyn.
2010;29(5):727-734. doi: 10.1002/nau.20818.
89. Elias LJ, Bryden MP, Bulman-Fleming MB. Footedness is a better predictor than is
handedness of emotional lateralization. Neuropsychologia. 1998;36(1):37-43. doi:
S0028393297001073 [pii].
90. Jimenez-Cidre MA, Lopez-Fando L, Esteban-Fuertes M, et al. The 3-day bladder diary is a
feasible, reliable and valid tool to evaluate the lower urinary tract symptoms in women.
Neurourol Urodyn. 2015;34(2):128-132. doi: 10.1002/nau.22530.
91. Laycock J, Jerwood D. Pelvic floor muscle assessment: The PERFECT scheme.
Physiotherapy. 2001;87(12):631-642.
92. Devreese A, Staes F, De Weerdt W, et al. Clinical evaluation of pelvic floor muscle function
in continent and incontinent women. Neurourol Urodyn. 2004;23(3):190-197.
93. Muthalib M, Millet GY, Quaresima V, Nosaka K. Reliability of near-infrared spectroscopy
for measuring biceps brachii oxygenation during sustained and repeated isometric contractions. J
Biomed Opt. 2010;15(1):017008. doi: 10.1117/1.3309746.
94. Sigurdardottir T, Steingrimsdottir T, Geirsson RT, Halldorsson TI, Aspelund T, Bø K. Do
female elite athletes experience more complicated childbirth than non-athletes? A case–control
study. Br J Sports Med. 2018:099447. doi: 10.1136/bjsports-2018-099447.
95. Buchheit M, Ufland P. Effect of endurance training on performance and muscle
reoxygenation rate during repeated-sprint running. Eur J Appl Physiol. 2011;111(2):293-301.
doi: 10.1007/s00421-010-1654-9.

159
96. Porcelli S, Marzorati M, Morandi L, Grassi B. Home-based aerobic exercise training
improves skeletal muscle oxidative metabolism in patients with metabolic myopathies. J Appl
Physiol. 2016;121(3):699-708. doi: 10.1152/japplphysiol.00885.2015.
97. Muthalib M, Lee H, Millet GY, Ferrari M, Nosaka K. Comparison between maximal
lengthening and shortening contractions for biceps brachii muscle oxygenation and
hemodynamics. J Appl Physiol. 2010;109(3):710-720. doi: 10.1152/japplphysiol.01297.2009.
98. McCully KK, Iotti S, Kendrick K, et al. Simultaneous in vivo measurements of HbO2
saturation and PCr kinetics after exercise in normal humans. J Appl Physiol. 1994;77(1):5-10.
doi: 10.1152/jappl.1994.77.1.5.
99. McCully KK, Landsberg L, Suarez M, Hofmann M, Posner JD. Identification of peripheral
vascular disease in elderly subjects using optical spectroscopy. J Gerontol A Biol Sci Med Sci.
1997;52(3):159.
100. Southern WM, Ryan TE, Reynolds MA, McCully K. Reproducibility of near-infrared
spectroscopy measurements of oxidative function and postexercise recovery kinetics in the
medial gastrocnemius muscle. Appl Physiol Nutr Metab. 2014;39(5):521-529. doi:
10.1139/apnm-2013-0347.
101. Ichimura S, Murase N, Osada T, et al. Age and activity status affect muscle reoxygenation
time after maximal cycling exercise. Med Sci Sports Exerc. 2006;28(7):1277-81. doi:
10.1097/01.GOX.0000546998.93095.5a.
102. Chance B, Dait MT, Zhang C, Hamaoka T, Hagerman F. Recovery from exercise induced
desaturation in the quadriceps muscles of elite competitive rowers. Am J Physiol. 1992;262:766-
775.

160
103. Nagasawa T. Slower recovery rate of muscle oxygenation after sprint exercise in long-
distance runners compared with that in sprinters and healthy controls. J Strength Cond Res.
2013;27(12):3360-3366. doi: 10.1519/JSC.0b013e3182908fcc.
104. Ryan TE, Erickson ML, Young HJ, McCully KK. Case report: Endurance electrical
stimulation training improves skeletal muscle oxidative capacity in chronic spinal cord injury.
Arch Phys Med Rehab. 2013;94(12):2559-2561. doi: 10.1016/j.apmr.2013.06.014.
105. Motobe M, Murase N, Osada T, et al. Noninvasive monitoring of deterioration in skeletal
muscle function with forearm cast immobilization and the prevention of deterioration. Dyn Med.
2004;3(1):2. doi: 10.1186/1476-5918-3-2.
106. DeLorey DS, Kowalchuk JM, Paterson DH. Relationship between pulmonary O2 uptake
kinetics and muscle deoxygenation during moderate intensity exercise. J Appl Physiol.
2003;95(1):113-20.
107. Mukaka MM. Statistics corner: A guide to appropriate use of correlation coefficient in
medical research. Malami Med J. 2012;24(3):69-71.
108. Loma I, Heyman R. Multiplse sclerosis pathogenesis and treatment. Curr Neuropharmacol.
2011;9(3):409-416.
109. Ghasemi N, Razavi S, Nikzad E. Multiple sclerosis: Pathogenesis, symptoms, diagnoses and
cell-based therapy. Cell J. 2017;19(1):1-10. doi: 10.22074/cellj.2016.4867.
110. Ibrahim EAA, Gassoum A, Aldeaf SAH, Ahmed MO, Ahmed SHA. The patterns of clinical
presentation of multiple sclerosis in patients admitted to the national center of neurological
sciences, Khartoum, Sudan 2018. J Neurol Neurosci. 2018;9(3). doi: 10.21767/2171-
6625.1000258.

161
111. Filipi ML, Kucera DL, Filipi EO, Ridpath AC, Leuschen MP. Improvement in strength
following resistance training in MS patients despite varied disability levels. NeuroRehabilitation.
2011;28(4):373.
112. Schulz K, Gold SM, Witte J, et al. Impact of aerobic training on immune-endocrine
parameters, neurotrophic factors, quality of life and coordinative function in multiple sclerosis. J
Neurol Sci. 2004;225(1-2):11-18. doi: 10.1016/j.jns.2004.06.009.
113. Lúcio AC, Perissinoto MC, Natalin RA, Prudente A, Damasceno BP, D'ancona CAL. A
comparative study of pelvic floor muscle training in women with multiple sclerosis: Its impact
on lower urinary tract symptoms and quality of life. Clinics. doi: 10.1590/S1807-
59322011000900010.
114. Dalgas U, Stenager E. Exercise and disease progression in multiple sclerosis: Can exercise
slow down the progression of multiple sclerosis? Ther Adv Neurol Disord. 2012;5(2):81-95. doi:
10.1177/1756285611430719.
115. Motl RW, Gosney JL. Effect of exercise training on quality of life in multiple sclerosis: A
meta-analysis. Mult Scler. 2008;14(1):129-135. doi: 10.1177/1352458507080464.
116. Rudroff T, Proessl F. Effects of muscle function and limb loading asymmetries on gait and
balance in people with multiple sclerosis. Front Physiol. 2018;9:531. doi:
10.3389/fphys.2018.00531.
117. Halabchi F, Alizadeh Z, Sahraian MA, Abolhasani M. Exercise prescription for patients
with multiple sclerosis; potential benefits and practical recommendations. BMC Neurol.
2017;17(1):185-11. doi: 10.1186/s12883-017-0960-9.

162
118. Bø K, Kvarstein B, Hagen R, Larsen S. Pelvic floor muscle exercise for the treatment of
female stress urinary incontinence: I. reliability of vaginal pressure measurements of pelvic floor
muscle strength. Neurourol Urodyn. 1990;9:471-77.
119. Bø K, Kvarstein B, Hagen RR, Larsen S. Pelvic floor muscle exercise for the treatment of
female stress urinary incontinence: II. validity of vaginal pressure measurements of pelvic floor
muscle strength and the necessity of supplementary methods for control of correct contraction.
Neurourol Urodyn. 1990;9:479-87.
120. Rahmani N, Mohseni-Bandpei MA. Application of perineometer in the assessment of pelvic
floor muscle strength and endurance: A reliability study. J Bodyw Mov Ther. 2011;15(2):209-
214. doi: 10.1016/j.jbmt.2009.07.007.
121. Aagaard P, Bangsbo J. The muscular system: Design, function, and performance
relationships. In: American College of Sports Medicine, ed. ACSM's advanced exercise
physiology. Philadelphia, US: Lippincott Williams and Wilkins; 2005:144-58.
122. Petrella JK, Kim J, Tuggle SC, Hall SR, Bamman MM. Age differences in knee extension
power, contractile velocity, and fatigability. J Appl Physiol. 2005;98(1):211-220. doi:
10.1152/japplphysiol.00294.2004.
123. South MMT, Stinnett SS, Sanders DB, Weidner AC. Levator ani denervation and
reinnervation 6 months after childbirth. Am J Obstet Gynecol. 2009;200(5):519.e7. doi:
10.1016/j.ajog.2008.12.044.
124. Shadgan B, Reid DW, Gharakhanlou R, Stothers L, Macnab AJ. Wireless near-infrared
spectroscopy of skeletal muscle oxygenation and hemodynamics during exercise and ischemia.
Spectroscopy. 2009;23:233-41. doi: 10.5489/cuaj.271.

163
125. Clifford PS, Hellsten Y. Vasodilatory mechanisms in contracting skeletal muscle. J Appl
Physiol. 2004;97:393-403.
126. Edgerton VR, Roy RR. The nervous system and movement. In: American College of Sports
Medicine, ed. ACSM's advanced exercise physiology. Philadelphia, US: Lippincott Williams and
Wilkins; 2005:41-90.
127. Segal SS, Bearden SE. Organization and control of circulation to skeletal muscle. In:
American College of Sports Medicine, ed. ACSM's advanced exercise physiology. Philadelphia,
US: Lippincott Williams and Wilkins; 2005:343-55.
128. Azevedo DdeP, Medeiros WM, de Freitas FF, et al. High oxygen extraction and slow
recovery of muscle deoxygenation kinetics after neuromuscular electrical stimulation in COPD
patients. Eur J Appl Physiol. 2016;116(10):1899-1910. doi: 10.1007/s00421-016-3442-7.
129. Shek K, Dietz H. Intrapartum risk factors for levator trauma. BJOG. 2010;117(12):1485-
1492. doi: 10.1111/j.1471-0528.2010.02704.x.
130. Erickson ML, Ryan TE, Young H, McCully KK. Near-infrared assessments of skeletal
muscle oxidative capacity in persons with spinal cord injury. Eur J Appl Physiol.
2013;113(9):2275-2283. doi: 10.1007/s00421-013-2657-0.
131. Segal SS. Regulation of blood flow in the microcirculation. Microcirculation.
2005;12(1):33-45. doi: 10.1080/10739680590895028.
132. Mateus-Vasconcelos ECL, Ribeiro AM, Antônio FI, Brito LGO, Ferreira CHJ.
Physiotherapy methods to facilitate pelvic floor muscle contraction: A systematic review.
Physiother Theory Pract. 2018;34(6):420-432. doi: 10.1080/09593985.2017.1419520.

164
133. Ashton-Miller J, Zielinski R, DeLancey JO, Miller JM . Validity and reliability of an
instrumented speculum designed to minimize the effect of intra-abdominal pressure on the
measurement of pelvic floor muscle strength. Clin Biomech. 2014;29(10):1146-1150
134. Dietz V. Spinal cord pattern generators for locomotion. Clin Neurophysiol.
2003;114(8):1379-1389. doi: 10.1016/S1388-2457(03)00120-2.
135. Marder E, Bucher D. Central pattern generators and the control of rhythmic movements.
Curr Biol. 2001;11(23):R986-996. doi: 10.1016/S0960-9822(01)00581-4.
136. Dudley-Javoroski S, Shields RK. Muscle and bone plasticity after spinal cord injury:
Review of adaptations to disuse and to electrical muscle stimulation. J Rehabil Res Dev
2008;45(2):283-296. doi: 10.1682/JRRD.2007.02.0031.
137. Jürgensen SP, Borghi-Silva A, Bastos AMFG, et al. Relationship between aerobic capacity
and pelvic floor muscles function: A cross-sectional study. Braz J Med Biol Res.
2017;50(11):e5996. doi: 10.1590/1414-431X20175996.
138. Luginbuehl H, Greter C, Gruenenfelder D, Baeyens J, Kuhn A, Radlinger L. Intra-session
test–retest reliability of pelvic floor muscle electromyography during running. Int Urogynecol J.
2013;24(9):1515-1522. doi: 10.1007/s00192-012-2034-2.
139. Sjödahl J, Kvist J, Gutke A, |Öberg B. The postural response of the pelvic floor muscles
during limb movements: A methodological electromyography study in parous women without
lumbopelvic pain. Clin Biomech (Bristol, Avon). 2008;24(2):183-189. doi:
10.1016/j.clinbiomech.2008.11.004.
140. Amaro JL, Moreira ECH, Gameiro M, Padovani CR. Pelvic floor muscle evaluation in
incontinent patients. Int Urogynecol J. 2005;16(5):352-354.

165
141. Gunnarsson M, Teleman P, Mattiasson A, Lidfeldt J, Nerbrand C, Samsioe G. Effects of
pelvic floor exercises in middle aged women with a history of naïve urinary incontinence: A
population based study. Eur Urol. 2002;41(5):556-561.
142. Verelst M, Leivseth G. Force and stiffness of the pelvic floor as function of muscle length:
A comparison between women with and without stress urinary incontinence. Neurourol Urodyn.
2007;26(6):852-857.
143. Harp MA, McCully KK, Moldavskiy M, Backus D. Skeletal muscle mitochondrial capacity
in people with multiple sclerosis. Mult Scler J Exp Trans Clin. 2016;2:1-7.
144. Sran M, Mercier J, Wilson P, Lieblich P, Dumoulin C. Physical therapy for urinary
incontinence in postmenopausal women with osteoporosis or low bone density: A randomized
controlled trial. Menopause. 2016;23(3):286-293. doi: 10.1097/GME.0000000000000594.
145. Cavkaytar S, Kokanali MK, Topcu HO, Aksakal OS, Doganay M. Effect of home-based
kegel exercises on quality of life in women with stress and mixed urinary incontinence. J Obstet
Gynaecol. 2015;35(4):407-410. doi: 10.3109/01443615.2014.960831.
146. Deegan EG, Stothers L, Kavanagh A, Macnab AJ. Quantification of pelvic floor muscle
strength in female urinary incontinence: A systematic review and comparison of contemporary
methodologies. Neurourol Urodyn. 2018;37(1):33-45. doi: 10.1002/nau.23285.
147. Martin Ginis KA, van der Scheer JW, Latimer-Cheung AE, et al. Evidence-based scientific
exercise guidelines for adults with spinal cord injury: An update and a new guideline. Spinal
Cord. 2018;56(4):308-321. doi: 10.1038/s41393-017-0017-3.
148. Garber CE, Blissmer B, Deschenes MR, et al. American College of Sports Medicine
position stand. Quantity and quality of exercise for developing and maintaining

166
cardiorespiratory, musculoskeletal, and neuromotor fitness in apparently healthy adults. Med Sci
Sports Exerc. 2011;43(7):1334-1359. doi: 10.1249/MSS.0b013e318213fefb.
149. Holloszy J, Coyle E. Adaptations of skeletal muscle to endurance exercise and their
metabolic consequences. J Appl Physiol Respir Environ Exerc Physiol. 1984;56(4):831-838.
150. Hart S, Gabbard C. Examining the stabilising characteristics of footedness. Laterality.
1997;2(1):17-26. doi: 10.1080/135765097397611.
151. Grouios G, Hatzitaki V, Kollias N, Koidou I. Investigating the stabilising and mobilising
features of footedness. Laterality. 2009;14(4):362-380. doi: 10.1080/13576500802434965.
152. Casey EK, Temme K. Pelvic floor muscle function and urinary incontinence in the female
athlete. Phys Sportsmed. 2017;45(4):399-407. doi: 10.1080/00913847.2017.1372677.
153. Dumoulin C, Hay-Smith J, Frawley H, et al. 2014 consensus statement on improving pelvic
floor muscle training adherence: International continence society 2011 state-of-the-science
seminar. Neurourol Urodyn. 2015;34(7):600-605.
154. Messer KL, Hines SH, Raghunathan TE, Seng JS, Diokno AC, Sampselle CM. Self-efficacy
as a predictor to PFMT adherence in a prevention of urinary incontinence clinical trial. Health
Educ Behav. 2007;34(6):942-52.
155. Hay-Smith J, Dean S, Burgio K, McClurg D, Frawley H, Dumoulin C. Pelvic-floor-muscle-
training adherence “modifiers”: A review of primary qualitative studies-2011 ICS state-of-the-
science seminar research paper III of IV. Neurourol Urodyn. 2015;34(7):622-631. doi:
10.1002/nau.22771.
156. Porta-Roda O, Vara-Paniagua J, Díaz-López MA, et al. Effect of vaginal spheres and pelvic
floor muscle training in women with urinary incontinence: A randomized, controlled trial.
Neurourol Urodyn. 2015;34(6):533-538.

167
157. Borello-France D, Burgio KL, Goode PS, et al. Adherence to behavioral interventions for
urge incontinence when combined with drug therapy: Adherence rates, barriers, and predictors.
Phys Ther. 2010;90(10):1493-1505. doi: 10.2522/ptj.20080387.
158. Van Cutsem M, Duchateau J, Hainaut K. Changes in single motor unit behaviour contribute
to the increase in contraction speed after dynamic training in humans. J Physiol.
1998;513(1):295-305. doi: 10.1111/j.1469-7793.1998.295by.x.
159. Pereira VS, Hirakawa HS, Oliveira AB, Driusso P. Relationship among vaginal palpation,
vaginal squeeze pressure, electromyographic and ultrasonographic variables of female pelvic
floor muscles. Braz J Phys Ther. 2014;18(5):427-434.
160. Dietz HP, Jarvis SK, Vancaillie TG. The assessment of levator muscle strength: A
validation of three ultrasound techniques. Int Urogynecol J Pelvic Floor Dysfunct.
2002;13(3):156-159; discussion 159.
161. Navarro Brazález B, Torres Lacomba M, de la Villa P, et al. The evaluation of pelvic floor
muscle strength in women with pelvic floor dysfunction: A reliability and correlation study.
Neurourol Urodyn. 2018;37(1):269-277. doi: 10.1002/nau.23287.
162. Kaya S, Akbayrak T, Gursen C, Beksac S. Short-term effect of adding pelvic floor muscle
training to bladder training for female urinary incontinence: A randomized controlled trial. Int
Urogynecol J. 2015;26(2):285-293.
163. Pereira VS, de Melo MV, Correia GN, Driusso P. Long-term effects of pelvic floor muscle
training with vaginal cone in post-menopausal women with urinary incontinence: A randomized
controlled trial. Neurourol Urodyn. 2013;32(1):48-52.

168
164. Dumoulin C, Gravel D, Bourbonnais D, Lemieux MC, Morin M. Reliability of
dynamometric measurements of the pelvic floor musculature. Neurourol Urodyn.
2004;23(2):134-142.
165. Bø K, Mørkved S, Frawley H, Sherburn M. Evidence for benefit of transversus abdominis
training alone or in combination with pelvic floor muscle training to treat female urinary
incontinence: A systematic review. Neurourol Urodyn. 2009;28(5):368-373. doi:
10.1002/nau.20700.
166. Aksac B, Aki S, Karan A, Yalcin O, Isikoglu M, Eskiyurt N. Biofeedback and pelvic floor
exercises for the rehabilitation of urinary stress incontinence. Gynecol Obstet Invest.
2003;56(1):23-27.

169
Appendix A
Appendix A Methods
A.1 PFMT Instruction Sheet

170
A.2 PFMT Recording Sheet

171
A.3 Bladder Diary

172
A.4 Questionnaire for Urinary Incontinence Diagnosis (QUID)

173
A.5 Urogenital Distress Inventory Short Form (UDI-6)

174
A.6 Incontinence Impact Questionnaire Short Form (IIQ-7)

175
A.7 Subjective Assessment of Improvement

176
A.8 Waterloo Footedness Questionnaire-Revised