The Evolution of the Sharing Economy: Redefining Industries ...
Upload
khangminh22Category
view
1download
0
sustainability
Article
Bike Sharing and the Economy, the Environment,and Health-Related Externalities
Lu-Yi Qiu 1 and Ling-Yun He 2,3,4,*1 College of Economics and Management, China Agricultural University, Beijing 100083, China;
[email protected] or [email protected] School of Economics, Jinan University, Guangzhou 510632, China3 Institute of Resource, Environment & Sustainable Development Research, Jinan University,
Guangzhou 510632, China4 School of Business, Nanjing University of Information Science and Technology, Nanjing 210044, China* Correspondence: [email protected]
Received: 6 March 2018; Accepted: 8 April 2018; Published: 11 April 2018�����������������
Abstract: In recent years, bike-sharing has experienced rapid development; however, controversiesabout the externalities of bike-sharing programs have arisen as well. While bike-sharing programshave impacts on traffic, the environment, and public health, the social impacts, the management,and sustainable development of bike-sharing has also been of interest. The debate regardswhether there are externalities, as well as whether and how such externalities can be determined.Based on the rapidly diffused bike-sharing in China, this paper quantitatively explores bike-sharingexternalities. Specifically, this paper estimates the impacts of bike-sharing on the economy, energyuse, the environment, and public health. The empirical results show that bike-sharing programshave significant positive externalities. The bike-sharing systems can provide urban residents with aconvenient and time-saving travel mode. We find that the bike-sharing dramatically decreases traffic,reduces energy consumption, decreasing harmful gas emissions, improves public health generally,and promotes economic growth. This study contributes to a better comprehension of the externalitiesof bike-sharing and provides empirical evidence of the impacts of bike-sharing. Findings suggest thatbike-sharing can play a critical role in the process of urban transportation development and provideinformation useful for urban transportation policies.
Keywords: bike-sharing; externality; economic growth; emission reduction; health effect
1. Introduction
Along with the growing levels of residents’ travel demand, personal transportation playsan essential role in our lives. Especially in recent years, the numbers of personal cars have seenrapid growth. For example, ownership of personal vehicles in China has risen from 18.48 millionin 2005 to 163.30 million in 2016 [1]. The growing levels of personal cars impose externalities onsociety, the economy and the environment, which has attracted the attention of academia [2–6].Cars can increase employment, productivity, and economic growth [7], but most attention has beenon their negative externalities. According to the literature [5,6,8–10], cars entail energy dependence,negative environmental effects (air pollution and noise annoyance), public health issues, road damage,accidents, congestion, and the overuse of public spaces in cities. Policy makers need to solve thesenegative externalities.
Solutions to negative externalities, such as Pigouvian taxes [11–14] or cap-and-tradesystems [15–17], have been proposed from an economic point of view. Some policies, such as those ofland use and transport planning [18,19], incentives to public transport, and information campaigns [20],
Sustainability 2018, 10, 1145; doi:10.3390/su10041145 www.mdpi.com/journal/sustainability

Sustainability 2018, 10, 1145 2 of 10
can be combined with corrective instruments. In addition, regulations or new technology could play arole [5]. In recent years, “transport sharing” has become increasingly popular across the globe, which isdesigned not only to reduce negative externalities but also to satisfy the demand of residents’ travelneeds and economic development.
Bike-sharing, as a form of shared transportation, has received increasing attention in recent years.The basic premise of bike-sharing programs is sustainable transportation. Objectives associated withbike-sharing programs include increased cycle usage and mobility options, an improved first/last mileconnection to other travel modes, reduced transport congestion and energy consumption, reducedenvironmental impacts, and improved public health [21–24]. However, controversies regardingthe implementation process, such as the waste of resources as well as bicycle maintenance andmanagement [25], have emerged. Therefore, two crucial questions consist in whether there areexternalities, as well as whether and how such impacts can be estimated.
Many studies on bike-sharing have focused on qualitative evaluation and discussion. For example,Gleason and Miskimins present various methods of making bikes more available in federal lands,and explore how elements of successful bike programs may be adapted for federal lands settings [26].Nair et al. analyze the functioning of a large-scale bicycle sharing system in Paris to provide insightsfor policy makers [27]. Some quantitative studies have taken a closer look at bike-sharing safety and therepositioning problem [28,29]. However, there are few empirical studies to comprehensively explorethe externalities of bike-sharing. Theoretically speaking, bike-sharing programs would have impactson public transportation, transport congestion, energy use, the environment, and personal health.Limited by essential data, in this paper, we only attempt to quantitatively explore the externalities ofbike-sharing on the economy, fuel use, harmful emissions, and health in Beijing, China. The studycontributes to a better comprehension of the externalities of bike-sharing, and provides empiricalevidence for the impacts of bike-sharing. The findings will be important and useful for urbantransportation policies.
This paper estimates economy, environment, and health externalities of a bike-sharing programin Beijing. In the last two years, bike-sharing, used with mobile apps, has been prominent in Chinesecities. The online bike-sharing service is different in the following ways: customers can easily locateand unlock shared bikes using mobile apps on a smart phone; shared bikes can be rented and returnedto any public area instead of one fixed location. Different online bike-sharing platforms in China aredistinguished by color. Of the 20 largest bike-share programs in the world, all but four are in China.Therefore, China is ideal for exploring and analyzing the externalities of bike-sharing.
This paper is organized into three main sections. First, the framework of this paper and themethods used to estimate the externalities of bike-sharing are introduced. Next, key findings aredescribed. Finally, the results are summarized and some implications are provided.
2. Methods and Materials
2.1. Estimation Strategy
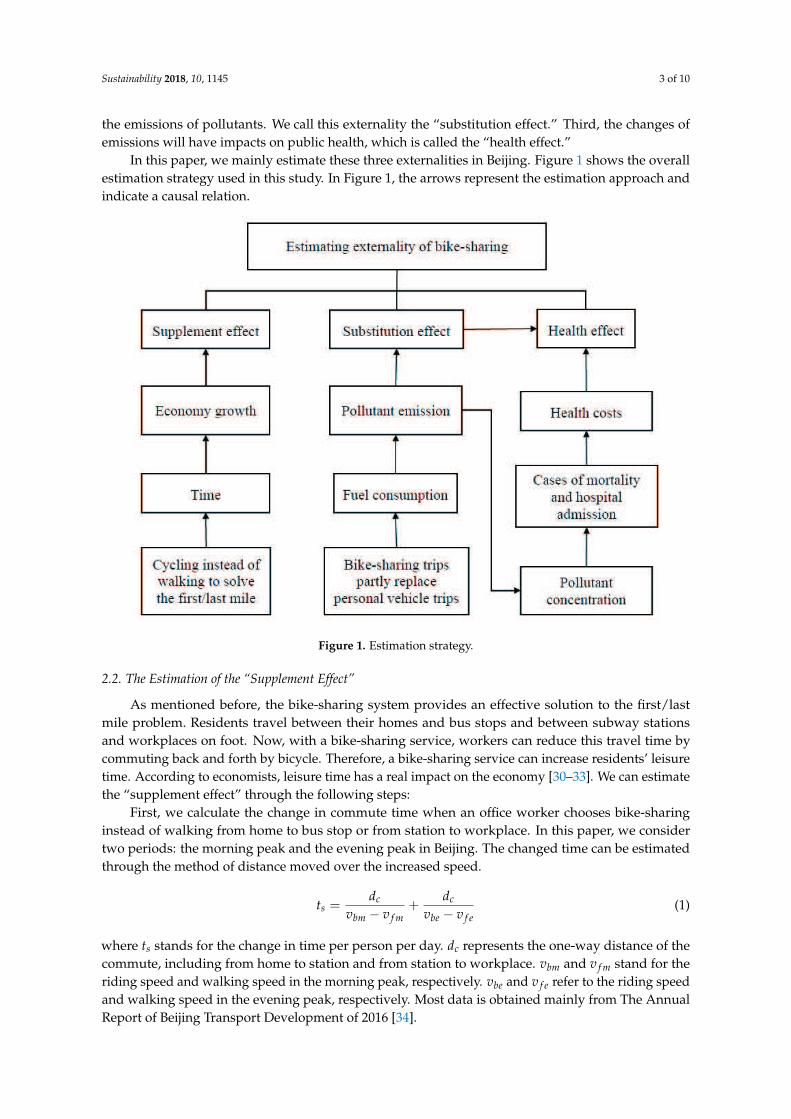
This paper attempts to explore the externalities of bike-sharing program in Beijing. Bike-sharingis a good option for short trips across the city, and is convenient, healthy, and environmentallyfriendly. Based on existing studies, we estimate the externalities of bike-sharing in the following ways:First, a bike-sharing system solves “the last mile” problem [23] and complements existing urban traffic.It can improve the first or the last mile connection to other traffic modes. In addition to traveling to busstops or subway stations from home on foot, residents can now use a bicycle-sharing service, which isconvenient and time-saving. In this paper, we call this externality the “supplement effect.” Second,bike riding is a green and low-carbon way to travel. Apart from solving the first/last mile problem,bike-sharing can partly replace travel modes of heavy pollution and energy consumption, such ascars and motorcycles. Such alternatives can influence overall energy consumption and further cut
Sustainability 2018, 10, 1145 3 of 10
the emissions of pollutants. We call this externality the “substitution effect.” Third, the changes ofemissions will have impacts on public health, which is called the “health effect.”
In this paper, we mainly estimate these three externalities in Beijing. Figure 1 shows the overallestimation strategy used in this study. In Figure 1, the arrows represent the estimation approach andindicate a causal relation.
Figure 1. Estimation strategy.
2.2. The Estimation of the “Supplement Effect”
As mentioned before, the bike-sharing system provides an effective solution to the first/lastmile problem. Residents travel between their homes and bus stops and between subway stationsand workplaces on foot. Now, with a bike-sharing service, workers can reduce this travel time bycommuting back and forth by bicycle. Therefore, a bike-sharing service can increase residents’ leisuretime. According to economists, leisure time has a real impact on the economy [30–33]. We can estimatethe “supplement effect” through the following steps:
First, we calculate the change in commute time when an office worker chooses bike-sharinginstead of walking from home to bus stop or from station to workplace. In this paper, we considertwo periods: the morning peak and the evening peak in Beijing. The changed time can be estimatedthrough the method of distance moved over the increased speed.
ts =dc
vbm − v f m+
dc
vbe − v f e(1)
where ts stands for the change in time per person per day. dc represents the one-way distance of thecommute, including from home to station and from station to workplace. vbm and v f m stand for theriding speed and walking speed in the morning peak, respectively. vbe and v f e refer to the riding speedand walking speed in the evening peak, respectively. Most data is obtained mainly from The AnnualReport of Beijing Transport Development of 2016 [34].

Sustainability 2018, 10, 1145 4 of 10
Second, we estimate the economy effect due to the change in time. Many existing studies suggestthat leisure time has a significant impact on economic growth. For example, some studies find that anincrease in leisure time of 1% would increase GDP per capita by 6.628% in America, 3.26% in Denmark,and 1.86% in Japan [33,35]. Therefore, we estimate the externalities of bike-sharing on the economy by
y1 =ts
tl× α × y (2)
where y1 refers to the economic growth due to the supplement effect. ts stand for the change in timeper person because of the bike-sharing service. tl is the leisure time per person, which is obtainedfrom the current literature [33]. y is a proxy for economy development, which is estimated throughthe per capita GDP of Beijing here. α is the coefficient between leisure time and economy. In ouranalysis, we estimate the supplement effect under different modes. It is also noteworthy that theusers of bike-sharing services are not only workers, but also students and other residents. Here wemainly estimate the impact based on office workers. Therefore, the supplement effect of bike-sharingis undervalued here.
2.3. The Estimation of the “Substitution Effect”
As defined above, the substitution effect indicates that a bike-sharing system provides a greentravel mode, and riding can replace certain high-energy-consuming travel modes. The governmentof Beijing has enacted a series of polices to develop such green travel modes. In 2016, BeijingMunicipal Commission of Transport enacted “The Traffic Development Plan of the 13th Five-YearPeriod of Beijing,” proposing that Beijing will develop green travel modes and build a convenient andcomfortable bicycle system. Moreover, the Beijing Municipal General Office has brought forward aplan to further restrict motor vehicle travel and to reduce the use of personal cars [36]. Based on thesepolicies, we designed an experimental scenario. We selected 2015 as the baseline year. According to“The Traffic Development Plan of the 13th Five-Year Period of Beijing,” the ratio of green travel will begreater than 70% in Beijing by the end of the 13th Five-Year period. The Beijing Municipal Commissionof Transport further proposes that the proportion of green travel will be as high as 75% by the endof 2020. Therefore, in such a scenario, we assume that 75% of bike-sharing kilometers traveled willreplace personal cars to estimate the substitution effect. Further, we estimate the changed energyconsumption and emission with a source-specific emission inventory for China. Thus, the substitutioneffect is estimated by the following equations.
First, we estimate the kilometers traveled provided by the existing bike-sharing service:
KT = da × V × r (3)
where KT refers to the bike-sharing kilometers traveled. da stands for the average daily distance ofbicycles, and r is the turnover rate per day, which is obtained from The Annual Report of BeijingTransport Development of 2016 [34]. V is the stock of existing bike-sharing, which is obtained from theBeijing Municipal Commission of Transport.
Then, the changed energy consumption can be calculated by the following equation:
F = 75% × KT × FE (4)
where F stands for the consumption of the fuel. In our design, bike-sharing replaces personal cars,which mainly burn gasoline. FE is the fuel economy of gasoline, which is obtained from the study byYang and He [37].
We multiply the emission coefficients by KT to calculate the resulting harmful emissions:
E = 75% × KT × EF (5)
Sustainability 2018, 10, 1145 5 of 10
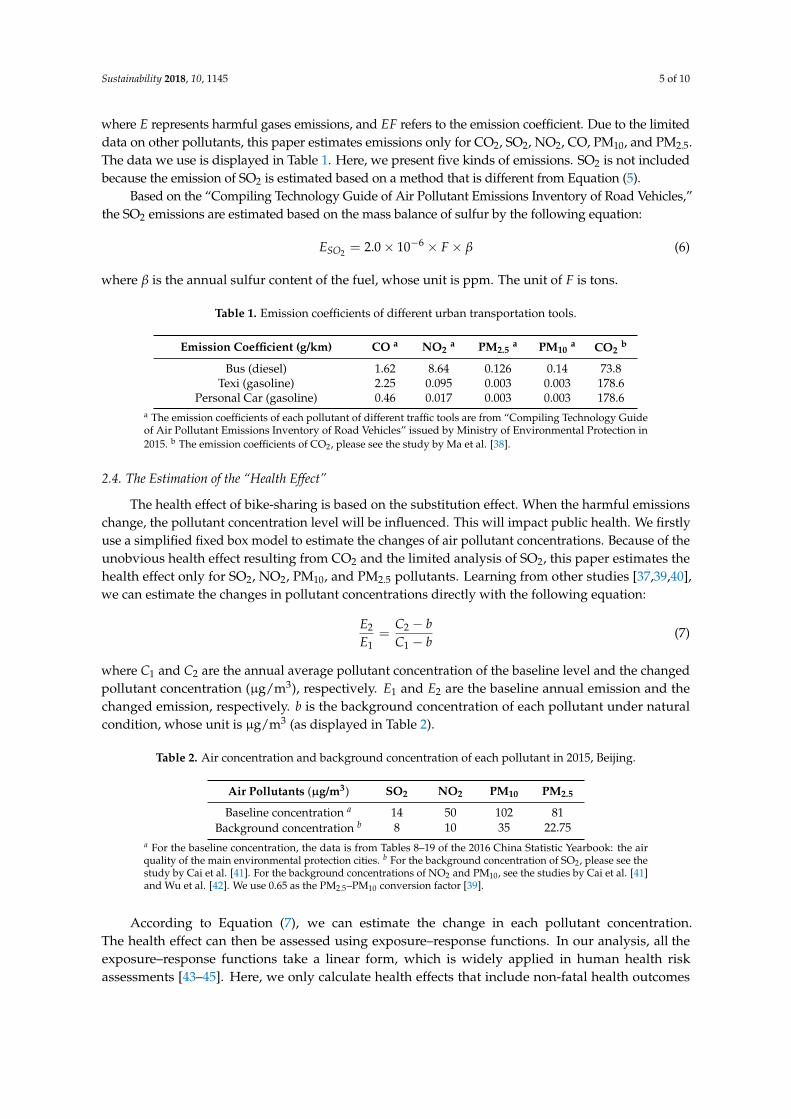
where E represents harmful gases emissions, and EF refers to the emission coefficient. Due to the limiteddata on other pollutants, this paper estimates emissions only for CO2, SO2, NO2, CO, PM10, and PM2.5.The data we use is displayed in Table 1. Here, we present five kinds of emissions. SO2 is not includedbecause the emission of SO2 is estimated based on a method that is different from Equation (5).
Based on the “Compiling Technology Guide of Air Pollutant Emissions Inventory of Road Vehicles,”the SO2 emissions are estimated based on the mass balance of sulfur by the following equation:
ESO2 = 2.0 × 10⁻⁶ × F × β (6)
where β is the annual sulfur content of the fuel, whose unit is ppm. The unit of F is tons.
Table 1. Emission coefficients of different urban transportation tools.
Emission Coefficient (g/km) CO a NO2a PM2.5
a PM10a CO2
b
Bus (diesel) 1.62 8.64 0.126 0.14 73.8Texi (gasoline) 2.25 0.095 0.003 0.003 178.6
Personal Car (gasoline) 0.46 0.017 0.003 0.003 178.6a The emission coefficients of each pollutant of different traffic tools are from “Compiling Technology Guideof Air Pollutant Emissions Inventory of Road Vehicles” issued by Ministry of Environmental Protection in2015. b The emission coefficients of CO2, please see the study by Ma et al. [38].
2.4. The Estimation of the “Health Effect”
The health effect of bike-sharing is based on the substitution effect. When the harmful emissionschange, the pollutant concentration level will be influenced. This will impact public health. We firstlyuse a simplified fixed box model to estimate the changes of air pollutant concentrations. Because of theunobvious health effect resulting from CO2 and the limited analysis of SO2, this paper estimates thehealth effect only for SO2, NO2, PM10, and PM2.5 pollutants. Learning from other studies [37,39,40],we can estimate the changes in pollutant concentrations directly with the following equation:
E2
E1=
C2 − bC1 − b
(7)
where C1 and C2 are the annual average pollutant concentration of the baseline level and the changedpollutant concentration (µg/m3), respectively. E1 and E2 are the baseline annual emission and thechanged emission, respectively. b is the background concentration of each pollutant under naturalcondition, whose unit is µg/m3 (as displayed in Table 2).
Table 2. Air concentration and background concentration of each pollutant in 2015, Beijing.
Air Pollutants (µg/m3) SO2 NO2 PM10 PM2.5
Baseline concentration a 14 50 102 81Background concentration b 8 10 35 22.75
a For the baseline concentration, the data is from Tables 8–19 of the 2016 China Statistic Yearbook: the airquality of the main environmental protection cities. b For the background concentration of SO2, please see thestudy by Cai et al. [41]. For the background concentrations of NO2 and PM10, see the studies by Cai et al. [41]and Wu et al. [42]. We use 0.65 as the PM2.5–PM10 conversion factor [39].
According to Equation (7), we can estimate the change in each pollutant concentration.The health effect can then be assessed using exposure–response functions. In our analysis, all theexposure–response functions take a linear form, which is widely applied in human health riskassessments [43–45]. Here, we only calculate health effects that include non-fatal health outcomes

Sustainability 2018, 10, 1145 6 of 10
(respiratory hospital admission, cardiovascular hospital admission, and asthma attack) and mortality(total mortality, respiratory mortality, and cardiovascular mortality).
Casen,i = ERn,i × Ci × P × Mn (8)
where ERn,i stands for exposure–response coefficients for mortality from different causes n andpollutant i, Ci is the concentration of pollutant i, and P is the population. Mn refers to the mortalityrate from different causes n.
Casej,i = ERj,i × Ci × P (9)
where ERj,i represents exposure–response coefficients for non-fatal health outcome j and pollutant i.Finally, the numbers of health cases are valuated in terms of RMB yuan with multiplying by unit
values. The detailed data of the exposure–response coefficients for mortality and non-fatal healthoutcomes, and the unit values can be found in Tables 3 and 4 in the study by He and Qiu [40].
3. Estimation Results
In this study, we estimate the externalities of the bike-sharing program in Beijing in terms of thesupplement effect, the substitution effect, and the health effect. To estimate the supplement effect ofbike-sharing, the first step was to estimate the change in commute time for office workers, which iscalculated on the basis of the difference between riding speed and walking speed. Our result, estimatedby Equation (1), shows that each worker who uses the bike-sharing service saves an average of 8 minper day. In this paper, we use the average distance of commuting and average bike riding speedpublished by Beijing Municipal Commission of Transport. It is noteworthy that this method mayunderestimate the result if we consider congestion. This extra time has an impact upon economicgrowth and efficiency. According to [33,35], leisure time had a weak negative effect on the economy ofChina before 2011. However, an approximate quadratic curve has been found to suit the relationshipbetween leisure time and Chinese economic development. After 1996, leisure time had a positive effecton the economy [33]. In addition, the results of the negative effect are based on the period 1980–2011and 1994–2011, respectively. In recent years, China has seen rapid development, so we have reasons tobelieve that leisure time had a positive effect on the economy of China in 2015. Therefore, we estimatethe supplement effect under three different modes: the U.S. mode, the Danish mode, and the Japanesemode. The estimation results show that the per capita GDP of Beijing would increase by RMB55.72yuan, and the total GDP of Beijing would increase by about RMB1.20 billion yuan in the Americanmodel. Following the Danish template, Beijing’s per capita GDP would increase by RMB27.41 yuan,and GDP would increase by about RMB592.25 million yuan. Moreover, in the Japanese model, the percapita GDP of Beijing would increase by RMB15.63 yuan, and the GDP would increase by RMB337.87million yuan. This estimation shows that a bike-sharing program can have a great positive effect onthe city’s economic development.
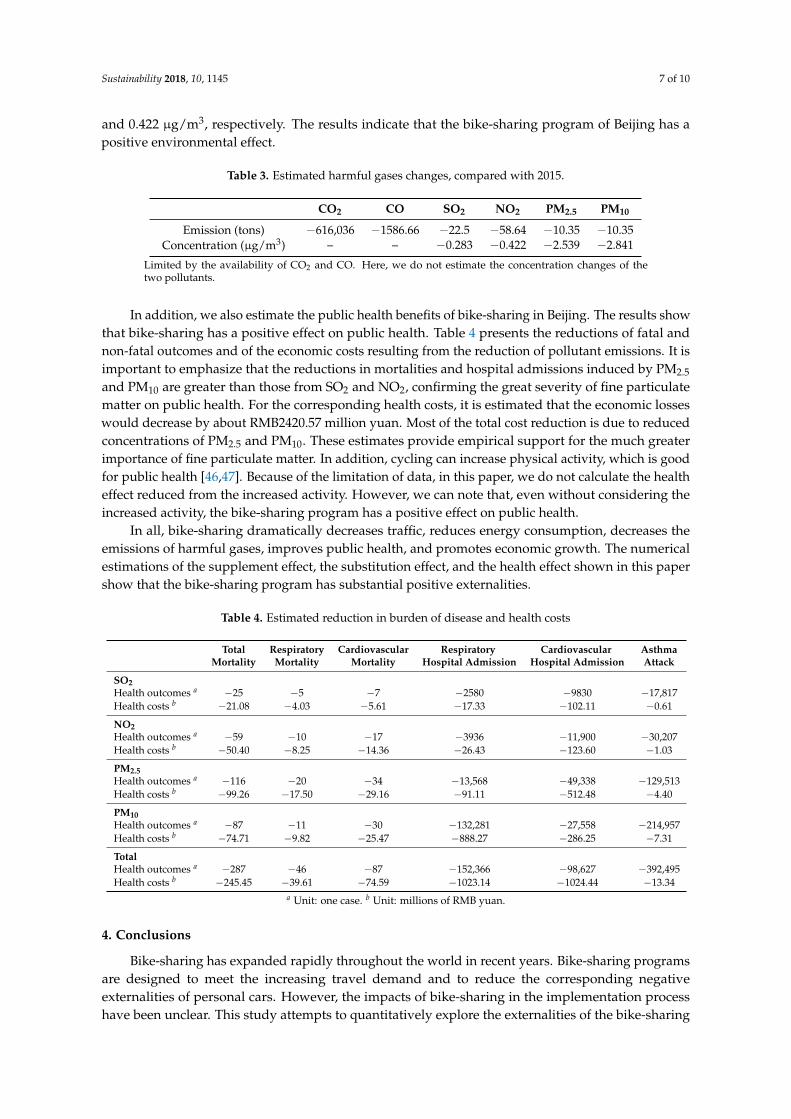
As per Equations (4)–(6), the substitution effect of bike-sharing was estimated by calculatingchanges in energy and emissions. Results indicate that, when the demand for personal car use ispartly replaced by bike-sharing, energy consumption and air pollutant emissions (emission quantitiesand concentrations) both decline correspondingly. To be more specific, compared with the baselineyear 2015, if 75% of the kilometers traveled by bicycle replaced that amount of kilometers traveled bycars, energy consumption would be reduced by nearly 225.06 thousand tons. Furthermore, the emissionof CO2 from road transport in Beijing would decrease by nearly 616.04 thousand tons, and emissionsof SO2, NO2, and CO would decrease by 22.50, 58.64, and 1586.66 tons, respectively. The reducedamount of PM10 and PM2.5 emissions would both total 10.35 tons. These results are displayed in Table 3.The negative in Table 3 means that, compared with 2015, in the scenario where car driving is partlyreplaced by bike-sharing, energy consumption and air pollutant emissions decline correspondingly.We can also see that the concentration of PM2.5 and PM10 would decrease by 2.539 µg/m3 and2.841 µg/m3, respectively. The reduced levels of SO2 and NO2 are relatively small, i.e., 0.283 µg/m3
Sustainability 2018, 10, 1145 7 of 10
and 0.422 µg/m3, respectively. The results indicate that the bike-sharing program of Beijing has apositive environmental effect.
Table 3. Estimated harmful gases changes, compared with 2015.
CO2 CO SO2 NO2 PM2.5 PM10
Emission (tons) −616,036 −1586.66 −22.5 −58.64 −10.35 −10.35Concentration (µg/m3) – – −0.283 −0.422 −2.539 −2.841
Limited by the availability of CO2 and CO. Here, we do not estimate the concentration changes of thetwo pollutants.
In addition, we also estimate the public health benefits of bike-sharing in Beijing. The results showthat bike-sharing has a positive effect on public health. Table 4 presents the reductions of fatal andnon-fatal outcomes and of the economic costs resulting from the reduction of pollutant emissions. It isimportant to emphasize that the reductions in mortalities and hospital admissions induced by PM2.5
and PM10 are greater than those from SO2 and NO2, confirming the great severity of fine particulatematter on public health. For the corresponding health costs, it is estimated that the economic losseswould decrease by about RMB2420.57 million yuan. Most of the total cost reduction is due to reducedconcentrations of PM2.5 and PM10. These estimates provide empirical support for the much greaterimportance of fine particulate matter. In addition, cycling can increase physical activity, which is goodfor public health [46,47]. Because of the limitation of data, in this paper, we do not calculate the healtheffect reduced from the increased activity. However, we can note that, even without considering theincreased activity, the bike-sharing program has a positive effect on public health.
In all, bike-sharing dramatically decreases traffic, reduces energy consumption, decreases theemissions of harmful gases, improves public health, and promotes economic growth. The numericalestimations of the supplement effect, the substitution effect, and the health effect shown in this papershow that the bike-sharing program has substantial positive externalities.
Table 4. Estimated reduction in burden of disease and health costs
Total Respiratory Cardiovascular Respiratory Cardiovascular AsthmaMortality Mortality Mortality Hospital Admission Hospital Admission Attack
SO2Health outcomes a −25 −5 −7 −2580 −9830 −17,817Health costs b −21.08 −4.03 −5.61 −17.33 −102.11 −0.61
NO2Health outcomes a −59 −10 −17 −3936 −11,900 −30,207Health costs b −50.40 −8.25 −14.36 −26.43 −123.60 −1.03
PM2.5Health outcomes a −116 −20 −34 −13,568 −49,338 −129,513Health costs b −99.26 −17.50 −29.16 −91.11 −512.48 −4.40
PM10Health outcomes a −87 −11 −30 −132,281 −27,558 −214,957Health costs b −74.71 −9.82 −25.47 −888.27 −286.25 −7.31
TotalHealth outcomes a −287 −46 −87 −152,366 −98,627 −392,495Health costs b −245.45 −39.61 −74.59 −1023.14 −1024.44 −13.34
a Unit: one case. b Unit: millions of RMB yuan.
4. Conclusions
Bike-sharing has expanded rapidly throughout the world in recent years. Bike-sharing programsare designed to meet the increasing travel demand and to reduce the corresponding negativeexternalities of personal cars. However, the impacts of bike-sharing in the implementation processhave been unclear. This study attempts to quantitatively explore the externalities of the bike-sharing

Sustainability 2018, 10, 1145 8 of 10
program of Beijing on the economy, fuel consumption, the environment, and public health. The resultsprovide empirical evidence for the impacts of bike-sharing across the world, and provide importantand useful information for urban transportation policies.
Overall, our study finds that the bike-sharing programs have positive externalities. Accordingto our estimation, the supplement effect, the substitution effect, and the health effect resulting frombike-sharing programs are all positive. Specifically, bike-sharing programs can help residents savetime, which further promotes the economic development of the city. In our study, we estimated thesupplement effect of bike-sharing, as a connection to other modes of urban traffic. Our results showthat bike-sharing in Beijing can help each worker save an average of 8 min per day. This additional timecan increase the total GDP of Beijing by about RMB1.20 billion, 592.25 million, and 337.87 million yuanaccording to American, Danish, and Japanese models, respectively. In addition, under a scenario where75% of kilometers traveled by bicycle replaces that amount of kilometers traveled via personal vehiclein Beijing, fuel consumption is reduced by 225.06 thousand tons. Accordingly, air pollutant emissionsand concentrations both decline (Table 3), which constitutes a further positive impact on public health.Our results show that bike-sharing would decrease health costs by about RMB2420.57 million yuan.However, it is important to note that, in our study, we only estimate the impact of bike-sharing onoffice workers, not all urban residents. Moreover, we do not consider the health impact of increasedactivity resulting from increased bike usage. Therefore, the estimation would undervalue the impactsof bike-sharing.
In summary, the results gained from this paper provide a better understanding of the externalitiesof bike-sharing programs. We found that bike-sharing programs have positive externalities on theeconomy, energy use, the environment, and public health. Although bike-sharing programs havesome negative externalities, such as bicycle maintenance and management, we believe that thenegative externalities are controllable. The findings of this paper can provide empirical evidencefor policy makers in urban communities that want to explore bicycle-sharing systems. In general,bike-sharing programs can play a critical role in the process of urban transportation development.Moreover, the externalities of bike-sharing are not limited to aspects of the economy, the environment,and health. Bike-sharing is also helpful for urban congestion, noise pollution, etc. Therefore, ongoingresearch in areas such as congestion, noise pollution, social benefits, and safety is still needed.
Acknowledgments: The authors would like to thank Liu Li, Ou Jia-Jia, Wei Wei, and all other colleagues fromboth China Agricultural University and Jinan University for their help, constructive suggestions, and pertinentcomments. This project was supported by the National Natural Science Foundation of China (Grant Nos. 71573258and 71273261).
Author Contributions: L.-Y.H. is a professor of energy economics and environmental policies. L.-Y.Q. is a Ph.D.candidate supervised by L.-Y.H. All authors contributed equally in the project. L.-Y.H. and L.-Y.Q. conceived anddesigned the research. L.-Y.Q. calculated and analyzed the results under L.-Y.H.’s supervision. L.-Y.H. and L.-Y.Q.co-wrote the manuscript.
Conflicts of Interest: The authors declare no conflict of interest.
References
1. National Bureau of Statistics of China. China Statistical Yearbook; China Statistics Press: Beijing, China, 2017.2. Button, K. Environmental externalities and transport policy. Oxf. Rev. Econ. Policy 1990, 6, 61–75.3. Verhoef, E. External effects and social costs of road transport. Transp. Res. Part A Policy Pract. 1994, 28,
273–287.4. Calthrop, E.; Proost, S. Road transport externalities. Environ. Resour. Econ. 1998, 11, 335–348.5. Santos, G.; Behrendt, H.; Maconi, L.; Shirvani, T.; Teytelboym, A. Part I: Externalities and economic policies
in road transport. Res. Transp. Econ. 2010, 28, 2–45.6. Profillidis, V.A.; Botzoris, G.N.; Galanis, A.T. Environmental Effects and Externalities from the Transport
Sector and Sustainable Transportation Planning—A Review. Int. J. Energy Econ. Policy 2014, 4, 647.7. Venables, A.J. Evaluating urban transport improvements: Cost benefit analysis in the presence of
agglomeration and income taxation. J. Transp. Econ. Policy (JTEP) 2007, 41, 173–188.
Sustainability 2018, 10, 1145 9 of 10
8. Newbery, D.M. Pricing and congestion: Economic principles relevant to pricing roads. Oxf. Rev. Econ. Policy1990, 6, 22–38.
9. Small, K.A.A.; Verhoef, E.T. The Economics of Urban Transportation; Rout ledge: London, UK, 2007.10. Parry, I.W.H.; Walls, M.; Harrington, H. Automobile externalities and policies. J. Econ. Lit. 2007, 45, 373–399.11. Pigou, A.C. The Report of the Royal Commission on the British Income Tax. Q. J. Econ. 1920, 34, 607–625.12. Barnett, A.H. The Pigouvian Tax Rule Under Monopoly. Am. Econ. Rev. 1980, 70, 1037–1041.13. Piga, C.A.G. Pigouvian Taxation in Tourism. Environ. Resour. Econ. 2003, 26, 343–359.14. Cato, S. Environmental policy in a mixed market: Abatement subsidies and emission taxes. Environ. Econ.
Policy Stud. 2011, 13, 283–301.15. Marschinski, R.; Flachsland, C.; Jakob, M. Sectoral linking of carbon markets: A trade-theory analysis.
Resour. Energy Econ. 2012, 34, 585–606.16. Cheng, B.; Dai, H.; Wang, P.; Zhao, D.; Masui, T. Impacts of carbon trading scheme on air pollutant emissions
in Guangdong province of China. Energy Sustain. Dev. 2015, 27, 174–185.17. Bertram, C.; Luderer, G.; Pietzcker, R.C.; Schmid, E.; Kriegler, E.; Edenhofer, O. Complementing carbon
prices with technology policies to keep climate targets within reach. Nat. Clim. Chang. 2015, 5, 235–239.18. Aytur, S.A.; Rodriguez, D.A.; Evenson, K.R.; Catellier, D.J.; Rosamond, W.D. Promoting active community
environments through land use and transportation planning. Am. J. Health Promot. 2007, 21 (Suppl. 4),397–407.
19. Aljoufie, M. Toward integrated land use and transport planning in fast-growing cities: The case of Jeddah,Saudi Arabia. Habitat Int. 2014, 41, 205–215.
20. Mulley, C.; Clifton, G.T.; Balbontin, C.; Liang, M. Information for travelling: Awareness and usage of thevarious sources of information available to public transport users in NSW. Transp. Res. Part A Policy Pract.2017, 101, 111–132.
21. De Maio, P. Bike-sharing: History, impacts, models of provision, and future. J. Public Transp. 2009, 12, 41–56.22. Midgley, P. The role of smart bike-sharing systems in urban mobility. Journeys 2009, 2, 23–31.23. Shaheen, S.A.; Guzman, S.; Zhang, H. Bikesharing in Europe, the Americas, and Asia: Past, present,
and future. Transp. Res. Rec. J. Transp. Res. Board 2010, 2143, 159–167.24. Audikana, A.; Ravalet, E.; Baranger, V.; Kaufmann, V. Implementing bikesharing systems in small cities:
Evidence from the Swiss experience. Transp. Policy 2017, 55, 18–28.25. Zhang, Y.; Huang, Z. Performance evaluation of bike sharing system in Wuchang area of Wuhan, China.
In Proceedings of the China Planning Conference, Wuhan, China, 17–19 June 2012; IEEE: Piscataway, NJ, USA,2012; pp. 1–10.
26. Gleason, R.; Miskimins, L. Exploring Bicycle Options for Federal Lands: Bike Sharing, Rentals andEmployee Fleets. Report Number FHWA-WFL/TD-12-001, Federal Highway Administration 2012. Availableonline: https://trid.trb.org/Results?txtKeywords=Exploring+Bicycle+Options+for+Federal+Lands#/View/1137968 (accessed on 10 April 2018).
27. Nair, R.; Miller-Hooks, E.; Hampshire, R.C.; Busic, A. Large-scale vehicle sharing systems: Analysis of Velib’.Int. J. Sustain. Transp. 2013, 7, 85–106.
28. Martin, E; Cohen, A.; Botha, J.; Shaheen, S. Bikesharing and Bicycle Safety. San Jose, CA:Mineta Transportation Institute 2016. Available online: http://transweb.sjsu.edu/research/bikesharing-and-bicycle-safety (accessed on 10 April 2018).
29. Raviv, T.; Tzur, M.; Forma, I.A. Static repositioning in a bike-sharing system: Models and solution approaches.EURO J. Transp. Logist. 2013, 2, 187–229.
30. Eichenbaum, M.S.; Hansen, L.P.; Singleton, K.J. A time series analysis of representative agent models ofconsumption and leisure choice under uncertainty. Q. J. Econ. 1988, 103, 51–78.
31. Gocke, M. Leisure versus learning-by-doing-saturation effects and utility-side limits to endogenous growth.Econ. Model. 2002, 19, 585–609.
32. Pintea, M.I. Leisure externalities: Implications for growth and welfare. J. Macroecon. 2010, 32, 1025–1040.33. Wei, X. Is China an inefficient country? A transnational comparison from the perspective of leisure.
China Soft Sci. 2014, 8, 49–60.34. Beijing Transport Institute. The Annual Report of Beijing Transport Development of 2016. Available online:
http://www.bjtrc.org.cn/JGJS.aspx?id=5.2&Menu=GZCG (accessed on 10 April 2018).

Sustainability 2018, 10, 1145 10 of 10
35. Ge, X.Y.; Ye, T.F.; Hu, C.B. Income taxation and leisure time’s impact on China’s economy growth. Econ. Surv.2014, 31, 126–131.
36. Beijing Municipal General Office, 2016. Available online: http://www.bjjtw.gov.cn/xxgk/xwfbh/201602/t20160205_117882.html (accessed on 10 April 2018).
37. Yang, S.; He, L.Y. Fuel demand, road transport pollution emissions and residents’ health losses in thetransitional China. Transp. Res. Part D Transp. Environ. 2016, 42, 45–59.
38. Ma, J.; Chai, Y.W.; Liu, Z.H.L. The mechanism of CO2 emissions from urban transport based on individuals’travel behaviour in Beijing. Acta Geogr. Sin. 2011, 66, 1023–1032.
39. Chen, S.M.; He, L.Y. Welfare loss of China’s air pollution: How to make personal vehicle transportationpolicy. China Econ. Rev. 2014, 31, 106–118.
40. He, L.Y.; Qiu, L.Y. Transport demand, harmful emissions, environment and health co-benefits in China.Energy Policy 2016, 97, 267–275.
41. Cai, X.H.; Zhang, R.; Song, Y.; Xie, S.D. An analysis on background concentration of PM10 and SO2 overBeijing area. Clim. Environ. Res. 2004, 9, 445–453.
42. Wu, D.; Xin, J.; Sun, Y.; Wang, Y.; Wang, P. Change and analysis of background concentration of air pollutantsin north China during 2008 Olympic games. Environ. Sci. 2010, 31, 1130–1138.
43. Guo, X.; Cheng, S.; Chen, D.; Zhou, Y.; Wang, H. Estimation of economic costs of particulate air pollutionfrom road transport in China. Atmos. Environ. 2010, 44, 3369–3377.
44. Wang, X.; Mauzerall, D.L. Evaluating impacts of air pollution in China on public health: Implications forfuture air pollution and energy policies. Atmos. Environ. 2006, 40, 1706–1721.
45. Quah, E.; Boon, T.L. The economic cost of particulate air pollution on health in Singapore. J. Asian Econ.2003, 14, 73–90.
46. Cavill, N.; Watkins, F. Cycling and health: An exploratory study of views about cycling in an area of NorthLiverpool, UK. Health Educ. 2007, 107, 404–420.
47. Shepard, R. Is Active Commuting the answer to population health? Sports Med. 2008, 39, 751–758.
c© 2018 by the authors. Licensee MDPI, Basel, Switzerland. This article is an open accessarticle distributed under the terms and conditions of the Creative Commons Attribution(CC BY) license (http://creativecommons.org/licenses/by/4.0/).
Copyright © 2022 FDOKUMEN