Big Game Hunting and Outfitting Economic Contributions in ...
8
BIG MONEY Big Game Hunting and Outfitting Economic Contributions in Wyoming
-
Upload
khangminh22 -
Category
Documents
-
view
1 -
download
0
Transcript of Big Game Hunting and Outfitting Economic Contributions in ...
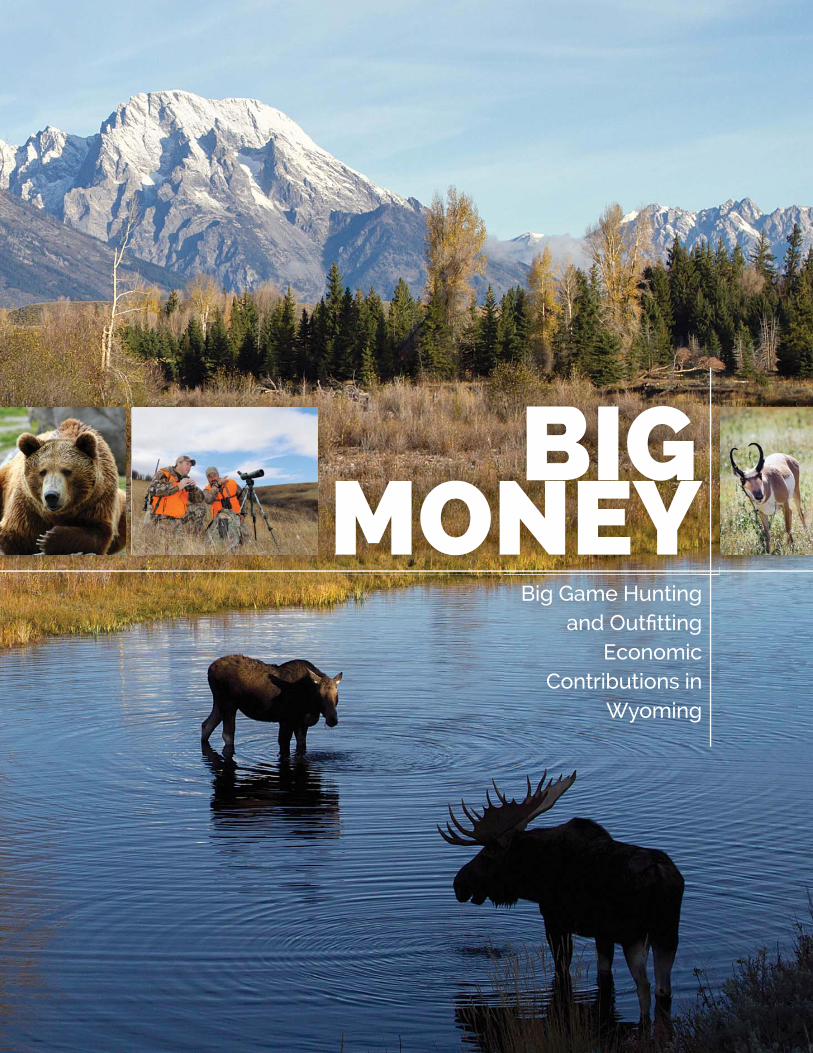
BIG MONEY
Big Game Hunting and Outfi tting
Economic Contributions in
Wyoming
2
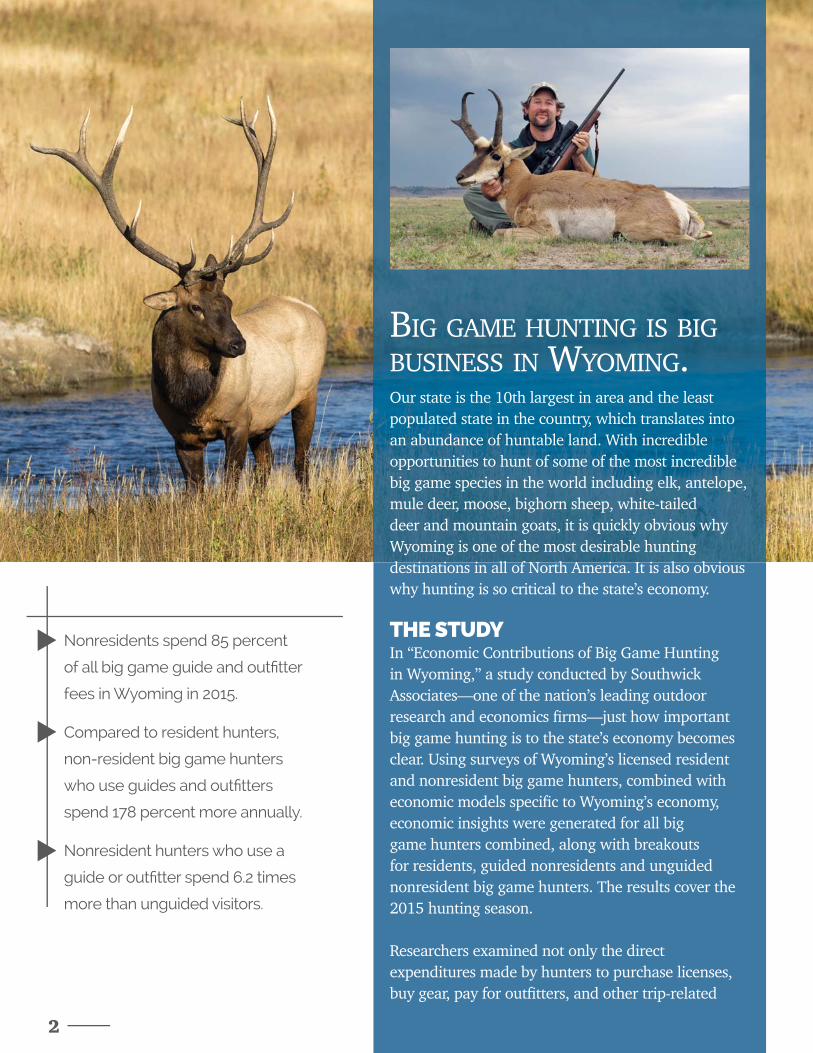
Our state is the 10th largest in area and the least populated state in the country, which translates into an abundance of huntable land. With incredible opportunities to hunt of some of the most incredible big game species in the world including elk, antelope, mule deer, moose, bighorn sheep, white-tailed deer and mountain goats, it is quickly obvious why Wyoming is one of the most desirable hunting destinations in all of North America. It is also obvious why hunting is so critical to the state’s economy.
THE STUDYIn “Economic Contributions of Big Game Hunting in Wyoming,” a study conducted by Southwick Associates—one of the nation’s leading outdoor research and economics fi rms—just how important big game hunting is to the state’s economy becomes clear. Using surveys of Wyoming’s licensed resident and nonresident big game hunters, combined with economic models specifi c to Wyoming’s economy, economic insights were generated for all big game hunters combined, along with breakouts for residents, guided nonresidents and unguided nonresident big game hunters. The results cover the 2015 hunting season.
Researchers examined not only the direct expenditures made by hunters to purchase licenses, buy gear, pay for outfi tters, and other trip-related
BIG GAME HUNTING IS BIG BUSINESS IN WYOMING.
Nonresidents spend 85 percent
of all big game guide and outfi tter
fees in Wyoming in 2015.
Compared to resident hunters,
non-resident big game hunters
who use guides and outfi tters
spend 178 percent more annually.
Nonresident hunters who use a
guide or outfi tter spend 6.2 times
more than unguided visitors.
▼▼
▼
3
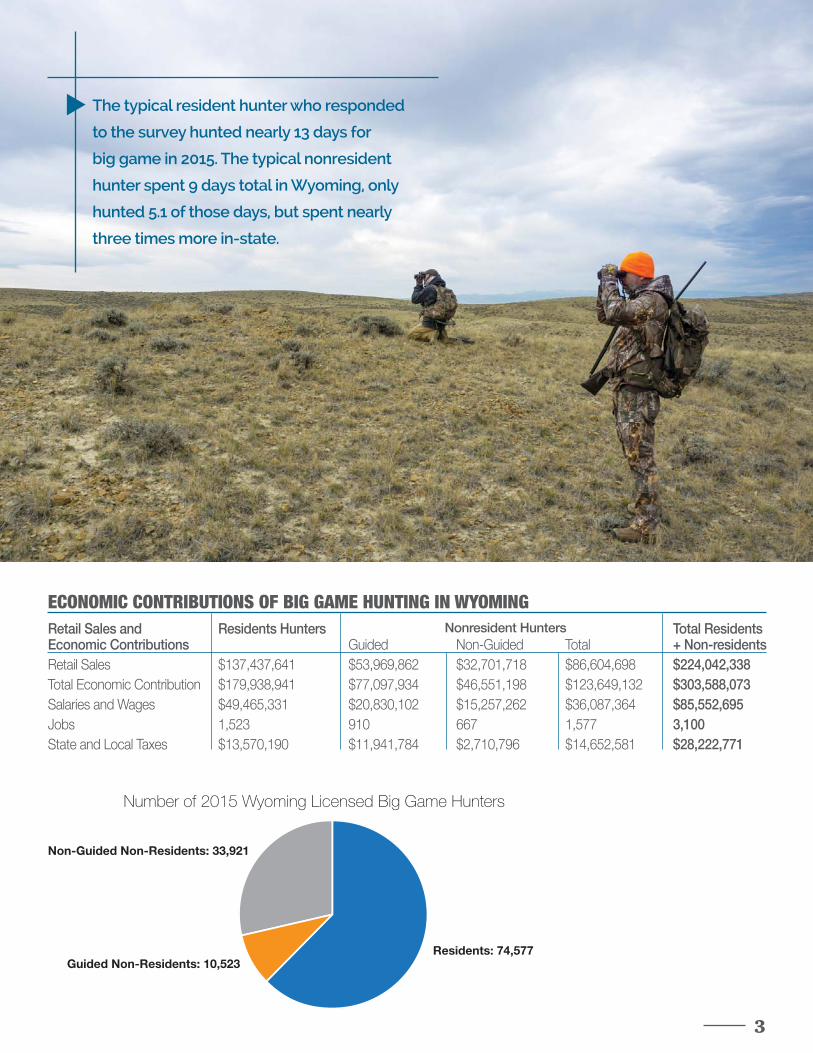
The typical resident hunter who responded
to the survey hunted nearly 13 days for
big game in 2015. The typical nonresident
hunter spent 9 days total in Wyoming, only
hunted 5.1 of those days, but spent nearly
three times more in-state.
Non-Guided Non-Residents: 33,921
Number of 2015 Wyoming Licensed Big Game Hunters
Residents: 74,577Guided Non-Residents: 10,523
▼
Retail Sales and Residents Hunters Total ResidentsEconomic Contributions Guided Non-Guided Total + Non-residentsRetail Sales $137,437,641 $53,969,862 $32,701,718 $86,604,698 $224,042,338 Total Economic Contribution $179,938,941 $77,097,934 $46,551,198 $123,649,132 $303,588,073 Salaries and Wages $49,465,331 $20,830,102 $15,257,262 $36,087,364 $85,552,695 Jobs 1,523 910 667 1,577 3,100State and Local Taxes $13,570,190 $11,941,784 $2,710,796 $14,652,581 $28,222,771
Nonresident Hunters
ECONOMIC CONTRIBUTIONS OF BIG GAME HUNTING IN WYOMING
4
expenses such as airline tickets, gas, hotels, food and restaurants, but also the state-wide multiplier effects of those expenses. These include jobs supported from their expenditures, income and tax revenues generated, and other pass-along economic benefi ts as people and businesses who directly benefi t from hunter dollars in turn spend those dollars on products and services themselves.
HUNTING OVERVIEWWyoming hosted more than 119,000 big game hunters in 2015, of which 63 percent were residents and 37 percent were nonresidents. Those hunters, that same year, spent $224 million on gear, travel, guides and other goods and services in Wyoming, which in turn generated economic benefi ts that extended to all state residents. These same dollars went on to support 3,100 jobs—more than many Fortune 500 companies; $85.6 million in salaries, wages and small business income—or $146 per state resident of any age; plus $28.2 million in state and local tax revenues. Looking at the bigger picture, big game hunting spending created a multiplier effect, or rounds of spending, of $303.6 million. In other words, if big game hunters took all their dollars out of state, the Wyoming economy would shrink by $303.6 million.
For a state like Wyoming, rural in nature and short on big industry, hunting is big industry and the numbers above testify to this fact. It is critical to all residents for hunting to generate as much money as possible for the state. This is an important distinction to make
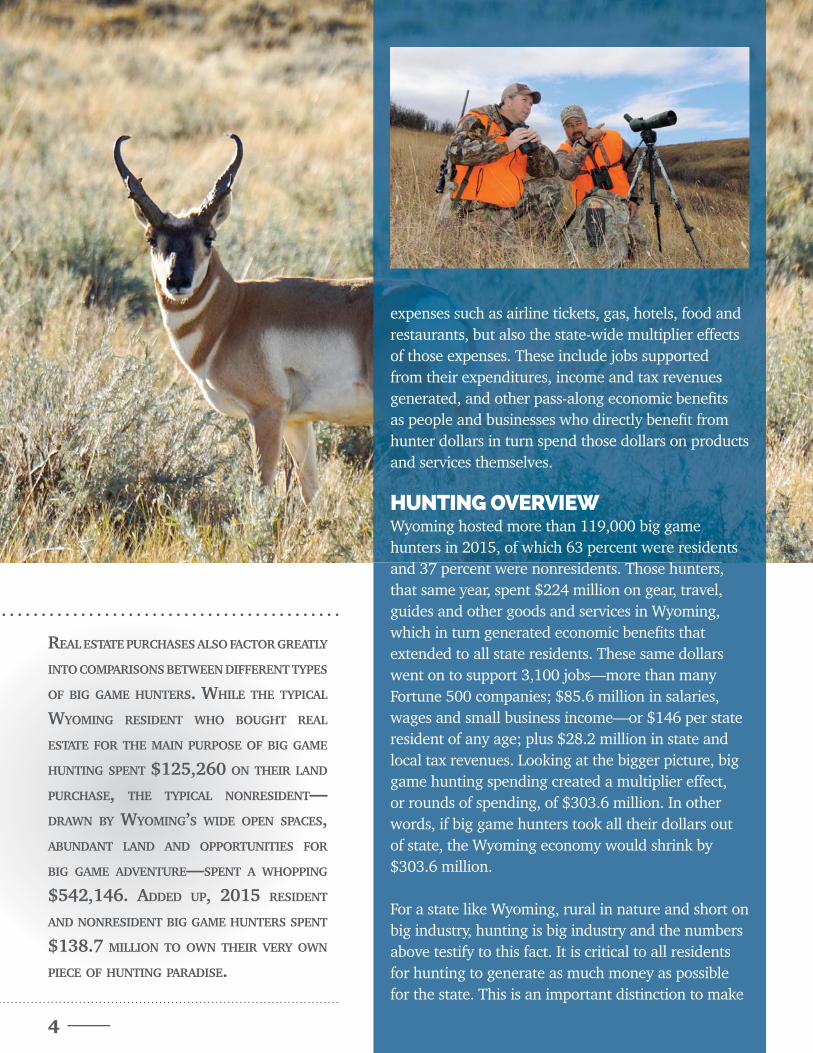
REAL ESTATE PURCHASES ALSO FACTOR GREATLY INTO COMPARISONS BETWEEN DIFFERENT TYPES OF BIG GAME HUNTERS. WHILE THE TYPICAL WYOMING RESIDENT WHO BOUGHT REAL ESTATE FOR THE MAIN PURPOSE OF BIG GAME HUNTING SPENT $125,260 ON THEIR LAND PURCHASE, THE TYPICAL NONRESIDENT—DRAWN BY WYOMING’S WIDE OPEN SPACES, ABUNDANT LAND AND OPPORTUNITIES FOR BIG GAME ADVENTURE—SPENT A WHOPPING $542,146. ADDED UP, 2015 RESIDENT AND NONRESIDENT BIG GAME HUNTERS SPENT $138.7 MILLION TO OWN THEIR VERY OWN PIECE OF HUNTING PARADISE.
55
to stakeholders involved in or benefi tting from Wyoming’s hunting future. But is all hunting or are all hunters equal when it comes to generating economic benefi ts for the state and its residents?
While they are all benefi cial, they absolutely are not all equal the study reveals. In fact, despite accounting for nearly one out of every three hunters in the state, nonresident hunters, particularly those hiring outfi tters, generate a disproportionate amount of the economic benefi ts.
RESIDENTS VS. NONRESIDENTSReducing the number of nonresident tags could exponentially negatively impact tax revenues, sales revenues and jobs in the state. Here’s a look at why by the numbers:
• 63 percent of all big game hunters are residents and they generate 61 percent of big game-related monies spent in the state.
• With only 37 percent of hunters being nonresidents and accounting for only 39 percent of all big game hunting retail sales (many will buy gear and equipment in their home state prior to arriving in Wyoming), they still generate 41 percent of the total activity, 51 percent of the jobs and 52 percent of tax receipts generated by big game hunting.
• Nonresidents accounted for 63 percent of all travel dollars spent by the state’s big game hunters. These are dollars spent on
Spending Categories Residents Total
Guided Non-Guided All Non-Residents
Commercial transportation $4,626,309 $4,990,622 $4,569,393 $9,509,908 $14,136,218
Other transportation costs $12,970,958 $1,901,014 $6,421,511 $8,323,036 $21,293,995
Groceries $9,033,352 $943,013 $3,834,037 $4,777,381 $13,810,733
Restaurants and bars $3,903,413 $1,268,000 $3,564,140 $4,830,731 $8,734,144
Lodging $2,319,997 $2,083,324 $4,548,655 $6,619,139 $8,939,137
Equipment rental $525,831 $279,630 $825,479 $1,104,881 $1,630,711
Fees paid to landowners $460,257 $808,332 $2,648,278 $3,456,781 $3,917,038
Heating/cooking fuel, ice, etc. $2,926,317 $205,064 $1,007,640 $1,212,464 $4,138,781
Other items $2,599,875 $525,171 $1,337,185 $1,859,285 $4,459,161
Guides/Outfi tters $7,140,706 $38,294,923 $0 $38,294,923 $45,435,629
Total Travel Spending: $46,507,016 $51,299,094 $28,756,318 $79,988,530 $126,495,546
Ammunition $4,966,439 $51,008 $158,355 $209,364 $5,175,803
Firearms & bows $7,555,665 $34,837 $220,522 $255,359 $7,811,025
Optics $9,729,233 $97,013 $164,778 $261,791 $9,991,024
Binoculars, cameras $2,800,035 $53,941 $46,361 $100,302 $2,900,337
Clothing $4,241,195 $194,239 $366,641 $560,881 $4,802,076
Other hunting gear $3,328,389 $62,812 $235,640 $298,452 $3,626,841
ATV, trailer, accessories $13,523,368 $3,223 $66,692 $69,915 $13,593,283
Boat, motor, trailer, accessories $438,346 $6,217 $8,651 $14,867 $453,213
Travel trailer, motor home, etc. $8,721,968 $0 $1,839 $1,839 $8,723,807
Motor vehicle $20,518,031 $0 $13,764 $13,764 $20,531,794
Maps $806,807 $31,433 $211,694 $243,127 $1,049,933
Repair of hunting equipment $1,424,723 $18,449 $140,503 $158,952 $1,583,676
Taxidermy $3,970,331 $865,714 $519,640 $1,385,354 $5,355,685
Meat processing and/or shipping $3,948,332 $1,146,633 $1,283,972 $2,430,605 $6,378,937
Camping equipment $1,739,412 $29,315 $151,129 $180,445 $1,919,856
Hunting dogs $1,230,594 $1,604 $0 $1,604 $1,232,198
Books, magazines, $436,845 $7,653 $39,787 $47,440 $484,286
Other hunting-related equipment $1,550,911 $66,675 $315,432 $382,107 $1,933,018
Total Equipment Spending: $90,930,625 $2,670,767 $3,945,400 $6,616,168 $97,546,792
Total, Travel + Equipment = $137,437,641 $53,969,862 $32,701,718 $86,604,698 $224,042,338
All Non-Resident Big Game Hunting
SPENDING BY WYOMING’S BIG GAME HUNTERS, 2015
66
lodging, food (both restaurants and grocery stores), gas stations, guides and outfi tters and other companies supporting hunters’ travel needs.
• Including equipment, nonresidents spend 39 percent of all dollars associated with big game hunting in Wyoming, and 85 percent of all big game guide and outfi tter fees.
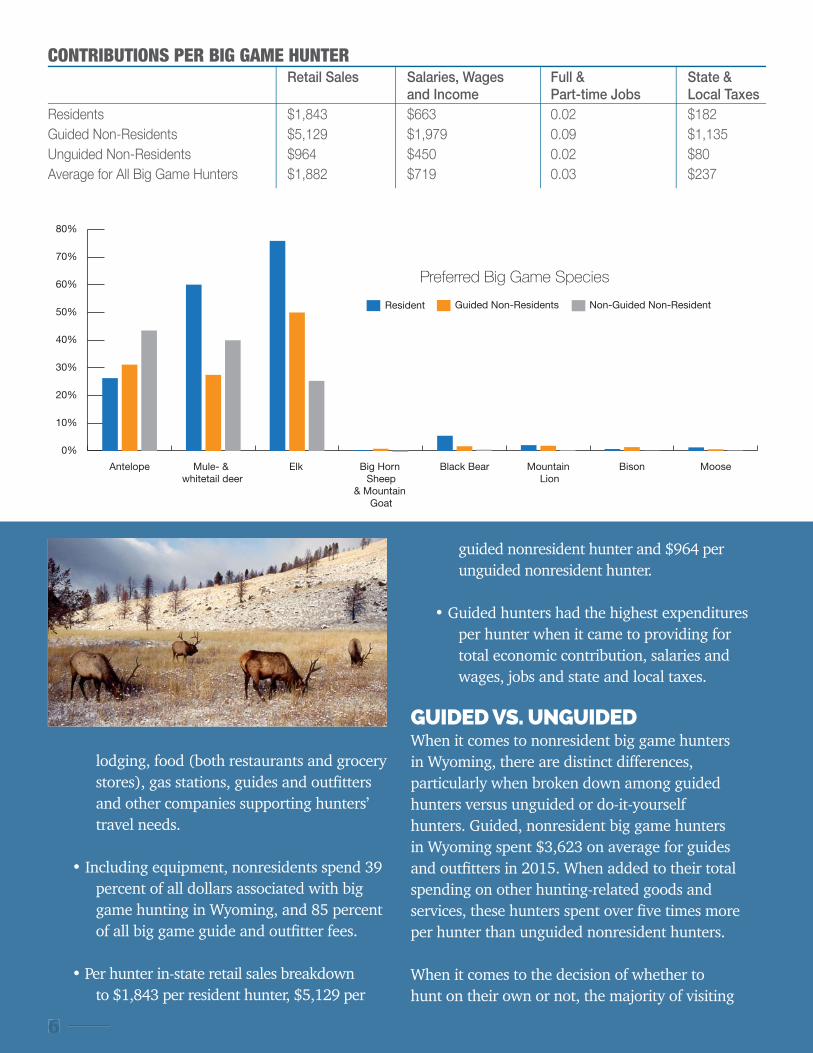
• Per hunter in-state retail sales breakdown to $1,843 per resident hunter, $5,129 per
guided nonresident hunter and $964 per unguided nonresident hunter.
• Guided hunters had the highest expenditures per hunter when it came to providing for total economic contribution, salaries and wages, jobs and state and local taxes.
GUIDED VS. UNGUIDEDWhen it comes to nonresident big game hunters in Wyoming, there are distinct differences, particularly when broken down among guided hunters versus unguided or do-it-yourself hunters. Guided, nonresident big game hunters in Wyoming spent $3,623 on average for guides and outfi tters in 2015. When added to their total spending on other hunting-related goods and services, these hunters spent over fi ve times more per hunter than unguided nonresident hunters.
When it comes to the decision of whether to hunt on their own or not, the majority of visiting
Retail Sales Salaries, Wages Full & State & and Income Part-time Jobs Local TaxesResidents $1,843 $663 0.02 $182 Guided Non-Residents $5,129 $1,979 0.09 $1,135 Unguided Non-Residents $964 $450 0.02 $80Average for All Big Game Hunters $1,882 $719 0.03 $237
CONTRIBUTIONS PER BIG GAME HUNTER
0%
10%
20%
30%
40%
50%
60%
70%
80%
Non-Guided Non-ResidentGuided Non-ResidentsResident
MooseBisonMountain Lion
Black BearBig Horn Sheep
& Mountain Goat
ElkMule- & whitetail deer
Antelope
Preferred Big Game Species
7
hunters prefer the do-it-yourself approach with only 24 percent using guides and outfi tters. However, this smaller group accounted for 64 percent of all travel-related dollars. Guided hunters also account for 85 percent of all big game guide and outfi tter fees. Outfi tters and guides were paid a total of $45.4 million by resident and nonresident hunters in 2015—again, 85 percent of that by nonresidents.
Monies spent for guides and outfi tters go to support jobs both directly hired by the outfi tters and for services ancillary to hunting activities such as lodging, food and taxidermy. Funds to outfi tters and guides also provide much-needed revenue streams for landowners who provide access to their lands for the purpose of hunting. Revenues dedicated to compensate landowners for access to their properties came in to the tune of $9.5 million annually.
FINAL TAKEBig game hunting in Wyoming is more than a hobby or casual pastime. It is big business that results in the expenditure of $224 million annually. While helping to support an entire industry built around outfi tting and guiding, the revenues generated transcend hunt-centric business and benefi t all state residents through funds spent on lodging, food, gas, other travel-related expenses, retail goods and services, land access and state and local taxes. Decisions that affect the allocation of future permits and licenses must carefully consider how big game hunting’s far-reaching economic benefi ts are created to ensure optimal economic benefi t for all Wyoming residents.
Elk is the most targeted
species by resident and
guided nonresident hunters.
Antelope and mule deer are
the most targeted species
by unguided nonresident
hunters.
▼▼
SOURCEEconomic Contributions of Big Game Hunting in Wyoming
Produced by Southwick Associates. January 2017
FUNDED BYCody Country Outfi tters & Guides Association
Dubois Outfi tters & Guides AssociationJackson Hole Outfi tters & Guides Association
Jim ConradLake Superior SCI ChapterNE Michigan SCI Chapter
RealtreeSafari Club International
Sublette County Outfi tters & Guides AssociationWyoming Offi ce of Tourism
Wyoming County Commissioner’s AssociationWyoming Stock Growers Association
Wyoming Outfi tters & Guides AssociationWyoming Game & Fish Commission
Wyoming Game Wardens AssociationWyoming Hunter Defense Fund
PRODUCED BYSouthwick Associates, Inc. Fernandina Beach, Florida.
Written by: Doug Howlett
LAYOUT AND DESIGNSweetpea Media, Fernandina Beach, Florida
Photos: Doug Howlett
Download full report at:https://wyoga.org/wp-content/uploads/pdf/studies/southwick-study/Wyoming-Big-Game-Hunting-Economics-Southwick-Associates-Final.pdf