Big Boxes, Power Centres and the Evolving Retail Landscape of Winnipeg: A Geographical Perspective
38
Big Boxes, Power Centres and the Evolving Retail Landscape of Winnipeg: A Geographical Perspective Research and Working Paper # 43 Brian J. Lorch Department of Geography Lakehead University, Thunder Bay, ON & Senior Research Associate Institute of Urban Studies University of Winnipeg Institute of Urban Studies 2004
Transcript of Big Boxes, Power Centres and the Evolving Retail Landscape of Winnipeg: A Geographical Perspective
Big Boxes, Power Centres and the Evolving Retail Landscape of Winnipeg:
A Geographical Perspective
Research and Working Paper # 43
Brian J. Lorch
Department of Geography Lakehead University, Thunder Bay, ON
&
Senior Research Associate Institute of Urban Studies
University of Winnipeg
Institute of Urban Studies
2004
PUBLICATION DATA Lorch, Brian Big Boxes, Power Centres and the Evolving Retail Landscape of Winnipeg: A Geographical Perspective Research and Working Paper # 43 ISBN 1-894858-12-3 I. The University of Winnipeg, Institute of Urban Studies. II. Title. III. Series: Research and Working Paper (The University of Winnipeg, Institute of Urban Studies); 43 This publication was funded by the Institute of Urban Studies but the views expressed are the personal views of the author. The Institute accepts no responsibility for them. Published by:
Institute of Urban Studies The University of Winnipeg
103-520 Portage Avenue Winnipeg, Manitoba
R3C 0G2
ISBN 1-894858-12-3
2004 Institute of Urban Studies
ii
Table of Contents
List of Tables iii List of Figures iii Acknowledgements iv Abstract v 1 Introduction 1 2 Overview of Big Box Store and Power Centre Development in Winnipeg 3 3 Underlying Economic Conditions Supporting Retail Expansion 5 4 Criteria for Defining Big Box Stores and Power Centres 8 5 Locational Pattern of Power Centre Development 9 6 Assessing the Fallout of Big Box and Power Centre Development 12 7 Power Centres and Consumer Spatial Behaviour 17 8 Looking to the Future 24 9 Summary and Conclusion 28 Endnotes 30 References 31
iii
List of Tables
Table 1 Examples of New Big Box Store Construction in Winnipeg, 1998-2002 5
List of Figures Figure 1 Value of Commercial Retail Building Permits, City of Winnipeg 4 Figure 2 Percentage Population Change in Prairie Census Metropolitan Areas, 1986-2002 6 Figure 3 Winnipeg Census Metropolitan Area Retail Sales 6 Figure 4 Change in Monthly Carrying Cost (Principal and Interest) on a $100,000 Mortgage, 1990 – 2002 7 Figure 5 Year End Close of the Dow Jones Industrial Average, 1990-2003 7 Figure 6 Quarterly Average Value of the United States Dollar in Canadian Funds, 1990-2002 8 Figure 7 Location of Major Planned Shopping Centres in Winnipeg 10 Figure 8 Average Household Income in Winnipeg Census Tracts, 2000 11 Figure 9 Old and New Faces of Canadian Tire 15 Figure 10 Vacancy Rates by Type of Retail Configuration in Winnipeg’s Major Suburban Retail Nodes 16 Figure 11 Site Plan of the Retail Development at Kenaston and McGillivray 19 Figure 12 Unfriendly Pedestrian Pathways in the Kenaston-McGillivray Retail Node 21 Figure 13 Retail Island Effect in Unicity Power Centre 22 Figure 14 Retail Island Effect in the Crossroads Station Power Centre 23 Figure 15 Longitudinal Trajectory of the Retail Cycle 24
iv
Acknowledgements
In November, 2003, I was asked to speak to a meeting of the Manitoba Professional Planners Institute (MPPI) held at the Fort Gary, Hotel in Winnipeg. This document represents the transformation of that morning’s presentation into a formal research report. I wish to thank Dr. Ian Wight, City Planning, University of Manitoba and Mr. Bill Budd of the MPPI for extending the invitation for me to speak. Over the past two years, the Institute of Urban Studies has made it possible for me to enjoy a reduced teaching load at Lakehead University and consequently enabled me to pursue research about Winnipeg’s retail landscape. The Institute’s on-going support is very much appreciated. Appreciation is also extended to my colleagues in the Geography Department at Lakehead University for their tolerance of my extended absences from campus. Particular appreciation is extended to Tom Carter and Jino Distasio who provided useful critiques of a draft of this report. Michelle Swanson, also of IUS, added valuable editorial comments.
v
ABSTRACT This report offers a geographical perspective on a wave of big box store and power centre development that Winnipeg experienced between 1998 and 2001. Analysis reveals that new retail development has gravitated to existing major retail nodes thereby reinforcing the traditional retail hierarchy. New big box discount and category killer merchants have not eroded the integrity of any regional or super-regional enclosed shopping malls. Smaller open air strip malls have not fared as well. Micro-geographies of traditional enclosed malls and the new retail power centres are explored with attention given to ways the typical design and layout of power centres contributes to increased levels of dependence on automobiles. Planning issues related to the construction of new retail space and the redevelopment of existing retail spaces are discussed.

1
1.0 Introduction In the world of retail development, “power centre” has become the accepted descriptor for a
planned agglomeration of big box retail outlets that may or may not be accompanied by
conventionally-sized commercial units. Architecturally speaking, the most distinguishing
feature of a power centre is its open-air design. Unlike tenants in a conventional enclosed
shopping centre, power centre tenants are not connected by an interior, climate-controlled
corridor. To move between stores, power centre patrons travel along exterior pathways or
across parking lots. In Canada, the popularity of the power centre format has not been
diminished by the harsh winter weather experienced by most regions of the country. Indeed,
since the early 1990s, the power centre format has all but replaced the enclosed shopping
centre as the preferred choice of developers (Jones and Doucet, 2001). Testimony to this is
the rapid growth of First Pro Shopping Centres, one of the leading developers of power
centres in Canada. First Pro currently operates or is in the process of developing over 90
power centre sites with at least one site in each province of the country.1
This paper examines aspects of big box store and power centre development in Winnipeg,
Manitoba from a geographical perspective. Geographical interest in retailing has its roots in
central place theory and its notion that the provision of goods and services evolves as a
hierarchical system. Within large metropolitan areas, this hierarchy is reflected in a system of
planned shopping centres beginning with large numbers of small neighbourhood nodes
offering mostly convenience goods and service and topped off by a limited number of much
larger regional and super-regional centres dominated by large department stores and specialty
retailers. Retail geographers are particularly interested in how power centres are melding
with this pre-existing hierarchy. Where are power centres located relative to established
shopping nodes? What types of goods and services are offered? How has or how will the
addition of power centres impinge on other components of a city’s shopping system?
Retail geographers are also interested in the spatial behaviour of consumers. Spatial
behaviour has both macro and micro dimensions. Macro refers to the choices consumers
2
make between competing shopping nodes or destinations. Micro-spatial behaviour refers to
how consumers move about within a planned shopping centre environment. Enclosed
regional and super regional malls and power centres offer starkly contrasting shopping
experiences. Of interest, then, is whether multiple big box outlets situated in open-air
environments is changing the way consumers shop.
Questions pertaining to the evolution of urban retail systems and spatial behaviour of
consumers should also interest those in the profession of urban planning. The cornerstone
principal of municipal retail planning for many years has been the same spatial hierarchy of
central place theory. Official Plans often spell out the framework for a spatial system of
shopping opportunities that are reasonably accessible to all consumers. At the same time,
regulatory environments have sought to restrict undue expansion of the system in order to
preserve the integrity of existing components. The classic example is that of efforts to
preserve the hegemony of the central business district in the face of the wave of suburban
enclosed shopping centre development that began to unfold in the 1960s and continued
through the 1970s and 1980s. Today, the same issue prevails but it is now beginning to
revolve around a different set of players as concerns are raised about the ability of those same
community and regional shopping centres to remain viable in the face of increased
competition from big box stores and power centres.
The interests of geographers and planners also intersect with regard to the spatial behaviour
of consumers. To a degree, the advent of power centre development is yet one more
manifestation of the type of urban landscape that evolves when society chooses to emphasize
private over public transportation. Like most regional shopping centres, power centres are
more conveniently accessed by automobile. It may be suggested, however, that power
centres create a second level of automobile dependency in that their morphological structure
induces shoppers not only arrive by car but to move from store to store by car as well.
This paper explores some of these dimensions of power centre development as they relate to
the retail landscape of Winnipeg. It begins with a brief overview of big box store and power
centre development in Winnipeg and some of the reasons underlying the surge in the
3
construction of retail space that has occurred in the last five years. The paper then examines
some of the strategic responses made by existing retailers and mall owners in the face of the
big box invasion. Several local power centres are then audited for the potential impact of
their layout and design on the spatial behaviour of consumers. Finally, the paper concludes
with a brief discussion of what the future might hold for further retail development as well as
policy to guide that development.
2.0 Overview of Big Box Store and Power Centre Development in Winnipeg That a new generation of stores is being built to a larger scale than previous ones is hardly a
new phenomenon to the Winnipeg market. One only need think of how the retailing of food
has evolved from small neighbourhood groceries to larger grocery supermarkets and them
most recently to the superstore model. As well, it could be argued that Winnipeg’s original
big box stores were the downtown locations of the Hudson Bay Company and former Eaton’s
department store chains were the original big box stores in the city. At over 500,000 square
feet, both outstripped by far any of the new Wal-Marts. If one adopts, though, the more
commonly held image of big box stores as suburban-based discounters or category killers,
such stores made their first appearance in Winnipeg in the late 1970s and early 1980s with
the arrival of such retailers as the Brick Furniture Warehouse and Toys R Us.
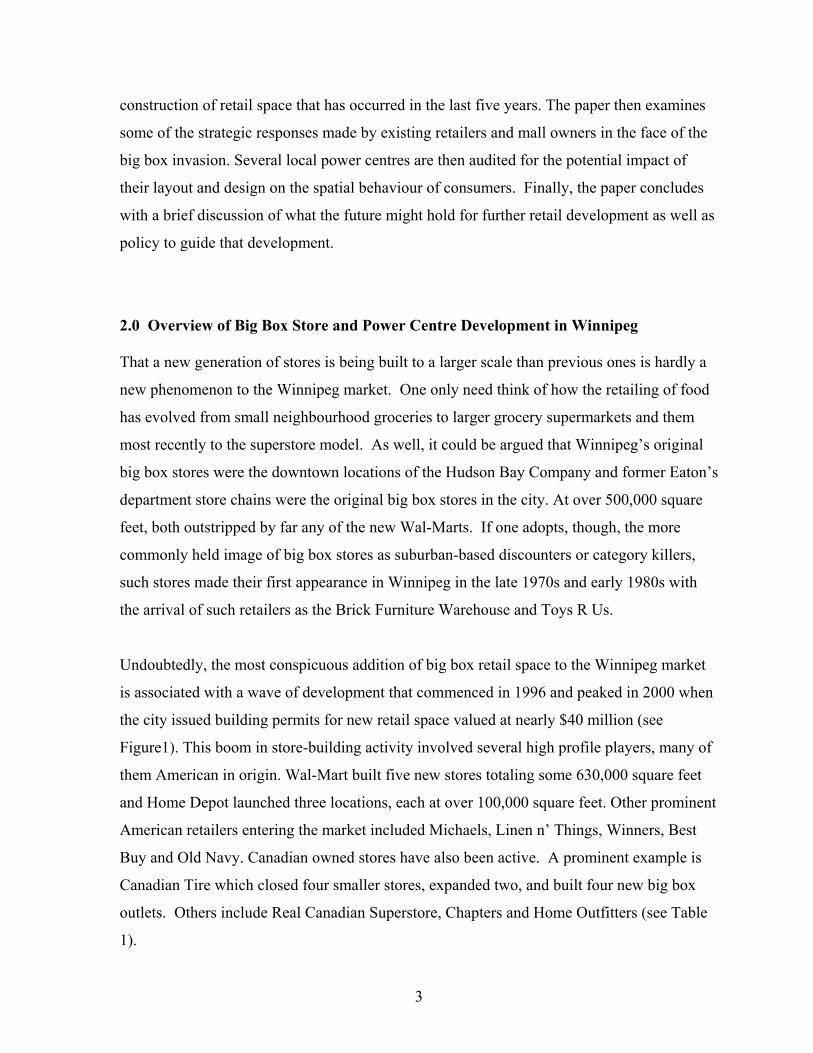
Undoubtedly, the most conspicuous addition of big box retail space to the Winnipeg market
is associated with a wave of development that commenced in 1996 and peaked in 2000 when
the city issued building permits for new retail space valued at nearly $40 million (see
Figure1). This boom in store-building activity involved several high profile players, many of
them American in origin. Wal-Mart built five new stores totaling some 630,000 square feet
and Home Depot launched three locations, each at over 100,000 square feet. Other prominent
American retailers entering the market included Michaels, Linen n’ Things, Winners, Best
Buy and Old Navy. Canadian owned stores have also been active. A prominent example is
Canadian Tire which closed four smaller stores, expanded two, and built four new big box
outlets. Others include Real Canadian Superstore, Chapters and Home Outfitters (see Table
1).

4
Figure 1
Value of Commercial Retail Building Permits, City of Winnipeg
(1992 Constant Dollars)
0
510
1520
2530
3540
$ m
illio
ns
1990 1992 1994 1996 1998 2000 2002
Sources: City of Winnipeg, Planning Property and Development Department; Statistics Canada, Cansim Table 326-0002 Consumer Price Index
5
Table 1
Examples of New Big Box Store Construction in Winnipeg, 1998-2002
Company # of New Stores Constructed Approximate New Store Square
Footage Added
Wal-Mart 5 630,000
Home Depot 3 321,000
Canadian Tire 3 285,000
Chapters 3 76,700
Home Outfitters 2 80,000
Michaels 2 49,000
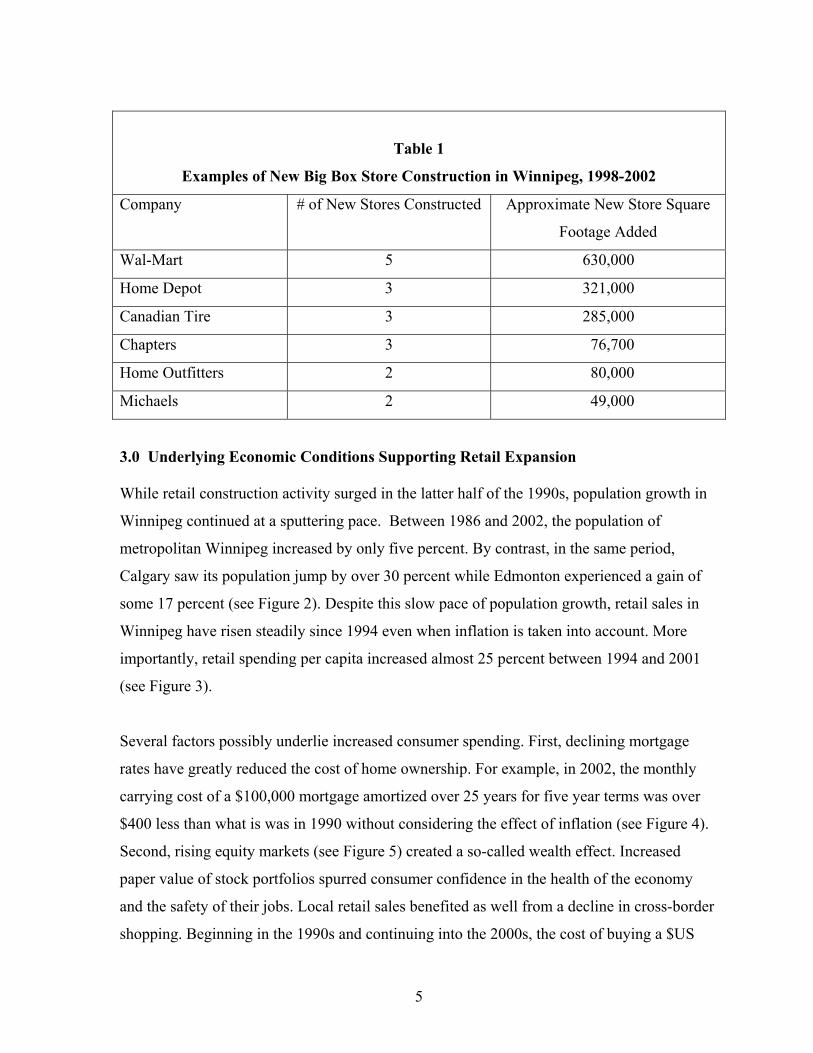
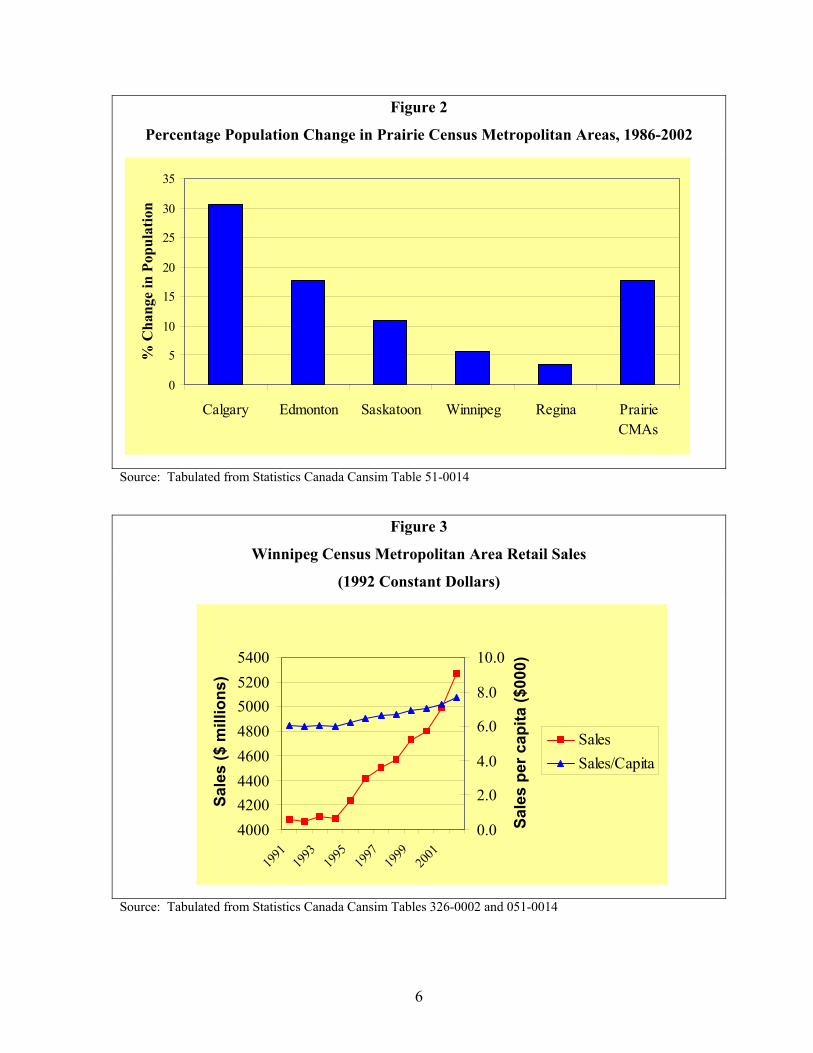
3.0 Underlying Economic Conditions Supporting Retail Expansion While retail construction activity surged in the latter half of the 1990s, population growth in
Winnipeg continued at a sputtering pace. Between 1986 and 2002, the population of
metropolitan Winnipeg increased by only five percent. By contrast, in the same period,
Calgary saw its population jump by over 30 percent while Edmonton experienced a gain of
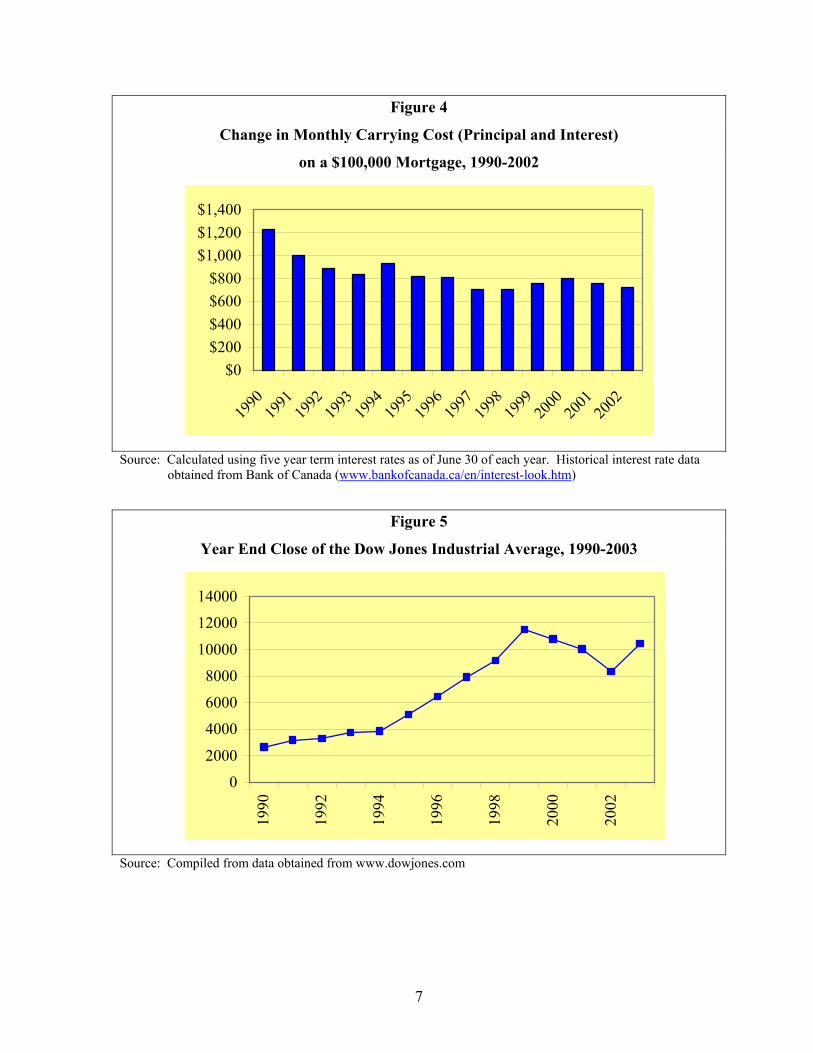
some 17 percent (see Figure 2). Despite this slow pace of population growth, retail sales in
Winnipeg have risen steadily since 1994 even when inflation is taken into account. More
importantly, retail spending per capita increased almost 25 percent between 1994 and 2001
(see Figure 3).
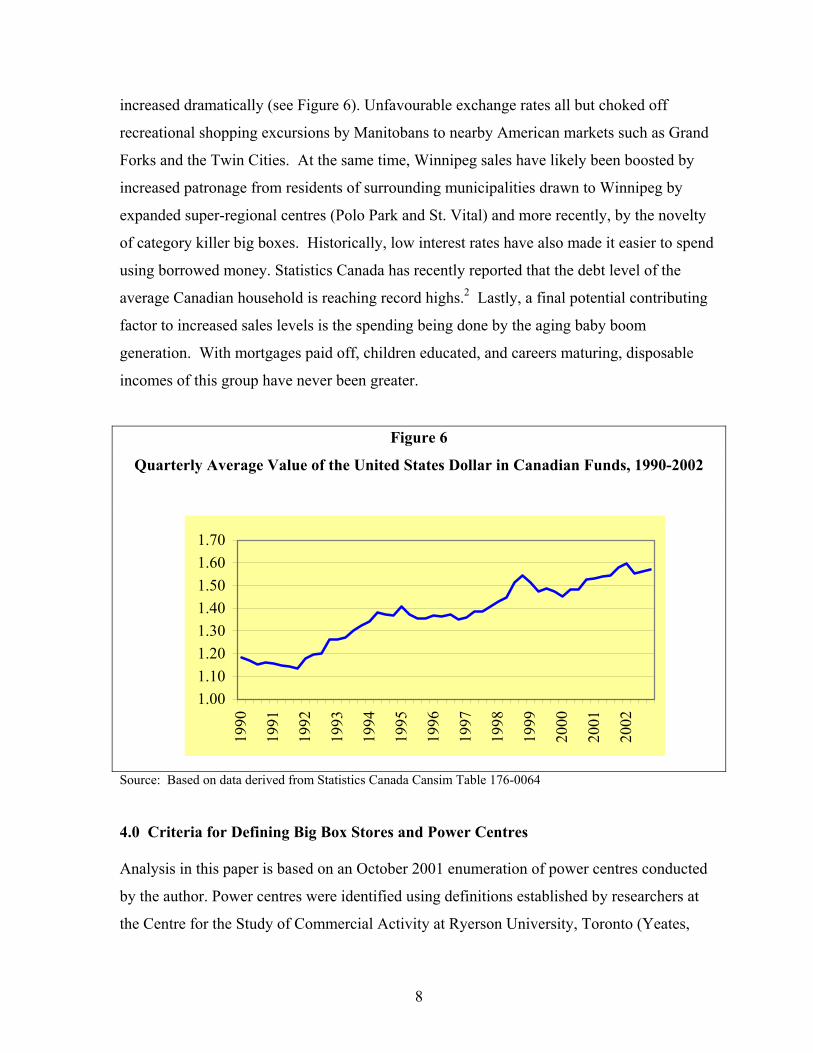
Several factors possibly underlie increased consumer spending. First, declining mortgage
rates have greatly reduced the cost of home ownership. For example, in 2002, the monthly
carrying cost of a $100,000 mortgage amortized over 25 years for five year terms was over
$400 less than what is was in 1990 without considering the effect of inflation (see Figure 4).
Second, rising equity markets (see Figure 5) created a so-called wealth effect. Increased
paper value of stock portfolios spurred consumer confidence in the health of the economy
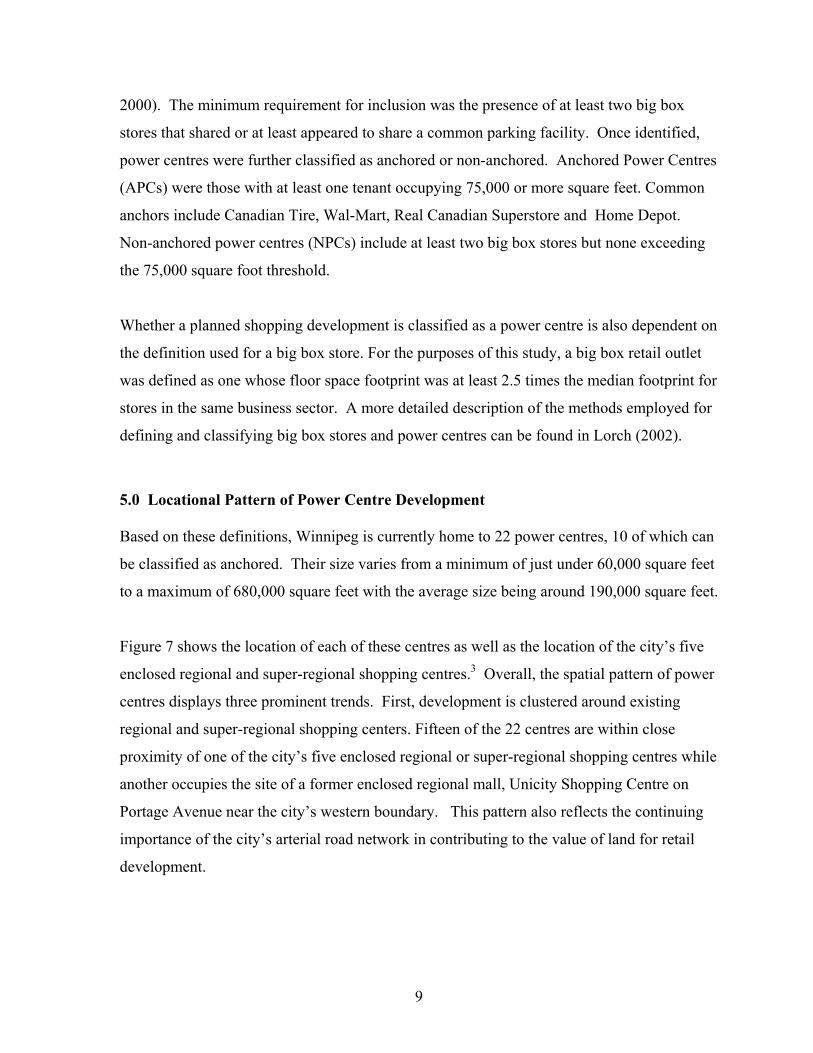
and the safety of their jobs. Local retail sales benefited as well from a decline in cross-border
shopping. Beginning in the 1990s and continuing into the 2000s, the cost of buying a $US
6
Figure 2
Percentage Population Change in Prairie Census Metropolitan Areas, 1986-2002
0
5
10
15
20
25
30
35
Calgary Edmonton Saskatoon Winnipeg Regina PrairieCMAs
% C
hang
e in
Pop
ulat
ion
Source: Tabulated from Statistics Canada Cansim Table 51-0014
Figure 3
Winnipeg Census Metropolitan Area Retail Sales
(1992 Constant Dollars)
40004200440046004800500052005400
1991
1993
1995
1997
1999
2001
Sale
s ($
mill
ions
)
0.0
2.0
4.0
6.0
8.0
10.0
Sale
s pe
r cap
ita ($
000)
SalesSales/Capita
Source: Tabulated from Statistics Canada Cansim Tables 326-0002 and 051-0014
7
Figure 4
Change in Monthly Carrying Cost (Principal and Interest)
on a $100,000 Mortgage, 1990-2002
$0$200$400$600$800
$1,000$1,200$1,400
1990
1991
1992
1993
1994
1995
1996
1997
1998
1999
2000
2001
2002
Source: Calculated using five year term interest rates as of June 30 of each year. Historical interest rate data
obtained from Bank of Canada (www.bankofcanada.ca/en/interest-look.htm)
Figure 5
Year End Close of the Dow Jones Industrial Average, 1990-2003
0
2000
4000
6000
8000
10000
12000
14000
1990
1992
1994
1996
1998
2000
2002
Source: Compiled from data obtained from www.dowjones.com
8
increased dramatically (see Figure 6). Unfavourable exchange rates all but choked off
recreational shopping excursions by Manitobans to nearby American markets such as Grand
Forks and the Twin Cities. At the same time, Winnipeg sales have likely been boosted by
increased patronage from residents of surrounding municipalities drawn to Winnipeg by
expanded super-regional centres (Polo Park and St. Vital) and more recently, by the novelty
of category killer big boxes. Historically, low interest rates have also made it easier to spend
using borrowed money. Statistics Canada has recently reported that the debt level of the
average Canadian household is reaching record highs.2 Lastly, a final potential contributing
factor to increased sales levels is the spending being done by the aging baby boom
generation. With mortgages paid off, children educated, and careers maturing, disposable
incomes of this group have never been greater.
Figure 6
Quarterly Average Value of the United States Dollar in Canadian Funds, 1990-2002
1.001.101.201.301.401.501.601.70
1990
1991
1992
1993
1994
1995
1996
1997
1998
1999
2000
2001
2002
Source: Based on data derived from Statistics Canada Cansim Table 176-0064
4.0 Criteria for Defining Big Box Stores and Power Centres Analysis in this paper is based on an October 2001 enumeration of power centres conducted
by the author. Power centres were identified using definitions established by researchers at
the Centre for the Study of Commercial Activity at Ryerson University, Toronto (Yeates,
9
2000). The minimum requirement for inclusion was the presence of at least two big box
stores that shared or at least appeared to share a common parking facility. Once identified,
power centres were further classified as anchored or non-anchored. Anchored Power Centres
(APCs) were those with at least one tenant occupying 75,000 or more square feet. Common
anchors include Canadian Tire, Wal-Mart, Real Canadian Superstore and Home Depot.
Non-anchored power centres (NPCs) include at least two big box stores but none exceeding
the 75,000 square foot threshold.
Whether a planned shopping development is classified as a power centre is also dependent on
the definition used for a big box store. For the purposes of this study, a big box retail outlet
was defined as one whose floor space footprint was at least 2.5 times the median footprint for
stores in the same business sector. A more detailed description of the methods employed for
defining and classifying big box stores and power centres can be found in Lorch (2002).
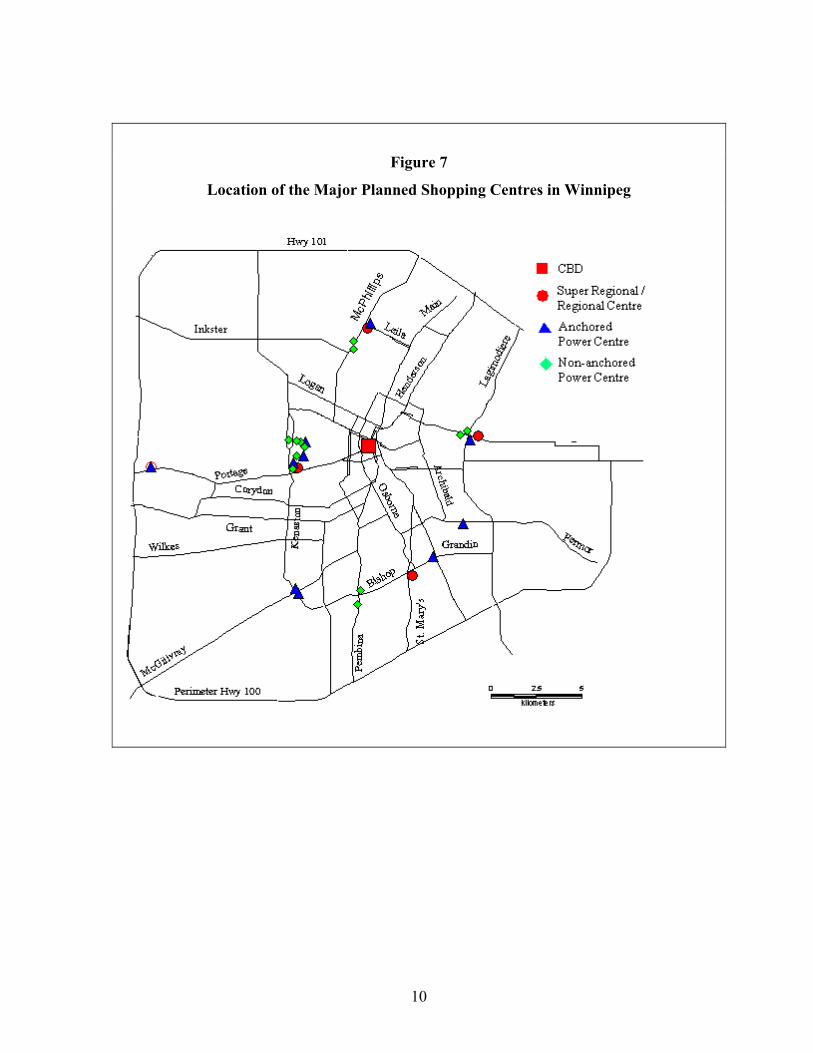
5.0 Locational Pattern of Power Centre Development Based on these definitions, Winnipeg is currently home to 22 power centres, 10 of which can
be classified as anchored. Their size varies from a minimum of just under 60,000 square feet
to a maximum of 680,000 square feet with the average size being around 190,000 square feet.
Figure 7 shows the location of each of these centres as well as the location of the city’s five
enclosed regional and super-regional shopping centres.3 Overall, the spatial pattern of power
centres displays three prominent trends. First, development is clustered around existing
regional and super-regional shopping centers. Fifteen of the 22 centres are within close
proximity of one of the city’s five enclosed regional or super-regional shopping centres while
another occupies the site of a former enclosed regional mall, Unicity Shopping Centre on
Portage Avenue near the city’s western boundary. This pattern also reflects the continuing
importance of the city’s arterial road network in contributing to the value of land for retail
development.
10
Figure 7
Location of the Major Planned Shopping Centres in Winnipeg
11
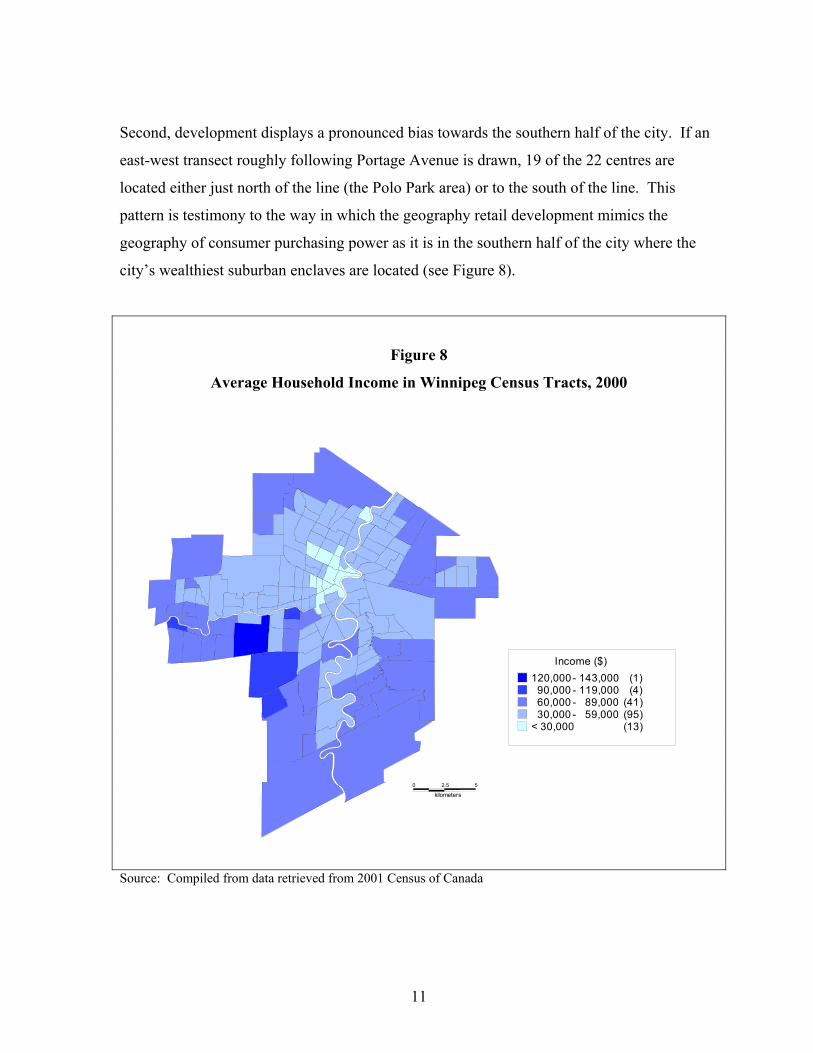
Second, development displays a pronounced bias towards the southern half of the city. If an
east-west transect roughly following Portage Avenue is drawn, 19 of the 22 centres are
located either just north of the line (the Polo Park area) or to the south of the line. This
pattern is testimony to the way in which the geography retail development mimics the
geography of consumer purchasing power as it is in the southern half of the city where the
city’s wealthiest suburban enclaves are located (see Figure 8).
Figure 8
Average Household Income in Winnipeg Census Tracts, 2000
Source: Compiled from data retrieved from 2001 Census of Canada
0 2.5 5
kilometers
Income ($)120,000 - 143,000 (1)
90,000 - 119,000 (4)60,000 - 89,000 (41)30,000 - 59,000 (95)
< 30,000 (13)
12
Third, the transformation of raw land at the corner of Kenaston and McGillivray into a Wal-
Mart anchored big box development is one of only a few power centres in Winnipeg that can
be classified as stereotypical green field development. The majority of projects have
involved either the transformation of industrial properties into retail use or the upgrading of
retail properties to power centre status through the addition of big box stores or
reconfiguration of existing space for big box tenants.
6.0 Assessing the Fallout of Big Box and Power Centre Development It is no secret that Wal-Mart’s 1994 acquisition of the 122 store Woolco chain and its ensuing
aggressive expansion and modernization strategy drastically altered the Canadian retail
playing field (Jones and Graff, 1998). In the face of strengthened competition, well-
established firms such as the Hudson Bay Company (owners of The Bay and Zellers ), Sears
and Canadian Tire were forced to adapt and did so with their own expansion and
reconfiguration strategies. The fallout from such action has left a significant spatial imprint
on the Winnipeg market.
With the Woolco acquisition, Wal-Mart obtained five Winnipeg outlets, almost none of
which met the long term needs of the company. Beginning in 1998, and over the next five
years, Wal-Mart embarked on an investment spree that saw the construction of five new
125,000 square foot stores. Some of this investment did not significantly alter the company’s
Winnipeg geography as it simply involved the substitution of new stores for old ones within
the same regional shopping nodes. In the Garden City and Regent Avenue nodes, old
Woolco stores were eventually occupied by other tenants. At Unicity, the old store was
demolished along with the rest of the enclosed shopping centre that it anchored and was
replaced by a power centre. Where geography was altered was with the decision to abandon
the Grant Park Shopping Centre store in favour of adding stores in new power centre
developments in the well established Polo Park node (Ellice Avenue) and in a green field
development on Kenaston Avenue about five kilometers southwest of the old Grant Park
location. The only surviving Woolco store is an anchor tenant in the St. Vital Centre, a super
regional mall in the city’s south end. This store, which only recently completed an
13
expansion, is now the only Wal-Mart location in Winnipeg found within an enclosed
shopping centre.
As suggested above, the competitive threat posed by Wal-Mart can be viewed as a struggle
between different corporate retail stores. It can also, though, be viewed as a struggle between
different corporate landlords. If Wal-Mart’s investment in Canada threatened the economic
position of stores such as Sears, Zellers, The Bay and Canadian Tire, what of the economic
vitality of the many enclosed malls that rely on such stores to be the anchor tenant engines
that draw in patrons?
In the case of Winnipeg, evidence suggests that the traditional enclosed regional and super-
regional malls, at least in the short run, have coped well. The Bay, Sears and Zellers have
responded to Wal-Mart’s aggressive expansion with a flood of re-investment dollars of their
own. At Kildonan Place, HBC converted its Bay store to the Zellers banner to counter Wal-
Mart’s new, larger store in an adjacent big box complex. At Southdale, HBC invested in a
significant expansion of a Zellers, a move that can be interpreted as a strategic effort to
prevent loss of market share to the Wal-Marts at St. Vital Centre and Crossroads Station.
Meanwhile, at Grant Park, the space previously occupied by Woolco and then Wal-Mart, was
acquired, renovated and expanded for a new Zellers location.
Garden City Shopping Centre in the city’s north end has also been the beneficiary of new
investment. New Canadian Tire and Winner’s outlets have mostly filled space vacated by
the bankrupted Eaton’s chain. As well, the former Wal-Mart store located in Garden City
Square across the street from Garden City Shopping Centre is in the process of being
renovated for a Home Depot outlet.
At Polo Park Shopping Centre, Sears has recently completed a wholesale renovation of a late
1950s vintage store while the Bay has moved into the mall’s other anchor space, which had
been an Eaton’s location. Similarly, Eaton’s in St. Vital Centre was converted to a Sears.
Overall, the net result of these investments is that with one exception, no major mall has
14
vacant anchor tenant space. The only exception is Garden City Shopping Centre, which has
not completely filled the space once occupied by Eaton’s.
Major malls have also fared quite well in terms of keeping their smaller commercial retail
units (CRUs) occupied in spite of the proliferation of big box category killer stores. A
survey of the city’s enclosed regional and super-regional centres conducted in September
2001 revealed a vacancy rate of less than four percent (Lorch, 2002). In part, the low
vacancy rate can be attributed to the ability of malls to retain existing and attract new, large
scale tenants. Such tenants in Polo Park Shopping Centre include Sport Chek, Eddie Bauer,
American Eagle and the Gap / Gap for Kids while local bookseller, McNally Robinson has
added a large format store in Grant Park Shopping Centre. Similarly, renovations at
Kildonan Place have made room for an enlarged Shoppers Drug Mart and an expansion
underway at St. Vital Centre will house the city’s first London Drugs outlet.
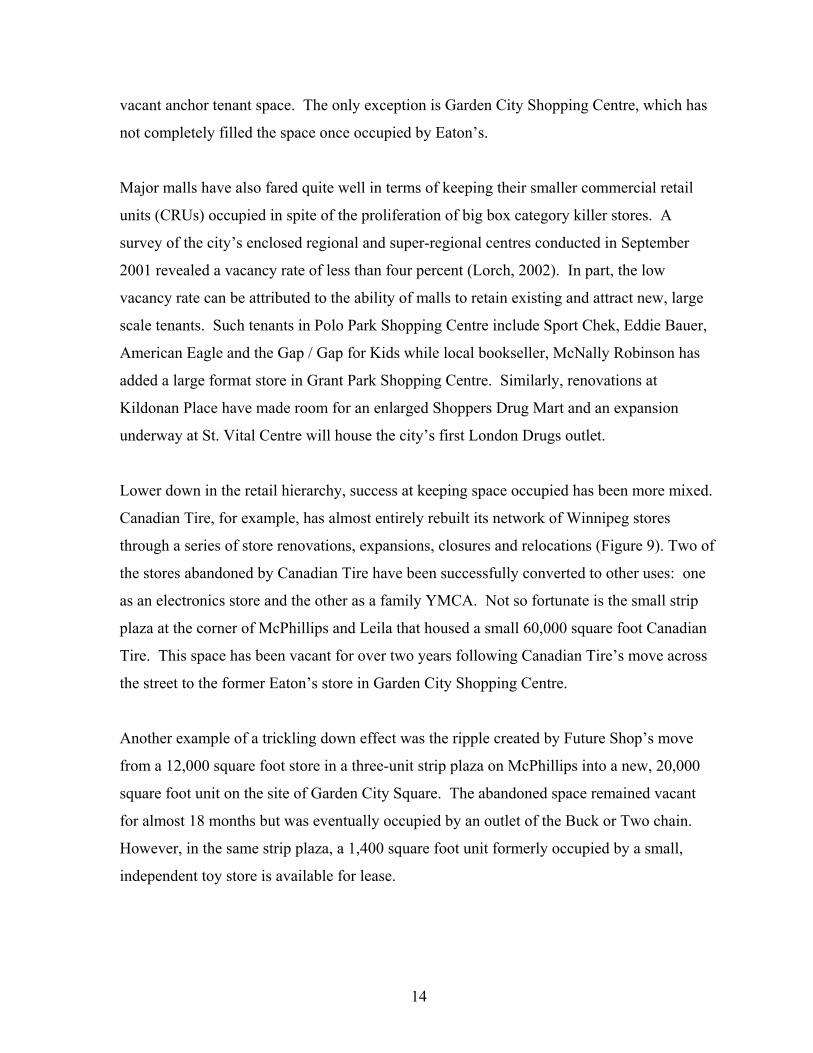
Lower down in the retail hierarchy, success at keeping space occupied has been more mixed.
Canadian Tire, for example, has almost entirely rebuilt its network of Winnipeg stores
through a series of store renovations, expansions, closures and relocations (Figure 9). Two of
the stores abandoned by Canadian Tire have been successfully converted to other uses: one
as an electronics store and the other as a family YMCA. Not so fortunate is the small strip
plaza at the corner of McPhillips and Leila that housed a small 60,000 square foot Canadian
Tire. This space has been vacant for over two years following Canadian Tire’s move across
the street to the former Eaton’s store in Garden City Shopping Centre.
Another example of a trickling down effect was the ripple created by Future Shop’s move
from a 12,000 square foot store in a three-unit strip plaza on McPhillips into a new, 20,000
square foot unit on the site of Garden City Square. The abandoned space remained vacant
for almost 18 months but was eventually occupied by an outlet of the Buck or Two chain.
However, in the same strip plaza, a 1,400 square foot unit formerly occupied by a small,
independent toy store is available for lease.
15
Figure 9
Old and New Faces of Canadian Tire
(a) An abandoned Canadian Tire outlet on McPhillips Avenue. This location was replaced
by a new store across the street in Garden City Shopping Centre
(b) New Canadian Tire outlet in Linden Ridge Power Centre on Kenaston Avenue.
Source: Photographed by author
16
One final example of a “trickling down the hierarchy” effect is the high vacancy rate at
Charleswood Shopping Centre. Located on Grant Avenue about 6 kilometers west of Grant
Park Shopping Centre, Charleswood Shopping Centre is a community-level shopping centre
anchored by a Safeway supermarket. Its other anchor space sits vacant following the closure
of an approximately 60,000 square foot Zellers store, as does a significant portion of its
smaller CRUs. Unfortunately for Charleswood, its Zellers store was deemed inefficient and
redundant following the opening of the Grant Park Zellers location. The latter is nearly twice
the size of as was the Zellers in Charleswood location.
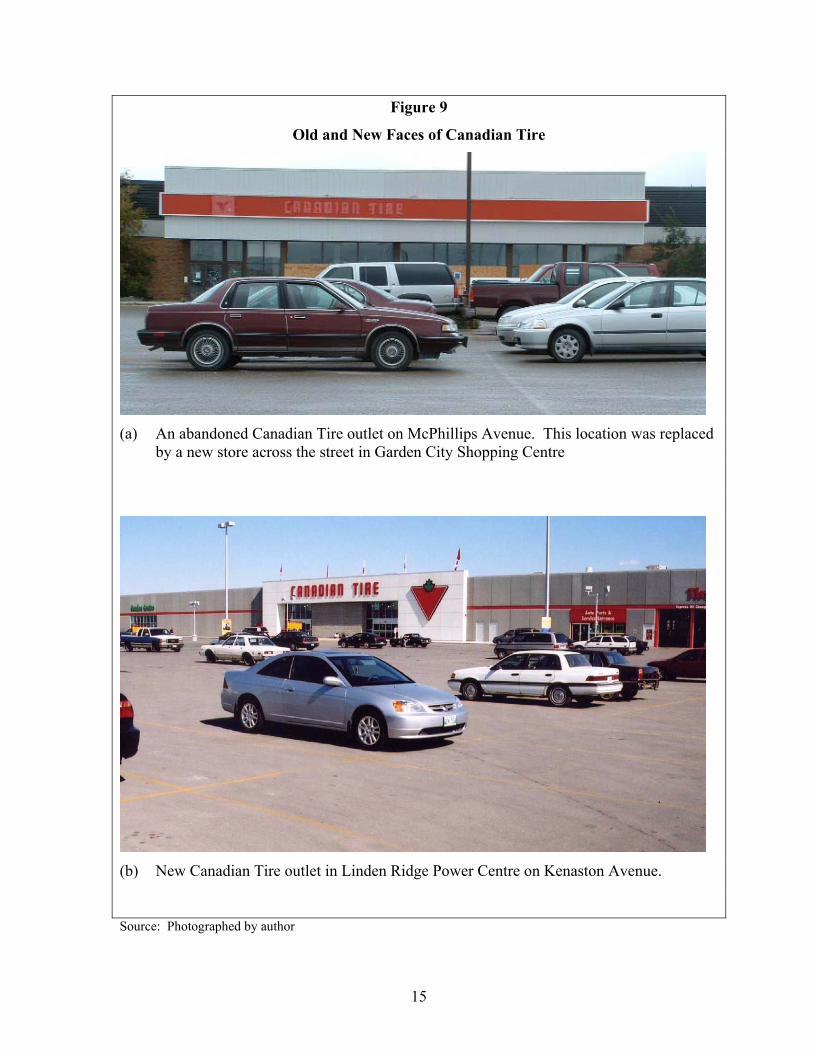
Overall, the anecdotal evidence suggests evidence of retail blight in the post-big box boom
era to be much more visible at lower levels of the retail hierarchy. This is consistent with the
results of a survey of retail activity in Winnipeg’s eight major retail nodes conducted in 2001
(Lorch, 2002) that found vacancy rates to be lowest in enclosed regional shopping centres
and power centres and highest in strip malls (see Figure 10).
Figure 10
Vacancy Rates by Type of Retail Configuration in
Winnipeg’s Major Suburban Retail Nodes
05
10152025
Strip
Ancho
red Strip
Free Stan
ding
Power
Centre
Enclos
ed
Anc Pow
er Cen
tre
Overal
l
Source: Compiled by author from field data collected Fall 2001.
17
7.0 Power Centres and Consumer Spatial Behaviour Historically, rent paid by a shopping centre tenant has been partially tied to the volume of
sales generated. Owners of such centres, therefore, have a vested interest in maximizing
overall sales. Furthermore, since sales are thought to be positively correlated with the
duration of shopper visits and the amount of distance shoppers walk during a visit to the
mall, owners have designed their malls with these objectives in mind. Site planning is the
first step. The mall structure itself is normally centred on the site with parking found around
the perimeter. Anchor tenants are placed at the extremities thus forcing shoppers wishing to
visit more than one major attraction to traverse a long corridor. This trip, of course, is made
palatable by the fact that the corridor is an enclosed climate-controlled space lined with
smaller shops. In a limited number of places along the way are benches that afford an
opportunity to rest, converse and watch people. If the mall is a multi-level facility, the
corridor ceiling is vaulted allowing those at ground level a glimpse of what stores await them
on the upper levels and vice-versa for those on upper levels looking down. So as to
maximize distance travelled on any level, only a limited number of places are provided for
shoppers to move between levels. Corridors sometimes curve or jog to downplay any
thought that the distance from one anchor tenant to another is too far to walk. Other design
features attempt to separate and insulate shoppers from their hectic every-day lives. They are
soothed by ‘muzak’ and enticed to think of more exotic locales by palm trees and fountains.
Clocks that would remind shoppers of other scheduled tasks are few and far between as are
windows. Views of the outside are generally restricted to ones seen through skylights.
Overall, the desired effect is one of psychologically distancing the consumer from the outside
environment left behind once they walk through the centre’s doors.4
To the retail geographer, power centres are intriguing phenomena because of the way they
have eschewed almost all of this conventional wisdom with regard to how to maximize the
sale generating capacity of a shopping centre. To begin, the typical power centre turns the
site plan geography of the traditional mall inside out. Often, it consists of not one, but
multiple structures. These structures are normally located on the perimeter of the site or, in
the case of larger developments, around the perimeter and about the interior of the site to
create a campus-like environment.
18
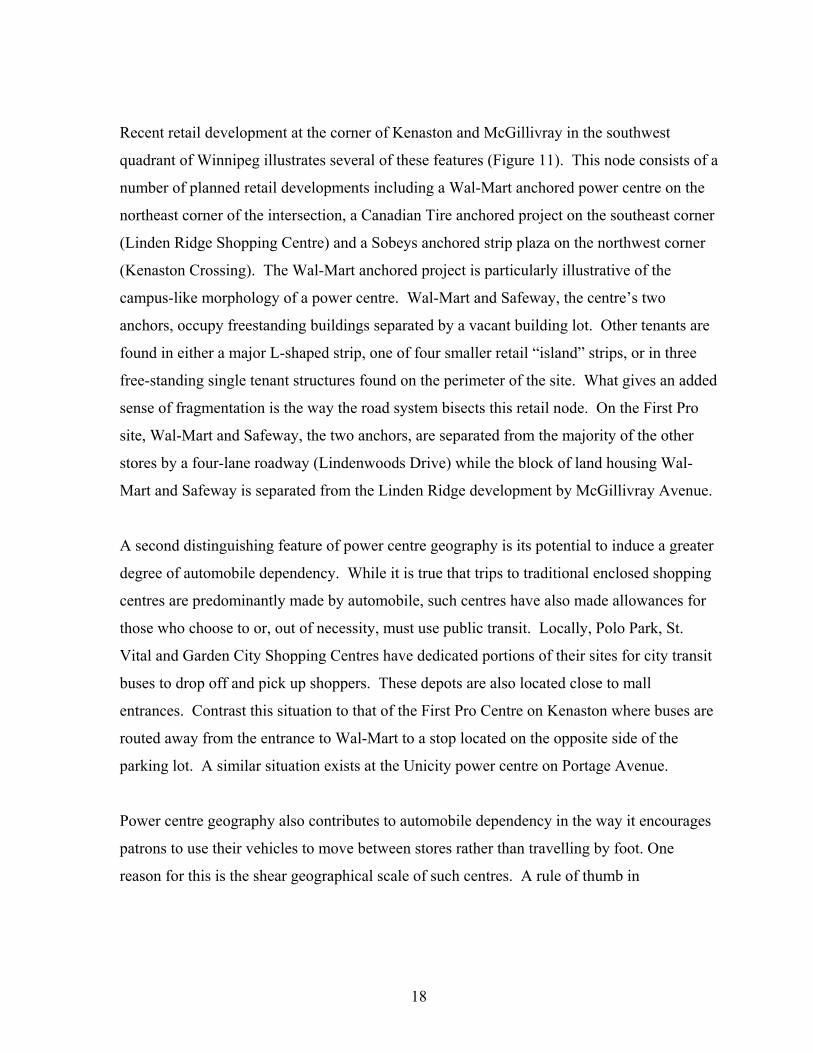
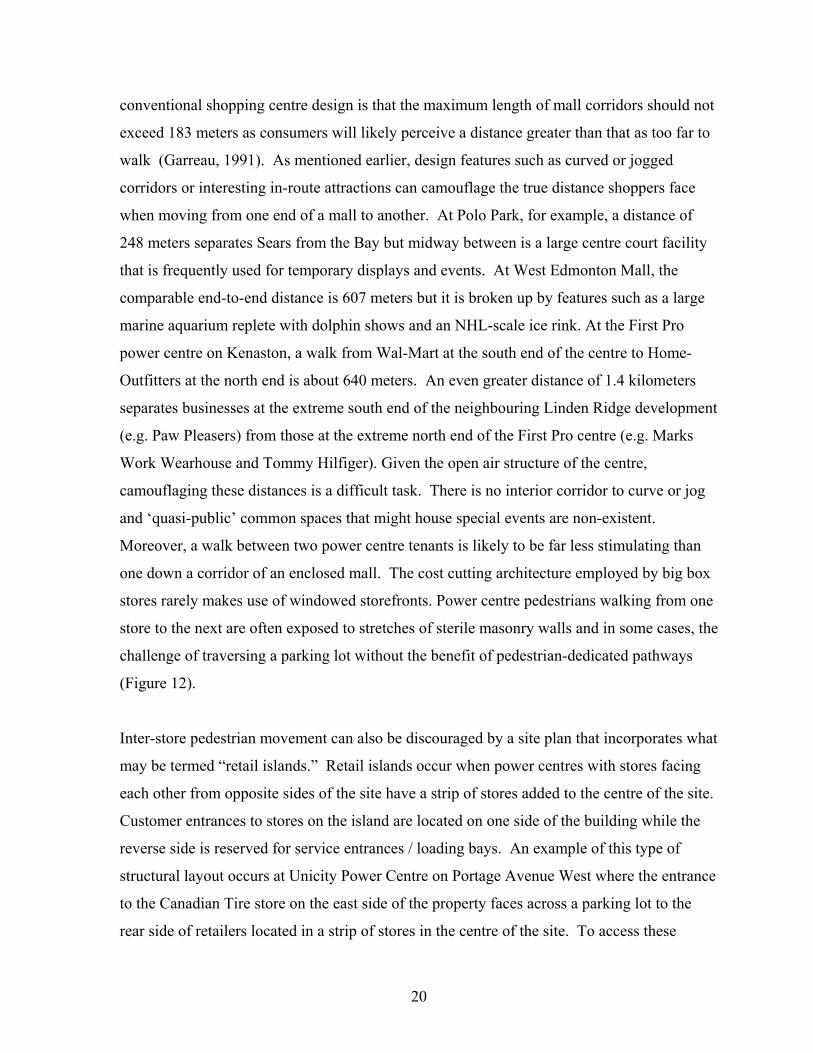
Recent retail development at the corner of Kenaston and McGillivray in the southwest
quadrant of Winnipeg illustrates several of these features (Figure 11). This node consists of a
number of planned retail developments including a Wal-Mart anchored power centre on the
northeast corner of the intersection, a Canadian Tire anchored project on the southeast corner
(Linden Ridge Shopping Centre) and a Sobeys anchored strip plaza on the northwest corner
(Kenaston Crossing). The Wal-Mart anchored project is particularly illustrative of the
campus-like morphology of a power centre. Wal-Mart and Safeway, the centre’s two
anchors, occupy freestanding buildings separated by a vacant building lot. Other tenants are
found in either a major L-shaped strip, one of four smaller retail “island” strips, or in three
free-standing single tenant structures found on the perimeter of the site. What gives an added
sense of fragmentation is the way the road system bisects this retail node. On the First Pro
site, Wal-Mart and Safeway, the two anchors, are separated from the majority of the other
stores by a four-lane roadway (Lindenwoods Drive) while the block of land housing Wal-
Mart and Safeway is separated from the Linden Ridge development by McGillivray Avenue.
A second distinguishing feature of power centre geography is its potential to induce a greater
degree of automobile dependency. While it is true that trips to traditional enclosed shopping
centres are predominantly made by automobile, such centres have also made allowances for
those who choose to or, out of necessity, must use public transit. Locally, Polo Park, St.
Vital and Garden City Shopping Centres have dedicated portions of their sites for city transit
buses to drop off and pick up shoppers. These depots are also located close to mall
entrances. Contrast this situation to that of the First Pro Centre on Kenaston where buses are
routed away from the entrance to Wal-Mart to a stop located on the opposite side of the
parking lot. A similar situation exists at the Unicity power centre on Portage Avenue.
Power centre geography also contributes to automobile dependency in the way it encourages
patrons to use their vehicles to move between stores rather than travelling by foot. One
reason for this is the shear geographical scale of such centres. A rule of thumb in
19
1 1 5
1 1 2
1 1 5
17
6 5
1 1 9
1 1 9
1 2 1
1 2 1
1 2 9
1 2 3
1 2 5
1 2 7
1 2 5
1 2 7
1 2 9
1 2 3
1 4 5
1 3 9
1 3 1
1 3 3
1 3 5
1 3 7
1 4 31 4 1
1 3 1
1 3 3
1 3 5
1 5 31 5 1
1 5 5
1 6 5
1 4 7
1 4 9
1 3 9 1 3 7
1 4 1
1 4 3
1 4 5
1 4 7
1 6 5
Un
it 22
U n it 29
U n it 30
U n i t 17
Un
i t 25
Un
i t 24
Un
i t 23
U n it 2
60
0
U n i t 1
60
0
U n it 2U n it 1
2
33
2
70
0
70
0
1 4
1
U n it 1 5
U n it 31U
ni t 1
2
U n i t 1 4
U n it 16
U n it 3
U n it 4
U n i t 26
U n it 27
U n it 28
U n i t 3
Un
i t 10
Un
i t 11
U n i t 5
U n i t 4
U n it 5
U n it 6
U n i t 11
U n it 6
Un
it 7U
nit 8
Un
i t 9
U n it 9
U n i t 10
U n it 12
U n it 27
U n i t 26
U n it 25
U n it 24
U n i t 23
U n it 22
Un it 4 4
Un
i t 45
Un
i t 17
Un
i t 42
Un
i t 43
Un
i t 15
Un it 14
Un
it 16
1 5 5
1 4 9
1 5 1
1 5 3
17
6 5
93
8 9
85
93
89
85
1 0 1
1 0 19 7
1 1 6
1 1 3
1 1 2
1 0 9
1 0 8
1 059 7
6 5 6 9
6 5
77
8 1
77
73
6 6
8 1
73
6 9
6 6
6 16 1
6 2
6 2
5 8
5 4
84
9 28
8
8 0
17
19
1 71
5
1 74
5
17
45
17
25
17
19
17
25
17
15
17
11
88
9 5
92
84
8 0
7 6
7 2
95
112
11
61
12
10
4
10
8
1 04
10
0
96
1 08
1 00
96
1 07
10
3
10
7
9 9
10
3
99
1 27
12
0
12
3
12
41
201
23
1 24
1 11
11
5
119
11
1
1 15
1 161
19
12
7
11
15
19
2 3
11
15
19
2 3
1 5 51 5 5
1 6 7
2 7
3 12 7
3 4
3 53 1
3 4
3 5
12
81
28
13
61 3
2
13
61
32
1 4 0
12
7
1 4 0
12
7
12
3
11
9
1 5 2
12
3
11
9
1 5 2
1 15
11
5
11
1
11
1
1 0 3
10
7
10
7
1 0 3
1 6 3
1 6 0
1 5 6
1 5 91 5 9
1 6 3
1 6 0
1 5 6
5 8
5 4
1 1 7
1 2 5
1 2 1
1 1 6
1 1 3
1 1 2
1 0 9
1 0 8
1 05
1 2 5
1 2 1
1 1 7
1 2 8
1 2 4
1 2 0
1 2 8
1 2 4
1 2 0
6 8
6 4
6 0
6 8
6 4
7 6
7 2
1 3 2
1 3 2
1 3 6
1 3 1
1 2 9
1 3 6
1 3 1
1 2 9
7
5 6
5 2
3
7
6 0
5 6
3
1 4 0
1 3 9
1 3 5
1 4 4
1 4 0
1 3 9
1 3 5
1 4 4
5 5
4 4
4 8
5 5
5 9
5 1
5 9
5 25 1
4 8
4 4
1 5 2
1 5 2
1 5 1
1 4 8
1 4 7
1 4 3
1 5 1
1 4 8
1 4 7
1 4 3
8 6
8 6
9 0
8 2
9 0
8 2
3 8
3 9
4 2
4 3
3 8
3 9
4 2
4 3
1 7 1
1 6 8
1 7 1
1 7 5
1 6 4
1 6 7
1 7 5
1 6 8
1 6 4
9 99 5
9 1
8 7
9 99 5
9 1
8 7
1 7 6
1 7 2
1 7 9
1 8 3
1 7 6
1 7 9
1 8 3
1 7 2
4 7
5 1
4 7
4 6
5 1
4 6
8 3
7 9
7 5
8 3
7 9
7 5
7 8
7 4
7 0
7 8
7 4
7 0
1 8 8
1 9 1
1 9 5
1 8 8
1 9 1
1 9 5
6 2
5 4
5 0
5 8
5 9
6 3
5 0
5 9
6 3
1 8 7
1 8 0
1 8 4
1 8 7
1 8 0
1 8 4
5 5
5 5
7 17 1
6 7
6 36 7
6 3
5 8
6 6
6 2
6 6
6 2
5 8
1 9 9
1 9 2
1 9 6 1 9 2
1 9 6
1 9 9
3 8
4 7
4 3
3 6
3 2
3 9
4 7
4 3
3 9
3 8
3 6
3 2
1 5 5
1 5 91 5 5
5 9
3 1
2 4
2 8
3 5
2 4
2 8
3 1
3 5
2 72 7
1 6
2 0
2 3
1 6
2 0
2 3
6 2
6 6
6 7
6 6
6 7
4
5 4
5 8
1 5
8
1 2
1 5
1 9
8
1 1
1 2
1 9
7 0
7 4
7 0
7 5
7 1
7 9
8 3
7 1
7 5
7 9
7 8
7 8
8 2
7 4
8 2
8 3
7
1 1
7
3
4
2 0 7
2 0 4
2 0 7
2 0 3
2 0 0
2 0 4
2 0 3
2 0 0
5 9
5 5
5 4
5 1
5 0
5 9
5 5
5 4
5 1
5 0
4 64 6
2 1 9
2 1 5
2 1 2
2 1 1
2 0 8
2 1 5
2 1 1
2 0 8
4 7
4 7
4 2
4 3
3 9
3 8
4 2
3 8
4 3
3 9
2 1 62 1 6 2 1 2
2 2 4
2 2 0
2 2 4
2 2 0
3 4
3 4
3 0
2 6
3 1
3 0
2 6
3 5
3 1
3 5
2 3 22 3 2
2 3 9
2 3 5
2 2 8
2 3 9
2 3 5
2 2 8
1 5
1 4
1 8
2 2
1 9
1 4
1 5
1 8
2 2
2
6
7
1 0
2
6
7
1 0
1 9
2 7
2 32 7
2 3
1 1
1 1
33
3
2 2 32 2 3
2 1 9
8 6
9 0
8 6
9 0
8 7
9 18 7
9 1
2 3 1
2 2 7
2 3 1
2 2 7
9 5
9 4
9 5
9 4
9 9
9 9
2 3 6
2 4 0
2 4 3
2 3 6
2 4 0
2 4 3
17
20
17
2 0
2 2 3 3
2 2 3 3
2 2 4 52 2 5 7
2 2 4 5
2 2 5 7
Un it 3 6
Un
it 39
Un it 4 0 U
n i t 3 7
Un
it 3 5
Un i t 3
4
Un i t 3 2U
nit 3 3
U n it 7
U n i t 8
Un
it 38
U n it 28
U n it 31
Un
i t 41
U n i t 30
U n i t 29
Un
i t 18
Un
i t 19
Un
i t 20
Un
i t 21
1 0
2
6
17
11
1 0
2
6
1
1 1 91 2 31 1 91 2 3
1 271 2 7
13
1
13
5
13
1
13
5
13
91
39
83
5
83
9
83
98
35
83
1
82
78 3
1
82
7
82
3
8 23
14
8
14
0
1 44
14
0
144
14
8
151
15
2
1 43
1 47
15
1
14
3
1 47
15
2
16
4
1 56
16
0
1 55
1 56
16
0
15
5
15
9
1 63
15
9
16
3
16
4
77
8 1
85
8 1
85
8 6
8 15
81
9
81
9
81
5
7878
8 2
86
77
82
7 4
7 3
7 0
74
7 3
70
81
1
8 07
80
3
7 99
81
1
80
7
8 03
79
9
696
9
66
65
66
65
3 9 9
3 9 6
4 0 0
4 0 4
4 0 3
4 0 4
3 9 6
3 9 9
4 0 0
4 0 3
4 24 2
2
6
10
2
6
10
4 0 8
4 1 24 0 8
4 1 2
4 0 7
4 1 1
4 1 5
41 9
4 0 7
4 1 1
4 1 5
41 9
3 9
3 5
3 8
3 0 3 43 0 3 4
3 8
3 5
3 9
22
2 6
22
14
18
14
18
2 6
62
62
58
5 45
85 4
77
9
78
3
77
97 8
3
77
5
77
5
7 95
7 87
79
5
78
7
79
2
7 92
77
1
77
1
76
7
7 63
7 59
75
5
75
1
76
7
7 63
75
9
75
5
75
1
16 65
2 1 0 0
2 1 0 0
2 22 62 6
1 8
10
14
14
1 8
2 2
6
10
6
4 7 5
4242
3 0
343
4
3 0
38
38
4 7 5
66
1 6 25
4 9 5
18
1 8
2 2
1414
1 01 0
2 62 6
2 2
3 4
3 03 0
3838
34
42
42
4 9 5
95
99
7979
99
95
9 1
1 0 71 0 3
1 0 3
83
83
8787
9 1
1 0 7
1 58 5
15 9 9
1 585
1 5 7 9
1 56 9
1 57 9
1 585
15 9 9
1 65 9
1 65 9
166 5
16
19
16 2 9
1 63 5 1 63 9
16 49
16 45
162 9
16 35
1 63 9
164 9
1 64 5
16
30
16
30
16 4
0
2 2 0 1
2 2 0 1
164
0
16
50
16 6
0
16
50
16
60
16
19
16 25
16
09
16
0 9
1 56 9
1 5 3 9
1 5 4 5
1 5 3 9
1 5 4 5
First Pro
Wal-Mart
Home Outfitters
CanadaSafeway
LindenwoodsSubdivision
WhyteRidge
Subdivision
Kenaston MacGillivray
CanadianTire
Paw Pleasers
Sobeys
Figure 11Site Plan of Retail Development at Kenaston and McGillivray
20
conventional shopping centre design is that the maximum length of mall corridors should not
exceed 183 meters as consumers will likely perceive a distance greater than that as too far to
walk (Garreau, 1991). As mentioned earlier, design features such as curved or jogged
corridors or interesting in-route attractions can camouflage the true distance shoppers face
when moving from one end of a mall to another. At Polo Park, for example, a distance of
248 meters separates Sears from the Bay but midway between is a large centre court facility
that is frequently used for temporary displays and events. At West Edmonton Mall, the
comparable end-to-end distance is 607 meters but it is broken up by features such as a large
marine aquarium replete with dolphin shows and an NHL-scale ice rink. At the First Pro
power centre on Kenaston, a walk from Wal-Mart at the south end of the centre to Home-
Outfitters at the north end is about 640 meters. An even greater distance of 1.4 kilometers
separates businesses at the extreme south end of the neighbouring Linden Ridge development
(e.g. Paw Pleasers) from those at the extreme north end of the First Pro centre (e.g. Marks
Work Wearhouse and Tommy Hilfiger). Given the open air structure of the centre,
camouflaging these distances is a difficult task. There is no interior corridor to curve or jog
and ‘quasi-public’ common spaces that might house special events are non-existent.
Moreover, a walk between two power centre tenants is likely to be far less stimulating than
one down a corridor of an enclosed mall. The cost cutting architecture employed by big box
stores rarely makes use of windowed storefronts. Power centre pedestrians walking from one
store to the next are often exposed to stretches of sterile masonry walls and in some cases, the
challenge of traversing a parking lot without the benefit of pedestrian-dedicated pathways
(Figure 12).
Inter-store pedestrian movement can also be discouraged by a site plan that incorporates what
may be termed “retail islands.” Retail islands occur when power centres with stores facing
each other from opposite sides of the site have a strip of stores added to the centre of the site.
Customer entrances to stores on the island are located on one side of the building while the
reverse side is reserved for service entrances / loading bays. An example of this type of
structural layout occurs at Unicity Power Centre on Portage Avenue West where the entrance
to the Canadian Tire store on the east side of the property faces across a parking lot to the
rear side of retailers located in a strip of stores in the centre of the site. To access these
21
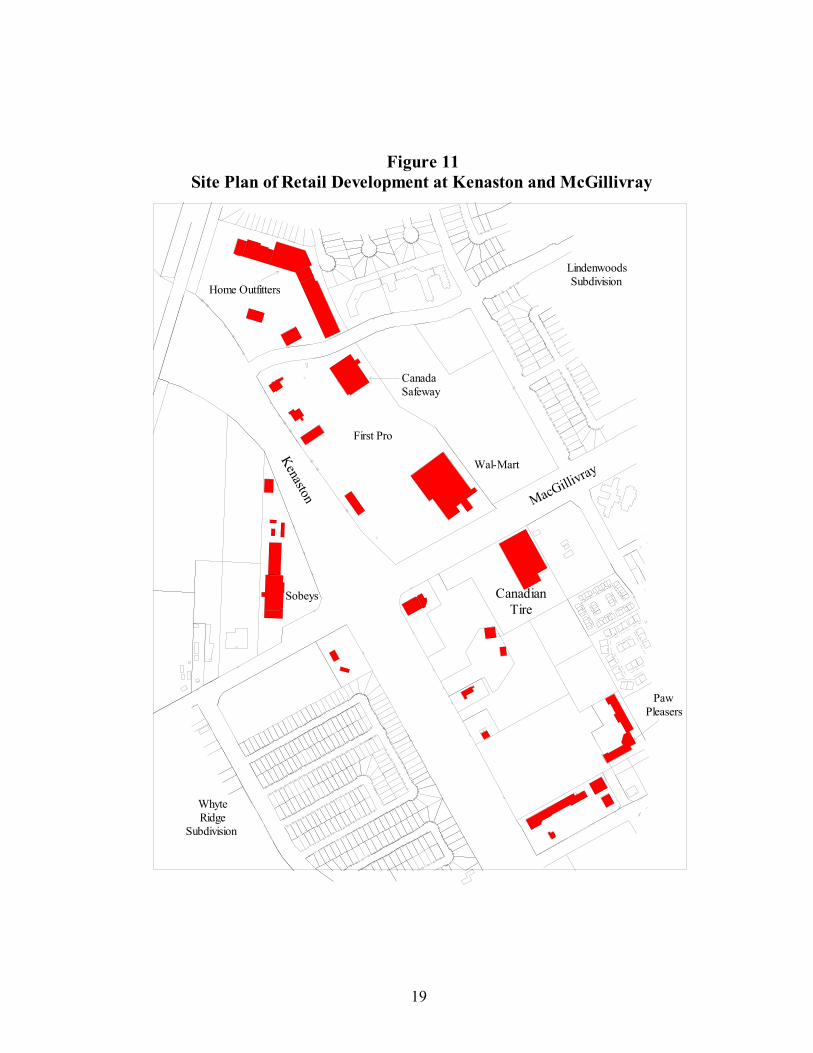
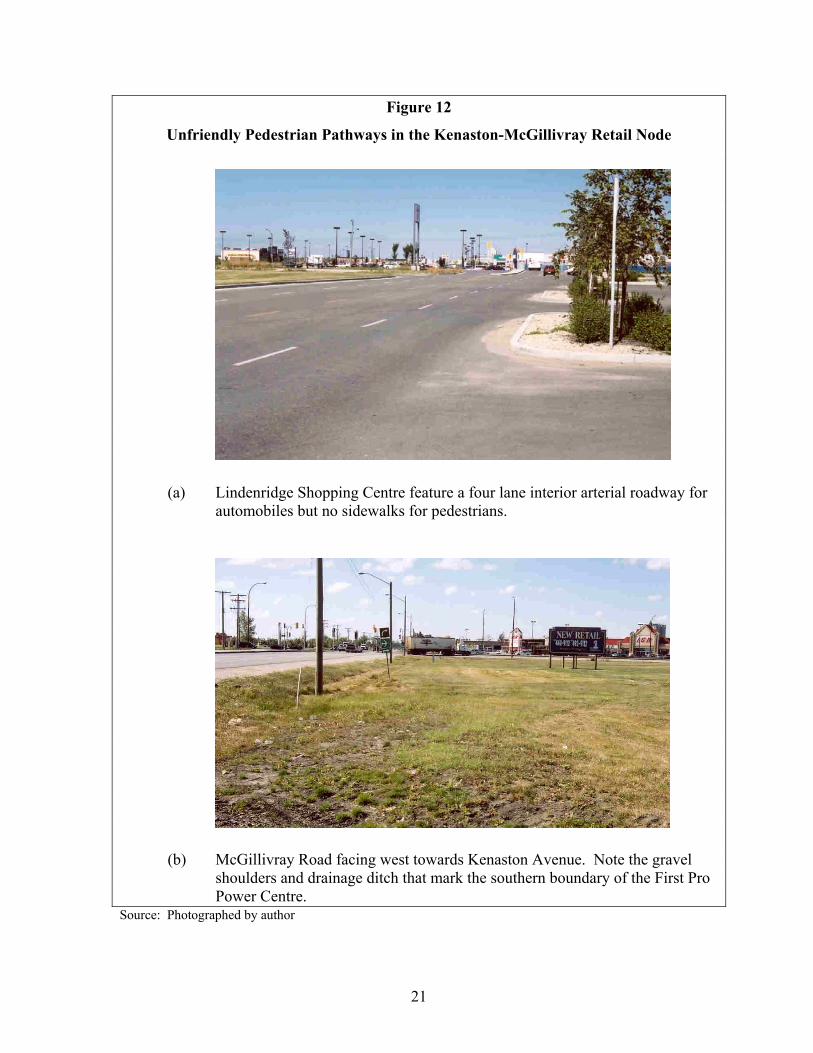
Figure 12
Unfriendly Pedestrian Pathways in the Kenaston-McGillivray Retail Node
(a) Lindenridge Shopping Centre feature a four lane interior arterial roadway for automobiles but no sidewalks for pedestrians.
(b) McGillivray Road facing west towards Kenaston Avenue. Note the gravel shoulders and drainage ditch that mark the southern boundary of the First Pro Power Centre.
Source: Photographed by author
22
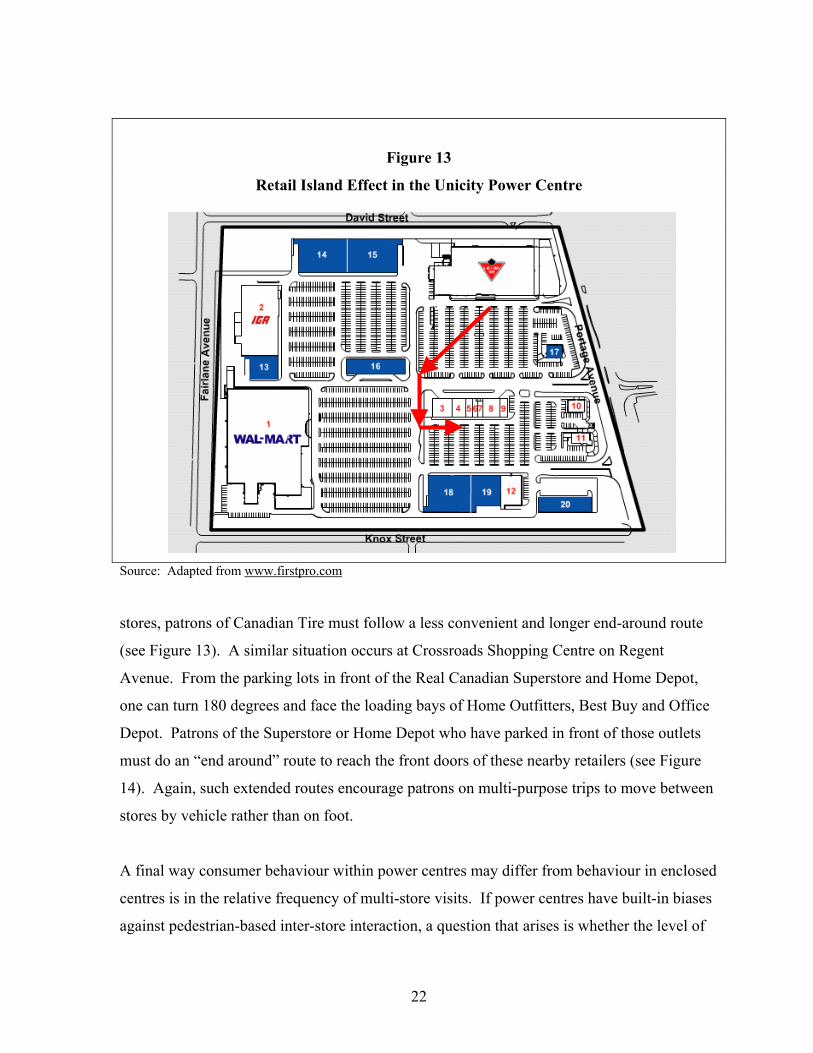
Figure 13
Retail Island Effect in the Unicity Power Centre
Source: Adapted from www.firstpro.com
stores, patrons of Canadian Tire must follow a less convenient and longer end-around route
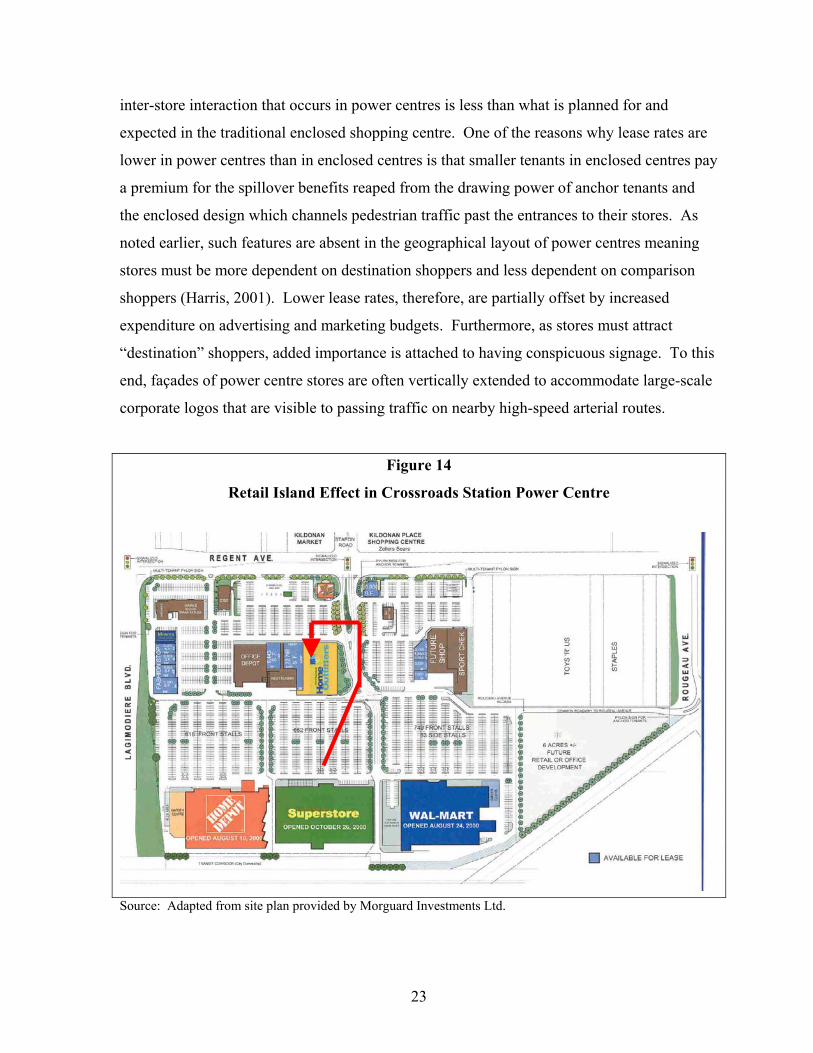
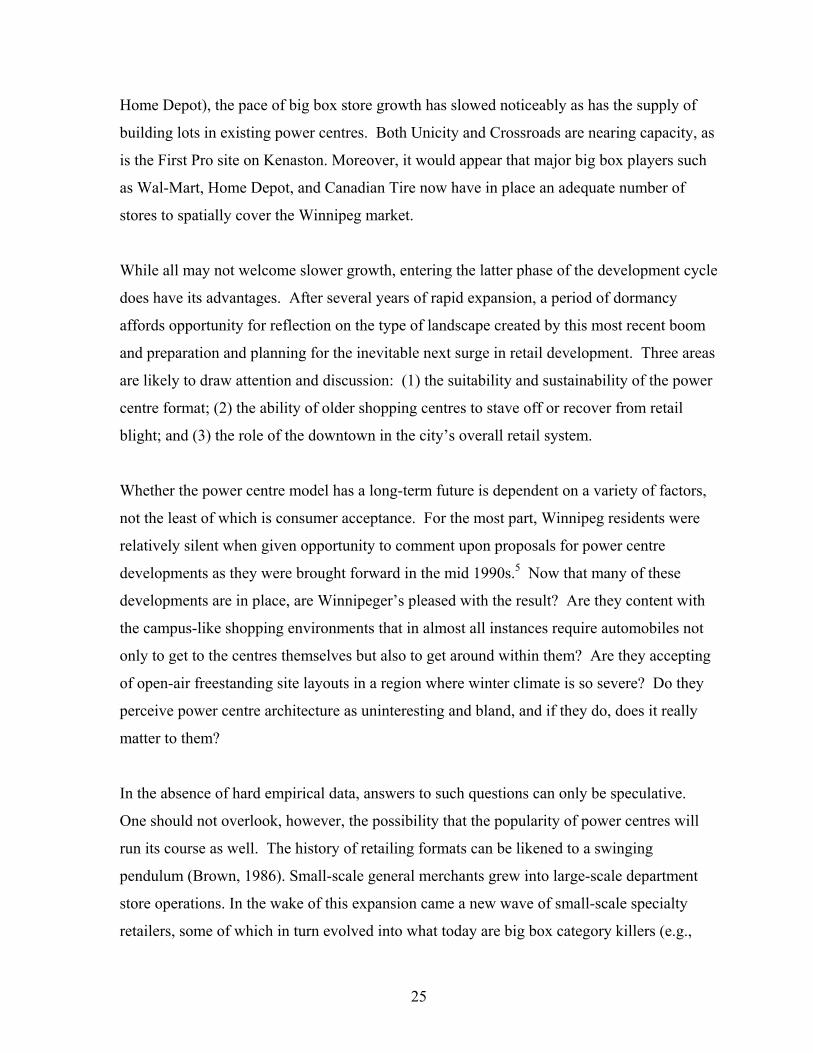
(see Figure 13). A similar situation occurs at Crossroads Shopping Centre on Regent
Avenue. From the parking lots in front of the Real Canadian Superstore and Home Depot,
one can turn 180 degrees and face the loading bays of Home Outfitters, Best Buy and Office
Depot. Patrons of the Superstore or Home Depot who have parked in front of those outlets
must do an “end around” route to reach the front doors of these nearby retailers (see Figure
14). Again, such extended routes encourage patrons on multi-purpose trips to move between
stores by vehicle rather than on foot.
A final way consumer behaviour within power centres may differ from behaviour in enclosed
centres is in the relative frequency of multi-store visits. If power centres have built-in biases
against pedestrian-based inter-store interaction, a question that arises is whether the level of
23
inter-store interaction that occurs in power centres is less than what is planned for and
expected in the traditional enclosed shopping centre. One of the reasons why lease rates are
lower in power centres than in enclosed centres is that smaller tenants in enclosed centres pay
a premium for the spillover benefits reaped from the drawing power of anchor tenants and
the enclosed design which channels pedestrian traffic past the entrances to their stores. As
noted earlier, such features are absent in the geographical layout of power centres meaning
stores must be more dependent on destination shoppers and less dependent on comparison
shoppers (Harris, 2001). Lower lease rates, therefore, are partially offset by increased
expenditure on advertising and marketing budgets. Furthermore, as stores must attract
“destination” shoppers, added importance is attached to having conspicuous signage. To this
end, façades of power centre stores are often vertically extended to accommodate large-scale
corporate logos that are visible to passing traffic on nearby high-speed arterial routes.
Figure 14
Retail Island Effect in Crossroads Station Power Centre
Source: Adapted from site plan provided by Morguard Investments Ltd.
24
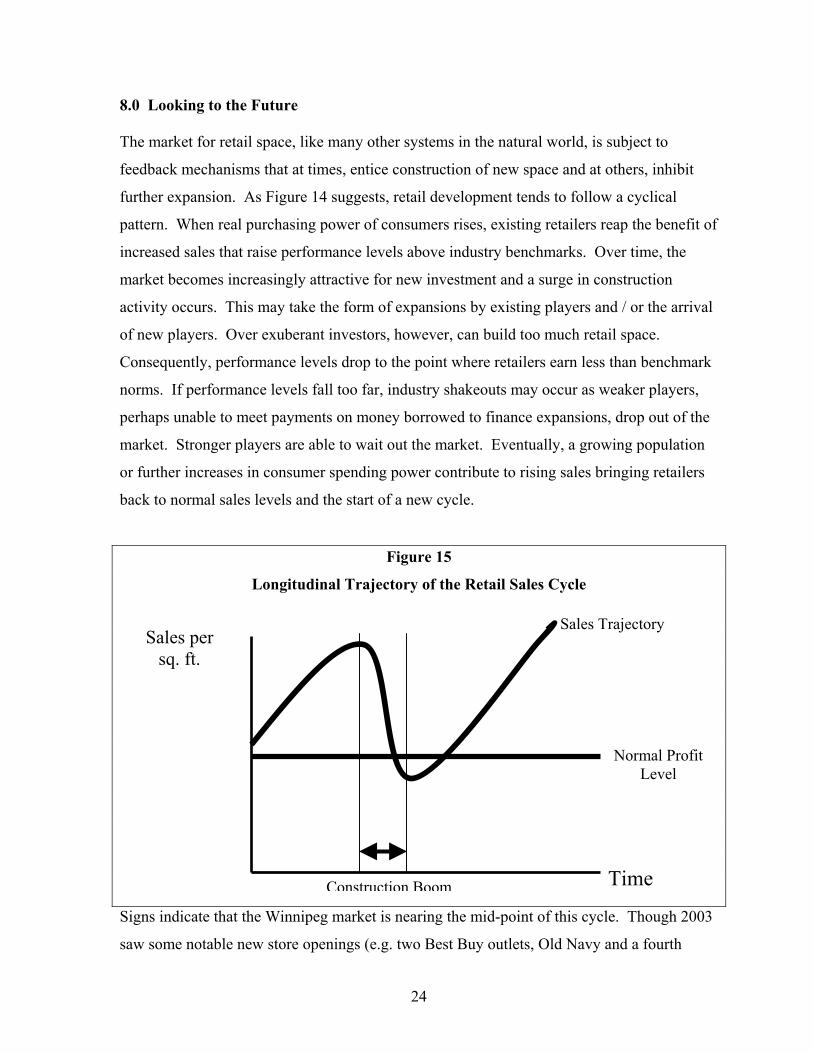
8.0 Looking to the Future The market for retail space, like many other systems in the natural world, is subject to
feedback mechanisms that at times, entice construction of new space and at others, inhibit
further expansion. As Figure 14 suggests, retail development tends to follow a cyclical
pattern. When real purchasing power of consumers rises, existing retailers reap the benefit of
increased sales that raise performance levels above industry benchmarks. Over time, the
market becomes increasingly attractive for new investment and a surge in construction
activity occurs. This may take the form of expansions by existing players and / or the arrival
of new players. Over exuberant investors, however, can build too much retail space.
Consequently, performance levels drop to the point where retailers earn less than benchmark
norms. If performance levels fall too far, industry shakeouts may occur as weaker players,
perhaps unable to meet payments on money borrowed to finance expansions, drop out of the
market. Stronger players are able to wait out the market. Eventually, a growing population
or further increases in consumer spending power contribute to rising sales bringing retailers
back to normal sales levels and the start of a new cycle.
Figure 15
Longitudinal Trajectory of the Retail Sales Cycle
Signs indicate that the Winnipeg market is nearing the mid-point of this cycle. Though 2003
saw some notable new store openings (e.g. two Best Buy outlets, Old Navy and a fourth
Sales per sq. ft.
Normal ProfitLevel
Time Construction Boom
Sales Trajectory
25
Home Depot), the pace of big box store growth has slowed noticeably as has the supply of
building lots in existing power centres. Both Unicity and Crossroads are nearing capacity, as
is the First Pro site on Kenaston. Moreover, it would appear that major big box players such
as Wal-Mart, Home Depot, and Canadian Tire now have in place an adequate number of
stores to spatially cover the Winnipeg market.
While all may not welcome slower growth, entering the latter phase of the development cycle
does have its advantages. After several years of rapid expansion, a period of dormancy
affords opportunity for reflection on the type of landscape created by this most recent boom
and preparation and planning for the inevitable next surge in retail development. Three areas
are likely to draw attention and discussion: (1) the suitability and sustainability of the power
centre format; (2) the ability of older shopping centres to stave off or recover from retail
blight; and (3) the role of the downtown in the city’s overall retail system.
Whether the power centre model has a long-term future is dependent on a variety of factors,
not the least of which is consumer acceptance. For the most part, Winnipeg residents were
relatively silent when given opportunity to comment upon proposals for power centre
developments as they were brought forward in the mid 1990s.5 Now that many of these
developments are in place, are Winnipeger’s pleased with the result? Are they content with
the campus-like shopping environments that in almost all instances require automobiles not
only to get to the centres themselves but also to get around within them? Are they accepting
of open-air freestanding site layouts in a region where winter climate is so severe? Do they
perceive power centre architecture as uninteresting and bland, and if they do, does it really
matter to them?
In the absence of hard empirical data, answers to such questions can only be speculative.
One should not overlook, however, the possibility that the popularity of power centres will
run its course as well. The history of retailing formats can be likened to a swinging
pendulum (Brown, 1986). Small-scale general merchants grew into large-scale department
store operations. In the wake of this expansion came a new wave of small-scale specialty
retailers, some of which in turn evolved into what today are big box category killers (e.g.,
26
Toys R Us, Linen n Things). What is the next step in this progression? Will an aging
population of consumers eventually grow tired of cavernous self-service stores? Will the
pendulum then swing back in the direction of smaller scale retailers offering specialized
goods with greater emphasis on pre and after sales service? If so, what will become of power
centres with geographies that favour large scale tenants and automobile dependent
consumers? In some American cities, there are already indications that the power centre
format is undergoing a transformation as new retail suburban retail developments begin to
adopt a mixed use approach (Schwanke, 2003). Hence, rather than building single purpose
retail centres, developers are producing projects that incorporate civic functions such as
libraries, recreation complexes and municipal offices as well as residential units. Internal
road systems too are being changed to take on more of a conventional ‘main street’ look
(Truit, 2003). Certainly one area in Winnipeg where such design features might take root is
in Waverly West in the city’s southwest quadrant. While the site is still in agricultural use,
plans call for a series of subdivision developments to be built over the course of several
decades that will collectively house some 50,000 people.6 Notwithstanding market and
political pressures that might come to bear, there is potential to create a less automobile
dependent type of suburban development than what has been built in the past.7
While the big box store phenomenon has apparently not significantly dented the fortunes of
shopping centres at the top end of the retail hierarchy, the same cannot be said for malls
lower down in the hierarchy. Of particular interest are those at the community level, a
Winnipeg example being the Charleswood Shopping Centre on Grant Avenue. Historically,
such centres have offered convenience goods and services along with a smattering of
shopping goods (e.g. fashion, home décor). When these latter functions are squeezed out of
the market by big-box competition, the vacancies created are in excess of what can be
absorbed by any expansion of convenience goods and services. Also commonly found in
such centres are junior department stores operating on spaces less than one half the size of
that occupied by a typical new Wal-Mart or Zellers location. The owners of the Charleswood
mall faced both of these pressures. The closure of a small Zellers store along with its
inability to fill many of its smaller commercial units lead to a decision to convert the mall
from its enclosed form to an open-air design. As part of this reconfiguration, the old Zellers
27
location is being demolished and replaced with a new big-box scale Shoppers Drug Mart
(Winnipeg Free Press, 2004b). The net result is a downgrading of the status of the mall to
more of a neighbourhood function. As centres such as Charleswood come under increasing
competitive pressure, there will also be opportunity to explore their potential for conversion
to mixed use developments. As the baby boom ages, demand for housing with accessibility
to frequently used retail services such as grocery supermarkets, drug stores, financial
institutions, medical practices and restaurants as well as recreational and social services such
as drop-in centres and fitness clubs may provide the boost needed to make tired retail
properties profitable once again.
A final focal point for reflection is the role the downtown core is to play in the overall retail
system of Winnipeg. As was the case with most North American cities, downtown
Winnipeg’s lost its hegemonic position in the 1970s when a ring of suburban regional malls
anchored by major department stores appeared on the landscape. Since then, continued
growth of housing subdivisions such as Lindenwoods and Whyte Ridge has created a ready
market for further suburban retail expansion. Suburbanites, it seems, have never had more
reason to do their shopping close to home as opposed to coming downtown. This is not to
say that downtown has become a retail wasteland. A significant retail presence still exists
but much of it is found inside the three enclosed malls and hence invisible to passing traffic.
What passing traffic does see are numerous vacant storefronts on the downtown’s main
artery, Portage Avenue. Even so, optimism for revitalization can be built upon the opening
of stores such as Mountain Equipment Co-op, a&b Sound, Red Apple, Giant Tiger and
Staples in the downtown core and by potential spin off benefits from the MTS Centre, a new
15,000 seat arena & entertainment complex slated to open its Portage Avenue doors in
November, 2004.8
All this new development notwithstanding, the most probable role for the downtown will be
that of a retail goods and service provider for what is still a sizeable downtown workforce.
While retailing in Winnipeg has decentralized over the years, the same cannot be said for
office space. The downtown core is still the dominant home of the office-based commercial
functions. For example, members of the Downtown Business Improvement Zone collectively
28
employ close to 35,000 people.9 Add in those working in offices and businesses in the
Exchange District, the provincial legislature and Great West Life and the workforce easily
climbs closer to 50,000 or more. Factor in still an additional 2,000 Manitoba Hydro
employees who will occupy a new headquarters office tower on Portage Avenue and one
cannot be entirely pessimistic about the future of downtown.
9.0 Summary and Conclusion Rising per capita retail sales, lower debt financing rates and a devalued Canadian dollar that
kept more shoppers at home all helped to support a wave of big box store and power centre
development in Winnipeg between 1996 and 2002. This wave, which brought a number of
new players and a considerable amount of new floor space to the local market, did not
significantly alter the spatial configuration of the city’s retail system. Much of the new
development has been concentrated in and around pre-existing regional-level nodes.
Increased competition from alternative retail formats has not adversely affected traditional
enclosed shopping centres, at least in terms of their ability to maintain occupancy rates.
Some locational shuffling and re-bannering of stores has occurred but overall the combined
effect of the loss of three Eaton’s stores and the addition of five new Wal-Mart stores has not
left any of the major enclosed centres without its historical number of anchor tenants. As
well, major enclosed centres such as Polo Park, St. Vital and Kildonan Place have been
successful in attracting larger format stores themselves by combining several smaller units to
accommodate the larger space needs of stores such as Eddie Bauer, Gap and American Eagle
or by sacrificing parking space to expand the existing building (e.g. London Drugs at St.
Vital Centre) or to construct on-site satellite retail units (e.g. Pier 1 at Polo Park).
The fallout from the wave of big box store expansion seems more conspicuous at lower
levels of the retail hierarchy. Vacancy rates in smaller open-air strip malls were found to be
in the range of 15 to 25 percent or five to eight times higher than what is the case in the
larger enclosed malls. Hence, as the average size of retail units increase and the number of
smaller “mom and pop,” non-chain retail businesses decrease, landlords of these smaller
29
malls are finding it increasingly difficult to find tenants to fill the type of units they have for
lease.
While the advent of power centres may not have significantly altered the geographical
distribution of shopping opportunities for Winnipeg consumers, the design of such centres
certainly has the potential to alter the nature of individual shopping trips. The shear scale of
these centres coupled with the way retail outlets are dispersed around the perimeter of sites
decreases the ease of inter-store interaction, especially by foot. Layouts are more conducive,
then, to purpose-minded destination shopping rather than outings for browsing. Shopping as
entertainment is also suppressed by the lack of enclosed common spaces and a central
corridor to channel the flow of pedestrians. Lack of climate controlled common space also
hinders the use of power centres as places to meet, hang out or just simply to stop, rest and
people watch.
Are Winnipeg consumers content with the new retail landscapes that have been created?
One might be tempted to answer this in the affirmative given the large number of cars
observed in the parking lots of the newest power centres on most weeknights and weekends.
Usage, though, may not in itself, be an indication of satisfaction. Usage may indicate the
attraction of something novel or perhaps resignation to the fact that alternatives to the cookie
cutter designs employed by power centre developers have not yet materialized. In the final
analysis, it seems an opportune time to reflect on what has transpired over the past decade
and to ask whether more of the same is a desirable option.
30
Notes 1 First Pro provides a listing of its shopping centre projects on its web site. See
www.firstpro.com. See Silcoff (2000) for an overview of First Pro’s rise to prominence in the Canadian commercial real estate development sector.
2 The average Canadian household has $103 in debt (mortgages and consumer credit
combined) for every $100 of disposable income (see Statistics Canada (2004). 3 The five super-regional and regional shopping centres are, in order of gross leasable area,
Polo Park Shopping Centre, St. Vital Centre, Garden City Shopping Centre, Kildonan Place, Grant Park Shopping Centre.
4 For a more detailed discussion of intentional features of mall design, see Bodamer
(2001), Goss (1993) and Farrell (2003). 5 The extent of citizen activism in Winnipeg pales in comparison to the opposition seen
recently in such American cities as Los Angeles (Wood, 2003), Oakland (Hallissy, 2004) and Denver (Ingold, 2004) where ordinances banning the construction of Wal-Mart super-centres have either been put in place or are being debated.
6 Waverly West will be bordered by Bishop Grandin Boulevard on the north and Waverly
Avenue on the east. While plans for the subdivision are far from being finalized, design concepts being considered call for the inclusion of a mixture of dwelling types and the use of geo-thermal energy as source of heating (see Winnipeg Free Press, 2004a).
7 Winnipeg’s Whyte Ridge subdivision provides a classic example of an automobile
dependent subdivision. The subdivision is exclusively single detached dwellings with a large majority having a two car garage. It also almost devoid of pedestrian-accessible neighbourhood shopping opportunities. The only retail use built into the community of 1,700 homes is a gas bar / convenience store located at the main entrance to the subdivision.
8 Downtown big box stores, though still somewhat of a rarity, are starting to make their
appearance in several North American cities as opportunities for suburban expansion are exhausted. Lowes, the big box American hardware chain, recently opened a 136,000 square foot store in the New York City borough of Brooklyn (Caldwell, 2004) while Safeway has opened a 50,000 square foot supermarket in downtown Portland replete with an underground parking garage below and residential units above (Libby, 2004).
9 Employment totals are based on data provided by the Winnipeg Downtown Biz.
31
References
Bodamer, D. 2001. From classic to rock, music sets mood for malls. Shopping Centers Today. October. http://www.icsc.org/srch/sct/current/sct1001/page66.html
Brown, S. 1986. Institutional change in retailing: a geographical interpretation. Progress in Human Geography 11 (2): 181-206.
Caldwell, D. 2004. Suburban retailing for the New Brooklyn. New York Times. May 3. http://www.nytimes.com
Farrell, J. 2003. One Nation Under Goods: the Seductions of American Shopping. Washington & London: Smithsonian Books.
Garreau, J. 1991. Edge City: Life on the New Frontier. New York: Doubleday.
Goss, J. 1993. The “magic of the mall”: an analysis of form function and meaning in the contemporary retail build environment. Annals of the American Association of Geographers 83 (1) 18-47.
Hallissy, E. 2004. Wal-Mart's super-size battle in the Bay Area: Contra Costa seeks to ban huge stores. San Francisco Chronicle. February 8. http://www.sfgate.com
Harris, G. 2001. Planning to shop: what planners need to know about retail. Ontario Planning Journal 16 (6) 7-8.
Ingold, J. 2004. Disdain for Wal-Mart pulls neighbors together. Denver Post. April 18. http://www.denverpost.com
Jones, K., and M. Doucet. 2001. The big box, the flagship and beyond: impacts and trends in the Greater Toronto Area. The Canadian Geographer 45 (4) 494-512.
Jones, K., and T. Graff. 1998. Wal-Mart Comes to Canada. Research Report 1998-9. Centre for the Study of Commercial Activity, Ryerson Polytechnic University, Toronto.
Libby, B. 2004. Safeway's Portland store redefines 'green' grocer. Metropolis Magazine. http://www.metropolismag.com/html/sustainable/case/safewaygreengrocer.html
Lorch, B. 2002. A Comparative Analysis of Major Suburban Shopping Nodes in Winnipeg. Research Paper 40. Institute of Urban Studies, Winnipeg.
Schwanke, D. 2002. Mixed use Development Handbook. Washington, D.C.: Urban Land Institute.
Silcoff, S. 2000. Wal-Mart's silent partners. Canadian Business 73 (1) 10-17.
Statistics Canada. 2004. National balance sheet accounts. The Daily. March 25.
32
Truit, S. 2003. The Greying of American Retail: Putting the ‘All’ back in Malls. Reiss Insights: Commentary and Analysis. December 16. http://www. reis.com
Winnipeg Free Press. 2004a. A vision for Winnipeg: environment not forgotten in southern city suburb. February 27. http://winnipegfreepress.com
Winnipeg Free Press. 2004b. A new face for Charleswood Centre. May 4, C6.
Wood, D. 2003. Wal-Mart rollout - or rollback? Christian Science Monitor. December 24. http://www.csmonitor.com/2003/1224/p01s01-usec.html
Yeates, M. 2000. The GTA @ Y2K: the Dynamics of Change in the Commercial Structure of the Greater Toronto Area. Research Report 2000-1, Centre for the Study of Commercial Activity, Ryerson Polytechnic University, Toronto.