Modeling bidding competitiveness and position performance in multi-attribute construction auctions
1
Abstract— the objective of this work is to discuss the modeling
of auctions of long-term electricity supply contracts for new capacity in Brazil. The modeling of risks such as price-quantity (hydrological) risk, project completion risk, environmental constraints, climate change and regulatory risks are discussed. An analytical model will be developed to price these risks and case studies will be presented for real projects that have participated in the Brazilian contract auctions for new capacity. We also discuss selection of projects with different risks.
Index Terms-- Power system economics, Auctions, electricity market, auction theory, investment, energy supply contracts.
I. INTRODUCTION
He need to ensure sufficient and efficient generation capacity has become a crucial challenge in electricity
markets. This includes the establishment of correct incentives to allow the entrance of new generation in order to meet load growth. Different countries worldwide are concerned on ensuring enough investment in the electric power sector, to achieve a reliable supply. This is particularly important in developing countries which present a fast and volatile demand growth. Latin America provides a good example. The region is characterized by high electricity demand growth rates (over 4-5% yearly) and strong hydro share (about 60%).
Countries in Latin America have operating power markets, mostly with centralized least-cost dispatch and energy spot prices based on marginal costs [9]. Because the energy spot price is very volatile (influenced by hydrological conditions), it has not provided the correct signals for system expansion. Consequently, current electricity market designs are being reviewed to avoid supply difficulties and to stimulate the entrance of new generation capacity. Several countries are progressing into a second stage of reforms with public supply auctions in a private environment. While their primary challenge is to ensure sufficient capacity and investment to serve reliably their growing economies, their second one is to meet low costs and prices of generation.
This second stage of reform has increased the importance
L.A. Barroso, S.Granville and B.Bezerra are with PSR, Rio de Janeiro,
Brazil (e-mail: [email protected], [email protected], [email protected])
A.Street is with PUC-Rio, Dept of Electrical Engineering, Rio de Janeiro, Brazil (e-mail: [email protected])
of long-term signals as contract prices and has dropped the short-term ones as spot prices. Although with different implementations per country, the core of the new proposals lies in two main rules:
a) All consumers, both regulated and free, should be 100% contracted. All contracts, which are financial instruments, should be covered by “firm energy” or “firm capacity” certificates. This means that a bundled product, which incorporates the “capacity certificate” and the “energy contract” is offered;
b) For the regulated users, the procurement of long-term contracts for new capacity is carried out through public auctions. Again, this is a “bundled” product: when the consumer buys the contract, it gets the capacity certificate. Auctions are used to incorporate a real market signal in the price of electricity contracts, and to ensure supply investment.
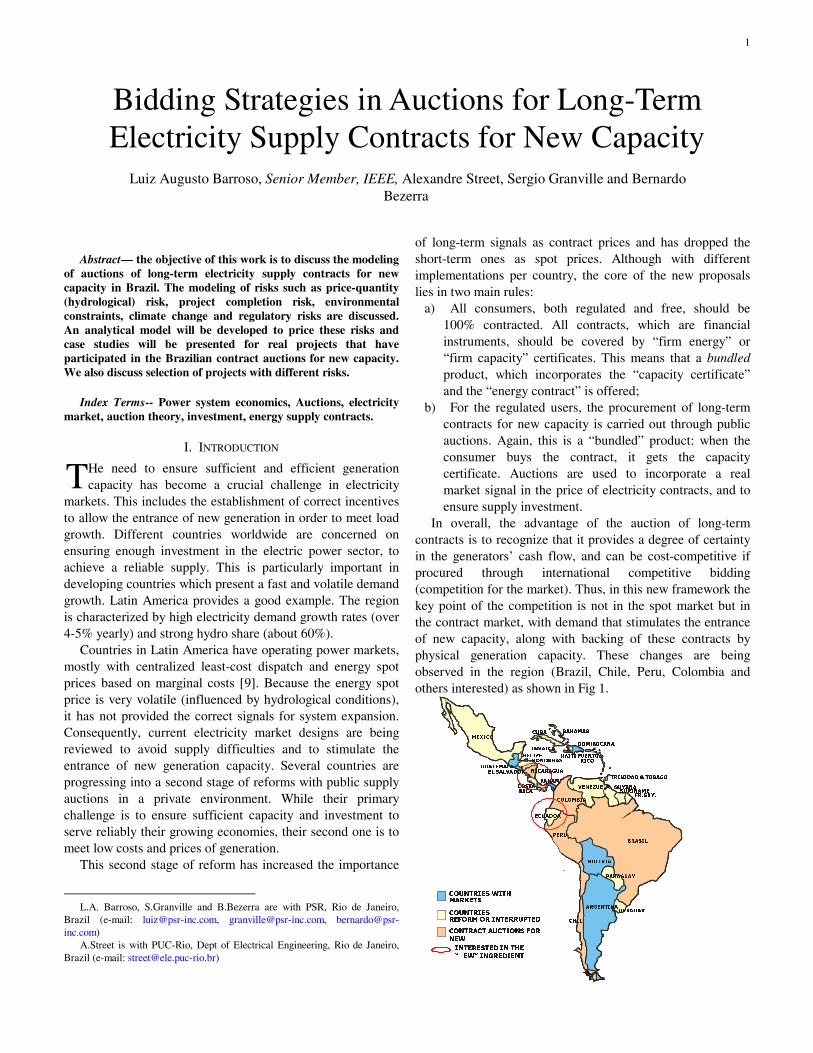
In overall, the advantage of the auction of long-term contracts is to recognize that it provides a degree of certainty in the generators’ cash flow, and can be cost-competitive if procured through international competitive bidding (competition for the market). Thus, in this new framework the key point of the competition is not in the spot market but in the contract market, with demand that stimulates the entrance of new capacity, along with backing of these contracts by physical generation capacity. These changes are being observed in the region (Brazil, Chile, Peru, Colombia and others interested) as shown in Fig 1.
Bidding Strategies in Auctions for Long-Term Electricity Supply Contracts for New Capacity
Luiz Augusto Barroso, Senior Member, IEEE, Alexandre Street, Sergio Granville and Bernardo Bezerra
T
GUATEMALA
MEXICO
NICARAGUA
PANAMA
EL SALVADOR
BELIZEHONDURAS
PANAMACOSTARICA
COLOMBIA
BRASIL
ECUADOR
PERU
BOLIVIA
ARGENTINA
CHIL
VENEZUELA GUYANA
DOMINICANA
PUERTORICO
TRINIDAD & TOBAGO
BAHAMASCUBA
JAMAICA
HAITI
SURINAMEFR.GUY.
PARAGUAY
URUGUAY
MÉXICO
GUATEMALA
MEXICO
NICARAGUA
PANAMA
EL SALVADOR
BELIZEHONDURAS
PANAMACOSTARICA
GUATEMALA
MEXICO
NICARAGUA
PANAMA
EL SALVADOR
BELIZEHONDURAS
PANAMACOSTARICA
COLOMBIA
BRASIL
ECUADOR
PERU
BOLIVIA
ARGENTINA
CHIL
VENEZUELA GUYANA
DOMINICANA
PUERTORICO
TRINIDAD & TOBAGO
BAHAMASCUBA
JAMAICA
HAITI
SURINAMEFR.GUY.
PARAGUAY
URUGUAY
MEXICO
COUNTRIES
REFORM OR INTERRUPTED
MARKETS
COUNTRIES WITH
CONTRACT AUCTIONS FOR
NEW
INTERESTED IN THE
“
EW” INGREDIENT
GUATEMALA
MEXICO
NICARAGUA
PANAMA
EL SALVADOR
BELIZEHONDURAS
PANAMACOSTARICA
COLOMBIA
BRASIL
ECUADOR
PERU
BOLIVIA
ARGENTINA
CHIL
VENEZUELA GUYANA
DOMINICANA
PUERTORICO
TRINIDAD & TOBAGO
BAHAMASCUBA
JAMAICA
HAITI
SURINAMEFR.GUY.
PARAGUAY
URUGUAY
MÉXICO
GUATEMALA
MEXICO
NICARAGUA
PANAMA
EL SALVADOR
BELIZEHONDURAS
PANAMACOSTARICA
GUATEMALA
MEXICO
NICARAGUA
PANAMA
EL SALVADOR
BELIZEHONDURAS
PANAMACOSTARICA
COLOMBIA
BRASIL
ECUADOR
PERU
BOLIVIA
ARGENTINA
CHIL
VENEZUELA GUYANA
DOMINICANA
PUERTORICO
TRINIDAD & TOBAGO
BAHAMASCUBA
JAMAICA
HAITI
SURINAMEFR.GUY.
PARAGUAY
URUGUAY
MEXICO
COUNTRIES
REFORM OR INTERRUPTED
MARKETS
COUNTRIES WITH
CONTRACT AUCTIONS FOR
NEW
INTERESTED IN THE
“
EW” INGREDIENT
GUATEMALA
MEXICO
NICARAGUA
PANAMA
EL SALVADOR
BELIZEHONDURAS
PANAMACOSTARICA
GUATEMALA
MEXICO
NICARAGUA
PANAMA
EL SALVADOR
BELIZEHONDURAS
PANAMACOSTARICA
COLOMBIA
BRASIL
ECUADOR
PERU
BOLIVIA
ARGENTINA
CHIL
VENEZUELA GUYANA
DOMINICANA
PUERTORICO
TRINIDAD & TOBAGO
BAHAMASCUBA
JAMAICA
HAITI
SURINAMEFR.GUY.
PARAGUAY
URUGUAY
MÉXICO
GUATEMALA
MEXICO
NICARAGUA
PANAMA
EL SALVADOR
BELIZEHONDURAS
PANAMACOSTARICA
GUATEMALA
MEXICO
NICARAGUA
PANAMA
EL SALVADOR
BELIZEHONDURAS
PANAMACOSTARICA
COLOMBIA
BRASIL
ECUADOR
PERU
BOLIVIA
ARGENTINA
CHIL
VENEZUELA GUYANA
DOMINICANA
PUERTORICO
TRINIDAD & TOBAGO
BAHAMASCUBA
JAMAICA
HAITI
SURINAMEFR.GUY.
PARAGUAY
URUGUAY
MEXICO
COUNTRIES
REFORM OR INTERRUPTED
MARKETS
COUNTRIES WITH
CONTRACT AUCTIONS FOR
NEW
INTERESTED IN THE
“
EW” INGREDIENT
2
Fig. 1: Current situation in Latin America
Brazil has leaded this process starting contract auctions in
2004 [5]. So far more than 30,000 aMW (energy, not peak) have been auctioned in the country (between contract renewal and new energy contracts).
The establishment of the mandatory contracting and the contract auctions create opportunities and challenges for investors willing to bid in the auctions. Opportunities appear because if an investor wins an auction, it gets a long-term energy contract that provides a degree of certainty in the generators’ cash flow, thus allowing access to long-term financing. On the other hand, challenges appear on the bidding side: bidders are obviously interested in developing bidding strategies in the contract auction that maximizes its profits, taking into account its risk profile and important long-term uncertainties with respect to the opportunity cost of its energy, construction risks, regulatory risks and other long-term risks that are involved in a long-term contract. The challenge is then how to price these risks in a single energy price, to be offered in the auctions.
The objective of this work is to start the discussion of the modeling of auctions of long-term electricity supply contracts for new capacity in Brazil1. The modeling of risks such as price-quantity risk, project completion risk, environmental constraints, climate change and regulatory risks are discussed. An analytical model will be developed to price these risks and case studies will be presented for real projects that have participated in the Brazilian contract auctions. This paper was prepared for a panel session on long-term risk analysis for the 2008 IEEE PES General Meeting.
II. MARKET FRAMEWORK
A. The Power System
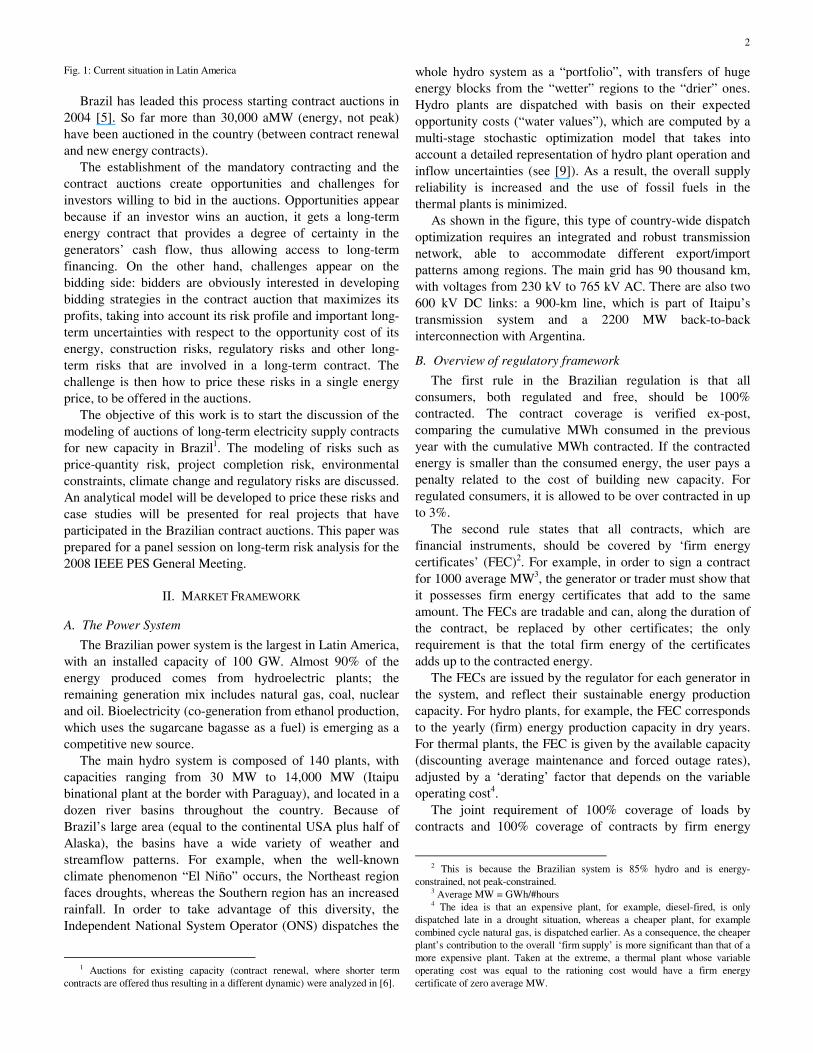
The Brazilian power system is the largest in Latin America, with an installed capacity of 100 GW. Almost 90% of the energy produced comes from hydroelectric plants; the remaining generation mix includes natural gas, coal, nuclear and oil. Bioelectricity (co-generation from ethanol production, which uses the sugarcane bagasse as a fuel) is emerging as a competitive new source.
The main hydro system is composed of 140 plants, with capacities ranging from 30 MW to 14,000 MW (Itaipu binational plant at the border with Paraguay), and located in a dozen river basins throughout the country. Because of Brazil’s large area (equal to the continental USA plus half of Alaska), the basins have a wide variety of weather and streamflow patterns. For example, when the well-known climate phenomenon “El Niño” occurs, the Northeast region faces droughts, whereas the Southern region has an increased rainfall. In order to take advantage of this diversity, the Independent National System Operator (ONS) dispatches the
1 Auctions for existing capacity (contract renewal, where shorter term
contracts are offered thus resulting in a different dynamic) were analyzed in [6].
whole hydro system as a “portfolio”, with transfers of huge energy blocks from the “wetter” regions to the “drier” ones. Hydro plants are dispatched with basis on their expected opportunity costs (“water values”), which are computed by a multi-stage stochastic optimization model that takes into account a detailed representation of hydro plant operation and inflow uncertainties (see [9]). As a result, the overall supply reliability is increased and the use of fossil fuels in the thermal plants is minimized.
As shown in the figure, this type of country-wide dispatch optimization requires an integrated and robust transmission network, able to accommodate different export/import patterns among regions. The main grid has 90 thousand km, with voltages from 230 kV to 765 kV AC. There are also two 600 kV DC links: a 900-km line, which is part of Itaipu’s transmission system and a 2200 MW back-to-back interconnection with Argentina.
B. Overview of regulatory framework
The first rule in the Brazilian regulation is that all consumers, both regulated and free, should be 100% contracted. The contract coverage is verified ex-post, comparing the cumulative MWh consumed in the previous year with the cumulative MWh contracted. If the contracted energy is smaller than the consumed energy, the user pays a penalty related to the cost of building new capacity. For regulated consumers, it is allowed to be over contracted in up to 3%.
The second rule states that all contracts, which are financial instruments, should be covered by ‘firm energy certificates’ (FEC)2. For example, in order to sign a contract for 1000 average MW3, the generator or trader must show that it possesses firm energy certificates that add to the same amount. The FECs are tradable and can, along the duration of the contract, be replaced by other certificates; the only requirement is that the total firm energy of the certificates adds up to the contracted energy.
The FECs are issued by the regulator for each generator in the system, and reflect their sustainable energy production capacity. For hydro plants, for example, the FEC corresponds to the yearly (firm) energy production capacity in dry years. For thermal plants, the FEC is given by the available capacity (discounting average maintenance and forced outage rates), adjusted by a ‘derating’ factor that depends on the variable operating cost4.
The joint requirement of 100% coverage of loads by contracts and 100% coverage of contracts by firm energy
2 This is because the Brazilian system is 85% hydro and is energy-
constrained, not peak-constrained. 3 Average MW = GWh/#hours 4 The idea is that an expensive plant, for example, diesel-fired, is only
dispatched late in a drought situation, whereas a cheaper plant, for example combined cycle natural gas, is dispatched earlier. As a consequence, the cheaper plant’s contribution to the overall ‘firm supply’ is more significant than that of a more expensive plant. Taken at the extreme, a thermal plant whose variable operating cost was equal to the rationing cost would have a firm energy certificate of zero average MW.
3
certificates creates a link between load growth and construction of new capacity. For example, if an industrial user forecasts that its load will increase by 200 average MW three years from now, it will start to procure contracts, in order to avoid the penalties. If supply is tight, the traders will not have enough FEC to cover the contract; the only option will be to offer a contract for an investor to construct a new plant. In other words, the contract coverage requirement makes load growth the driver for the construction of new capacity, and the FEC coverage requirement ensures that the constructed capacity is adequate to cover this load growth.
For the regulated users, the procurement of new capacity is carried out through two public auctions carried out every year for energy delivery 3 and 5 years ahead. Long term contracts are offered in each auction to meet future demand. Note that the Brazilian approach bundles two products: the FEC and the contract auction.
C. Auction Procedure
Discos are required to inform their load forecasts and a contract auction is carried out to meet the total load increase. The objective of the joint auction is to allow smaller Discos to benefit from economies of scale, for example of larger hydro generators. Each generator (Genco) that wins the auction signs separate bilateral contracts with each of the Discos, in proportion to their forecasted loads. This allows the benefit of cheaper energy to be shared by all consumers. Note that this contracting scheme is different from a traditional ‘single buyer’ scheme, where a government agency signs a PPA with an energy producer. In the contract auctions, there is no government interference or guarantee; the contracts are private instruments, signed between Discos and Gencos. Another important difference is that there is no government-based load forecast; Discos are responsible for this activity, thus avoiding the ‘optimistic’ government bias that in many countries has led to over-capacity and expensive PPAs. Figures 2, 3 and 4 show the main steps of the auction mechanism. In the case of auctions for new capacity, the country has used two contract types: standard financial forward contracts and energy call options.
Fig.2 - Auction scheme: before the auction
Genco 1
Genco 2
Genco m
.
.
.
Disco 1
Disco 2
Disco n
.
.
.
During the auction, Gencos bid to supply total auction demand
(descending-price clock auction)
Genco 1
Genco 2
Genco m
.
.
.
Disco 1
Disco 2
Disco n
.
.
.
During the auction, Gencos bid to supply total auction demand
(descending-price clock auction)
Fig.3 - Auction scheme: during the auction
Genco 1
Genco 2
Genco m
.
.
.
Disco 1
Disco 2
Disco n
.
.
.
During the auction, Gencos bid to supply total auction demand
(descending-price clock auction)
Genco 1
Genco 2
Genco m
.
.
.
Disco 1
Disco 2
Disco n
.
.
.
During the auction, Gencos bid to supply total auction demand
(descending-price clock auction)
Fig.4 - Auction scheme: after the auction
D. Auction Results
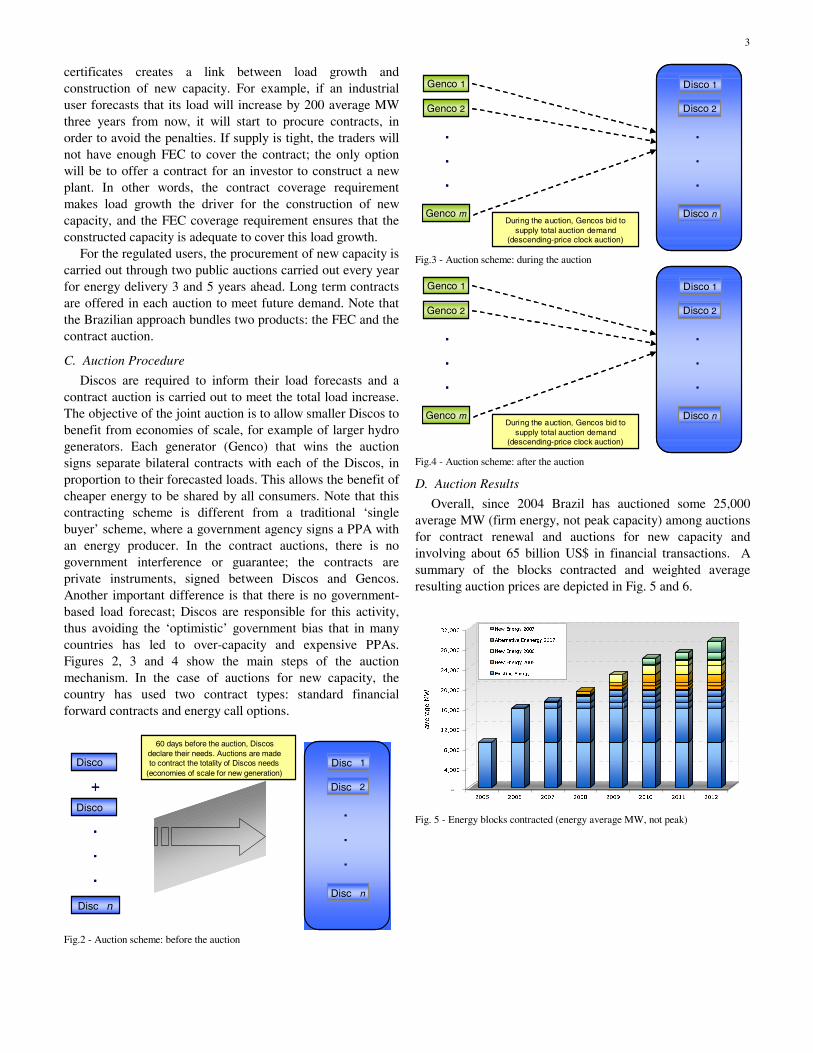
Overall, since 2004 Brazil has auctioned some 25,000 average MW (firm energy, not peak capacity) among auctions for contract renewal and auctions for new capacity and involving about 65 billion US$ in financial transactions. A summary of the blocks contracted and weighted average resulting auction prices are depicted in Fig. 5 and 6.
-
4,000
8,000
12,000
16,000
20,000
24,000
28,000
32,000
average MW
2005 2006 2007 2008 2009 2010 2011 2012
New Energy 2007
Alternative Enenergy 2007
New Energy 2006
New Energy 2005
Existing Energy
Fig. 5 - Energy blocks contracted (energy average MW, not peak)
Disco
Disco
Disc n
.
.
.
Disc 1
Disc 2
Disc n
.
.
.
+
60 days before the auction, Discosdeclare their needs. Auctions are madeto contract the totality of Discos needs
(economies of scale for new generation)Disco
Disco
Disc n
.
.
.
Disc 1
Disc 2
Disc n
.
.
.
+
60 days before the auction, Discosdeclare their needs. Auctions are madeto contract the totality of Discos needs
(economies of scale for new generation)
4
140
129
135135
135135
138 137
126
65
76
89
92
102
105
60
70
80
90
100
110
120
130
140
150
2005 2006 2007 2008 2009 2010 2011 2012
R$/MWh
New Energy 2007
Alt.Energy 2007
New Energy 2006
New Energy 2005
Existing Energy
Existing Energy (A-1 of 2007)
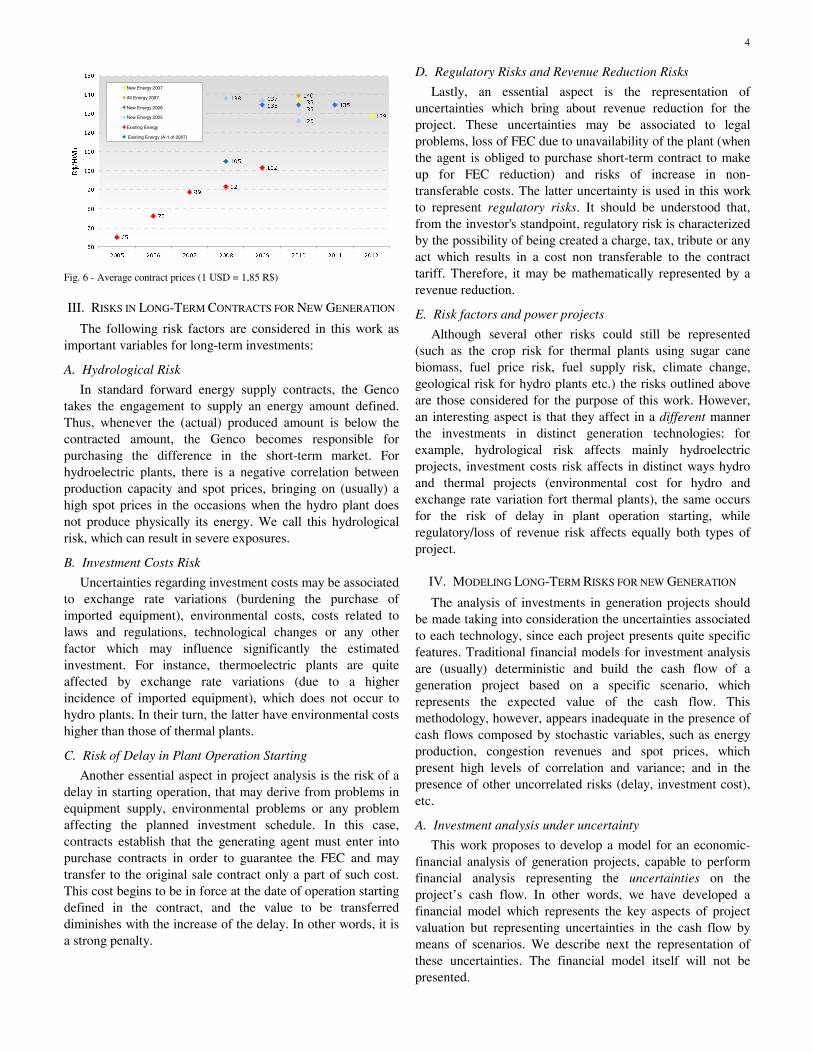
Fig. 6 - Average contract prices (1 USD = 1,85 R$)
III. RISKS IN LONG-TERM CONTRACTS FOR NEW GENERATION
The following risk factors are considered in this work as important variables for long-term investments:
A. Hydrological Risk
In standard forward energy supply contracts, the Genco takes the engagement to supply an energy amount defined. Thus, whenever the (actual) produced amount is below the contracted amount, the Genco becomes responsible for purchasing the difference in the short-term market. For hydroelectric plants, there is a negative correlation between production capacity and spot prices, bringing on (usually) a high spot prices in the occasions when the hydro plant does not produce physically its energy. We call this hydrological risk, which can result in severe exposures.
B. Investment Costs Risk
Uncertainties regarding investment costs may be associated to exchange rate variations (burdening the purchase of imported equipment), environmental costs, costs related to laws and regulations, technological changes or any other factor which may influence significantly the estimated investment. For instance, thermoelectric plants are quite affected by exchange rate variations (due to a higher incidence of imported equipment), which does not occur to hydro plants. In their turn, the latter have environmental costs higher than those of thermal plants.
C. Risk of Delay in Plant Operation Starting
Another essential aspect in project analysis is the risk of a delay in starting operation, that may derive from problems in equipment supply, environmental problems or any problem affecting the planned investment schedule. In this case, contracts establish that the generating agent must enter into purchase contracts in order to guarantee the FEC and may transfer to the original sale contract only a part of such cost. This cost begins to be in force at the date of operation starting defined in the contract, and the value to be transferred diminishes with the increase of the delay. In other words, it is a strong penalty.
D. Regulatory Risks and Revenue Reduction Risks
Lastly, an essential aspect is the representation of uncertainties which bring about revenue reduction for the project. These uncertainties may be associated to legal problems, loss of FEC due to unavailability of the plant (when the agent is obliged to purchase short-term contract to make up for FEC reduction) and risks of increase in non-transferable costs. The latter uncertainty is used in this work to represent regulatory risks. It should be understood that, from the investor's standpoint, regulatory risk is characterized by the possibility of being created a charge, tax, tribute or any act which results in a cost non transferable to the contract tariff. Therefore, it may be mathematically represented by a revenue reduction.
E. Risk factors and power projects
Although several other risks could still be represented (such as the crop risk for thermal plants using sugar cane biomass, fuel price risk, fuel supply risk, climate change, geological risk for hydro plants etc.) the risks outlined above are those considered for the purpose of this work. However, an interesting aspect is that they affect in a different manner the investments in distinct generation technologies: for example, hydrological risk affects mainly hydroelectric projects, investment costs risk affects in distinct ways hydro and thermal projects (environmental cost for hydro and exchange rate variation fort thermal plants), the same occurs for the risk of delay in plant operation starting, while regulatory/loss of revenue risk affects equally both types of project.
IV. MODELING LONG-TERM RISKS FOR NEW GENERATION
The analysis of investments in generation projects should be made taking into consideration the uncertainties associated to each technology, since each project presents quite specific features. Traditional financial models for investment analysis are (usually) deterministic and build the cash flow of a generation project based on a specific scenario, which represents the expected value of the cash flow. This methodology, however, appears inadequate in the presence of cash flows composed by stochastic variables, such as energy production, congestion revenues and spot prices, which present high levels of correlation and variance; and in the presence of other uncorrelated risks (delay, investment cost), etc.
A. Investment analysis under uncertainty
This work proposes to develop a model for an economic-financial analysis of generation projects, capable to perform financial analysis representing the uncertainties on the project’s cash flow. In other words, we have developed a financial model which represents the key aspects of project valuation but representing uncertainties in the cash flow by means of scenarios. We describe next the representation of these uncertainties. The financial model itself will not be presented.
5
B. Uncertainty representation
In order to obtain the scenarios of the uncertainties which will compose the project cash flows, hydro-thermal optimization models and market rules simulation models are utilized, under a fundamentalist approach. Thus, risk factors may be associated to their respective models as follows:
a) hydrological risk: represented by means of equiprobable scenarios produced by hydro-thermal stochastic dispatch models [9]5. As a result, time dependent production scenarios for the plant under consideration (physical production of thermal plants or energy credits of hydro plants) and difference settlement prices are produced considering the correct correlation between these variables. The major uncertainty driver is the hydrology, which is represented by Monte-Carlo simulations;
b) for the other uncertainties, a representation also by means of scenarios is used, with their respective probabilities of occurrence. This type of approach facilitates the representation of uncertainties such as Investment, Delay, Regulatory and Environmental issues. They can be assumed to be uncorrelated to each other and to spot prices and the future generation profile (depending on hydrology), and therefore scenarios can be independently generated and used to compound the cash flow scenarios randomly. Nevertheless, this approach requires from the analysts a knowledge of the possible risks associated to investment for each type of technology.
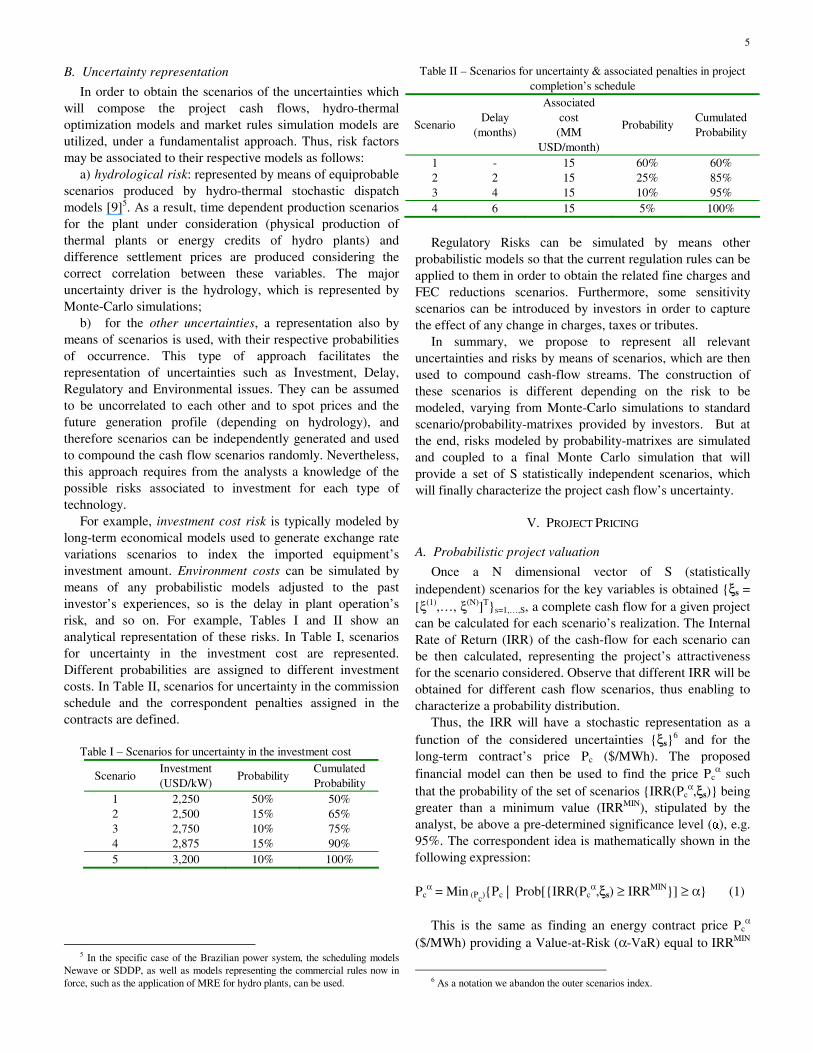
For example, investment cost risk is typically modeled by long-term economical models used to generate exchange rate variations scenarios to index the imported equipment’s investment amount. Environment costs can be simulated by means of any probabilistic models adjusted to the past investor’s experiences, so is the delay in plant operation’s risk, and so on. For example, Tables I and II show an analytical representation of these risks. In Table I, scenarios for uncertainty in the investment cost are represented. Different probabilities are assigned to different investment costs. In Table II, scenarios for uncertainty in the commission schedule and the correspondent penalties assigned in the contracts are defined.
Table I – Scenarios for uncertainty in the investment cost
Scenario Investment (USD/kW)
Probability Cumulated Probability
1 2,250 50% 50% 2 2,500 15% 65% 3 2,750 10% 75% 4 2,875 15% 90% 5 3,200 10% 100%
5 In the specific case of the Brazilian power system, the scheduling models
Newave or SDDP, as well as models representing the commercial rules now in force, such as the application of MRE for hydro plants, can be used.
Table II – Scenarios for uncertainty & associated penalties in project completion’s schedule
Scenario Delay
(months)
Associated cost (MM
USD/month)
Probability Cumulated Probability
1 - 15 60% 60% 2 2 15 25% 85% 3 4 15 10% 95% 4 6 15 5% 100%
Regulatory Risks can be simulated by means other
probabilistic models so that the current regulation rules can be applied to them in order to obtain the related fine charges and FEC reductions scenarios. Furthermore, some sensitivity scenarios can be introduced by investors in order to capture the effect of any change in charges, taxes or tributes.
In summary, we propose to represent all relevant uncertainties and risks by means of scenarios, which are then used to compound cash-flow streams. The construction of these scenarios is different depending on the risk to be modeled, varying from Monte-Carlo simulations to standard scenario/probability-matrixes provided by investors. But at the end, risks modeled by probability-matrixes are simulated and coupled to a final Monte Carlo simulation that will provide a set of S statistically independent scenarios, which will finally characterize the project cash flow’s uncertainty.
V. PROJECT PRICING
A. Probabilistic project valuation
Once a N dimensional vector of S (statistically independent) scenarios for the key variables is obtained {ξs = [ξ(1),…, ξ(N)]T}s=1,…,S, a complete cash flow for a given project can be calculated for each scenario’s realization. The Internal Rate of Return (IRR) of the cash-flow for each scenario can be then calculated, representing the project’s attractiveness for the scenario considered. Observe that different IRR will be obtained for different cash flow scenarios, thus enabling to characterize a probability distribution.
Thus, the IRR will have a stochastic representation as a function of the considered uncertainties {ξs}
6 and for the long-term contract’s price Pc ($/MWh). The proposed financial model can then be used to find the price Pc
α such that the probability of the set of scenarios {IRR(Pc
α,ξs)} being greater than a minimum value (IRRMIN), stipulated by the analyst, be above a pre-determined significance level (α), e.g. 95%. The correspondent idea is mathematically shown in the following expression: Pc
α = Min (Pc){Pc | Prob[{IRR(Pcα,ξs) ≥ IRRMIN}] ≥ α} (1)
This is the same as finding an energy contract price Pc
α
($/MWh) providing a Value-at-Risk (α-VaR) equal to IRRMIN
6 As a notation we abandon the outer scenarios index.
6
for the IRR of the project. In other words, this answers the following question: “for which price should I offer my project in an energy contract auction so that it assures an IRR of x% with a confidence level of y% considering all the risks involved?”.
Fig. 7 exhibits an illustrative example of IRR probability distribution functions (density and accumulated) and the related α-VaR quantile.
I
Prob(IRR ≤ I)
VaR95%
(IRR)
5%
100%
IRR
Prob(IRR)
VaR95%
(IRR)
5%
95%
Fig. 7 – Project’s estimated VaRα(IRR)
This contract value would be, for the case of a risk-averse investor, the lower contract price by which he would be willing to build the project. It can be straightforwardly calculated iteratively (it is a one-dimensional search). Figure 8 presents the final outlook of the methodology:
P: Preço decontrato em(R$/MWh)
Modelodeavaliaçãofinanceira
TIRMIN TIR
Densidade de prob. (TIR)
95%
Modelosde simulaçãode regrasde mercado
e despachohidrotérmico
Distribuiçõesdeprobabilidade para os
demais fatoresderisco
Especificaçõesdoprojetoe dados do
financiamento
P: Preço decontrato em(R$/MWh)
Modelodeavaliaçãofinanceira
TIRMIN TIR
Densidade de prob. (TIR)
95%
TIRMIN TIR
Densidade de prob. (TIR)
95%
Modelosde simulaçãode regrasde mercado
e despachohidrotérmico
Distribuiçõesdeprobabilidade para os
demais fatoresderisco
Especificaçõesdoprojetoe dados do
financiamento
IRR
Densidade de Prob(IRR)
VaR95%
(IRR)
5%
95%
Models for simulationof the market rulesand hidro-thermal
dispatch
Financial Valuation
Model
ProbabilityDistributions for the
additional riskfactors
Project Specifications andfinancing data input
P: ContractPrice
(R$/MWh)
P: Preço decontrato em(R$/MWh)
Modelodeavaliaçãofinanceira
TIRMIN TIR
Densidade de prob. (TIR)
95%
Modelosde simulaçãode regrasde mercado
e despachohidrotérmico
Distribuiçõesdeprobabilidade para os
demais fatoresderisco
Especificaçõesdoprojetoe dados do
financiamento
P: Preço decontrato em(R$/MWh)
Modelodeavaliaçãofinanceira
TIRMIN TIR
Densidade de prob. (TIR)
95%
TIRMIN TIR
Densidade de prob. (TIR)
95%
Modelosde simulaçãode regrasde mercado
e despachohidrotérmico
Distribuiçõesdeprobabilidade para os
demais fatoresderisco
Especificaçõesdoprojetoe dados do
financiamento
IRR
Densidade de Prob(IRR)
VaR95%
(IRR)
5%
95%P: Preço decontrato em(R$/MWh)
Modelodeavaliaçãofinanceira
TIRMIN TIR
Densidade de prob. (TIR)
95%
Modelosde simulaçãode regrasde mercado
e despachohidrotérmico
Distribuiçõesdeprobabilidade para os
demais fatoresderisco
Especificaçõesdoprojetoe dados do
financiamento
P: Preço decontrato em(R$/MWh)
Modelodeavaliaçãofinanceira
TIRMIN TIR
Densidade de prob. (TIR)
95%
TIRMIN TIR
Densidade de prob. (TIR)
95%
Modelosde simulaçãode regrasde mercado
e despachohidrotérmico
Distribuiçõesdeprobabilidade para os
demais fatoresderisco
Especificaçõesdoprojetoe dados do
financiamento
IRR
Densidade de Prob(IRR)
VaR95%
(IRR)
5%
95%
IRR
Densidade de Prob(IRR)
VaR95%
(IRR)
5%
95%
Models for simulationof the market rulesand hydro-thermal
dispatch
Financial Valuation
Model
ProbabilityDistributions for the
additional riskfactors
Project Specifications andfinancing data input
P: ContractPrice
($/ MWh)
P: Preço decontrato em(R$/MWh)
Modelodeavaliaçãofinanceira
TIRMIN TIR
Densidade de prob. (TIR)
95%
Modelosde simulaçãode regrasde mercado
e despachohidrotérmico
Distribuiçõesdeprobabilidade para os
demais fatoresderisco
Especificaçõesdoprojetoe dados do
financiamento
P: Preço decontrato em(R$/MWh)
Modelodeavaliaçãofinanceira
TIRMIN TIR
Densidade de prob. (TIR)
95%
TIRMIN TIR
Densidade de prob. (TIR)
95%
Modelosde simulaçãode regrasde mercado
e despachohidrotérmico
Distribuiçõesdeprobabilidade para os
demais fatoresderisco
Especificaçõesdoprojetoe dados do
financiamento
IRR
Densidade de Prob(IRR)
VaR95%
(IRR)
5%
95%P: Preço decontrato em(R$/MWh)
Modelodeavaliaçãofinanceira
TIRMIN TIR
Densidade de prob. (TIR)
95%
Modelosde simulaçãode regrasde mercado
e despachohidrotérmico
Distribuiçõesdeprobabilidade para os
demais fatoresderisco
Especificaçõesdoprojetoe dados do
financiamento
P: Preço decontrato em(R$/MWh)
Modelodeavaliaçãofinanceira
TIRMIN TIR
Densidade de prob. (TIR)
95%
TIRMIN TIR
Densidade de prob. (TIR)
95%
Modelosde simulaçãode regrasde mercado
e despachohidrotérmico
Distribuiçõesdeprobabilidade para os
demais fatoresderisco
Especificaçõesdoprojetoe dados do
financiamento
TIRMIN TIR
Densidade de prob. (TIR)
95%
TIRMIN TIR
Densidade de prob. (TIR)
95%
Modelosde simulaçãode regrasde mercado
e despachohidrotérmico
Distribuiçõesdeprobabilidade para os
demais fatoresderisco
Especificaçõesdoprojetoe dados do
financiamento
TIRMIN TIR
Densidade de prob. (TIR)
95%
Modelosde simulaçãode regrasde mercado
e despachohidrotérmico
Distribuiçõesdeprobabilidade para os
demais fatoresderisco
Especificaçõesdoprojetoe dados do
financiamento
IRR
Densidade de Prob(IRR)
VaR95%
(IRR)
5%
95%
IRR
Densidade de Prob(IRR)
VaR95%
(IRR)
5%
95%
Models for simulationof the market rulesand hidro-thermal
dispatch
Financial Valuation
Model
ProbabilityDistributions for the
additional riskfactors
Project Specifications andfinancing data input
P: ContractPrice
(R$/MWh)
P: Preço decontrato em(R$/MWh)
Modelodeavaliaçãofinanceira
TIRMIN TIR
Densidade de prob. (TIR)
95%
Modelosde simulaçãode regrasde mercado
e despachohidrotérmico
Distribuiçõesdeprobabilidade para os
demais fatoresderisco
Especificaçõesdoprojetoe dados do
financiamento
P: Preço decontrato em(R$/MWh)
Modelodeavaliaçãofinanceira
TIRMIN TIR
Densidade de prob. (TIR)
95%
TIRMIN TIR
Densidade de prob. (TIR)
95%
Modelosde simulaçãode regrasde mercado
e despachohidrotérmico
Distribuiçõesdeprobabilidade para os
demais fatoresderisco
Especificaçõesdoprojetoe dados do
financiamento
TIRMIN TIR
Densidade de prob. (TIR)
95%
TIRMIN TIR
Densidade de prob. (TIR)
95%
Modelosde simulaçãode regrasde mercado
e despachohidrotérmico
Distribuiçõesdeprobabilidade para os
demais fatoresderisco
Especificaçõesdoprojetoe dados do
financiamento
TIRMIN TIR
Densidade de prob. (TIR)
95%
Modelosde simulaçãode regrasde mercado
e despachohidrotérmico
Distribuiçõesdeprobabilidade para os
demais fatoresderisco
Especificaçõesdoprojetoe dados do
financiamento
IRR
Densidade de Prob(IRR)
VaR95%
(IRR)
5%
95%
IRR
Densidade de Prob(IRR)
VaR95%
(IRR)
5%
95%P: Preço decontrato em(R$/MWh)
Modelodeavaliaçãofinanceira
TIRMIN TIR
Densidade de prob. (TIR)
95%
Modelosde simulaçãode regrasde mercado
e despachohidrotérmico
Distribuiçõesdeprobabilidade para os
demais fatoresderisco
Especificaçõesdoprojetoe dados do
financiamento
P: Preço decontrato em(R$/MWh)
Modelodeavaliaçãofinanceira
TIRMIN TIR
Densidade de prob. (TIR)
95%
TIRMIN TIR
Densidade de prob. (TIR)
95%
Modelosde simulaçãode regrasde mercado
e despachohidrotérmico
Distribuiçõesdeprobabilidade para os
demais fatoresderisco
Especificaçõesdoprojetoe dados do
financiamento
P: Preço decontrato em(R$/MWh)
Modelodeavaliaçãofinanceira
TIRMIN TIR
Densidade de prob. (TIR)
95%
TIRMIN TIR
Densidade de prob. (TIR)
95%
Modelosde simulaçãode regrasde mercado
e despachohidrotérmico
Distribuiçõesdeprobabilidade para os
demais fatoresderisco
Especificaçõesdoprojetoe dados do
financiamento
P: Preço decontrato em(R$/MWh)
Modelodeavaliaçãofinanceira
TIRMIN TIR
Densidade de prob. (TIR)
95%
TIRMIN TIR
Densidade de prob. (TIR)
95%
Modelosde simulaçãode regrasde mercado
e despachohidrotérmico
Distribuiçõesdeprobabilidade para os
demais fatoresderisco
Especificaçõesdoprojetoe dados do
financiamento
TIRMIN TIR
Densidade de prob. (TIR)
95%
TIRMIN TIR
Densidade de prob. (TIR)
95%
Modelosde simulaçãode regrasde mercado
e despachohidrotérmico
Distribuiçõesdeprobabilidade para os
demais fatoresderisco
Especificaçõesdoprojetoe dados do
financiamento
TIRMIN TIR
Densidade de prob. (TIR)
95%
Modelosde simulaçãode regrasde mercado
e despachohidrotérmico
Distribuiçõesdeprobabilidade para os
demais fatoresderisco
Especificaçõesdoprojetoe dados do
financiamento
IRR
Densidade de Prob(IRR)
VaR95%
(IRR)
5%
95%
IRR
Densidade de Prob(IRR)
VaR95%
(IRR)
5%
95%
Models for simulationof the market rulesand hydro-thermal
dispatch
Financial Valuation
Model
ProbabilityDistributions for the
additional riskfactors
Project Specifications andfinancing data input
P: ContractPrice
($/ MWh)
IRR Probab. Distribution
Fig. 8 – General outlook of the methodology
Another option of the proposed model is to calculate the resulting IRR when the contract price is a fixed parameter (Pc
project). In this case, the {IRR(Pcproject,ξs)} VaR or CVaR and
its complete distribution may be accessed so as to compose part of subsequent models for comparing technologies and selecting projects.
B. Using coherent risk measures
Once the Value-at-Risk risk metric is a probabilistic measure, it violates the sub-additivity property (or supper-additivity, in the case of a left tail version as shown Fig. 8 – see [1][2] for more information of sub-additivity need). Therefore, the VaR is considered to be a non-coherent risk measure. Thus, as mentioned in [1][2], the Conditioned Value-at-Risk (CVaR) can be used as a natural alternative for VaR. The CVaR is the average of the conditioned scenarios worse than the VaR threshold and contains all properties needed to provide a coherent risk measure (see [1], [3]). Furthermore, in [10], the linear convex formulation proposed by R.T. Rockafellar and S.P. Uryasev for the CVaR measure has provided a new paradigm for its use, with. Model (1) can be rewritten using this measure as: Pc
α-CVaR = Min (Pc){Pc | CVaRα[{IRR(Pcα,ξs)}] ≥ IRRMIN} (2)
As the CVaR provides a more risk aversive bound than
VaR, Pcα-CVaR will be always grater or equal than Pc
α, for the same IRRMIN requirement. But the selection of a risk measure in beyond the scope of this work and is a private choice of each investor. Thus, we will illustrate results using the CVaR as risk measure.
VI. PROJECT SELECTION
A. Comparing different projects
Once we have modeled the IRR probability distribution of each available project, investors can visualize the different returns and risks in a risk-return chart. This enables to visualizes choices and identify dominated projects. However, before doing that, it is needed to construct a pure risk index, in accordance with the selected risk measure, in order to separate expected return and risk components.
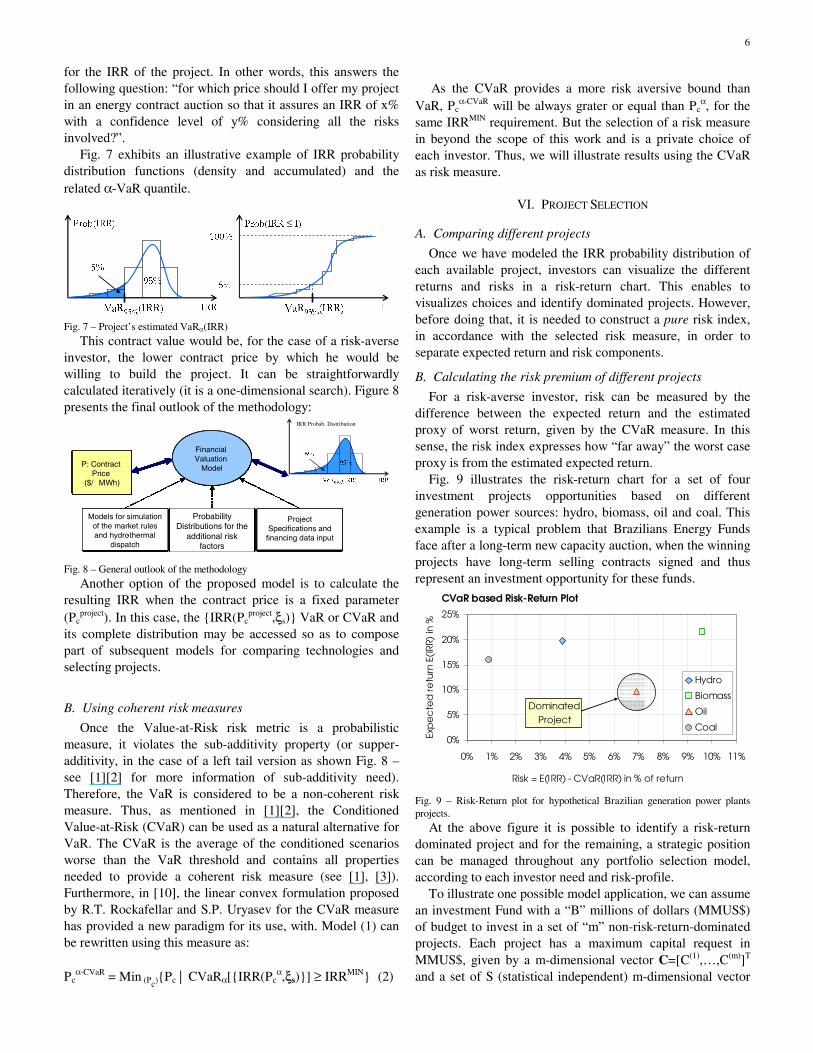
B. Calculating the risk premium of different projects
For a risk-averse investor, risk can be measured by the difference between the expected return and the estimated proxy of worst return, given by the CVaR measure. In this sense, the risk index expresses how “far away” the worst case proxy is from the estimated expected return.
Fig. 9 illustrates the risk-return chart for a set of four investment projects opportunities based on different generation power sources: hydro, biomass, oil and coal. This example is a typical problem that Brazilians Energy Funds face after a long-term new capacity auction, when the winning projects have long-term selling contracts signed and thus represent an investment opportunity for these funds. CVaR based Risk-Return Plot
0%
5%
10%
15%
20%
25%
0% 1% 2% 3% 4% 5% 6% 7% 8% 9% 10% 11%
Risk = E(IRR) - CVaR(IRR) in % of return
Exp
ec
ted
retu
rn E
(IR
R) in
%
Hydro
Biomass
Oil
Coal
DominatedProject
Fig. 9 – Risk-Return plot for hypothetical Brazilian generation power plants projects.
At the above figure it is possible to identify a risk-return dominated project and for the remaining, a strategic position can be managed throughout any portfolio selection model, according to each investor need and risk-profile.
To illustrate one possible model application, we can assume an investment Fund with a “B” millions of dollars (MMUS$) of budget to invest in a set of “m” non-risk-return-dominated projects. Each project has a maximum capital request in MMUS$, given by a m-dimensional vector C=[C(1),…,C(m)]T and a set of S (statistical independent) m-dimensional vector

7
of pre-calculated scenarios {IRRs=[IRRs(1),…,IRRs
(m)]T}, in which each scenario has a 1/S probability.
Assuming that the Fund risk area demands a minimal return of IRRMIN % for the α-CVaR of the obtained portfolio, one possible approach is to formulate a expected value maximization problem with a CVaR constraining the requested minimal return requirement as follows:
Max(x) S
-1⋅∑s⟨IRRs,x⟩ (3) s.t.:
⟨C,x⟩ ≤ B (3.1) βs < ⟨IRRs,x⟩ – λ ∀ s (3.2) βs ≤ 0 ∀ s (3.3)
λ + [S(1–α)]-1⋅∑sβs ≥ IRRMIN (3.4) x ∈ [0,1] (3.5) βs ∈ ℜ ∀ s (3.6) λ ∈ ℜ (3.7) In the above model, vector x represents the m-dimensional
portfolio budget allocation that provides the percentages of each C(j) available for invest capital, which this Fund is willing to buy. ⟨.,.⟩ represents the inner vector product ℜ is the real line set. Furthermore, constraints (3.2) to (3.4) provide the CVaRα({⟨IRRs,x⟩}) ≥ IRRMIN constraint for each possible portfolio, defined by the allocation vector x, in which equations (3.2) and (3.3) represent a two-segment piecewise linear function, which computes in βs the violation of each scenario whose return is lower than the λ threshold. As shown in [10] for a convex optimization problem, this threshold will reach, in the optimum solution, the α-Value-at-Risk and thus, the equation (3.4) will provide a bound for the conditioned expected VaR violations (which is the CVaR).
VII. CONCLUSIONS
The paper contributes with an analytical approach to carry out investment analysis under uncertainty, aiming at pricing risks involved into long-term investments in power projects. We illustrate the approach using as background the auctions of electricity long-term supply contracts (15 years) offered in some power markets, such as Brazil. Correct risk management provides investors security limits to devise bids during the auction processes as well as to support their choices among investment opportunities in different generation options.
VIII. REFERENCES [1] Acerbi, C., “Coherent measures of risk in everyday market practice”,
Quantitative Finance, Vol. 7, No. 4, 359–364, August 2007. [2] Acerbi, C. and Tasche, D., Expected shortfall: a natural coherent
alternative to value at risk. Econ. Notes, 2002b, 31(2), 379–388. [3] Artzner, Philippe, Freddy Delbaen, Jean-Marc Eber, David Heath,
“Coherent Measures of Risk”, Mathematical Finance 9 no. 3, 203-228, 1999
[4] H. Rudnick, L.A. Barroso, C. Skerk, and A. Blanco. “South American Reform Lessons –Twenty Years of Restructuring and Reform in Argentina, Brazil and Chile”. IEEE Power and Energy Magazine, Vol. 3, (4) July/August 2005, pp. 49-59.
[5] L.A.Barroso, H. Rudnick, R.Moreno & B. Bezerra, “Ensuring Resource Adequacy with Auctions of Options and Forward Contracts” Proceedings of IEEE PES General Meeting 2007, Tampa, USA.
[6] L.A.Barroso, A.Street, S.Granville, M.Pereira, J.Rosenblatt, J. Cahuano and L.M. Thomé , Market Models & Monitoring: Assessing new techniques for long-term PPA auctions to support long-run policy decisions in Brazil – 2005 IEEE General Meeting San Francisco, USA, 2005, Pages 1569-1571
[7] V. Krishna, Auction Theory, Academic Press, San Diego, California (2002).
[8] P. Kemplerer, Auction Theory: A Guide to the Literature, Journal of Economic Surveys, 13(3), 227-286 (1999).
[9] M.V. Pereira, , N. Campodónico, and R. Kelman, “Long-term hydro scheduling based on stochastic models”, Proceedings of EPSOM Conference, Zurich, 1998 – Available at http://www.psr-inc.com
[10] R.T. Rockafellar and S.P. Uryasev, “Optimization of conditional value-at-risk”, The Journal of Risk, 2 (2000), 21-41.
IX. BIOGRAPHIES
Luiz Augusto Barroso (S’00, M’06, SM’07) has a BSc in Mathematics and received in 2006 the PhD degree in operations research from COPPE/UFRJ, Brazil. He is a technical director at PSR, where he has been providing consulting services and researching on power systems economics, planning and operation, focusing on hydrothermal systems in Brazil and abroad. He has been a speaker on these subjects in Latin America, Europe and US/Canada.
Alexandre Street has MSc in Electrical Engineering and is currently working towards a PhD in Optimization, both from PUC-Rio. He joined PSR in 2003 as a researcher and has been involved in the research of the following fields: decision support tools for strategic bidding under uncertainty in the Brazilian energy contract auctions, medium and long term portfolio optimization.
Sergio Granville has a BSc and a MSc degrees in Applied Mathematics and a PhD degree in OR. Dr. Granville has coordinated the software development and optimization studies for portfolios involving physical and financial assets, strategic bidding in energy auctions and pricing of options contracts. Before joining PSR, he was a project manager at Cepel, where he coordinated research in the areas of optimal power flow, VAR planning and short-term hydrothermal dispatch.
Bernardo Bezerra has a BSc in Electrical and Industrial Engineering and an MSc degree in Optimization, both from PUC-Rio. He joined PSR in 2004 and has been working in several projects related stochastic optimization models applied to contract pricing (including energy call options), synthetic streamflow generation and integrated electricity-gas operations planning.

8
Copyright © 2022 FDOKUMEN