BIBLIOGRAPHIC DATA SHEET
116
1. CONTROL NUMBER 2. SUBJECT CLASSIFICL4TION (695) BIBLIOGRAPHIC DATA SHEET PN-AAJ-819 AE30-0000-G100 3. TITLE AND SUBTITLE (240) Agriculture and rural development; 1980 functional review 4. PERSONAL AUTHORS (100) Holdcroft, Lane; Doggett, Clinton; Krause, Stanley; McMillan, Wendell 5. CORPORATE AUTHORS (101) AID/AFR/ DR/ARD 6. DOCUMENT DATh (110) 17. NUMBER OF PAGES (120) 8. ARC NUMBER (170) 1980 114p.I AFR338.I.H726 9. REFERENCE ORGANIZATION (130) AFR/DR/ARD 10. SUPPLEMENTARY NOTES (500) 11. ABSTRACT (950) 12. DESCRIPTORS (920) Agricultural aspects Productiorn Rural Africa developme3nt AfricaTYPE Agricultural development Food 13. PROJECT NUMBER (150) 14. CONTRACT NO.(] 4) AFR/ DR/ARD 16. TYPE OF DOCUMEN T (I6C) 15. CONTRACT (140) AID 590-7 (10-79)
-
Upload
khangminh22 -
Category
Documents
-
view
2 -
download
0
Transcript of BIBLIOGRAPHIC DATA SHEET

1. CONTROL NUMBER 2. SUBJECT CLASSIFICL4TION (695)BIBLIOGRAPHIC DATA SHEET PN-AAJ-819 AE30-0000-G100
3. TITLE AND SUBTITLE (240)
Agriculture and rural development; 1980 functional review
4. PERSONAL AUTHORS (100)
Holdcroft, Lane; Doggett, Clinton; Krause, Stanley; McMillan, Wendell
5. CORPORATE AUTHORS (101)
AID/AFR/ DR/ARD
6. DOCUMENT DATh (110) 17. NUMBER OF PAGES (120) 8. ARC NUMBER (170)
1980 114p.I AFR338.I.H726
9. REFERENCE ORGANIZATION (130)
AFR/DR/ARD 10. SUPPLEMENTARY NOTES (500)
11. ABSTRACT (950)
12. DESCRIPTORS (920)
Agricultural aspects Productiorn RuralAfricadevelopme3nt
AfricaTYPE
Agricultural development Food
13. PROJECT NUMBER (150)
14. CONTRACT NO.(] 4)
AFR/ DR/ARD
16. TYPE OF DOCUMEN T (I6C)
15. CONTRACT(140)
AID 590-7 (10-79)
AGRICULTURE AND RURAL DEVELOPMENT
1980 FUNCTIONAL REVIEW
Africa Bureau
Office of Development Resources
Agriculture and Rural Development Division
October 1980

PREFACE
This third annual ARD Functional Review was prepared by the staff of
the Agriculture and Rural Development Division of the Office of Development
Resources under the general direction of Lane Holdcroft. Major contribu
tions were made by Clinton Doggett, Stanley Krause and Wendell McMillan.
ARD would also like to thank Robert Hudec of FM and Kris Wolter of DS/DIU
for computer retrieval assistance.

TABLE OF CONTENTS
I. Introduction 1
I1. Conceptual Frame~ork and Procedures 1
IlI. Trends in Sub-Saharan Agriculture 3
A. The Food Production Problem 3
B. Impacts on Income and Nutrition 8
IV. Analysis of the Africa Bureau's Investment Portfolio 12
A. Functional Profile 13
B. Food Production and Income Generation Profile 24
V. Implications for Bureau Strategy 28
A. Food Production 31
B. Consumption 34
C. Transportation and Communications 34
D. General Development 34
E. Food Production and Income Generation 35
VI. Recommended Course of Action 36
Appendix 1. Methodology
Appendix 2. Projects by Country and Regional Program
P~pendix 3. Expenditure Proportions by Country and Regional Program, FY 1977-81

I. Introduction
The annual ARD Functional Review is designed to provide ar overview,
in quantitative terms, of -he Africa Bureau's agricultural projects in the
rural sector of Africa. The year's analysis represents a departure from
the previous t'wo years in that, rather than limiting itself to agricultural
subject matter areas, it focuses on investment directed at achieving two
of the major goals of AID's assistance program as articulated hy the Africa
Bureau and most fieid missions: Increasing food production and rural icomes.
Given the importance of augmenting food supplies in the face of increasing
demand and declining production, this year's analysis has the added objec
tive of establishing a reference point from which Bureau assistance
strategies for the rural sector may evolve.
More specifically, the purposes of the 1980 Functional Review are:
I.To develop a profile of all Africa Bureau projects to determine the
level of investment directed at increasing food production and rural income
in Africa, by year and by country, for the period FY 1977-81;
2. To identify investment trends by project category, i.e. agriculture
(including ron(oarch, pruducIon, mnrkotI Inq, otc.), health, educaItion, nutri
tion, housing, enterprise promotion and manpower development, over the period;
3. To identify, within the category of agricultural development projects,
trends of investment that impact directly and indirectly on food production
and rural income over the period; and
4. To develop a refe-ence point from which a Bureau assistance strategies
for investment in the rural sector may evolve.
II.Conceptual Framework and Procedures
The conceptual framework guiding this analysis of Investment strategies
can bo summarized as follows.

2.
The bulk of AID's assistance to Africa't dovoloping nations is directed
at encouraging the rural development process. Rural development is defined
as the process by which the poor majority of ru,-al populations is assisted
in solving its problems of livelihood and hence improving its standard of
living on a self-sustaining basis. This process of rural development recog
nizes the creation of disequilibrium through changes in institutions, tech
nology and people, and it includes three major aspects--raising levels ot
output and living, increasing participation of the rural poor, and making
the process self-sustaining.
In looking at AID's assistance programs and projects in Africa, three
broad categories of rural development programs can be identified: produc+ion
programs (including research and distribution), and consumptlon programs of
two types, namely social services and social welfare. The development
model most widely accepted at present dictates that investment, both public and
private, in production programs (as defined above) provides the basis for
increased tax collection by host country governments, which In turn finances
the bulk of consumption programs, both of the sc.clal services and social
welfare nature. The increased investment in social services by host countries,
with external donor assistance, of course feeds back into increasing produc
tion. Social services programs (i.e. education, health, family planning, etc.)
over the long term are considered essential to sustaining improvement in
levels of living. There is ample evidence to SLipport the thesis that Invest
ment in social services as compared to social welfare proC;-ams (i.e. grant
food assistance) ismuch more efficient in terms; of sustaining improved levels
of living.
The methodology used in the Functional Review, as detailed in Appendix 1,
includes (a) definition of the universe, (b) data sources, (c) categorization

3.
of projects and (d) illustrative project titles for each category. Briefly,
the main steps included compilation of project expenditure data contained
inprintouts from Financial Management and in the Bureau's 1982 Annual Budget
Submission; categorization of the projects by functional areas; and calcu
lation of investment levels and trends by categories over the five-year
period FY 1977-81.
Following an examination of current trends in Sub-Saharan agriculture,
particularly with regard to problems of food production and rural incomes,
the findings from the analysis of the Bureau's investment profile are pre
sented. The concluding sections discuss implications of the analysis for
future Bureau assistance strategy, and recommended courses of action.
Ill. Trends in Sub-Saharan Agriculture
A. The Food Production Problem I
Sub-Saharan Africa is the only region in the world where per capita
food production declined over the past two decades. A few countries im
proved on the recird of the early sixties; most, however, showed moderate
to severe declines (Table 1). In 1978, per capita food production in
Angola, Benin, Ethiopia, Ghana, Nigeria, Zimbabwe, Senegal, Sierra Leone,
Uganda and Upper Volta was less than 90 percent of the 1961-65 average.
Declining per capita food production exacts a high price in both
human and economic terms. The human price is inadequate nutrition, the
most basic measure of which is caloric intake. Inmost sub-Saharan
countries, per capita calorie intake falls below minimal nutritional stan
dards (Table 2). Even if the total food available were distributed equally
I/This section represents a condensation of a portion of the "Overview" chapter of Food Problems and Prospects in Sub-Saharan Africa, USDA, September 1980, pp. 1-11.

4.
Index of Food Production Per Capita: Sub-Saharan Africa
120
1 1 5 - - 6%
,,0 L
110 - / Asia
/ 10 x/ I, / .\t\ I
105 / ~ *j'X \ /
°.. \ /
100 """°° ° S.. / S~
/95" Latin America /
95
90 Sub-Saharan Africa 90
85
80
75 IJ
1961- 65 66 67 68 69 70 71 72 73 74 75 76 77 78 65 Avg.
Source: U.S. Department of Agriculture, Food Problems and Prospects in Sub-Saharan Africa: The Decade of the 1980s, p. 2.

Table 1--ldices of per capita food production. Sub-Saharan Africa, 1970-79
Region and ,country
1970 1971 : 1972 1973 1974 : 1975 1976 1977 : 1978 : 19791/
1961-65-100
Sahel: Hali Niger Senegal Upper Volta
* 84 104 64 76
86 109 87 70
65 105 56 66
67 66 68 58
86 91 90 72
88 76
1flO 76
97 103 87 74
82 92 59 67
105 106 88 69-
75 8568 67
West Africa; Benin Co"roon ;hana Cuinaa Ivory Coast Liberia Nigeria Sierra Leone Togo
:
92 97 99 107 107 81 95 93 108
89 102 93 110 113 84 93 98 103
88 97 31 109 105 84 95 96 102
93 93 87 108 109 91 87 95 96
89 97 8 98 120 100 90 92 98
24 96 75 94 142 94 89 96 96
85 97 74
101 129 96 88 92 97
58 96 71 93 125 98 86 95 9J
89 97 68
102 128 96 84 07 97
8297 -70
101 -
IJ2 -9784" 82 "
96
t:entral Africa: Angola Zaire *
104 119
95 109
88 106
5 112
92 107
72 105
65 106
58 103
53 97
51. 97 -
East Africa: Burundhi Ethiopia Kenya Rwanda Sedan Tanzdia Uganda
*
: *
1t7 99 96 123 110 102 95
119 99 94 122 115 104 92
119 91 99 115 107 100 87
117 87 97 118 101 101 82
98 84 96 112 114 114
79
113 67 102 121 125 117 81
110 63 113 119 122 99 77
109 58
117 121 123 98 73
108 52-
'Fit 119 129 100
76-
109" 54
110119123105
68
Southern Africa; Madagascar Malawi Zambia Zimbabwe
.
: :
108 96 95 79
107 108 117 93
107 118 132 103
98 109 110 78
ii2 110 135 102
105 97 139 92
105 101 153 88
107 95 142 86
i0e 96
128 83
99" 90" 10469
Source: U.S. Dept. Agri, Ecoma., Stat., Coop. Service, Indices of Agricultural Production. 1976-7%. I/ Preliminary
%-n
6.
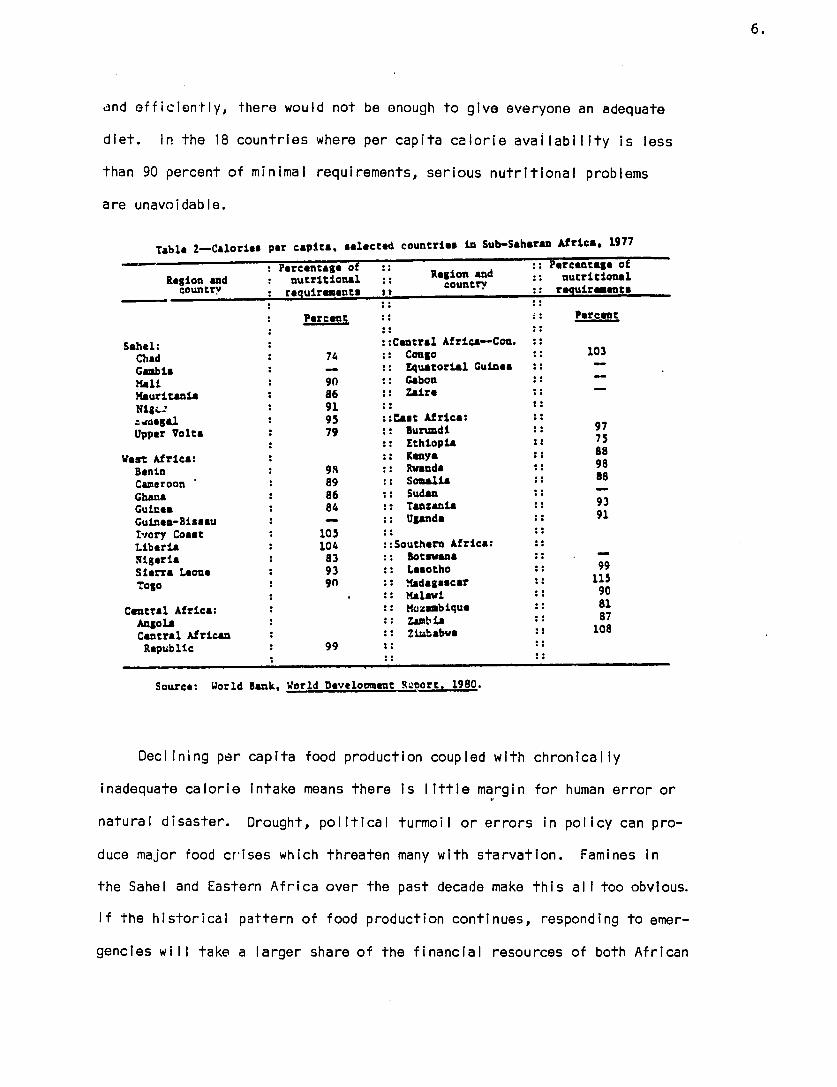
and efficiently, there would not be enough to give everyone an adequate
diet. In the 18 countries where per capita calorie availability is less
than 90 percent of minimal requirements, serious nutritional problems
are unavoidable.
selected countries in Sub-Saharan Africa, 1977 Table 2-Calories per capita,
:: Percentage ofPercentaea of :: Region and urioa: nutritional :: Reioncounryand :: nutritional
countrY requirements I, o:rrequirements
PercentPercent ::
Sahel: ::Central Africa-Con. 103 Chad . 74 :: Congo :: 103
Gambia - :: Equatorial Guinea : : : 90 GabonMali
Mauritania . 86 :: Zaire Nig: . 91 :
-Wega.l : 95 ::Cast Africa: 97 Upper Volta . 79 Burundi
Z 75Ethiopia :: Kenya :: 88
West Africa: : 9R :: Rvanda :: 98
Benin : 89 :: Somalia :8: 8
Caeroon SudanGhana : 86 ::
93 . 84 :: TanzaniaGuinea 91- :: Uganda :Guinea-Bissau
Ivory Coast : 105
Liberia . 104 ::Southern Africa: Nigeria 83 :: Botswana ::
93 :: Lesotho :: 99Sierra Leone 9n :: adagscar • 115
Togo .
Malawi :: 90
Central Africa: . :: Mozambique : 81 Zambia :: 87
Angola :: 108: :: ZiababveCentral African
Republic . 99
Source: World Bank, World Development .Lvort, 1980.
Declining per capita food production coupled with chronically
inadequate calorie intake means there is little margin for human error or
natural disaster. Drought, political turmoil or errors in policy can pro
duce major food crises which threaten many with starvation. Famines in
the Sahel and Eastern Africa over the past decade make this all too obvious.
If the historical pattern of food production continues, responding to emer
gencies will take a larger share of the financial resources of both African

7.
countries and International food aid programs.
The major economic price of inadequate food production is a rising
import bill. Other effects are felt throughout African economies. Govern
ments in Sub-Saharan Africa have responed to inadequate domestic food pro
duction by increasing imports. During the sixties, grain imports Imposed
little financial hardship. While the volume of imports doubled, the cost
rose by only 50 percent. Stable, low grain prices combined with concessional
sales made imports a cheap and relatively secure way of meeting growing urban
demand. In the seventies, however, the situation changed dramatically. The
cost of sub-Saharan Africa's cereal imports In 1978 was double that of 1970.
The food situation just described would be serious in almost any io-er
national economic environment. It is particularly ominous now, however,
since many African countries have been experiencing severe balance of payments
problems as a result of recent international economic changes. African
countries are usual ly exporters of primary commodities. Even the largest of
the foreign exchange earners depend on a few unprocessed products. With the
exception of oil, these commodities' prices have not kept pace with the
increased cost of key imports. Short-lived booms in coffee, sugar and copper
temporarily bousted some countries' earnings but have not offset the rising
cc.st of imports. Hence, the balance of trade for sub-Saharan Africa (exclud
ing Nigeria) moved from a small surplus in 1970 to a massive defecit in 1976.
Financing food imports is more difficult not only because real grain
prices are higher, but also because other imports such as petroleum and indus
trial goods are much more costly. In addition, sub-Saharan countries may
have to compete for food supplies in tighter, less stable global markets.
Global cereal markets, once characterized by assured supplies for commercial
and concessional sales, are in a state of transition. Several forces are at

8.
work.
First, commercial demand for grain Imports Is increasing among middle
income LDCs, as well as in Eastern Europe and the Soviet Union. Second,
some experts now 1hink U.S. agriculture is in a state of "rough equilibrium",
without the chronic surplus capacity which characterized the last several
decades. Third, financial conditions in the major industrial countries
limit the growth of aid. Finially, another shift in global markets is pos
sible if major grain producing countries find it politically and economically
attractive to generate a portion of their energy requirements from foodstuffs.
Virtually all attempts to project Africa's import requirements conclude
that unless there are major changes in domestic production trends, the situ
ation will become much worse during the 1980s. Ifdomestic production trends
conrinue, Africa's demand for food imports will be two to three times Its
present level by 1990, even without significant income growth. However, for
some African countries, even maintaining per capita income at 1975 levels
may be an optimistic scenario. Based On 1974-79 trends, real per capita
income is projected to decline in both the Sahel and southern Africa, while
West Africa (primarily Nigeria) would experience strong real income growth.
Under these conditions, the import demand for food in sub.-Saharan Africa
would rise to 21.1 million tons (wheat equivalent). However, West Africa
would account for 86 percent of the import demand. Because growth is concen
trated in West Africa, even this dramatic increase in paying demand does
little to reduce the calorie gap, which now amounts to 10.1 million tons.
Without major efforts to supploment comrmorclal purchases, diets would remain
inadequate in the Sahel, Central and East Africa.
B. Impacts on Incomes and Nutrition
Sub-Saharan Africa is in economic distress and this distress is generally

9.
most severe in rural areas. Viewed another way, the economic distress
tends to be rooted in poor performance in food and other agricultural pro
duction, since most of the rural people derive their entire or primary
income from agriculture. The poor performance in food production trans
lates into lack of adequate food for many people, including farmers them
selves.
While the purposes of this Functional Review do not include inter
sectoral macro-economic analysis, it is noted that the recent World Devel
opment Raport indicates growth of per capita GNP of only 0.2 percent from
1970 to 1980 for low-income oil-importing countries of sub-Saheran Africa.1/
The comparable figuro for middlo-incomo oil-Importers was 0.9 percent.
This poor record of income growth is projected to continue in the
1980s, as is indicated in Table 3. The "low" and "high" case represent
Table 3. Growth of Gross National Product Per Person in Sub-Saharan Africa, 1970-1990.
Average Annual Percentage Growth Populatior Low Case High Case
1980 1970 1980 1985* 1980 1985 Country Group (millions) -80 -85 -90 -85 -90 Low-Income Oil Importers 141 0.2 -0.3 0.1 1.10.1
Middle-Income Dil Importers 125 0.9 1.3 1.3 1.6 1.4
Source: World Bank, World Development Report, August 1980. Table 2.8, p. 11.
alternative projections of the severity of impact of higher energy costs,
petterns of policy response, and degree of success of those responses. The
"low" case may result in a reduction of per capita GNP by 0.3 percent annu
ally from 1980-85 in the low-income oil-importing countries, rising to a
growth rate of only 1.0 percent annually from 1985-90. The "high" case
requires a series of policy adjustments, and fair success from them. The
I/ World Bank, World Development Report, August 1980, Table 2.8.

10.
pic-ure is moderately brighter for the middle-income countries. Unfortun
ately, the World Bank presentaion does not allow identification of the
countries in each group, except that Angola, Congo, Gabon, Nigeria and
Zaire are identified as oil-exporters.
USDA employed a series of projections in its recent analysis that
were largely still less favorable, particularly for the Sahel and south
ern Africa./
The past and projected poor performance of agricultural production
is central to the aggregate economic picture. Most of the population is
rural, and indeed depend directly on agriculture for their principal
iicome. Agricultural output per worker is low and displays slow growth.
In these circumstances nutrition levels are low, purshasing power for
food and other goods is low, and the capacity to support public services
for health, education etc. is low or non-existent. The following para
graphs provide some supporting data for these statements.
The World Bank report provides data on the labor force in agriculture.
Eighty percent or more were in agriculture in 16 of the 25 low-income oil
importing countries listed in sub-Saharan Africa in 1978, and sixty percent
or morn in five of the eight middle-income countries.
The proportion of gross domestic product derived from agriculture
is substantial but much lower than the labor force in agriculture, reflecting
low incomes of farmers and incompleteness of national accounts data. World
Bank reports that 40 percent or more of GDP was derived from agriculture in
13 of the 25 low-income oil-importing countries, and at least 30 percent in
12 of the 20 remaining low and middle-income countries tabulated.
These data imply a very large discrepancy between income from agriculture
1/ USDA, op. cit., Appendix Table 6, p. 397.

and that from other sources. Three primary factors are involved: (1) in
comes of agricultural workers are low, (2) national accounts data for
subsistenc food production and associated non-agricultural output for
auto-consumption are notoriously incomplete, and (3) agricultural workers
nearly always produce other products (monetary or implied forms of income)
than iood. Nevertheless, the extent of the implied difference of
income is worth noting. The data suggest agricultural incomes less than
20 percent those inother sectors in 18 of 33 countries, and at least
40 percent in only five! Some of the sharpest contrasts are in the Sahel
and in Lesotho. The relatively best agricultural incomes were in Benin,
Ghana, Nigeria, Angola and Mozambique.
The Dreceeding omitted two significant rural items: fish, which also
is food, and fuelwood. Wood is a product of rural people and land
resources comparable to those used for food production. Wood gathering
is a task that occupies a substantial and growing amount of time of som
rural people, and wood is becoming very expensive for many who must buy
it. Inthese and other ways, wood production, gathering, transportation,
and commerce is becoming increasingly significant. Similar statements
can be made for non-commercial fishing.
"In some parts of the world, undernutrition is primarily a distribu
tion problem. This is, in general, not true for Africa; inadequate nutri
tion is both a production and distribution problem. Aggregate supplies
are inadequate--even assuming totally egalitarian distribution. Further
more, much of the inequality in income which exists reflects urban-rural
differences." I/ The USDA report goes on to review the state of knowledge
of nutrition levels, food consumption patterns, and results of inadequate
nutrition in Africa. Estimates of FAO and World Bank of the aggregate
I/ USDA, op. cit., pp. 49-50.
9

12.
position!, are cited. Aqgreqato food suplio!i wore about 10 percent less than I/
minimal requirements in 1975 (World Bank) and in 1976 (FAO).- The number
of underfed people has been growing. Various analysts estimate a country
requires an aggregate of 10 percent more calories than minimum nutritional
requirements of the population, in order to expect to meet to meet inevitable
distribution requirements to satisfy higher-income people. Thus, _n overall
availability of 90 percent of overall minimum needs, mathematically, probably
represents an overall deficiency of 20 percent from the 110 percent needed on
a practical basis.
These data provide a general view of the basic relationships between
agricultural productivity, trends in food production, the primary role of agri
culture, income levels, and general levels of nutrition. The critical need to
improve performance in agricultural production is evident.
IV.Analysis of the Africa Bureau's Investment Portfolio, FY 1977-81
Examination of the Bureau's investment (project) portfolio included three
major aspects: (1)An analysis of the "profile" over time of the Africa Bureau's
project portfolio based on major functional categories; (2) An analysis over
time of the degree to which projects in the portfolio addressed the problems
of augmenting food production; (3) An analysis over time of the degree to which
projects in the portfolio addressed the problems of enhancing income-generating
activities. The three separate analyses are presented individually below.
1/ USDA, op. cit., p. 49.

13.
A. Functional Profile
Table 4 lays out the Bureau's portfolio profile in terms of expendi
tures, both in absolute amounts and as a percentage of each year's total,
for each of the four major functional areas of Production, Consumption,
Transportation and Communications, and General Development. (Note: All
dollar figures presented in this analysis are in O00s). A glance at these
Table 4. Expenditure by Functional Category (in $O00s)
FY 77 FY 78 FY 79 FY 80 FY 81
Production 50,238 84,838 95,536 193,189 287,216 294 Projects 43.2% 54.3% 53.5% 59.7% 60.5%
Consumption 23,440 30,304 31,835 69,783 87,438 147 Projects 20.2% 19.4% 17.8% 21.6% 18.4%
Transptn & Comm's 23,553 17,546 27,213 17,292 26,388 49 Projects 20.3% 11.2% 15.2% 5.3% 5.6%
General Development 18,949 23,629 23,884 43,112 73,839 80 Projects 16.3% 15.1% 13.4% 13.3% 15.5%
TOTAL $116,180 $156,317 $178,468 $323,376 $474,881 570 Projects (100%) (100%) (100%) (100%) (100%)
figures reveals that (1) Production-oriented projects have steadily increased
as a percentage of total expenditure for each year; Consumption-oriented
projects have remained at around the level of 20 percent, with slight vari
ation in either direction for each year; (3) Transportation and Communica
cations has declined significantly as a proportion of annual expenditure;
and (4) General Development has consistently remained at about 15 percent of
each year's expenditure. A more detailed breakdown of expenditure propor
tions by functional category and sub-category is presented in Table 5.
1. Production
Within this functional area are the categories Production-Food (PF),

Table 5.
Africa Bureau Portfolio Trend Analysis: Breakdown of Expenditure by Functional Category (in $000s)
I. Production-Food
General Agriculture 68 Projects
Physical Inputs 10 Projects
Crops 22 Projects
Crop Storage & Protection 12 Projects
Fish 8 Projects
Livestock/Range Management 26 Projects
Agricultural Marketing 3 Projects
Institutions/Manpower Development II Projects
Agricultural Education/Training 14 Projects
Agricultural Research/Extension 26 Projects
Agricultural Credit 7 Projects
FY 77
10,190 8.8%
9,827 8.5%
6,778 5.8%
1,188 1.0%
69 0.1%
10,044 8.6%
277 0.2%
990 0.9%
276 0.2%
1,342 1.2%
1,047 0.9%
FY 78
13,103 8.A%
28,513 18.2%
IC,545 6.7%
1,634 1.0%
51
11,461 7.3%
116 0.1%
2,199 1.4%
2,458 1.6%
2,410 1.5%
2,697 1.7%
FY 79
30,690 17.2%
6,742 3.8%
11,304 6.3%
2,818 1.6%
60 -
15,398 8.6%
87 -
2,647 1.5%
5,397 3.0%
2,758 1.5%
688 0.4%
FY 80 FY 81
47,587 91,601 14.7% 19.3%
22,649 16,425 7.0% 3.5%
10,913 11,242 3.4% 2.4%
3,652 9,934 1.1% 2.1%
370 2,125 0.1% 0.4%
15,208 17,044 4.7% 3.6%
- 985 - 0.2%
5,428 9,439 1.7% 2.0%
14,210 17,088 4.4% 3.6%
23,458 30,742 7.3% 6.5%
800 1,050 0.2% 0.2%

Table 5 (Cont'd)
Agricultural Planning II Projects
Subtotal 218 Projects
II. Production-Nonfood
Human Resources 5 Projects
Industry/Enterprise Promotion II Projects
Credit 2 Projects
Subtotal l8 Projects
Ill. Production-Mixed
Natural Resources & Energy 42 Projects
Commodity Import 2 Projects
Credit 4 Projects
Miscellaneous 10 Projects
FY 77
774 0.7%
(42,802) (36.8%)
-
2,377 2.0%
3,046 2.6%
(5,423) (4.7%)
1,871 1.6%
--
142 0.1%
-
FY 78
1,179 0.8%
(76,366) (48.9%)
-
2,507 1.6%
1,267 0.8%
(3,774) (2.4%)
4,215 2.7%
--
212 0.1%
271 0.2%
FY 79
1,427 0.8%
(80,016) (44.8%)
40 -
1,885 !.1%
2,560 1.4%
(4,485) (2.5%)
6,720 3.8%
--
195 0.1%
4,120 2.3%
FY 80 FY 81
2,329 5,174 0.7% 1.1%
(146,604) (212,849) (45.3%) (44.8%)
1,965 4,000 0.6% 0.8%
4,945 5,173 1.5% 1.1%
100 200 - -
(7,010) (9,373) (2.2%) (2.0%)
12,888 27,844 4.0% 5.9%
19,600 30,000 6.1% 6.3%
980 1,526 0.3% 0.3%
6,107 5,624 1.9% 1.2%

Table 5 (Cont'd)
Sub-Total 58 Projects
IV. Consumption-Services
General Education 32 Projects
Health & Population 79 Projects
Potable Water II Projects
Sub-Total 122 Projects
V. Consumption-Welfare
Disaster/Refugee Assistance 13 Projects
Shelter 9 Projects
Food Distribution 3 Projects
Sub-Total 25 Projects
VI. Transportation & Communications
Sector & Miscellaneous 6 Projects
FY 77
(2,013) (1.7%)
5,708 4.9%
;5,840 13.6%
206 0.2%
(21,754) (18.7%)
1,060 0.9%
55 -
571 0.5%
(1,686) (1.5%)
1,447 1.2%
FY 78
(4,698) (3.0%)
12,091 7.7%
15,521 9.9%
576 0.4%
(28,188) (18.0%)
836 0.5%
343 0.2%
937 0.6%
(2.116) (1.4%)
1,626 1.0%
FY 79
(11,035) (6.2%)
!O,591 5.9%
18,458 10.3%
504 0.3%
(29,553) (16.6%)
956 0.5%
282 0.2%
1,044 0.6%
(2,282) (1.3%)
84 -
FY 80 FY 81
(39,575) (64,994) (12.2%) (13.7%)
16,523 11,391 5.!% 2.4%
27,853 51,539 8.6% 10.9%
6,462 12,779 2.0% 2.7%
(50,838) (75,709) (15.7%) (15.9%)
16,893 10,245 5.2% 2.2%
2,023 1,484 0.6% 0.3%
29 -
(18,945) (11,729) (5.9%) (2.5%)
3,726 1,050 1.2% 0.2%

Table 5 (Cont'd) FY 77 FY 78 FY 79 FY 80 FY 81
Roads 34 Projects
-,806 11.9%
11,138 7.1%
17,421 9.8%
13,566 4.2%
25,338 5.3%
Railroads i Project
--
--
4,717 2.6%
--
--
Telecommunications 4 Projects
3,363 2.9%
2,960 1.9%
1,624 0.9%
--
--
Airports 673 - 415 - -2 Projects 0.6% - 0.2% - -
Bridge & Port Construction 2 Projects
4,264 3.7%
1,822 1.2%
2,952 1.7%
--
--
Sub-Total 43 Projects
(23,553) (20.3%)
(17,546) (11.2%)
(27,213) (15.2%)
(17,292) (5.3%)
(26,388) (5.6%)
VII. General Development
Miscellaneous 50 Projects
14,925 12.8%
18,349 11.7%
16,816
9.4% 28,675
8.9% 49,916
10.5% Research & Training 6 Projects
1,834 1.6%
639 0.4%
356 0.2%
879 0.3%
1,414 0.3%
Manpower Development 17 Projects
1,139 1.0%
3,313 2.1%
6,066 3.4%
13,438 4.2%
22,359 4.7%
Communi+y Development 3 Projects -
5 228 0.1%
425 0.2%
120 -
-
Public Administration 4 Projects
1,046 0.9%
1,100 0.7%
221 0.1%
- 150
Sub-Total 80 Projects
(18,949) (16.3%)
(23,629) (15.1%)
(23,884) (13.4%)
(43,112) (13.3%)
(73,839) (15.5%)
GRAND TOTAL: 570 Projects $116,180 $156,317 $178,468 $323,376 $474,831 (100%) (100%) (100%) (100%) (100%)

18.
lroduction-Nonfood (PN) and Production-Mixed (PM). Following an analysis
of these three categories, immediately following, a breakdown for the PF
category, which is of special interest to the ARD Functional Review, will
be provided.
Table 6 summarizes the portfolio trends with respect to the three
major categories within the functional area of production: PF, PN and PM.
Table 6. Breakdown of Production (in $O00s)
FY 77 FY 78 FY 79 FY 80 FY 81
Production-Food 42,802 76,366 80,016 146,604 212,849
Production-Nonfood 5,423 3,774 4,485 7,010 9,373
Production-Mixed 2,013 4,698 11,035 39,575 64,994
All Others 65,942 71,79 82932 130187 187,665
TOTAL $116,180 $156,317 $178,468 $323,376 $474,881
From the data it is apparent that (1) PF has increased as a percentage of
the total yearly expenditure, from 36.8 percent in FY 77 to 44.8 percent in
FY 81, although down from a high of 48.9 percent in FY 78; (2) PN has
declined, from 4.7 percent in FY 77 to 2.0 percent in FY 81; and (3) PM has
incrnsod., from 1.7 porcnt In lY 77 lo 1").7 percent in FY 81. (Note: The
large jump in PM for fiscal years 80 and 81 Is largely accounted for by
two commodity import programs in Sudan Totalling $19,975 and $30,000 respec
lively. Ommitting these two items from the analysis altogether, the PM
proportions would have been 6.6 percent in FY 80 and 7.9 percent in FY 81.
These figures would still represent a significant growth rate for this
category, however, reflecting the increases in the sub-category under PM
called "Natural Resources and Energy," which by itself increased from 1.6
percent in FY 77 to 5.9 percent in FY 81.)

19.
IProductIon-l od (I)
The analysis of the PF category is based on the PF sub-categories
expressed as a proportion of expenditure for all categories (i.e. PF +
PN + PM + CS + CW + TC + GD). Table 5 provides a breakdown of the propor
tions spent in each category and sub-category, including sub-totals for
the former, for each fiscal year, including those for PF. Looking at the
PF category in relation to each year's total for all categories, the fol
lowing observations on PF sub-categories are offered.
General Agriculture (68 projects), which Includes sector support, integrated rural development and projects c itting across two or more subcategories under PF, has increased from 3.8% in FY 77 to 19.3% in FY 81;
Physical Inputs (10 projects) has declined from 8.5% inin FY 77 to 3.5% in FY 81 after an initial rise to 18.2% in FY 78;
Crops (22 projects), rising from 5.8% in FY 77 to 6.7% in FY 78, has since declined to 2.4% in FY 81; Crop Storage ano Protection (12 projects) has increased from 1.0% in FY 77
to 2.1% in FY 81;
Fish (8 projects) has remained consistently under 0.5%;
Livestock and Range Management (26 projects) has declined from 8.6% in FY 77 to 3.6% in FY 81;
Agricultural Marketinq (3 projects) has remained consistently at or under 0.2%;
Institutions/Manpower Development (11 projects) has increased modestly from 0.9% in FY 77 to 2.0% in FY 81;
Agricultural Education and Training (14 projects) has steadily increased,from 0.2% in FY 77 to 3.6% in FY 81, although down from a high of 4.4% in FY 80;
Agricultural Research and Extension (26 projects) has increased dramatically,from 1.2% in FY 77 to 6.5% in FY 81, although also down from FY 80 when it constituted 7.3% of the total;
Agricultural Credit (7 projects) rose from 0.9% in FY 77 to 1.7% in FY 78 and has since declined to 0.2% in FY 81; and
Agricultural Planning (11 projects) has increased very modestly, from 0.7% in FY 77 to 1.1% in FY 81.

20.
Inassessing investment trends of the PF sub-categories it must be
borne in mind that projects cutting across two or more sub-categories were
entered under the "General Agriculture" sub-category. An example of such
a project would be "Crop Production and Marketing" (Botswana, -0056).
With this important clarification in mind, conclusions are presented below
on expenditure trends for the various PF sub-categories. A listing of
specific projects under each PF sub-category, including General Agriculture,
is offered as Appendix 2 to this study.
a. Significant increases In expenditure as a proportion of each
year's total were noted for i) General Agriculture, (ii)Agricultural
Education and Training, and (iii) Agricultural Research and Training.
b. Significant decreases inexpenditure as a proportion of each
year's total were noted for i) Physical Inputs, (ii)Crops and (iii) Live
stock and Range Management.
c. PF sub-catogorios consistontly representing less than 2.5 per
cent of each year's total expenditure were (i)Crop Storage and Protection,
(ii)Fish, (iii) Agricultural Marketing, (iv)Agricultural Institutions/
Manpower Development, (v) Agricultural Credit and (vi) Agricultural Planning.
d. Within the PF category itself (i.e. taking PF expenditures as
representing 100 percent of total expenditure for each fiscal year) it is
apparent that, with the exception of Crops and Livestock/Range Management,
simi lar patiorn; 2morqe whether one takos the PF category as representing
100 percent of expenditure for each year or whether one takes as 100 ?ercent
for each year the sum total of all categories (i.e. PF + PN + PM + CS + CW +
GD). Using the former mode of analysis, Crops declined by a factor of 3
(as oppsed to 2 under the latter) and Livestock/Range Management declined by
a factor of 3 (as opposed to about 2.5 in the latter).

21.
Production-Nonfood (PN)
Within this category are the sub-categories of Human Resources,
Industry/Enterprise Promotion, and Credit. The following observations
on PN sub-categories,are offered.
Human Resources (5 projects) has increased from zero percent of total expenditure to 0.8% in FY 81;
Industry/Enterprise Promotion (11 projects) has declined from 2.0% in FY 77 to 1.1% in FY 81; and
Credit (2 projects) has declined from 2.6% in FY 77 to zero percent in FY 81.
Production-Mixed (PM)
Within this category are the sub-categories Natural Resources and
Energ,, Commodity Import, Credit and Miscellaneous. The following obser
vations on PM sub-categorles are offered.
Natural Resources and Energy (42 projects) has steadily increased as a proportion of annual expenditure, from 1.6% in FY 77 to 5.9% in FY 81;
Commodity Import (2 projects, both in Sudan) has increased from zero per
cent in FY 77 to 6.1% in FY 80 and 6.3% in FY 81;
Credit (4 projects) has increased from 0.1% in FY 77 to 0.3% in FY 81; and
Miscellaneous (10 projects) rose to 2.3% in FY 79 and has declined to 1.2% in FY 81.
2. Consumption
Within this functional area are the categories of Consumption-Services
(CS), comprising projects aimed at enhancing or enabling the provision of
government or quasi-government services such as health delivery and educa
tion, and Consumption-Welfare (CW), containing projects aimed at "welfare"
functions of governments such as free food distribution and the provision

22.
of Iow-incomo ihol Ior. lokon tojothtir, tho!se two cdtoqUrles have averaged
about 20 percent of expenditure for each of the fiscal years 1977-81.
Consumption-Services (CS)
Containing the bulk of expenditure for the "Consumption" functional
area, this category includes the sub-categories of General Education,
Health and Population, and Potable Water, for a total of 122 projects
active at some point during the period. The following observations on
trends for each sub-category are offered.
General Education (32 projects) represented 4.9% of expenditure in FY 77, rose to 7.7% in FY 78, and has since declined steadily, to 2.4% in FY 81;
Health and Population (79 projects), combined here due to the numerous instances (as in Maternal-Child Health/Family Planning) in which these areas overlap in both funding source and project purpose, comprised the bulk of the CS category. Expenditures amounted to 13.6% in FY 77 and has declined to 10.9% in FY 81, although up from the low of 8.6% in FY 80;
Potable Water (11 projects) has risen fairly steadily from less than 1%of expenditure in FY 77 to 2.7% in FY 81.
Consumption-Welfare (CW)
Containing the balance of the "Consumption"-projects, this category
comprises the sub-categories of Disaster/Refugee Assistance, Shelter and
Food Distribution. It must be emphasied, however, (a) that the bulk of
U.S. disaster relief and refugee assistance is carried out through the
Office of U.S. Foreign Disaster Assistance (PDC/OFDA) and is not "projec
tized" in the AID sense, dnd therefore is not included in this category,
and (b) that PL 480 activities are not included in this analysis and there
fore are likewise not represented in this category. With these important
clarifications inmind, the following observations can be made with regard
to the CW sub-categories.
23.
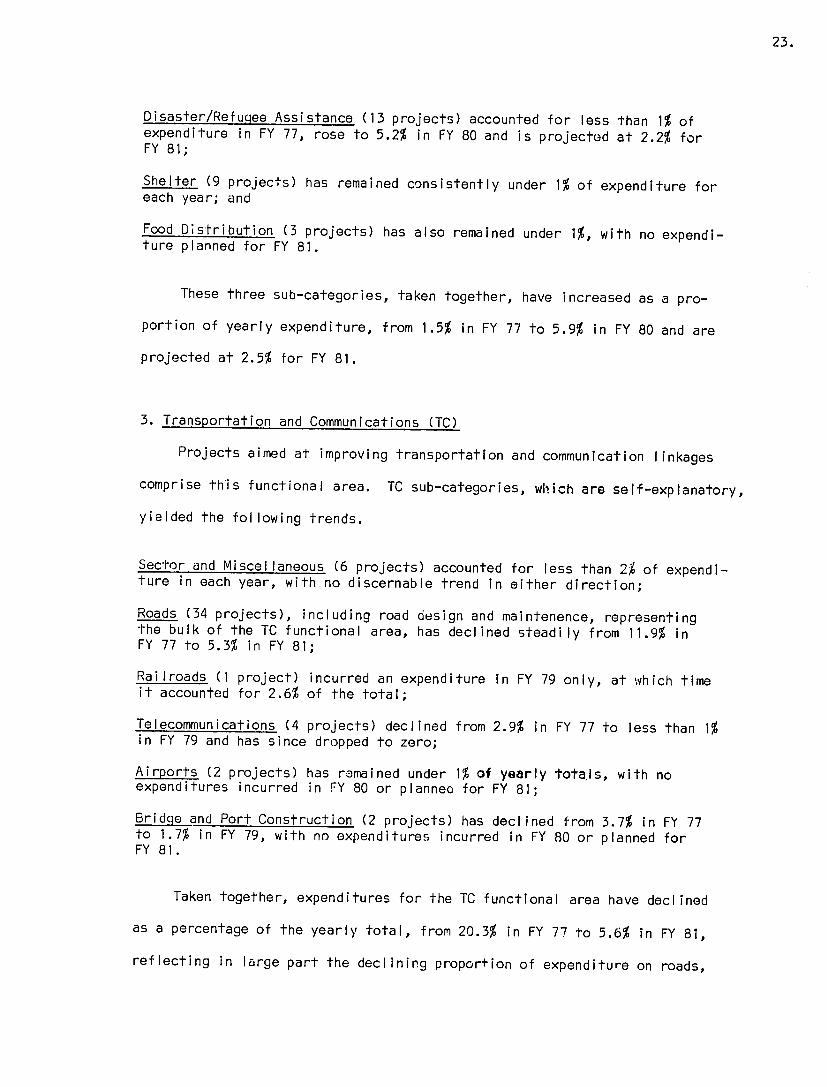
Disaster/Refugee Assistance (13 projects) accounted for less than 1% of expenditure in FY 77, rose to 5.2% in FY 80 and is projected at 2.2% for FY 81;
Shelter (9 projects) has remained consistently under 1% of expenditure for each year; and
Food Distribution (3 projects) has also remained under 1%, with no expenditure planned for FY 81.
These three sub-categories, taken together, have increased as a pro
portion of yearly expenditure, from 1.5% in FY 77 to 5.9% in FY 80 and are
projected at 2.5% for FY 81.
3. Transportation and Communications (TC)
Projects aimed at improving transportation and communication linkages
comprise this functional area. TC sub-categories, which are self-explanatory,
yielded the following trends.
Sector and Miscellaneous (6 projects) accounted for less than 2% of expenditure in each year, with no discernable trend in either direction;
Roads (34 projects), including road design and maintenence, representingthe bulk of the TC functional area, has declined steadily from 11.9% in FY 77 to 5.3% in FY 81;
Railroads (1 project) incurred an expenditure in FY 79 only, at which time it accounted for 2.6% of the total;
Telecommunications (4 projects) declined from 2.9% in FY 77 to less than 1% in FY 79 and has since dropped to zero;
Airports (2 projects) has remained under 1% of yearly totals, with noexpenditures incurred in FY 80 or planned for FY 81;
Bridge and Port Construction (2 projects) has declined from 3.7% in FY 77 to 1.7% in FY 79, with no expenditures incurred in FY 80 or planned for FY 81.
Taken together, expenditures for the TC functional area have declined
as a percentage of the yearly total, from 20.3% in FY 77 to 5.6% in FY 81,
reflecting in large part the declining proportion of expenditure on roads,

24.
but also the fall-off in expenditure for Railroads,Telecommunications,
Airports, and Bridge and Port Construction.
4. General Development
Projects aimed at enhancing the development "process" itself are
included in this 'unctional area. Observations on trends with regard to
sub-categories in this area are offered below.
Miscellaneous (50 projects) has averaged 10.5% each year, with no discernable trend ineither direction;
Research and Training (6 projects) has declined from 1.6% in FY 77 to less than 1% in FY 81;
Manpower Development (17 projects) has increased from 1% in FY 77 to 4.7% in FY 81;
Community Development (3 projects) has represented well under 1% for all five years; and
Public Administration (4 projects) has remained under 1% for all years.
Taken together, the GD functional area has averaged about 15% of
expenditure each year, with no clearly discernable trend evident in either
direction.
This concludes the Functional Profile of the Bureau's investment
portfolio.
B. Food Production and !ncome Generation Profile
As statod earlier in this paper, an analysis was also conducted to
determine the extent to which the Africa Bureau project portfolio addressed
problems associated with (a) food production and (b) income generftion.
By way of clarification, it should be repeated that each of the 570 pro
jects comprising the universe, irrespective of functional area designation,

25.
was evaluated, informally, against both food production and income genera
tion. Thus, some projects were directly related to one but only indirectly
reiated to the other, directly related to both, or any other possible com
bination- / The findings of this portion of the analysis are summarized in
Table 7, yielding the following observations.
1. Income Generation
A. Activities directly related to Income generation (253 projects
dominated by PF, PN and PM) accounted for 42.0% of expenditure at the begin
ning of the period, rose to 52.0% in FY 78, and have since declined to 48.8%,
representing a net gain of 6.8 percentage points.
B. Activities indirectly related to income generation (292 pro
jects dominated by CS, GD, PM and TC) have decliined as a percentage of total
expenditure, from 57.0% in FY 77 to 48.5% in FY 81, a net loss of 8.5 per
centage points.
C. Activities unrelated to income (25 projects dominated by CW)
have increased from 1.0% in FY 77 to 2.7% in FY 81, following a jump to
6.0% in FY 80 caused by start-up expenditures for project 690-0201, "Refu
gee Support" in the Southern Africa Regional program.
2. Food Production
A. Activities directly related to food production (226 projects
dominated by PF and PM) accounted for 36.7% of FY 77 expenditure, rose to
48.8% in FY 78, and have since declined to 45.6% in FY 81, representing a
net gain of nearly 9 percentage points.
B. Activities indirectly related to food production (191 projects
I/ See Methodology, Appendix 1.
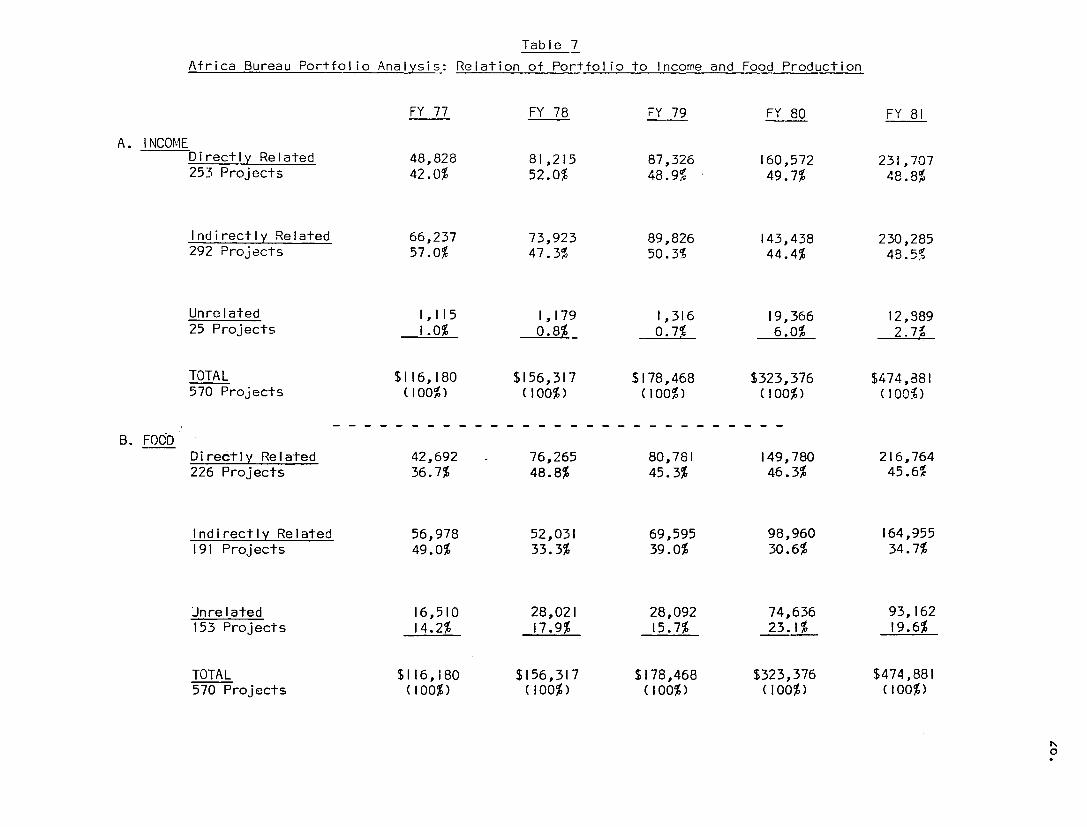
Table 7
Africa Bureau Portfolio Analysis: Relation of Portfolio to Income and Food Production
A. INCOME Directly Related 253 Projects
Indirectly Related 292 Projects
Unrelated 25 Projects
TOTAL 570 Projects
B. FOOD Directly Related 226 Projects
Indirectly Related 191 Projects
Jnrelated 153 Projects
TOTAL 570 Projects
FY 77
48,828 42.0%
66,237 57.0%
1,115 1.0%
$116,180 (100%)
42,692 36.7%
56,978 49.0%
16,510 14.2%
$116,180 (100%)
FY 78
81,215 52.0%
73,923 47.3%
1,179 0.8%_
$156,317 (100%)
76,265 48.8%
52,031 33.3%
28,021 17.9%
$156,317 (100%)
FY 79
87,326 48.9%
89,826 50.3%
1,316 0.7%
S178,468 (100%)
80,781 45.3%
69,595 39.0%
28,092 15.7%
$178,468 (100%)
FY 80 FY 81
160,572 231,707 49.7% 48.8%
143,438 230,285 44.4% 4B.5%
19,366 12,389 6.0% 2.7G
$323,376 $474,881 (100%) (100%)
149,780 216,764 46.3% 45.6%
98,960 164,955 30.6% 34.7%
74,636 93,162 23.1% 19.6%
$323,376 $474,881 (100%) (100%)

27.
dominated by PM, TC, and GD) have declined as a percentage of total expendi
ture from 49.0% in FY 77 to 34.7% in FY 81.
C. Activities unrelated to food production (153 projects dominated
by PN, CS and CW) have increased from 14.2% of total expenditure for FY 77
to 19.6 of that for FY 81.
It is apparent from these separate analyses that there is a correlation
between income-generating projects and food-producing projects. This is
largely due to the internal consistence of the analysis: for example,
nearly all projects in the PF category were by definition directly related
to food production but also to income generation since the former strongly
affects the latter. In any case, it may be observed that
a. Expenditures directly related to either food or income reached
their peak as a proportion of total expenditure in FY 78 and have since
declined:
b. Expenditures indirectly related to either food or income have
declined as a proportion of total expenditure; and
c. Expenditures unrelated to either food or income have increased
as a proportion of total expenditure, most notably with respect to
projects unrelated to food.
28.
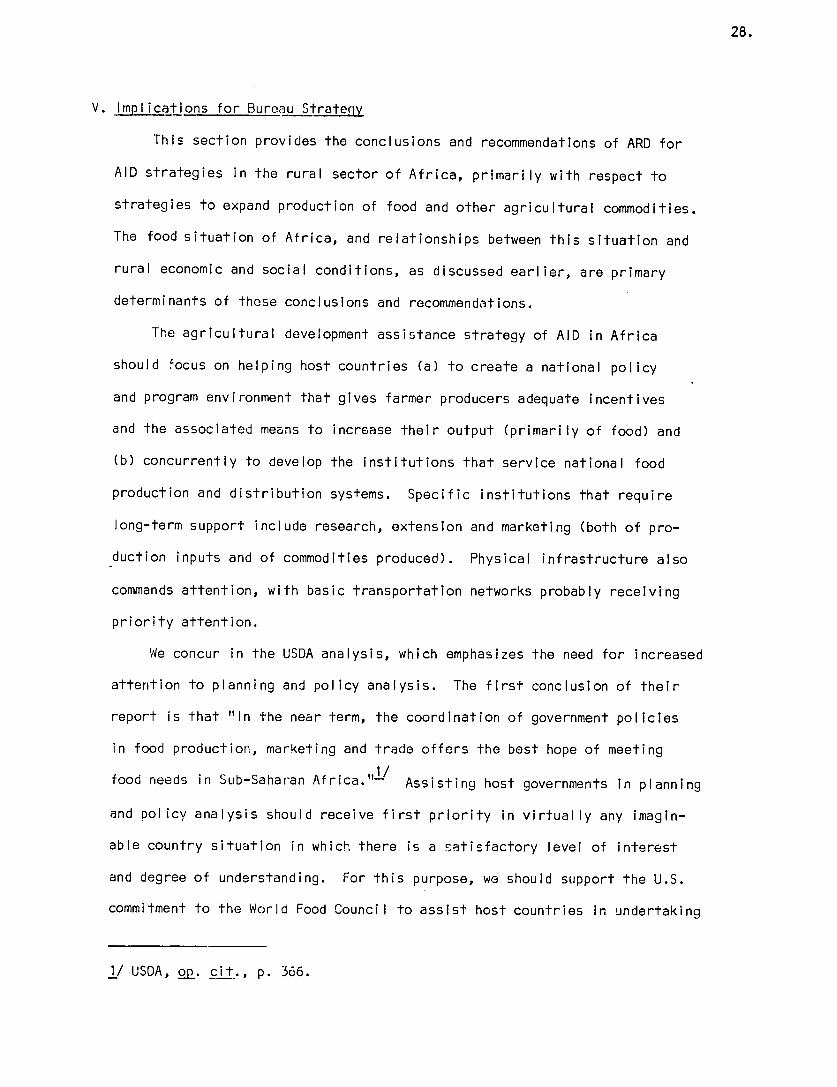
V. Implications for Bureau Strategy
This section provides the conclusions and recommendations of ARD for
AID strategies in the rural sector of Africa, primarily with respect to
strategies to expand production of food and other agricultural commodities.
The food situation of Africa, and relationships between this situation and
rural economic and social conditions, as discussed earlier, are primary
determinants of these conclusions and recommendations.
The agricultural development assistance strategy of AID inAfrica
should focus on helping host countries (a) to create a national policy
and program environment that gives farmer producers adequate incentives
and the associated means to increase their output (primarily of food) and
(b) concurrently to develop the Institutions that service national food
production and distribution systems. Specific institutions that require
long-term support include research, extension and marketing (both of pro
duction inputs and of commodities produced). Physical infrastructure also
commands attention, with basic transportation networks probably receiving
priority attention.
We concur in the USDA analysis, which emphasizes the need for increased
attention to planning and policy analysis. The first conclusion of their
report is that "In the near term, the coordination of government policies
in food production, marketing and trade offers the best hope of meeting
food needs in Sub-Sahar-an Africa."- Assisting host governments in planning
and policy analysis should receive first priority invirtually any imagin
able country situation in which there is a satisfactory level of interest
and degree of understanding. For this purpose, we should support the U.S.
commitment to the World Food Council to assist host countries in undertaking
1/ USDA, op. cit., p. 366.

29.
food sector strategy studios. PL 480, rltie III provisions offer a par
ticular entree to undertake policy studies and to negotiate for policy
changes that may be identified as needed. And over the long term, we
need to dramatically expand our assistance to host countries in launching
projects that will institutionalize rural agricultural food sector plan
ning and policy analysis capabilities. Our project portfolio analysis
indicates only very modest efforts to date.
The USDA analysis clearly Identified the need for supporting insti
tutional capacities to make price incentives effective. There is little
use in announcing a price floor that cannot be backed by providing con
venient buying points, prompt payments, storage and transport. An almost
disastrous series of events In Kenya and Tanzania following exceptionally
large crop harvests should amply dramatize these relationships.
The need for better trained human resources is an integral part of
virtually any program thrust. Certainly policy analysis and management
of programs of implementalion, research and extenslon require cadres of
highly trained people and also less-trained supporting staff.
A mid-term and long-term strategy requires development of Improved
technology, production and distribution of any inputs that are required
from off-farm sources, and presenting ("teaching") the new techniques to
farmers through extension processes. For a variety of compelling econ
omic and logistic reasons, the Improved technology should be as nearly
"solf-contained" as possible, with little dependence on heavy supporting
infrastructure.1 This consideration may be similar in its results to
the efforts to identify "appropriate technology," at least to the extent
that those engaged in "appropriate +echnology" activities are fully
I/ USDA, op. cit., p. 365.

30.
knowlodgoablo and IpY C:loWe attonl Ion to tho roquiromonts of agriculture.
Many ol),;orvor, including the USDA analystn, have noted the shift
toward foods thet are difficult or impossible to produce In Africa, especi
ally on the part of urban dwellers. The shift, especially toward wheat
and rice, has serious economic implications. The shift away from tradi
tional staples should be arrested or reversed if possible. The means may
be an enlarged program to identify specific concumer preferences, to inte
grate this information with research on new varieties, and to develop new
processing technologies.-'
In the longer term, it is necessary to transform the subsistence sector
in ways that raise living standards and respect social values. Only thus
can food production really be increased sharply, generating substantially
increased employment and income.- / Only through a transformation that sub".
stantially increases output per worker can the conditions of severe rural
poverty in most of Africa really be relieved. Research must play a funda
mental role in identifying the needed technology.
Recent statements by David Garst of the Board for International Food
and Agricultural Development (BIFAD) underscore the preceding emphasis
on identification and dissemination of technology that is truly productive.
Garst notes that it may be suprising that he, a U.S. agri-businessman,
whould support institutional and human resource development activities.
He employs an illustration based on fertilizer use and its effect on pro
duction in Bangladesh and India. Only by finding technology that provides
a much better pay-off will investment in fertilizer really pay off. The
returns to cost from research are thus likely to be much higher than short
1/ USDA, _p. cit., p. 366. 2/ Ibid., p. 367

31.
term returns from fertilizer purchases. He concludes, "Present shortages
are human resources and institutional Infrastructure, not fertilizer or
credit..,1-/
How do these program needs compare with the profile of AID expenditures
in Africa for the period FY 1977-81?
Growth of expenditures for projects classified as "Production", both
in level and percentage, is consistent with the urgent need for both food
and income. A continued and even heavier emphasis on production is Indi
cated as imperative throughout this decade. The quality of the production
projects is as important as levels of Investment.
Stability of the level of expenditures for Transportation and Com
munications, but a sharp decline in the percentage allocation, is sharply
contrary to perceived neuds. Opportunities to build and renovate roads
that directly support food production and riarketing should receive pri
ority attention.
Division of the Production category among food, nonfood and mixed
groupings raises questions, but no definitive conclusions. The "Produc
tion-Mixed" category, which increased so sharply, deserves further study.
It is not clear that this increase represents a valid, rewarding shift
from specialized to more rewarding, logically integrated multi-activity
projects.
A. Food Production
The food production grouping Is treated in greater detail than others.
The sharp increase in "General Agriculture" projects may represent a
desirable long-term objective, but other typoe of projects may have been
1/ Agency for International Development, BIFAD Briefs, Vol. III, No. 6, October 1980, pp. 1-2.
32.
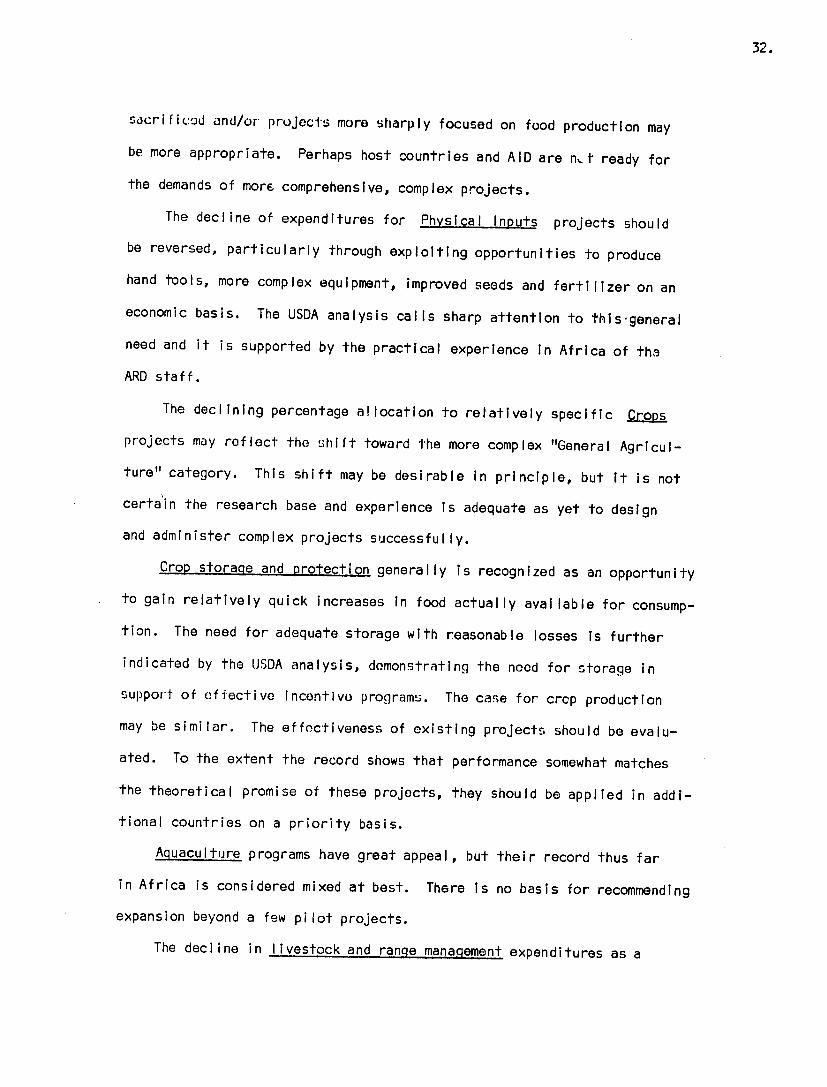
sacrifi od and/or projects more sharply focused on food production may
be more appropriate. Perhaps host countries and AID are nt ready for
the demands of more comprehensive, complex projects.
The decline of expenditures for Physical Inputs projects should
be reversed, particularly through exploiting opportunities to produce
hand tools, more complex equipment, improved seeds and fertilizer on an
economic basis. The USDA analysis calls sharp attention to this~general
need and it is supported by the practical experience in Africa of tha
ARD staff.
The declining percentage allocation to relatively specific Crogs
projects may reflect the shift toward the more complex "General Agricul
ture" category. This shift may be desirable In principle, but it is not
certain the research base and experience is adequate as yet to design
and administer complex projects successfully.
Crop storage and protection generally is recognized as an opportunity
to gain relatively quick increases in food actually available for consump
tion. The need for adequate storage with reasonable losses Is further
indicated by the USDA analysis, domonstrating the need for storage in
support of effective Incentivo programs. The case for crcp production
may be similar. The effectiveness of existing projects should be evalu
ated. To the extent the record shows that performance somewhat matches
the theoretical promise of these projects, they should be applied in addi
tional countries on a priority basis.
Aquaculture programs have great appeal, but their record thus far
in Africa isconsidered mixed at best. There is no basis for recommending
expansion beyond a few pilot projects.
The decline in livestock and range management expenditures as a

33.
proportion of yearly totals may reflect the difficulty of designing and
implementing successful range management projects in particular. The
need for improved range management as a base for more productive live
stock isevident. Efforts should be continued and expanded where there
is solid promise of progress.
There is need for major expansion and Improvement of marketing
systems, particularly as productivity of farmers can be Increased to
provide more food for the rapidly growing cities. While there Is some
marketing activity included inother project categories, the need isso
great that projects with a marketing emphasis should be sought, and
expenditures Increase .
The institutions and manpower group Isvaried, and most of this
activity is hidden in other groups (i.e. research and extension, agricul
tural education and training). We place great emphasis on institution
building and on manpower development. However, while these purposes may
in most cases best be met through other projects with a functional orien
tation, cooperative development activities should be discussed separately.
A few specialized cooperatives projects are included in this category.
This organization type is widespread, and involved integrally in many
projects that AID supports. Performance of cooperatives should be strength
ened through oxpandod spocial ized attontion and assistance, not necessarily
requiring specialized projects.
Agricultural education and training should receive continued empha
sis, probably continuing to increase in both amount and proportion.
This represents an area of special U.S. skill, and offers high returns.
AID needs to adopt a long-term commitment toward this activity, including
willingness to absorb recurrent costs where public reserves are not

34.
sufficient.
The dramatic increase ;n agricultural research and extension is sup
ported solidly. The need to identify, prove and disseminate improved
technology is paramount in improving the food and rural income situation
of Africa. Potentially effective research programs should not suffer
for lack of funds, and extension systems must be strengthened to dissemi
nate proven technology.
It is not certain that lack of agricultural credit has been a sig
nificant production constraint in most of Africa. The need for credit
will expand sharply, however, when the need for purchased components of
proven technology is shown, and Inputs are available. The need for- credit
may readily outrun AID capabilities, and AID may elect to defer to the
World Bank or other donors in many cases.
As indicated above, improved agricultural planning and policy analysis
at the host country sector level is the most critical of our recommended
priorities. These activities must be expanded. As our project portfolio
analysis suggests, relatively little attention has been given to this by
the Africa Bureau and its field missions.
B. Consumption
ARD has no comments or recommendations on this category.
C. Transportation and Communications
The decline in the proportion for roads should be reversed, as noted
above.
D. General Development
The increase inexpenditures for manpower development may be desir
able. New proposals should be examined constantly for the relevance of
35.
training programs to productive occupations, especially farming and re
lated functions.
Public administration may be a valuable category, to the extent
these projects genuinely contrubute to improved administration of public
programs, especially the production-oriented ones.
E. Food Production and Income Generation
Analysis of the division of expenditures between that directly
income-related and that indirectly related showed a sharp increase in
the direct group in FY 1978 and then a fairly steady percentage thereafter.
This constancy is not consistent with the critical need for goods, and
for income to support services inAfrica. It may be difficult, however,
to expand the income-relarted portfolio while the situation dictates much
emphasis on institution building, training, and planning and policy
analysis.
The close correlation between the portfolio related to Income pro
duction and that related to food was noted earlier. The needs of Africa
definitely dictate more direct attention to food than the proportions
indicated by this classification, never reaching 50 percent, and declin
ing slightly as a percentage since FY 1978.

36.
VI. Recommended Course of Action
Much rocont ncIlysi!5, and oven information getting Into the mass
media, highlight the food needs of Africa -)- an extent that demands still
further emphasis on food production activities by AID. Decisions by the
Africa Bureau to concentrate in this area in its regular program, and in
the additional "Leadership" investment proposal, are strongly endorsed.
Action to increase food production also will increase incom9s of
farmers, those in the input supply system, and those who market the
increased output. More food production produces more income, purchasing
power for food and other goods, and the private and public income stream
required to support and service the components of basic human needs.
AID strategy and programs in Africa should focus on helping (a) to
create a national policy and program environment that gives farmers ade
quate incentives and the associated means to increase their output (pri
marily of food) and (b)concurrently to develop the institutions that
service national food production and distribution systems. Actions to
accomplish these broad purposes are varied, complex, and require fitting
to individual countries. The following paragraphs lift up the main items
considered applicable to most or many African host countries.
Assisting in planning and policy analysis should receive first pri
ority. Preparing food sector stratogy statements Inselected countries,
as recommended by World Food Council, provides a short-term means of plan
ning and policy assistance. Other similar rural/agricultural/food sector
planning and policy analysis efforts must be encouraged for both the
short- and long-term. The priorities in institutional development are
for research, extension and marketing. These estaulishments and their
operating programs offer the way to Identify and disseminate technology

37.
1hal wi I I incrnn'iv ulpIit- po)r w )rkolr. In, IlIti i-Ifln-u IIdl nq proqrarns and
prujoct muI bo oxponded. In addil lo to maintalning and expanding cur
rent research initiatives, AFR is preparing for presentation to a group
of donors under the framework of Concerted Action for Development (CADA),
a proposed major additional research initiative.
As improved technologies are identified and disseminated, it will
be necessary to supply the physical inputs involved. We recommend expan
sion of projects to produce such inputs incountries whenever feasible.
Actions to expand distribution systems for the inputs go hand in hand.
Such distribution and marketing of production inputs usually should be
combined in a strengthened marketing system for commodities produced.
AID should begin planning and preparing for major actions in this field.
Transportation is frequently identified as a significant bottleneck.
Certainly AID and other donors must prepare to make large investments
in road networks and truck fleets before a really more productive agri
cultural system, particularly one involving inputs supplied from towns
and cities and products returned to them, can be in place.
Actions to improve crop protection and crop storage will command
priority consideration whenever economic actions are identified because
these actions can yield a rapid increase in food available for consumers.
Agricultural education and training needs cut across virtually all
conceivable functional actions, The U.S. can provide a lasting benefit
to African courtri n by ircroa.o( invo-,lmont in Irairninfj, par-ticularly
in skills required for tangible development programs. ARD recommends
that selected missions be encouraged to prepare training projects, per
se, and that AFGRAD-type programs be expanded. ARD is preparing for con
sideration a proposal for a new high-level agricultural university for

38.
aidv ;ncoJand qpecialiIod ir innign In Afr'ic:,o.
This outline and presentation may imply a low priority for projects
contributing directly to increased production in the short term. It is
true we perceive the greatest needs to be in the areas of policies, insti
tutional systems and manpower, before bricks, mortar, machines,dams and
fertilizer investment on a large scale can be very effective. None-the
less, short-term direct producton interventions shouald be undertaken
as opportunities are identified and resources are available, particularly
those that test and commence to build institutions That increase produc
tion. We do recommend continued acceptance of an institution-building
approach, albeit sometimes ind!rect, giving priority attention to identi
fied functional requirements of a productive system of agriculture.

A-I
Al1 Izcl i*.
MethodoI oy
A. Definition of the Univarse
The Africa Bureau Portfolio Trend Analysis was designed to discern
patterns of investment by the Bureau over a five-year period, FY 1977-81.
The universe consisted of all proiectized expenditures, regardless of
funding account, incurred at any time during this period. Since some
projects incurred their final expenditures at the beginning of the period
(FY 77) while others wore only coming on stream at the end (FY 81), the
resulting universe represents the cross-section of a flow of expenditure
over time. The total number of projects incurring expenditure during the
period, exclusive of "Self-Holp Developmnt" projects, for which descrip
tive material was not readily available, was fixed at 570 separate and
discreet activities. These projects are listed in Appendix 2 by country
or rejional program.
B. Data Sources
Two sources were employed in the compilation of project expenditure
data: printouts from Finai al Management and the 1982 Annual Budget
Submission for the Bureau. The former, containing actual expenditures
by year and by project, were used for the fiscal years 1977, 1978 and
1979, while the latter, containing estimated expenditures by year and by
project, was used for fiscal years 1980 and 1981. The data taken from
the 1982 ABS did not incorporate new projects projected for FY 1982.
The Iwo ;ources, lIken toihoer', enabled .in overview of the five-year
period reveal ing not only older and newer projects but projects spanning
the two data sources as well. Thus, for example, a project that began
in FY 1979, the last year covered under the printouts from FM, was picked
up al in in IIh I Y 1981 AlIri .do3tl

A-2
C. Cdlo lori / Iion of JI cJl I
I. Functional Categories
As originally envisaged, the Portfolio Trend Analysis was to
divide activities into projects of two types, "Production" and "Consump
tion.' The former was to cover all projects aimed at the producing sec
tors of a given economy (i.e. agriculture and industry) while the latter
was to cover activities aimed at the consumptive sectors (i.e. health and
education). As the review of projects proceeded, however, it became
apparent that certain activities did not "fit" into either category and
it was determined that two new ones would be added: Transportation and
Communications (TC), covering chiefly roads but also road maintenence,
telecommunications, bridge and port construction and other activities
in this area, and General Development (GD), covering activities such as
"training in project management" which aim at enhancing the develop
ment "process" itself.
a. Production
As stated above, projects in this functional area are "aimed" at
the productive sector of a given economy. The beneficiaries of these
projects either produce goods and services, as in crop production, or
enhance their capability to do so, as in vocational education.
Production, for the purplos-, of this analysis, is broken down
into lProducl;on-lood (I'I ), l rudu:lion-Nonfood (lWN) 3nd Production-Mixed
(PM), whichir in turn furlhorr )rroko down Into sub-categories. Follow
ing is a brief doscripiion of each catogory and a listing of illustrative
project titles in each sub-category.
PF-Proiects aimed at the production of food
General Agriculture- Includes sector support, integrated rural development, or projects contaning componenets of two or more sub-categories in this group,

A-3
i,lmhiri Kenya
W~-l).I)l b,1ub-0169
Auli It tiI Itir'o & Purai LIv l)ljuffll Agriculfure Systems Support
Uganda Niger
617-0142 683-0228
Agricultural Projects Support Rural Integrated Agricultural Development
Physical Inputs
Rwanda 696-0103 Farm Hand Tools Tanzania 621-0092 Seed Multiplication & Distribution Sahel 625-0013 Sahel Fertilizer Development
Crops
Nigeria Mali Chad
620-0798 688-0206 677-0001
Food Grop Production Action Riz-Sorgho Lake Chad Irrigated Agriculture
Crop Storaqo & Protection
Senegal Sahel
685-0209 625-0928
Grain Storage Regional Food Crop Protection
Fish
Cameroon 631-0022 Small Farmer Fish Production C.A.R. 676-0004 Fish Culture Extension
Livestock & Ran le Manacement
Kenya 615-0157 National Range & Ranch Development Tanzania Somalia
621-0129 649-0108
Dairy Production Central Rangelands Development
Aqricultural Marketing
Tanzania Sahel Upper Volta
621-0099 625-0523 686-0243
Agriculture Marketing Development West Africa Meat Marketing Grain Marketing Development
I i liIu i(ri':;& Maiiimowcr
Tanzania 621-0119 Agriculture Manpower Development Somalia Liberia
649-0112 669-0127
Agriculture Delivery Systems AgIricultural Cooperatives Development
Agricultural Education & Training
Malawi 612-0054 Bunda Agricultural College

A-4
Mali 688-0207 Agricultural Officers Training (omelroc on ,I -0()0 [r'ai1n i rn r forFa rFani I Io.i
Agricultural Research & Extension
Kenya 615-0180 Cropping Systems Research Botswana 633-0215 Horticulture Extension Africa Reg'l 698-0393 Food Grain Research & Development
Agricultural Credit
Sierra Leone 636-0112 Cooperative Credit Society 1.i h rii 669-014') Aqric I:tlIiral Credi' 1Hank Af r ic i kc 'I ib98-() 501 I)iroc(ld Agricul 1ural Production Credit
Agricultural Planning
Cameroon 631-0008 Agriculture Management & Planning Lesotho 632-0064 Lesotho Agriculture Sector Analysis
PN-Proiects aimed at the production of goods and services other than food.
Human Resources
Liberia 669-0131 Vocational Training Senegal 685-0222 Integrated Youth Job Development
Industry & Enterprise Promotion
Sierra Leone 636-0168 Opportunities Industrialization Center Sahel 625-0717 African Enterprises Promotion II Lesotho 632-0209 Cottage Mohair Production
Credit
Kenya 615-0202 Credit Union Development Sahel 625-0715 Investment and Credit Facility
PM- IProit.'clt, irmod aIl lh. y -proluclionbIolh food and non-foodof _oods and 5ervicc5. Includes natural resources and energy.
Natural Resources; & Enery
Botswana 633-0209 Renewable Energy Technology Sudan 650-0045 Rural Reforestation Senegal 685-0223 National Plan for Natural Resources

A-5
Sudan 650-0038 Commodity Import Program Sudan 650-0040 Commodity Import Program 11
Credit
Lesotho 632-0214 Credit Union Development
b. Consumption
Projects in this functional area are divided into two groups: Con-
sumption-Services (CS) and Consumtion-Welfaro (CW). The former relates
to quasi-governmental functions generally associated with user fees or
charges such as health and education, while the latter involves transfer
payments or free distribution of commodities, such as food, or services,
such as low-income shelter. Following is a list of illustrative project
titles for sub-categories under each of these two groups.
CS-Proiects aimed at the provision of government services
General Education
Guinea-Bissau 657-0003 Primary Teacher Training Niger 683-0237 Literacy Training Chad 677-0005 kL,-al School Construction Africa Reg'l 698-0062 Graduate Fellowship Program
Health & Population
Tanzania 621-0157 Health Education & Training Ghana 641-0087 Population Dynamics Swaziland 645-0062 Water-Borne Disease Control Botswana 633-0032 Maternal-Child Health/Family Planning Liberia 669-0054 National Medical Center
Potable Water
Mali 688--0224 Rural Water Improvement C (ipc Vorrho ('Y'I-)004 Minll I .,, iini/)r nat-i

A-6
CW-Proiects aimed at free distribution of commodities or sorvico,
Disaster/Refugee Ass istance
Tanzania 621-0123 Disaster Relief Assistance Ethiopia 663-0211 International Disaster Seminar Chad 677-0043 Chad Recovery & Rehabilitation
Shelter
Botswana 633-0092 Self-Help Housing Development Guinea 675-0202 Secondary Cities Shelter Niger. 683-0224 Shelter Sector Planning
Food Distribution
Chad 677-0023 Food Delivery & Rural Works
c. Transportation & Communications
Projects in this category are aimed at improving transportation and
communications linkages in African countries. Sub-categories in this
functional area are self-explanatory and are as follows: (I) Sector
Support and Miscellaneous, (2) Roads, (3) Rail, (4) Telecommunications,
(5) Airport and (6) Bridge and Port Construction. Following are illustra
tive project titles.
Africa Rg'I 698-0423 Transportation Development Studies Gambia 635-0206 Roads Maintonence Systems Sudan 650-0031 Southern Access Road Cameroon 631-0011 Trans-Cameroon Railroad III Liberia 669-0111 relocommunIcations Expansion Iiberio 600-OIOi NovijI0 ional Aid'I l Principle Airports .;ahol 625-0888 Cotonou l3ridge & Dam
d. General Development
Projects aimed at the development "process" itself are included In
this category. Following are illustrative project titles for each sub
category.

A-7
Ghana 641-0062 Economic Development Management Sierra Leone 636-0108 Increasing Revenue for Development S. Afr. Reg'l 690-0104 Project Development & Support Africa Reg'l 698-0127 African Development Bank Sahel 625-0934 Sahel Private Voluntary Organizations
Research & Training
Cameroon 631-0007 Social Science Research & Training Botswana 633-0095 National Migration Study Africa Reg'l 698-0403 Social Science Research
Manpower Development
Lesotho 632-0030 S'ern Africa Development Personnel & Trng. Africa Req'l 698-0384 African Manpower Development Mauritania 682-0211 Rural A!;sessment/Manpower Survey
Community Development
Cameroon 631-0010 Pilot Community Development Ghana 641-0095 Community Development Staff Training Mali 688-0209 Community Development for Women
Public Administration
Liberia 669-0122 Institute of Public Administration E. Afr. Reg'l 618-0649 East Africa Community Staffing/Management Ni!ler 68'3-0229 FviIluivi ion Assistance to Ministry of Plan
D. Relation of Portfolio to Food Production and Income Generation
In addition to constructing the typology described above, each project,
irrespective of functional category, was evaluated with regard to its
potential or actual relation to (a) food production and (b) income genera
tion. Based on descriptions of project purpose and goal, a project was
either directly related (D), indirectly related (I) or unrelated (U) to
these two objectives. It must be emphasizod that each of the 570 projects
comprising the universe was evaluated against both food and income. Hence,

A-8
a project might be directly related to income but unrelated to food, unre
lated to either, or any other of the nine possible combinations:
Food-D Food-D Food-D Food-I Food-I Food I Food-U Food-U Food-U
Each of the major functional
CS, GD, etc.) were dominated, with
following configurations:
Production-Food Production-Nonfood Production-Mixed Consumption-Services Consumption-Welfare Transportation & Communications General Development
Income-D Income-I Income-U Income-D ncome I Income-U Income-D Income-I Incpmo-U
categories discussed earlier, (i.e. PF,
some exceptions in each category, by the
Food-D lncome-D Food-U Income-D Food-I Income-I Food-U Income-I Food-U Income-U Food-I Income-I Food-I Income-I

Appondix 2.
Projects by Country and Regional Program
(In Numerical Order of Country or Regional Program Code)
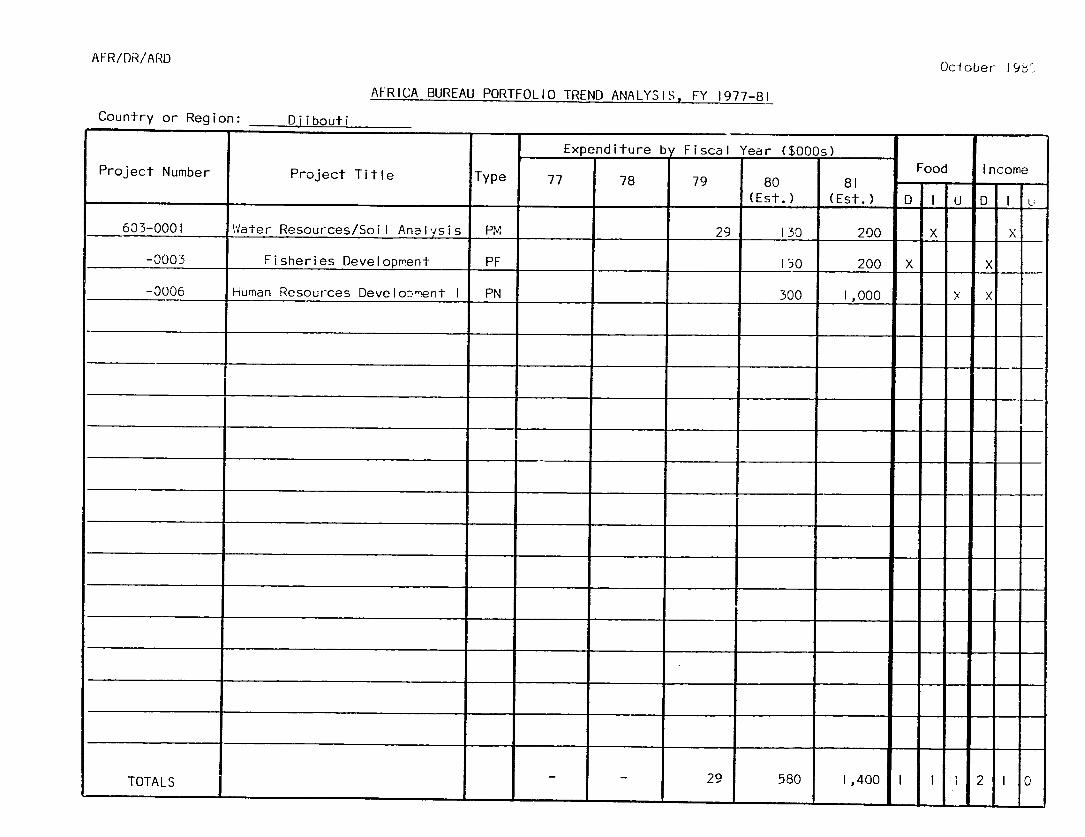
AFR/DR/ARD Oclober 19.
Country or Region: Diibouti
AFRICA BUREAU PORTFOLIO TREND ANALYSIS, FY 1977-81
Project Number Project Title Type
Expenditure b
77 78
Fiscal Year ($000s)
79 80 81 Food Income
(Est.) (Est.) D I U D I L;
603-0001 Water Resources/Soil Analysis PM 29 130 200 X X
-0003 Fisheries Development PF 150 200 X X
-0006 Human Resources Develo:ment I PN 300 1,000 X X
TOTALS 29 580 1,400 I :1 2 I 0
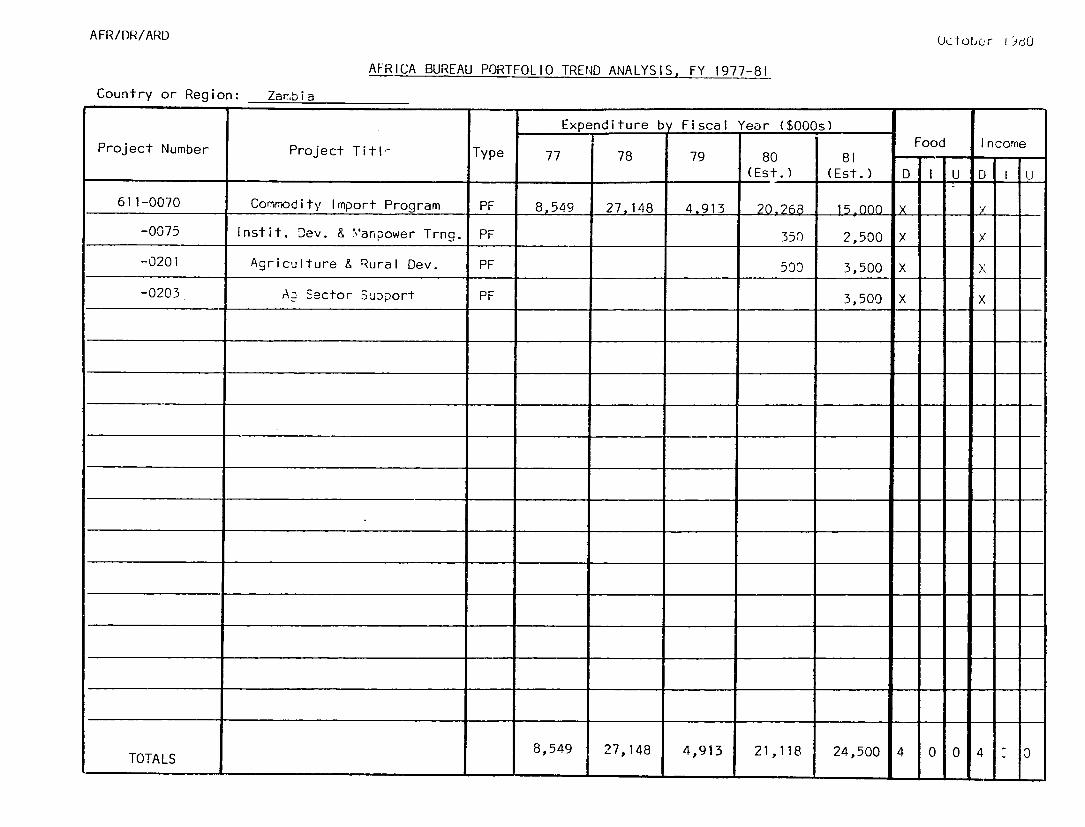
AFR/DR/ARD Oclober idO
AFRICA BUREAU PORTFOLIO TREND ANALYSIS, FY 1977-81
Country or Region: Zarrbia
Expenditure bT Fiscal Year ($O00s) Food Income Project Number Project Titl Type 77 1 78 79 80 81 F Inco-
I (Est.) (Est.) D I U D I U
611-0070 Commodity Import Program PF 8,549 27,148 4.913 20.268 15.000 X I y__
-0075 Instit. Dev. & Manpower Trng. PF 350 2,500 X Ix
-0201 Agriculture & Rural Dev. PF 500 3,500 X X
-0203 A, Sector SuDport PF 3,500 X X
TOTALS 8,549 27,148 4,913 21,118 24,500 4 0 0 4 0

AFR/[)ARD Oclober 193.BJ
Country or Region: Malawi
AFRICA BUPEAU PORTFOLIO TREND ANALYSIS, FY 1977-81
Project Number Project Title Type
Expenditure by
77 78
Fiscal
79
Year ($O00s)
80 81
(Est.) (Est.)
Food
D I U
Income
D I L
612-0054 Bunda Agricultural Collece PF 85 1,458 1,426 621 571 X X
-=1
-02G2
.alawi Polytechnic Inst"tue
Agriculture Research
PM
PF
400
1,700
1,900
2,850 X
X X
X
-023 Rural Water CS 350 730 X X
TOTALS 85 1,458 1,426 3,071 6,101 2 2 0 3 1 0
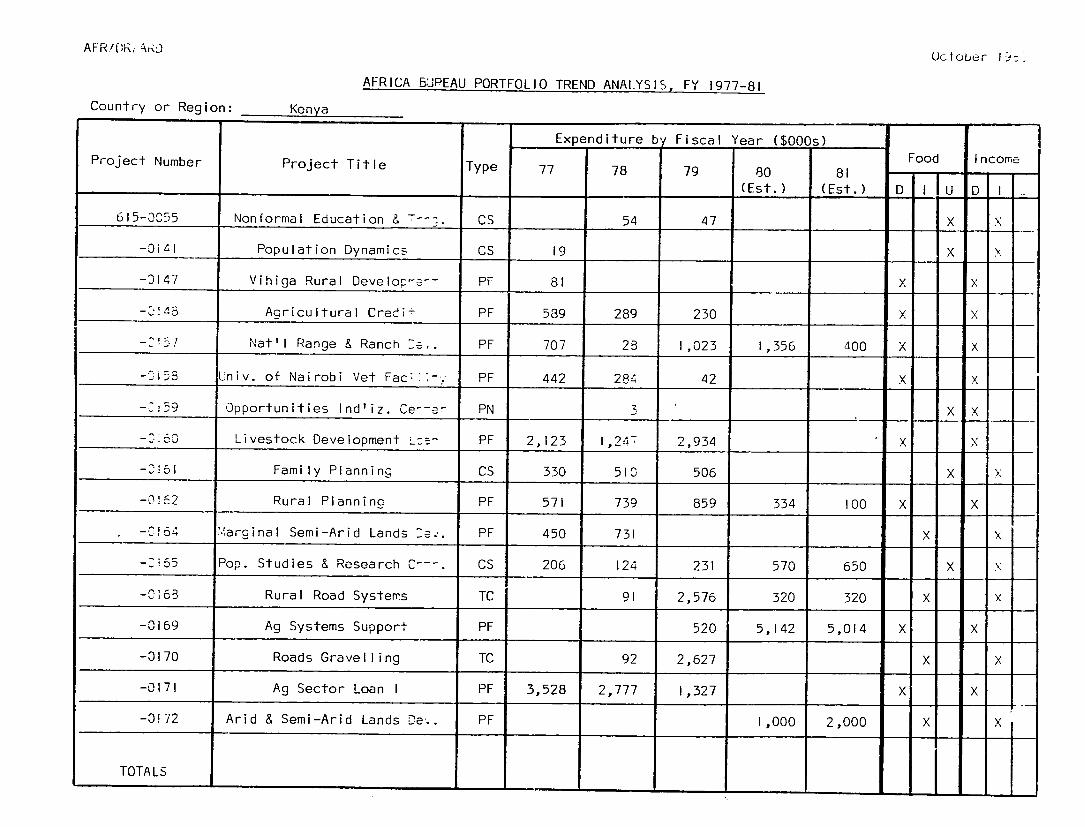
AFR'DR, A D October l.z
AFRICA BUPEAU PORTFOLIO TREND ANALYSIS, FY 1977-81
Country or Region: Kenya
Project Number Project Title Type
Expenditure by
77 78
Fiscal Year ($O00s)
79 80 81
(Est.) (Est.)
Food
D I IU Income
D I
615-0055
-__4I
Nonformal Education & 7--:.
Population Dynamics
CS
CS 19
54 47 X
X
X
X
-D147
-Cr45
-- 57
Vihiga Rural Develope--
Aqricultural Credi-
Nat'l Range & Ranch e..
PF
PF
PF
81
589
707
289
28
230
1,023 1,356 400
X
X
X
X
X
X
-915S Univ. of Nairobi Vet Fac*V*-- PF 442 284 42 X X
-;r9
-S______ Opportunities Ind'iz. Ce-e-Livestock Development
PN PF 2,123 1,24T 2,934 X
X X X
-. 51
-0164
Family Planning
Rural Plannina
iarainal Semi-Arid Lands
CS
PF
PF
330
571
450
510
739
731
506
859 334 100 X
N
X
X
X
N
-__;55 Pop. Studies & Research C---. CS 206 124 231 570 650 X X
-0165
-0169
-0170
-0171
-0172
Rural Road Systems
Ag Systems Support
Roads Gravelling
Ag Sector Loan I
Arid & Semi-Arid Lands De..
TC
PF
TC
PF
PF
3,528
91
92
2,777
2,576
520
2,627
1,327
320
5,142
1,000
320
5,014
2,000
X
X
X
X
X
X
X
N
X
X
TOTALS
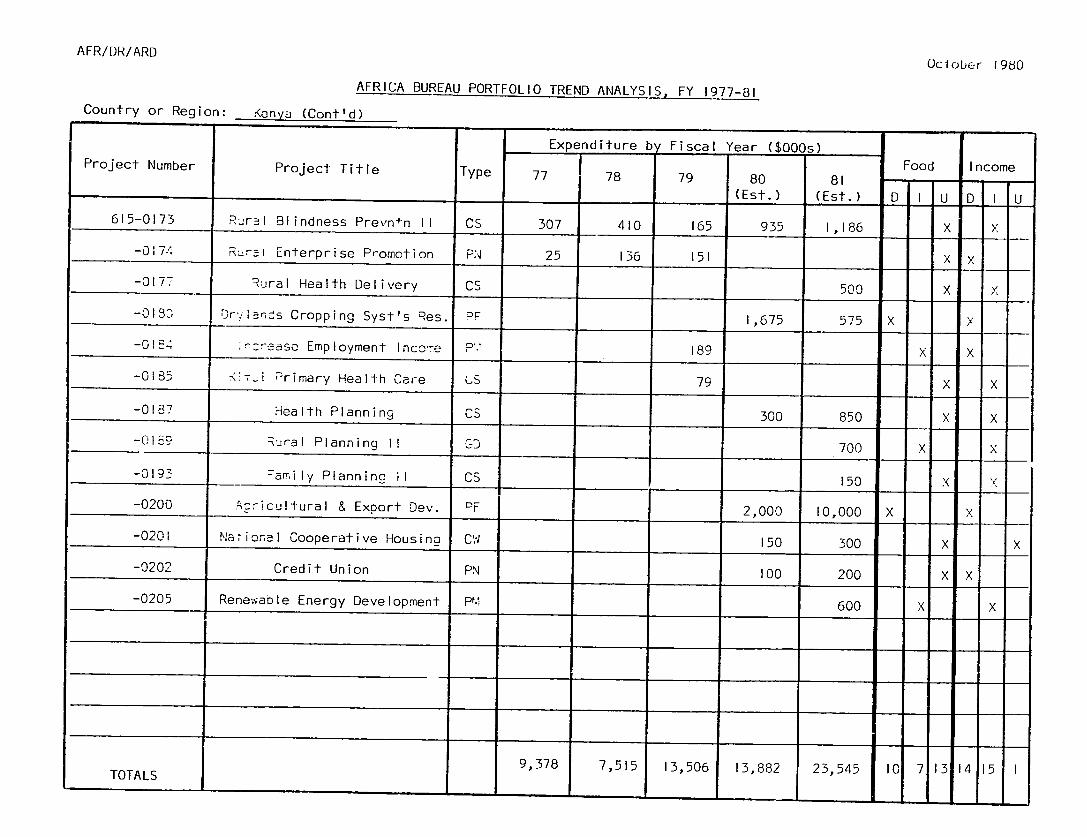
AFR/DR/ARD
October 1980
AFRICA BUREAU PORTFOLIO TREND ANALYSIS, FY 1977-81
Country or Region: Kenya (Cont'd)
Expenditure by Fiscal Year ($O00s) Project Number Project Title Type 77 78 79 80 81 FoodF IncomeIncome
(Est.) (Est.) D I U D I U
615-0173 Rural Blindness Prevn+n II CS 307 410 165 935 1,186 X X
-0174 RuraI Enterprise Promotion PN 25 136 151 X X
-0177 Rural Health Delivery CS 500 X X Ir181 'a s Cropping Syst's Res.
ur , P, .. 1,675 575 XX
x
-0164 :rease Employment Incore 1.89 X X
-015 Ki-Ti primary Health Care uS 79 X X
-0187 Health Planning CS 300 850 X X
-0189 Rural Planninq II rD 700 X X
-0197 Zamily Planning il CS 150 X X
-0200 !Azricultural & Export Dev. CF 2,000 10,000 X X
-0201 NaTional Cooperative Housing CW 150 300 X X
-0202 Credit Union PN 100 200 X X
-0205 Renewable Energy Development PM 600 X X
9,378 7,515 13,506 13,882 23,545 10 7 13 14 15 1 TOTALS

AFR/I)R/ARD OtLer 1980
AFRICA BUREAU PORTFOLIO TREND ANALYSIS, FY 1977-81 Country or Region: Uganda
Expenditure by Fiscal Year ($O00s)Project Number Project Title Type 77 78 79 80 81 Food Income
(Est.) (Est.) D I U D I 617-0102 hood Production Support PF
4,000 X -
-0105 nzriulture Reh-anilitation PF 1_000 X X -0107 'anpower Development GD 5C5 C X
TOTALS 1 5,500 2 1 0 2 0
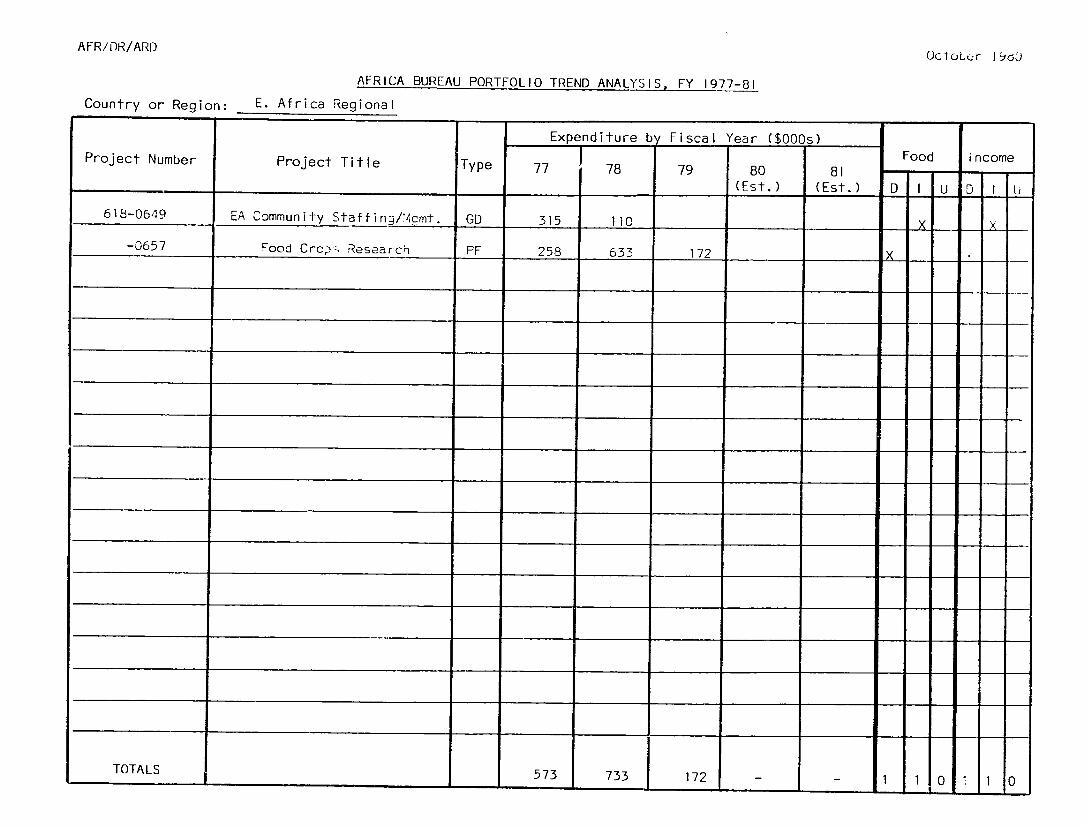
AFR/DR/ARD OcloLur 19di
Country or Region:
AFRICA BUREAU PORTFOLIO TREND ANALYSIS. FY
E. Africa Regional
1977-81
Project Number Project Title Type
Expenditure b 77 78
Fiscal Year ($O00s) 79 80 81 Food income
I (Est.) (Est.) D I U D I
618-0649 EA Community Staffing*/Icmt. GD 315 110 XX
-0657 rood Crcp Research PF 258 633 172 -
TOTALS 573 733 172 1 1 0 1 0

AFR/DR/ARD IbUot II;J )
AFRICA BUREAU PORTFOLIO TREND ANALYSIS, FY 1977-81 Country or Region: 'iigeria
Project Number Project Title Type Expenditure by
77 78 Fiscal Year ($O00s) 79 80 81 Food Income
.(Est.) (Est.) D I U D I U
620-0739 Fa-ily Health Training CS 184 134 1 X X -0792 Advance Professional Studies CS 96 9 X X
-0798 Food Crop Production PF 474 37 X x -0817 let Fdcility PF 558 8 X X
-0818 -rogram Grant GD 803 432 X ".V
TOTALS 1,312 991 433 - 2 1 2 2 3 0

AFR/DR/ARU uclober
AFRICA BUREAU PORTFOLIO TREND ANALYSIS, FY 1977-81
Country or Region: Tanzania
Expenditure b Fiscal Year ($O00s)
Project Number Project Title Type 77 78 79 80 81 Food Inc
_(Est.) (Est.) D I U D
621-0092 Seed Multiplication & Dist'n PF 553 803 1,111 1,783 599 X X
-0093 '.asai Livestock & Range Mar-±. PF 613 713 588 X X
-0099 .nricuiture "arketinq Dev. PF 271 116 87 X
-0107 Acriculture Research PF 371 916 583 2,481 2,685 X
-0117 Agricultural Credit PF 2,133 333 X X
-0119 '-riculture Vanpower Dev. PF 926 1,075 689 X
-0121 Traininc for '.'CH Aides CS 899 2,250 !,157 1,624 806 X
-0122 Livestock M.'arketing & Dev. PF 548 567 655 X X
-0123 Dwsaster Relief Assistance CW 22 9 X
-0128 Disaster Relief Assistance CW 423 814 374 X
-0129 Dairy Production Assistance PF 326 366 142 X X
-0135 Agriculture Educ. & ExT. PF 568 807 X X
-0133 District Villace Health CS 66 67 X
-0139 Vocatnlztn of Primary Schools CS 28 96 X '
-0142 Agriculture Projects Support PF 502 125 X X
-0143 Reg'l Planning/Village Dev. GD 1,204 3,665 8,452 X
-0147 Cancer Control CS 158 159 X
TOTALS

AFR/DR/ARJ Oc :L-r 19 0
AFRICA BLJPEAU PORTFOLIO TREND ANALYSIS, FY 1977-81
Country or Region: Tanzania (Cont'd)
Expenditure by Fiscal Yea, ($000s)
Project Number Project Title Type 77 78 79 80 81 Food Income
(Est.) (Est.) D I U D I
621-0149 Training for Rural Developren. GD 2,480 3,384 X
-0150 Z-uc. for Health Workers CS 900 X X
-:155 .illage Production & Inco-e PF 90 4,730 X
-i56 %arming Systems Research PF 1,000 X
-!57 -ealth Workers Training CS 1,830 X
-'i63 .llage Envir. Improvement PM 248 X X
- 161 -rnz. for Rural Developnent I GD 1,103 X X
-:;65 -ealth Envir. Vonitorinc CS 540 X X
5,482 10,207 7,146 12,691 27,084 12 4 9 2 II 2 TOTALS

AFI?/ {)/AHI Ucl0.IUt r
AFRICA BURFAU PORTFOLIO TREND ANALYSIS, FY 1977-81
Country or Region: Sacl Reqional
Expenditure b Fiscal Year ($O00s)
Project Number Project Title Type 77 78 79 80 81 Food Ir--e
(Est.) (Est.) D I U 0 L
625-0009 Trnc for Inland Fisheries PF 300 X X
-0010 LCB Lvs-k & '.iixed Acric. PF 400 X X
-0012 :a.bia River Basin Dev. PF 30 100 X -0013 zahel :erTilizer Dev. P200 X
-0161 zrin Prcjction F. "ktg. 412 63 207 200 x
-0172 _37e-Accra Teleco-m's TC X
-0305 '.frica Cereals PF 57 Ij-'aJor X
-0501 _aze Cna4 Teleco-'s TC 101 -48 55B x
-0506 5:Dort to Rec'l Sr.aniz's CD 95 84 7I 80 144 X
-0510 1e'lPublic Health Trng. CS 46 9 X
-0523 .Arica -'eat 4arketinc PF 6 X X
-0530 a, Adv. School of Agric. PF 107 38 3 X X
-0531 n Center for Health Sci. CS 425 403 1,!49 X
-0534 Lake Chad II Roads Link TC 819 731 X
-0605 O.VS Acronomic Research II PF 450 873 1,258 X X
-0610 Central Vet Lab PF 138 332 437 X X
-0614 !ali Highway Developrment TC 25 1,249 163 X
TOTALS

Au,'.o r IFRR
AFRICA BUREAU PORTFOLIO TREND ANALYSIS, FY 1977-81
Country or Region: Sahel (t'd)
Expenditure b Fiscal Year ($O00s)
Project Number Project Title Type 77 78 79 80 81 F Income __ _ __ _ __ _ _ _ ___ __ _ _ (Esi.) (Est.) D I U D I Li
£5-0616 OVVS AgrRr:"-K Research PF 520 __- 20 X X
-0617 O!VS Env\-. ssess ent P; 471 , 1,262 480 52 X X
-0618 Study of *-'a- -eri-eter PF 166 X /
-,6.0 0,VS Data -s"It. De'.. P:.I 4,200 2,100 /
O'rVS !re:-ee Dev. PF 600 X
- ,714Parakou-'aaA,!Ie Road TC 3,665 33 X V
-3715 Investment :eit 7acility PN 3,046 1,267 2,560 X
-0716 Bridqe & Pc-- -nstr-ction TC 160 3785 X
-3717 African : ses !--I PN 109 32E 277 620 750
-3803 CA Lvsik S .'ea- Vkto. PF 75 52 112 X
-3588 Cotonou Bri :e & Dar- TC 4,104 i,725 2,867 X
-0904 Health Del;.ery Systems CS 371 X
-0905 T-. for Prcoec esi=/,...rtt GD 614 53 X
-0907 Studies--Sahe ':!.dano Zone GD 1,792 573 227 X X
-0909 Support to Int'! Organiz's GD 779 1,466 284 X X
-0911 Aid Coordination & Planning GD 390 1,510 1,112 1,500 2,000 X X
-0915 River Basin 2e.. & Planning GD 5 16 27 X X
TOTALS

AFR/DR/ARD Oclober IUJ
AFRICA BURFAU PORTFOLIO TREND ANALYSIS, FY 1977-81
Country or Region: Sahel (C nt'd)
Expenditure by Fiscal Year ($O00s) fFooo IInc
Project Number Project Title Type 77 78 79 80 81 Food I- - -
_(Esi.) i(Est.) D I U .D I U
625-0916 Sahel FooA Cr: Protection PF 670 920 1,387 X I
-,'917 .ater Data Ncz...ork & Dev. P7.1 314 637 2,202 1,896 D3 X X
0926 -rican Devel:°.ent Pro:ram GD 2,767 2,7'5 588 X X
092 7 Demographic Data CS 400 flO K
-3926 :'I Food Crc: otection PF 24 2,900 =,2 X X
-arnning, ManaReeent & es. GD 2, 3,226 X X
-3930 Instit. Bldg./Socio-Econ. Dev GD 200 500 X,0 XA
Sahel GD i00 X X
-2936 Sahel Manpe ),-- Dev. GD 181 1,400 2,:0 X
-0937 Accelerated !r:act Progra GD 1,000 l,229 X X
-0939 Improved Rural Technology PM 50 60 X X
-0940 Water Data Network & 11rgt.II PM 2 X X
-0942 Envir. Trng. :.igmt. PM 10 55 X
-0980 Reg'l Roads Maint. Trng. Cntr. TC 130 X X
-9801 Human Rights Fund for Africa CW 70 10 X
21,382 20,141 20,449 16,439 20,349 18 25 6 21 27
TOTALS

AFR/DR. AND Oclober 1,-
AFRICA BUREAU PORTFOLIO TREND ANALYSIS, FY 1977-81
Country or Region: ADO-Niamey
Project Number Project Title Type
Expenditure b
77 78
Fiscal
79
Year ($O00s)
80 81
(Est.) (Est.)
-ood
I U
Income
D I
-D203 Entente Food Production PF 244 855 5,76-, 3,900 4,300 X
-0204 Entente Lvstk. Production I PF 342 1,479 I,i00 1,600 X
244 1,197 7,247 5,000 5,900 2 0 0 2 0 CTOTALSL

;.I b . -. .), -
AFRICA BUREAU PORTFOLIO TREND ANALYSIS, FY 1971-81
Country or Region: ADO.-Dkar
Project Number Project Title Type
Expenditure b
77 78
Fiscal Year ($O00s)
79 80 81
(Est.) (Est.)
F
D I U
Ir--e
D _ U
__2_-__20 O-IVS Dat & !rs-;-. Dev. p~v 3,037 X
- - 3,037 - 1 0 0TOTALS

AFR/DHiARD Oclcber WD;O
AFRICA BUREAU PORTFOLIO TREND ANALYSIS, FY 1977-81
Country or Region:
Project Number
Cameroon
Project Title Type
Expenditure b
77 78
Fiscal
79
Year ($O00s)
80 81
(Est.) (Est.)
Food
D I U
Income
D I
631-0001
-0002
-3003
Seed i.'ultiplication
Trainin: for Farm Far ilies
Low Inoe Housin:
PF
PF
CW
234
55
387
37
:22
194
309
151
232 165 X
X X
X
X
-0004 Livestock A3ricultire Dev. 1rI 161 1,702 I* X '
-3307 Social Science Res. & Trno. GD 31 429 254 X X
-008 Agriculture '.mt.& Planning PF 40D 1,200 XV
-0009 Traininc in Health Education CS 2 64 297 X X
-0010
-C011
-3012
Pilot Community Develo2ment
Trans-Ca-eroon Railroad III
Mandara .*tns Water Resources
GD
TC
PM
34 132
4,717
300 2,000
X
X
X
x
X
X
-0013
-3315
Cereals Research & Extension
Livestock & Poultry Dev.
PF
PF
349
190
1,367
464
X
X
X
X
-0016
-0022
.:ical System for Cameroon
Small Farmer Fish Production
CS
PF 40
2,000
425 X
X
X
X
-0024
-0025
-0031
Food Crop Protection
Margui-Wandala Water Supply
Hiaher Education for Dev.
PF
CS
CS
210
480
422
230
600
X
X
X
X
X
X
TOTALS

AFR/DR/AkD Uc oL
AFRICA BUREAU PORTFOLIO TREND ANALYSIS, FY 1977-81
Country or Region: Cameroon (ConT':;
Project Number Project Tille Type
Expenditure b
77 78
Fiscal
79
Year ($000s)
80 81
(Est.) (Est.)
FoodF
D II U
vy)e- -
Z I
-
U
631-0033 Support to Primar. Education CS 22S X
-0041 7ari Iv -e= ', CS 860 X
-0044 Cre Vt -:nio S-e.,e'o.ment PM 221 X
-0045 Householz Exrerz'--re Survey GD 50 I,'0 X X
-0201 Rural healtt :-c_-;ion CS 6 56 X
377 1,068 5,992 4,382 12,898 9 5 8 1c 2
TOTALS -

AFR/DR/ARD Oclober 1ldU
AFRICA BUREAU PORTFOLIO TREND ANALYSIS, FY 1977-81
Country or Region: Lesotho
Project Number Project Title Type
Expenditure b
77 78
Fiscal Year ($000s)
79 80 81
(Est.) (Est.) D I U
1Income
D I U
632-0030
-;031
SA . ev. Personnel
That Bosiu Rural
& Training
Development
_D
_
232
699
326
496
14
2X
X X
-0043 anc & Water Resource Dev. P.! 467 673 51? 281 310 X X
-0053 Rural -ealth Development CS 305 623 612 X X
-._-1 'nstr..at's Resource Cntr. CS 27 '97 1,106 8X4 X
-0064 Aric.iTure Sector Analysis PF 204 X
-0065
-0366
-369
-0076
-308C0
-arrlng Systems Research
\utri + Plannnc ? Research
an:o.er Development & Trng.
Lesotho Roads
Nat'I -niversitv of Lesotho
S
;D
T9
C
76 189
60
267
05
326
30
275
1,497
1,955
215
1,810
3,379
75
X
X
X
X
X
X
-0088
-0089
-0209
-0210
-0214
-urai.ater & Sanitation
Low, .ncome Shelter
Cotta.e 'ohair industry
Commodity Warehousing
Credit Union Development
nS
CW
.4
C!
PIM
152 41
138
78
333
313
80
3,620
34
205
X
X
X
X
X
X
V
"
X
X
-0215 Land Conservation/Range Dev. PF 2,189 X
TOTALS
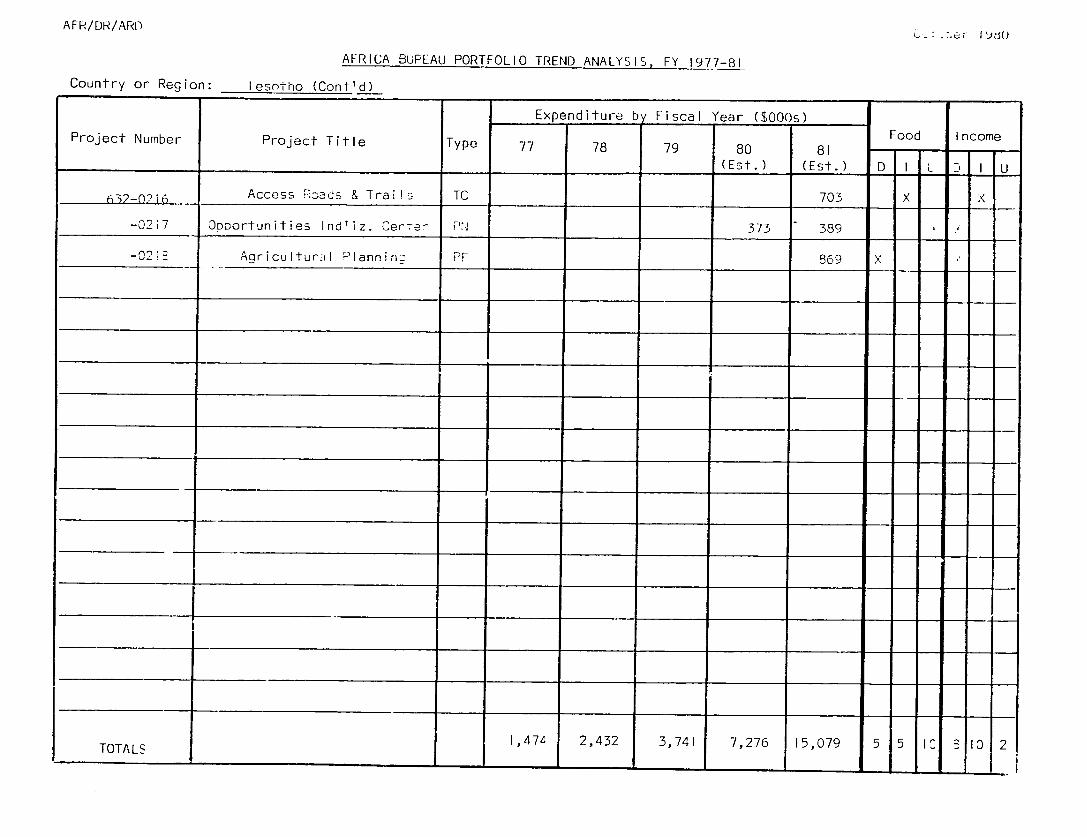
AFR/DR/ARIP I (
Country or Region:
AFRICA BUPEAU PORTFOLIO TREND ANALYSIS, FY
Lesotho (Cont'd)
1977-81
Project Number Project Title Type
Expenditure b
77 78
Fiscal
79
Year ($O00s)
80 81
(Est.) (Est.)
Food
D I L
Income
I U
632-02i6 Access Rzads & Trails TC 703 X X
-02i7 Opportunities Ind'iz. CerTe- PN 373 389
-02) Agricultur-il Plannin PF 869 X
TOTALS 1,474 2,432 3,741 7,276 15,079 5 5 IC 0 2TOTALS
- - - -I

AFR/DR/ARD October 1)60
AFRICA BUREAU PORTFOLIO TREND ANALYSIS 2 FY 1977-81
Country -r Region: Botswana
Project Number Project Title Type
Expenditure by Fiscal
78 79
77
Year ($O00s)
80 81
(Est.) (Est.) D
Food
I U
Income
D I U
633-0015 Ranme :'anaqement/Lvstk. Dev. PF 40 61 225 690 609 X
-0030
-0032
-0041
-0056
-0059
-0067
SA Dev. Personnel & Training
ly Planning
J3o.Zam Road
Crop Production & Marketinz
Rural ManDower Development
Agricultural Planning
GD
CS
TC
PF
CD
PF
272
415
10
75
415
193
317
420
286
175
125
201
50
490
1,165
200
9P_X
426
.24
lV6
X
X
X
X
X
X
X
X
x
X
-0069
-0072
-0073
-0074
-0077
-0078
-0084
-0092
-0095
-0102
;anporevelo-ment & Trn.
BotZa- Road Desihn
Transport Sector Support I
Agric. College Expansion
Rural Development Sector Grant
-jlth Services Development
Environmental Sanitation
Self-Help Housing Development
National Migration Study
Fund for Student Refugees
.D
TC
TC
PF
GD
CS
CS
CW
GD
CS
165
69
2,000
II
70
II
51
610
540
1-1
],226
3,027
250
1,000
90
405
400
2,400
,4
2:6
1,050
2,.790
1,600
1,400
180
270
120
990
X
X
X
X
X
X
X
X
X
X
Y
X
X
X
X
X
X
X
X
X
TOTALS

AFR/DR/ARD October 1980
AFRICA BUREAU PORTFOLIO TREND ANALYSIS, FY 1977-81
Country or Region: -Lseana (Cont'd)
Expenditure b Fiscal Year ($000s)
Project Number Project Title Type 77 78 79 80 81 Food Income
(Est.) (Est.) D I U D I U
633-0209 Rene,.'ale.Eer~y Technology P1 I00 850 X X
12 Rural EntorDr;se Ext. Svc. PF 98 200 201 X
-025 k-rtiou e Extension PF 180 10,
-2230 '. bator PF 200 X
-023 cri.trl Res:-ach PF 300 Y
-0222 Education -'. Ir-Drove-ent CS 400 X
812 3,220 2,082 14,895 14,437 9 7 7 9 2 2 TOTALS

AFR/DR/ARD Octobe- M O80
Country or Region: Ca'-bia
AFRICA BUREAU PORTFOLIO TREND ANALYSIS, FY 1977-81
Project Number Project Title lype
Expenditure b
77 78
Fiscal
79
Year ($000s)
80 81
(Est.) (Esi.)
Food
D I U
Income
D ! U
635-0202 Soi I/Wa-er Resource '.gmnt. P., I 316 500 800 .
-0203
-0204
'.lixed Farmir: & Resource "c'-.
ral De. :..ent Proqra,
PF 1,500 1,500
300
X
X
-0205 3a"_:: -e-orestatior Pl 300 500 X
-0200
-0208
:jrai %oa:s "aint. Syste"-s
Coopera=- ,es DevelopmenT
TC
PF
,300
53
2,000
350 X
X
-0215 Trainin: -Dr ,:evel...ent !D 200 X
TOTALS II 316 3,350 5,650 3 4 0 3

AFR/DR/ARD October'Q
AFRICA BUREAU PORTFOLIO TREND ANALYSIS, FY 1977-81
Country or Region: i:-na Leone
Project Number Froject Title lype
Expendilure by
77 78
Fiscal Year ($000s)
79 80 81 Food Inco-e
(Est.) (Est.) D I U D
636-0101 Rra -cvetration Roads TC 500 x
-0102
-010
0077-s Zrops Res. & Ext.
incr-e " > o.efor Dev.
__ 75
33
1,955 2,000
206
X X
-0111 >.ra! Keration Roads 1 T 1,257 1,267 1,407 x
-0112
-0113 00
ve-'.:e Credit Societ,,
7sc.: struction &. Maint. TC
2 200
500 X
-0126 me-s-ration Roads TV 125 x
-0160 :0rT's - 'iz. Center Int'l 57e 309 X X
125 1,763 1,375 4,467 3,215 2 5 ITOTALS --- 3 I

AFR/DR/ARD .:7otOer 1980
AFRICA BUREAU PORTFOLIO TREND ANALYSIS, FY 1977-81
Country or Region: Ghana
Expenditure by Fiscal Year ($000s) Project Number Projeci Title Type 77 78 79 80 81 Foc Income
I (Est.) (Est.) D I D I U
641-0000 -ro:ram Development Svcs. 2
-0055 Rral Health Family Planninp CS 1,023 5: 54z 354 200 X
-00b2 ::nomic Devel:r-ent "Cr-T. D 153 3 V
-0063 '::ortuni-ies ndustrial'z'n P' 70
-C06- =-: lation Procram SucDnc-- CS 530 2-0 235 300 300
-0067 "tIlDAS" 613 1,394 , 668 2,253 X
-0066 "zmt. of Rural Health Scvs. CS 399 6;I 186 83 X
-0069 7e'. App!ic's of Science 94 27 89 X -0070 A:P-iulture '.anacement 20
281 207 175 I^, X\
-0072 Farmers Assoc's/Agribus. Dev. 282 1,065 590 560 X K
-0073 DisTrict Planning/Rural Dev. 07 3 4 i46 130 650
-0074 Agric. Rehab. & Health Prorrtn =F 108 57 6X
-0075 .,,omen In Development GD 2 15 X
-0077 Economic/Rural Dev. Mgrt. Dc 76 632 324 600 600 X X
-0082 Deliv. of Rural Health Svcs. CS 100 X
-0083 Women in Ghanaian Development GD 84 185 107 101 xX
-0084 ADDlic's of Intermed. Tech. P 160 1,300 X
TOTALS

Al-/11H/ARD October
Country or Region:
AFRICA E:-JEAU PORTFOLIO TREND ANALYSIS, FY
Ghana (Cont'L)
1977-81
Project Number Project Title Type
Expenditure b
77 78
Fiscal
79
Year ($O00s)
80 81
(Est.) (Est.)
FoodF
D I U
no=In =
D I
641-0087 Programs in Pop. Dyra" : CS 141 89 233 137 X
-;088 Cormunity Health Teams SCS _200 200 X
-0093 "aI Scale Ind'I Aci. -" P.____ 50 X
-C39 Cc-munit,,, Dev. Staff - GD 277 120 X
-0101
ion. Planning & Rjral ..
Q) rt's Ind'iz. CenTer..
CS
PN
100
225
X
X X
-3102
-01C3
"MIDAS II"
-armers Assoc's/AcS.= -..
PF
PF
75 3,750
100
X
X
X
X
-0105 Increased Revenue -or . GD 50 X
TOTALS 3,438 4,465 9,520 4,688 10,863 7 10 9 9 1

AFR/DR/ARD October IBO
AFRICA BUREAU PORTFOLIO TREND ANALYSIS, FY 1977-81
Country or Region: Mauritius
Project Number Project Title lype
Expenditure by
77 78
Fiscal Year ($O00s)
79 80 81
(Est.) (Est.)
Food
D I U
Income
D I U
642-0002 Housing TA Grant CW 355 X
TOTALS - 355 0 0 1 0 1.
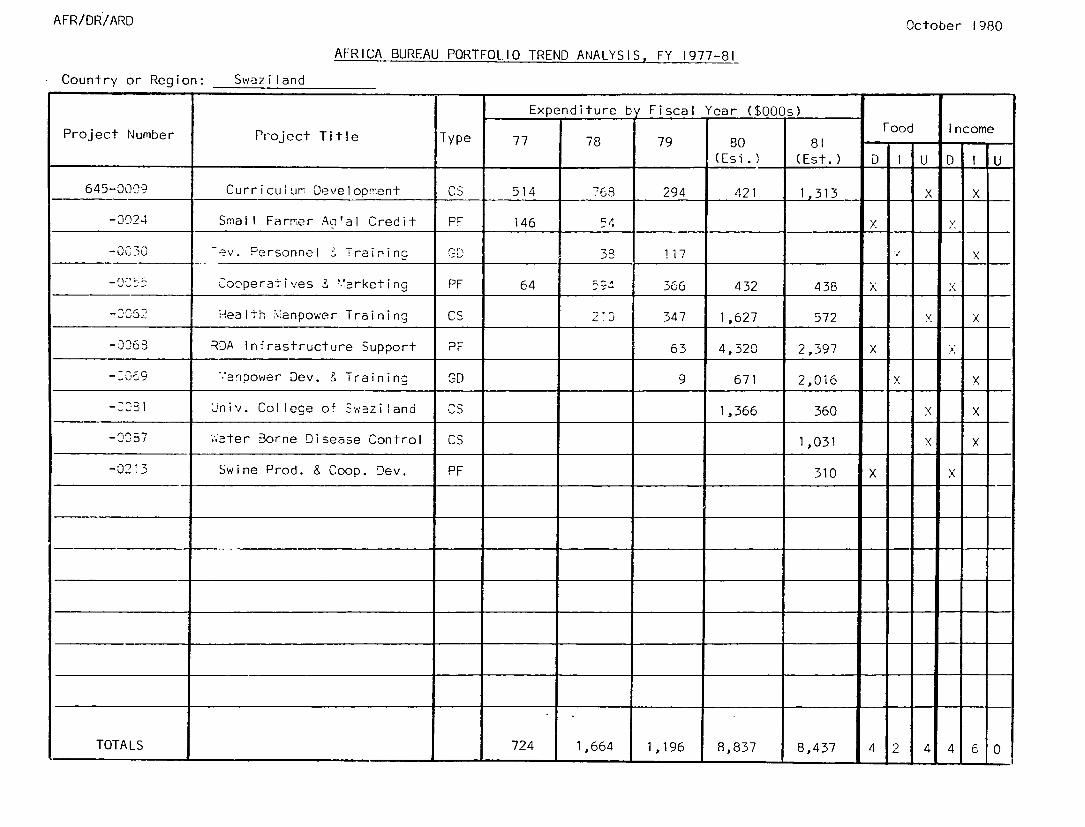
AFR/DR/ARD October 1980
AFRICA BUREAU PORTFOLIO TREND ANALYSIS, FY 1977-81
Country or Region: Swaziland
Expenditure b Fiscal Year ($O00s) Food Income
Project Number Project Title Type 77 78 79 80 81 F income
(Est.) (Est.) D I U D I U
645-0009 Curriculum Development CS 514 768 294 421 1,31 X X
-0024 Small Farmer Aa'al Credit PF 146 54 X X
-0070 ev. Personnel Training GD 3R 117 .' X -025 Cooperatives Z -.larketing PF 64 432 438 X X366
-752 Health Viianpower Training CS 2 347 1,627 572 Y X
-036 RDA Infrastructure Support PF 63 4,320 2,397 X
-anpower Dev. & Training GD 9 671 2,016 X X
-51 Jniv. College of Swaziland CS 1,366 360 X X
-00.7 Water Borne Disease Control CS 1,031 X X
02 Swine Prod. & Coop. Dev. PF 310 X X
TOTALS 724 1,664 1,196 8,837 8,437 4 2 4 4 6 0

AFR/DR/ARD Octobe- 1980
AFRICA BUREAU PORTFOLIO TREND ANALYSIS, FY 1977-81
Country or Region: Somalia
Project Number Project Title Type
Expenditure by Fiscal
77 78 79
649_01_
Year ($000s)
80 81
(Est.) (Est.)
Food
D I U
-come
I U
649-0131
-0.32
Ag. Ext. Training
Rural Health
. -esearch
eK"er
PF
CS
23 3,027
2,500
2,000
3,000
X
X
-010"
-014
Kutunwaare e - e-ent
Comp. Groundwae-r :ev.
CW
P2
42 1,240
2,200
818
2,200 X
X X
-2112
-0113
Central Rangelands e.'!cpment
Acricultural Deliver. S-.stems
Bay Region Deve::-:-en+
PF
PF
PF
1,904
645
3,200
1,861
1,500
X
X
X
TOTALS 65 11,516 14,579 4 1 2 4 I

AFR/DR/ARD Octcs:er Il
AFRICA BUREAU PORTFOLIO TREND ANALYSIS, FY 1977-81
Country or Region: Sudan
Project Number Project Title Type
Expenditure by Fiscal
77 78 79
Year ($000s)
80 81 Food F -
IncomeI- -
(Est.) (Est.) D I U D I
650-0010 Extension Educ. & Trainina CS 189 120 25 _ X
-0011 "crthern Primary Health Care CS 711 _._ _
-0018 >_e Nile AQricultural Dev. PF 2 1 3,092 2,962 X
-0019 '--ern Primary Health Care CS 30C 2,650 620 .,
-0020 esern Sudan Ac'al Research PF 4,800 6,000 X
-0021 zi.Teern Manpower Development PF 74 7,700 2,500 X
-0025 :::el Intearated Rural Dev. PF 40 44- X
-3026 .,ai Halfa Commrunitv Dev. PF 479 19 X
-0028 Literacy Traininc CS 683 717 _. X
-0030 riealth Sector Support CS 3,215 X1 y
-0031 Southern Rural Infrastructure TC 350 2,378 X A
-0035 Yar-io Agricultural Research PF 400 400 X
-0036 Southern Access Road TC 2,000 -X X
-0038 Commodity Import Program PM 19,600 15,000 -X- X
-0039 Petroleum Training PM 124 76 X X
-0040 Comcdity Import Program II PM 15,000 X X
-0041 Alternative Energy Dev. PM 680 X X
TOTALS

AFR/DR/ARD October Ki
Country or Region:
AFRICA BUREAU PORTFOLIO TREND ANALYSIS, FY 1977-81
S~dan "S-ent'd)
Project Number Project Title Type
Expenditure b
77 78
Fiscal Year ($000s)
79 80 81
(Est.) (Est.)
F
D I U
Inc'-
D J
650-0045 F-ral Reforestation PM 150 347 _X
-0100 Z.an-TRahad Project PF 647 677 X X
-0103 Acric. "'atural Resources PA 35 75 X
TOTALS 682 792 2,025 35,148 51,939 7 8 5 7 13

AFR/DR/ARD October 1980
AFRICA BUREAU PORTFOLIO TREND ANALYSIS, FY 1977-81
Country or Region: Caae Verde
Expenditure by Fiscal Year ($O00s) Food Income
Project Number Project Title Type 77 78 79 80 81 F Income
(Est.) (Est.) D I U D I U
655-0001 Rural Works CW 571 911 849 X X
-0003 Tarrafal Water Rescurces HM 417 1,777 X X
-0004 Mincelo Desalinization CS 8 527 1 X X
-0005 Sal Cesaliniz./Power Plant PM 100 900 X X
-0006 ;'.atershed Xrgmt./Soi I Conserv. PM 500 1,500 X X
-0008 rrimary & %onformal Education CS 50 800 X X
TOTALS 579 1,855 2,777 1,300 2,400 0 3 3 1 5

AFR/DR/ARD October 1980
AFRICA BUREAU PORTFOLIO TREND ANALYSIS, FY 1977-81
Country or Region: "ozErbique
Project Number Project Title Type
Expenditure b
77 78
Fiscal
79
Year ($O00s)
80 81 (Est.) (Est.)
Food
D I U
Income
D I U
656-0001 Pefu;ee Assistance CW 605 10 X X
-0201 Acriculture Sector Program PF 3,000 X X
-0202 A:7Kc":+re Production & Mktg. PF 4.000 X X
TOTALS 605 10 7,000 2 0 1 2 C

AF/DR/ARD October 1980
AFRICA BUREAU PORTFOLIO TREND ANALYSIS, FY 1977-81
Country or Region: Guir.ea Bissau
Project Number Project Title Type
Expenditure b
77 78
Fiscal
79
Year ($000s)
80 81 oD I nc m
(Esi.) (Est.) D I U D I U
657-0002 Acricjlure Development rFIr 309 382 850 703 X X
-0003 Primr-. Teacner Trainina CS 22 223 400 930 X X
-0 05 Forestry -ana.-emert P., 250 X X
-2166cle S'1 isheries 180 200 X X
-07 Fooc ?oD rotection PF 73 200 430 X X
-035 Selected 3ev. Training GD 300 X X
-R339 'ce Production PF 90 500 X X
TOTALS 331 678 1,720 3,250 4 2 1 4 3

AFR/DR/ARD October 1980
AFRICA BUREAU PORTFOLIO TREND ANALYSIS, FY 1977-81
Country or Region: Sao Tor'e & Princi:e
Project Number Project Title Type
Expenditure b
77 78
Fiscal Year ($000s)
79 80 81 Food Income
658-0001 Crop Prod. & Diversizication FF 132
(Esi.) (Est.) D
X
I U D
X
I LI
TOTALS 132 1 0 0 1 0 C

AFR/DR/APD
October 1980 AFRICA BUCEAU PORTFOLIO TREND ANALYSIS, FY 1977-81
Country or Region: Zaire
Project Number Project Title Type
Expenditure by Fiscal 77 78 79
Year ($O00s)
80 81
660-3032
-X049
-353
-C52
Transport Sector
MUH/Family Plannin:
Planning & Management
Agriculture Economic ge..
TC
CS
P:s.PF
F
1,447
236
163
168
116
37
50
530
12
523
(Est.) (Est.) D
X
X
I
X
U
X
D I
X
x
U
-
-I354
-N
-F5
Inland Waterways
utrition Planning
Fishing Cooperative Ex:--=:-
TC
CS
=F
7
37
60
156
21
12
545
x
X
X
x
A
X
Health Systems Develo,-e-- CS 25 '21 702 261 X x
-0059
-. ",,-62
-'D64
-0067
-0068
-0070
-0071
-0075
j
F
E & C Disease Contrc!
North Shaba Rural DeveloDMe-7
Feasibility Study
INERA Support
Basic Family Health Service5
Development Manpower Train>;:
Agriculture Sector Study
ERTS
Agricultural Tools Producti±H
CS
PF
GD
PF
CS
PF
PF
GD
PF
98
123
31
207
1,460
43
z07
2,716
51
11
235
40
55
1,350
200
300
805
1,234
533
500
700
X
X
X
X
X
X
X
X
X
X
X
X
X
X
X
X
X
TOTALS
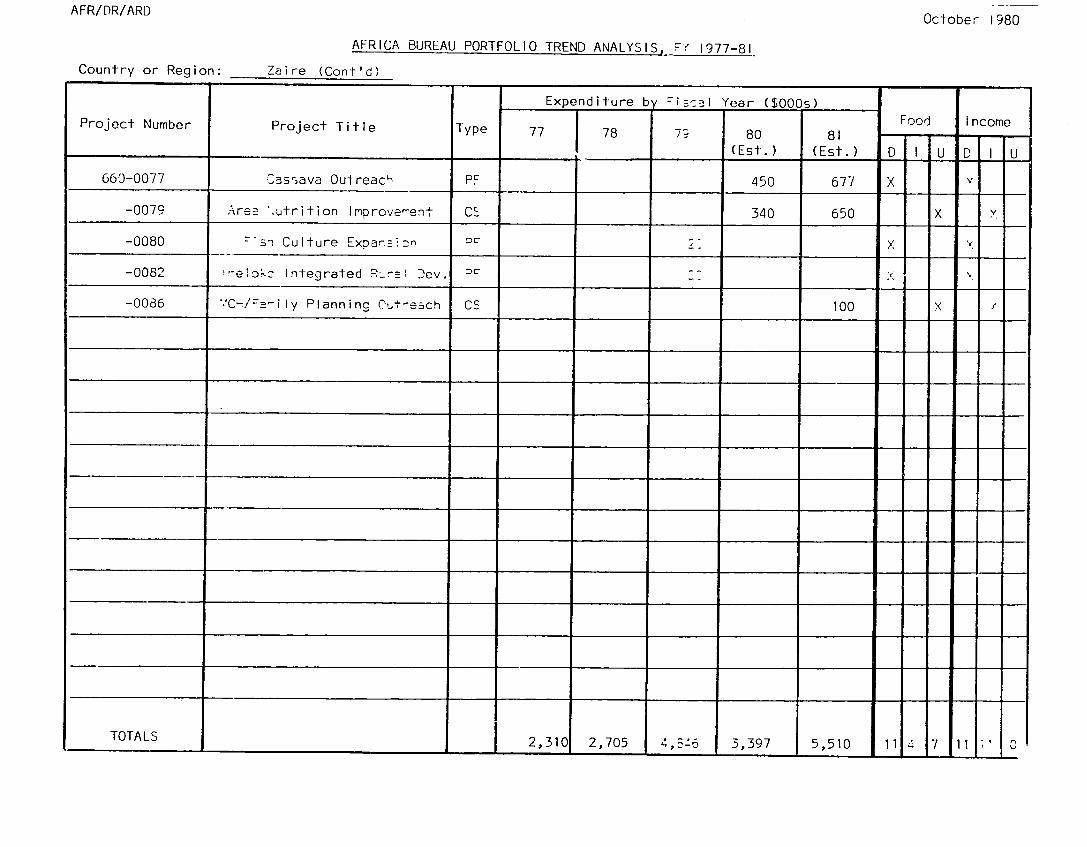
AFR/DR/ARD October 1980
AFRICA BUREAU PORTFOLIO TREND ANALYSIS, Pf 1977-81
Country or Region: Zaire (Cont'd)
Expenditure b 7iscal Year ($000s)
Project Number Project Title Type 77 78 7; 80 81 Food Income
(Est.) (Est.) D I U D I U
660-0077 Cassava Outreach PF 450 677 X
-0079 Area '.utrition Improve-ent CS 340 650 X X
-0080 s- Culture Expar zTn x
-0082 !!-e okc Integrated - Dev.
-0086 ".'C i/za~ly Planninc 0,t-each CS 100 X
TOTALS 2,310 2,705 4,S-6 3,397 5,510 11 4 7 11 W 0

AFR/DR/ARD Oct.: - 1980
AFRICA BUREAU PORTFOLIO TREND ANALYSIS, FY 1977-81
Country or Region: Ethiopia
Expenditure b Fiscal Year ($O00s)
Project Number Project Title Type 77 78 79 80 81 Food !ncome
(Est.) (Est.) 0 I U I U
663-0000 Technical Support CW 2 X X
-0006 Malaria Control CS 4,402 694 210 X X
-0138 University General Support CS 316 24 44 X X
-0153 Feasibility Studies GD 15 X
-0162 Ada District Development PF 66 3 X
-0166 Pulse Diversific. & Improve. PF 250 145 89 X
-0167 Rural Agricultural Development PF 149 109 1 X
-0172 Acriculture Sector Planning PF 38 X
-0179 Jpper Didessa Development PF 269 X
-0180 Integ. Family Life Educatior CS 60 11 X X
-0187 Drought Recovery & Rehab. TC 155 956 781 X X
-0210 Southern Genu-Gofa Rehab. I GD 181 15 X X
-0211 Int'l Disaster Seminar CW 10 X X
-0213 Integrated Family Life II CS 78 65 X X
-0214 Micro-Regional Rural Dev. PF 581 X __
-0215 Inland Transportation TC 1,350 X X
-0219 Emergency Transportation Fund TC 100 X X
TOTALS

AFR/DR/ARD October 1980
AFRICA BUREAU PORTFOLIO TREND ANALYSIS, FY 1977-81
Country or Region: Ethiopia (Cont'd)
Project Number Project Title Type
Expenditure b
77 78
Fiscal Year ($000s)
79 80 81
(Est.) (Est.)
Food
F -ncome
D I U
Income
D I U
663-0220 Seed/Oxen/fool Replacemnt Fnd. PF 50 X "
-0223 Emergency Drought Area Comm. TC 50 X X
-0229 7th Day Ade-tis+ Project CW I X
-0230 Emergen.',, ReIief CW 400 X X
-0231 Desert Lccst Control PF 159 X
TOTALS 5,461 3,701 2,667 9 7 3 9 9

AFR/DR/ARD October --
AFRICA BUREAU PORTFOLIO TREND ANALYSIS, FY 1977-81
Country or Region: Liberia
Project Number Project Title Type
Expenditure b
77 78
Fiscal
79
Year ($O00s)
80 81 Fcod Inco
(Est.) (Est.) D I U D I
669-0054
-0107
National Medical Center
Airport Improvement
CS
TC
565
673
_
Ro . .
-0111 Telecommunications Expansion TC 3,253 2,212 1,016 _"
-0116
-0117
Rural Access Roads II
Hilhway ain~enance Equipment
TC
TC
425
42
500 1,005 X ,
-0122 Institute of Public Admin. GD 556 585 78
-0123
-0124
Agriculture Program Dev.
Civil Service Development
PF
GD
411
175
251
405 143
X X
-0125 Lofa Country Rural Health CS 392 572 236 548 X
-0126
-0127
-0130
-0131
-0132
-0135
-0137
-0138
Health Management Planning
Ayriculturn Cooperative Dev.
Improved EYfic. of Learning
Vocational Training
Increased Revenue for Dev.
Agric. Researh & Extension
Agric. Analysis & Plawaing
Rural Roads III
CS
PF
CS
PN
GD
PF
PF
TC
348
2
287
248
135
186
335
361
825
10
397
432
984
200
361
900
700
500
725
430
2,278
500
430
1,500
1,200
400
1,160
450
1,000
X
X
X
X
X
X
X
X
X
X
X
X
X
TOTALS

AFR/DR/ARD October I80
AFRICA BUREAU PORTFOLIO TREND ANALYSIS, FY 1977-81
Country or Region: Lizeria (Cont'd)
Expenditure b Fiscal Year ($O00s)
Project Number Project Title Type 77 78 79 80 81 Food Inco-e
(Est.) (Est.) D I U D I U
669-0139 Upper 3ona County Rural Dev. PF 1,151 1,500 1,949 X X
-0141 Agric-Iture Training & Dev. PF 9 48 10 X X
-0142 Upper Lofa County Rural Dev. PF 136 541 902 1,421 2,000 X X
-0143 Roat '.'intenence Equipment TC 675 90 91 811 X
-0145 Acricultural Credit Bank PF 550 600 X X
-0146 -w i-come Housing CW 22 250 380 X X
-0153 Ruro .ielpment Traininc PF 250 1,734 350 350 X X
-0154 Nirba County Entrep'l Dev. PN 50 113 X X
-0157 Hand Dug Wells CS 208 X
-0159 Navig. Aids at Princ. Airports TC 415 X
-0160 Youth On-the-Job 'rainino PN 295 200 X X
-0!63 Nimba County Rural Technology PM 150 600 X X
-0164 Land Tenure PF 355 X
-0165 Health Delivery System CS 2,250 X
-0168 Opport's Ind'iz. Center int'l PN 500 500 X X
-0171 BWI Expansion PN 1,000 X X
7,662 6,360 10,468 12,469 16,824 0 12 II 15 -I
TOTALS
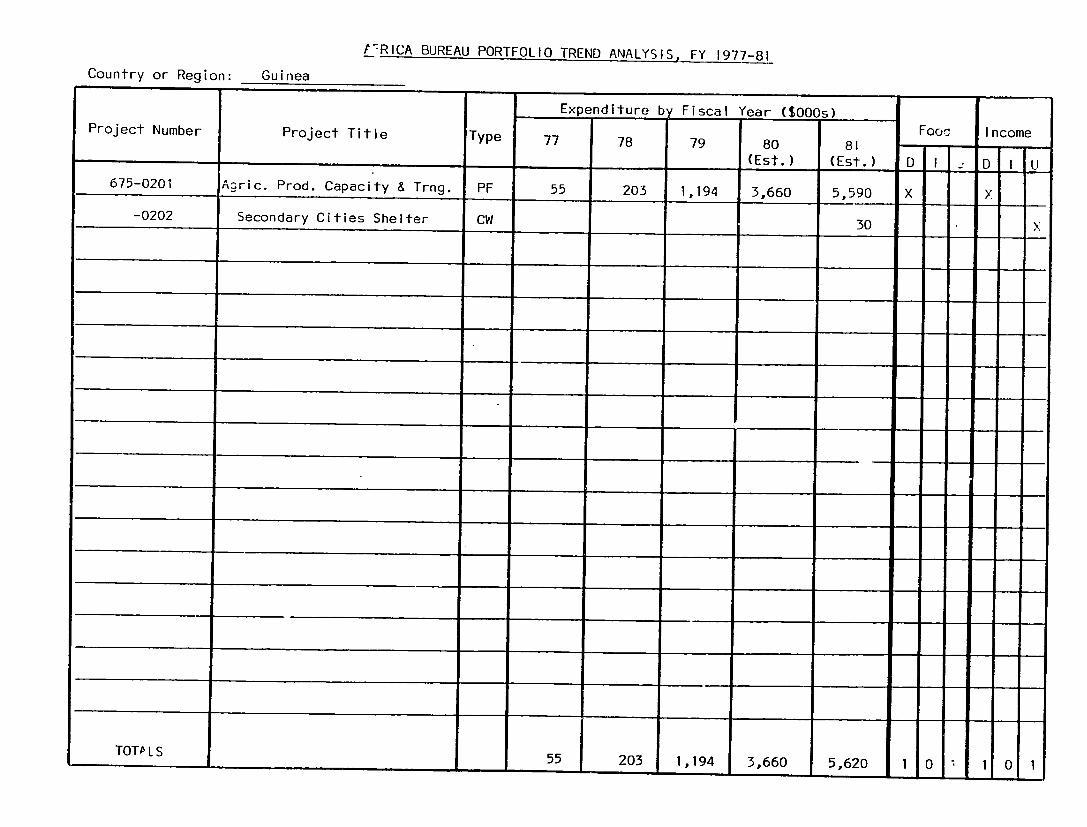
VRICA BUREAU PORTFOLIO TREND ANALYSIS, FY 1977-81
Country or Region: Guinea
Project Number
675-0201
-0202
Project Title
Acric. Prod. Capacity & Trng.
Secondary Cities Shelter
Type
PF
CW
Expenditure b Fiscal 77 78 79
.. _(Est.)
55 203 1,194
Year ($O00s)
80 81
(Est.)
3,660 5,590
30
Foo
D I
X
Income
D I LU
X
X
TOTALS 55 203 1,194 3,660 5,620 1 0 1 0 1

X -002
AFRICA BUREAU PORTFOLIO TREND ANALYSIS, FY 1977-81 Country or Region: Central African Rep.
Expenditure bProject Number Project Title Fiscal Year ($O00s)
F Type 77 78 79 80 81 Food Income
(Est.) (Est.) D676-0001 I U D I USeed Production Center PF 91 33 123 Rurl Health CS 30 275 202X
-0004 Fish Culture Extension PF 32 30 40X
-0202 Rural Village Wells CS 198 25 65X
0-
TO A S351! 363 4302 0 2 2 2 0

Octoze- 1980AFR/DR/ARD
AFRICA BUREAU PORTFOLIO TREND ANALYSIS, FY 1977-81
Country or Region:
Project Number
Chad
Project Title Type
Expenditure b
77 78
Fiscal
79
Year ($000s)
80 81
(Est.) (Est.)
Food
D I U
Income
0 I U
677-0001
-0002
Lake Chad Irrigated A:ric.
Aaricultural Instititic- Dev.
PF
PF
30 1,00-1 277
92
X
X
-0004 Vural Health Planr-ir:-:-t. CS 15 155 X X
-0005 Como. Human Resource- .. C2 47 59 477 X
-03C3 Accacia Albida Expa 5"z Pr 352 452 286 X
-0C09 Irrigated Crop Pro-uc- on PF 118 1C6 148 X
-0014 Crop Prod/Seed .ut/P-e '-'ktg PF 25 X
-02C Rural Family Grair, :-ae PF 93 65 X
-0021 Rural School Constr-c.:< n CS 126 X
-0022 Rural Sanitary water CS- 2A 230 339_ X
-0023
-0032
Food Delivery/Rural .,crks
Thad Road Mainterance
CW
TC
26 117
500
29
754 X
X .X
X
-0033 Lvstk Vaccination CaDaoicn PF 245 69 X
-0043 Chad Recovery & Rehabil tation CW 1,500 X x
-0201 Chad Range & Livestock Dev. PF 870 821 377 X
TOTALS 1,432 3,412 2,944 1,122 1,500 8 1 6

AFR/DR/ARD October 1980
AFRICA BUREAU PORTFOLIO TREND ANALYSIS, FY 1977-81
Country or Region: Con~o
Expenditure b Fiscal Year ($O00s)Project Number Project Title Type 77 78 79 80 81 Food Income
(Est.) (Est.) D I U D I U
679-0001 Smalinolcer Agriculture Dev. t: 400 X
TOTALS - - 400 1 0 0 0 C

1980 AFR/DR/ARD
AFRICA BUPEAU PORTFOLIO TREND ANALYSIS, FY 1977-81
Country or Region: Niger
Project Number
683-0130
-0201
-0202
-2_0
Project Title
Road Maintenance
%izer Cereals Production
Range & Livestock Mg'm-.
Entente Livestock I!
Type
TC
PF
PF
PF
Expenditure b
77 78
673 104
2,619 2,637
68 277
462 540
Fiscal Year ($O00s)
79 80 81
(Est.) (Est.)
4,339
688 1,220 1,940
1,909
Fooc
D I L
X
X
X
X
Income
D I U
X
X
X
-3235
-023
-0214
"iamey Dept. Rural 'e,.,.
IlmDrovinc Rural Health
3asic Health Svcs Deliver,,
PF
CS
CS
244
909
2,202
286
994
1,530
1,573
600
958
4,411
104
X
X
X
-$22
-725
-0226
-0228
-0229
-0230
-0234
-0235
-0237
-0240
zrelter Sector lannin:
'4i-er Cereals Research
Rural Sector Hurnan Resources
Rural Integrated Agric. Dev.
Eval. Assist. to Min. of Plan
_crtry & Land Use Plannin:
Agriculture Prod. Support
Niger Solar Energy
Literacy Training
Niamey Dept. Rural Dev. II
CW
PF
GD
PF
GD
PM
PF
PM
CS
PF
50
17
i38
17
150
110
250
320
945
2,443
150
300
1,060
200
1,500
X
X
X
X
X
X
X
X
>
X
X
X
X
X
X
X
TOTALS

AFR/DR/ARD October !?P0
AFRICA BUREAU PORTFOLIO TREND ANALYSIS, FY 1977-81
Country or Region: !icer (Cont'd)
Project Number Project Title Type
Expenditure by
77 78
Fiscal Year ($O00s)
79 80 81
Food Ii Incom~e
-(Est.) (Est.) D I U D I U
683-0241 ONAhA "'aintenance Center PF 300 X X
TOTALS 3,822 4,761 10,590 5,433 14,631 9 5 4 9 I

________
IA-H/UH/ARD
Octoter 1980 AFRICA BUREAU PORTFOLIO TREND ANALYSIS, FY 1977-8
Country or Region: _. Bone
Expenditure by Fiscal fear ($O00s)Project Number Prolect Title Type 77 178 79 80 81 Foo Income
(Est.) (Est.) D I i D I U 680-0201 Rura' .ae Supply
IS____ ,0,0 -0207 Soya r-crion/Nutrition P7 400 300
TOTALS - 1,900 2,800 1 0 1 1 •

October 1980 AFRICA BUREAU PORTFOLIO TREND ANALYSIS, FY 1977-81
Country or Region: -'uritania
Project Number Project Title Type
Expenditure by
77 78
Fiscal
79
Year ($O00s)1 80 81 Food Income
-
68?-020
-0203
-020 : -0205
nt~era-ej Rural Devoeopment
'.ra1Vand Reclamation
. e- =le Production-= -:....- :R'es).rce cgnt/C on s.
_ _
'
_
262 132 809
6 66
80
(Est.)
1,018
6-500
7 49
(Est.)
1,701
1,500
500
2X'
D
X X
X
I U D. U
-0207 I e Oasis Dev. 80__ 734
500
942
1,300 X
-021i Rural Assess./Manpower Stud, 206 776 2,77 x
2 %-ra! %oads Development 950 X -022c-e
-022. Alre---=-
restation
ve Energy Program .'
J 1,200
1 200
x
X :
-002 5-all Perimeters ___650
X
TOTALS 262 338 1,671 5 05,585 10,984 50

AFR/DR/ARD October '80
AFRICA BUREAU PORTFOLIO TREND ANALYSIS,_FY 1977-81
Country or Region: Senecal
Expenditure by Fiscal Year ($O00s) Project Number Project Title Type 77 78 79 80 81 Food In:-me
(Est.) (Est.) D I U D I U
685-0201 Cereals Production 872 1,575 963 X
-0202 Pance & Lvstk Development -- 114 874 1,075 630 700 X
-0205 Cssa-ance Regional Dev. 276 70D 2,600 X
-0215 !a1 irrigated Perimeters 44 858 836 1,300 1,500 X
-0209 -'rain Storage -: 567 748 X
-0210 ural -iealth Services Dev. CS 3 554 516 00 1,000 X
-0217 7amiiy Planning 900 X
-021. SAE. Trainina -: 38 00 1,500 X
-0219 uelwood Production I 1 1,!2 1,000 X
-0222 Intecrated Youth Job Dev. 30 673 600 X
_02 Natl Hlan for Nat. Resources _ 50 700 X
-0224 SO.....Livestock Production 80 2,650 1,635 X
-0233 "-,:culture Sector Analysis PF 500 X
-0235 Cereals Production II F 1,000 1,500 X
-0242 Rural Health Services II CS 500 X
-0243 Forestry PM 50 77 X
-0246 Renewable Energy II P : 200 X
TOTALS
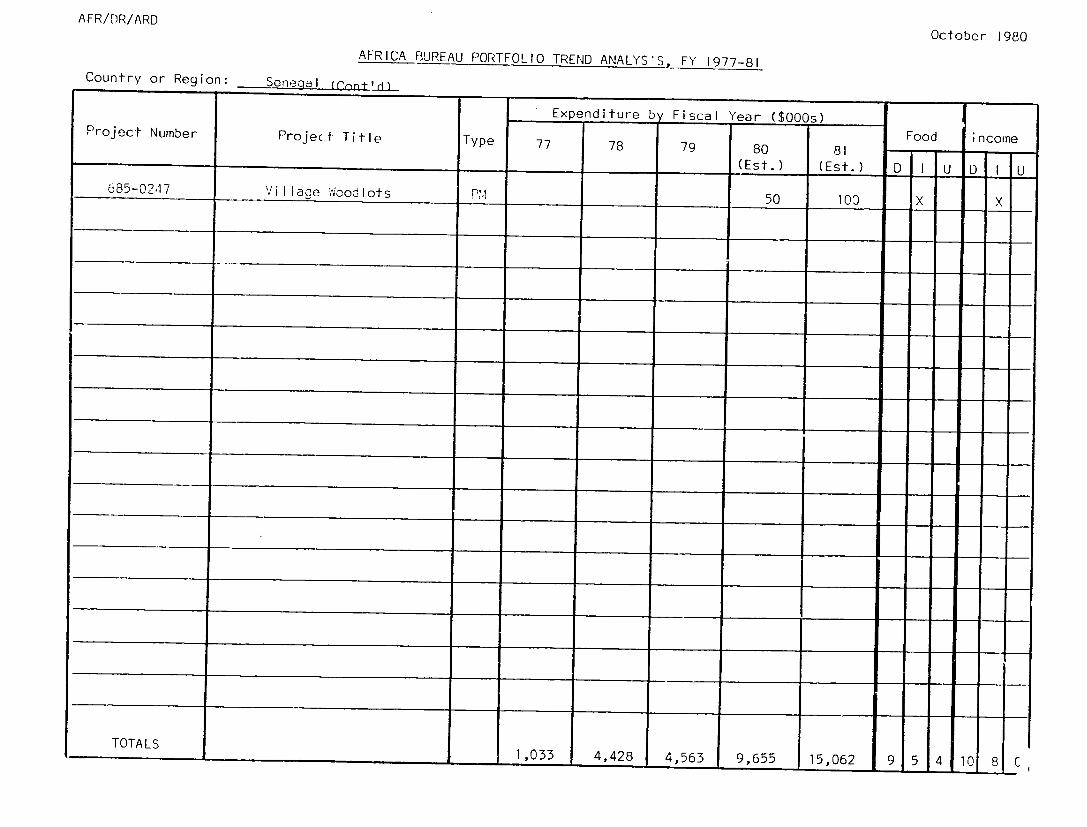
AFR/R/ARD
October 1980 AFRICA BUREAU PORTFOLIO TREND ANALYS'S, FY 1977-81
Country or Region: Senegal (rnnt')
Expenditure b Fiscal Year ($O00s) Project Number Project Title Type 77 78 79 80 81 Food incoe
(Est.) (Est.) D I U D I U 685-0247 ViIIace Woolots PM
50 103 X X
TOTALS 1,033 4,428 4,563 9,655 15,062 9 5 4 10 8 C

AFR/DR/ARD October 100
AFRICA BUREAU PORTFOLIO TREND ANALYSIS, FY 1977-81
Country or Region:
Project Number
Upper .o!ta
Project Title Type
Expenditure b
77 78
Fiscal
79
Year (00Cs)
80 81
(Est.) (Est.)
Food
D I U
Income
D I U
636-020i Lasern (>. trey. Rural Dev. PV 072 561 331 884 790 V -
-0202
-0203
See
.Mlase
. It iutilicatiop
Avestock Dev.
100
248
92
535
2W7
237
366
643
136
266
x
-0211 .'en's Rc -s in Development 110 121 189 640 x,
-0212
-0215 E
'laoDevelopment
Rural Roads
7-1
7:
38
522
16
568
120
1,024
155
408
_
X Y
-0219 ra!ise Development V., 180 232 185 45 X
-0220 ::.cni irte:-.es Rural Dev. Pz 22 70 98 30 . ,
-0221 .. roaa Resources Dev. P: 194 1,094 2,500 y X
-0222
-0226
volta Va ev Development
Trainins .c'cr in the Sahel
P _
GD
_5___ _:
79 155 4000- Y -
-022.
-0231
-0235
Rural ,'aer SuJpty
lozuenega Mteg. Rural Dev.
Forestry Education & Dev.
OSC
7F 347
2,000
1,956
100
3.900
1,158
1,800
X
X
X
V
-0243 Grain 'arkeing Development PF 985 x X
-0245 Foundation Seed Production PF 325 X X
-0247 ura! Roads II TC 838 X x
TOTALS 1,642 2,108 3,470 8,746 14,726 12 1 11 11

AFR/DR/ARD
October 1930
AFRICA BUREAU PORTFOLIO TREND ANALYSIST FY 1977-81
Country or Region: :.a Ii
ConExpenditure b/ Fiscal Year (1000s)
Project Number Project Title Type 77 78 79 80 81 F -ncome
(Est.) (Est.) DIU D U
668-0002 Centrai Vet Laboratory PF 54 X
-0201 la! I Livestock Development F713 1,417 919 X -0202 _,oration %Mils II -F 978 2,073 2,372 2,956 2,133 X X
-22 Livestock Sector I PF 1,045 2,752 2,407 5,045 3,755 X X
-020 Rural Works PM 53 646 1,002 144 X X
-0205 Land _se Capability Inventory PM 117 2,176 1,592 X -0206-)-206 Action Riz-Sorgho PF 394 537 1,427 1,140 350 X X
-0207 Acric=!uraI Officers Trng. PF 87 44 3,660 1,980 X X
-0208 Rural -ealth Services Dev. CS 312 611 683 903 X
-0209 Community Dev. for Women GD 5 194 16 X
-0210 Operation Haute Vallee PF 210 4,678 3,446 X X
-0212 Kayes-Nioro Road TC 100 X
-0213 AcTion Ble PF 179 921 1,000 X X
-0215 First Region Pilot Dev. PF 400 X X
-0217 Renewable Energy PM 96 833 1,730 X
-0218 Livestock Sector II PF 500 X X
-0219 Semi-Arid Tropics Research PF 31 325 X X
TOTALS

AFR/PR/ARD October 195O
Country or Region: Mali
AFRICA BUREAU PORTFOLIO TREND ANALYSIS, FY 1977-81
(Continued)
Project Number Project Title Type
Expenditure by Fiscal
77 78 79
Year ($O00s)
80 81 Food F
Income
638-0221
-0224
Development Leadership Trng.
Rural 'dater Ir1nproverrent
_ (Esi.)
40
60
(Est.)
250
149
D I
X
U
N
D I
X
X
U
-0225
-xxxx
-n. Center for Rural
Primary Eye Care
Wornen D2 __"___--_____ 50 200
50
X X
X
TOTALS 3,189 7,425 9,445 23,569 18,682 11 7 3. 12 9 C

AFR/DR/ARD October 1980
AFRICA BUREAU PORTFOLIO TREND ANALYSIS, FY 1977-81
Country or Region: Entente
Project Number Project Title Type
Expenditure b
77 78
Fiscal
79
Year ($O00s)
80 81 (Esi.) (Est.)
Food F
D I U
Income Income
D I U
689-0205 Entente Rural Devel3pment PF 400 X X
TOTALS - 400 100 1 O

AFR/DR/ARD October 1980
AFRICA BUR[AU PORTFOLIO TREND ANALYSIS, FY 1977-81
Country or Region: Southern Africa 7ec,
Expenditure by Fiscal Year $o00s)
Project Number Project Title Type 77 78 79 80 81 Food Income
(Est.) (Est.) D I U D I U
690-0004 L.niv. of Bots/Les/Swazi iand CS 8 X /
-0006 BotZam Road TC 2,662 911 1,101 X X
-0035 Malawi Roads I TC 1,795 1,228 X X
-0046 Malawi Roads I TC 3,564 2,092 1,<83 X
-0063 Dev. Trng. for S'ern A a CS 577 3,589 3,979 8,000 3,043 X x
-0076 Southern Perimeter Poe: TC 4,000 8,000 X X
-0083 Academic & Skills Tr-aiin: CS 2 126 97.0 X x
-0102 Fund for Student Re CS 2,000 61C X
-0104 Program Development & u:,Dort 3D 694 217 X
-0105 SA Dev. Anal. & Planninz. GD 313 520 X
-0201 Refugee Support CW 12,101 2,000 X
-0202 Private Voluntary Organiz's GD 800 X x
-0206 _;.-ining, Mgmt., & Research GD 1,000 1,750 X
-0207 Agriculture & Lvstk. Dev. PF 250 X X
-0208 Technical & Managerial Trng. GD 500 X
-0209 Transportation & Storage ;ev. PF 3,000 X X
TOTALS 8,608 10,953 11,580 25,101 19,343 2 1014 2 1

AFR/DR/ARD October 1980
AFRICA BUREAU PORTFOLIO TREND A!,ALYSIS, FY 1977-81 Country or Region: Togo
Expenditjre b Fiscal Year ($000s)Project Number Project Title Type 77 75 79 80 81 Food Income
(Est.) (Est.) D I U D I I U 693-0210 Rural Water Supply CS 900 ,600 -X X
-0212 Family Health Center CS 38 100 1,000 X X -0213 Low Income Shelter CW 400 150 X -X
-0217 Community Training arm PF 500 X X
-0220 Togo Credit Unions PF 50 250 X x
TOTALS 38 1,450 3,500 2 0 1 1 2 2
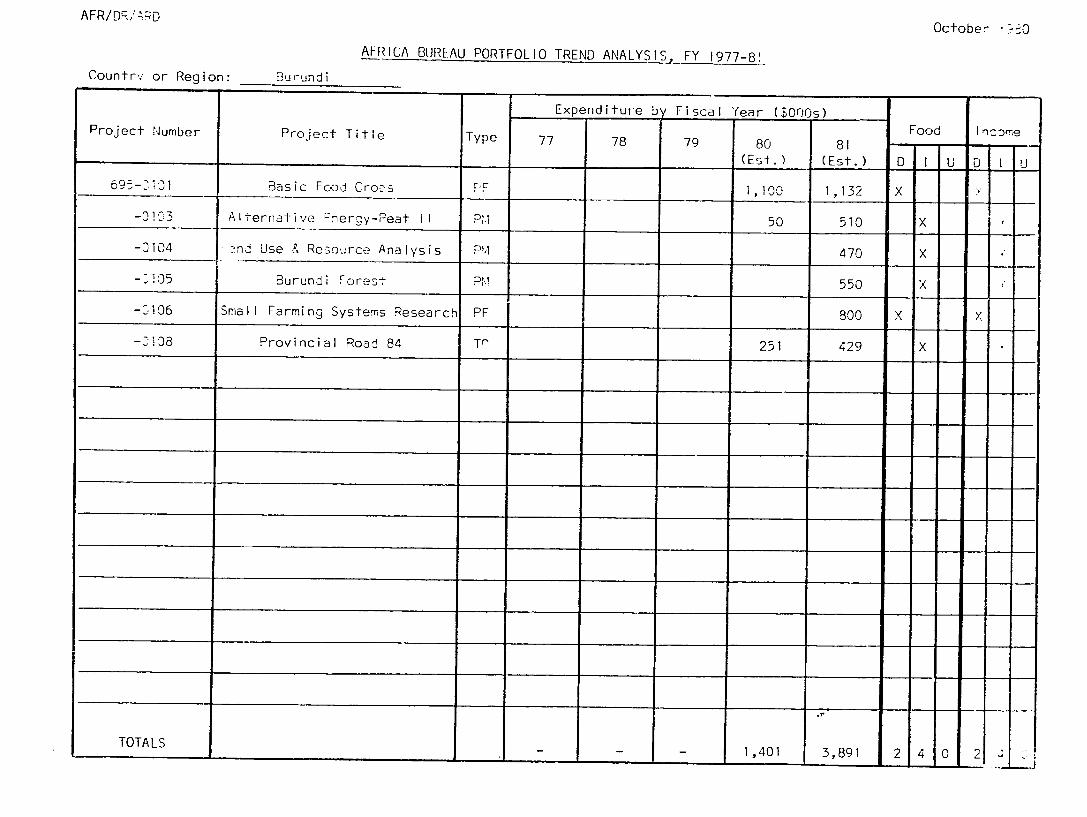
AFR/D;, AqD October O
Countr,., or Region: Durundi
AFRICA BUREAU PORTFOLIO TREND ANALYSIS FY 1977-8!
Project Number Project Title Type
Expenditure by
77 78
Fiscal
79
Year ($O00s)
80 81 Food Incoe
(Esi.) (Est.) D I U D I U
69-i01
-D3
Basic Food Croos
Alternative nergy-eat I
lF
PM
1,100
50
1,132
510
X
X
-0104 :rnd Use & Resource Analysis PM 470 X
-: 05
-,106 Small
Burundi Forest
Farming Systems Research
Pt.
PF
550
800 X
X
X
--108 Provincial Road 84 T 251 429 X
TOTALS 1,401 3,891 2 4 0 2

AFR/DR/ARD OctoL - 30
AFRICA BUREAU PORTFOLIO TREND ANALYSIS, FY 1977-81
Country or Region: Rwanda
Expenditure by Fiscal Year ($O00s)" Project Number Project Title Type 77 78 79 80 81
(Est.) (Est.)
696-0100 Food Storage & Marketing PF 518 54 331
-0103 Farm Hand Tools '114
-0107 Local Crop Storaae -__ 342 712
-0108 Cooperative Grain Storace 31
-0109 Agriculture Education PF 630 1,200
-0112 Fish Culture 1,000
--113 Rural Health/Family Planning CS 1,000
-0115 Agric. Survey & Analysis 890
-0116 Food Storage & Marketing II 300
Food - .- e
D I U . U
X
X .
X
X
X
X
X
X
X
TOTALS 518 54 476 972 5,102 8 0 1 - 0

0 0
co
U
o x
X~ x~~'
0
(N0
Iii
0n
CD~
0) 0
00
0
0
0 0
( Ill)
co IC
D,-
o
--
"'"
.
-.
co
-)
-
LU
0
o 0
0
0
-L
U)
co (a
L.-
.
V)
0
0' -)
Vo
>. o
' >
-i L
,
()
0+_
(N
L
C/)
li)
LL 0
u
0
+s
-+
.. .
.. C
L
(L C
(N
-(--
.-
--
rZ
LU
(0
)
0 M
-U.
L" i
U)
( f)
+-
-<
NU
CLL
.>
T.
"
o 00
0C<
0U
-0
••
0 q-
C)
) (1)
UU))
L(V
to-L
-0F
L -
+a
.. -I-V
~
00L 0
*T.U
-
L
C'
-01'I0-
>
0 C
l 4.
(1) L
L
CD
I 1
(1 I-
C
c °--)
_(_ 4-..
< ..
E
L-00
m
0. N
i .
4 :3L
N
C4
0 :r
00 ~
z-t -
I ID
I
CC
) U
C))
u
.0-~ L
*.) C
.
0 >:
i *
00L
:r:
LL
a
<0

I
,~
2
-:P'-
:'
.00
0
0
0 C .'
;: .....
. ...
...,
Cro'o
a," 0
o S'
oC),o
-"-0
-> <
o uI
o
o <
>
o
o
o
,g) o< o~
..
'A.
:
1C *
4)
0L
LL
L"A
N
C0
CD
C0
0 -
0
0 C
:)
co N
C)"0
C zr
-
C
Ln
0
C)
N
I 0 L
x
r fI .0 0
C)
C\N
0) LA
.
co
0
CD
L a
LU
0C) _)
(\-N0 C
) 0)C
)C
) C
)
C)
C)
O1
0)LA t
C)
0-
0
C) ,)
-t
'
C)0
'.
'-
LA
r-
C)
0 n
N
CO
tr3
C)
0) ,) 0
0 -
V)
ILm
\ O-
0 1 )
-,
<4:
C
LU
I)
_j
SO
''.
L
_0 c
C. S)0
LU
CO
r
.4-
o
22l co --
.
NN
C)
CD co
:
0'O
0) \c No':
.
':.
" C
fZ2'
'
C)
CO
C
CO
()
.
.
--I
IL
C)0. ,
.0. n
')
-U
)C.)
0. co
L.
0-U
) (1)
L )
C )..
.
o .
LUJ -
Of
U..
-<
:
Ci0
CL4
0 '
c 0 a,*C))
a,
L
q1-
C.
c, 00
a-
4-)
H a,
a..
UL
0,
T L
0 0 4. 3
* fu
0 0 4-
C
-c (t.
C
fl rp
+ ~C
' 0
LI
a) I-_
01 0)
NI,0
71. U
)M
L
u
C
C
c 0-
L M
, a,
L
n. U
) U
)A
-
E ~
L
4 U
(D
Q
)a,
c
(7) +-
-C
. U
) -
E
-E
_f_-
4-1
a M
-.
a, C
L
-*
4-Q
a,
a U
)()c
0 co
E
fu
4-C
L 0
-a,
. +-
-D
-L
0
)4-
a,) 0.
(1) C
))(1
C1
U
0
(I) ~~~
1
T:
I j
U)f,
, If)
a,U-
L.
:3 0U
) a,
L(1)4-r,
C
0. a, (1)L
a,)(1)L
U
-0
_C
U
C
CD
-
~3 1)
4-
o
.
.-L
0 0.3 0.
D:
M/
-a, a,Ca)
C
LU W
Y.
. ~a
,C
.
..1o V
)
L0 4-*
C))
CL
H--
4-) C
1a)E
0
L0
-a,) > ,
o: )
0)u
L
0 U
)
L
(1),4-M
..a,3:
MaC
0 0) ,A ~
o uI
I C
U
ca,)U
J)
a,4-0 2 a C
Da
C
0 C-1
a n
1n ID" o
Q(,
U
I)
C-o
4-o)
U -
*Cf
Lfl0
Lo
0) <
-CV
, )7,:-C
0
4-a,)
1 C
: *
C
4-co
4-0
a,C) L
-.
-
a o
*o_
:3
4-C
(1)E ca.0
>
Q) ~
4-L 00.
M
c a,
L
a u
L I-
L
M,
0
0 qI-
a 0) a,
E>
Z)
: ao~
M-
a
C
(o -
U
-0
1
L a L
U
L
r) c
( ry0
L
0 L -
L-0
-30
M)
ZZ
U
L
0.
EC
O
CD
C)
GO
0)
m'
( CD
C)
.D
C)
N~
: C
)
t') -C
) ' C
) ' C)
q)LA
'. 4 C
)
-.
*j C
)
(X) O
0 N
'~ ~
C)
0)
N0V.
ClJ 4'
C)
("I
C)j
N
N~
0
)N 4
C)
'Tr
(N
4 C
)
'0N\
l4 C
)
V)
-j~ 4 C

o o
C
00
0
V
-M
-
X
1xxX
x X
>< x
0~
-0 U
))
:'/,?/i
"+
-0O
: ;
Y -D
{!!J'
~0 *
x
CA
I)
0
0
0C
*.
L O
-D
-
-() L C
0 0-
1i
0 .....
CD
C)0
L
(0
(C)
CC
C
HCC, >V
H.L
CC
)(f) U)
LD
cc
r-
r
-3
C
-C
Nl
-o
N-
N
N)
..... N
C'
N
CO
0 N
C
2) nO
....
N
0 S....)
...
0
IN
C'
o
NN
0 0) 0
LA....0
0
. C
O
.
o
CID
..
,I ..
ON
A~
o ....
.....
-
C N
C.
) C
D
0 C
C
D
CD
C
. c
)L
CD
U
[I-
.
..-..
0 -)
>
0L C
D
L
-F>
CD
ul
C)
-0D
0C.
CU
).
u0,,
C)
U
CC
U
C
L
.CD
-
L
D
(D
CD
C
...
D
-<C o
U)
CD
(D
C'
) ,
) U
U
co ........
. >.
o>
-o
uC
.
Co
-C
C
D
CD
,
~ 0.
4 U
......
< H
. C
fl
C0U
V
U
V0C
2C
D
Cu
..
.L
..
C
U-0
U
C
-C
C.
E
Li
UL
L
CL
-0
-.-
) ). C
C..CD.C.)
0 .)
..
0
) D
o
C
(1U)
-cC
c U
q
UL. U.CD.
CDC
D~4
L
...-
'..
C
U-
lL. c
-1
<.
"
0 C
C
I) (A
. .0U
-3
. ..
r
U
'L
'-0V
-T
C,
-C
U
0
u
LL4 C
U
-
cL
0
(D,-
C)
L
2o)'
( -
L.
o
D CD
C
j W.
4-10 fl3
0
.. ...
0 U
l : C,
UL
CU
a)(DC
U
L.
U
D
I>
(A*
C
.-
.
C) ..
:T-U
.
(7-
U
c)) L
D
-T
-0LU
U
0UL+
-_)
U)
L
(fC,
fu 0t-
-() +3
C: :3
iC u ,+,+
< +.+
_++.- :+D
++
u+o fu (,,U.. >
o
..... L
L
C
. 7
.u :.
u
....
< C.
0 ()
1-N -u
c
(. m
LA
L
0
0' ,
0 0
0"
...
.... .
..
......-UA
CA
L
.
-
L L
<T
m
C
0
L
Zo
0 0
o
.
.. o
0 L
94~-
0-~ )C
)0
C
L
054
CD
0
CD
-g

AFR/DR/ARD October 1980
AFRICA BUREAU PORTFOLIO TREND ANALYSIS, FY 1977-81
Country or Region: Africa Pecional
Expenditure b Fiscal Year ($O00s)
Project Number Project Tiflle Type 77 78 79 80 81 Food Income
(Esl.) (Est.) D I U D I U 698-0062 rE!te PrDrr, .... 2,15 1,303
-0106 ,,,ter, e un:-' L"vestcck Sector PF 900 --0127 Arican Develo ,:entBank 3D 276 254 464 954 2,-24 X
-0135 -rocr- evelop,-ent & Support GD 7,081 4, 4,646 6,738 7,097 X
-0154 .ec-o a 1 3rcariizations Dev. P%! 142 212 150 X ,'
-0186 Educa=icn & T-aining Activity CS 395 X X
-0210 Inrter-.rican Scho!arship Proj CS 1,171 49C 200 X X
-021i ducaion A*v ry Services CS 206 52 X X
-0340 Ecor. Crn-.ission for Africa GD 778 38S 13 350 450 X X
-0356 African '.'athe-atics Program CS 52 X X
-0358 .HEC Extension CS 429 320 60 X
-0363 African Labor Development PN 2,173 1,991 1,206 2,894 3,000 X .
-0365 .3DSC/.'-A Program Support GD 19 2 6 X
-0382 Rice Research & Production PF 884 240 1,815 1,000 X X
-0383 Television Eval. System CS 165 X X
-0384 African '.'anpower Development GD 560 2,218 3,723 5,250 6,500 X X
-0386 Private .'ol. Organizations GD 2,075 8,506 X
TOTALS

--
Appendix '.
AFRICA HUREAU PORTFOLIO TREND ANALYSIS
Country and Regional Program Expenditures Expressed as a Percentage of Total Expenditure
Central Africa
631 Cameroon 658 Sao Tome/Principe 660 Zaire 676 Central African Rep. 679 Congo 696 Rwanda 695 Burundi
Total
East Africa
603 Dj ibou [i 615 Kenya 617 Uganda 618 East Africa Reg'Il 621 Tanzania 642 Mauritius 649 Somalia 650 Sudan 662 Seychelles 663 Ethiopia
Total
Coastal West Africa
620 Niqeria 6367'iorr a Leonn ,41 (,hana 669 Liberia 675 (11inea 680 denin 693 Togo
Total
Southern Africa
611 Zambia 612 Malawi 6S2 l hsobo
(Continued next pacle)
FY77
0.3% -
2.0% 0.3%
0.4%
-8.1% .
0.5% -.7%
-0.6% -
4.7%
18.6%
I1.1% 0.1% 3.0% 6.6% -
-
10.8%
7.4% 0.1% I. %
FY78
0.7% 0.1 1.7% 0.2% --
2.7%
-4.8%
0.5% 6.5% --
0.5% -
2.4%
14.7%
0.6% 1.1% 2.9% 4.1% 0.1% --
8.8%
17.4% 0.9% 1.,%
FY79
3.4% -
2.7% 0.2% -
0.3%
6.6%
-7.6%
0.1% 4.0% --1.1% -1.5%
14.3%
0.2% 0.8% 5.1% 5.9% 0.7% --
12.9%
2.8% 0.1% 2.1%
FY80 FY81
1.4% 2.7% _ _
1.1% 1.2% - -- 0.1%
0.3% 1.1% 0.4% 0.8%
3.2% 5.9%
0.2% 0.3% 4.3% 5.0%
1.2% - -
3.9% 5.7% 0.1% 3.6% 3.% 10.9% 10.9% 0.1% 0.1% - -
23.1% 26.3%
- -1.4% 0.7% 1.4% 2.3% 3.9% 3.5% 1.1% 1.2% 0.6% 0.6% 0.4% 0.7%
8.8% 9.0%
6.5% 5.2% 0.9% 1.3% 2.3% 3.2%

IY71 FY78 FY79 FY80 FY81
Southern Africa (Cont.)
633 Botswana 645 Swaziland 656 Mozambique 690 S'ern Africa Reg'l
0.7% 0.6% 0.5% 7.4%
2.1% 1.1% -
7.0%
1.2% 0.7%
_ 6.5%
4.6% 2.7%
-7.8%
3.0% 1.8% 1.5% 4.1%
rotal 18.0% 30.1% 14.1% .24.8% 20.1%
Sahel
657 Guinea-Bissau 63: Gambia 685 Senegal 682 Mauritania 688 Mali 686 Upper Volta 683 Niger 677 Chad 0,5 (:,,p Verdo (, , ADO-N i. irny 628 ADO-DLa ka r 689 Entente 625 Sahel Regional
-
-0.9% o.2% 2.7% 1.4% 3.3% 1.2%
0.4)% o., %).%
-.
18.4%
0.2% -
2.8% 0.2% 4.7% 1.3% 3.0% 2.2% 1 .2%
12.9%
0.4% 0.2% 2.6% 0.9% 5.3% 1.9% 5.9% 1.6% 1.6% 4.1%
1% -
11.5%
0.5% 1.0% 3.0% 1.7% 7.3% 2.7% 1.7% 0.3% 0.4% 1.5%
-5.1%
0.7% 1.2% 3.2% 2.3% 3.9% 3.1% 3.1% 0.3% 0.5% 1.2%
0.1% 4.3%
Total 28.8% 293 37.7% 25.2% 23.9%
698 Africa Reqional 20. 14.3% I 14.8% 15.0%
('rand Iotal 116,180 (100%)
I',:, II (100%)
118,468 (100%)
323,376 (I00%)
474,881(100%)

AFR/DR/ARD October 1980
Country or Region: Seychelles
AFRICA BUREAU PORTFOLIO TREND ANALYSIS, FY 1977-81
Project Number Project Title Type
Expenditure by Fiscal
77 78 79
Year ($O00s)
80 81 Food Income
(Est.) (Est.) D I U D I U
662-000 Food Crop Research PF 250 400 X
TOTALS - - - 250 400 1 0 0 0