BI-520 Introduction to Public Health Lab Manual - CUNY ...
103
City University of New York (CUNY) City University of New York (CUNY) CUNY Academic Works CUNY Academic Works Open Educational Resources Queensborough Community College 2021 Laboratory Techniques in Public Health: BI-520 Introduction to Laboratory Techniques in Public Health: BI-520 Introduction to Public Health Lab Manual Public Health Lab Manual Anuradha Srivastava CUNY Queensborough Community College How does access to this work benefit you? Let us know! More information about this work at: https://academicworks.cuny.edu/qb_oers/171 Discover additional works at: https://academicworks.cuny.edu This work is made publicly available by the City University of New York (CUNY). Contact: [email protected]
-
Upload
khangminh22 -
Category
Documents
-
view
2 -
download
0
Transcript of BI-520 Introduction to Public Health Lab Manual - CUNY ...

City University of New York (CUNY) City University of New York (CUNY)
CUNY Academic Works CUNY Academic Works
Open Educational Resources Queensborough Community College
2021
Laboratory Techniques in Public Health: BI-520 Introduction to Laboratory Techniques in Public Health: BI-520 Introduction to
Public Health Lab Manual Public Health Lab Manual
Anuradha Srivastava CUNY Queensborough Community College
How does access to this work benefit you? Let us know!
More information about this work at: https://academicworks.cuny.edu/qb_oers/171
Discover additional works at: https://academicworks.cuny.edu
This work is made publicly available by the City University of New York (CUNY). Contact: [email protected]
Laboratory Techniques in Public Health
BI-520
Introduction to Public Health Lab Manual
Dr. Anuradha Srivastava
Creative Commons License This work is licensed under a Creative Commons Attribution‐Noncommercial‐Share Alike 4.0 License

Acknowledgements
First of all, I would like to express my deep and sincere thanks to Dr. David Klarberg for giving me the opportunity to own and complete this lab manual. I am grateful for his motivation, enthusiasm and immense knowledge on the subject.
I am also thankful to Ms. Teresa R. Salas and Mr. Terence J. Rohan, who as technical staff have always supported my new ideas and it would have not been possible to execute these labs without their assistance.
I am also grateful to Dr. Nidhi Gadura for her constant encouragement throughout the course of present work. I take this opportunity to record my sincerest thanks to faculty members of Department of Biological Sciences and Geology for their help and encouragement.
I extend my gratitude to Open Education Resources team of Queensborough Community College for coordination and management of the project that was crucial to completion of this lab manual. I would like to thank City University of NewYork for financial support.
It is my privilege to thank my husband, Dr. Anupam Pradhan for his active critique and proof reading the labs. Last but not the least, my wonderful children who were very generous with giving away their time with me, so that I could complete this assignment with my full attention.

Table of Contents
Lab Exercise ................................................................................................. Page
Lab 1… .................................................................................................................................... 1 Seeing things, the eye cannot: Introduction to Microscopy
Lab 2… .................................................................................................................................... 9 Microbes and Diseases: Aseptic and Culturing Techniques
Lab 3… ................................................................................................................................... 18 Basic Clinical Bacteriology: Gram Staining
Lab 4… ................................................................................................................................... 24 Controlling Microbial Pathogens in the Environment by Altering Physical and Chemical Factors
Lab 5… .................................................................................................................................... 32 Respiratory System Diseases: Significance, Structure and Assessment
Lab 6… .................................................................................................................................... 39 Cardiovascular Diseases: Significance, Structure and Assessment
Lab 7… .................................................................................................................................... 46 Blood: Significance, Diseases and Assessment
Lab 8… .................................................................................................................................... 55 Urinary System: Structure, Diseases and Assessment
Lab 9… .................................................................................................................................... 64 Aging and Special Senses: Vision
Lab 10… .................................................................................................................................. 74 Aging and Special; Senses: Hearing
Lab11… ................................................................................................................................... 81 Environmental Health and Safety
Lab 12… .................................................................................................................................. 87 Obesity and Estimation of Body Mass Index
Lab 13… .................................................................................................................................. 95 Diabetes and Glucose Tolerance Test
1
EXERCISE 1
SEEING THINGS, THE EYE CANNOT: INTRODUCTION TO MICROSCOPY
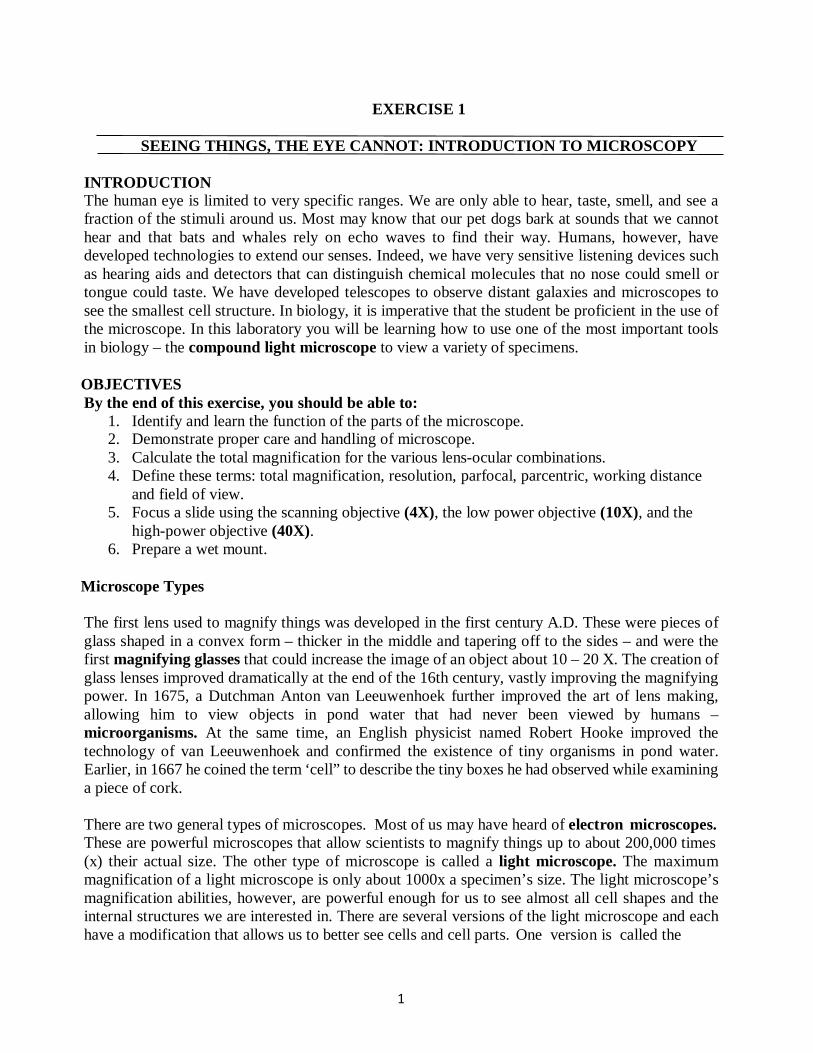
INTRODUCTION The human eye is limited to very specific ranges. We are only able to hear, taste, smell, and see a fraction of the stimuli around us. Most may know that our pet dogs bark at sounds that we cannot hear and that bats and whales rely on echo waves to find their way. Humans, however, have developed technologies to extend our senses. Indeed, we have very sensitive listening devices such as hearing aids and detectors that can distinguish chemical molecules that no nose could smell or tongue could taste. We have developed telescopes to observe distant galaxies and microscopes to see the smallest cell structure. In biology, it is imperative that the student be proficient in the use of the microscope. In this laboratory you will be learning how to use one of the most important tools in biology – the compound light microscope to view a variety of specimens.
OBJECTIVES By the end of this exercise, you should be able to:
1. Identify and learn the function of the parts of the microscope.2. Demonstrate proper care and handling of microscope.3. Calculate the total magnification for the various lens-ocular combinations.4. Define these terms: total magnification, resolution, parfocal, parcentric, working distance
and field of view.5. Focus a slide using the scanning objective (4X), the low power objective (10X), and the
high-power objective (40X).6. Prepare a wet mount.
Microscope Types
The first lens used to magnify things was developed in the first century A.D. These were pieces of glass shaped in a convex form – thicker in the middle and tapering off to the sides – and were the first magnifying glasses that could increase the image of an object about 10 – 20 X. The creation of glass lenses improved dramatically at the end of the 16th century, vastly improving the magnifying power. In 1675, a Dutchman Anton van Leeuwenhoek further improved the art of lens making, allowing him to view objects in pond water that had never been viewed by humans – microorganisms. At the same time, an English physicist named Robert Hooke improved the technology of van Leeuwenhoek and confirmed the existence of tiny organisms in pond water. Earlier, in 1667 he coined the term ‘cell” to describe the tiny boxes he had observed while examining a piece of cork.
There are two general types of microscopes. Most of us may have heard of electron microscopes. These are powerful microscopes that allow scientists to magnify things up to about 200,000 times (x) their actual size. The other type of microscope is called a light microscope. The maximummagnification of a light microscope is only about 1000x a specimen’s size. The light microscope’smagnification abilities, however, are powerful enough for us to see almost all cell shapes and theinternal structures we are interested in. There are several versions of the light microscope and eachhave a modification that allows us to better see cells and cell parts. One version is called the

2
Air
Glass
Air
bright field light microscope which is the most popular type and the one that we will be using. It shows the specimen on a white background. Another version is called a dark field light microscope and still another is the phase contrast light microscope.
Activity 1: Setting Up the Microscope & Learning its Parts and their Functions Retrieving the Microscope You will be using the microscope in various exercises throughout the course. It is your responsibility to take proper care of the microscope and to learn to use it correctly. When instructed, carefully transport your assigned microscope from the storage cabinet to your laboratory station. Your microscope corresponds to your seat number from the cabinet (power cords are in a plastic box in the drawer near your seat). Make sure that you support the bottom of the instrument and hold the scope to your body to prevent the possibility of dropping it or hitting it against something. You will be working with a compound light microscope. Magnification is the result of two lenses: the objective and the ocular. The objectives, located on the rotary nosepiece, achieve 4 different degrees of magnification. The ocular, located at the end of the body tube, has a magnification power of 10X. The total magnification is determined by multiplying the power of the objective by the power of the ocular. Total magnification= ocular magnification x objective magnification
Name Characteristics Magnifying power Total Magnification Scanning power red stripe 4 X Low power yellow stripe 10 X High-dry power blue stripe 40 X Oil immersion black stripe 100 X As two small objects move closer to each other, a point is reached where the eye is unable to distinguish the objects as separate entities. The smallest distance at which two points can be seen separately is called resolution However; magnification is the process of making the specimen look larger.
Figure1: Refraction of Light Rays
As the light passes through air, enters the glass slide, and then enters air again, the light is bent. This bending (Figure 1) is called refraction, which occurs when light moves from one medium of density to another medium of different density. When refraction occurs, the refracted light is lost, and it is harder see your object. Refraction can be partially overcome if material of the same density is placed between the slide and the glass lens of the objective. Modern light microscopes use immersion oil and objective lens referred to as oil-immersion objectives to overcome refraction at higher magnification

3
The field-of-view (the area of your sample, you can see at any one time) and the working distance (space between the objective lens and the slide) decrease with increased magnification. A set of objectives on a microscope are said to be parfocal when the specimen stays in focused in the field of view from one objective lens to the next lens. Parcentric is a term that refers to the property of a set of objectives when the specimen stays centralized in the field of view from one objective lens to the next lens.
Parts of the Compound Microscope and their functions
Supporting framework 1. Body tube - a tube, quite long in some microscopes, which forms the main body of the
microscope; the ocular is at the top of the body tube, and a nosepiece often containing severalobjectives, is at the bottom of the tube.
2. Arm - the main supportive structure of the microscope, and the only part except the base bywhich the instrument should be carried.
3. Mechanical Stage - the platform on which the slide is placed.4. Stage clip or clamp - used to hold the glass slide in position on the stage.5. Base - the supportive bottom of the instrument that also holds the light source.
Magnification System 6. Ocular (eyepiece) - usually a 10 power (10X) lens containing a pointer which can be used to
designate a particular location in the field of view.7. Revolving Nosepiece - a turret that holds the objectives and allows them to pivot into position
as needed.
8. Objectives - there are usually four objective lenses, but some nosepieces have fewer; they area 4X (scanning lens), a 10X (low power), a 40X (high power), and a 100X (oil immersion).
Adjustment System 9. Coarse adjustment knob ‐ a knob which raises and lowers the body tube or stage to
bring the specimen on the slide into focus.10. Fine adjustment knob ‐ a knob to be used for fine adjustment (focusing) after using
the coarse adjustment, to increase the resolution of the specimen.11. Slide adjustment Knobs/Travel knobs – these knobs move the slide left or right and
towards or away from you.
Illumination System 12. Light / Illuminator with switch - a sub-stage light is enclosed in the base of some
microscope. Turn this light off when not in use.13. Condenser - a lens system located immediately below the stage. Collects light from the
illuminator and concentrates it on the slide. The condenser can be adjusted to a higher or lowerposition by a sub stage adjustment knob but for most purposes, the condenser should be fullyraised. If a pattern appears in the field of view, you lower the condenser until the patterndisappears. The diaphragm is housed within the condenser.
14. Condenser control Knob – the condenser can be moved up and down by using this knob.

4
15. Iris Diaphragm - a unit housed within the condenser that regulates the amount of lightentering through the opening in the stage, thus regulating the amount of light passing throughthe specimen.
16. Iris Diaphragm Lever - used to adjust the amount of light a specimen receives.17. Power cord – should be connected to the power outlet when microscope in use.
Figure 1. Parts of the Microscope

5
Note: Before we try to look at any cells, make sure you: 1. Clean the lens of the ocular, objectives, and condenser with windex and lens paper only.2. Place the slide on the stage between the side clips with the object at the center of the opening
of the stage.3. Move the low power objective into place.4. Raise the condenser and partially close the iris diaphragm.5. Plug the power cord into the outlet.
Note: Before you return the microscope to the cabinet:
1. Leave the low objective in place with the objective close to the stage. NEVER LEAVE ASLIDE ON THE STAGE.
2. 4 X objective clicked into place (shortest lens).3. Stage is in the lowest possible position.4. Make sure the lenses are cleaned with Windex and lens paper.5. The power cord is unplugged and placed back in the box.
Activity 2: Practicing the Use of the Microscope-The Letter “e” MATERIALS:
Compound Light Microscope Windex and Lens Paper Letter “e” slide
PROCEDURE: 1. Obtain a prepared slide of the letter “e”. Place the slide on the horizontal stage so that the “e” is
directly below the low-power objective lens. Rotate the nose piece to the scanning (4X) lens makingsure it clicks into place securely and is aligned, with the ocular. Always examine a specimen firstunder low magnification, since this gives you a greater field of vision.
2. Plug in the electric cord and turn on the illuminator.3.Check the diaphragm level below the stage to make sure it is open, assuring the proper amount of
light.4.Using the coarse adjustment and looking through the eyepiece, raise the low power objective
slowly until the object comes into view.5. Still using the low power objective, search the field for the object to be examined.6. Focus on the letter under all the three lenses-4X, 10X and 40X.7. Without touching the adjustment knobs, rotate the nosepiece to bring the high-power objective into
place. The objectives on this microscope can shift from one magnification to another with onlyminor focusing adjustments.

6
8. Whenever the high-power lens is in place ONLY the FINE ADJUSTMENT knobs are used to bring the specimen into focus.
9. If necessary, adjust the iris diaphragm to allow more light to enter the high-power objective.10. Bring the object (or specimen) into sharp focus with a slight movement of the fine adjustment
knob.11. Notice that the image is inverted.
Draw your letter “e” as it appears in the microscope using scanning, low and high dry objectives.
Scanning Objective Low Power Objective High-Dry Objective
Total Magnification Total Magnification Total Magnification
Activity 3: Practicing the Use of the Microscope- Colored Cross Threads
MATERIALS: Compound Light Microscope Windex and Lens Paper Colored Cross Thread slide
PROCEDURE: 1. Obtain a prepared slide of colored cross threads.2. Repeat steps 1-10 from Activity 2.3. Notice as the magnification increases, the depth of field decreases to a field where only one threadis in focus. As the magnification is increased, depth of field decreases, but the ability to resolvedetails becomes greater.4. Practice adjusting the illumination to achieve optimum contrast.
Activity 4: Preparing Wet Mount: Buccal Smear/Cheek Cells
MATERIALS: Compound Light Microscope Windex and Lens Paper A clean glass slide and coverslip

A toothpick and a paper towel Methylene blue/Crystal violet stain
PROCEDURE: 1. Scrape the inside of your cheek with the broad, flat end of a toothpick. 2. Place a drop of the stain on the glass slide. 3. Smear the cheek cells on the stain. 4. Lower a coverslip over the smear. 5. Blot up excess stain with a paper towel 6. Examine under scanning lens. 7. Repeat steps 1-10, as mentioned in Activity 2.
Draw your cheek cells as they appear in the microscope using scanning, low and high dry objectives.
Scanning Objective Low Power Objective High-Dry Objective
Note: Clean-Up
Since saliva is a potentially infectious body fluid, proper disposal of laboratory materials is necessary.
Discard the glass slide, coverslip, toothpick and broken slides in Sharps container.
Test Yourself
1. What is the type of microscope that we use in this lab?
2. Give Magnification: a) What is the magnification that is written on the ocular lens (eyepiece)? b) What is the magnification that is written on the scanning objective? c) What is the magnification that is written on the low power objective?
7

d) What is the magnification that is written on the high-powerobjective?
e) What is the total magnification of a specimen when viewed with the following objective?: Scanning Low power High Power Oil Immersion
3. Briefly define the following: a) Parfocal
b) Parcentric
c) Working distance
d) Field of view
e) Resolution:
4. Answer the following: a) Which objective should you initially locate the specimen?
b) Which provides the largest field of view? The low or high-power objective?
c) When examining the crossed threads, which objective provides the greatest depth of field-high or low power? Explain your answer.
5. Give the function of: a) Diaphragm:
b) Condenser:
8

9
EXERCISE 2
MICROBES AND DISEASES: ASEPTIC AND CULTURING TECHNIQUES
INTRODUCTION Disease is condition in which the body is unable to maintain homeostasis, or balance. This disruption of internal constancy, the loss of health, is usually manifest by specific signs and symptoms of disease. The causes of disease are many, with some being genetic conditions we inherit. Others are due to nutritional deficiencies and some the result of the aging process. Still others are due to malfunctions of our immune system and of course pathogens, disease causing microbes.
Microbes are too small to be seen with the unaided eye and, therefore, we need microscopes to see them. Microbes that cause diseases are found in bacteria, fungi (as in molds or yeast), and many of the protozoa (like the amoeba). Even though they are not considered alive, viruses are also included in the family of disease causing microbes. Only species of algae have been found to cause disease in humans.
It should be stressed that microbes are essential to life on this planet. Many provide essential links in food chains and others provide the essential functions of transforming and degrading dead organic matter, which in turn releases trapped nutrients that can be used by plants and other organisms. Some bacteria can even digest oil from oil spills, while other microbes are essential to our food industry (used to make yogurt and cheeses, for example). And yet still, several microbes produce antibiotics. Fewer than 1% of microbes cause disease making only a fraction of microbes pathogenic. However, that small percentage has been responsible for untold human suffering and death.
When a microbe is able to establish itself (reproduce) in or on the body, an infection is said to exist. If that infection is not causing any signs or symptoms of disease, the infection is said to be a subclinical infection. Technically speaking, a non-clinical infection does not cause a disease. If, on the other hand, there are symptoms, a clinical infection is said to exist and as the symptoms occur, the body’s homeostasis is disrupted. An infection that is found in one tissue or organ is said to be a local infection and one that has spread throughout the body is called a systemic infection.
Infectious diseases that can be spread from person to person are said to be communicable diseases. If the disease can spread easily, the infection is said to be contagious. If the disease agent cannot be passed from person to person, then the disease is called non-communicable.
Inanimate objects (such as our laboratory tables and clothes), as well as our unbroken skin, are said to be contaminated if microbes are unable (or have not yet been able) to multiply. The physical removal or killing of microbes is called decontamination. Technically, any noxious material residing on us or an object (i.e. a table or coat) is a contaminant and the process of its removal or destruction called its decontamination. For example, your clothes may become contaminated with asbestos fibers; removal of the fibers by washing the clothes would decontaminate them. Chemicals used in the laboratory to decontaminate (kill) microbes are called disinfectants.
10
Chemicals used on our skin to decontaminate microbes are called antiseptics. Antiseptics are less injurious to our tissues than are disinfectants.
The daily conduct of our lives, in and outside of the laboratory, should be spent ever vigilant of coming into contact with pathogens, or potential pathogens. “Portals of entry” refer to the parts of our bodies that allow entry of microbes into us. These portals include cuts or broken skin, the respiratory tract as we breathe in the air around us, the digestive system that can be affected by the foods we eat and water we drink. Also included are the genitals (through sexual activity) and the placenta from which a mother can infect the fetus.
The next few laboratory exercises involve the use of bacteria. Bacteria are used because they are easier and faster to produce than other microbes. In addition to the bacteria supplied from cultures, we will sample the bacteria and fungi that ubiquitously inhabit our surroundings.
Aseptic techniques refer to a set of procedures used to minimize chances that microbial cultures and laboratory workers will be contaminated by each other. Culturing (growing) bacteria is necessary if we are to be able to identify them.
OBJECTIVES
By the end of this exercise, you should be able to: 1. Define these terms: infection, sub clinical and clinical infection, local and systemic infection,
contagious, communicable and non-communicable diseases, contamination anddecontamination, disinfectants and antiseptics, portals of entry.
2. Learn and practice safe laboratory habits.3. Learn how to keep laboratory surfaces decontaminated.4. Define and learn aseptic procedures.5. Learn how to inoculate and culture bacteria.6. Learn how to take environmental samples.
Activity 1: Learning Aseptic Techniques
Aseptic techniques are designed to prevent the transfer of bacteria from the surrounding environment into a culture medium. These techniques require care and concentration. Pay attention to what you are doing at all times. Aseptic techniques include the following procedures. 1. Laboratories should always be considered contaminated. Therefore, your first activity before
doing anything is to decontaminate your workspace with the Vasphene disinfectant at your table,using the sponge provided. Disinfect the work area before and after use.
2. Never put your hands to your face; they may be contaminated.3. Wear either a laboratory coat or shirt that can easily be washed if it becomes contaminated (and
will protect you from splashed stains and other chemicals).4. Make sure that long hair is tied back and that loose-fitting clothing is secured. Flames from
Bunsen burners are a serious threat.5. Make sure that when burners are used, they are toward the center of the table and make sure
they are extinguished when not in use.

11
Hottest part of the flame
Air hole
Gas supply
6. Eye protection is recommended. If something should splash into your eye, immediately use theeye wash at the Eye Wash Station and inform the instructor (for possible referral).
7. Minimize the time that cultures and growth media are open to the environment.8. Do not touch or breathe into the sterile culture media or the stock cultures.9. Loops, needles, pipets, etc. should be sterilized before they are used.10. When working with tubes, the tube caps should not be placed on the bench top; they should be
held in your hand while inoculating.11. When removing the caps from test tubes, flame the lip of the test tube after the cap is removed.
This heats the air inside the tube, so the air moves out of the tube, preventing contaminants fromentering the tube.
12. If a bacterial culture spills, soak it with Vasphene and let it stand for at least 10 minutes beforeyou wipe it up.
13. Make sure that contaminated transfer instruments are properly sterilized or disposed of as perthe instructor’s requirement, after use.
14. Wash your hands with antiseptic soap supplied if you think they may have been contaminatedand before you leave the laboratory.
Activity 2: Using aseptic Techniques to Transfer Bacteria by Inoculating in Growth Media
1. Setting up and using the Bunsen burner:
The Bunsen burner is used when we are working with microbes as a means of preventing contamination by sterilizing instruments that can be flamed. There is a separate Bunsen burner for each student. Before trying to use it, make sure that the hose connections at the gas supply valve and burner are secure and there is no evidence of leakage. The burner should be placed toward the center of the table, to lessen the risk of accidentally burning yourself. Make sure a spark igniter or match is at hand prior to turning on the gas. The gas is flowing when the gas valve handle is in line with the hose connection. Moving the valve handle to the left or right shuts the gas off. To light the Bunsen burner, turn on the gas on and hold the spark igniter to the burner opening, while Figure 1. Bunsen burner
keeping your head as far back as possible. The burner may need adjustment if the flame is too high or yellow in color. Ask the instructor to make these adjustments for you. Practice lighting the burner a few times until you are comfortable with the procedure.
By Unknown. Found on Pixabay. Bunsen Burner Pixabay License. Free for commercial use. No attribution required.

12
2. Sterilizing the Inoculating loop:In a holder on each table, there are inoculating loops and needles, one for each student. Take one loop and place it in the test tube rack provided. Light you Bunsen burner. Next place the end of the inoculating loop in the flame until it glows orange for most effective sterilization. At this point the loop has been sterilized. You are now ready to use the loop for inoculation. For quick sterilization, position the loop at the top of the inner blue cone of flame—this is where the temperature of the Bunsen burner is the hottest.
NOTE: Sterilization refers to a procedure that ensures all biological life and viruses are destroyed. Sterilization may be achieved by several methods. An autoclave uses steam under pressure and a hot air oven “dries and bakes”. Incineration uses open flames and chemicals such as ethylene oxide directly destroy organic molecules. Inoculation is purposeful introduction of bacteria in a growth medium.
3. Growth Medium:There are two commonly used physical forms of growth media: liquid media and solid growth media. A liquid medium is called a broth. Solid growth media usually contain agar, which is a mixture of polysaccharides derived from red algae. Agar is derived from sea weed and universally used as a bacterial growth medium. It is sterilized as a liquid and it solidifies when it cools. It is presented in different types of containers (petri dishes and test tubes) and in different ways (flat and slanted surfaces), depending upon what kind of growth we want to look at. We often combine the agar with different kinds of nutrients to either encourage or discourage certain types of bacterial growth. We also often add different kinds of indicator chemicals that change colors when certain kinds of metabolism (chemical reactions of the organism) occur.
1. Always label your plates/tubes prior to transfers. You can use Sharpies on the plates, but waxpencils only on tubes. When labeling tubes, label the tube itself—don’t label the cap!2. Make sure you label the bottom of the plates (the part of the plate that holds the agar).3. Place plates upside down for incubation. This prevents condensation from falling on the surfaceof the agar and disrupting the streaking pattern.
Depending upon the container from which we take the bacteria and to which containers they are being moved to, the procedure varies somewhat. Each procedure will be demonstrated by your instructor, after which you will practice each until you are comfortable doing them.
i ) Test Tube to Test Tube Transfer
MATERIALS: Each student: 1 nutrient broth tube Stock Bacteria used: Staphylococcus aureus and Escherichia coli. Two students on the table will use Escherichia coli and two students will use Staphylococcus aureus.
3. Labeling and Incubating Plates and Tubes:
4.Procedures for Transfer/Inoculation:

13
PROCEDURE: 1. Light your Bunsen burner.2. Sterilize your inoculating loop and hold it in your hand while you pick up your bacterial source
tube.3. Unscrew and remove the cap of the source tube. The cap is held by the pinky of the hand in
which you are holding the inoculating loop.4. Flame the mouth of the source tube by briefly holding it to the burner flame. This will prevent
airborne microbes from settling into and contaminating the source culture. The heated glasswill provide convection current upward while you are doing the transfer, keeping airflow awayfrom the mouth.
5. Insert the tip of the transfer loop (inoculating loop) down into the source tube until it touchesthe bacteria and then withdraw it. Avoid touching the side of the test tube during entry andwithdrawal.
6. As we did with the source tube, remove the cap and flame the mouth.7. Carefully insert the transfer loop with its specimen into the mouth of the destination tube until
contact is made with the growth medium. Avoid touching the sides of the tube during theprocedure.
8. Recap the destination tube and sterilize the inoculating (transfer) loop.9. Return the transfer loop to its holder and carefully label the newly inoculated tube. Include the
date, your initials, and a notation of letter or number which identifies (to you) what you putinto the tube.
10. Sterilize the transfer loop and return it to the holder.
ii) Test Tube to Petri Dish Transfera) Nutrient Broth to Petri Dishb) Agar Slant to Petri Dish
MATERIALS: Each pair of students: 1 nutrient broth, 1 agar slant and 2 TSA plates ; one student will inoculate from broth to agar plate and the other from slant to agar plate. Stock Bacteria used: Nutrient Broth: Staphylococcus aureus and Escherichia coli
Agar Slant: Staphylococcus aureus and Escherichia coli PROCEDURE: 1. Take a TSA plate and divide it into two parts. Draw a line on the bottom of the dish with a wax
pencil and label each section with the name of the type of bacteria that will be streaked there(See Figure 2 below).
2. To obtain the bacterial inoculum from the source tube, follow steps 1-6 in the previous section.3. Use the inoculation loop to make a single streak of S. aureus and E. coli in each half (see below).
Drag the tip of the loop lightly over the surface of the agar in a back and forth motion (calledstreaking the plate).
4. Cover and incubate the plates until the next lab period.

14
Figure 2
ii) Petri Dish to Petri Dish Transfer
Figure 3
MATERIALS: Each pair of students: 1 TSA plate; select one bacterium to transfer Stock Bacteria used: Agar Plates: Staphylococcus aureus and Escherichia coli.
PROCEDURE: 1. Carefully label a destination petri dish and lay it on your table next to the source dish.2. Sterilize the transfer loop as describe above.3. Lift the cover of the source dish high enough to insert the loop.4. Glide the loop along the surface to obtain the inoculum (sample). Not much is needed.5. Remove the loop and replace the source dish cover.6. Use the inoculation loop to make a single streak of S. aureus or E. coli on the destination petri
dish (See Figure 3 above).7. Cover and incubate the plates until the next lab period.These cultures will be incubated by the technician, at room temperature for one week. We will usethese new cultures for next week’s laboratory.
Note: When placing the petri dishes in the incubation bin, turn then upside down. This keeps moisture from condensing on the cover.
Activity 3: Culturing Microorganisms from Environmental Samples
To try and find the source of some bacterium, or to see if something is contaminated, scientists often walk around with petri dishes and inoculate them on the spot.
MATERIALS: Each student: 1 TSA plate, 1 tube of distilled water, 2 sterile cotton swabs
PROCEDURE: 1. Take a TSA plate and divide it into two parts. Draw a line on the bottom of the dish with a wax
pencil and label each section with the name of the environmental surface you want to sample(See Figure 2 above): a shoe, water fountain, your hair, etc.
2. Open the sterile cotton swab packet, leaving the cotton swab in the package. This keeps thetips sterile until we sample.
Nutrient Broth Bacteria Growth (+/-)
S. aureus
E. coli
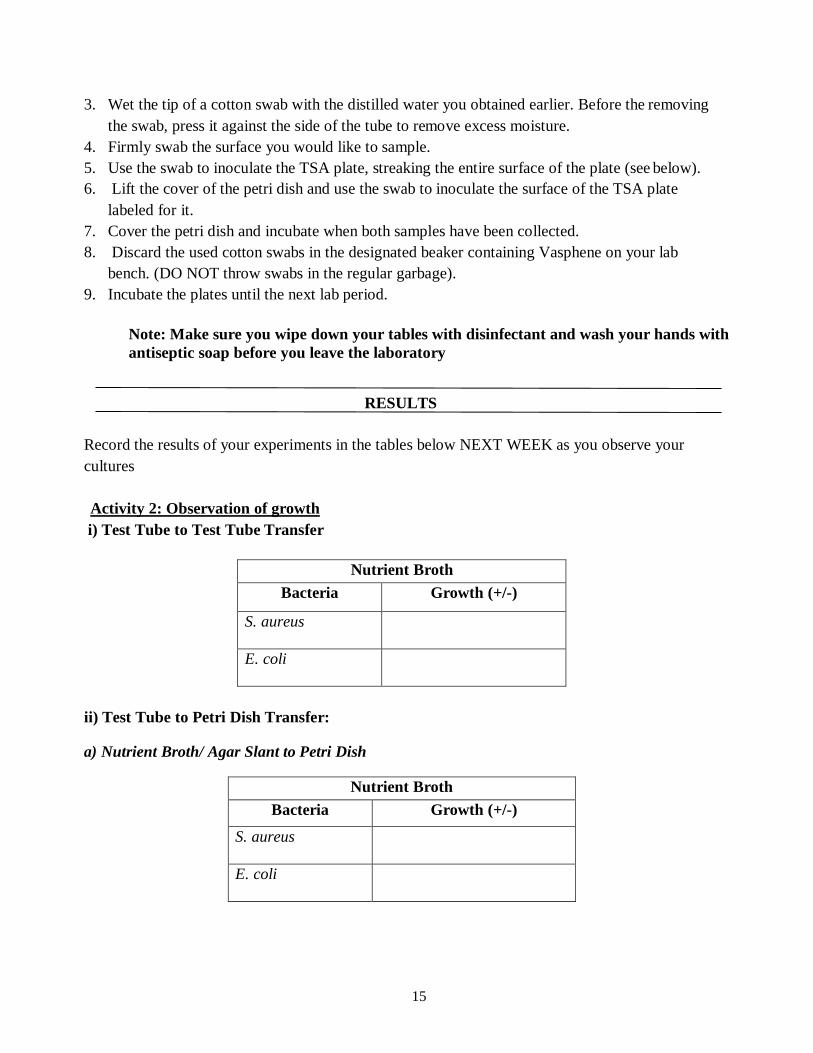
3. Wet the tip of a cotton swab with the distilled water you obtained earlier. Before the removing the swab, press it against the side of the tube to remove excess moisture.
4. Firmly swab the surface you would like to sample. 5. Use the swab to inoculate the TSA plate, streaking the entire surface of the plate (see below). 6. Lift the cover of the petri dish and use the swab to inoculate the surface of the TSA plate
labeled for it. 7. Cover the petri dish and incubate when both samples have been collected. 8. Discard the used cotton swabs in the designated beaker containing Vasphene on your lab
bench. (DO NOT throw swabs in the regular garbage). 9. Incubate the plates until the next lab period.
Note: Make sure you wipe down your tables with disinfectant and wash your hands with antiseptic soap before you leave the laboratory
RESULTS
Record the results of your experiments in the tables below NEXT WEEK as you observe your cultures
Activity 2: Observation of growth i) Test Tube to Test Tube Transfer
Nutrient Broth Bacteria Growth (+/-)
S. aureus
E. coli
ii) Test Tube to Petri Dish Transfer:
a) Nutrient Broth/ Agar Slant to Petri Dish
15

16
b) Agar Slant to Petri Dish
Agar Slant Bacteria Growth (+/-)
S. aureus
E. coli
iii) Petri Dish to Petri Dish Transfer
TSA plate Bacteria Growth (+/-)
S. aureus
E. coli
Activity 3. Environmental Sample Record the results of your own environmental samples
Type of sample Growth (+/-) Growth Characteristics Are there several types of colonies
1.
2.
Test Yourself
1. Infectious diseases that can be spread from person to person are categorized as ?
2. Briefly define the following:a) Portals of entry

17
b) Infection
c) Sub clinical infection
d) Clinical Infection
3. Answer the following:a) What is the difference between local and systemic infection?
b) What is the difference between disinfectants and antiseptics?
4. Procedures used to minimize chances that microbial cultures and laboratory workers will becontaminated by each other are
5. List five basic safety procedures for working in the laboratory
6. What is agar and why is it used in the laboratory?
7. Is it true or false that that fewer than 1% of microbes cause diseases?a. Trueb. False

18
EXERCISE 3
BASIC CLINICAL BACTERIOLOGY: GRAM STAINING
INTRODUCTION Minimally trained public health and medical office personnel who have access to standard microbiological equipment and supplies can often generate supporting evidence as to the causative agents of many common infectious disease outbreaks. The signs and symptoms of certain diseases as well as the epidemics they cause often suggest a certain microbial pathogen. Simple observations of the shape of bacteria, the arrangement of their cells, how their colonies appear, and how they react to standard straining procedures can support or negate suspicions. Indeed, simple and quick supporting evidence of a suspect microbial pathogen can alert medical personnel and epidemiologists who must contain the outbreak.
OBJECTIVES
By the end of this exercise, you should be able to: 1. Learn about simple and differential stains2. Learn the difference between gram positive and gram-negative bacterial cell wall3. Learn how to prepare bacterial smear and perform gram staining procedure4. Learn bacterial shapes and arrangements and identify under microscope5. Learn to identify gram positive and gram-negative bacteria under microscope6. Learn to use oil immersion lens of the microscope
Simple Staining Bacteria appears translucent and difficult to see when unstained. To examine bacterial morphology (shapes and arrangements,) we apply a simple stain, just as we did when we examined the cheek cells in our first exercise. Almost any cell stain we find in the laboratory can be used as a simple stain, ex. Methylene blue, crystal violet, safranin etc. Differential Staining Simple stains are great for looking at cells, but they will stain nearly all cells equally. Differential staining technique, a procedure that allows the observer to visually distinguish between different types of bacterial cells. This technique is based on the fact that bacteria may have different physical properties. Gram staining Gram stain is a differential stain and the most frequently used stain in a clinical microbiology laboratory. It is usually the first step in identifying bacteria. It was developed by Danish physician Hans Christian Gram in 1884. Nearly all clinically important bacteria can be detected using this method with few exceptions. The differences in cell wall composition of gram positive and gram-negative bacteria accounts for the gram staining differences. (Figure 1)
1. Gram-positive cell walls have a thick peptidoglycan layer beyond the plasma membrane. (stains dark purple/blue).2. Gram-negative cell walls are more complex. They have a thin peptidoglycan layer and an outer membrane beyond the plasma membrane. The space between the plasma membrane and the outer membrane is called the periplasmic space. The outer leaflet of the outer membrane is composed largely of a molecule called lipopolysaccharide (LPS) (stains pink).

19
Fig 1. Cell wall structure of gram positive and gram negative bacteria
Picture Reference: By Graevemoore at English Wikipedia. Found on Wikimedia Commons. Cell Wall Structure of Gram Positive and Gram Negative Bacteria . Licensed in the Public Domain. This file is licensed under the Creative Commons Attribution-ShareUnported license. Alike 3.0
Activity 1: Determining Bacterial Shapes and Arrangement
MATERIALS: Compound Light Microscope Windex and Lens Paper Prepared Bacterial slides displaying different shapes and arrangements
PROCEDURE: 1. Obtain a prepared bacterial slide. Place the slide on the horizontal stage so that the specimen isdirectly below the low-power objective lens.2. Rotate the nose piece to the scanning (4X) lens making sure it clicks into place securely and isaligned, with the ocular. The cells will be very small at this magnification.3. Using the coarse adjustment and looking through the eyepiece, raise the low power objective10X) slowly until the object comes into view and then to 40X (you can skip this step).4. To use an oil immersion lens, first place a drop of immersion oil on the cover slip over that area,and very carefully swing the oil immersion lens into place. When in focus the lens nearly touchesthe cover slip. Oil immersion lenses are used only with oil, and oil can't be used with dry lenses,such as your 40x lens.
In general, bacteria are grouped into several basic types based on shape or their arrangement (Figure 2).

1. Bacterial classification based on shape: coccus (spherical), bacillus (rod), and spirillum (helical). Therod- shaped (bacillus) bacteria may vary in length and in the shape of their ends; some being rounded, othersbeing square and yet others being pointed. Some bacilli are so short and fat that they look like cocci and arereferred to as coccobacilli. The helical shaped bacteria are called vibrios when they look like bent rods,spirochaetes when they look like corkscrews.2. Bacterial classification based on arrangement: The coccus (spherical) bacteria may be found arrangedin pairs (diplococcus), grouped in fours (tetrad), grouped in eights (sarcina) in clusters (staphylococcus), orin chains (streptococcus). Most bacilli appear as single rods, diplobacilli appear in pairs and streptobacilliappear in chains
Fig 2. Bacterial Shapes and Arrangements
Picture Reference: Translated by Alex Nico, based on image by Mariana Ruiz. Found on Wikimedia Commons. Bacterial classification based on morphology and arrangement. Licensed in the Public Domain. This file is licensed under the Creative Commons Attribution-Share Alike 4.0 International license.
Draw in the circles below your specimens as they appear in the microscope using oil immersion lens. Identify their shape and arrangement.
Coccus Bacillus Spirillum
20

21
Activity 2: Bacterial Smear Preparation & Gram Staining
MATERIALS:
Clean microscope slides Staining trays and newspaper Gram stain reagents: crystal violet, Gram’s iodine, safranin, 95% ethanol Water bottle (for rinsing) Bacterial cultures: Escherichia coli, Staphylococcus aureus from previous lab Work in pairs!
PROCEDURE: Preparing Bacterial smear 1. Appropriately label your slide using wax pencil as demonstrated by your lab instructor.2. If the culture of bacteria is not growing in a liquid media, add a tiny drop of saline to a slide.3. Sterilize your loop, cool it, and pick up a very tiny amount of bacteria, adding an almost invisibleamount of bacteria to the saline, mix well and spread uniformly, making a very thin smear.4. Sterilize your loop before placing it back, and allow the bacteria on the slide to air dry. Appearsmilky when completely dry.5. Once dry, heat fix it by passing it through a flame three times using a slide holder (instructor willdemonstrate). The slide should feel slightly warm on the slide receiving the heat. If it feels hot, youare overheating it. If it does not feel slightly warm, repeat the process passing the slide over the heata little slower.Gram Staining
1. Place the heat-fixed smears on the staining tray.2. Flood the surface of the smear with crystal violet (primary stain) and let it stand for approximately
1 minute.3. Wash the crystal violet off the slide gently using the wash bottle and shake off the excess water.4. Cover the slide with Gram’s iodine (mordant) and let is stand for 1 minute.5. Gently wash the iodine off the slide with the water bottle.6. The next step, decolorization, is critical to the success of this procedure. If you over decolorize,
you may report a Gram-positive as a negative and if you under decolorize, you may report aGram-negative as a positive. There is no absolute decolorizing time; some smears are thick andrequire more, while other smears are thin and require less time. The basic instruction here is toflood the smear with alcohol for between 10 and 20 seconds and immediately wash with water.Only the wash process stops the decolorizing process.
7. Shake off the excess water and flood the slide with safranin (secondary stain) for 1 minute.8. Wash with water, shake off excess water, and blot with a bibulous paper.9. Observe under microscope under oil immersion lens.10. Gloves should be worn while staining and removed before working with the microscope.

22
RESULTS: Draw sketches for each type of bacteria that you observe in the circles below. Identify its morphology, arrangement, and Gram reaction.
Bacterial Smear 1 Bacterial Smear 2 Color Observed Color Observed Gram Reaction Gram Reaction Shape Shape Arrangement Arrangement
Note: When you are finished, make sure you clean the oil off the 100x lens with lens paper and you dispose of your slides in the red sharps container. Also remember to wipe down your tables and wash your hands.
Test Yourself
1. What is a simple stain? Explain and provide example.
2. What is a differential stain? Explain and provide example.
3. Explain the difference between Gram positive and Gram-negative bacterial cell walls.
23
4. What is the procedure that fixes bacteria to a slide so they do not wash off during staining?
5. Identify the grouping of the following and draw pictures:
• Diplococcus
• Staphylococcus
• Streptococcus
• Streptobacilli
• Spirillum
• Spirochete
6. Explain how bacteria can be classified on the basis of shapes. Give all the categories.
7. Explain why it is important to use only a small amount of bacteria when preparing a smear.
8. True or False.
a. Gram positive bacteria appear pink under the microscope.
b. Rod shaped bacteria are called as spirillum.
c. Alcohol is a decolorizer.
d. Iodine is the secondary stain.

24
EXERCISE 4
CONTROLLING MICROBIAL PATHOGENS IN THE ENVIRONMENT BY ALTERING PHYSICAL AND CHEMICAL FACTORS
INTRODUCTION
To survive and thrive microbes, like all other organisms, have specific environmental living requirements. There are minimal survival conditions, maximum tolerance, and optimal environments. An organism’s own needs relate to their own special cellular chemistry that has developed over the course of their individual evolution. Different species have different nutrient needs; some are only able to digest and use certain proteins and sugars. Most organisms have enzymes, the molecules that allow much of the cell’s chemical reactions to occur, that only work in certain temperatures and pH (how acidic a solution is) ranges. Other organisms can only survive in solutions with high salt concentrations (such as the ocean), while others can only survive in waters with low amounts of salt (like freshwater lakes). These considerations are called osmotic requirements. Certain plants, animals, and microbes can tolerate a lot of exposure to ultraviolet radiation; dosages that would easily kill others. Lastly, some organisms produce poisons (antibiotics) that selectively inhibit and kill only certain other species that are sensitive to those chemicals.
Microbial life on this planet demonstrates some of the most extreme life adaptations and tolerances of any other organism. Some are found growing in ice and others survive and do best in waters almost boiling. There are microbes living in environments where there are no discernable food resources and yet there are others found in waters so salty that nothing else can survive there.
Our efforts to control infectious diseases involve a variety of strategies. We are most familiar with drug and immunization programs. Immunizations with specific vaccines train our immune systems to identify and destroy individual pathogens that invade us before they can do harm. Drug programs (antibiotics, antivirals, antifungals, and other chemotherapeutic agents) have been developed to kill microbes that have invaded us and are causing disease. In addition to these methods, we can also control pathogens by altering the conditions in which they must survive. Indeed, most of us understand this strategy intuitively from our understanding of what is accomplished by refrigerators, freezers, and our use of disinfectant cleaners in our homes.
OBJECTIVES
By the end of this exercise, students must be able to determine the effects of following environmental factors on microbial growth
1. temperature2. ultraviolet light3. antiseptics and disinfectants4. altering the osmotic properties of the growth medium

A. Altering the Physical Factors:
Effect of Temperature Bacteria, and other microbes, can only live and reproduce within a certain range of temperature. Microbes are particularly susceptible to external temperatures as they cannot regulate their internal temperature. For every organism there are three cardinal temperatures: the minimum growth temperature, the optimum growth temperature, and the maximum growth temperature. Microbial growth is best at its optimum growth temperature, which could be defined as a particular temperature range at which it grows and reproduces best. The minimum growth temperature is the lowest temperature at which a specific organism will grow and reproduce. The maximum growth temperature is the highest temperature at which a specific organism will grow and reproduce. Each species of bacteria has its own upper and lower limit, which distinctive to that species.
Effect of Ultraviolet Light Sunlight is the major source of radiation on Earth. It includes visible light, ultraviolet (UV) radiation, infrared rays, and radio waves. Ultraviolet (UV) radiation can killmicroorganisms due to its short wavelength and high energy. It is a kind of electromagnetic radiation and exerts its effects by formation of additional bonds between adjacent pyrimidines (specifically thymine) in DNA, resulting in formation of pyrimidine dimers. These dimers may change the shape of the DNA in the cell and interfere with replication. The cell often tries to repair pyrimidine dimers before replication, but the repair mechanism can also be adversely affected.
Picture Reference:By NASA/David Herring. Found on Wikimedia Commons. DNA-UV mutation. This file is in the public domain in the United States because it was solely created by NASA. NASA copyright policy states that "NASA material is not protected by copyright unless noted". Licensed in the Public Domain.
Effect of Osmotic Characteristics Osmosis is a term which describes the movement of water through a cell’s membrane into and out of the cell along a diffusion gradient. This gradient is the result of the number of molecules that are dissolved in the water. Water moves out of a cell if there are more molecules outside (hypertonic solution) and water moves into a cell if there are more molecules in the cell than in the water outside of it (hypotonic solution). Because a selectively permeable plasma membrane separates microorganisms from their environment, they can be affected by changes in the salt concentrations of their surroundings of their surroundings. IN this laboratory, you will be given agar plates that have either 0.5% salt, 5% salt or 10% salt. If an organism can only grow on the 0.5% or 5% plates only, it is classified as a non-halophile. If the organism can also grow on the 10% plate, it is classified as halophile.
25
26
A. Altering the Chemical Factors:Effect of antiseptics and disinfectantsAntiseptics and disinfectants are chemical agents that are biocides and are widely used in hospitals,laboratories and other health care settings for a variety of topical and hard-surface applications.Disinfectant is used for an agent used to kill nonliving objects or surfaces but is generally to toxic touse on human tissues. Antiseptic refers to an agent that kills or inhibits growth of microbes but issafe to use living tissue. Sanitizer is a chemical agent that reduces microbes to a safe level, but maynot eliminate completely. Bacteriostatic is a particular agent only inhibits the growth of bacterialcells but does not kill them. Bactericidal is an agent that kill bacterial cells there are a number offactors which influence the antimicrobial action of disinfectants and antiseptics, including:concentration, storage temperature, kind and number of microorganisms it can kill, shelf life and thetype of surface it is applied to.Disk diffusion method is one way that microbiologists use to test the efficacy on chemical agents
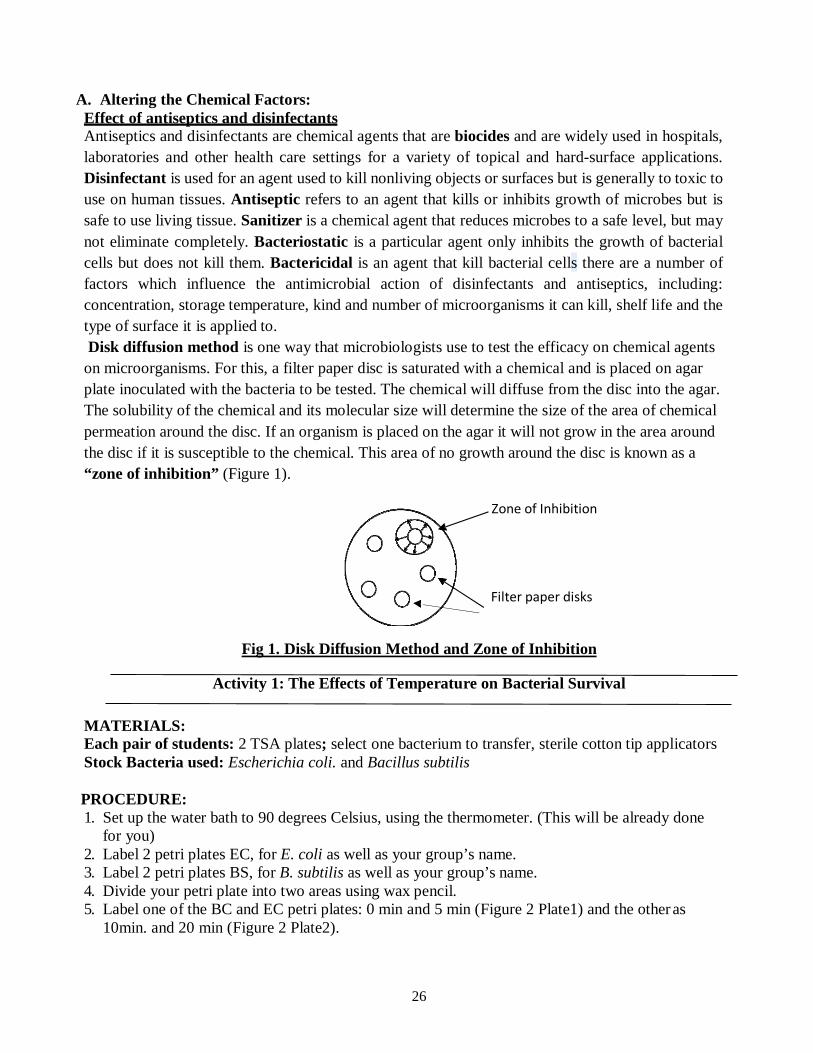
on microorganisms. For this, a filter paper disc is saturated with a chemical and is placed on agarplate inoculated with the bacteria to be tested. The chemical will diffuse from the disc into the agar.The solubility of the chemical and its molecular size will determine the size of the area of chemicalpermeation around the disc. If an organism is placed on the agar it will not grow in the area aroundthe disc if it is susceptible to the chemical. This area of no growth around the disc is known as a“zone of inhibition” (Figure 1).
Zone of Inhibition
Filter paper disks
Fig 1. Disk Diffusion Method and Zone of Inhibition
Activity 1: The Effects of Temperature on Bacterial Survival
MATERIALS: Each pair of students: 2 TSA plates; select one bacterium to transfer, sterile cotton tip applicators Stock Bacteria used: Escherichia coli. and Bacillus subtilis
PROCEDURE: 1. Set up the water bath to 90 degrees Celsius, using the thermometer. (This will be already done
for you)2. Label 2 petri plates EC, for E. coli as well as your group’s name.3. Label 2 petri plates BS, for B. subtilis as well as your group’s name.4. Divide your petri plate into two areas using wax pencil.5. Label one of the BC and EC petri plates: 0 min and 5 min (Figure 2 Plate1) and the other as
10min. and 20 min (Figure 2 Plate2).

27
6. Aseptically take an inoculation of each bacterium, EC and BS, using sterile cotton tipapplicator and streak the area on the petri plates marked 0 min.
7. Place both the EC and BS source cultures into the 900Celsius water bath.8. After 5 min., aseptically take an inoculum of both EC and BS and streak the area on the petri
plates marked 5 min.9. After 10 min., repeat the procedure streaking the area marked as10 min. on the petri plates.10. After 20 min., take the last sample from each broth and streak the last area of the petri plates
marked 20 min.11. Place your group’s 2 petri plates in the incubation bin.
0 min 5min 10 min 20min
EC/BS EC/BS Fig 3. Plate 2
Activity 2: Effect of Ultraviolet Light on Bacterial Growth
MATERIALS: Each pair of students: 3 TSA plates; select one bacterium to transfer, sterile cotton tip applicators, UV lamp, lamp with light bulb Stock Bacteria used: Staphylococcus aureus and Bacillus subtilis
PROCEDURE: 1. Label 3 TSA plates EC for E. coli and label 3 agar plates BS B. subtilis. Also include your group’s
name on all.2. Mark one each of the EC and BS plates: 1 min., 5 min., and 15 min.3. Use sterile cotton applicators to inoculate the 3 EC plates and 3 BS plates.4. Remove the covers of the petri plates and place all six plates (the EC and EB plates) under a UV
light.5. Before turning the light on, cover half each plate with a 3’ x 5’ note card. This will provide half
of the plate as a control since UV light cannot penetrate the card.6. At the end of 1 min., remove the EC plate and BS plate marked 1 min. and replace their covers.7. At the end of 5 min., remove the light from the EC and BS plates marked 5 min. and replace their
covers.8. At the end of 15 min., take the last two plates (marked 30 min.) and replace their covers.
Fig 2. Plate 1

28
9. Place all properly labeled plates in the incubation bin.
1 min cont
SA/BS
Fig 3. Plate 1
5 min cont
SA/BS
Fig 4. Plate 2
15 min cont
SA/BS
Fig 5. Plate 3
Activity 3: Alternating the Osmotic Characteristics of the Growth Media
MATERIALS: Each pair of students: 3 TSA plates; one each of:
• 0.5% NaCl nutrient agar plate; 5% NaCl nutrient agar plate;10% NaCl nutrient agar plateStock Bacteria used: Staphylococcus aureus and Escherichia coli. Select one bacterium to transfer, sterile cotton tip applicators.
PROCEDURE: 1. Label one 0 .5% NaCl agar plate with EC for Escherichia coli and the other with SA for
Staphylococcus aureus.2. Label one of the 5% NaCl plates with EC and the other with SA.3. Label one of the 10% NaCl plates with EC and the other with SA.4. Aseptically transfer E. coli into each of the plates labeled EC.5. Aseptically transfer S. aureus to the 3 plates labeled SA.6. Place all 6 of the plates upside down in the incubation bin. Be sure your group’s name is on each
one.0.5%NaCl 5%NaCl 10%NaCl
EC/SA EC/SA EC/SA Fig 4. Plate 1 Plate 2 Plate 3

29
Activity 4: The Effect of Antiseptics and Disinfectants on Bacteria
MATERIALS: Each pair of students: 1TSA plate. Stock Bacteria used: Staphylococcus aureus and Escherichia coli. Select one bacterium to transfer, sterile cotton tip applicators.
• Disinfectants: 2 types in beakers, supplied by technician• Antiseptics: 2 types in beakers, supplies by technician• Forceps, one for each beaker• Filter paper disks
PROCEDURE: 1. Label one agar plate EC for E. coli and the other SA for S. aureus. Label group’s name as well.2. Aseptically inoculate the agar plate with bacteria of interest.3. Divide the plate into 4 sections by drawing lines with a wax pencil on the bottom.4. Label each of the sections with the names of the 2 antiseptics and 2 disinfectants supplied.5. Carefully, doing one at a time to make sure you do not replace the forceps for each solution to the
wrong beaker (contaminating the solutions), take a paper disk with the forceps and dip it in theantiseptic/disinfectant.
6. After shaking off any excess solution, place the disk in the middle of the section of the agar platelabeled with that solution’s name.
7. After adding disks to each of the 4 sections on the EC plate and the 4 sections on the SA plate,invert the plates and place them in the incubation bin
Record the results of your experiments in the tables below NEXT WEEK as you observe your cultures
A. The Effects of Temperature on Bacterial Survival
Bacterial species 0min 5 min 10 min 20 min Escherichia coli
Bacillus subtilus
B. Effects of Ultraviolet Light on Bacterial GrowthBacterial species 1min 5 min 15 min
Exptl Contl Exptl Contl Exptl Contl
Staphylococcus aureus
Bacillus subtilus

30
C. Alternating the Osmotic Characteristics of the Growth MediaBacterial species 0.5 % NaCl 5 % NaCl 10 % NaCl
Escherichia coli
Staphylococcus aureus
D. The Effects of Antiseptics and Disinfectants on Bacteria
Bacterial species Disk #1 Disk #2 Disk #3 Disk #4
Escherichia coli Name
Effect
Staphylococcus aureus
Name
Effect
Test Yourself 1. Explain the mechanism by which UV radiation affects the growth of microorganisms.
2. What is optimum temperature?
3. Define the following:a. Sanitizer
b. Zone of inhibition
c. Bactericidal
4. What is the method that was used in the lab to check the efficacy of disinfectants onbacteria?
5. Explain the difference between antiseptics and disinfectants?

31
6. Explain the difference between hypotonic and hypertonic solutions:
7. True or Falsea. Halophiles are salt-loving bacteria.b. UV radiation is good for bacterial growth.c. Bacteriostatic agents slow down the growth of microorganisms.d. In hypotonic environment the water will enter inside the cell.
8. The diffusion of water through a cell’s membrane is known as:a. Filtrationb. Osmosisc. Hydro-penetrationd. Gradient realignment
9. What are some of the ways people change the environment for microbial life? All of thefollowing are ways EXCEPT:a. Feversb. Disinfectant cleanersc. Refrigeratorsd. Cold medicines
10. What does direct UV light do to bacterial growth?a. Stops itb. Accelerates itc. Does nothingd. Does minimal damage

32
EXERCISE 5
RESPIRATORY SYSTEM DISEASES: SIGNIFICANCE, STRUCTURE, AND ASSESSMENT
INTRODUCTION A consideration of respiratory (pulmonary) diseases is of critical importance to us in our study of public health. Indeed, chronic obstructive pulmonary disease (COPD), a disorder which is characterized by recurrent and chronic obstruction of airflow, affects about 30 million Americans and is classified as the fourth leading cause of death. Chronic bronchitis and emphysema are the principle types of COPD. Chronic bronchitis is characterized by excessive production of bronchial mucus and manifests a productive cough (brings up secretions) which may persist for several months.
Emphysema is characterized by the destruction of tiny air exchange sacs in the lungs called alveoli. When this happens, there is less exchange surface for oxygen and carbon dioxide. Patients become breathless easily and a collapse of air tubes, called bronchioles, leads to air trapping, further reducing air exchange. The most common cause of COPD is cigarette smoking or breathing secondhand smoke. Occupational causes of COPD are second in importance to cigarettes, but include such things as irritating dusts and fumes.
Other important lung diseases include asthma, lung cancer, tuberculosis, and pneumonia, influenza, and the common cold. Asthma is a disorder characterized by a chronic inflammation of the air tubes and the lungs, with symptoms ranging from difficulty in breathing, coughing, wheezing, and tightness in the chest. Asthma is caused by abnormal sensitivities to many common stimuli like pollen, dust mites, molds, exercise, cold air, cigarette smoke, or certain foods. This disease affects from 3% to 5% of the American population.
Lung cancer is the leading cause of cancer deaths in males and females, causing 160,000 deaths per year. Cigarette smoking accounts for about 85% of lung cancers. Most people with lung cancer die within a year of diagnosis. The overall survival rate is only 10%-15%. Exposure to secondhand smoke had been recently associated with both the development of lung cancer and heart disease.
Tuberculosis (TB) is a communicable disease caused by a bacterium. It usually affects the lung tissue and the pleural membranes covering the lungs, but may also invade other parts of the body. Over the past few years, TB incidence had increased greatly. This has been associated principally with the presence of HIV disease (AIDS). Other associations include the increased number of homeless.
Pneumonia is an acute inflammation and infection of the lungs, accompanied by fluid accumulation. It is reported that there are about four million cases per year in this country. Bacteria or viruses usually cause it. It is classified as the most common infectious cause of death in the United States. The elderly, infants, those with AIDS, cigarette smokers, and people with COPD are most at risk. Most cases of pneumonia are preceded by a viral upper respiratory infection.

33
The function of the respiratory system is to deliver oxygen rich air to the blood and remove the metabolic waste product carbon dioxide. The respiratory system includes the lungs, the passage ways into and out of the lungs, and the muscles that change the air pressure of the chest cavity which allow the cyclic air movements.
OBJECTIVES By the end of this exercise, students must be able to:
1. Identify the parts of the respiratory system.2. Know the functions of different parts of the respiratory system.3. Conduct spirometry to evaluate lung functions.4. Define these terms: tidal volume, residual volume, inspiratory reserve volume, expiratory
reserve volume, vital capacity.5. Understand the mechanics of breathing.
Activity 1: Learning the General Anatomy of the Respiratory System
MATERIALS: Anatomical model: Heads and Torso, Lungs Anatomical charts: Respiratory system
PROCEDURE: Follow the instructor’s demonstration of the anatomy of the respiratory system. The head & torso model shows the contiguous parts of the system and their relationship to surrounding anatomical structures. As air moves in form the external nares down to the microscope air sacs, distinct regions are seen. It is important to be able to identify these regions and structures because each has their own associated pathologies.
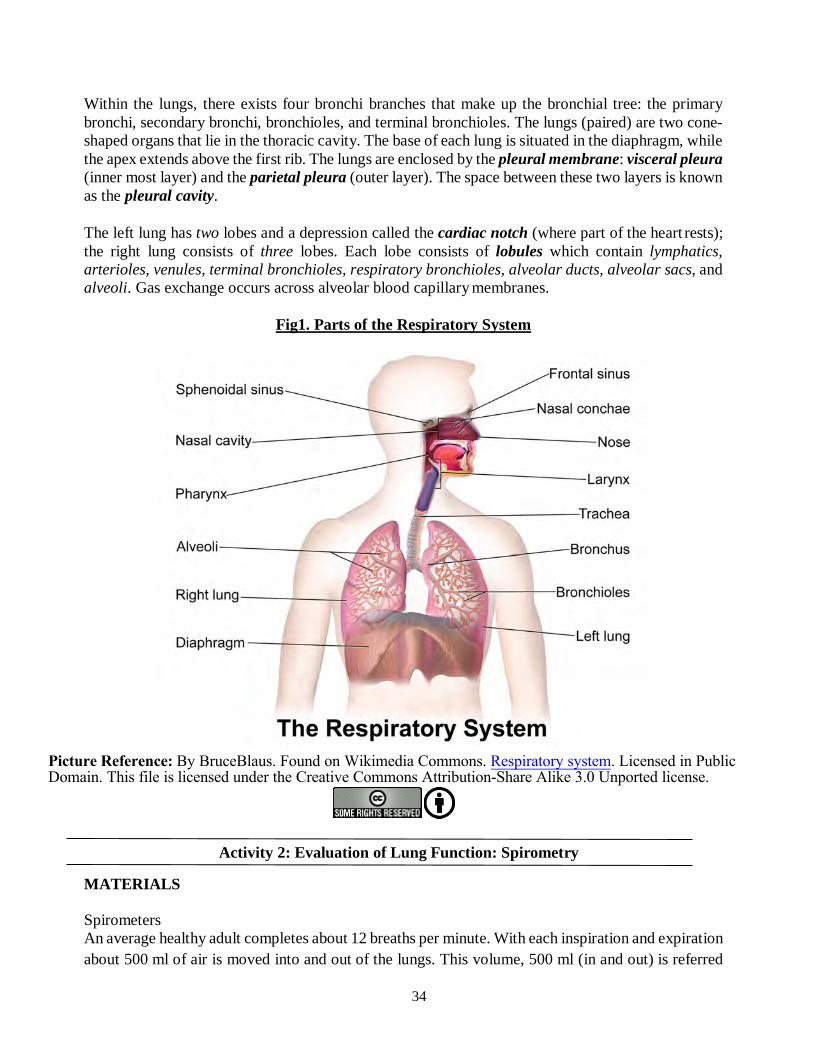
The anatomy of the respiratory system includes the nose, pharynx, larynx, trachea, bronchi, and lungs. The nose consists of bone and cartilage covered by skin and lined with mucous membrane. External nares are the openings to the exterior. The internal nares open into the throat (pharynx). The pharynx consists of three parts: nasopharynx, oropharynx, and laryngopharynx. The pharynx itself is lined with mucous membrane and is connected to the trachea via the larynx. The larynx contains the true vocal cords that are necessary to produce sound. The thyroid cartilage (Adam’s Apple) and the epiglottis (which prevents food from entering the larynx) are both prominent cartilages of the larynx. The trachea is composed of smooth muscle, C-shaped rings of cartilage, and is lined with ciliated mucous membrane. The trachea extends form the larynx to the primary bronchi.
Within the lungs, there exists four bronchi branches that make up the bronchial tree: the primary bronchi, secondary bronchi, bronchioles, and terminal bronchioles. The walls of each contain cartilaginous rings which finally disappear at the bronchiole as the bronchi become narrower.
34
Within the lungs, there exists four bronchi branches that make up the bronchial tree: the primary bronchi, secondary bronchi, bronchioles, and terminal bronchioles. The lungs (paired) are two cone-shaped organs that lie in the thoracic cavity. The base of each lung is situated in the diaphragm, while the apex extends above the first rib. The lungs are enclosed by the pleural membrane: visceral pleura (inner most layer) and the parietal pleura (outer layer). The space between these two layers is known as the pleural cavity.
The left lung has two lobes and a depression called the cardiac notch (where part of the heart rests); the right lung consists of three lobes. Each lobe consists of lobules which contain lymphatics, arterioles, venules, terminal bronchioles, respiratory bronchioles, alveolar ducts, alveolar sacs, and alveoli. Gas exchange occurs across alveolar blood capillary membranes.
Fig1. Parts of the Respiratory System
Picture Reference: By BruceBlaus. Found on Wikimedia Commons. Respiratory system. Licensed in Public Domain. This file is licensed under the Creative Commons Attribution-Share Alike 3.0 Unported license.
Activity 2: Evaluation of Lung Function: Spirometry
MATERIALS
Spirometers An average healthy adult completes about 12 breaths per minute. With each inspiration and expiration about 500 ml of air is moved into and out of the lungs. This volume, 500 ml (in and out) is referred

35
to as the tidal volume. Indeed, the 6 liters moved per minute is called the minute ventilation value. In like manner, an average healthy person would be able to inhale about 3100 ml more of air after a tidal inspiration; a volume referred to as the inspiratory reserve volume. After a tidal expiration, the average healthy adult should be able to expel an extra 1200 ml of air; a volume referred to as the expiratory reserve volume. The volume of air left in the lungs after the most forceful expiration is called the residual volume (about 1200 ml).
Lower-than-normal lung volumes usually are a sign of pulmonary disease or dysfunction, such as COPD, mentioned earlier. It should be noted that the values for the volumes listed above are averages. To determine whether someone has compromised lung function we would have to generate predictive values based on a person’s gender, age, and height. Normal lung volumes are greater when we are young. Volumes are usually larger in men and obviously large people will have larger lungs, thus a larger volume.
A respirometer, or spirometer, is the apparatus that we commonly used to measure the lung volumes and breathing rates. The lung evaluation process with such devices is called spirometry. There are many different iterations of the basic spirometer. Some are referred to as “wet” spirometers because they have an air volume chamber that floats on water. The other forms, of course, are “dry” spirometers. Some spirometers are continuous inspiration and expiration devices, others are only expiratory. For expiratory devices you must calculate inspiration values.
PROCEDURE: The instructor will demonstrate the operation of the Jones Spirometer and give each student one blank strip chart to record his or her own lung function values.
The lung volumes you will record or calculate are: • Tidal Volume (TV): The volume of air which is inhaled and exhaled with each normal
breath.• Inspiratory Reserve Volume (IRV): The volume of sir that can be inhaled after a tidal
inspiration.• Expiratory Reserve Volume (ERV): The volume of air that can be exhaled after a normal
tidal expiration.• Vital Capacity (VC): The maximum volume of air that can be exhaled from the lungs.
Each student performs the following procedure and records the required volumes as noted on the table:
1. Put a new disposable cardboard mouthpiece on the spirometer input hose. Remember, this isan expiratory spirometer. Once you exhale into it, move the mouthpiece away from yourmouth as the air comes out again. Dispose of your mouthpiece in the garbage when you aredone.
2. Make sure that the instructor has calibrated your machine with the 1 liter syringe. The stylusmark on the calibration strip chart should be exactly on 1 liter. If it is not, make sure the

36
adjustment is made. 3. Breathe in and out normally a few times and then after another normal inspiration, turn on the
strip chart tray motor and exhale as much air as you can. Turn off the tray motor immediatelyafter the exhalation. The mark on the strip chart represents the tidal volume plus the expiratoryreserve volume (TV + ERV). Record this value on the table below in the trial 1.
4. Repeat step number three and list the volume obtained in the trial 2 box.5. Reset the strip tray at the top. Take a few more quiet breaths and then after a normal
expiration, turn on the chart drive and push out as much additional air as you can. Turn offthe tray motor. The volume indicated on the strip chart represents the expiratory reservevolume (ERV) by itself. Record this number in the trial 1 box of the table.
6. Repeat step 5 and record the results in the trial 2 box under ERV.7. Reset the strip chart at the top of the top of the drive path. Take as deep a breath as you can,
turn on the chart drive and push out as much as you can. This value represents your vitalcapacity (VC).
8. The tidal volume (TV) is calculated by subtracting from the ERV + TV volumes the ERVvalues. Record the two calculations in the appropriate boxes in the table.
9. The inspiratory reserve volume (IRV) is calculated by subtracting the ERV + TV volumesfrom the VC volumes. Record these calculated volumes in the IRV boxes.
10. Take the average of the two trials for each determined and calculated volumes and enter itwhere averages are indicated.
11. Consult the tables of predicted values provided and compare it with your results.
TRIAL TV+ERV ERV TV VC IRV
1
2
AVERAGE
Activity 3: The Mechanics of Breathing
Breathing is an unconscious and continuous activity stimulated by reflex centers of the brain stem, requiring the coordinated contractions of muscles which increase and decrease the volume of the thoracic cavity. Inspiration, or inhalation, occurs as air rushes into the lungs to equalize the decreased pressure caused by the thoracic cavity enlarging. The chest cavity (thoracic cavity) increases in volume principally due to the contraction of the diaphragm; the dome-shaped muscle that separates the abdominal cavity from the thoracic cavity. As this muscle contracts, it flattens out, pushing down on the abdominal organs, thus increasing the volume of the thoracic cavity (causing a negative
37
pressure to develop). In addition to the diaphragm, there are muscles between the ribs and some of the neck area that
serve to move the ribs and sternum (breast bone) upward and outward. This also increases the volume of the thoracic cavity and contributes to the development of negative pressure. The principal muscles of these are the external intercostals. A forced inspiration may take place by consciously contracting the intercostals.
The lung tissue itself is passive and elastic. As air rushes in, it expands until the negative pressure is fully compensated for. Expiration (exhalation) is usually the result of the inhibition of the muscles of inspiration and the massive passive recoil of the tissues and organs involved. When no longer stimulated to contact, the diaphragm and chest muscles recoil back to their original shapes; the compressed abdominal organs, no longer pressed, recoil to their original shapes, and positions. The lung tissues re-expand.
Forced expiration, which may occur during heavy exertion or playing a wind instrument, is an active process usually involving contraction of the abdominal and internal intercostal muscles.
MATERIALS • Bell jar• Rubber stoppers with glass “Y”• Two balloons• Rubber membrane• Elastic bands
PROCEDURE: 1. The bell jar is fitted with the rubber membrane at the bottom and held in place with elastic
bands. This represents the chest cavity and the diaphragm.2. The glass “Y” represents the trachea and the two primary bronchi. It is fitted with the two
balloons; one attached to each of the “bronchi”. Use elastic bands to secure them.3. Before we can demonstrate the passive nature of the lungs filling and emptying, (inspiration
and unforced expiration) you must first simulate the natural position of the diaphragm. To dothis, take your clenched fist and push in on the rubber membrane. Now our diaphragm is inthe natural dome-shaped position.
4. Normal passive inhalation can now be observed as you withdraw your fist. The balloons(lungs) fill.
5. Normal passive exhalation can be observed as you “stop contracting the diaphragm” andallow it to resume its dome position by reinserting your fist.
Test Yourself 1. Define chronic obstructive pulmonary disease (COPD) and define its two principletypes, chronic bronchitis and emphysema.

38
2. What is the main function of the respiratory system?
3. Define the following:a. Tidal Volume
b. Vital Capacity
c. Inspiratory Reserve Volume
d. Expiratory Reserve Volume
4. Alveoli are tiny sacs in the lungs.
5. Air tubes in the lungs are also called .
6. Lung cancer is the leading cause of death in males and females.True or False
7. Cigarette smoking accounts for about 85% of lung cancers.True or False
8. Tuberculosis is a disease caused by a:a. Bacteriab. Virusc. Fungusd. Parasite
9. Acute inflammation of the lungs accompanied by fluid accumulation is commonlyknown as
10. Match the Values:tidal volume 6 liters minute ventilation 1200 ml inspiratory volume 3100 ml expiratory reserve 1200ml residual volume 500 ml

39
EXERCISE 6
CARDIOVASCULAR DISEASES: SIGNIFICANCE, STRUCTURE, AND ASSESSMENT
INTRODUCTION
The leading causes of death in the United States are diseases of the heart and blood vessels. Cardiovascular diseases include such conditions heart disease, stroke, hypertension, rheumatic heart disease, and congestive heart failure. Heart disease is the leading cause of death in the United States, killing about 610,000 people every year–that’s 1 in every 4 deaths.1Heart disease is the leading cause of death for both men and women. Heart disease is the leading cause of death for people of most ethnicities in the United States, including African Americans, Hispanics, and whites. For American Indians or Alaska Natives and Asians or Pacific Islanders, heart disease is second only to cancer. Coronary heart disease (CHD), also called coronary artery disease (CAD), alone affects some 7 million people in the United States each year and kills more people than any other illness. CHD/CAD is the most common type of heart disease, killing over 370,000 people annually.
For some people, the first sign of CAD is a heart attack. CAD is caused by plaque buildup in the walls of the arteries that supply blood to the heart (called coronary arteries) and other parts of the body. Plaque is made up of deposits of cholesterol and other substances in the artery. Plaque buildup causes the inside of the arteries to narrow over time, which could partially or totally block the blood flow. This process is called atherosclerosis. Too much plaque buildup and narrowed artery walls can make it harder for blood to flow through your body. When your heart muscle doesn’t get enough blood, you may have chest pain or discomfort, called angina. Angina is the most common symptom of CAD. It may feel like pressure or a squeezing pain in the chest. Over time, CAD can weaken the heart muscle. This may lead to heart failure, a serious condition where the heart can’t pump blood the way that it should. An irregular heartbeat, or arrhythmia, also can develop
Risks factors are unique characteristics a person has that are statistically associated with acquiring a disease. Some risk factors are non-modifiable, such as your gender and age, while other risk factors can be changed, like exercise and diet. Risk factors for coronary heart disease include high blood cholesterol, high blood pressure, cigarette smoking, obesity, diabetes, a sedentary life style, and a type A personality.
Other Conditions Related to Heart Aortic aneurysm and dissection are conditions that can affect the aorta, the major artery that carries blood from the heart to the body. An aneurysm is an enlargement in the aorta that can rupture or burst. A dissection is a tear in the aorta. Both of these conditions are medical emergencies.
Atrial fibrillation is a type of arrhythmia that can cause rapid, irregular beating of the heart’s upper chambers. Blood may pool and clot inside the heart, increasing the risk for heart attack and stroke.

40
Cardiomyopathy occurs when the heart muscle becomes enlarged or stiff. This can lead to inadequate heart pumping (or weak heart pump) or other problems. Cardiomyopathy has many causes, including family history of the disease, prior heart attacks, uncontrolled high blood pressure, and viral or bacterial infections
Congenital heart defects are problems with the heart that are present at birth. They are the most common type of major birth defect. Examples include abnormal heart valves or holes in the heart’s walls that divide the heart’s chambers. Congenital heart defects range from minor to severe.
Heart failure is often called congestive heart failure because of fluid buildup in the lungs, liver, gastrointestinal tract, and the arms and legs. Heart failure is a serious condition that occurs when the heart can’t pump enough blood to meet the body’s needs. It does not mean that the heart has stopped but that muscle is too weak to pump enough blood. The majority of heart failure cases are chronic, or long-term heart failures.
Rheumatic heart disease is damage to the heart valves caused by a bacterial (streptococcal) infection called rheumatic fever.
OBJECTIVES: By the end of this exercise, students must be able to:
1. Identify the anatomy of the heart2. Know the functions of different parts of the heart3. Understand blood flow through heart and body4. Learn how to measure pulse rate and blood pressure5. Learn how to do blood typing
Activity 1: Learning the General Anatomy of the Heart and Blood Flow
MATERIALS: Anatomical model: Heart Anatomical charts: Heart and Blood Circulation
PROCEDURE: 1. Follow the instructor’s explanation and demonstration of the anatomy of the heart.2. Study the models at your tables and learn the anatomical features discussed.3. Refer to the charts as supplements.4. Inspect and study the torso model and understand the relation of the heart to its surrounding
structures.
HEART The heart is found below the sternum (breastbone), between the lungs, in an area we refer to as the mediastinum. The heart is composed mostly of muscle tissue, the myocardium and pericardial membrane covers the heart. The pericardial membrane actually forms the outer layer of the heart and is called the epicardium. The lining of the heart is called the endocardium. There are four

41
chambers within the heart, two atria and two ventricles. The function of the two atria is to collect blood before it is pumped. The right atrium collects blood from the body, which needs oxygen and needs to get rid of carbon dioxide. The left atrium collects blood from the lungs which has had these tasks done. The function of the ventricles is to pump blood. The right ventricle gets blood from the right atrium and pumps it to the lungs. The left ventricle gets blood from the left atrium and pumps it into the aorta, to the entire body.
Separating the two atria from the two ventricles are one- way valves that prevent blood from returning to the atria. The valve separating the right atrium from the right ventricle is called the tricuspid. The valve separating the left atrium from the left ventricle is called the mitral. Sometimes blood regurgitates back through the closed valves, because the flaps of the valves do not fit tightly. The sounds that are made by regurgitation are called murmurs. They may result from damage caused by rheumatic fever or certain drugs (for example, the Phen- Fen diet drugs). When your doctor is listening to your heart,he/she is listening to
Figure 1: Diagram of the Human Heart
Picture Reference: By Wapcaplet. Found on Wikimedia Commons. Diagram of the human heart. Licensed in Public Domain. This file is li censed under the Creative Commons Attribution-Share Alike 3.0 Unported license. these valves as well as the two
valves that are preventing blood from returning to the ventricles, after they pump. These valves are called the semilunar valves. One is in the blood vessel that is taking the blood to the lungs (pulmonary semilunar valve) and one is in the blood vessel taking blood to the body (aortic semilunar valve). When the tricuspid and mitral valves close (at the same time) the resulting sound is a low pitch “lubb”. When the two semilunar valves close (together) the resulting sound is a higher pitch “dupp”.
Contraction of heart muscle is called systole. When it relaxes it is called diastole. The two atria contract together and then relax together; as do the ventricles. When the atria are in systole the ventricles are in diastole. The heart is autorhythmic. That is to say it causes its own beat. There is a patch of tissue located in the wall of the right atrium called the sinoatrial node, or pacemaker. It sends out impulses to contract which (when modified by an autonomic nervous system neurotransmitter) causes the average heart to beat about 75 beats per minute. Hearts that beat abnormally fast, over 100 times per minute are said to be in tachycardia. On the other hand, hearts that beat abnormally slow, less than 60 beats per minute, are in bradycardia. People who are more

42
athletically conditioned usually have much slower heart rates because their hearts are able to pump more efficiently. Many drugs, like the caffeine in our coffee, can speed up or slow down the heart. We can look at the electrical activity of the heart as the contraction stimulus moves through the heart muscle with a machine called an electrocardiograph. This device produces a recording called an electrocardiogram (ECG). The ECG can tell us if the conduction system is abnormal, how fast the heart is beating, if the heart is enlarged, and if the heart muscle has been damaged (for example, by a heart attack).
BLOOD VESSELS Arteries take blood away from the heart and veins bring blood to the heart. Capillaries connect arteries and veins to each other. Capillaries can be considered the “business end” of this system because they are where most materials are exchanged between the blood and the tissues. Capillaries are microscopic, having walls that are only one cell thick. Veins and arteries have several layers of tissues and range in size from very large to almost microscopic. Arteries have relatively thick and robust walls that allow them to handle blood under pressure. Veins, on the other hand have relatively thin and weak walls. Blood pressure in veins is very low.
When the left ventricle goes into systole (contracts), it pushes blood under pressure into the aorta (the largest artery of the body). This bolus of pressure causes the aorta to expand and then recoil. This phenomenon helps to push the blood along. This wave is passed along the aorta and then to smaller arteries, still helping to move the blood. We feel this wave as pulse. By helping to move the blood along, this wave of expansion and recoil takes work off of the heart. As we get older, then elastic fibers in the arteries start to breakdown, we call this hardening of the arteries, or arteriosclerosis.
Arteriosclerosis makes the heart work harder because the “expansion and recoil” becomes less effective. As the heart works harder, it may enlarge a risk factor for a heart attack (myocardial infarction). Often times, because we either produce too much cholesterol in our bodies or we eat too much of it in our food, we develop plaques (atheroma) in the walls of our arteries. This condition, atherosclerosis, adds to the normal pathology of arteriosclerosis and puts a person at high risk for spontaneous blood clot (thrombosis) and perhaps a myocardial infarction (MI).
Blood pushing on the walls of blood vessels is called blood pressure (BP). When the ventricles contract, blood pressure develops in both the pulmonary artery going to the lungs and in the aorta going to the body. The “pulmonary circuit”, however, is relatively low pressure and is usually not of great concern to us.
Activity 2: Measuring Pulse Rate
MATERIALS: Watch or timer (two per table)
PROCEDURE: 1. Your first task here is to determine your lab partner’s pulse rate. You will count the beats you feelfor 15 seconds and then multiply that number by 4 to get beats per minute.

43
2. Any artery that lies near the surface and runs over bone may easily be used. Select several common pulse points listed below and see if you are able to get the same rate for each. Record the first rest results.
Record Pulse Rates:
artery beats/min.
artery beats/min.
artery beats/min.
Activity 3: Measuring Blood Pressure
Blood pushing on the walls of blood vessels is called blood pressure (BP). When the ventricles contract, blood pressure develops in both the pulmonary artery going to the lungs and in the aorta going to the body. The “pulmonary circuit”, however, is relatively low pressure and is usually not of great concern to us.
Blood pressure going into the “systemic circuit” (the body) is high and of great clinical importance to us. If it is too low, the capillaries will not have enough pressure to perfuse the tissues. If it is too high, it can rupture capillaries and cause such things as kidney failure, heart disease, and stroke. A normal, young, and healthy person will develop about 120 mmHg of pressure in their aorta during left ventricular systole. This is called the systolic pressure. When the left ventricle relaxes (goes into diastole) the pressure in the aorta is about 80 mmHg. This is called the diastolic pressure. We would normally report this person’s blood pressure as “120 over 80”; or 120/80. A person who has a systolic pressure regularly over 130 mmHg or a diastolic pressure regularly over 90 mmHg is hypertensive; has high blood pressure.
Pulse pressure is the difference between the systolic and diastolic pressures. For a normal healthy person this would be about 40 mmHg (120-80 = 40). Pulse pressure is used to calculate an important value, the mean arterial blood pressure (MABP). This is the pressure that indicates whether there is sufficient force to perfuse the tissues with blood. The mean arterial pressure is calculated by adding the diastolic blood pressure and one third of the pulse pressure:
MABP = diastolic BP + 1/3 (systolic BP – diastolic BP)
Artery Location Dorsal pedis Superior to instep
of foot Radial Distal half of
wrist Facial Lower jaw at
corner of mouth Common carotid Lateral to voice
box Superficial temporal
Side of eye orbit
Popliteal Back of knee

44
Thus, a person with a BP of 120/80, would have a MABP = 80 + 1/3(40), or about 93mmHg.
MATERIALS: • Sphygmomanometer (two per table)• Stethoscope (two per table)
PROCEDURE:
Learning to take blood pressure requires you to learn how to hear carefully. Indeed, the lab room noise must be kept to an absolute minimum. As with pulse, you will take a blood pressure reading before and after exercise. However, since we normally take our reading at one location, only three readings are required. Carefully watch as your instructor demonstrates this procedure.
1. Locate the brachial artery above the antecubital area (front of the elbow) of the arm of your laboratory partner.2. The cuff of the sphygmomanometer is wrapped around the upper arm, covering the brachial artery.3. The pressure dial is affixed to wrapped cuff so that it can easily be seen. At this time, take your stethoscope and place the bell firmly on the antecubital area. Fit the earpieces so they are comfortable in your ears.4. Make sure that the valve on the compressible hand bulb is closed and then start pumping.5. As pressure increases in the cuff, the brachial artery starts to collapse. Since we do not know what your partner’s blood pressure will be, keep pumping until the dial pressure exceeds 160 mmHg. It may be their systolic exceeds 160 and you may have to repeat this step, going to a higher pressure. The brachial artery is totally compressed when this step is completed; there is no blood flow through it. You can confirm this by checking to make sure there is no pulse.6. Slowly turn the valve on the hand pump bulb, releasing pressure in the cuff. At the same time listen carefully with the stethoscope.7. Note the pressure on the dial when you first hear a spurt of blood push through the artery. This pressure is the systolic (SBP).8. Continue to listen to the pulsating spurts until they seem to disappear. The pressure indicated on the dial when the sound disappears is the diastolic (DBP).9. Record both pressures in the “before” column10. Have your lab partner run in place for two minutes, immediately after which you take the second blood pressure reading.11. Wait for about 5 minutes and take a third blood pressure. Note the changes in blood pressure from before to after. Was the last reading comparable to the first?
BP before exercise: BP just after exercise:
SBP DBP SBP DBP
BP 5 min. after exercise: SBP DBP 12. Calculate the pulse pressure (SBP-DBP): mmHg 13.
Calculate the mean arterial pressure (see above): mmHg

45
Test Yourself 1. Cardiovascular diseases include such conditions as: (list)
2. Heart disease is the leading cause of death in the United States, killing about 610,000people every year.a. Trueb. False
3. The following are all risk factors for coronary heart disease EXCEPT?a. Type A personalityb. Obesityc. Diabetesd. Asbestos
4. The heart is found below the sternum and between the lungs in a placed referred to asthe mediastinum:a. Trueb. False
5. Pericardial membrane forms the outer layer of this organ:a. Lungsb. Heartc. Mediastinum
6. Which of the following forms the outer layer of the heart?a. endocardiumb. ventriclesc. atriad. epicardium
7. The valves that prevent blood from returning to the ventricles after they have pumpedarea. Semilunar valvesb. Aortic valvesc. Pacemakersd. Tricuspid valves
8. Draw the flow of blood through the heart. Name all chambers, valves, arteries and veins.

46
EXERCISE 7
BLOOD: SIGNIFICANCE, DISEASES AND ASSESSMENTS
INTRODUCTION
BLOOD
The principal purpose of the cardiovascular system is to move blood and thereby transport oxygen, carbon dioxide, hormones, nutrients, metabolic waste products, electrolytes, vitamins, water, elements and cells of our immune system, and heat. These substances must be picked up from their sources and delivered to their destinations when needed, if homeostasis, or health, is to be maintained. Oxygen is acquired at the lungs and is transported to the capillaries of tissues to be off-loaded. Carbon dioxide is picked up from the tissues and transported to the capillaries of the lungs for off-loading. Nutrients are picked up from the intestines and transported to the liver and then to the body’s tissues.
Unfortunately, as with other systems and tissues of the body, human blood demonstrates and participates in many pathologies, or disease conditions. Blood borne and associated diseases are of grave concern to public health worldwide. It is noted that clinical care providers examine blood more than any other tissue in the body when trying to determine the cause of disease.
Blood borne viral diseases include forms of hepatitis, which affects the liver, infectious mononucleosis, which causes abnormally high numbers of white blood cells to form, and AIDS, which destroys the cells of our immune system. Drugs in the blood may cause hepatitis, leukopenias (abnormally low numbers of white blood cells), and types of anemia (inability of the blood to carry sufficient oxygen). Bone marrow cancer often produces a polycythemia, too many red blood cells. Blood cancers are called leukemias, causing abnormally large numbers of white blood cells (leukocytosis). Sickle-cell anemia is a genetic disease affecting the hemoglobin molecules, so they cannot bind to much oxygen. Radiation, drugs, and cancers can cause the platelets of the blood (involved with clotting) to decrease dramatically in number, causing a thrombocytopenia. Blood also carries dietary-acquired molecules and elements responsible for blood vessel and nervous system disease. LDL cholesterol is involved with the development of atherosclerosis. Lead poisoning (often from kids eating paint chips) impairs neurological and intellectual functions.
Blood is considered a fluid connective tissue. It has two phases to it, one liquid and the other solid. The solid phase represents the formed elements, the red blood cells, the white blood cells, and the platelets. The red cells are involved with gas transport, the white cells are involved with protection, and the platelets are involved with the blood clotting process.
OBJECTIVES By the end of this exercise, students must be able to:
1. Composition of Blood2. Perform hematocrit count and blood typing3. Learn about blood borne infectious diseases

47
4. Learn to perform ELISA to detect HIV-1 using simulated patient samples
Activity 1: Packed Cell Volume or Hematocrit
The formed elements of the blood, the RBC’s (erythrocytes), the WBCs (leukocytes), and the platelets (thrombocytes) make up about 45% of the blood volume for the population in general. Males, on average, are usually somewhat higher (47.0 + 7 %) than females (42.0 + 5 %). The balance of the blood volume is made up of plasma (about 55%, on average).
The test used to evaluate the percentage relationship between the formed elements and the plasma is usually called the hematocrit. However, it is also referred to as the packed cell volume. This is because the test more accurately describes what is really being measured. That is, included in this measurement are the white blood cells and the platelets. However, platelets are very tiny cell fragments and there are only 5,000 to 10,000 white blood cells versus 5 million or so red blood cells.
Clinically, the hematocrit test is used to screen for certain anemia. An anemia is a condition in which the blood has a reduced capacity to carry oxygen. It is usually due to either a decrease in the number of red blood cells in circulation or to a decrease in the amount of hemoglobin in the red blood cells. The hematocrit test tells us about the number of red blood cells, expressed as a percentage.
Erythrocytes, or red blood cells (RBC), carry about 98% of the oxygen in the blood. They occur in the blood at a concentration of about 5 million cells per micro liter. Males average slightly more and females average slightly less. Abnormally low numbers usually indicate anemia and high numbers of polycythemia. While we reflexively think of abnormal numbers as indicators of disease, sometimes it is not the case. For example, people living at high altitudes, such as Denver, usually demonstrate a “normal” polycythemia. Since the concentration of oxygen in the air is lower at higher altitudes, the body compensates by making more red blood cells to capture the oxygen available more efficiently. This normal adjustment is called a physiological polycythemia.
Leukocytes, or white blood cells (WBC), are normally found in concentrations of between 5,000 and 10,000 per micro liter. These cells provide us with protection against a variety of potential pathogens. People with infections may have many more leukocytes as the body does battle with the microbes. People with AIDS may have considerably fewer WBCs as the pathogenic virus destroys them. Within the WBC population of cells, we find 5 different types. These are the eosinophils, basophils, neutrophils, lymphocytes, and monocytes. Each of these cell types has their own jobs to and they normally occur in predicable numbers. Neutrophils, for example, phagocytes (eat) bacteria and some fungi. Among their functions, Basophils provide chemicals, like histamine, that aide in the inflammatory reaction, attracting other white blood cells to the site of the inflammation. Lymphocytes provide us with our immune systems; the T cells and B cells that are able to “remember”. Monocytes, like neutrophils, are phagocytic, but they are able to engulf larger “prey” and they are able to leave the blood (and become known as macrophages) and wander around the body and provide protection almost everywhere. The eosinophils perform several functions, but they are most noted for their roles in attacking parasitic worms and lessening the effects of allergic reactions. Indeed, if a differential count identified an increase in eosinophils, we might suspect that the patient is either infected with some parasite or has had a severe allergic reaction.

48
Your instructor will demonstrate the entire procedure before you attempt it. Make sure you ask questions if you do not understand something.
MATERIALS: • Hematocrit centrifuge• Heparinized hematocrit capillary tubes• Lancets• Alcohol swabs• Cotton balls• Sealing clay
PROCEDURE: 1. Clean a finger from which a blood sample will be taken, using an alcohol swab.2. Swing the arm to move blood toward the hand.3. Use a lancet to jab the finger.4. As a drop of blood appears, hold the capillary tube with the red-line end away from you,
angled down, to it. The blood will fill the tube by capillary action. Make sure you fill thetube at least ¾ full.
5. Hold a cotton ball to the puncture wound and seal the capillary tube.6. Sealing is accomplished by pushing the tube, from the fill end, into the sealing clay.7. Mount the hematocrit tube on the head of the hematocrit centrifuge, inserting the red-
marked end of the tube toward the center; the clay sealed end toward the outer margin.8. Make sure that each student mounts his/her tubes across from another tube, to balance the
weight. If there is an “odd” tube, counter balance with a tube with water.9. Place the head cover on the centrifuge, screw it down securely.10. Turn the centrifuge on and let it spin for 4-5 minutes.11. When the spinning has stopped and the head cover is removed, determine the packed cell
volume (hematocrit) by using the built-in hematocrit tube reader on the head.12. The separated blood will demonstrate packed RBCs toward the outside and the yellowish
clear plasma toward the center.13. Align the reader scale to the top of the blood sample (the free end of the plasma), and read
the % volume. Record you results:
Hematocrit (packed cell volume) = %
Activity 2: ABO Blood Typing
The outer surface of red blood cells has a variety of glycoprotein and glycolipid molecules attached to it designated by letters such as A, B, M, N, Rh, and others. The presence of these molecules is determined genetically. Those that are on the surfaces of your red blood cells are the result of what you mother and father contributed to you at conception. We refer to these molecules as antigens, or agglutinogens. We also usually find in plasma, proteins called antibodies, or agglutinins that are capable of reacting with red blood cells having different antigens, making them clump together, a process called agglutination.
Clinically, most of the RBC surface molecules are not important. Those that are most significant are the A, B, and Rh antigens. The A and B are part of what we call the ABO blood group. The O designation is actually referring to the absence of an antigen. The mechanics of

49
understanding the ABO group is fairly easy to understand. There are three possibilities (alleles) we can inherit, an A antigen, a B antigen, or O, no antigen. Since we only have two parents, we can only inherit two of these three possibilities (alleles). The possible combinations of the antigens A and B, and the lack of antigen, O are as follows: AA two antigens for A AO one antigen A and one no antigen (O) AB one antigen A and one antigen B BB two antigens for B BO one antigen B and one no antigen (O) OO no antigens
Remember, one of each of these combinations came from each parent. The combination of these two possibilities (alleles) is the person’s genotype for the ABO blood group. When we do blood typing, we do not determine the genotype, we merely identify which antigens are present.
A person with the genotype AA would test out as blood type “A”. A person with genotype AO also has the A antigen and therefore test out as blood type “A”. Someone with genotype AB has both antigens A and B, so they would test out as blood type “AB”. The genotype OO has neither antigen, so they would test out as blood type “O”.
Someone with blood type “A” has antibodies against antigen B. Someone with blood type “B” has antibodies against antigen A Someone with blood type “AB” has no antibodies against antigen A or B. Someone with blood type “O” has antibodies against both antigens A and B.
Therefore, someone who is: type A can get blood only from a type A or a type O; type B can get blood only from a type B or a type O; type AB can get blood only from a type A, type B, type AB or type O; type O can only get blood from a type O
Type AB is called the universal receiver and type O is called the universal donor. In this exercise we will only test our blood to see what ABO blood group type we have, A, B, AB,
or O.
MATERIALS: Microscope slides, Anti-A serum (has antibodies against A); Anti-B serum (has antibodies against B), Toothpicks, Alcohol swabs, Wax pencils, Lancets, Cotton balls, Light tray
PROCEDURE: 1. Lay a clean slide on a paper towel and with a wax pencil mark A and B on different ends.2. Clean a finger with an alcohol swab and swing its arm to move blood toward the finger.3. Jab the finger with the lancet and place one drop of blood at the site marked A and one drop ofblood at the slide site marked B. Hold cotton ball to puncture wound.4. Place one drop of anti-A serum on the slide site marked “A” and one drop of anti-B serum onthe site marked “B”.5. Mix the blood and anti-sera together with clean toothpicks.

50
6. Move the slide to a light tray for easier observation.
The test is read as follows: Reaction A Reaction B Blood Type Result No Reaction A and No Reaction B Have Blood Type O No Reaction A and Is Reaction B Have Blood Type B Is Reaction A and Is Reaction B Have Blood Type AB Is Reaction A and no Reaction B Have Blood Type A
7. Make sure lancets and used slides are put in sharps container and other materials are disposed ofappropriately.
Fig 1. ABO blood group and Rh factor agglutination test
Picture reference: Blood Typing test
Activity 3: Detection of HIV-1 by ELISA in simulated patient samples
Blood borne Infectious Diseases: HIV/AIDS and Hepatitis Exposures to blood and other body fluids occur across a wide variety of occupations. Health care workers, emergency response and public safety personnel, and other workers can be exposed to blood through needlestick and other sharps injuries, mucous membrane, and skin exposures. The pathogens of primary concern are the human immunodeficiency virus (HIV), hepatitis B virus (HBV), and hepatitis C virus (HCV). Workers and employers should take advantage of available engineering controls and work practices to prevent exposure to blood and other body fluids.
Hepatitis A is a vaccine-preventable, communicable disease of the liver caused by the hepatitis A virus (HAV). It is usually transmitted person-to-person through the fecal-oral route or consumption of contaminated food or water. Hepatitis A is a self-limited disease that does not result in chronic infection. Most adults with hepatitis Hepatitis A rates in the United States have declined by more than 95% since hepatitis A vaccine first became available in 1995. (National Notifiable Diseases Surveillance System (NNDSS).
Hepatitis B is a liver infection caused by the Hepatitis B virus (HBV). Hepatitis B is transmitted when blood, semen, or another body fluid from a person infected with the Hepatitis B virus enters

51
the body of someone who is not infected. This can happen through sexual contact; sharing needles, syringes, or other drug-injection equipment; or from mother to baby at birth. For some people, hepatitis B is an acute, or short-term, illness but for others, it can become a long-term, chronic infection. Chronic Hepatitis B can lead to serious health issues, like cirrhosis or liver cancer. The best way to prevent Hepatitis B is by getting vaccinated.
Hepatitis C is a liver infection caused by the Hepatitis C virus (HCV). Hepatitis C is a blood-borne virus. Today, most people become infected with the Hepatitis C virus by sharing needles or other equipment to inject drugs. For some people, hepatitis C is a short-term illness but for 70%–85% of people who become infected with Hepatitis C, it becomes a long-term, chronic infection. Chronic Hepatitis C is a serious disease than can result in long-term health problems, even death. The majority of infected persons might not be aware of their infection because they are not clinically ill. There is no vaccine for Hepatitis C. The best way to prevent Hepatitis C is by avoiding behaviors that can spread the disease, especially injecting drugs.
Hepatitis D, also known as “delta hepatitis,” is a liver infection caused by the hepatitis D virus (HDV). Hepatitis D is uncommon in the United States. There is no vaccine for Hepatitis D.
Hepatitis E is a liver infection caused by the Hepatitis E virus (HEV). Hepatitis E is a self-limited disease that does not result in chronic infection. While rare in the United States, Hepatitis E is common in many parts of the world. It is transmitted from ingestion of fecal matter, even in microscopic amounts, and is usually associated with contaminated water supply in countries with poor sanitation. There is currently no FDA-approved vaccine for Hepatitis E.
HIV stands for human immunodeficiency virus. It weakens a person’s immune system by destroying important cells that fight disease and infection. specifically, the CD4 cells, often called T cells. Over time, HIV can destroy so many of these cells that the body can’t fight off infections and disease. These special cells help the immune system fight off infections. Untreated, HIV reduces the number of CD4 cells (T cells) in the body. This damage to the immune system makes it harder and harder for the body to fight off infections and some other diseases. Opportunistic infections or cancers take advantage of a very weak immune system and signal that the person has Acquired immune deficiency syndrome (AIDS).
HIV and AIDS remain a persistent problem for the United States and countries around the world. While great progress has been made in preventing and treating HIV, there is still much to do. No effective cure exists for HIV. But with proper medical care, HIV can be controlled. Most commonly, people get or transmit HIV through sexual behaviors and needle or syringe use. Only certain body fluids—blood, semen (cum), pre-seminal fluid (pre-cum), rectal fluids, vaginal fluids, and breast milk—from a person who has HIV can transmit HIV. Today, more tools than ever are available to prevent HIV. One can use strategies such as abstinence (not having sex), limiting number of sexual partners, never sharing needles, and using condoms the right way every time one has sex.
An estimated 1.1 million people in the United States had HIV at the end of 2016, the most recent year for which this information is available. Of those people, about 14%, or 1 in 7, did not know

52
they had HIV. The annual number of new diagnoses has declined 9% from 2010 to 2016 in the 50 states and the District of Columbia. In 2018, gay, bisexual, and other men who have sex with men accounted for 69% of all new HIV diagnoses in the United States and 6 dependent areas. In the same year, heterosexuals made up 24% of all HIV diagnoses. If we look at HIV diagnoses by race and ethnicity, we see that Blacks/African Americans are most affected by HIV. In 2018, adult and adolescent Blacks/African Americans accounted for 42% of all new HIV diagnoses. Additionally, Hispanics/Latinos are also strongly affected. They accounted for 27% of all new HIV diagnoses.
Fig1. New HIV Diagnoses in the United States and 6 Dependent Areas by Transmission Category, 2018
Picture Reference: (New HIV Diagnoses in the United States and 6 Dependent Areas by Transmission Category, 2018 )
Fig 2. New HIV Diagnoses by Race/Ethnicity, 2018

53
Picture Reference: (New HIV Diagnoses by Race/Ethnicity, 2018 )
MATERIALS: Microtiter plates, transfer pipets, micro test tubes with caps, plastic tubes, 50 ml, simulated HIV antigen, positive control (primary antibody), donors’ serum-1 &2, secondary antibody, hydrogen peroxide, p amino alicyclic acid peroxide co-substrate, pbs concentrate
PROCEDURE: For this lab activity, you will work with the entire group on your table. You will perform an ELISA test on simulated samples of patients from a kit, AIDS Kit I: Simulation of HIV-1 detection by ELISA from Edvotek Company. In this simulation experiment, two simulated samples ae used and ELISA test is conducted to see if they are HIV-1 positive. An ELISA is a colorimetric assay based on specific antigen-antibody binding. In this specific test we are screening for anti-HIV-1 IgG antibody.
Fig. 3 ELISA procedure
1. Carefully follow all the directions from the instruction sheet. Do not cross contaminate thesamples.2. Record the results in Table 1.
RESULTS:
Table 1: ELISA results for HIV-1 Well Number
(Sample type) Color change HIV-1 (+/-)
1. Negative control2. Positive control3. Donor sample #14. Donor sample #2
Note: 1. This experiment is a simulation of a test to detect HIV-1 IgG levels. None of the components
1. Add HIV virus 2. Add primary antibody 3. Add secondary antibodylinked to enzyme
4. Add substrateand look for colorchange

54
have been prepared from human or animal sources. All reagents are simulations. 2. In this experiment, the color change will indicate the presence or absence of HIV-1 IgG and notthe quantity of how much virus is present.
Test Yourself 1. Two blood borne viral diseases list in your lab are and explain their characteristics: (list)
2. in the blood may cause hepatitis, leukopenia and types of anemia.
3. Sickle-cell anemia is not a genetic disease that affects hemoglobin molecules disabling them frombinding to oxygen.True or False
4. Explain Leukemia.
5. What are three causes for a decreased number of platelets and what is that condition called?
a. Leukopeniasb. Thrombocytopeniac. Atherosclerosisd. Hepatitis
6. LDL cholesterol is involved with the development of .
7. Red blood cells also go by the namee. Erythrocytesf. Polycythemiag. Leukocytesh. Platelets
8. Define and explain physiological polycythemia.
9. What do white blood cells, also known as , do for our bodies?

55
EXERCISE 8
URINARY SYSTEM: STRUCTURE, DISEASES AND ASSESSMENT
INTRODUCTION
Urinary system and Urine:
The branch of study in medicine that deals with the urinary tracts of both men and women and the reproductive system of males, is called urology. The male system is often referred to as urogenital because part of his reproductive structures is also used by his urinary system. The female reproductive structures do not share common function with the urinary system. The medical specialty of obstetrics and gynecology specializes in the female reproductive system. The study of the kidney alone is called nephrology.
Kidney and urologic diseases affect more than 13 million Americans, causing about 260,000 deaths per year. As the populations of older adults, racial groups, and ethnic minorities grow so will these numbers. Problems in the urinary system can be caused by aging, injury, or illness. Diseases range from the fairly easy-to-treat to those that are life threatening. The following are some of the most serious or debilitating disorders.
Kidney stones, or calculi, are crystals of salts that have precipitated into insoluble forms in the kidneys or elsewhere in the urinary system. Conditions leading to stone formation include too much calcium consumption, low water intake, abnormal pH of the urine, and problems with a hormone from the parathyroid gland. They range greatly in size and may cause a little or debilitating pain. Some stones are passed naturally during urination; others are usually broken with sound wave treatment (lithotripsy). Kidney stones affect men more than women.
Renal failure (kidney failure) occurs when the kidneys are not able to perform their vital functions of waste removal from the blood and water and electrolyte balance for the body. Acute renal failure may be caused by an accident that either causes massive bleeding or direct injury to the kidneys, or due to some drugs and poisons. Recovery from the injuries or withdrawal of the offending chemicals may restore kidney function. Chronic kidney failure, on the other hand, is a slow and progressive condition that may lead to a permanent kidney failure, or end-stage renal disease (ESDR). The cause of most end stage renal disease is associated with diabetes, hypertension, and glomerulonephritis.
Benign prostatic hyperplasia (BPH) is a problem in men affecting the prostate gland. The prostate forms part of the tube through which the urine must pass as it leaves the bladder. BPH is an enlargement of the prostate that can interfere with urination by squeezing the urethra. It is estimated that about 50% of men over 60 years old and that 80-90 % of the men over 80 years old suffer from BPH.
Prostatitis is an inflammation of the prostate gland causing a variety of symptoms, such as pain in the genital area, lower back pain, urinary frequency, and painful urination. In some cases, it is

56
caused by a bacterial infection, however, the most common forms of it are not associated with any specific cause.
Urinary tract infection (UTI) is as term used to describe either an infection of a part of the urinary system or the presence of microbes in the urine. Urinary tract infections include urethritis (an inflammation of the urethra), cystitis (an inflammation of the urinary bladder), and polynephritis (an inflammation of the kidneys). Since females have a much shorter urethra, they tend to have more UTIs. Symptoms may include low back pain, urgent and frequent urination, bed-wetting, and burning urination.
Painful bladder syndrome, or interstitial cystitis, is a condition in which the bladder wall becomes inflamed and irritated and can lead to a scarring and stiffening of the bladder. Ulcers, bleeding and a decreased bladder capacity can result. The cause is unknown.
Glomerulonephritis is an inflammation of the kidneys that often results from an allergic reaction to the toxin produced by streptococcal bacteria that have recently infected the throat or some other area. The inflammation can progress to the point where the kidneys cannot filter properly and may be damaged permanently. This is a cause of chronic renal failure.
Age is another cause for kidney malfunctions. With age, the kidneys shrink. Between the ages of 40 and 70 renal filtration and blood flow rates decline by 50%. Kidney diseases such as acute and chronic kidney inflammations, as well as renal calculi all become more common with age. Indeed, urinary tract infections are more common among the elderly, as are nocturia (excessive urination at night), hematuria (blood in the urine), polyuria (excessive urine production), increased frequency of urination, urinary retention or incontinence, and dysuria (painful urination).
Functions of the Urinary System
The urinary system functions in several capacities. Its principal activities are to maintain the delicate balance between the volume and composition of the body fluids and to rid the body of metabolic wastes.
The kidneys filter blood continuously, allowing toxic substances, wastes, and excess ions to leave the body in the urine, at the same time returning to the blood substances that are needed. While performing these excretory functions, the kidneys simultaneously adjust the balance between water and salts and between acids and bases.
Other regulatory functions include helping to maintain blood pressure, through the renin- angiotensin pathway, and helping to maintain the oxygen carrying capacity of the blood by producing the bone marrow stimulating hormone erythropoietin, when low blood oxygen is detected.
OBJECTIVES: By the end of this exercise, students must be able to:
1. learn the anatomy of the urinary system and the nephron and understand their functions2. Perform urine analysis

Activity 1: Anatomy of the Urinary System and Anatomical Function
MATERIALS: Human torso model (two), Urinary system wall chart, Model of the nephron
PROCEDURE: 1. Study the human torso model and identify all of the parts of the urinary system noted in the
introduction. Know the anatomical relationships between the parts of the urinary systemand the organs surrounding it. Observe the position of the kidneys in the back region. Arethe kidneys well protected from injury? Look at the position of the urinary bladder. Is iteasy to see why females have more UTIs?
2. Use the wall chart to reinforce your understanding. Different presentations often revealitems you may have missed on a previous presentation.
3. Study the model of the nephron. Locate and learn the anatomical features noted in theintroduction.
The urinary system is easily constructed. Its principal components are:
Figure1. Urinary System
1. Urinary system2. Kidney3. Renal pelvis4. Ureter5. Urinary bladder6. Urethra (Left side with frontalsection)7. Adrenal gland8. Renal artery and vein
10.Abdominal aorta9. Inferior vena cava
11.Common iliac artery and vein12.Liver13.Large intestine14.PelvisPicture Reference: By Jordi March iNogué. Found on Wikimedia Commons.Urinary system . Licensed in PublicDomain. This file is licensed under theCreative Commons Attribution-ShareAlike 3.0 Unported license.
57

58
2 Kidneys – Bean-shaped, reddish in color– Located in the lower part of the back, partly below the rib cage– 4-5 inches long, 2-3 inches wide, 1 inch thick– Composed of functional nephrons2 Ureters– Muscular tubes, 10-12 inches long– Transports urine form the renal pelvis of the kidney to the urinary bladder by
peristalsis– “squirts” small amount of urine into bladder every 10-15 secondsBladder– Hollow, muscular, distensible– Posterior to pubic symphysis– In males anterior to rectum– In females anterior to vagina, inferior to uterus– 700-800 ml capacityUrethra– Tube leading from bladder to exterior– Starts at internal urethral sphincter– External urethral sphincter muscle is voluntary– Females, 1.5 inches long, in males 6-8 inches long
The functional unit of the kidneys is the nephron. This is where the business of the urinary system takes place. There are over 1 million nephrons in each kidney.
Figure 2: Structure of a Nephron
Picture Reference: Transferred from en.wikibooks to Commons by Adrignola using CommonsHelper. The original uploader was Sunshineconnelly at English Wikibooks. Structure of a nephron . Licensed in Public Domain. This file is licensed under the Creative Commons Attribution-Share Alike 3.0 Unported license.

59
Each nephron consists of: 1. Renal Corpuscle- function is filtration
– Glomerulus: knot of capillaries extending from the arterioles whose ultimate originis the renal artery; provides blood under pressure.
– Glomerular Capsule: surrounds glomerulus, receives filtrate– Renal Tubule- its function is reabsorption of selected filtered molecules and
secretion of unfiltered molecules from blood to filtrate.– Proximal convoluted tubule– Loop of Henle– Distal convoluted tubule
Blood from the renal arteries enters the kidneys to be filtered. The renal artery subdivides ultimately into the afferent arterioles, which enter the nephrons, located in the renal cortex of the kidney. The cortex is the outer part of the organ. The internal tissue of the kidney is called the renal medulla. As the afferent arteriole enters the nephron it forms a knot, or tuft, of capillaries called the glomerulus.
The glomerulus is part of the first anatomical section of the nephron, the renal corpuscle. The second part of the renal corpuscle is the Glomerular capsule, or Bowman’s capsule. The muscular arterioles, which supply the glomerulus with blood, are able to adjust the blood pressure to allow filtration to take place. Molecules in the blood, including water, are pushed through the walls of the glomerulus into the space provided by the Glomerular capsule. The fluid resulting from filtration is called the filtrate. As the filtrate enters the second part of the nephron, the renal tubule, it will be “adjusted” until it finally becomes urine.
When the filtrate enters the renal tubule, we recognize that: 1. There are some materials passed into the filtrate that the body needs to reclaim, and 2. There were some things in the blood that the body wants to get rid of but they did not make it into the filtrate during filtration. Making these two “adjustments” to the filtrate are the functions of the renal tubule: selective reabsorption of molecules from the filtrate back into the blood and, secretion of certain molecules from the blood into the filtrate. Materials can move easily back and forth between the blood and the filtrate because of an extension of the arteriole that entered the glomerulus and covers the entire renal tubule; the peritubular capillary bed.
During a 24-hour period, on average, females produce about 150 liters of filtrate, while males produce about 180 liters. This represents about 65 times the entire blood plasma volume. More than 99% of the filtrate is returned to the blood by tubular reabsorption. Only about 1-2 liters are excreted as urine.
Activity 2: Urine Analysis
MATERIALS • Urine Analyzer (Siemens Clinitek Status + Analyzer)• Urine collection cups, 1 per student• Chemstrip or Multistix dip sticks, 1 bottle per table, multi-test• Chemstrip or Multistix comparison charts, 1 per table• Latex exam gloves

60
PROCEDURE: 1. Take a urine collection cup and obtain a freshly voided urine. Use latex gloves when
handling all specimens. Be careful not to contaminate yourself with someone else’s urine.If urine spills, cover it with bleach and let it stand for a few minutes before cleaning it.
2. Determine the color, transparency, and odor of the sample urines and record your results inTable 1.
3. Carefully follow all the directions from the instruction sheet for Urine analyzer. Do notcross contaminate the samples.
4. Print the results.5. Do not throw away urine sample. Save it for next activity.
In a normal healthy individual, urine represents the efforts of the kidneys to maintain constancy in the blood. Despite the great daily variation of dietary input (both food and liquid), and physical activity (reflecting different metabolic states) the body fluids remain fairly stable. Excesses and deficiencies are largely compensated for by the reabsorption and secretion activities of the renal tubule.
Urine is a complex solution of both inorganic and organic compounds. Its principal components include water, urea, sodium, potassium, phosphate ions, sulfate ions, cretonne, and uric acid ions . It is normally clear and pale yellow to amber in color. The color is due to the normal excretion of a breakdown product of hemoglobin when the body destroys old red blood cells. Urine has a normal characteristic slightly aromatic smell to it. We would expect the urine of a healthy person to have a pH of about 6; in a range from 4.5 to 8. The normal specific gravity value, which represents the relative concentration/weight of dissolved substances in urine, should be in the range of 1.001 to 1.030.
Abnormal urine constituents are clues to various pathologies. For example, hemoglobin in the urine (hemoglobinuria) is the result of red blood cell destruction, hemolysis. This could be the result of hemolytic anemia, renal disease, or transfusion reactions. Red blood cells in the urine (hematuria) may be due to kidney stones damaging some part of the urinary tract, or perhaps there might be an infection, or there was a physical trauma to the system.
People with diabetes mellitus usually have ketone bodies in their urine, from the breakdown of fats. In addition, since diabetics have insulin or insulin utilization problems, glucose is little used and it spills over into the urine (glucosuria). Other abnormal constituents would include bacteria, white blood cells, and casts.
Table 1: Physical characteristics of Urine sample
Sample No Color Odor Transparency
61
Activity 3: Determining kinds of casts in Urine samples
Casts are small pieces of material that have hardened and assumed the shape of the lumen of tubule in which they formed
MATERIALS
• Urine sample• Urine sediment charts, 1 per table• Sediment stain• Microscope slides• Table top Centrifuge• Centrifuge tubes, 15 ml• Pasteur pipettes with rubber bulbs
PROCEDURE 1. Pour a urine sample in a clean centrifuge tube and an equal amount of water in another
tube. Mount both tubes across from each other in the centrifuge head.2. Tighten the head cover and turn on the centrifuge for 5 minutes.3. If sediments appear in the bottom of the centrifuge tube, pour off the urine (into the sink)
and use a Pasteur pipette to take a sample of it.4. Place the sediment sample onto a clean microscope slide and add a drop of sediment stain.
Cover with a cover slip.5. Examine your slide at 40x. make sure you clean the lenses of the microscope first with lens
paper. Record your results.6. Compare the shapes of sediments with sediment charts and draw some shapes below.7. Throw away left over urine sample in designated sink. Turn on the water tap to flush it down
the drain. Place the cover back on the collection cup and throw the cup and pipette inbiohazard bin.
Sediment #1 Sediment #2 Sediment #3

62
Test Yourself 1.What is urology and what does it have to do with public health?
2.The study of the kidney alone is calleda. Lithotripsyb. Urogenitalologyc. Obstetricsd. Nephrology
3. Renal failure occurs when the kidneys are unable to perform what functions?
4. Kidney stones or calculi affect more men than women.
True or False
5. What is are the major differences between chronic kidney failure and acute renal failure?
6. What is the term used to describe an infection of a part of the urinary system or the presence ofmicrobes in the urine? Does this condition affect more women or men? Why?
7. is an inflammation of the prostate gland causing pain in the genital area, urinary frequency, lower back pain, and painful urination.
8. Glomerulonephritis is:a. Inflammation of the kidneysb. Inflammation of the bladderc. Inflammation of the prostate glandd. A genetic disease of the kidneys

63
9. What is benign prostatic hyperplasia?
10. As we grow older, kidney malfunctions become more common. List some of the renal andkidney ailments that befall us as we age, as well as describe their symptoms.

64
EXERCISE 9
AGING AND THE SPECIAL SENSES: VISION
INTRODUCTION
The population of the United States is aging. The median age of Americans has increased from 20 in 1860 to 34 in 1994, and is expected to reach 39 by 2030. Since 1900, people 65 years and older have increased their numbers by 11 times (from 3.1 million to over 33 million), while people under 65 have only increased their numbers 3 times. At the same time, life expectancies from birth have increased from just over 47, in 1900, to over 75 (72.1 for males and 79 for females). The elderly population is not only increasing in numbers, but increasing in general health as well. In general, the elderly has better health habits than the non-elderly; they are less likely to smoke, drink, or be overweight. These are reflections of positive life style decisions made in their earlier years that continue to be fruitful. Most of the chronic diseases of old age have their beginnings in our early years, often as the result of poor lifestyle choices.
We now operationally divide the elderly into three separate groups because they approximate different populations that demonstrate different health and public health characteristics and needs. Those who are in the age range from 65 to 74 are referred to as the young old; those from 75 to 84 care classified as the aged; and those who are 85 years and older are called the oldest old. Interestingly, the oldest old (85+) are the fastest growing segment of our population.
Government surveys report that most of the elderly consider their health to be good. The younger groups report the highest levels of satisfaction. Approximately 75% of them consider their health to be good, very good, or excellent. It should be noted however, that slightly more than 38% (in a 1994 survey) said that they were limited in their activity. Most of the elderly are non- institutionalized; only about 5% are in nursing homes. In the oldest old group, however, this jumps to about 24%.
The major health problems of the elderly are degenerative and other chronic diseases. The incidence of hypertension, heart disease, diabetes, arthritis, and similar conditions tend to increase with age. We also witness men suffering more from life-threatening acute diseases, such as stroke and heart conditions, and women being more affected by more physically limiting chronic maladies, such as osteoporosis and arthritis.
Among the most prevalent conditions suffered by all of the elderly, men and women alike, is part of the normal pathology of aging, progressive vision and hearing impairment. In specific individuals these processes may be exacerbated by lifestyle exposures. Not wearing sunglasses in bright light may lead to macular degeneration. Nutritional deficiencies may have contributed to cataract formation. Not wearing ear protection at work may have caused conduction deafness. Studies have associated sensory loss with compromised cognitive ability and depression. The loss of either of these faculties’ limits communication with others and with one’s environment. As the dependent skills of reading, writing, and listening are lost, the elderly often become socially isolated and withdrawn. The loss of vision also increases the risk of falls and usually restricts or eliminates driving.

65
The pathology of vision loss includes a reduction in visual acuity, or sharpness of vision, as well as a decreased sensitivity to contrast. The cornea, the transparent anterior aspect of the eye that participates in the bending of light for focusing, may thicken and reduce its ability to function. The lens naturally hardens with age and causes the loss of near-point accommodation (how close to an object you can focus), a condition called presbyopia. If the lens becomes hazy or entirely obstructed, we call the condition cataracts. In addition, with age, there is a reduction in the number of nerve cells in the retina. The elderly is also at risk for glaucoma, the second leading cause of blindness in the United States. Diabetic retinopathy is also an issue as diabetics move into old age. The leading cause of blindness in people over 75 is macular degeneration, the deterioration of the retina around the macula lutea (discussed below). This area is where we normally have our sharpest vision.
OBJECTIVES:
By the end of this exercise, students must be able to:
1. Learn the basic anatomy of eye and ear2. Learn the functions of the eye and ear3. Conduct some common vision and hearing assessments
Activity 1: Anatomy of the Eye
MATERIALS • Eye model, in situ (1 per table)• Eye model, cross-section (1 per table)• Anatomic wall chart of eye
PROCEDURE 1. Follow along with the instructor as parts of the eye are described.2. Find the three layers of the eye: the sclera, choroids, and the retina3. Locate the iris, pupil and lens4. Find the optic disk, macula lutea and fovea centralis.
The human eye is about one inch in diameter. It sits in the eye-socket of the skull, which is composed of parts of several bones. Only the anterior portion of the eye, which is boarded and protected by the eyelids, is observable. The wall of the eyeball consists of three layers, the outer tough and protective sclera, the middle choroids, and the photoreceptor-containing retina. The anterior portion of the sclera is the clear, transparent, cornea. Behind the cornea there is a space called the anterior cavity, the back wall of which is the lens. Immediately anterior (in front) to the lens is the iris, the circular colored portion of the eye. The hole in the middle of the iris is called the pupil. The iris contains circular and radial muscles which change the size of the pupil. The fluid in the anterior cavity is called aqueous humor. This fluid is produced and drained continuously. Anything that interferes with its drainage increases pressure in the eye (intraocular pressure). When intraocular pressure increases to a point where the retina and optic nerve are pressed against the wall of the eyeball, pain and possible blindness can result. This condition is called glaucoma.

66
Between the lens and the retina is a large space called the posterior cavity. The retina actually lines the entire posterior cavity. Within this cavity is a jelly-like, transparent, substance called the vitreous humor (body). The vitreous humor holds the posterior cavity open. The retinal lining is fairly uniform except for two places. One is where the optic nerve exits the back of the eye. There are no photoreceptors here and this spot is called the blind spot, or optic disk. The other area is a yellowish spot called the macula lutea. Within the macula lutea is a depression called the fovea centralis. The fovea centralis is important to know because it has a very high concentration of photoreceptors called cones.
The cones along with the rods are the two kinds of photoreceptors that allow light to be changed into signals that the brain can interpret as images. Each photoreceptor has its own characteristics. Cones only operate with high light levels. They also provide us with the ability to see things in sharp focus (high visual acuity) and in color. The other photoreceptors, rods, operate only in low light conditions, provide us with images that are in shades of black and white and that not too distinct (low visual acuity). At dawn and dusk and in a darkened room, we are principally using our rods. Things look grayish and a little fuzzy. When the sun comes up, or if we turn off the lights, things now appear in color and they look distinct and clear. The fovea centralis, therefore is the region of the retina that provides us with the highest visual acuity.
Figure 1: Schematic diagram of Human Eye
Picture reference: Artwork by Holly Fischer. Found on Wikimedia Commons. Structure of the Human Eye. Licensed in Public Domain. This file is licensed under the Creative Commons Attribution-Share Alike 3.0 Unported license.

67
Activity 2: Assessments of Eye Function
There are many conditions that are either present at birth or develop over time that immediately or eventually produce vision problems. In addition, there are certain diseases that are indicated early on by observable changes in the internal anatomy of the eye. The series of tests and examinations you will complete will give clues to potential vision problems. Each is a standard method of observation and assessment.
MATERIALS • Ophthalmoscope (2 per class)• Snellen chart• Astigmatism chart• Pen lights (2 per table)• 3x5 cards• Ishihara’s Tests for Color Blindness (1 book per table)• Ruler, 18 inches (1 per table)• Fundic Exam eye charts (1 per table)
PROCEDURES Near-Point of Accommodation Determination Accommodation is the term we use to describe the process in which the lens of the eye changes
shape in order to cast the image of objects of near vision (less than 20 feet away) on the retina. For objects greater than 20 feet from the eye, no change in the lens is needed; all refraction (bending of the light) required to cast the image on the retina is due to the cornea. That is to say, accommodation is focusing. The eyes ability to accommodate is at a maximum in infants. The lens is most flexible and can change shape easily. As we get older, the lens gradually loses it elasticity. The near-point of accommodation is the minimum distance from the eye that an object can be clearly focused on. Therefore, since the lens loses its elasticity with age, the near-point of accommodation gradually increases. There is a fairly predicable correlation between near-point of accommodation with age:
Age Distance (in.) 10 3 20 3.5 30 4.5 40 6.5 50 20.5 60 33
The loss of near-point of accommodation is called presbyopia, noted previously. By age 40 presbyopia has interfered with our normal reading distance and we require reading glasses. People who already wear glasses usually get bifocals. To test your near point of accommodation, do the following:
A
1. With one eye closed, focus on the letter “A” above.

Left Eye Right Eye _____in. _____in. _____in. _____in _____in. _____in. _____in. _____in.
2. Have your lab partner measure the distance from your eye to the letter. 3.Slowly move your head toward the letter until you can no longer see it clearly. 4. Measure and record this distance. This is your near-point of accommodation for that eye. 5.Repeat these steps again several times with the same eye and record your results. 6. Repeat these steps with your other eye. Record your results.
Data Table
Visual Acuity Determination Visual acuity is sharpness of vision, the ability to discriminate details. The Snellen eye chart was developed to assess this capability. This chart is mounted on the side wall of the laboratory and we will be using it shortly. The principle of the Snellen test is that certain letters of a certain size should be seen distinctly at a specific distance by eyes that have normal acuity. Look at the wall- mounted chart. Note that line 1 has a “200” next to it. This means that a person with normal visual acuity should be able to read it easily at 200 feet. Line 8 has a “20” next to it. This means that a person with normal visual acuity can easily read this line at 20 feet. Indeed, when we use this chart, we stand exactly 20 feet away. A person with normal acuity is classified as 20/20 because line 8 has the smallest letters that they can see clearly. If at exactly 20 feet away you can read the next line down, 9, which has the number 15 by it, you have 20/15 vision. That is to say, you can read line 9 at 20 feet, whereas a person with 20/20 vision could only read it at 15 feet.
1.Stand exactly 20 feet from the Snellen eye chart. There is a mark indicating this on the floor. 2. Cover one eye with a 3x5 card. 3. Read all of the lines you can, starting from the top, without squinting or straining. 4.Record the number of the last line that can be successfully read. 5. Repeat these steps using the other eye. Record the results. 6.Repeat the steps using both eyes. Record the results.
Left eye: 20/ Right eye: 20/ Both eyes: 20/
Test for Astigmatism Astigmatism is a blurring of vision due to an irregularity in the surface of either the lens or the cornea. The astigmatism chart that is mounted on the wall is used to test for such defects. To determine the presence of astigmatism, look at the center of the chart and note if all of the radiating lines are in focus and are of the same intensity of black. If all of the lines are of the same intensity and are in focus, there is no astigmatism. Check each eye with the other closed. Record your results: Left eye: Right eye:
68

69
Test for Color Blindness There are three different types of cones in the retina, each of which responds to a different color; red, blue, and green. The degree of stimulation of each of the cones tells the brain about the type and shade of color. Color blindness is a sex-linked genetic condition involving the X chromosome. Certain cones are absent from the retina, rendering the person incapable of seeing certain colors. A discussion of the principles of genetics related to this condition is found in the genetics exercise, elsewhere in this manual. The most common form of this condition is red-green colorblindness. This disease is much more common in men than women (about 8% of men and 0.5% of females are afflicted).
To test for color blindness, work with your lab partner and do the following. Move to a room window and use sunlight if available.
1. Open the Ishihara’s test plate book to plate 1 and hold it about 30 inches from your partner. 3. The observation time is about 3 seconds. 4. Record the response; what numbers are seen. 5. Repeat the procedure with the other 13 plates in the series. And record the results. 6. Compare the results with the correct answers.
Test Left Eye Right Eye Test Left Eye Right Eye Plate 1: Plate 2: Plate 3: Plate 4: Plate 5: Plate 6: Plate 7: Plate 8: Plate 9: Plate 10: Plate 11: Plate 12: Plate 13: Plate 14:
Test for Blind Spot The blind spot, or optic disk, is on the retina where the optic nerve and blood vessels exit the eye. There are no rods or cones here and therefore, no ability for visual perception. Casting an image across the blind spot can make it look indistinct since some of the image is not detected.
1. To test for the blind spot, close your left eye and focus your right on the cross to the left. 2.Move your eye about 15 inches from the paper and then slowly move the paper closer. 3.At some point the dot on the right will disappear as it is focused on the blind spot.
+ .

70
Pupillary Accommodation Reflex 1. Observe the size of your lab partner’s pupil under room light conditions, while they are focusing
on an object on the other side of the room for a minute or two.2. Hold an object about 6 inches from their eyes and have them focus on it.3.Observe the change in the size of the pupil.
4. What happened?
Convergence Reflex and Depth Perception Binocular vision is an adaptation that allows us and some other animals effective depth perception. The eyes move together staying focused on an object and their individual fields of vision overlap to a great extent. However, even though they appear to be looking at the exact same object in exactly the same way, the eyes are actually seeing things from a slightly different perspective. When people have injuries to or lose an eye, they are at higher risk of injury from the loss of their ability to perceive distance accurately. This is especially important when engaging in activities that require quick adjusting responses, such as when driving a car.
To demonstrate that the two eyes move together to stay focused on the same object simply:
1. Have your lab partner observe you focus on a pen you are holding about 18 inches fromyour nose.
2. Slowly move the pen toward your nose.3. Your eyes will turn medially as they follow the pen.4. At some point you will see two pens and/or a blurring of the pen.5. Reverse roles and observe your partner repeat the demonstration.
To experience the phenomenon of depth perception simply:
1. Have your lab partner hold a test tube with one hand at arm’s length.2. Take a pencil in your other hand, starting close to your body and with both eyes open insert
the erasure end into the mouth of the test tube as fast as possible.3. Bring the pencil back to your body and repeat the procedure with one eye closed.4. Was it more difficult to insert the pencil in the tube mouth with two eyes open?5. Repeat this procedure using the other eye.
Ophthalmoscope Examination Examining the interior of the eye, the fundus, is a routine part of a physical examination. In addition to seeing anatomical anomalies associated with eye trauma, the examination can also identify or provide clues to certain health problems or indicate the progression of them. This is because the retina is the only non-invasive place where relatively large blood vessels are easily observed. Fundic exams can tell us about such diseases as diabetes, hypertension, brain tumors, and meningitis.
The exam, done with the ophthalmoscopes you recognize in the charging stands at your table, customarily looks at the retina, the blood vessels, the optic disk, and macula lutea.

71
The operation of the ophthalmoscope will be demonstrated by your instructor. Note that light is beamed into the eye through the pupil by a mirror in the head of the scope. There is a slit in the mirror through which the examiner looks to see inside. A light control is located at the top of the battery compartment that increases intensity as it is turned clockwise. Focusing is done by rotating the lens selection disk, which appears as a large wheel. There is also an aperture selection disk that is used to change the color of the light. Consensus suggests a green light is less irritating and shows the blood vessels well. It is also suggested that to reduce reflection, the beam of light should be directed toward the edge of the pupil and not in the middle.
The exam procedure is as follows: 1. Darken the room as much as possible to avoid stray light.2. Sit facing your lab partner.3. Adjust your light so you have a green spot; shine it on your hand to see it.4. Use your right eye to examine your partner’s right eye and left eye for their left eye.5. Hold the scope with your index finger on the lens selection disk and your eye as close to
the viewing window as possible.6. Tell your partner to open their eyelids as far as possible.7. Start viewing from a distance of about 6 inches, moving in toward the eye, directing the
beam of light toward the edge of the pupil.8. As you get closer to the eye you should see a red area as the interior of the eye starts to
come into focus. Move to within 2 inches of your partner’s eye.9. Steady your hand with the scope against your partner’s cheek, otherwise you will not be
able to focus easily.10. Rotate the lens selection disk until you are able to see clearly.11. Look at the Fundic examine reference pictures, at your table, to help you identify the optic
disk, macula leuta, and blood vessels.12. After you have examined both of your partner’s eyes, allow them to examine yours.
Test Yourself 1. The lens loses elasticity with age.
True or False
2. The loss of near-point accommodation is a condition known asa. Cataractsb. Macular degenerationc. Glaucomad. Presbyopia
3. Macular degeneration isa. Is the leading cause of blindness in people over 75b. Is the leading cause of death for people over 75c. Is another name for cataracts

72
4. Define the following structures of the eye: where each is relative to one another and theirfunction.
a. Aqueous humor
b. Pupil
c. Cones
d. Rods
e. Fovea centralis
f. Vitreous humor
g. Posterior cavity
h. Optic disk
i. Macula
5. As intraocular pressure increases to the point where the retina and optic nerve are pressedagainst the wall of the eyeball, pain and possible blindness can result. What is thiscondition commonly called?
a. Cataractsb. Macular degenerationc. Glaucomad. Near-sighted
6. What is the difference between refraction and accommodation?
7. is the minimum distance from the eye that an object can be clearly focused on, but the loss of that ability is known as ?
8. What is astigmatism and what kind of test determines it?

73
9. A visual adaptation that allows us (and some other animals) to have effective depthperception
a. Binocular visionb. Near sighted visionc. The cones of the eyed. Rods
10. The interior of the eye is also referred to (collectively) as thea. Corneab. Irisc. Lensd. Fundus

74
EXERCISE 10
AGING AND THE SPECIAL SENSES: HEARING
INTRODUCTION
As stated in previous lab exercise, our population is rapidly aging and along with this explosive growth the many pathologies associated with growing old have become more significant in our general health and public health considerations. Not only are we faced with the normal degenerative problems of the aging process, but we must also cope with the many additional diseases, such as cancers and heart disease, that develop through the years as we expose ourselves to unhealthy habits.
In this and the previous exercise we are concerned more with those issues of normal degenerative processes. This is because accidents associated with the frailties of sensory loss in old age, as well as reduced access to medical care due to physical limitations, and the personal isolation and depression which leads to a loss of quality of life, are unnecessarily and unacceptably high.
Hearing impairments affect between 5% and 10% of the general population. However, in the elderly over 65, this jumps to about 30%. About 23% of those aged 65 to 74 and almost 50% among those 85 and older demonstrate hearing losses. The most common form of hearing loss in the elderly is characterized by a decrease in sensitivity to higher-pitched sounds (presbycusis), which impairs an understanding of speech, especially the higher frequency consonant sounds. This type of hearing deficit is associated with damage to the receptors for hearing, or to the structures surrounding them in the inner ear. The progression of hearing loss is slow. Causes may include chronic exposure to a variety of chemicals (ototoxics) like some antibiotics, diuretics, quinine, carbon monoxide, tobacco, and alcohol, and continuous exposure to loud noises. It should be noted that even though we think of presbycusis as associated with old age, it has become more common in younger people who expose themselves to loud music, loud recreational activities and unprotected workplace.
Deafness is considered as either a significant decrease or total loss of hearing. There are types of deafness referred to as conduction deafness if they involve changes in the outer or middle ears which impede sound from being conducted to the inner ear. Nerve deafness (sensineural) involves damage to the inner ear or the nerves. Other causes of hearing deficits and deafness of the elderly (other than those noted above) include tumors, bacterial and viral infections, atherosclerosis (of the blood vessels supplying the nerves), diabetes mellitus, syphilis, and noise exposure. Studies demonstrate that senior citizens from rural environments have less of a hearing loss than those from cities.
OBJECTIVES: By the end of this exercise, students must be able to:
1. Learn the basic anatomy of eye2. Learn the functions of different parts of the ear3. Conduct some common hearing assessments

75
Activity 1: Anatomy of the Ear
MATERIALS • Model of the ear (1 per table)• Model of the cochlea• Wall chart of the ear
PROCEDURE 1. Using the model of the ear, follow along with the instructor as he points out each part of the
ear. Know the parts of the outer, the middle, and the inner ear.2. Study the model of the cochlea. Identify the scala tympani, the scala vestibuli, the cochlear
duct, the basilar membrane, the vestibular membrane and the organ of Corti.3. Refer to the wall chart for reinforcement.
The human ear is broadly divided into three different divisions, the outer ear, the middle ear and the inner ear. The outer ear is composed of the pinna (the funnel-like visible part) , the auditory canal (the ear canal) and the tympanic membrane (ear drum). The function of the pinna is to collect the sound waves and to direct them down the ear canal to the tympanic membrane, which then starts to vibrate in sympathy to the frequency of the sound waves.
The middle ear is composed of the body’s smallest bones (the ossicles). These are (in the order in which they articulate with each other) the malleus, the incus, and the stapes. Their principle job is to transfer the energy that sound waves imparted to the tympanic membrane, to the inner ear where the receptors for hearing are located. The last bone in the sequence, the stapes, articulates with a membrane called the oval window. The surface area of the oval window is so much smaller than that of the tympanic membrane that when the energy arrives from the outer ear it is “concentrated”. This amplification phenomenon is classified as a function of the middle ear. The middle ear is connected to the throat (pharynx) by the Eustachian tube; a channel which allows equalizing air pressure to move into and out of the middle ear.
One of our public health concerns of the infant and toddler population is infection of the middle ear, otitis media. In that population group the Eustachian tube is often not well-developed enough to allow air flow and fluid drainage. Infections can develop and fester. Otitis media is the number one complaint that young children present with to pediatricians.
The inner ear is also referred to as the labyrinth because it is a series of complicated canals. It has an outer bony structure and it is protected in the temporal bone. There are three separate structural and functional parts to it. One is the vestibule, another the semicircular canals, and the third the cochlea. The vestibule functions in equilibrium activities, sending information to the brain about the position of the head. The semicircular canals, made up of three canals oriented in three different planes, are also involved in equilibrium. However, unlike the static equilibrium of the vestibule, the semicircular canals display dynamic equilibrium, sending the brain information about the rotational movements of the head. The cochlea, which is snail-shaped, is involved with sound reception. It contains the receptors for hearing, the organ of Corti.

76
Figure 1: Schematic diagram of Human Ear
Picture Reference: By Lars Chittka and Axel Brockmann. Found on Wikimedia Commons. Structure of the Human Ear. Licensed in Public Domain This file is licensed under the Creative Commons Attribution 2.5 Generic license.
The next two activities will involve various methods for evaluating your hearing. Before we proceed with them, it is important that we consider the nature and properties of sound.
Sound is an energy wave, best defined as a series of pressure disturbances, compressions and rarefactions, that originate from a vibrating object that travels through a medium (either solid or gaseous) with specific characteristics. The analogy of a ripple moving out on the surface of a pond from a stone thrown into it is often used.
The characteristics of sound that we use to describe what we hear include pitch, loudness, and quality. The pitch of a sound is its frequency of vibration, cycles per second. The human ear can distinguish sounds between 20 to 20,000 cycles per second. Our ears, however, are most sensitive to frequencies between 1500 and 4000 cycles per second, or Hertz (1 Hz = 1 cycle per second). While children can perceive sound to 22,000 Hz., aging demonstrates a sensorineural loss that is seen as early as 20, when the highest frequencies are first lost. By age 40 the upper limit is about 15,000 Hz and by 80 it may be as low as 8,000! The quality of sound has to do with the nature of the vibrations produced and is revealed by the wave shape of the vibration.
The greater the intensity or amplitude of a sound wave, the louder it is. Sound intensity and loudness is measured in decibels (dB). The dB scale is logarithmic. Each 10 dB represents a tenfold increase in sound intensity. The human hearing threshold, where sound can just be distinguished, is defined as 0 dB at 1000 Hz, for a young adult. A normal conversation is about 60 dB. Sound becomes uncomfortable at about 120 dB and painful at about 140 dB.
Hearing Tests
77
Activity 2: Hearing Tests: Sound Localization; Auditory Acuity; Weber; Rinne; Audiometry
Except for the audiometry, the other tests require minimal experience and almost no expense to conduct. Their simplicity and reliability have stood the test of time as valuable screening techniques. The Room Should Be Kept as Quiet as Possible During These Tests
MATERIALS • Audiometer (1 per table)• Tuning forks/pair of students• Audiogram recording charts• Cotton balls
PROCEDURE
Sound Localization
1. Have your lab partner sit with their eyes closed2. Hold a ticking watch about 6 inches from their ear.3. Tell them to point to the location of the ticking sound every time you tell them to.4. Move the watch to different locations in the back, sides, above, in front.5. Can the ticking be heard in all directions, or is it better in some locations?
Observation:
Auditory Acuity
1. Have your lab partner close one ear with a cotton ball.2. Sit quietly with the eyes closed.3. Hold a ticking watch to the open ear canal so it can be heard.
4. Slowly move the watch away until it cannot be heard.5. Measure the distance between the ear and the watch.6. Record the results and repeat with the other ear.7. Compare results with the class; list on the blackboard
Distance Left Ear: Distance Right Ear:
Weber Test for Conductive and Sensorineural Deafness 1. Have your lab partner seated.2. Strike tuning fork and hold the tip of the handle against the medial aspect of the upper
forehead.3. If there is normal hearing, the sound of the fork is heard at equal intensity in both ears.
If there is conduction deafness, the sound will be louder in the deaf ear than the normal ear. If there is sensorineural deafness, the sound will be louder in the normal ear than the deaf ear.

78
4. Simulate conduction deafness by putting cotton one ear and repeating the steps.
Observation:
Rinne Test: Comparing Air Conduction of Sound with Bone Conduction
1. Seat your lab partner.2. Strike a tuning fork and hold it to their mastoid process.3. When they can no longer hear the sound move the still vibrating fork in front of the ear
canal.4. Ask if the sound can still be heard, if so, hearing is not impaired.5. Repeat the test by testing air conduction first.6. Strike the tuning fork and hold it in front of the ear canal until the sound can no longer be
heard.7. When the sound can no longer be heard, quickly move the still vibrating fork to the mastoid
behind that ear.8. If the tuning fork can still be heard, this indicates conduction deafness.9. Repeat using the other ear.
Right Ear: bone-to-air Left Ear: bone-to-air
air-to-bane air-to-bone
Audiometry The audiometer on your table is an instrument that tests auditory acuity by delivering specific frequencies at specific intensities. It measures the ear’s ability to hear sounds in the range from 125 Hz to 8000 Hz.; the range that is most important for normal speech. Essentially, this instrument is used to test one ear at a time to see what thresholds (minimum intensities) are required to hear different frequencies. The procedure starts with a 0 dB sound. Note that 0 dB is not the absence of sound but rather a level that is considered threshold for those with the best possible hearing sensitivity. If a person cannot hear a sound at 0 dB, the sound is gradually increased until they can. The number of dB that we have to increase the sound before it can be heard is recorded as the dB hearing loss at the test frequency. The instructor will demonstrate the use of the audiometer using one of your classmates. Note the
position and use of each of the controls. Identify the two-tone control wheels, one on each side of the machine. The one on the right controls the frequency (from 125 Hz to 8000 Hz) and the one on the left controls the hearing threshold level control. Intensity is set at 0 dB to start at each frequency, the base minimum level. Note also the left-right ear switch, which allows the operator to switch between the two ears during the testing.
1. Have your lab partner sit facing away from you and the audiometer.2. Place the earphones on their head with the red earpiece on the right ear and the blue one on
the left ear.3. Instruct him/her to raise their hand if they hear something. Raise the right hand if a sound is
heard in the right ear and left hand for sounds heard in the left ear.4. Set the frequency control for 125 Hz and gradually increase the sound intensity until a sound
is heard. Record the hearing threshold value.

79
5. Repeat this procedure with 250 Hz, 500 Hz, 1000 Hz, 2000 Hz, 4000 Hz, and 8000 Hz.Record all results.
6. Repeat all 7 frequencies for the other ear. Record the results.7. Plot the results on the audiogram charts available at the front table.
Test Yourself 1. Hearing loss can be attributed to chronic exposure to what media? List
2. List the parts of the outer ear and their function.
3. As intraocular pressure increases to the point where the retina and optic nerve are pressed against the wall of the eyeball, pain and possible blindness can result. What is this condition commonly called?
a. Cataractsb. Macular degenerationc. Glaucomad. Near-sighted
4. The smallest bones in the body are found in the middle ear. What are they called?
5. The principle job of the incus, malleus, and stapes are to the energy that sound waves imparted to the tympanic membrane and onward to the to the inner ear.
6. The inner ear is also referred to as the , because it is a series of complicated canals.
7. List the three structural parts of the inner ear and then describe their function.
a. Cochleab. Ossiclesc. Pinnad. Papillae

80
8. What is the difference between amplitude and pitch?
9. If conduction deafness is deafness due in part to changes in the outer or middle ears which impedes sound from being conducted to the inner ear, what is nerve deafness?
10. List four more causes for hearing deficits and deafness in the elderly that affect both nerve components and conduction.

81
EXERCISE 11
ENVIORNMENTAL HEALTH AND SAFETY
INTRODUCTION
World Health Organization (WHO) reports that 24% of global disease is caused by environmental exposures which can be averted. Well-targeted interventions can prevent much of this environmental risk. They further estimate that more than 33% of disease in children under the age of 5 is caused by environmental exposures. Preventing environmental risk could save as many as four million lives a year in children alone, mostly in developing countries. It is concluded that one way or another, the environment significantly affects more than 80% of the major diseases. Moreover, it looks to quantify only those environmental hazards that are modifiable - that is, those that are readily amenable to change through policies or technologies that already exist. It is estimated that more than 13 million deaths annually around the globe are due to preventable environmental causes.1
The four main diseases influenced by poor environments are diarrhea, lower respiratory infections, various forms of unintentional injuries, and malaria. Measures which could be taken now to reduce this environmental disease burden include the promotion of safe household water storage and better hygienic measures; the use of cleaner and safer fuels; increased safety of the built environment, more judicious use and management of toxic substances in the home and workplace; better water resource management.1
Widespread scientific consensus exists that the world’s climate is changing. Some changes that could negatively affect health include more variable weather patterns, heat waves, heavy precipitation events, flooding, droughts, more intense storms, sea level rise, and air pollution. While climate change is a global issue, the particular health effects will vary across geographic regions and populations2. Climate change, together with other natural and human-made health stressors, influences human health and disease in numerous ways. Some existing health threats will intensify and new health threats will emerge.
In the U.S., public health can be affected by disruptions of physical, biological, and ecological systems, including disturbances originating here and elsewhere. The health effects of these disruptions include increased respiratory and cardiovascular disease, injuries and premature deaths related to extreme weather events, changes in the prevalence and geographical distribution of food- and water-borne illnesses and other infectious diseases, and threats to mental health2.
By the end of this exercise, students must be able to:
1. Learn the health impact of water pollution 2. Learn the health impact of air pollution 3. Conduct experiment to detect the presence of harmful coliform bacteria in water samples 4. Conduct experiment to demonstrate air pollution

82
Picture Reference: Impact of Climate Change on Human Health Water Pollution
With its many uses for drinking, recreation, sanitation, hygiene, and industry, water is our most precious global resource. Clean and safe drinking water is critical to sustain human life and without it waterborne illness can be a serious problem.
The United States has one of the safest public drinking water supplies in the world. Over 286 million Americans get their tap water from a community water system. The US Environmental Protection Agency (EPA) regulates drinking water quality in public water systems and sets maximum concentration levels for water chemicals and pollutants. Sources of drinking water are subject to contamination and require appropriate treatment to remove disease-causing contaminants. Contamination of drinking water supplies can occur in the source water as well as in the distribution system after water treatment has already occurred. There are many sources of water contamination, including naturally occurring chemicals and minerals (for example, arsenic, radon, uranium), local land use practices (fertilizers, pesticides, concentrated feeding operations), manufacturing processes, and sewer overflows or wastewater releases.3
The presence of contaminants in water can lead to adverse health effects, including gastrointestinal illness, reproductive problems, and neurological disorders. Infants, young children, pregnant women, the elderly, and people whose immune systems are compromised because of AIDS, chemotherapy, or transplant medications, may be especially susceptible to illness from some contaminants.
During 2013–2014, a total of 42 drinking water–associated outbreaks were reported to CDC, resulting in at least 1,006 cases of illness, 124 hospitalizations, and 13 deaths. Legionella was responsible for 57% of outbreaks and 13% of illnesses, and chemicals/toxins and parasites together accounted for 29% of outbreaks and 79% of illnesses. Eight outbreaks caused by parasites resulted in 289 (29%)
83
cases, among which 279 (97%) were caused by Cryptosporidium and 10 (3%) were caused by Giardia duodenalis. Chemicals or toxins were implicated in four outbreaks involving 499 cases, with 13 hospitalizations, including the first outbreaks associated with algal toxins.4
Lead is a pervasive environmental contaminant. The adverse health effects of lead exposure in children and adults are well documented. Because lead accumulates in the body, all sources of lead should be controlled or eliminated to prevent lead poisoning. Lead has long been used in the plumbing materials and solder that are in contact with drinking water as it is transported from its source into homes. Lead leaches into tap water through the corrosion of plumbing materials that contain lead.5
Water-based physical activity, such as swimming, improves physical and mental health throughout life; however, it can put people at risk for recreational water–associated illness and injury. A recreational water illness outbreak is the occurrence of similar illnesses in two or more persons, epidemiologically linked by location and time of exposure to recreational water. For 1978–2012, 879 recreational water illness outbreaks have been reported CDC, and the number reported annually has increased significantly in recent years, especially the number of outbreaks associated with treated recreational water venues (e.g., pools and hot tubs/spas).6
Activity 1: Detection of waterborne coliforms and fecal coliforms using Coliscan Easy gel
MATERIALS: Per pair of students: Instruction sheet from the kit (Ward’s Coliscan Kit: How Clean is Your Water), a tube of coliscan gel, a pretreated easygel petri dish, a water sampling bottle, an interpretation guide, a sterile pipette, a user guide.
PROCEDURE: Using the water sampling bottle, you will collect water sample from a water source of your choice and test them as soon as possible after collection. Note: 1. Carefully follow all the directions from the instruction sheet. Do not cross contaminate the samples with your hands. 2. Incubate the plate until the next lab. 3. You will read the results in the next lab and record your observations below in Table 1.
Results:
Table 1.
(Sample type) No. of colonies (pink) No. of colonies (purple)
Q. Is your water sample contaminated with fecal coliform bacteria? Please explain your answer.

84
Air Pollution
Health effects of air pollution from particulate matter are well known, and worldwide efforts are being made to reduce both air pollution peaks and long-term exposure to harmful levels. However, air pollution episodes and sustained high levels still occur in various parts of the world. Ambient air pollution accounts for an estimated 4.2 million deaths per year due to stroke, heart disease, lung cancer and chronic respiratory diseases. Around 91% of the world’s population lives in places where air quality levels exceed WHO limits. While ambient air pollution affects developed and developing countries alike, low- and middle-income countries experience the highest burden. In 2016, household air pollution was responsible for 3.8 million deaths, and 7.7% of the global mortality. Fifty percent of pneumonia deaths in children under 5 are due to household air pollution.7
In United States, Outdoor air quality has improved since the 1990s, but many challenges remain in protecting Americans from air quality problems. Ground-level ozone, the main part of smog, and particle pollution are just two of the many threats to air quality and public health in the United States. EPA has identified six pollutants as “criteria” air pollutants because it regulates them by developing human health-based and/or environmentally-based criteria (science-based guidelines) for setting permissible levels. These six pollutants are carbon monoxide, lead, nitrogen oxides, ground-level ozone, particle pollution (often referred to as particulate matter), and sulfur oxides. These pollutants are associated with many health problems, such as diminished lung function, increased hospital admissions and emergency room visits for asthma, and increases in premature deaths.8 Following people are at highest risk for negative health impacts:
• People with asthma or other lung diseases • Older adults • People of all ages who exercise or work hard outside • Babies and children
Activity 2: Demonstrating air pollution by performing a bioassay on plant growth
MATERIALS: Per Table: Instruction sheet from the kit (VWR: Cat #470006- 890; Demonstrating Air Pollution), a petri dish, a germination pad, a plastic cone and a spoon, squash and marigold seeds, a user guide.
PROCEDURE:
Note: 1. Carefully follow all the directions from the instruction sheet. Do not cross contaminate the samples with your hands. 2. You will read the results in the next lab and record your observations in the table provided in the instruction sheet.
85
References: 1. Diseases caused by Environmental exposures/ 2. CDC’s Climate and Health Program 3. Water-related Diseases and Contaminants in Public Water Systems 4. Waterborne Disease Outbreaks Associated with Drinking Water 5. Lead in Drinking Water 6. Healthy water and swimming 7. Air pollution/ 8. Air pollutants
Test Yourself 1. List the four diseases most impacted by poor environment.
2. List the criteria pollutants as designated by EPA.
3. This toxicant leach into tap water through the corrosion of plumbing materials
a. Mercury b. Mica c. Lead d. Ozone
4. True or False?
Fifty percent of pneumonia deaths in children under 5 are due to household air pollution. a. True b. False
5. True or False? People of all ages who exercise or work hard outside are at risk to develop negative health conditions due to ambient air pollution.
a. True b. False
6. is the main component of smog.

86
7. List the groups pf people at highest risk to suffer negative health effects due to air pollution
8. These kinds of infectious agents can be present in polluted water. List at least, three
9. True or False? USA has the safest drinking water in the world. a. True b. False
10. List four adverse health effects of environmental pollution.

EXERCISE 12
OBESITY AND ESTIMATION OF BODY MASS INDEX
INTRODUCTION
Obesity has become a global public health problem and a complex health issue to address. Obesity is associated with an increased risk of a number of diseases, including cardiovascular diseases like hypertension, coronary heart disease, high LDL cholesterol, low HDL cholesterol, or high levels of triglycerides, stroke and other conditions like type 2 diabetes, gallbladder disease, osteoarthritis (breakdown of cartilage and bone within a joint), sleep apnea and breathing problems, some cancers (endometrial, breast, colon, kidney, gallbladder, and liver), low quality of life, mental illness such as clinical depression, anxiety, and other mental disorders, body pain and difficulty with physical functioning, and with decreased longevit y.
According to Centre for Diseases Control (CDC), National Health and Nutrition Examination Survey has concluded that in 2015–2016, the prevalence of obesity was 39.8% in adults and 18.5% in youth of United States. The prevalence of obesity was higher among middle-aged adults (42.8%) than among younger adults (35.7%). Childhood obesity is a serious problem in the United States putting children and adolescents at risk for poor health. Obesity prevalence among children and adolescents is still too high. The prevalence of obesity was higher among youth aged 6–11 years (18.4%) and adolescents aged 12–19 years (20.6%) compared with children aged 2–5 years (13.9%). Obesity disproportionally affects children from low-income families. The overall prevalence of obesity was higher among non-Hispanic black and Hispanic adults than among non-Hispanic white and non-Hispanic Asian adults. There was no significant difference in the prevalence of obesity between men and women overall or by age group. Prevalence of Obesity Among Adults and Youth: United States, 2015–2016. However, based on race/ethnicity, women had a higher prevalence of obesity than men among non-Hispanic black, non-Hispanic Asian, and Hispanic adults, but not among non-Hispanic white adults. Among youth, there was no significant difference in obesity prevalence between boys and girls of the same race and Hispanic origin. From 1999–2000 through 2015–2016, a significantly increasing trend in obesity was observed in both adults and youth. The prevalence of obesity in the United States remains higher than the Healthy People 2020 goals of 14.5% among youth and 30.5% among adults More efforts are needed, and new federal initiatives are helping to change our communities into places that strongly support healthy eating and active living.
Obesity and Body Mass Index
Obesity is defined as a body mass index (BMI) at or above the 95th percentile of the CDC sex-specific BMI-for-age growth charts. BMI does not measure body fat directly, and the relationship between BMI and body fat varies by sex, age, and race and Hispanic origin. Morbidity and mortality risk may vary between different race and Hispanic-origin groups at the same BMI. The definition of obesity is based on BMI for both youth and adults, but the definitions are not directly comparable. Among adults, there is a set cut point based on health risk, while among children, the definition is statistical and is based on a comparison to a reference population.
87

88
Causes
Obesity results from a combination of causes and contributing factors, including individual factors such as behavior and genetics. Behaviors can include dietary patterns, physical activity, inactivity, medication use, and other exposures. Additional contributing factors in our society include the food and physical activity environment, education and skills, and food marketing and promotion.
Genes and Obesity
Genetic changes in human populations occur too slowly to be responsible for the obesity epidemic. Nevertheless, the variation in how people respond to the environment that promotes physical inactivity and intake of high-calorie foods suggests that genes do play a role in the development of obesity. Studies have identified variants in several genes that may contribute to obesity by increasing hunger and food intake. In 2007 and 2010, researches have reported presence of a variant of the fat mass obesity gene (FTO) in 50% of U.S. Population with European ancestry and same gene allele in 25% of U.S. Hispanics; 15% of African Americans and Asians each in this category. The carriers of the variant of this gene are thought to be at higher risk of gaining weight and a strong link between FTO gene variant and BMI is now established. Undoubtedly, genes play an important role in the development of obesity, however, lifestyle and environment remain to be the major factors and change in behavior can prevent obesity.
Hormones and Obesity
A variety of hormones have been implicated in increased risk for development of obesity. It has been found that growth hormone which is responsible for building bones and muscles and which also affects our metabolism is present in lower levels in people who are obese than in people of normal weight. Some hormones like ghrelin (which causes hunger) and leptin (which makes a person feel full) have been found to be associated with obesity and thus can be used as biomarkers for determining the cause of obesity. Leptin is produced by fat cells and is secreted into our bloodstream. Leptin acts on specific brain centers and reduces a person's appetite by making them feel full and decreases food intake and regulate glucose and fat metabolism. It also controls body fat distribution. Because leptin is produced by fat, leptin levels tend to be higher in people who are obese than in people of normal weight. However, despite having higher levels of this appetite-reducing hormone, people who are obese are resistant to effects of leptin and this may be due to mutations in their genes. In this lab, we will conduct an Enzyme-Linked Immunosorbent Assay (ELISA) with simulated samples of patients to test for leptin resistance.
Sex hormones and body fat distribution
Body fat distribution plays a significant role in the development of obesity-related conditions such as heart disease, stroke and some forms of arthritis. Fat accumulated around a person’s abdomen is associated with higher risk factor for disease developments than fat stored on the bottom, hips and thighs. It seems that estrogens and androgens help to decide body fat distribution. The changes with age in the sex hormone levels of both men and women results in changes in body fat distribution.

89
Young women of child bearing age tend to accumulate fat in their lower body, while older men and postmenopausal women have increased storage of fat around their abdomen.
OBJECTIVES
By, the end of this lab, students will learn the following:
1. Causes and Consequences of Obesity 2. Calculating Body Mass Index 3. Conduct an ELISA test to study leptin resistance
Estimation of BMI:
BMI can be used for population assessment of overweight and obesity. Because calculation requires only height and weight, it is inexpensive and easy to use for clinicians and for the general public. BMI can be used as a screening tool for body fatness but is not diagnostic. BMI is calculated the same way for both adults and children.
Activity 1: Measuring Height and Weight to estimate BMI
MATERIALS: Weight measuring scale, measuring tapes
PROCEDURE: Students will work individually for this activity For this exercise you will measure your weight in pounds and heights in inches and use the formula in Table 1. to calculate your BMI. You will compare your calculated result with values provided in Table 2.
Table 1: Formulas for calculating BMI
Measurement Units Formula and Calculation
Kilograms and meters (or centimeters)
Formula: weight (kg) / [height (m)]2
With the metric system, the formula for BMI is weight in kilograms divided by height in meters squared. Because height is commonly measured in centimeters, divide height in centimeters by 100 to obtain height in meters. Example: Weight = 68 kg, Height = 165 cm (1.65 m) Calculation: 68 ÷ (1.65)2 = 24.98
Pounds and inches Formula: weight (lb) / [height (in)]2 x 703 Calculate BMI by dividing weight in pounds (lbs) by height in inches (in) squared and multiplying by a conversion factor of 703. Example: Weight = 150 lbs, Height = 5’5″ (65″) Calculation: [150 ÷ (65)2] x 703 = 24.96
Reference: Assessing BMI-CDC

RESULTS:
MATERIALS:
Table 2: Standard weight status categories associated with BMI ranges for adults BMI Weight Status
Below 18.5 Underweight
18.5 – 24.9 Normal or Healthy Weight
25.0 – 29.9 Overweight
30.0 and Above Obese
Reference: Assessing adult BMI- CDC
Weight in Pounds: Height in Inches: BMI:
Activity 2: Analyzing body fat and BMI using a Fat Loss Monitor
Fat Loss Monitor
PROCEDURE: Students will work individually for this activity 1.Carefully follow all the directions from the instruction sheet or as shown by the instructor. 2. Record the results 3.Compare BMI and fat percentage from the values provided in Table 3.
Table 3: Recommended Body Fat Ranges and BMI
Recommended Body Fat Ranges and BMI
Gender Age Low (BMI < 18.5)
Normal (BMI 18.5-24.9)
High (BMI 25.0-29.9)
Very High (BMI ≥ 30.0)
Female 20-39 < 21.0 21.0-32.9 33.0-38.9 ≥ 39.0
40-59 <23.0 23.0-33.9 34.0-39.9 ≥ 40.0
60-79 < 24.0 24.0-35.9 36.0-41.9 ≥ 42.0
Male 20-39 < 8.0 8.0-19.9 20.0-24.9 ≥ 25.0
40-59 < 11.0 11.0-21.9 22.0-27.9 ≥ 28.0
60-79 <13.0 13.0-24.9 25.0-29.9 ≥ 30.0
Based on NIH/WHO guidelines for BMI
90

91
RESULTS:
BMI:
Fat Percentage:
Is there a difference between BMI calculated in activities 1 and 2? If yes, can you explain the reason?
How good is BMI as an indicator of body fatness?
The correlation between the BMI and body fatness is fairly strong but even if two people have the same BMI, their level of body fatness may differ.
In general,
• At the same BMI, women tend to have more body fat than men. • At the same BMI, Blacks have less body fat than do Whites and Asians have more body fat
than do Whites • At the same BMI, older people, on average, tend to have more body fat than younger
adults. • At the same BMI, athletes have less body fat than do non-athletes.
According to the BMI weight status categories, anyone with a BMI between 25 and 29.9 would be classified as overweight and anyone with a BMI over 30 would be classified as obese. However, athletes may have a high BMI because of increased muscularity rather than increased body fatness. In general, a person who has a high BMI is likely to have body fatness and would be considered to be overweight or obese, but this may not apply to athletes. A trained healthcare provider should perform appropriate health assessments in order to evaluate an individual’s health status and risks.
Activity 3: Analyzing Leptin Resistance in simulated DNA samples of patients
MATERIALS:
Rabbit anti-human leptin antibody, secondary antibody-enzyme linked body to leptin, substrate negative control, positive control, patient 1 and 2 samples, plastic strips of microtiter wells, micropipettes, di H2O, permanent marker

92
PROCEDURE:
For this lab activity, you will work with the entire group on your table. You will perform an ELISA test on simulated samples of patients from a kit, “What causes Obesity?” by DNA Depot.
In this simulation experiment, two obese parents are concerned about their two adolescent children who are considered overweight. An ELISA test is conducted to see if they are leptin resistant. An ELISA is a colorimetric assay based on specific antigen-antibody binding.
Figure 1. ELISA procedure
1. Carefully follow all the directions from the instruction sheet. Do not cross contaminate thesamples.2. Record the results in Table 4.
RESULTS:
Table 4: ELISA results for Leptin Well Number (Sample type) Color change Leptin (+/-)
1. Negative control2. Positive control3. Patient sample #14. Patient sample #2
Note: 1. This experiment is a simulation of a test to determine leptin levels. None of the components have been prepared from human or animal sources. All reagents are simulations.
2. In this experiment, the color change from colorless to (red) will indicate the presence or absence of leptin and not the quantity of how much leptin is present.
2. Add primary antibody 3. Add secondary antibodylinked to enzyme
4. Add substrate andlook for color change
1. Add Leptin

93
Test Yourself
1. What are the causes of obesity? List at least three.
2. List at least three health risks when a person has a high BMI?
3.Circle the choice that is not true for obesity: i) It can be caused by lack of physical activity ii) It is caused by resistance to leptin gene iii) BMI of 30 or greater is considered as one being obese iv) Currently, we do not know how to prevent obesity
4.Circle the correct choice(s):
i) At the same BMI, women tend to have more body fat than men.
ii) At the same BMI, athletes have less body fat than do non-athletes. iii) The prevalence of diabetes is higher among young adults than middle-aged adults iv) Obesity is not a risk factor for development on type 2 diabetes
5.True/False:
a) The overall prevalence of obesity was higher among non-Hispanic black and Hispanic adults than among non-Hispanic white and non-Hispanic Asian adults.
b) BMI can be used as a screening tool for body fatness but is not diagnostic
6. Briefly explain ELISA procedure:
94
7. These sex hormones affect body fat distribution: and
8. i) Leptin is produced by?
ii) What is its function?
9. What is Ghrelin and what is its function?
10. FTO stands for this gene:
References:
Overweight & Obesity by CDC
Prevalence of Obesity Among Adults and Youth: United States, 2015–2016 by CDC(PDF).
Clinical Growth charts by CDC

95
EXERCISE 13
DIABETES AND GLUCOSE TOLERANCE TEST
INTRODUCTION
Diabetes is a chronic health condition that affects how your body turns food into energy. Most of the food you eat is broken down into sugar (also called glucose) and released into your bloodstream. When your blood sugar goes up, it signals your pancreas to release insulin. Insulin acts like a key to let the blood sugar into your body’s cells for use as energy. If you have diabetes, your body either doesn’t make enough insulin or can’t use the insulin it makes as well as it should. When there isn’t enough insulin or cells stop responding to insulin, too much blood sugar stays in your bloodstream. Over time, that can cause serious health problems, such as heart disease, vision loss, and disease. There isn’t a cure yet for diabetes, but losing weight, eating healthy food, and being active can really help. Taking medicine as needed, getting diabetes self-management education and support, and keeping health care appointments can also reduce the impact of diabetes on your life.
In United States, 30.3 million adults have diabetes, and 1 in 4 of them don’t know they have it. Diabetes is the seventh leading cause of death in the United States. Diabetes is the No. 1 cause of kidney failure, lower-limb amputations, and adult blindness. In the last 20 years, the number of adults diagnosed with diabetes has more than tripled. In the United States, 84.1 million adults— more than 1 in 3—have prediabetes. What’s more, 90% of them don’t know they have it. With prediabetes, blood sugar levels are higher than normal, but not high enough yet to be diagnosed as type 2 diabetes. Prediabetes raises your risk for type 2 diabetes, heart disease, and stroke. People with diabetes are twice as likely to have heart disease or a stroke as people without diabetes—and at an earlier age. Diabetes is the leading cause of Chronic Kidney Disease in the United States, 2019, lower-limb amputations, and adult-onset blindness. Smokers are 30–40% more likely to develop type 2 diabetes than nonsmokers. People with diabetes who smoke are more likely to develop serious related health problems, including heart and kidney diseases. African Americans, Hispanic/Latino Americans, American Indians/Alaska Natives, Pacific Islanders, and some Asian Americans are at higher risk for prediabetes and type 2 diabetes. American Indians/Alaska Natives are twice as likely as whites to have diabetes. During their lifetime, half of all Hispanic men and women and non-Hispanic black women are predicted to develop diabetes.
There are three main types of diabetes: type 1, type 2, and gestational diabetes. Type 1 diabetes is thought to be caused by an autoimmune reaction (the body attacks itself by mistake) that stops your body from making insulin. About 5% of the people who have diabetes have type 1. Symptoms of type 1 diabetes often develop quickly. It’s usually diagnosed in children, teens, and young adults. If someone has type 1 diabetes, they need to take insulin every day to survive. Currently, no one knows how to prevent type 1 diabetes. With type 2 diabetes, the body doesn’t use insulin well and can’t keep blood sugar at normal levels. About 90% of people with diabetes have type 2. It develops over many years and is usually diagnosed in adults. Type 2 diabetes can be prevented or delayed with healthy lifestyle changes, such as losing weight, eating healthy food, and being active. Gestational diabetes develops in pregnant women who have never had diabetes. If a woman has gestational diabetes, her baby could be at higher risk for health problems.

96
Gestational diabetes usually goes away after the baby is born but increases the woman’s risk for type 2 diabetes later in life. The baby is more likely to have obesity as a child or teen, and more likely to develop type 2 diabetes later in life too.
Risk factors: These people are at risk for developing prediabetes or type 2 diabetes if : i) are overweight, ii)are age 45 or older, iii) have a parent, brother, or sister with type 2 diabetes, iv) are physically active less than 3 times a week, v) have ever had gestational diabetes (diabetes while pregnant)
OBJECTIVES
In this lab, you will work with simulated patient blood samples to learn about: 1. Insulin production by the pancreas and utilization of glucose to produce energy 2. The principle and procedure of glucose tolerance test 3. Analyze blood glucose levels 4. Analyze blood insulin levels
Glucose Tolerance Test
Health care providers often perform a glucose tolerance test for a patient complaining of fatigue and increased urination. The symptoms may indicate that the patient has diabetes. If the results of blood test show that blood glucose levels are elevated from the average normal range, the patient is advised to take a blood glucose tolerance test. This test is performed to screen for diabetes. This test allows to measure body’s response to sugar glucose and to check how the body metabolizes blood sugar. The patient fasts overnight, approximately for eight – twelve hours before the test and the next morning, is given a concentrated sugar solution to drink. The blood sample is withdrawn periodically for next several hours and glucose levels are measured. Ideally, the blood glucose levels should return to normal range within 2-3 hours. However, if the person has diabetes, the blood glucose levels may stay elevated for several hours after drinking the glucose solution.
All the activities are performed using Science take out Diagnosing Diabetes kit (Catalog #STO- 117)
Activity 1: Insulin production, glucose utilization and diabetes
MATERIALS: An information sheet on insulin production and glucose utilization, a picture sheet to match with information, a pair of scissors and a glue stick
PROCEDURE: Students will work in pairs for this activity For this exercise you will carefully read the details provided in each box of the information sheet. You will then use the picture sheet to match each image on the sheet with the correct box. You will cut the pictures with scissors and glue them against the correct box.
The instructor will go over the information sheet at the end of the activity.

97
Activity 2: Analyzing blood glucose levels by performing a glucose tolerance test
MATERIALS: Instruction sheet from the kit, 5 tubes of simulated blood plasma (0,30,60,90 and 120 minutes) 6 labeled droppers, simulated glucose test paper, glucose test color chart, glucose tolerance testing sheet
PROCEDURE: For this lab activity, you will work with the entire group on your table. You will perform a glucose tolerance test on simulated patient blood plasma samples from a kit- Science Take Out, Diagnosing Diabetes Kit. The patients’ blood samples are centrifuged to separate into blood cells and plasma. The concentration of glucose is measured in the patient’s plasma samples. The simulated blood samples that you will work with represent patient blood samples collected at five time points: 0 min (before drinking the concentrated glucose drink) and at 30, 60, 90, 120 minutes after drinking a concentrated glucose (50-100 g) drink.
Note: 1. Carefully follow all the directions from the instruction sheet. Do not cross contaminate the samples. 2. Please save the glucose tolerance testing sheet, droppers and patient’s plasma samples for use in Activity 3. 2. Record the results in Table 1 of the instruction sheet 3. Plot the data from test results on the Graph1 on the instruction sheet 4. Answer the questions on the sheet. Refer to the information sheet and pictures you used in Activity 1.
Activity 3: Analyzing blood insulin levels in patient’s blood plasma
MATERIALS: Instruction sheet from the kit, 5 tubes of simulated blood plasma (0,30,60,90 and 120 minutes), 1 tube of simulated insulin indicator, 6 labeled droppers, glucose tolerance testing sheet (column 2) insulin test indicator color chart.
PROCEDURE: For this lab activity, you will work with the entire group on your table. You will analyze blood insulin levels on simulated patient blood plasma samples from a kit- Science Take Out, Diagnosing Diabetes Kit. The patients’ blood samples are centrifuged to separate into blood cells and plasma. The concentration of glucose is measured in the patient’s

98
plasma samples. The simulated blood samples that you will work with represent patient blood samples collected at five time points: 0 min (before drinking the concentrated glucose drink) and at 30, 60, 90, 120 minutes after drinking a concentrated glucose (50-100 g) drink.
Note:
1. Carefully follow all the directions from the instruction sheet. Do not cross contaminate the samples. 2. Record the results in Table 2 of the instruction sheet. 3. Plot the data from test results on the Graph 2on the instruction sheet. 4. Answer the questions on the sheet.
Test Yourself
1. What kind of health problems can diabetes cause? List at least three.
2. List the risk factors that can lead to development of Type 2 diabetes?
3.Circle the choice that is not true for type 1 diabetes i) The patient does not produce insulin at all ii) It is caused by an auto immune reaction iii) More than 50% diabetic patients have this type of diabetes iv) Currently, we do not know how to prevent type 1 diabetes
4.Circle the choice that is not true for type 2 diabetes
i) The patient produces some insulin ii) The patient may not need insulin from an external source iii) About 90% of diabetic patients have type 2 diabetes iv) Smoking is not a risk factor for development on type 2 diabetes
5.True/False: a) American Indians/Alaska Natives are twice as likely as whites to have diabetes.
b) Those women who have experienced gestational diabetes have the same chances of developing diabetes later in life as women who did not experience gestational diabetes.
6. Briefly explain Glucose Tolerance Test:
7. Some common symptoms of diabetes are: and
8. Insulin is produced by this organ:
9.Gestational Diabetes is:
10. With prediabetes, blood sugar levels are higher than normal, but not high enough yet to
be diagnosed as?
References:
Diabetes by Centers for Disease Control and Prevention
About Diabetes by Centers for Disease Control and Prevention
National Diabetes Statistics Report by Center for Disease Control and Prevention
99